Screening Approach for Short-Term PM2.5 Health Co-Benefits
15
Citation: Lam, Y.-F.; Chang, J.M.H.; Loo, B.P.Y.; Zhang, H.-S.; Leung, K.K.M.; Axhausen, K.W. Screening Approach for Short-Term PM 2.5 Health Co-Benefits: A Case Study from 15 Metropolitan Cities around the World during the COVID-19 Pandemic. Atmosphere 2022, 13, 18. https://doi.org/10.3390/ atmos13010018 Academic Editors: Gunnar W. Schade, Nicole Mölders, Daniele Contini, Gabriele Curci, Francesca Costabile, Prashant Kumar and Chris G. Tzanis Received: 27 November 2021 Accepted: 17 December 2021 Published: 23 December 2021 Publisher’s Note: MDPI stays neutral with regard to jurisdictional claims in published maps and institutional affil- iations. Copyright: © 2021 by the authors. Licensee MDPI, Basel, Switzerland. This article is an open access article distributed under the terms and conditions of the Creative Commons Attribution (CC BY) license (https:// creativecommons.org/licenses/by/ 4.0/). atmosphere Article Screening Approach for Short-Term PM 2.5 Health Co-Benefits: A Case Study from 15 Metropolitan Cities around the World during the COVID-19 Pandemic Yun-Fat Lam 1, * , Jeffrey M. H. Chang 1 , Becky P. Y. Loo 1 , Hong-Sheng Zhang 1 , Kenneth K. M. Leung 2 and Kay W. Axhausen 3 1 Department of Geography, The University of Hong Kong, Hong Kong, China; [email protected] (J.M.H.C.); [email protected] (B.P.Y.L.); [email protected] (H.-S.Z.) 2 Hong Kong Environmental Protection Department, Hong Kong, China; [email protected] 3 Institute for Transport Planning and Systems, Eidgenössische Technische Hochschule Zürich, 8093 Zurich, Switzerland; [email protected] * Correspondence: [email protected] Abstract: Fifteen cities across the world have been selected to investigate the public health co-benefits of PM 2.5 reduction, during a period when various non-pharmaceutical interventions (NPIs) were adopted in the COVID-19 pandemic. Through applying a public health model, AirQ+, substantial spatial variations of global public health co-benefits were identified. Differences in seasonal air quality and population baselines were key underlying factors. For cities in North America, NPIs were introduced during the low pollution season, generating no co-benefits. On the other hand, tremendous health co-benefits were observed for cities in India and China, due to the high PM 2.5 background with a large population. Among all, New Delhi has received the largest co-benefits, which saved over 14,700 premature deaths. As the pollution level (i.e., 45 μgm -3 ) with NPIs still exceeded the air quality standard, more rigorous emission controls are urgently needed to protect the public 0 s health in India. At last, a novel and practical tool for co-benefit screening was developed using data from one of the global measurement networks (i.e., IQAir). Keywords: spatio-temporal dynamics of air pollution; COVID19; PM 2.5 ; pandemic lockdown; public health co-benefits; IQAir 1. Introduction The rapid spread of COVID-19 has made the World Health Organization (WHO) declare the outbreak of the disease as a Public Health Emergency of International Concern on 30 January 2020, and a pandemic on 11 March 2020. In terms of the introduction of non-pharmaceutical interventions (NPIs), China has taken the earliest precaution in late January 2020, just before the lunar new year, to lockdown the affected cities (e.g., Wuhan), preventing the further spread of the virus within China [1]. With the continuous spread of COVID-19 and escalated confirmed cases globally, the world has taken the pandemic seriously and implemented a series of stringent policies to cut off its transmission routes. NPIs, such as restrictions on international travel, social distancing, work from home (WFH), and mandatory quarantine, were adopted. With surges in confirmed cases, some adminis- trations have implemented massive city-wide or country-based emergency lockdowns [2]. These NPIs caused significant impacts on the local economy and industrial activities, in which travelling and gathering were suspended or heavily restricted [3]. It has been re- ported that traffic volumes in various US and European cities in the first three months of the pandemic were reduced by 48% to 86% [4]. In the UK, the reduction was about 41% to 55% [5]. In East Asia, limited reductions in traffic (i.e., 10–18%) and total passenger number (i.e., 41.4%) were also observed in cities, such as Hong Kong [4,6,7]. Apart from the absolute traffic volume reduction, decreases in traffic congestion (i.e., 14–20%) and total vehicle Atmosphere 2022, 13, 18. https://doi.org/10.3390/atmos13010018 https://www.mdpi.com/journal/atmosphere
-
Upload
khangminh22 -
Category
Documents
-
view
1 -
download
0
Transcript of Screening Approach for Short-Term PM2.5 Health Co-Benefits
�����������������
Citation: Lam, Y.-F.; Chang, J.M.H.;
Loo, B.P.Y.; Zhang, H.-S.; Leung,
K.K.M.; Axhausen, K.W. Screening
Approach for Short-Term PM2.5
Health Co-Benefits: A Case Study
from 15 Metropolitan Cities around
the World during the COVID-19
Pandemic. Atmosphere 2022, 13, 18.
https://doi.org/10.3390/
atmos13010018
Academic Editors: Gunnar W.
Schade, Nicole Mölders, Daniele
Contini, Gabriele Curci, Francesca
Costabile, Prashant Kumar and Chris
G. Tzanis
Received: 27 November 2021
Accepted: 17 December 2021
Published: 23 December 2021
Publisher’s Note: MDPI stays neutral
with regard to jurisdictional claims in
published maps and institutional affil-
iations.
Copyright: © 2021 by the authors.
Licensee MDPI, Basel, Switzerland.
This article is an open access article
distributed under the terms and
conditions of the Creative Commons
Attribution (CC BY) license (https://
creativecommons.org/licenses/by/
4.0/).
atmosphere
Article
Screening Approach for Short-Term PM2.5 Health Co-Benefits:A Case Study from 15 Metropolitan Cities around the Worldduring the COVID-19 Pandemic
Yun-Fat Lam 1,* , Jeffrey M. H. Chang 1 , Becky P. Y. Loo 1, Hong-Sheng Zhang 1 , Kenneth K. M. Leung 2
and Kay W. Axhausen 3
1 Department of Geography, The University of Hong Kong, Hong Kong, China;[email protected] (J.M.H.C.); [email protected] (B.P.Y.L.); [email protected] (H.-S.Z.)
2 Hong Kong Environmental Protection Department, Hong Kong, China; [email protected] Institute for Transport Planning and Systems, Eidgenössische Technische Hochschule Zürich,
8093 Zurich, Switzerland; [email protected]* Correspondence: [email protected]
Abstract: Fifteen cities across the world have been selected to investigate the public health co-benefitsof PM2.5 reduction, during a period when various non-pharmaceutical interventions (NPIs) wereadopted in the COVID-19 pandemic. Through applying a public health model, AirQ+, substantialspatial variations of global public health co-benefits were identified. Differences in seasonal airquality and population baselines were key underlying factors. For cities in North America, NPIswere introduced during the low pollution season, generating no co-benefits. On the other hand,tremendous health co-benefits were observed for cities in India and China, due to the high PM2.5
background with a large population. Among all, New Delhi has received the largest co-benefits,which saved over 14,700 premature deaths. As the pollution level (i.e., 45 µg m−3) with NPIs stillexceeded the air quality standard, more rigorous emission controls are urgently needed to protect thepublic′s health in India. At last, a novel and practical tool for co-benefit screening was developedusing data from one of the global measurement networks (i.e., IQAir).
Keywords: spatio-temporal dynamics of air pollution; COVID19; PM2.5; pandemic lockdown; publichealth co-benefits; IQAir
1. Introduction
The rapid spread of COVID-19 has made the World Health Organization (WHO)declare the outbreak of the disease as a Public Health Emergency of International Concernon 30 January 2020, and a pandemic on 11 March 2020. In terms of the introduction ofnon-pharmaceutical interventions (NPIs), China has taken the earliest precaution in lateJanuary 2020, just before the lunar new year, to lockdown the affected cities (e.g., Wuhan),preventing the further spread of the virus within China [1]. With the continuous spreadof COVID-19 and escalated confirmed cases globally, the world has taken the pandemicseriously and implemented a series of stringent policies to cut off its transmission routes.NPIs, such as restrictions on international travel, social distancing, work from home (WFH),and mandatory quarantine, were adopted. With surges in confirmed cases, some adminis-trations have implemented massive city-wide or country-based emergency lockdowns [2].These NPIs caused significant impacts on the local economy and industrial activities, inwhich travelling and gathering were suspended or heavily restricted [3]. It has been re-ported that traffic volumes in various US and European cities in the first three months ofthe pandemic were reduced by 48% to 86% [4]. In the UK, the reduction was about 41% to55% [5]. In East Asia, limited reductions in traffic (i.e., 10–18%) and total passenger number(i.e., 41.4%) were also observed in cities, such as Hong Kong [4,6,7]. Apart from the absolutetraffic volume reduction, decreases in traffic congestion (i.e., 14–20%) and total vehicle
Atmosphere 2022, 13, 18. https://doi.org/10.3390/atmos13010018 https://www.mdpi.com/journal/atmosphere
Atmosphere 2022, 13, 18 2 of 15
number (i.e., 21.5%) were also reported [6,8]. These traffic reductions have resulted in asharp decline in local air pollution and contributed to short-term public health co-benefitsfrom pollution reduction [9–11]. Overall, reductions in global air pollution (excluding O3)and values of the air quality index (AQI) were reported, ranging from −15 to −60% and−15.2 to −47%, respectively, with strong spatial heterogeneity [12–17]. Large pollutionreductions (i.e., AQI from “Unhealthy” to “Moderate”) were observed in East and SouthAsia, while mild pollution reductions (i.e., AQI from “Moderate” to “Good”) were reportedfor Europe and North America [11,12,18]. A distinct pattern of global pollution reductionhas emerged from the effect of NPIs. City-wide reductions in NO2, CO, PM10, and PM2.5,with an increase in O3, were generally observed during the lockdown. The increase in O3was attributed to the weakening of the titration effect from reducing NOx (NO + NO2)emissions. Keller et al. [19] reported that 18% to 60% reductions in NO2 were observedin 46 countries between January to June 2020, when compared with the case of businessas usual in 2019, while other studies reported drops in PM2.5 or PM10, between 4–32%in US cities, 24–60% in Chinese cities, 24% to 31% in European cities, and 19% to 54% inIndian cities [12,13,20–24]. In general, the percentage of reductions in roadside NO2 andPM2.5 were more significant than those observed in ambient stations, due to a substantialdecrease in local vehicular traffic. In China, a strong correlation between NO2 reductionand traffic volume was also reported for different cities [24]. Huang et al. [1] estimated thatabout 70–80% of the reduction in NOx emission during the pandemic was attributable tothe reduction in traffic; and every 1% drop in intra-city travel intensity (TI) contributedto about 2–4% NO2 reduction [15]. Clearly, these studies have demonstrated that a reduc-tion in traffic emissions can have substantial influence on air pollution during COVID-19.However, it should not be neglected that the level of pollution reduction in cities cannotsolely be explained by the decline in vehicular emissions. Other factors, such as industrialemission in the region, change of local meteorology affecting pollution dispersion, urbanand rural composition, level of lockdown, and seasonal pollution baselines, could alsoinfluence the pollution level observed during COVID-19 [24].
In this study, 15 cities worldwide were selected to investigate the impact of PM2.5 airquality and its associated short-term health co-benefits (measured as premature deaths)during the pandemic. The study examined the temporal and spatial variations of health co-benefits during the first few months of the COVID-19 pandemic. Owning to the influenceof different meteorological conditions, four years (2017–2020) of ground-based PM2.5 airquality data, obtained from various monitoring networks, were employed. Summariesof generalized location patterns and a discussion of mechanisms concerning the baselinepollution values with seasonal impact on the health co-benefits were performed. Througha comparative analysis, the study established the relationship between cities’ baselineconcentration and level of premature deaths during the lockdown. The findings offer aunique explanation to the spatial heterogeneity observed in the global air pollution data.In addition, a novel screening method for public health co-benefits, using one of the globalmeasurement networks (i.e., IQAir), was introduced. The rest of the paper is organized asfollows. Section 2 covers data collection and analysis methodology. Section 3.1 examines thegeospatial variations of air quality change around the world. Finally, Section 3.2 discussesPM2.5 reductions and their associated public health co-benefits, along with the developmentof a co-benefit screening tool.
2. Data Collection, Observations, and Methodologies2.1. Study Areas and Air Quality Data
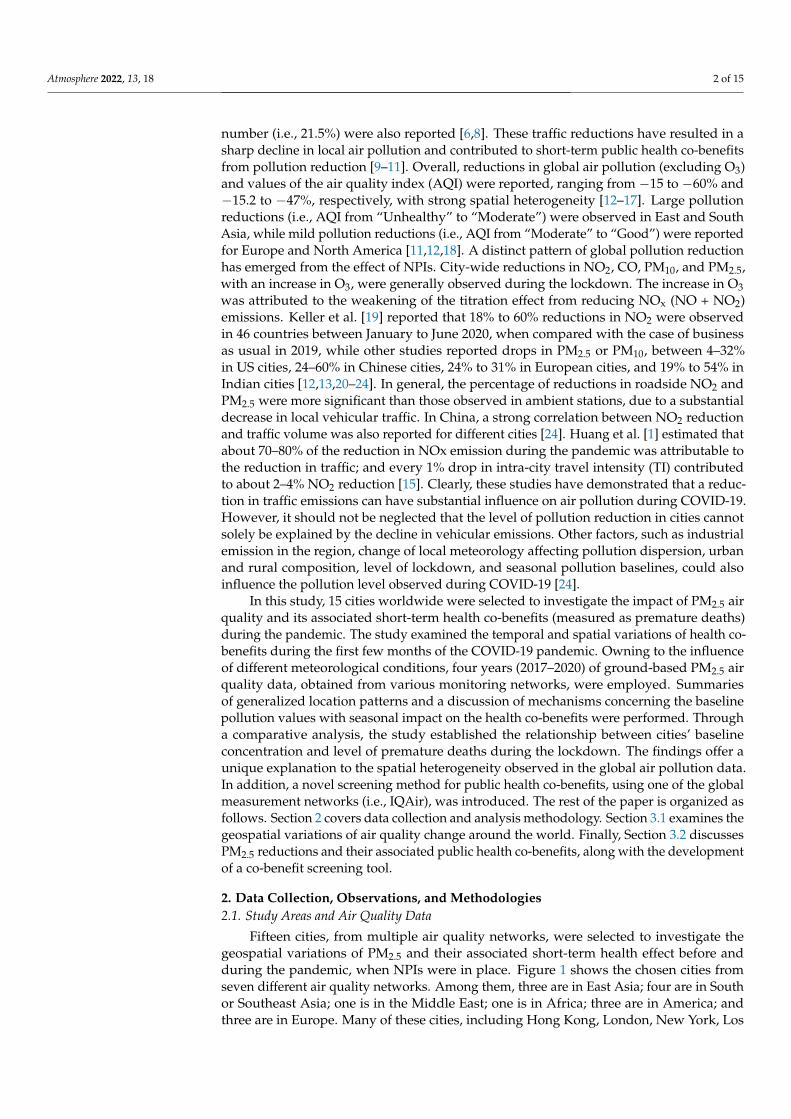
Fifteen cities, from multiple air quality networks, were selected to investigate thegeospatial variations of PM2.5 and their associated short-term health effect before andduring the pandemic, when NPIs were in place. Figure 1 shows the chosen cities fromseven different air quality networks. Among them, three are in East Asia; four are in Southor Southeast Asia; one is in the Middle East; one is in Africa; three are in America; andthree are in Europe. Many of these cities, including Hong Kong, London, New York, Los
Atmosphere 2022, 13, 18 3 of 15
Angeles, Beijing, Tokyo, and Zurich, were listed as the top 50 smart cities [25]. The reasonsfor selecting these cities were mainly based on data availability, PM2.5 pollution level, andglobal spatial coverage.
Atmosphere 2021, 12, x FOR PEER REVIEW 3 of 16
different air quality networks. Among them, three are in East Asia; four are in South or Southeast Asia; one is in the Middle East; one is in Africa; three are in America; and three are in Europe. Many of these cities, including Hong Kong, London, New York, Los Ange-les, Beijing, Tokyo, and Zurich, were listed as the top 50 smart cities [25]. The reasons for selecting these cities were mainly based on data availability, PM2.5 pollution level, and global spatial coverage.
Figure 1. Selected cities for this air quality study.
Table 1 shows the selected cities with their corresponding networks. For the AIRNow network, only one station per city was used due to data availability. All stations in the network are categorized as urban ambient (not urban traffic/roadside) stations. MET One BAM 1020 is used for continuous PM2.5 measurement [26]. For non-AIRNow stations, both urban ambient (hereinafter referred to as “ambient station”) and urban traffic/roadside stations (hereinafter referred to as “traffic station”) were selected. The inclusion of traffic stations allows one to gauge the influence of changes in local transport on PM2.5 from COVID-related NPIs. Depending on data availability, one to three stations were selected for each city. Details of the selected PM2.5 air quality stations and their station characteris-tics are listed in Table 1. For easy comparison among the stations, cities were divided into three groups based on their annual PM2.5 concentrations from the 2019 IQAir report, as shown in Figure 1 [27]. The IQAir report provides annual PM2.5 data from the top 100 most polluted cities, and the data were summarized from over 10,000 stations around the world. The first group is called “heavily polluted cities”, with an annual PM2.5 concentra-tion greater than 40 μg m−3. In our list, five cities fall into this category, including New Delhi (98.6 μg m−3), Jakarta (51.7 μg m−3), Beijing (42.1 μg m−3), Abu Dhabi (42.4 μg m−3), and Hanoi (46.9 μg m−3). They were being ranked among the top 10 polluted cities in the report. The second group is called “medium polluted cities”, with an annual PM2.5 con-centration between 10 μg m−3 and 40 μg m−3. These cities include Colombo (25.2 μg m−3), Lima (23.7 μg m−3), Pristina (23.5 μg m−3), Vientiane (23.1 μg m−3), Addis Ababa (20.1 μg m−3), Los Angeles (12.7 μg m−3), Hong Kong (20.3 μg m−3), Tokyo (11.7 μg m−3), and London (11.4 μg m−3). The last group is referred to as “relatively clean cities”. These cities include New York and Zurich, with an annual PM2.5 concentration below 10 μg m−3, which meets the annual standard of the WHO air quality guidelines (AQG). It should be noted that the optical-based PM2.5 measurements (i.e., using optical particle counter) taken from IQAir may be skewed toward the low-side of PM2.5, compared to the measurement data gathered from official government networks (especially for groups in relatively heavily polluted
Figure 1. Selected cities for this air quality study.
Table 1 shows the selected cities with their corresponding networks. For the AIRNownetwork, only one station per city was used due to data availability. All stations in thenetwork are categorized as urban ambient (not urban traffic/roadside) stations. MET OneBAM 1020 is used for continuous PM2.5 measurement [26]. For non-AIRNow stations, bothurban ambient (hereinafter referred to as “ambient station”) and urban traffic/roadsidestations (hereinafter referred to as “traffic station”) were selected. The inclusion of trafficstations allows one to gauge the influence of changes in local transport on PM2.5 fromCOVID-related NPIs. Depending on data availability, one to three stations were selected foreach city. Details of the selected PM2.5 air quality stations and their station characteristicsare listed in Table 1. For easy comparison among the stations, cities were divided intothree groups based on their annual PM2.5 concentrations from the 2019 IQAir report, asshown in Figure 1 [27]. The IQAir report provides annual PM2.5 data from the top 100 mostpolluted cities, and the data were summarized from over 10,000 stations around the world.The first group is called “heavily polluted cities”, with an annual PM2.5 concentrationgreater than 40 µg m−3. In our list, five cities fall into this category, including New Delhi(98.6 µg m−3), Jakarta (51.7 µg m−3), Beijing (42.1 µg m−3), Abu Dhabi (42.4 µg m−3), andHanoi (46.9 µg m−3). They were being ranked among the top 10 polluted cities in the report.The second group is called “medium polluted cities”, with an annual PM2.5 concentrationbetween 10 µg m−3 and 40 µg m−3. These cities include Colombo (25.2 µg m−3), Lima(23.7 µg m−3), Pristina (23.5 µg m−3), Vientiane (23.1 µg m−3), Addis Ababa (20.1 µg m−3),Los Angeles (12.7 µg m−3), Hong Kong (20.3 µg m−3), Tokyo (11.7 µg m−3), and London(11.4 µg m−3). The last group is referred to as “relatively clean cities”. These cities includeNew York and Zurich, with an annual PM2.5 concentration below 10 µg m−3, which meetsthe annual standard of the WHO air quality guidelines (AQG). It should be noted thatthe optical-based PM2.5 measurements (i.e., using optical particle counter) taken fromIQAir may be skewed toward the low-side of PM2.5, compared to the measurement datagathered from official government networks (especially for groups in relatively heavilypolluted cities), as some of their instruments may be situated in a semi-indoor environment

Atmosphere 2022, 13, 18 4 of 15
with a certain degree of PM2.5 removal from heating, ventilation, and air conditioning(HVAC) units or indoor filtration systems. Moreover, their instruments (those placed insidehigh-rise buildings) may be higher in station elevation than the official ambient air qualitystations. Hence, the values reported in the IQAir report may not fully reflect the seriousness(i.e., maximum concentration) as the values reported from the official ambient air qualitystations. Nevertheless, the IQAir still provides relatively reliable concentration data for thegrouping and screening exercises.
Table 1. Selected cities with their air quality stations.
Region Cities Sites Sources
SEA, SA, EA,SAM, ME, NA,
and AF
New Delhi, India; Jakarta, Indonesia; Beijing, China;Hanoi, Vietnam; Colombo, Sri Lanka; Lima, Peru; Pristina,
Kosovo; Addis Ababa, Ethiopia, and Abu Dhabi, UAE
AIRNow, Department of State, USA:https://www.airnow.gov/international/us-
embassies-and-consulates/ (accessed on26 May 2020)
NA Los Angeles, USA Long Beach 1, LA-North, andRiverside-Rubidoux
South Coast Air Quality Management District:https://www.arb.ca.gov/aqmis2/aqdselect.php
(accessed on 26 May 2020)
NA New York, USA PS314 1, Queens Near Road 1,and Maspeth 1
New York State Department of EnvironmentalConservation: http://www.nyaqinow.net
(accessed on 26 May 2020)
EA Hong Kong, China Shum Shui Po, Mongkok1,Shatin and Yuen Long
Hong Kong Environmental Protection Departmenthttps://cd.epic.epd.gov.hk/EPICDI/air/station/
?lang=en (accessed on 26 May 2020)
EA Tokyo, JapanDaiichi Keihin Takanawa 1,Takanawa, Minato-ku, and
Daiba, Minato-ku
Minato City Council, Tokyo:https://www.city.minato.tokyo.jp/
kankyoushidouasesutan/2016date.html (accessedon 26 May 2020)
EU London, UKMarylebone Road 1,
Kensington, Haringey Park 1,and Camden Kerbside 1
Department for Environment Food & Rural Affairshttps://uk-air.defra.gov.uk/data/data_selector
(accessed on 26 May 2020)
EU Zurich, Switzerland Zürich-Kaserne (only stationin Zurich)
National Air Pollution Monitoring Network,Switzerland
https://www.bafu.admin.ch/bafu/en/home/topics/air/state/data/historical-data.html
(accessed on 26 May 2020)1 Roadside/urban traffic station; SEA—Southeast Asia; SA—South Asia; EA—East Asia; East; AF—Africa;NA.—North America; ME.—Middle East; EU—Europe; SAM—South America.
In this study, the hourly air quality data in the first two months (about 60 days) after theannouncement of the COVID-19 pandemic were collected. The common period of 1 April to15 May 2020 (45 days), when all cities have implemented some forms of NPIs, was adoptedfor the analysis. For evaluating the short-term co-benefits of air pollution reduction duringthe study period, air quality data from 2017 to 2019 on the same calendar period werealso collected. All data (2017–2020) were processed to obtain a uniform format to analyzethe influence of emission change on air quality. The selection of three earlier historicalyears allows a better reflection on the effect of meteorological variations in air qualitycomparison. It is common to evaluate air quality changes in such a way for the observationcomparison [6,12,14,17]. After the air quality evaluation, the processed data was thenfurther applied to a public health model, AirQ+, to estimate the potential short-term healthbenefit from the pandemic. As multiple cities were considered, spatial variations of healthco-benefits and how background pollution concentration influences the health co-benefitswere investigated. Details of AirQ+ are discussed in the next section. At last, with the casestudies of New Delhi, London, Hong Kong, New York, and Zurich, the relationship oflocal traffic change and PM2.5 air quality were examined. Data from TomTom vehicular
Atmosphere 2022, 13, 18 5 of 15
GPS network, which contains the nearly real-time hourly congestion level for individualstreets, was used to evaluate traffic reduction and the change in congestion level during thepandemic [28]. The proposed analysis with local air quality data provides insights into howthe COVID-related NPIs affect the local traffic and subsequently influence the temporaland spatial patterns of air pollution around the world.
2.2. The Health Co-Benefit Model, AirQ+
AirQ+ quantifies the health burden and impact of air pollution. It was developed bythe WHO regional office for Europe. The model utilizes regional public health data with apollutant exposure methodology to assess the health effects from air pollutant exposure.The health-related outcomes, including mortality and morbidity, can be determined throughthe model. The model has been validated and used in various air quality and health-relatedstudies [29–31]. In this study, the 24-h PM2.5 data from 2017 to 2020 (1 April to 15 May) inthe selected cities (i.e., 15) was used as inputs. Simulations of pre-COVID cases (i.e., 2017,2018, and 2019) were performed independently for individual years. The multiple-yearobservations allow us to evaluate the impact of meteorological variations on air quality andhealth related impacts. The COVID-19 situation was simulated based on data in 2020. Thedifferences between the pre-COVID and COVID-19 situations were then used to estimatethe short-term health co-benefits during the pandemic. To calculate the air quality healthimpact (i.e., mortality rate) from the model, city-level population data obtained from theUnited Nations [32] was applied. The default value of 25 µg m−3 (24-h mean) was appliedas the cut-off concentration, aligning with the WHO AQG for the 24-h PM2.5 standard [33].Based on the data obtained from Western Europe and North American studies, a relativerisk (RR) value of 1.0123 for all-cause mortality was used [34].
3. Results and Discussion3.1. Geospatial Variations of Air Quality Change before and during the Pandemic
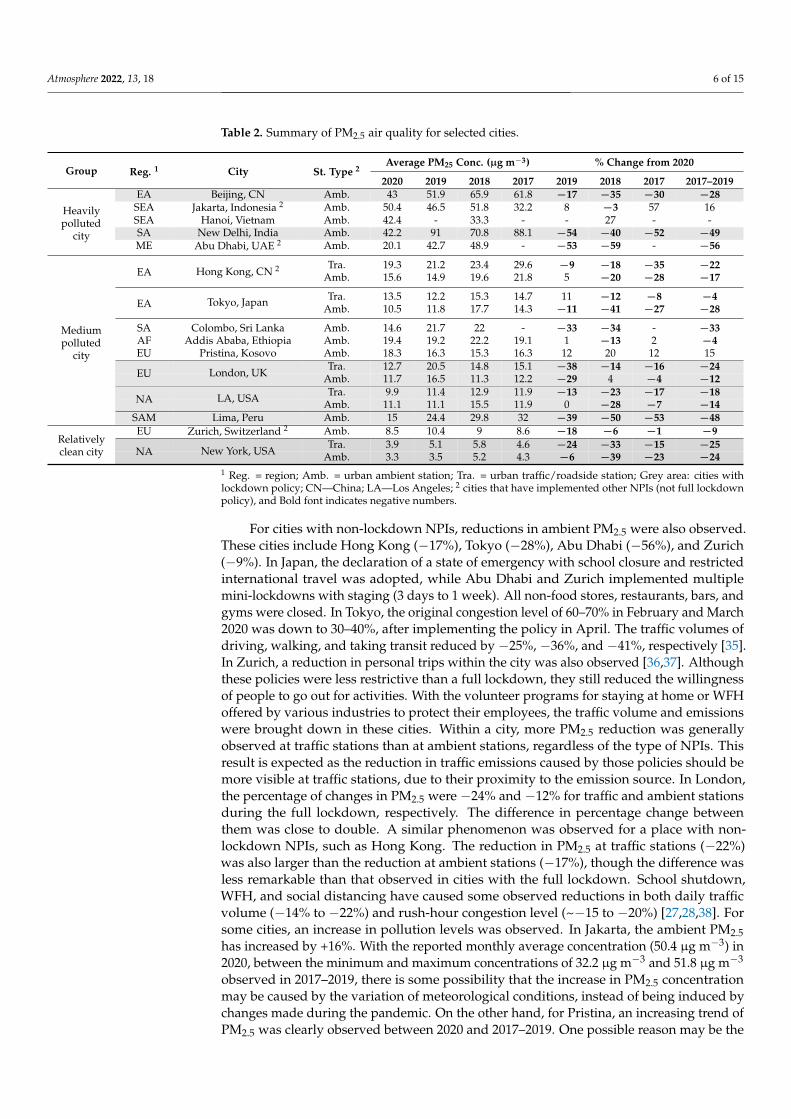
The NPIs were more popular among countries and cities in America, Europe, andEast Asia at the beginning of the pandemic. The intention was to break the transmissionpathways of COVID-19, aiming to lower the rising trend and ease the shortage of resources(i.e., physicians and surgical masks) in the public health sector. As many cities sufferedfrom a strong hit in the first wave of the pandemic, the large number of confirmed cases,combined with a lack of medical resources, forced governments to implement NPIs to curbthe spread of the virus. Table 2 summarizes the average PM2.5, as well as the percentagechange of pollutant concentrations between the pandemic and business-as-usual condition(BAU) situation in 2017–2019, for the same calendar period. The grey color highlights citieswith a full lockdown, which restricted people from leaving their homes freely, and “#”indicates cities with non-lockdown NPIs, where policies such as school closure, suspensionof public services, or social distancing were in force. As reflected in the table, the fulllockdown (cities with grey color) has resulted in appreciable PM2.5 reductions (shownas negative) on both ambient and traffic air quality stations, regardless of their regions.The percentage change in PM2.5 from cities with lockdown ranged from −12% to −49%in the ambient stations, with Beijing, New Delhi, London, Los Angeles, Lima, and NewYork being −28%, −49%, −12%, −14%, −48%, and −24% on 3-year averaging (2017–2019),respectively. For traffic stations, the range of change was between −18% and −25%. Theobserved low value of the change at the top range (−25%) among traffic stations may createa misconception of less drastic reductions at traffic stations than ambient stations. However,when we carefully analyzed the traffic station data, the low value at the top range wascaused by data missing for some cities with heavy PM2.5 reductions. Excluding those citiesthat did not have data from traffic stations in calculating the percentage change in theambient stations, the upper range has become −24%, which is comparable with that oftraffic stations.
Atmosphere 2022, 13, 18 6 of 15
Table 2. Summary of PM2.5 air quality for selected cities.
Group Reg. 1 City St. Type 2Average PM25 Conc. (µg m−3) % Change from 2020
2020 2019 2018 2017 2019 2018 2017 2017–2019
Heavilypolluted
city
EA Beijing, CN Amb. 43 51.9 65.9 61.8 −17 −35 −30 −28SEA Jakarta, Indonesia 2 Amb. 50.4 46.5 51.8 32.2 8 −3 57 16SEA Hanoi, Vietnam Amb. 42.4 - 33.3 - - 27 - -SA New Delhi, India Amb. 42.2 91 70.8 88.1 −54 −40 −52 −49ME Abu Dhabi, UAE 2 Amb. 20.1 42.7 48.9 - −53 −59 - −56
EA Hong Kong, CN 2 Tra. 19.3 21.2 23.4 29.6 −9 −18 −35 −22Amb. 15.6 14.9 19.6 21.8 5 −20 −28 −17
EA Tokyo, Japan Tra. 13.5 12.2 15.3 14.7 11 −12 −8 −4Amb. 10.5 11.8 17.7 14.3 −11 −41 −27 −28
SA Colombo, Sri Lanka Amb. 14.6 21.7 22 - −33 −34 - −33AF Addis Ababa, Ethiopia Amb. 19.4 19.2 22.2 19.1 1 −13 2 −4EU Pristina, Kosovo Amb. 18.3 16.3 15.3 16.3 12 20 12 15
Tra. 12.7 20.5 14.8 15.1 −38 −14 −16 −24EU London, UK Amb. 11.7 16.5 11.3 12.2 −29 4 −4 −12
Tra. 9.9 11.4 12.9 11.9 −13 −23 −17 −18NA LA, USA Amb. 11.1 11.1 15.5 11.9 0 −28 −7 −14
Mediumpolluted
city
SAM Lima, Peru Amb. 15 24.4 29.8 32 −39 −50 −53 −48EU Zurich, Switzerland 2 Amb. 8.5 10.4 9 8.6 −18 −6 −1 −9
Tra. 3.9 5.1 5.8 4.6 −24 −33 −15 −25Relativelyclean city NA New York, USA Amb. 3.3 3.5 5.2 4.3 −6 −39 −23 −24
1 Reg. = region; Amb. = urban ambient station; Tra. = urban traffic/roadside station; Grey area: cities withlockdown policy; CN—China; LA—Los Angeles; 2 cities that have implemented other NPIs (not full lockdownpolicy), and Bold font indicates negative numbers.
For cities with non-lockdown NPIs, reductions in ambient PM2.5 were also observed.These cities include Hong Kong (−17%), Tokyo (−28%), Abu Dhabi (−56%), and Zurich(−9%). In Japan, the declaration of a state of emergency with school closure and restrictedinternational travel was adopted, while Abu Dhabi and Zurich implemented multiplemini-lockdowns with staging (3 days to 1 week). All non-food stores, restaurants, bars, andgyms were closed. In Tokyo, the original congestion level of 60–70% in February and March2020 was down to 30–40%, after implementing the policy in April. The traffic volumes ofdriving, walking, and taking transit reduced by −25%, −36%, and −41%, respectively [35].In Zurich, a reduction in personal trips within the city was also observed [36,37]. Althoughthese policies were less restrictive than a full lockdown, they still reduced the willingnessof people to go out for activities. With the volunteer programs for staying at home or WFHoffered by various industries to protect their employees, the traffic volume and emissionswere brought down in these cities. Within a city, more PM2.5 reduction was generallyobserved at traffic stations than at ambient stations, regardless of the type of NPIs. Thisresult is expected as the reduction in traffic emissions caused by those policies should bemore visible at traffic stations, due to their proximity to the emission source. In London,the percentage of changes in PM2.5 were −24% and −12% for traffic and ambient stationsduring the full lockdown, respectively. The difference in percentage change betweenthem was close to double. A similar phenomenon was observed for a place with non-lockdown NPIs, such as Hong Kong. The reduction in PM2.5 at traffic stations (−22%)was also larger than the reduction at ambient stations (−17%), though the difference wasless remarkable than that observed in cities with the full lockdown. School shutdown,WFH, and social distancing have caused some observed reductions in both daily trafficvolume (−14% to −22%) and rush-hour congestion level (~−15 to −20%) [27,28,38]. Forsome cities, an increase in pollution levels was observed. In Jakarta, the ambient PM2.5has increased by +16%. With the reported monthly average concentration (50.4 µg m−3) in2020, between the minimum and maximum concentrations of 32.2 µg m−3 and 51.8 µg m−3
observed in 2017–2019, there is some possibility that the increase in PM2.5 concentrationmay be caused by the variation of meteorological conditions, instead of being induced bychanges made during the pandemic. On the other hand, for Pristina, an increasing trend ofPM2.5 was clearly observed between 2020 and 2017–2019. One possible reason may be the
Atmosphere 2022, 13, 18 7 of 15
implementation of city quarantine (no going in and out of the city), which elevates citizens’anxiety on resource scarcity (e.g., food, gasoline, etc.) and results in more trips for resourcehunting within the city. The induced traffic congestion has elevated traffic emissions andtriggered an increase in PM2.5. The situation is similar to the pre-hurricane or -typhoonconditions, where people go out for food and consumables. Such actions would worsen airquality in the affected cities.
Overall, no clear signal of continental or regional dependence on “the percentage ofPM2.5 reduction” among the cities. The percentage reduction was calculated based on thedifference between the reported concentrations in 2020 and concentrations in 2017–2019,under the BAU condition; therefore, the influence of location dependence has been dimin-ished when evaluating using percentage of PM2.5 reduction. On the other hand, in terms ofthe absolute value of PM2.5 reduction, the heavily polluted cities seemed to receive morereduction in PM2.5 than the other two groups. As these polluted cities were concentratedin East and South Asia, there was a clear regional pattern. For the heavily polluted cities,the reduction from the COVID-related NPIs ranged from −16.9 µg m−3 to −41.1 µg m−3.In contrast, for the medium polluted and relatively clean cities, the reductions were from−1.6 µg m−3 to −13.7 µg m−3 and −1.1 µg m−3 to 1.3 µg m−3, respectively. The observedtrend was mainly caused by the difference in the baseline concentrations under the BAUcondition, where high concentrations were observed in Asia cities, due to the rapid eco-nomic development with limited pollution controls, as well as low concentrations in Europeand North America, due to the success of continuous efforts of implementing air pollutioncontrols in their cities.
Case Studies on the Relationship of Traffic Reduction and PM2.5 Concentration
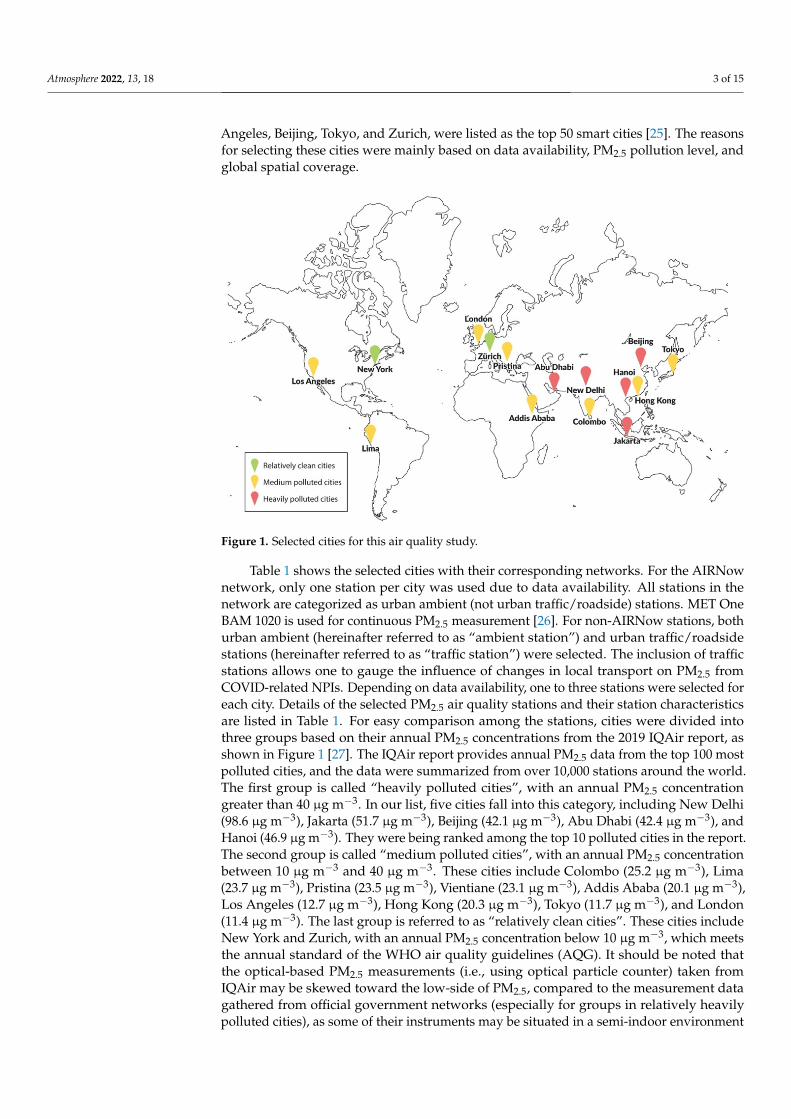
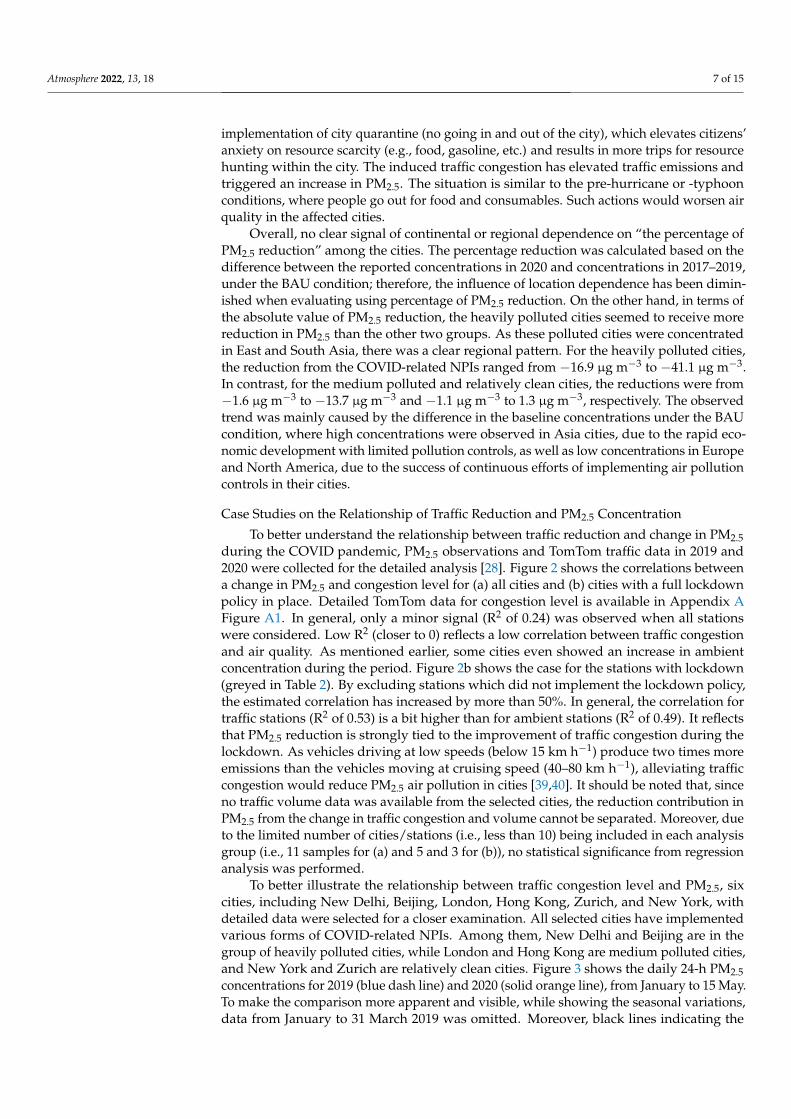
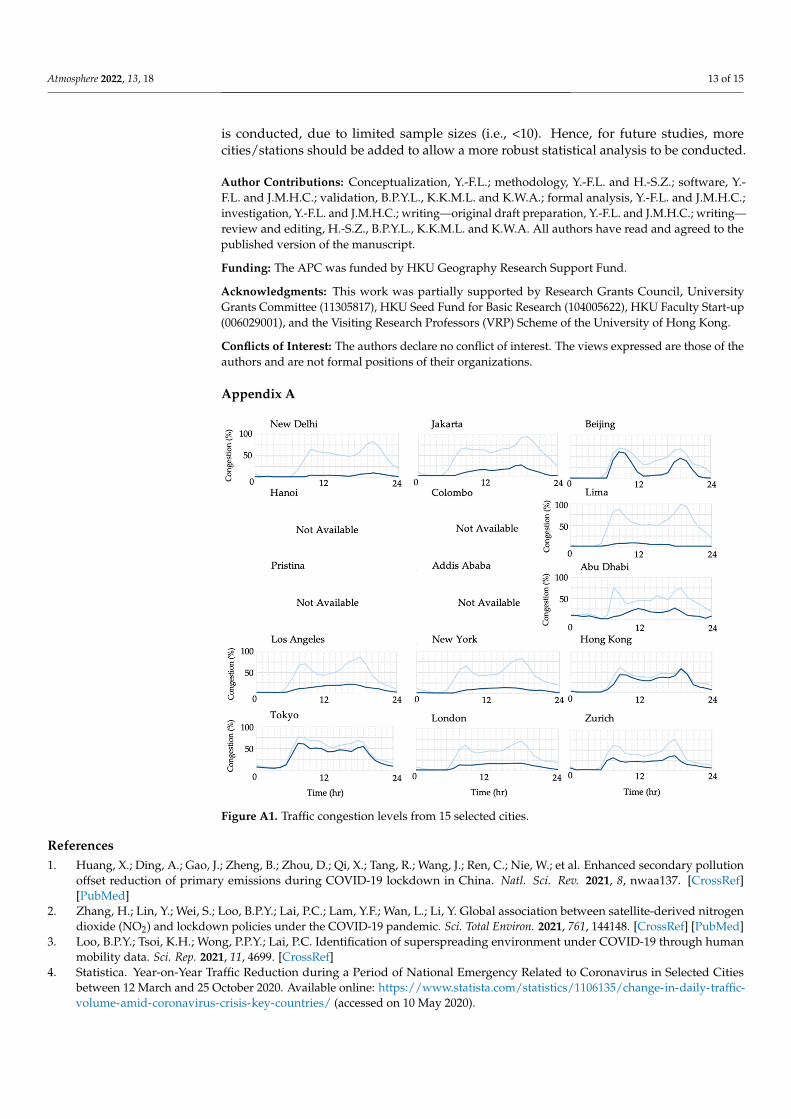
To better understand the relationship between traffic reduction and change in PM2.5during the COVID pandemic, PM2.5 observations and TomTom traffic data in 2019 and2020 were collected for the detailed analysis [28]. Figure 2 shows the correlations betweena change in PM2.5 and congestion level for (a) all cities and (b) cities with a full lockdownpolicy in place. Detailed TomTom data for congestion level is available in Appendix AFigure A1. In general, only a minor signal (R2 of 0.24) was observed when all stationswere considered. Low R2 (closer to 0) reflects a low correlation between traffic congestionand air quality. As mentioned earlier, some cities even showed an increase in ambientconcentration during the period. Figure 2b shows the case for the stations with lockdown(greyed in Table 2). By excluding stations which did not implement the lockdown policy,the estimated correlation has increased by more than 50%. In general, the correlation fortraffic stations (R2 of 0.53) is a bit higher than for ambient stations (R2 of 0.49). It reflectsthat PM2.5 reduction is strongly tied to the improvement of traffic congestion during thelockdown. As vehicles driving at low speeds (below 15 km h−1) produce two times moreemissions than the vehicles moving at cruising speed (40–80 km h−1), alleviating trafficcongestion would reduce PM2.5 air pollution in cities [39,40]. It should be noted that, sinceno traffic volume data was available from the selected cities, the reduction contribution inPM2.5 from the change in traffic congestion and volume cannot be separated. Moreover, dueto the limited number of cities/stations (i.e., less than 10) being included in each analysisgroup (i.e., 11 samples for (a) and 5 and 3 for (b)), no statistical significance from regressionanalysis was performed.
To better illustrate the relationship between traffic congestion level and PM2.5, sixcities, including New Delhi, Beijing, London, Hong Kong, Zurich, and New York, withdetailed data were selected for a closer examination. All selected cities have implementedvarious forms of COVID-related NPIs. Among them, New Delhi and Beijing are in thegroup of heavily polluted cities, while London and Hong Kong are medium polluted cities,and New York and Zurich are relatively clean cities. Figure 3 shows the daily 24-h PM2.5concentrations for 2019 (blue dash line) and 2020 (solid orange line), from January to 15 May.To make the comparison more apparent and visible, while showing the seasonal variations,data from January to 31 March 2019 was omitted. Moreover, black lines indicating the
Atmosphere 2022, 13, 18 8 of 15
WHO AQG of 25 µg m−3 were added to illustrate whether the PM2.5 concentration datahad exceeded the AQG.
Atmosphere 2021, 12, x FOR PEER REVIEW 8 of 16
Figure 2. Effect of PM2.5 from the change in congestion level: (a) all ambient stations with or without lockdown and (b) all stations with the full lockdown. The colored dash lines (i.e., blue in (a), blue in (b), and orange in (b)) indicate the linear best fit for ambient (R2 of 0.2357), mixed (R2 of 0.491), and roadside (R2 of 0.5314) stations, respectively.
To better illustrate the relationship between traffic congestion level and PM2.5, six cit-ies, including New Delhi, Beijing, London, Hong Kong, Zurich, and New York, with de-tailed data were selected for a closer examination. All selected cities have implemented various forms of COVID-related NPIs. Among them, New Delhi and Beijing are in the group of heavily polluted cities, while London and Hong Kong are medium polluted cit-ies, and New York and Zurich are relatively clean cities. Figure 3 shows the daily 24-h PM2.5 concentrations for 2019 (blue dash line) and 2020 (solid orange line), from January to 15 May. To make the comparison more apparent and visible, while showing the sea-sonal variations, data from January to 31 March 2019 was omitted. Moreover, black lines indicating the WHO AQG of 25 μg m−3 were added to illustrate whether the PM2.5 concen-tration data had exceeded the AQG.
Overall, there were apparent seasonal variations of PM2.5 in all stations, except Zur-ich, in 2020. For New Delhi (a), Beijing (c), and New York (f), PM2.5 pollution was more severe in winter than in spring. For London (b) and Hong Kong (d), spring seems to have higher PM2.5 than winter. It is commonly known that the winter PM2.5 in Hong Kong is usually higher than in spring. However, due to the lockdown policy enforced in late Jan-uary in China and the lack of facemask supplies during the Chinese New Year (25 Janu-ary), the emission of PM2.5 from both local traffic and the long-range transport of PM25 and its precursors had been reduced drastically. Hence, it has resulted in low PM2.5 in January and February 2020. In general, the average and rush-hour congestion levels have been down by 10% to 45% and 8% to 62%, respectively. For cities without the full lockdown, such as Hong Kong and Zurich, changes of congestion level were about −10% (from 38% to 28%) and −12% (from 37% to 25%), which corresponds to −9% (21.2 to 19.3 μg m−3) and −17% (10.4 to 8.6 μg m−3) reductions in PM2.5, respectively. In Hong Kong, the policy of WFH, initiated by the government, with the closure of public and private schools reduced the traffic volume by 12%.
Overall, cities with “no lockdown” did not exhibit a substantial reduction in PM2.5. For cities with a full lockdown, such as New Delhi, London, New York, and Beijing, there were −45% (from 50% to 5%), −31% (from 48% to 17%), −29% (from 42% to 13%), and −21%
Figure 2. Effect of PM2.5 from the change in congestion level: (a) all ambient stations with or withoutlockdown and (b) all stations with the full lockdown. The colored dash lines (i.e., blue in (a), blue in(b), and orange in (b)) indicate the linear best fit for ambient (R2 of 0.2357), mixed (R2 of 0.491), androadside (R2 of 0.5314) stations, respectively.
Atmosphere 2021, 12, x FOR PEER REVIEW 9 of 16
(from 30% to 9%) in congestion level, which corresponds to −49.4%, −48.4%, −4.7%, and −21.2% in PM2.5 reductions, respectively. The low reduction (e.g., −4.7%) observed in New York was attributed to a low baseline value (average of 4.3 μg m−3 in 2019).
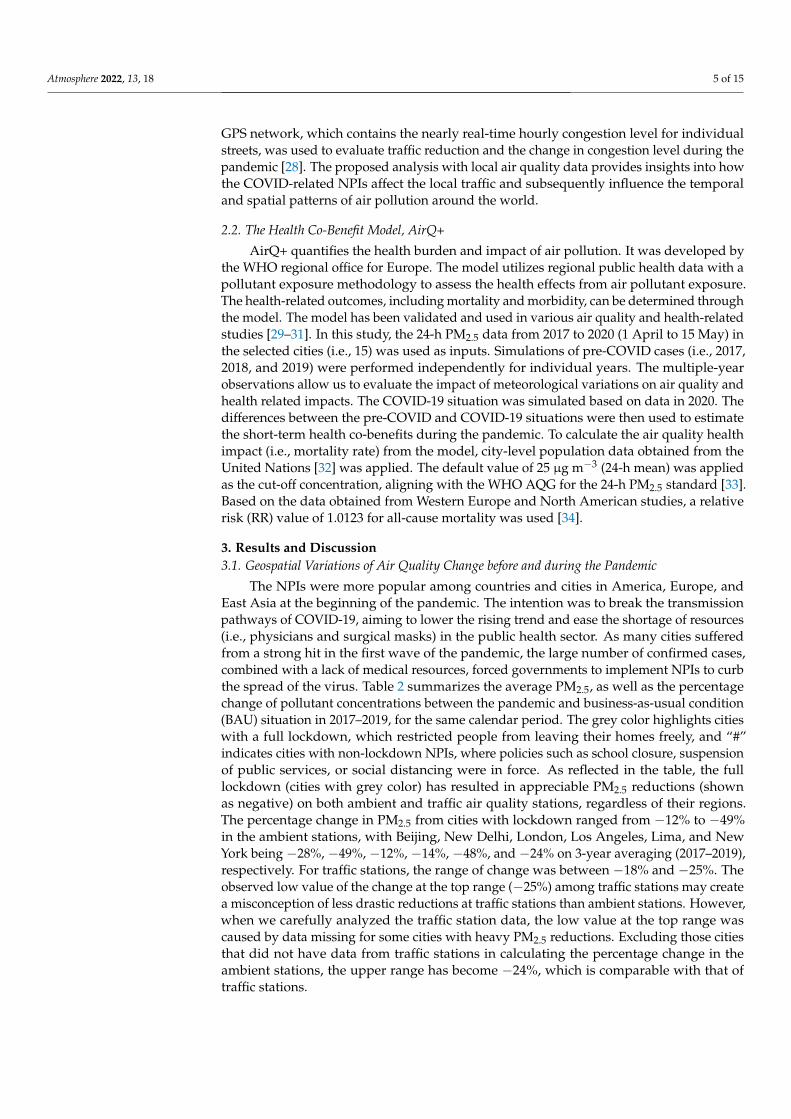
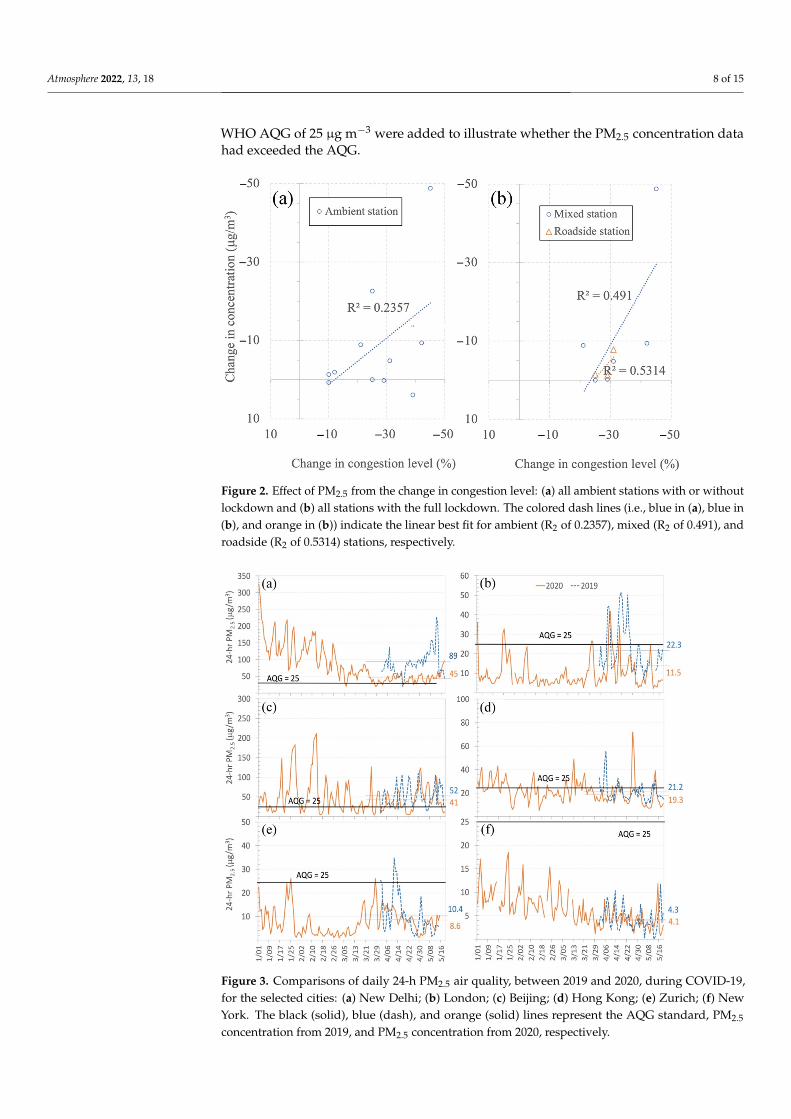
Figure 3. Comparisons of daily 24-h PM2.5 air quality, between 2019 and 2020, during COVID-19, for the selected cities: (a) New Delhi; (b) London; (c) Beijing; (d) Hong Kong; (e) Zurich; (f) New York. The black (solid), blue (dash), and orange (solid) lines represent the AQG standard, PM2.5 concen-tration from 2019, and PM2.5 concentration from 2020, respectively.
3.2. Potential Health Co-Benefits and PM2.5 Reduction 3.2.1. Health Co-Benefits and PM2.5 Reduction
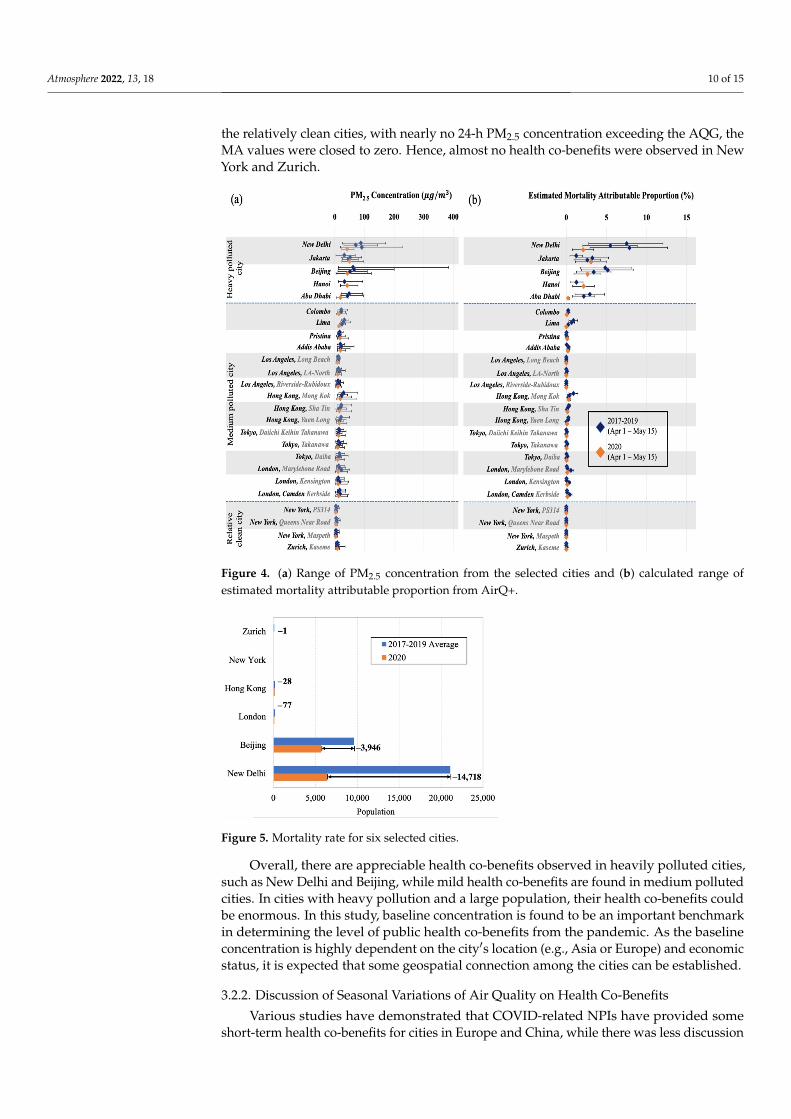
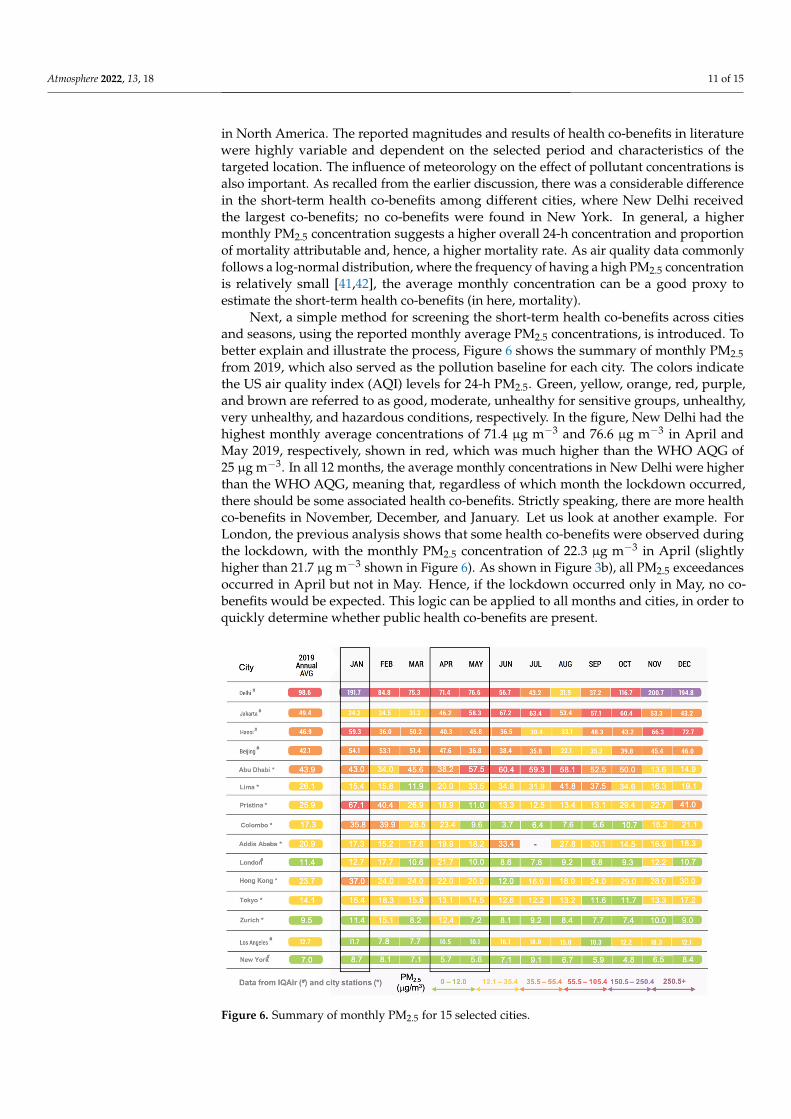
Figures 4 and 5 show the summary of PM2.5 and corresponding proportion of mor-tality attributable (MA) from AirQ+, as well as the mortality rate for the six selected cities, respectively. A higher average daily PM2.5 level would generally result in a higher MA, when it is beyond the WHO AQG level of 25 μg m−3 for the 24-h standard. For the mortality rate, a higher MA with a higher city population would trigger a higher number of prem-ature deaths from air pollution. The MA is defined as the proportion of deaths attributed to the exposure to PM2.5. In Figure 4, high MA values (in %) (blue dots in the figure) are observed mainly in heavily polluted cities, such as New Delhi, Jakarta, Beijing, and Abu Dhabi. Among these cities, New Delhi has the highest MA, ranging from 3% to 12.3% in 2017–2019, with a yearly average of 6.3%. The maximum value of 12.3% is attributed to extended periods exceeding 200 μg m−3 on 24-h PM2.5. As PM2.5 in 2020 were cut by 49%, due to the lockdown, significant differences in MA values between 2017–2019 (blue dots) and 2020 (orange dot) were observed. The average MA in 2020 was 2%, three times lower than the average in 2017–2019. As shown in Figure 5, the short-term co-benefits of air quality improvement from the lockdown saved 14,718 premature deaths in New Delhi. For Beijing, another heavily polluted city, the average MA ranged between 2% and 8.7%, with an average of 4.1% in 2017–2019, which was two-thirds of the value observed in New
Figure 3. Comparisons of daily 24-h PM2.5 air quality, between 2019 and 2020, during COVID-19,for the selected cities: (a) New Delhi; (b) London; (c) Beijing; (d) Hong Kong; (e) Zurich; (f) NewYork. The black (solid), blue (dash), and orange (solid) lines represent the AQG standard, PM2.5
concentration from 2019, and PM2.5 concentration from 2020, respectively.
Atmosphere 2022, 13, 18 9 of 15
Overall, there were apparent seasonal variations of PM2.5 in all stations, except Zurich,in 2020. For New Delhi (a), Beijing (c), and New York (f), PM2.5 pollution was more severein winter than in spring. For London (b) and Hong Kong (d), spring seems to have higherPM2.5 than winter. It is commonly known that the winter PM2.5 in Hong Kong is usuallyhigher than in spring. However, due to the lockdown policy enforced in late January inChina and the lack of facemask supplies during the Chinese New Year (25 January), theemission of PM2.5 from both local traffic and the long-range transport of PM25 and itsprecursors had been reduced drastically. Hence, it has resulted in low PM2.5 in January andFebruary 2020. In general, the average and rush-hour congestion levels have been downby 10% to 45% and 8% to 62%, respectively. For cities without the full lockdown, such asHong Kong and Zurich, changes of congestion level were about −10% (from 38% to 28%)and −12% (from 37% to 25%), which corresponds to −9% (21.2 to 19.3 µg m−3) and −17%(10.4 to 8.6 µg m−3) reductions in PM2.5, respectively. In Hong Kong, the policy of WFH,initiated by the government, with the closure of public and private schools reduced thetraffic volume by 12%.
Overall, cities with “no lockdown” did not exhibit a substantial reduction in PM2.5.For cities with a full lockdown, such as New Delhi, London, New York, and Beijing, therewere −45% (from 50% to 5%), −31% (from 48% to 17%), −29% (from 42% to 13%), and−21% (from 30% to 9%) in congestion level, which corresponds to −49.4%, −48.4%, −4.7%,and −21.2% in PM2.5 reductions, respectively. The low reduction (e.g., −4.7%) observed inNew York was attributed to a low baseline value (average of 4.3 µg m−3 in 2019).
3.2. Potential Health Co-Benefits and PM2.5 Reduction3.2.1. Health Co-Benefits and PM2.5 Reduction
Figures 4 and 5 show the summary of PM2.5 and corresponding proportion of mortalityattributable (MA) from AirQ+, as well as the mortality rate for the six selected cities,respectively. A higher average daily PM2.5 level would generally result in a higher MA,when it is beyond the WHO AQG level of 25 µg m−3 for the 24-h standard. For themortality rate, a higher MA with a higher city population would trigger a higher numberof premature deaths from air pollution. The MA is defined as the proportion of deathsattributed to the exposure to PM2.5. In Figure 4, high MA values (in %) (blue dots in thefigure) are observed mainly in heavily polluted cities, such as New Delhi, Jakarta, Beijing,and Abu Dhabi. Among these cities, New Delhi has the highest MA, ranging from 3%to 12.3% in 2017–2019, with a yearly average of 6.3%. The maximum value of 12.3% isattributed to extended periods exceeding 200 µg m−3 on 24-h PM2.5. As PM2.5 in 2020 werecut by 49%, due to the lockdown, significant differences in MA values between 2017–2019(blue dots) and 2020 (orange dot) were observed. The average MA in 2020 was 2%, threetimes lower than the average in 2017–2019. As shown in Figure 5, the short-term co-benefitsof air quality improvement from the lockdown saved 14,718 premature deaths in NewDelhi. For Beijing, another heavily polluted city, the average MA ranged between 2% and8.7%, with an average of 4.1% in 2017–2019, which was two-thirds of the value observed inNew Delhi. However, it is noted that Beijing has a much wider range of PM2.5 (i.e., 10 to390 µg m−3), partly due to the adverse meteorological conditions in spring (e.g., regionaldust storms). As the calculation of MA value considered both the magnitude of 24-h PM2.5and frequency of exceedance, infrequent super high PM2.5 (i.e., 390 µg m−3) did not triggera high MA value.
The difference in MA values for Beijing between 2020 and 2017–2019 was about 1.6%(from 4.1% to 2.5%), and the co-benefits of air quality improvement from the lockdown havesaved 3946 premature deaths in Beijing. For medium polluted cities, since the 24-h concen-tration of PM2.5 ranged between 10 to 25 µg m−3, with occasional incidents exceeding the24-h WHO AQG, the MA values in 2017–2019 were in the low range, between 0 to 1%. Thetop three highest MAs from this group were Lima, Hong Kong, and London. AppreciableMA reduction was observed in Lima, while less was found in HK and London. Overall,about 77 and 28 premature deaths were saved in London and Hong Kong, respectively. For
Atmosphere 2022, 13, 18 10 of 15
the relatively clean cities, with nearly no 24-h PM2.5 concentration exceeding the AQG, theMA values were closed to zero. Hence, almost no health co-benefits were observed in NewYork and Zurich.
Atmosphere 2021, 12, x FOR PEER REVIEW 10 of 16
Delhi. However, it is noted that Beijing has a much wider range of PM2.5 (i.e., 10 to 390 μg m−3), partly due to the adverse meteorological conditions in spring (e.g., regional dust storms). As the calculation of MA value considered both the magnitude of 24-h PM2.5 and frequency of exceedance, infrequent super high PM2.5 (i.e., 390 μg m−3) did not trigger a high MA value.
Figure 4. (a) Range of PM2.5 concentration from the selected cities and (b) calculated range of esti-mated mortality attributable proportion from AirQ+.
Figure 5. Mortality rate for six selected cities.
The difference in MA values for Beijing between 2020 and 2017–2019 was about 1.6% (from 4.1% to 2.5%), and the co-benefits of air quality improvement from the lockdown have saved 3,946 premature deaths in Beijing. For medium polluted cities, since the 24-h concentration of PM2.5 ranged between 10 to 25 μg m−3, with occasional incidents exceeding the 24-h WHO AQG, the MA values in 2017–2019 were in the low range, between 0 to 1%.
Figure 4. (a) Range of PM2.5 concentration from the selected cities and (b) calculated range ofestimated mortality attributable proportion from AirQ+.
Atmosphere 2021, 12, x FOR PEER REVIEW 10 of 16
Delhi. However, it is noted that Beijing has a much wider range of PM2.5 (i.e., 10 to 390 μg m−3), partly due to the adverse meteorological conditions in spring (e.g., regional dust storms). As the calculation of MA value considered both the magnitude of 24-h PM2.5 and frequency of exceedance, infrequent super high PM2.5 (i.e., 390 μg m−3) did not trigger a high MA value.
Figure 4. (a) Range of PM2.5 concentration from the selected cities and (b) calculated range of esti-mated mortality attributable proportion from AirQ+.
Figure 5. Mortality rate for six selected cities.
The difference in MA values for Beijing between 2020 and 2017–2019 was about 1.6% (from 4.1% to 2.5%), and the co-benefits of air quality improvement from the lockdown have saved 3,946 premature deaths in Beijing. For medium polluted cities, since the 24-h concentration of PM2.5 ranged between 10 to 25 μg m−3, with occasional incidents exceeding the 24-h WHO AQG, the MA values in 2017–2019 were in the low range, between 0 to 1%.
Figure 5. Mortality rate for six selected cities.
Overall, there are appreciable health co-benefits observed in heavily polluted cities,such as New Delhi and Beijing, while mild health co-benefits are found in medium pollutedcities. In cities with heavy pollution and a large population, their health co-benefits couldbe enormous. In this study, baseline concentration is found to be an important benchmarkin determining the level of public health co-benefits from the pandemic. As the baselineconcentration is highly dependent on the city′s location (e.g., Asia or Europe) and economicstatus, it is expected that some geospatial connection among the cities can be established.
3.2.2. Discussion of Seasonal Variations of Air Quality on Health Co-Benefits
Various studies have demonstrated that COVID-related NPIs have provided someshort-term health co-benefits for cities in Europe and China, while there was less discussion
Atmosphere 2022, 13, 18 11 of 15
in North America. The reported magnitudes and results of health co-benefits in literaturewere highly variable and dependent on the selected period and characteristics of thetargeted location. The influence of meteorology on the effect of pollutant concentrations isalso important. As recalled from the earlier discussion, there was a considerable differencein the short-term health co-benefits among different cities, where New Delhi receivedthe largest co-benefits; no co-benefits were found in New York. In general, a highermonthly PM2.5 concentration suggests a higher overall 24-h concentration and proportionof mortality attributable and, hence, a higher mortality rate. As air quality data commonlyfollows a log-normal distribution, where the frequency of having a high PM2.5 concentrationis relatively small [41,42], the average monthly concentration can be a good proxy toestimate the short-term health co-benefits (in here, mortality).
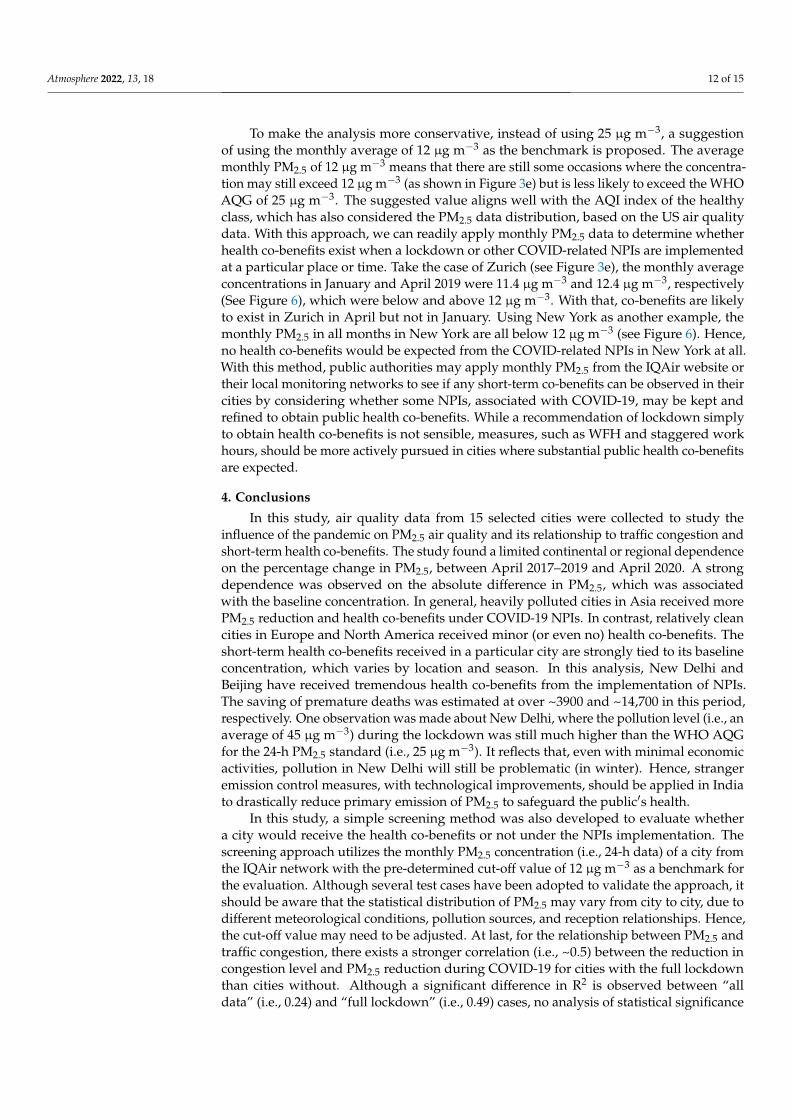
Next, a simple method for screening the short-term health co-benefits across citiesand seasons, using the reported monthly average PM2.5 concentrations, is introduced. Tobetter explain and illustrate the process, Figure 6 shows the summary of monthly PM2.5from 2019, which also served as the pollution baseline for each city. The colors indicatethe US air quality index (AQI) levels for 24-h PM2.5. Green, yellow, orange, red, purple,and brown are referred to as good, moderate, unhealthy for sensitive groups, unhealthy,very unhealthy, and hazardous conditions, respectively. In the figure, New Delhi had thehighest monthly average concentrations of 71.4 µg m−3 and 76.6 µg m−3 in April andMay 2019, respectively, shown in red, which was much higher than the WHO AQG of25 µg m−3. In all 12 months, the average monthly concentrations in New Delhi were higherthan the WHO AQG, meaning that, regardless of which month the lockdown occurred,there should be some associated health co-benefits. Strictly speaking, there are more healthco-benefits in November, December, and January. Let us look at another example. ForLondon, the previous analysis shows that some health co-benefits were observed duringthe lockdown, with the monthly PM2.5 concentration of 22.3 µg m−3 in April (slightlyhigher than 21.7 µg m−3 shown in Figure 6). As shown in Figure 3b), all PM2.5 exceedancesoccurred in April but not in May. Hence, if the lockdown occurred only in May, no co-benefits would be expected. This logic can be applied to all months and cities, in order toquickly determine whether public health co-benefits are present.
Atmosphere 2021, 12, x FOR PEER REVIEW 12 of 16
Figure 6. Summary of monthly PM2.5 for 15 selected cities.
To make the analysis more conservative, instead of using 25 μg m−3, a suggestion of using the monthly average of 12 μg m−3 as the benchmark is proposed. The average monthly PM2.5 of 12 μg m−3 means that there are still some occasions where the concentra-tion may still exceed 12 μg m−3 (as shown in Figure 3e) but is less likely to exceed the WHO AQG of 25 μg m−3. The suggested value aligns well with the AQI index of the healthy class, which has also considered the PM2.5 data distribution, based on the US air quality data. With this approach, we can readily apply monthly PM2.5 data to determine whether health co-benefits exist when a lockdown or other COVID-related NPIs are implemented at a particular place or time. Take the case of Zurich (see Figure 3e), the monthly average con-centrations in January and April 2019 were 11.4 μg m−3 and 12.4 μg m−3, respectively (See Figure 6), which were below and above 12 μg m−3. With that, co-benefits are likely to exist in Zurich in April but not in January. Using New York as another example, the monthly PM2.5 in all months in New York are all below 12 μg m−3 (see Figure 6). Hence, no health co-benefits would be expected from the COVID-related NPIs in New York at all. With this method, public authorities may apply monthly PM2.5 from the IQAir website or their local monitoring networks to see if any short-term co-benefits can be observed in their cities by considering whether some NPIs, associated with COVID-19, may be kept and refined to obtain public health co-benefits. While a recommendation of lockdown simply to obtain health co-benefits is not sensible, measures, such as WFH and staggered work hours, should be more actively pursued in cities where substantial public health co-benefits are expected.
4. Conclusions In this study, air quality data from 15 selected cities were collected to study the influ-
ence of the pandemic on PM2.5 air quality and its relationship to traffic congestion and short-term health co-benefits. The study found a limited continental or regional depend-ence on the percentage change in PM2.5, between April 2017–2019 and April 2020. A strong dependence was observed on the absolute difference in PM2.5, which was associated with the baseline concentration. In general, heavily polluted cities in Asia received more PM2.5 reduction and health co-benefits under COVID-19 NPIs. In contrast, relatively clean cities
Figure 6. Summary of monthly PM2.5 for 15 selected cities.
Atmosphere 2022, 13, 18 12 of 15
To make the analysis more conservative, instead of using 25 µg m−3, a suggestionof using the monthly average of 12 µg m−3 as the benchmark is proposed. The averagemonthly PM2.5 of 12 µg m−3 means that there are still some occasions where the concentra-tion may still exceed 12 µg m−3 (as shown in Figure 3e) but is less likely to exceed the WHOAQG of 25 µg m−3. The suggested value aligns well with the AQI index of the healthyclass, which has also considered the PM2.5 data distribution, based on the US air qualitydata. With this approach, we can readily apply monthly PM2.5 data to determine whetherhealth co-benefits exist when a lockdown or other COVID-related NPIs are implementedat a particular place or time. Take the case of Zurich (see Figure 3e), the monthly averageconcentrations in January and April 2019 were 11.4 µg m−3 and 12.4 µg m−3, respectively(See Figure 6), which were below and above 12 µg m−3. With that, co-benefits are likelyto exist in Zurich in April but not in January. Using New York as another example, themonthly PM2.5 in all months in New York are all below 12 µg m−3 (see Figure 6). Hence,no health co-benefits would be expected from the COVID-related NPIs in New York at all.With this method, public authorities may apply monthly PM2.5 from the IQAir website ortheir local monitoring networks to see if any short-term co-benefits can be observed in theircities by considering whether some NPIs, associated with COVID-19, may be kept andrefined to obtain public health co-benefits. While a recommendation of lockdown simplyto obtain health co-benefits is not sensible, measures, such as WFH and staggered workhours, should be more actively pursued in cities where substantial public health co-benefitsare expected.
4. Conclusions
In this study, air quality data from 15 selected cities were collected to study theinfluence of the pandemic on PM2.5 air quality and its relationship to traffic congestion andshort-term health co-benefits. The study found a limited continental or regional dependenceon the percentage change in PM2.5, between April 2017–2019 and April 2020. A strongdependence was observed on the absolute difference in PM2.5, which was associatedwith the baseline concentration. In general, heavily polluted cities in Asia received morePM2.5 reduction and health co-benefits under COVID-19 NPIs. In contrast, relatively cleancities in Europe and North America received minor (or even no) health co-benefits. Theshort-term health co-benefits received in a particular city are strongly tied to its baselineconcentration, which varies by location and season. In this analysis, New Delhi andBeijing have received tremendous health co-benefits from the implementation of NPIs.The saving of premature deaths was estimated at over ~3900 and ~14,700 in this period,respectively. One observation was made about New Delhi, where the pollution level (i.e., anaverage of 45 µg m−3) during the lockdown was still much higher than the WHO AQGfor the 24-h PM2.5 standard (i.e., 25 µg m−3). It reflects that, even with minimal economicactivities, pollution in New Delhi will still be problematic (in winter). Hence, strangeremission control measures, with technological improvements, should be applied in Indiato drastically reduce primary emission of PM2.5 to safeguard the public′s health.
In this study, a simple screening method was also developed to evaluate whethera city would receive the health co-benefits or not under the NPIs implementation. Thescreening approach utilizes the monthly PM2.5 concentration (i.e., 24-h data) of a city fromthe IQAir network with the pre-determined cut-off value of 12 µg m−3 as a benchmark forthe evaluation. Although several test cases have been adopted to validate the approach, itshould be aware that the statistical distribution of PM2.5 may vary from city to city, due todifferent meteorological conditions, pollution sources, and reception relationships. Hence,the cut-off value may need to be adjusted. At last, for the relationship between PM2.5 andtraffic congestion, there exists a stronger correlation (i.e., ~0.5) between the reduction incongestion level and PM2.5 reduction during COVID-19 for cities with the full lockdownthan cities without. Although a significant difference in R2 is observed between “alldata” (i.e., 0.24) and “full lockdown” (i.e., 0.49) cases, no analysis of statistical significance
Atmosphere 2022, 13, 18 13 of 15
is conducted, due to limited sample sizes (i.e., <10). Hence, for future studies, morecities/stations should be added to allow a more robust statistical analysis to be conducted.
Author Contributions: Conceptualization, Y.-F.L.; methodology, Y.-F.L. and H.-S.Z.; software, Y.-F.L. and J.M.H.C.; validation, B.P.Y.L., K.K.M.L. and K.W.A.; formal analysis, Y.-F.L. and J.M.H.C.;investigation, Y.-F.L. and J.M.H.C.; writing—original draft preparation, Y.-F.L. and J.M.H.C.; writing—review and editing, H.-S.Z., B.P.Y.L., K.K.M.L. and K.W.A. All authors have read and agreed to thepublished version of the manuscript.
Funding: The APC was funded by HKU Geography Research Support Fund.
Acknowledgments: This work was partially supported by Research Grants Council, UniversityGrants Committee (11305817), HKU Seed Fund for Basic Research (104005622), HKU Faculty Start-up(006029001), and the Visiting Research Professors (VRP) Scheme of the University of Hong Kong.
Conflicts of Interest: The authors declare no conflict of interest. The views expressed are those of theauthors and are not formal positions of their organizations.
Appendix A
Atmosphere 2021, 12, x FOR PEER REVIEW 14 of 16
Figure A1. Traffic congestion levels from 15 selected cities.
References 1. Huang, X.; Ding, A.; Gao, J.; Zheng, B.; Zhou, D.; Qi, X.; Tang, R.; Wang, J.; Ren, C.; Nie, W.; et al. Enhanced secondary pollution
offset reduction of primary emissions during COVID-19 lockdown in China. Natl. Sci. Rev. 2021, 8, nwaa137. https://doi.org/10.1093/nsr/nwaa137.
2. Zhang, H.; Lin, Y.; Wei, S.; Loo, B.P.Y.; Lai, P.C.; Lam, Y.F.; Wan, L.; Li, Y. Global association between satellite-derived nitrogen dioxide (NO2) and lockdown policies under the COVID-19 pandemic. Sci. Total Environ. 2021, 761, 144148. https://doi.org/10.1016/j.scitotenv.2020.144148.
3. Loo, B.P.Y.; Tsoi, K.H.; Wong, P.P.Y.; Lai, P.C. Identification of superspreading environment under COVID-19 through human mobility data. Sci. Rep. 2021, 11, 4699. https://doi.org/10.1038/s41598-021-84089-w.
4. Statistica. Year-on-Year Traffic Reduction during a Period of National Emergency Related to Coronavirus in Selected Cities between 12 March and 25 October 2020. Available online: https://www.statista.com/statistics/1106135/change-in-daily-traffic-volume-amid-coronavirus-crisis-key-countries/ (accessed on 10 May 2020).
5. Stone, T. Coronavirus: UK Traffic Levels Rise 10% in Lockdown Three Compared to First Lockdown in 2020. Available online: https://www.traffictechnologytoday.com/news/covid-19-news/coronavirus-uk-traffic-levels-rise-10-in-lockdown-three-compared-to-first-lockdown-in-2020.html (accessed on 11 March 2021).
6. Huang, Y.; Zhou, J.L.; Yu, Y.; Mok, W.-C.; Lee, C.F.C.; Yam, Y.-S. Uncertainty in the Impact of the COVID-19 Pandemic on Air Quality in Hong Kong, China. Atmosphere 2020, 11, 914. https://doi.org/10.3390/atmos11090914.
7. Lam, Y.F.; Loo, B.P.Y.;Zhang, H.S.;Leung,K.K.M.;Axhausen, K.W. People-environment Dynamics under COVID-19. Presented at the COVID-19 and Geography Forum, Hong Kong, China, May 2020.
8. Morris, D.Z. These U.S. cities led the world in reduced car traffic last year. Available online: https://fortune.com/2021/01/12/us-car-traffic-2020-covid-19-tomtom/ (accessed on 11 March 2021).
9. Han, C.; Hong, Y.-C. Decrease in Ambient Fine Particulate Matter during COVID-19 Crisis and Corresponding Health Benefits in Seoul, Korea. Int. J. Environ. Res. Public Health 2020, 17, 5279. https://doi.org/10.3390/ijerph17155279.
10. Chen, Z.; Hao, X.; Zhang, X.; Chen, F. Have traffic restrictions improved air quality? A shock from COVID-19. J. Clean. Prod. 2021, 279, 123622. https://doi.org/10.1016/j.jclepro.2020.123622.
11. Liu, F.; Wang, M.; Zheng, M. Effects of COVID-19 lockdown on global air quality and health. Sci. Total Environ. 2021, 755, 142533. https://doi.org/10.1016/j.scitotenv.2020.142533.
12. Skirienė, A.F.; Stasiškienė, Ž. COVID-19 and Air Pollution: Measuring Pandemic Impact to Air Quality in Five European Countries. Atmosphere 2021, 12, 290.
13. Gautam, A.S.; Dilwaliya, N.K.; Srivastava, A.; Kumar, S.; Bauddh, K.; Siingh, D.; Shah, M.A.; Singh, K.; Gautam, S. Temporary reduction in air pollution due to anthropogenic activity switch-off during COVID-19 lockdown in northern parts of India. Environ. Dev. Sustain. 2021, 23, 8774–8797. https://doi.org/10.1007/s10668-020-00994-6.
Figure A1. Traffic congestion levels from 15 selected cities.
References1. Huang, X.; Ding, A.; Gao, J.; Zheng, B.; Zhou, D.; Qi, X.; Tang, R.; Wang, J.; Ren, C.; Nie, W.; et al. Enhanced secondary pollution
offset reduction of primary emissions during COVID-19 lockdown in China. Natl. Sci. Rev. 2021, 8, nwaa137. [CrossRef][PubMed]
2. Zhang, H.; Lin, Y.; Wei, S.; Loo, B.P.Y.; Lai, P.C.; Lam, Y.F.; Wan, L.; Li, Y. Global association between satellite-derived nitrogendioxide (NO2) and lockdown policies under the COVID-19 pandemic. Sci. Total Environ. 2021, 761, 144148. [CrossRef] [PubMed]
3. Loo, B.P.Y.; Tsoi, K.H.; Wong, P.P.Y.; Lai, P.C. Identification of superspreading environment under COVID-19 through humanmobility data. Sci. Rep. 2021, 11, 4699. [CrossRef]
4. Statistica. Year-on-Year Traffic Reduction during a Period of National Emergency Related to Coronavirus in Selected Citiesbetween 12 March and 25 October 2020. Available online: https://www.statista.com/statistics/1106135/change-in-daily-traffic-volume-amid-coronavirus-crisis-key-countries/ (accessed on 10 May 2020).
Atmosphere 2022, 13, 18 14 of 15
5. Stone, T. Coronavirus: UK Traffic Levels Rise 10% in Lockdown Three Compared to First Lockdown in 2020. Available on-line: https://www.traffictechnologytoday.com/news/covid-19-news/coronavirus-uk-traffic-levels-rise-10-in-lockdown-three-compared-to-first-lockdown-in-2020.html (accessed on 11 March 2021).
6. Huang, Y.; Zhou, J.L.; Yu, Y.; Mok, W.-C.; Lee, C.F.C.; Yam, Y.-S. Uncertainty in the Impact of the COVID-19 Pandemic on AirQuality in Hong Kong, China. Atmosphere 2020, 11, 914. [CrossRef]
7. Lam, Y.F.; Loo, B.P.Y.; Zhang, H.S.; Leung, K.K.M.; Axhausen, K.W. People-environment Dynamics under COVID-19. InProceedings of the Presented at the COVID-19 and Geography Forum, Hong Kong, China, 28 May 2020.
8. Morris, D.Z. These U.S. cities led the world in reduced car traffic last year. Available online: https://fortune.com/2021/01/12/us-car-traffic-2020-covid-19-tomtom/ (accessed on 11 March 2021).
9. Han, C.; Hong, Y.-C. Decrease in Ambient Fine Particulate Matter during COVID-19 Crisis and Corresponding Health Benefits inSeoul, Korea. Int. J. Environ. Res. Public Health 2020, 17, 5279. [CrossRef] [PubMed]
10. Chen, Z.; Hao, X.; Zhang, X.; Chen, F. Have traffic restrictions improved air quality? A shock from COVID-19. J. Clean. Prod. 2021,279, 123622. [CrossRef]
11. Liu, F.; Wang, M.; Zheng, M. Effects of COVID-19 lockdown on global air quality and health. Sci. Total Environ. 2021, 755, 142533.[CrossRef] [PubMed]
12. Skiriene, A.F.; Stasiškiene, Ž. COVID-19 and Air Pollution: Measuring Pandemic Impact to Air Quality in Five EuropeanCountries. Atmosphere 2021, 12, 290. [CrossRef]
13. Gautam, A.S.; Dilwaliya, N.K.; Srivastava, A.; Kumar, S.; Bauddh, K.; Siingh, D.; Shah, M.A.; Singh, K.; Gautam, S. Temporaryreduction in air pollution due to anthropogenic activity switch-off during COVID-19 lockdown in northern parts of India. Environ.Dev. Sustain. 2021, 23, 8774–8797. [CrossRef] [PubMed]
14. Li, J.; Yang, H.; Zha, S.; Yu, N.; Liu, X.; Sun, R. Effects of COVID-19 Emergency Response Levels on Air Quality in theGuangdong-Hong Kong-Macao Greater Bay Area, China. Aerosol Air Qual. Res. 2021, 21, 200416. [CrossRef]
15. Wang, J.; Xu, X.; Wang, S.; He, S.; He, P. Heterogeneous effects of COVID-19 lockdown measures on air quality in Northern China.Appl. Energy 2021, 282, 116179. [CrossRef] [PubMed]
16. Lian, X.; Huang, J.; Huang, R.; Liu, C.; Wang, L.; Zhang, T. Impact of city lockdown on the air quality of COVID-19-hit of Wuhancity. Sci. Total Environ. 2020, 742, 140556. [CrossRef] [PubMed]
17. Venter, Z.S.; Aunan, K.; Chowdhury, S.; Lelieveld, J. COVID-19 lockdowns cause global air pollution declines. Proc. Natl. Acad.Sci. USA 2020, 117, 18984. [CrossRef]
18. Gope, S.; Dawn, S.; Das, S.S. Effect of COVID-19 pandemic on air quality: A study based on Air Quality Index. Environ. Sci. Pollut.Res. 2021, 28, 35564–35583. [CrossRef] [PubMed]
19. Keller, C.A.; Evans, M.J.; Knowland, K.E.; Hasenkopf, C.A.; Modekurty, S.; Lucchesi, R.A.; Oda, T.; Franca, B.B.; Mandarino, F.C.;Díaz Suárez, M.V.; et al. Global impact of COVID-19 restrictions on the surface concentrations of nitrogen dioxide and ozone.Atmos. Chem. Phys. 2021, 21, 3555–3592. [CrossRef]
20. Chauhan, A.; Singh, R.P. Decline in PM2.5 concentrations over major cities around the world associated with COVID-19. Environ.Res. 2020, 187, 109634. [CrossRef]
21. Tobías, A.; Carnerero, C.; Reche, C.; Massagué, J.; Via, M.; Minguillón, M.C.; Alastuey, A.; Querol, X. Changes in air quality duringthe lockdown in Barcelona (Spain) one month into the SARS-CoV-2 epidemic. Sci. Total Environ. 2020, 726, 138540. [CrossRef][PubMed]
22. Kumar, P.; Hama, S.; Omidvarborna, H.; Sharma, A.; Sahani, J.; Abhijith, K.V.; Debele, S.E.; Zavala-Reyes, J.C.; Barwise, Y.; Tiwari,A. Temporary reduction in fine particulate matter due to ‘anthropogenic emissions switch-off’ during COVID-19 lockdown inIndian cities. Sustain. Cities Soc. 2020, 62, 102382. [CrossRef]
23. Li, L.; Li, Q.; Huang, L.; Wang, Q.; Zhu, A.; Xu, J.; Liu, Z.; Li, H.; Shi, L.; Li, R.; et al. Air quality changes during the COVID-19lockdown over the Yangtze River Delta Region: An insight into the impact of human activity pattern changes on air pollutionvariation. Sci. Total Environ. 2020, 732, 139282. [CrossRef]
24. Wang, Y.; Yuan, Y.; Wang, Q.; Liu, C.; Zhi, Q.; Cao, J. Changes in air quality related to the control of coronavirus in China:Implications for traffic and industrial emissions. Sci. Total Environ. 2020, 731, 139133. [CrossRef]
25. Mak, H.W.L.; Lam, Y.F. Comparative assessments and insights of data openness of 50 smart cities in air quality aspects. Sustain.Cities Soc. 2021, 69, 102868. [CrossRef]
26. Mukherjee, A.; Toohey, D.W. A study of aerosol properties based on observations of particulate matter from the U.S. Embassy inBeijing, China. Earth’s Future 2016, 4, 381–395. [CrossRef]
27. IQAir. 2019 World Air Quality Report. Available online: https://www.iqair.com/world-air-quality-ranking (accessed on11 March 2021).
28. TomTom. 2020 TomTom Traffic Index Ranking. Available online: https://www.tomtom.com/en_gb/traffic-index/ranking/(accessed on 21 June 2020).
29. Oliveri Conti, G.; Heibati, B.; Kloog, I.; Fiore, M.; Ferrante, M. A review of AirQ Models and their applications for forecasting theair pollution health outcomes. Environ. Sci. Pollut. Res. 2017, 24, 6426–6445. [CrossRef] [PubMed]
30. Rovira, J.; Domingo, J.L.; Schuhmacher, M. Air quality, health impacts and burden of disease due to air pollution (PM10, PM2.5,NO2 and O3): Application of AirQ+ model to the Camp de Tarragona County (Catalonia, Spain). Sci. Total Environ. 2020,703, 135538. [CrossRef] [PubMed]
Atmosphere 2022, 13, 18 15 of 15
31. Ansari, M.; Ehrampoush, M.H. Meteorological correlates and AirQ+ health risk assessment of ambient fine particulate matter inTehran, Iran. Environ. Res. 2019, 170, 141–150. [CrossRef]
32. United Nations Department of Economic and Social Affairs, Population Division. 2019 Revision of World Population Prospects.Available online: https://population.un.org/wpp/ (accessed on 21 June 2020).
33. World Health Organization. Occupational and Environmental Health Team. WHO Air Quality Guidelines for Particulate Matter,Ozone, Nitrogen Dioxide and Sulfur Dioxide: Global Update 2005: Summary of Risk Assessment. Available online: https://apps.who.int/iris/handle/10665/69477 (accessed on 21 June 2020).
34. Mudu, P.; Gapp, C.; Dunbar, M. AirQ+-Example of Calculations; World Health Organization, Regional Office for Europe: Copen-hagen, Denmark, 2018.
35. AppleMaps. Mobility Trends Reports. Available online: https://covid19.apple.com/mobility (accessed on 21 June 2020).36. HKU-Geog. COVID-19 Forum: People-environment Dynamics under COVID-19. 2020. Available online: https://www.matpp.
hku.hk/post/f20200528 (accessed on 21 June 2020).37. Molloy, J.; Tchervenkov, C.; Hintermann, B.; Axhausen, K.W. Tracing the Sars-CoV-2 impact. The first month in Switzerland–March
to April 2020. Arb. Verk.- Raumplan. 2020, 1503, 1–8. [CrossRef]38. CILTHK. Impact of COVID-19 on Hong Kong’s Transport; The Chartered Institute of Logistics and Transport: Hong Kong,
China, 2020.39. Yao, Z.; Wei, H.; Perugu, H.; Liu, H.; Li, Z. Sensitivity analysis of project level MOVES running emission rates for light and heavy
duty vehicles. J. Traffic Transp. Eng. 2014, 1, 81–96. [CrossRef]40. Liu, D.; Lou, D.; Liu, J.; Fang, L.; Huang, W. Evaluating nitrogen oxides and ultrafine particulate matter emission features of
urban bus based on real-world driving conditions in the Yangtze River Delta Area, China. Sustainability 2018, 10, 2051. [CrossRef]41. Gardner, M.J. Lognormality of trace contaminant concentrations in sewage effluents. Environ. Monit. Assess. 2014, 186, 4819–4827.
[CrossRef]42. Sansuddin, N.; Sansuddin, N.; Ramli, N.A.; Ramli, N.A.; Yahaya, A.S.; Yahaya, A.S.; Yusof, N.F.F.M.D.; Yusof, N.F.F.M.D.; Ghazali,
N.A.; Ghazali, N.A.; et al. Statistical analysis of PM10 concentrations at different locations in Malaysia. Environ. Monit. Assess.2011, 180, 573–588. [CrossRef]