Traffic impacts on PM2.5 air quality in Nairobi, Kenya
18
Traffic Impacts on PM 2.5 Air Quality in Nairobi, Kenya Patrick L. Kinney 1,* , Michael Gatari Gichuru 2 , Nicole Volavka-Close 3 , Nicole Ngo 4 , Peter K. Ndiba 5 , Anna Law 1 , Anthony Gachanja 6 , Samuel Mwaniki Gaita 2 , Steven N. Chillrud 7 , and Elliott Sclar 4 1 Department of Environmental Health Sciences, Mailman School of Public Health, Columbia University, 722 West 168th St., New York, NY 10032, USA, [email protected] (Kinney), [email protected] (Law) 2 Institute of Nuclear Science and Technology, College of Architecture and Engineering, University of Nairobi, P.O. Box 30197, G.P.O., Nairobi, Kenya, [email protected] (Gatari), [email protected] (Gaita) 3 Center Center for Sustainable Urban Development, Earth Institute, Columbia University, 475 Riverside Drive, Suite 520, New York, NY 10115, USA, [email protected] (Volavka- Close), [email protected] (Sclar) 4 Columbia University, PhD candidate in Sustainable Development in the College of Arts and Sciences, School of International and Public Affairs, 420 West 118th Street, New York, NY 10027, USA, [email protected] 5 Department of Civil Engineering, College of Architecture and Engineering, University of Nairobi, P. O. Box 30197, G.P.O., Nairobi, Kenya, [email protected] 6 Department of Chemistry, Jomo Kenyatta University of Agriculture and Technology, P.O. Box 62000 – 00200, Nairobi, Kenya, [email protected] 7 Lamont-Doherty Earth Observatory, Columbia University, 61 Rt 9W, Palisades, NY 10964, USA, [email protected] Abstract Motor vehicle traffic is an important source of particulate pollution in cities of the developing world, where rapid growth, coupled with a lack of effective transport and land use planning, may result in harmful levels of fine particles (PM 2.5 ) in the air. However, a lack of air monitoring data hinders health impact assessments and the development of transportation and land use policies that could reduce health burdens due to outdoor air pollution. To address this important need, a study of traffic-related PM 2.5 was carried out in the city of Nairobi, Kenya, a model city for sub-Saharan Africa, in July 2009. Sampling was carried out using portable filter-based air samplers carried in backpacks by technicians on weekdays over two weeks at several sites in and around Nairobi ranging from high-traffic roadways to rural background. Mean daytime concentrations of PM 2.5 ranged from 10.7 at the rural background site to 98.1 μg/m 3 on a sidewalk in the central business district. Horizontal dispersion measurements demonstrated a decrease in PM 2.5 concentration from 128.7 to 18.7 μg/m 3 over 100 meters downwind of a major intersection in Nairobi. A vertical © 2011 Elsevier Ltd. All rights reserved. * Corresponding Author: Department of Environmental Health Sciences, Mailman School of Public Health, Columbia University, 722 West 168th St., New York, NY 10032, USA, [email protected], Tel.: +1-212-305-3663, Fax: +1-212-305-4012. Publisher's Disclaimer: This is a PDF file of an unedited manuscript that has been accepted for publication. As a service to our customers we are providing this early version of the manuscript. The manuscript will undergo copyediting, typesetting, and review of the resulting proof before it is published in its final citable form. Please note that during the production process errors may be discovered which could affect the content, and all legal disclaimers that apply to the journal pertain. NIH Public Access Author Manuscript Environ Sci Policy. Author manuscript; available in PMC 2012 June 1. Published in final edited form as: Environ Sci Policy. 2011 June ; 14(4): 369–378. doi:10.1016/j.envsci.2011.02.005. NIH-PA Author Manuscript NIH-PA Author Manuscript NIH-PA Author Manuscript
-
Upload
independent -
Category
Documents
-
view
2 -
download
0
Transcript of Traffic impacts on PM2.5 air quality in Nairobi, Kenya
Traffic Impacts on PM2.5 Air Quality in Nairobi, Kenya
Patrick L. Kinney1,*, Michael Gatari Gichuru2, Nicole Volavka-Close3, Nicole Ngo4, Peter K.Ndiba5, Anna Law1, Anthony Gachanja6, Samuel Mwaniki Gaita2, Steven N. Chillrud7, andElliott Sclar4
1Department of Environmental Health Sciences, Mailman School of Public Health, ColumbiaUniversity, 722 West 168th St., New York, NY 10032, USA, [email protected] (Kinney),[email protected] (Law)2Institute of Nuclear Science and Technology, College of Architecture and Engineering, Universityof Nairobi, P.O. Box 30197, G.P.O., Nairobi, Kenya, [email protected] (Gatari),[email protected] (Gaita)3Center Center for Sustainable Urban Development, Earth Institute, Columbia University, 475Riverside Drive, Suite 520, New York, NY 10115, USA, [email protected] (Volavka-Close), [email protected] (Sclar)4Columbia University, PhD candidate in Sustainable Development in the College of Arts andSciences, School of International and Public Affairs, 420 West 118th Street, New York, NY10027, USA, [email protected] of Civil Engineering, College of Architecture and Engineering, University of Nairobi,P. O. Box 30197, G.P.O., Nairobi, Kenya, [email protected] of Chemistry, Jomo Kenyatta University of Agriculture and Technology, P.O. Box62000 – 00200, Nairobi, Kenya, [email protected] Earth Observatory, Columbia University, 61 Rt 9W, Palisades, NY 10964, USA,[email protected]
AbstractMotor vehicle traffic is an important source of particulate pollution in cities of the developingworld, where rapid growth, coupled with a lack of effective transport and land use planning, mayresult in harmful levels of fine particles (PM2.5) in the air. However, a lack of air monitoring datahinders health impact assessments and the development of transportation and land use policies thatcould reduce health burdens due to outdoor air pollution. To address this important need, a studyof traffic-related PM2.5 was carried out in the city of Nairobi, Kenya, a model city for sub-SaharanAfrica, in July 2009. Sampling was carried out using portable filter-based air samplers carried inbackpacks by technicians on weekdays over two weeks at several sites in and around Nairobiranging from high-traffic roadways to rural background. Mean daytime concentrations of PM2.5ranged from 10.7 at the rural background site to 98.1 μg/m3 on a sidewalk in the central businessdistrict. Horizontal dispersion measurements demonstrated a decrease in PM2.5 concentration from128.7 to 18.7 μg/m3 over 100 meters downwind of a major intersection in Nairobi. A vertical
© 2011 Elsevier Ltd. All rights reserved.*Corresponding Author: Department of Environmental Health Sciences, Mailman School of Public Health, Columbia University, 722West 168th St., New York, NY 10032, USA, [email protected], Tel.: +1-212-305-3663, Fax: +1-212-305-4012.Publisher's Disclaimer: This is a PDF file of an unedited manuscript that has been accepted for publication. As a service to ourcustomers we are providing this early version of the manuscript. The manuscript will undergo copyediting, typesetting, and review ofthe resulting proof before it is published in its final citable form. Please note that during the production process errors may bediscovered which could affect the content, and all legal disclaimers that apply to the journal pertain.
NIH Public AccessAuthor ManuscriptEnviron Sci Policy. Author manuscript; available in PMC 2012 June 1.
Published in final edited form as:Environ Sci Policy. 2011 June ; 14(4): 369–378. doi:10.1016/j.envsci.2011.02.005.
NIH
-PA Author Manuscript
NIH
-PA Author Manuscript
NIH
-PA Author Manuscript

dispersion experiment revealed a decrease from 119.5 μg/m3 at street level to 42.8 μg/m3 on athird-floor rooftop in the central business district. Though not directly comparable to air qualityguidelines, which are based on 24-hour or annual averages, the urban concentrations we observedraise concern with regard to public health and related policy. Taken together with survey data oncommuting patterns within Nairobi, these results suggest that many Nairobi residents are exposedon a regular basis to elevated concentrations of fine particle air pollution, with potentially seriouslong-term implications for health.
Keywordsoutdoor air quality; health; urban; transport; sub-Saharan Africa; Nairobi
1. IntroductionMotor vehicle traffic is an important source of harmful emissions of particulate pollution incities of the developing world, where economic growth, coupled with a lack of effectivetransport and land use planning is resulting in increasing vehicle ownership and trafficcongestion. These factors combine to create air pollution hotspots near roads. Urban growthis expected to continue at a rapid pace in the developing world, particularly in sub-SaharanAfrica (UN, 2010) as rural populations continue to migrate to cities in search of employmentand expectations of better living conditions. If nothing is done to reduce emissions and tobetter plan for urbanization, this trend can be expected to further exacerbate already seriousair quality problems in sub-Saharan African cities as well as the health impacts thataccompany them. Fine particulate matter (PM2.5), generated by fuel combustion (e.g., inmotor vehicles) has been linked to a wide range of health effects, including more than800,000 deaths in cities around the world (Cohen et al., 2004; Pope and Dockery, 2006).However, little information exists on levels of particulate air pollutants currentlyexperienced by urban residents in Africa (Gatari et al., 2005; Maina et al., 2006; van Vlietand Kinney, 2007). This data gap hinders health impact assessments, the development ofcost-effective strategies to reduce the health burden due to outdoor air pollution and theability to influence urban transportation and planning policies in relation to air quality andhealth.
Nairobi, Kenya is in many ways typical of the fast growing cities of sub-Saharan Africa.Central Nairobi had a resident population of 3.2 million in 2009 with a daytime populationof 4.2 million (Kenya National Bureau of Statistics (KNBS) 2008, in Ministry of Transport2010). The resident population is up from about 1.3 million in 1989 (East African StatisticalDepartment, in Obudho, 1997) representing a 3.9% annual growth. Similarly, the overallproportion of urban dwellers in Kenya has increased from 8% in the 1980s to over 34% in2003 and is expected to reach 50% by 2020 (KNBS, 2008 in Ministry of Transport, 2010).The larger Nairobi metropolitan area had a population of 6.1 million in 2007, which isprojected to rise to over 12 million by 2030 (Ministry of Nairobi Metropolitan Development,2008). Much of this growth is occurring in the peri-urban regions, which are absorbingspillovers from the central city where scarce rental housing is increasingly unaffordable toaverage citizens. This growth, combined with a lack of investment in public transport andurban road infrastructure has resulted in increasing road deterioration, numbers of motorvehicles and congestion (Ministry of Transport and Communications, 2004). Spatially, thegrowth is taking the shape of urban sprawl which, along with growing urban air pollutionexacerbates a number of other health risks, such as diabetes (see for example, Frumkin et al.,2004). Commercial and industrial activities remain concentrated in a central area wheretraffic congestion has become the norm. In an attempt to alleviate congestion, large-scaleroad infrastructure projects are currently underway in and around Nairobi and others are
Kinney et al. Page 2
Environ Sci Policy. Author manuscript; available in PMC 2012 June 1.
NIH
-PA Author Manuscript
NIH
-PA Author Manuscript
NIH
-PA Author Manuscript

being planned. Considerations for long-term improvements in air quality and health must betaken into account as these projects are planned and implemented. Thus, the results of thisstudy come at a crucial time.
It has been estimated that 90% of urban air pollution in rapidly growing cities in developingcountries is attributable to motor vehicle emissions (UNEP, 2011) so while there are manysources of air pollution in Nairobi, including open air burning of refuse and biomass (Gatari,2006), industrial operations and domestic cooking fires, motor vehicles play a critical role inthe problem. Increasing road congestion, along with a high prevalence of old, poorly-maintained vehicles and of low quality fuels, contribute to this problem. One projectionestimates that in a “do nothing” (or business as usual) scenario, the number of vehicle tripsbetween 2004 and 2025 in the Nairobi Metropolitan Area will increase by 148% and that theaverage speed of trips will decrease from 35km/hr to 11km/hr as congestion increases(Japanese International Cooperation Agency, 2006) which makes it reasonable to assumethat if nothing is done, urban air quality will worsen. The mixture of vehicles in 2004 was29% passenger cars, 35% light-duty trucks, 7% heavy-duty trucks, 7% minibuses (Matatus),and 22% others (KNBS, 2007). Between 2002 and 2006, the number of trucks increased byabout 60% (KNBS, 2007), reflecting increased activities in the agricultural and industrialsectors. Most trucks and buses rely on high sulfur diesel fuel (≤5000 ppm S) which leads tohigh particulate emissions. A large proportion of newly-registered vehicles in Nairobi areimported as used vehicles from East Asia.
There are important health implications of roadway emissions, particularly for highlyexposed individuals near roadways and/or for population subgroups that are particularlysensitive to health effects, such as children and the elderly (Pope et al., 2002; Jansen et al.,2005; Ibald-Mulli, 2004). Of great concern are the large concentrations of pedestrians whowalk along busy Nairobi roads. Aligula et al., (2005) reported that 49% of daily trips inNairobi were either on foot or bicycle. However, bicycle use was limited by safety concerns(especially over lack of bicycle lanes) (Khayesi et al., 2010). Another 42% of trips usedminibuses or other forms of public transport, while 9% were made in private vehicles.Another significant concern involves populations such as street vendors and traffic police,who spend their days along and on congested roadsides and roads.
Motor vehicle emissions include a range of pollutants, including particulate matter (PM),carbon monoxide, sulfur oxides, nitrogen oxides and a wide range of volatile organiccompounds, which react with sunlight to form ozone Many of these pollutants have well-known health effects which may be exhibited with short term exposure, including wheezing,coughing, shortness of breath phlegm and sore throats as well as irritation of existingrespiratory conditions such as asthma (Hedley et al, 2003; Frumkin et al, 2004, Schwela etal, 2006). However, PM2.5 is of particular significance because research on health effects inurban areas has demonstrated associations between both short-term and long-term averageambient PM2.5 concentrations and a variety of adverse health outcomes. These includeincreased post neonatal infant mortality (Woodruff et al, 2006) and premature deaths relatedto heart and lung diseases (e.g., Dockery et al, 1993; Schwartz, 1994; Samet et al., 2000;Pope et al., 2002). PM2.5 is a complex mixture of solid or liquid organic and inorganicparticles that share the property of being less than/equal to 2.5 μm in aerodynamic diameter.Because of their small sizes, PM2.5 particles are able to penetrate deeply into the lungswhere they can exert adverse effects. In 2005, the World Health Organization (WHO), basedon known health effects, set a 24-hour average guideline of 25 μg/m3 and an annual averageguideline of 10 μg/m3. PM2.5 includes black carbon (BC), or soot, which is emitted byincomplete combustion sources including diesel and poorly-tuned gasoline engines, andopen fires. In addition to adverse health impacts (USEPA, 2002; Bell et al., 2009), BCcontributes to climate change (Ramanathan and Carmichael, 2008).
Kinney et al. Page 3
Environ Sci Policy. Author manuscript; available in PMC 2012 June 1.
NIH
-PA Author Manuscript
NIH
-PA Author Manuscript
NIH
-PA Author Manuscript

Understanding and quantifying the effects of roadway traffic on PM2.5 concentrations inNairobi would help improve the knowledge base to influence and support urgently neededpolicy solutions aimed at improving health through decreased transport emissions. Toaddress this important need, the Nairobi Area Traffic Contribution to Air Pollution(NATCAP) study was carried out in the summer of 2009. The overall objective of the studywas to characterize the impacts of heavy motor vehicle traffic on concentrations of PM2.5near roadways in Nairobi so that levels of exposure and their possible impacts on healthcould be considered.
2. MethodsIn this collaborative study, Columbia University, University of Nairobi and Jomo KenyattaUniversity of Agriculture and Technology together undertook an intensive air monitoringcampaign for PM2.5 during two weeks in July 2009. Nairobi is located 1.32°S and 36.9°Eand experiences two rainy seasons; one from March to May and another from October toDecember. Its proximity near the equator lends to overall mild winters, but due to its altitude(approximately 1.6 km above sea level), Nairobi experiences some seasonal variation intemperatures (Gatari and Boman, 2005). Sampling was carried out on weekdays (Mondaythrough Friday) at a range of sites in and around Nairobi ranging from high-traffic roadwaysto rural background (see supplemental material Figures 1 and 2). Measurements were takenon the weekdays to capture typical concentrations at times of highest vehicle and pedestriantraffic on Nairobi streets.
Air monitoring was carried out simultaneously at five core sites from 0730 to 1830 hr fornine days, with the tenth day reserved for field blank measurements. These five sitesincluded Ronald Ngala, Tom Mboya, and River Road, which represented heavy-traffic sitesin the Central Business District of Nairobi (CBD); Thika Road, a highway linking outlyingperi-urban areas and suburbs with Nairobi; and Kenyatta University, a rural background site.As part of a separate ongoing study (led by Gothenburg University, Sweden), monitoringwas also carried out on the rooftop at the University of Nairobi’s main campus in the CBD.Since this site was not directly impacted by traffic, it may be viewed as an urban backgroundsite for the purposes of the present study. While included here for reference, these latter dataare not directly comparable because the samples were collected over 24-hour intervals.
Nairobi’s downtown CBD is characterized by retail shops, supermarkets, and various otherbusinesses, and has high vehicle and pedestrian traffic. In addition, the CBD serves as animportant transfer point for minibuses linking urban, peri-urban and rural destinations.Monitoring was carried out at three sites within the CBD. The River Road site had highbuildings on either side of the street forming a street canyon. There were several hotels inthe vicinity. The Ronald Ngala site was near a major minibus stop and near a congestedpickup point for passengers. The Tom Mboya site was near the Kenya National Archivebuilding and experienced heavy pedestrian and vehicle traffic most of the day.
Thika Road serves as an important commuter route into and out of Nairobi, serving both theexpanding Nairobi metropolis and the heavily populated central and eastern regions ofKenya. Traffic jams on this road begin as early as 0530 hr for those traveling into Nairobi,and again in the evening to as late as 2030 hr. Sampling was conducted on both sides of thishighway.
The rural background site at Kenyatta University was located approximately 20 kmnortheast of downtown. The sampler was placed on a chair in an open field on a remote areaof the university grounds.
Kinney et al. Page 4
Environ Sci Policy. Author manuscript; available in PMC 2012 June 1.
NIH
-PA Author Manuscript
NIH
-PA Author Manuscript
NIH
-PA Author Manuscript

In addition to the five sites sampled every day, air samples were also taken at two spatialdispersion sites for 3-4 days during the study. A horizontal dispersion site was located at thehigh-traffic Chiromo-Museum intersection near the University of Nairobi, where sampleswere taken on four days. The objective was to examine the decrease in PM2.5 concentrationswith increasing distances downwind of a major intersection. At this site, the prevailingwinds were south easterlies, and samples were taken simultaneously at the curbside upwindof the road (southeast of the intersection), immediately downwind (northwest of theintersection), and at 30 m and 100 m downwind in a straight line.
A vertical dispersion site situated in the Nairobi CBD was sampled for three days. It waslocated near the Nairobi Fire Station at a busy intersection that marks the junction of TomMboya Street and River Road. Tall buildings line both sides of the street, creating a streetcanyon, with the main source of air flowing through this canyon from the intersection. Atthis site, measurements were taken at the street level (~1.2 m agl), 2nd floor of the building(~4 m agl), 3rd floor (~10 m agl), and the third floor rooftop (four levels above ground, or~17 m agl).
Air monitoring was carried out by 60 field technicians (mainly students and recent graduatesfrom the University of Nairobi) hired specifically for the project. Supervision and qualitycontrol was carried out by a separate group of students and staff at the Institute of NuclearScience and Technology (INST) at the University of Nairobi and from Columbia University.Technicians worked daily in one of two six-hour shifts. The first shift ran from 0700 to 1300hr and the second shift from 1300 to 1900 hr. As mentioned above, sampling was carried outfrom 0730 to 1830 hr each day at each site; the extra half hour in each of the shifts was usedfor preparation and travel to the sites. Every group and shift had a floating student whofacilitated rest times after every hour. Prior to the start of the monitoring campaign, thesupervisors held a series of four meetings to strategize and train everybody who wasinvolved in the exercise. Full staff meetings were also held on Saturdays during the study toreview the previous sampling week’s challenges and successes.
Airborne particle concentrations were monitored using portable air sampling instrumentshoused in backpacks carried by field technicians. The instrument pumped air at 4 liters perminute (LPM) through an anodized aluminum cyclone (BGI Inc., Waltham, MA) to removeparticles larger than 2.5 μm in aerodynamic diameter before depositing smaller particles on aTeflon filter fitted into a plastic cassette downstream of the cyclone. Air was drawn by aBGI personal vacuum pump powered by a rechargeable battery-pack. Flow rates weremeasured and recorded before and after each sampling event by trained staff from ColumbiaUniversity and INST using rotameters (SKC) that were pre-calibrated by a mass flow meter(TSI Model 4199). The times of the sampling period were recorded using a digital minutetimer on the pump. After sampling, filter cassettes were separated from the tubing andpumps, then capped and placed in air-tight plastic bags.
The sample filters were transported to Columbia University where they were analyzed formass (PM2.5). Filters were then preserved for later analyses (e.g., black carbon, trace metals,PAHs). All filters were pre-weighed at Columbia University before shipment to Nairobiunder controlled temperature and humidity conditions in a HEPA-filtered hood. The filterswere re-weighed under the same conditions after sampling to determine PM2.5 mass.
Pumps were carried in backpacks, with the inlet nozzle placed near the shoulder toapproximate the pedestrian breathing zone. For the sites in the CBD, a student carrying abackpack stood on the curbside of the road for one hour then crossed the road and sampledfor another hour. This sampling process was repeated throughout the sampling period tocapture an average sample of both sides of the road. At Thika Road, air samples were taken
Kinney et al. Page 5
Environ Sci Policy. Author manuscript; available in PMC 2012 June 1.
NIH
-PA Author Manuscript
NIH
-PA Author Manuscript
NIH
-PA Author Manuscript

simultaneously on both curbsides of the road using two separate air monitors since it wasdangerous to cross the road on foot. Dispersion site monitoring was carried out using onesampler for each sub-location (i.e., various horizontal or vertical distances), with two tothree students per sampling location. The experiments were closely supervised by seniorinvestigators to ensure proper procedures were followed. Site-to-site and day-to-daydifferences in particle concentrations were analyzed using one-way analysis of variance.
3. ResultsMean concentrations of PM2.5 at the five core sampling sites varied markedly, ranging from10.7 to 98.1 μg/m3 (Table 1 and Figure 1), with highest levels observed at the three sites inthe CBD, slightly lower concentrations on Thika Road (the commuter route), and very lowconcentrations at the rural background site at Kenyatta University. Site to site variationswere statistically significant across all five sites, across the four traffic sites, and across thethree CBD sites in 2-way ANOVA analyses. PM2.5 at the University of Nairobi rooftop sitewas intermediate to those from Thika Road and Kenyatta University. Though within theCBD, the University of Nairobi site was located on a 5th floor rooftop and away from majortraffic sources. It also monitored 24-hr average concentrations which thus includednighttime concentrations which were expected to be lower than daytime concentrationsmonitored at the five core sites.
Results from the horizontal dispersion site (Table 1 and Figure 2) show a rapid reduction inPM2.5 concentrations with increasing distance from the intersection. Concentrationsimmediately adjacent to the intersection averaged 50.7 μg/m3 in the usual upwind directionand 128.7 μg/m3 in the usual downwind direction implying the high influence of vehicleemissions downwind. After 30 and 100 m, concentrations in the usual downwind directionwere reduced to 28.4 and 18.7 μg/m3 respectively. This represented over a six-folddifference in concentrations within 100 m of the traffic source. The intersection was outsideof the CBD and adjacent to university sports fields, which meant that the traffic in, out andaround the intersection was the primary source of particulate matter in this location. This isreflected in the relatively low concentrations seen 100 m downwind, which were lower thanthe upwind location and substantially below those seen on the University of Nairobi rooftop(also shown in Table 1). These findings indicate that the concept of “urban background” issite specific and must take account of local and regional sources as well as geography inorder to be interpretable.
Similar to the horizontal dispersion site, the vertical dispersion experiment (Table 1 andFigure 3) revealed a decrease in PM2.5 concentrations with vertical distance away from theroadway ground level in the street canyon site located in the CBD. Mean PM2.5concentrations at different heights over three days of monitoring ranged from 119.5 μg/m3at curbside, 76.3 μg/m3 on the first floor balcony, 56.9 μg/m3 on the third floor balcony, to42.8 μg/m3 on the rooftop. The lowest concentration, on the rooftop, was similar to butgreater than those monitored on the University of Nairobi rooftop site, perhaps reflecting theimpact of greater traffic volumes near the vertical dispersion site.
4. Discussion and Policy ImplicationsDaytime concentrations of PM2.5 were seen to be very high at sites located adjacent toroadways in this study, ranging from 50.7 to 128.7 μg/m3 across the three CBD sites, thecommuter route, and the near-roadway locations at the horizontal and vertical dispersionsites. These data represent averages of daytime levels over 3-9 days, and thus cannot bedirectly compared with health-based guideline concentrations. As noted above, the WHO’s24-hour average guideline is 25 μg/m3 and the annual average guideline is 10 μg/m3 (WHO,
Kinney et al. Page 6
Environ Sci Policy. Author manuscript; available in PMC 2012 June 1.
NIH
-PA Author Manuscript
NIH
-PA Author Manuscript
NIH
-PA Author Manuscript

2006). Since our data were collected for just two weeks in July, it is of interest to know howthis period compares to other seasons in Nairobi. Systematic, year-round monitoring data donot yet exist for Nairobi. However, preliminary inferences can be derived from monthlyaverage total suspended particulate (TSP) matter and elemental concentrations (e.g.,Bromine) reported for Nairobi between December 1993 and October 1004 by Gatebe andcolleagues (Gatebe et al., 1996). Considerable month to month variability was seen for TSP,and July was among the lowest months reported. Bromine concentrations showed lessseasonality, and July appeared to fall at or slightly below the annual mean. Bromine hasbeen shown to be a tracer for fine particles in the east African city of Dar es Salaam,Tanzania (Bennett et al., 2005). Our data generally indicated that roadside concentrationswere higher than concentrations monitored simultaneously at urban sites away fromroadways. This was confirmed by the horizontal and vertical dispersion sites, which showedsharp concentration declines with distance away from roadway sources. Based on theseobservations, we tentatively conclude that traffic emissions were likely the dominant sourceof PM2.5 during our study. However, a firm conclusion in this regard would require moreextensive data, including trace elements (work in progress). While it is agreed that trafficemissions world-wide contribute significantly to PM air pollution, it would be useful inmore extensive future studies to determine the contribution of other sources, such asindustry and biomass burning.
We can compare our horizontal dispersion results to those from a PM2.5 roadside dispersionstudy in Hong Kong, which employed a protocol similar to ours. In the Hong Kong study,PM2.5 concentrations decreased very slowly with distance from the road, going from 57 μg/m3 by the roadside, to 54 μg/m3 at the 30 m distance, to 48 μg/m3 at the 100 m distance(Wang et al., 2006). In comparison, at our Nairobi dispersion site, average concentrations bythe roadside (0 m) were more than four times higher than average concentrations 30 maway, and over six times higher than those 100 m away. The difference between these twodispersion profiles may be attributed to differences in the geography and dominant source ofambient PM2.5 between the two cities. The Hong Kong study was set in a dense urbanlocation, where buildings prevented PM2.5 from dispersing quickly. Our Nairobi site waslocated on the edge of open sports fields, allowing the uninhibited flow of wind and therapid dispersion of pollutants away from the heavy traffic roadway. Furthermore, studieshave shown that the primary source of PM2.5 in Hong Kong is not local vehicle emissionsbut regional industrial emissions from the Pearl River Delta (Hagler et al., 2007). Incontrast, the Nairobi dispersion profile showed a sharp drop in concentrations that wasdetermined almost entirely by roadway emissions. This result implies that concentrationscould be substantially reduced by regulations directed at vehicular emissions in Nairobi.This idea is supported by a recently published 2003 study, which found that levels of PM10were well above WHO guidelines on a roundabout connecting two Nairobi highways(University and Uhuru) and that the strong correlation between fine particulates and vehicledensity indicated that vehicular emissions were the main source of fine particulate matter(Odhiambo et al, 2010). An earlier study in Nairobi reported highly elevated PM2.5 and BCconcentrations measured while driving in the CBD and on Thika Road (van Vliet andKinney, 2007).
We can also compare our particulate matter concentrations with data from those observed inother cities. In Accra, Ghana, annual average roadside PM2.5 levels ranged from 39 to 53 ug/m3 (Dionisio et al, 2010). Near-road measurements in that study were taken at the rooftoplevel and are fairly similar to the rooftop measurements at our vertical dispersion site. It maybe plausible to assume that if measurements in the Accra study were taken on sidewalks, asin our study, that higher concentrations may have been observed.
Kinney et al. Page 7
Environ Sci Policy. Author manuscript; available in PMC 2012 June 1.
NIH
-PA Author Manuscript
NIH
-PA Author Manuscript
NIH
-PA Author Manuscript
In North America, a sidewalk air quality monitoring study conducted in an underprivilegedurban neighborhood in New York City (Harlem) where diesel vehicle traffic density wasdisproportionately high found that PM2.5 levels over five summer days averaged 42 μg/m3
(Kinney et al, 2000). Similar to our Nairobi study, samples were taken at about shoulder-level, using portable monitors worn by project staff, An investigation into asthmahospitalizations in New York City showed that several sections of this New York Cityneighborhood had the highest rates (Carr et al, 1992 in Kinney et al, 2000). Findings from amore recent New York City-wide study show that average roadside PM2.5 concentrationsare 12.4 μg/m3 in the summer and 15.7 μg/m3 in the winter (as a result of building-relatedemissions for heating). It is interesting to note that levels of PM2.5. were 15% and 27%greater at higher traffic, as opposed to lower traffic sites, in the summer and winter months,respectively (Clougherty, 2010a; Clougherty, 2010b) indicating the contribution of vehicleemissions to pollutant levels. Samples for this study were collected close to street level;samplers were mounted on lamp posts at 10-12 feet. In Europe, annual average PM2.5concentrations at traffic sites in Stockholm, Munich, the Netherlands, and the Rotterdamarea ranged from 11.6 μg/m3 in Stockholm to 20.1 μg/m3 in Rotterdam. PM2.5concentrations at the study’s traffic sites were on average 17-18% higher than at urbanbackground sites (Hoek et al, 2002). The authors indicate that heights at which the varioussamples were taken in this multi-area study were at least 1.5 meters above the surface butnot in the dripline of trees, which allows us to assume that the samples were taken close tostreet level.
Our findings in Nairobi suggest that people who spend substantial time on or near roadways— particularly motorists, pedestrians, traffic police and those engaged in the many informalbusinesses located along roadways— are of particular concern regarding potential humanhealth impacts. Those who live and work downtown in buildings adjacent to busy roads mayalso be exposed to high PM2.5 concentrations. Results from the vertical dispersion siteshowed that PM2.5 concentrations did decrease significantly with height. However,concentrations on the 3rd floor rooftop were still double the WHO 24-hour guideline. Thissuggests that residents of buildings adjacent to heavy traffic roadways in Nairobi, even ifthey live on upper level floors, may still be exposed to dangerously high particulate matterlevels.
Pope and Dockery (2006) summarize the results of over 20 peer-reviewed prospectivecohort studies that found that long-term exposure to elevated levels of PM leads to increasedmortality from heart and lung disease. For example, in an extended analysis of a survey ofsix American cities, Laden et al (2006) found that with each 10-μg/m3 increase in PM2.5, therelative risk of mortality from cardiopulmonary diseases was increased by 28%. In terms ofpostneonatal infant mortality, the impacts are quite alarming - Woodruff et al (2006) foundthat each 10-μg/m3 increase in PM2.5 was associated with a near doubling of these deathsdue to respiratory causes. Evidence has also shown an association between air pollution andlung cancer (Pope and Dockery, 2006) and air pollution more generally (that is, whenelevated levels of other pollutants are considered) has also linked to lung cancer, particularlyas a result of traffic emissions (Nyberg, 2000). Health impacts such as asthma, bronchialinfections, chronic cough and decreased lung function are also linked to air pollution, aswell as increased emergency room visits and hospitalizations and school absences (e.g.,Pope and Dockery, 2002; Schwela et al, 2006). Results of a three-year study in Mexico Cityfound that long-term exposure to ambient air pollutants is associated with lung-growthdeficits in children; while no specific sources are identified, the authors indicate that theeffect is likely due to vehicular exhaust (Rojas-Martinez et al, 2007). In addition to impactsin children, these early lung deficits may increase the risk of developing lung and heartdisease (with associated increases in morbidity and mortality) later in life (Schroeder et al,2003; Schunemann et al, 2000).
Kinney et al. Page 8
Environ Sci Policy. Author manuscript; available in PMC 2012 June 1.
NIH
-PA Author Manuscript
NIH
-PA Author Manuscript
NIH
-PA Author Manuscript

There have been questions raised about whether it is possible to extrapolate theconcentration-response functions derived from studies in high-income countries to those ofmiddle- and low-income (e.g., Smith and Akbar, 2003). Studies in Asia have beendeveloped to respond to these concerns and while results from a coordinated time-seriesanalysis in Bangkok, Hong Kong, Shanghai and Wuhan suggest that the effect of PM ondaily mortality remain consistent with the Western industrial nations (Wong et al, 2008),there have been no cohort studies of the effects of long-term exposure to air pollution onmortality from cardiovascular and respiratory diseases in Asian populations (HEI, 2010).There is a general lack of data from sub-Saharan Africa. Furthermore, factors related tosocioeconomic status may modify the effects of air pollution, leading to larger effects insome populations (HEI, 2010). Slum populations in South Asia have been found to besimultaneously at risk from both household environmental hazards, from poor food andindoor air and water quality, as well as to community hazards in the form of outdoor airpollution, traffic, etc (Smith, K.R., 1997). This pattern likely holds true for Nairobi, wherehealth outcomes are not only significantly worse in slum populations than in other areas ofNairobi but in some cases worse than those in rural areas (Volavka-Close and Sclar, 2010;APHRC, 2002). In addition to the relationship between competing risk factors, poverty andoutdoor air pollution, the varying chemical composition of particle mixtures in low andmiddle-income countries (e.g., they may have higher fractions of diesel exhaust and biomassfuel particles) as well as higher levels of pollutants are concerns for extrapolation (Smithand Akbar, 2003). These factors should be incorporated into critically needed efforts toassess health impacts of outdoor air pollution on the entire population, as well as relatedpolicy-making in Nairobi and other rapidly growing urban areas in developing countries.Further air monitoring, as well as epidemiologic studies in Nairobi, are needed for acomprehensive assessment of health impacts as well as any evaluation of associated costs.
If we define the population exposed to roadside pollution as all those driving, walking orworking on the street, working in buildings or living in apartments above high-traffic roads,then a large fraction of Nairobi residents are expected to be exposed to harmful roadwayemissions on a regular basis. Another cause for the high roadway exposure across the entirepopulation is the high concentration of informal businesses and shops on roadsides, whichare frequented by lower and middle class urbanites alike. As noted, walking is the singlemost common mode of transport in Nairobi (Aligula et al., 2005). People who walk do soprimarily because they cannot afford other means of transport (Salon and Gulyani, 2010).This is significant because these pedestrians are the city’s poorest residents, which suggeststhat this already-vulnerable population group may suffer from disproportionate exposure toor effects from air pollution, particularly if their travel times are longer. Additionally, theseresidents typically have lower levels of access to health care and other services, so it may bemore likely that health impacts of emissions will go untreated. The importance of walking asa means of transportation was confirmed by pedestrian count results in the current study forthe Ronald Ngala and Tom Mboya sites, which were each frequented by an average of90,000 people every day between 0700 and 1900 hr.
In addition to being one of the few studies to examine roadway emissions in a sub-SaharanAfrican city, this project also showed the potential for partnerships within the localcommunity for research and capacity building. Students and staff from University of Nairobiand Columbia University worked closely together in designing and implementing this study,as well as engaging Nairobi residents. The success of the project encourages morepartnerships such as these to occur throughout research in rapidly-urbanizing sub-SaharanAfrica. The importance of partnerships between the global North and South and the co-production of knowledge that they foster has been documented (e.g., Klopp et al,forthcoming).
Kinney et al. Page 9
Environ Sci Policy. Author manuscript; available in PMC 2012 June 1.
NIH
-PA Author Manuscript
NIH
-PA Author Manuscript
NIH
-PA Author Manuscript

The policy implications of this study are substantial. On a metropolitan level, Nairobi isgrowing quickly without accompanying transportation and infrastructure services or even anurban transportation policy, as indicated in the Kenya Ministry of Transport’sRecommendations on an Integrated National Transport Policy (INTP) (Kenya Ministry ofTransport and Communications, 2004). This lack of policy is made manifest by atransportation system characterised by severe congestion, high-polluting vehicles, lack ofpedestrian and bicycle lanes, lack of accessible, high quality public transport options, anddeteriorating infrastructure (Ministry of Transport and Communications, 2004; Aligula et al,2005). The Integrated National Transport Policy (INTP) recommendations evolved into a2010 policy paper, “Sessional Paper on INTP” which was passed by the Cabinet and hasbeen submitted to the Parliament for approval. This paper identifies the transport sector’stop challenges as poor quality of transport services, inappropriate modal split, weakadherence to environmental requirements and lack of an urban transport policy. There isbrief mention that traffic congestion contributes to air pollution but at the same time it isnoted that “no measures exist to determine the damage caused to the environment” due tothis pollution. Links between air pollution and human health implications, as well as costsassociated with health impacts must be made clear and become an integral part of transportpolicy formulation and implementation. It is hoped that the current paper will assist inhighlighting health considerations in those policy discussions. This is particularly critical ata time when the government is moving forward with massive road expansion projects whichseem to be primarily opening up space for more cars on bigger roads. While upgrading andexpansion might be necessary, this alone will not solve the problems of congestion and airpollution; Los Angeles, a city that tried to build its transport system almost exclusivelyaround freeways is a prime example of how this approach fails (Kenworthy, 1997). ThikaRoad, one of this study’s sampling sites, is currently undergoing upgrading and expansion,transforming the road into an eight-lane superhighway. Further research should includeongoing monitoring along this road. While congestion may initially ease, if no measures aretaken to reduce demand and limit the use of automobiles through an efficient publictransport system and safe, non-motorized transport alternatives, Thika and other newly-expanded roads will likely fill with cars again. This would suggest further worsening of airquality and the negative health impacts associated with it.
Supplementary MaterialRefer to Web version on PubMed Central for supplementary material.
AcknowledgmentsThis study was initiated by the Center for Sustainable Urban Development (CSUD) and funded by the VolvoResearch and Educational Foundations (VREF). CSUD is a VREF Center of Excellence for Future Urban Transportand is housed at Columbia University’s Earth Institute. The authors also acknowledge research support by theInternational Science Programs to the Institute of Nuclear Science and Technology, the host of this corroborativestudy. Additional support was provided by the NIEHS Center for Environmental Health in Northern Manhattan(ES09089). The authors also would like to thank Jonathan Chanin of CSUD for his efforts in preparing thedocument and Jennifer Schumacher-Kocik and Jennifer Graeff for their extensive administrative and logisticalefforts related to the study.
Role of the Funding Source Funding for this research and preparation of the article was provided by the VolvoResearch and Educational Foundations (VREF), the International Science Programs and the NIEHS Center forEnvironmental Health in Northern Manhattan (ES09089). These sponsors played no role in study design; in thecollection, analysis and interpretation of data; in the writing of the report; and in the decision to submit the paperfor publication.
Kinney et al. Page 10
Environ Sci Policy. Author manuscript; available in PMC 2012 June 1.
NIH
-PA Author Manuscript
NIH
-PA Author Manuscript
NIH
-PA Author Manuscript

ReferencesAligula, EM.; Abiero-Gariy, Z.; Mutua, J.; Owegi, F.; Osengo, C.; Olela, R. Special Report No 7.
Nairobi, Kenya: Kenya Institute for Public Policy and Research Analysis; 2005. Urban PublicTransport Patterns in Kenya: A Case Study of Nairobi City.
African Population and Health Research Center (APHRC). Populatio and Health Dynamics inNairobi’s Informal Settlements. Nairobi: African Population and Health Research Center; 2002.
Bennet C, Jonsson P, Lingren ES. Concentrations and sources of trace elements in particulate airpollution, Dar es Salaam, Tanzania, studied by EDXRF. X-Ray Spectrometry. 2005; 34:1–6.
Carr W, Zeitel L, Weiss K. Variations in Asthma Hospitalization and Deaths in New York City.Journal of the American Medical Association. 1992; 82:59–65.
Clougherty, JE.; Kheirbek, I.; Johnson, S.; Pezeshki, G.; Bryan Jacobson, J.; Eisl, HM.; Gorczynski,JE.; Ross, Z.; Kitson, H.; Benson, A.; Camacho, A.; Werbe-Fuentes, J.; Haviland-Markowitz, J.;Munoz, R.; Tilles, A.; Strickland, CH.; Charles-Guttman, K.; Markowitz, S.; Kass, D.; Matte, T.The New York City Community Air Survey: Results from Summer Monitoring 2009. New YorkCity: Department of Health and Mental Hygiene, and NYC Mayor’s Office for Long-Term Planningand Sustainability. 8 April 2010; 2009a.http://www.nyc.gov/html/doh/downloads/pdf/eode/nyccas-report-summer09.pdf
Clougherty, JE.; Kheirbek, I.; Johnson, S.; Pezeshki, G.; Bryan Jacobson, J.; Eisl, HM.; Gorczynski,JE.; Ross, Z.; Kitson, H.; Benson, A.; Camacho, A.; Werbe-Fuentes, J.; Haviland-Markowitz, J.;Munoz, R.; Tilles, A.; Strickland, CH.; Charles-Guttman, K.; Markowitz, S.; Kass, D.; Matte, T.The New York City Community Air Survey: Results from Winter Monitoring 2008-2009. NewYork City: Department of Health and Mental Hygiene, and NYC Mayor’s Office for Long-TermPlanning and Sustainability. 8 April 2010; 2009b.http://www.nyc.gov/html/doh/downloads/pdf/eode/nyccas_master_report_12_15_09.pdf
Cohen, A.; Anderson, H.; Ostra, B.; Pandey, D.; Krzyzanowski, M.; Künzli, N.; Gutschmidt, K.; Pope,CA., III; Romieu, I.; Samet, J.; Smith, K. Chapter 17: Urban air pollution. In: Ezzati, Majid; Lopez,Alan D.; Rodgers, Anthony; Murray, ChristopherJL., editors. Comparative Quantification of HealthRisks: Global and Regional Burden of Disease Attributable to Selected Major Risk Factors, Volume1. Geneva, Switzerland: World Health Organization; 2004. p. 1353-1434.
Dioniso KL, Arku RE, Friedman AB, Hughes AF, Vallarino J, Carmichael H, Spengler JD, Agyei-Mensah S, Ezzati M. Air Pollution in Accra Neighborhoods: Spatial, Socioeconomic and TemporalPatterns. Environmental Science and Technology. 2010; 44(7):2270–2276. [PubMed: 20205383]
Dockery DW, Pope CA III, Xu X, Spengler JD, Ware JH, Fay ME, Ferris BG, Speizer FA. AnAssociation between Air Pollution and Mortality in Six U.S. Cities. New England Journal ofMedicine. 1993; 329(24):1753–59. [PubMed: 8179653]
Frumkin, H.; Frank, L.; Jackson, R. Urban Sprawl and Public Health: Designing, Planning andBuilding for Healthy Communities. Island Press; Washington, D.C: 2004.
Gatari MJ, Boman J. Black carbon and total carbon measurements at urban and rural sites in Kenya,East Africa. Atmospheric Environment. 2003; 37:1149–1154.
Gatebe CK, Kinyua AM, Mangala MJ, Kwach R, Njau LN, Mukolwe EA, Maina DM. Determinationof suspended particulate matter of major significance to human health using nuclear techniques inKenya. Journal of Radioanalytical and Nuclear Chemistry. 1996; 203:125–134.
Gatari MJ, Wagner A, Boman J. Elemental composition of tropospheric aerosols in Hanoi, Vietnamand Nairobi, Kenya. Science of the Total Environment. 2005; 341:241–249. [PubMed: 15833255]
Gatari, MJ. PhD Thesis. Department of Chemistry, Goteborg University; Goteborg, Sweden: 2006.Studies of Atmospheric Aerosols and Development of Energy Dispersive X-Ray FluorescenceSpectrometer.
Hagler GSW, Bergin MH, Salmon LG, Yu JZ, Wan ECH, Zheng M, Zeng LM, Kiang CS, Zhang YH,Schauer JJ. Local and regional anthropogenic influence on PM2.5 elements in Hong Kong.Atmospheric Environment. 2007; 41(28):5994–6004.
HEI International Scientific Oversight Committee. Special Report 18. Health Effects Institute; Boston,MA: 2010. Outdoor Air Pollution and Health in the Developing Countries of Asia: AComprehensive Review.
Kinney et al. Page 11
Environ Sci Policy. Author manuscript; available in PMC 2012 June 1.
NIH
-PA Author Manuscript
NIH
-PA Author Manuscript
NIH
-PA Author Manuscript
Hoek G, Meliefste K, Cyrys J, Lewné M, Bellander T, Brauer M, Fischer P, Gehring U, Heinrich J,van Vliet P, Brunekreef B. Spatial variability of fine particle concentrations in three Europeanareas. Atmospheric Environment. 2002; 36:4077–4088.
Ibald-Mulli A, Timonen KL, Peters A, Heinrich J, Wolke G, Lanki T, Buzorius G, Kreyling WG, deHartog J, Hoek G, ten Brink HM, Pekkanen J. Effects of particulate air pollution on blood pressureand heart rate in subjects with cardiovascular disease: A multicenter approach. EnvironmentalHealth Perspectives. 2004; 112:369–377. [PubMed: 14998755]
Jansen KL, Larson TV, Koenig JQ, Mar TF, Fields C, Stewart J, Lippmann M. Associations betweenhealth effects and particulate matter and black carbon in subjects with respiratory disease.Environmental Health Perspective. 2005; 113:1741–1746.
Japanese International Cooperation Agency (JICA). Final Report. Tokyo: JICA; 2006. The Study on aMaster Plan for Urban Transport in the Nairobi Metropolitan Area in the Republic of Kenya.
Kenworthy, JR. Automobile Dependence in Bangkok: An International Comparison with Implicationsfor Planning Policies and Air Pollution. In: Fletcher, T.; McMichael, AJ., editors. Health at theCrossroads: Transport Policy and Urban Health. West Sussex, England: John Wiley & Sons; 1997.p. 215-233.
Kinney PL, Aggarwal M, Northridge M, Janssen NAH, Shepard P. Airborne Concentrations of PM 2.5and Diesel Exhaust Particles on Harlem Sidewalks: A Community-Based Pilot Study.Environmental Health Perspectives. 2000; 108(3):213–218. [PubMed: 10706526]
Kenya National Bureau of Statistics, Ministry of Planning. Republic of Kenya Economic Survey.2007. <www.cbs.go.ke>
Khayesi M, Monheim H, Nebe JM. Negotiating “streets for all” in urban transport planning: The casefor pedestrians, cyclists and street vendors in Nairobi, Kenya. Antipode. 2010; 24(1):103–126.
Klopp J, Ngau P, Sclar E. University/City Partnerships: Creating Policy Networks for UrbanTransformation in Nairobi. Metropolitan Universities. Forthcoming
Laden F, Schwartz J, Speizer FE, Dockery DW. Reduction in Fine Particulate Air Pollution andMortality: Extended Follow-Up of the Harvard Six Cities Study. American Journal of Respiratoryand Critical Care Medicine. 2006; 173:667–672. [PubMed: 16424447]
Maina, DM.; Gatari, MJ.; Bundi, P.; Muturi, H. Impact of road transport on air quality in Kenya;Roadside survey in the cities of Mombasa and Nairobi; Proceedings of International AerosolConference (IAC2006); St Paul Minnesota, USA. 10-15 September 2006; 2006.
Ministry of Nairobi Metropolitan Development. Nairobi Metro 2030: A World Class AfricanMetropolis - Building a Safe, Secure and Prosperous Metropolitan. Nairobi: Government ofKenya; 2008.
Ministry of Planning. Republic of Kenya Economic Survey 2007. Nairobi: Kenya National Bureau ofStatistics; 2007. <www.cbs.go.ke>
Ministry of Transport and Communications. Recommendations on Integrated National TransportPolicy: Moving a Working Nation. Nairobi: Government of Kenya; 2004.
Ministry of Transport. Sessional Paper on Integrated National Transport Policy. Nairobi: Governmentof Kenya; 2010.
Nyberg F, Gustavsson P, Järup L, Bellander T, Berglind N, Jakobsson R, Pershagen G. Urban AirPollution and Lung Cancer in Stockholm. Epidemiology. 2000; 7(5):487–495. [PubMed:10955399]
Obudho, RA. Nairobi: National Capital and Regional Hub. In: Rakodi, Carol, editor. The UrbanChallenge in Africa. Tokyo, Japan: United Nations University; 1997. p. 292-336.
Odhiambo GO, Kinyua AM, Gatebe CK, Awange J. Motor Vehicles Air Pollution in Nairobi, Kenya.Research Journal of Environmental and Earth Sciences. 2010; 2(4):178–187.
Pope CA III, Burnett RT, Thun MJ, Calle EE, Krewski D, Ito K, Thurston GD. Lung cancer,cardiopulmonary mortality, and long-term exposure to fine particulate air pollution. Journal of theAmerican Medical Association. 2002; 287(9):1132–41. [PubMed: 11879110]
Pope CA III, Dockery DW. Health effects of fine particulate air pollution: Lines that connect. TheJournal of Air and Waste Management Association. 2006; 56:709–742.
Ramanathan V, Carmichael G. Global and regional climate changes due to black carbon. NatureGeoscience. 2008; 1:221–227.
Kinney et al. Page 12
Environ Sci Policy. Author manuscript; available in PMC 2012 June 1.
NIH
-PA Author Manuscript
NIH
-PA Author Manuscript
NIH
-PA Author Manuscript

Salon D, Gulyani S. Mobility, poverty and gender: Travel ‘choices’ of slum residents in Nairobi,Kenya. Transport Reviews. 2010; 30(5):641–657.
Samet, J.; Zeger, S.; Dominici, F., et al. Research report 94. Cambridge, Mass: Health Effects Institute;2000. The National Morbidity, Mortality, and Air Pollution Study, Part II: Morbidity and mortalityfrom air pollution in the United States.
Schwartz J. Air pollution and daily mortality: A review and meta-analysis. Environmental Research.1994; 64:36–52. [PubMed: 8287841]
Schwela, D.; Haq, G.; Huizenga, C.; Han, W-J.; Fabian, H.; Ajero, M. Urban Air Pollution in Cities;Status, Challenges and Management. London: Earthscan; 2006.
Smith, KR. Development, Health and the Risk Transition. In: Shahi, G., et al., editors. InternationalPerspectives in Environment, Development and Health. New York: Springer; 1997. p. 51-62.
Smith, KR.; Akbar, S. Health-Damaging Air Pollution: A Matter of Scale. In: McGranahan, G.;Murray, F., editors. Air Pollution and Health in Rapidly Developing Countries. Canada: Earthscan;2003.
Sommer, H.; Künzli, N.; Seethaler, R.; Chanel, O.; Herry, M.; Masson, S.; Vergnaud, J-C.; Filliger, P.;Horak, F., Jr; Kaiser, R.; Medina, S.; Puybonnieux-Texier, V.; Quénel, P.; Schneider, J.;Studnicka, M. An impact assessment project of Austria, France and Switzerland. New York:OECD Report; 2000. Economic Evaluation of Health Impacts Due to Road Traffic-Related AirPollution.
United Nations, Department of Economic and Social Affairs. World Urbanization Prospects: The 2009Revision. New York: United Nations; 2010.
United Nations Environment Programme (UNEP). Kenya: Integrated assessment of the Energy Policy- with Focus on the Transport and Household Energy Sectors. United Nations; 2006.
United Nations Environment Program (UNEP). Urban Air Pollution. December 14. 2010http://www.unep.org/urban_environment/issues/urban_air.asp
van Vliet EDS, Kinney PL. Impacts of roadway emissions on urban particulate matter concentrationsin sub-Saharan Africa: new evidence from Nairobi, Kenya. Environmental Research Letters. 2007;2(4)
Volavka-Close, N.; Sclar, ED. Improving Population Health in a Rapidly Urbanizing World. In:Vlahov, D.; Boufford, JI.; Pearson, C.; Norris, L., editors. Urban Health; Global Perspectives. SanFrancisco, California: Jossey Bass; 2010. p. 453-467.
Wang JS, Chan TL, Ning Z, Leung CW, Cheung CS, Hung WT. Roadside measurement andprediction of CO and PM2.5 dispersion from on-road vehicles in Hong Kong. TransportationResearch Part D: Transport and Environment. 2006; 11:242–249.
Wong C-M, Vichit-Vadakan V-V, Kan H, Quian Z. PAPA Project Teams. Public Health and AirPollition in Asia (PAPA): A Multicity Study of Short-term Effects of Air Pollution on Mortality.Environmental Health Perspectives. 2008; 116:1195–1202. [PubMed: 18795163]
Woodruff TJ, Parker JD, Schoendorf KC. Fine Particulate Matter (PM2.5) Air Pollution and SelectedCauses of Postneonatal Infant Mortality in California. Environmental Health Perspectives. 2006;105:608–612. [PubMed: 9288495]
World Health Organization. Air Quality Guidelines: Global Update 2005. Copenhagen, Denmark:World Health Organization Regional Office for Europe; 2006.
BiographiesDr. Patrick Kinney is Professor of Environmental Health Sciences at the Mailman Schoolof Public Health at Columbia University. His research and teaching address health impactsof air pollution and climate change in a global context.
Dr. Michael Gatari Gichuru holds a PhD in Environmental Science (Physics) and his keyarea of research is atmospheric aerosol in the perspective of human health and climatechange. He is a university lecturer in applications of nuclear techniques, and radiationdetection, measurements and electronics.
Kinney et al. Page 13
Environ Sci Policy. Author manuscript; available in PMC 2012 June 1.
NIH
-PA Author Manuscript
NIH
-PA Author Manuscript
NIH
-PA Author Manuscript

Nicole Ngo is a Ph.D. candidate in Sustainable Development at Columbia University. She isinterested in air pollution and its health impacts, as well as its influence on climate change.
Nicole Volavka-Close is Associate Director of the Center for Sustainable UrbanDevelopment, housed at The Earth Institute, Columbia University. Her research interestsinclude the address of health impacts of transport and land use in the global context.
Dr. Peter K. Ndiba is a Senior Lecturer in the Department of Civil Engineering, Universityof Nairobi, Kenya. He teaches environmental engineering and his main research interest isheavy metals in sediments, soils, water and air.
Anna Law obtained her Bachelor’s Degree in Environmental Policy from Barnard College,Columbia University in May 2010. For her senior thesis, she sought to quantify the impactsof fine particulate matter air pollution on mortality in Nairobi and to propose policysolutions to curb fine particulate matter roadway emissions.
Dr. Anthony Gachanja is Professor of Analytical Environmental Chemistry in the Facultyof Science, Jomo Kenyatta University of Agriculture and Technology, Nairobi, Kenya. Hisresearch is in Analytical Environmental pollution studies in Kenya.
Samuel Gaita holds a MSc in Atmospheric Science (Chemistry) from GothenburgUniversity, Sweden. He is currently a graduate student at the Institute of Nuclear Scienceand Technology, University of Nairobi. His research interest is the application of radiationspectroscopy methods in atmospheric research with regard to human health and climatechange.
Dr Steven N. Chillrud is a Doherty Research Professor at Lamont-Doherty EarthObservatory of Columbia University. His air pollution research focuses on identifying andcharacterizing exposure pathways and sources of airborne particulate matter includingdevelopment and testing of new air monitoring equipment.
Dr. Elliott Sclar is Professor of Urban Planning and Director of the Center for SustainableUrban Development housed at The Earth Institute, Columbia University. He specializes ininternational urban and transportation planning and economics.
Kinney et al. Page 14
Environ Sci Policy. Author manuscript; available in PMC 2012 June 1.
NIH
-PA Author Manuscript
NIH
-PA Author Manuscript
NIH
-PA Author Manuscript

Fig. 1.Average 0730-1830 hr weekday PM2.5 concentrations at five core sites in Nairobi. TheUniversity of Nairobi site is included for reference but is not directly comparable due todifferent sampling parameters (RN= Ronald Ngala, RR= River Road, TM=Tom Mboya,TR=Thika Rd, KU= Kenyatta Univ., UN= Univ. of Nairobi).
Kinney et al. Page 15
Environ Sci Policy. Author manuscript; available in PMC 2012 June 1.
NIH
-PA Author Manuscript
NIH
-PA Author Manuscript
NIH
-PA Author Manuscript
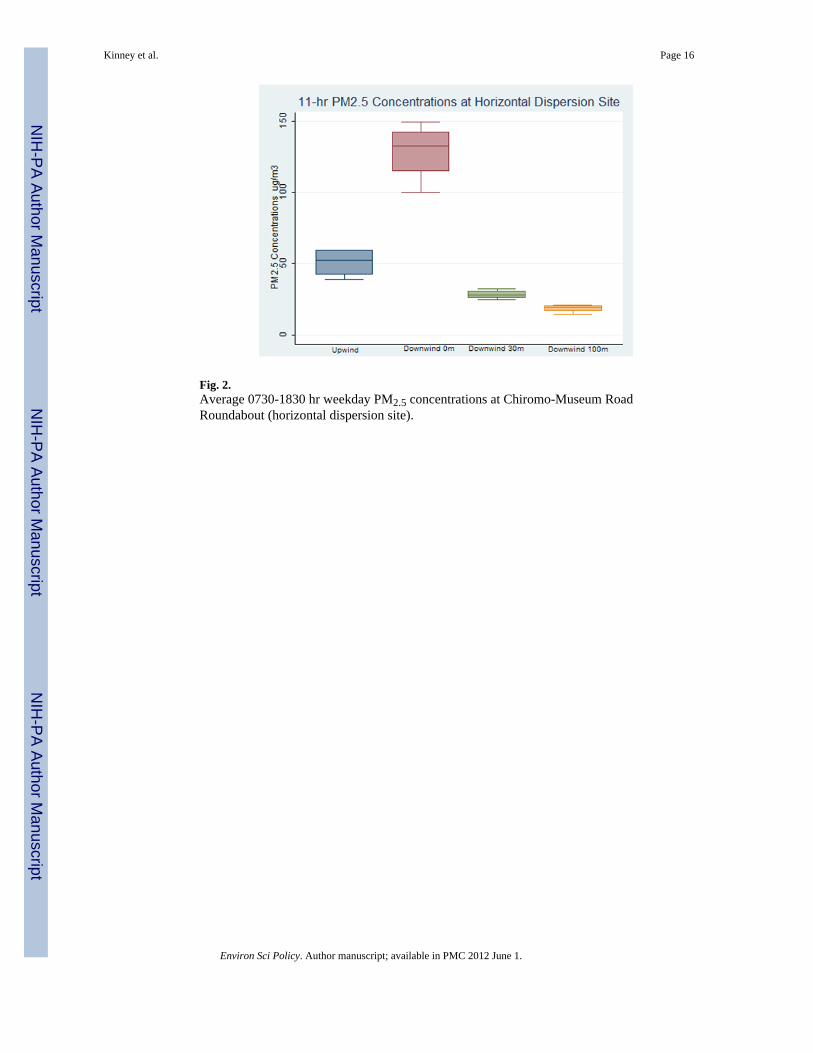
Fig. 2.Average 0730-1830 hr weekday PM2.5 concentrations at Chiromo-Museum RoadRoundabout (horizontal dispersion site).
Kinney et al. Page 16
Environ Sci Policy. Author manuscript; available in PMC 2012 June 1.
NIH
-PA Author Manuscript
NIH
-PA Author Manuscript
NIH
-PA Author Manuscript
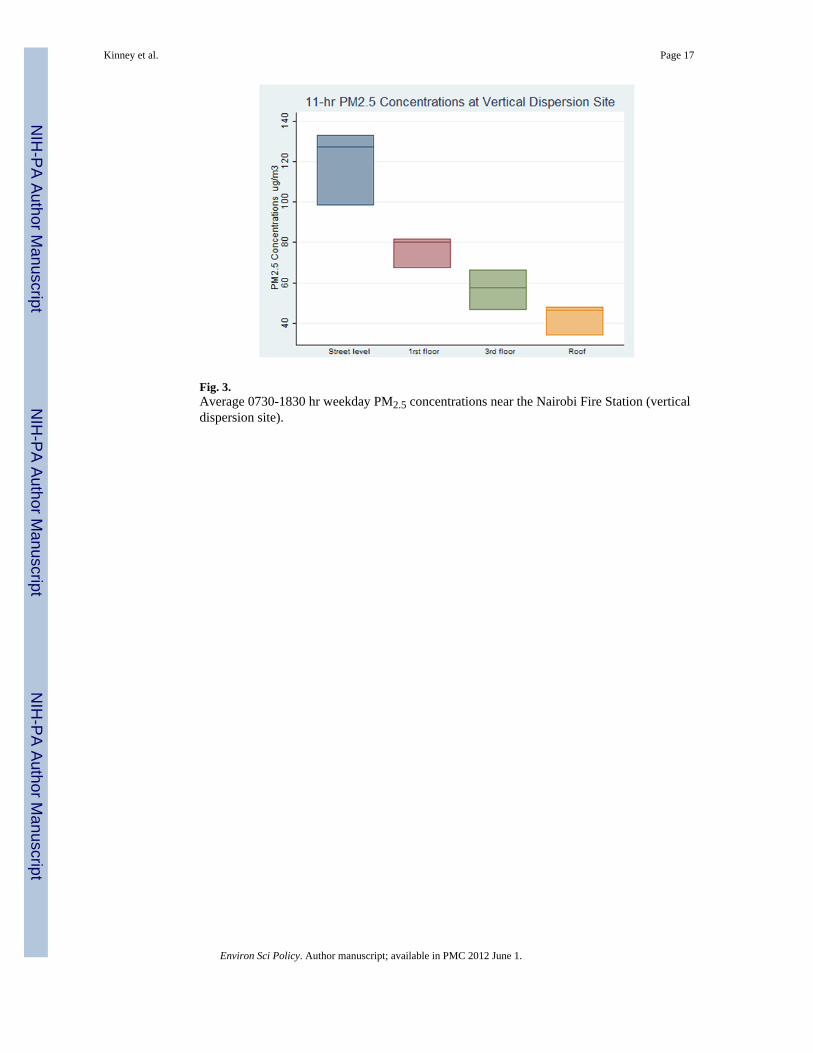
Fig. 3.Average 0730-1830 hr weekday PM2.5 concentrations near the Nairobi Fire Station (verticaldispersion site).
Kinney et al. Page 17
Environ Sci Policy. Author manuscript; available in PMC 2012 June 1.
NIH
-PA Author Manuscript
NIH
-PA Author Manuscript
NIH
-PA Author Manuscript

NIH
-PA Author Manuscript
NIH
-PA Author Manuscript
NIH
-PA Author Manuscript
Kinney et al. Page 18
Tabl
e 1
11-h
r ave
rage
s (07
30-1
830
hr) P
M2.
5 co
ncen
tratio
ns (μ
g/m
3) a
t sev
en si
tes i
n N
airo
bi.
Loc
atio
nJu
ly 6
July
7Ju
ly 8
July
9Ju
ly 1
0Ju
ly 1
3Ju
ly 1
4Ju
ly 1
5Ju
ly 1
6M
ean
± SD
Cor
e Si
tes (
RN
, TM
, and
RR
are
in th
e ce
ntra
l bus
ines
s dis
tric
t; T
R is
a c
omm
uter
rou
te; K
U is
in a
rur
al lo
catio
n)
Ron
ald
Nga
la73
.964
.374
.094
.593
.659
.161
.192
.667
.675
.6±1
4.4
Tom
Mbo
ya95
.012
7.5
124.
194
.710
3.7
87.9
100.
977
.071
.798
.1±1
8.9
Riv
er R
oad
83.1
138.
811
5.3
84.6
66.5
67.3
77.7
95.4
70.1
88.8
±24.
3
Thik
a R
d In
70.3
93.3
50.4
26.2
60.8
62.1
58.4
57.5
42.5
58.1
+18.
8
Thik
a R
d O
ut79
.610
1.1
81.0
65.8
77.2
76.9
73.8
62.8
90.1
78.7
±11.
7
Ken
yatta
Uni
v7.
413
.312
.16.
95.
016
.013
.611
.510
.7±3
.8
Hor
izon
tal D
ispe
rsio
n Si
te
Upw
ind
0m45
.738
.759
.259
.250
.7±1
0.2
Dow
nwin
d 0m
149.
312
9.4
100.
313
5.8
128.
7± 2
0.7
Dow
nwin
d 30
m27
.129
.425
.032
.228
.4+3
.1
Dow
nwin
d 10
0m19
.921
.114
.619
.218
.7+2
.8
Ver
tical
Dis
pers
ion
Site
Stre
et le
vel
98.2
133.
012
7.3
119.
5+18
.7
1st fl
oor
67.1
80.2
81.7
76.3
+8.0
3rd fl
oor
46.6
66.3
57.7
56.9
+9.9
Roo
ftop
33.9
46.4
48.1
42.8
+7.8
Urb
an R
oofto
p R
efer
ence
Site
(24
hour
ave
rage
)
40.3
49.6
28.2
53.1
14.5
33.4
30.0
26.9
37.8
34.9
±11.
9
* Not
e th
at th
e U
nive
rsity
of N
airo
bi si
te w
as o
pera
ted
as p
art o
f a se
para
te o
ngoi
ng st
udy,
and
is in
clud
ed h
ere
for r
efer
ence
pur
pose
s cou
rtesy
of J
ohan
Bom
an, G
othe
nbur
g U
nive
rsity
, Sw
eden
.C
once
ntra
tions
at t
he U
nive
rsity
of N
airo
bi si
te a
re 2
4-hr
ave
rage
s.
Environ Sci Policy. Author manuscript; available in PMC 2012 June 1.