Africa Dialogues- NAIROBI - Global Sustainable Electricity ...
409
e8-GEF-UNDESA Financing Sustainable Electrification Dialogues HCB Initiative 1 Financing Sustainable Electrification Workshop -Africa Dialogues- NAIROBI A few lessons learned from an innovative concept for rural electrification : EDF’ s experience on RESCOS Christine HEURAUX EDF Head of Energy Access Programme April 13, 2010
-
Upload
khangminh22 -
Category
Documents
-
view
2 -
download
0
Transcript of Africa Dialogues- NAIROBI - Global Sustainable Electricity ...

e8-G
EF-U
ND
ESA
Fin
anci
ng S
usta
inab
le E
lect
rific
atio
n D
ialo
gues
HC
B In
itiat
ive
1
Financing Sustainable Electrification Workshop
-Africa Dialogues-NAIROBI
A few lessons learned from an innovative concept for rural electrification : EDF’ s experience on RESCOS
Christine HEURAUXEDF
Head of Energy Access Programme
April 13, 2010
e8-G
EF-U
ND
ESA
Fin
anci
ng S
usta
inab
le E
lect
rific
atio
n D
ialo
gues
HC
B In
itiat
ive
2
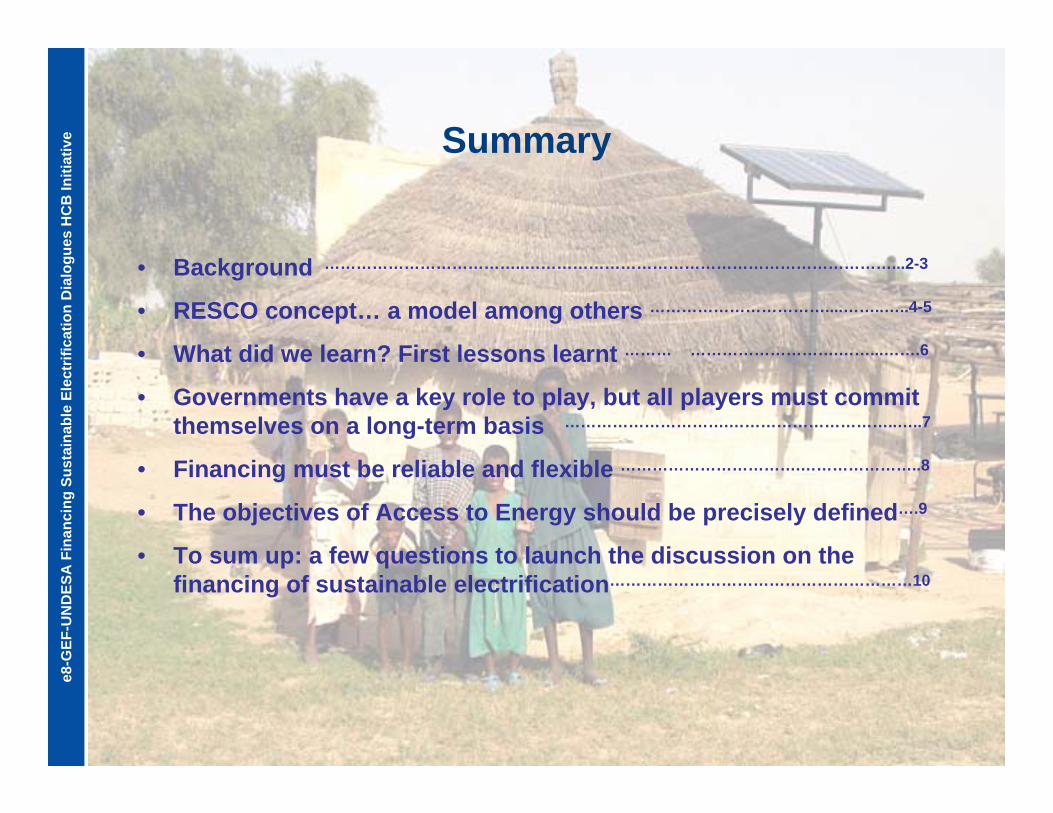
Summary
• Background ………………………………..……………………………………………………………...2-3
• RESCO concept… a model among others ……………………………....……..…..4-5
• What did we learn? First lessons learnt ……… ……………………….……...…….6
• Governments have a key role to play, but all players must committhemselves on a long-term basis ………………………….…………………………..…..7
• Financing must be reliable and flexible …………………………….…………………..8
• The objectives of Access to Energy should be precisely defined….9
• To sum up: a few questions to launch the discussion on the financing of sustainable electrification…………………………………………………10
e8-G
EF-U
ND
ESA
Fin
anci
ng S
usta
inab
le E
lect
rific
atio
n D
ialo
gues
HC
B In
itiat
ive
3
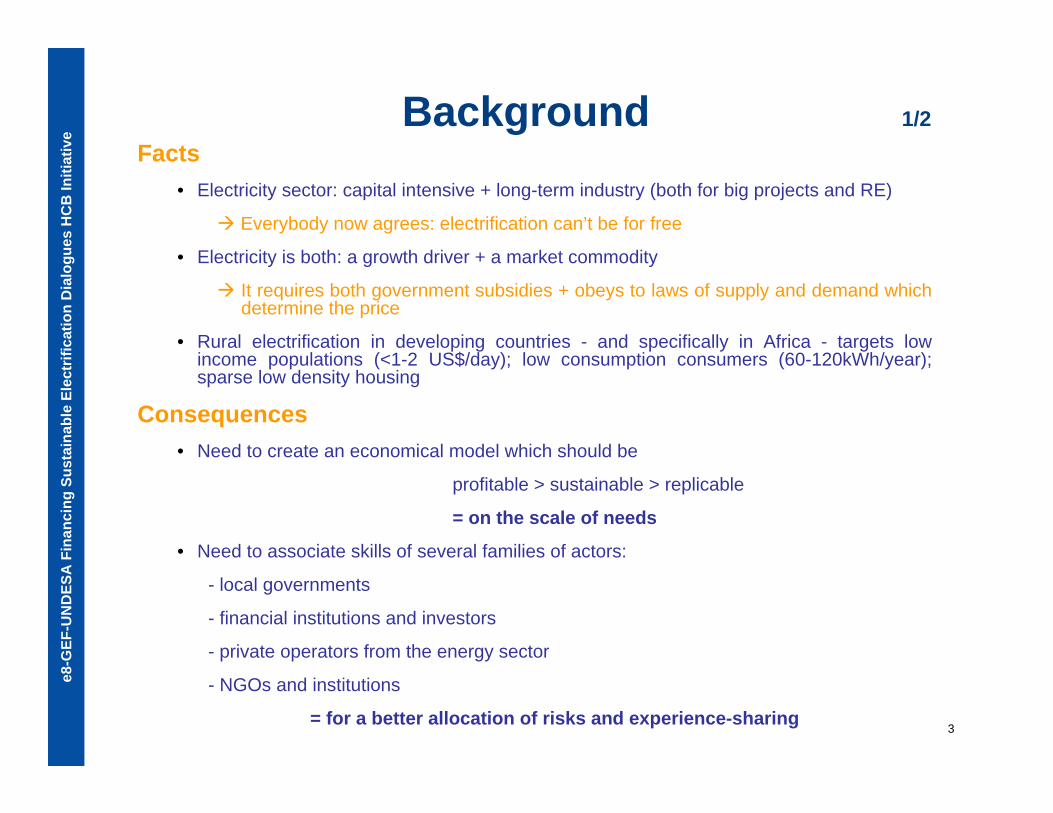
Background 1/2Facts
• Electricity sector: capital intensive + long-term industry (both for big projects and RE)
Everybody now agrees: electrification can’t be for free
• Electricity is both: a growth driver + a market commodity
It requires both government subsidies + obeys to laws of supply and demand which determine the price
• Rural electrification in developing countries - and specifically in Africa - targets low income populations (<1-2 US$/day); low consumption consumers (60-120kWh/year); sparse low density housing
Consequences• Need to create an economical model which should be
profitable > sustainable > replicable
= on the scale of needs
• Need to associate skills of several families of actors:
- local governments
- financial institutions and investors
- private operators from the energy sector
- NGOs and institutions
= for a better allocation of risks and experience-sharing

e8-G
EF-U
ND
ESA
Fin
anci
ng S
usta
inab
le E
lect
rific
atio
n D
ialo
gues
HC
B In
itiat
ive
4
Background 2/2
4 key fundamentals for starting a sustainable electrification programme, on which everybody now agrees:
• An appropriate institutional and legal framework and agreements with national and local authorities on a long term basis
• A local anchorage through local partners and locally trained capacities
• A viable financial model mixing investment, subsidies and adapted tariffs (tailor-made)
• A bottom-up approach to choose the right equipments and technologies at the right place and at the right time
e8-G
EF-U
ND
ESA
Fin
anci
ng S
usta
inab
le E
lect
rific
atio
n D
ialo
gues
HC
B In
itiat
ive
5
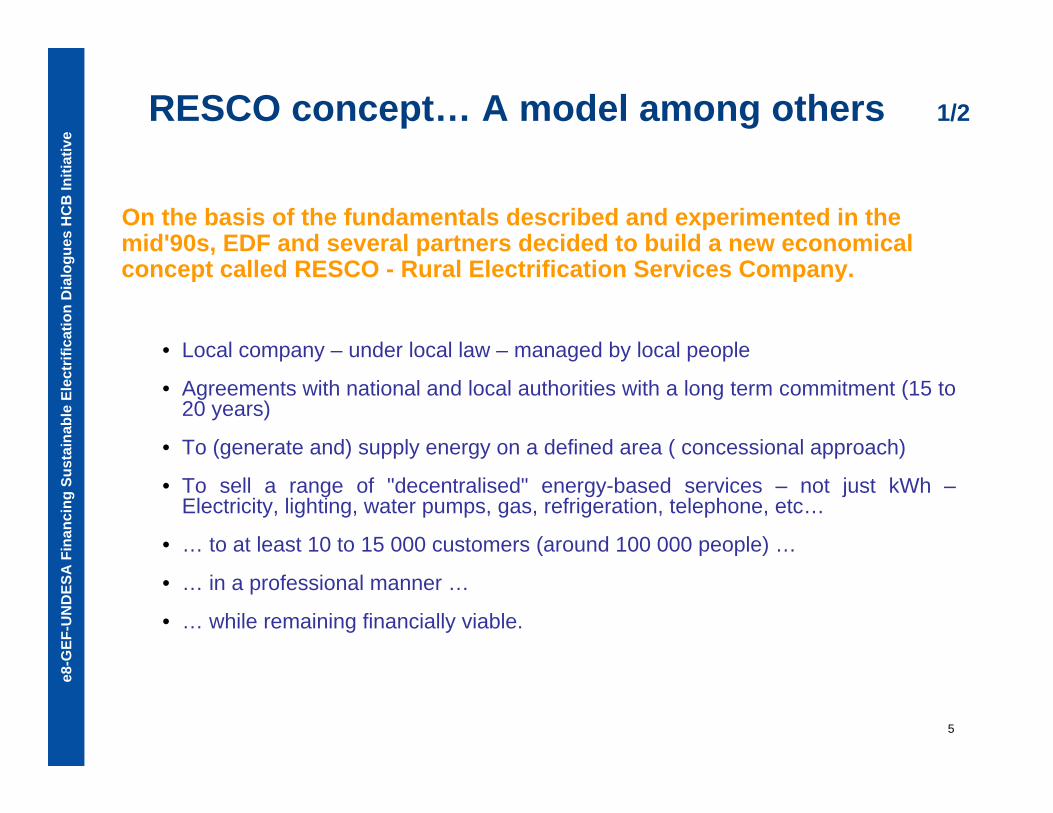
RESCO concept… A model among others 1/2
On the basis of the fundamentals described and experimented in the mid'90s, EDF and several partners decided to build a new economical concept called RESCO - Rural Electrification Services Company.
• Local company – under local law – managed by local people
• Agreements with national and local authorities with a long term commitment (15 to 20 years)
• To (generate and) supply energy on a defined area ( concessional approach)
• To sell a range of "decentralised" energy-based services – not just kWh –Electricity, lighting, water pumps, gas, refrigeration, telephone, etc…
• … to at least 10 to 15 000 customers (around 100 000 people) …
• … in a professional manner …
• … while remaining financially viable.

e8-G
EF-U
ND
ESA
Fin
anci
ng S
usta
inab
le E
lect
rific
atio
n D
ialo
gues
HC
B In
itiat
ive
6
* FRES (NUON Foundation) owns 100% of Yéelen Kura since end of 2008 (20% of the capital should be transferred to the salaries).** Korayé Kurumba was transferred in mid 2009 to the EIG GoléKanu owned to 100% by the salaries.
Mali
South Africa
Morocco
Yéelen Kura : EDF, NUON*2 450 clients44 100 people
KES : EDF, TOTAL, CALULO9 800 clients58 800 people
Temasol : EDF, TOTAL, TENESOL26 600 clients186 200 people
KorayéKurumba** : EDF, TOTAL2 000 clients36 000 people
As of February 2010: 325 000 people gotaccess to electricity in 3 countries through 4 RESCOs
RESCO concept… A model among others 2/2
e8-G
EF-U
ND
ESA
Fin
anci
ng S
usta
inab
le E
lect
rific
atio
n D
ialo
gues
HC
B In
itiat
ive
7
What did we learn?First lessons learned
RESCO is an operational model which convinced different governments and is now adopted by them.
What are the challenges to be tackled?
The first assessment of the model is positive but further enhancement is needed
• Although the figures are encouraging, they remain modest
(325 000 people versus 500 million/1,6 billion without access to electricity in Africa and worldwide)
• Still in a learning process
• Very fragile structures
The discussions that follow should address 3 main points: • Commitment of the actors
• How to secure sustainable financing
• The goal of access to energy programme
e8-G
EF-U
ND
ESA
Fin
anci
ng S
usta
inab
le E
lect
rific
atio
n D
ialo
gues
HC
B In
itiat
ive
8
Governments have a key role to play, but all players must commit themselves on a long-term basis
The challenges of rural electrification requires the commitment of several kinds ofplayers
• Local governments and authorities, who draft and implement the regulatory and institutional frameworks that govern economic developments, the creation of infrastructures, secure investments, organize training of human resources and foster the emergence of local entrepreneurs and investors
• Major financial institutions and investors who provide funding and canalise international funding.
• Energy players who contribute their expertise in training, choice of technologies etc.
• NGOs, individual and local communities that participate in rural electrification operations. Key role of the government to achieve a balanced PPP
This commitment must be held over the long term (min. 10 years)
• Long-lasting processes: it takes time to elaborate, implement the legal framework, create the relevant institutions
Business plans have to face variability of economy worldwide
• Small structures can’t afford irregularity and uncertainty of subsidies and tariffs.
Flexibility and long term commitment are needed and may involve all players

e8-G
EF-U
ND
ESA
Fin
anci
ng S
usta
inab
le E
lect
rific
atio
n D
ialo
gues
HC
B In
itiat
ive
9
Financing must be reliable and flexible
Rural electrification financing combines:• subsidies: must be predictable, reliable, regularly paid
• investments: must be secured
• tariffs: must - be adapted to the capacity of the clients to pay
- ensure the operation of the RESCO over the long term
Requires: a continuous discussion and a balanced agreement between public authority
(application of regulatory framework; definition of tariffs; payment of subsidies) and private sector (to find the right equilibrium between services and development/profit)
the business plan should be updated according to the constraints, knowing that the implementation of the RE programmes may take several years.
e8-G
EF-U
ND
ESA
Fin
anci
ng S
usta
inab
le E
lect
rific
atio
n D
ialo
gues
HC
B In
itiat
ive
10
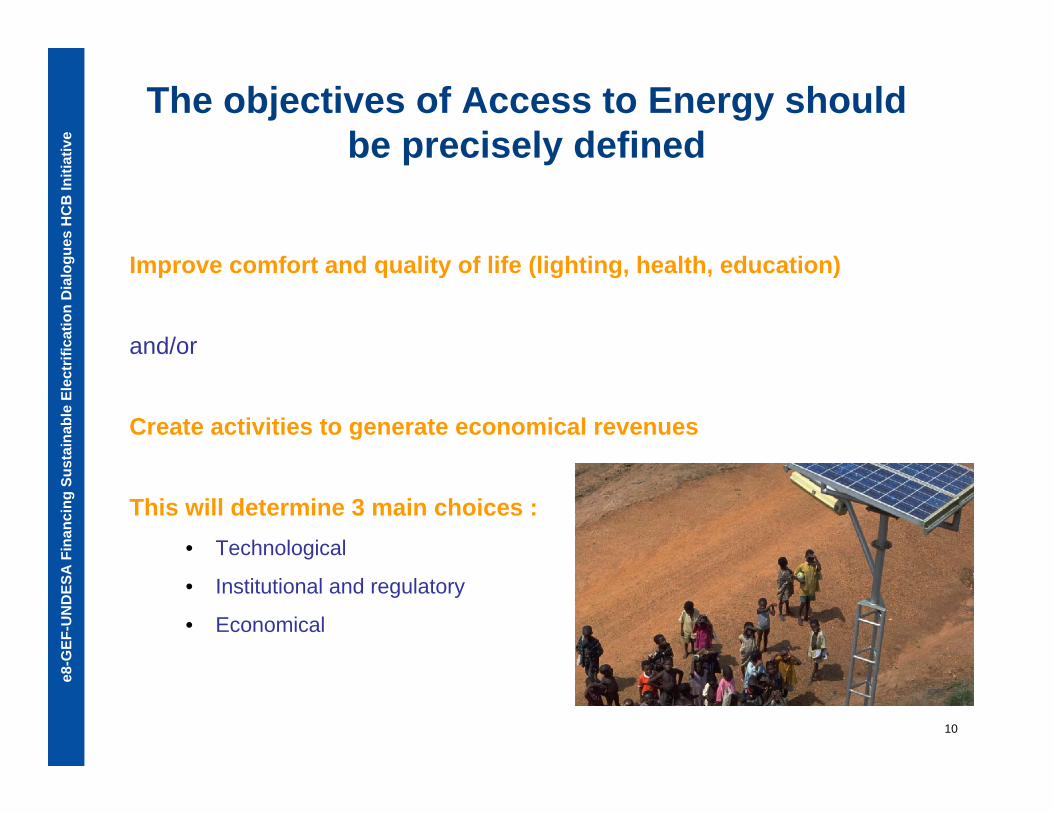
The objectives of Access to Energy should be precisely defined
Improve comfort and quality of life (lighting, health, education)
and/or
Create activities to generate economical revenues
This will determine 3 main choices :• Technological
• Institutional and regulatory
• Economical
e8-G
EF-U
ND
ESA
Fin
anci
ng S
usta
inab
le E
lect
rific
atio
n D
ialo
gues
HC
B In
itiat
ive
11
To sum up: a few questions to launch the discussion on the conditions for a sustainable
access to energy
• Which kind of commitments for which kind of players?
• Which technologies are more suitable for sustainable programmes?
• Which kind of financial models are the most adapted to launch a local
development ?
• Which kind of models are replicable independently from local specificities ?

e8-G
EF-U
ND
ESA
Fin
anci
ng S
usta
inab
le E
lect
rific
atio
n D
ialo
gues
HC
B In
itiat
ive
12
THANK YOU FOR YOUR ATTENTION
e8-G
EF-U
ND
ESA
Fin
anci
ng S
usta
inab
le E
lect
rific
atio
n H
CB
Initi
ativ
eA
fric
a D
ialo
gues
, Apr
il 13
-15,
201
0, N
airo
bi, K
enya
e8-GEF-UNDESA Financing Sustainable Electrification
Africa DialoguesNairobi, Kenya, April 13-15, 2010
RWE's perspectives&
CDM Fuel Switch and Energy Efficiency Lusaka, Zambia
Antonio Aguilera LagosHead of Carbon Credit Purchase &
Portfolio ManagementRWE Power AG, Germany
e8-G
EF-U
ND
ESA
Fin
anci
ng S
usta
inab
le E
lect
rific
atio
n H
CB
Initi
ativ
eA
fric
a D
ialo
gues
, Apr
il 13
-15,
201
0, N
airo
bi, K
enya
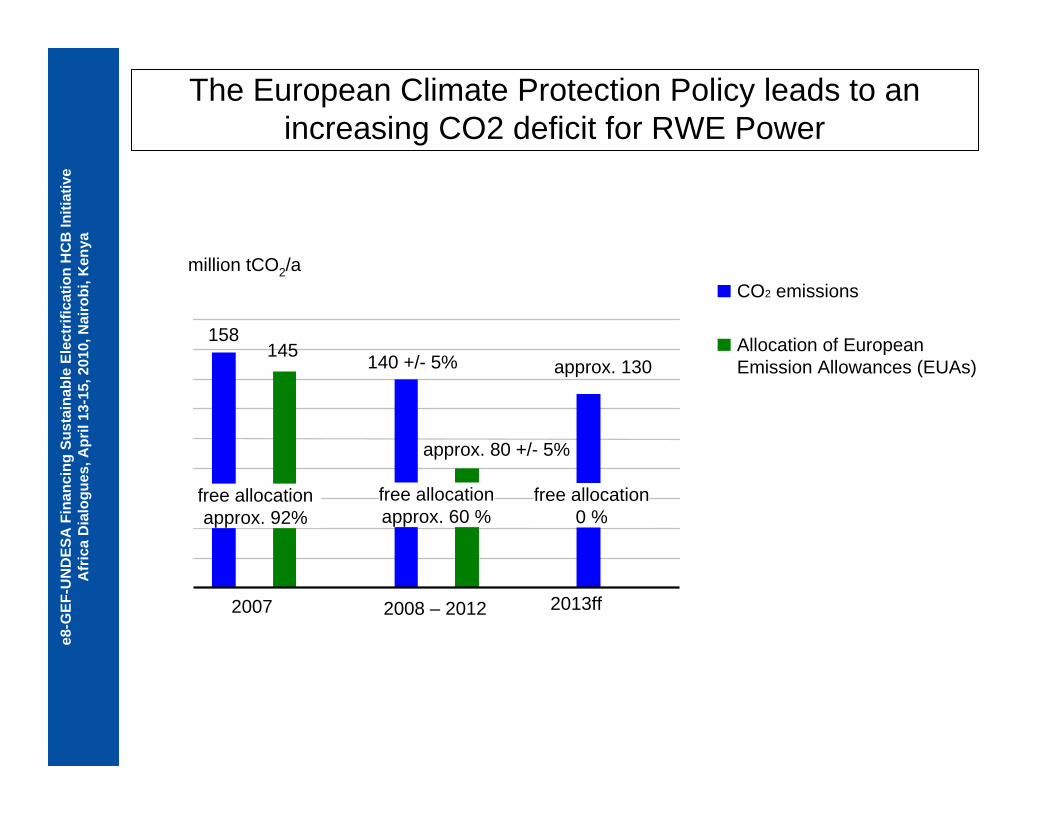
The European Climate Protection Policy leads to an increasing CO2 deficit for RWE Power
2007
158145
free allocationapprox. 92%
140 +/- 5%
2008 – 2012
free allocationapprox. 60 %
CO2 emissions
Allocation of EuropeanEmission Allowances (EUAs)
million tCO2/a
free allocation0 %
2013ff
approx. 130
approx. 80 +/- 5%
e8-G
EF-U
ND
ESA
Fin
anci
ng S
usta
inab
le E
lect
rific
atio
n H
CB
Initi
ativ
eA
fric
a D
ialo
gues
, Apr
il 13
-15,
201
0, N
airo
bi, K
enya
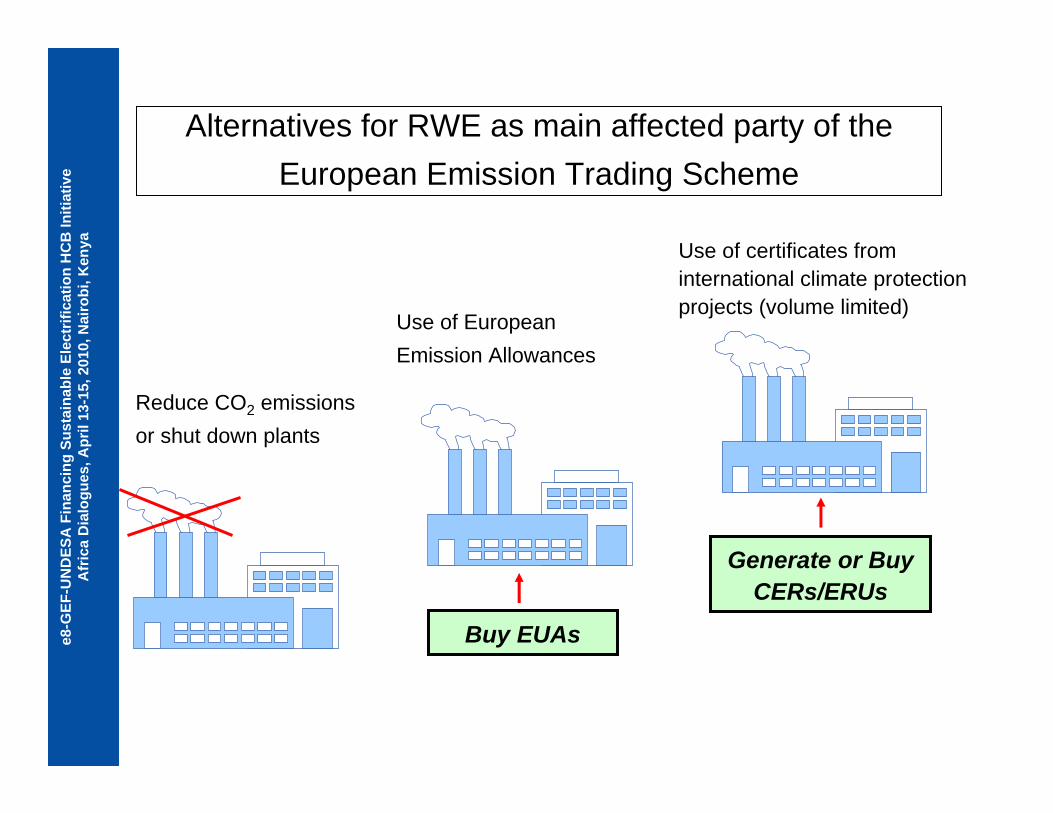
Alternatives for RWE as main affected party of the European Emission Trading Scheme
Reduce CO2 emissionsor shut down plants
Buy EUAs
Generate or Buy CERs/ERUs
Use of European Emission Allowances
Use of certificates from international climate protection projects (volume limited)

e8-G
EF-U
ND
ESA
Fin
anci
ng S
usta
inab
le E
lect
rific
atio
n H
CB
Initi
ativ
eA
fric
a D
ialo
gues
, Apr
il 13
-15,
201
0, N
airo
bi, K
enya
RWE's climate protection strategy
JI/CDM:Realization of climate protection projects in developing and emerging countries
Renewables:Significant increase of the proportion of renewable energies within the energy generation mix.Investment: 1 bnl. €/a
Energy efficiency:Construction of power plants with higher efficiencies / R&D
Climate friendly power plants:Construction of climate friendlycoal-fired power plants at industrial scale
RWE's components for climate protection
e8-G
EF-U
ND
ESA
Fin
anci
ng S
usta
inab
le E
lect
rific
atio
n H
CB
Initi
ativ
eA
fric
a D
ialo
gues
, Apr
il 13
-15,
201
0, N
airo
bi, K
enya
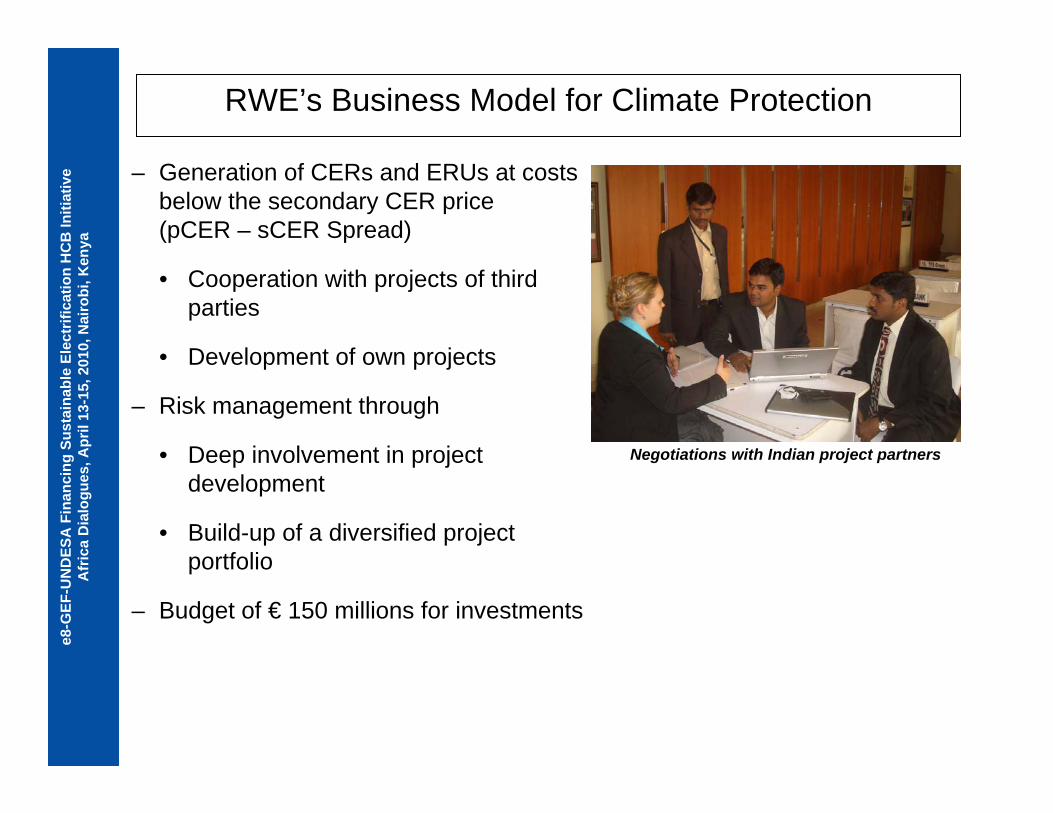
RWE’s Business Model for Climate Protection
Negotiations with Indian project partners
– Generation of CERs and ERUs at costs below the secondary CER price (pCER – sCER Spread)
• Cooperation with projects of third parties
• Development of own projects
– Risk management through
• Deep involvement in project development
• Build-up of a diversified project portfolio
– Budget of € 150 millions for investments

e8-G
EF-U
ND
ESA
Fin
anci
ng S
usta
inab
le E
lect
rific
atio
n H
CB
Initi
ativ
eA
fric
a D
ialo
gues
, Apr
il 13
-15,
201
0, N
airo
bi, K
enya
RWE's current portfolio of certificates for the CP 1 (2008-12)
* In Operation: All projects which have already issued certificates
** Latest EU-directive for certificates implies no additional Redemption Capacity for RWE Power concerning the years 2013 till 2020, but usage of certificates is still enabled post 2012
e8-G
EF-U
ND
ESA
Fin
anci
ng S
usta
inab
le E
lect
rific
atio
n H
CB
Initi
ativ
eA
fric
a D
ialo
gues
, Apr
il 13
-15,
201
0, N
airo
bi, K
enya
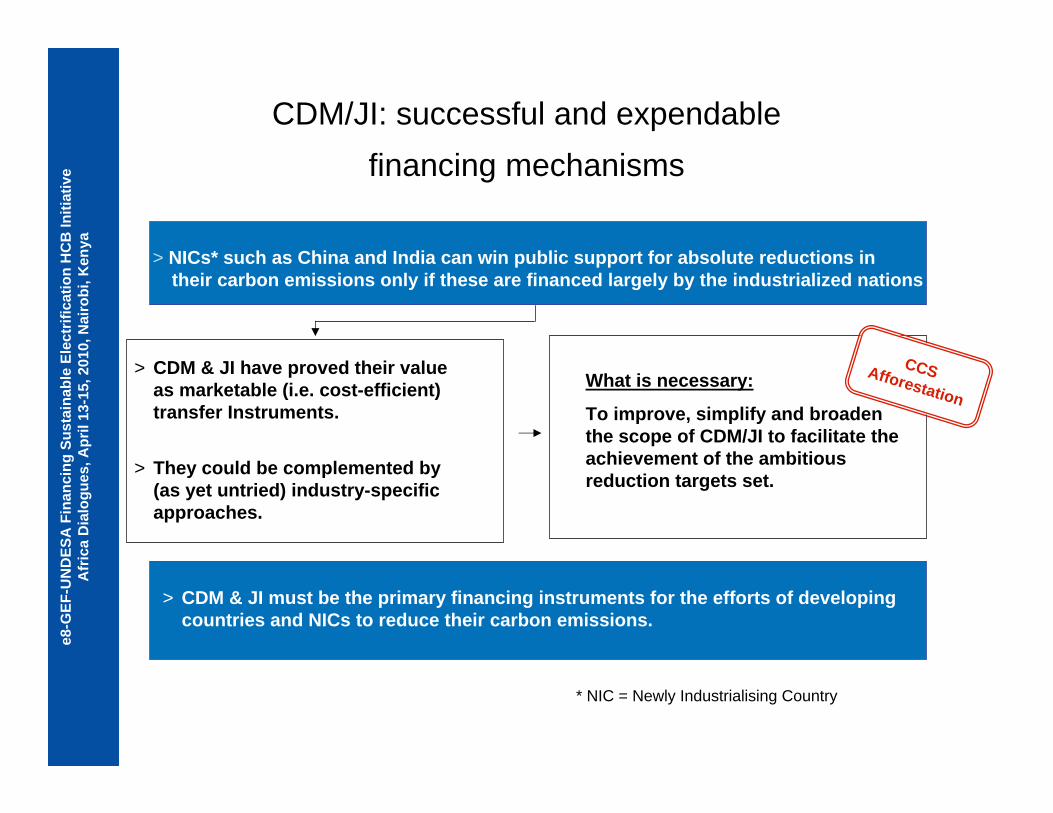
CDM/JI: successful and expendable financing mechanisms
> NICs* such as China and India can win public support for absolute reductions in their carbon emissions only if these are financed largely by the industrialized nations
> CDM & JI have proved their value as marketable (i.e. cost-efficient) transfer Instruments.
> They could be complemented by (as yet untried) industry-specific approaches.
What is necessary:
To improve, simplify and broaden the scope of CDM/JI to facilitate the achievement of the ambitious reduction targets set.
CCSAfforestation
> CDM & JI must be the primary financing instruments for the efforts of developing countries and NICs to reduce their carbon emissions.
* NIC = Newly Industrialising Country
e8-G
EF-U
ND
ESA
Fin
anci
ng S
usta
inab
le E
lect
rific
atio
n H
CB
Initi
ativ
eA
fric
a D
ialo
gues
, Apr
il 13
-15,
201
0, N
airo
bi, K
enya
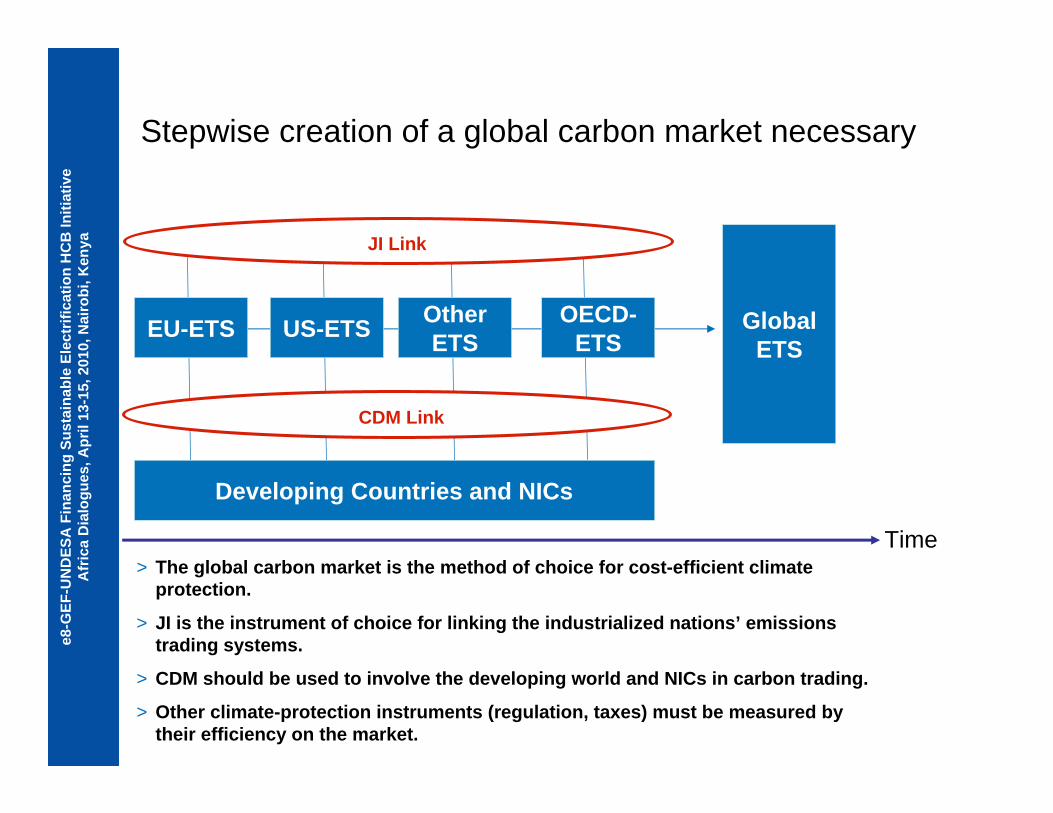
Stepwise creation of a global carbon market necessary
JI Link
Developing Countries and NICs
CDM Link
Global ETS
> The global carbon market is the method of choice for cost-efficient climate protection.
> JI is the instrument of choice for linking the industrialized nations’ emissions trading systems.
> CDM should be used to involve the developing world and NICs in carbon trading.
> Other climate-protection instruments (regulation, taxes) must be measured by their efficiency on the market.
Time
EU-ETS US-ETS OtherETS
OECD-ETS

e8-G
EF-U
ND
ESA
Fin
anci
ng S
usta
inab
le E
lect
rific
atio
n H
CB
Initi
ativ
eA
fric
a D
ialo
gues
, Apr
il 13
-15,
201
0, N
airo
bi, K
enya
Effective and cost-efficient climate protection is crucial for RWE’s position on the post-Kyoto treaty
> The post-Kyoto treaty must contain binding reduction commitments on a scale large enough to stabilize the global climate.
> The efforts of the global community to reduce carbon emissions must be economically efficient so as not to jeopardize prosperity.
> In the long run, there will have to be a global pricing mechanism for CO2emissions to signal shortages more efficiently and ensure that CO2 avoidance is rewarded.
> The measures adopted must be aimed solely at stabilizing the global climate and not to be burdened with extraneous political objectives.
e8-G
EF-U
ND
ESA
Fin
anci
ng S
usta
inab
le E
lect
rific
atio
n H
CB
Initi
ativ
eA
fric
a D
ialo
gues
, Apr
il 13
-15,
201
0, N
airo
bi, K
enya
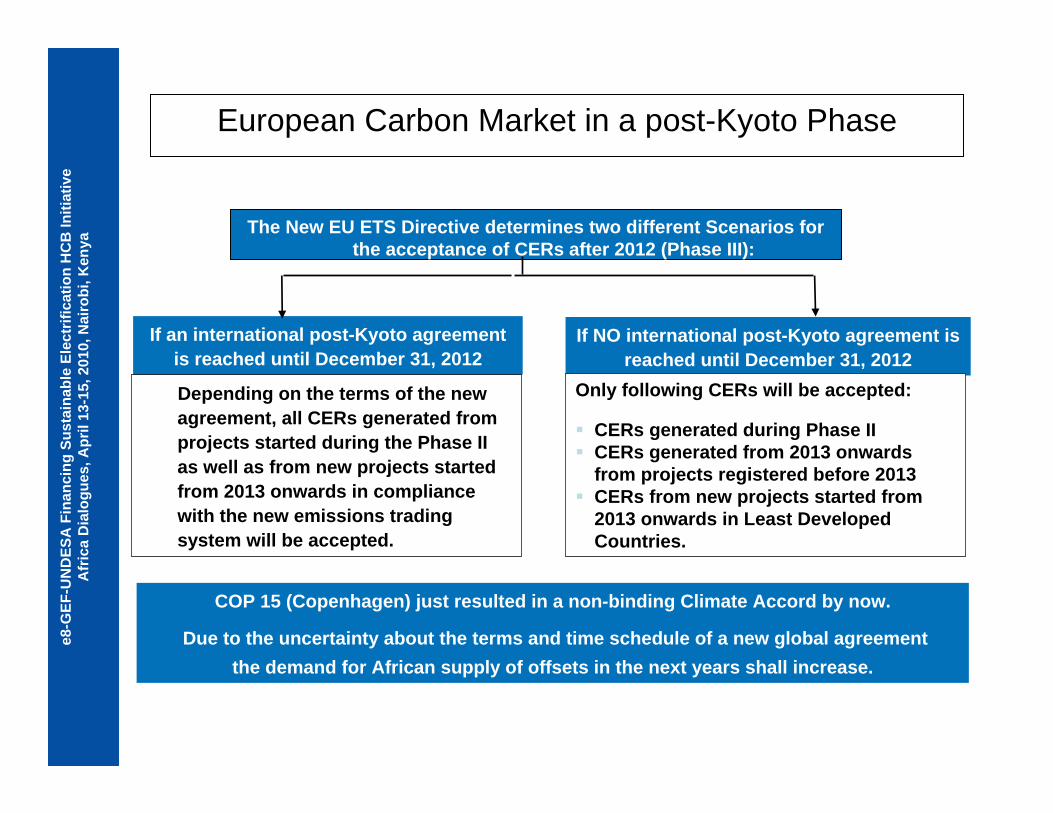
If NO international post-Kyoto agreement is reached until December 31, 2012
European Carbon Market in a post-Kyoto Phase
The New EU ETS Directive determines two different Scenarios for the acceptance of CERs after 2012 (Phase III):
If an international post-Kyoto agreement is reached until December 31, 2012
Only following CERs will be accepted:
CERs generated during Phase II CERs generated from 2013 onwards
from projects registered before 2013 CERs from new projects started from
2013 onwards in Least Developed Countries.
Depending on the terms of the new agreement, all CERs generated from projects started during the Phase II as well as from new projects started from 2013 onwards in compliance with the new emissions trading system will be accepted.
COP 15 (Copenhagen) just resulted in a non-binding Climate Accord by now.
Due to the uncertainty about the terms and time schedule of a new global agreementthe demand for African supply of offsets in the next years shall increase.
e8-G
EF-U
ND
ESA
Fin
anci
ng S
usta
inab
le E
lect
rific
atio
n H
CB
Initi
ativ
eA
fric
a D
ialo
gues
, Apr
il 13
-15,
201
0, N
airo
bi, K
enya
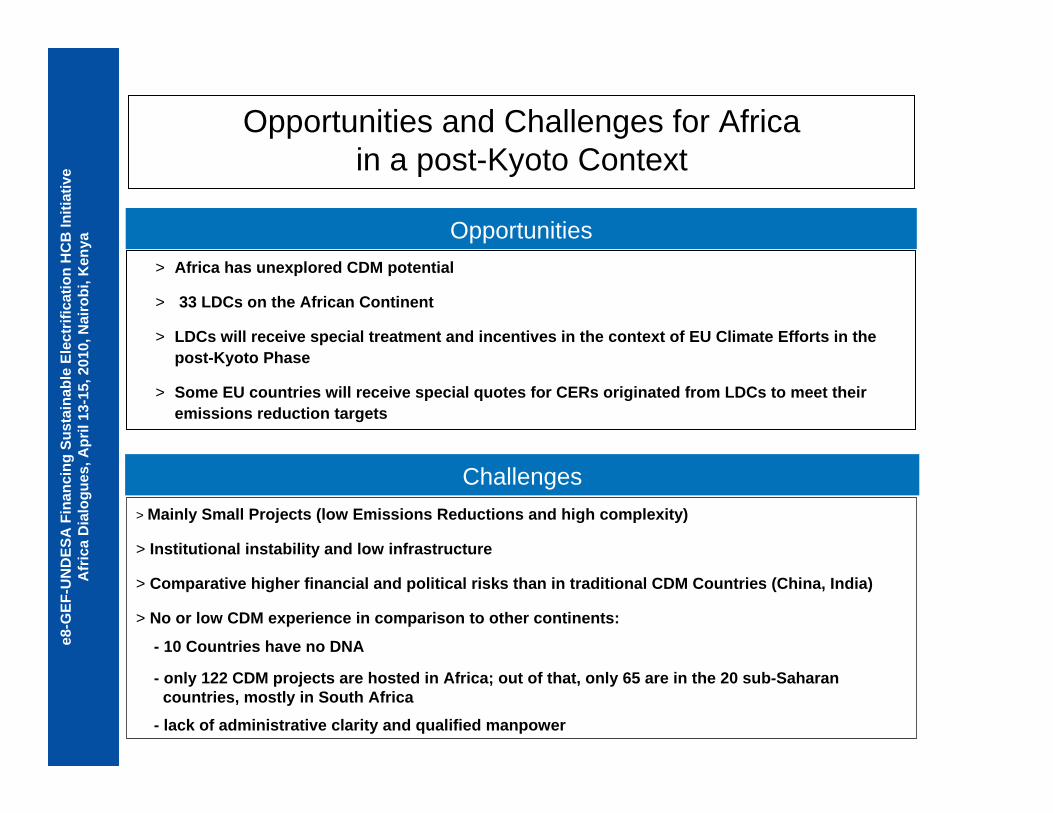
Opportunities and Challenges for Africa in a post-Kyoto Context
> Africa has unexplored CDM potential
> 33 LDCs on the African Continent
> LDCs will receive special treatment and incentives in the context of EU Climate Efforts in the post-Kyoto Phase
> Some EU countries will receive special quotes for CERs originated from LDCs to meet their emissions reduction targets
Opportunities
Challenges> Mainly Small Projects (low Emissions Reductions and high complexity)
> Institutional instability and low infrastructure
> Comparative higher financial and political risks than in traditional CDM Countries (China, India)
> No or low CDM experience in comparison to other continents:
- 10 Countries have no DNA
- only 122 CDM projects are hosted in Africa; out of that, only 65 are in the 20 sub-Saharancountries, mostly in South Africa
- lack of administrative clarity and qualified manpower
e8-G
EF-U
ND
ESA
Fin
anci
ng S
usta
inab
le E
lect
rific
atio
n H
CB
Initi
ativ
eA
fric
a D
ialo
gues
, Apr
il 13
-15,
201
0, N
airo
bi, K
enya
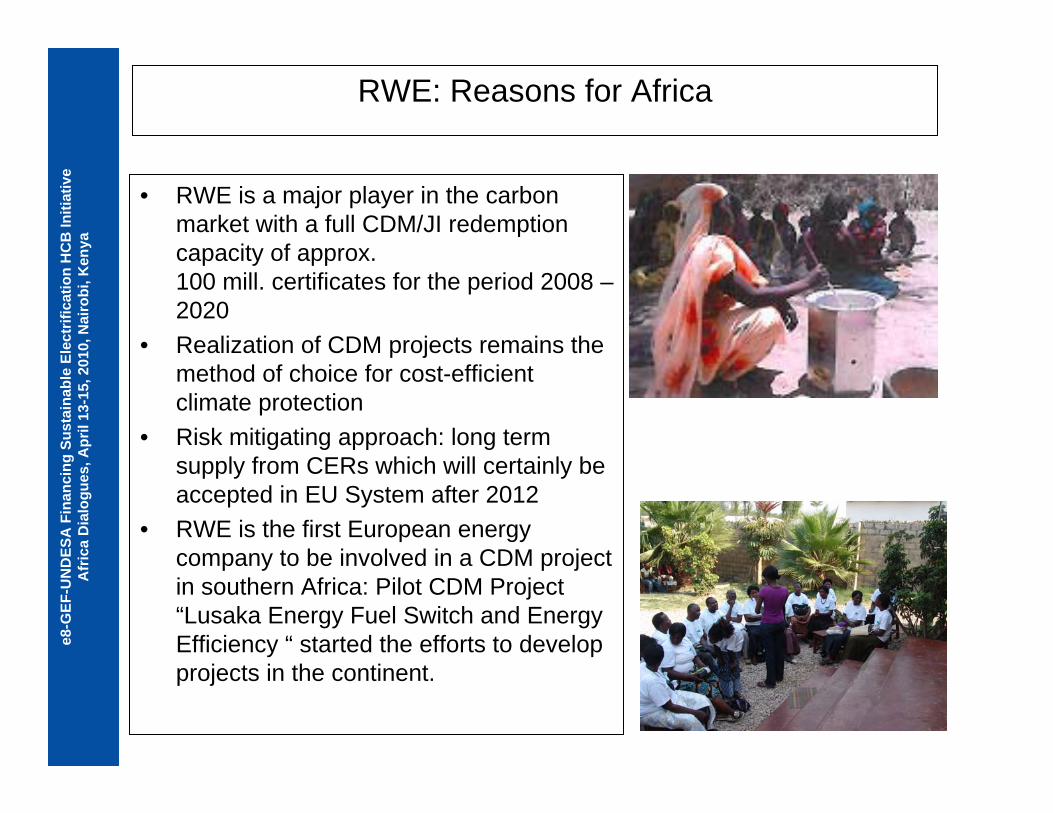
RWE: Reasons for Africa
• RWE is a major player in the carbon market with a full CDM/JI redemption capacity of approx. 100 mill. certificates for the period 2008 –2020
• Realization of CDM projects remains the method of choice for cost-efficient climate protection
• Risk mitigating approach: long term supply from CERs which will certainly be accepted in EU System after 2012
• RWE is the first European energy company to be involved in a CDM project in southern Africa: Pilot CDM Project “Lusaka Energy Fuel Switch and Energy Efficiency “ started the efforts to develop projects in the continent.
e8-G
EF-U
ND
ESA
Fin
anci
ng S
usta
inab
le E
lect
rific
atio
n H
CB
Initi
ativ
eA
fric
a D
ialo
gues
, Apr
il 13
-15,
201
0, N
airo
bi, K
enya
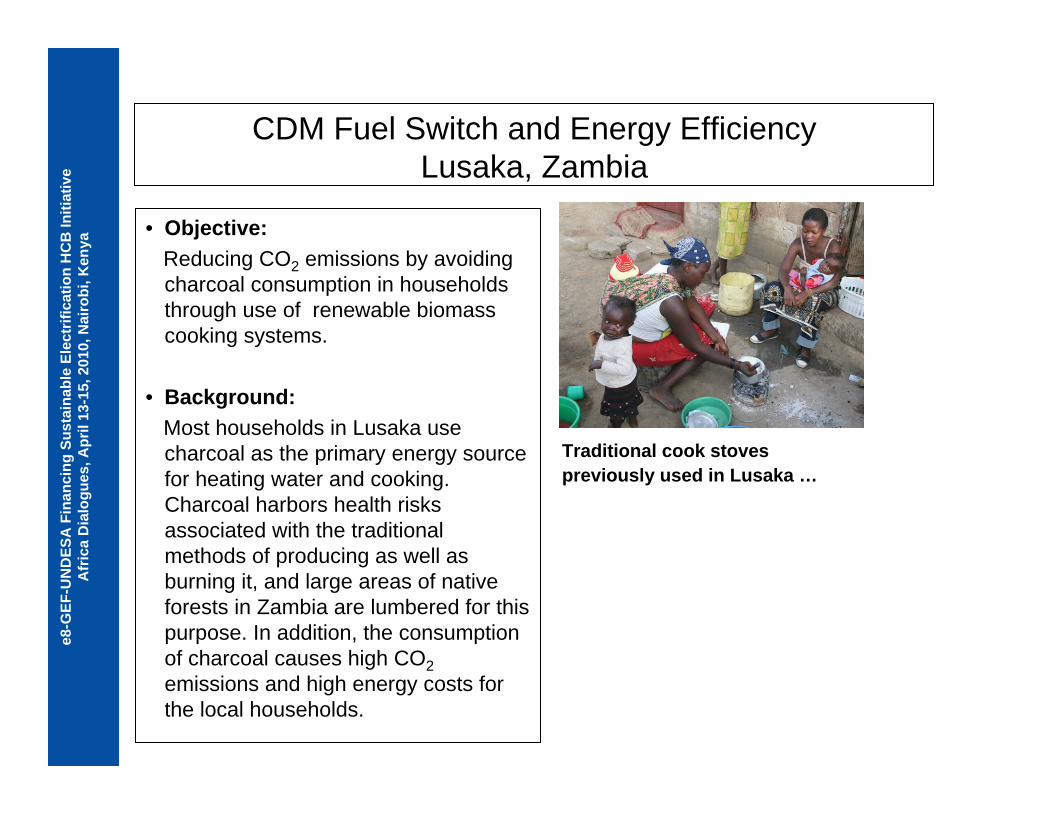
CDM Fuel Switch and Energy EfficiencyLusaka, Zambia
• Objective:Reducing CO2 emissions by avoiding charcoal consumption in households through use of renewable biomass cooking systems.
• Background: Most households in Lusaka use charcoal as the primary energy source for heating water and cooking. Charcoal harbors health risks associated with the traditional methods of producing as well as burning it, and large areas of native forests in Zambia are lumbered for this purpose. In addition, the consumption of charcoal causes high CO2emissions and high energy costs for the local households.
Traditional cook stoves previously used in Lusaka …
e8-G
EF-U
ND
ESA
Fin
anci
ng S
usta
inab
le E
lect
rific
atio
n H
CB
Initi
ativ
eA
fric
a D
ialo
gues
, Apr
il 13
-15,
201
0, N
airo
bi, K
enya
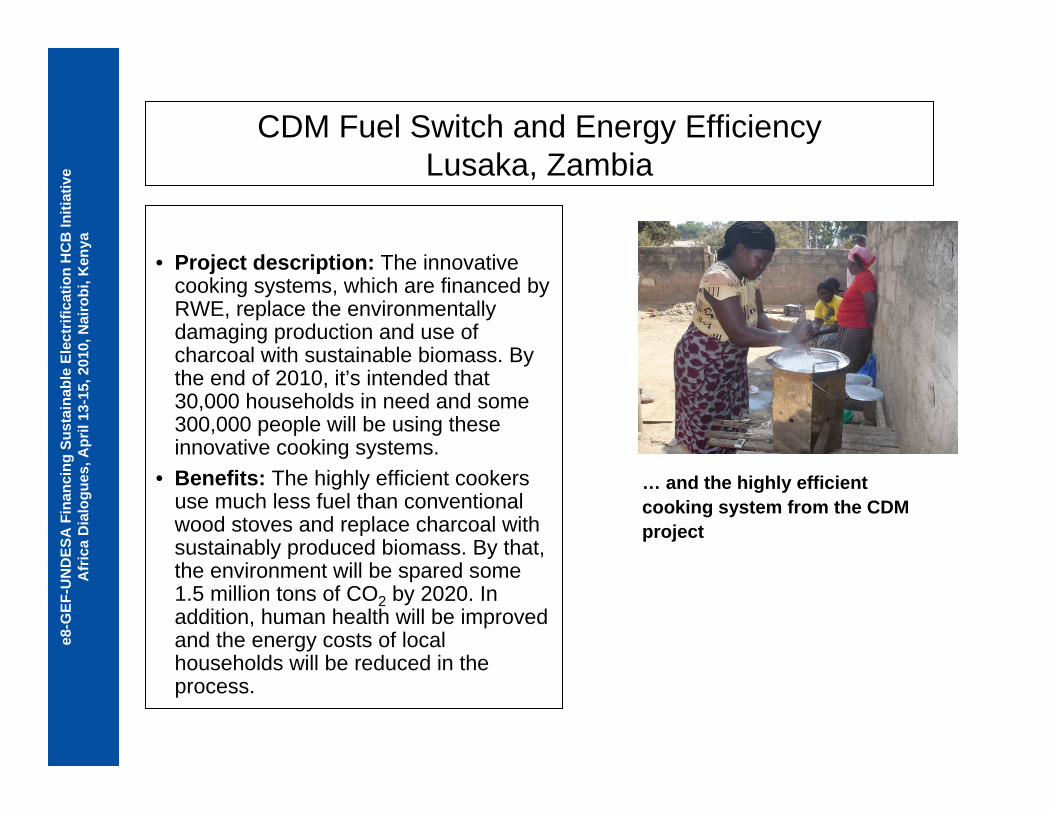
CDM Fuel Switch and Energy Efficiency Lusaka, Zambia
• Project description: The innovative cooking systems, which are financed by RWE, replace the environmentally damaging production and use of charcoal with sustainable biomass. By the end of 2010, it’s intended that 30,000 households in need and some 300,000 people will be using these innovative cooking systems.
• Benefits: The highly efficient cookers use much less fuel than conventional wood stoves and replace charcoal with sustainably produced biomass. By that, the environment will be spared some 1.5 million tons of CO2 by 2020. In addition, human health will be improved and the energy costs of local households will be reduced in the process.
… and the highly efficient cooking system from the CDM project
e8-G
EF-U
ND
ESA
Fin
anci
ng S
usta
inab
le E
lect
rific
atio
n H
CB
Initi
ativ
eA
fric
a D
ialo
gues
, Apr
il 13
-15,
201
0, N
airo
bi, K
enya
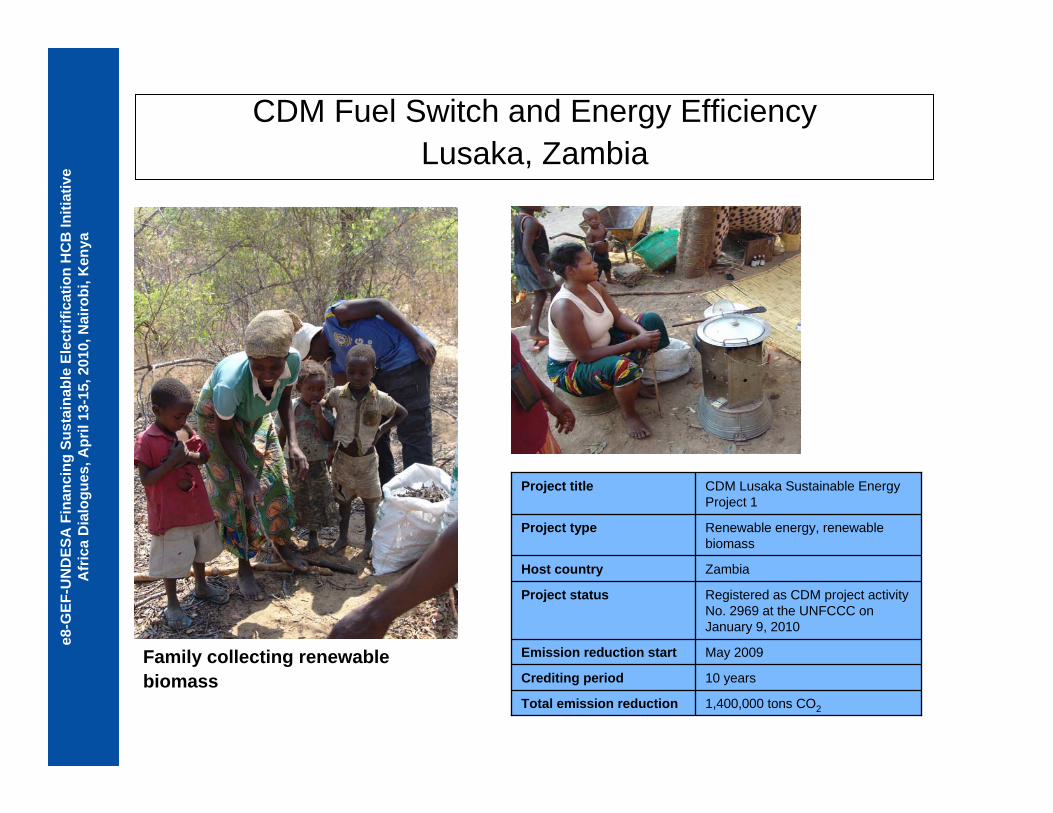
CDM Fuel Switch and Energy EfficiencyLusaka, Zambia
10 yearsCrediting period
1,400,000 tons CO2Total emission reduction
Registered as CDM project activity No. 2969 at the UNFCCC on January 9, 2010
Project status
May 2009Emission reduction start
ZambiaHost country
Renewable energy, renewable biomass
Project type
CDM Lusaka Sustainable Energy Project 1
Project title
Family collecting renewable biomass
e8-G
EF-U
ND
ESA
Fin
anci
ng S
usta
inab
le E
lect
rific
atio
n H
CB
Initi
ativ
eA
fric
a D
ialo
gues
, Apr
il 13
-15,
201
0, N
airo
bi, K
enya
Benefits of a partnership
A partnership with RWE offers project developers significant benefits: • RWE is a trustworthy and reliable business partner. RWE is financial secure and
buys CERs/ERUs to meet its own long-term reduction obligations in Europe.
• RWE can support you financially.
• RWE is willing, as a project partner, to assume project risks in the implementation of CDM projects.
• RWE has been developing experience in the execution of its own CDM and JI projects since 1999.
• RWE offers you technological expertise in the most important GHG avoidance methods, which are a crucial success factor in the implementation of CDM projects.
• RWE supports you in the entire CDM process: from preparing the PDD all the way to the issue of certificates.
Please discuss your potential CDM projects with us.
Suitable financing schemes and regulations for rural electrification
Financing Sustainable Rural Electrification, Africa Dialogues
Workshop E8, GEF, UNDESANairobi, 13-15 April 2010
Simon RollandPolicy and Development Officer, Alliance for Rural Electrification

2Simon Rolland, Workshop E8, GEF, UNDESA Nairobi, 13-15 April 2010
ARE promotes and provides efficient renewable solutions for rural electrification in developing countries.
• The Alliance attracts and unites all relevant private actors in order to speak with one voice about rural electrification with renewable energies.
• The Alliance generates technical and financial solutions about rural electrification in developing countries.
• ARE communicates and advocates for rural electrification using RET and convinces all relevant stakeholders.
The Alliance for Rural ElectrificationMission and Objectives
3Simon Rolland, Workshop E8, GEF, UNDESA Nairobi, 13-15 April 2010
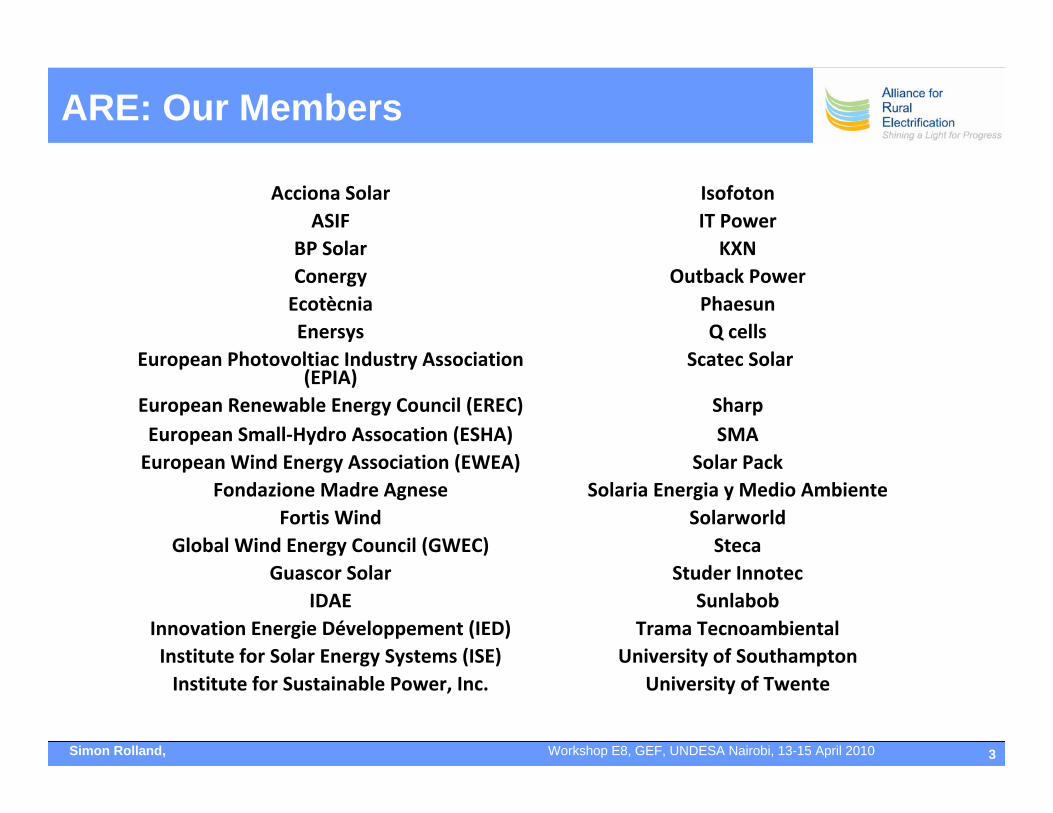
ARE: Our Members
Acciona Solar IsofotonASIF IT Power
BP Solar KXNConergy Outback PowerEcotècnia PhaesunEnersys Q cells
European Photovoltiac Industry Association (EPIA)
Scatec Solar
European Renewable Energy Council (EREC) SharpEuropean Small‐Hydro Assocation (ESHA) SMAEuropean Wind Energy Association (EWEA) Solar Pack
Fondazione Madre Agnese Solaria Energia y Medio AmbienteFortis Wind Solarworld
Global Wind Energy Council (GWEC) StecaGuascor Solar Studer Innotec
IDAE SunlabobInnovation Energie Développement (IED) Trama TecnoambientalInstitute for Solar Energy Systems (ISE) University of SouthamptonInstitute for Sustainable Power, Inc. University of Twente
4Simon Rolland, Workshop E8, GEF, UNDESA Nairobi, 13-15 April 2010
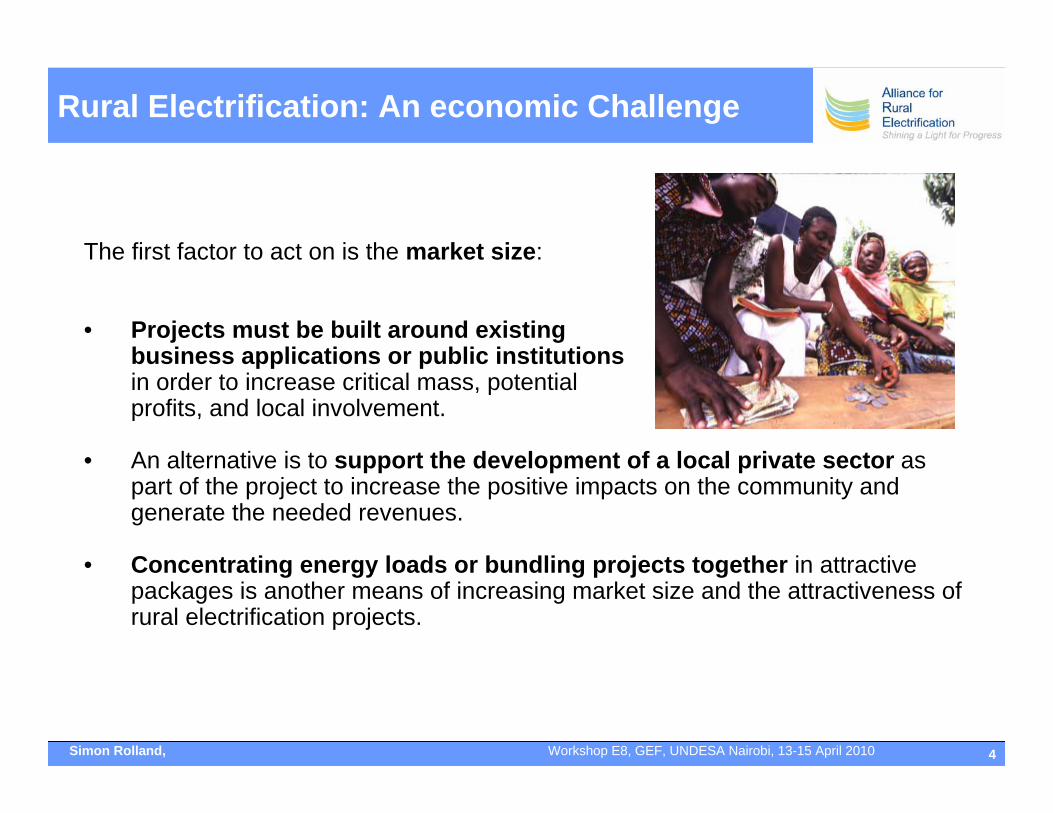
The first factor to act on is the market size:
• Projects must be built around existing business applications or public institutionsin order to increase critical mass, potential profits, and local involvement.
• An alternative is to support the development of a local private sector as part of the project to increase the positive impacts on the community and generate the needed revenues.
• Concentrating energy loads or bundling projects together in attractive packages is another means of increasing market size and the attractiveness of rural electrification projects.
Rural Electrification: An economic Challenge
5Simon Rolland, Workshop E8, GEF, UNDESA Nairobi, 13-15 April 2010
Rural Electrification: An economic Challenge
The second and main factor are tariffs and subsidies:
• Sustainable rural electrification tariff must at least cover the running and replacement costs (break-even tariff), even though the opportunity for profit is key to attract private operators (financially viable tariffs).
• Tariffs must maintain the balance between commercial viability and consumers’ ability and willingness to pay.
• Smart combinations of subsidies are key to attract operators and ensure project sustainability.
• Subsidies can support the investment, the connection, the operation costs and the output: Investment subsidies are a good solution if they go along with a good tariff structure; whereas OBA schemes if adequately planned are powerful instruments to leverage private investments and ensure O&M.
• Other forms of support can also be offered to project developers: tax credits; low import duties; site surveys; market studies; and capacity-building.
6Simon Rolland, Workshop E8, GEF, UNDESA Nairobi, 13-15 April 2010
Rural Electrification: A regulation Challenge
Regulation has to be an instrument favoring new projects. It needs to be light and flexible for small power producer in terms of standards and tariffs. It also has to protect rural consumers.
PPA regulation is especially important:
- PPAs must be fair and binding to protect every actor equally.
- PPAs should be as standardized as possible.
- PPAs should be signed over longer period of time and should be flexible and revisable when it comes to tariff.

7Simon Rolland, Workshop E8, GEF, UNDESA Nairobi, 13-15 April 2010
Rural Electrification: A political Challenge
• Access to electricity must rank high on the development agenda
• Access to electricity should follow a reliable long term strategy and the legal framework must allow for private and local initiatives
• Subsidies for fossil fuels should be phased out or transferred to the RETs. Trade barriers should be removed, as a pre-condition of the involvement of the funding of the project.
• A close dialogue between policymakers, the private sector and representatives of rural communities is indispensable for sustainable policies (Better education/communication on RETs).
8Simon Rolland, Workshop E8, GEF, UNDESA Nairobi, 13-15 April 2010
Rural Electrification: A local Challenge
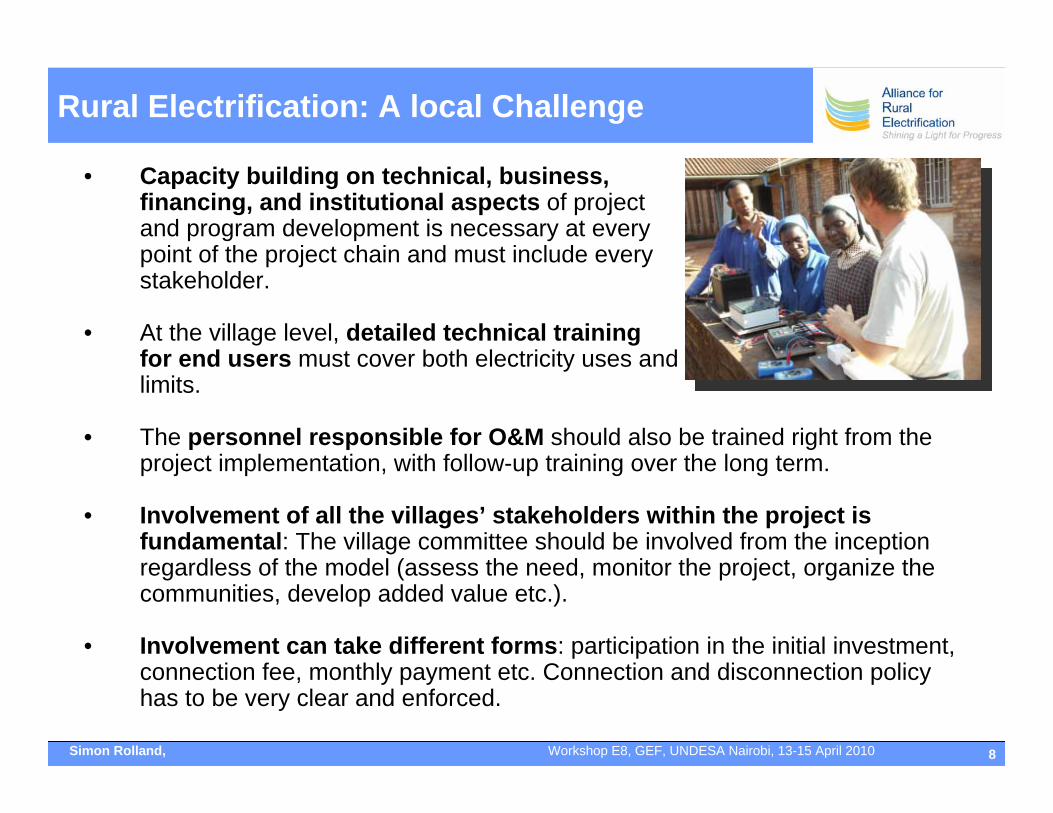
• Capacity building on technical, business, financing, and institutional aspects of project and program development is necessary at every point of the project chain and must include every stakeholder.
• At the village level, detailed technical training for end users must cover both electricity uses and limits.
• The personnel responsible for O&M should also be trained right from the project implementation, with follow-up training over the long term.
• Involvement of all the villages’ stakeholders within the project is fundamental: The village committee should be involved from the inception regardless of the model (assess the need, monitor the project, organize the communities, develop added value etc.).
• Involvement can take different forms: participation in the initial investment, connection fee, monthly payment etc. Connection and disconnection policy has to be very clear and enforced.
9Simon Rolland, Workshop E8, GEF, UNDESA Nairobi, 13-15 April 2010
Alliance for Rural Electrification
Rue d’Arlon 63‐65,
1040 Brussels, Belgium
T +32 2 400 10 52
www.ruralelec.org Pho
to c
redi
t: A
RE
mem
bers
THANK YOU!
e8-G
EF-U
ND
ESA
Fin
anci
ng S
usta
inab
le R
ural
Ele
ctrif
icat
ion
HC
B In
itiat
ive
Afr
ica
Dia
logu
es, A
pril
13-1
5, 2
010,
Nai
robi
, Ken
ya Peri-urban Electrification
By Connie SmyserSmyser Associates
e8-GEF-UNDESA Financing Rural Sustainable Electrification
Africa Dialogues Nairobi, Kenya, April 13-15, 2010

e8-G
EF-U
ND
ESA
Fin
anci
ng S
usta
inab
le R
ural
Ele
ctrif
icat
ion
HC
B In
itiat
ive
Afr
ica
Dia
logu
es, A
pril
13-1
5, 2
010,
Nai
robi
, Ken
ya
Outline
• What is peri-urban electrification and where does it fit?
• What is the success rate and is it sustainable?
• What factors influence success?• Business opportunities and barriers to
investment• Finance options
e8-G
EF-U
ND
ESA
Fin
anci
ng S
usta
inab
le R
ural
Ele
ctrif
icat
ion
HC
B In
itiat
ive
Afr
ica
Dia
logu
es, A
pril
13-1
5, 2
010,
Nai
robi
, Ken
ya
Where Does Peri-urban Electrification Fit?
•• DefinitionDefinition– NOT suburban– Poor, informal, contiguous to urban area, few or no
services, tenancy issues, may or may not be temporary
•• What is the key difference from a slum?What is the key difference from a slum?– Distinction is blurry. Little difference except for
location and possibly characteristics of inhabitants. Ex. Townships in S. Africa are government sanctioned but conditions are slumlike and most often on the far edges of cities.
– For this talk, examples from slums and peri-urban situations will be used, referring to urban electrification
e8-G
EF-U
ND
ESA
Fin
anci
ng S
usta
inab
le R
ural
Ele
ctrif
icat
ion
HC
B In
itiat
ive
Afr
ica
Dia
logu
es, A
pril
13-1
5, 2
010,
Nai
robi
, Ken
ya
How does this affect electrification needs and supply?
•• Potential customer perspectivePotential customer perspective, great willingness to connect legally but many barriers.
•• GovernmentsGovernments may “lump” urban areas in with either rural or urban slum electrification. BUT: Policies may be radically different.– Ex. Brazil Luz para Todos is rural while a separate program and policies
exist for urban “favelas” (slums).– But, in P-U areas alternatives to electricity are more like slums than
rural areas, e.g., little access to fuel wood, likely to have LPG etc. – P-U/slum solutions range from programs such as Morocco’s (Villes sans
Bidonvilles, i.e., eradication) to those in Latin America that favor acceptance, upgrading in situ, and granting tenancy and other rights.
•• Degree of FormalityDegree of Formality of the area may matter. – Ex: settlements on rights of way would be considered temporary and
therefore ineligible while those informal areas that could be legally developed may become eligible, creating inequalities among areas.
•• Municipalities become key partnersMunicipalities become key partners.
e8-G
EF-U
ND
ESA
Fin
anci
ng S
usta
inab
le R
ural
Ele
ctrif
icat
ion
HC
B In
itiat
ive
Afr
ica
Dia
logu
es, A
pril
13-1
5, 2
010,
Nai
robi
, Ken
ya
The Distribution Company Perspective
•• Proximity, access to supply and safetyProximity, access to supply and safety are main distinctions. Mounting a program can be quite different in terms of costs, type of actions taken and likely effectiveness.
•• Proximity:Proximity:– Close to existing distribution grid means likely rampant theft and
excessive usage. Company will need to implement a set of actions that “take back” the concession area along with making necessary distribution system upgrades
– Far from the grid (or war torn) means dramatically higher costs of grid installation and expanding O&M activities and personnel AND planning for inevitable attempts to steal electricity.
•• Are structures electrifiable?Are structures electrifiable? Where there is a will, there is a way, but adds costs.
e8-G
EF-U
ND
ESA
Fin
anci
ng S
usta
inab
le R
ural
Ele
ctrif
icat
ion
HC
B In
itiat
ive
Afr
ica
Dia
logu
es, A
pril
13-1
5, 2
010,
Nai
robi
, Ken
ya
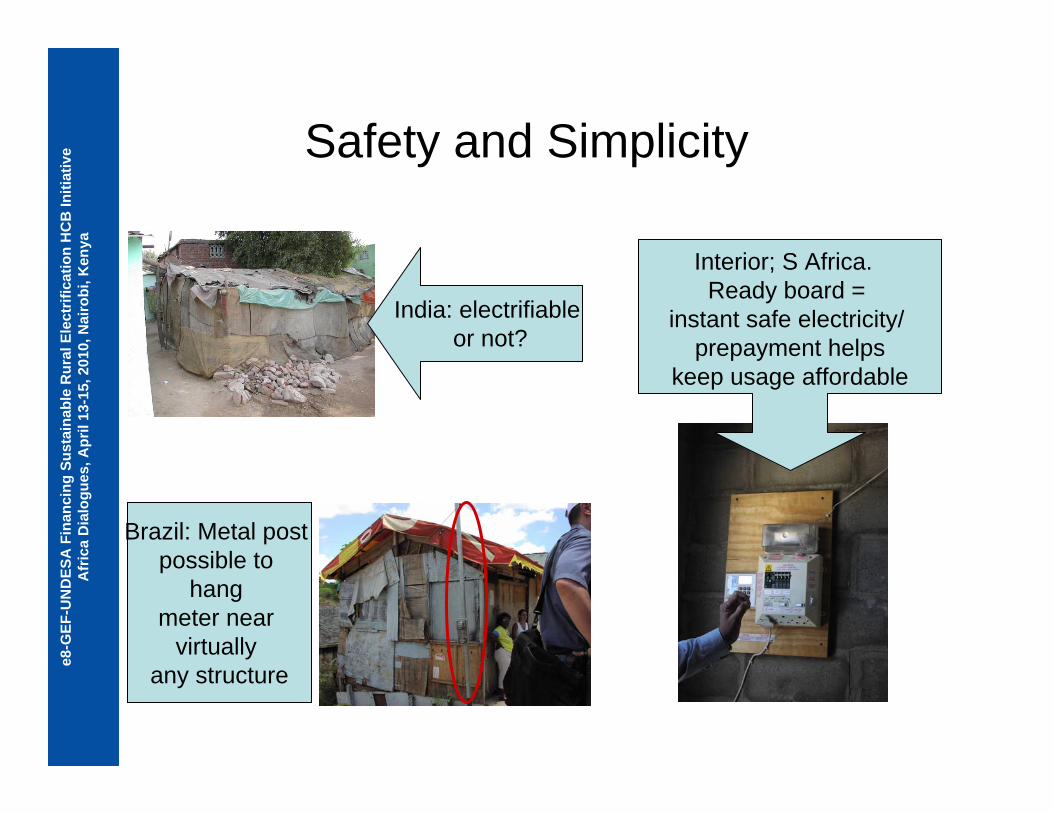
Safety and Simplicity
India: electrifiableor not?
Interior; S Africa. Ready board =
instant safe electricity/ prepayment helps
keep usage affordable
Brazil: Metal post possible to
hang meter near
virtually any structure
e8-G
EF-U
ND
ESA
Fin
anci
ng S
usta
inab
le R
ural
Ele
ctrif
icat
ion
HC
B In
itiat
ive
Afr
ica
Dia
logu
es, A
pril
13-1
5, 2
010,
Nai
robi
, Ken
ya
What is the success rate and is it sustainable?
•• Some notable failures but others unqualified successesSome notable failures but others unqualified successes•• Morocco: Morocco: ““temporarytemporary”” electrificationelectrification
– 93% of the communities electrified with payment performance 96% of billing. ROI less than one year.
•• AmplaAmpla/Brazil High tech solutions/Brazil High tech solutions– Investment actually reduced tariffs by 1.23% in the 2009. – Theft reduced to <5% and non-payment virtually eliminated where technology
applied– 40% decrease in kWh used – 3.4 percentage point drop in losses– Chile, Peru, Argentina, Colombia and many companies in Brazil have similar
successes.
•• Mozambique:Mozambique: Prepayment systemPrepayment system plus commercial management improvements
– Number of customers more than doubled in 4 years; – Collection rate improved from 75% in 1995 to 94% in 2005;– Average consumption per customer dropped from 148 kWh to 124 kWh– Total distribution losses decreased from 43% to 18% between 1995 and 2005.
e8-G
EF-U
ND
ESA
Fin
anci
ng S
usta
inab
le R
ural
Ele
ctrif
icat
ion
HC
B In
itiat
ive
Afr
ica
Dia
logu
es, A
pril
13-1
5, 2
010,
Nai
robi
, Ken
ya
Components of Success
•• Effective antiEffective anti--theft technologytheft technology tailored to the socio-economic character of the area targeted. Can range from simply making meter bypass harder to total reconfiguration of the grid and replacing conventional meters with electronic meters with remote reading and disconnection.
•• SocioSocio--economic Solutionseconomic Solutions– Social Partnership (“We deliverYou pay”)– Know your community– Community based service “agents” (intermediaries)– Making it easier to pay connection fees/bills, e.g. payments over time for
connection to helping customer to become eligible for low income tariff.– Energy efficiency assistance; internal improvements, e.g., rewiring for safety,
efficiency– Economic development assistance– Community and individual legal assistance (e.g., for land title or equivalent)
•• Appropriate support and realistic policies applied by governmentAppropriate support and realistic policies applied by governmentss•• Business plans that management and financiers can trustBusiness plans that management and financiers can trust

e8-G
EF-U
ND
ESA
Fin
anci
ng S
usta
inab
le R
ural
Ele
ctrif
icat
ion
HC
B In
itiat
ive
Afr
ica
Dia
logu
es, A
pril
13-1
5, 2
010,
Nai
robi
, Ken
ya
Government Policies & MarketConditions Affect ROI
NET REVENUE & PAYBACK FOR PILOT CASES AND SENSITIVITIES
0200,000400,000600,000800,000
1,000,0001,200,0001,400,0001,600,000
BASE CASE
BASE with
O&M
12%
debt
50%
debt
No S
ubsid
iesNo re
sale
No Avo
ided C
osts, N
o res
ale
No S
ubs,
No AC, N
o Res
ale
Base, Optimistic and Pessimistic Cases and Sensitivities
Net R
even
ue U
S$
0.00
5.00
10.00
15.00
20.00
25.00
30.00
Payb
ack
(yea
rs)
RevenuesPayback
Based on data from USAID SELR Brazil Project 2007

e8-G
EF-U
ND
ESA
Fin
anci
ng S
usta
inab
le R
ural
Ele
ctrif
icat
ion
HC
B In
itiat
ive
Afr
ica
Dia
logu
es, A
pril
13-1
5, 2
010,
Nai
robi
, Ken
ya
Effect of EE Measures on Usage and Bill
0
10
20
30
40
50
60
70
80
90
0-100 101-150 151-200 201-300 >300Consumption Blocks (kWh)
Avg
Billin
g wi
th T
axes
0%
5%
10%
15%
20%
25%
Perc
ent o
f Sala
ry
Total monthly billBill after EE Savings% of Salary% of salary after EE
Less than 5% of salary is considered affordable and likely to Less than 5% of salary is considered affordable and likely to reduce temptation to stealreduce temptation to steal

e8-G
EF-U
ND
ESA
Fin
anci
ng S
usta
inab
le R
ural
Ele
ctrif
icat
ion
HC
B In
itiat
ive
Afr
ica
Dia
logu
es, A
pril
13-1
5, 2
010,
Nai
robi
, Ken
ya
Results Achieved
•• Legal & Safe Access Legal & Safe Access to electricity for millions achieved
•• Technical and nonTechnical and non--technical lossestechnical losses dramatically reduced
•• RevenuesRevenues increased through improved payment performance and sales to non-subsidized customers
•• Energy efficiencyEnergy efficiency: typical reductions in usage for those formerly stealing are from 20 to 50%; EE assistance can dramatically increase savings. Saved power can be sold to full tariff customers.
•• Bottom lineBottom line: long term effort to meet a permanent challenge can make significant improvements in company viability dependingon the scale of the interventions -- but investments will be necessary.
e8-G
EF-U
ND
ESA
Fin
anci
ng S
usta
inab
le R
ural
Ele
ctrif
icat
ion
HC
B In
itiat
ive
Afr
ica
Dia
logu
es, A
pril
13-1
5, 2
010,
Nai
robi
, Ken
ya
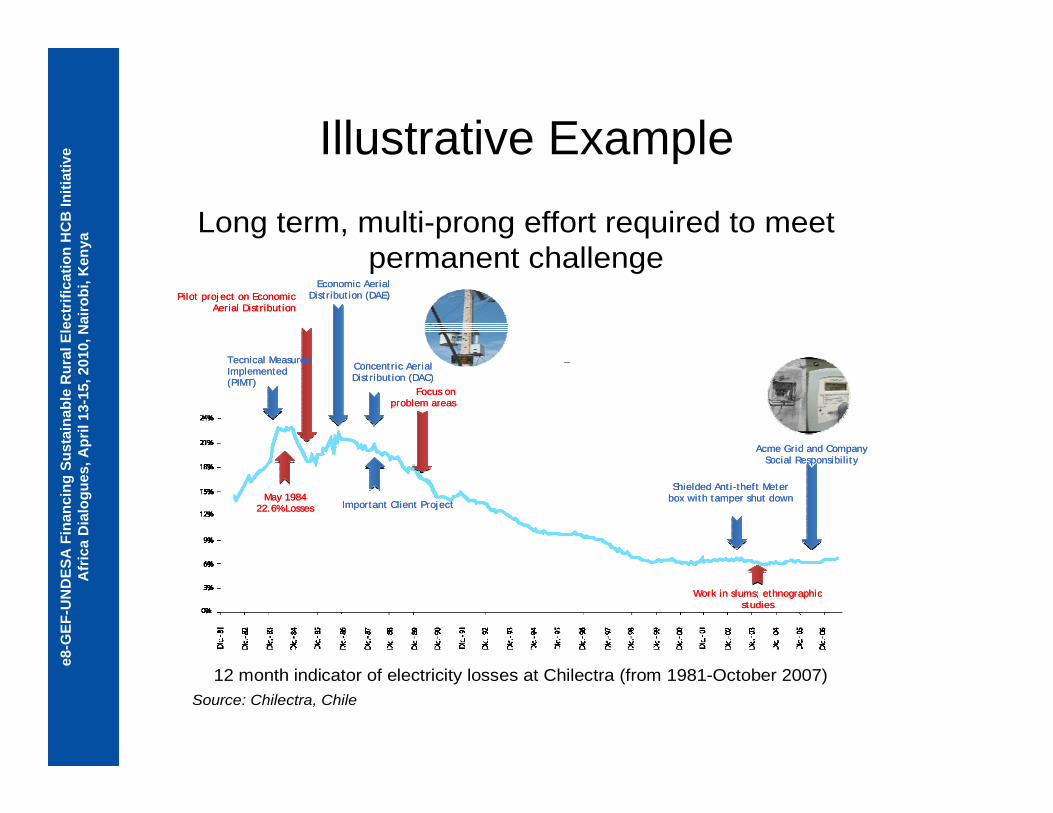
Illustrative ExampleLong term, multi-prong effort required to meet
permanent challenge
May 198422.6% Losses
May 198422.6% Losses
Pilot project on EconomicAerial Distribution
Pilot project on EconomicAerial Distribution
Economic AerialDistribution (DAE)
Economic AerialDistribution (DAE)
Important Client ProjectImportant Client Project
Concentric AerialDistribution (DAC)Concentric AerialDistribution (DAC)
Focus onproblem areas
Focus onproblem areas
Shielded Anti-theft Meter box with tamper shut downShielded Anti-theft Meter
box with tamper shut down
Work in slums; ethnographicstudies
Work in slums; ethnographicstudies
Acme Grid and CompanySocial Responsibility
Acme Grid and CompanySocial Responsibility
12 month indicator of electricity losses at Chilectra (from 1981-October 2007)
Tecnical MeasuresImplemented(PIMT)
Tecnical MeasuresImplemented(PIMT)
Source: Chilectra, Chile
e8-G
EF-U
ND
ESA
Fin
anci
ng S
usta
inab
le R
ural
Ele
ctrif
icat
ion
HC
B In
itiat
ive
Afr
ica
Dia
logu
es, A
pril
13-1
5, 2
010,
Nai
robi
, Ken
ya
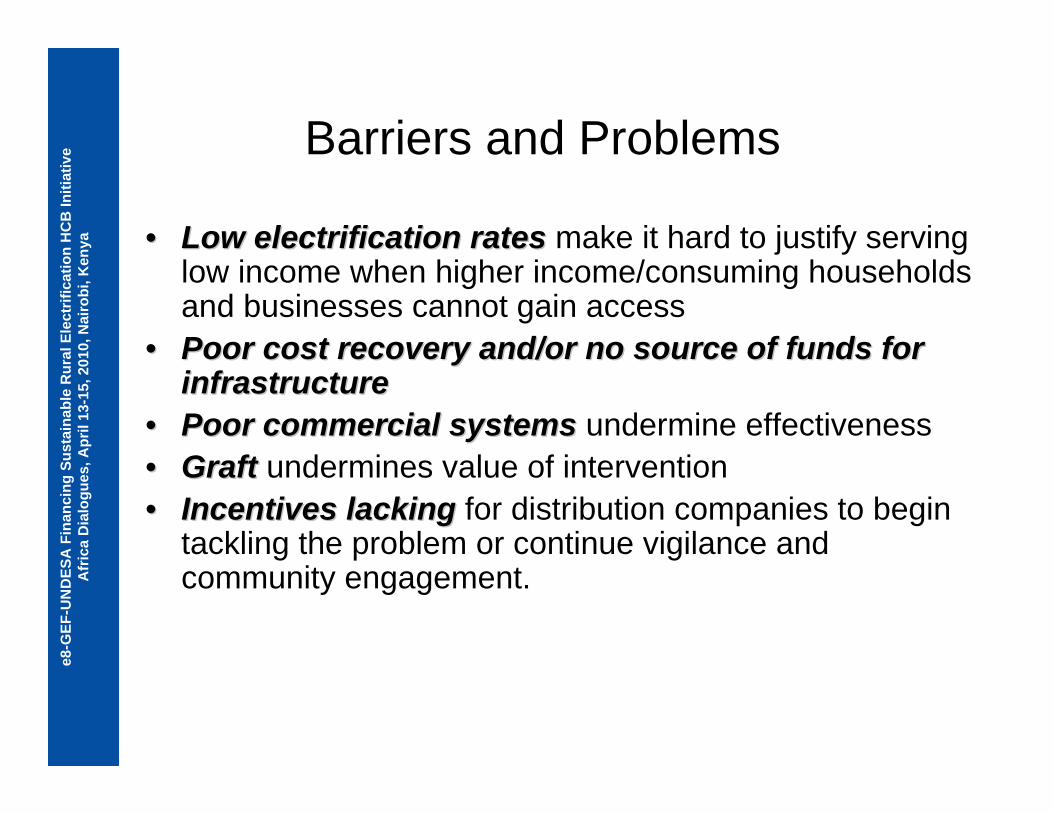
Barriers and Problems
•• Low electrification ratesLow electrification rates make it hard to justify serving low income when higher income/consuming households and businesses cannot gain access
•• Poor cost recovery and/or no source of funds for Poor cost recovery and/or no source of funds for infrastructureinfrastructure
•• Poor commercial systems Poor commercial systems undermine effectiveness•• GraftGraft undermines value of intervention •• Incentives lackingIncentives lacking for distribution companies to begin
tackling the problem or continue vigilance and community engagement.
e8-G
EF-U
ND
ESA
Fin
anci
ng S
usta
inab
le R
ural
Ele
ctrif
icat
ion
HC
B In
itiat
ive
Afr
ica
Dia
logu
es, A
pril
13-1
5, 2
010,
Nai
robi
, Ken
ya
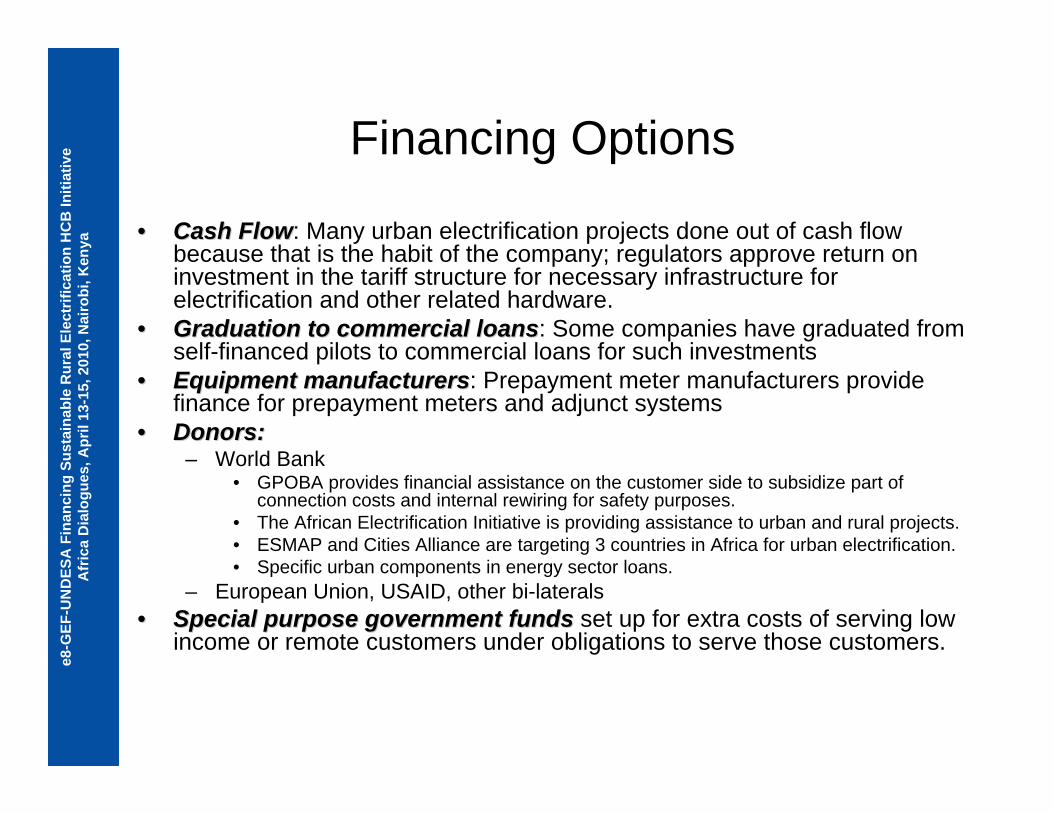
Financing Options
•• Cash FlowCash Flow: Many urban electrification projects done out of cash flow because that is the habit of the company; regulators approve return on investment in the tariff structure for necessary infrastructure for electrification and other related hardware.
•• Graduation to commercial loansGraduation to commercial loans: Some companies have graduated from self-financed pilots to commercial loans for such investments
•• Equipment manufacturersEquipment manufacturers: Prepayment meter manufacturers provide finance for prepayment meters and adjunct systems
•• Donors:Donors:– World Bank
• GPOBA provides financial assistance on the customer side to subsidize part of connection costs and internal rewiring for safety purposes.
• The African Electrification Initiative is providing assistance to urban and rural projects. • ESMAP and Cities Alliance are targeting 3 countries in Africa for urban electrification.• Specific urban components in energy sector loans.
– European Union, USAID, other bi-laterals•• Special purpose government fundsSpecial purpose government funds set up for extra costs of serving low
income or remote customers under obligations to serve those customers.
e8-G
EF-U
ND
ESA
Fin
anci
ng S
usta
inab
le R
ural
Ele
ctrif
icat
ion
HC
B In
itiat
ive
Afr
ica
Dia
logu
es, A
pril
13-1
5, 2
010,
Nai
robi
, Ken
ya
Thank You!Thank You!
Connie SmyserSmyser Associates
[email protected] me for bibliography and URLs for
materials relating to peri-urban and slum electrification
e8-G
EF-U
ND
ESA
Fin
anci
ng S
usta
inab
le E
lect
rific
atio
n H
CB
Initi
ativ
eA
fric
a D
ialo
gues
, Apr
il 13
-15,
201
0, N
airo
bi, K
enya e8-GEF-UNDESA
Financing Sustainable Electrification
Africa DialoguesNairobi, Kenya, April 13-15, 2010
Africa Energy Access Initiative and the South African Experience
Coretta MagongoaExecutive Manager,
Eskom/ Energy Poverty Action
e8-G
EF-U
ND
ESA
Fin
anci
ng S
usta
inab
le E
lect
rific
atio
n H
CB
Initi
ativ
eA
fric
a D
ialo
gues
, Apr
il 13
-15,
201
0, N
airo
bi, K
enya
Background• South Africa electricity sector is fully regulated - Eskom – the national power utility
– generates 95% of the electricity. • In 2009, maximum installed capacity reached 43 650 MW which represents close
to 40% of the African continent’s total installed capacity. Electricity is produced mainly from coal (94%).
• National plans are in place to expand the power supply, effectively doubling installed generation to some 80 000 MW by 2025 with associated grid expansion and strengthening.
• In 2009, 75% electrification was achieved –– 88% urban and 55% rural populations. (Electrification is registered as
electrification of households and not as the number of people) • South Africa’s electrification has been achieved mainly through grid extension• In the future, more renewable sources may facilitate further electrification if
barriers to their widespread use are overcome.
e8-G
EF-U
ND
ESA
Fin
anci
ng S
usta
inab
le E
lect
rific
atio
n H
CB
Initi
ativ
eA
fric
a D
ialo
gues
, Apr
il 13
-15,
201
0, N
airo
bi, K
enya
• 1990-1993 Eskom performed 380 000 connections
• 1994 - Target set by Government for 1,75m by year 2000.
• 2001 to date - over 3,5 million households electrified
– Connection every 30 seconds, pole every 10 seconds, 200m cable every minute.
– 1000 projects - 200 simultaneously each year.
As a result of the optimisation of the technical aspects of the design and construction, the cost per connection reduced in realterms. This resulted in the average cost per connection for grid being below the cost of non grid solar panels.
SA Electrification Programme –Post Apartheid
Due to Apartheid each city, town and village had established areas with good service delivery, and areas with poor or no service delivery. To date, there are still areas without basic services such as water, sanitation and access to electricity and these are not only in rural areas.
In 1994, after the first free election was held, it was estimated that approximately 6 million households were without electricity and the Government embarked on massive electrification drive:
e8-G
EF-U
ND
ESA
Fin
anci
ng S
usta
inab
le E
lect
rific
atio
n H
CB
Initi
ativ
eA
fric
a D
ialo
gues
, Apr
il 13
-15,
201
0, N
airo
bi, K
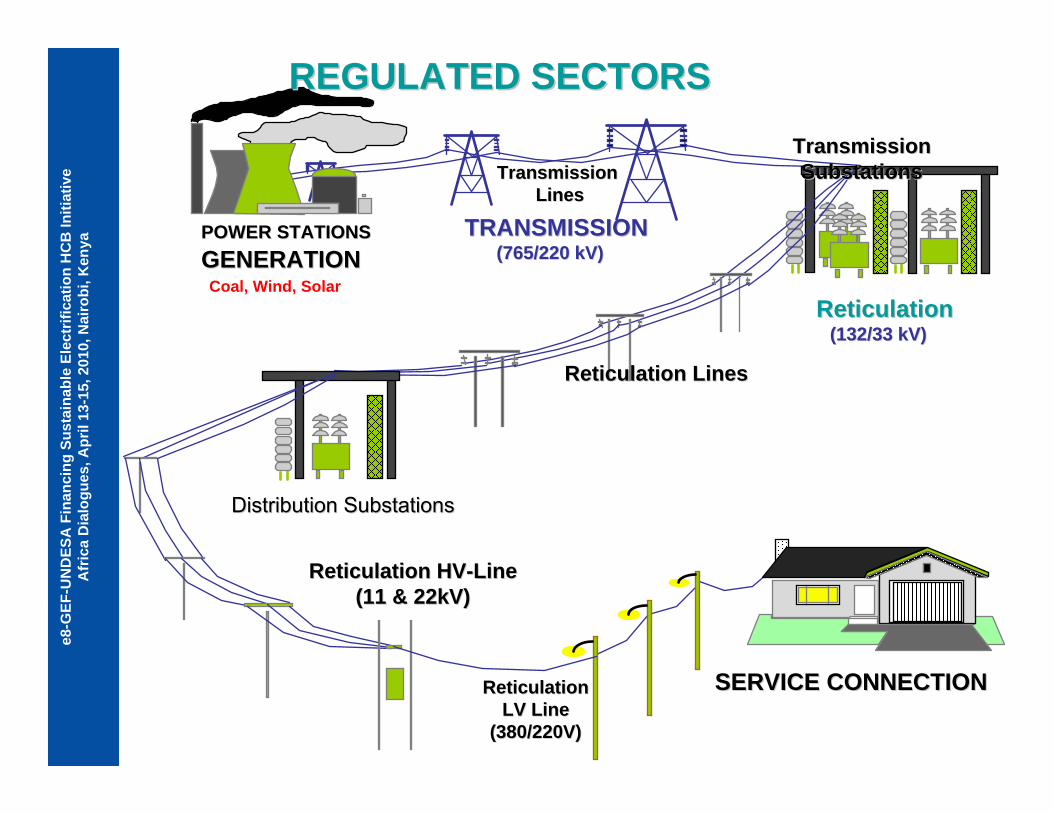
enya POWER STATIONSPOWER STATIONS
GENERATIONGENERATION
Transmission Transmission LinesLines
Transmission Transmission SubstationsSubstations
Reticulation LinesReticulation Lines
SERVICE CONNECTIONSERVICE CONNECTION
Reticulation HVReticulation HV--LineLine(11 & 22kV)(11 & 22kV)
TRANSMISSIONTRANSMISSION(765/220 kV)(765/220 kV)
ReticulationReticulation(132/33 kV)(132/33 kV)
ReticulationReticulationLV LineLV Line
(380/220V)(380/220V)
Distribution SubstationsDistribution Substations
REGULATED SECTORSREGULATED SECTORS
Coal, Wind, Solar
e8-G
EF-U
ND
ESA
Fin
anci
ng S
usta
inab
le E
lect
rific
atio
n H
CB
Initi
ativ
eA
fric
a D
ialo
gues
, Apr
il 13
-15,
201
0, N
airo
bi, K
enya
• The governance of the electricity sector is the responsibility of the Department of Energy (DoE).
• In 1994, Parliament approved a plan to ensure equal access to basic services for all South Africans.
• The National Energy Regulator, was given the task to develop and oversee the implementation of the Integrated National Electrification Programme (INEP).
• Eskom was tasked by National Energy Regulator of South Africa (NERSA) and later by DoE) to undertake the implementation through the use of contractors as part of any other Eskom business.
• Municipalities are now responsible for reticulation and distribution of electricity to households as well as to small businesses.
• Eskom maintains direct supply of electricity to larger industries• Non-grid electrification is provided by concessionaires. • Only in 2009 has renewable energy officially been accepted as “real” power when
the first national feed-in tariff scheme was established by NERSA.
Legal and regulatory frameworks;
e8-G
EF-U
ND
ESA
Fin
anci
ng S
usta
inab
le E
lect
rific
atio
n H
CB
Initi
ativ
eA
fric
a D
ialo
gues
, Apr
il 13
-15,
201
0, N
airo
bi, K
enya • The main funding of the National Electrification Programme is through the
National Budget and not through cross-subsidies.
• Once households are electrified, consumers are billed by the municipalities.
• External donor agencies, in particular the German KfW, support the electrification of schools and clinics.
• Also NORAD, the Norwegian agency for development co-operation, provides support in the form of capacity building, for example to monitor sale and management of electricity, also at the municipal level.
Funding Options
e8-G
EF-U
ND
ESA
Fin
anci
ng S
usta
inab
le E
lect
rific
atio
n H
CB
Initi
ativ
eA
fric
a D
ialo
gues
, Apr
il 13
-15,
201
0, N
airo
bi, K
enya
• Policies and funds are allocated to ensure that areas or individual houses that cannot be connected to the grid can be serviced through different means of modern energy applications such as solar PV.
• But, Poor policy implementation and lack of clear financial and legal regimes have constrained the development and introduction of new renewable energy sources such as solar, wind, modern bioenergy, etc.
• A key government priority is the issues around the 1.7 million households living in informal settlements be addressed first (by their respective municipal councils):
– either the areas must be formalised, or the inhabitants must be moved to other formalised human settlements before they can be included in the INEP.
• The DoE’s policy guideline addresses this matter, and a plan and its budget are in place to enable connection before 2014 if the Department of Housing or the municipality arrange for people to live in formalised housing.
Financial and energy policy environment

e8-G
EF-U
ND
ESA
Fin
anci
ng S
usta
inab
le E
lect
rific
atio
n H
CB
Initi
ativ
eA
fric
a D
ialo
gues
, Apr
il 13
-15,
201
0, N
airo
bi, K
enya
Tariffs• South Africa has amongst the lowest electricity tariffs in the world.• As a result, it has not been financially feasible for South Africa − to install new
power generation. • In South Africa alone, the generation margin was only 4% in 2008, leading to
endless power cuts and systematic load shedding. • Tariff increases are now being implemented commencing this month for 2010/11
at 24.8% which translates to ZAR 0.42 (USD 0.067) per kWh• There been considerations on differential tariff increases to protect the poor, a
“home-light” tariff for the low income sector, a similar tariff for small, micro and medium-sized enterprises (SMMEs), and time-of-use tariffs.
• This debate is in line with South Africa’s rural electrification agenda, as new power generation will be necessary to service more households
• NERSA published the REFIT (Renewable Energy Feed In Tariff) in March 2009:• Supports government target of 10 000GWh from renewable energy
sources by 2013 • Four technologies under REFIT Phase I:
0.900.94
2.101.25
R/kWhWind1Concentrated solar power trough with 6 hours storage2
Landfill gas4Small hydro (less than 10 MW)3
Technology

e8-G
EF-U
ND
ESA
Fin
anci
ng S
usta
inab
le E
lect
rific
atio
n H
CB
Initi
ativ
eA
fric
a D
ialo
gues
, Apr
il 13
-15,
201
0, N
airo
bi, K
enya
• Due to the low cost of grid in South Africa and the excess capacity of generation in the 1990s, Distributed generation option such as diesel or biomass generators, was not economically viable. On average, it proved always more optimum to supply the area with grid.
• Off-grid electrification is carried out by private-sector service providers (concessionaires)
• The non-grid electrification programme which expected to install 300 000 Solar Home System (SHS) (the photovoltaic panel with a battery that could supply lights and radios) in 1998 has not managed to reach its objective. To date, only around 50 000 SHS have been installed
Reason:• Lack of political will• Non-payment of bills• Lack of expected government capital subsidies delayed much of the work. • Decision making, concerning the definition of a non-grid area has also caused delays
and costs to the concessionaires. • Lack of Renewable technology acceptance by Communities• These difficulties have weakened the financial stability of the concessionaires and
delayed the installation process.
Green Technology options, associated costs, risk and opportunities;
e8-G
EF-U
ND
ESA
Fin
anci
ng S
usta
inab
le E
lect
rific
atio
n H
CB
Initi
ativ
eA
fric
a D
ialo
gues
, Apr
il 13
-15,
201
0, N
airo
bi, K
enya
• In 2008, Eskom launched a programme to subsidise solar water heating (SWH)• The subsidy level was too low and required massive administration and control
systems so that the programme has had little success. • Since 2008 some municipalities have introduced SWH as a way of avoiding load
shedding by Eskom. • Feed-in tariff offers an incentive for grid-connected renewable energy.• Free basic electricity provision for the first 50kWh of consumption per month • Prepaid electricity meters form part of the installation for all new connections, meters
are used to reduce the problem of non-payment.
Subsidies and cost reduction incentives
e8-G
EF-U
ND
ESA
Fin
anci
ng S
usta
inab
le E
lect
rific
atio
n H
CB
Initi
ativ
eA
fric
a D
ialo
gues
, Apr
il 13
-15,
201
0, N
airo
bi, K
enya
• The DoE monitors the implementation of electrification through field checks and similar direct follow-ups and initiates corrective measures when results are not as planned.
• But there has been an implementation deficit at the DoE because of insufficient capacity and poor co-ordination between the non-grid component of INEP and the Renewable Energy Directorate, which is impeding the efficiency of the Department.
• In the case of non-grid electrification, non-acceptance of renewable energy systems as a solution for the provision of electricity is slowing down the electrification process.
• Experience with non-grid electrification through solar heating systems (SHS) has taught a lesson that solar panels are subject to theft and vandalism.
Risk and liability mitigation;
e8-G
EF-U
ND
ESA
Fin
anci
ng S
usta
inab
le E
lect
rific
atio
n H
CB
Initi
ativ
eA
fric
a D
ialo
gues
, Apr
il 13
-15,
201
0, N
airo
bi, K
enya
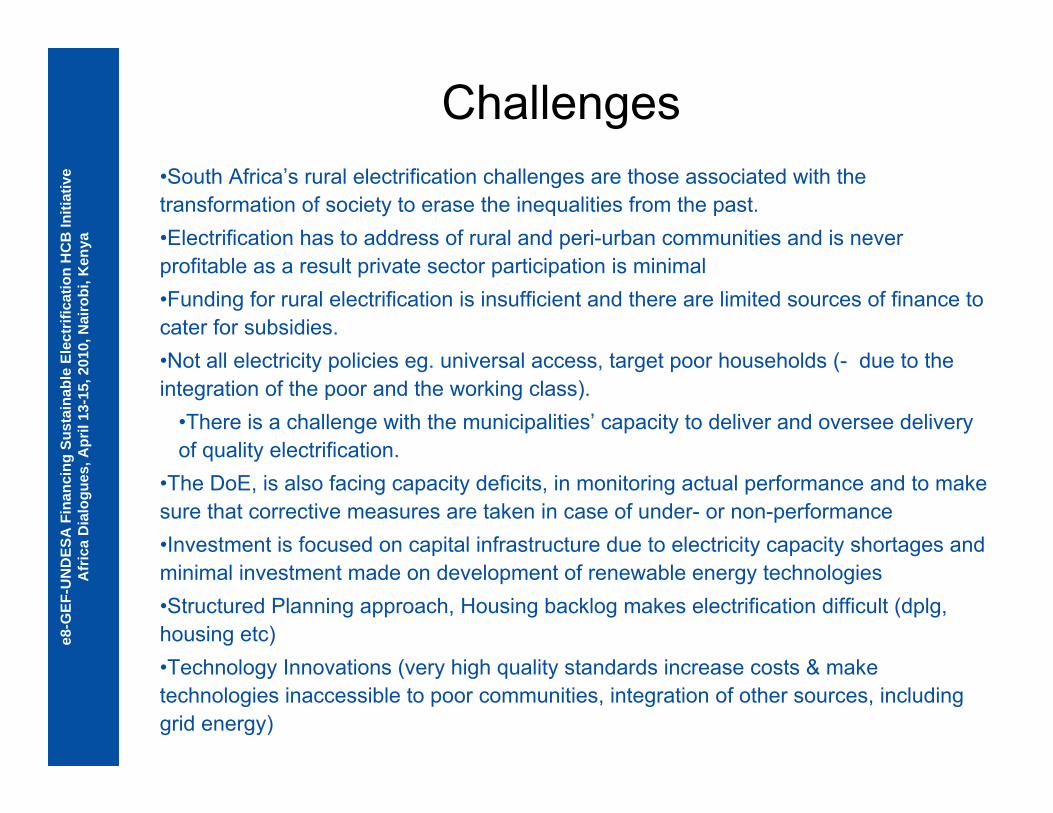
Challenges•South Africa’s rural electrification challenges are those associated with the transformation of society to erase the inequalities from the past.•Electrification has to address of rural and peri-urban communities and is never profitable as a result private sector participation is minimal•Funding for rural electrification is insufficient and there are limited sources of finance to cater for subsidies.•Not all electricity policies eg. universal access, target poor households (- due to the integration of the poor and the working class).
•There is a challenge with the municipalities’ capacity to deliver and oversee delivery of quality electrification.
•The DoE, is also facing capacity deficits, in monitoring actual performance and to make sure that corrective measures are taken in case of under- or non-performance•Investment is focused on capital infrastructure due to electricity capacity shortages and minimal investment made on development of renewable energy technologies•Structured Planning approach, Housing backlog makes electrification difficult (dplg, housing etc)•Technology Innovations (very high quality standards increase costs & make technologies inaccessible to poor communities, integration of other sources, including grid energy)
e8-G
EF-U
ND
ESA
Fin
anci
ng S
usta
inab
le E
lect
rific
atio
n H
CB
Initi
ativ
eA
fric
a D
ialo
gues
, Apr
il 13
-15,
201
0, N
airo
bi, K
enya
Regional Cooperation
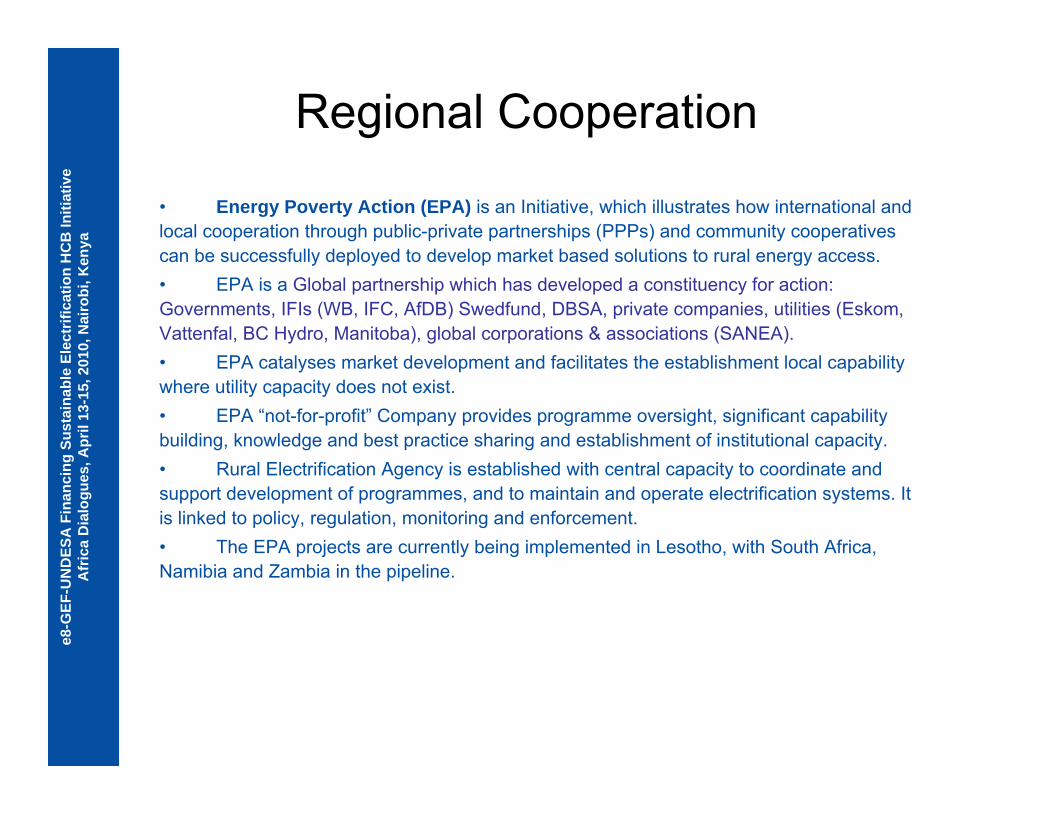
• Energy Poverty Action (EPA) is an Initiative, which illustrates how international and local cooperation through public-private partnerships (PPPs) and community cooperatives can be successfully deployed to develop market based solutions to rural energy access. • EPA is a Global partnership which has developed a constituency for action: Governments, IFIs (WB, IFC, AfDB) Swedfund, DBSA, private companies, utilities (Eskom, Vattenfal, BC Hydro, Manitoba), global corporations & associations (SANEA).• EPA catalyses market development and facilitates the establishment local capability where utility capacity does not exist.• EPA “not-for-profit” Company provides programme oversight, significant capability building, knowledge and best practice sharing and establishment of institutional capacity. • Rural Electrification Agency is established with central capacity to coordinate and support development of programmes, and to maintain and operate electrification systems. It is linked to policy, regulation, monitoring and enforcement.• The EPA projects are currently being implemented in Lesotho, with South Africa, Namibia and Zambia in the pipeline.
e8-G
EF-U
ND
ESA
Fin
anci
ng S
usta
inab
le E
lect
rific
atio
n H
CB
Initi
ativ
eA
fric
a D
ialo
gues
, Apr
il 13
-15,
201
0, N
airo
bi, K
enya
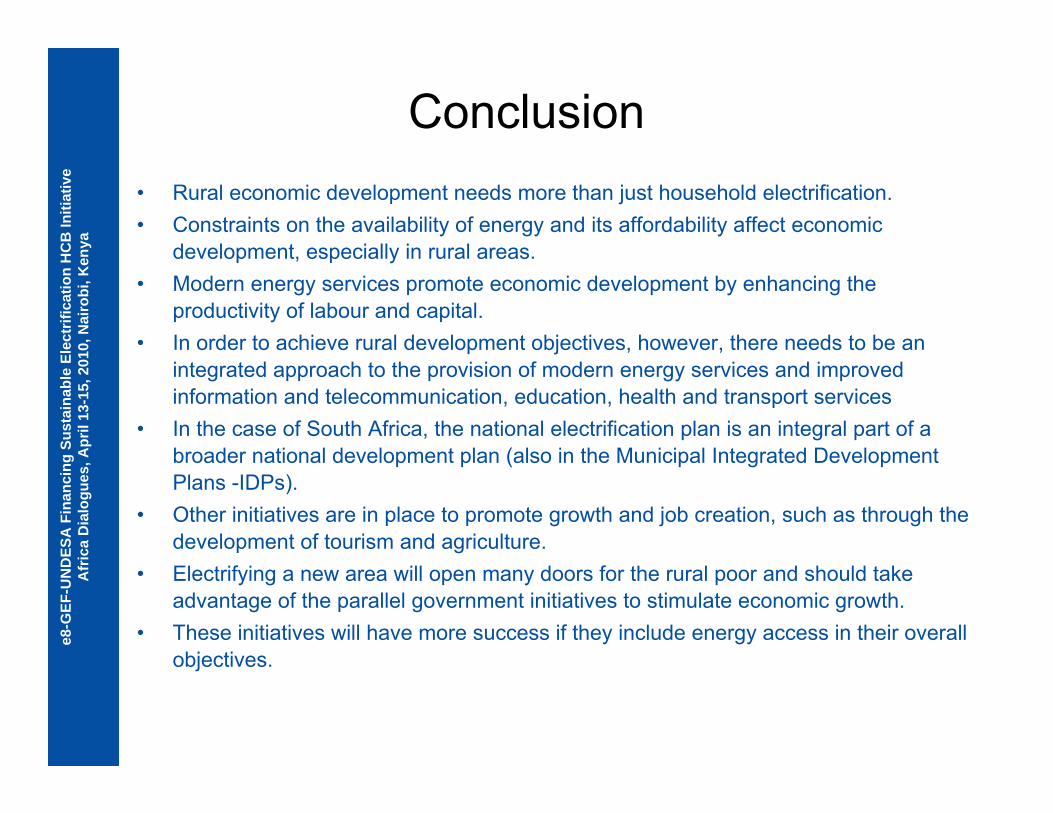
Conclusion• Rural economic development needs more than just household electrification. • Constraints on the availability of energy and its affordability affect economic
development, especially in rural areas. • Modern energy services promote economic development by enhancing the
productivity of labour and capital.• In order to achieve rural development objectives, however, there needs to be an
integrated approach to the provision of modern energy services and improved information and telecommunication, education, health and transport services
• In the case of South Africa, the national electrification plan is an integral part of a broader national development plan (also in the Municipal Integrated Development Plans -IDPs).
• Other initiatives are in place to promote growth and job creation, such as through the development of tourism and agriculture.
• Electrifying a new area will open many doors for the rural poor and should take advantage of the parallel government initiatives to stimulate economic growth.
• These initiatives will have more success if they include energy access in their overall objectives.

e8-G
EF-U
ND
ESA
Fin
anci
ng S
usta
inab
le E
lect
rific
atio
n H
CB
Initi
ativ
eA
fric
a D
ialo
gues
, Apr
il 13
-15,
201
0, N
airo
bi, K
enya
Contact Information:Email: [email protected]
Tel: +27 11 800 2436Fax: +27 860 665 566
Website:www.eskom.co.zaand www.weforum.org/epa
1
e8-G
EF-U
ND
ESA
Fin
anci
ng S
usta
inab
le E
lect
rific
atio
n H
CB
Initi
ativ
eA
fric
a D
ialo
gues
, Apr
il 13
-15,
201
0, N
airo
bi, K
enya
e8-GEF-UNDESAFinancing Sustainable Electrification
Africa DialoguesNairobi, Kenya, April 13-15, 2010
San Cristobal-Galapagos Wind Project
e8
2
e8-G
EF-U
ND
ESA
Fin
anci
ng S
usta
inab
le E
lect
rific
atio
n H
CB
Initi
ativ
eA
fric
a D
ialo
gues
, Apr
il 13
-15,
201
0, N
airo
bi, K
enya
The e8 San Cristobal-Galapagos Wind Project
3
e8-G
EF-U
ND
ESA
Fin
anci
ng S
usta
inab
le E
lect
rific
atio
n H
CB
Initi
ativ
eA
fric
a D
ialo
gues
, Apr
il 13
-15,
201
0, N
airo
bi, K
enya
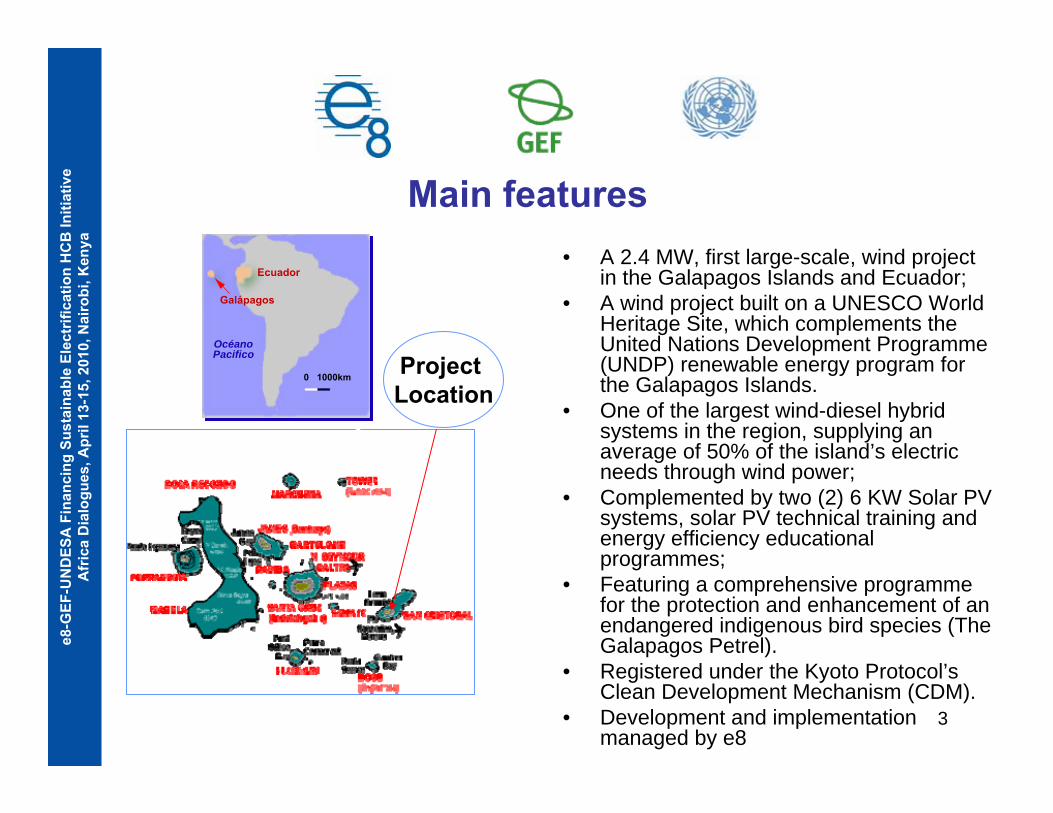
Main features• A 2.4 MW, first large-scale, wind project
in the Galapagos Islands and Ecuador;• A wind project built on a UNESCO World
Heritage Site, which complements the United Nations Development Programme (UNDP) renewable energy program for the Galapagos Islands.
• One of the largest wind-diesel hybrid systems in the region, supplying an average of 50% of the island’s electric needs through wind power;
• Complemented by two (2) 6 KW Solar PV systems, solar PV technical training and energy efficiency educational programmes;
• Featuring a comprehensive programme for the protection and enhancement of an endangered indigenous bird species (The Galapagos Petrel).
• Registered under the Kyoto Protocol’s Clean Development Mechanism (CDM).
• Development and implementation managed by e8
Project Location
0 1000km
Galápagos
Ecuador
OcéanoPacifico
4
e8-G
EF-U
ND
ESA
Fin
anci
ng S
usta
inab
le E
lect
rific
atio
n H
CB
Initi
ativ
eA
fric
a D
ialo
gues
, Apr
il 13
-15,
201
0, N
airo
bi, K
enya
Project Main Objectives• Reduce the risk of oil spills in a highly vulnerable environment;• Reduce atmospheric fossil-fuel emissions;• Decrease San Cristobal's dependence on diesel fuel;• Transfer technological expertise to local electric utility fro the
operation and maintenance of wind-based power system on a sustained basis;
• Provide a demonstration project model for the promotion and replication of small-scale power systems;
• Contribute to the protection of a unique ecosystem and World Heritage Site
• Increase access of the local population to renewable energy;• Develop public awareness of effective demand-side management
and energy conservation practices.

5
e8-G
EF-U
ND
ESA
Fin
anci
ng S
usta
inab
le E
lect
rific
atio
n H
CB
Initi
ativ
eA
fric
a D
ialo
gues
, Apr
il 13
-15,
201
0, N
airo
bi, K
enya
Project Timeline
• Concept 1999• Pre- Feasibility Study 2001• Feasibility Study 2005• Limited Notice to Proceed 2005• Full Notice to Proceed 2006• Implementation 2006-2007• Project Closeout 2007• Commissioning Oct. 2007• Inauguration Mar. 2008

6
e8-G
EF-U
ND
ESA
Fin
anci
ng S
usta
inab
le E
lect
rific
atio
n H
CB
Initi
ativ
eA
fric
a D
ialo
gues
, Apr
il 13
-15,
201
0, N
airo
bi, K
enya
Specific topics•Legal framework•Financial structure•Tariffs•Subsidies•Risk and liability mitigation•Technology issues•Logistical challenges
7
e8-G
EF-U
ND
ESA
Fin
anci
ng S
usta
inab
le E
lect
rific
atio
n H
CB
Initi
ativ
eA
fric
a D
ialo
gues
, Apr
il 13
-15,
201
0, N
airo
bi, K
enya
Legal and regulatory framework• Energy and rural electrification policies were stable and clear. In spite of
frequent turn over of main Government officers, agreements were fully respected
• Regulatory framework was adequate• Rural Electrification Special Law, established a specific fund for supporting
rural electrification programs• Project developers worked with success together with the National
Electricity Council (CONELEC) in order to allow the use of ruralelectrification funds in renewable energy projects like the Galapagos
• Ecuadorian Electricity Law determines preferred dispatching for electricity from renewable sources. Tariffs regulation establishes a preferred rate for renewable energy in the Galapagos Islands. Both factors were reflected in the PPA signed with Elecgalapagos, the local utility

8
e8-G
EF-U
ND
ESA
Fin
anci
ng S
usta
inab
le E
lect
rific
atio
n H
CB
Initi
ativ
eA
fric
a D
ialo
gues
, Apr
il 13
-15,
201
0, N
airo
bi, K
enya
Financing the Project (1)• In the 90’s, the Ecuadorian Government declared the need to
promote renewable energy in the Galapagos Islands to replace diesel powered electricity generation
• UNDP committed its support to the Ecuadorian Government to develop a program based on renewable energy for re-electrifying the Galapagos Islands
• A Pre-feasibility report was issued in 2000 by UNDP consultants with identification of renewable resources in the 4 inhabited islands: San Cristobal, Santa Cruz, Isabela and Floreana. Estimated budgets were included.
• Ecuadorian Government and UNDP started to search at international level, potential donors/investors for the development of the Program

9
e8-G
EF-U
ND
ESA
Fin
anci
ng S
usta
inab
le E
lect
rific
atio
n H
CB
Initi
ativ
eA
fric
a D
ialo
gues
, Apr
il 13
-15,
201
0, N
airo
bi, K
enya
Financing the Project (2)
• Based on previous experiences with UNDP, the e8 companies demonstrated interest in providing financial and technical support to develop the wind project in the San Cristobal island: first site visit was conducted by e8 delegates in November, 2001.
• The e8 companies committed their support, provided that the United Nations Foundation (UNF) also provides a complementary financial support.
• In April, 2003 a Project Document (ProDoc) was signed by the Government of Ecuador, the e8 companies, UNF and UNDP for the development of the Project. Funds from the e8 companies and UNF were provided as grants.
• A Commercial Trust was structured at the same time in order to administrate and manage the project funds. A private Ecuadorian experienced financial agency was designated as the Trustee.
10
e8-G
EF-U
ND
ESA
Fin
anci
ng S
usta
inab
le E
lect
rific
atio
n H
CB
Initi
ativ
eA
fric
a D
ialo
gues
, Apr
il 13
-15,
201
0, N
airo
bi, K
enya
Financing the Project (3)• The Ecuadorian government contributed with financial resources
from the Rural Electrification Fund (FERUM Fund). FERUM Fund rules were modified to permit financing of renewable energy projects.
• Through a Law in force at the time of Project implementation, itwas possible to receive a percentage of income tax as voluntary donations from Ecuadorian taxpayers.
• Interests earned by funds were also a component of the financialstructure.
• A small financial gap was filled with a short term loan provided with UNF funds through UNDP. Such funds had been provided by UNF for financing other renewable projects in other Galapagos islands.
• Total project cost was USD 10,5 million. • In addition project development and environmental studies were
totally funded and lead by charitable grant and technical expertise from e8 companies.

11
e8-G
EF-U
ND
ESA
Fin
anci
ng S
usta
inab
le E
lect
rific
atio
n H
CB
Initi
ativ
eA
fric
a D
ialo
gues
, Apr
il 13
-15,
201
0, N
airo
bi, K
enya
Financial structure
Financial structure (millions USD)
e8 ; $5,5 ; 52%
UNF ; $0,3 ; 3%
FERUM ; $3,3 ; 32%
Tax payers ; $0,4 ; 4%
Loan ; $0,6 ; 6%
Interests; $0,3 ; 3%
e8 UNF FERUM Tax payers Loan Interests
12
e8-G
EF-U
ND
ESA
Fin
anci
ng S
usta
inab
le E
lect
rific
atio
n H
CB
Initi
ativ
eA
fric
a D
ialo
gues
, Apr
il 13
-15,
201
0, N
airo
bi, K
enya
Tariffs (1)
• The Ecuadorian Electricity Council (CONELEC) - the electricity regulator - has established specific tariffs for renewable energies in Ecuador
• For the Galapagos Islands there are special preferential rates, although still not adequate, as explained below.
• The tariff value determined for wind energy is US$ 0,1282 / kWh for the San Cristobal – Galapagos Wind Project
• Above value was fixed by CONELEC after a detailed cost analysis in accordance with the agency criteria based on costs for grid integrated systems. Although the Project developers demonstratedthat such prices are insufficient to cover capital and O&M costs for the San Cristobal project, the regulator did not consider the rationale behind such explanation.

13
e8-G
EF-U
ND
ESA
Fin
anci
ng S
usta
inab
le E
lect
rific
atio
n H
CB
Initi
ativ
eA
fric
a D
ialo
gues
, Apr
il 13
-15,
201
0, N
airo
bi, K
enya
Tariffs (2)
• Because of such price restriction, the current tariff covers only O&M costs as well as other obligations of the Trust (fund for petrelprotection program, emergency maintenance fund, demobilization fund, seed fund for future re-equipment)
• A PPA has been signed between EOLICSA (the IPP - San Cristobal Wind Project company) and “Elecgalapagos” the local Government Utility, responsible for electricity distribution in the Galapagos
• As mentioned, PPA is based on a rate of US$ 0,1282 / kWh for wind energy delivered to Elecgalapagos, while diesel generated electricity costs approximately US$ 0,17 / kWh to the local utility, based on subsidized fuel delivered at less than 1 USD per gallon(US$ 0.26 / litre).
• Tariffs to final users are regulated by the Ecuadorian Electricity Council (CONELEC)
14
e8-G
EF-U
ND
ESA
Fin
anci
ng S
usta
inab
le E
lect
rific
atio
n H
CB
Initi
ativ
eA
fric
a D
ialo
gues
, Apr
il 13
-15,
201
0, N
airo
bi, K
enya
Subsidies
• Average tariff to final users is US$ 0.09 / kWh, while actual cost to the utility is roughly US$ 0.19 / kWh, including wind component. The difference is being subsided by the Government
• Diesel fuel for electricity generators is also subsided by the Ecuadorian Government
• Above situation is common for all distribution companies (Government owned) in Ecuador
• The Rural Electrification Special Law, established an specific fund coming from monthly contributions of industrial and commercial electricity users (10% of electricity invoices) in order to support rural electrification programs
• An important component (32%) of the San Cristobal Wind Project was financed as a subsidy with rural electrification funds; i.e. the national subsidy to diesel generation was re-directed to wind generation
• PPA tariff is not enough to recover investment costs: financial structure was mainly based on international and national grants (subsidy to capital costs)
15
e8-G
EF-U
ND
ESA
Fin
anci
ng S
usta
inab
le E
lect
rific
atio
n H
CB
Initi
ativ
eA
fric
a D
ialo
gues
, Apr
il 13
-15,
201
0, N
airo
bi, K
enya
Risk and liability mitigation (1)• e8 liability with respect to the Project was mitigated/eliminated by means of
its participation through a Trust scheme: it legally shields the settlers liability• The implementation approach of a Limited Notice to Proceed (LNTP) phase,
followed by a Full Notice to Proceed (FNTP) phase was effective for mitigation of financial risk
• e8 funds were not transferred to the Project until other funds were transferred
• The risk concerning estimation of capital cost was mitigated through the determination of fixed price proposals prior to Project implementation
• The risk of miss evaluation of O&M costs was mitigated through thoroughly investigations and estimations of actual local costs and imported goods and services
• Technical risk was mitigated by utilizing the e8 Network of Expertise to provide management and technical support, as well as, well experienced Project Director team and Local Management
16
e8-G
EF-U
ND
ESA
Fin
anci
ng S
usta
inab
le E
lect
rific
atio
n H
CB
Initi
ativ
eA
fric
a D
ialo
gues
, Apr
il 13
-15,
201
0, N
airo
bi, K
enya
Risk and liability mitigation (2)
• Risk of misestimation of wind resource was mitigated through theinstallation of an additional 50-meter measuring system on the project site, before project implementation (previously two 20 meters masts were installed for 2 years for collecting wind data). Hybrid system diesel displacement was reduced from originally estimated 61% to 52 %.
• Risk from multi-contract approach was mitigated through increased effort by project management
• Risk to affect the endangered petrel in the project area was mitigated through: relocation of project site, stringent Environmental Management Plan, location of funds for petrel program, high level Supervision Committee
• Instability of the Ecuadorian public administration during past periods created frequent changes in key government appointments. It was mitigated though the signature of step-by-step agreements, including PPA, well respected by involved public agencies

17
e8-G
EF-U
ND
ESA
Fin
anci
ng S
usta
inab
le E
lect
rific
atio
n H
CB
Initi
ativ
eA
fric
a D
ialo
gues
, Apr
il 13
-15,
201
0, N
airo
bi, K
enya
Risk and liability mitigation (3)• To avoid to politicize the Project, the e8 maintained
leadership in the Trustee Committee. Risk was mitigated through stream-lined project management with pre-assigned authorization limits and provision for electronic approval of major project management decisions by the Trust Committee
• Risk of future changes of electricity sector regulations is mitigated through terms and conditions of signed PPA
• In-country Local Manager activity was very important in keeping the project on course and facilitating discussions with government agencies and local stakeholders during period of high-turnover in government agencies
18
e8-G
EF-U
ND
ESA
Fin
anci
ng S
usta
inab
le E
lect
rific
atio
n H
CB
Initi
ativ
eA
fric
a D
ialo
gues
, Apr
il 13
-15,
201
0, N
airo
bi, K
enya
Technological issues• The wind-diesel hybrid system in operation is an state-of-the-art-
system regarding operational philosophy• Risk of operative problems has been mitigated by means of an O&M
Contract signed with the manufacturer for 2-years duration (the same as the guarantee period)
• Through O&M Contract the manufacturer provides on site full-time engineer and remote permanent supervision through internet from the manufacturer headquarters in Spain
• Risk mitigation is also provided through highly experienced Operations Manager duly trained at the manufacturer facilities
• In addition, a permanent on site HCB plan to local operators is in process by Operations Manager and manufacturer’s engineer, in order to minimize operational risk
• The e8 companies permanent supervision is an additional and highly important support to mitigate technological risks

19
e8-G
EF-U
ND
ESA
Fin
anci
ng S
usta
inab
le E
lect
rific
atio
n H
CB
Initi
ativ
eA
fric
a D
ialo
gues
, Apr
il 13
-15,
201
0, N
airo
bi, K
enya
Logistical Challenges
20
e8-G
EF-U
ND
ESA
Fin
anci
ng S
usta
inab
le E
lect
rific
atio
n H
CB
Initi
ativ
eA
fric
a D
ialo
gues
, Apr
il 13
-15,
201
0, N
airo
bi, K
enya
Summary: Innovative Aspects and Challenges
• INNOVATION: IPP Model-Funding from multiple sources. CHALLENGE: Multiple accounts and reporting, cash flow difficulty.
• INNOVATION: Environmental protection special programmes. CHALLENGE: Additional responsibility, coordination and adapted timelines.
• INNOVATION: Strong involvement of local partner, EEPG, provided many benefits -Generating Concession, FERUM Subsidies, Local Designated Income Tax Payments, and Land Easement.CHALLENGE: Addressing local capacity issues and local staff availability to work on new projects.
• INNOVATION: Commercial Trust Legal structure CHALLENGE: Additional management efforts.
→ Public–Private Partnership model with strong project management, strong support within Ecuador and from UNDP were key to addressing the many unique challenges of the San Cristobal Wind Project.

21
e8-G
EF-U
ND
ESA
Fin
anci
ng S
usta
inab
le E
lect
rific
atio
n H
CB
Initi
ativ
eA
fric
a D
ialo
gues
, Apr
il 13
-15,
201
0, N
airo
bi, K
enya
Project First Results and Success
22
e8-G
EF-U
ND
ESA
Fin
anci
ng S
usta
inab
le E
lect
rific
atio
n H
CB
Initi
ativ
eA
fric
a D
ialo
gues
, Apr
il 13
-15,
201
0, N
airo
bi, K
enya Operation results
• Operation started October 2007• 2008 was an unusual “low wind” year• 2009 wind conditions are becoming normal• Next slide shows wind vs. diesel energy production for
the whole operation period
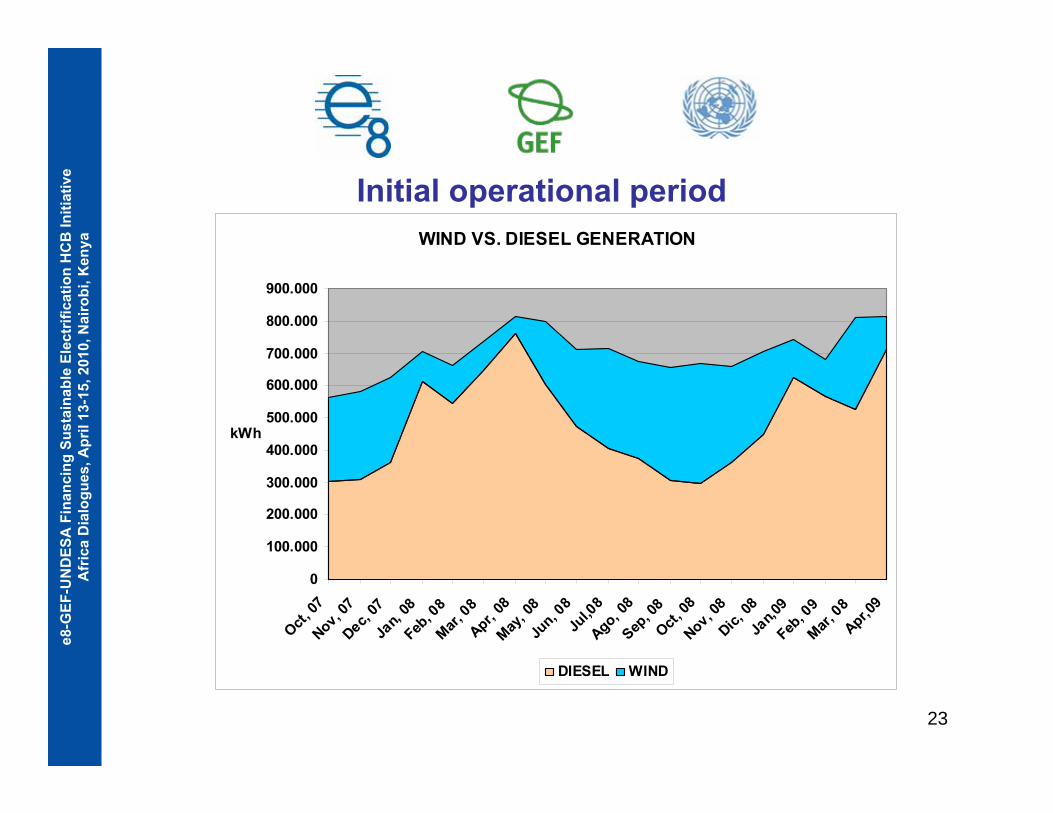
23
e8-G
EF-U
ND
ESA
Fin
anci
ng S
usta
inab
le E
lect
rific
atio
n H
CB
Initi
ativ
eA
fric
a D
ialo
gues
, Apr
il 13
-15,
201
0, N
airo
bi, K
enya
Initial operational periodWIND VS. DIESEL GENERATION
0
100.000
200.000
300.000
400.000
500.000
600.000
700.000
800.000
900.000
Oct, 07
Nov, 07
Dec, 07
Jan,
08Feb
, 08
Mar, 08
Apr, 08
May, 0
8Ju
n, 08
Jul,0
8Ago, 0
8Sep
, 08
Oct, 08
Nov, 08
Dic, 08
Jan,0
9Feb
, 09
Mar, 08
Apr,09
kWh
DIESEL WIND
24
e8-G
EF-U
ND
ESA
Fin
anci
ng S
usta
inab
le E
lect
rific
atio
n H
CB
Initi
ativ
eA
fric
a D
ialo
gues
, Apr
il 13
-15,
201
0, N
airo
bi, K
enya
Financial Achievements
• 100% of invoices for energy delivered to local utility have been paid on time
• Incomes from energy sales are sufficient for putting aside funds for long term replacement / major repairs, as well as for petrel protection program
• Annual operation budgets have been kept below original foreseen values
• Short term loans being paid on time
25
e8-G
EF-U
ND
ESA
Fin
anci
ng S
usta
inab
le E
lect
rific
atio
n H
CB
Initi
ativ
eA
fric
a D
ialo
gues
, Apr
il 13
-15,
201
0, N
airo
bi, K
enya
Environmental Achievements
• Fossil fuel reduction: 1,375,000 litres of diesel imported for the period October 2007 – March 2009
• CO2 Emissions avoided: 3,200 tons avoided during the same period
• Petrel protection and enhancement programme: very positive results for the period October 2007 – March 2009
26
e8-G
EF-U
ND
ESA
Fin
anci
ng S
usta
inab
le E
lect
rific
atio
n H
CB
Initi
ativ
eA
fric
a D
ialo
gues
, Apr
il 13
-15,
201
0, N
airo
bi, K
enya
Project Team
• Paul Loeffelman: American Electric Power (AEP) –Project Leader
• Jim Tolan: Industry and Energy Associates (IEA) –Project Director
• Luis C. Vintimilla: Ecuadorian Idependent Consultant -Project Manager

27
e8-G
EF-U
ND
ESA
Fin
anci
ng S
usta
inab
le E
lect
rific
atio
n H
CB
Initi
ativ
eA
fric
a D
ialo
gues
, Apr
il 13
-15,
201
0, N
airo
bi, K
enya
THANK YOU
For more information please contact:e8 General Secretariat
Email: [email protected]: +1-514-392-8876Fax:+1-514-392-8900
www.e8.org
Eólica San Cristóbal S.A - EOLICSAEmail: [email protected]
www.eolicsa.com.ecTel/Fax: +593-2-354 0161
e8-G
EF-U
ND
ESA
Fin
anci
ng S
usta
inab
le R
ural
Ele
ctrif
icat
ion
HC
B In
itiat
ive
Afr
ica
Dia
logu
es, A
pril
13-1
5, 2
010,
Nai
robi
, Ken
ya
e8-GEF-UNDESA Financing Rural Sustainable Electrification
Africa DialoguesNairobi, Kenya, April 13-15, 2010
KES – Rural electrification in South AfricaVicky Basson, CEO, KES Pty South Africa
e8-G
EF-U
ND
ESA
Fin
anci
ng S
usta
inab
le R
ural
Ele
ctrif
icat
ion
HC
B In
itiat
ive
Afr
ica
Dia
logu
es, A
pril
13-1
5, 2
010,
Nai
robi
, Ken
ya
Overview of presentation
- Presentation of KES- History of project- Fee for service model- KES contracts and key figures- SHS system- Challenges and benefits- Conclusion

e8-G
EF-U
ND
ESA
Fin
anci
ng S
usta
inab
le R
ural
Ele
ctrif
icat
ion
HC
B In
itiat
ive
Afr
ica
Dia
logu
es, A
pril
13-1
5, 2
010,
Nai
robi
, Ken
ya
KES in South Africa

e8-G
EF-U
ND
ESA
Fin
anci
ng S
usta
inab
le R
ural
Ele
ctrif
icat
ion
HC
B In
itiat
ive
Afr
ica
Dia
logu
es, A
pril
13-1
5, 2
010,
Nai
robi
, Ken
ya
AGENDA21
History• EDF representation office in South Africa• Interested in variety of projects in sub-Saharan Africa
• Looking for RE project to support its rural electrification drive worldwide
• ACCESS team created in France as part of EDF’s Agenda 21 (features 21 guidelines )
13th commitment
«Facilitating the access to electricity of the rural inhabitants of developing countries»
• ACCESS creates RESCOS in developing countries:– Similar projects in Mali and Morocco – Both created with EDF as partner– EDFs model is to replace when viable with local partners

e8-G
EF-U
ND
ESA
Fin
anci
ng S
usta
inab
le R
ural
Ele
ctrif
icat
ion
HC
B In
itiat
ive
Afr
ica
Dia
logu
es, A
pril
13-1
5, 2
010,
Nai
robi
, Ken
ya
KES
• Company began operations in 2001
• First project was a DME subsidised program in KZN –started in 2001 installed 9000 systems by 2006
• 2nd Project – KFW funded project in Eastern Cape for a total of +/- 30000 households began in 2008
• Total of 3000 customers installed in Eastern Cape to date
• November 2009 – submitted tender to DoE for additional 4000 systems in KZN
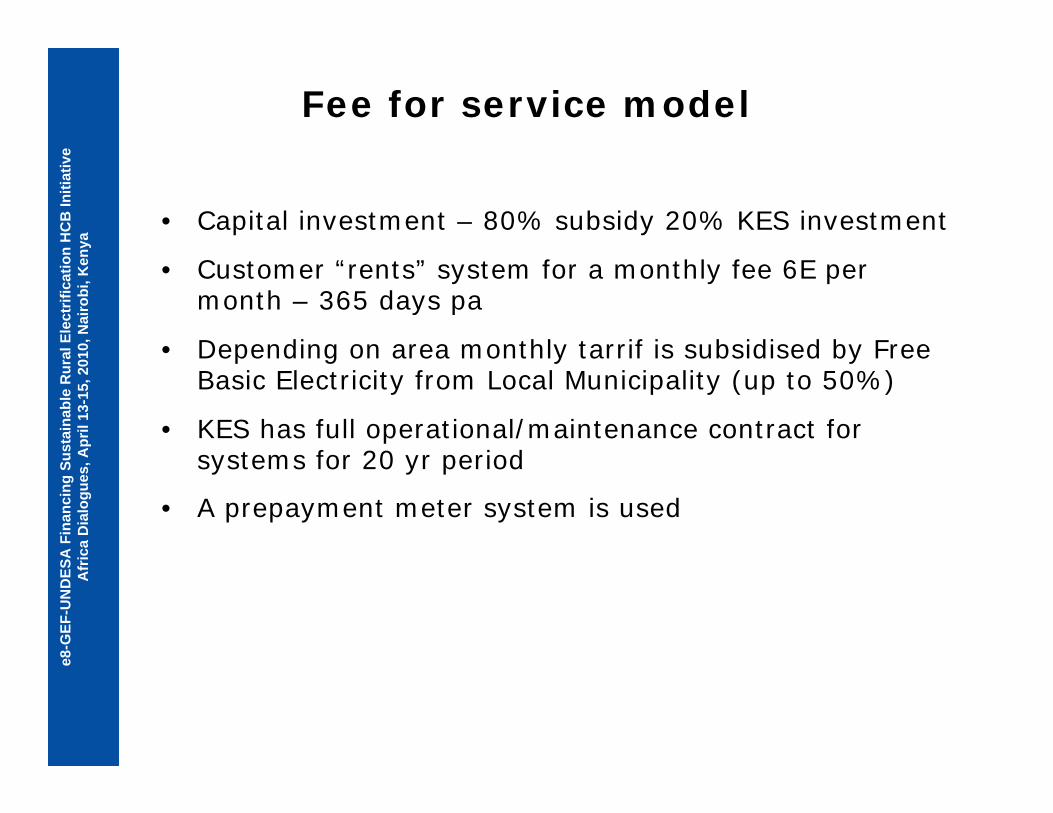
e8-G
EF-U
ND
ESA
Fin
anci
ng S
usta
inab
le R
ural
Ele
ctrif
icat
ion
HC
B In
itiat
ive
Afr
ica
Dia
logu
es, A
pril
13-1
5, 2
010,
Nai
robi
, Ken
ya
Fee for service model
• Capital investment – 80% subsidy 20% KES investment
• Customer “rents” system for a monthly fee 6E per month – 365 days pa
• Depending on area monthly tarrif is subsidised by Free Basic Electricity from Local Municipality (up to 50%)
• KES has full operational/maintenance contract for systems for 20 yr period
• A prepayment meter system is used
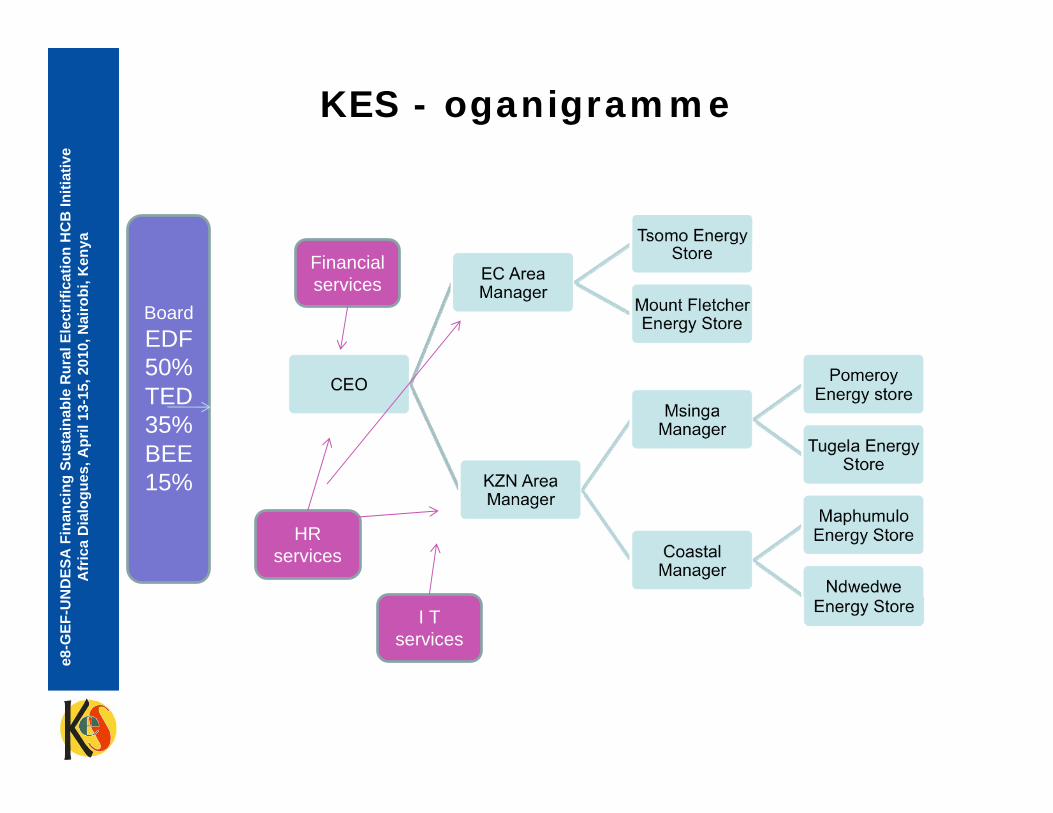
e8-G
EF-U
ND
ESA
Fin
anci
ng S
usta
inab
le R
ural
Ele
ctrif
icat
ion
HC
B In
itiat
ive
Afr
ica
Dia
logu
es, A
pril
13-1
5, 2
010,
Nai
robi
, Ken
ya
KES - oganigramme
BoardEDF 50%TED 35%BEE 15%
Financial services
HR services
I T services

e8-G
EF-U
ND
ESA
Fin
anci
ng S
usta
inab
le R
ural
Ele
ctrif
icat
ion
HC
B In
itiat
ive
Afr
ica
Dia
logu
es, A
pril
13-1
5, 2
010,
Nai
robi
, Ken
ya
KES KZN Contract
• Concession Area - 5 year exclusivity for capital subsidy
• Permission Area - specific geographical areas for Non Grid
• Capital Subsidy - R3500 per SHS (necessary to reduce long-term operating cost and to ensure customer affordability
• Connection Fee - R110 per connection
• Operating Fee -58 Rands per month in1999), 74 rands per month in 2010
• Customer Contract – customer service levels detailed e.gmaintenance response time
• Specifications - levels of service (50kW panel for 4 lights, monochrome TV and Radio), maintenance (routine 1 pa)
e8-G
EF-U
ND
ESA
Fin
anci
ng S
usta
inab
le R
ural
Ele
ctrif
icat
ion
HC
B In
itiat
ive
Afr
ica
Dia
logu
es, A
pril
13-1
5, 2
010,
Nai
robi
, Ken
ya
KES in Eastern Cape• Project funded by KFW donor funds – with DoE as Agent• Tender closed in 2005• Contract signed with KES in July 07• KES began operations
– French Project manager to initiate operations – costs subsidised by shareholders
– Offices located, communities approached, tender for equipments, staff engaged
– Delay in appointment of monitoring consultant so interim consultant appointed until Dec 2009.
• KES has installed the first 3000 systems but is awaiting appointment of permanent consultant before commencing main installation programme – cash flow risks
e8-G
EF-U
ND
ESA
Fin
anci
ng S
usta
inab
le R
ural
Ele
ctrif
icat
ion
HC
B In
itiat
ive
Afr
ica
Dia
logu
es, A
pril
13-1
5, 2
010,
Nai
robi
, Ken
ya
Key figures for Eastern Cape
• Initially for 26000 households and schools and clinics
• DME - Schools and clinics will be electrified under universal access goals so removed from KFW program
• Funds transferred to SHS so 30000 plus households will be installed
• Same parameters as KZN – 80% subsidy, fee for service model etc.
• Total subsidy from KFW is 16 M Euros
• Investment from Shareholders 4 M Euros
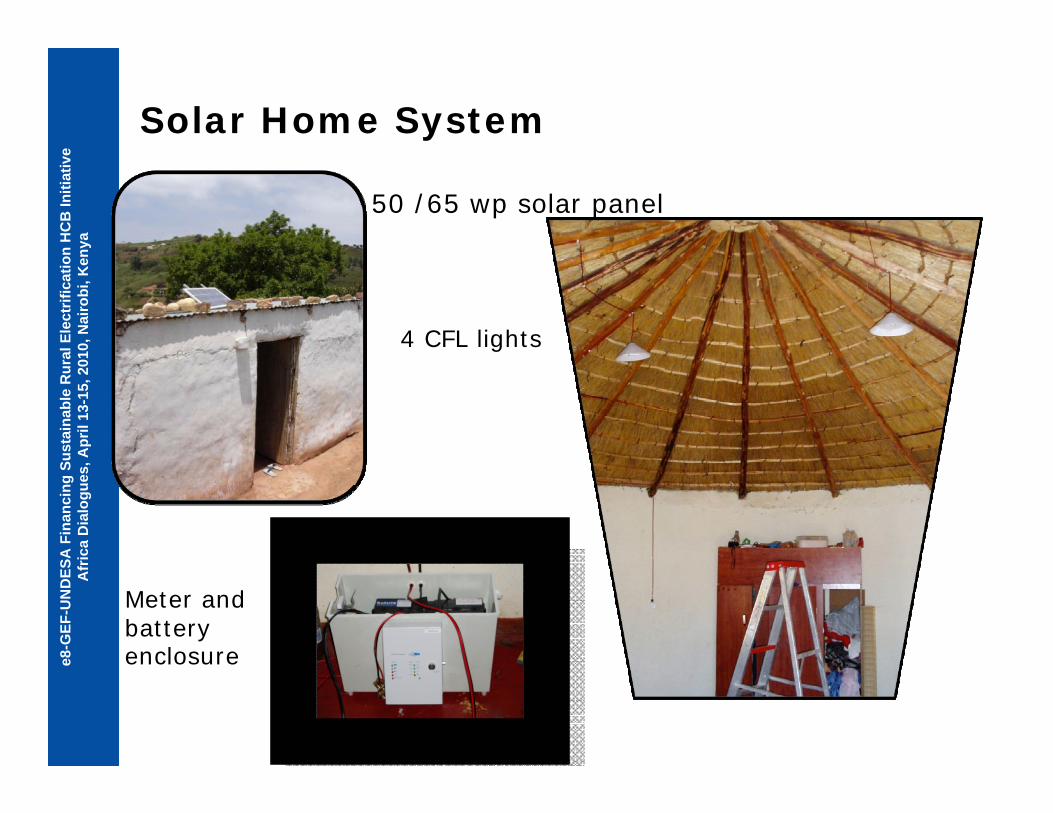
e8-G
EF-U
ND
ESA
Fin
anci
ng S
usta
inab
le R
ural
Ele
ctrif
icat
ion
HC
B In
itiat
ive
Afr
ica
Dia
logu
es, A
pril
13-1
5, 2
010,
Nai
robi
, Ken
ya
50 /65 wp solar panel
Solar Home System
4 CFL lights
Meter and battery enclosure
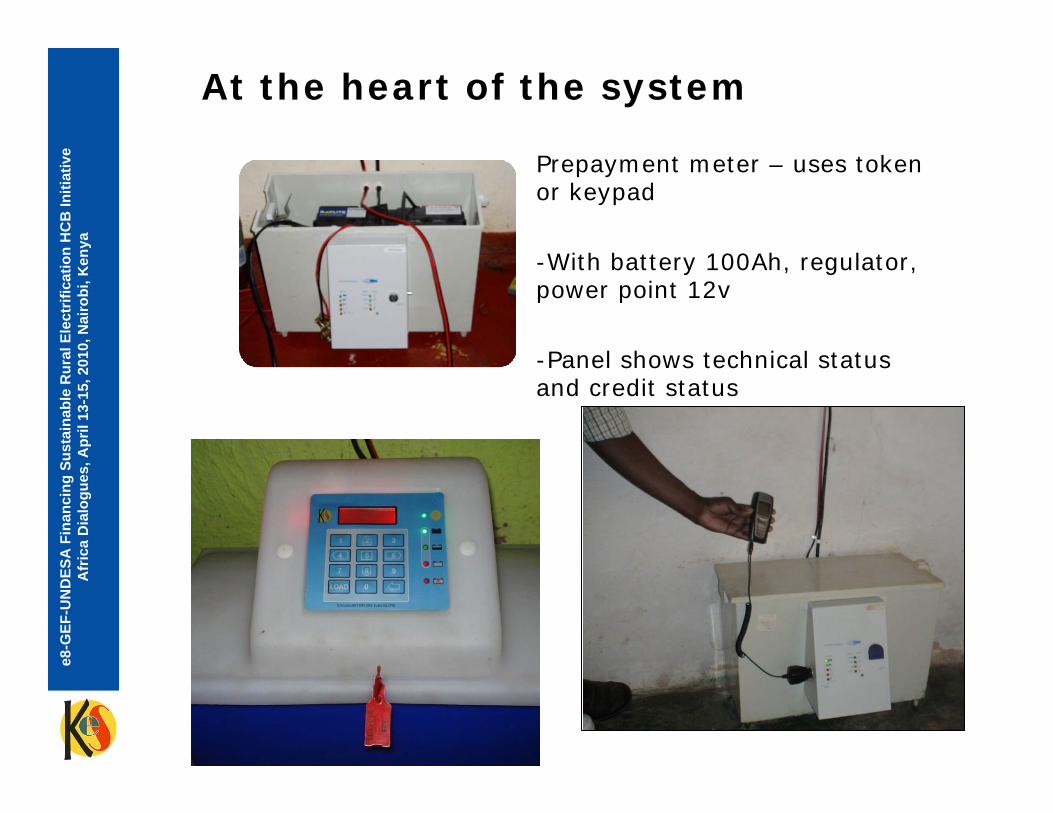
e8-G
EF-U
ND
ESA
Fin
anci
ng S
usta
inab
le R
ural
Ele
ctrif
icat
ion
HC
B In
itiat
ive
Afr
ica
Dia
logu
es, A
pril
13-1
5, 2
010,
Nai
robi
, Ken
yaAt the heart of the system
Prepayment meter – uses token or keypad
-With battery 100Ah, regulator, power point 12v
-Panel shows technical status and credit status
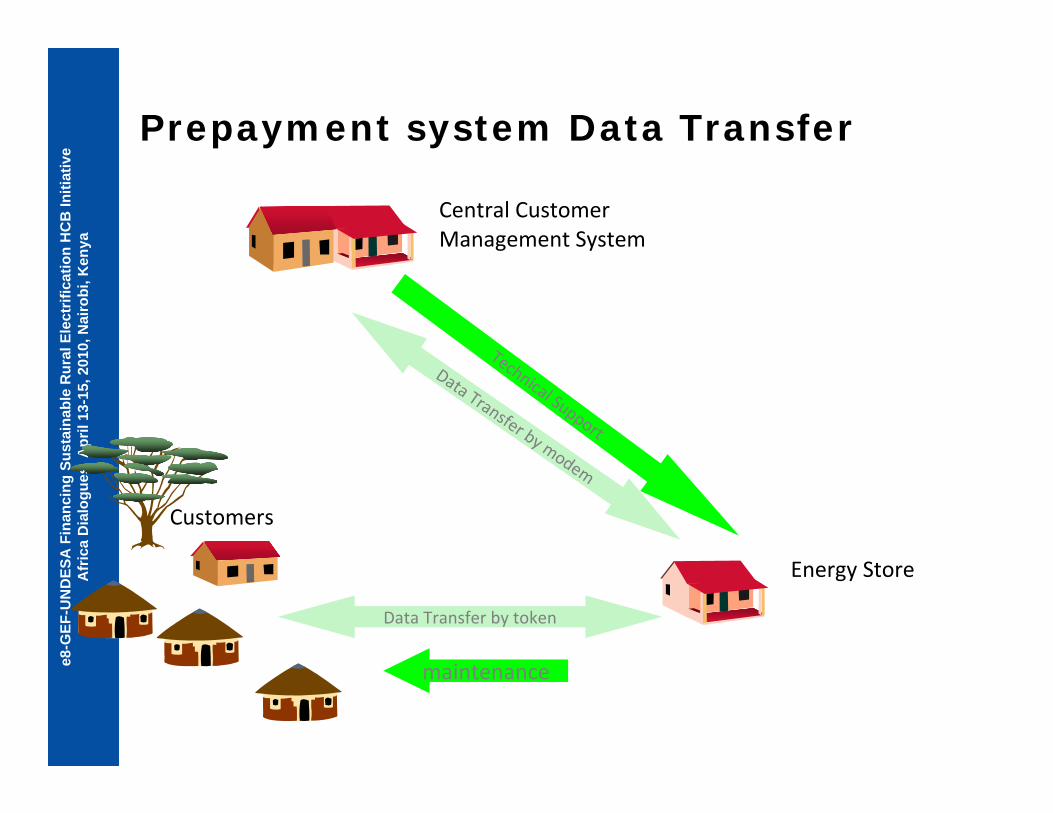
e8-G
EF-U
ND
ESA
Fin
anci
ng S
usta
inab
le R
ural
Ele
ctrif
icat
ion
HC
B In
itiat
ive
Afr
ica
Dia
logu
es, A
pril
13-1
5, 2
010,
Nai
robi
, Ken
ya
Technical Support
Central Customer Management System
Energy Store
Customers
Data Transfer by token
maintenance
Data Transfer by modem
Prepayment system Data Transfer

e8-G
EF-U
ND
ESA
Fin
anci
ng S
usta
inab
le R
ural
Ele
ctrif
icat
ion
HC
B In
itiat
ive
Afr
ica
Dia
logu
es, A
pril
13-1
5, 2
010,
Nai
robi
, Ken
ya
e8-G
EF-U
ND
ESA
Fin
anci
ng S
usta
inab
le R
ural
Ele
ctrif
icat
ion
HC
B In
itiat
ive
Afr
ica
Dia
logu
es, A
pril
13-1
5, 2
010,
Nai
robi
, Ken
ya
e8-G
EF-U
ND
ESA
Fin
anci
ng S
usta
inab
le R
ural
Ele
ctrif
icat
ion
HC
B In
itiat
ive
Afr
ica
Dia
logu
es, A
pril
13-1
5, 2
010,
Nai
robi
, Ken
ya

e8-G
EF-U
ND
ESA
Fin
anci
ng S
usta
inab
le R
ural
Ele
ctrif
icat
ion
HC
B In
itiat
ive
Afr
ica
Dia
logu
es, A
pril
13-1
5, 2
010,
Nai
robi
, Ken
ya
e8-G
EF-U
ND
ESA
Fin
anci
ng S
usta
inab
le R
ural
Ele
ctrif
icat
ion
HC
B In
itiat
ive
Afr
ica
Dia
logu
es, A
pril
13-1
5, 2
010,
Nai
robi
, Ken
ya
e8-G
EF-U
ND
ESA
Fin
anci
ng S
usta
inab
le R
ural
Ele
ctrif
icat
ion
HC
B In
itiat
ive
Afr
ica
Dia
logu
es, A
pril
13-1
5, 2
010,
Nai
robi
, Ken
ya
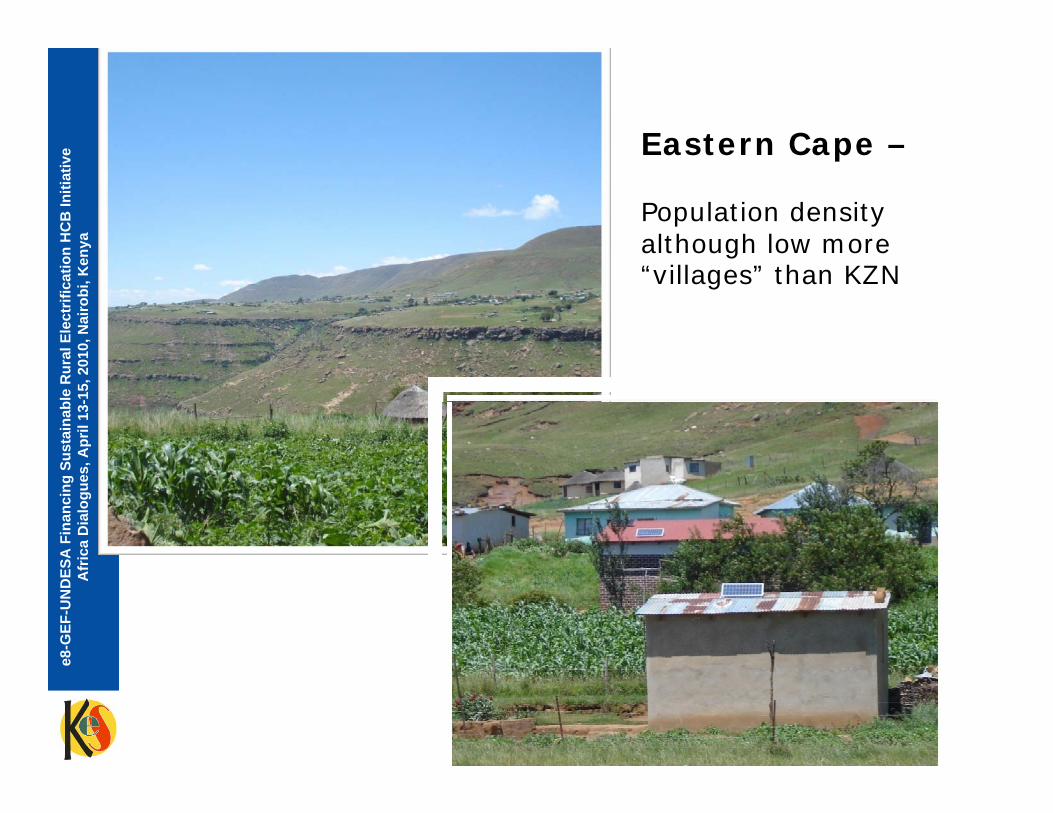
e8-G
EF-U
ND
ESA
Fin
anci
ng S
usta
inab
le R
ural
Ele
ctrif
icat
ion
HC
B In
itiat
ive
Afr
ica
Dia
logu
es, A
pril
13-1
5, 2
010,
Nai
robi
, Ken
ya
Eastern Cape –
Population density although low more “villages” than KZN
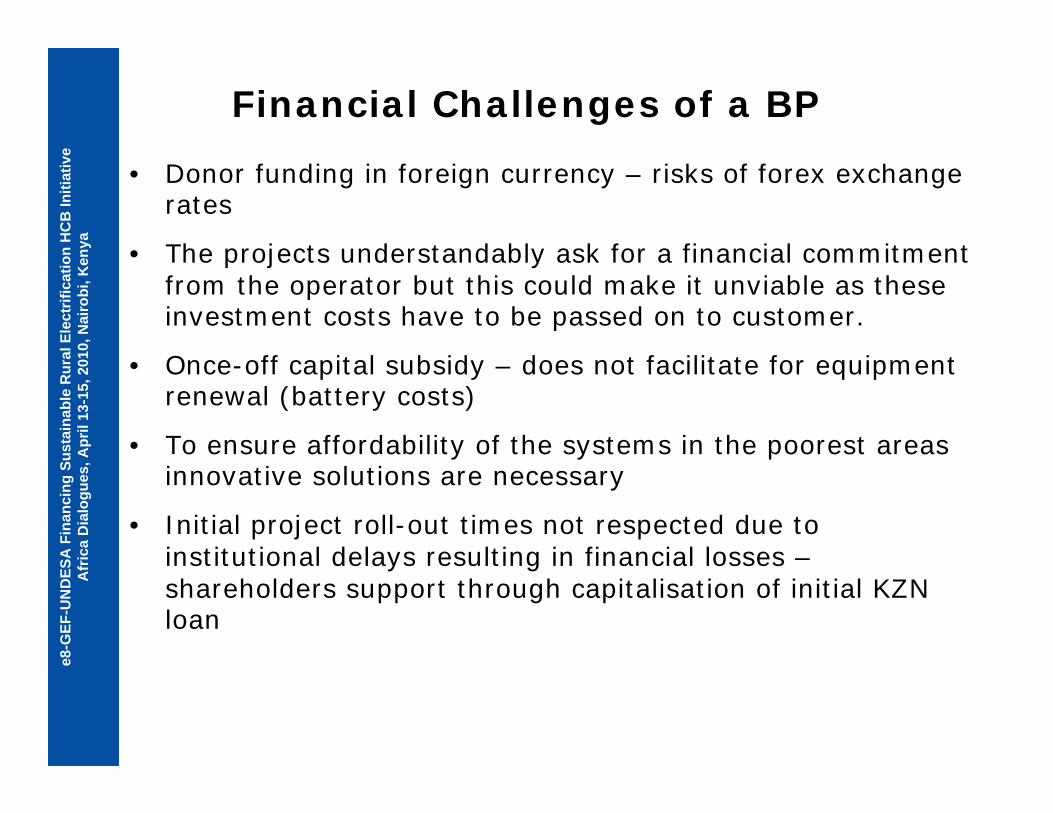
e8-G
EF-U
ND
ESA
Fin
anci
ng S
usta
inab
le R
ural
Ele
ctrif
icat
ion
HC
B In
itiat
ive
Afr
ica
Dia
logu
es, A
pril
13-1
5, 2
010,
Nai
robi
, Ken
ya
Financial Challenges of a BP
• Donor funding in foreign currency – risks of forex exchange rates
• The projects understandably ask for a financial commitment from the operator but this could make it unviable as these investment costs have to be passed on to customer.
• Once-off capital subsidy – does not facilitate for equipment renewal (battery costs)
• To ensure affordability of the systems in the poorest areas innovative solutions are necessary
• Initial project roll-out times not respected due to institutional delays resulting in financial losses –shareholders support through capitalisation of initial KZN loan
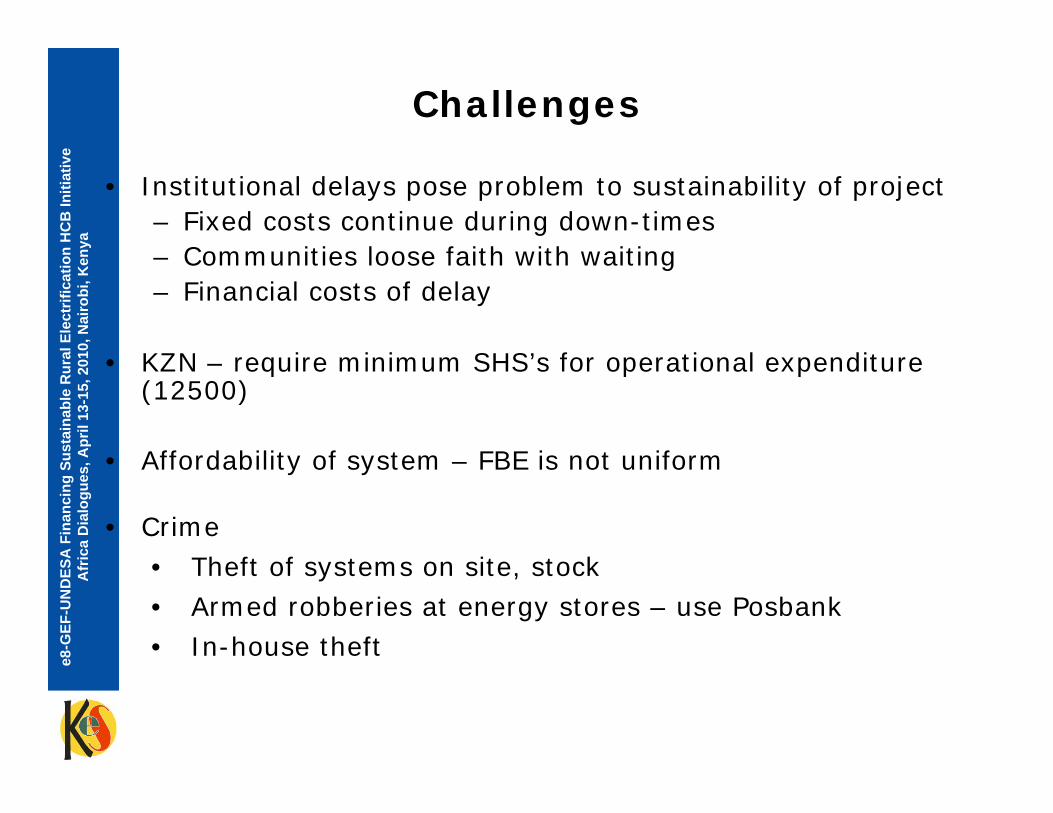
e8-G
EF-U
ND
ESA
Fin
anci
ng S
usta
inab
le R
ural
Ele
ctrif
icat
ion
HC
B In
itiat
ive
Afr
ica
Dia
logu
es, A
pril
13-1
5, 2
010,
Nai
robi
, Ken
ya
Challenges
• Institutional delays pose problem to sustainability of project– Fixed costs continue during down-times– Communities loose faith with waiting– Financial costs of delay
• KZN – require minimum SHS’s for operational expenditure (12500)
• Affordability of system – FBE is not uniform
• Crime• Theft of systems on site, stock• Armed robberies at energy stores – use Posbank• In-house theft
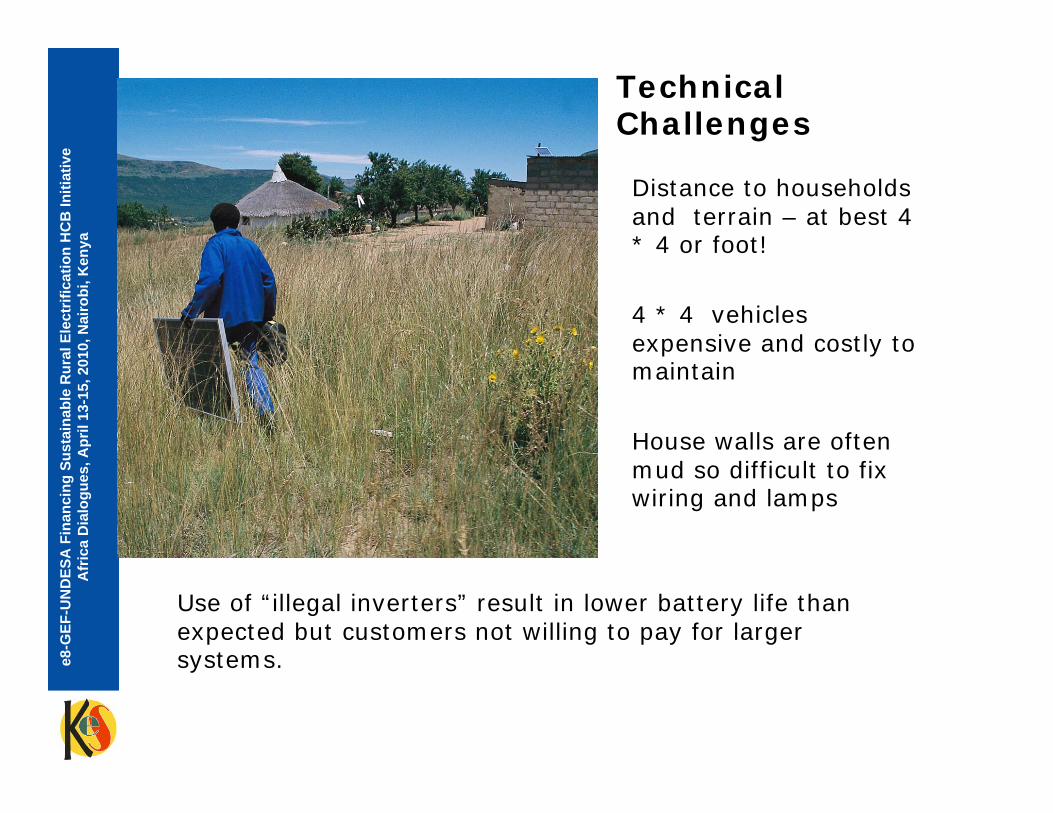
e8-G
EF-U
ND
ESA
Fin
anci
ng S
usta
inab
le R
ural
Ele
ctrif
icat
ion
HC
B In
itiat
ive
Afr
ica
Dia
logu
es, A
pril
13-1
5, 2
010,
Nai
robi
, Ken
yaTechnical Challenges
Distance to households and terrain – at best 4 * 4 or foot!
4 * 4 vehicles expensive and costly to maintain
House walls are often mud so difficult to fix wiring and lamps
Use of “illegal inverters” result in lower battery life than expected but customers not willing to pay for larger systems.
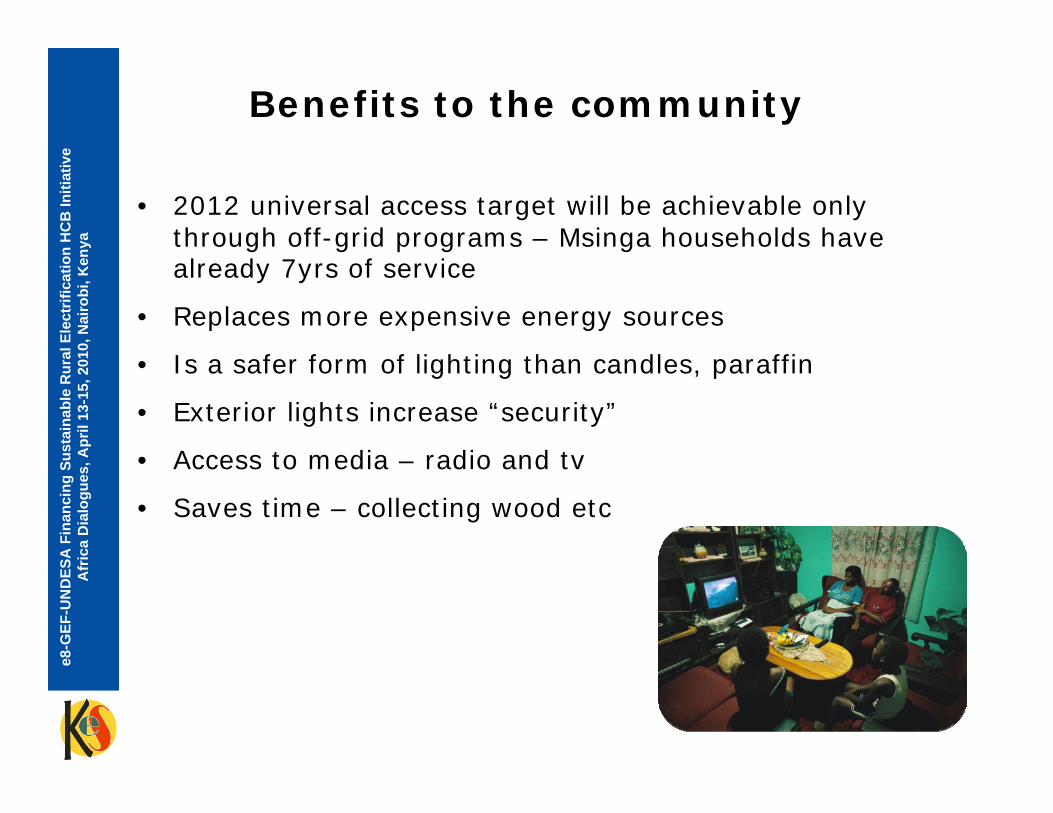
e8-G
EF-U
ND
ESA
Fin
anci
ng S
usta
inab
le R
ural
Ele
ctrif
icat
ion
HC
B In
itiat
ive
Afr
ica
Dia
logu
es, A
pril
13-1
5, 2
010,
Nai
robi
, Ken
ya
Benefits to the community
• 2012 universal access target will be achievable only through off-grid programs – Msinga households have already 7yrs of service
• Replaces more expensive energy sources
• Is a safer form of lighting than candles, paraffin
• Exterior lights increase “security”
• Access to media – radio and tv
• Saves time – collecting wood etc

e8-G
EF-U
ND
ESA
Fin
anci
ng S
usta
inab
le R
ural
Ele
ctrif
icat
ion
HC
B In
itiat
ive
Afr
ica
Dia
logu
es, A
pril
13-1
5, 2
010,
Nai
robi
, Ken
ya
Other benefits:
• LPG sold in energy stores to answer thermal needs. LPG sold at “cost”
• Energy efficient and safe wood burning stoves sold at stores
• Project benefits from shareholders support by:
– Piggy back projects – solar water pump in Garden in Tugela – 75 ladies form community trust to farm land –funding provided by EDF Energy (UK)
– AIDS Awareness project – holistic approach through CARE and project empower – funded by EDF and TED
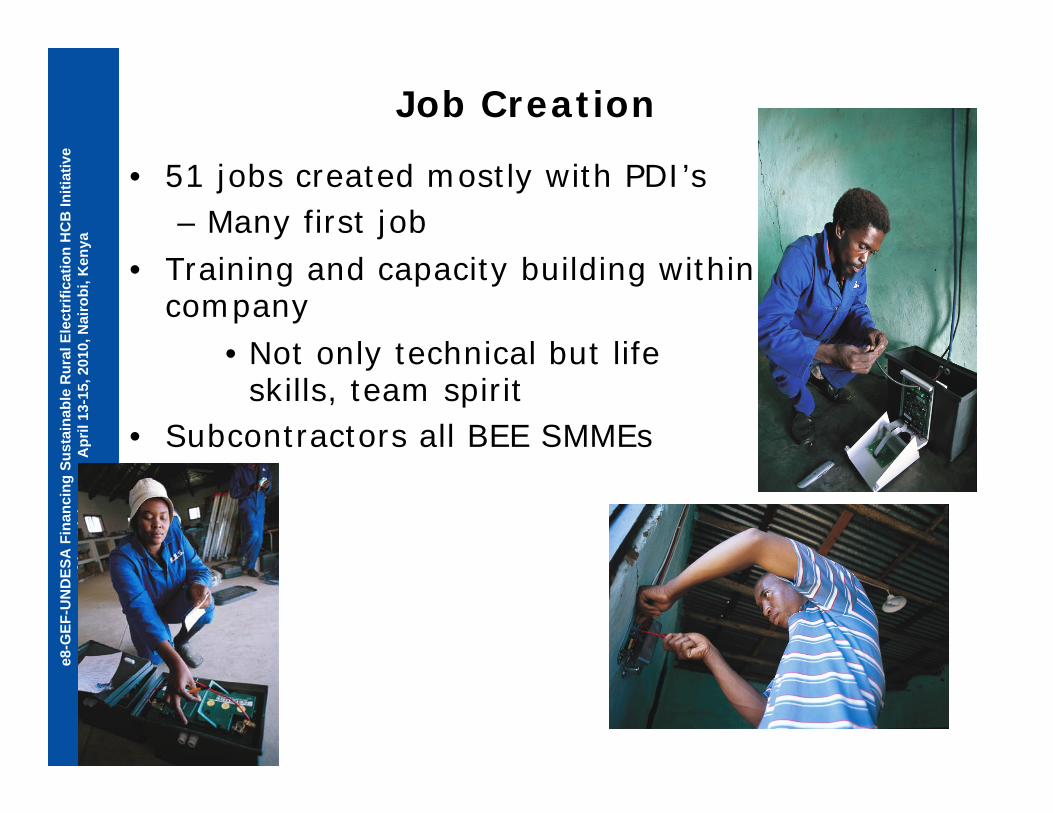
e8-G
EF-U
ND
ESA
Fin
anci
ng S
usta
inab
le R
ural
Ele
ctrif
icat
ion
HC
B In
itiat
ive
Afr
ica
Dia
logu
es, A
pril
13-1
5, 2
010,
Nai
robi
, Ken
ya
Job Creation
• 51 jobs created mostly with PDI’s– Many first job
• Training and capacity building within company
• Not only technical but life skills, team spirit
• Subcontractors all BEE SMMEs
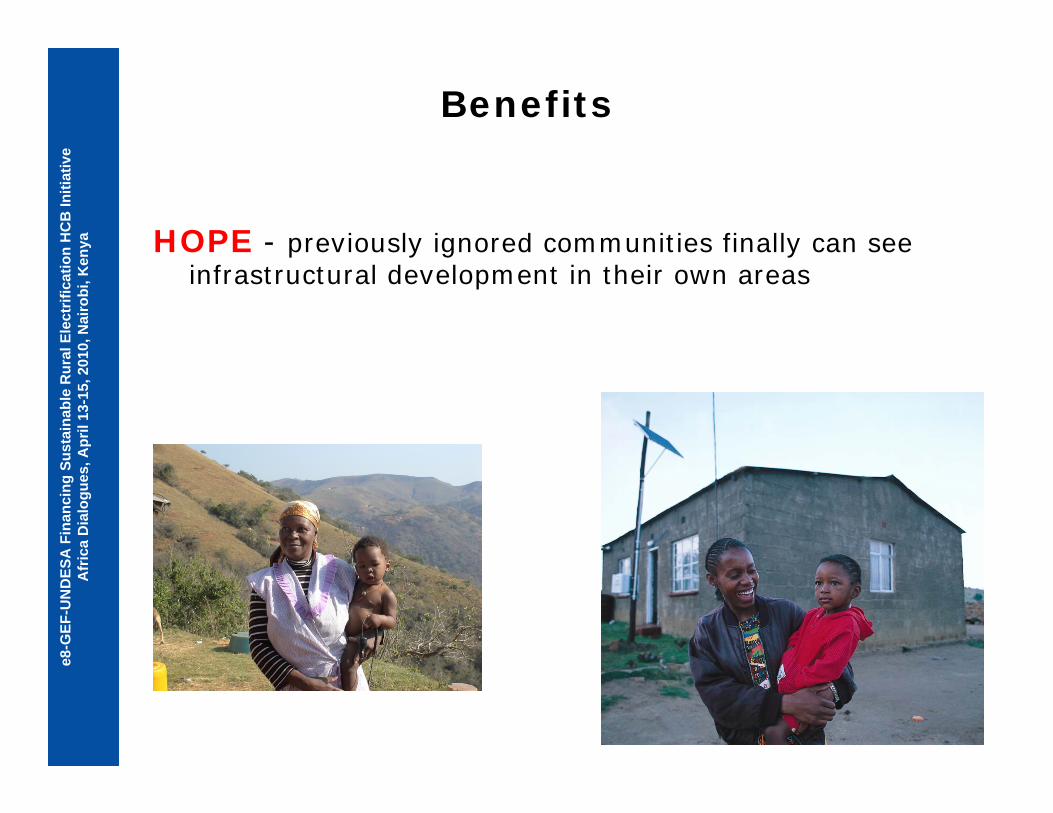
e8-G
EF-U
ND
ESA
Fin
anci
ng S
usta
inab
le R
ural
Ele
ctrif
icat
ion
HC
B In
itiat
ive
Afr
ica
Dia
logu
es, A
pril
13-1
5, 2
010,
Nai
robi
, Ken
ya
Benefits
HOPE - previously ignored communities finally can see infrastructural development in their own areas
e8-G
EF-U
ND
ESA
Fin
anci
ng S
usta
inab
le R
ural
Ele
ctrif
icat
ion
HC
B In
itiat
ive
Afr
ica
Dia
logu
es, A
pril
13-1
5, 2
010,
Nai
robi
, Ken
ya
Conclusion
Rural electrification is not an easy task nor does it offer great financial rewards.
KES benefits from strong shareholders
KES has been in operation for 8 years an illustration how a Public Private Partnership can result in a sustainable
project.
Thank you for your attention
e8-G
EF-U
ND
ESA
Fin
anci
ng S
usta
inab
le R
ural
Ele
ctrif
icat
ion
HC
B In
itiat
ive
Afr
ica
Dia
logu
es, A
pril
13-1
5, 2
010,
Nai
robi
, Ken
ya
Contact Information:Email: [email protected]
Tel: 27 82 902 8430Fax:
Website:
e8-G
EF-U
ND
ESA
Fin
anci
ng S
usta
inab
le E
lect
rific
atio
n H
CB
Initi
ativ
eA
fric
a D
ialo
gues
, Apr
il 13
-15,
201
0, N
airo
bi, K
enya e8-GEF-UNDESA
Financing Sustainable Electrification
Africa DialoguesNairobi, Kenya, April 13-15, 2010
Public-Private Partnerships in Rural Electrification: The case of Uganda
Benon Bena, Manager Project Planning
Rural Electrification Agency, Uganda

e8-G
EF-U
ND
ESA
Fin
anci
ng S
usta
inab
le R
ural
Ele
ctrif
icat
ion
HC
B In
itiat
ive
Afr
ica
Dia
logu
es, A
pril
13-1
5, 2
010,
Nai
robi
, Ken
ya
PUBLIC-PRIVATE PARTNERSHIP IN RURAL ELECTRIFICATION:
THE CASE OF UGANDA

e8-G
EF-U
ND
ESA
Fin
anci
ng S
usta
inab
le R
ural
Ele
ctrif
icat
ion
HC
B In
itiat
ive
Afr
ica
Dia
logu
es, A
pril
13-1
5, 2
010,
Nai
robi
, Ken
ya
1. BACKGROUND TO THE UGANDA POWER SECTOR
Liberalised Sector:
• Generation and distribution operated by the private sector.
• Transmission operated by Government Corporation.
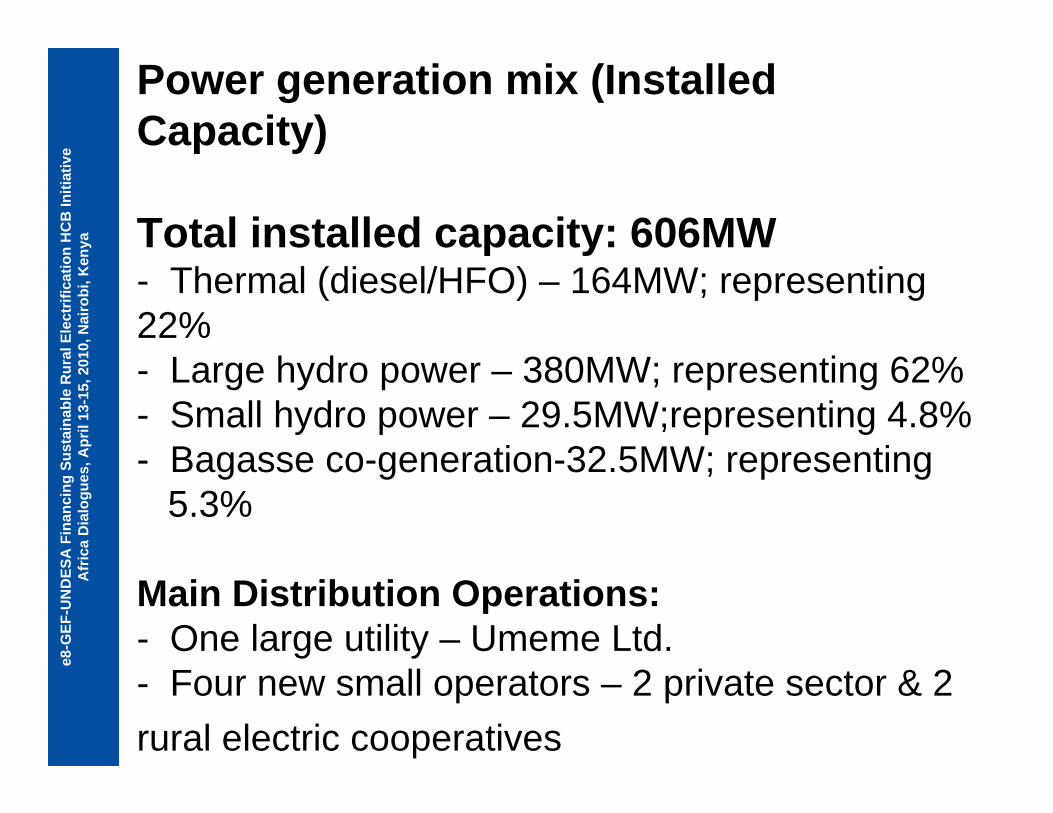
e8-G
EF-U
ND
ESA
Fin
anci
ng S
usta
inab
le R
ural
Ele
ctrif
icat
ion
HC
B In
itiat
ive
Afr
ica
Dia
logu
es, A
pril
13-1
5, 2
010,
Nai
robi
, Ken
yaPower generation mix (Installed Capacity)
Total installed capacity: 606MW- Thermal (diesel/HFO) – 164MW; representing 22%- Large hydro power – 380MW; representing 62%- Small hydro power – 29.5MW;representing 4.8%- Bagasse co-generation-32.5MW; representing
5.3%
Main Distribution Operations:- One large utility – Umeme Ltd.- Four new small operators – 2 private sector & 2 rural electric cooperatives
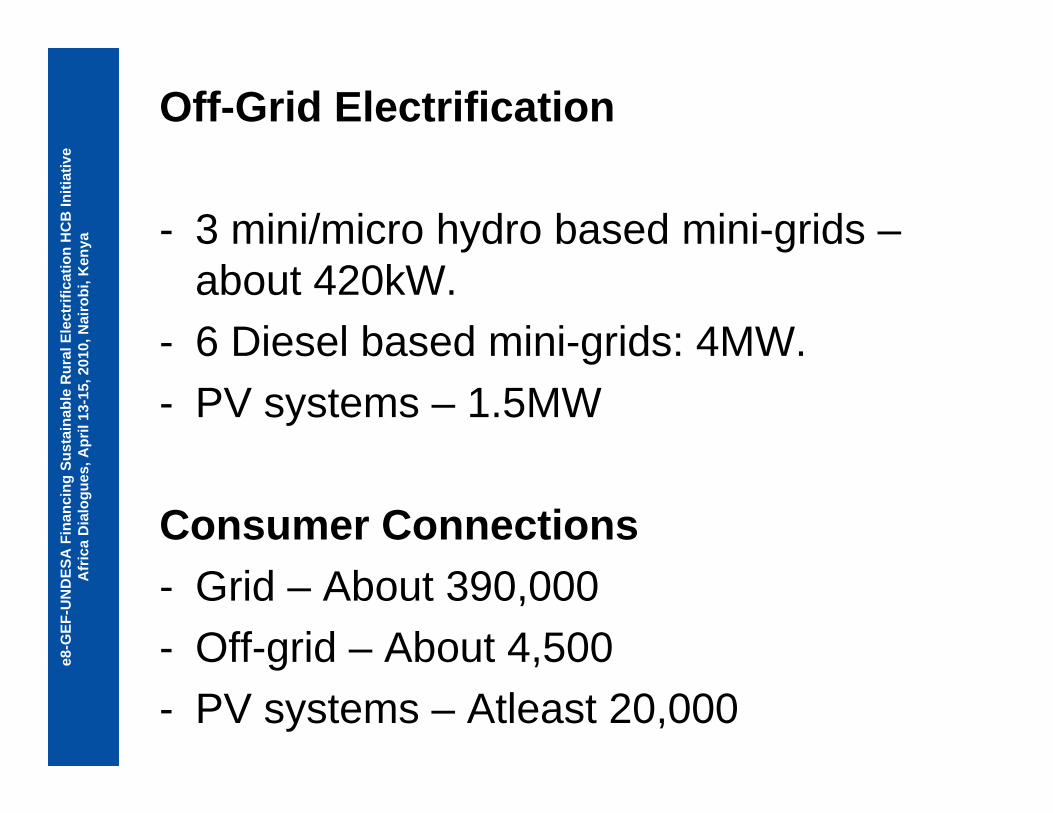
e8-G
EF-U
ND
ESA
Fin
anci
ng S
usta
inab
le R
ural
Ele
ctrif
icat
ion
HC
B In
itiat
ive
Afr
ica
Dia
logu
es, A
pril
13-1
5, 2
010,
Nai
robi
, Ken
ya
Off-Grid Electrification
- 3 mini/micro hydro based mini-grids –about 420kW.
- 6 Diesel based mini-grids: 4MW.- PV systems – 1.5MW
Consumer Connections- Grid – About 390,000- Off-grid – About 4,500- PV systems – Atleast 20,000
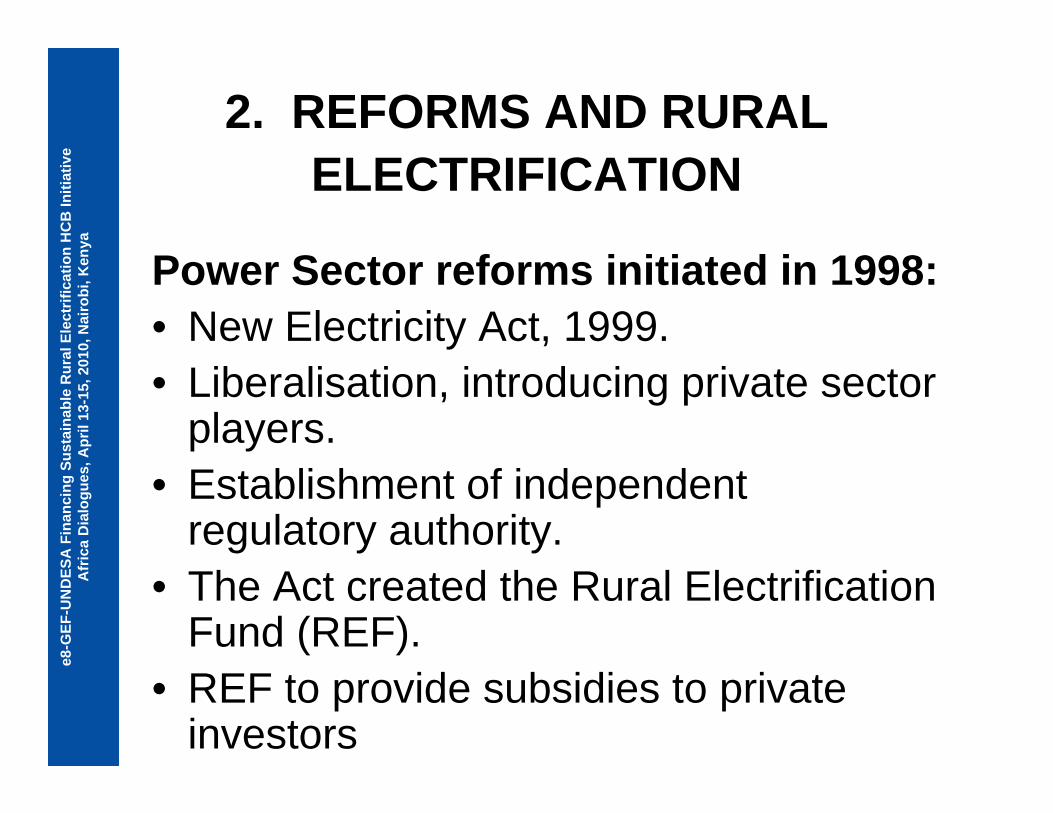
e8-G
EF-U
ND
ESA
Fin
anci
ng S
usta
inab
le R
ural
Ele
ctrif
icat
ion
HC
B In
itiat
ive
Afr
ica
Dia
logu
es, A
pril
13-1
5, 2
010,
Nai
robi
, Ken
ya
2. REFORMS AND RURAL ELECTRIFICATION
Power Sector reforms initiated in 1998:• New Electricity Act, 1999.• Liberalisation, introducing private sector
players.• Establishment of independent
regulatory authority.• The Act created the Rural Electrification
Fund (REF).• REF to provide subsidies to private
investors
e8-G
EF-U
ND
ESA
Fin
anci
ng S
usta
inab
le R
ural
Ele
ctrif
icat
ion
HC
B In
itiat
ive
Afr
ica
Dia
logu
es, A
pril
13-1
5, 2
010,
Nai
robi
, Ken
ya
Statutory Instrument (No. 75 of 2001)
• Established Rural Electrification Fund.
• Established Rural Electrification Agency to manage the Fund
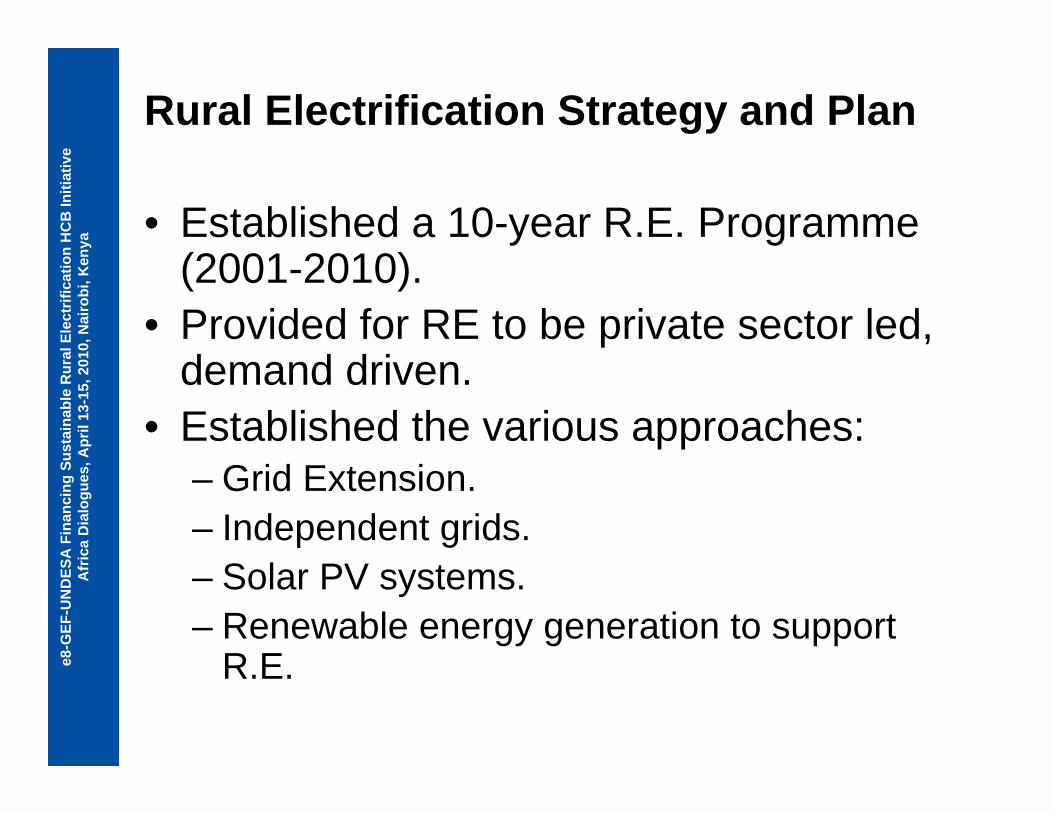
e8-G
EF-U
ND
ESA
Fin
anci
ng S
usta
inab
le R
ural
Ele
ctrif
icat
ion
HC
B In
itiat
ive
Afr
ica
Dia
logu
es, A
pril
13-1
5, 2
010,
Nai
robi
, Ken
ya
Rural Electrification Strategy and Plan
• Established a 10-year R.E. Programme (2001-2010).
• Provided for RE to be private sector led, demand driven.
• Established the various approaches:– Grid Extension.– Independent grids.– Solar PV systems.– Renewable energy generation to support
R.E.
e8-G
EF-U
ND
ESA
Fin
anci
ng S
usta
inab
le R
ural
Ele
ctrif
icat
ion
HC
B In
itiat
ive
Afr
ica
Dia
logu
es, A
pril
13-1
5, 2
010,
Nai
robi
, Ken
ya
3. GOVERNMENT INITIATIVES TO PROMOTE PUBLIC PRIVATE PARTNERSHIP IN RURAL
ELECTRIFICATION
• REF established to provide capital subsidies to private sector investments.
• Refinancing facility set up for private sector borrowing.• Standardized tariff for grid connected small renewable
energy generation (<20MW).• Financing for private sector feasibility studies,
business plans and capacity building.• Output based grant for PV private sector installations.• Government sought and obtained support from the
World Bank and other donors to implement a 10-year programme: Energy for Rural Transformation

e8-G
EF-U
ND
ESA
Fin
anci
ng S
usta
inab
le R
ural
Ele
ctrif
icat
ion
HC
B In
itiat
ive
Afr
ica
Dia
logu
es, A
pril
13-1
5, 2
010,
Nai
robi
, Ken
ya
4. ACHIEVEMENTS AND CHALLENGES OF THE 10-YEAR (2001-2010)
PROGRAMME
• Private Sector financing for grid extension did not occur.Government decided to revert to public
sector financing.
• Private sector operators procured for infrastructure built by public financing10-year Lease Agreement
e8-G
EF-U
ND
ESA
Fin
anci
ng S
usta
inab
le R
ural
Ele
ctrif
icat
ion
HC
B In
itiat
ive
Afr
ica
Dia
logu
es, A
pril
13-1
5, 2
010,
Nai
robi
, Ken
ya
Achievements & Challenges cont’d…
• 7 new concessions/leases to 4 operators given out – 2 private sector operators– 2 rural electric cooperatives.
• Two private sector mini-hydro based independent grids (3.5MW and 0.3MW) supported through capital subsidies –(3.5MW plant still under construction).
• Two diesel independent grids operated by the private sector.

e8-G
EF-U
ND
ESA
Fin
anci
ng S
usta
inab
le R
ural
Ele
ctrif
icat
ion
HC
B In
itiat
ive
Afr
ica
Dia
logu
es, A
pril
13-1
5, 2
010,
Nai
robi
, Ken
ya
Achievements & Challenges cont’d…• Over 6,000 PV systems installed by private
sector.• Private sector investments in grid connected
small renewable energy power generation very encouraging.
42MW independent small renewable energy power generation commissioned.
24MW independent small renewable energy power generation under construction (hydro).
10MW (hydro) due to start construction by mid-2010.
e8-G
EF-U
ND
ESA
Fin
anci
ng S
usta
inab
le R
ural
Ele
ctrif
icat
ion
HC
B In
itiat
ive
Afr
ica
Dia
logu
es, A
pril
13-1
5, 2
010,
Nai
robi
, Ken
ya
5. NEW 10-YEAR PROGRAMME
• Public investment in grid extension projects still the major approach.
• Private sector utility operations to continue.
• Uganda Energy Capitalisation Company created to provide private sector finance hedging in renewable energy projects.
• Financial Support for private sector feasibility studies, business plans and capacity building.
e8-G
EF-U
ND
ESA
Fin
anci
ng S
usta
inab
le R
ural
Ele
ctrif
icat
ion
HC
B In
itiat
ive
Afr
ica
Dia
logu
es, A
pril
13-1
5, 2
010,
Nai
robi
, Ken
ya
NEW 10-YEAR PROGRAMME Cont’d….
• Subsidies for PV installations and credits for PV consumers.
• Connection subsidies for grid extension consumers– US$40 for fresh networks.– US$100 Output Based Aid (OBA) for
connections 18 months after commissioning a network.
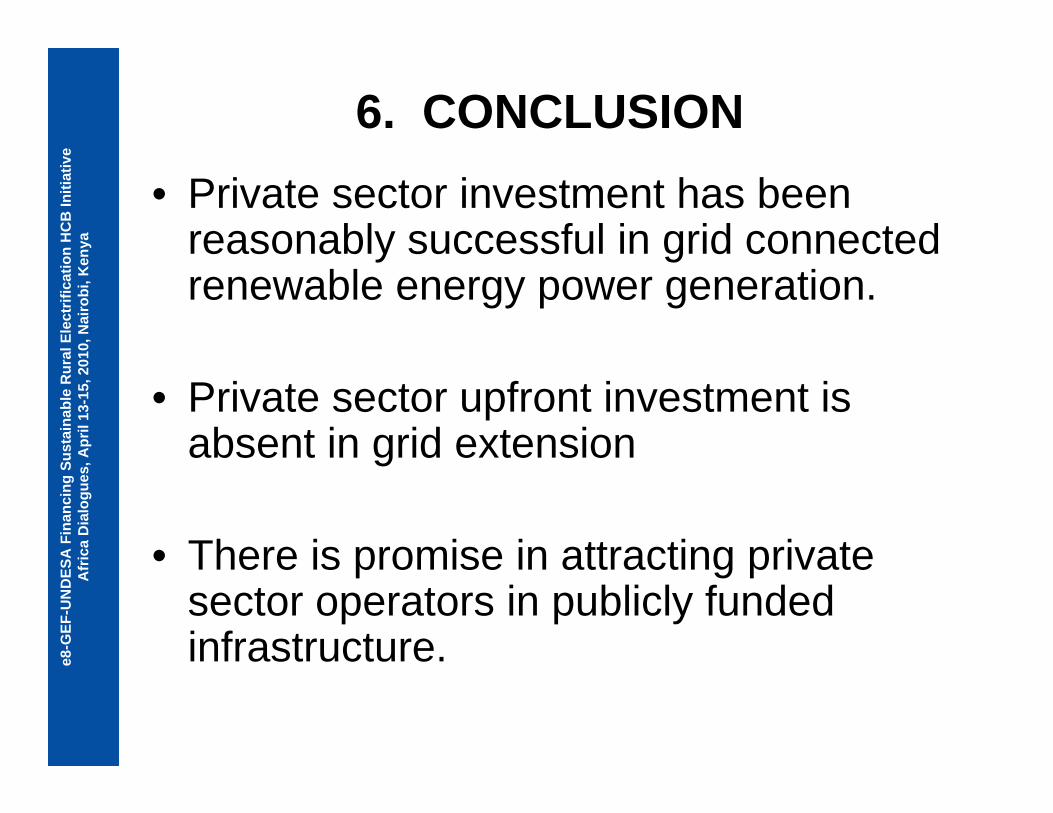
e8-G
EF-U
ND
ESA
Fin
anci
ng S
usta
inab
le R
ural
Ele
ctrif
icat
ion
HC
B In
itiat
ive
Afr
ica
Dia
logu
es, A
pril
13-1
5, 2
010,
Nai
robi
, Ken
ya
6. CONCLUSION• Private sector investment has been
reasonably successful in grid connected renewable energy power generation.
• Private sector upfront investment is absent in grid extension
• There is promise in attracting private sector operators in publicly funded infrastructure.

e8-G
EF-U
ND
ESA
Fin
anci
ng S
usta
inab
le R
ural
Ele
ctrif
icat
ion
HC
B In
itiat
ive
Afr
ica
Dia
logu
es, A
pril
13-1
5, 2
010,
Nai
robi
, Ken
ya
CONCLUSION cont’d …..• Independent grids: Limited private
sector investment– Government has had to use high levels of
subsidies (over 80% of total capital).
• Reasonable growth in private sector PV industry – Supported by installation subsidies and
consumer credits.
e8-G
EF-U
ND
ESA
Fin
anci
ng S
usta
inab
le R
ural
Ele
ctrif
icat
ion
HC
B In
itiat
ive
Afr
ica
Dia
logu
es, A
pril
13-1
5, 2
010,
Nai
robi
, Ken
ya
*Rural electrification requires heavy public investment and a lot of incentives to attract private sector participation.
THANK YOU
e8-G
EF-U
ND
ESA
Fin
anci
ng S
usta
inab
le R
ural
Ele
ctrif
icat
ion
HC
B In
itiat
ive
Afr
ica
Dia
logu
es, A
pril
13-1
5, 2
010,
Nai
robi
, Ken
ya
Contact Information:Email: [email protected]: +256-312 264095/6Fax:+256-414 346013
Website: www.rea.or.ug
e8-G
EF-U
ND
ESA
Fin
anci
ng S
usta
inab
le E
lect
rific
atio
n H
CB
Initi
ativ
eA
fric
a D
ialo
gues
, Apr
il 13
-15,
201
0, N
airo
bi, K
enya
e8-GEF-UNDESA Financing Sustainable Electrification
Africa DialoguesNairobi, Kenya, April 13-15, 2010
Rural Electrification in Botswana
Philimon Dhafana, Acting Director – Rural Business Unit, Botswana Power Corporation
e8-G
EF-U
ND
ESA
Fin
anci
ng S
usta
inab
le R
ural
Ele
ctrif
icat
ion
HC
B In
itiat
ive
Afr
ica
Dia
logu
es, A
pril
13-1
5, 2
010,
Nai
robi
, Ken
ya
FACTS AND FIGURES -BOTSWANA
• Location – Southern Africa, neighbouring countries being Zimbabwe, Zambia, South Africa and Namibia
• Surface area: 582,000 square kilometres• Population – 1.694 million; 0.87 million male and 0.87
million female; 2001 Census• GDP growth – average 5.5% per annum• Poverty – 2001; 23% lived on less than 1USD per day• Literacy rate – 85%
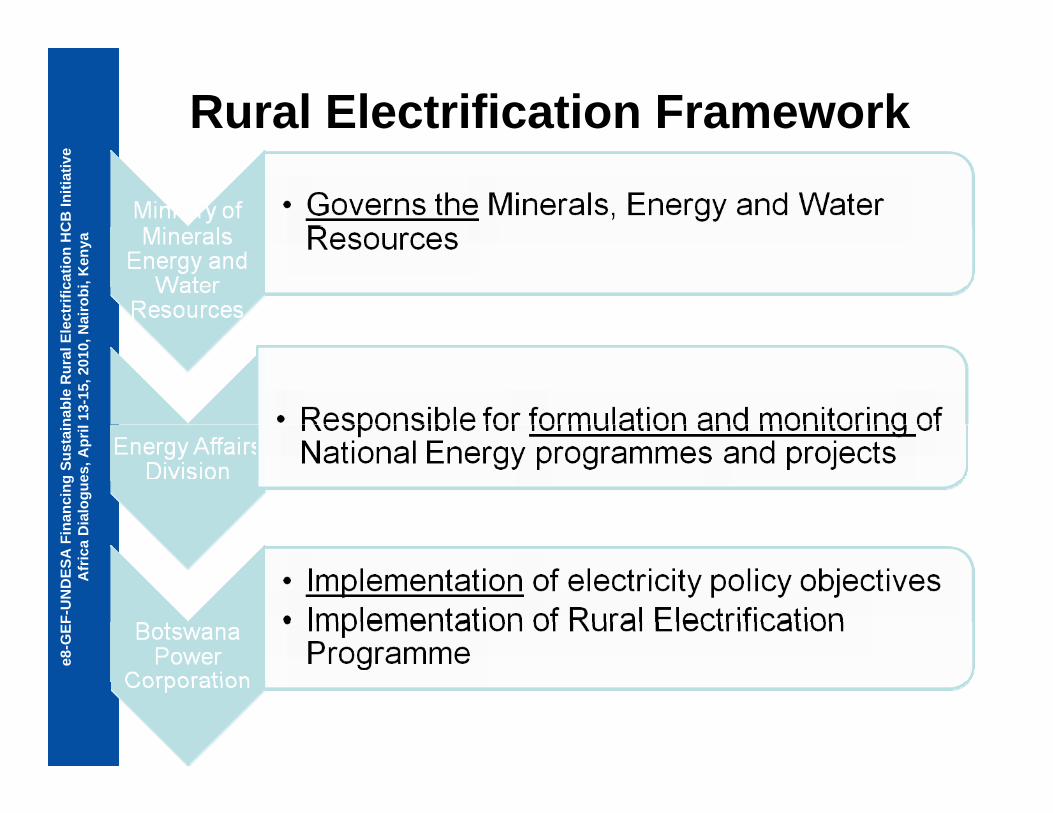
e8-G
EF-U
ND
ESA
Fin
anci
ng S
usta
inab
le R
ural
Ele
ctrif
icat
ion
HC
B In
itiat
ive
Afr
ica
Dia
logu
es, A
pril
13-1
5, 2
010,
Nai
robi
, Ken
ya
Rural Electrification Framework
e8-G
EF-U
ND
ESA
Fin
anci
ng S
usta
inab
le R
ural
Ele
ctrif
icat
ion
HC
B In
itiat
ive
Afr
ica
Dia
logu
es, A
pril
13-1
5, 2
010,
Nai
robi
, Ken
ya
General Objectives of Rural Electrification
• Promotion of productive use of electricity in rural areas to facilitate economic development and the alleviation of poverty
• Improving the living conditions of rural communities by satisfying their basic needs for access to electricity
• Providing electricity to as many villages as possible to slow down environmental degradation
• To reduce the social gap between rural and urban communities in order to reduce migration from the former to the latter

e8-G
EF-U
ND
ESA
Fin
anci
ng S
usta
inab
le R
ural
Ele
ctrif
icat
ion
HC
B In
itiat
ive
Afr
ica
Dia
logu
es, A
pril
13-1
5, 2
010,
Nai
robi
, Ken
ya
Sources of funding for Rural electrification
• Direct Government funding through the annual development budget (bulk of the funding)
• Government funding through loans secured from international markets
• Direct funding by Botswana Power Corporation through annual CAPEX budgets
• Assistance from Donor Agencies e.g. SIDA(1975) and DANIDA(1987), JICA (2000) and GEF (2005 for RE Botswana)
e8-G
EF-U
ND
ESA
Fin
anci
ng S
usta
inab
le R
ural
Ele
ctrif
icat
ion
HC
B In
itiat
ive
Afr
ica
Dia
logu
es, A
pril
13-1
5, 2
010,
Nai
robi
, Ken
ya
Progress in Rural Electrification (Grid)
• Programme initiated in 1975 by Government of Botswana through from SIDA (11 villages) and DANIDA (8 villages in 1987)
• Out of 475 villages, 330 are currently electrified giving a penetration rate of 69%
• Total national grid connections currently about 210,000. Rural customers total about 130,000.
• Access rate is currently 56% with a target of 80% by 2016

e8-G
EF-U
ND
ESA
Fin
anci
ng S
usta
inab
le R
ural
Ele
ctrif
icat
ion
HC
B In
itiat
ive
Afr
ica
Dia
logu
es, A
pril
13-1
5, 2
010,
Nai
robi
, Ken
ya
Progress in Rural Electrification (Off Grid)
• Agreement between Governments of Japan and Botswana in 2000 resulted in the ‘’Master Plan Study on Photovoltaic Rural Electrification in the Republic of Botswana’’ covering a period of ten years
– Solar Home Systems installed in 3 villages and a battery charging station in one village under JAICA assistance
– PV mini grid installed in one village
• Agreement between Government of Botswana and GEF in 2005 resulted in the ‘Renewable Energy Based Rural Electrification Programme
• CASE STUDY OF RE BOTSWNA PROJECT
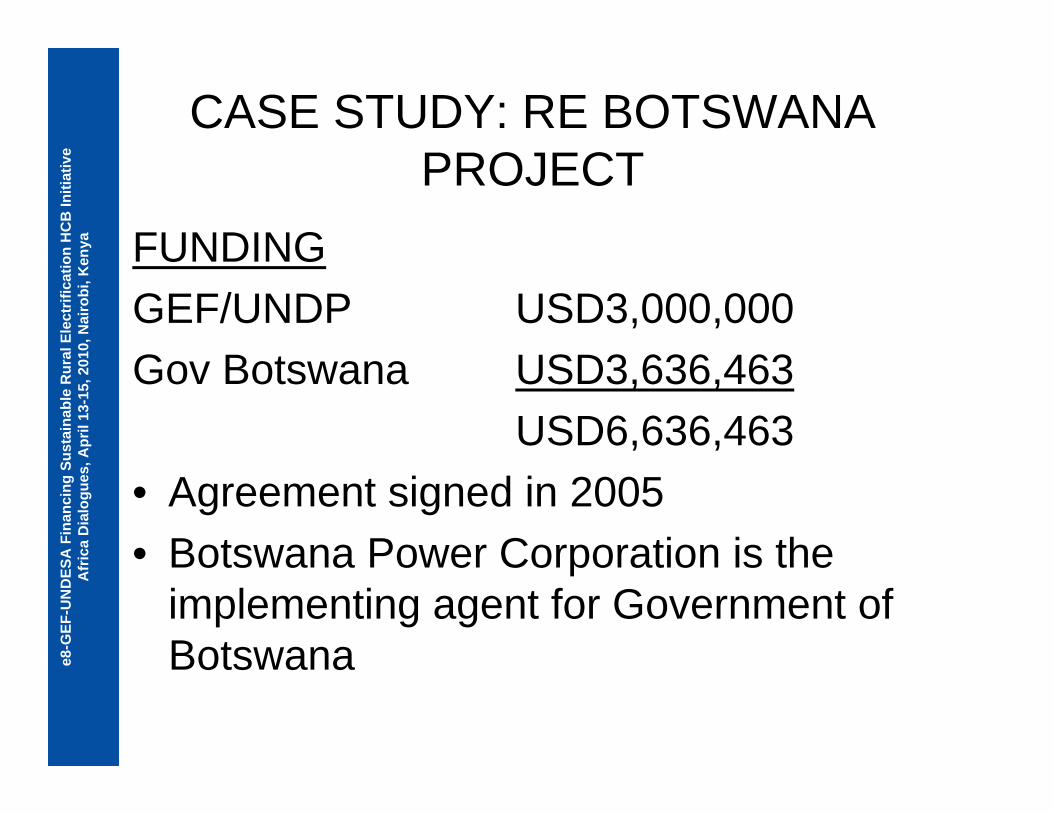
e8-G
EF-U
ND
ESA
Fin
anci
ng S
usta
inab
le R
ural
Ele
ctrif
icat
ion
HC
B In
itiat
ive
Afr
ica
Dia
logu
es, A
pril
13-1
5, 2
010,
Nai
robi
, Ken
ya
CASE STUDY: RE BOTSWANA PROJECT
FUNDINGGEF/UNDP USD3,000,000Gov Botswana USD3,636,463
USD6,636,463• Agreement signed in 2005• Botswana Power Corporation is the
implementing agent for Government of Botswana

e8-G
EF-U
ND
ESA
Fin
anci
ng S
usta
inab
le R
ural
Ele
ctrif
icat
ion
HC
B In
itiat
ive
Afr
ica
Dia
logu
es, A
pril
13-1
5, 2
010,
Nai
robi
, Ken
ya
RE BOTSWANA PROJECT OBJECTIVES
1. Reducing Botswana’s energy related CO2 by substituting fossil fuels with PV and efficient cooking appliances, to provide basic energy services to rural homes and community users
2. Improving people's livelihoods by improving access to and affordability of modern energy services
e8-G
EF-U
ND
ESA
Fin
anci
ng S
usta
inab
le R
ural
Ele
ctrif
icat
ion
HC
B In
itiat
ive
Afr
ica
Dia
logu
es, A
pril
13-1
5, 2
010,
Nai
robi
, Ken
ya
Identified barriers to utilisation of renewable and low GHG technologies
1. Insufficient knowledge and information amongst end users and decision makers on available technologies
2. Constraints in access to finance by private sector and end users
3. High upfront costs coupled with inflexible payment terms for end users
e8-G
EF-U
ND
ESA
Fin
anci
ng S
usta
inab
le R
ural
Ele
ctrif
icat
ion
HC
B In
itiat
ive
Afr
ica
Dia
logu
es, A
pril
13-1
5, 2
010,
Nai
robi
, Ken
ya
Identified barriers to utilisation of renewable and low GHG technologies (contd)
4. Lack of technical capacity and experience in renewable energy technologies
5. Existing legal/policy structures not conducive to implementation of delivery models
6. Weak linkages between private and public sector7. Donor funded projects through public sector
institutions lacking mandates to provide long term services
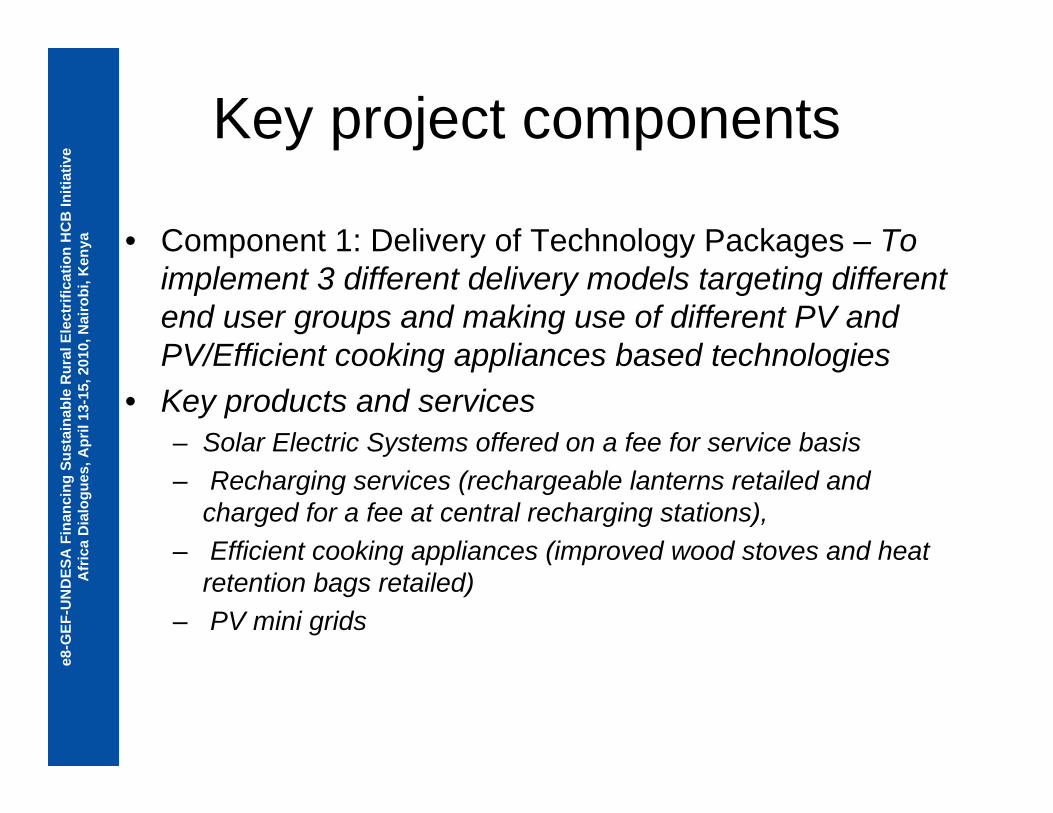
e8-G
EF-U
ND
ESA
Fin
anci
ng S
usta
inab
le R
ural
Ele
ctrif
icat
ion
HC
B In
itiat
ive
Afr
ica
Dia
logu
es, A
pril
13-1
5, 2
010,
Nai
robi
, Ken
ya
Key project components
• Component 1: Delivery of Technology Packages – To implement 3 different delivery models targeting different end user groups and making use of different PV and PV/Efficient cooking appliances based technologies
• Key products and services – Solar Electric Systems offered on a fee for service basis– Recharging services (rechargeable lanterns retailed and
charged for a fee at central recharging stations),– Efficient cooking appliances (improved wood stoves and heat
retention bags retailed)– PV mini grids
e8-G
EF-U
ND
ESA
Fin
anci
ng S
usta
inab
le R
ural
Ele
ctrif
icat
ion
HC
B In
itiat
ive
Afr
ica
Dia
logu
es, A
pril
13-1
5, 2
010,
Nai
robi
, Ken
ya
Delivery of products and services under component 1
Pilot project completed in February 2010 in 4 villages within 120km of Gaborone. Pilot project evaluation in progress before full roll out countrywide
A special purpose vehicle company, BPC Lesedi set up to offer off grid energy services to rural customers. BPC Lesedi is a joint venture company between BPC and a suitable strategic partner which will operate through a business format franchise
e8-G
EF-U
ND
ESA
Fin
anci
ng S
usta
inab
le R
ural
Ele
ctrif
icat
ion
HC
B In
itiat
ive
Afr
ica
Dia
logu
es, A
pril
13-1
5, 2
010,
Nai
robi
, Ken
ya
Key project components (contd)
Component 2: Policy Support and Policy Framework• To assist with the development of policy and
institutional arrangements conducive for the integration and provisions of off grid electricity services within the existing rural electrification programme
Component 3: Awareness Raising & Changing of Perceptions
• To increase awareness and change perceptions among the general public, decision makers and rural consumers on the potential role of PV and efficient cooking appliances in meeting basic energy needs
e8-G
EF-U
ND
ESA
Fin
anci
ng S
usta
inab
le R
ural
Ele
ctrif
icat
ion
HC
B In
itiat
ive
Afr
ica
Dia
logu
es, A
pril
13-1
5, 2
010,
Nai
robi
, Ken
ya
Key project components (contd)
Component 4: Private and Public Sector Strengthening and Training
• To strengthen and support public and private working in the PV and renewable energy sector to provide better quality of service. Component 3: Awareness Raising & Changing of Perceptions
Component 5: Financial Engineering• To assist with the development of appropriate
financing mechanisms for the larger scale dissemination of PV based technologies to rural customers
e8-G
EF-U
ND
ESA
Fin
anci
ng S
usta
inab
le R
ural
Ele
ctrif
icat
ion
HC
B In
itiat
ive
Afr
ica
Dia
logu
es, A
pril
13-1
5, 2
010,
Nai
robi
, Ken
ya
Key project components (contd)
Component 6: Learning and replication• To strengthen and support public and private
working in the PV and renewable energy sector to provide better quality of service. Component 3: Awareness Raising & Changing of Perceptions
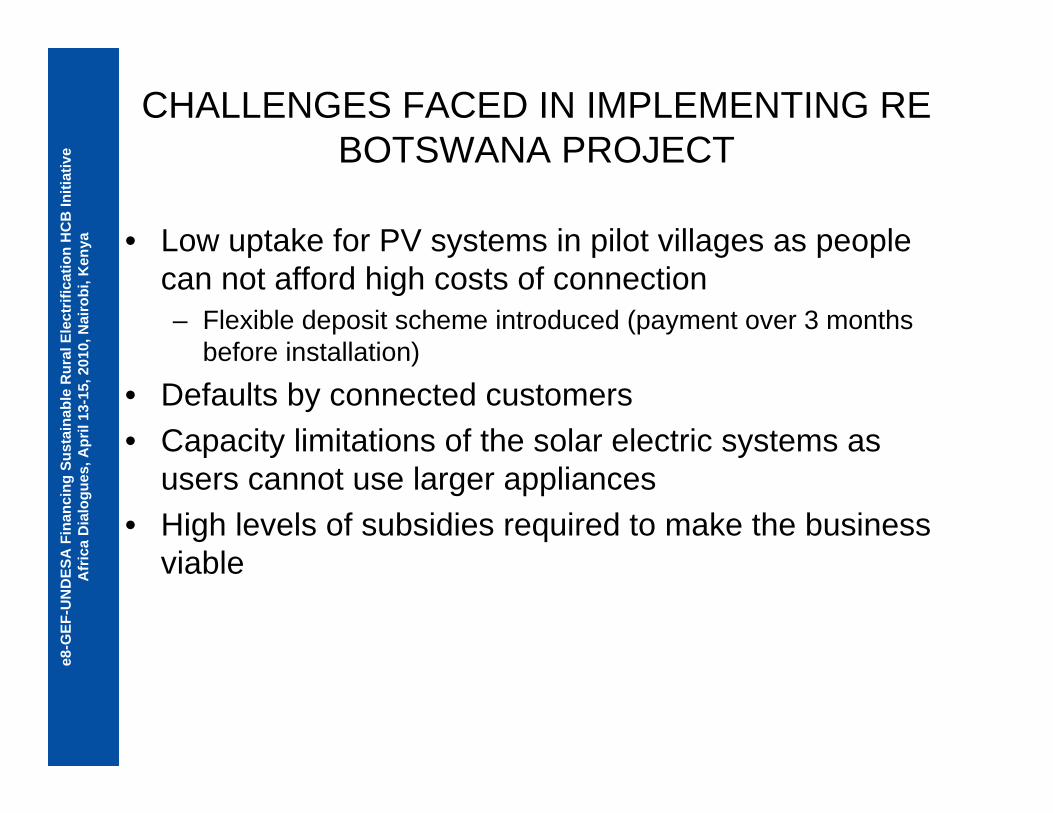
e8-G
EF-U
ND
ESA
Fin
anci
ng S
usta
inab
le R
ural
Ele
ctrif
icat
ion
HC
B In
itiat
ive
Afr
ica
Dia
logu
es, A
pril
13-1
5, 2
010,
Nai
robi
, Ken
ya
CHALLENGES FACED IN IMPLEMENTING RE BOTSWANA PROJECT
• Low uptake for PV systems in pilot villages as people can not afford high costs of connection– Flexible deposit scheme introduced (payment over 3 months
before installation)
• Defaults by connected customers• Capacity limitations of the solar electric systems as
users cannot use larger appliances• High levels of subsidies required to make the business
viable

e8-G
EF-U
ND
ESA
Fin
anci
ng S
usta
inab
le R
ural
Ele
ctrif
icat
ion
HC
B In
itiat
ive
Afr
ica
Dia
logu
es, A
pril
13-1
5, 2
010,
Nai
robi
, Ken
ya
THANK YOU
e8-G
EF-U
ND
ESA
Fin
anci
ng S
usta
inab
le R
ural
Ele
ctrif
icat
ion
HC
B In
itiat
ive
Afr
ica
Dia
logu
es, A
pril
13-1
5, 2
010,
Nai
robi
, Ken
ya
Contact Information:Email: [email protected]
Tel: +267 3603349Fax: +267 3953300
Mobile: +267 71318931
Website:www.bpc.bw

e8-G
EF-U
ND
ESA
Fin
anci
ng S
usta
inab
le R
ural
Ele
ctrif
icat
ion
HC
B In
itiat
ive
Afr
ica
Dia
logu
es, A
pril
13-1
5, 2
010,
Nai
robi
, Ken
ya
e8-GEF-UNDESA Financing Rural Sustainable Electrification
Africa DialoguesNairobi, Kenya, April 13-15, 2010
[EUEI Partnership Dialogue Facility]
[David Otieno, Regional Manager, GTZ-REAP]

e8-G
EF-U
ND
ESA
Fin
anci
ng S
usta
inab
le R
ural
Ele
ctrif
icat
ion
HC
B In
itiat
ive
Afr
ica
Dia
logu
es, A
pril
13-1
5, 2
010,
Nai
robi
, Ken
ya
Structure of presentation
• About EUEI PDF
• EUEI PDF activities
• Africa EU Energy Partnership
• Africa Electrification Initiative
• ACP Energy Governance

e8-G
EF-U
ND
ESA
Fin
anci
ng S
usta
inab
le R
ural
Ele
ctrif
icat
ion
HC
B In
itiat
ive
Afr
ica
Dia
logu
es, A
pril
13-1
5, 2
010,
Nai
robi
, Ken
ya
About EUEI PDF
• EUEI launched at WSSD (http:\\euei.org)
• Funded and directed by some EU Member States (NL, UK, DE, AT, SE, FI) and the European Commission
• facilitates dialogue on energy access between:– The European Union and its Partner Countries– Stakeholders at national and regional level
• Supports development of national and regional energy access policies
• Supports the development of the Africa-EU energy Partnership,
• hosted by GTZ
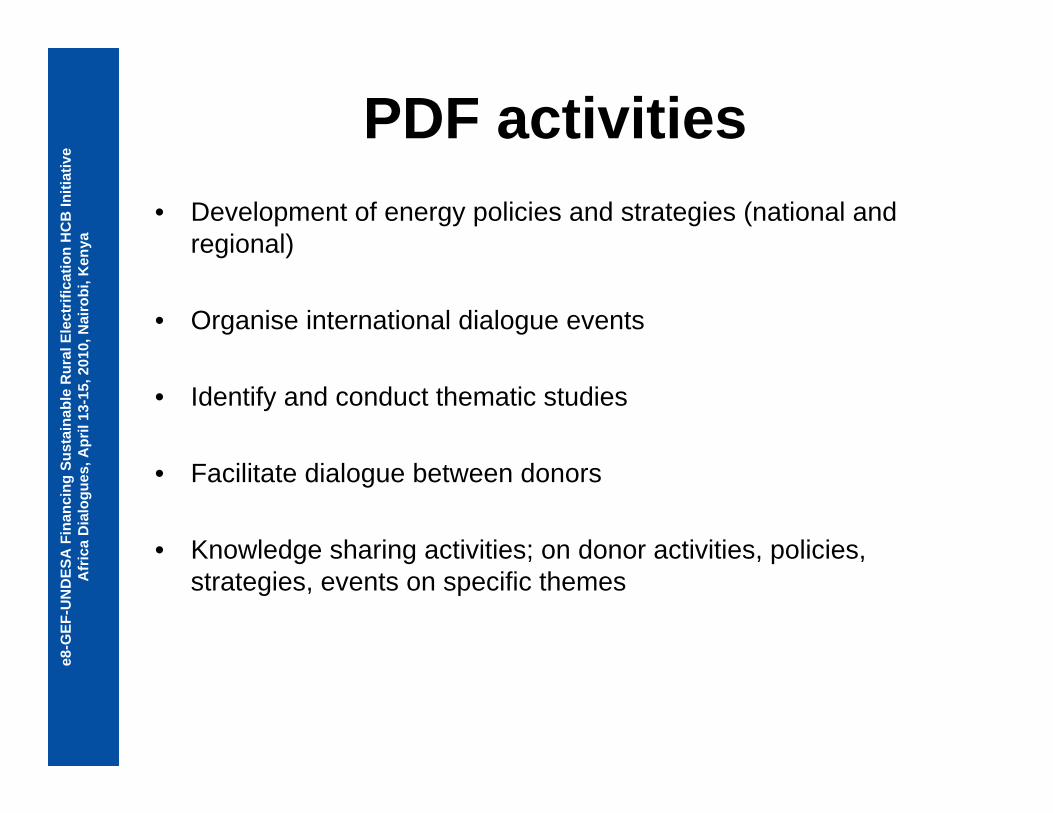
e8-G
EF-U
ND
ESA
Fin
anci
ng S
usta
inab
le R
ural
Ele
ctrif
icat
ion
HC
B In
itiat
ive
Afr
ica
Dia
logu
es, A
pril
13-1
5, 2
010,
Nai
robi
, Ken
ya
PDF activities • Development of energy policies and strategies (national and
regional)
• Organise international dialogue events
• Identify and conduct thematic studies
• Facilitate dialogue between donors
• Knowledge sharing activities; on donor activities, policies, strategies, events on specific themes
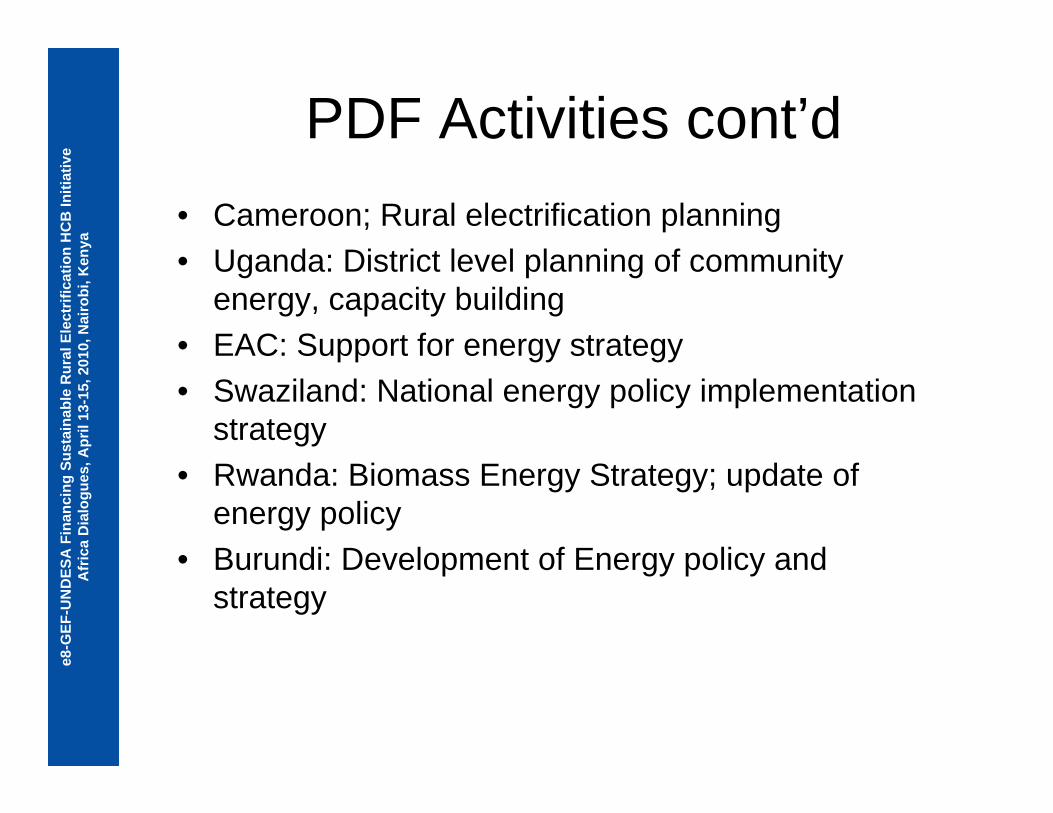
e8-G
EF-U
ND
ESA
Fin
anci
ng S
usta
inab
le R
ural
Ele
ctrif
icat
ion
HC
B In
itiat
ive
Afr
ica
Dia
logu
es, A
pril
13-1
5, 2
010,
Nai
robi
, Ken
ya
PDF Activities cont’d• Cameroon; Rural electrification planning• Uganda: District level planning of community
energy, capacity building• EAC: Support for energy strategy• Swaziland: National energy policy implementation
strategy• Rwanda: Biomass Energy Strategy; update of
energy policy• Burundi: Development of Energy policy and
strategy
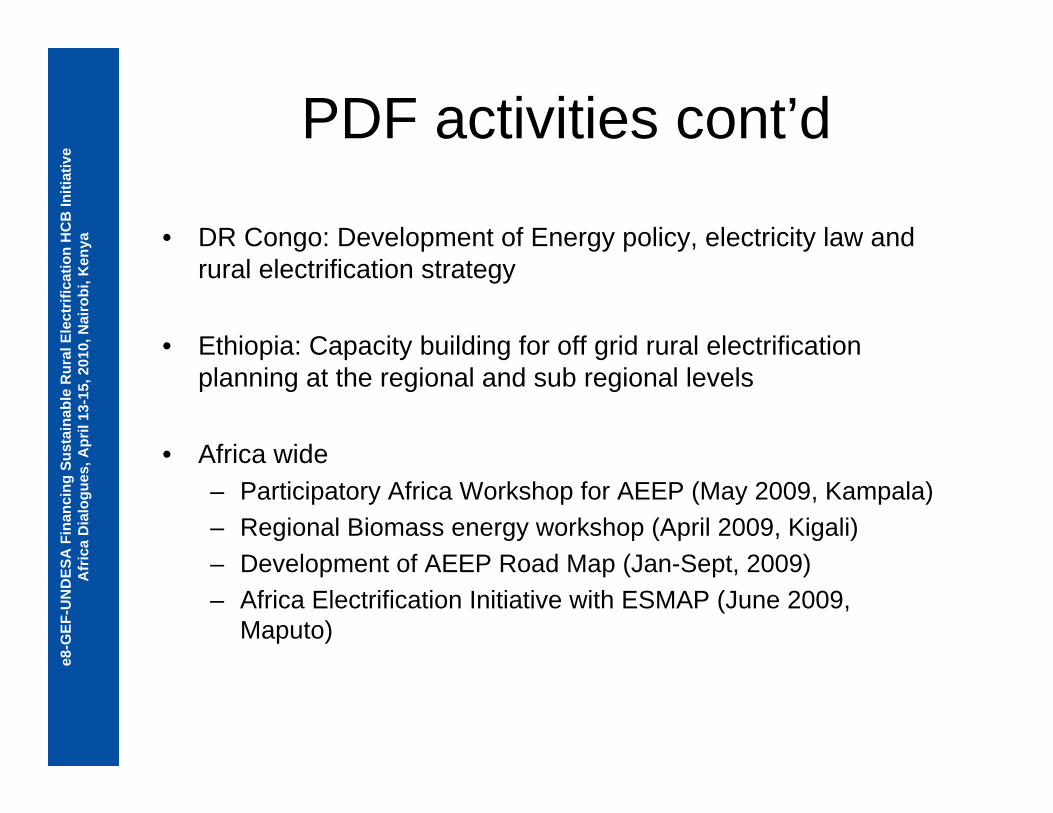
e8-G
EF-U
ND
ESA
Fin
anci
ng S
usta
inab
le R
ural
Ele
ctrif
icat
ion
HC
B In
itiat
ive
Afr
ica
Dia
logu
es, A
pril
13-1
5, 2
010,
Nai
robi
, Ken
ya
PDF activities cont’d
• DR Congo: Development of Energy policy, electricity law and rural electrification strategy
• Ethiopia: Capacity building for off grid rural electrification planning at the regional and sub regional levels
• Africa wide– Participatory Africa Workshop for AEEP (May 2009, Kampala)– Regional Biomass energy workshop (April 2009, Kigali)– Development of AEEP Road Map (Jan-Sept, 2009)– Africa Electrification Initiative with ESMAP (June 2009,
Maputo)
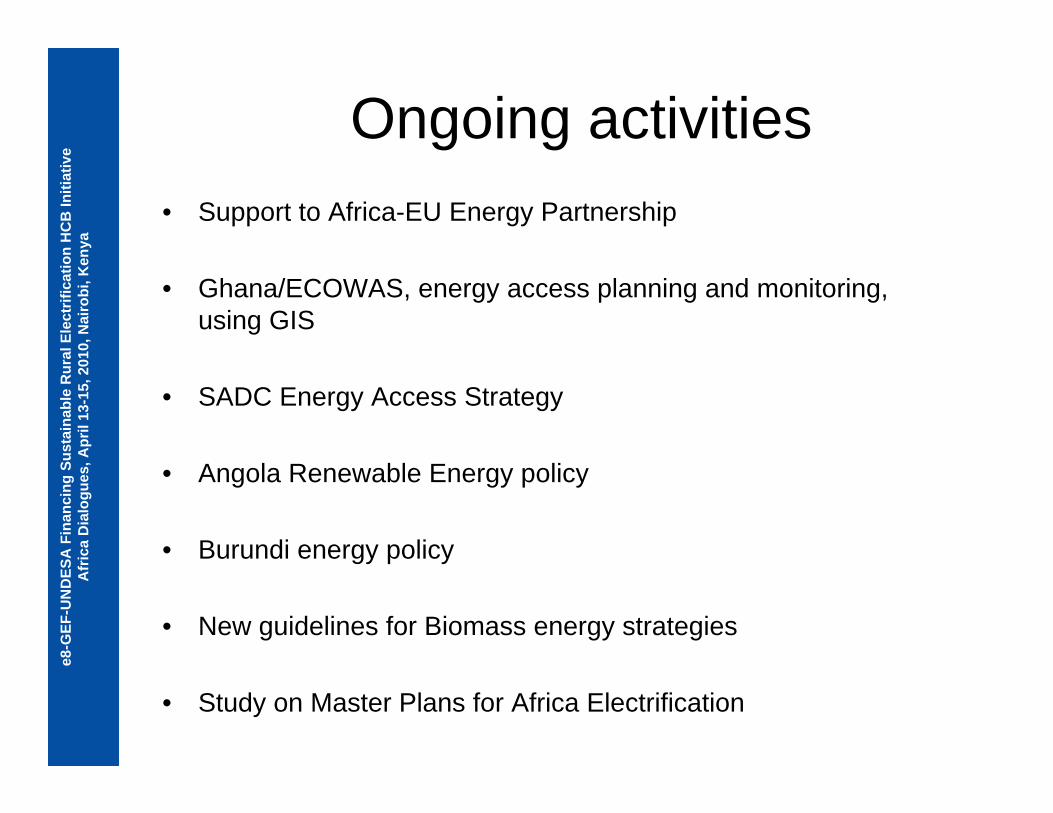
e8-G
EF-U
ND
ESA
Fin
anci
ng S
usta
inab
le R
ural
Ele
ctrif
icat
ion
HC
B In
itiat
ive
Afr
ica
Dia
logu
es, A
pril
13-1
5, 2
010,
Nai
robi
, Ken
ya
Ongoing activities • Support to Africa-EU Energy Partnership
• Ghana/ECOWAS, energy access planning and monitoring, using GIS
• SADC Energy Access Strategy
• Angola Renewable Energy policy
• Burundi energy policy
• New guidelines for Biomass energy strategies
• Study on Master Plans for Africa Electrification
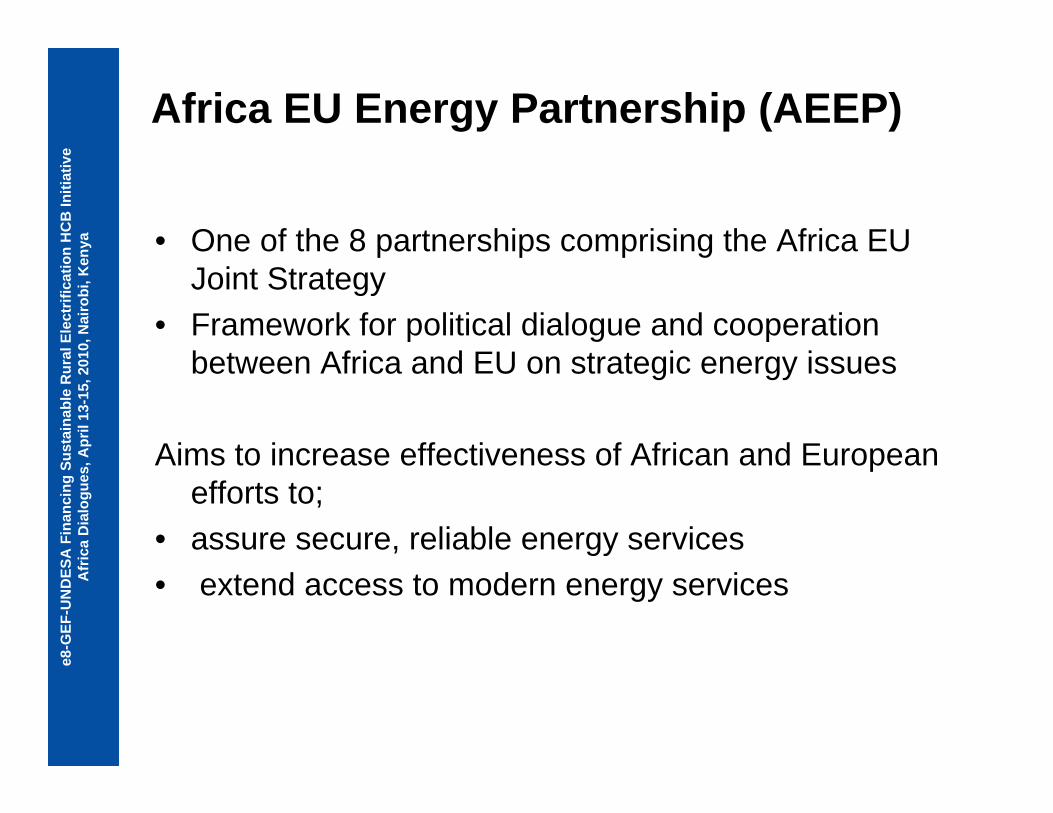
e8-G
EF-U
ND
ESA
Fin
anci
ng S
usta
inab
le R
ural
Ele
ctrif
icat
ion
HC
B In
itiat
ive
Afr
ica
Dia
logu
es, A
pril
13-1
5, 2
010,
Nai
robi
, Ken
ya
Africa EU Energy Partnership (AEEP)
• One of the 8 partnerships comprising the Africa EU Joint Strategy
• Framework for political dialogue and cooperation between Africa and EU on strategic energy issues
Aims to increase effectiveness of African and European efforts to;
• assure secure, reliable energy services• extend access to modern energy services

e8-G
EF-U
ND
ESA
Fin
anci
ng S
usta
inab
le R
ural
Ele
ctrif
icat
ion
HC
B In
itiat
ive
Afr
ica
Dia
logu
es, A
pril
13-1
5, 2
010,
Nai
robi
, Ken
ya
AEEP activities • Mobilising additional resources and support for energy
access
• Regional and intercontinental integration of energy systems and markets
• Renewable Energy and Energy Efficiency
• Enabling environment for scaling up investments and mobilising private capital
• Support the World Bank Global Gas Flaring Reduction Partnership

e8-G
EF-U
ND
ESA
Fin
anci
ng S
usta
inab
le R
ural
Ele
ctrif
icat
ion
HC
B In
itiat
ive
Afr
ica
Dia
logu
es, A
pril
13-1
5, 2
010,
Nai
robi
, Ken
ya
AEEP activities cont’d
• Develop institutional and technical capacity
• Political and technical dialogue, contacts and exchanges
• Improving management of energy resources
• Mainstreaming climate change into development cooperation
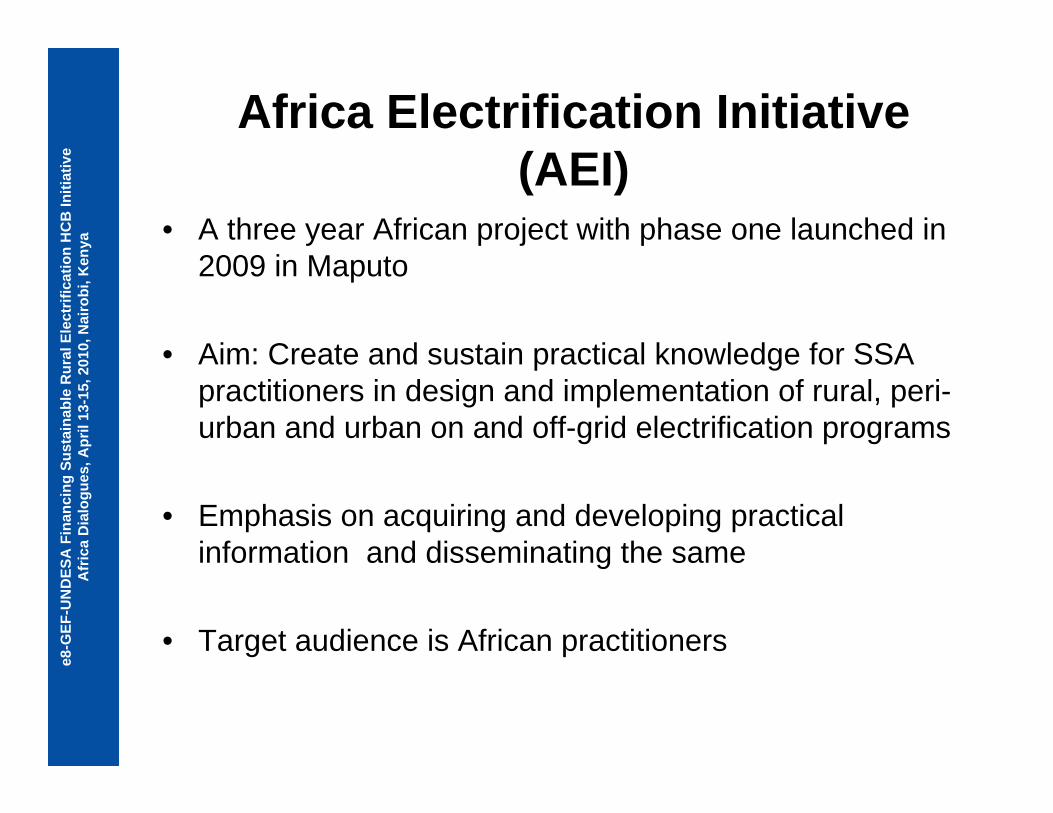
e8-G
EF-U
ND
ESA
Fin
anci
ng S
usta
inab
le R
ural
Ele
ctrif
icat
ion
HC
B In
itiat
ive
Afr
ica
Dia
logu
es, A
pril
13-1
5, 2
010,
Nai
robi
, Ken
ya
Africa Electrification Initiative (AEI)
• A three year African project with phase one launched in 2009 in Maputo
• Aim: Create and sustain practical knowledge for SSA practitioners in design and implementation of rural, peri-urban and urban on and off-grid electrification programs
• Emphasis on acquiring and developing practical information and disseminating the same
• Target audience is African practitioners

e8-G
EF-U
ND
ESA
Fin
anci
ng S
usta
inab
le R
ural
Ele
ctrif
icat
ion
HC
B In
itiat
ive
Afr
ica
Dia
logu
es, A
pril
13-1
5, 2
010,
Nai
robi
, Ken
ya
AEI Project implementation Project is being organized in two phases;Phase 1• Launched with a kick off workshop in Maputo in June 2009
• Discussed ground level techniques related to rural, peri-urban and urban electrification
• Workshop aimed to achieve shared practical information, a network for practitioners and refine topics where SSA practitioners face constraints
• Workshop received funding from ESMAP, AFREA, EUEI PDF, FEMA, GTZ, WB
e8-G
EF-U
ND
ESA
Fin
anci
ng S
usta
inab
le R
ural
Ele
ctrif
icat
ion
HC
B In
itiat
ive
Afr
ica
Dia
logu
es, A
pril
13-1
5, 2
010,
Nai
robi
, Ken
ya
Project implementation cont’dPhase IIFocused on ;• Creating long-term dissemination mechanisms such as a
website for ; - participants to share information on topics of interest- access documents for practical use- Interact via blog
• Producing technical papers on key implementation topics
• International experiences of relevance illustrated
• Emphasis on local knowledge sharing
• Implemented in partnership with other organizations (local and international)
• Google Search for World Bank Energy Africa - Projects
e8-G
EF-U
ND
ESA
Fin
anci
ng S
usta
inab
le R
ural
Ele
ctrif
icat
ion
HC
B In
itiat
ive
Afr
ica
Dia
logu
es, A
pril
13-1
5, 2
010,
Nai
robi
, Ken
ya
ACP Energy GovernanceObjectives;• Support to ACP countries on creation of an enabling
environment for promotion and support to the energy sector
• Development of action-oriented regional, national and sub-national policies and strategies on energy access, including development of energy legislation, regulation, investment plans
• Builds capacity to manage PPPs on energy and biomass energy strategies
• Strengthen regional, national and sub-national energy expertise through training and networking

e8-G
EF-U
ND
ESA
Fin
anci
ng S
usta
inab
le R
ural
Ele
ctrif
icat
ion
HC
B In
itiat
ive
Afr
ica
Dia
logu
es, A
pril
13-1
5, 2
010,
Nai
robi
, Ken
ya
ACP Energy Governance activities • Development of policies, strategies, legal and
regulatory instruments
• Capacity development during the three year period to March 2012 (with potential for extension to 2013)
• Action will seek complementarity and synergies with national and regional programmes funded by EC, EU member states and other donors
Support is provided in response to requests from governments – no standard format.
See www.euei-pdf.org
e8-G
EF-U
ND
ESA
Fin
anci
ng S
usta
inab
le R
ural
Ele
ctrif
icat
ion
HC
B In
itiat
ive
Afr
ica
Dia
logu
es, A
pril
13-1
5, 2
010,
Nai
robi
, Ken
ya
Contact Information:Email: [email protected]
Tel: +256-414-347145Fax: +256-414-347217
Website: www.euei-pdf.orgwww.gtz.dewww.regionalenergy-net.com
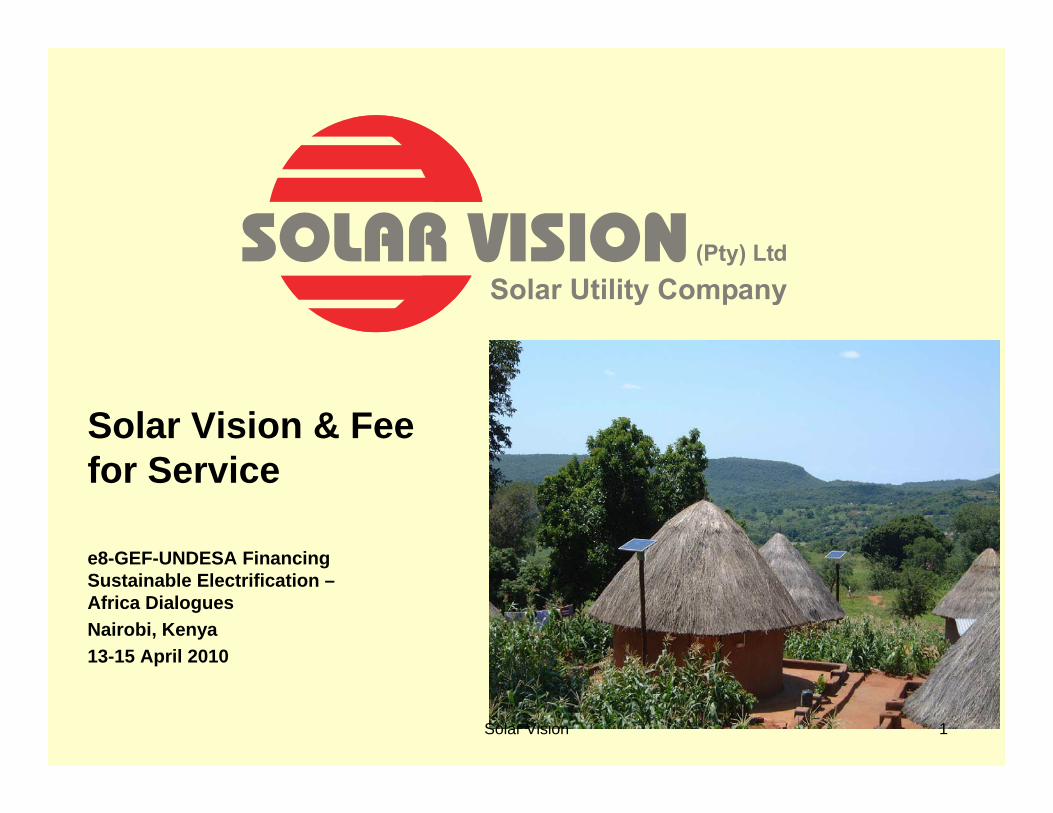
Solar Vision & Fee for Service
e8-GEF-UNDESA Financing Sustainable Electrification –Africa DialoguesNairobi, Kenya13-15 April 2010
1Solar Vision
Solar Vision and fee for service
• Solar Vision – the company• Solar Vision – background• State of solar energy• Fee for service as a business model
Solar Vision 2

Solar Vision – The Organisation
ShareholdersJJJ Trust
InSite International asET Tshipota BEE
J JacobsMD
Admin / HRR Neethling
Finance Vhembe (DC 34) Capricorn (DC 35) Area Man
IT
SMS
Operations
DC 34
DC35
CBDC 3
Solar Vision 3
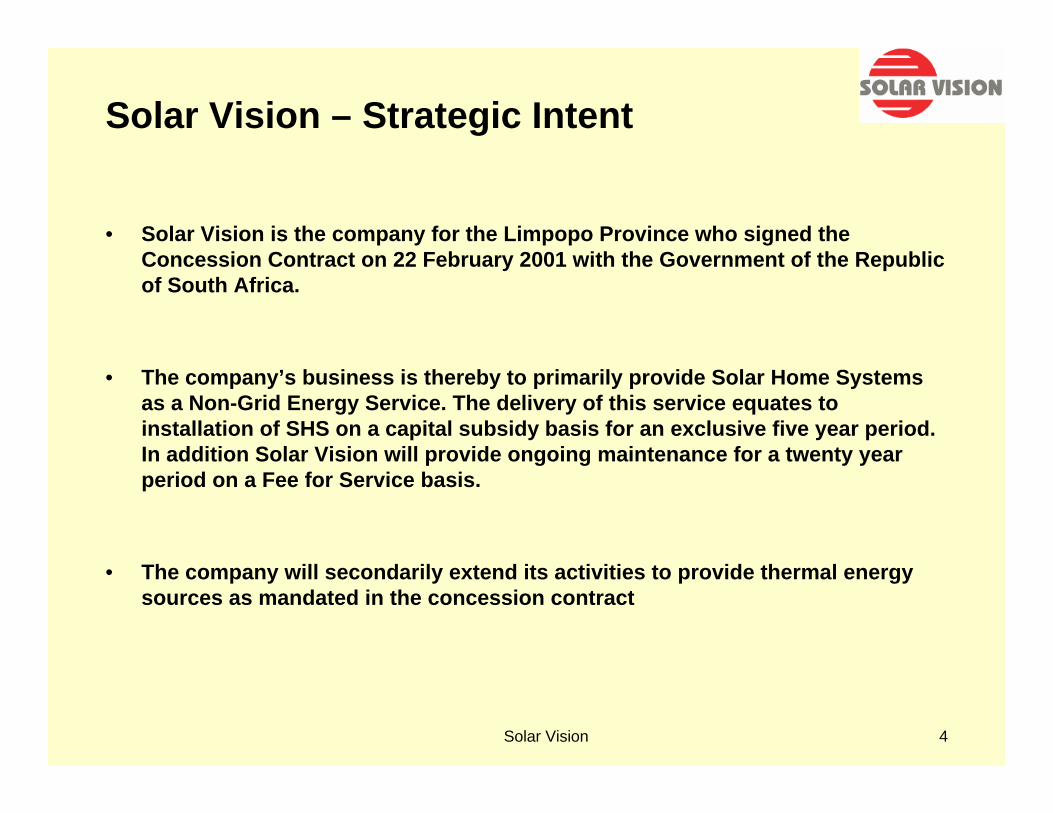
Solar Vision – Strategic Intent
• Solar Vision is the company for the Limpopo Province who signed the Concession Contract on 22 February 2001 with the Government of the Republic of South Africa.
• The company’s business is thereby to primarily provide Solar Home Systems as a Non-Grid Energy Service. The delivery of this service equates to installation of SHS on a capital subsidy basis for an exclusive five year period. In addition Solar Vision will provide ongoing maintenance for a twenty year period on a Fee for Service basis.
• The company will secondarily extend its activities to provide thermal energy sources as mandated in the concession contract
4Solar Vision
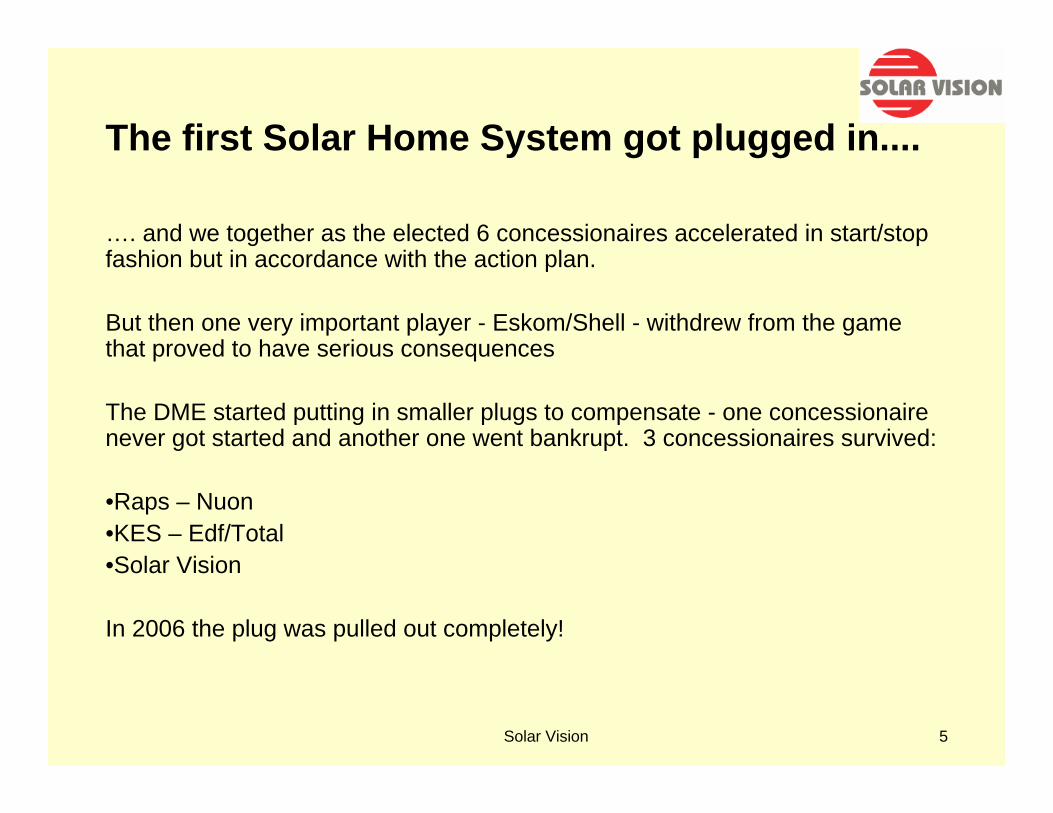
The first Solar Home System got plugged in....
…. and we together as the elected 6 concessionaires accelerated in start/stop fashion but in accordance with the action plan.
But then one very important player - Eskom/Shell - withdrew from the game that proved to have serious consequences
The DME started putting in smaller plugs to compensate - one concessionaire never got started and another one went bankrupt. 3 concessionaires survived:
•Raps – Nuon•KES – Edf/Total•Solar Vision
In 2006 the plug was pulled out completely!
Solar Vision 5
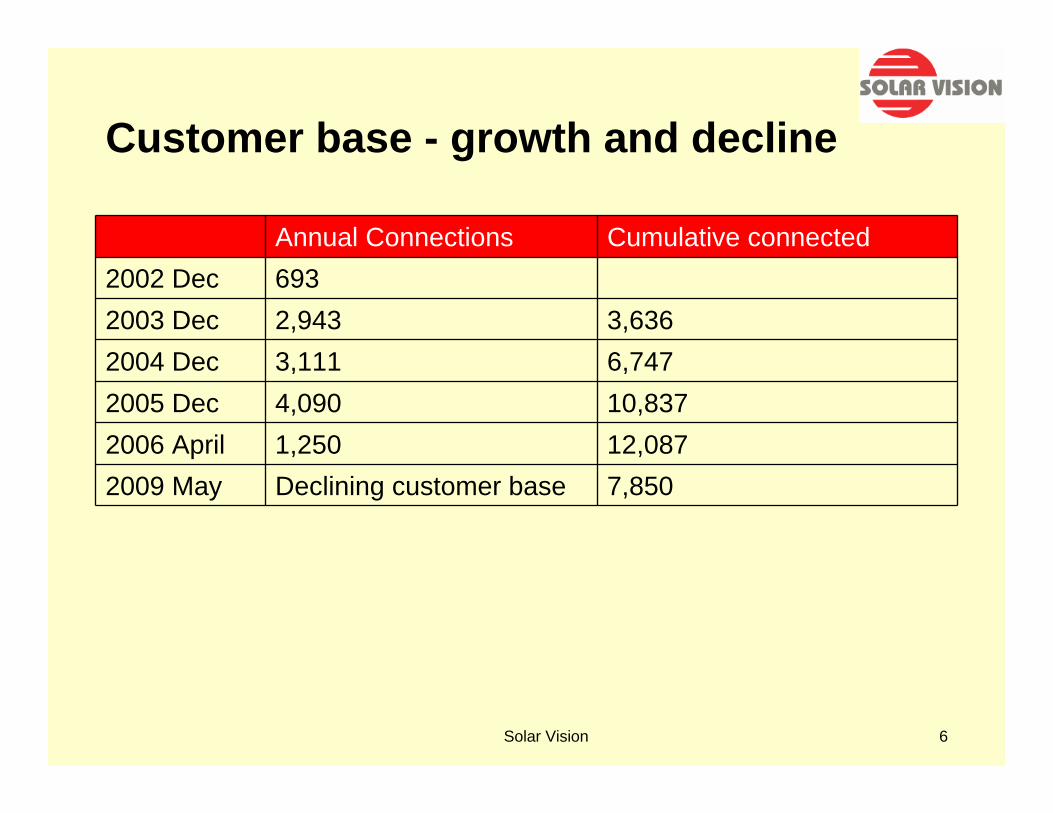
Customer base - growth and decline
Annual Connections Cumulative connected2002 Dec 6932003 Dec 2,943 3,6362004 Dec 3,111 6,7472005 Dec 4,090 10,8372006 April 1,250 12,0872009 May Declining customer base 7,850
Solar Vision 6
The Old Starting Plug
The plug we started with was built on a legally contracted promise consisting of a political commitment.
• This allowed for the business planning of a 20 year business model.
• The Free Basic Electricity law ensured the Fee for Service component but the Capital Subsidy was built on a weak foundation showing in reality that it was not sustainable as it was defined.
• There were impossible expectations that this would be guaranteed in consecutive annual government budgets.
• It then defaulted to high dependency on the ‘rich foreign uncles’ to cover the annual deficits.
Solar Vision 7

The Old Plug succeeded in spite of..
• Solar Energy as a decentralized solution has and is the most proven & viable alternative to provide a rural utility service, while patiently waiting for a centralized energy supply to be available via a grid and when the level of consumption combined with purchasing power has increased to an optimal stage.
• The Fee for Service component as it continues, has proven to be a most trusted and viable component, as it really delivers to the bottom of the pyramid a utility service. It is also a sustainable learning path for its consumers at their own affordable level.
Solar Vision 8
A Fixed and Irremovable Plug
• The concession should develop its impact to move from a single application at a household level to also look at community level and community infrastructure needs in areas like
– Clean water & hot water, health, education and entrepreneurial services to its consumers.
– The existing offering of providing LPG solutions to offset wood, coal and kerosene based cooking must continue at a higher pace. The demand is there and even though it is a fossil-fuel based solution it offsets deforestation, gives the household a better tool and with an acceptable emission level.
• The concession should in addition give focus to community level applications and infrastructure such as:
– clean water & hot water, health, education and entrepreneurial business services
Solar Vision 9

A Stronger Plug
• When a grid is available, the local community should be given an opportunity to buy the working SHS at an affordable sum. Removing the system is not productive.
• A combination of SHS at household level combined with a move to mini grids of +/- 1MW should be feasible and surplus energy supplied into the existing public grid with a with an attractive feed-in tariff.
• In peri-urban and urban areas low cost housing should in existing and new townships should prefab include solar based electricity and solar geyser based hot water. Such costs will be lower than retrofit at a later stage.
Solar Vision 10

A Sustainable Plug
• Foreign ‘uncles’ with deep pockets do certainly help. SV lacks one but the new shareholders are determined not to give up. SV will continue to work towards the original concession goal of 50 000 solar home systems.
• Rural electrification in a 100% decentralized mode can only be financed by a capital subsidy through a strong fund and a long and sustainable period of time and the use of Renewables. Concessionaires must expect that both sides in an agreement stick to their commitments.
• The fund must ideally be handled by a national, financially professional, non-governmental and non-utility entity with a mixed private/public Board of Directors elected for maximum 5 years, with a clearly defined responsibility to oversee via statutory definition and that each 5 year plan is executed annually without political interference.
• A concessionaire can expect the capital subsidy to be revised by falling prices but not be expected to contribute towards the capital subsidy.
• The installation plan periods should be of maximum 5 years at a time with continued life time Fee for Service for the consumer.
Solar Vision 11
A Plug for the Bottom of the Pyramid
• The Fee for Service must not be touched for the concession period with regard to the FBE based 60% contribution.
• SV will strengthen the model through private Donor monies from abroad in the form of village adoption and individual households serve as a important part of a revival of a private-public partnership based on CSR as an integral part of the financing model
• Open a commercial side for the company including partnering with foreign partner and public funding to apply the successful Fee for Service model in other markets in Africa and elsewhere to sustain the implementation vehicle.
Solar Vision 12
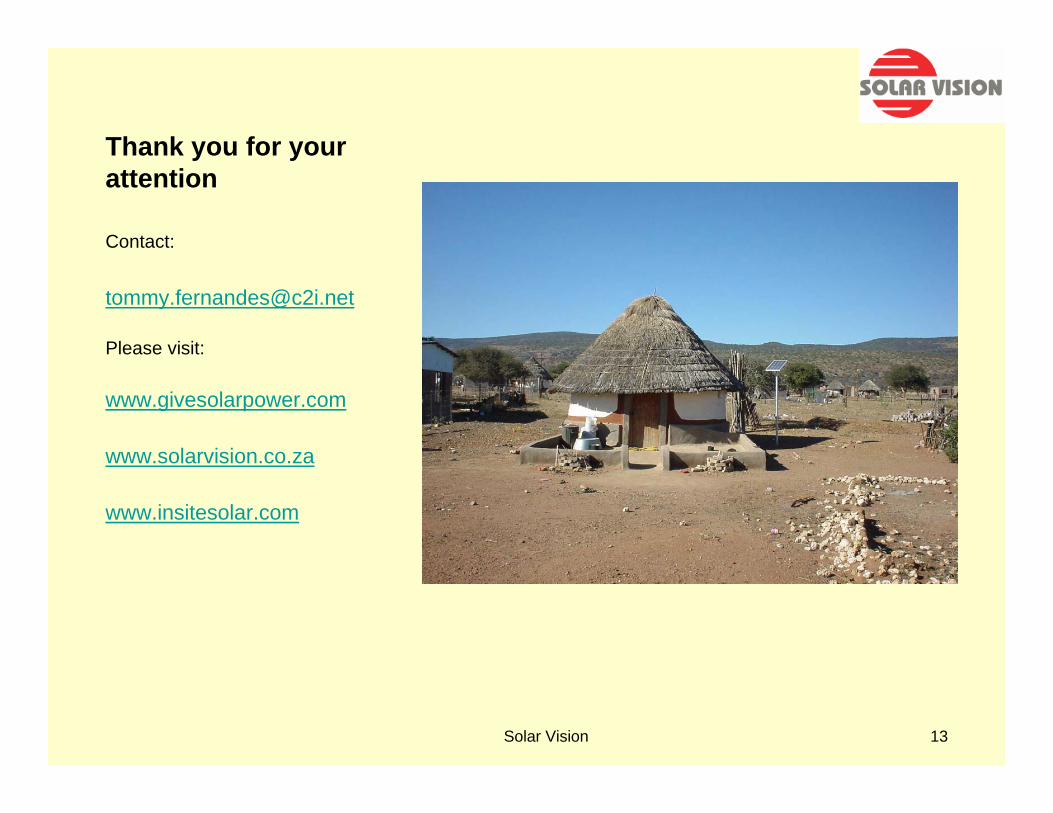
Thank you for your attention
Contact:
Please visit:
www.givesolarpower.com
www.solarvision.co.za
www.insitesolar.com
Solar Vision 13
Facilita'ng access to renewable energy for only USD 5 per newly connected person
Nairobi, April 13, 2010
Peter Huisman, Country Manager Tanzania
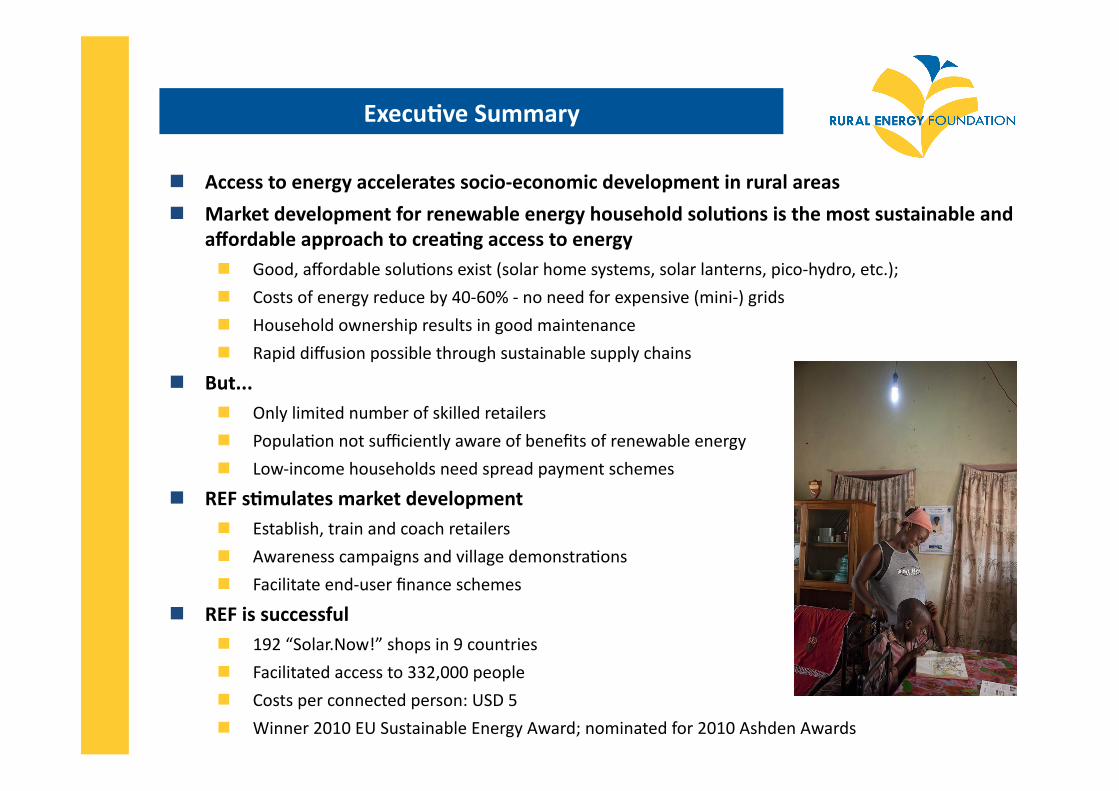
Execu've Summary
Access to energy accelerates socio-‐economic development in rural areas
Market development for renewable energy household solu'ons is the most sustainable and affordable approach to crea'ng access to energy Good, affordable soluAons exist (solar home systems, solar lanterns, pico-‐hydro, etc.);
Costs of energy reduce by 40-‐60% -‐ no need for expensive (mini-‐) grids
Household ownership results in good maintenance
Rapid diffusion possible through sustainable supply chains
But... Only limited number of skilled retailers
PopulaAon not sufficiently aware of benefits of renewable energy
Low-‐income households need spread payment schemes
REF s'mulates market development Establish, train and coach retailers
Awareness campaigns and village demonstraAons
Facilitate end-‐user finance schemes
REF is successful 192 “Solar.Now!” shops in 9 countries
Facilitated access to 332,000 people
Costs per connected person: USD 5
Winner 2010 EU Sustainable Energy Award; nominated for 2010 Ashden Awards
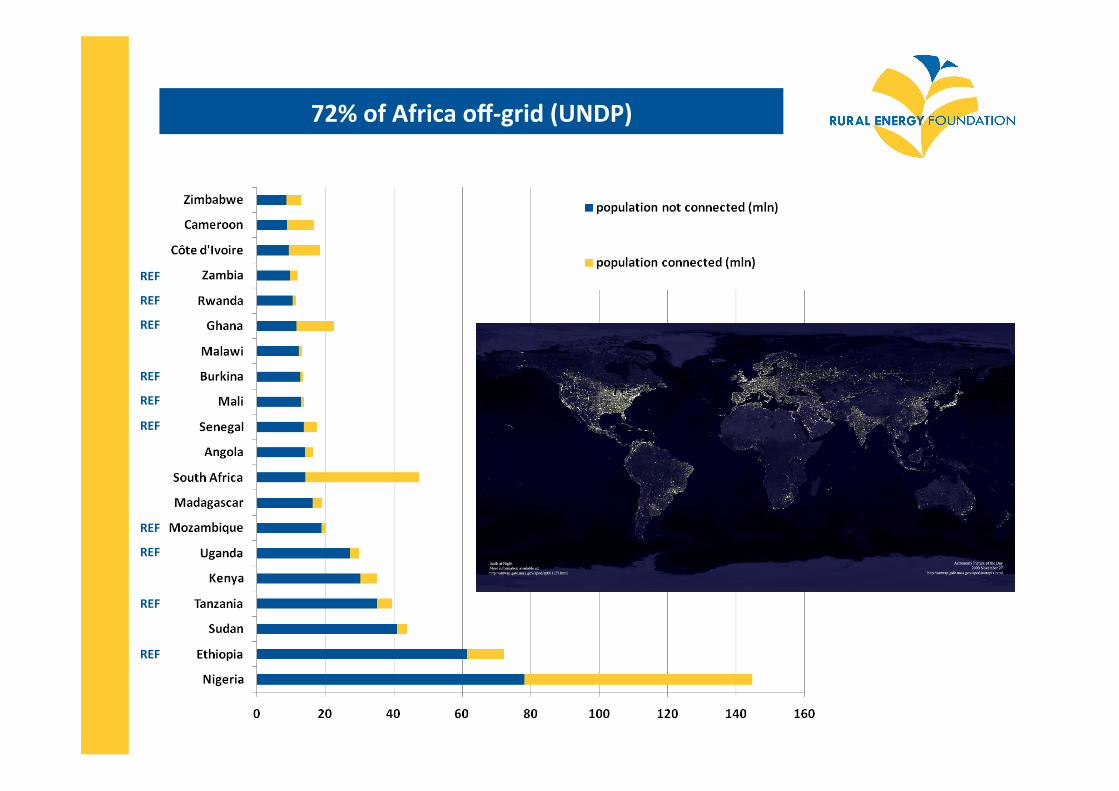
72% of Africa off-‐grid (UNDP)
REF
REF
REF
REF
REF
REF
REF
REF
REF
REF
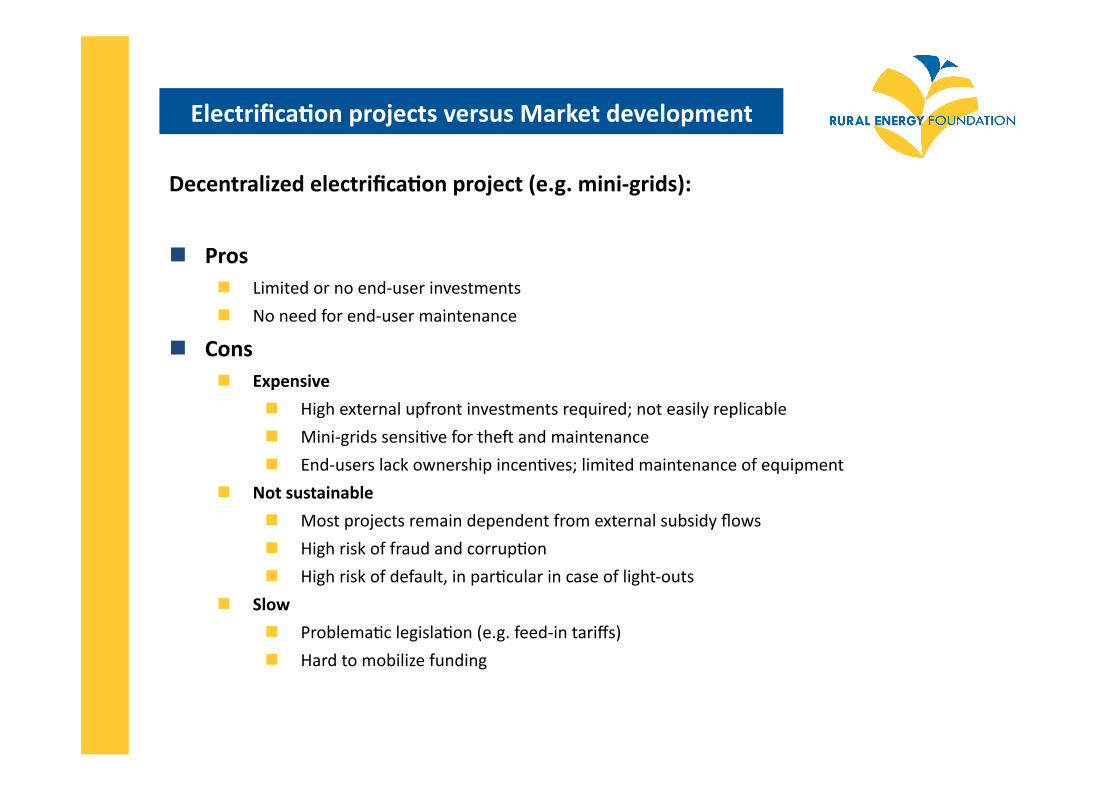
Electrifica'on projects versus Market development
Decentralized electrifica'on project (e.g. mini-‐grids):
Pros Limited or no end-‐user investments
No need for end-‐user maintenance
Cons Expensive
High external upfront investments required; not easily replicable
Mini-‐grids sensiAve for thec and maintenance
End-‐users lack ownership incenAves; limited maintenance of equipment
Not sustainable
Most projects remain dependent from external subsidy flows
High risk of fraud and corrupAon
High risk of default, in parAcular in case of light-‐outs
Slow
ProblemaAc legislaAon (e.g. feed-‐in tariffs)
Hard to mobilize funding
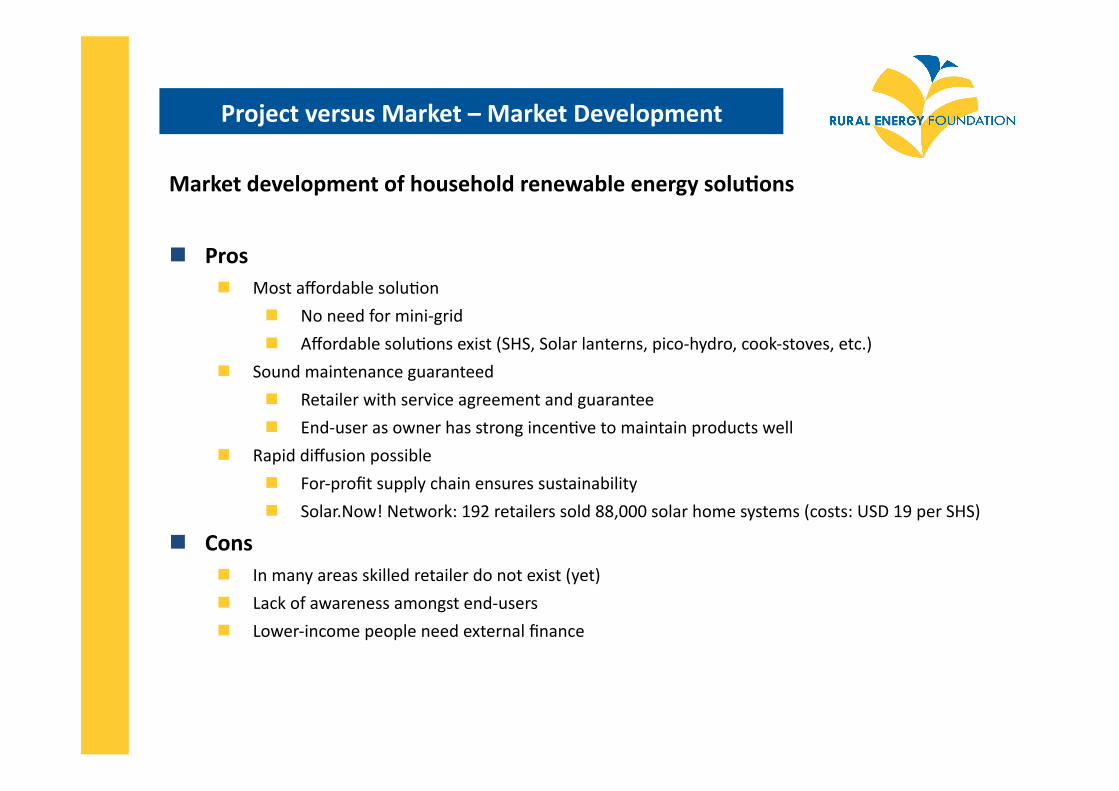
Project versus Market – Market Development
Market development of household renewable energy solu'ons
Pros Most affordable soluAon
No need for mini-‐grid
Affordable soluAons exist (SHS, Solar lanterns, pico-‐hydro, cook-‐stoves, etc.)
Sound maintenance guaranteed
Retailer with service agreement and guarantee
End-‐user as owner has strong incenAve to maintain products well
Rapid diffusion possible
For-‐profit supply chain ensures sustainability
Solar.Now! Network: 192 retailers sold 88,000 solar home systems (costs: USD 19 per SHS) Cons
In many areas skilled retailer do not exist (yet)
Lack of awareness amongst end-‐users
Lower-‐income people need external finance
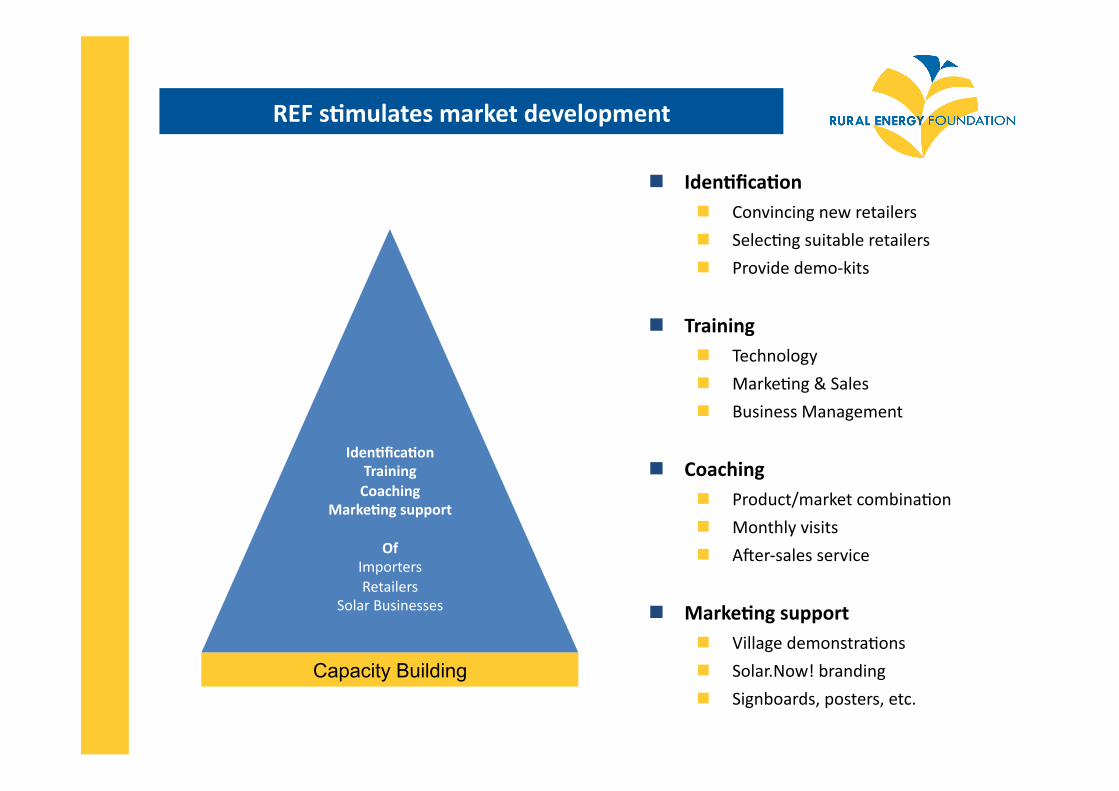
REF s'mulates market development
Iden'fica'on Training Coaching
Marke'ng support
Of Importers Retailers
Solar Businesses
Capacity Building
Iden'fica'on Convincing new retailers
SelecAng suitable retailers
Provide demo-‐kits
Training Technology
MarkeAng & Sales
Business Management
Coaching Product/market combinaAon
Monthly visits
Acer-‐sales service
Marke'ng support Village demonstraAons
Solar.Now! branding
Signboards, posters, etc.

Iden'fica'on Training Coaching
Marke'ng support
Of Importers Retailers
Solar Businesses
Capacity Building
REF s'mulates market development
Market Facilitation
Awareness campaigns Product innova'on Exchange website Product reviews Associa'ons Cer'fica'on NewsleWers Regula'on Trade fairs
Large-‐scale marke'ng campaigns Radio adds
TV news items
Product Innova'on REF cooperates with producers
Solar mini-‐kits
Pico-‐hydro systems
Cooking stoves
Other ac'vi'es Solar industry associaAons
Quarterly newslemers
Government lobby
Organize trade fairs
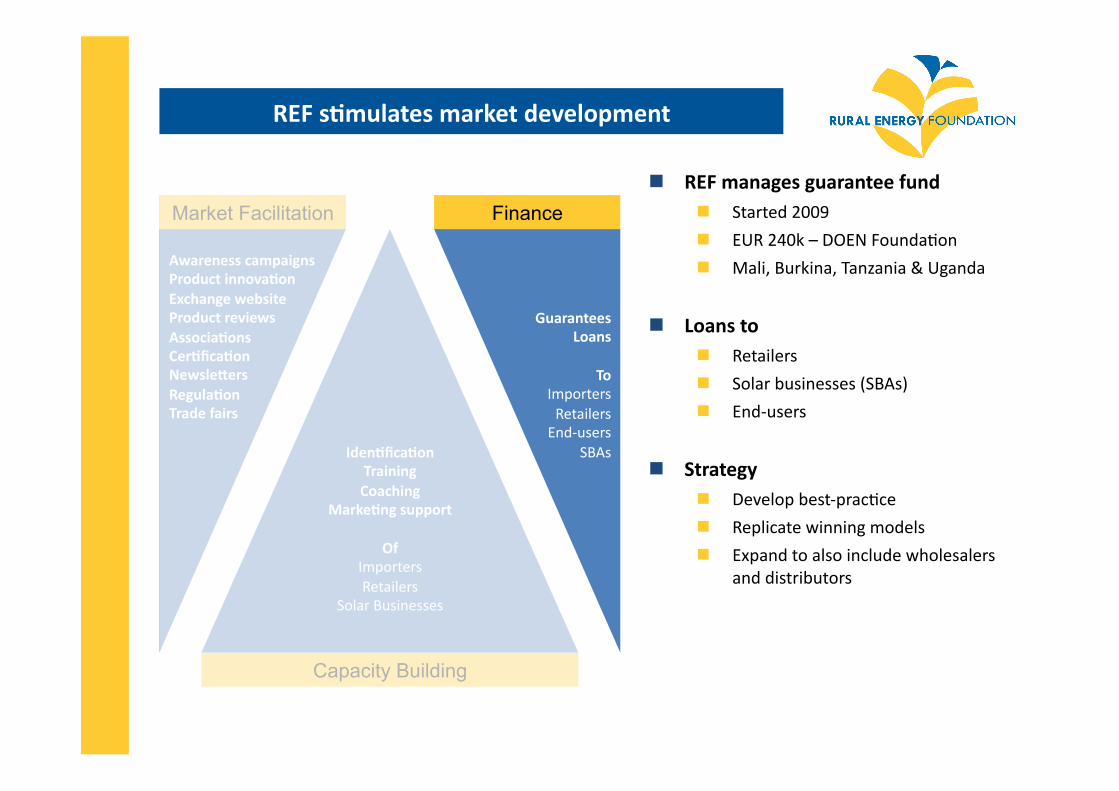
Market Facilitation
Awareness campaigns Product innova'on Exchange website Product reviews Associa'ons Cer'fica'on NewsleWers Regula'on Trade fairs
Capacity Building
Iden'fica'on Training Coaching
Marke'ng support
Of Importers Retailers
Solar Businesses
REF s'mulates market development
Finance
Guarantees Loans
To Importers Retailers End-‐users
SBAs
REF manages guarantee fund Started 2009
EUR 240k – DOEN FoundaAon
Mali, Burkina, Tanzania & Uganda
Loans to Retailers
Solar businesses (SBAs)
End-‐users
Strategy Develop best-‐pracAce
Replicate winning models
Expand to also include wholesalers and distributors
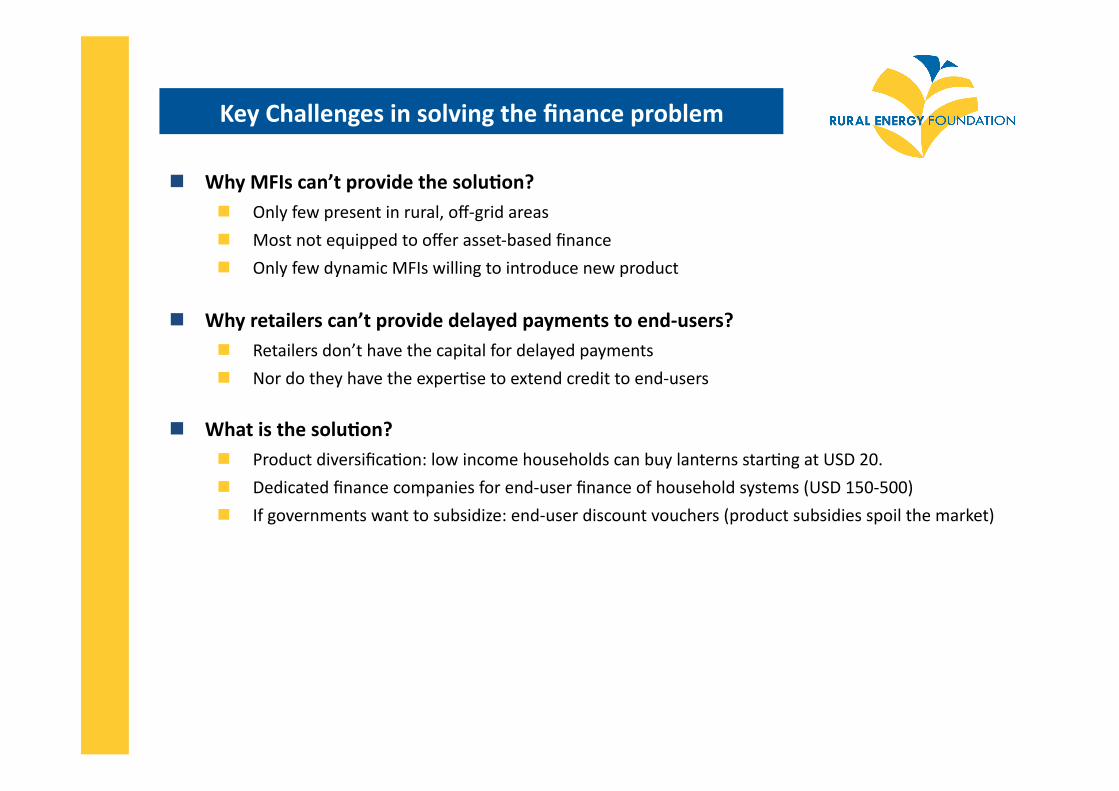
Key Challenges in solving the finance problem
Why MFIs can’t provide the solu'on? Only few present in rural, off-‐grid areas
Most not equipped to offer asset-‐based finance
Only few dynamic MFIs willing to introduce new product
Why retailers can’t provide delayed payments to end-‐users? Retailers don’t have the capital for delayed payments
Nor do they have the experAse to extend credit to end-‐users
What is the solu'on? Product diversificaAon: low income households can buy lanterns starAng at USD 20.
Dedicated finance companies for end-‐user finance of household systems (USD 150-‐500)
If governments want to subsidize: end-‐user discount vouchers (product subsidies spoil the market)
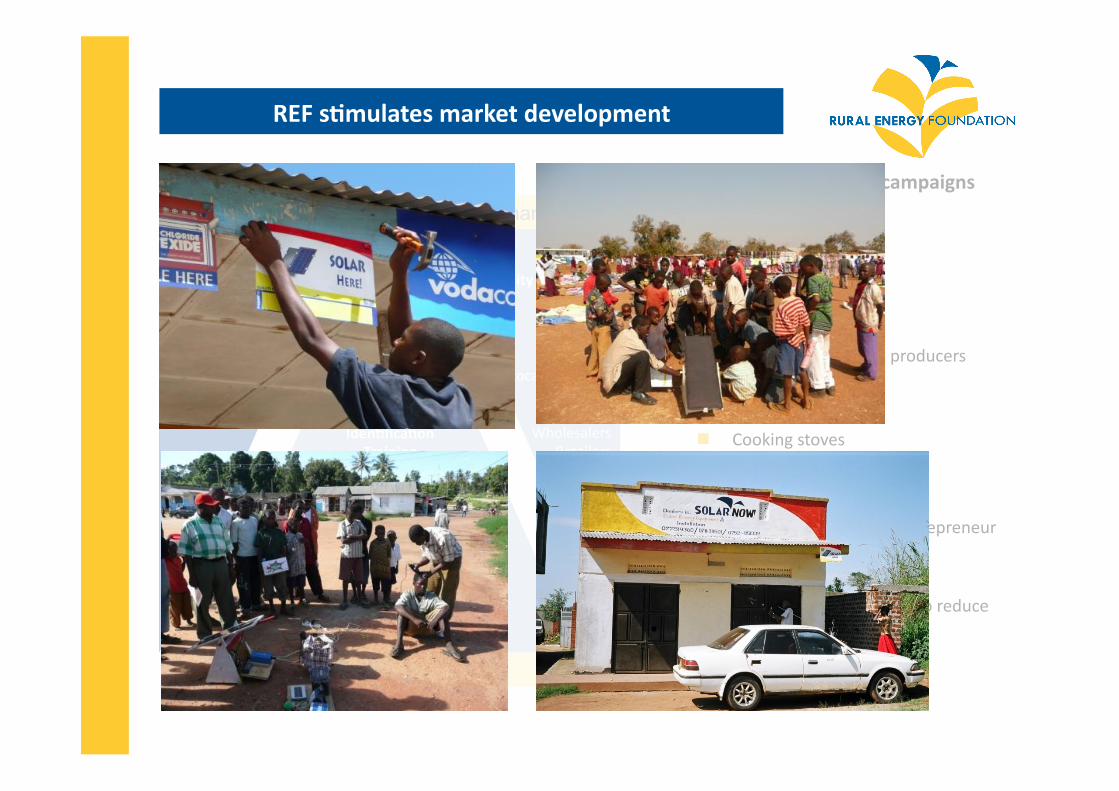
REF s'mulates market development
Iden'fica'on Training Coaching
Marke'ng support
Of Local producers,
Importers, Distributors, Wholesalers,
Retailers and SBAs
Capacity Building
Finance
Equity investment Guarantees
Loans
To Local producers
Importers Distributors Wholesalers
Retailers End-‐users
SBAs
Market Facilitation
Awareness campaigns Product innova'on Exchange website Product reviews Associa'ons Cer'fica'on NewsleWers Regula'on Trade fairs
Large-‐scale marke'ng campaigns Radio adds
Billboards
Bio gas
Product Innova'on REF cooperates with producers
Solar mini-‐kits
Pico-‐hydro systems
Cooking stoves
Other ac'vi'es REF established solar entrepreneur
associaAons
Quarterly newslemers
Pressurize governments to reduce import duAes
Organize trade fairs
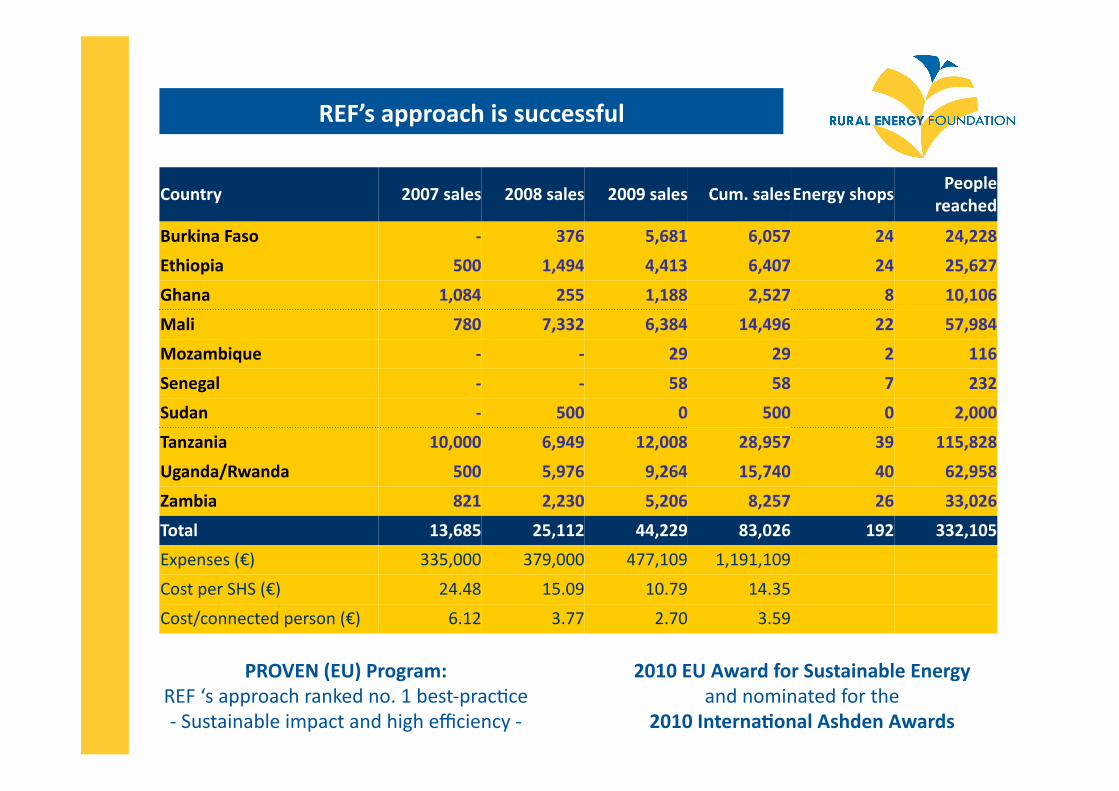
REF’s approach is successful
PROVEN (EU) Program: REF ‘s approach ranked no. 1 best-‐pracAce -‐ Sustainable impact and high efficiency -‐
2010 EU Award for Sustainable Energy and nominated for the
2010 Interna'onal Ashden Awards
Country 2007 sales 2008 sales 2009 sales Cum. sales Energy shops People reached
Burkina Faso -‐ 376 5,681 6,057 24 24,228
Ethiopia 500 1,494 4,413 6,407 24 25,627
Ghana 1,084 255 1,188 2,527 8 10,106
Mali 780 7,332 6,384 14,496 22 57,984
Mozambique -‐ -‐ 29 29 2 116
Senegal -‐ -‐ 58 58 7 232
Sudan -‐ 500 0 500 0 2,000
Tanzania 10,000 6,949 12,008 28,957 39 115,828
Uganda/Rwanda 500 5,976 9,264 15,740 40 62,958
Zambia 821 2,230 5,206 8,257 26 33,026
Total 13,685 25,112 44,229 83,026 192 332,105
Expenses (€) 335,000 379,000 477,109 1,191,109
Cost per SHS (€) 24.48 15.09 10.79 14.35
Cost/connected person (€) 6.12 3.77 2.70 3.59
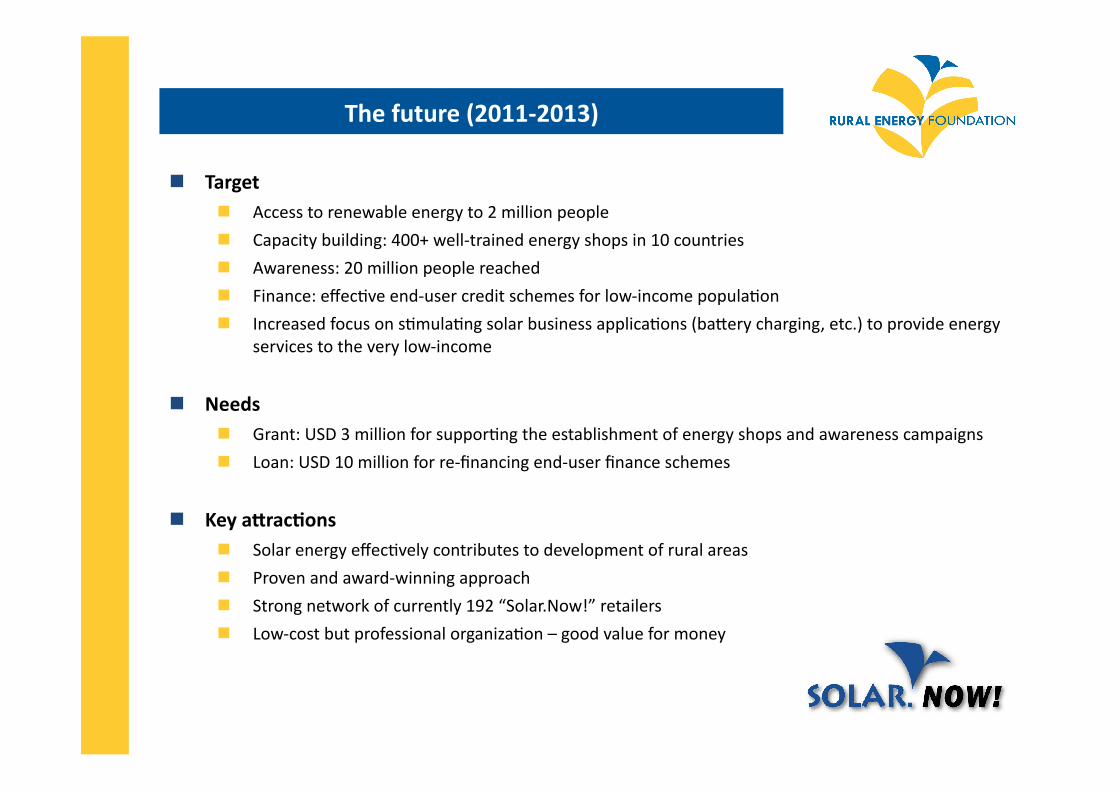
The future (2011-‐2013)
Target Access to renewable energy to 2 million people
Capacity building: 400+ well-‐trained energy shops in 10 countries
Awareness: 20 million people reached
Finance: effecAve end-‐user credit schemes for low-‐income populaAon
Increased focus on sAmulaAng solar business applicaAons (bamery charging, etc.) to provide energy services to the very low-‐income
Needs Grant: USD 3 million for supporAng the establishment of energy shops and awareness campaigns
Loan: USD 10 million for re-‐financing end-‐user finance schemes
Key aWrac'ons Solar energy effecAvely contributes to development of rural areas
Proven and award-‐winning approach
Strong network of currently 192 “Solar.Now!” retailers
Low-‐cost but professional organizaAon – good value for money

Contact
PO Box 1307
6501 BH Nijmegen
The Netherlands
+31 626 696 693
+31 613 114 681
www.ruralenergy.nl
Mariam Salum Tanzania
Ronald Schuurhuizen Uganda
Godwin Msigwa Tanzania
Luc Severi Mozambique
Tewodros Worku Ethiopia
Miep Sellmeijer Uganda
Ashenafi Woldu Ethiopia
Chris Mulindwa Uganda
Willem Nolens Netherlands
Modibo Kante Mali
Julius Magala Uganda
Suzgo Mhango Zambia
Frank Aggrey Ghana
Ibrahima Diarra Mali
MarAn van Dam Burkina
Karin Wilms Mali
Eric Coulibaly Burkina
Enock Chomba Zambia
Peter Huisman Tanzania
Jasmien Bronckaers Senegal
Constant Sié Kansé Burkina
Laurens Friso Ethiopia
William Ssegirinya Uganda
Jean Claude Ouedraogo Burkina Faso
Dirkpieter Idzenga Zambia
Sandra Bos Mozambique
Evert Bos Tanzania
Aloysius Kenkeni Anyiam Ghana
Issa Kone Mali
Ababacar Ndiaye Senegal
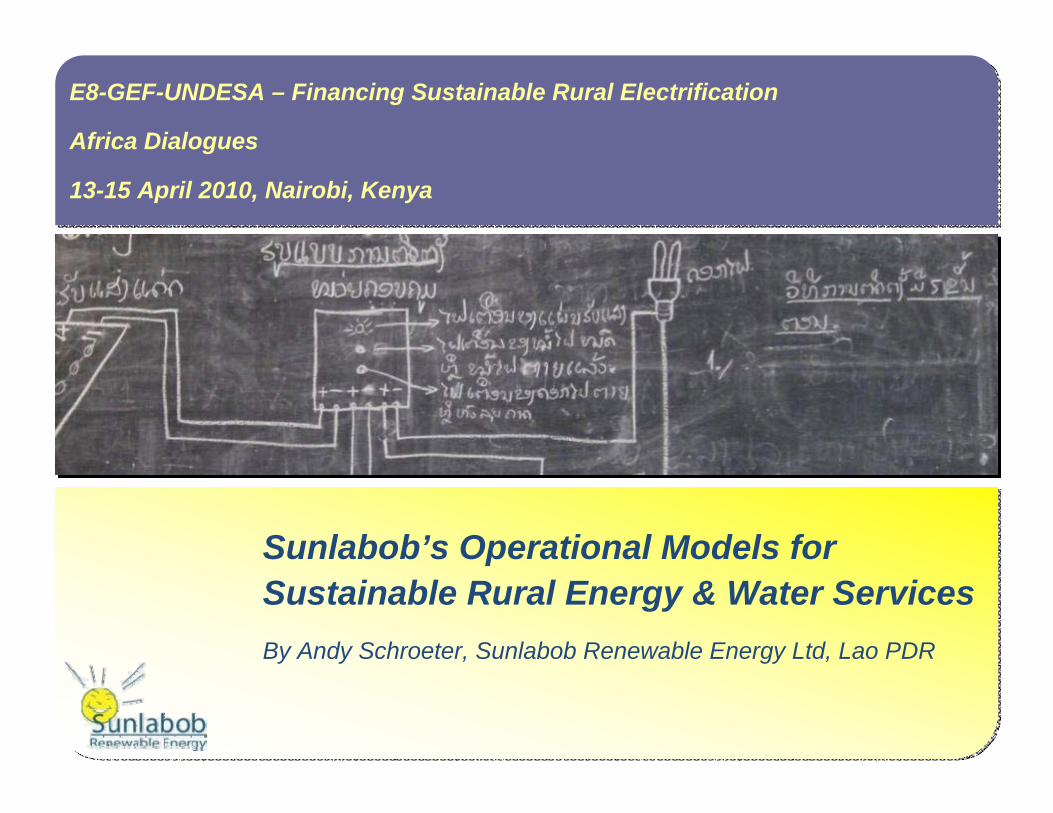
Sunlabob’s Operational Models for Sustainable Rural Energy & Water ServicesBy Andy Schroeter, Sunlabob Renewable Energy Ltd, Lao PDR
E8-GEF-UNDESA – Financing Sustainable Rural Electrification
Africa Dialogues
13-15 April 2010, Nairobi, Kenya
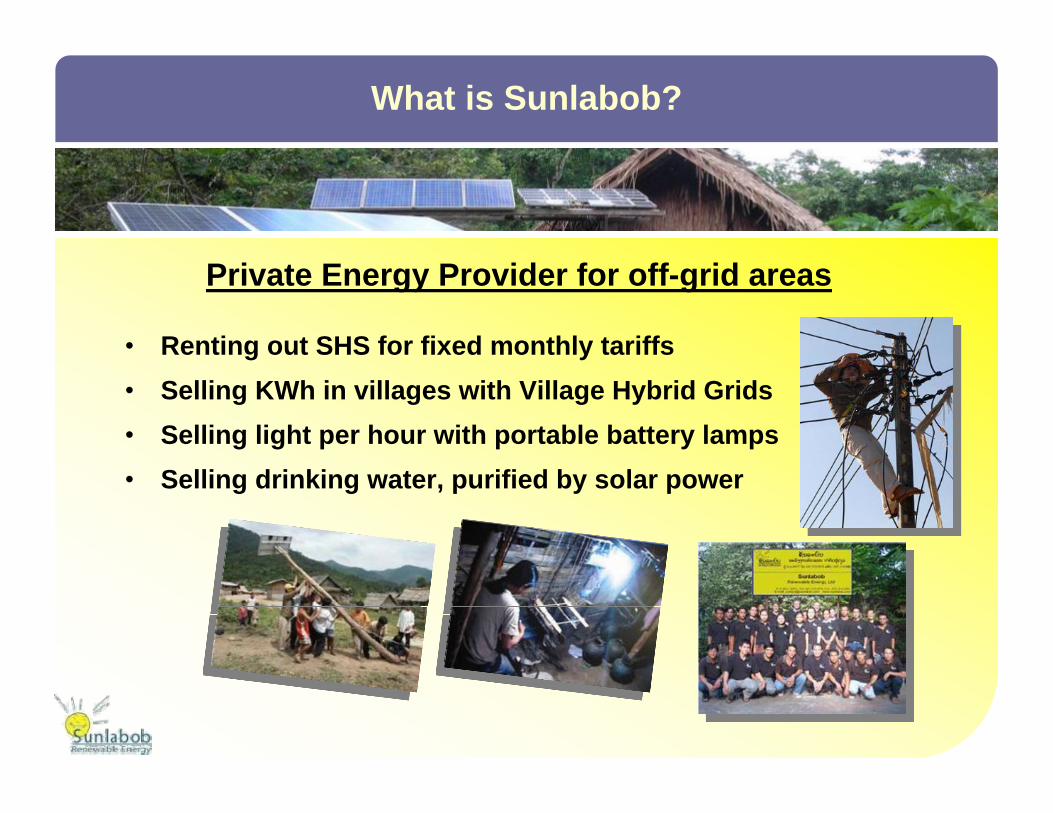
What is Sunlabob?
Private Energy Provider for off-grid areas
• Renting out SHS for fixed monthly tariffs• Selling KWh in villages with Village Hybrid Grids• Selling light per hour with portable battery lamps• Selling drinking water, purified by solar power
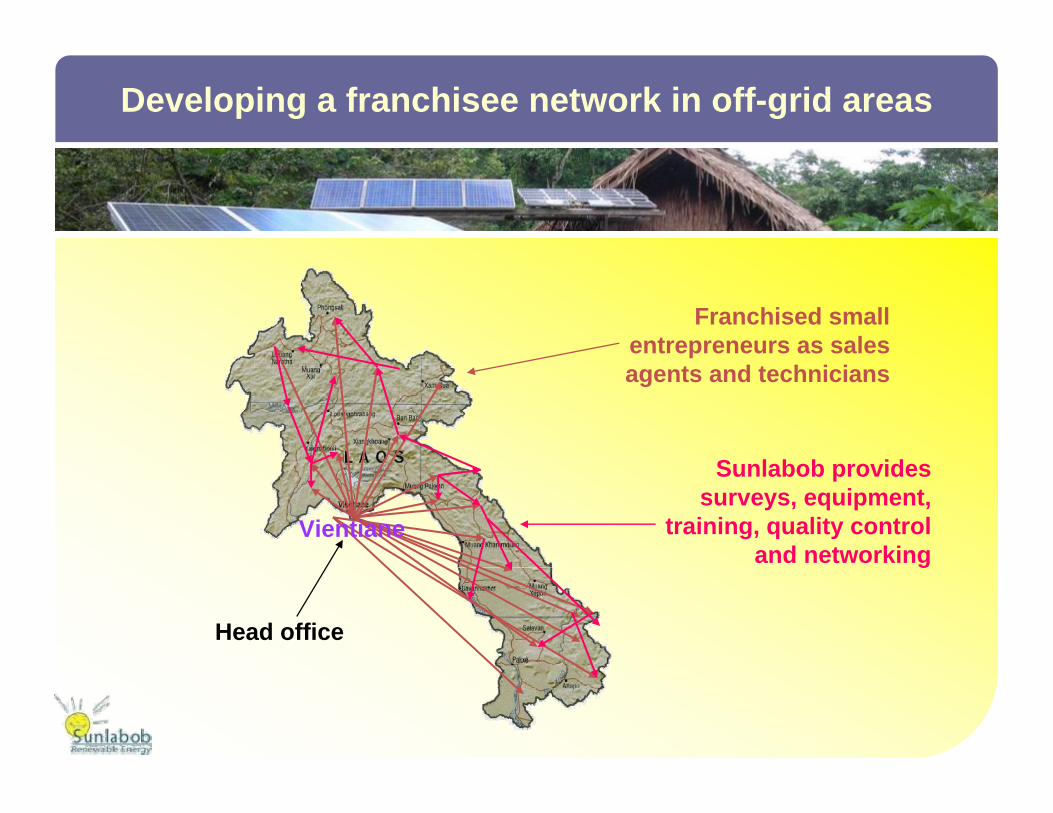
Head office
Franchised small entrepreneurs as sales agents and technicians
Sunlabob provides surveys, equipment,
training, quality control and networking
Vientiane
Developing a franchisee network in off-grid areas
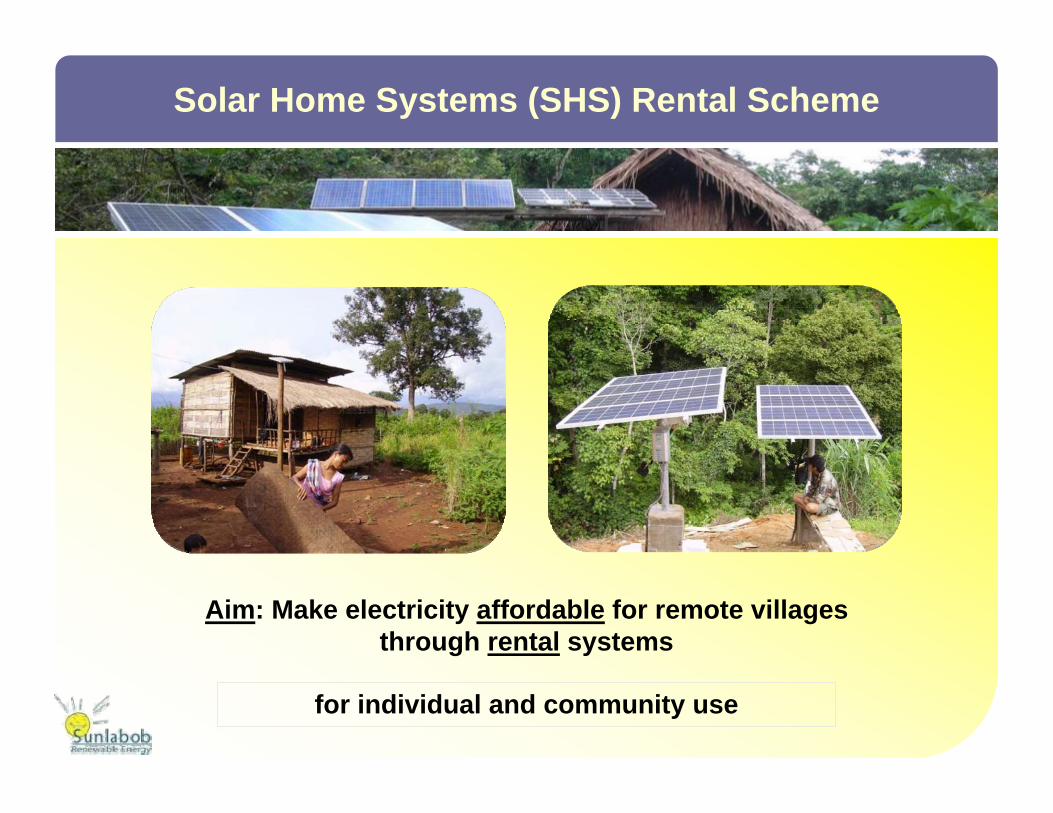
for individual and community use
Aim: Make electricity affordable for remote villages through rental systems
Solar Home Systems (SHS) Rental Scheme
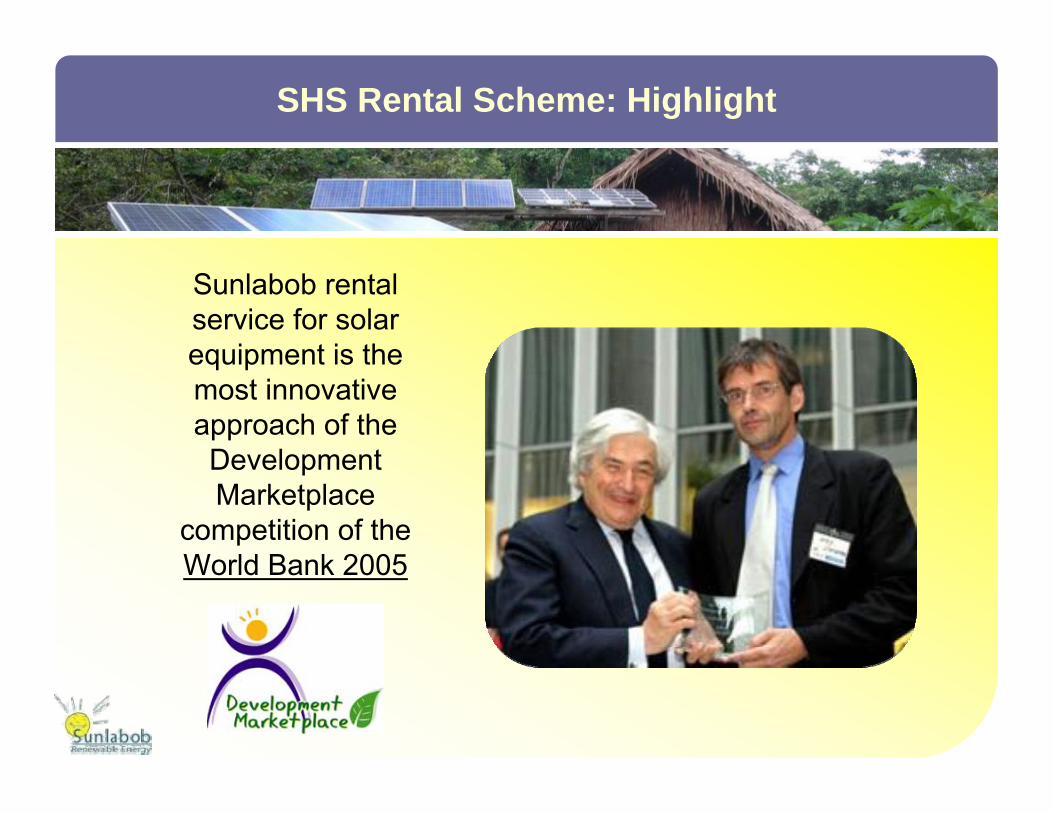
Sunlabob rental service for solar equipment is the most innovative approach of the Development Marketplace
competition of the World Bank 2005
SHS Rental Scheme: Highlight
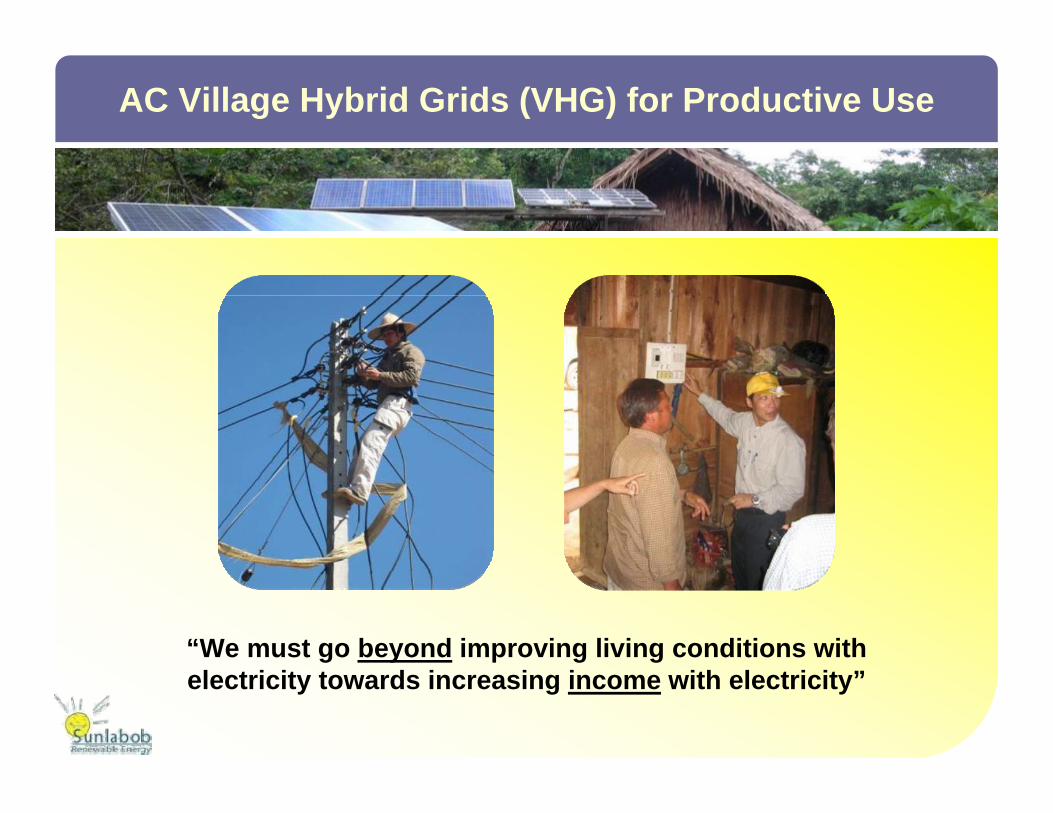
“We must go beyond improving living conditions with electricity towards increasing income with electricity”
AC Village Hybrid Grids (VHG) for Productive Use

Village Electrificationwith Hybrid
System
Private Public
Partnership
Moveable assets
Fixed assets
Trust-Fund
Eco-Fund
Private Energy Provider (PEP)
Operate Hybrid Generation
Pico/Micro Hydro
Solar Generator
Bio-fuel Genset
Remote Village
With Grid
Sell AC KWh
Public-Private Partnership (PPP) for Remote VHG
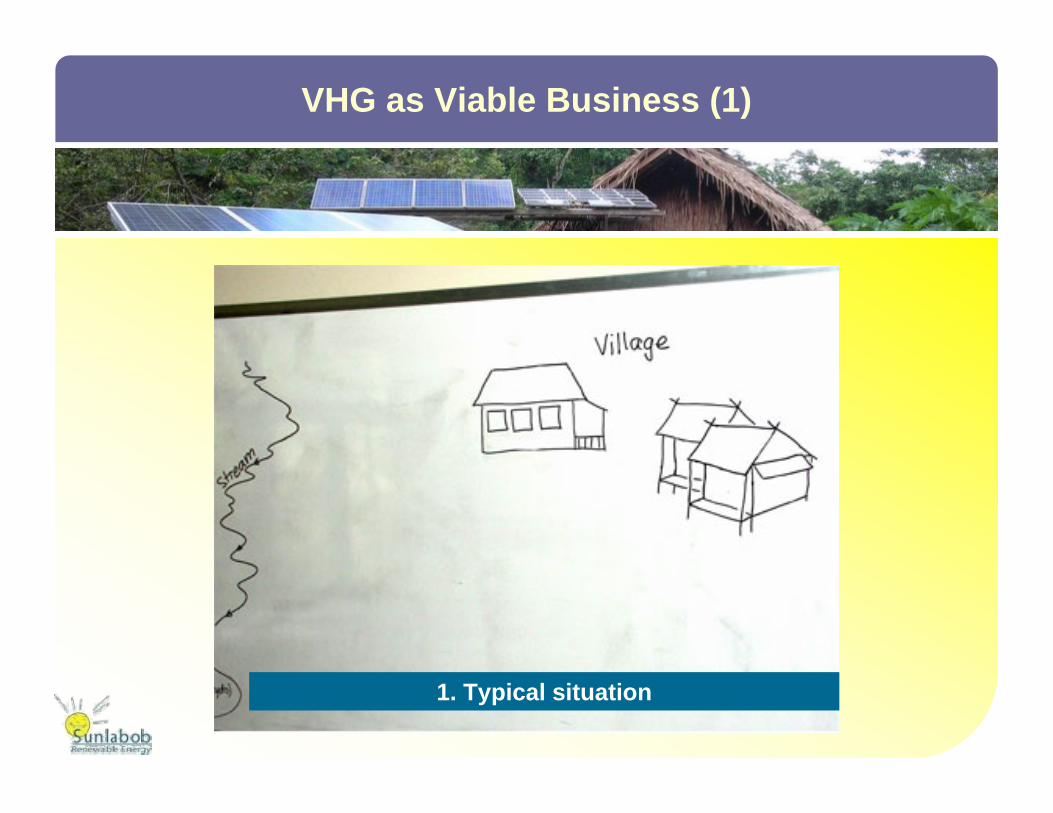
1. Typical situation
VHG as Viable Business (1)

2. Public-Private cooperation for hydro
VHG as Viable Business (2)
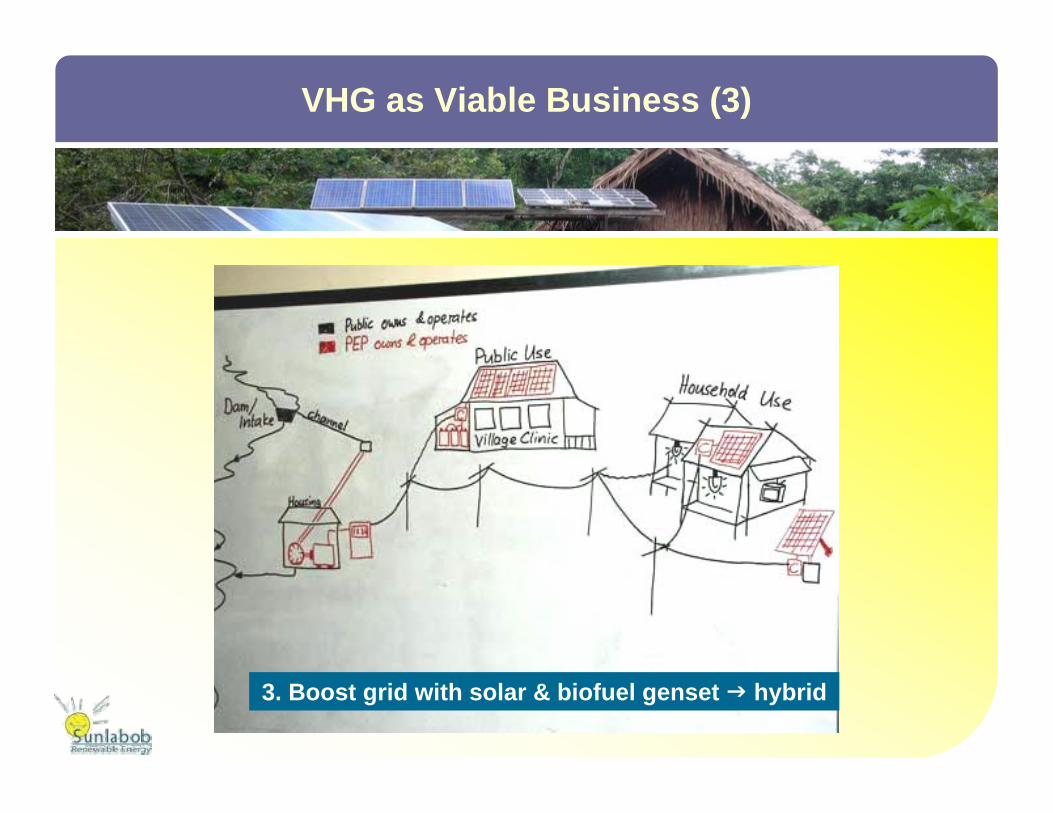
3. Boost grid with solar & biofuel genset hybrid
VHG as Viable Business (3)
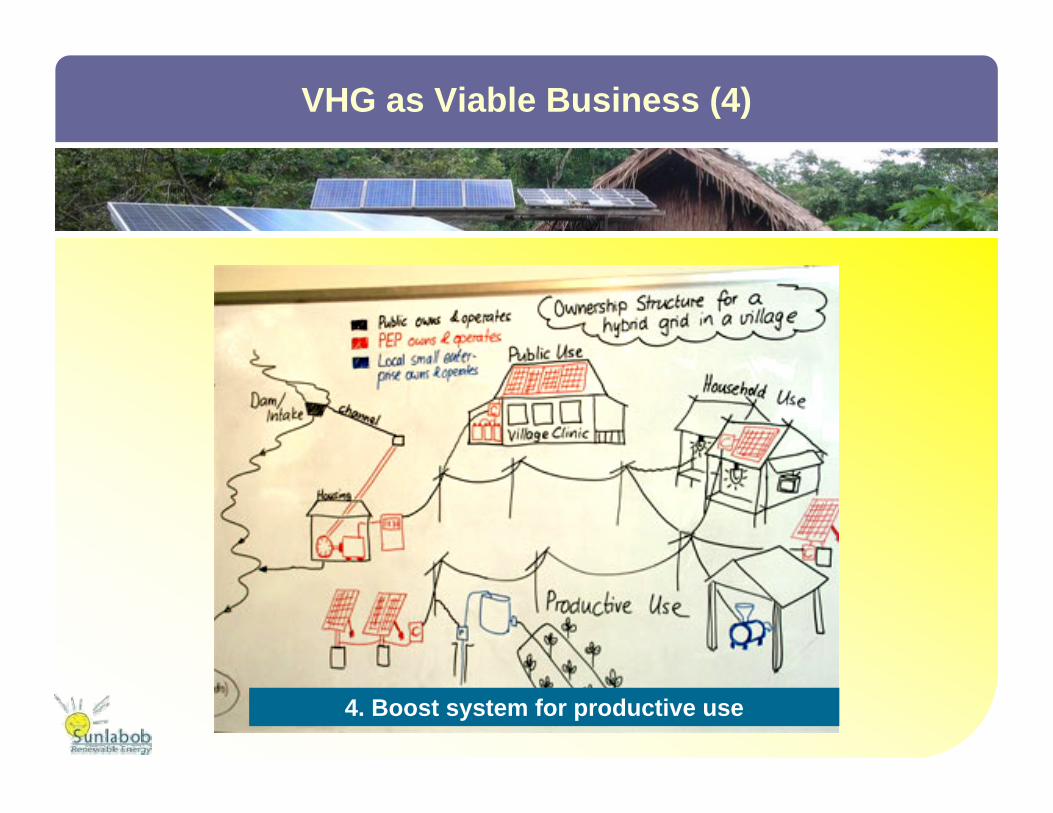
4. Boost system for productive use
VHG as Viable Business (4)
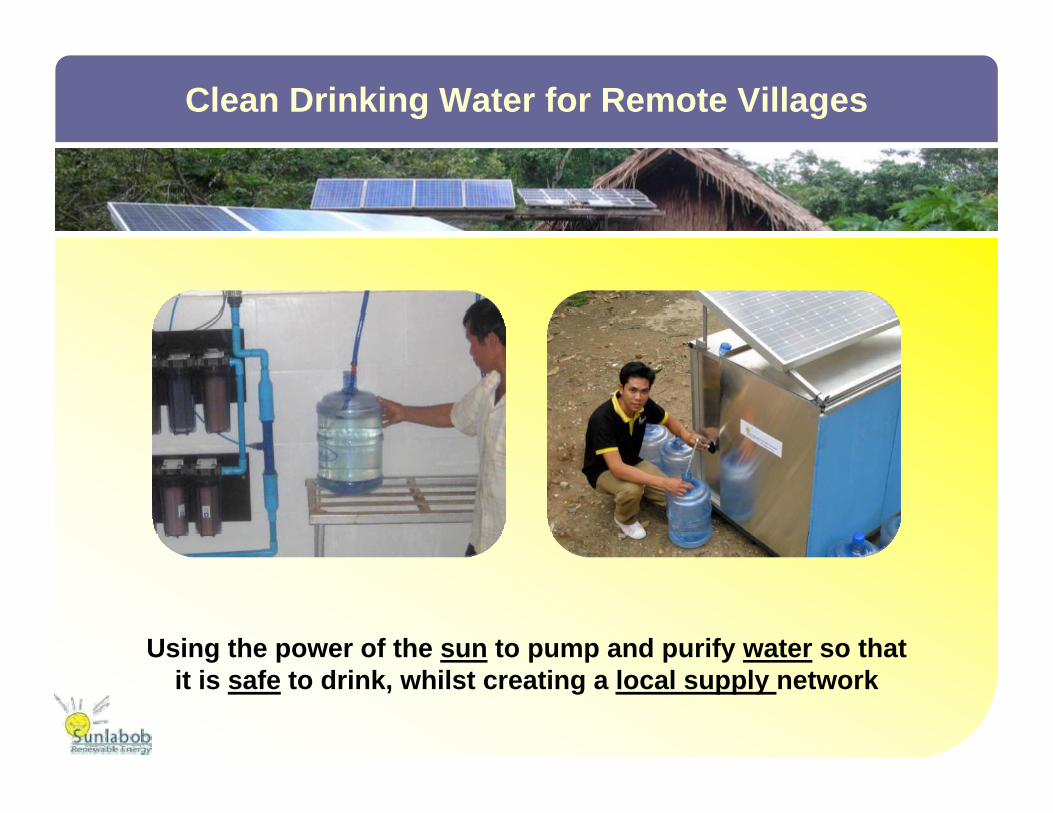
Clean Drinking Water for Remote Villages
Using the power of the sun to pump and purify water so that it is safe to drink, whilst creating a local supply network
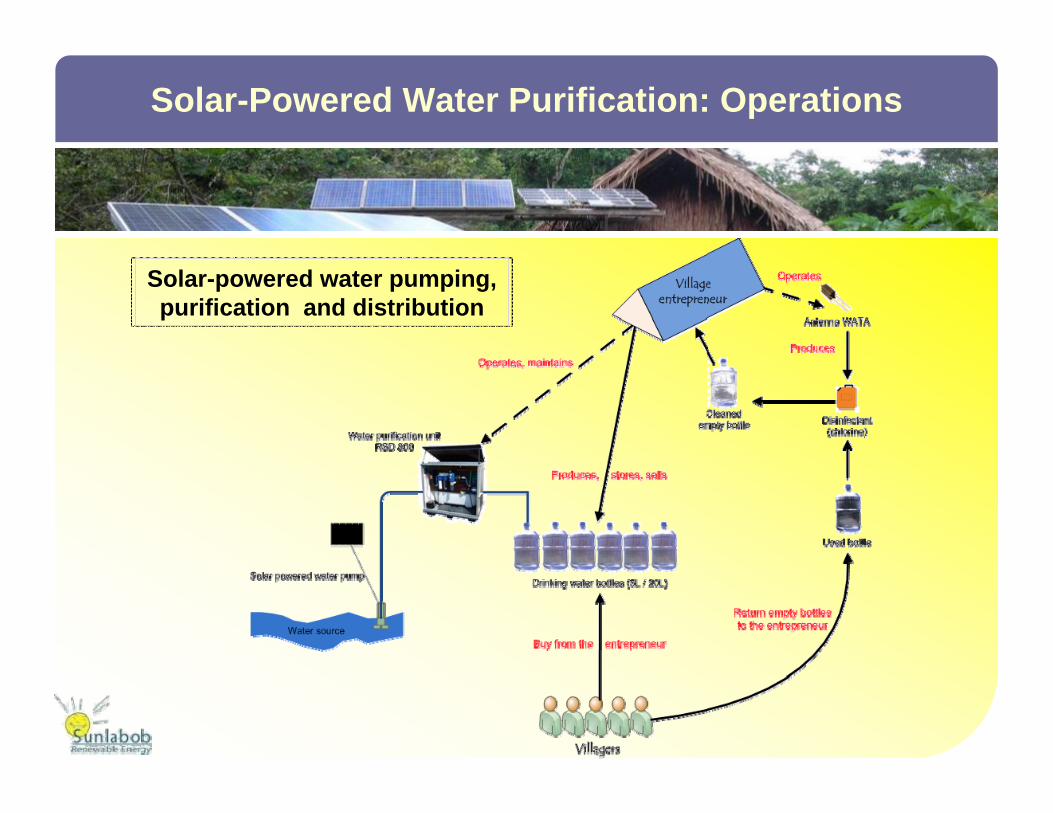
Solar-Powered Water Purification: Operations
Solar-powered water pumping, purification and distribution
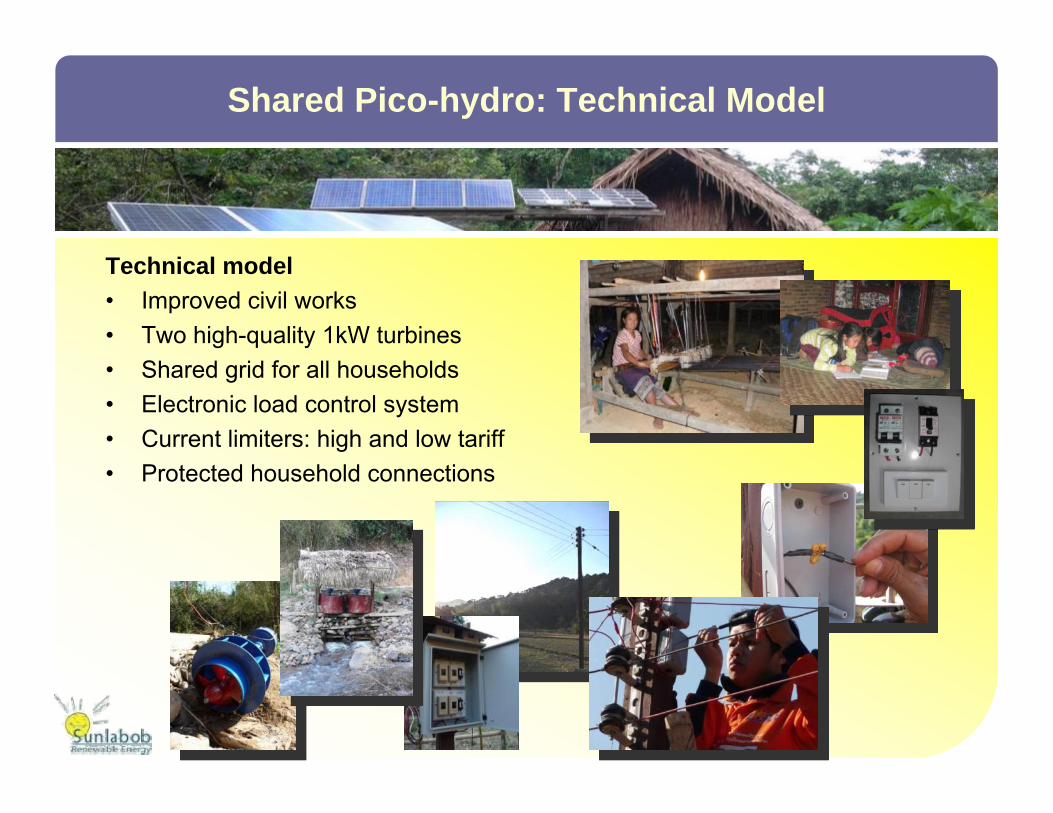
Technical model• Improved civil works• Two high-quality 1kW turbines• Shared grid for all households• Electronic load control system• Current limiters: high and low tariff• Protected household connections
Shared Pico-hydro: Technical Model
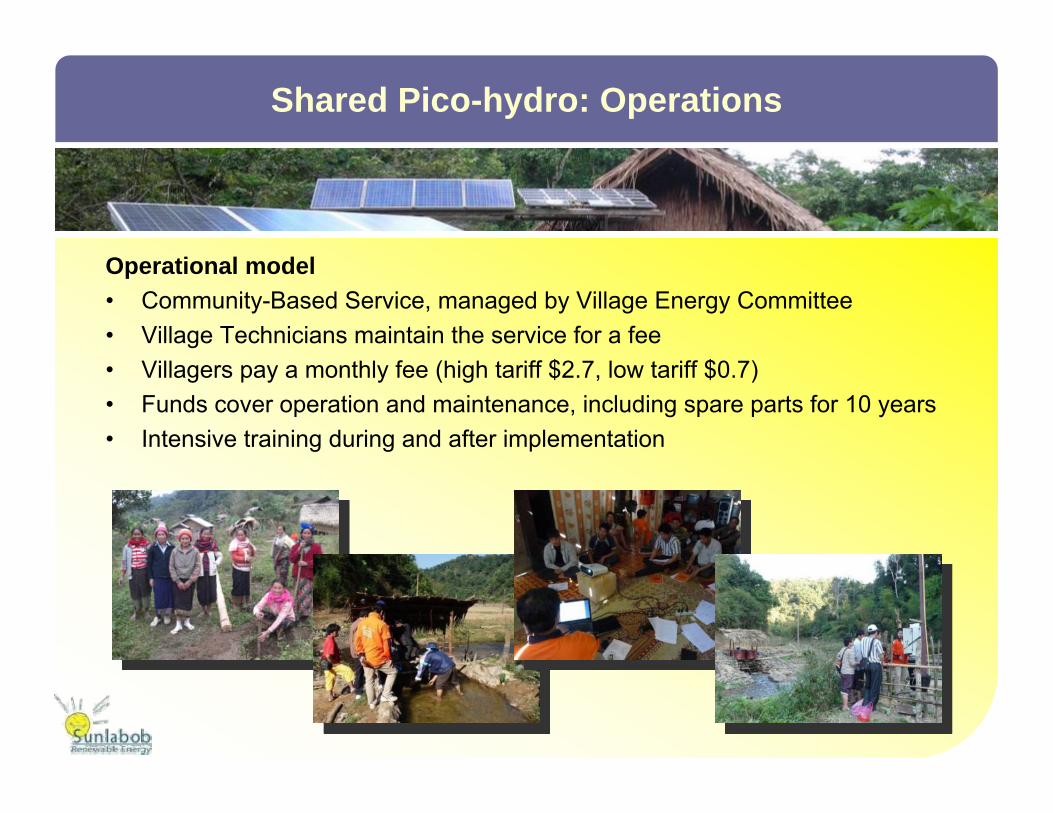
Operational model• Community-Based Service, managed by Village Energy Committee• Village Technicians maintain the service for a fee• Villagers pay a monthly fee (high tariff $2.7, low tariff $0.7)• Funds cover operation and maintenance, including spare parts for 10 years• Intensive training during and after implementation
Shared Pico-hydro: Operations
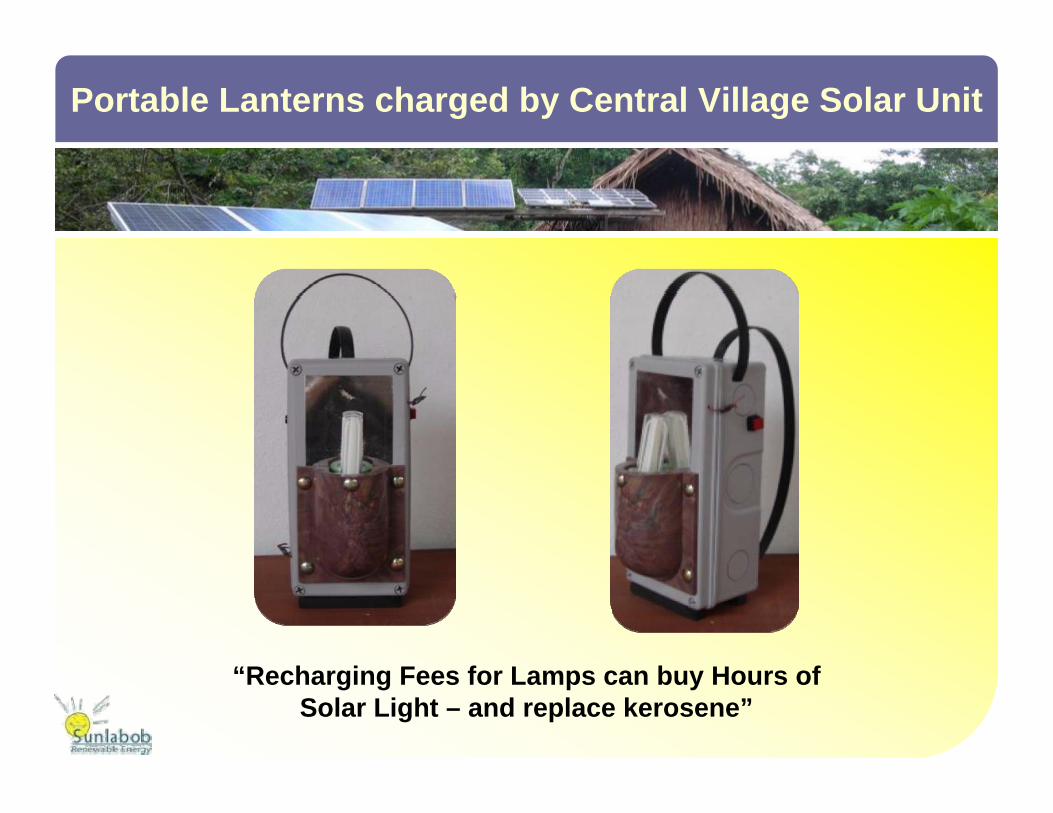
“Recharging Fees for Lamps can buy Hours of Solar Light – and replace kerosene”
Portable Lanterns charged by Central Village Solar Unit

Project Overview
Solar Lantern Rental System (SLRS)
• Benefits: • Reliable and cost-saving alternative to kerosene lamps: improved health (smoke reduction), cheaper than kerosene, saving fossil fuels, brighter lighting, safety• Central charging with guaranteed operating hours• Automated data collection allows for carbon accountability and entering the carbon markets
• Target beneficiaries:• Poorest off-grid households living in districts identified as poor & in areas where no grid extension is pending
• end-users• village entrepreneurs and energy committees
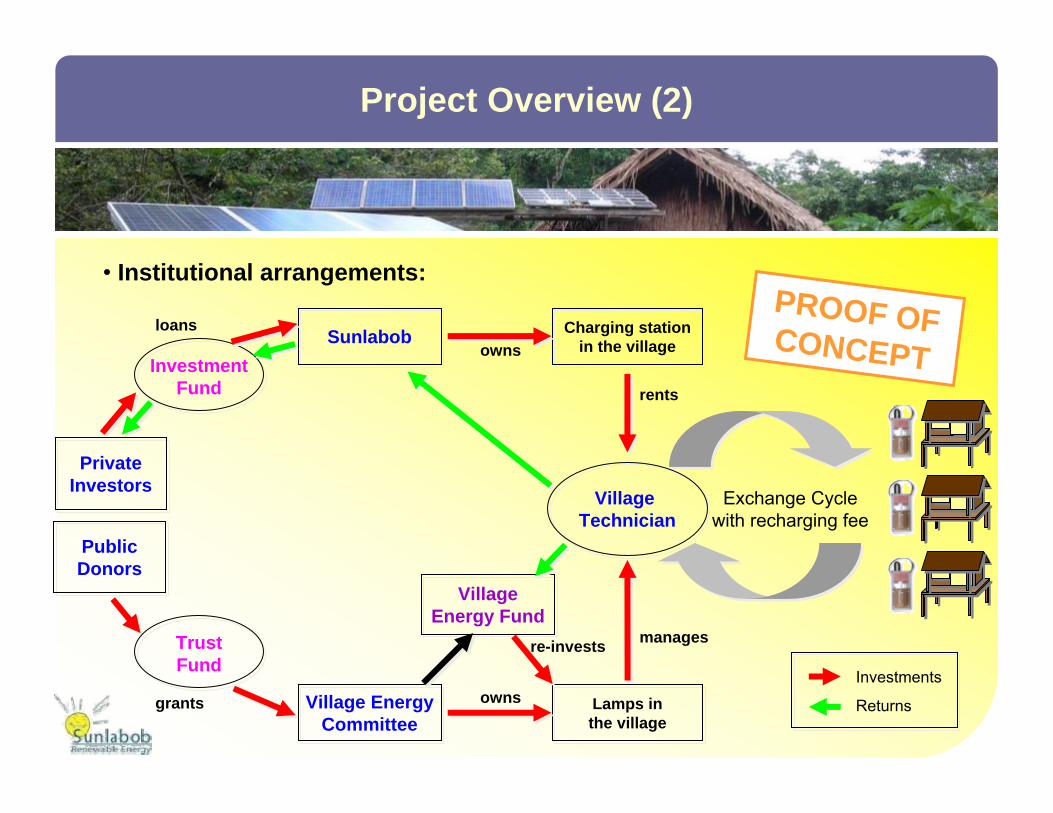
Project Overview (2)
• Institutional arrangements:
Exchange Cycle with recharging fee
Village Technician
Investments
ReturnsVillage Energy Committee
owns
manages
Charging station in the villageowns
rents
Lamps in the village
Sunlabob
Village Energy Fund
re-invests
Investment Fund
loans
Private Investors
grants
Public Donors
Trust Fund
PROOF OF CONCEPT
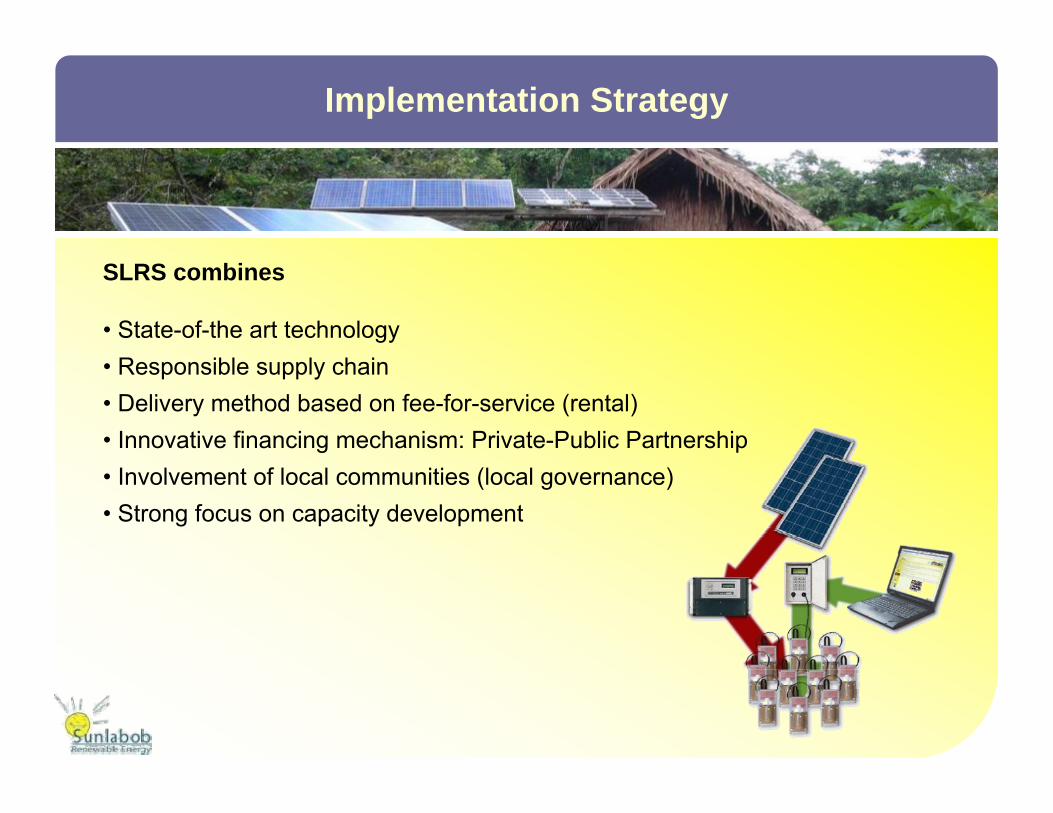
Implementation Strategy
SLRS combines
• State-of-the art technology• Responsible supply chain• Delivery method based on fee-for-service (rental)• Innovative financing mechanism: Private-Public Partnership• Involvement of local communities (local governance)• Strong focus on capacity development
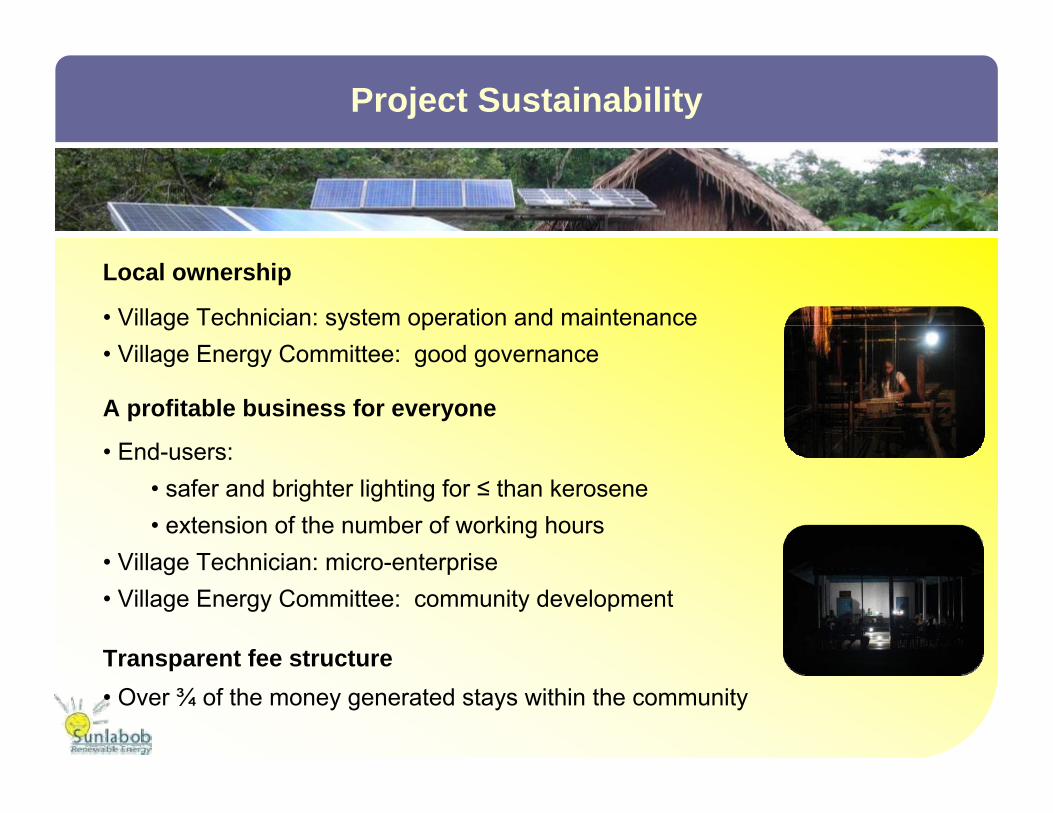
Project Sustainability
Local ownership
• Village Technician: system operation and maintenance• Village Energy Committee: good governance
A profitable business for everyone
• End-users: • safer and brighter lighting for ≤ than kerosene• extension of the number of working hours
• Village Technician: micro-enterprise• Village Energy Committee: community development
Transparent fee structure• Over ¾ of the money generated stays within the community
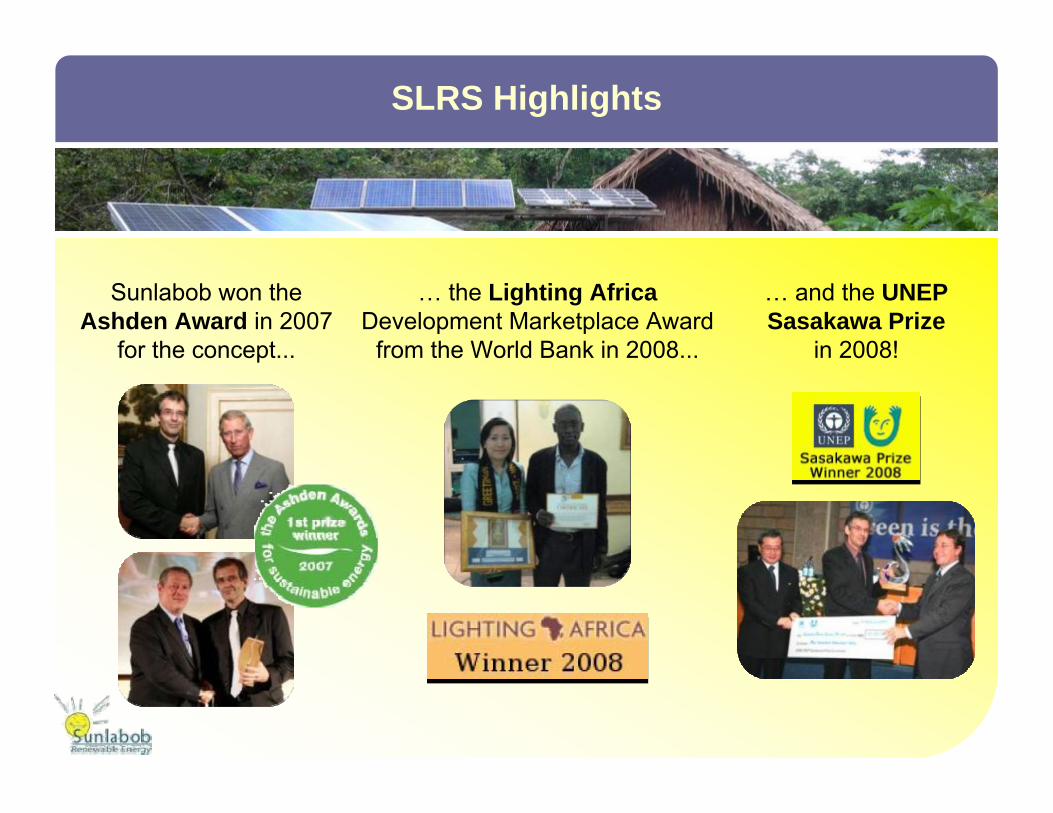
SLRS Highlights
Sunlabob won the Ashden Award in 2007
for the concept...
… the Lighting Africa Development Marketplace Award
from the World Bank in 2008...
… and the UNEP Sasakawa Prize
in 2008!
Sunlabob Renewable Energy Ltd PO Box 9077, Vientiane, Lao PDR - Tel: (+856 21) 313874 - Fax: (+856 21) 314045 [email protected] www.sunlabob.com
Thank you for your attention!
E8-GEF-UNDESA – Financing Sustainable Rural Electrification
Africa Dialogues
13-15 April 2010, Nairobi, Kenya
Small scale electricity generation in rural East Africa:
Challenges of implementation,with concrete examples from Tanzania
(Building on presentation by Sunlabob on solar charging stations and village micro-hydro grids)

How to install it....
.... AND HOW TO KEEP IT OPERATING
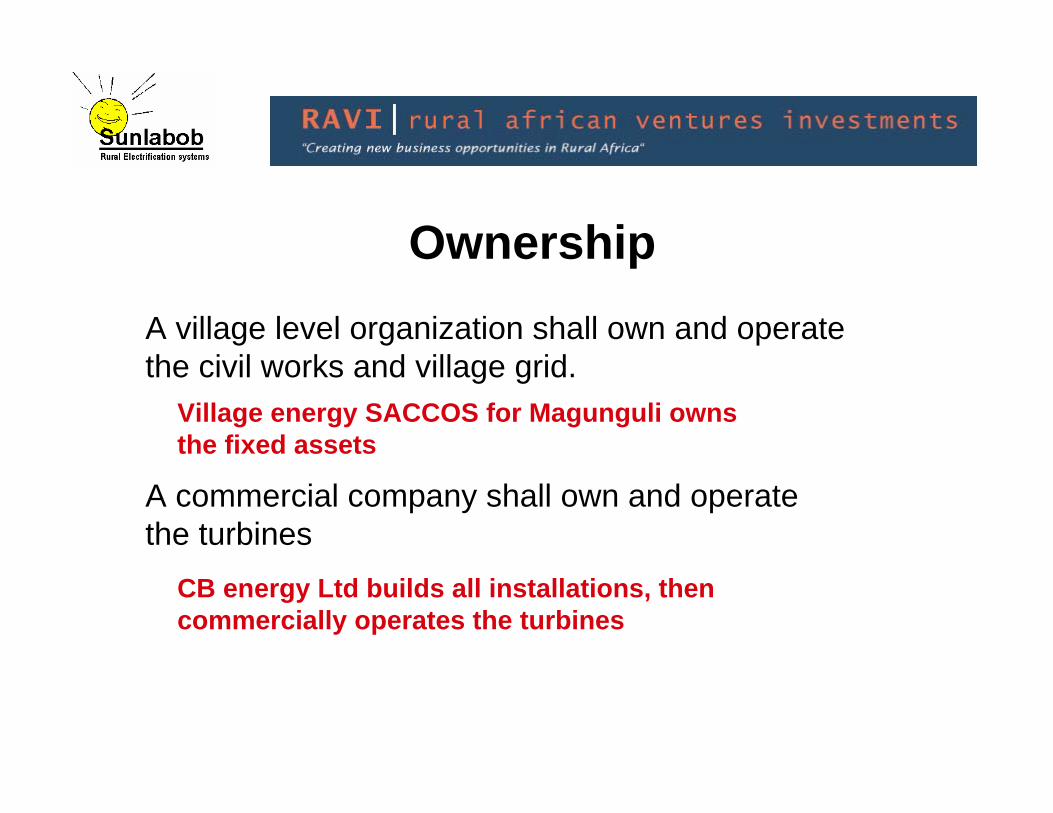
OwnershipA village level organization shall own and operate the civil works and village grid.
A commercial company shall own and operate the turbines
Village energy SACCOS for Magunguli owns the fixed assets
CB energy Ltd builds all installations, then commercially operates the turbines

Role of local governmentLocal government must ensure that - there will be no conflicts of interest on the use of water, and - ensure installation safety standards. District council to approve sites for larger turbines
District council funding for village grids of larger turbines, eg. for fixed assets in ownership of village, such as grid, civil works, etc.
Time limits for milestones of installation process, funding according to milestones
Financing – "mutual leverage"There must be mutual leverage of commercial loan funding for generating equipment on the one hand, and (public) grant funding for village assets on the other hand
Pilot a specialized investment fund for organizing both channels
Define milestones for decisions and fund disbursements
Define due diligence procedures for both the (public) grants and the commercial loans

EconomicsSmall village grids do not have the main grid as a load buffer. They are at an economic disadvantage
Villagers (and their politicians) will not understand why a village household should pay more for electricity than the people in town
Decentralized generation of electricity at the “fringe” of the main grid can help to smooth out local voltage fluctuations.

Economics (contd.)Explore whether subsidies are needed to bring down the village kWh to main grid prices. If yes, explore the best procedures that ensure sustainable operations
Technical and operational R&D for village grid load buffering Challenge to the engineering community at large!
Define operational and financial procedures for when the main grid gets connected up with a village grid

Pico installations(solar, hydro, wind..)
These can go down to even minuscule installations of a few hundred Watt. Their load buffering can be through charging of lanterns, laptops, batteries, etcSuggestion: No regulation for installation in water courses
Ensure quality and security through solid training programs for “fundis”, ie. village level technicians.
Rechargeable lanterns are analogous to a village grid, and may be owned by a village energy SACCOS
Training requirementsThere is very little technical capacity in outlying villages forinstallations and operations.
The level of required skill development and training is beyond the capacity that emerging start-up companies in rural electrification can manage on their own. There is a new RURAL opportunity for self-employment and income generation out there: Village level electric technician
There is a new opportunity for learning about village level organization out there: Village energy SACCOS
Training requirements (contd.)
Funding by state, implemented by companies on the ground, with internships, etc...
Training type 1: Village TechnicianTraining courses in vocational training centers, preferably also on-the-job tele-courses.
Practical, aiming for self-employment, also with low level of formal schooling, ie. available for bright and serious rural youths who dropped out of school due to lack of money.
Need for hands-on courses, eg. “Training & Coaching”through the first commercial cycles.
Not only for technology, but also operations and handling money, customer care, etc.
Training requirements (contd.)
Training 2: Village energy SACCOSHow to manage village level SACCOS
Training 3: District Council officersRoles, procedures and operations at District Council level for taking up the role of the public.
All trainings to be piloted first, scaled to available real implementations on the ground for getting the hands-on experiences. Then later scaled up.
Sunlabob-RAVI, now
Also operating with a franchised company in Uganda.
Building partnership with local Tanzanian company.
First implementations with already surveyed village grid installation, and with some pico installationsLooking for funding agencies who are willing to invest in the pilots, for later commercial scaling up. “Pre-commercial funding”
Willing to explore partnerships also in Kenya, and later in other countries
Looking for partnerships with vocational training institutions
Ueli ScheuermeierRural African Ventures InvestmentsA private Ltd company registered in England and Wales No. 650037515 Grafton Road, Worthing, West Sussex BN11 1QR, UKTelephones: Swiss: +41 764 263 879 / Africa: +255 782 603 476Skype: uelischEmails: [email protected] / [email protected]: www.sunlabob.com / www.ravinvest.biz
1 | Corporate Presentation, April 14, 2010
vestas.com
Vestas Wind Systems A/SE8 Nairobi
13 April 2010

“AFRICA NEEDS POWER”…and we’re gonna bring just that!
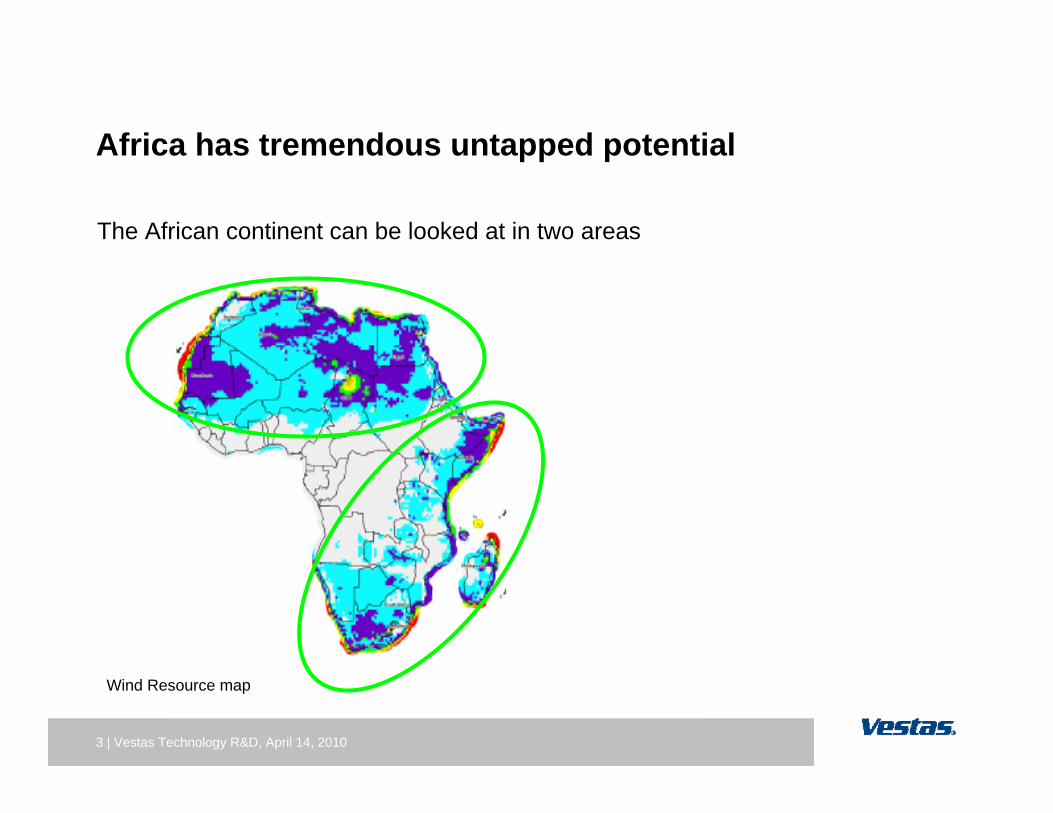
3 | Vestas Technology R&D, April 14, 2010
Wind Resource map
The African continent can be looked at in two areas
Africa has tremendous untapped potential

4 | Full Year 2009, April 14, 2010
Globally Installed Wind Power Capacity 2009
10,872MW
622MW
230MW
10,526MW
14,639MW
Argentina = 2MW
GWEC, 2010
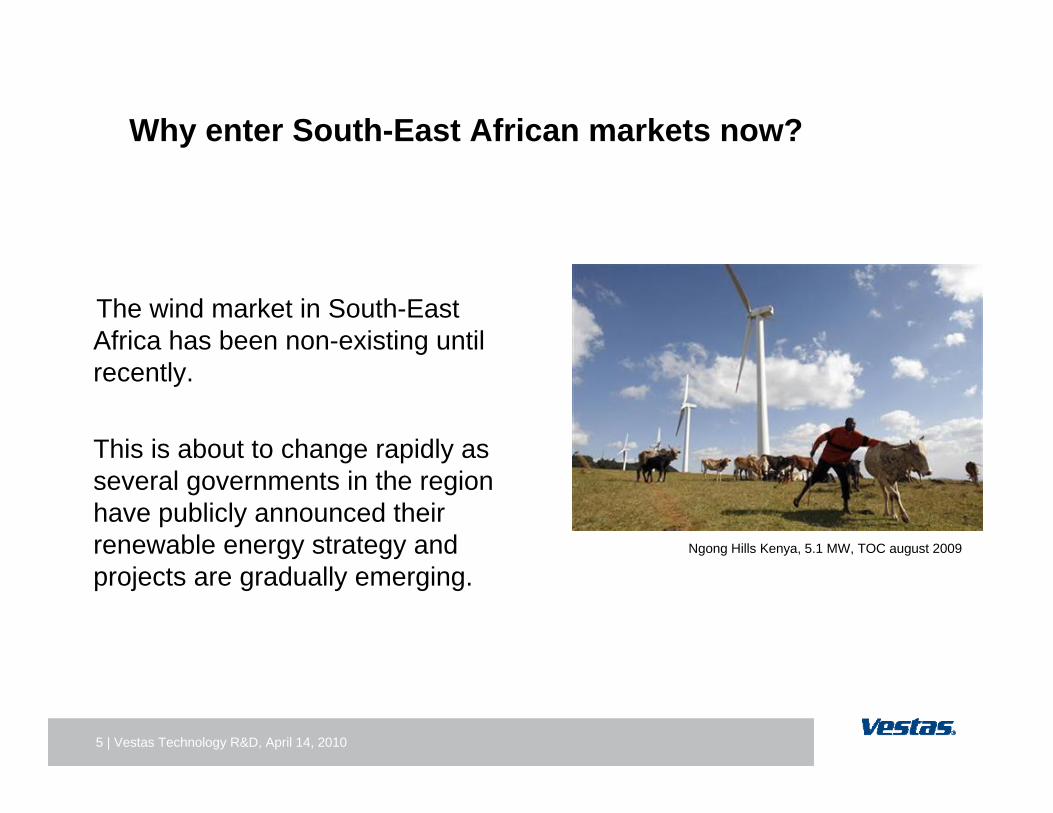
5 | Vestas Technology R&D, April 14, 2010
The wind market in South-East Africa has been non-existing until recently.
This is about to change rapidly as several governments in the region have publicly announced their renewable energy strategy and projects are gradually emerging.
Ngong Hills Kenya, 5.1 MW, TOC august 2009
Why enter South-East African markets now?

6 | Vestas Technology R&D, April 14, 2010
CEU new markets in AfricaVestas Central Europe isresponsible for all greencolored countries:• South Africa• Namibia• Uganda• Botswana• Tanzania• Madagascar• Zambia• Kenya• Rwanda• Burundi• Djibouti• Zimbabwe• Ethiopia• Malawi
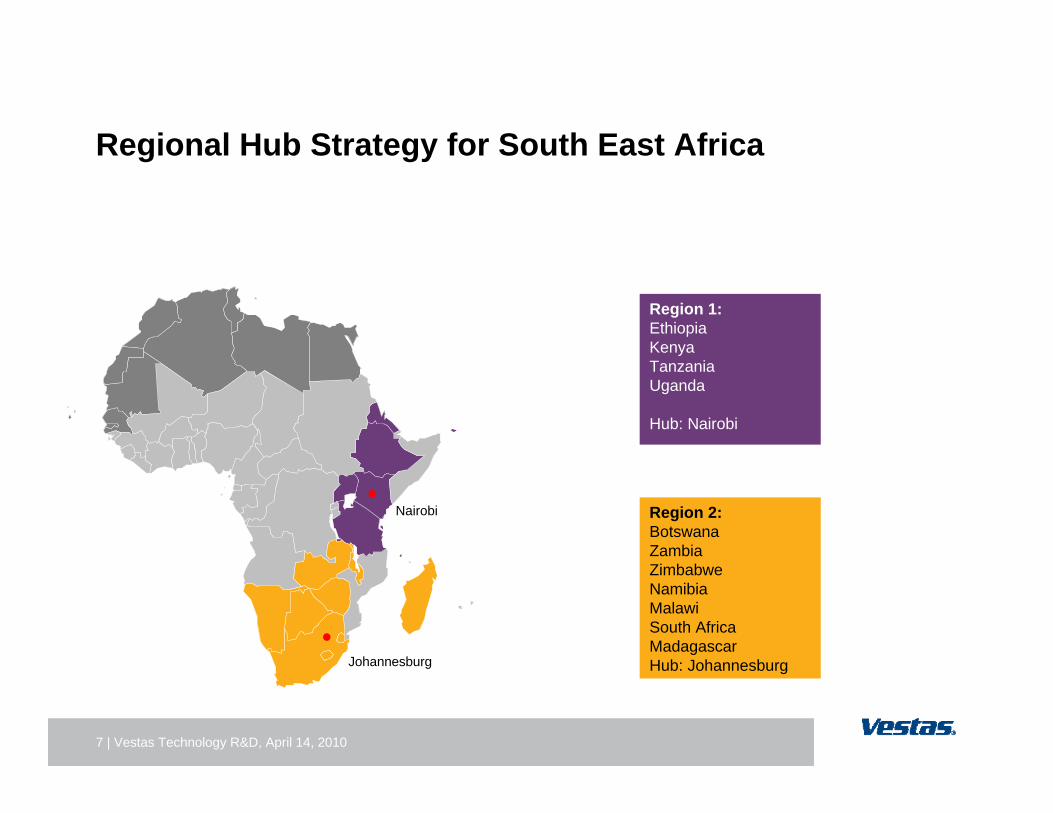
7 | Vestas Technology R&D, April 14, 2010
Regional Hub Strategy for South East Africa
Region 1:EthiopiaKenyaTanzaniaUganda
Hub: Nairobi
Region 2:BotswanaZambiaZimbabweNamibiaMalawiSouth AfricaMadagascarHub: JohannesburgJohannesburg
Nairobi

8 | Vestas Technology R&D, April 14, 2010
Wind, Oil and
Gas
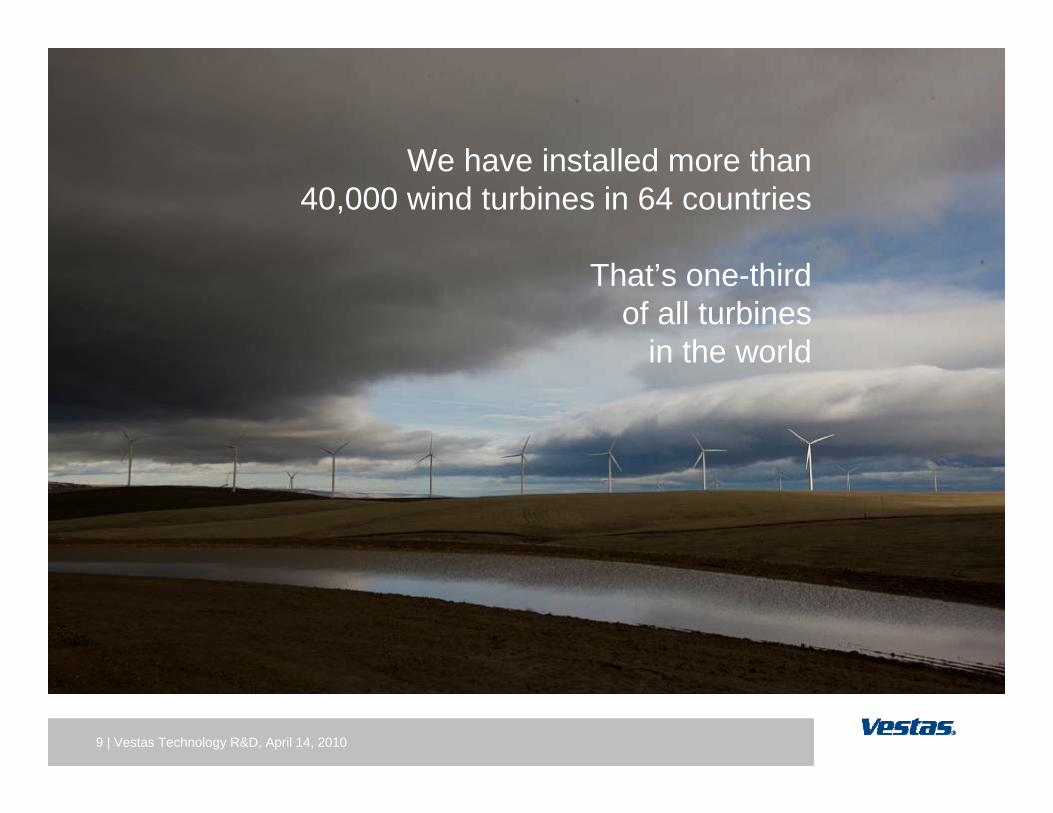
9 | Vestas Technology R&D, April 14, 2010
We have installed more than 40,000 wind turbines in 64 countries
That’s one-third of all turbines
in the world
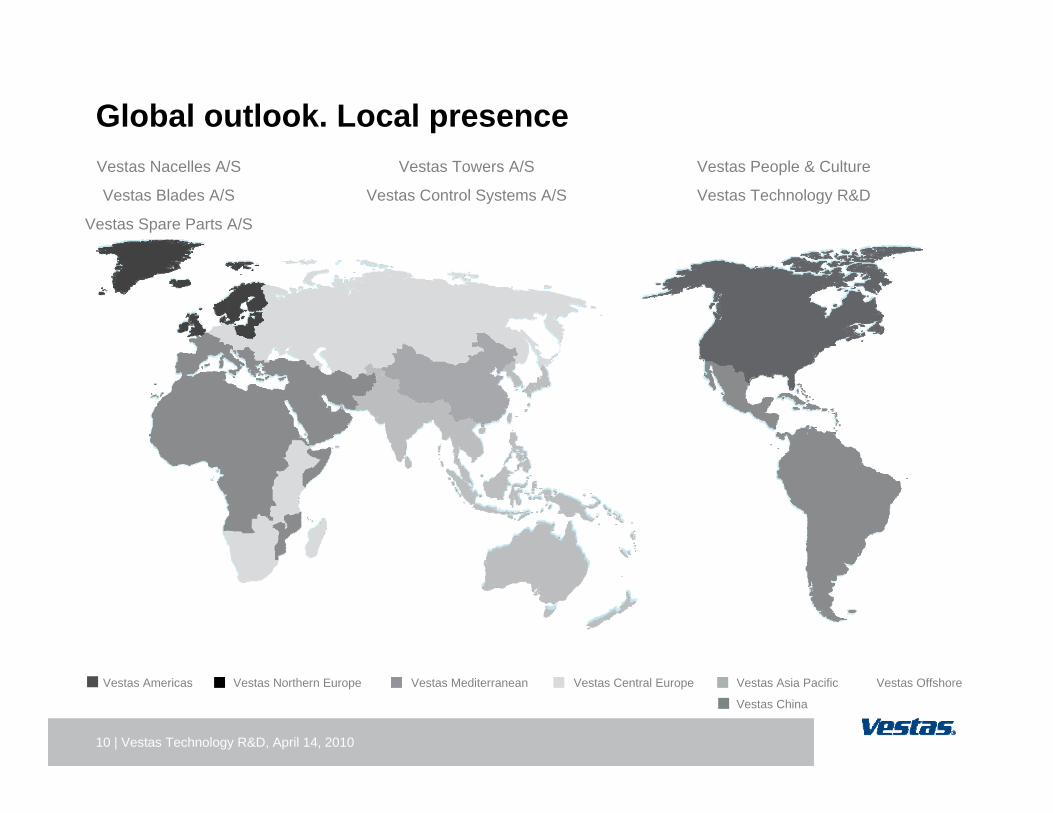
10 | Vestas Technology R&D, April 14, 2010
Vestas Northern Europe Vestas Mediterranean Vestas Central Europe Vestas Asia Pacific
Vestas China
Vestas OffshoreVestas Americas
Vestas Nacelles A/S
Vestas Blades A/S
Vestas Spare Parts A/S
Vestas Towers A/S
Vestas Control Systems A/S
Vestas People & Culture
Vestas Technology R&D
Global outlook. Local presence
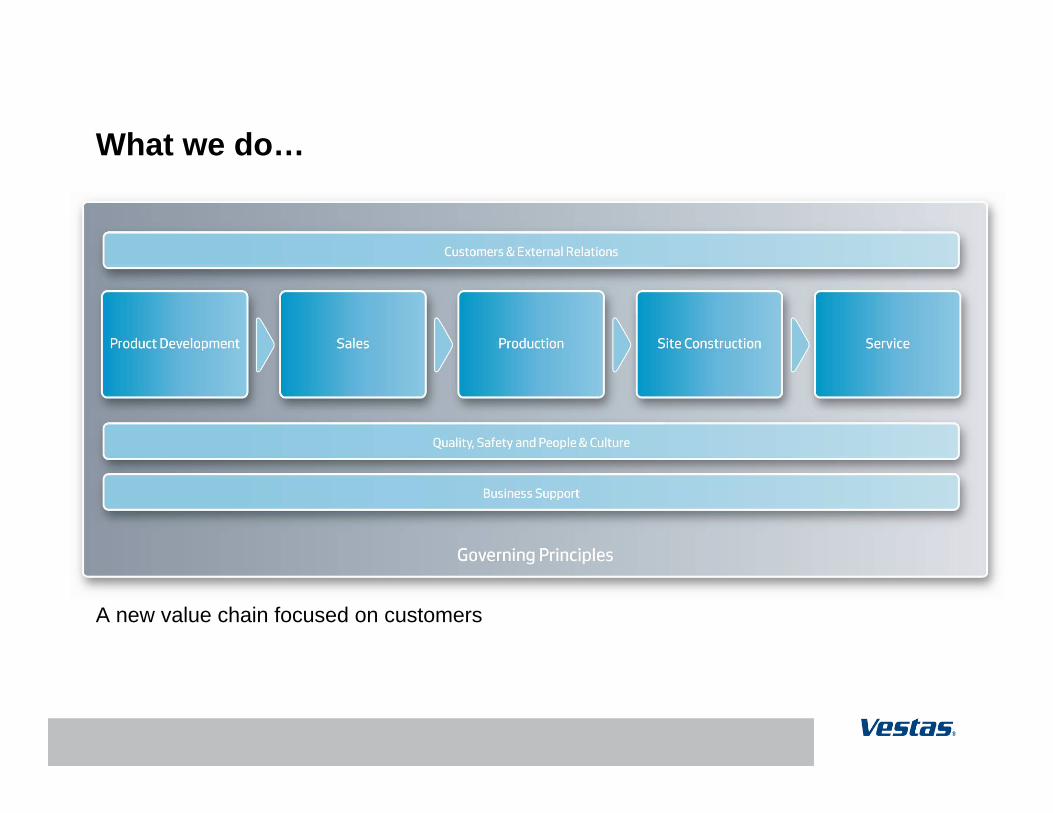
What we do…
A new value chain focused on customers

12 | Third quarter 2009, 27 October 2009
Vestas’ Turbine Range
Constantly improving efficiency on platforms.Competitive and predictable cash flows.
3MWPlatform
V90V112
2MWPlatform
V80V82V90V100
6MWPlatform
KWPlatform
V52V60
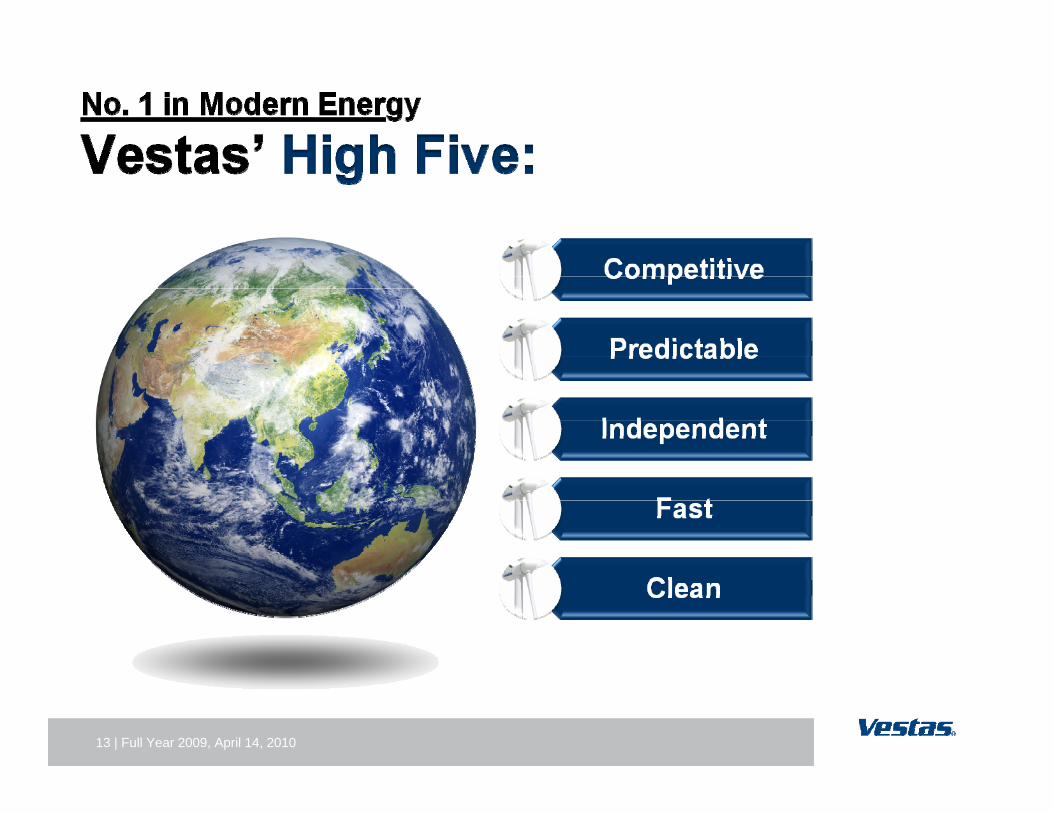
13 | Full Year 2009, April 14, 2010
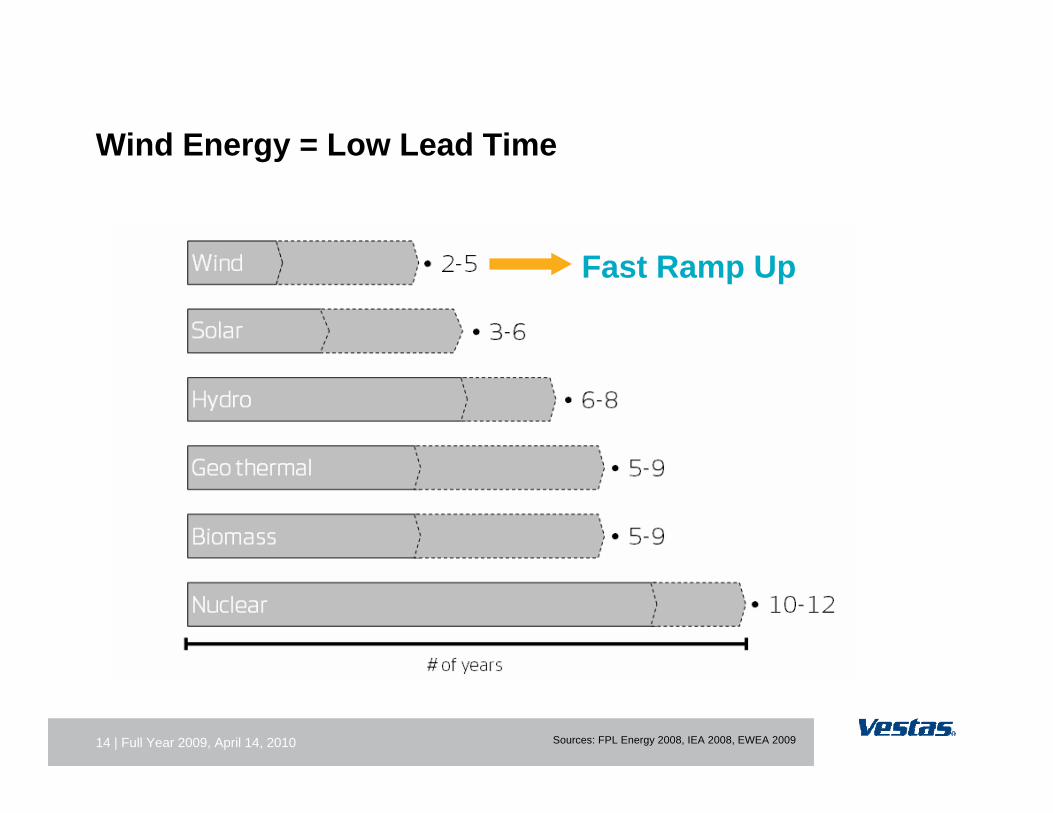
14 | Full Year 2009, April 14, 2010
Wind Energy = Low Lead Time
Sources: FPL Energy 2008, IEA 2008, EWEA 2009
Fast Ramp Up
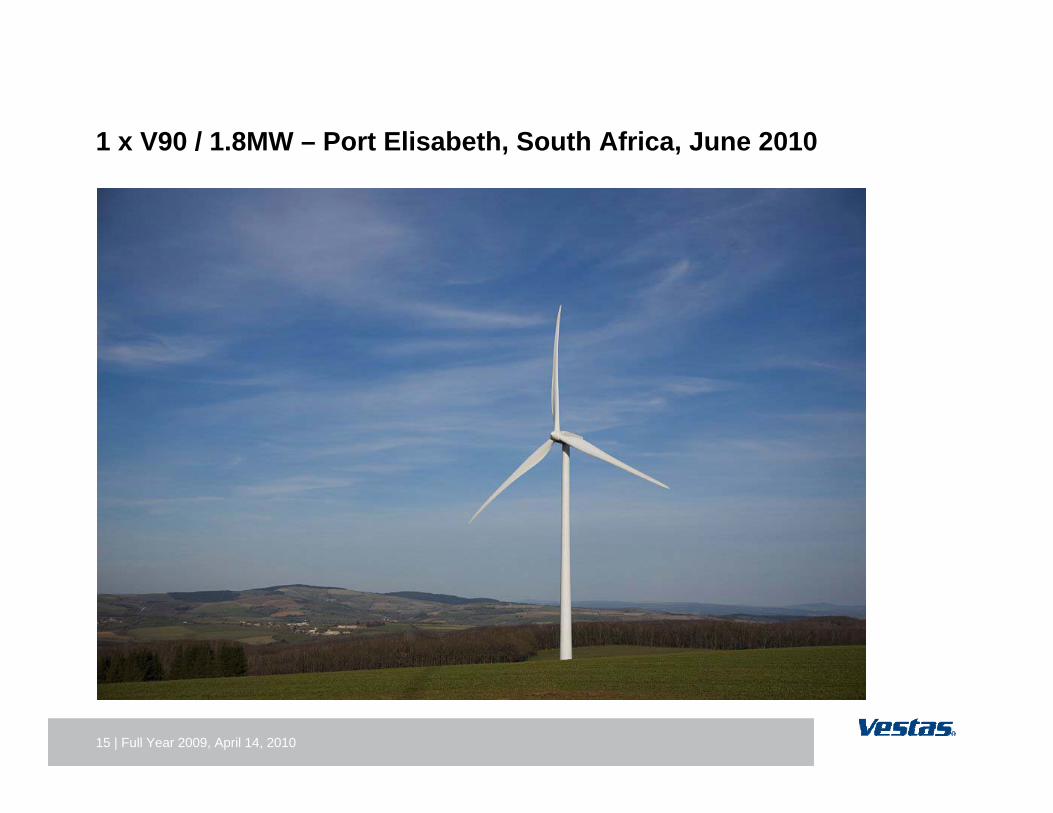
15 | Full Year 2009, April 14, 2010
1 x V90 / 1.8MW – Port Elisabeth, South Africa, June 2010
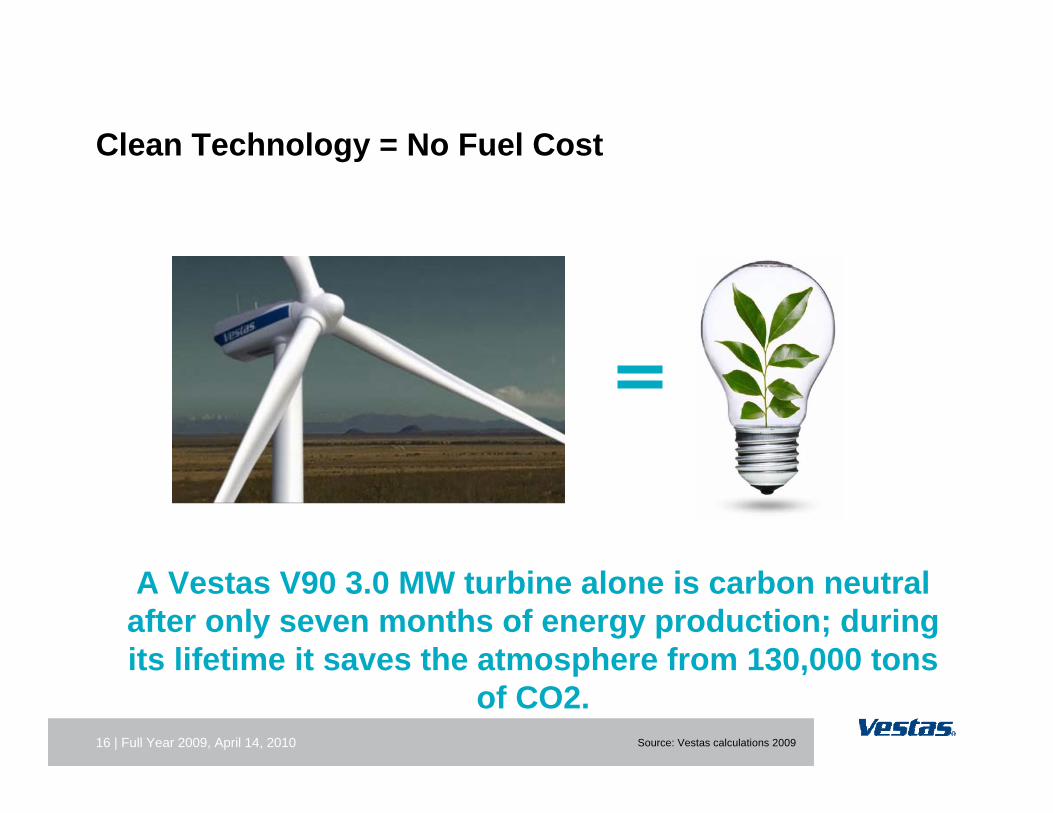
16 | Full Year 2009, April 14, 2010
Clean Technology = No Fuel Cost
A Vestas V90 3.0 MW turbine alone is carbon neutral after only seven months of energy production; during its lifetime it saves the atmosphere from 130,000 tons
of CO2.Source: Vestas calculations 2009
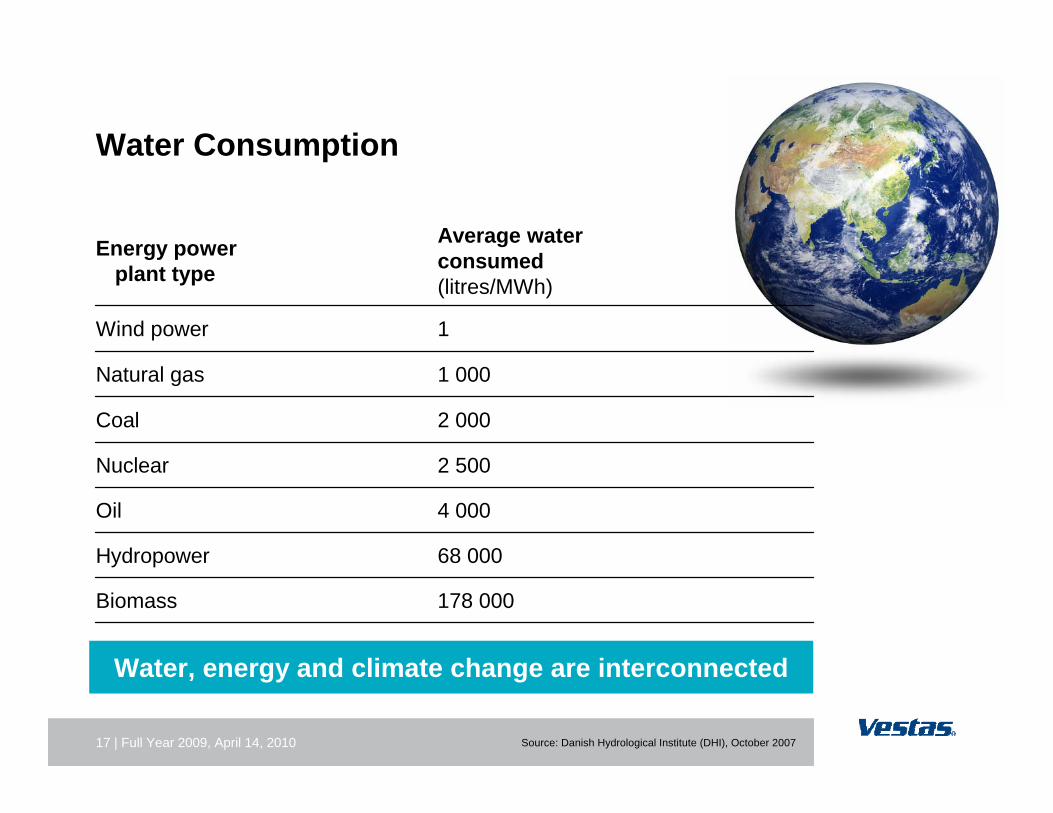
17 | Full Year 2009, April 14, 2010
Water Consumption
178 000Biomass
68 000Hydropower
4 000Oil
2 500Nuclear
2 000Coal
1 000Natural gas
1Wind power
Average waterconsumed(litres/MWh)
Energy power plant type
Water, energy and climate change are interconnected
Source: Danish Hydrological Institute (DHI), October 2007

18 | Full Year 2009, April 14, 2010
Long term Service & Availability Agreement -supports the bankability of your wind farm
In short what you get is…• A bankable supply contract • A full scope service contract. No unforeseen and no
unbudgeted costs for maintenance.• Contract duration of up to 10 years from commissioning
– warranty like coverage for the duration• Wind Farm availability performance guarantee up to
97%.• If availability threshold is not met – liquidated damages
are paid by Vestas
19 | Full Year 2009, April 14, 2010
Bankability continued
Political, legal and regulatory stabile framework provides predictable returns on investment
A bankable PPA
Fair, transparent, efficient permitting and planning process
20 | Corporate Presentation, April 14, 2010
vestas.com
Thank you for your attentionVestas Wind Systems A/S
Copyright NoticeThe documents are created by Vestas Wind Systems A/S and contain copyrighted material, trademarks, and other proprietary information. All rights reserved. No part of the documents may be reproduced or copied in any form or by any means—such as graphic, electronic, or mechanical, including photocopying, taping, or information storage and retrieval systems without the prior written permission of Vestas Wind Systems A/S. The use of these documents by you, or anyone else authorized by you, is prohibited unless specifically permitted by Vestas Wind Systems A/S. You may not alter or remove any trademark, copyright or other notice from the documents. The documents are provided “as is” and Vestas Wind Systems A/S shall not have any responsibility or liability whatsoever for the results of use of the documents by you.
Michael Wollny Director Technical Sales Off-Grid Systems
SMA Solar Technology AG, Germany
Nairobi, April 2010
Renewable Energy Solutions forRural Electrification and Policies to support them

Agenda
» SMA Solar Technology, short company introduction
» Potential of the Off-Grid market
» Suitable technological solutions
» Economical aspects
» Improved framework conditions
» Best practices
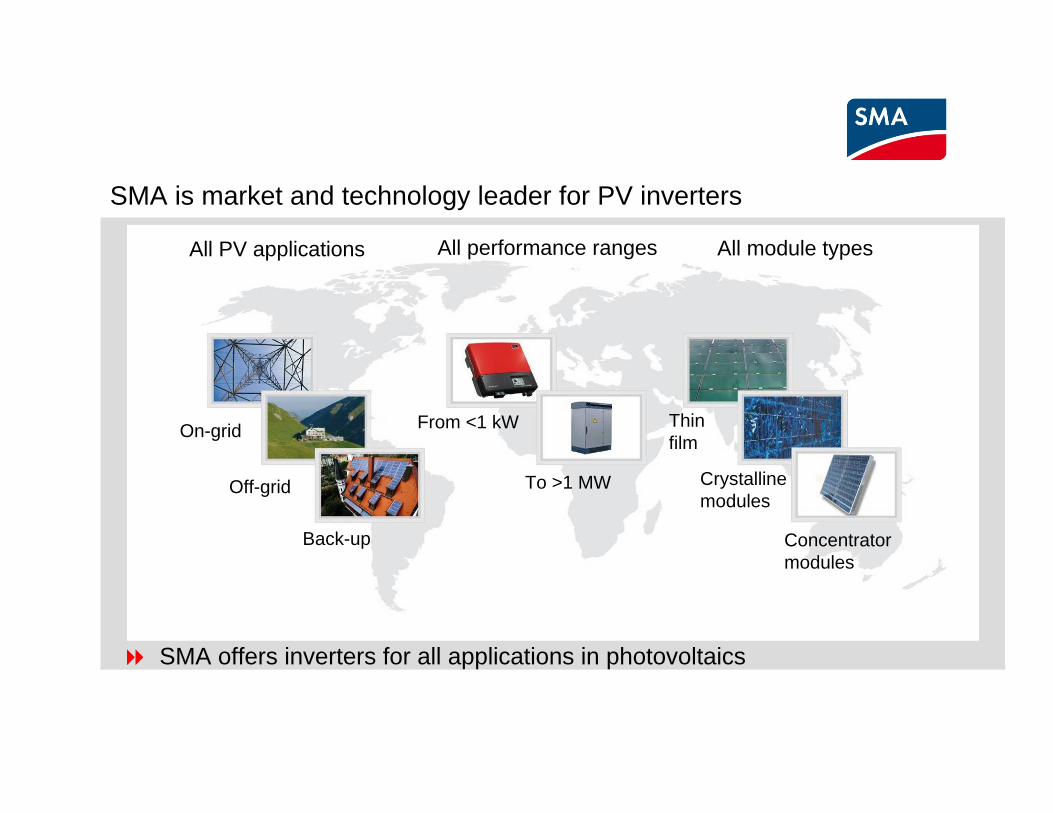
SMA is market and technology leader for PV inverters
SMA offers inverters for all applications in photovoltaics
On-grid From <1 kW
To >1 MW
Thinfilm
Crystalline modules
Concentratormodules
Back-up
Off-grid
All PV applications All performance ranges All module types
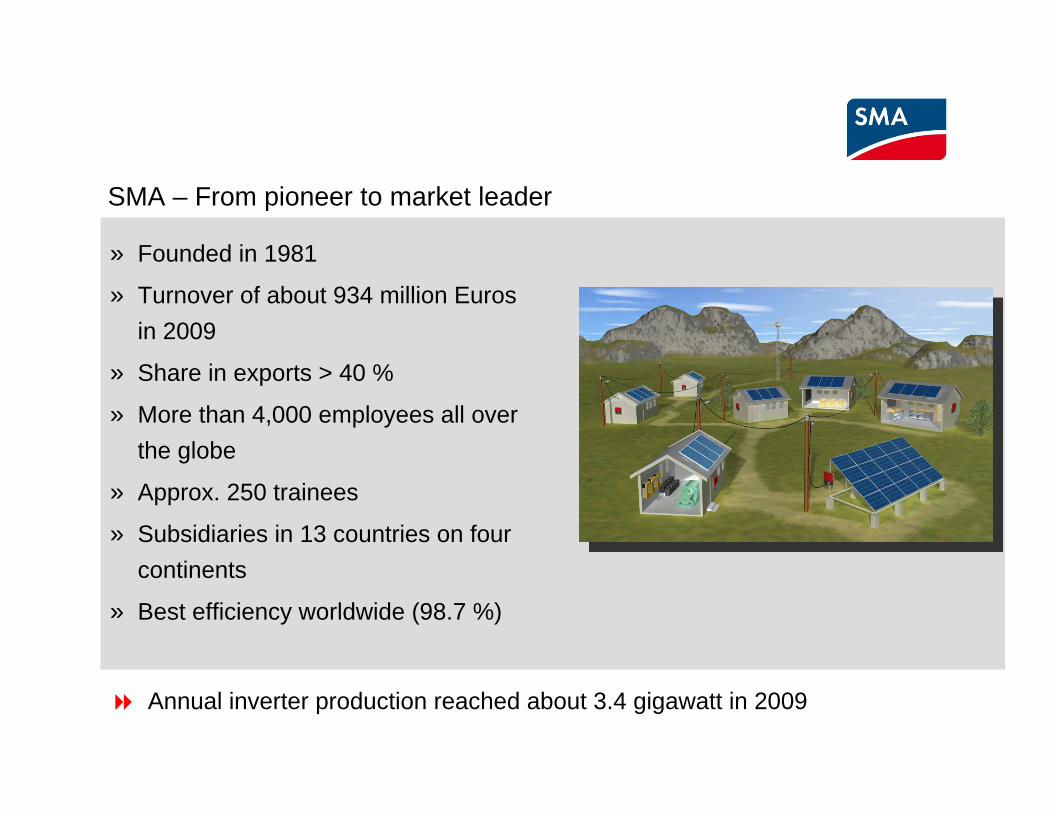
SMA – From pioneer to market leader
» Founded in 1981
» Turnover of about 934 million Euros in 2009
» Share in exports > 40 %
» More than 4,000 employees all over the globe
» Approx. 250 trainees
» Subsidiaries in 13 countries on four continents
» Best efficiency worldwide (98.7 %)
Annual inverter production reached about 3.4 gigawatt in 2009
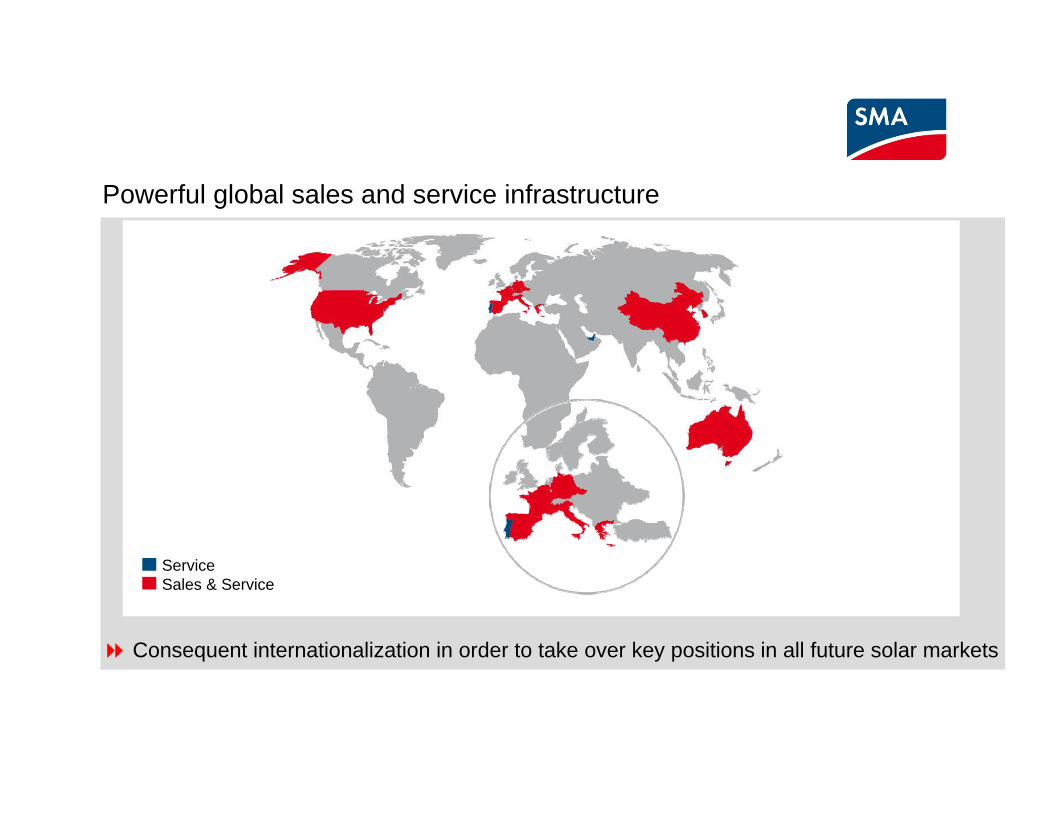
ServiceSales & Service
Powerful global sales and service infrastructure
Consequent internationalization in order to take over key positions in all future solar markets
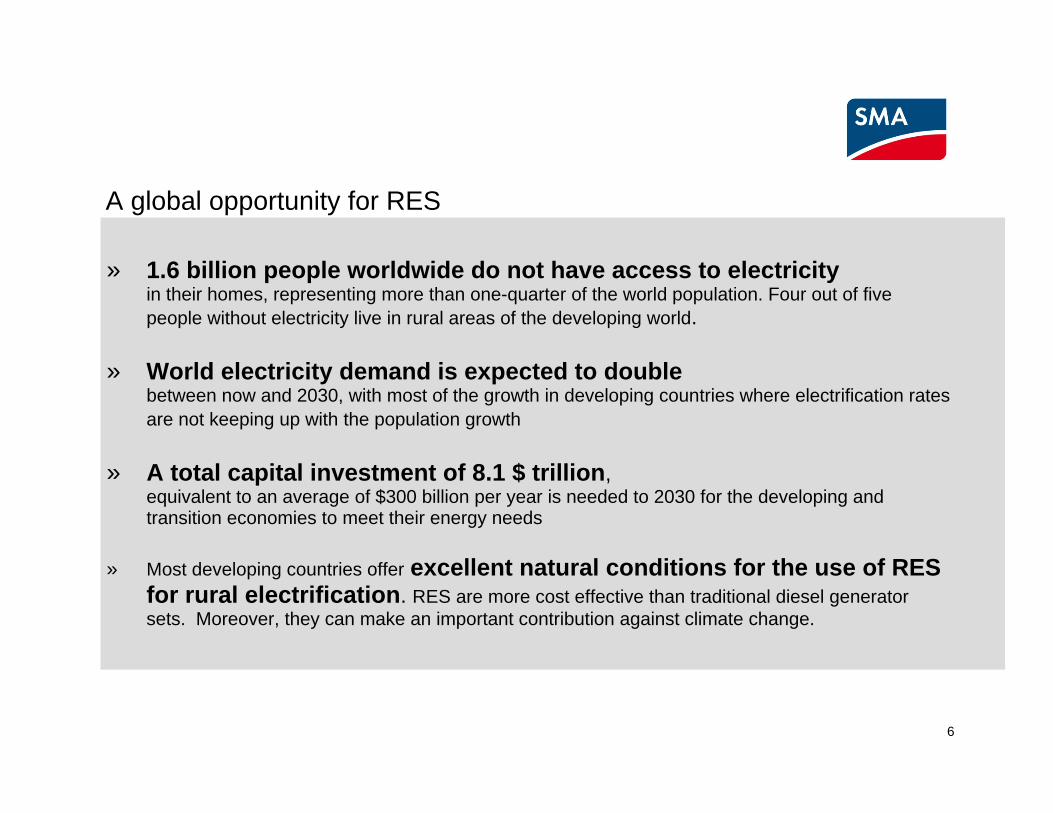
6
A global opportunity for RES
» 1.6 billion people worldwide do not have access to electricityin their homes, representing more than one-quarter of the world population. Four out of five people without electricity live in rural areas of the developing world.
» World electricity demand is expected to doublebetween now and 2030, with most of the growth in developing countries where electrification rates are not keeping up with the population growth
» A total capital investment of 8.1 $ trillion, equivalent to an average of $300 billion per year is needed to 2030 for the developing and transition economies to meet their energy needs
» Most developing countries offer excellent natural conditions for the use of RES for rural electrification. RES are more cost effective than traditional diesel generator sets. Moreover, they can make an important contribution against climate change.
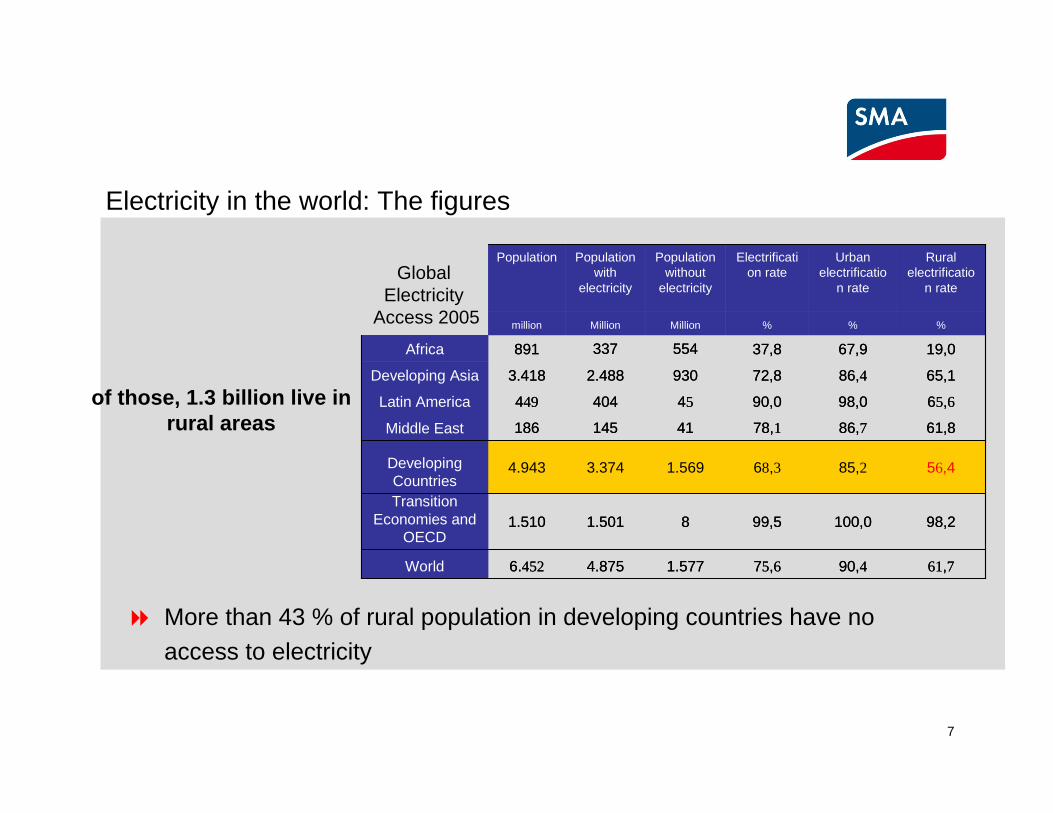
7
Electricity in the world: The figures
of those, 1.3 billion live in rural areas
1.577
8
1.569
41
45
930
554
Million
Population without
electricity
65,186,472,82.4883.418Developing Asia
65,698,090,0404449Latin America
61,790,475,64.8756.452World
98,2100,099,51.5011.510Transition
Economies and OECD
56,485,268,33.3744.943Developing Countries
61,886,778,1145186Middle East
19,067,937,8337891Africa
%%%Millionmillion
Rural electrificatio
n rate
Urban electrificatio
n rate
Electrification rate
Population with
electricity
Population
More than 43 % of rural population in developing countries have no access to electricity
GlobalElectricity
Access 2005
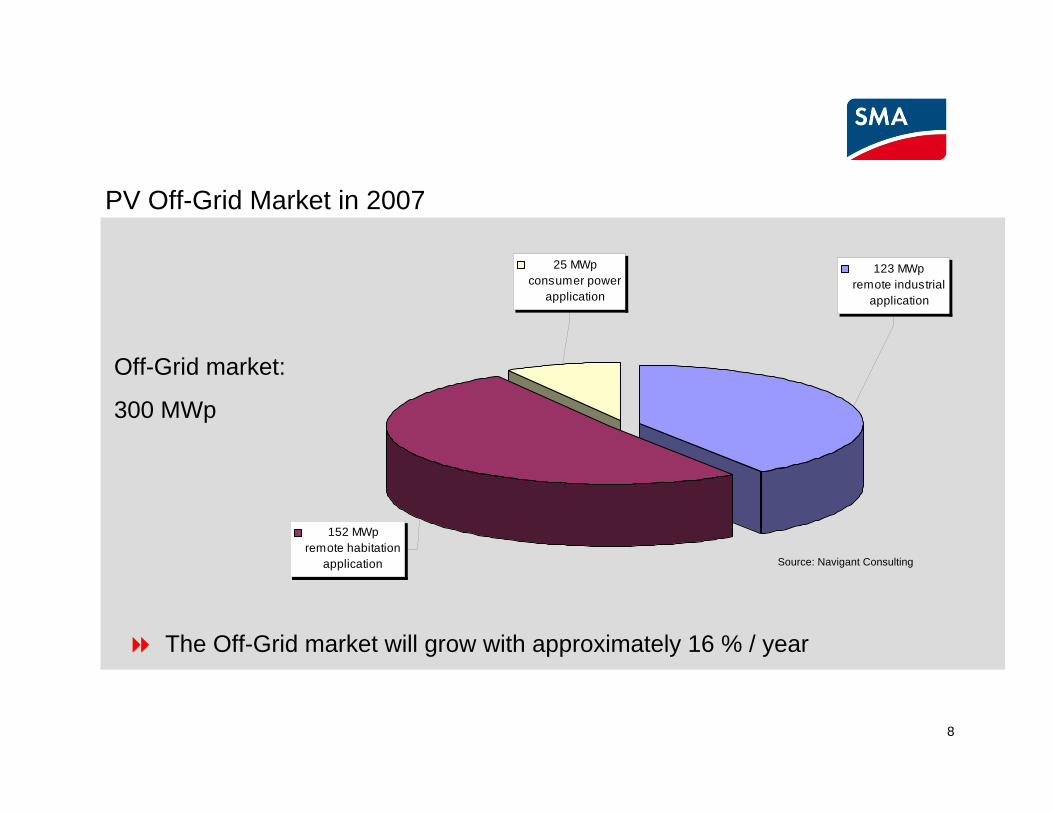
8
PV Off-Grid Market in 2007
Source: Navigant Consulting
152 MWpremote habitation
application
123 MWpremote industrial
application
25 MWpconsumer power
application
Off-Grid market:
300 MWp
The Off-Grid market will grow with approximately 16 % / year
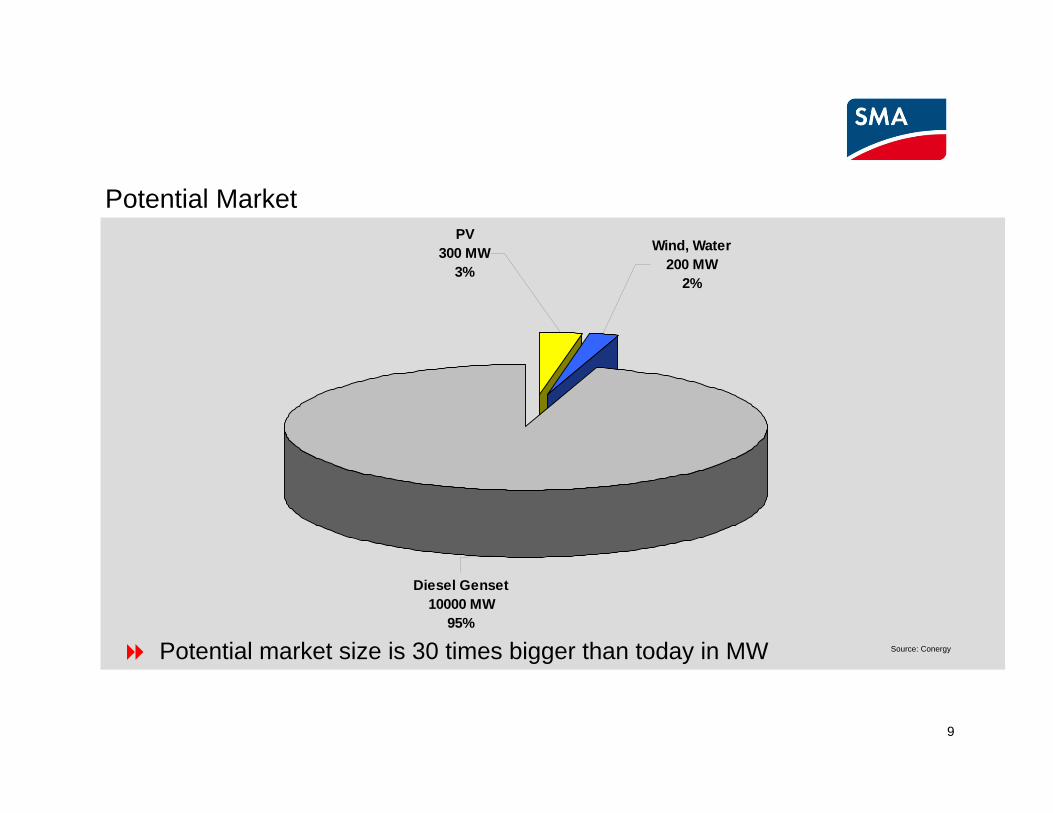
9
Potential Market
Source: Conergy
Diesel Genset10000 MW
95%
PV300 MW
3%
Wind, Water200 MW
2%
Potential market size is 30 times bigger than today in MW

10
Off-Grid is a future market
» EPIA/Greenpeace Prognoseup to 2030:
- 105...281 GWp/year
- 30 % for Off-Grid sector
2,4 GWp 6,6 GWp 56 GWp 281 GWp
Annual installed power [Source: EPIA/Greenpeace]
Off-Grid market will increase faster compare to the On-Grid market
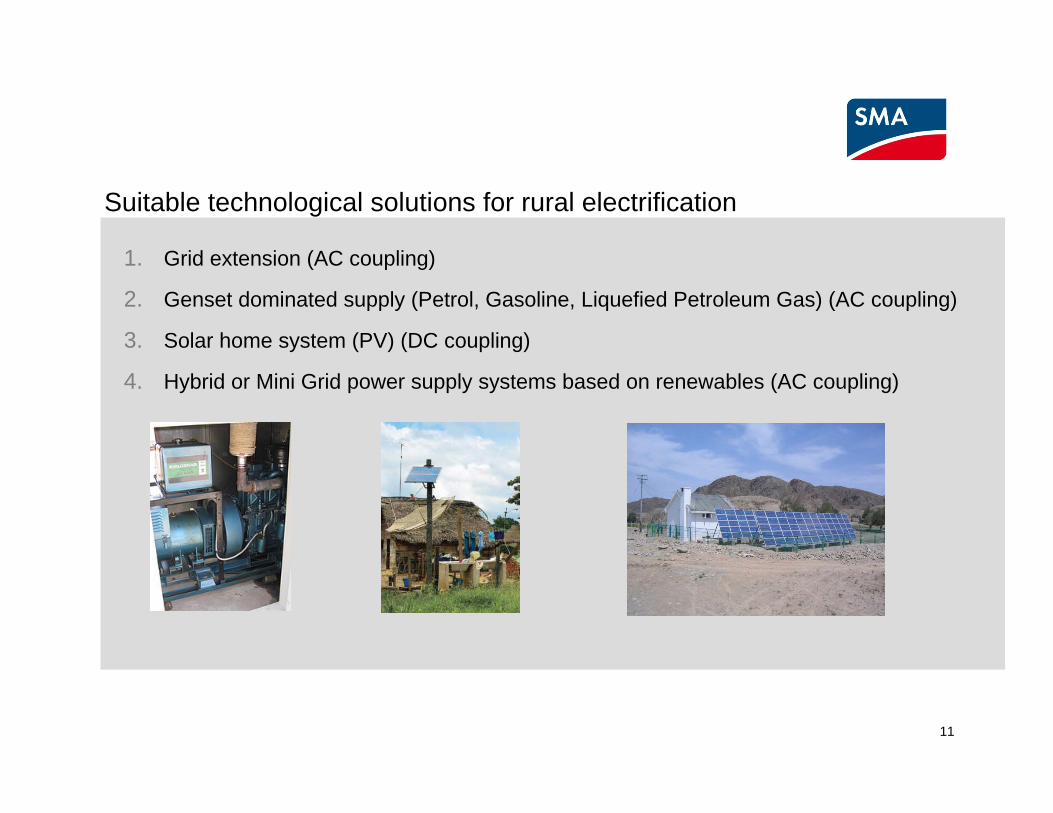
11
Suitable technological solutions for rural electrification
1. Grid extension (AC coupling)
2. Genset dominated supply (Petrol, Gasoline, Liquefied Petroleum Gas) (AC coupling)
3. Solar home system (PV) (DC coupling)
4. Hybrid or Mini Grid power supply systems based on renewables (AC coupling)
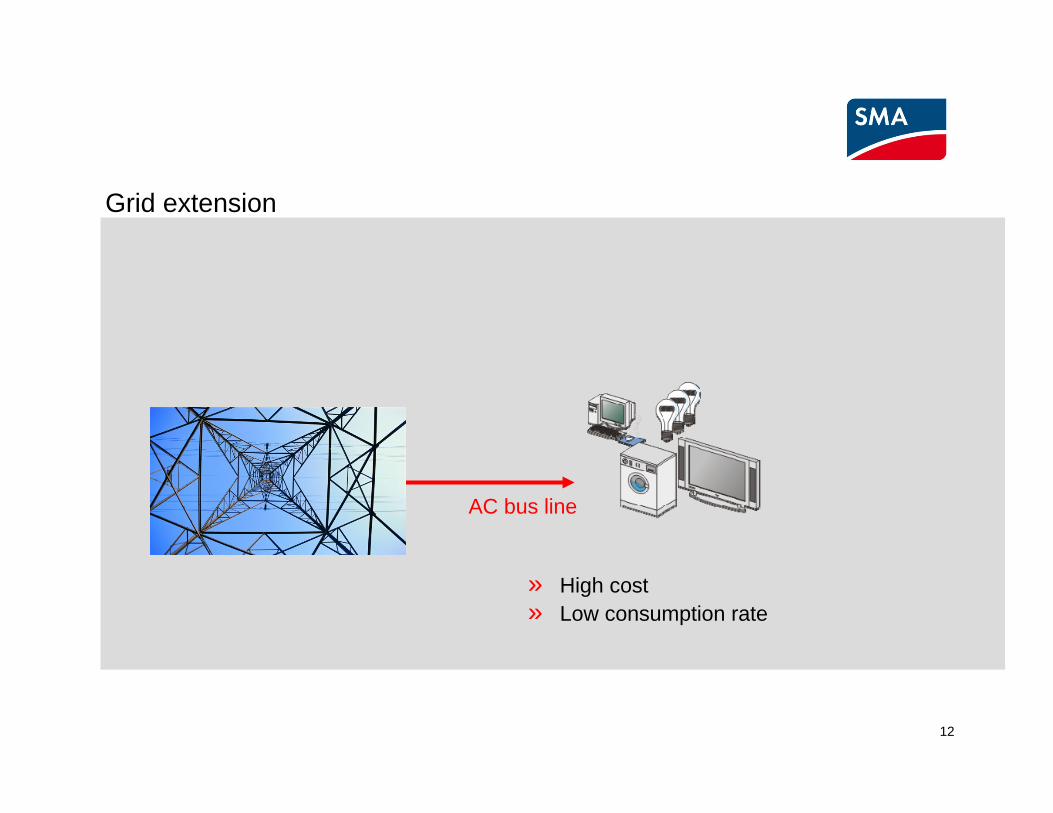
12
Grid extension
» High cost» Low consumption rate
AC bus line
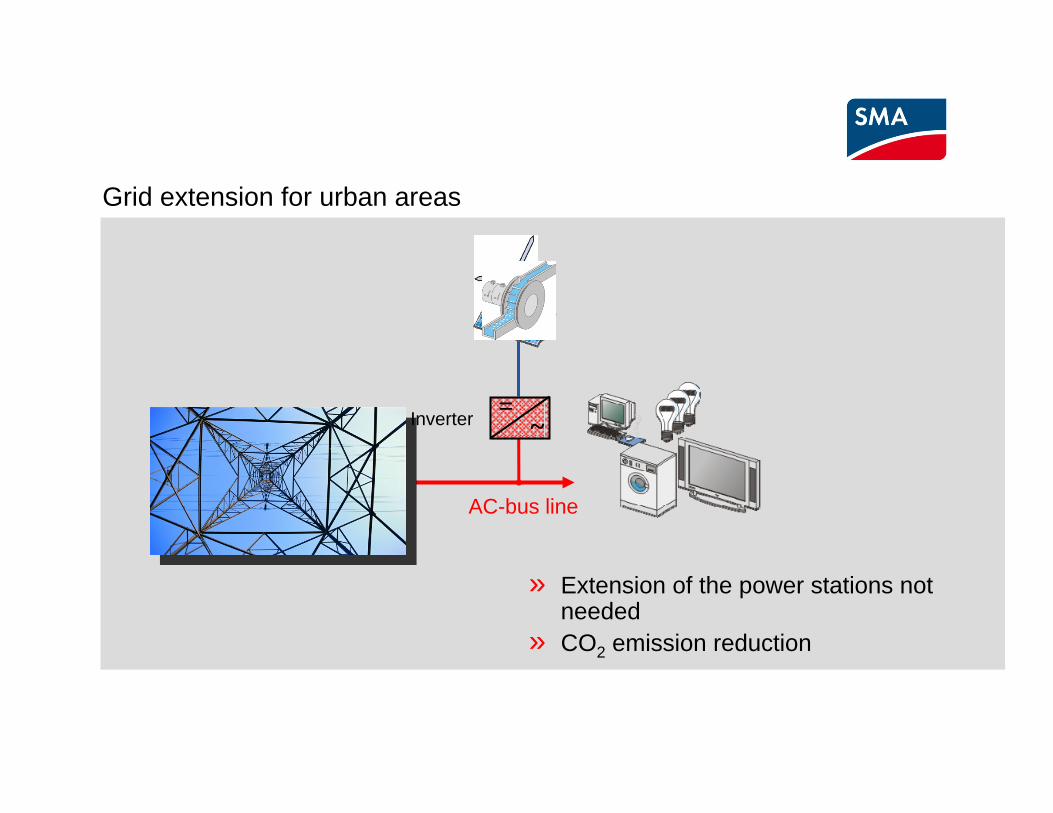
Grid extension for urban areas
» Extension of the power stations not needed
» CO2 emission reduction
AC-bus line
~=Inverter
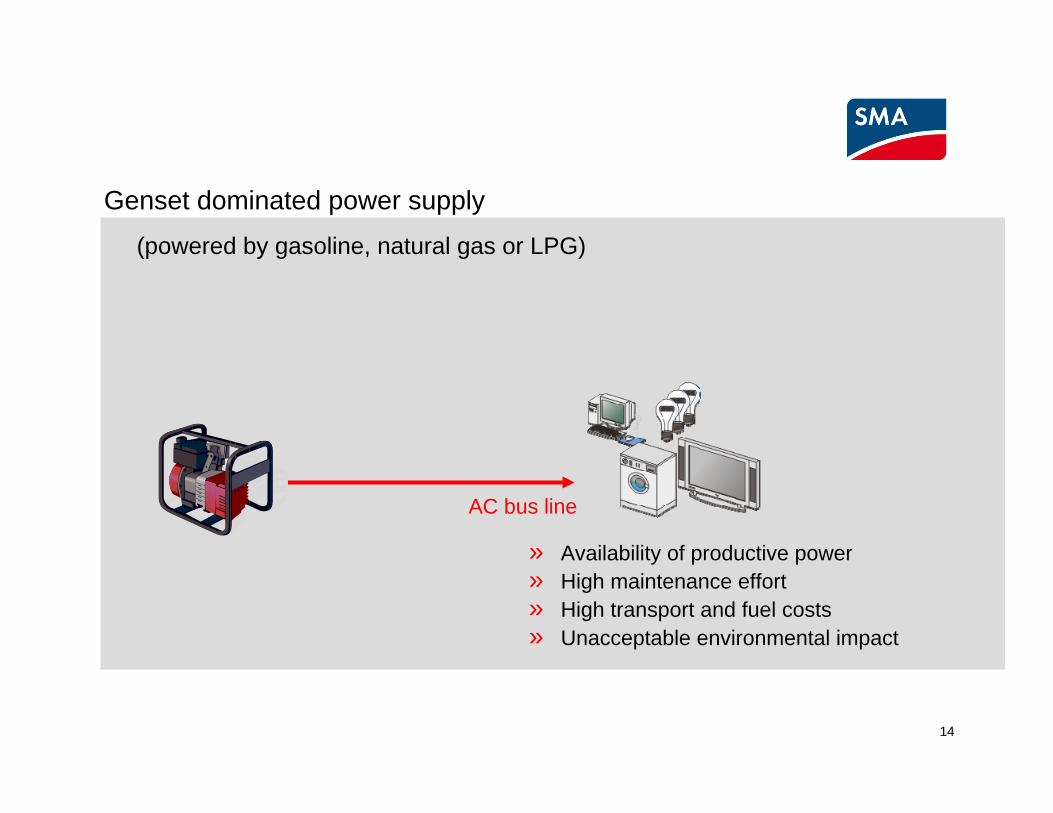
14
Genset dominated power supply
(powered by gasoline, natural gas or LPG)
» Availability of productive power» High maintenance effort» High transport and fuel costs» Unacceptable environmental impact
AC bus line

15
Genset dominated power supply supported by RES
» Fuel saver operation» Reduced transport and fuel costs» Uninterrupted running of generator» Low comfort
AC bus line
~=Inverter

16
Solar Home System
» No generator needed» Individual energy supply» Restricted economic development
DC bus line
Charger ==

17
Mixed DC and AC bus line
» AC and DC appliances» Availability of productive power» Redundant system design with generator
DC bus line
Charger == ~
=
AC bus line
Inverter

18
Modular hybrid design
» Grid quality electricity» Easy expandability» Backup solution » Integration of different RES» Standard components
Inverter
AC bus line~=
~=
~=
Master Inverter
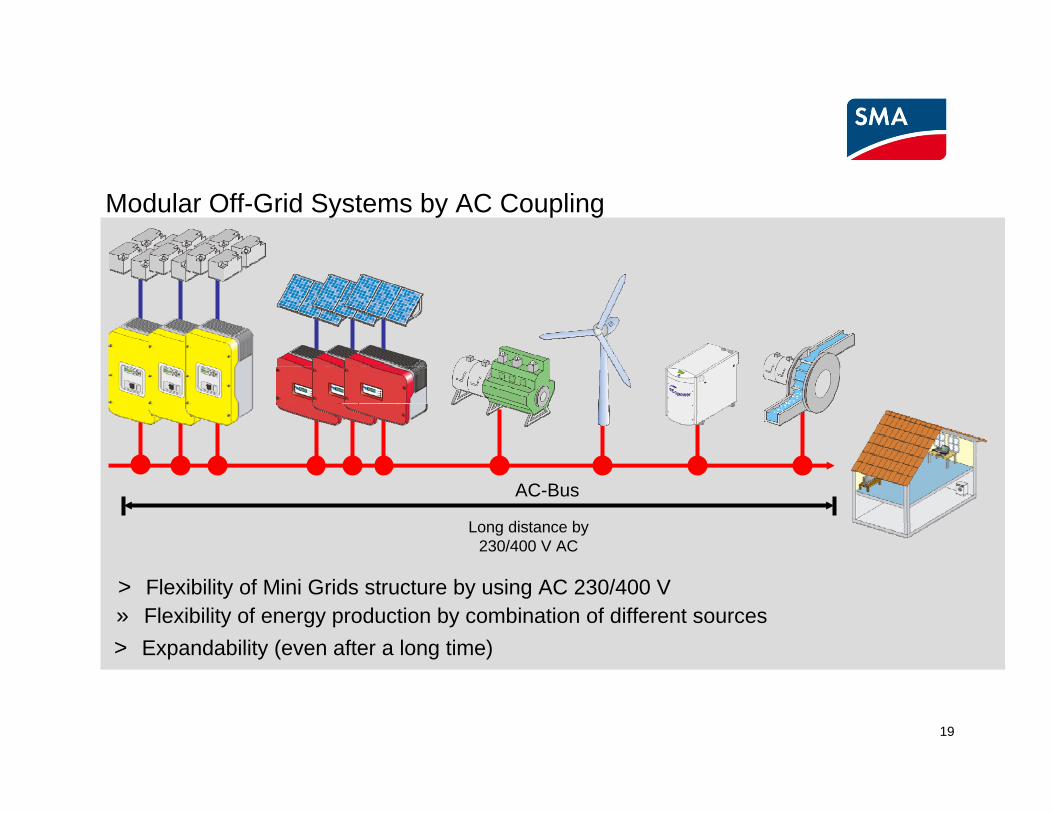
19
AC-Bus
» Flexibility of energy production by combination of different sources
Long distance by 230/400 V AC
> Flexibility of Mini Grids structure by using AC 230/400 V
> Expandability (even after a long time)
Modular Off-Grid Systems by AC Coupling

20
Modular energy supply

21
Simple enlargement
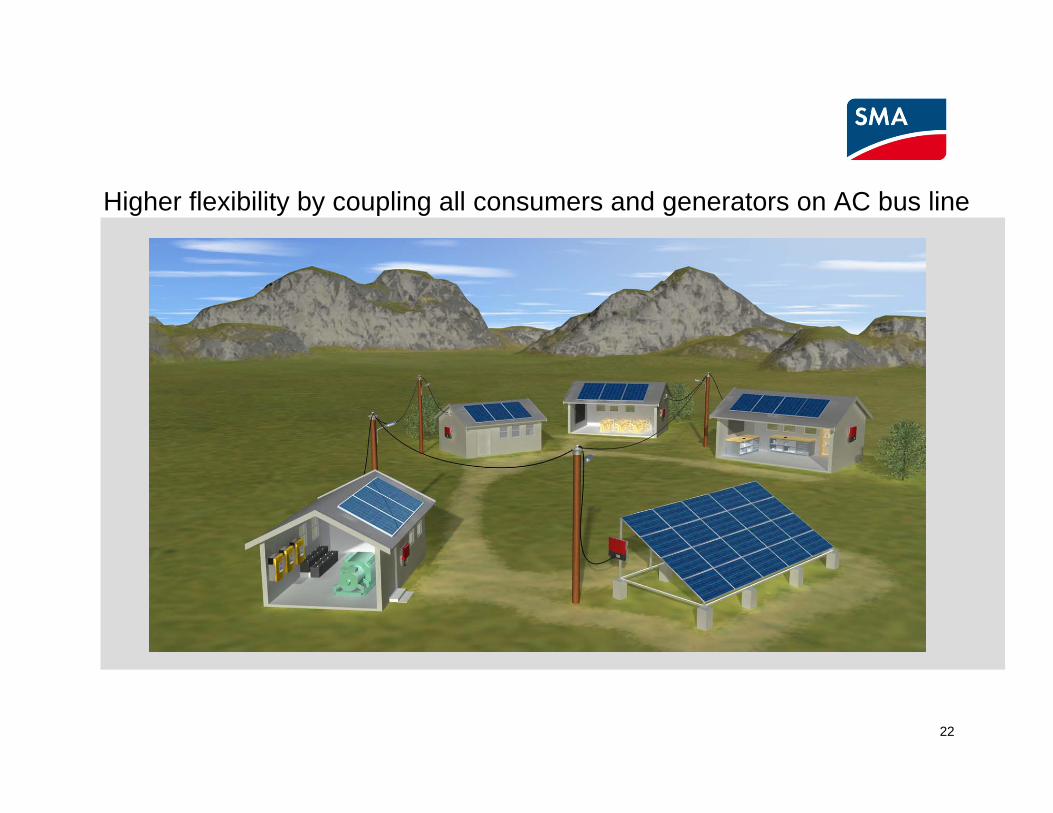
22
Higher flexibility by coupling all consumers and generators on AC bus line
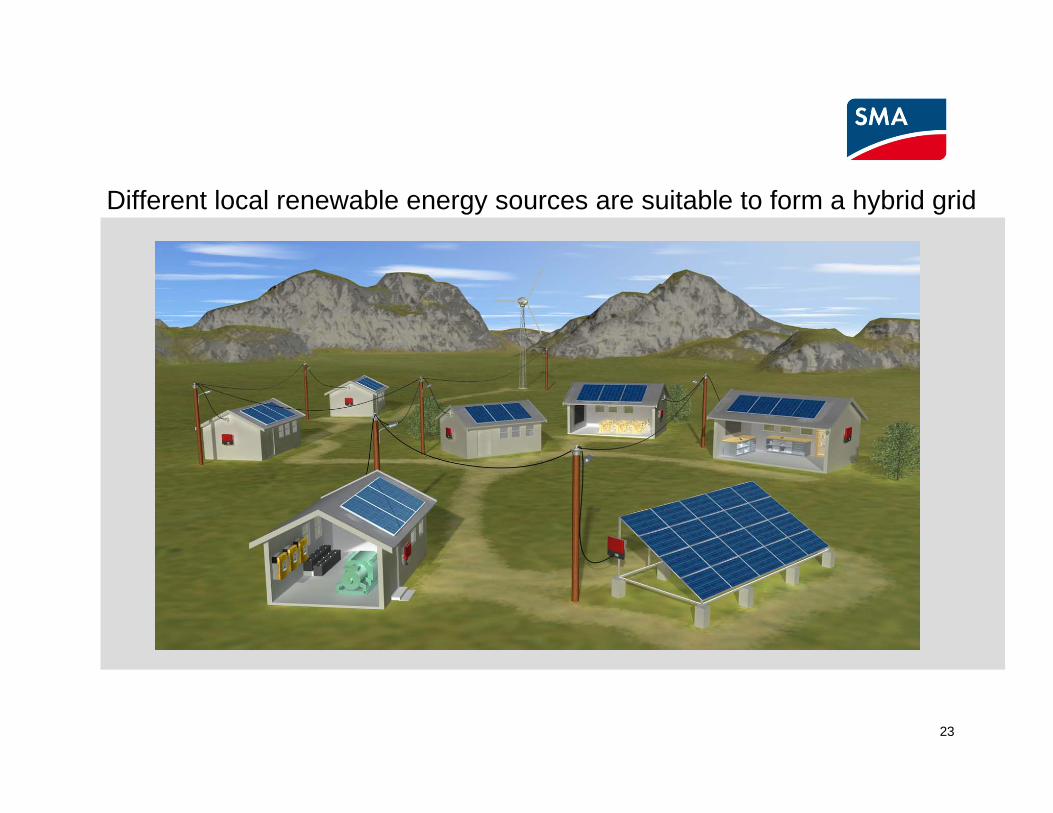
23
Different local renewable energy sources are suitable to form a hybrid grid
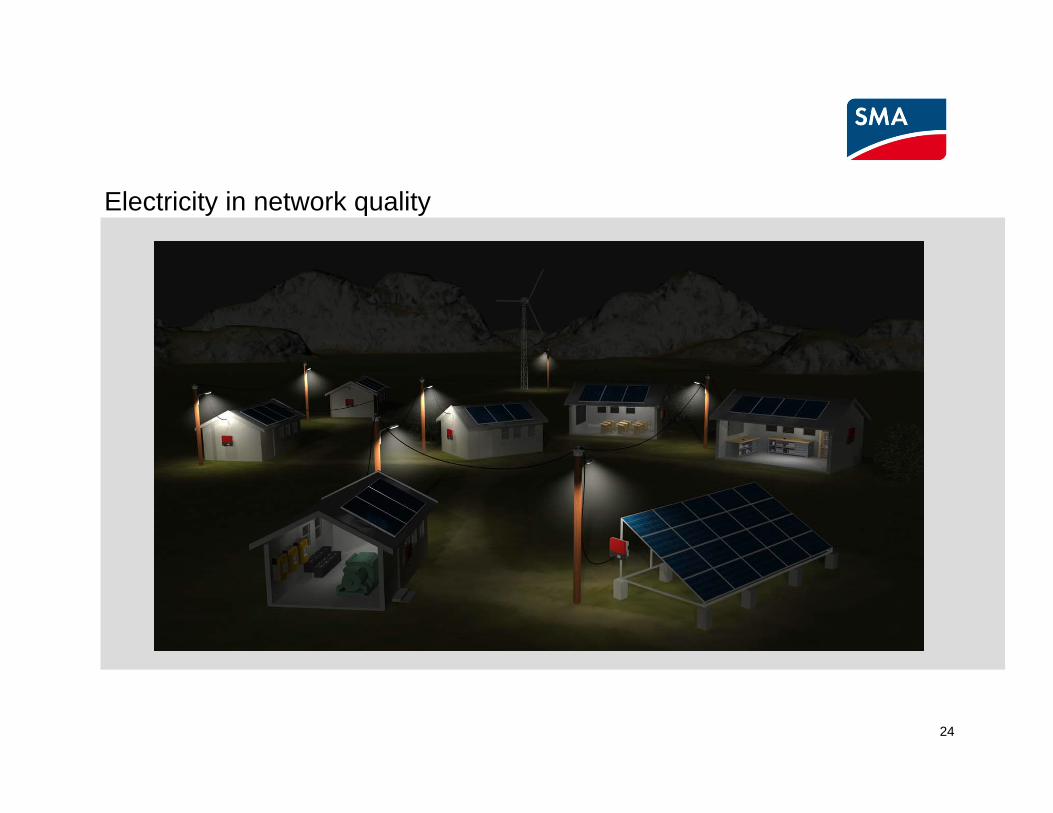
24
Electricity in network quality

25
Economical comparison: Grid extention vs. hybrid systems
0 €
100 .000 €
200 .000 €
300 .000 €
400 .000 €
500 .000 €
600 .000 €
700 .000 €
0 5 10 15 20 25
Kilometer
Inve
stmen
t cos
ts
Public Grid3 kWp PV Power Supply5 kWp PV Power Supply12 kW p PV Power Supply30 kW p PV Power Supply
» The extension costs are primarily distance dependent
» The break even “distance” is therefore related to the demand
Source: Alliance of rural electrification
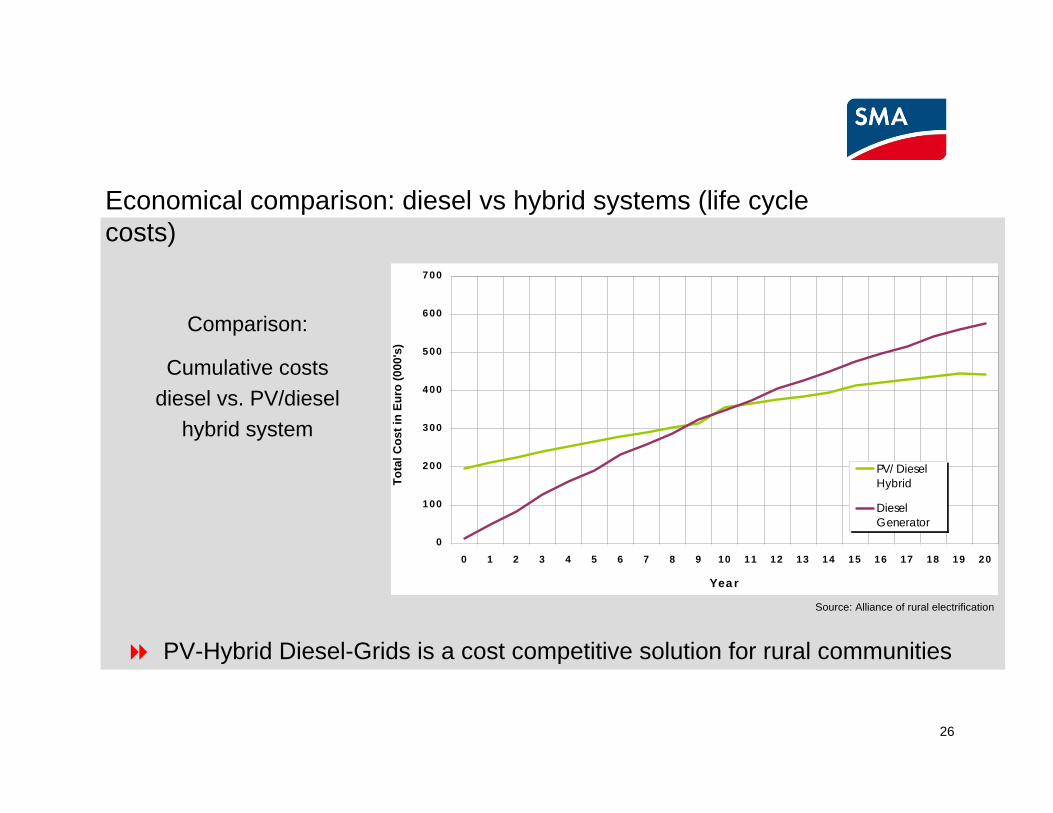
26
Economical comparison: diesel vs hybrid systems (life cycle costs)
Source: Alliance of rural electrification
0
100
200
300
400
500
600
700
0 1 2 3 4 5 6 7 8 9 10 11 12 13 14 15 16 17 18 19 20
Yea r
Tota
l Cos
t in
Euro
(000
's)
PV/ DieselHybrid
DieselGenerator
Comparison:
Cumulative costs diesel vs. PV/diesel
hybrid system
PV-Hybrid Diesel-Grids is a cost competitive solution for rural communities

What do we need on the political level ?
Access to electricity should follow a reliablelong term strategy and the legal framework must allow a setup of private and local initiatives
Amendments of specific framework conditions can start private investments
Development of the off-grid market when it is commercial driven by the private sector
A close dialogue between all actors is indispensable for sustainable market stimulation and development
What do we need on the political level ?
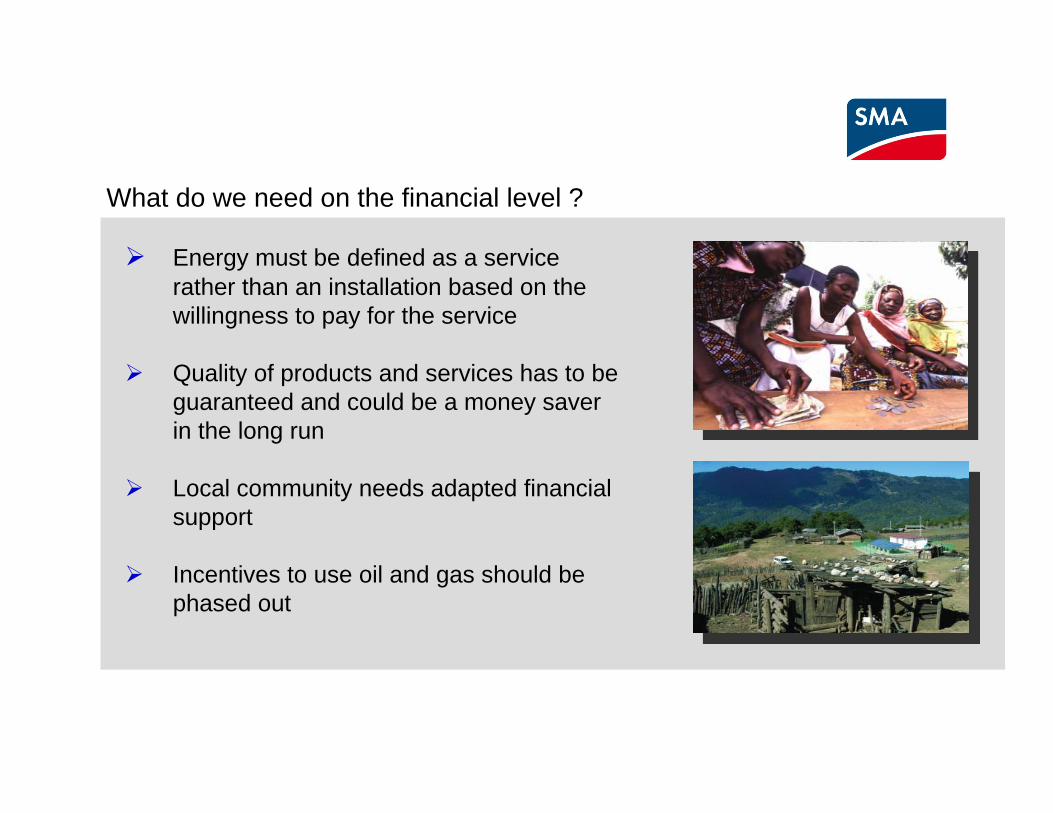
What do we need on the financial level ?
Energy must be defined as a service rather than an installation based on the willingness to pay for the service
Quality of products and services has to be guaranteed and could be a money saver in the long run
Local community needs adapted financial support
Incentives to use oil and gas should be phased out
What do we need on the financial level ?
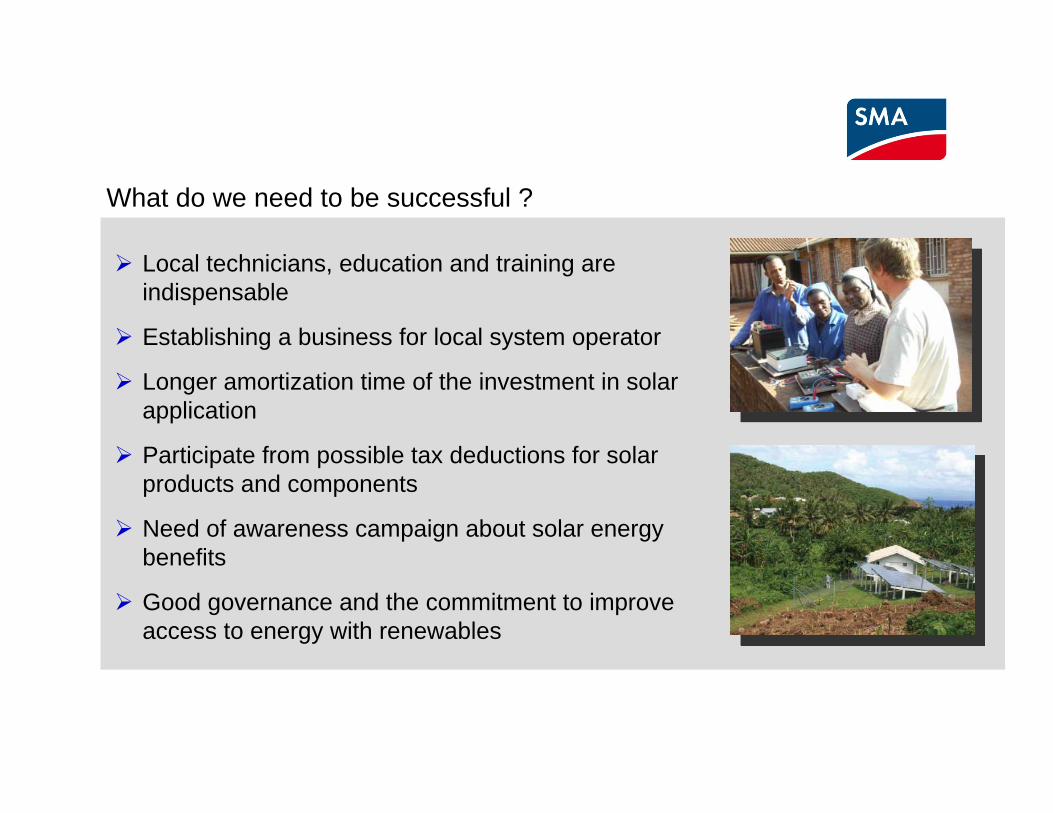
Local technicians, education and training are indispensable
Establishing a business for local system operator
Longer amortization time of the investment in solar application
Participate from possible tax deductions for solar products and components
Need of awareness campaign about solar energy benefits
Good governance and the commitment to improve access to energy with renewables
What do we need to be successful ?What do we need to be successful ?
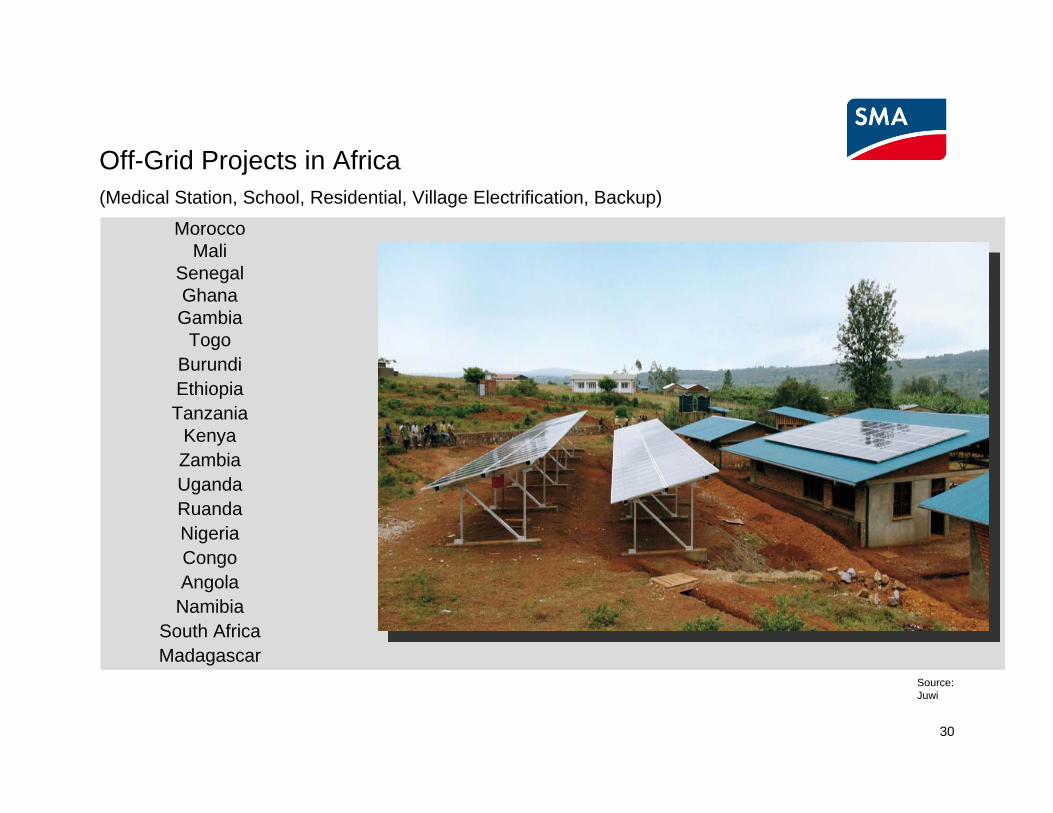
30
Off-Grid Projects in Africa(Medical Station, School, Residential, Village Electrification, Backup)
MoroccoMali
SenegalGhanaGambia
TogoBurundiEthiopiaTanzania
KenyaZambiaUgandaRuandaNigeriaCongoAngola
NamibiaSouth AfricaMadagascar
Source: Juwi
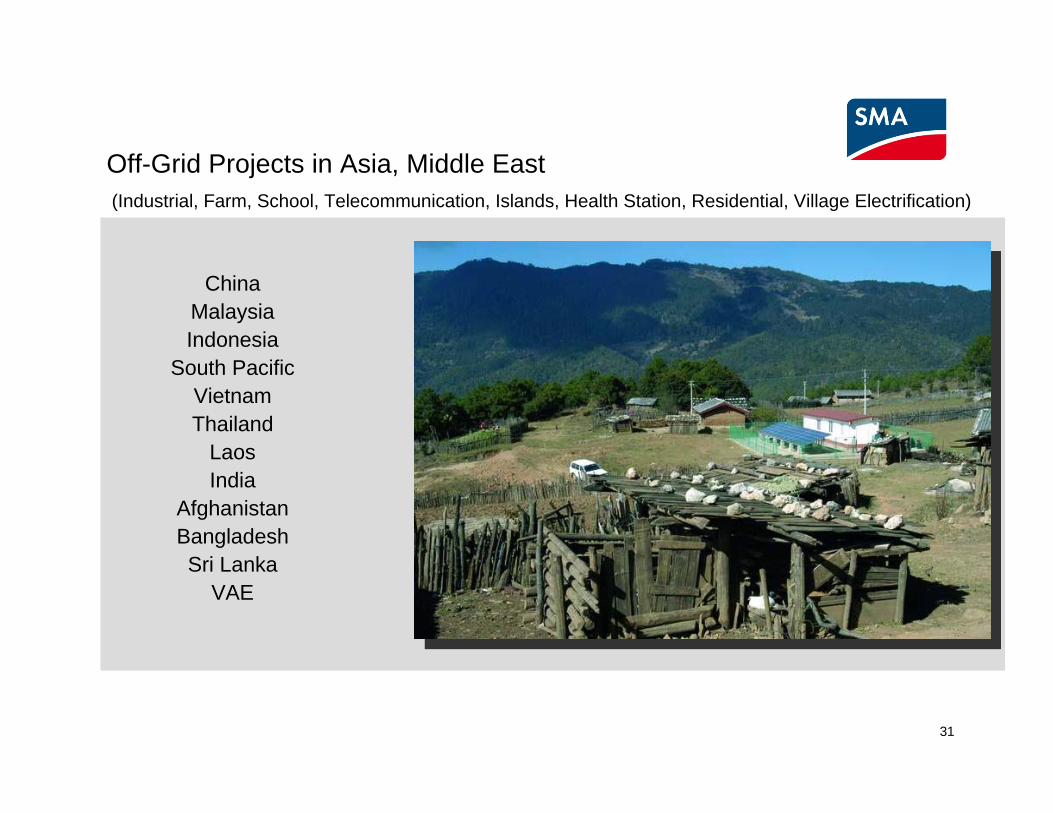
31
Off-Grid Projects in Asia, Middle East(Industrial, Farm, School, Telecommunication, Islands, Health Station, Residential, Village Electrification)
ChinaMalaysiaIndonesia
South PacificVietnamThailand
LaosIndia
AfghanistanBangladeshSri Lanka
VAE

32
Off-Grid Projects in Europe (Farm, Lodge, Telecommunication, Health Station, Residential, Islands,Mountain Refugees)
SpainGreece
ItalyFrance
PortugalGermanyTurkeyRussiaAustria
RomaniaUnited Kingdom
Switzerland
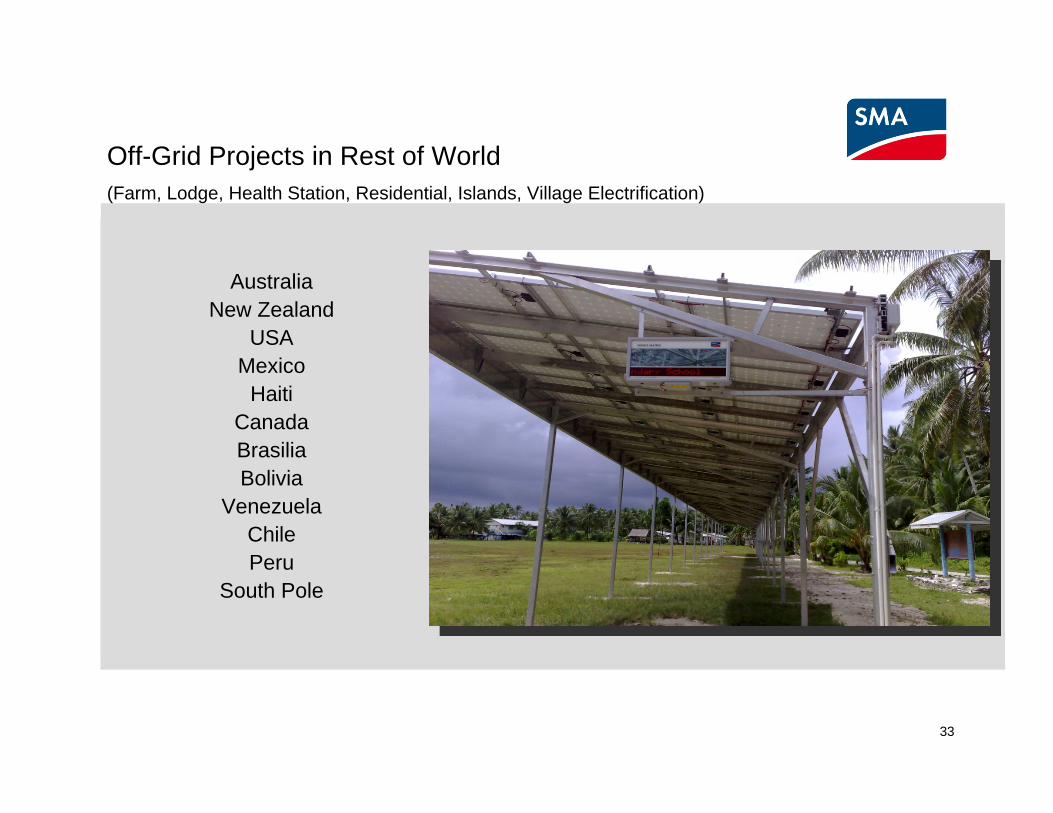
33
Off-Grid Projects in Rest of World (Farm, Lodge, Health Station, Residential, Islands, Village Electrification)
AustraliaNew Zealand
USAMexico
HaitiCanadaBrasiliaBolivia
VenezuelaChilePeru
South Pole
34
SMA Solar Technology AG
www.SMA.de
Sou
rce:
Ene
rgie
bau
Köl
n
Let‘s talk !
e8-GEF-UNDESA Financing Sustainable Electrification
Africa Dialogues Nairobi, Kenya, April 13-15, 2010
The Wind Factory / The Sun Factory
Pieter Klimp, Managing Director

• System House for Renewable Energy Solutions:– Solar Energy Systems (on/off-grid)– Wind Energy Systems (on/off-grid)– Medium and small innovative energy systems (< 1 MW)
• PROJECT DEVELOPMENT – SALES – ENGINEERING –MANUFACTURING – INSTALLATION – SERVICE –MAINTENANCE – MONITORING & CONTROL
• Internationally Operating and Expanding• Focus on decentralized Energy Systems in Africa!• Operation & Maintenance structure is a must!
The Wind Factory / The Sun Factory
Hybrid
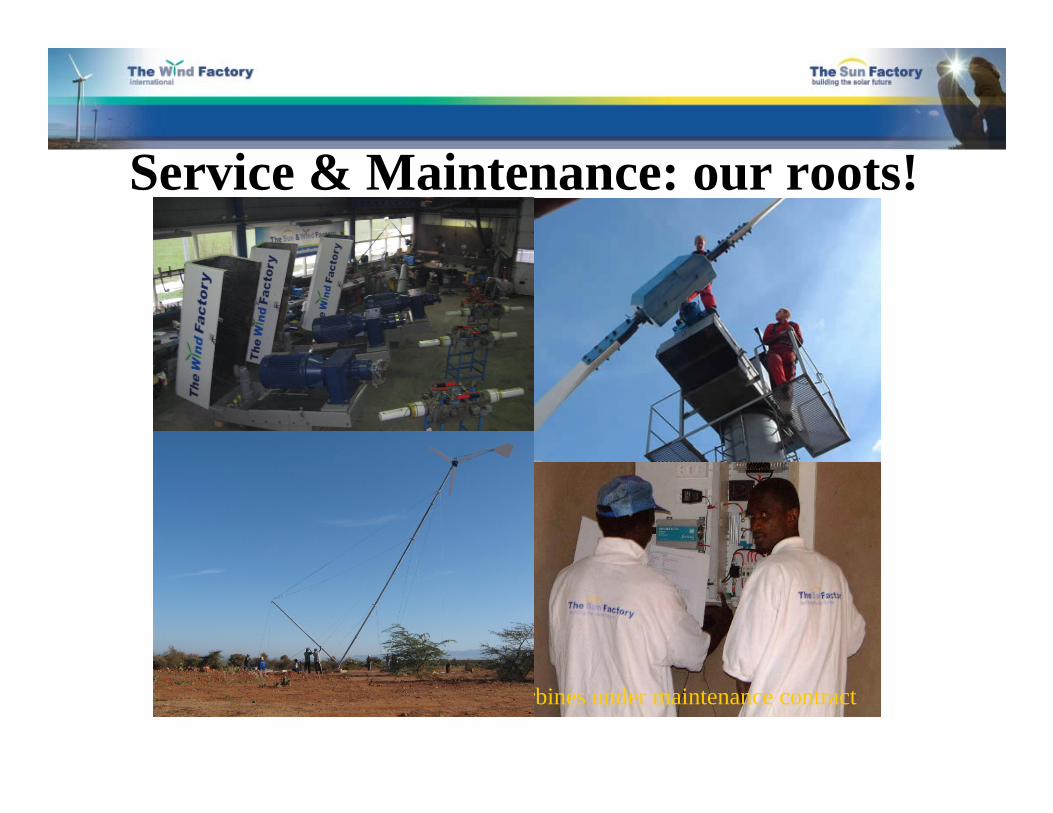
Service & Maintenance: our roots!
As a group we have over 350 wind turbines under maintenance contract

Established in Europe with small and medium Wind Turbines (+ Solar); Why (East) Africa?
NETHERLANDS EAST AFRICAAverage Wind Speed 5-7 m/s at 30m 4-10 m/s at 30mSolar Radiation 3kWh/m2/day 6kWh/m2/dayEnergy Prices / Tariff 0.04 – 0.25 EUR / kWh 0.07 – > 1.00 EUR/kWhSubsidies Yes NoneBuilding Permit 2 - 15 years 2 - 15 weeksGrid Capacity Large Limited or none gridCrisis sensitive More LessFinancing / payments Affordable / Structured Expensive / Risc
Our off-grid knowledge and wind-diesel concept fits perfectly in the African market
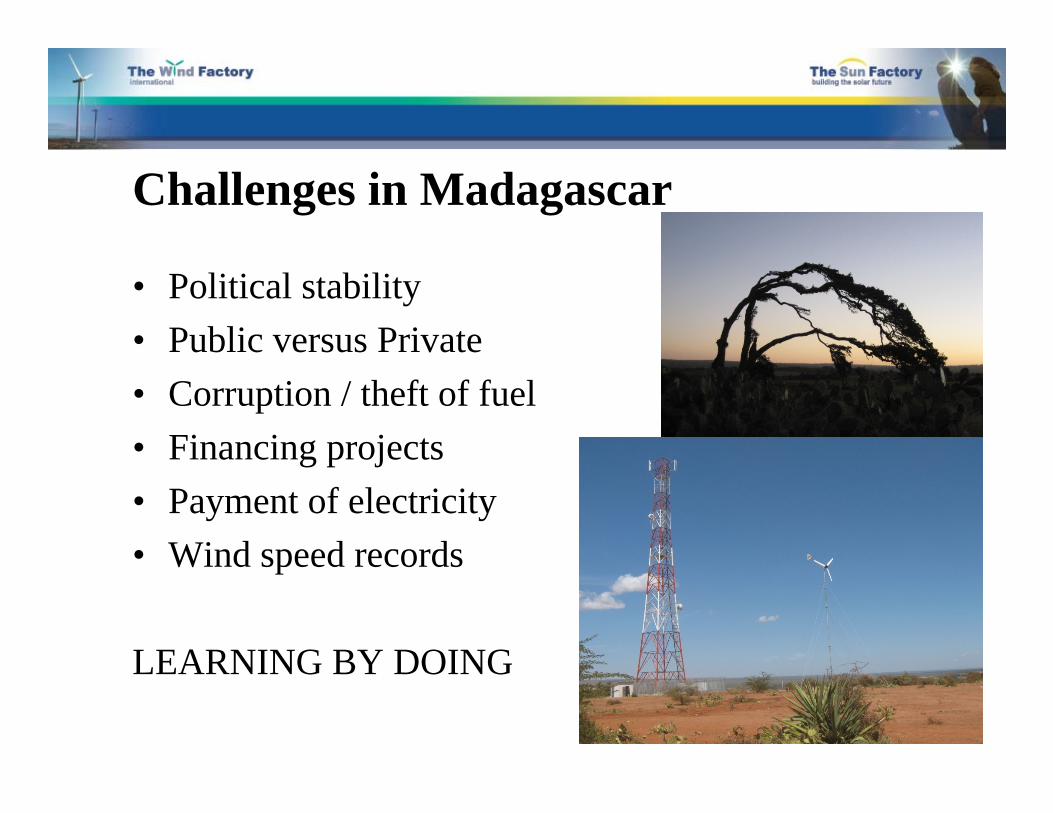
Challenges in Madagascar
• Political stability• Public versus Private• Corruption / theft of fuel• Financing projects• Payment of electricity• Wind speed records
LEARNING BY DOING
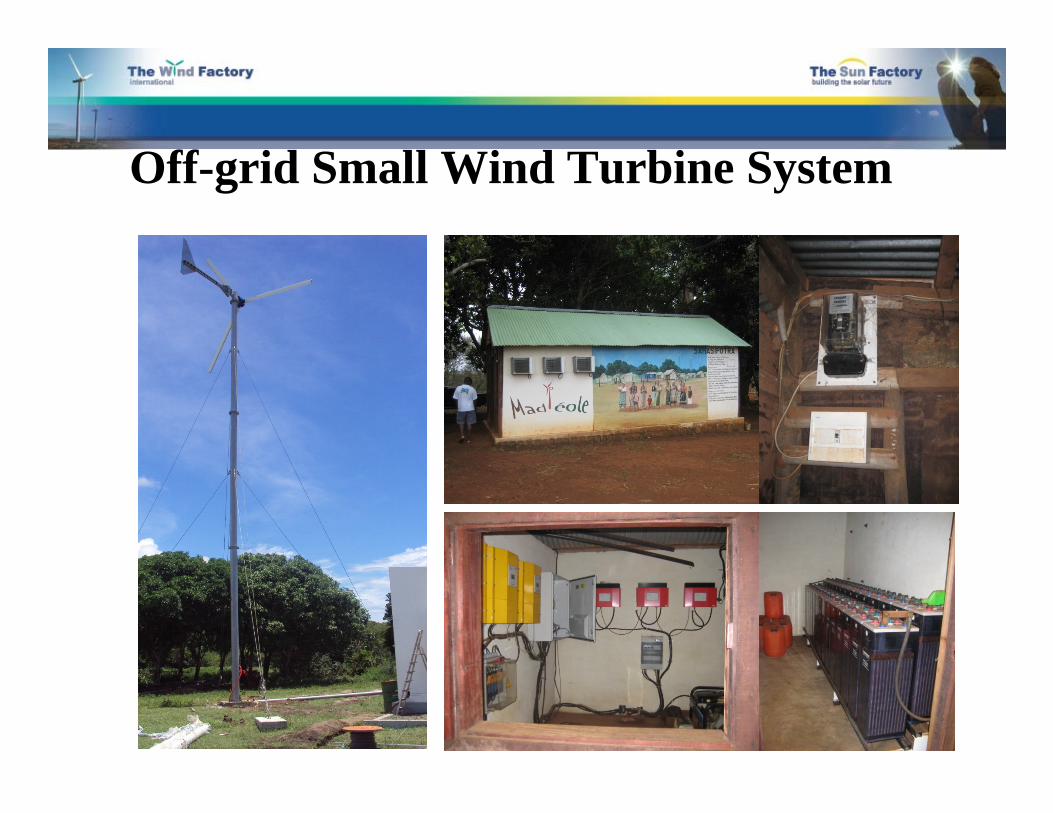
Off-grid Small Wind Turbine System
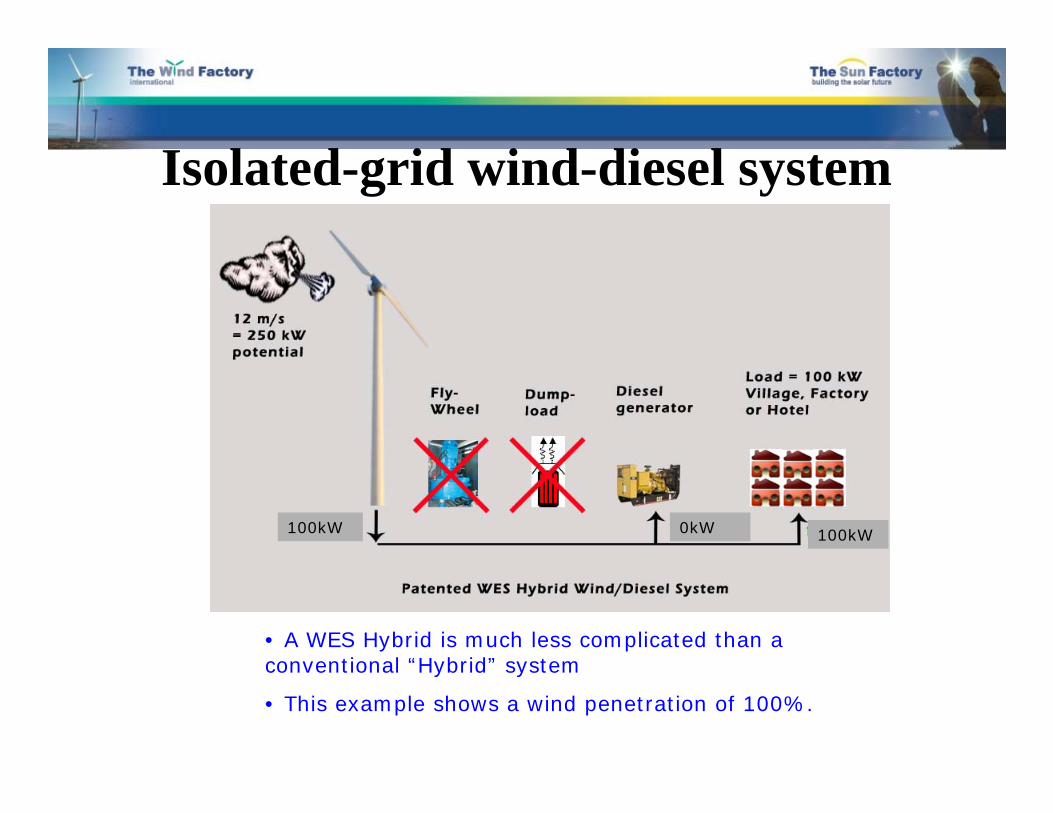
Isolated-grid wind-diesel system
• A WES Hybrid is much less complicated than a conventional “Hybrid” system
• This example shows a wind penetration of 100%.
100kW 100kW0kW
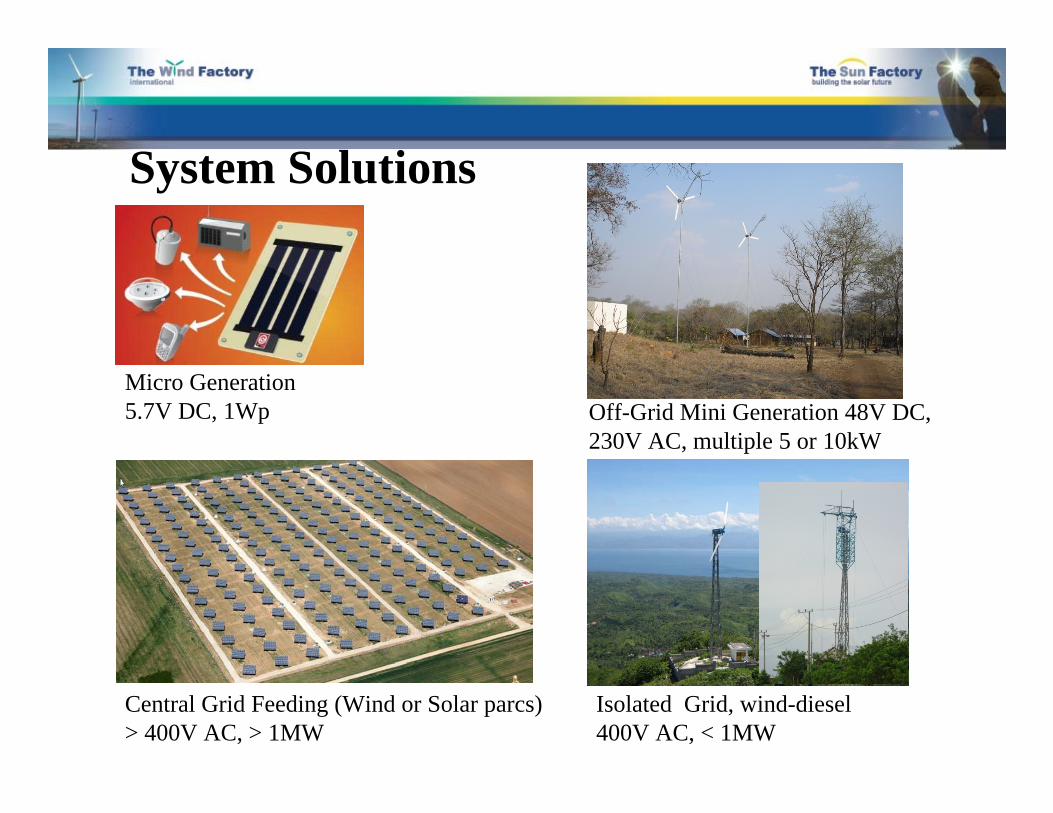
System Solutions
Micro Generation5.7V DC, 1Wp
Central Grid Feeding (Wind or Solar parcs) > 400V AC, > 1MW
Off-Grid Mini Generation 48V DC, 230V AC, multiple 5 or 10kW
Isolated Grid, wind-diesel400V AC, < 1MW
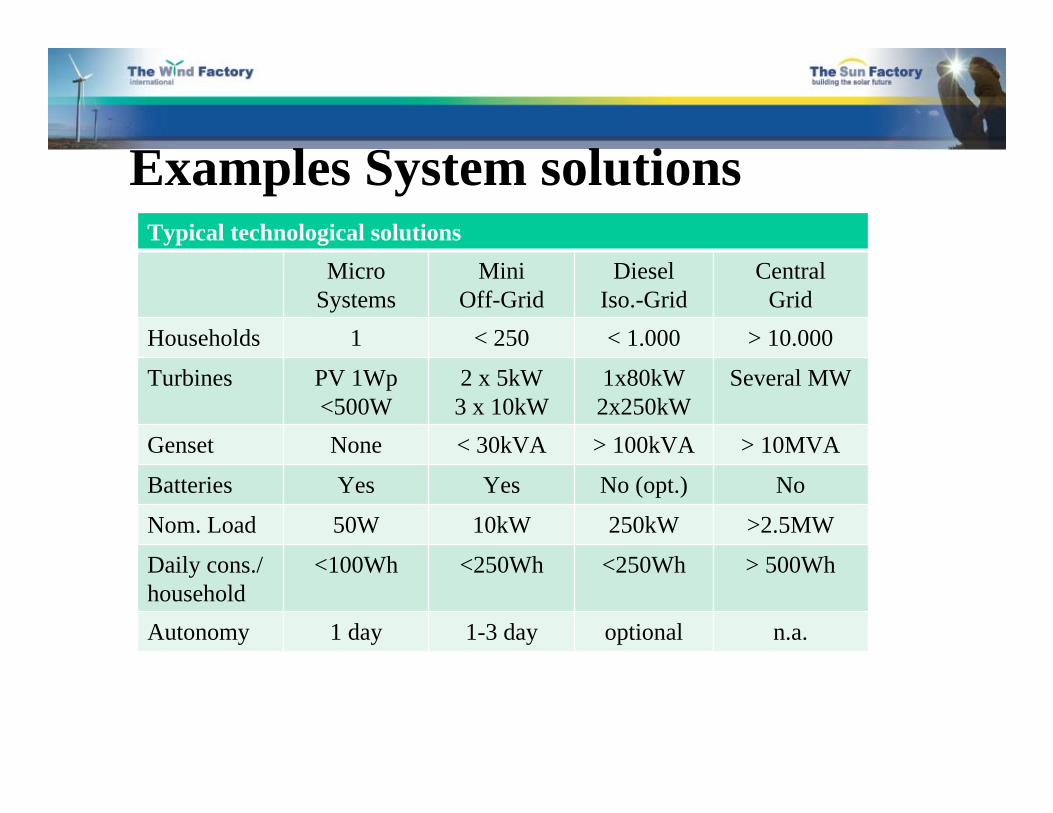
Typical technological solutionsMicro
SystemsMini
Off-GridDiesel
Iso.-GridCentral
GridHouseholds 1 < 250 < 1.000 > 10.000
Turbines PV 1Wp<500W
2 x 5kW3 x 10kW
1x80kW2x250kW
Several MW
Genset None < 30kVA > 100kVA > 10MVA
Batteries Yes Yes No (opt.) No
Nom. Load 50W 10kW 250kW >2.5MW
Daily cons./ household
<100Wh <250Wh <250Wh > 500Wh
Autonomy 1 day 1-3 day optional n.a.
Examples System solutions

• Reduce VAT and duties to stimulate investment in rural electrification by clean energy (solar/wind/hydro)
• Facilitate IPP status to increase competition;• Research resource potential (wind map)• Make Carbon Credits accessible for small and
medium power systems to benefit extra revenues;• Combine rural electrification with professional
market (telecommunications, farms, …). SERVICE!• Reduce urbanisation: install decentralized renewable
energy systems in Rural Africa!
Recommendations
1
e8 –UNDESA-GEFFinancing Sustainable Electrification
WorkshopNairobi - April 13 -15 2010
Developing the Rural Electrification and
Energy Sector in Africa
Isolated Grid Option
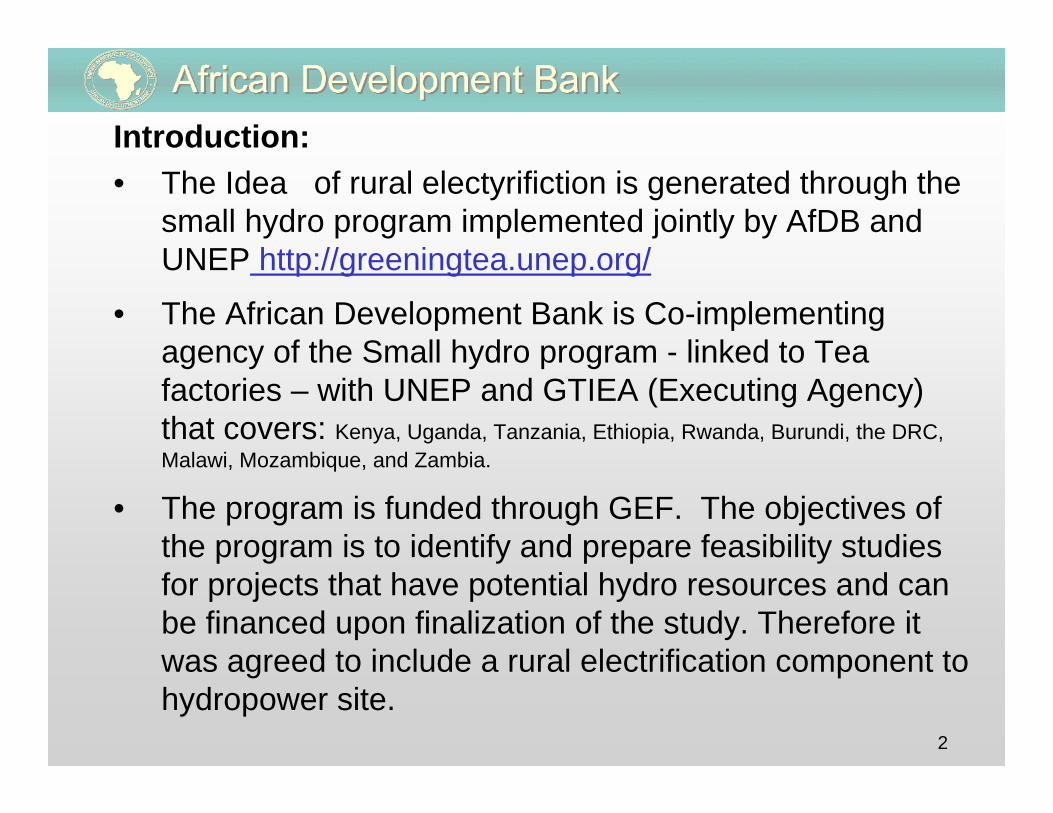
2
Introduction:• The Idea of rural electyrifiction is generated through the
small hydro program implemented jointly by AfDB and UNEP http://greeningtea.unep.org/
• The African Development Bank is Co-implementing agency of the Small hydro program - linked to Tea factories – with UNEP and GTIEA (Executing Agency) that covers: Kenya, Uganda, Tanzania, Ethiopia, Rwanda, Burundi, the DRC, Malawi, Mozambique, and Zambia.
• The program is funded through GEF. The objectives of the program is to identify and prepare feasibility studies for projects that have potential hydro resources and can be financed upon finalization of the study. Therefore it was agreed to include a rural electrification component to hydropower site.
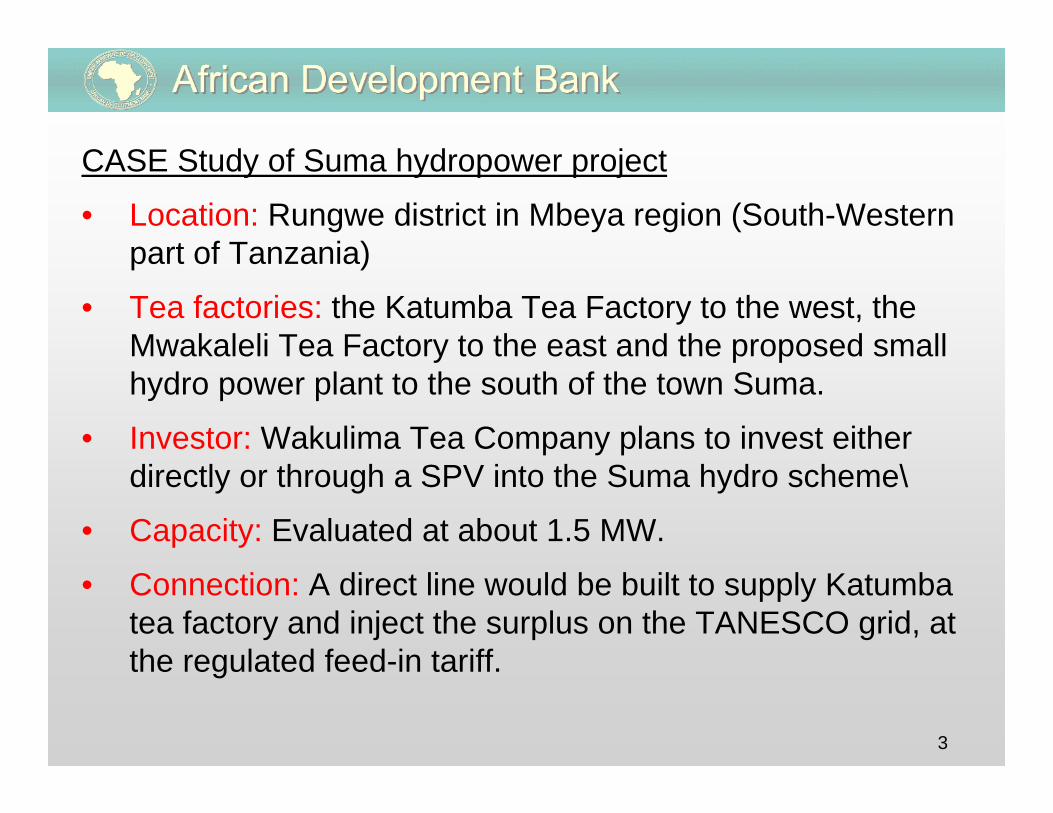
3
CASE Study of Suma hydropower project
• Location: Rungwe district in Mbeya region (South-Western part of Tanzania)
• Tea factories: the Katumba Tea Factory to the west, the Mwakaleli Tea Factory to the east and the proposed small hydro power plant to the south of the town Suma.
• Investor: Wakulima Tea Company plans to invest either directly or through a SPV into the Suma hydro scheme\
• Capacity: Evaluated at about 1.5 MW.
• Connection: A direct line would be built to supply Katumba tea factory and inject the surplus on the TANESCO grid, at the regulated feed-in tariff.
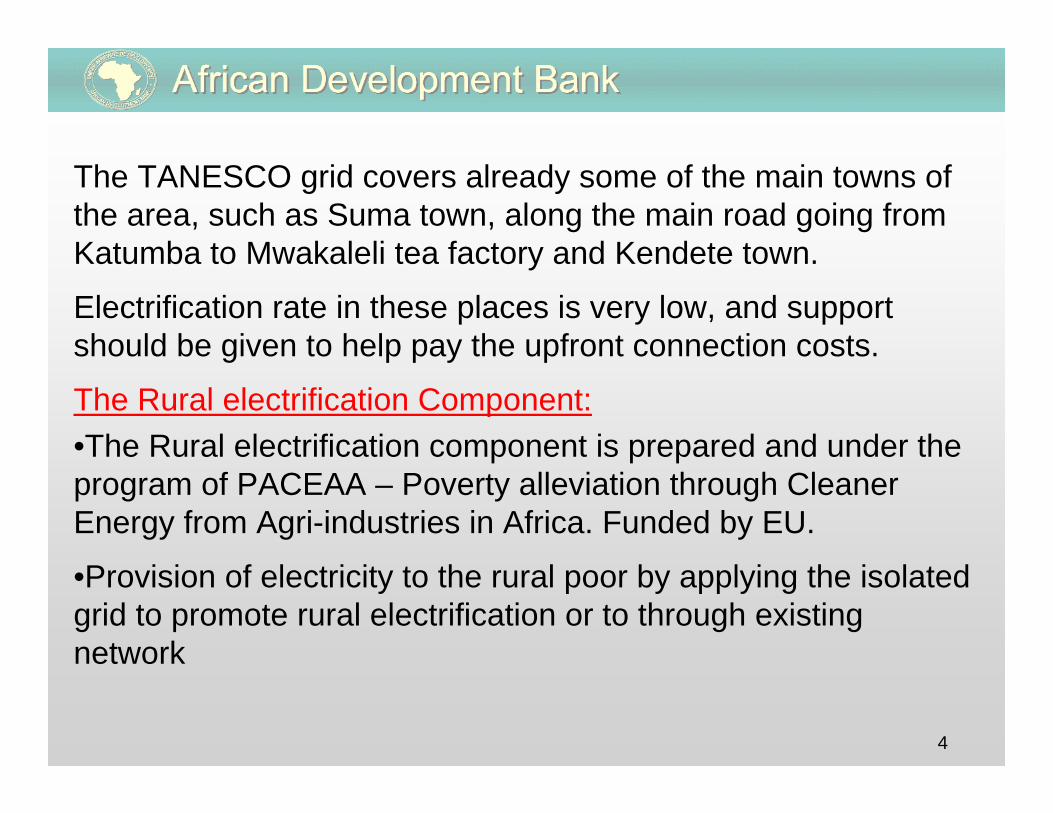
4
The TANESCO grid covers already some of the main towns of the area, such as Suma town, along the main road going from Katumba to Mwakaleli tea factory and Kendete town.
Electrification rate in these places is very low, and support should be given to help pay the upfront connection costs.
The Rural electrification Component:•The Rural electrification component is prepared and under the program of PACEAA – Poverty alleviation through Cleaner Energy from Agri-industries in Africa. Funded by EU.
•Provision of electricity to the rural poor by applying the isolated grid to promote rural electrification or to through existing network
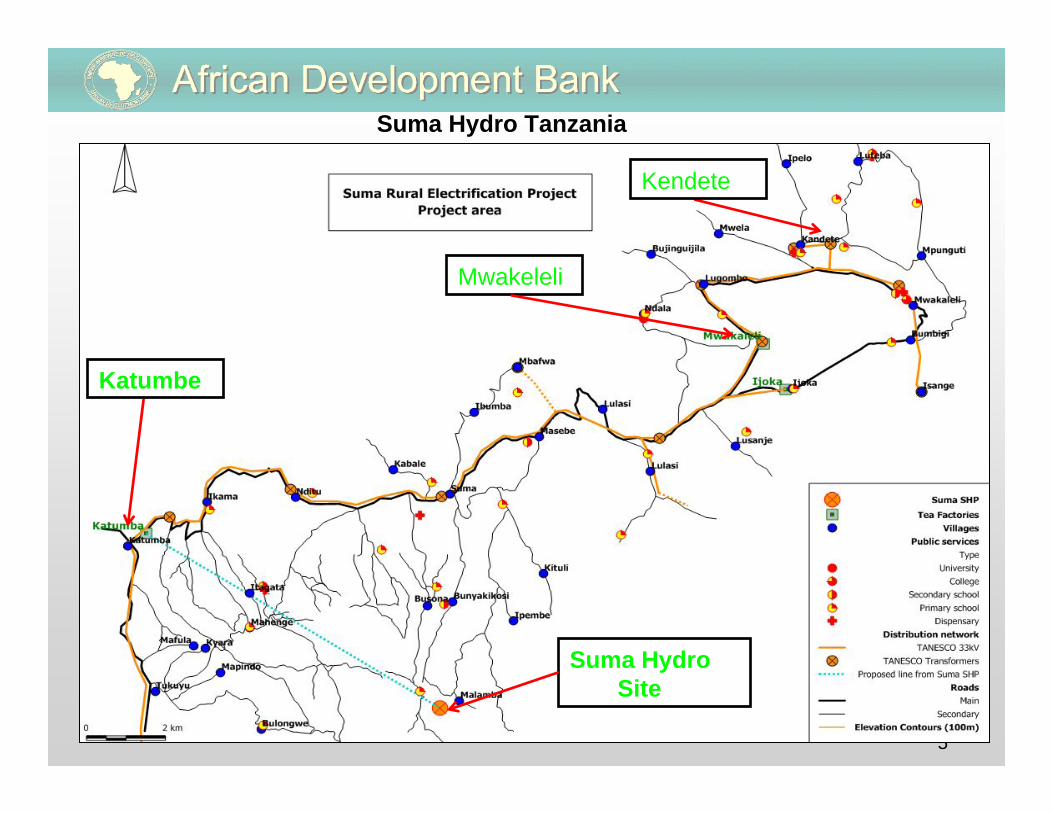
5
Suma Hydro Tanzania
Katumbe
Mwakeleli
Kendete
Suma Hydro Site
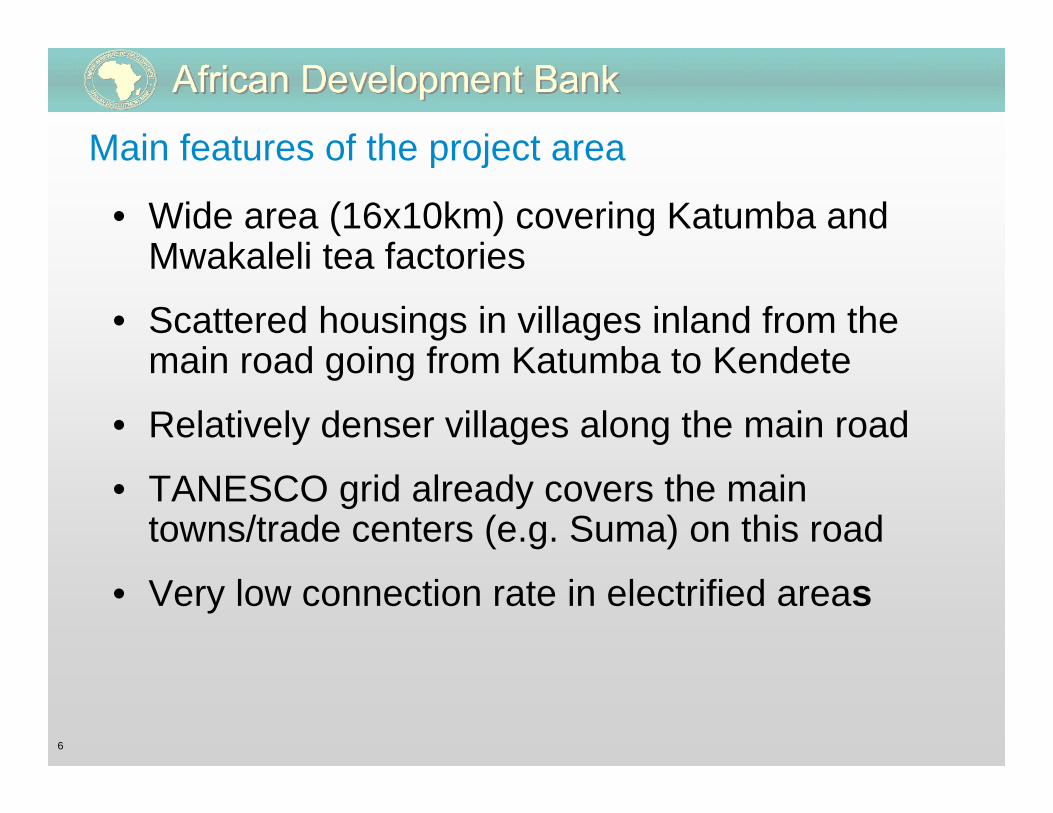
6
Main features of the project area
• Wide area (16x10km) covering Katumba and Mwakaleli tea factories
• Scattered housings in villages inland from themain road going from Katumba to Kendete
• Relatively denser villages along the main road
• TANESCO grid already covers the main towns/trade centers (e.g. Suma) on this road
• Very low connection rate in electrified areas
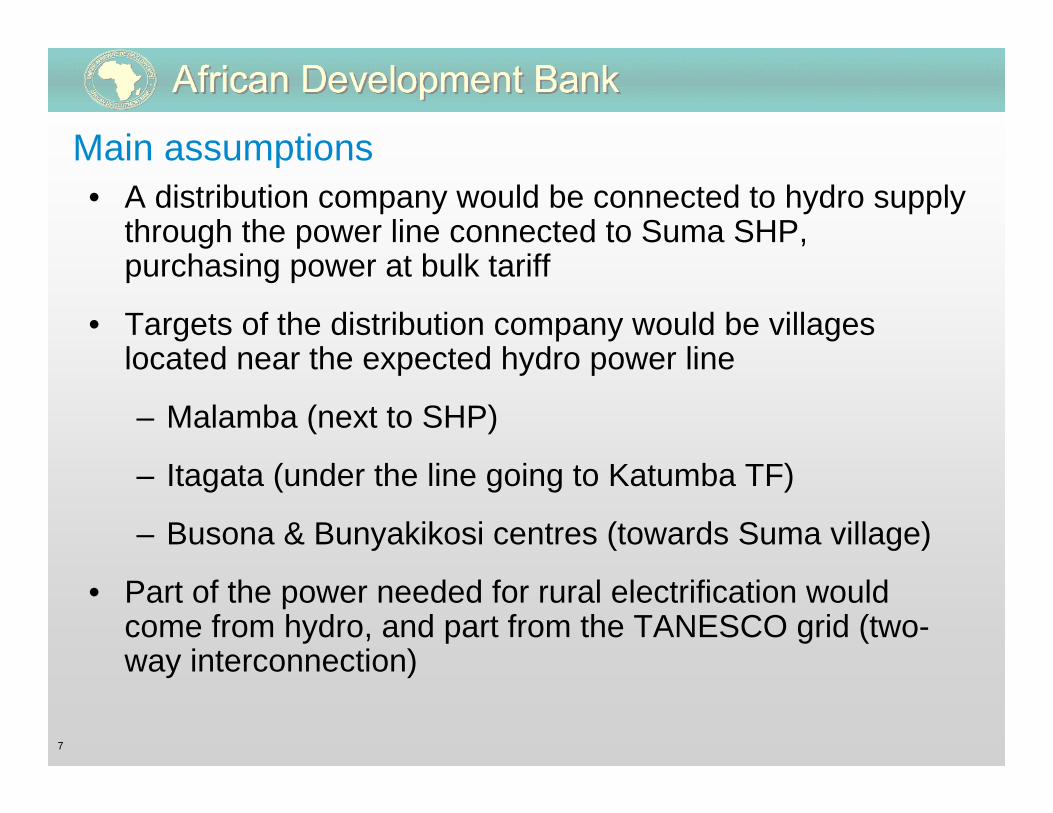
7
Main assumptions• A distribution company would be connected to hydro supply
through the power line connected to Suma SHP, purchasing power at bulk tariff
• Targets of the distribution company would be villages located near the expected hydro power line
– Malamba (next to SHP)
– Itagata (under the line going to Katumba TF)
– Busona & Bunyakikosi centres (towards Suma village)
• Part of the power needed for rural electrification would come from hydro, and part from the TANESCO grid (two-way interconnection)
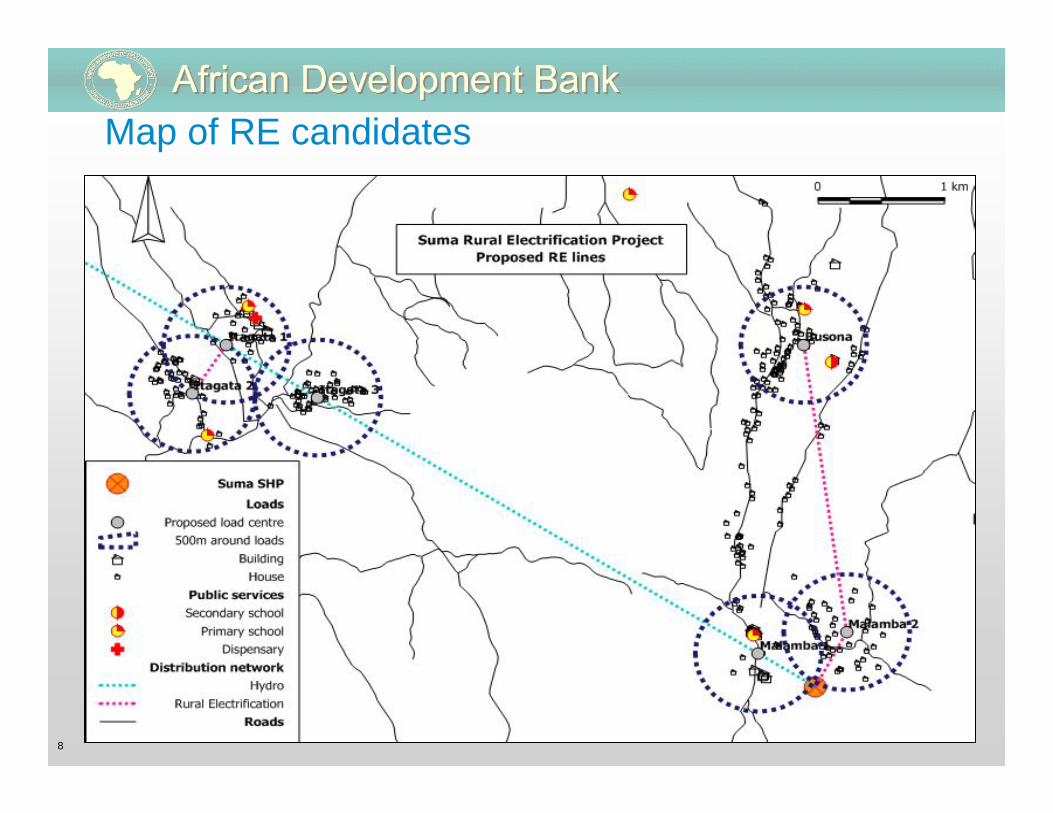
8
Map of RE candidates
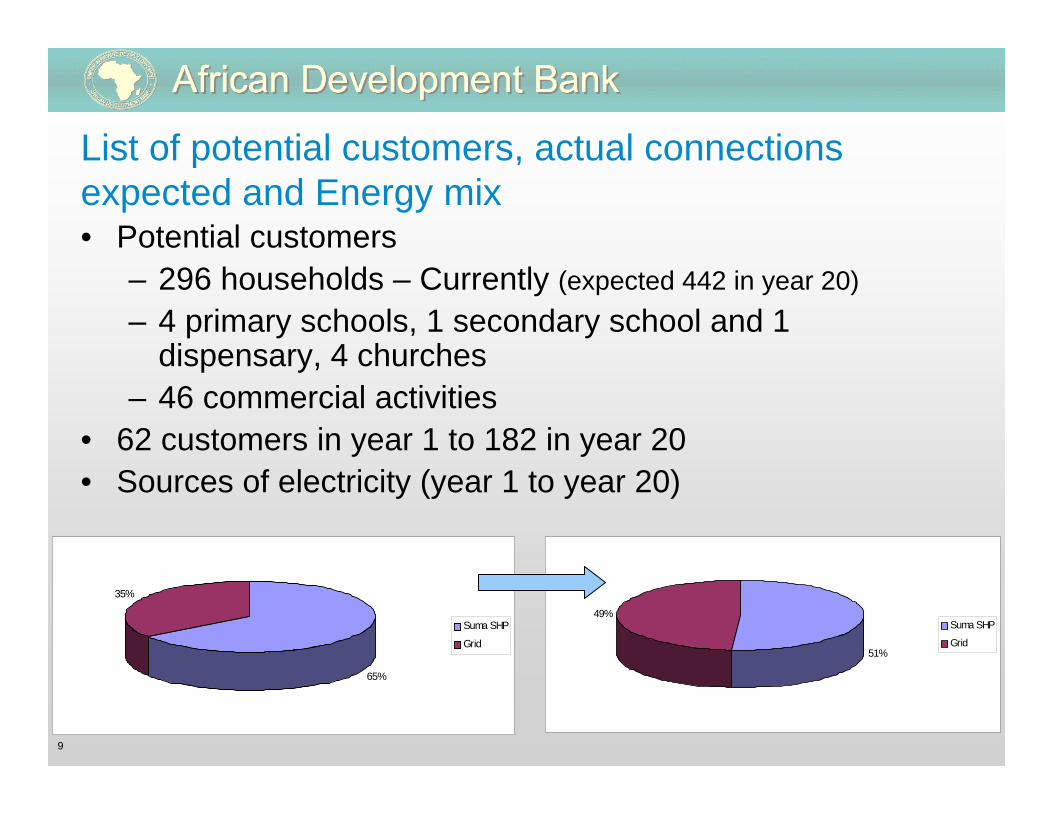
9
List of potential customers, actual connections expected and Energy mix• Potential customers
– 296 households – Currently (expected 442 in year 20)– 4 primary schools, 1 secondary school and 1
dispensary, 4 churches– 46 commercial activities
• 62 customers in year 1 to 182 in year 20• Sources of electricity (year 1 to year 20)
65%
35%
Suma SHP
Grid51%
49%Suma SHP
Grid
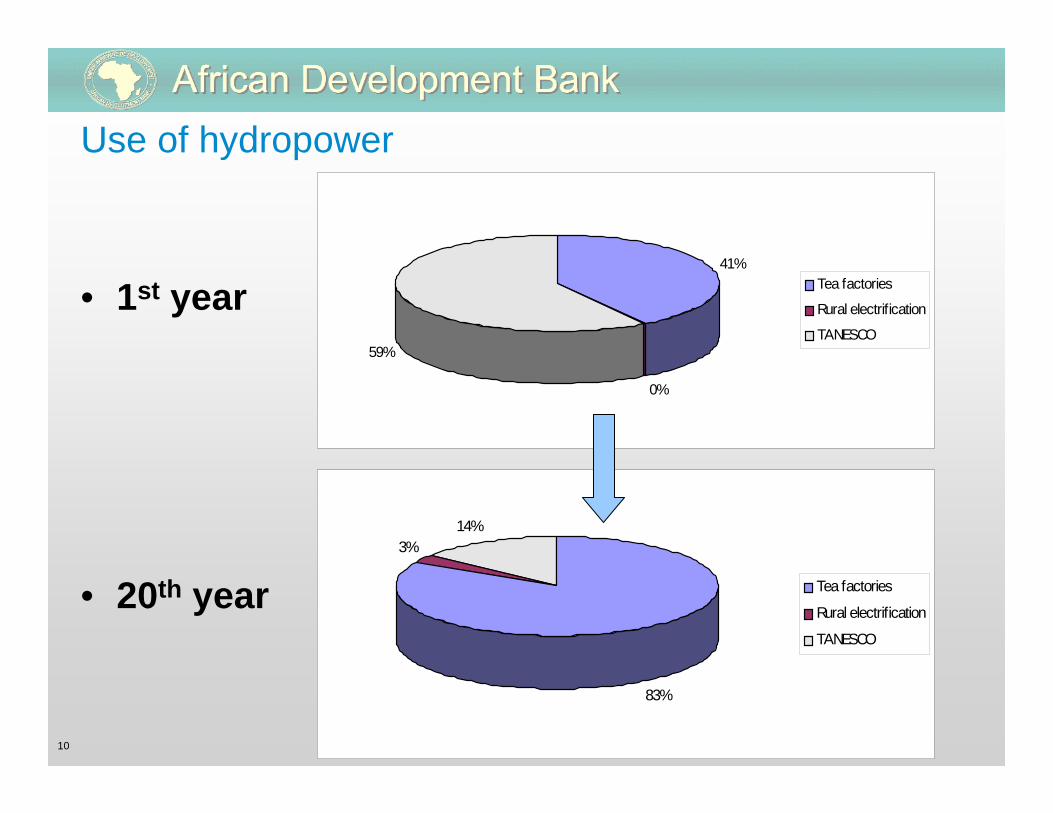
10
Use of hydropower
• 1st year
• 20th year
41%
0%
59%
Tea factories
Rural electrification
TANESCO
83%
3%14%
Tea factories
Rural electrification
TANESCO

11
Year Investment (US$)Year 1 169,000
Year 20 (over a period) 108,000
Initial Investment costs (meters, transformers, lines)
Investments
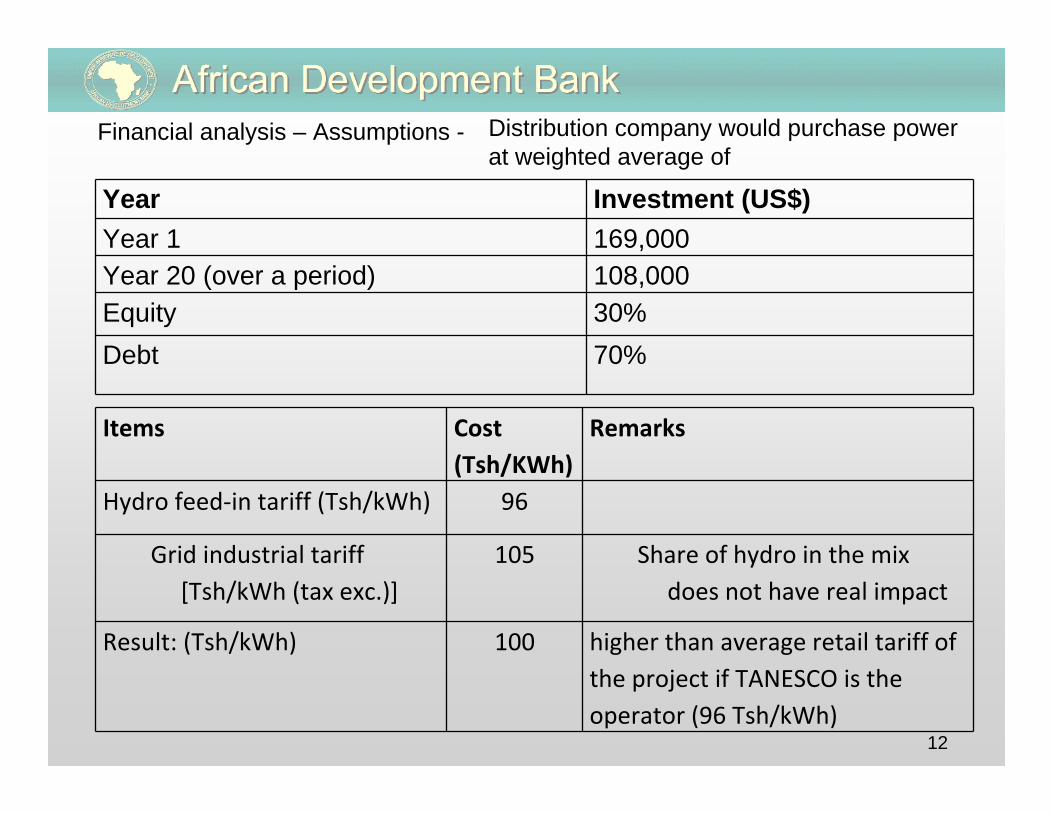
12
Year Investment (US$)Year 1 169,000Year 20 (over a period) 108,000Equity 30%Debt 70%
Items Cost (Tsh/KWh)
Remarks
Hydro feed‐in tariff (Tsh/kWh) 96
Grid industrial tariff[Tsh/kWh (tax exc.)]
105 Share of hydro in the mix does not have real impact
Result: (Tsh/kWh) 100 higher than average retail tariff of the project if TANESCO is the operator (96 Tsh/kWh)
Financial analysis – Assumptions - Distribution company would purchase power at weighted average of
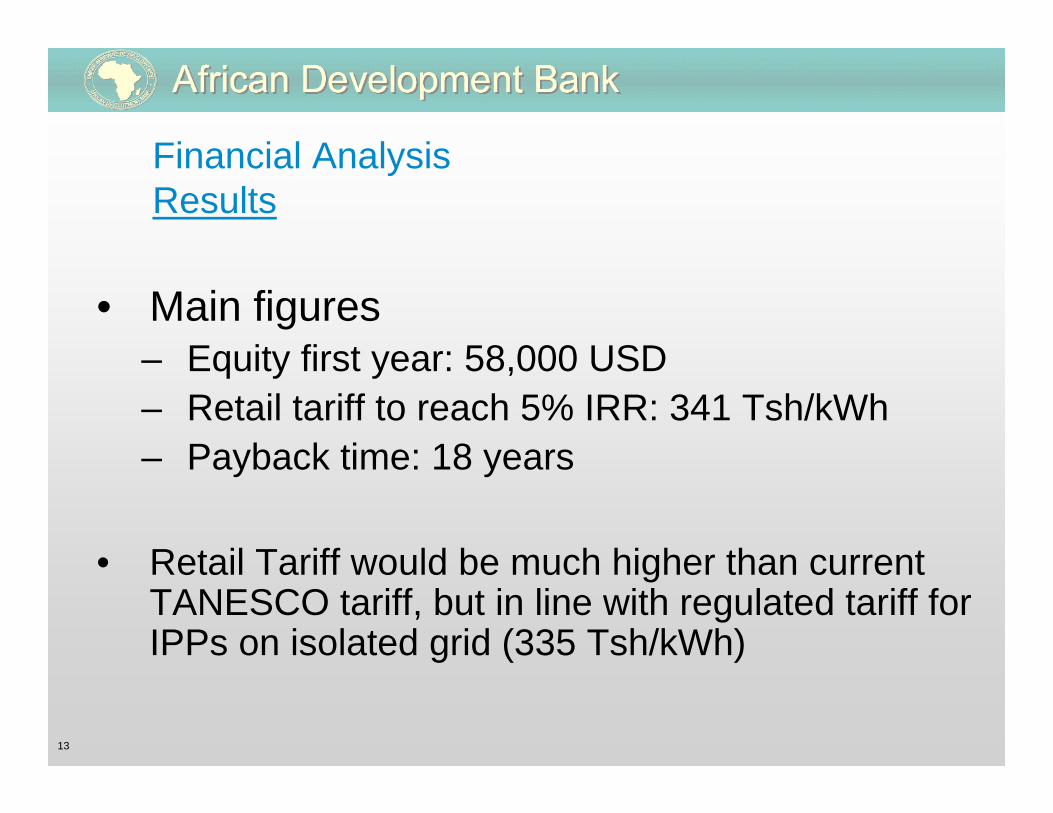
13
Financial Analysis Results
• Main figures– Equity first year: 58,000 USD– Retail tariff to reach 5% IRR: 341 Tsh/kWh– Payback time: 18 years
• Retail Tariff would be much higher than current TANESCO tariff, but in line with regulated tariff for IPPs on isolated grid (335 Tsh/kWh)
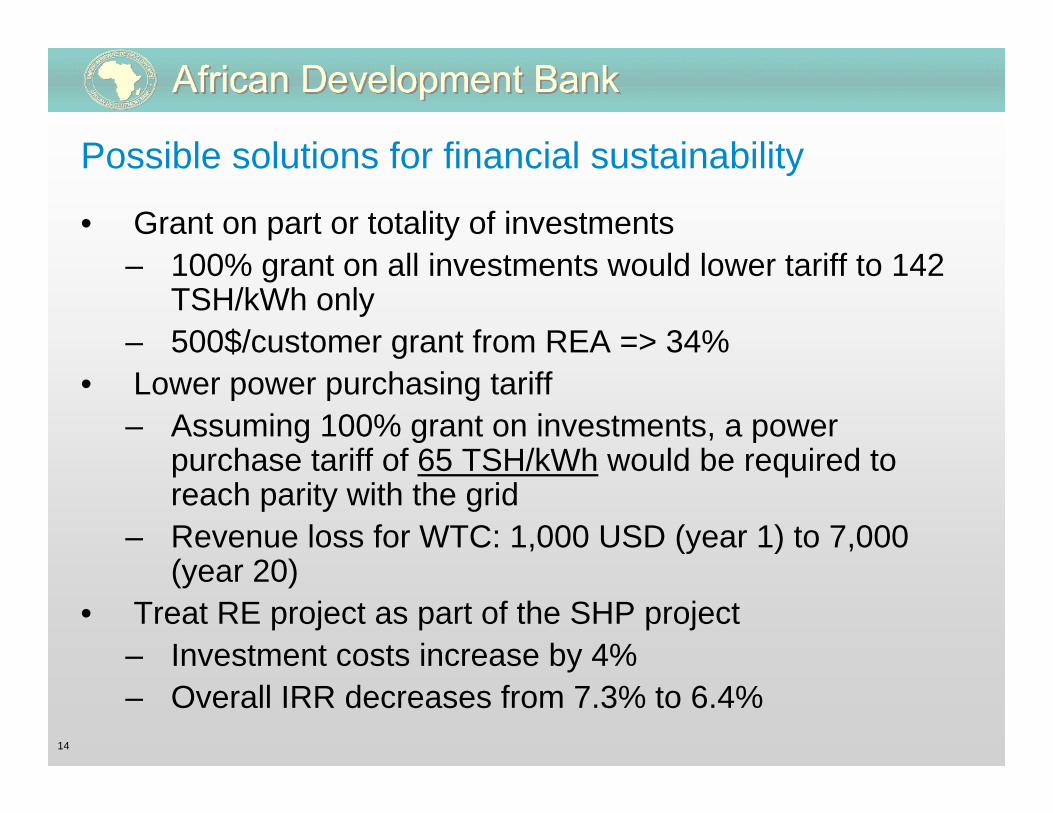
14
Possible solutions for financial sustainability
• Grant on part or totality of investments– 100% grant on all investments would lower tariff to 142
TSH/kWh only– 500$/customer grant from REA => 34%
• Lower power purchasing tariff– Assuming 100% grant on investments, a power
purchase tariff of 65 TSH/kWh would be required to reach parity with the grid
– Revenue loss for WTC: 1,000 USD (year 1) to 7,000 (year 20)
• Treat RE project as part of the SHP project– Investment costs increase by 4%– Overall IRR decreases from 7.3% to 6.4%
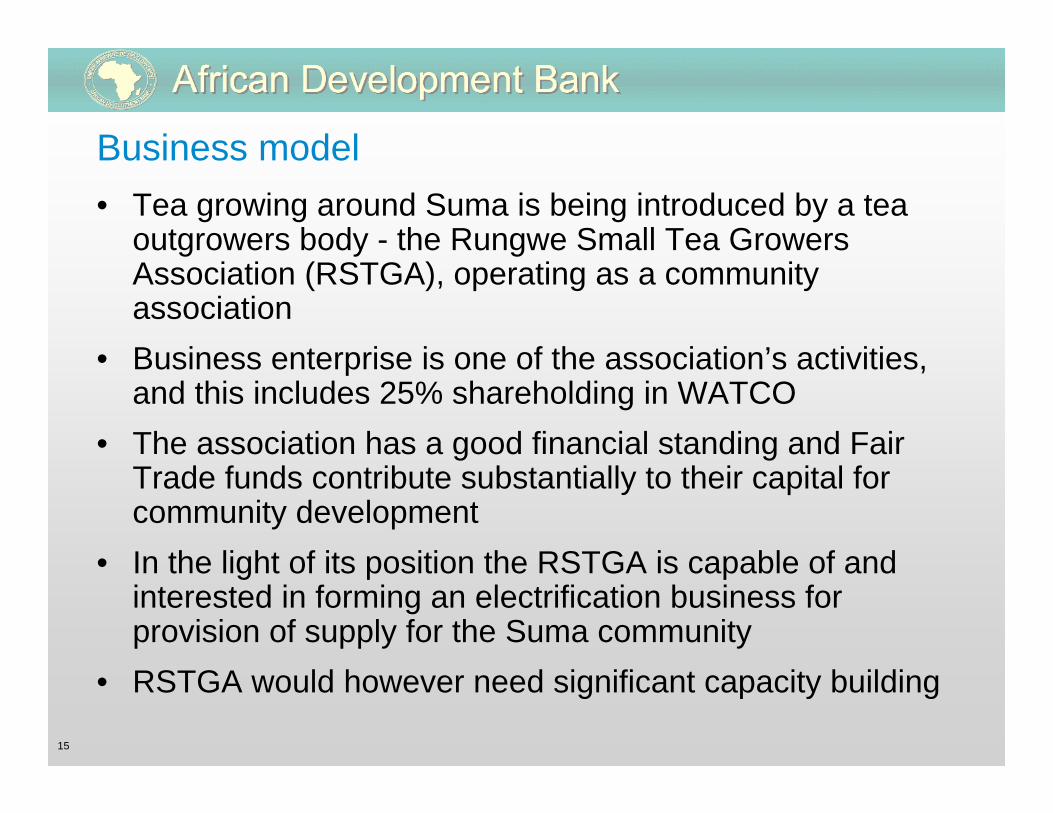
15
Business model• Tea growing around Suma is being introduced by a tea
outgrowers body - the Rungwe Small Tea Growers Association (RSTGA), operating as a community association
• Business enterprise is one of the association’s activities, and this includes 25% shareholding in WATCO
• The association has a good financial standing and Fair Trade funds contribute substantially to their capital for community development
• In the light of its position the RSTGA is capable of and interested in forming an electrification business for provision of supply for the Suma community
• RSTGA would however need significant capacity building

16
Financial Analysis - Results
• Main figures– Equity first year: 58,000 USD– Retail tariff to reach 5% IRR: 341 TSH/kWh– Payback time: 18 years
• Retail Tariff would be much higher than current TANESCO tariff, but in line with regulated tariff for IPPs on isolated grid (335 TSH/kWh)

17
Next steps
• Possibility is being sought for an international energy firm that is working with RSTGA on a Combination of various energy resources (solar, wind hydro, cogen), to form a joint company with RSTGA
• The joint company would carry out electrification while the international company builds RSTGA’s capacity for power business management
• If this approach succeeds, scale up program will prepared for diplication in other countries (proposal to REA)
• Execution of implementation plan by the joint venture• Operate and manage power business jointly and eventually
transfer fully to RSTGA
THANK YOU
Sidi Salem hydro-electric,Tunisia – Photo –Youssef Arfaoui18
Cogeneration for Africa Project
AFREPREN/FWDP.O Box 30979 – 00100 GPO
Nairobi, KenyaTel: +254 ‐20‐3866032
Email: [email protected]: http://cogen.unep.org
AFREPREN/FWDEnergy, Environment and Development Network for Africa
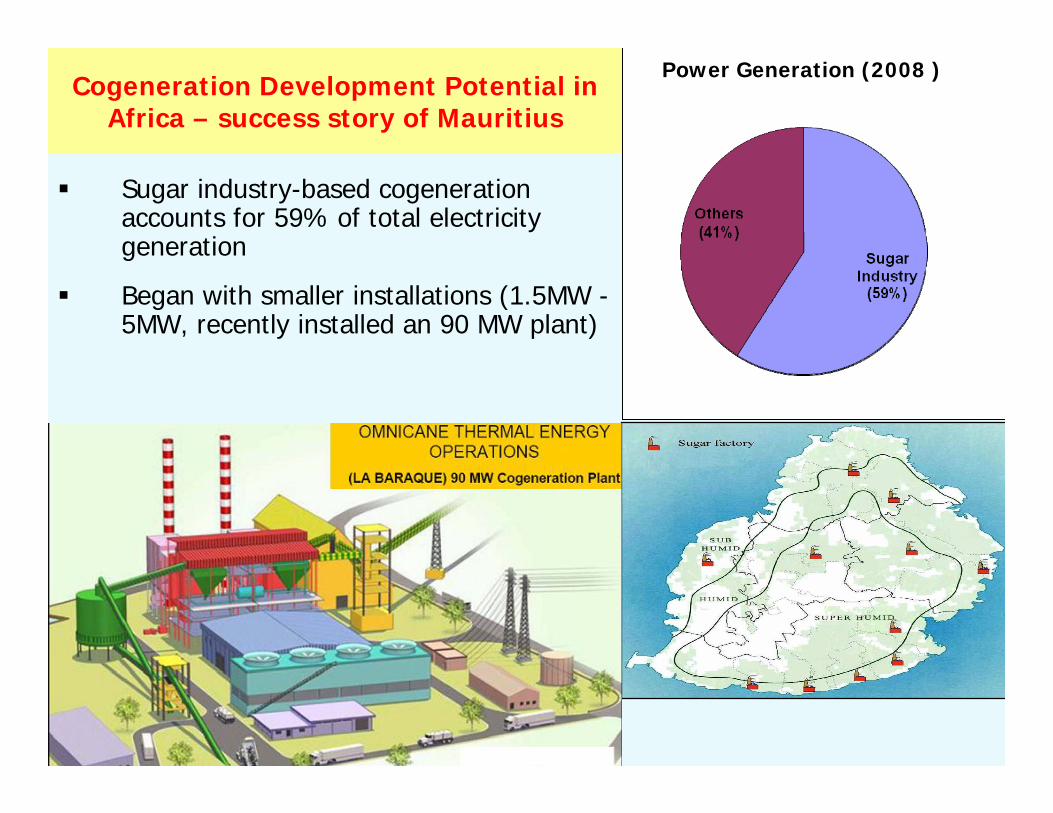
www.afrepren.orghttp://cogen.unep.org
Cogeneration Development Potential in Africa – success story of Mauritius
Sugar industry-based cogeneration accounts for 59% of total electricity generation
Began with smaller installations (1.5MW -5MW, recently installed an 90 MW plant)
Power Generation (2008 )
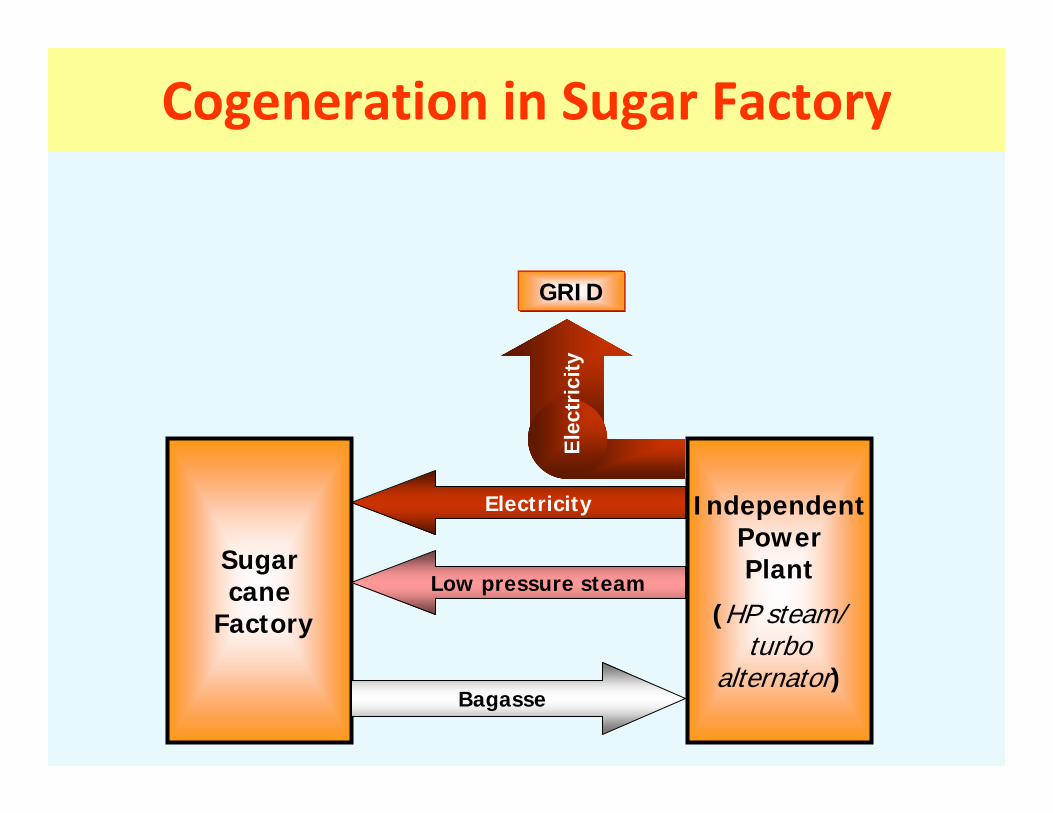
Sugarcane
Factory
Bagasse
Low pressure steam
GRID
Electricity IndependentPowerPlant
(HP steam/turbo
alternator)
Elec
tric
ity
Cogeneration in Sugar Factory

www.afrepren.orghttp://cogen.unep.org
Cogeneration Potential in Selected Countries & Africa‐wide
0.00
5.00
10.00
15.00
20.00
25.00
30.00
35.00
40.00
45.00
50.00
55.00
60.00
65.00
Baggase Cogeneration Potential as a % of Electricity Demand
Sugar industry
Sugar industry + Agro + Forestry industries
Sugar industry + Agro + Forestry industries + Cement + Steel + Oil &
gas, etc
5 %
10 %
20 %
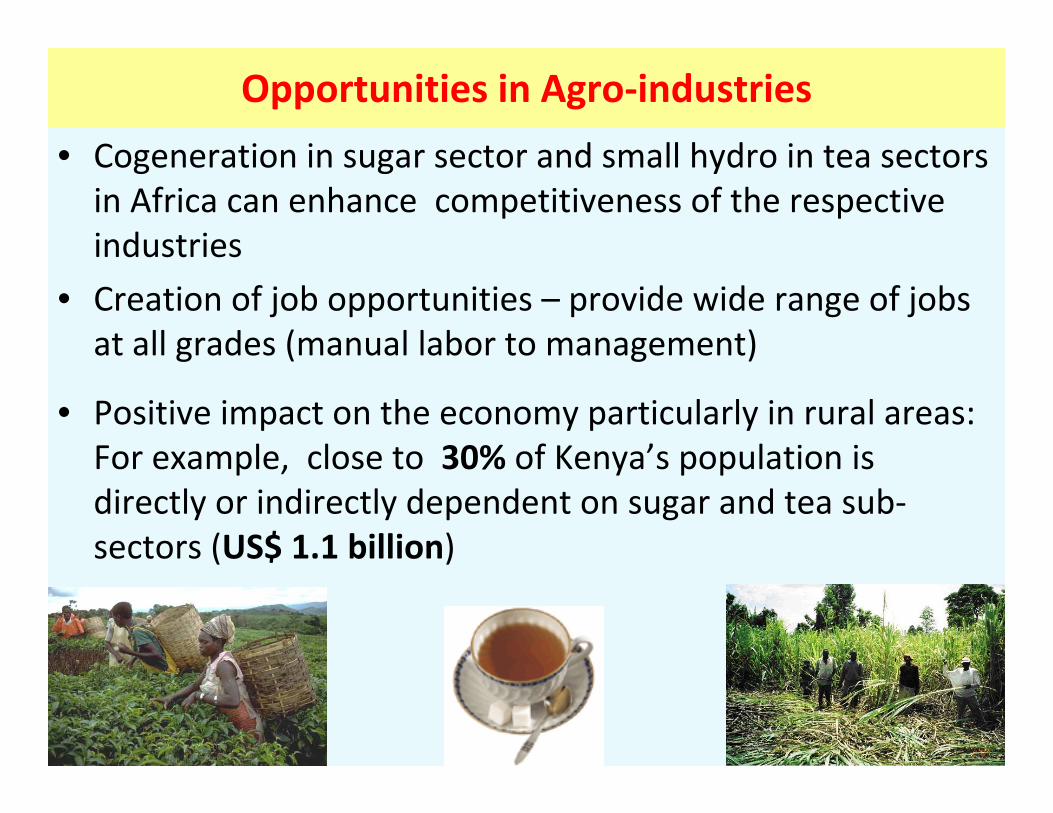
• Cogeneration in sugar sector and small hydro in tea sectors in Africa can enhance competitiveness of the respective industries
• Creation of job opportunities – provide wide range of jobs at all grades (manual labor to management)
• Positive impact on the economy particularly in rural areas: For example, close to 30% of Kenya’s population is directly or indirectly dependent on sugar and tea sub‐sectors (US$ 1.1 billion)
Opportunities in Agro‐industries
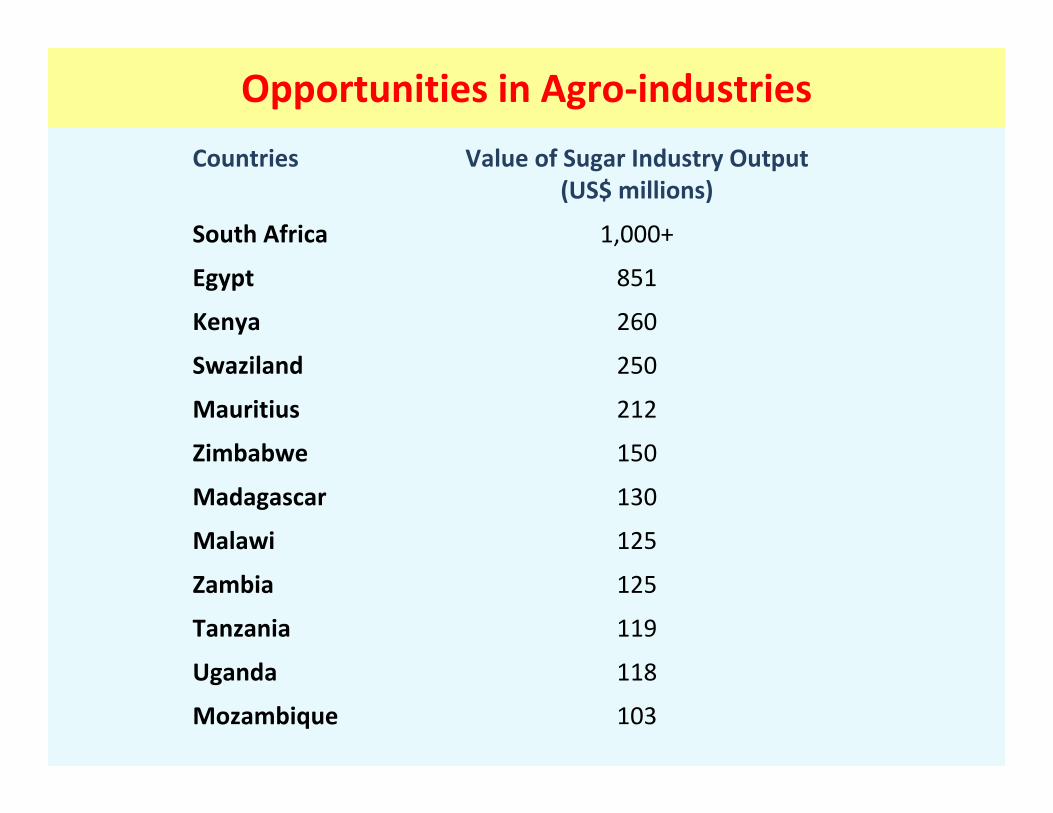
Opportunities in Agro‐industries
Countries Value of Sugar Industry Output(US$ millions)
South Africa 1,000+
Egypt 851
Kenya 260
Swaziland 250
Mauritius 212
Zimbabwe 150
Madagascar 130
Malawi 125
Zambia 125
Tanzania 119
Uganda 118
Mozambique 103

Kenya
Lesotho
South Africa
Zambia
Comoros
Mauritius
Sao Tome and Principe
Sudan
Ethiopia
EgyptLibya
DR Congo
Algeria
Tanzania
ChadNigerMali
Mauritania
NamibiaBotswana
Angola
Zimbabwe
Nigeria
Burkina Faso
Cote d’IvoreSierra Leone
Swaziland
GuineaGuinea Bissau
SenegalThe Gambia
Rwanda
Burundi
Djibouti
Countries Affected by Power Shortages in Africa
Recurrent power crises pushing countries to enact STANDARD FEED-IN TARIFFS

Cogeneration Development Targets – Cogen for Africa
6 year project period +4 years
40 MW
20 MW
40 MW
200 MW
+10 years
+746 MW
22 MW
42 MW
25 MW
Capacity Realized in last 3 years
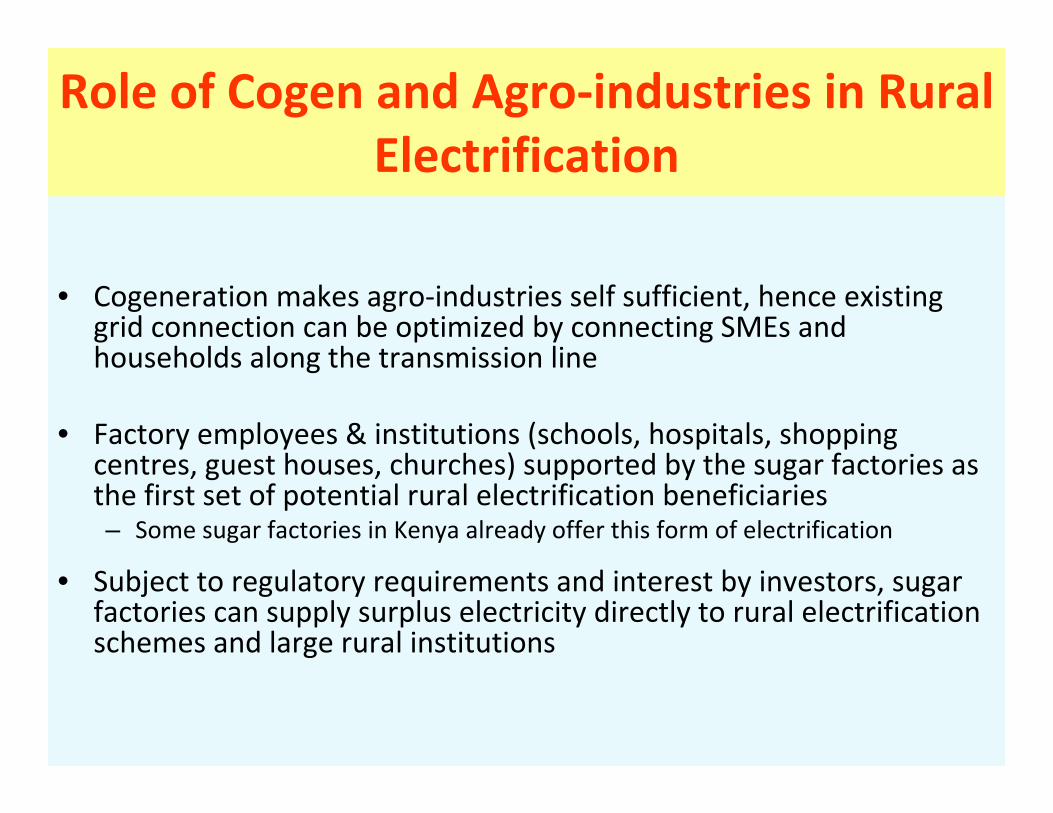
Role of Cogen and Agro‐industries in Rural Electrification
• Cogeneration makes agro‐industries self sufficient, hence existing grid connection can be optimized by connecting SMEs and households along the transmission line
• Factory employees & institutions (schools, hospitals, shopping centres, guest houses, churches) supported by the sugar factories as the first set of potential rural electrification beneficiaries– Some sugar factories in Kenya already offer this form of electrification
• Subject to regulatory requirements and interest by investors, sugar factories can supply surplus electricity directly to rural electrification schemes and large rural institutions
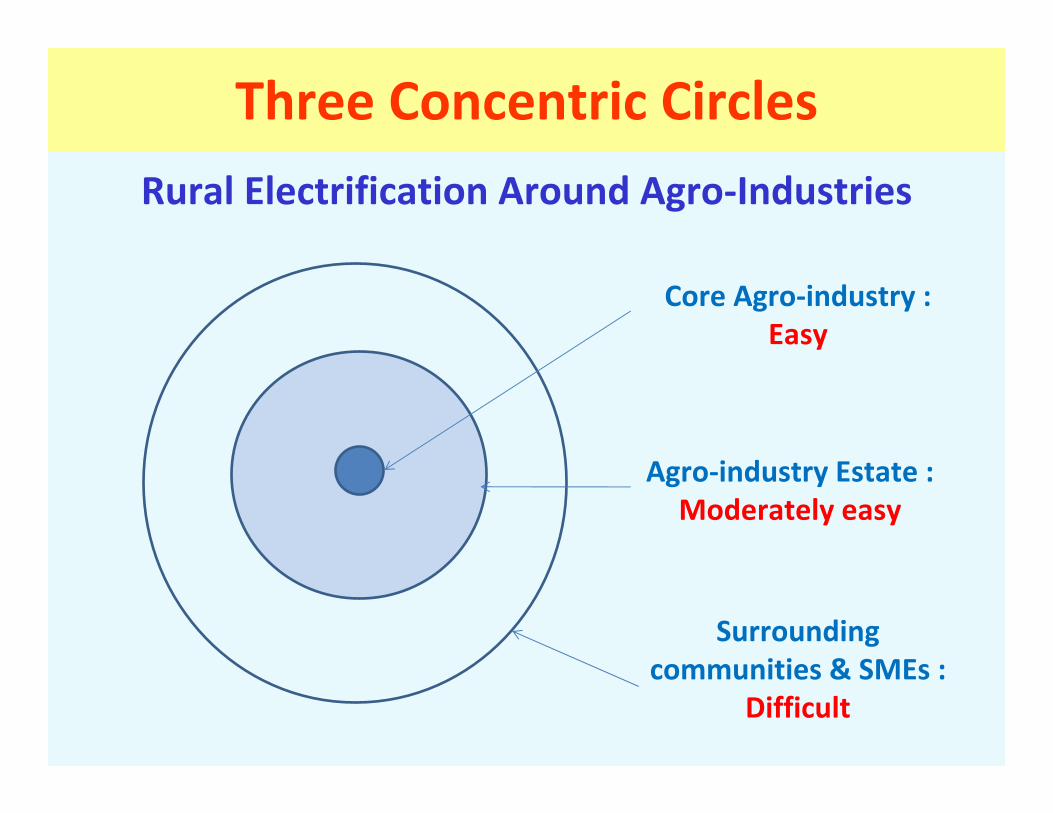
Three Concentric Circles
Rural Electrification Around Agro‐Industries
Core Agro‐industry : Easy
Agro‐industry Estate : Moderately easy
Surrounding communities & SMEs :
Difficult

Opportunities in Agro‐industries

Case Study
Rural Electrification Around Sugar Factory
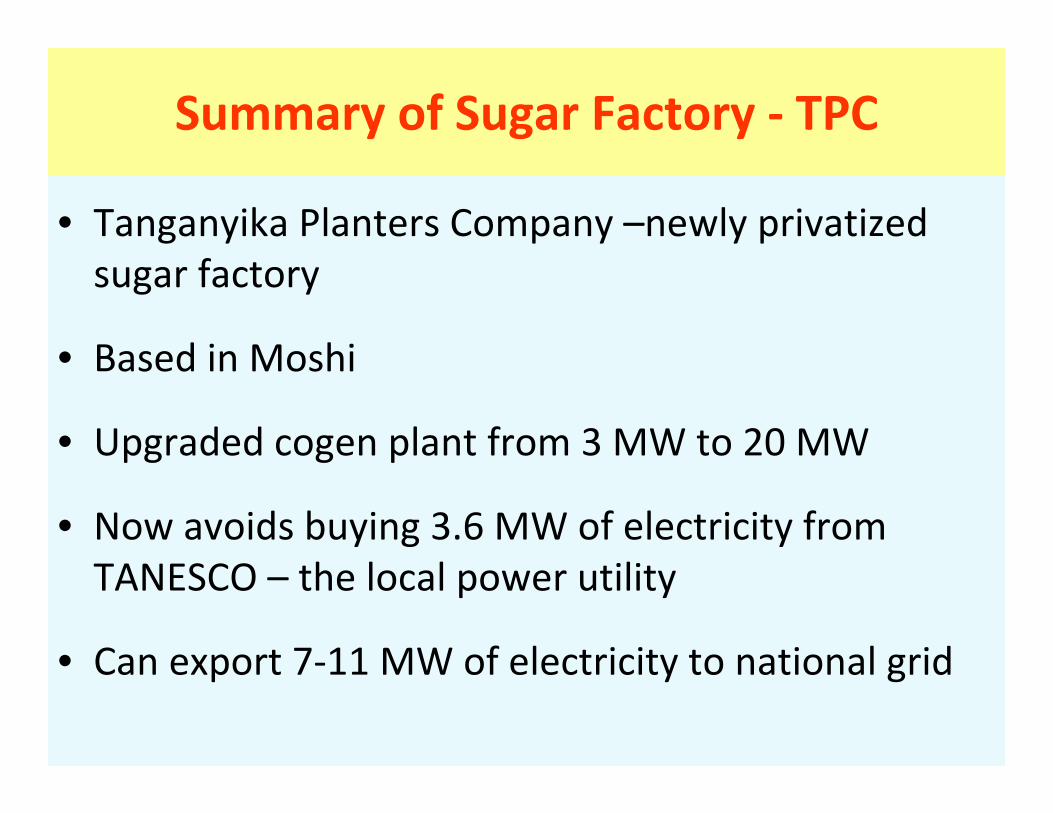
Summary of Sugar Factory ‐ TPC
• Tanganyika Planters Company –newly privatized sugar factory
• Based in Moshi
• Upgraded cogen plant from 3 MW to 20 MW
• Now avoids buying 3.6 MW of electricity from TANESCO – the local power utility
• Can export 7‐11 MW of electricity to national grid

Three Concentric Circles
Rural Electrification Around Agro‐Industries
Core Agro‐industry : Easy
Agro‐industry Estate : Moderately easy
Surrounding communities & SMEs :
Difficult
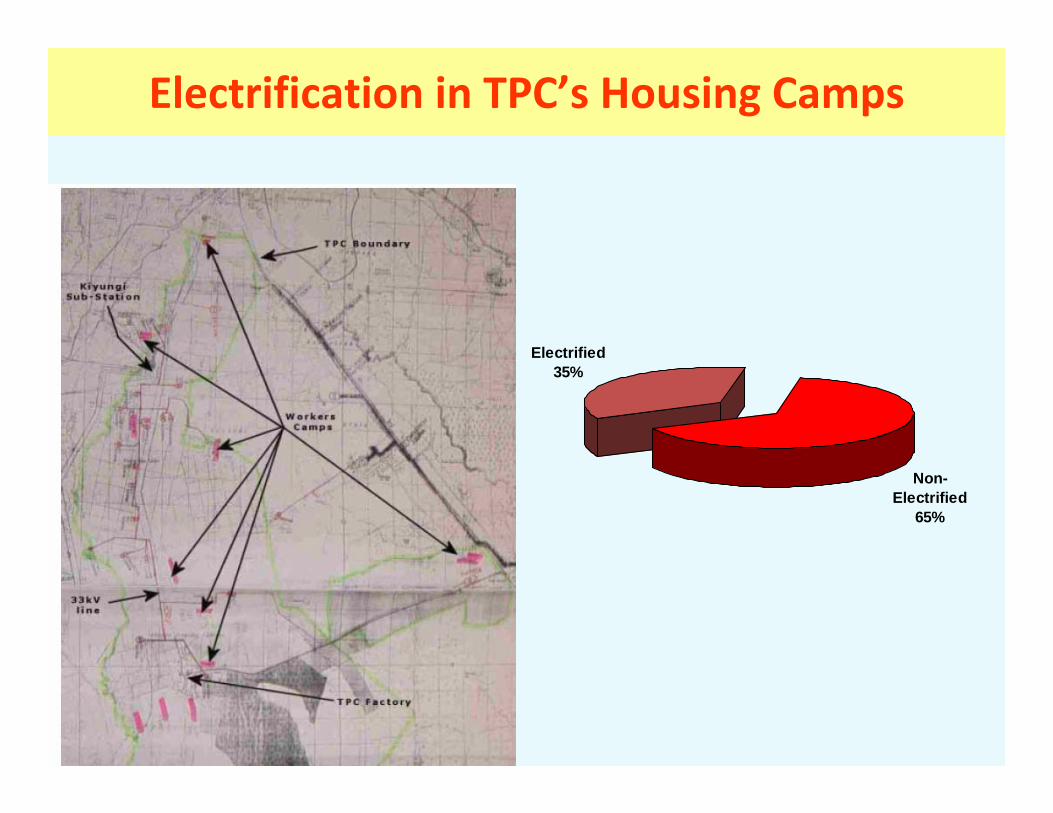
Electrification in TPC’s Housing Camps
Non-Electrified
65%
Electrified35%

Households Electricity Use
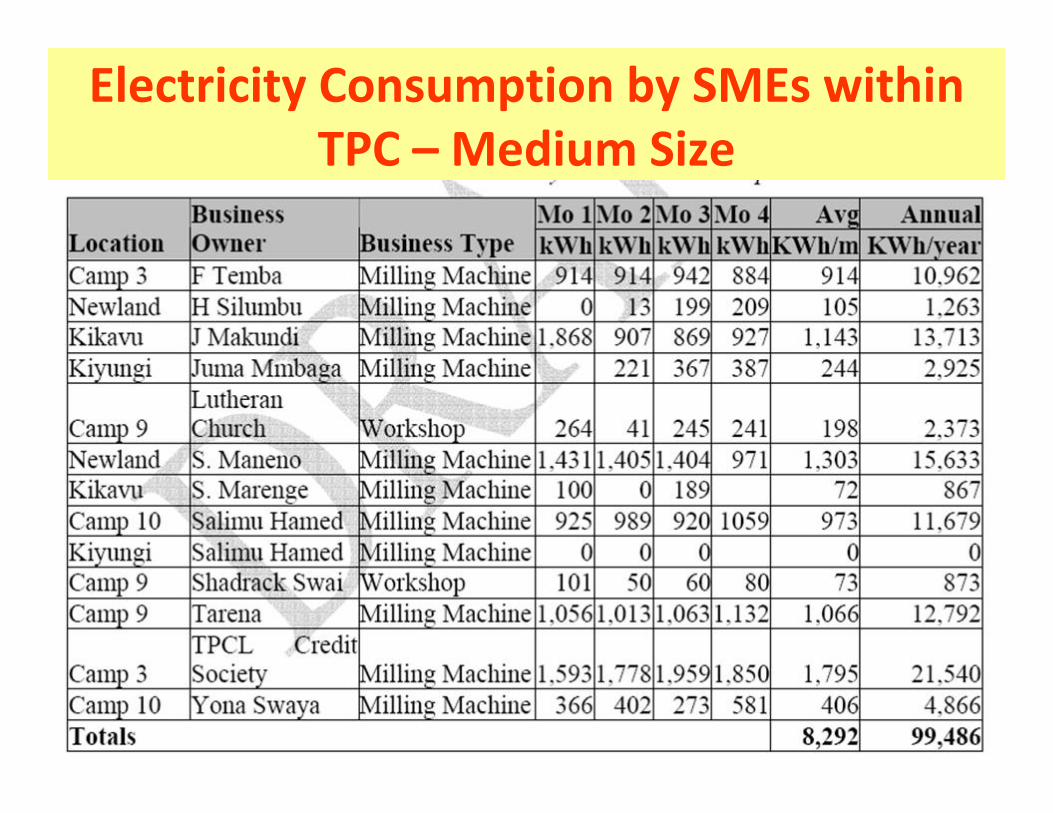
Electricity Consumption by SMEs within TPC – Medium Size
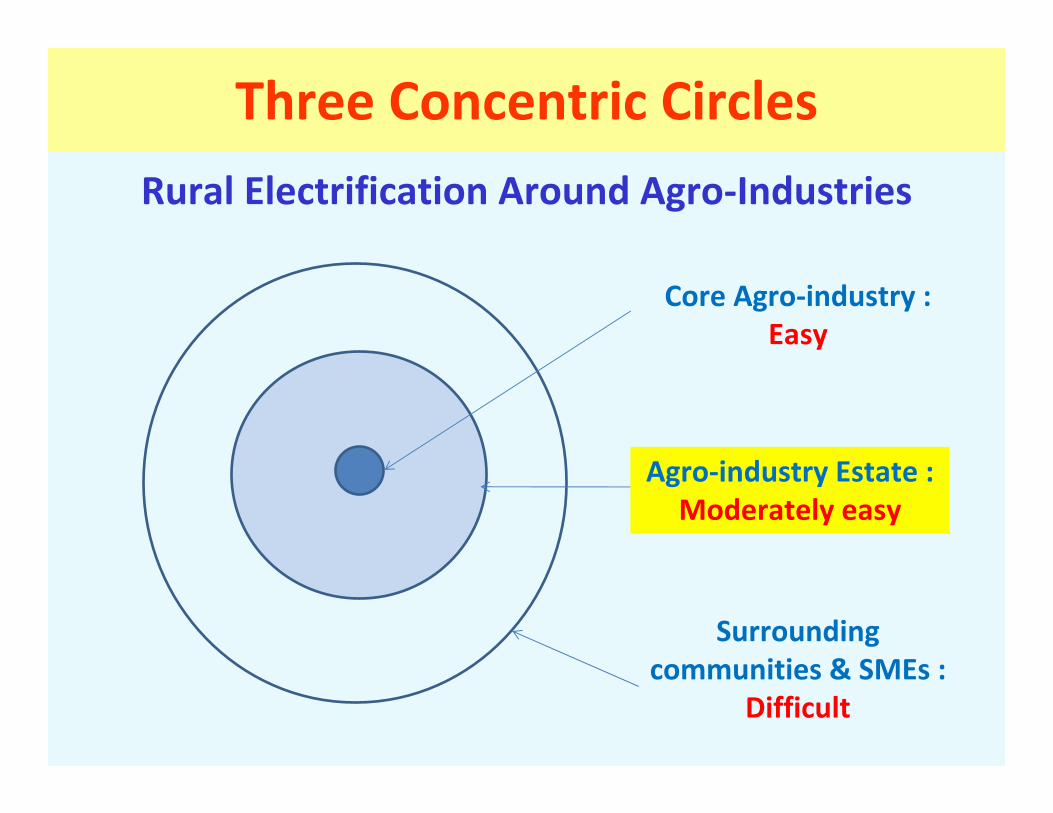
Three Concentric Circles
Rural Electrification Around Agro‐Industries
Core Agro‐industry : Easy
Agro‐industry Estate : Moderately easy
Surrounding communities & SMEs :
Difficult
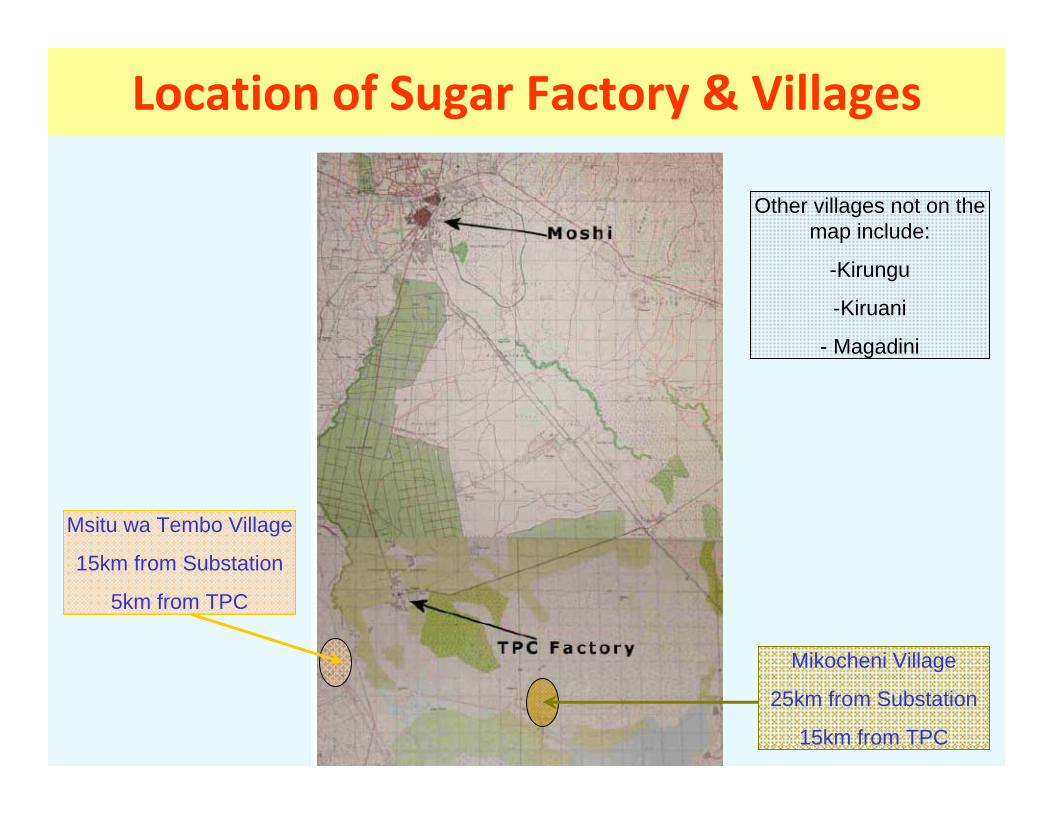
Location of Sugar Factory & Villages
Msitu wa Tembo Village
15km from Substation
5km from TPC
Mikocheni Village
25km from Substation
15km from TPC
Other villages not on the map include:
-Kirungu
-Kiruani
- Magadini

Appliances Used by SMEs
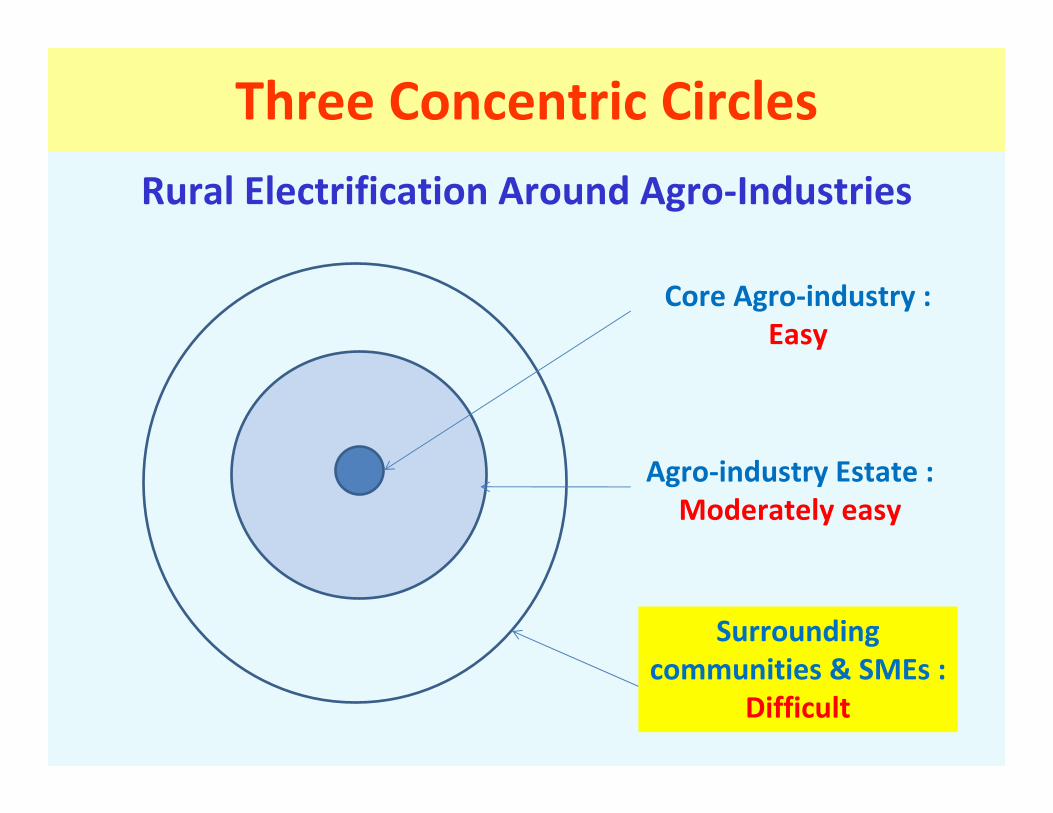
Three Concentric Circles
Rural Electrification Around Agro‐Industries
Core Agro‐industry : Easy
Agro‐industry Estate : Moderately easy
Surrounding communities & SMEs :
Difficult
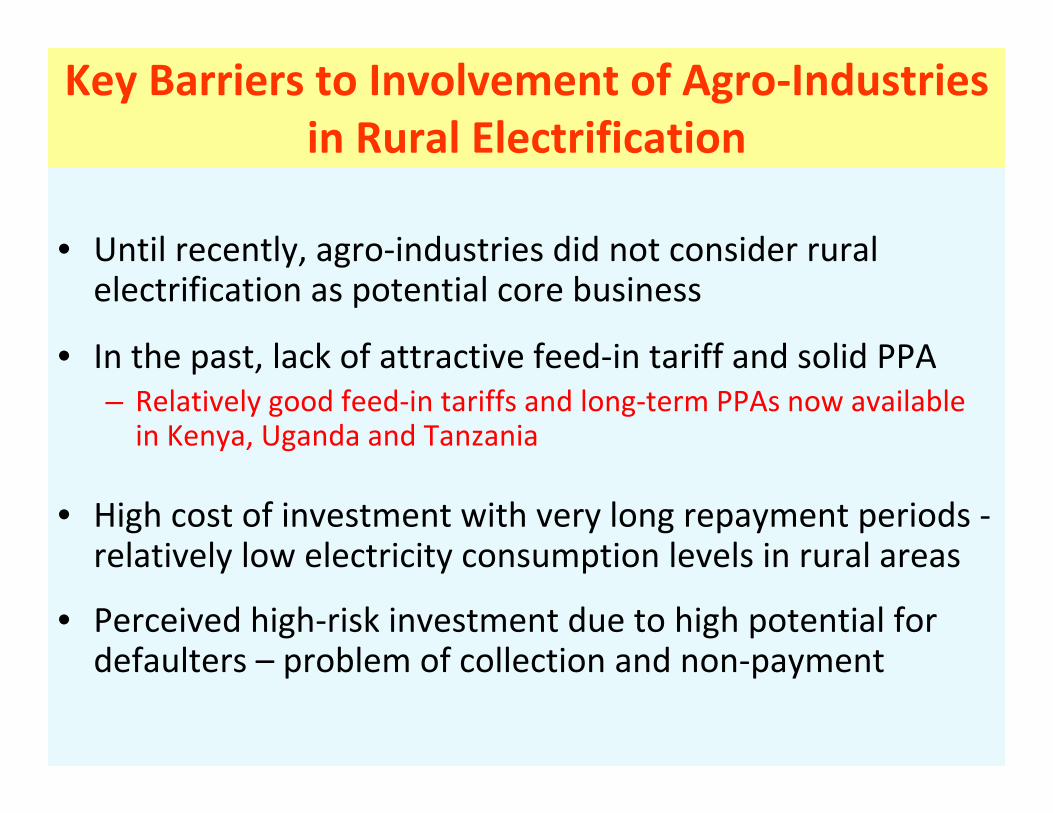
Key Barriers to Involvement of Agro‐Industries in Rural Electrification
• Until recently, agro‐industries did not consider rural electrification as potential core business
• In the past, lack of attractive feed‐in tariff and solid PPA– Relatively good feed‐in tariffs and long‐term PPAs now available in Kenya, Uganda and Tanzania
• High cost of investment with very long repayment periods ‐relatively low electricity consumption levels in rural areas
• Perceived high‐risk investment due to high potential for defaulters – problem of collection and non‐payment
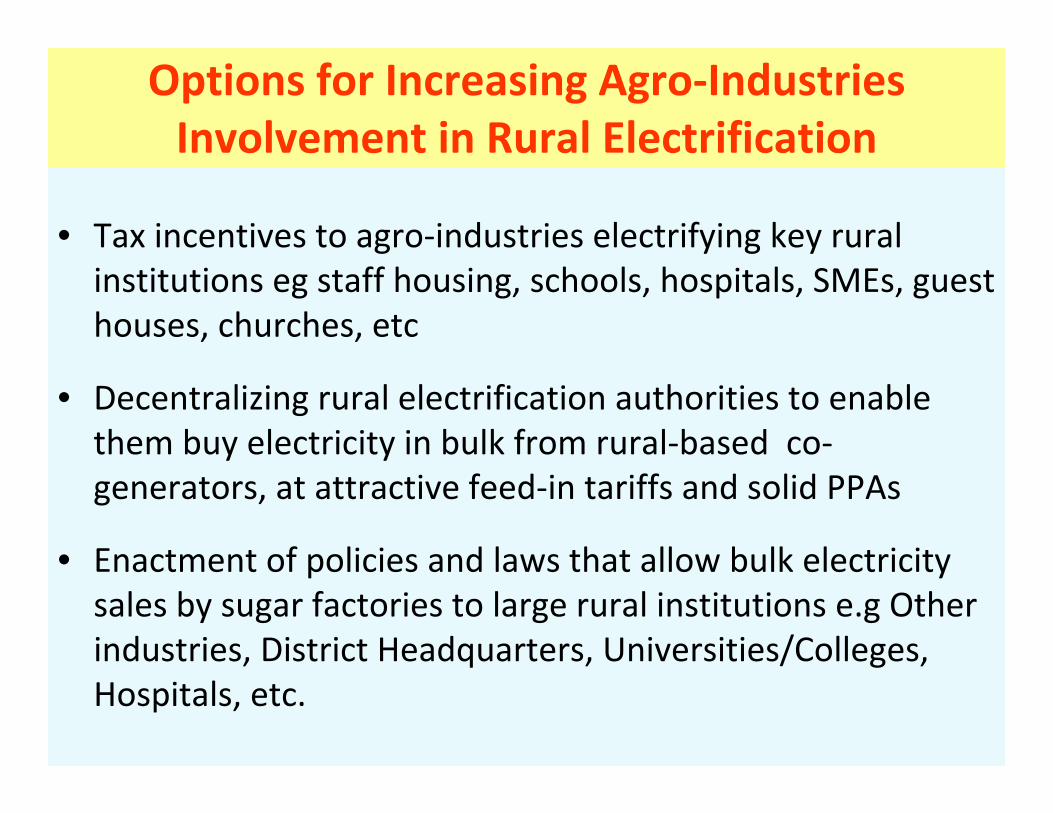
Options for Increasing Agro‐Industries Involvement in Rural Electrification
• Tax incentives to agro‐industries electrifying key rural institutions eg staff housing, schools, hospitals, SMEs, guest houses, churches, etc
• Decentralizing rural electrification authorities to enable them buy electricity in bulk from rural‐based co‐generators, at attractive feed‐in tariffs and solid PPAs
• Enactment of policies and laws that allow bulk electricity sales by sugar factories to large rural institutions e.g Other industries, District Headquarters, Universities/Colleges, Hospitals, etc.

Overcoming Barriers to Electrification Challenge in Africa
• In many sub‐Saharan African countries, population growth outpacing electricity connection rate
• Number of sub‐Saharan Africans with no electricity increasing every year
• Need for some radical approaches
• Two important options: – Strengthen traditional rural electrification approach as done in much of South Africa, North Africa, Asia and Latin America.
– For private sector, allow free and variable tariffs and remove most licence requirements for installations and distribution mini‐grids of less than 1MW (later to be raised to 5MW) –example of Nepal.

Cogeneration for Africa Project
AFREPREN/FWDP.O Box 30979 – 00100 GPO
Nairobi, KenyaTel: +254 ‐20‐3866032
Email: [email protected]: http://cogen.unep.org
AFREPREN/FWDEnergy, Environment and Development Network for Africa
e8-G
EF-U
ND
ESA
Fin
anci
ng S
usta
inab
le R
ural
Ele
ctrif
icat
ion
HC
B In
itiat
ive
Afr
ica
Dia
logu
es, A
pril
13-1
5, 2
010,
Nai
robi
, Ken
ya
e8-GEF-UNDESA Financing Rural Sustainable Electrification
Africa DialoguesNairobi, Kenya, April 13-15, 2010
Opportunities & Challenges
Marina Pannekeet, Investment Officer, Structured Finance Energy, FMO, the Netherlands

e8-G
EF-U
ND
ESA
Fin
anci
ng S
usta
inab
le R
ural
Ele
ctrif
icat
ion
HC
B In
itiat
ive
Afr
ica
Dia
logu
es, A
pril
13-1
5, 2
010,
Nai
robi
, Ken
ya
Vision FMO
The Netherlands Development Finance Company (FMO)
• Invests risk capital (equity and debt)
• infra‐ and energy projects, financial institutions & in companies,
• In developing countries/emerging markets, including LDCs
Goal: Create flourishing enterprises which can serve as engines for sustainable growth
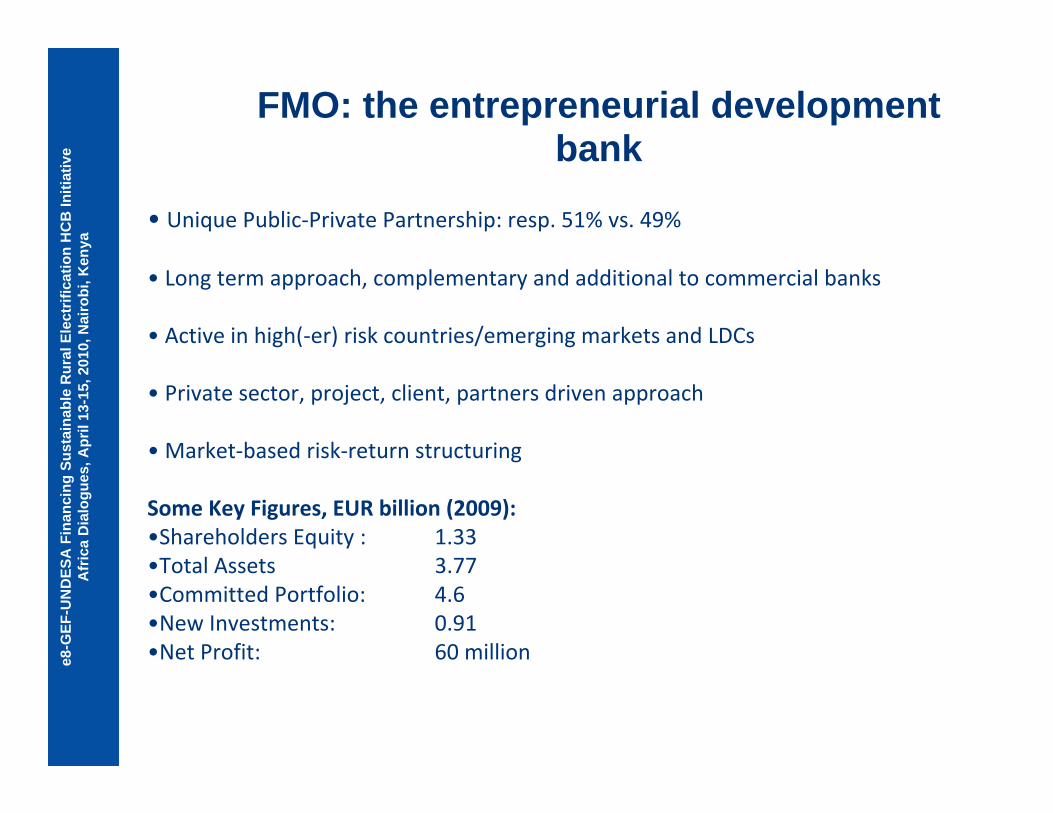
e8-G
EF-U
ND
ESA
Fin
anci
ng S
usta
inab
le R
ural
Ele
ctrif
icat
ion
HC
B In
itiat
ive
Afr
ica
Dia
logu
es, A
pril
13-1
5, 2
010,
Nai
robi
, Ken
ya
FMO: the entrepreneurial development bank
• Unique Public‐Private Partnership: resp. 51% vs. 49%
• Long term approach, complementary and additional to commercial banks
• Active in high(‐er) risk countries/emerging markets and LDCs
• Private sector, project, client, partners driven approach
• Market‐based risk‐return structuring
Some Key Figures, EUR billion (2009):•Shareholders Equity : 1.33•Total Assets 3.77 •Committed Portfolio: 4.6•New Investments: 0.91 •Net Profit: 60 million

e8-G
EF-U
ND
ESA
Fin
anci
ng S
usta
inab
le R
ural
Ele
ctrif
icat
ion
HC
B In
itiat
ive
Afr
ica
Dia
logu
es, A
pril
13-1
5, 2
010,
Nai
robi
, Ken
ya
FMO strategy: “Moving frontiers”• Focus on low and lower‐middle income countries (World Bank list January 2008)
• Three focus sectors:
Financial sector: cornerstone to a viable economy. Access to finance for micro, small and medium sized enterprises means people can grow sound and sustainable companies
Energy sector: provision of a basic needs. With high dependence on scarce/finite resources, sustainable energy is now very important
Housing sector: a strong affordable housing sector serves as an engine for economic growth and employment, with spin offs to related industries
• Catalyzing commercial investors to challenging markets
• Focus on and pro‐active approach regarding Environmental, Social and Governance (ESG)
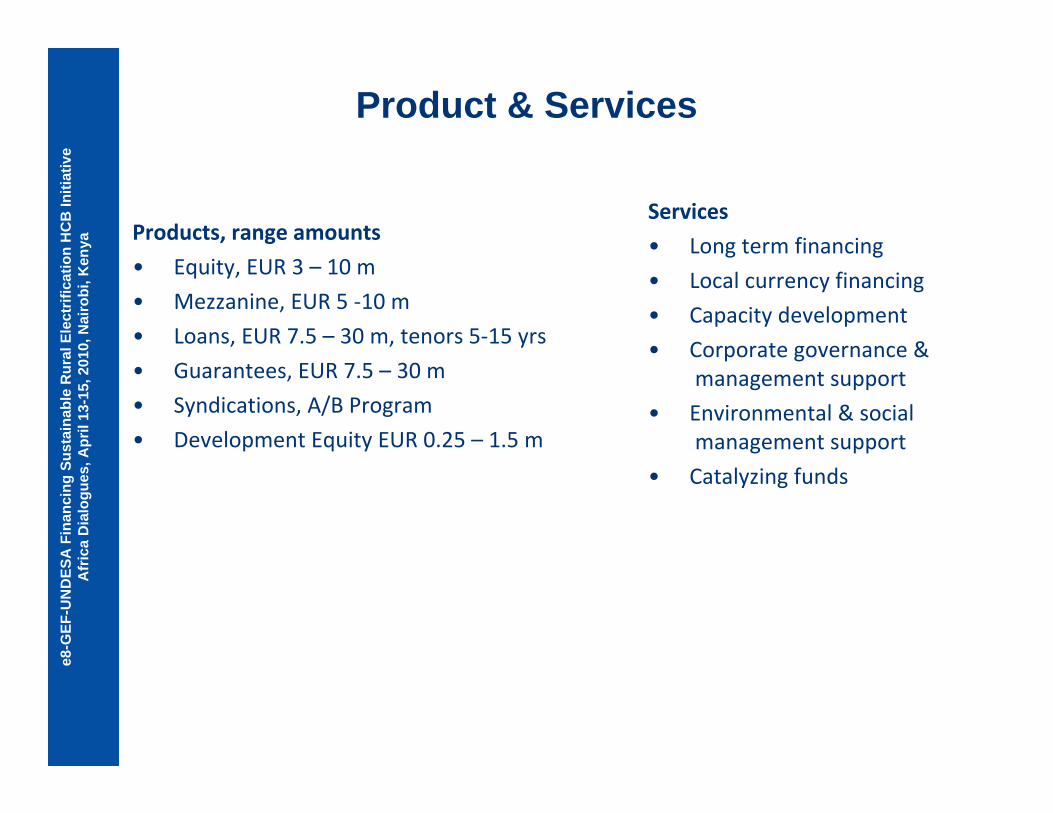
e8-G
EF-U
ND
ESA
Fin
anci
ng S
usta
inab
le R
ural
Ele
ctrif
icat
ion
HC
B In
itiat
ive
Afr
ica
Dia
logu
es, A
pril
13-1
5, 2
010,
Nai
robi
, Ken
ya
Product & Services
Products, range amounts
• Equity, EUR 3 – 10 m
• Mezzanine, EUR 5 ‐10 m
• Loans, EUR 7.5 – 30 m, tenors 5‐15 yrs
• Guarantees, EUR 7.5 – 30 m
• Syndications, A/B Program
• Development Equity EUR 0.25 – 1.5 m
Services
• Long term financing
• Local currency financing
• Capacity development
• Corporate governance &management support
• Environmental & socialmanagement support
• Catalyzing funds

e8-G
EF-U
ND
ESA
Fin
anci
ng S
usta
inab
le R
ural
Ele
ctrif
icat
ion
HC
B In
itiat
ive
Afr
ica
Dia
logu
es, A
pril
13-1
5, 2
010,
Nai
robi
, Ken
ya
FMO’s Committed portfolio, EUR 4.6 mln(as per December 31, 2009)
Per Sector(%)
53%
14%
7%
26%
Financial institutions Energy Housing Other
Per income group(euro mln)
1,834
2,012
752
Low income Low er-middle income Upper-middle income
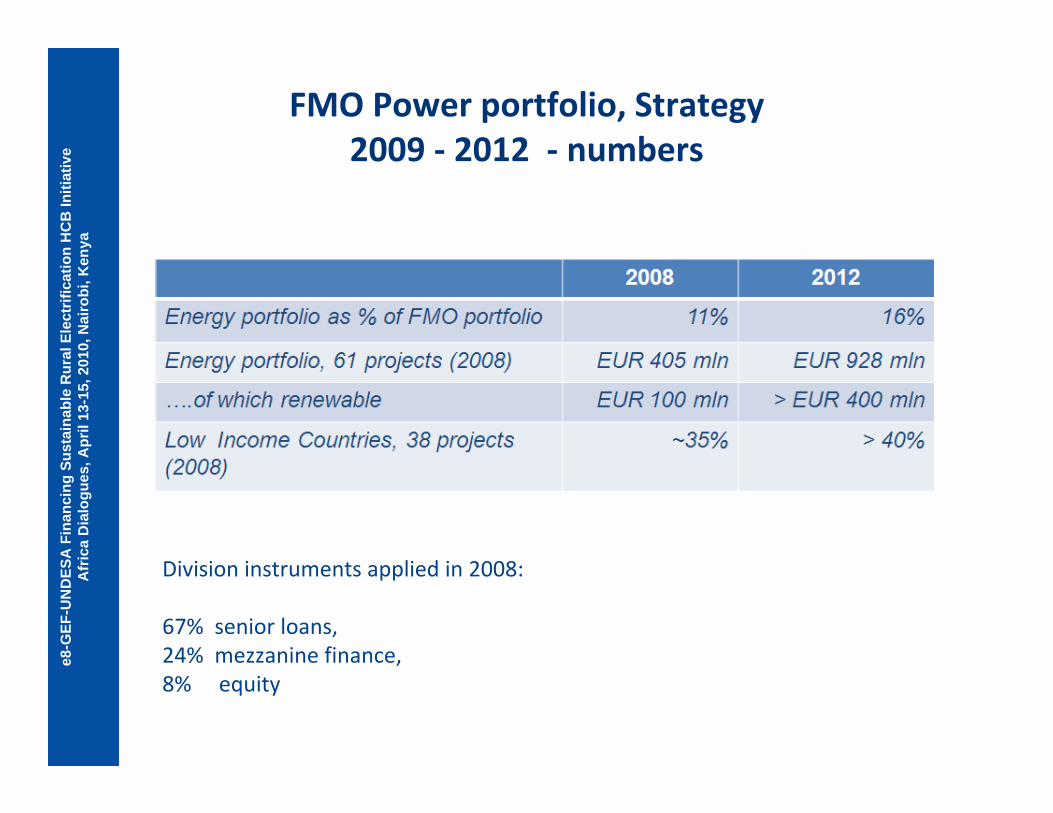
e8-G
EF-U
ND
ESA
Fin
anci
ng S
usta
inab
le R
ural
Ele
ctrif
icat
ion
HC
B In
itiat
ive
Afr
ica
Dia
logu
es, A
pril
13-1
5, 2
010,
Nai
robi
, Ken
ya
FMO Power portfolio, Strategy 2009 ‐ 2012 ‐ numbers
Division instruments applied in 2008:
67% senior loans, 24% mezzanine finance, 8% equity

e8-G
EF-U
ND
ESA
Fin
anci
ng S
usta
inab
le R
ural
Ele
ctrif
icat
ion
HC
B In
itiat
ive
Afr
ica
Dia
logu
es, A
pril
13-1
5, 2
010,
Nai
robi
, Ken
ya
FMO Energy Strategy ‐ Ambitions
• Double total energy portfolio 2009 ‐ 2012 !
• Largely active in power generation projects.
• Increased emphasis on renewable energy, high growth target: midsize hydro’s, wind, geothermal, biomass, solar.
• Transmission, Distribution Private and/or PPP investments also of interest
• Priority low Income Countries (LIC’s)
• Support developers in Africa and other regions with development equity, TA, etc.
• Outreach to smaller projects through investments in P/E Funds and credit lines
• Strong role in appraising, managing environmental/social issues related risks
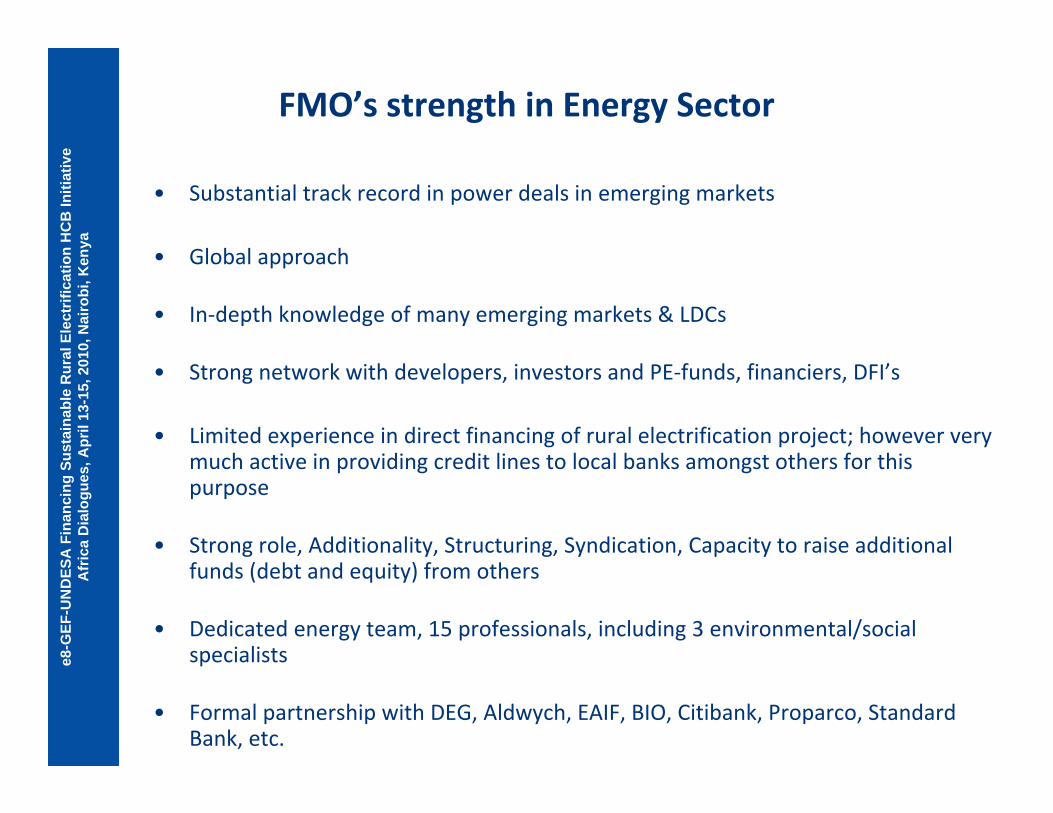
e8-G
EF-U
ND
ESA
Fin
anci
ng S
usta
inab
le R
ural
Ele
ctrif
icat
ion
HC
B In
itiat
ive
Afr
ica
Dia
logu
es, A
pril
13-1
5, 2
010,
Nai
robi
, Ken
ya
FMO’s strength in Energy Sector
• Substantial track record in power deals in emerging markets
• Global approach
• In‐depth knowledge of many emerging markets & LDCs
• Strong network with developers, investors and PE‐funds, financiers, DFI’s
• Limited experience in direct financing of rural electrification project; however very much active in providing credit lines to local banks amongst others for this purpose
• Strong role, Additionality, Structuring, Syndication, Capacity to raise additional funds (debt and equity) from others
• Dedicated energy team, 15 professionals, including 3 environmental/social specialists
• Formal partnership with DEG, Aldwych, EAIF, BIO, Citibank, Proparco, Standard Bank, etc.
e8-G
EF-U
ND
ESA
Fin
anci
ng S
usta
inab
le R
ural
Ele
ctrif
icat
ion
HC
B In
itiat
ive
Afr
ica
Dia
logu
es, A
pril
13-1
5, 2
010,
Nai
robi
, Ken
ya
I would like to ask you the following question:
Who has experience working with DFI’s / FMO?
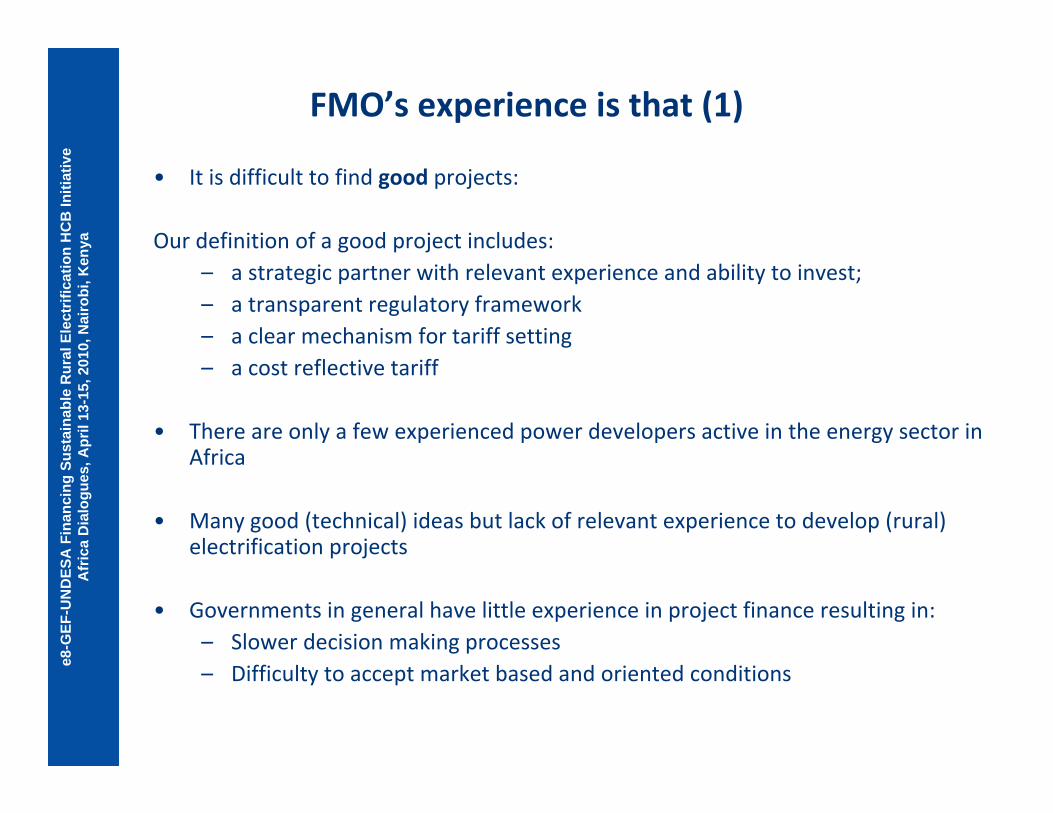
e8-G
EF-U
ND
ESA
Fin
anci
ng S
usta
inab
le R
ural
Ele
ctrif
icat
ion
HC
B In
itiat
ive
Afr
ica
Dia
logu
es, A
pril
13-1
5, 2
010,
Nai
robi
, Ken
ya
FMO’s experience is that (1)
• It is difficult to find good projects:
Our definition of a good project includes:– a strategic partner with relevant experience and ability to invest;– a transparent regulatory framework– a clear mechanism for tariff setting– a cost reflective tariff
• There are only a few experienced power developers active in the energy sector in Africa
• Many good (technical) ideas but lack of relevant experience to develop (rural) electrification projects
• Governments in general have little experience in project finance resulting in:– Slower decision making processes– Difficulty to accept market based and oriented conditions
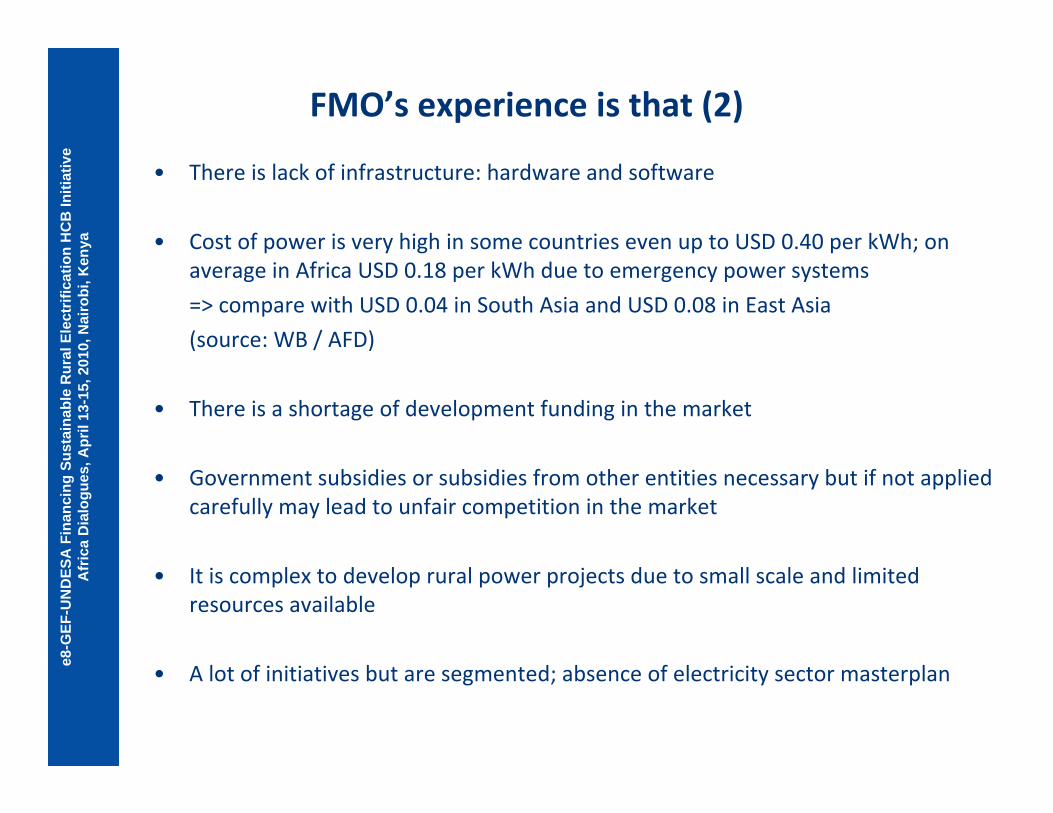
e8-G
EF-U
ND
ESA
Fin
anci
ng S
usta
inab
le R
ural
Ele
ctrif
icat
ion
HC
B In
itiat
ive
Afr
ica
Dia
logu
es, A
pril
13-1
5, 2
010,
Nai
robi
, Ken
ya
FMO’s experience is that (2)
• There is lack of infrastructure: hardware and software
• Cost of power is very high in some countries even up to USD 0.40 per kWh; on average in Africa USD 0.18 per kWh due to emergency power systems
=> compare with USD 0.04 in South Asia and USD 0.08 in East Asia
(source: WB / AFD)
• There is a shortage of development funding in the market
• Government subsidies or subsidies from other entities necessary but if not applied carefully may lead to unfair competition in the market
• It is complex to develop rural power projects due to small scale and limited resources available
• A lot of initiatives but are segmented; absence of electricity sector masterplan
e8-G
EF-U
ND
ESA
Fin
anci
ng S
usta
inab
le R
ural
Ele
ctrif
icat
ion
HC
B In
itiat
ive
Afr
ica
Dia
logu
es, A
pril
13-1
5, 2
010,
Nai
robi
, Ken
ya
Why is DFI financing relevant
• DFI’s in general take more risk than commercial financing institutions
• DFI financing adds to the sustainability of a project:
– Commercial
– Operations and Maintenance
– Environmental
– Social
• DFI financing can be combined with government subsidies; FMO has applied this structure in a number of projects
• FMO’s view is that stimulating private sector development and investments adds to sustainability
e8-G
EF-U
ND
ESA
Fin
anci
ng S
usta
inab
le R
ural
Ele
ctrif
icat
ion
HC
B In
itiat
ive
Afr
ica
Dia
logu
es, A
pril
13-1
5, 2
010,
Nai
robi
, Ken
ya
A Case ‐ Sunlabob
• Local company providing full rang of affordable, off‐grid renewable energy solutions in rural areas;
• Purpose to scale up rental business of solar panels and to develop and grow hybrid village grid program;
• Total project cost USD 4 mln;
• FMO provided USD 2.5 mln of funding from AEF, alongside Triodos (USD 1.5 mln);
• In addition technical assistance provided to improve financial accounting and inventory management systems, corporate governance structure and training of employees
• Project contributes to rural development through improved access to energy and by providing income generation opportunities;
• Development impact is high as project contributes to conservation of non‐renewable resources and has strong impact on welfare and economic activities in villages where the company is active;
• AEF financing provides access to energy to approx. 57,000 people
e8-G
EF-U
ND
ESA
Fin
anci
ng S
usta
inab
le R
ural
Ele
ctrif
icat
ion
HC
B In
itiat
ive
Afr
ica
Dia
logu
es, A
pril
13-1
5, 2
010,
Nai
robi
, Ken
ya
FMO’s view on challenges & opportunitiesvis a vis rural electrification (1)
Challenges are more or less similar to the ones that are faced by larger power projects:
• Lack of experienced small scale project developers
• Small scale projects too small to carry due diligence costs
• Lack of development funding to bring the projects to bankability
• Many good (technical) ideas but difficult to develop into a (financially) feasible project
• O&M and hence sustainability seems to be a risk with subsidized projects
e8-G
EF-U
ND
ESA
Fin
anci
ng S
usta
inab
le R
ural
Ele
ctrif
icat
ion
HC
B In
itiat
ive
Afr
ica
Dia
logu
es, A
pril
13-1
5, 2
010,
Nai
robi
, Ken
ya
FMO’s view on challenges & opportunitiesvis a vis rural electrification (2)
Opportunities:
• Establishment and support of initiatives of experienced small scale project developers
• Enlarging the scale of small projects by clustering
• Combine different types of (renewable) energy for power generation
• Use of bio fuels for rural electrification: bio ethanol gel; bio diesel etc. for cooking– Improve health circumstances– Improve safety– Limit further deforestation
e8-G
EF-U
ND
ESA
Fin
anci
ng S
usta
inab
le R
ural
Ele
ctrif
icat
ion
HC
B In
itiat
ive
Afr
ica
Dia
logu
es, A
pril
13-1
5, 2
010,
Nai
robi
, Ken
ya
Contact Information:Email: [email protected]
Tel: +31 70 314 9781Mob: + 31 6 10911715
Website: www.fmo.nl
Thank you for your attention!
e8-G
EF-U
ND
ESA
Fin
anci
ng S
usta
inab
le E
lect
rific
atio
n H
CB
Initi
ativ
eA
fric
a D
ialo
gues
, Apr
il 13
-15,
201
0, N
airo
bi, K
enya
e8-GEF-UNDESA Financing Sustainable Electrification
Africa DialoguesNairobi, Kenya, April 13-15, 2010
Private Sector Participation in Financing Rural Electrification in East and Southern Africa
Hancox Wilson Jaoko, REA, USAID/EA
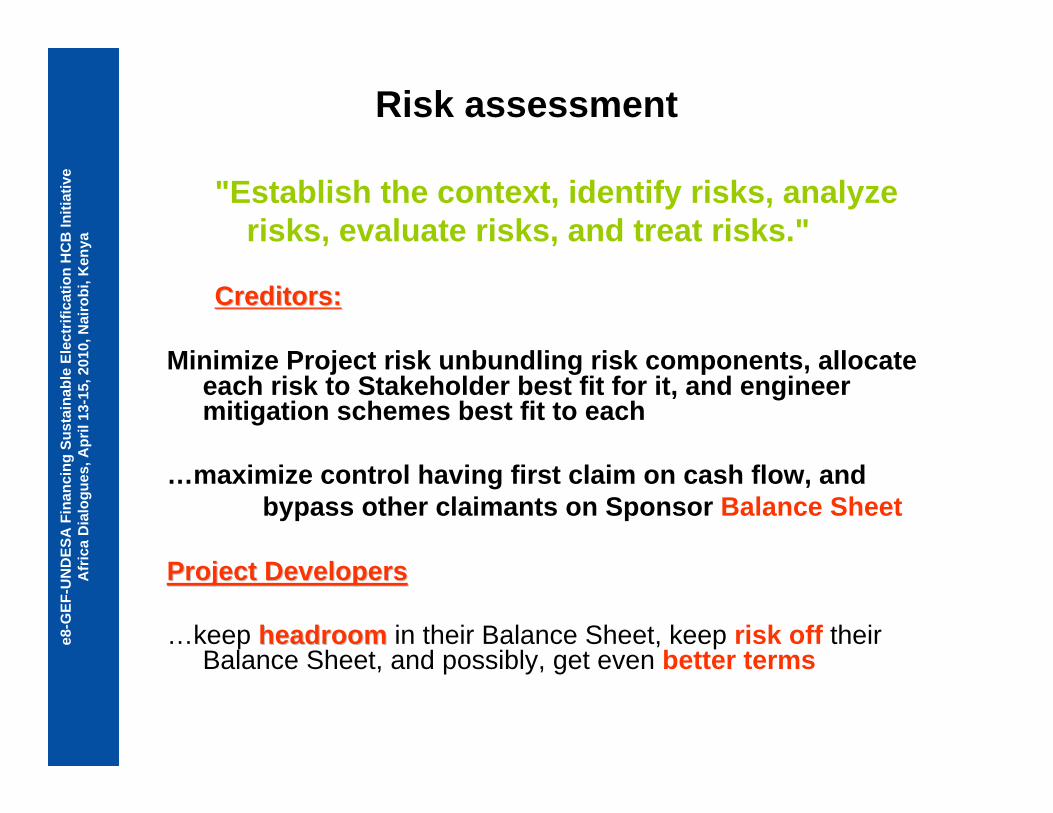
e8-G
EF-U
ND
ESA
Fin
anci
ng S
usta
inab
le E
lect
rific
atio
n H
CB
Initi
ativ
eA
fric
a D
ialo
gues
, Apr
il 13
-15,
201
0, N
airo
bi, K
enya
Risk assessment
"Establish the context, identify risks, analyze risks, evaluate risks, and treat risks."
Creditors: Creditors:
Minimize Project risk unbundling risk components, allocate each risk to Stakeholder best fit for it, and engineer mitigation schemes best fit to each
…maximize control having first claim on cash flow, andbypass other claimants on Sponsor Balance Sheet
Project DevelopersProject Developers
…keep headroomheadroom in their Balance Sheet, keep risk off their Balance Sheet, and possibly, get even better terms

e8-G
EF-U
ND
ESA
Fin
anci
ng S
usta
inab
le E
lect
rific
atio
n H
CB
Initi
ativ
eA
fric
a D
ialo
gues
, Apr
il 13
-15,
201
0, N
airo
bi, K
enya
Risks and mitigationsForce Majeure
InsuranceRegulatory Risk
Pass-throughs, Change-of-law clauses
Political RiskMDB, ECA, PRI, Loc. Partners, Offsh. Acct.
Sponsor RiskLim. Recourse, J & S, Clawback
Environmental RiskEIA, Remedial Undertaking
Technology RiskWarranties, Insurance
Project Completion RiskSponsor Guarantees, Turnkeys, Bonds, Retentions, Completion Tests
Cost Overrun RiskSponsor Guarantees, Contingencies, Capex Reserve, Liq. Damages
Fuel Supply RiskPut-or-pay
Operating RiskManagement, Incentives, Insurance
Offtaker RiskDSCR, Opex & DS Reserves
Market RiskTake-or-Pay
Currency RiskHedging, Swaps
Macroeconomic RiskTake-or-Pay
Legal RiskLegal opinion
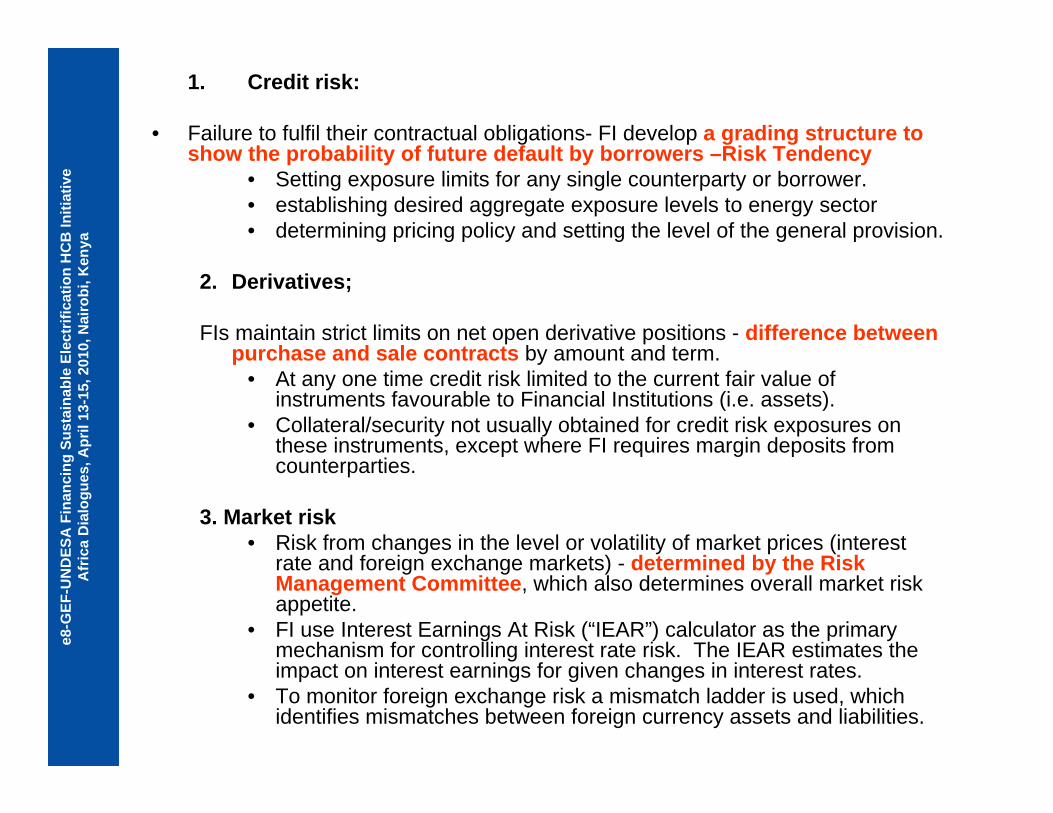
e8-G
EF-U
ND
ESA
Fin
anci
ng S
usta
inab
le E
lect
rific
atio
n H
CB
Initi
ativ
eA
fric
a D
ialo
gues
, Apr
il 13
-15,
201
0, N
airo
bi, K
enya
1. Credit risk:
• Failure to fulfil their contractual obligations- FI develop a grading structure to show the probability of future default by borrowers –Risk Tendency
• Setting exposure limits for any single counterparty or borrower.• establishing desired aggregate exposure levels to energy sector• determining pricing policy and setting the level of the general provision.
2. Derivatives;
FIs maintain strict limits on net open derivative positions - difference between purchase and sale contracts by amount and term.
• At any one time credit risk limited to the current fair value ofinstruments favourable to Financial Institutions (i.e. assets).
• Collateral/security not usually obtained for credit risk exposures on these instruments, except where FI requires margin deposits fromcounterparties.
3. Market risk• Risk from changes in the level or volatility of market prices (interest
rate and foreign exchange markets) - determined by the Risk Management Committee, which also determines overall market risk appetite.
• FI use Interest Earnings At Risk (“IEAR”) calculator as the primary mechanism for controlling interest rate risk. The IEAR estimates the impact on interest earnings for given changes in interest rates.
• To monitor foreign exchange risk a mismatch ladder is used, which identifies mismatches between foreign currency assets and liabilities.
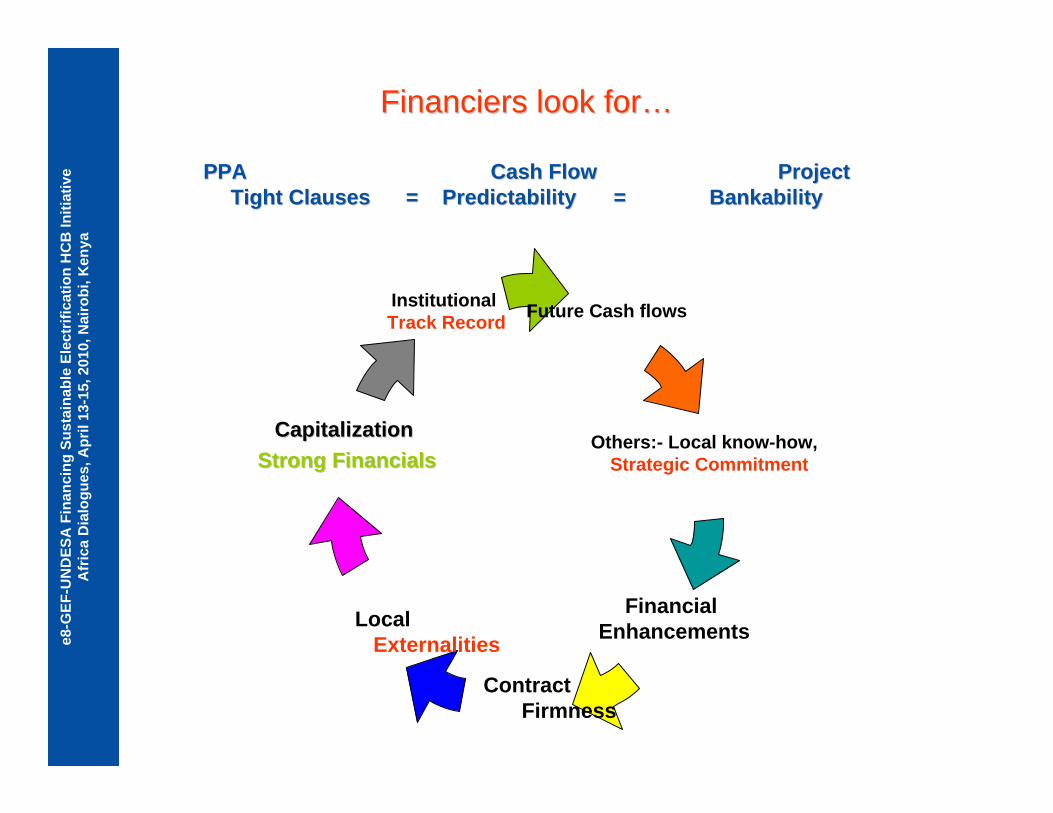
e8-G
EF-U
ND
ESA
Fin
anci
ng S
usta
inab
le E
lect
rific
atio
n H
CB
Initi
ativ
eA
fric
a D
ialo
gues
, Apr
il 13
-15,
201
0, N
airo
bi, K
enya
Financiers look for…Financiers look for…
PPAPPA Cash FlowCash Flow ProjectProjectTight Clauses = PredictabilityTight Clauses = Predictability == BankabilityBankability
Future Cash flows
FinancialEnhancements
Capitalization Capitalization Strong FinancialsStrong Financials
Institutional Track Record
Others:- Local know-how, Strategic Commitment
ContractFirmness
LocalExternalities
e8-G
EF-U
ND
ESA
Fin
anci
ng S
usta
inab
le E
lect
rific
atio
n H
CB
Initi
ativ
eA
fric
a D
ialo
gues
, Apr
il 13
-15,
201
0, N
airo
bi, K
enya
Public Private Partnership
• Benefits of using PPP as opposed to traditional methods:
– Save the costs to public but also inject needed private sector efficiency in the government sector domain.
– improved value for money - maximized when the project maximizes the net present value of social benefits of a project over its entire life cycle.
– Used to circumvent government accounting rules by moving borrowing off the public sector balance sheets, under the misconception that doing so creates fiscal space for other activities.
• Best PPP model is one that equally apportions the risk and reward to both parties . Win! Win!Win! Win!
• PPP most likely where future revenues reasonably predictable. – Sharing historical revenue data with the prospective vendors encourages
participation in PPP.
• Revenue sharing models are based upon the risk/return relationship principles.
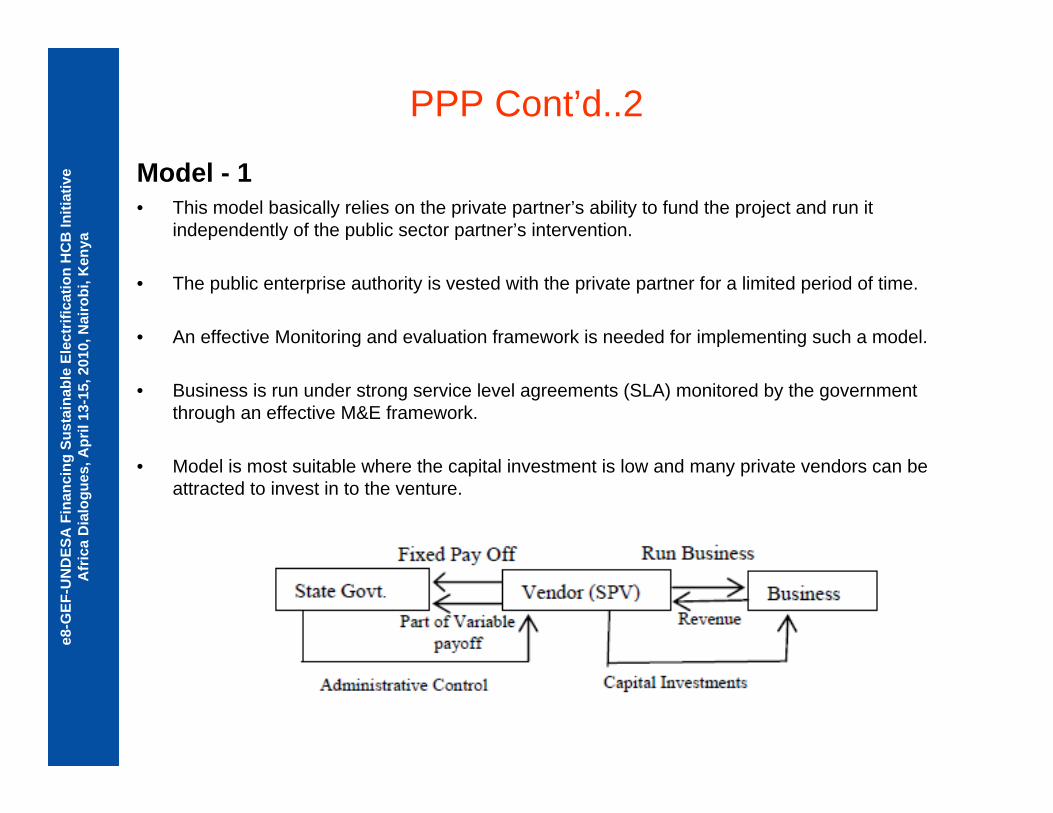
e8-G
EF-U
ND
ESA
Fin
anci
ng S
usta
inab
le E
lect
rific
atio
n H
CB
Initi
ativ
eA
fric
a D
ialo
gues
, Apr
il 13
-15,
201
0, N
airo
bi, K
enya
PPP Cont’d..2
Model - 1• This model basically relies on the private partner’s ability to fund the project and run it
independently of the public sector partner’s intervention.
• The public enterprise authority is vested with the private partner for a limited period of time.
• An effective Monitoring and evaluation framework is needed for implementing such a model.
• Business is run under strong service level agreements (SLA) monitored by the government through an effective M&E framework.
• Model is most suitable where the capital investment is low and many private vendors can be attracted to invest in to the venture.
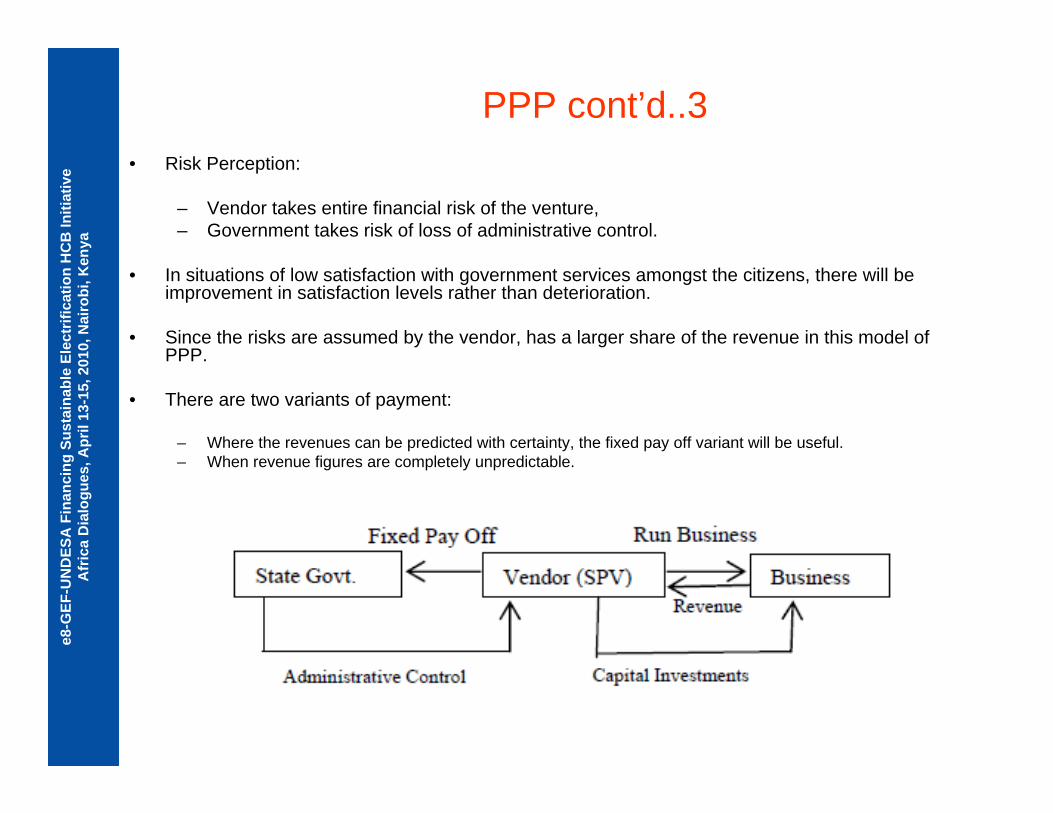
e8-G
EF-U
ND
ESA
Fin
anci
ng S
usta
inab
le E
lect
rific
atio
n H
CB
Initi
ativ
eA
fric
a D
ialo
gues
, Apr
il 13
-15,
201
0, N
airo
bi, K
enya
PPP cont’d..3• Risk Perception:
– Vendor takes entire financial risk of the venture, – Government takes risk of loss of administrative control.
• In situations of low satisfaction with government services amongst the citizens, there will be improvement in satisfaction levels rather than deterioration.
• Since the risks are assumed by the vendor, has a larger share of the revenue in this model of PPP.
• There are two variants of payment:
– Where the revenues can be predicted with certainty, the fixed pay off variant will be useful. – When revenue figures are completely unpredictable.
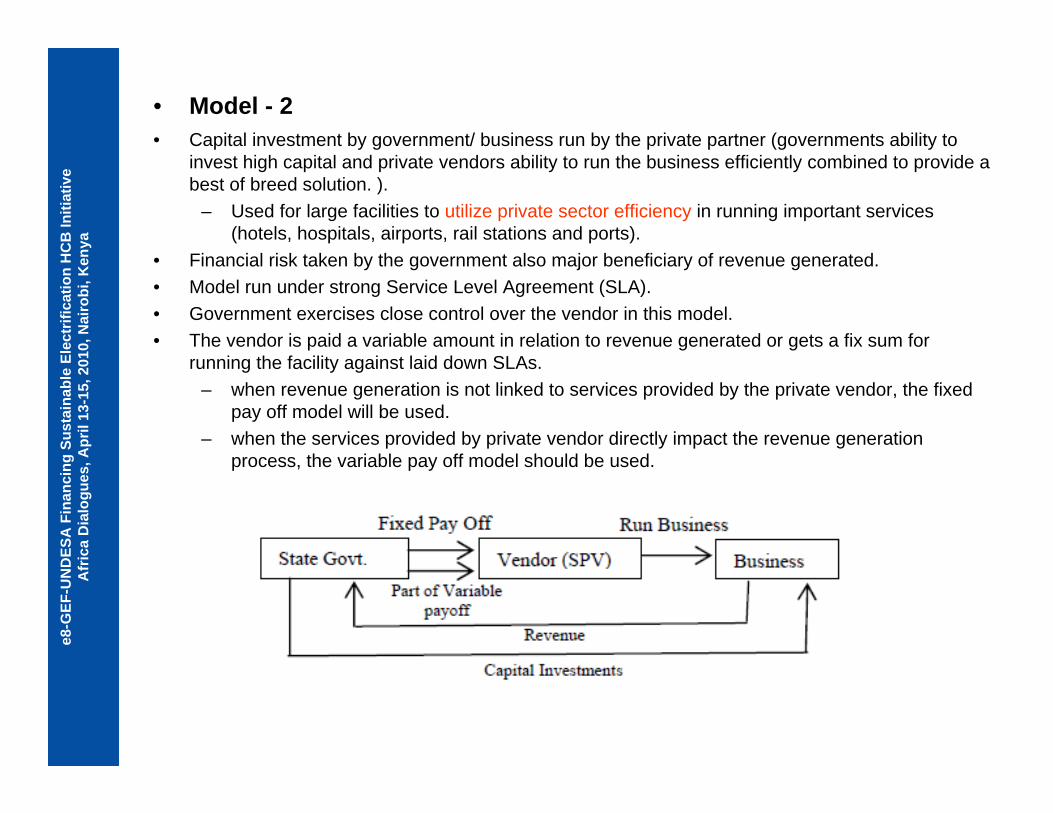
e8-G
EF-U
ND
ESA
Fin
anci
ng S
usta
inab
le E
lect
rific
atio
n H
CB
Initi
ativ
eA
fric
a D
ialo
gues
, Apr
il 13
-15,
201
0, N
airo
bi, K
enya
• Model - 2• Capital investment by government/ business run by the private partner (governments ability to
invest high capital and private vendors ability to run the business efficiently combined to provide a best of breed solution. ).
– Used for large facilities to utilize private sector efficiency in running important services (hotels, hospitals, airports, rail stations and ports).
• Financial risk taken by the government also major beneficiary of revenue generated. • Model run under strong Service Level Agreement (SLA). • Government exercises close control over the vendor in this model.• The vendor is paid a variable amount in relation to revenue generated or gets a fix sum for
running the facility against laid down SLAs. – when revenue generation is not linked to services provided by the private vendor, the fixed
pay off model will be used. – when the services provided by private vendor directly impact the revenue generation
process, the variable pay off model should be used.

e8-G
EF-U
ND
ESA
Fin
anci
ng S
usta
inab
le E
lect
rific
atio
n H
CB
Initi
ativ
eA
fric
a D
ialo
gues
, Apr
il 13
-15,
201
0, N
airo
bi, K
enya
PPP Cont’d…4Model 3• Closes to true PPP model: equal division of risk and return between the PPP partners.
• Both partners invest capital in to the project (Returns per capital investment ratio as well as the risk perception of the partners).
• Advisable for project to be run by the private enterprise drawing on its efficiency/past experience.
• Projects requiring large capital like oil refining etc may fall under this category of PPP revenue models.
• Risk Perception: Attempts to equally distribute the risk and return amongst the PPP partners.

e8-G
EF-U
ND
ESA
Fin
anci
ng S
usta
inab
le E
lect
rific
atio
n H
CB
Initi
ativ
eA
fric
a D
ialo
gues
, Apr
il 13
-15,
201
0, N
airo
bi, K
enya
Alternative Financing Mechanism– Can only be assured with policy/legal reforms
Competitive/open and transparent bidding processTariff reform: Non-Cost Recovering Tariffs discourage both
private and public sectorMarket-based reforms (energy, telecom)
–– Specialized Infrastructure Financing FundsSpecialized Infrastructure Financing Funds have been designed and implemented in several similar developing economies with different results.
–– Credit GuaranteesCredit Guarantees (provided by donors/Multilateral Banks.
–– Output based ConcessionOutput based Concession –grant based• Subsidy provided but reduced with time and based on
output.• Concession framework required.
e8-G
EF-U
ND
ESA
Fin
anci
ng S
usta
inab
le E
lect
rific
atio
n H
CB
Initi
ativ
eA
fric
a D
ialo
gues
, Apr
il 13
-15,
201
0, N
airo
bi, K
enya
Challenges and mitigation to PPP Policy & Legal Framework
Clear rules of the game are necessary Ownership of assets Rules of bidding process
Cost of Legal Framework & Process Costs higher than EPC process. Need larger government team involving MOF
Partnership Spirit: 20+ years
P3s are more than a one off transaction. Long term mutuality of interest beyond contract; Flexibility required on both parts
without changing basic contractual terms. Often advised that price be reviewed every year (inflation) and every 5 years
(structural costs)
•• Need to develop a PPP discount rate that facilitates comparison Need to develop a PPP discount rate that facilitates comparison for evaluation for evaluation purposes, in net present value terms, of the cash flows in both purposes, in net present value terms, of the cash flows in both the traditional the traditional (represented by the Public Sector Benchmark (PSB)) and the PPP b(represented by the Public Sector Benchmark (PSB)) and the PPP bidder’s idder’s financial model, for the asset/service to be provided under a PPfinancial model, for the asset/service to be provided under a PPP arrangement.P arrangement.
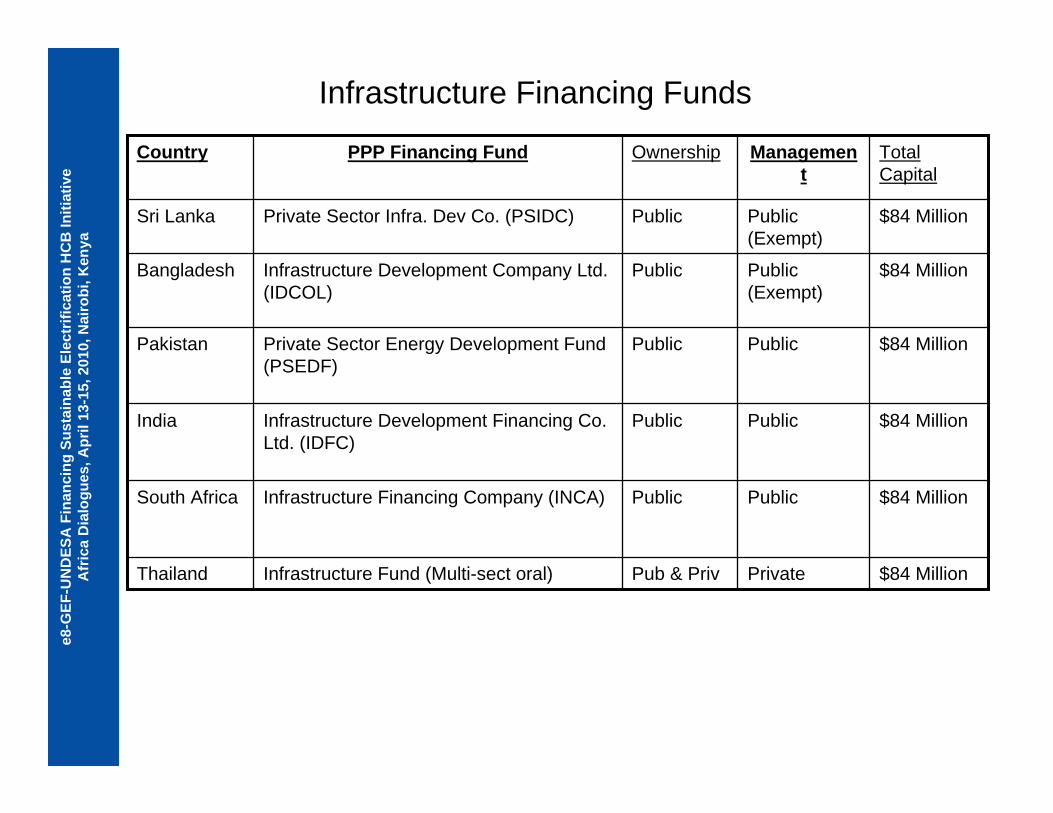
e8-G
EF-U
ND
ESA
Fin
anci
ng S
usta
inab
le E
lect
rific
atio
n H
CB
Initi
ativ
eA
fric
a D
ialo
gues
, Apr
il 13
-15,
201
0, N
airo
bi, K
enya
Infrastructure Financing Funds
$84 MillionPrivatePub & PrivInfrastructure Fund (Multi-sect oral)Thailand
$84 MillionPublic PublicInfrastructure Financing Company (INCA)South Africa
$84 MillionPublic PublicInfrastructure Development Financing Co. Ltd. (IDFC)
India
$84 MillionPublic PublicPrivate Sector Energy Development Fund (PSEDF)
Pakistan
$84 MillionPublic (Exempt)
PublicInfrastructure Development Company Ltd. (IDCOL)
Bangladesh
$84 MillionPublic (Exempt)
PublicPrivate Sector Infra. Dev Co. (PSIDC)Sri Lanka
Total Capital
Management
OwnershipPPP Financing FundCountry
e8-G
EF-U
ND
ESA
Fin
anci
ng S
usta
inab
le E
lect
rific
atio
n H
CB
Initi
ativ
eA
fric
a D
ialo
gues
, Apr
il 13
-15,
201
0, N
airo
bi, K
enya
Output-Base Concessions (OBC)
• Concession an area to private investor and subsidizing based on performance.
• traditional subsidies pay service agencies based on their inputs, especially costs, OBC pays only based upon output levels of service achieved.
• OBC is:1. Explicit — like a contract2. Performance-based3. Grant -based
Over 70 projects funded (health, water, energy, telecom, roads, franspor1, etc.)
Over $15 million in supporting Technical Assistance to prepare and support projects
Over $170 million in output-based subsidies paid to social services providers
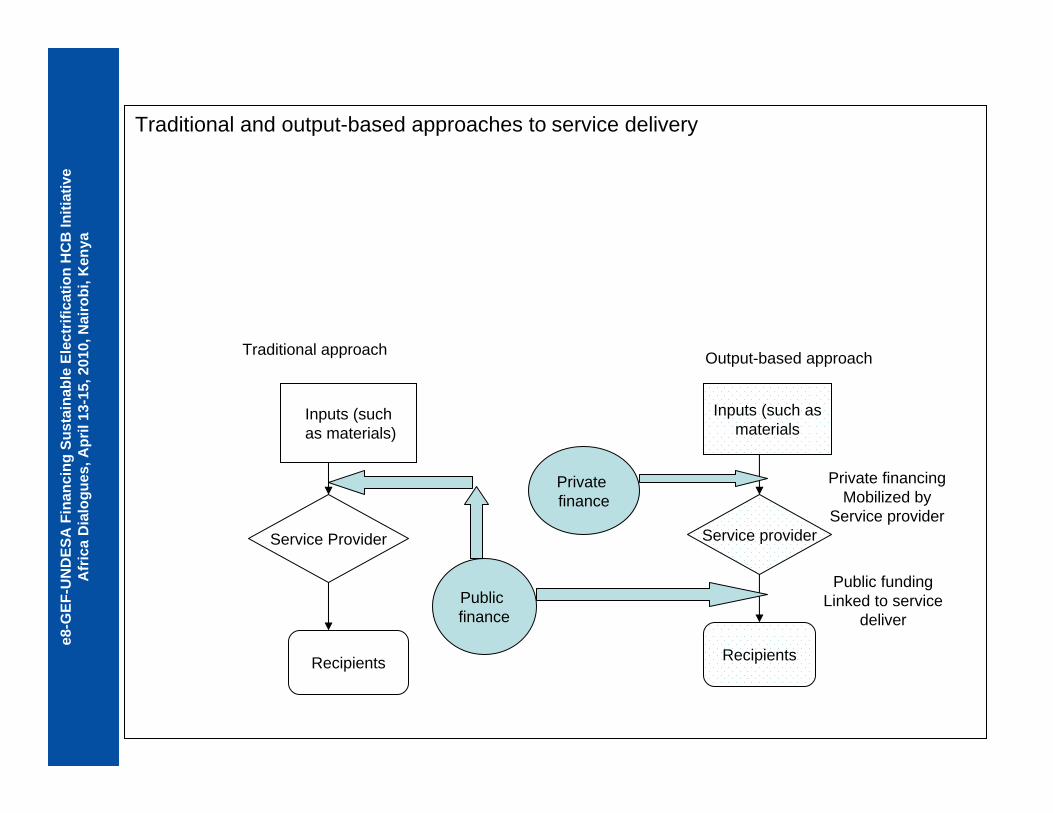
e8-G
EF-U
ND
ESA
Fin
anci
ng S
usta
inab
le E
lect
rific
atio
n H
CB
Initi
ativ
eA
fric
a D
ialo
gues
, Apr
il 13
-15,
201
0, N
airo
bi, K
enya
Traditional and output-based approaches to service delivery
Inputs (suchas materials)
Recipients
Service Provider
Private finance
Public finance
Inputs (such asmaterials
Service provider
Recipients
Traditional approach Output-based approach
Private financingMobilized by
Service provider
Public funding Linked to service
deliver
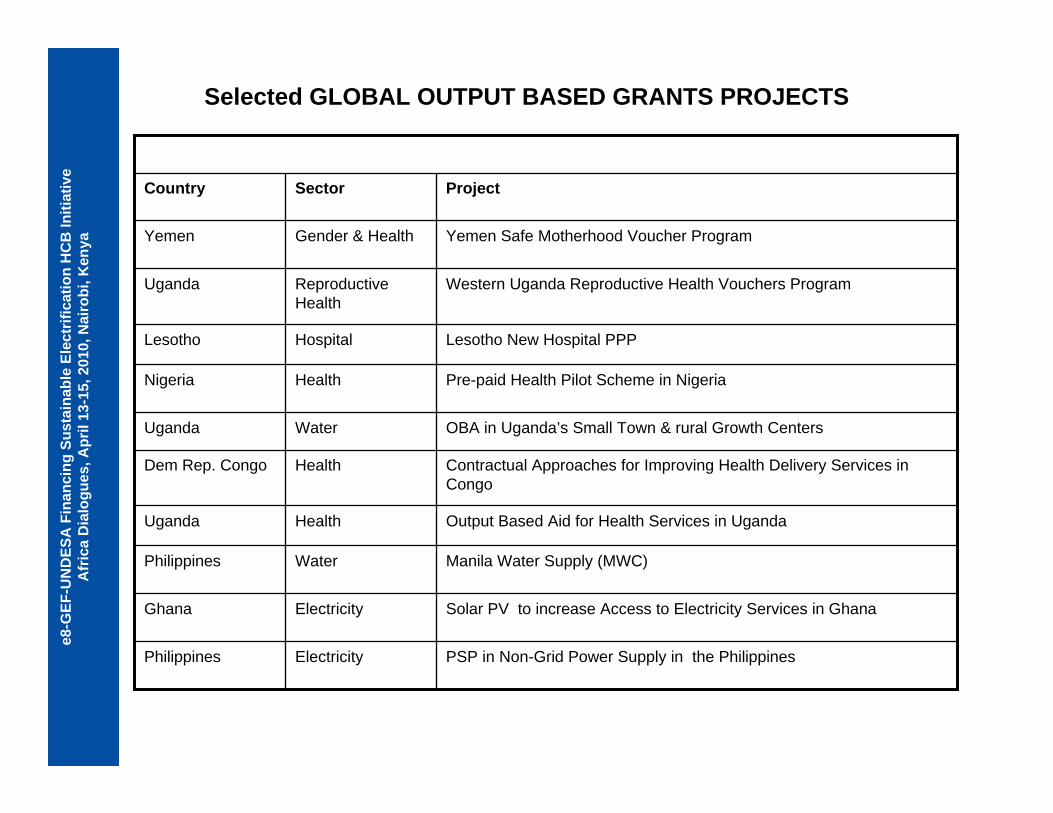
e8-G
EF-U
ND
ESA
Fin
anci
ng S
usta
inab
le E
lect
rific
atio
n H
CB
Initi
ativ
eA
fric
a D
ialo
gues
, Apr
il 13
-15,
201
0, N
airo
bi, K
enya
Selected GLOBAL OUTPUT BASED GRANTS PROJECTS
PSP in Non-Grid Power Supply in the PhilippinesElectricityPhilippines
Solar PV to increase Access to Electricity Services in GhanaElectricityGhana
Manila Water Supply (MWC)WaterPhilippines
Output Based Aid for Health Services in UgandaHealthUganda
Contractual Approaches for Improving Health Delivery Services inCongo
HealthDem Rep. Congo
OBA in Uganda’s Small Town & rural Growth CentersWaterUganda
Pre-paid Health Pilot Scheme in NigeriaHealthNigeria
Lesotho New Hospital PPPHospitalLesotho
Western Uganda Reproductive Health Vouchers ProgramReproductive Health
Uganda
Yemen Safe Motherhood Voucher ProgramGender & HealthYemen
ProjectSectorCountry
e8-G
EF-U
ND
ESA
Fin
anci
ng S
usta
inab
le E
lect
rific
atio
n H
CB
Initi
ativ
eA
fric
a D
ialo
gues
, Apr
il 13
-15,
201
0, N
airo
bi, K
enya
Contact Information:
Email: [email protected]@gmail.com
Tel: +254208622500
Website:www.usaideastafrica.gov
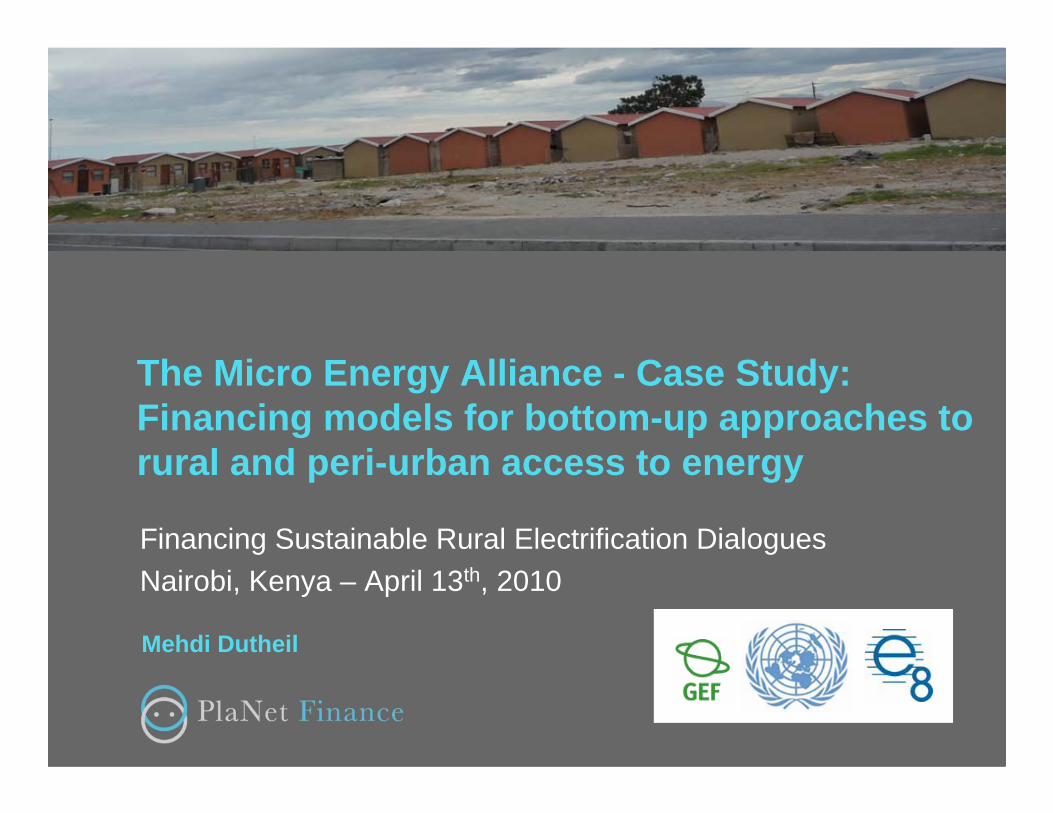
The Micro Energy Alliance - Case Study:Financing models for bottom-up approaches to rural and peri-urban access to energy
Financing Sustainable Rural Electrification DialoguesNairobi, Kenya – April 13th, 2010
Mehdi Dutheil

A BRIEF INTRODUCTION TO PLANET FINANCE
2
To alleviate poverty through the development of microfinance, therefore increasing the unbanked and under-banked’s access to financial servicesActive in over 80 countries with 1,000+ staff
Mission

3
Access to clean and affordable energyWaste management and ecotourism Developing energy service dealerships
3 Project lines launched from 2008-2010
Completed projects
Developing renewable energy (biogas) in China (2008) Solar energy promotion in Indonesia (2009), and in Bolivia and Paraguay (2008) Renewable energy and energy efficiency study in Morocco (2008) Jatropha and microfinance study (2007) RENDEV “Reinforcing the Provision of Sustainable Energy in Bangladesh and Indonesia” Bangladesh, 2007-2010
Current Case Study
Micro Energy Alliance – “Developing Renewable Energy housing solutions for low-income populations in South Africa through Micro-franchising and Microfinance”
Current and Past Projects
MICROFINANCE AND ENERGY PROGRAMMES
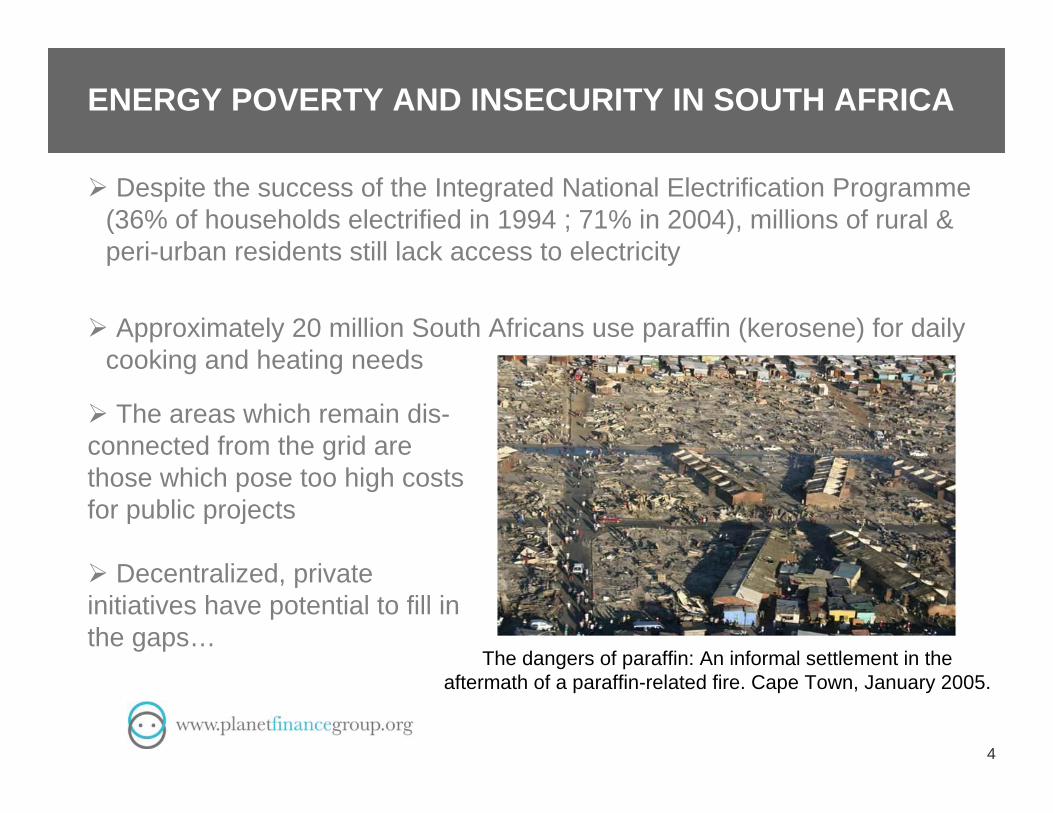
ENERGY POVERTY AND INSECURITY IN SOUTH AFRICA
Despite the success of the Integrated National Electrification Programme (36% of households electrified in 1994 ; 71% in 2004), millions of rural & peri-urban residents still lack access to electricity
Approximately 20 million South Africans use paraffin (kerosene) for daily cooking and heating needs
4
The dangers of paraffin: An informal settlement in the aftermath of a paraffin-related fire. Cape Town, January 2005.
The areas which remain dis-connected from the grid are those which pose too high costs for public projects
Decentralized, private initiatives have potential to fill in the gaps…

MACRO (top down) and MICRO (bottom up) APPROACHES TO ELECTRIFICATION
Characteristics• Government-planned• Public-financed (multilateral/national) / PPP• Large scale projects
Limitations• Extremely capital intensive• Leveraging private sector investment not always possible
Characteristics• Market-based and Demand-driven• Organic growth process• Potential for private sector investment
Limitations• Deployment difficult to plan• Model for financial sustainability at scale remains to be demonstrated
5
The top-down approach The bottom-up approach
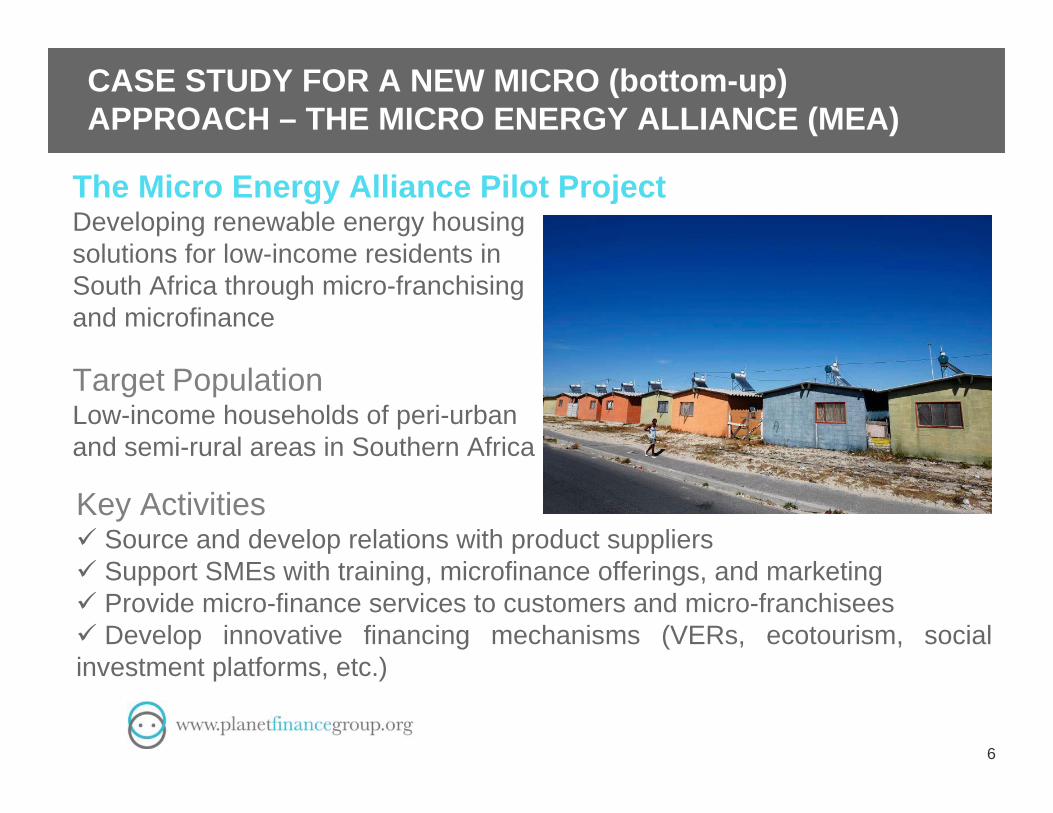
CASE STUDY FOR A NEW MICRO (bottom-up) APPROACH – THE MICRO ENERGY ALLIANCE (MEA)
6
Key Activities Source and develop relations with product suppliers Support SMEs with training, microfinance offerings, and marketing Provide micro-finance services to customers and micro-franchisees Develop innovative financing mechanisms (VERs, ecotourism, social investment platforms, etc.)
Target Population Low-income households of peri-urban and semi-rural areas in Southern Africa
The Micro Energy Alliance Pilot ProjectDeveloping renewable energy housing solutions for low-income residents in South Africa through micro-franchising and microfinance
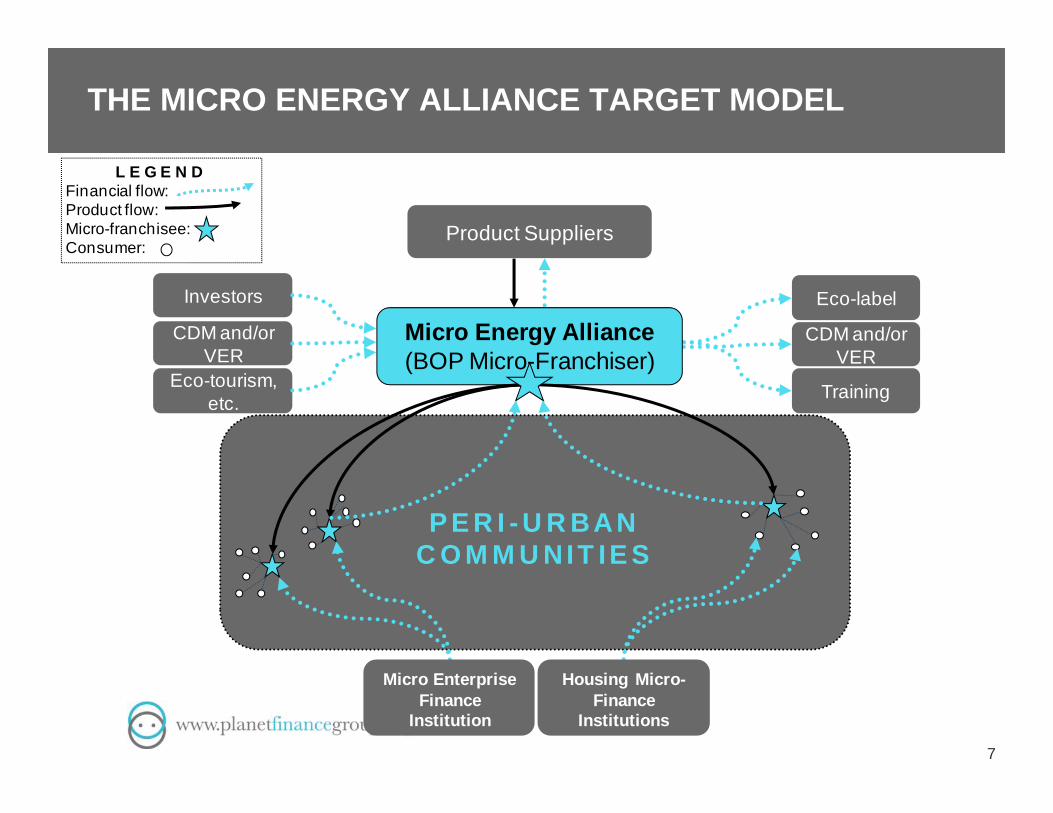
THE MICRO ENERGY ALLIANCE TARGET MODEL
7
L E G E N DFinancial flow:Product flow:Micro-franchisee: Consumer:
P E R I - U R BANC O M M U NIT IE S
Micro Energy Alliance (BOP Micro-Franchiser)
Investors
CDM and/or VER
Eco-tourism, etc.
Eco-label
CDM and/or VER
Training
Micro Enterprise Finance
Institution
Housing Micro-Finance
Institutions
Product Suppliers
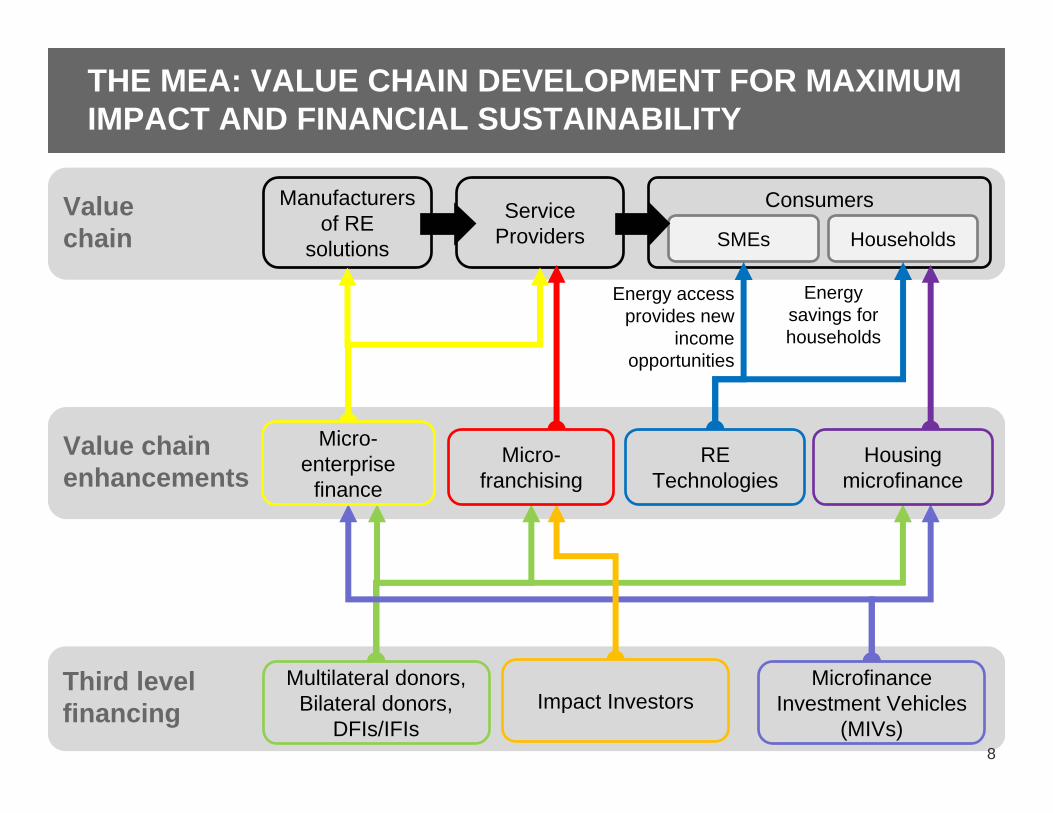
Third level financing
Value chain
Value chain enhancements
8
Manufacturers of RE
solutions
Service Providers
Consumers
SMEs Households
Energy access provides new
income opportunities
Energy savings for households
THE MEA: VALUE CHAIN DEVELOPMENT FOR MAXIMUM IMPACT AND FINANCIAL SUSTAINABILITY
Multilateral donors, Bilateral donors,
DFIs/IFIs
Microfinance Investment Vehicles
(MIVs)Impact Investors
RE Technologies
Housing microfinance
Micro-franchising
Micro-enterprise
finance
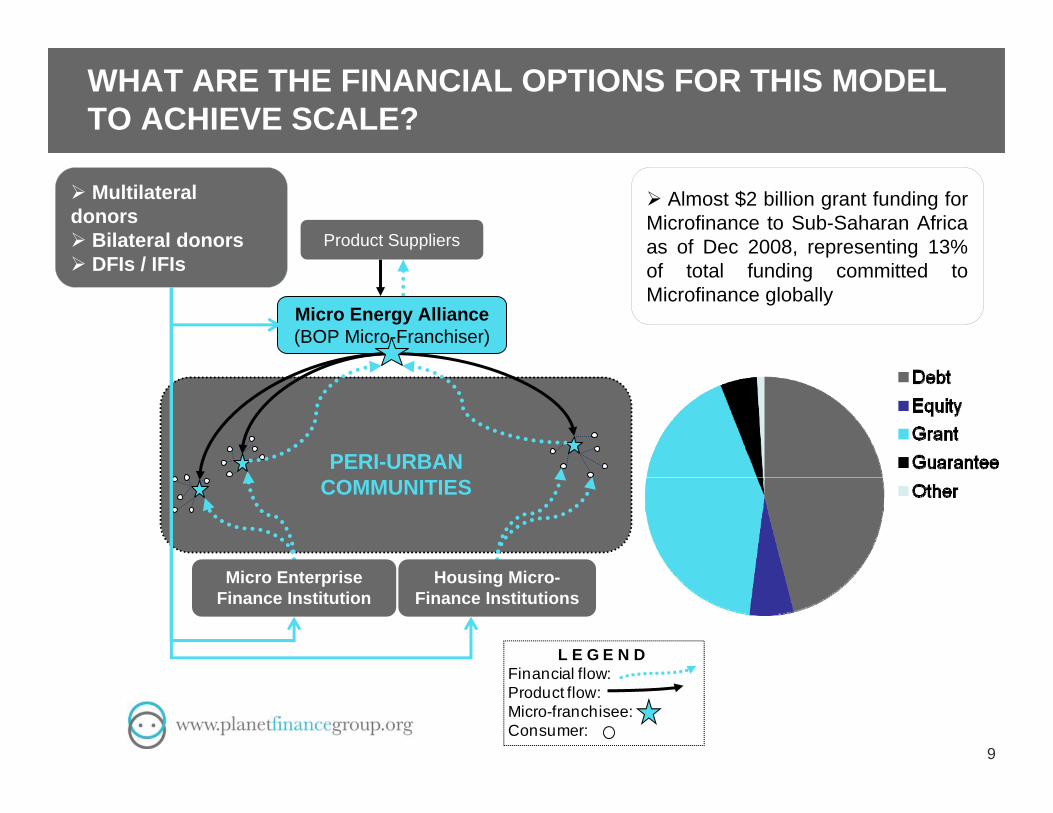
WHAT ARE THE FINANCIAL OPTIONS FOR THIS MODEL TO ACHIEVE SCALE?
9
L E G E N DFinancial flow:Product flow:Micro-franchisee: Consumer:
Multilateral donors Bilateral donors DFIs / IFIs
PERI-URBANCOMMUNITIES
Micro Energy Alliance (BOP Micro-Franchiser)
Micro Enterprise Finance Institution
Housing Micro-Finance Institutions
Product Suppliers
Almost $2 billion grant funding for Microfinance to Sub-Saharan Africa as of Dec 2008, representing 13% of total funding committed to Microfinance globally
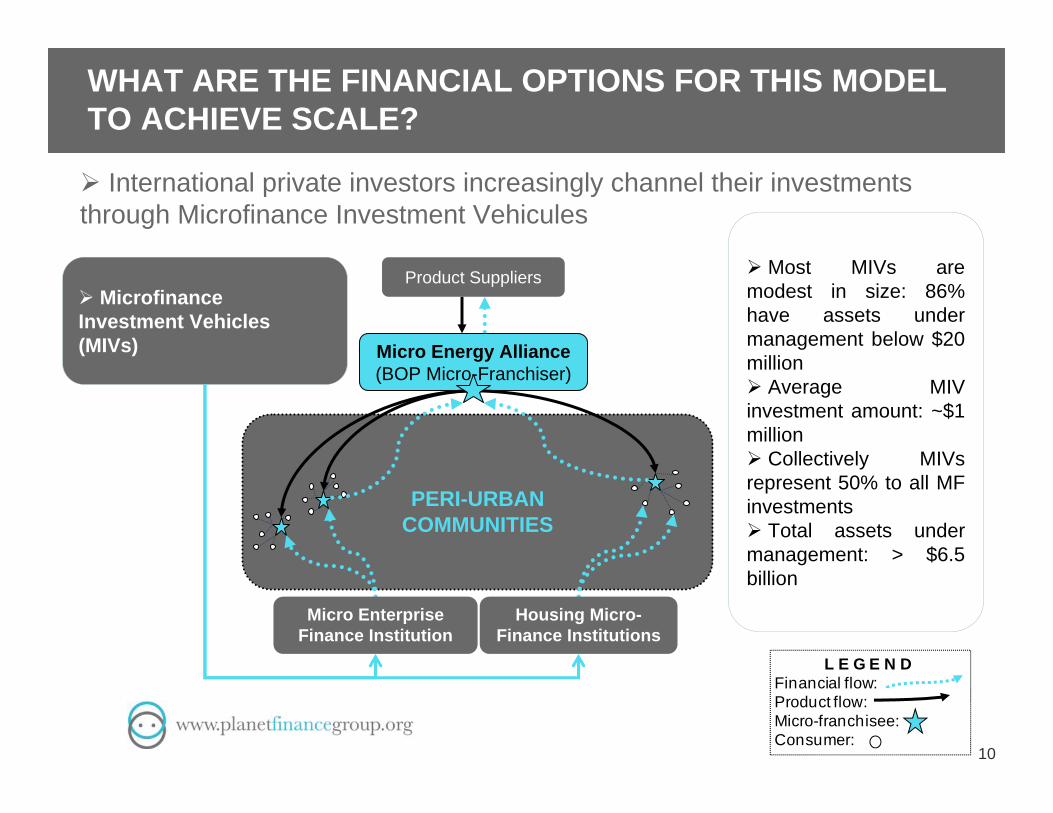
WHAT ARE THE FINANCIAL OPTIONS FOR THIS MODEL TO ACHIEVE SCALE?
10
L E G E N DFinancial flow:Product flow:Micro-franchisee: Consumer:
Microfinance Investment Vehicles (MIVs)
PERI-URBANCOMMUNITIES
Micro Energy Alliance (BOP Micro-Franchiser)
Micro Enterprise Finance Institution
Housing Micro-Finance Institutions
Product Suppliers Most MIVs are modest in size: 86% have assets under management below $20 million Average MIV investment amount: ~$1 million Collectively MIVs represent 50% to all MF investments Total assets under management: > $6.5 billion
International private investors increasingly channel their investments through Microfinance Investment Vehicules
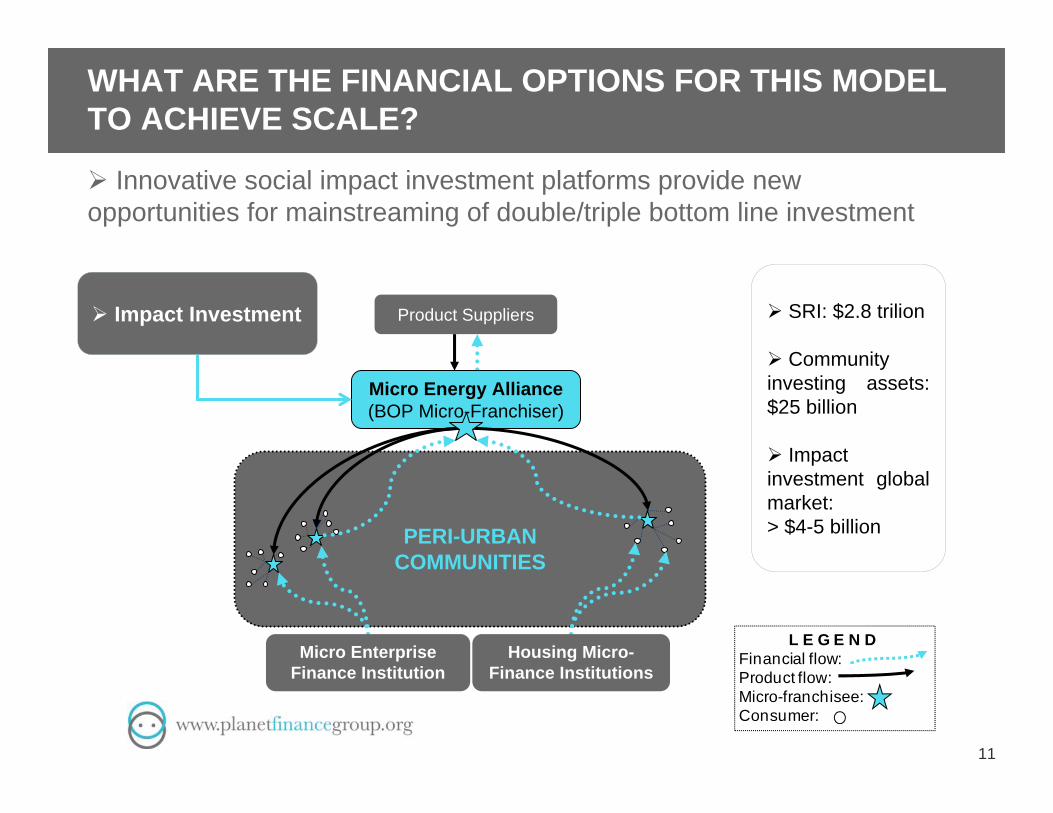
WHAT ARE THE FINANCIAL OPTIONS FOR THIS MODEL TO ACHIEVE SCALE?
11
L E G E N DFinancial flow:Product flow:Micro-franchisee: Consumer:
Impact Investment
PERI-URBANCOMMUNITIES
Micro Energy Alliance (BOP Micro-Franchiser)
Micro Enterprise Finance Institution
Housing Micro-Finance Institutions
Product Suppliers SRI: $2.8 trilion
Community investing assets: $25 billion
Impact investment global market:> $4-5 billion
Innovative social impact investment platforms provide new opportunities for mainstreaming of double/triple bottom line investment

HOW REPLICABLE IS THE MICRO VALUE CHAIN DEVELOPMENT MODEL?
International networks of MFIs in low-income, energy-poor communities provides strong platforms for model replication
Low-equity model Limited financial support required for start-up
Demand-driven, self-sustainable, scalable model
Fast growth of RE technology sector implies growing potential of the Micro Franchising Organization business model
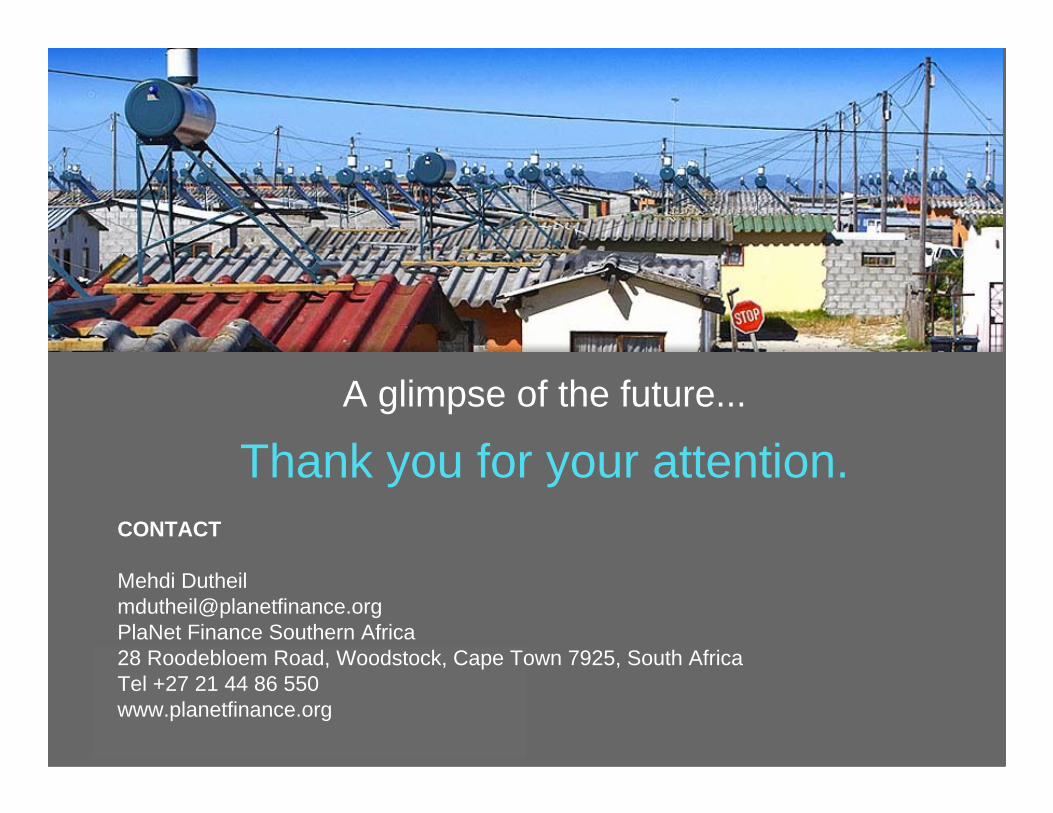
A glimpse of the future...
Thank you for your attention.CONTACT
Mehdi [email protected] Finance Southern Africa28 Roodebloem Road, Woodstock, Cape Town 7925, South AfricaTel +27 21 44 86 550www.planetfinance.org
Global Environment FacilityGlobal Environment FacilityClimate Change Mitigation Investments Climate Change Mitigation Investments
Nairobi, KenyaApril 13, 2010
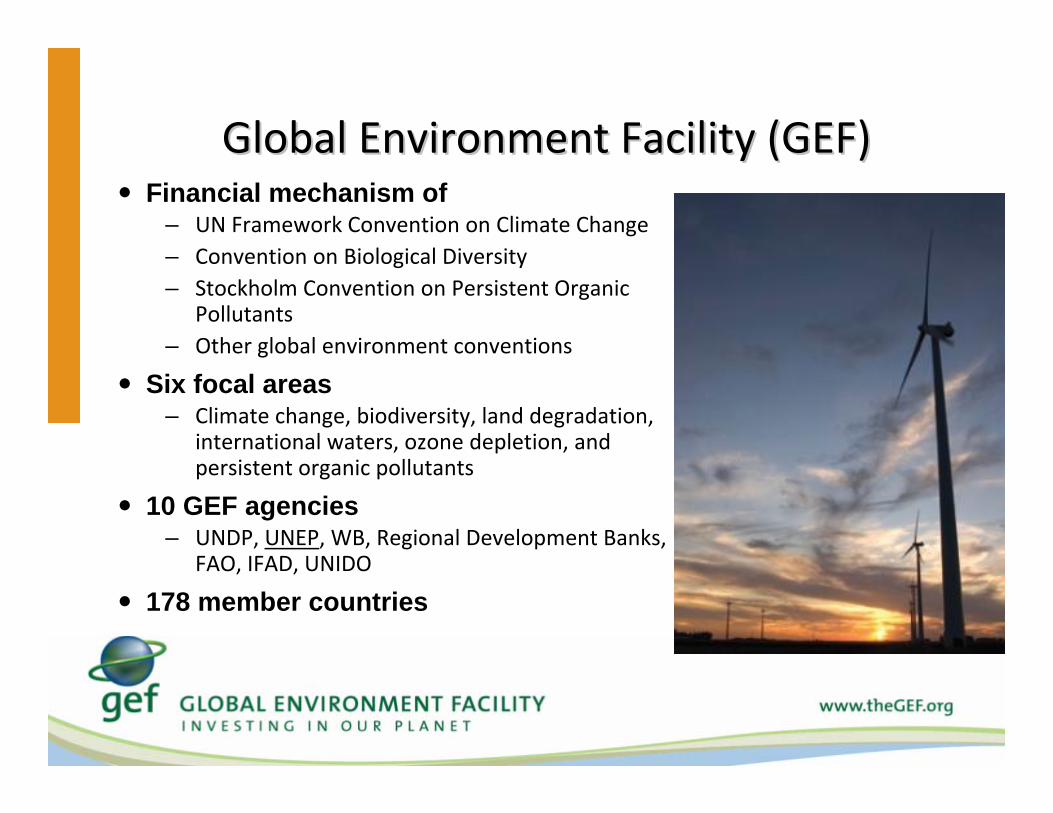
Global Environment Facility (GEF)Global Environment Facility (GEF) Financial mechanism of
– UN Framework Convention on Climate Change– Convention on Biological Diversity– Stockholm Convention on Persistent Organic
Pollutants– Other global environment conventions
Six focal areas– Climate change, biodiversity, land degradation,
international waters, ozone depletion, and persistent organic pollutants
10 GEF agencies– UNDP, UNEP, WB, Regional Development Banks,
FAO, IFAD, UNIDO
178 member countries
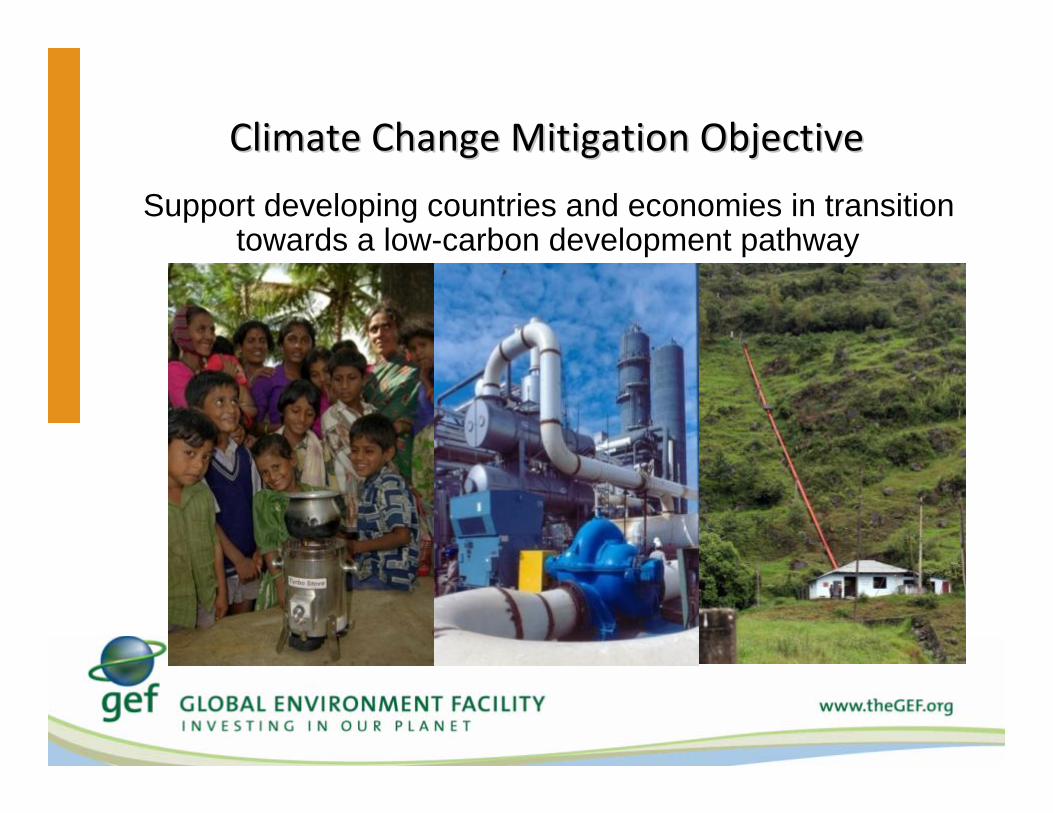
Support developing countries and economies in transition towards a low-carbon development pathway
Climate Change Mitigation ObjectiveClimate Change Mitigation Objective
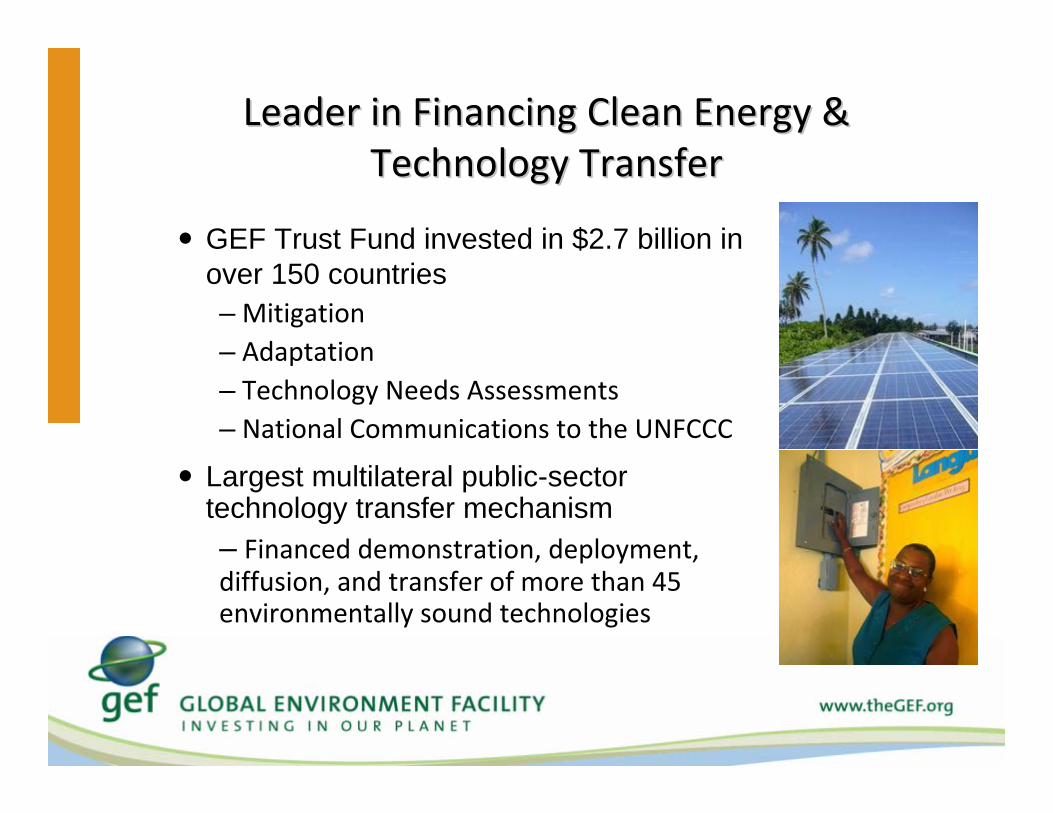
Leader in Financing Clean Energy & Leader in Financing Clean Energy & Technology TransferTechnology Transfer
GEF Trust Fund invested in $2.7 billion in over 150 countries– Mitigation– Adaptation– Technology Needs Assessments– National Communications to the UNFCCC
Largest multilateral public-sector technology transfer mechanism– Financed demonstration, deployment, diffusion, and transfer of more than 45 environmentally sound technologies
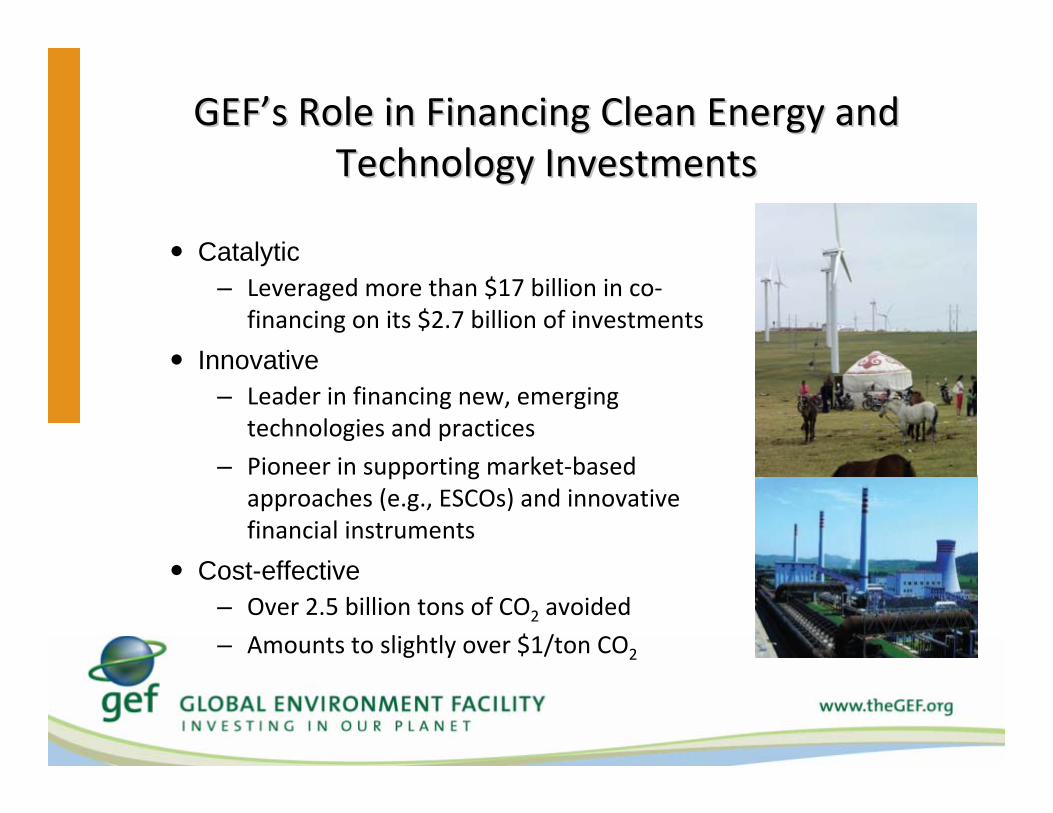
GEFGEF’’s Role in Financing Clean Energy and s Role in Financing Clean Energy and Technology InvestmentsTechnology Investments
Catalytic – Leveraged more than $17 billion in co‐
financing on its $2.7 billion of investments
Innovative– Leader in financing new, emerging
technologies and practices
– Pioneer in supporting market‐based approaches (e.g., ESCOs) and innovative financial instruments
Cost-effective– Over 2.5 billion tons of CO2 avoided
– Amounts to slightly over $1/ton CO2

GEF Support to Renewable Energy GEF Support to Renewable Energy
–Creating conductive markets to renewable energy
– Invest in the transfer of renewable energy technologies
–Promote access to modern energy services
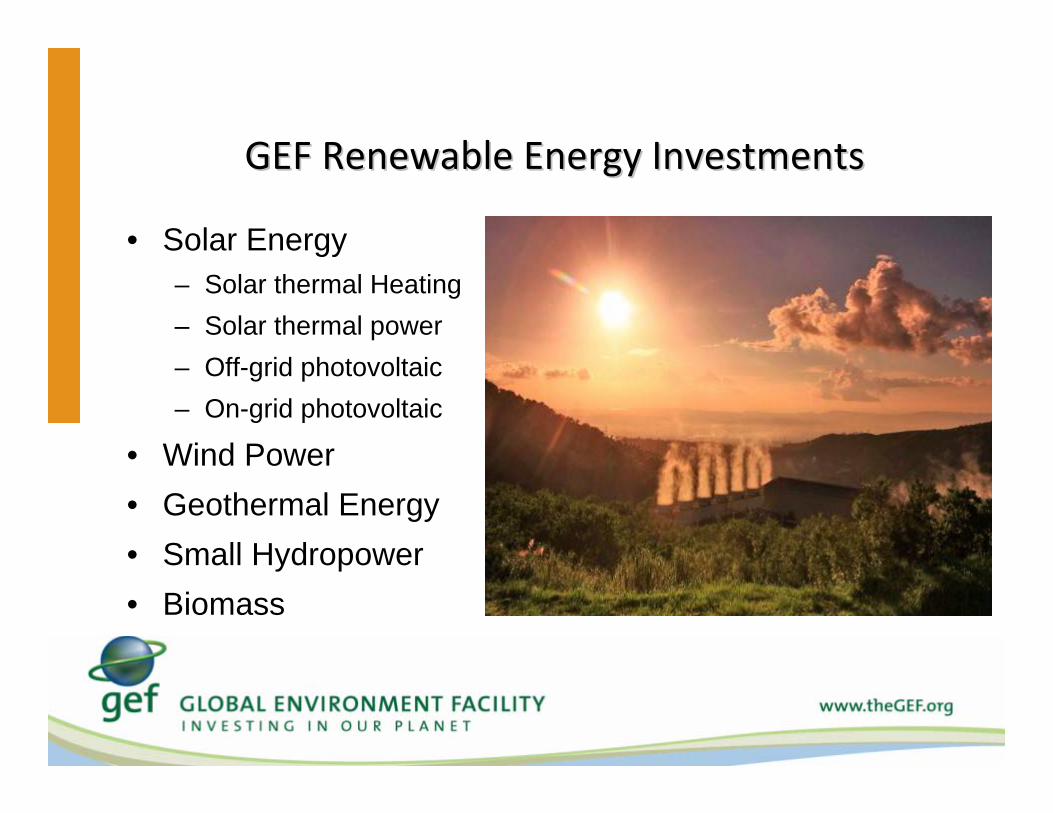
GEF Renewable Energy InvestmentsGEF Renewable Energy Investments
• Solar Energy– Solar thermal Heating– Solar thermal power– Off-grid photovoltaic– On-grid photovoltaic
• Wind Power• Geothermal Energy• Small Hydropower• Biomass
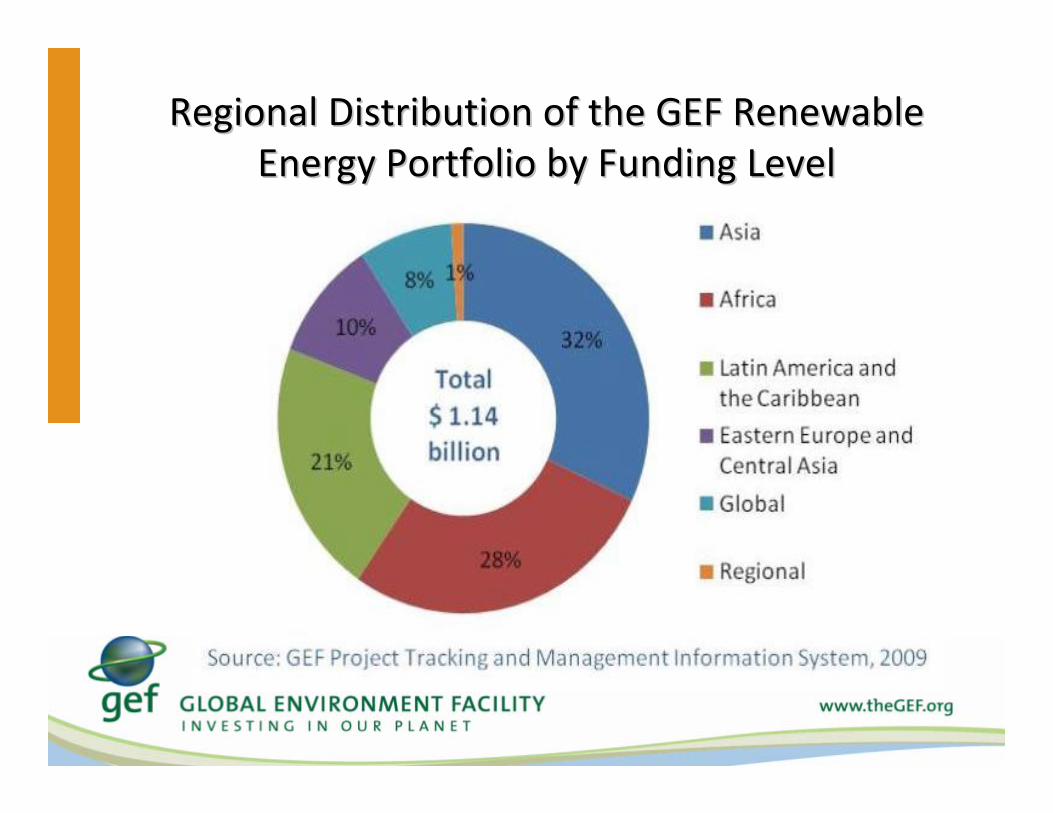
Regional Distribution of the GEF Renewable Regional Distribution of the GEF Renewable Energy Portfolio by Funding LevelEnergy Portfolio by Funding Level

GEF Renewable Energy Projects in AfricaGEF Renewable Energy Projects in Africa
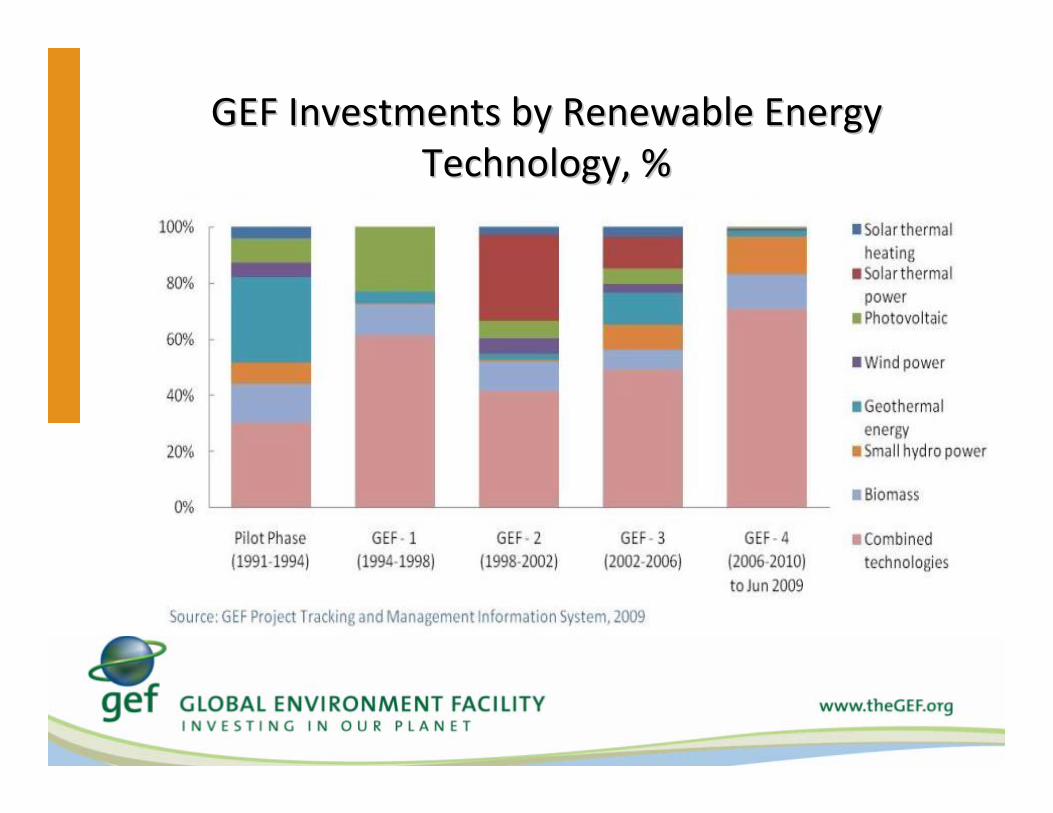
GEF Investments by Renewable Energy GEF Investments by Renewable Energy Technology, %Technology, %
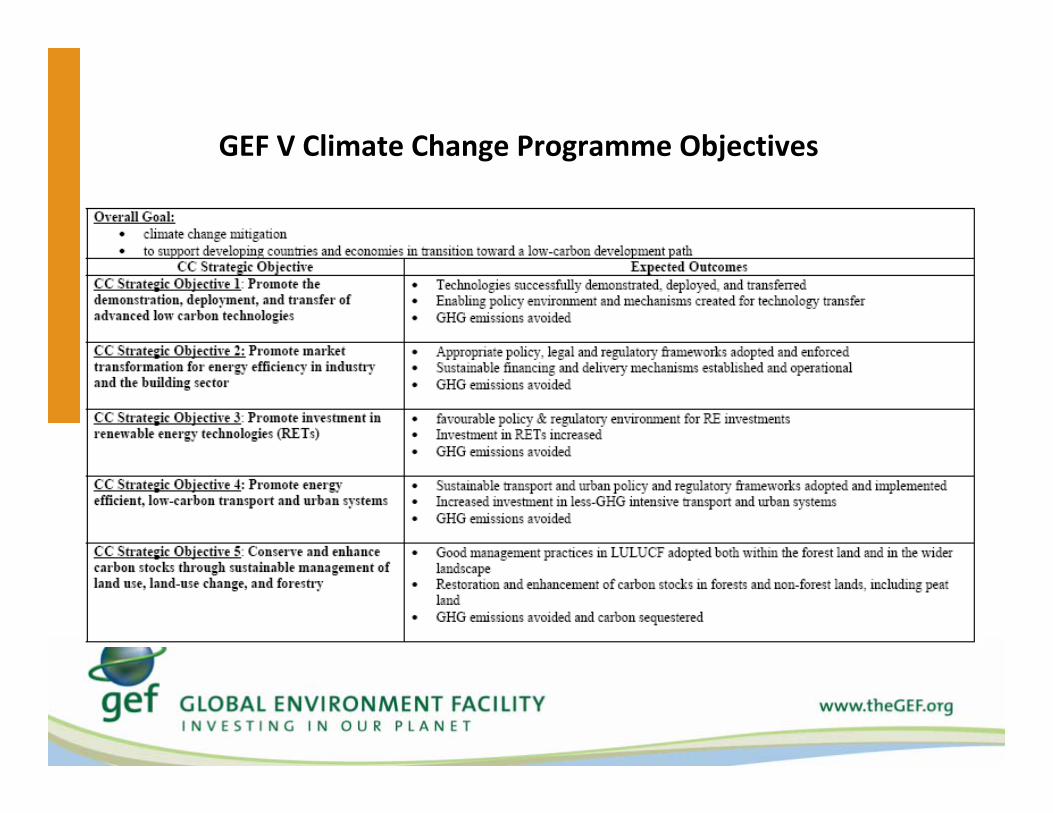
GEF V Climate Change Programme Objectives
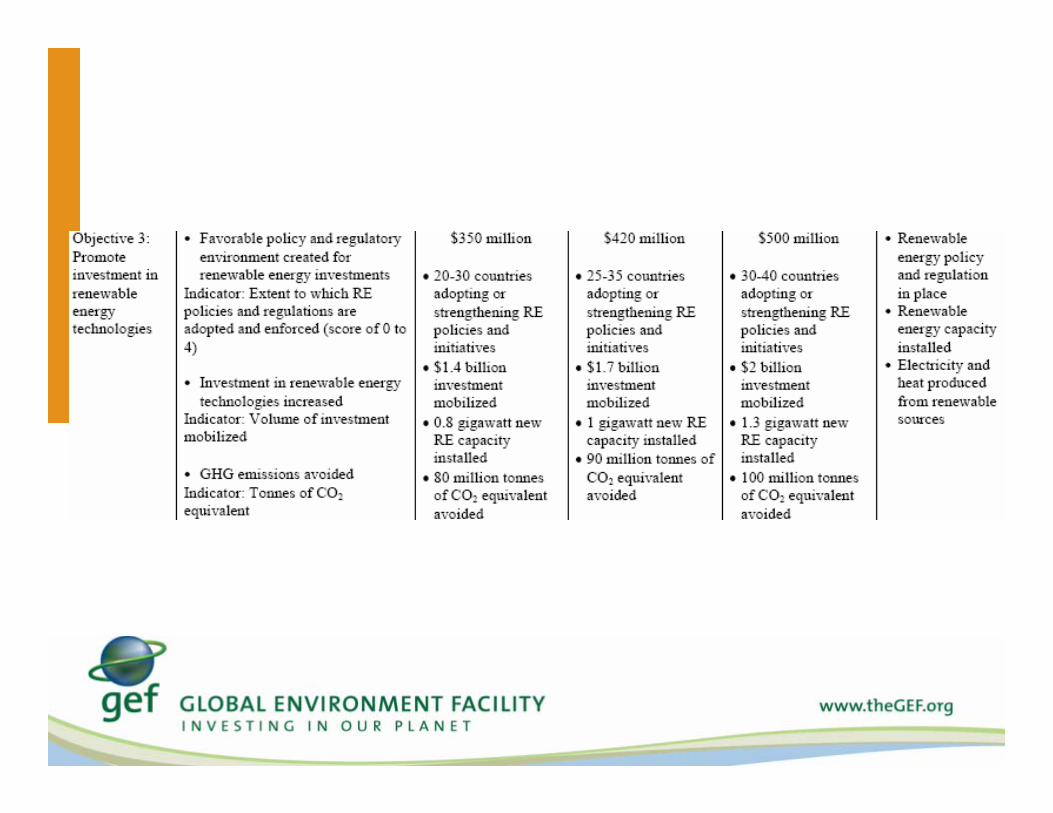

How to Access GEF How to Access GEF Funding?Funding?
Eligibility for GEF Funding for Climate Change Projects– Party to the UNFCCC
– Receives development assistance
Types of Funding
– Full‐size project (FSP)• More than $1 million
– Medium‐sized project (MSP)• $1 million or less
– Project preparation grant (PPG)• Based on needs
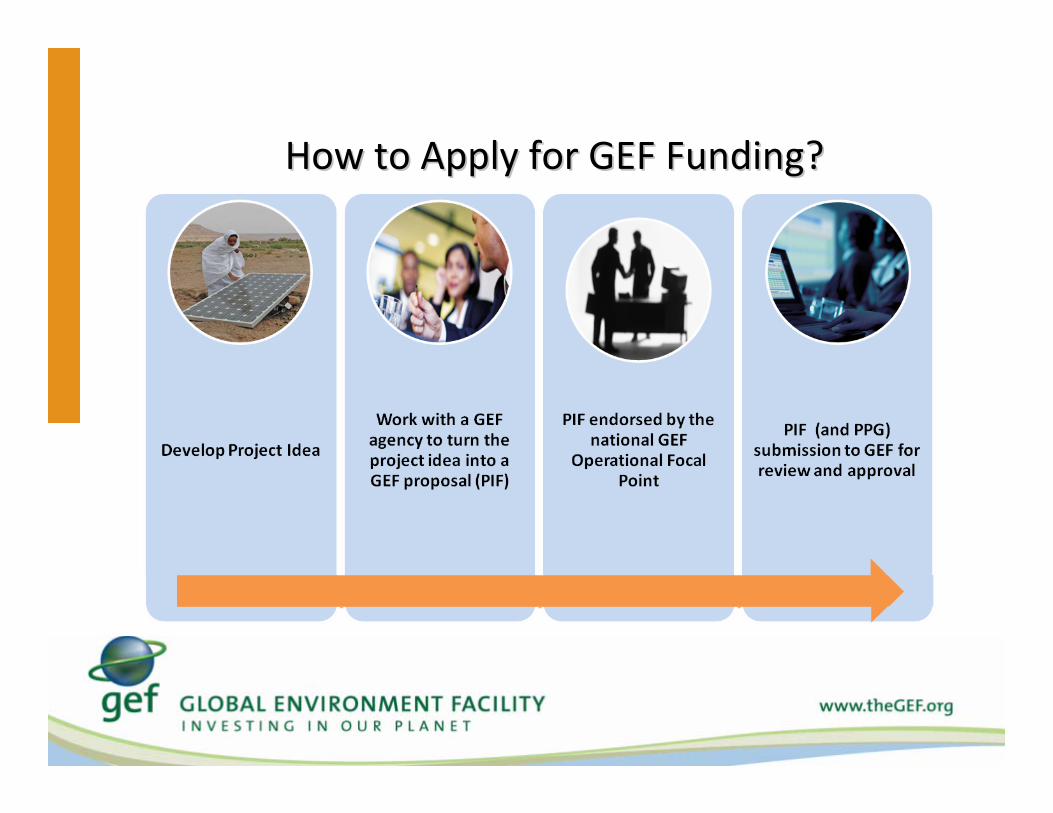
How to Apply for GEF Funding?How to Apply for GEF Funding?
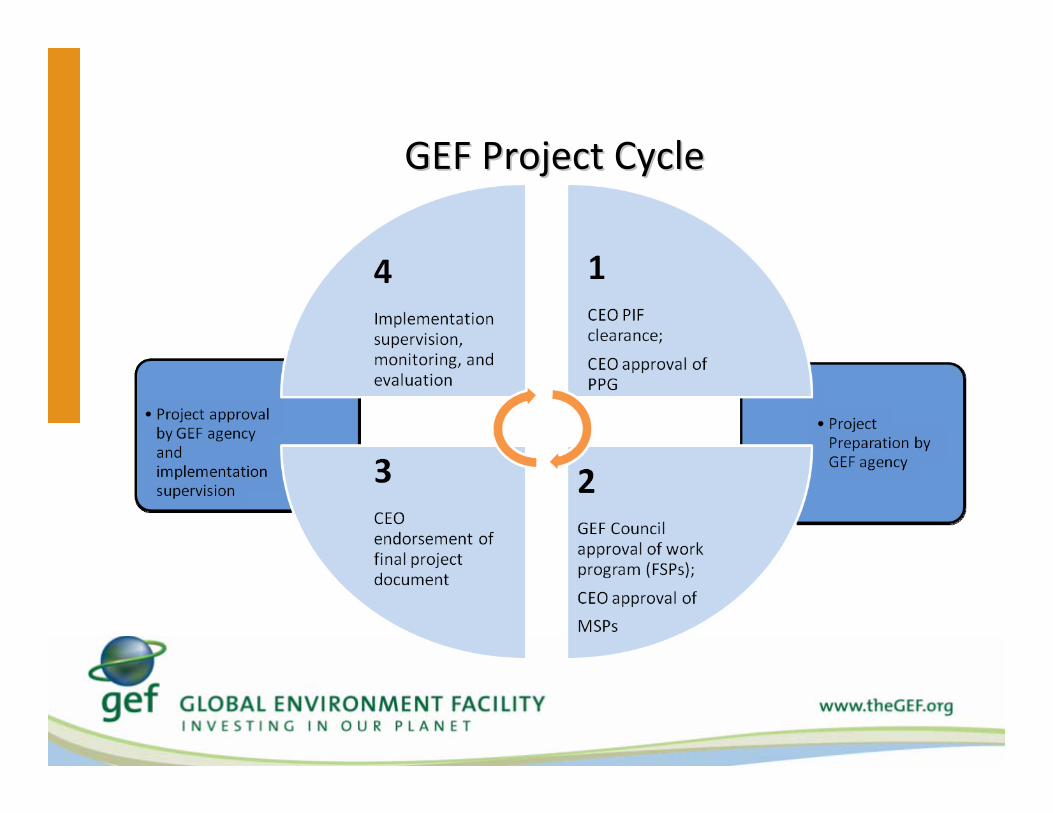
GEF Project CycleGEF Project Cycle

Project Review by GEFProject Review by GEFCountry eligibilityEndorsement by the national GEF Operational Focal PointConsistency with GEF strategic objectivesResource availabilityComparative advantage of the GEF agencyDelivery of global environmental benefitsSoundness of project designConsistency with national priorities and policiesCost-effectiveness of the projectValue-added of GEF involvement (incremental reasoning)Project cost and co-financing
Thank You!Thank You!
GEF Contact: GEF Contact: Ganna OnyskoGanna Onysko
[email protected]@thegef.orgWebsite: Website: www.TheGEF.orgwww.TheGEF.org
UNEPUNEP‐‐DGEF Contact:DGEF Contact:Conrado HeruelaConrado Heruela
EE‐‐mail: mail: [email protected]@unep.org
Website: Website: www.unep.org/gefwww.unep.org/gef