University of Nairobi - School of Engineering
85
i University of Nairobi School of Engineering Analysis of Land Use Land Cover Change and its Implication on Peri-Urban Agriculture: Case Study; Kiambu Sub-County in Kiambu County, Kenya. BY John Mungai Gitau F56/88248/2016 A Project submitted in partial fulfillment of the requirements for the Degree of Master of Science in Geographic Information System, in the Department of Geospatial and Space Technology of the University of Nairobi July 2018
-
Upload
khangminh22 -
Category
Documents
-
view
0 -
download
0
Transcript of University of Nairobi - School of Engineering

i
University of Nairobi
School of Engineering
Analysis of Land Use Land Cover Change and its Implication on Peri-Urban Agriculture:
Case Study; Kiambu Sub-County in Kiambu County, Kenya.
BY
John Mungai Gitau
F56/88248/2016
A Project submitted in partial fulfillment of the requirements for the Degree of Master of Science
in Geographic Information System, in the Department of Geospatial and Space Technology of
the University of Nairobi
July 2018

ii
DECLARATION
I, John Mungai Gitau, hereby declare that this project is my original work. To the best of my
knowledge, the work presented here has not been presented for a degree in any other university.
JOHN MUNGAI GITAU …….……………… …………………
Name of student Signature Date
This project has been submitted for review with my approval as university supervisor.
DR. F.N KARANJA ……….……………… …………………
Name of supervisor Signature Date

iii
ACKNOWLEDGEMENTS
First I would like to acknowledge that it is by the Grace of God that I have made this far. The gift
of life, sound mind and good health that has been granted graciously has enabled me to
undertake this research.
I acknowledge the guidance and advice from my supervisor, Dr. F.N Karanja. Thank you for
your continued advisory and supervisory support in my undertaking of this project
I would also like to acknowledge my colleagues, Johnson Njeri Kamau and Stacey Isumba for
their support and encouragement in doing this project.
My parents and siblings have given me support and encouragement to completion of this
research. I highly thank you for your financial support.
I would also like to thank the department of Geospatial and Space Technology from the
University of Nairobi. It is through the skills and knowledge acquired from this department that I
have been able to complete research.
My gratitude to Bishop Edwin Thuo for your continued moral support and Prayers to guide me
on the right path as I embarked on preparing my proposal.

iv
ABSTRACT In the past few decades Africa has been experiencing a high population growth rate compared to
other continents. The peri-urban areas have been noted to have a higher growth rate in population
as the cities expands outward encroaching into the prime agricultural lands in the peri-urban
areas. In Kenya, the capital city Nairobi continue to grow and to expand outward and encroach
into Kiambu Sub-County. This research focused on the use of remote sensing and GIS tools to
detect land use and land cover changes, analysed them and their implications on peri-urban
agriculture. Multispectral images from Landsat Thematic Mapper, Enhanced Thematic Mapper
plus (ETM+) and OLI were used as a source for satellite images. Images obtained were for the
years 1995, 2000, 2014 and 2018. These images were analysed using ARCGIS and ERDAS
Imagine.
This research involved digital image classification of the satellite image using the supervised
classification technique to classify images. The results revealed that agricultural land is reducing
at an alarming rate by being converted to built-up areas. In the year 2018, agricultural land had
reduced from 8429.67 Ha in 1995 to 4376.52 Ha. This means that 4053.15 Ha of prime
agricultural land had been converted into built up areas within a period of 23 years. In terms of
percentage, agricultural land declined by 38.02% within 23 years. The research revealed that
land use conversion was accelerated by increase in population which ultimately increased the
demand for housing. The real estate developers were noted to be the main agents of land use
conversion. Low returns from agricultural output forced farmers to abandon farming and engage
in attractive and lucrative business in housing and other uses. This has affected the agricultural
production posing a serious threat to food security in the area. Many employees who relied on
agricultural related jobs were rendered jobless and this increased the poverty levels
This research recommends the need for land management bodies to create and regularly update
the land use plans to regulate conversion of land in the sub-county. There is also need to enhance
agricultural practices by encouraging intensive farming, precision agriculture and urban
agriculture. In an effort to improve returns from farming, there is need to improve marketing
through formation of strong cooperative societies, training on modern farming technologies and
value addition through pre-processing. This would slow down the rate of conversion of
agricultural land and conserve agricultural land thereby ensuring food security.
v
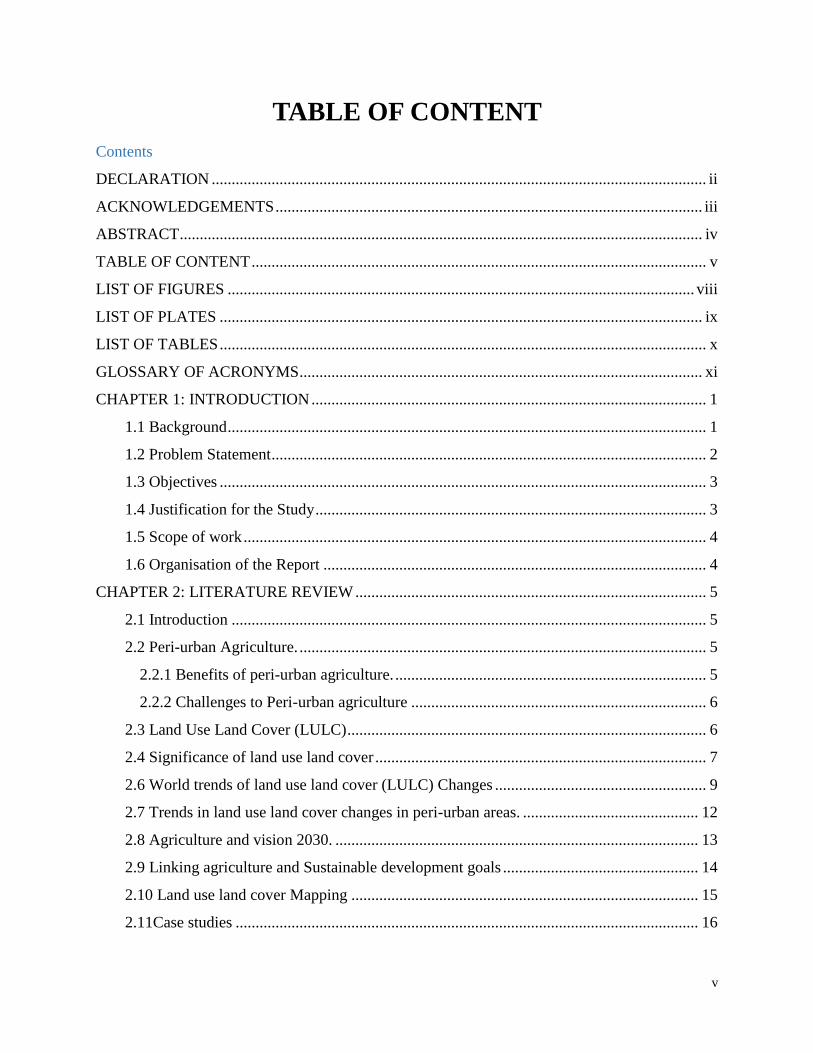
TABLE OF CONTENT
Contents
DECLARATION ............................................................................................................................ ii
ACKNOWLEDGEMENTS ........................................................................................................... iii
ABSTRACT ................................................................................................................................... iv
TABLE OF CONTENT .................................................................................................................. v
LIST OF FIGURES ..................................................................................................................... viii
LIST OF PLATES ......................................................................................................................... ix
LIST OF TABLES .......................................................................................................................... x
GLOSSARY OF ACRONYMS ..................................................................................................... xi
CHAPTER 1: INTRODUCTION ................................................................................................... 1
1.1 Background ........................................................................................................................ 1
1.2 Problem Statement ............................................................................................................. 2
1.3 Objectives .......................................................................................................................... 3
1.4 Justification for the Study .................................................................................................. 3
1.5 Scope of work .................................................................................................................... 4
1.6 Organisation of the Report ................................................................................................ 4
CHAPTER 2: LITERATURE REVIEW ........................................................................................ 5
2.1 Introduction ....................................................................................................................... 5
2.2 Peri-urban Agriculture. ...................................................................................................... 5
2.2.1 Benefits of peri-urban agriculture. .............................................................................. 5
2.2.2 Challenges to Peri-urban agriculture .......................................................................... 6
2.3 Land Use Land Cover (LULC) .......................................................................................... 6
2.4 Significance of land use land cover ................................................................................... 7
2.6 World trends of land use land cover (LULC) Changes ..................................................... 9
2.7 Trends in land use land cover changes in peri-urban areas. ............................................ 12
2.8 Agriculture and vision 2030. ........................................................................................... 13
2.9 Linking agriculture and Sustainable development goals ................................................. 14
2.10 Land use land cover Mapping ....................................................................................... 15
2.11Case studies .................................................................................................................... 16
vi
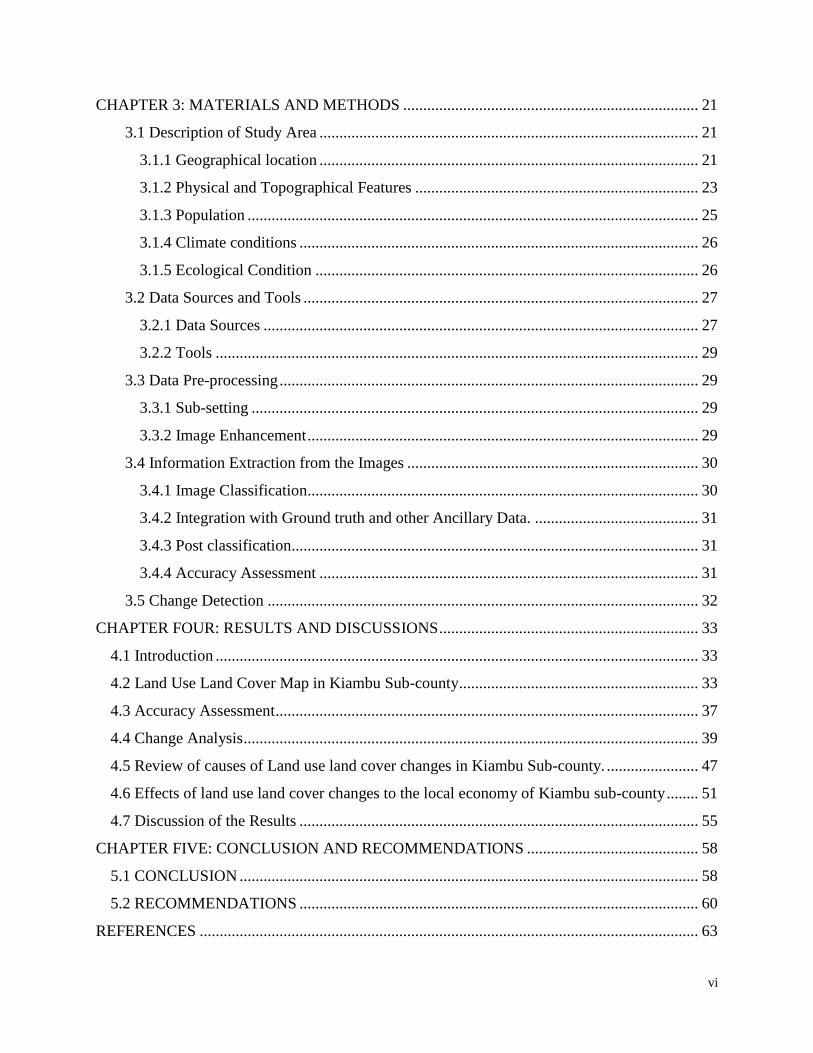
CHAPTER 3: MATERIALS AND METHODS .......................................................................... 21
3.1 Description of Study Area ............................................................................................... 21
3.1.1 Geographical location ............................................................................................... 21
3.1.2 Physical and Topographical Features ....................................................................... 23
3.1.3 Population ................................................................................................................. 25
3.1.4 Climate conditions .................................................................................................... 26
3.1.5 Ecological Condition ................................................................................................ 26
3.2 Data Sources and Tools ................................................................................................... 27
3.2.1 Data Sources ............................................................................................................. 27
3.2.2 Tools ......................................................................................................................... 29
3.3 Data Pre-processing ......................................................................................................... 29
3.3.1 Sub-setting ................................................................................................................ 29
3.3.2 Image Enhancement .................................................................................................. 29
3.4 Information Extraction from the Images ......................................................................... 30
3.4.1 Image Classification.................................................................................................. 30
3.4.2 Integration with Ground truth and other Ancillary Data. ......................................... 31
3.4.3 Post classification...................................................................................................... 31
3.4.4 Accuracy Assessment ............................................................................................... 31
3.5 Change Detection ............................................................................................................ 32
CHAPTER FOUR: RESULTS AND DISCUSSIONS ................................................................. 33
4.1 Introduction ......................................................................................................................... 33
4.2 Land Use Land Cover Map in Kiambu Sub-county ............................................................ 33
4.3 Accuracy Assessment .......................................................................................................... 37
4.4 Change Analysis .................................................................................................................. 39
4.5 Review of causes of Land use land cover changes in Kiambu Sub-county. ....................... 47
4.6 Effects of land use land cover changes to the local economy of Kiambu sub-county ........ 51
4.7 Discussion of the Results .................................................................................................... 55
CHAPTER FIVE: CONCLUSION AND RECOMMENDATIONS ........................................... 58
5.1 CONCLUSION ................................................................................................................... 58
5.2 RECOMMENDATIONS .................................................................................................... 60
REFERENCES ............................................................................................................................. 63

vii
APPENDICES .............................................................................................................................. 68
Appendix A: False colour composites ...................................................................................... 68
Appendix B.Kiambu Sub-County Topographical Map............................................................. 70
Appendix C: Similarity Report ................................................................................................. 71

viii
LIST OF FIGURES
Figure 2.1: Land use and land cover per original ecosystem………….…..……………….....…10
Figure 2.2: Global rural and urban migration…………………...……..……………...................11
Figure 2.3: Raipur LULC map for year 1999.........................................................................…...19
Figure 2.4: Raipur LULC map for year 2016……………………………………………….…...20
Figure 3.1: Geographical location of Kiambu County in the context of Kenya…………….…...21
Figure 3.2: Kiambu sub-counties…………………………………………………..…………….22
Figure 3.3: Research Methodology flow chart…………………………….…………………….28
Figure 4.1: Land use land cover distribution in 1995……………………………………….…...34
Figure 4.2: Land use land cover distribution in 2000……..…………………………….…….…35
Figure 4.3: Land use land cover distribution in 2014………………………………………........36
Figure 4.4: Land use land cover distribution in 2018…………………………………………....37
Figure 4.5: Bar graph for land use change (1995-2000)………………………………………....39
Figure 4.6: Land use land cover changes (1995-2000)……………………………………….….40
Figure 4.7: Bar graph for land use change (2000-2014)…………………………………...….…41
Figure 4.8: Land use land cover changes (2000-2014) ………………………………………….42
Figure 4.9: Bar graph for land use change (2014-2018)……………………………………...….43
Figure 4.10: Land use land cover changes (2014-2018)…………...………………………….…44
Figure 4.11: Bar graph for land use change (1995-2018)…………………………………..........45
Figure 4.12: Land use land cover changes (1995-2018)……………………………………...….46
Figure 4.13 Bar graph for land use change (1995-2018)………………………………………...46

ix
LIST OF PLATES
Plate 4.1: Four way Junction Estate……………………………………………………………...48
Plate 4.2: Real Estate development along Kiambu Road.......................................................…...49

x
LIST OF TABLES Table 2.1: Bosomtwe Landsat Images……………………………………………………….…..17
Table 2.2: Bosomtwe Land Use Change………………………………………………….……...17
Table 2.3: Raipur Land Use Change…………………………………………….…………….…18
Table 3.1: Area of county by sub-county……………………………………………………..….23
Table 3.2: Population Density by Sub-Counties………………………………………………....25
Table 3.3: Data type, source of data and its description…………………………………………27
Table 3.4: Land use/land cover classes description……………………………...………………30
Table 4.1: Land use land cover changes from 1995 to 2018…………………………………….33
Table 4.2: Accuracy assessment report for 1995………………………………………………...38
Table 4.3: Accuracy assessment report for 2000………………………………………………...38
Table 4.4: Accuracy assessment report for 2014………………………………………………...38
Table 4.5: Accuracy assessment report for 2018………………………………………………...38
Table 4.6: Overall accuracy and Kappa Coefficient Statistics…………………………………..38
Table: 4.7: Land use change between 1995 and 2000……………………...……………………39
Table 4.8: Land use change between 2000 and 2014…………...……………………………….41
Table 4.9: Land use change between 2014 and 2018……………………………………………43
Table 4.10: Land use change between 1995 and 2018……………………………..……………45
Table 4.11: Population Census Data......................................................................................…....47
Table 4.12: Population projections………………………………………………...…………….47

xi
GLOSSARY OF ACRONYMS
1. LULC- Land Use Land Cover
2. LULCC- Land Use Land Cover changes
3. PUA-Peri-Urban Agriculture
4. UN DESA-United Nations, Department of Economic and Social Affairs
5. GIS-Geographic Information System
6. RADAR-Radio Detecting and Ranging
7. LiDAR-Light Detection and Ranging
8. GPS-Global Positioning System
9. FAO-Food and Agriculture Organisation
10. UNEP-United Nation Environmental Program
11. ETM+ - Enhanced Thematic Mapper Plus
12. AOI- Area of Interest.
13. RCMRD-Regional Centre for Mapping of Resource for Development
14. ILRI-International Livestock Research Institute
15. DN-Digital Numbers
16. ADP-Annual Development Plans
17. C.G.K- County Government of Kiambu

1
CHAPTER 1: INTRODUCTION
1.1 Background Land use refers to various human activities on the surface of the earth. These activities normally
change the natural environment into built environment. Land cover on the other hand refers to
things that cover the earth surface. Land covers can be observed directly through a remote
sensor. Land use on the other cannot be observed directly but rather it is deduced from inferences
made from land cover (Bhatta, 2011).
Increased population and rapid urban growth is associated with massive human activities
resulting into significant change in land uses and land covers. This often results in more pressure
being exerted on the existing agricultural land and in the long run affecting agriculture (Kim et
al., 2011). In Kenya, agriculture is the backbone of the economy attributed to good fertile soils
and good rainfall enabling both food crop and cash crop farming. However, food security has
been threatened due to changes in land use and land cover which has seen large amount of
agricultural land being converted into urban land uses such as residential, commercial and
industrial uses. This has led to reduced foreign exchange income and risk of food insecurity
(Musa and Odera, 2014).
The rate of growth in urban areas has been rapid in the last few decade. This growth has been
contributed by increased population in the urban areas. Although the current world population is
estimated at approximately 7.6 billion, there are projections that this will increase from 8.6
billion in 2030 to 9.8 billion in 2050 (UN DESA, 2017). The growth of urban areas leads to
outward expansion of cities into the peri-urban areas leading to significant changes in land use
and land cover in agricultural land in the peri-urban areas. Aguilar and Ward (2003), observed
that as one moves from urban centers to rural areas, the land becomes progressively agricultural
with various land covers. Since land is a fixed factor of production the land remain fixed as the
population increases hence urban sprawl into peri-urban areas changing the land use and land
cover.

2
Urban areas in Kenya mainly expands in a radial direction around an established urban center or
in a linear way along infrastructures such as roads or railway lines (Mundia and Aniya, 2005).
The study area which is Kiambu sub county borders Kenya’s capital city, Nairobi and thus it has
had a significant land use and land cover changes due to the expansion of the city over some
time. This changes in land use land cover have impacted agriculture in a great way in this sub
county. Originally Kiambu sub-county was a large scale coffee and tea growing zone with
massive plantations. This was due to good climate and fertile soils in the region. It also served as
the food basket of the capital city providing cheap and affordable food stuffs.
The term peri-urban agriculture is defined by FAO as a type of agriculture that happens on farm
units that are closer to town that engage in intensive semi- or fully commercial farms. These
farms are used to grow vegetables and for horticulture practices. It also involves poultry and
livestock farming for production of milk and eggs among other products. The production in peri-
urban agriculture is primarily market oriented and economically dependent on the city (FAO,
2011).
Peri-urban agriculture is an important food base for growing cities in Kenya. Its need is
accelerated by increasing urban population, impacts of climate change, energy cost and changing
pattern of food consumption. Unlike rural areas with poor infrastructure for transporting and
preserving their products, peri-urban agriculture in Kenya is driven by the following factors.
Readily available consumer market
Reduced expenses for packaging, storage and transportation
Readily available human resource
Job creation and source of income
1.2 Problem Statement Changes in land use land cover impacts on agriculture affecting agricultural practices such as
food crop, cash crop and livestock farming. Over the past few decades there has been a rapid
change in land use and land cover in Kiambu sub-county. These changes have been caused by
rapid urbanisation and increases in population densities as a result outward of expansion of
Nairobi city into the peri-urban areas. Changes in land use and land cover can be viewed in three
perspectives; type of change, amount of change and the location of these changes.

3
Peri –urban agriculture has become an important aspect to land use planners to secure the natural
resource base for food production to the urban dwellers. Therefore land use planners need to
identify land use land cover changes in order to make informed decisions in securing and
preserving peri-urban agricultural zones (Ulf and Bergman, 2014). Kiambu County originally
was the food basket of Nairobi and also provided coffee and tea for export.
There has been very minimal attempts to detect and analyse these changes and their implication
to agriculture using remote sensing and GIS tools (Musa and Odera, 2014). Therefore, there is a
need to effectively and efficiently detect these changes and evaluate implication that they have
on the area of study so as to effectively deal with these LULC changes. This will inform decision
making using the knowledge acquired.
1.3 Objectives The main objective of this research was to map land use land cover changes and their implication
on agriculture in Kiambu sub-county using Remote Sensing and GIS tools.
Specific objectives
The specific objectives were namely to:-
1. Map land use land cover changes in Kiambu sub-county.
2. Quantify the effects of land use land cover changes on agricultural land in Kiambu sub-
county
3. Review causes of land use land cover changes in Kiambu sub-county
4. Interpret the effects of land use land cover changes to the local economy of Kiambu sub-
county
1.4 Justification for the Study Increased population has resulted in increased human activities on the surface of the earth
leading to land use land cover changes. There has been a rapid increase in urban population
associated with rural to urban migration because of better infrastructures and services in the
urban areas. As the town expands outwards it sprawls into the peri-urban areas taking over
massive fertile agricultural land and converting it into urban land uses such as residential,
commercial recreational and industrial(Kim et al., 2011).

4
According to UN-Habitat (2010) approximately 1 to 2 million Ha of agricultural land is being
converted to meet the rising demand for housing, industry, infrastructure and recreation in most
developing countries. This in itself is a serious threat considering that Kenya’s economy is
primarily agro-based. Large scale coffee and tea plantation are being replaced by real estate
developments in at alarming rate (Musa and Odera, 2014).
These land use land cover changes affecting peri-urban agriculture necessitates the need to
employ an approach that can be able to monitor these changes and analyse them for decision
makers. The traditional method of data collection have huge limitation in change detection and
monitoring as well as analysing these changes. Therefore the use of remote sensing and GIS
tools is necessary to be able to collect, detect change and analyse the implication of land use land
cover changes to peri-urban agriculture.
The findings of this research will benefit Kiambu Sub-County, the larger Kiambu County and the
national government as it can be used as the basis for further research and intervention. It can be
most useful to the department of agriculture, livestock and fisheries in Kiambu County. It will be
useful for policy formulation on matters regarding land cover land use changes, their
implementation, monitoring and evaluation
1.5 Scope of work This study is limited to Kiambu sub-county within Kiambu County. It covers an area of 105.9
square kilometres. It comprises of four wards and 18 sub-locations. This study focuses on
detecting land use land cover changes, analysing these changes and their implication on peri-
urban agriculture. On the implication of these changes the focus will be on sizes of agricultural
land, farming methods and livelihood of citizen dependant on agriculture in Kiambu Sub County.
This study employs remote sensing and GIS tools.
1.6 Organisation of the Report This project is structured into five chapters. Chapter one contains background information about
the project, problem statement, objectives of the project, justification of this study and the scope
of the study. Chapter two contains literature review that provides knowledge and information
used to guide this project. Chapter three contains description of the area study and the
methodology used in carrying out this research. Chapter four contains analysis and discussions of
the results. Chapter five contains conclusions and recommendations.

5
CHAPTER 2: LITERATURE REVIEW
2.1 Introduction This chapter includes the review of relevant literature in line with trends in LULC, causes of
LULC, implications of LULC on peri-urban agriculture and the application of Remote Sensing
and G.I.S tools in response to LULC changes in land use planning.
2.2 Peri-urban Agriculture. Food and Agriculture Organization of United Nation (FAO, 2012) defines peri-urban agriculture
as agriculture practices within and around cities which compete for resources which could serve
other purposes to satisfy the requirement of urban population. Peri-urban agriculture operates on
units close to towns and practices intensive farming that is semi or fully commercial. It involves
vegetables and other horticultures. Livestock is based on small ruminants that require less space
to provide milk and meat. It also involves poultry farming for eggs.
Urban centres in developing countries are growing at a rapid rate leading to proliferation of
urban sprawl into the peri-urban areas. It is estimated that approximately more than half of the
world population live in urban centres (UN DESA, 2015). Rapid urbanisation has caused
emergence of large group of urban poor with widespread issues of food insecurity and
malnutrition in developing countries. It is estimated that 40% of urban inhabitants live on less
than one US dollar while 70% of the inhabitants living on less than two US dollar (FAO, 2012).
Rural to urban migration has been the major factor for rapid urbanization. As the rural residents
migrated to urban centres, they brought with them agricultural practices for food security and
livelihood purpose. This transformed traditional rural farming to peri-urban farming to provide
food for the urban population.
2.2.1 Benefits of peri-urban agriculture. Peri-urban agriculture promotes environmental conservation by creating or conserving urban
open spaces at the edge of urban areas. This impacts positively on climate by reducing urban
heat island effect and carbon sequestration. It ensures food security to the urban population
creating a dependable access to adequate and nutritious food commodities. This boost both
physical and mental health of the urban population and peri-urban population (Maheshwari et al.,
2016)

6
The urban poor can grow their own food to promote their urban livelihood by getting income
from peri-urban agriculture. This leads to poverty reduction and promotes decent livelihood.
Peri-urban areas are characterised of better infrastructure than rural areas and thus it can be able
to get farm inputs more easily and transport farm output more easily to the market. They have
access to facilities to keep farm produce fresh such as refrigerators. Peri-urban agriculture has an
already existing market and thus have provided many people with employment
2.2.2 Challenges to Peri-urban agriculture As urban centres grow, they expand outward into the prime agricultural peri-urban land. This
growth is haphazard, disordered and uncoordinated leading to unplanned and uncontrolled
landscapes. The growth of urban population creates high demand for food security. Peri-urban
areas are useful for urban survival in that they ensure food availability and affordability which
the current sizes of land may not produce (Kiita, 2013).
Peri-urban lands are generally meant for production of commodities for consumption by the
massive population of city dwellers. However, the rate at which agricultural land is converted to
other urban land uses surpasses the ability of the current available land to provide to the growing
population. Countries experiencing rapid urbanisation suffer from displacement of agriculture
from peri-urban land (Naab, 2012).
Due to competition and pressure on land to meet urban demands, there has been excessive use of
farming inputs such as nitrogen, phosphorous, pesticides and raw organic matter in which the
levels of undesirable residues such as heavy metals is dangerous. The crops are in danger of
physical, chemical and fungal threat from the urban environment in the form of roadway exhaust
and debris, industrial chemicals and pollution from organic matter (Lee-Smith, 2014).
2.3 Land Use Land Cover (LULC) Land is a natural resource comprising of soil, water and the associated flora and fauna that make
the entire ecosystem. For effective planning of land as a resource, it is important to understand
the spatial distribution of land use and land cover. Normally, land use and land cover have been
used interchangeably although their actual meaning differs.

7
Land use refers to human activities on the earth surface that modifies or transforms the surface of
the earth. Land use varies depending on the purpose which can be production of food, housing,
recreational, extraction and biophysical characteristics of the land. Land use is not directly
observed rather inferences about land use in a given piece of land are drawn from observing land
covers (Bhatta, 2011).Looking at different social and economic systems in a given region, one is
able to see the character of society in its interaction with the physical environment. In developing
countries land use has largely resulted in land degradation because of excess pressure on land in
an attempt to extract maximum output from the available resources (Yadav et al., 2012).
Land cover refers to the physical and biological cover over the surface of land including water,
vegetation, bare soil and/or artificial structures (Ellis, 2007). This refers to the spatial distribution
of various land cover classes on the surface of the earth. Land cover can be estimated both
quantitatively and qualitatively through remote sensing. Land use land cover change refers to
transformation of the surface of the earth by natural and human factors. This is a process that
involves identifying driving factors to change and analysing them, monitoring land resources to
identify changes and carrying out predictions (Carmelita et al., 2002).
2.4 Significance of land use land cover Through identifying, monitoring, planning and managing land resources, a baseline for land
cover change detection can be established. This can also be used as ground cover information for
baseline thematic maps (Bhatta, 2011).Land cover analysis using remote sensing can be used to
give inferences about existing land use. Land use baseline mapping can be useful in that it
provides a reference point in change detection. To detect changes we need timely information on
the current state of the land available and changes in land use from time to time (Bhatta, 2011).
The knowledge acquired is useful in developing strategies in response to conflicting land uses,
conservation and development pressure on the finite land resource. This knowledge forms the
basis of studies on removal of disturbances on productive land, urban encroachment and
depletion of forest (Kavitha et al., 2012).
Land use land cover change detection plays a critical role in planning and management of the
existing natural resources to ensure sustainable development. It shows the dynamics of land use
land cover change processes, drivers of these changes and their consequences.

8
Land use land cover changes is a dynamic process covering a wide area that is accelerated by
natural phenomena and human activities. This is a major factor leading to global environmental
change which is a hot topic in the 21st century (Kalantari et al., 2014).
Studies involving LULC are often multi-disciplinary in nature involving international
conservation bodies, non-governmental organisation, food security agencies, government
researchers, private researchers and forestry and wildlife researchers.
The government may divide its coverage into regions managed by regional agencies. They are
mandated to take inventory of land cover and to monitor land use in order to manage resources
within their jurisdiction. In furtherance to sustainable land management, land cover and land use
information is applied in planning, monitoring and evaluation of developments, reclamation of
land or industrial activities (Bhatta, 2011).
2.5 Land use land cover change (LULCC)
This refers to the modification of the terrestrial surface of the earth by human activities. Human
activities are dated back to many centuries ago and they were used for extraction of essential
products from resources in the earth surface to improve their livelihood. However, this rate, the
extent and intensity at which this modification is taking place is way far beyond the past and
creates pressure on the existing land (Carmelita et al., 2002).
In the recent past the world has experienced unprecedented changes in the ecosystem and
environmental process. This changes are driven by LULCC occurring at local, regional and
global scale. This LULCC has necessitated the study and analysis of changes happening at a
global scale in order to inform decision making in environmental planning and ecological
management to ensure sustainable development. (Kalantari et al., 2014).
The rate at which urban areas are expanding has brought about rapid urbanisation and urban
sprawl into prime agricultural land. It is estimated that approximately more than half of the world
population live in urban areas (Kassim and Weliwita, 2015). The agricultural land and forest land
cannot deflect the encroachment of urban areas because of its rapid rate of growth. The increase
in urban population increases demand for food, infrastructures, energy and housing. In attempts
to satisfy this needs, urban areas exerts high pressure on available land with agricultural land
suffering more as it is converted into built up areas at an alarming rate (Matuschkle, 2009).

9
Practical classification of different types of land uses over large areas can be done using remote
sensing since its faster, efficient, effective and economical. Change is normally detected by
comparing previous maps with current updated time series land use land cover change maps
derived from satellite images (Estoque and Murayama, 2011).
Land cover may be seasonal as seen in agricultural land and deciduous trees which change
seasonally. It can also be annual change such as deforestation that happens in many years to pave
way for built up areas. Land use change detection and mapping use high imageries in order to
obtain detailed information and combines this with multi spectral optical data that help to
distinctively distinguish various land use classes (Alkema et al. 2012).
2.6 World trends of land use land cover (LULC) Changes Human population has a close relationship to land use and land cover in a given geographical
region. Human activities on a given piece of land have drastically changed land use/land cover to
a greater extent. According to United Nation world population prospects 2017, the current world
population of 7.6 billion is expected to increase to 8.6 billion by the year 2030. It further projects
that the world population will reach 11.2 billion by the year 2100 with 83 million people being
added every year.
UN DESA (2015) estimates that the world population will increase to 9.7 billion by the year
2050. Africa is estimated to be the fast growing continent and is estimated to increase by 2.4
billion people between 2015 and 2050. The second will be Asia with projected growth of 0.9
billion people between 2015 and 2050. It is estimated that North America, Latin America, the
Caribbean and Oceania will have small increment in their population size (UN DESA, 2015).
The increase in world population is projected to be greater in urban areas or in cities. The UN
Habitat Global Activities Report 2015 projects that, two third of the world population will be
living in cities by the year 2050.
It estimates that the world urban population will be increasing with nearly 73 million every year.
This means that the current urban centres are likely to grow bigger and increase in coverage
since more than half of the world population will be living in the cities. Therefore as the towns
and urban centres expands outwards it will swallow the existing peri-urban areas to satisfying the
increased demand of the new urban population (Kassim and Weliwita, 2015).

10
This increase in population increases human activities in the interest of meeting the demand of
resources to satisfy human needs. This results in excess pressure on the existing land to provide
the required resources since land is a fixed factor of production. Therefore, there has been
massive land transformation with more than 50% of the earth surface being transformed by
human activities (Kim et al., 2011). The expansions of infrastructure and agriculture has brought
about significant changes in land use and land cover
The earth’s land surface is estimated to cover an area of approximately 132 million square
kilometres. Crop farming is estimated to take 15 million square kilometres while grassland for
livestock takes 25 square kilometres. On the higher side, range lands are approximately
estimated to 35 square kilometres (FAO et al., 2015). Forestry is believed to have taken 12
million square kilometres for production purposes and 10 million square kilometres for multiple
use exploitation. Urban areas and infrastructure accounts for a very small portion of land use at a
global scale (FAO et al., 2015).
Source: (Van et al., 2017)
Figure 2.1: Land use and land cover per original ecosystem (2010)
The rapid increase in population has necessitated expansion in agriculture in an attempt to
provide food for the growing population. Expansion in agriculture has drastically reduced the
forest cover and wetland areas on the earth surface.

11
FAO (2016) noted that, expansion in agriculture has reduced world forest cover by 1.3 million
square kilometres resulting to global forest cover below 40 million square kilometres. The
reduction of wetland areas have increased from 64% to 71% from the begging of 20th century. In
an attempt to curb the need for agricultural expansion to new land, farming practise such as
irrigation, fertilisation and use of pesticides to increase agricultural yields have been employed.
The idea or the main goal has been to increase the productivity gain of given piece of land
instead of expanding to new lands (FAO, 2017).
The rate of urbanisation has increased at the expense of fertile agricultural land. Increase in
population largely brought about by rural to urban migration has led to growth in urbanisation. It
was observed that global urban population increased from 30% in 1960 to 54% in 2015 (UN,
2014). Generally growth in urban centres are known to displace agriculture as human settlement
mostly develop in fertile areas. Growth is mainly at the peri-urban areas which expand at a faster
rate (four times) than the rate of urban areas (Piorr et al., 2011). Agriculture is displaced to take
place at other region at expense of grasslands, savannah and forests.
Figure 2.2: Global rural and urban migration

12
Human activities has adversely affected climate leading to global climate change. Climate
change affects land use and land cover. Climate change alters the growing season and water
availability season which can displace agriculture to other places or lead to drought affecting
land use and land cover (UNEP, 2014). There has been global summit to address climate change
and look for mitigation strategies to reduce greenhouse gas emission. Protection of forest cover
has been at front line to prevent global warming by absorption of carbon gases in the
atmosphere.
2.7 Trends in land use land cover changes in peri-urban areas. The approximate size of Kenya is 582,646 square kilometres out of which 97.8% comprises of
land and 2.2% comprises of water. This land comprises of 20% medium to high potential with
the rest being classified as arid or semi-arid (Government of Kenya, 2009).Kenya population by
the year 2014 was estimated at approximated 40 million people at an average growth rate of 3.0
% (KNBS, 2009).It is project that the country will hit 71 million people by the year 2030.
Currently approximately 75% of Kenya population resides in the 20% of Kenya’s land classified
as medium to high potential area and the rest distributed in the vast arid and semi-arid areas
(Government of Kenya, 2009).
This means that the medium to high potential areas have high population densities exerting
pressure on land in those areas. By the year 2013, 25% (11,004,417) of Kenya’s total population
occupied the urban areas. The growth rate of urban population was estimated at 4.4% between
2010 and 2015. Most of this growth occurs in Nairobi, Kisumu, Kakamega, Eldoret and
Mombasa (KNBS, 2009).
The rural areas are characterised by high poverty levels which compels majority of young people
to move to urban areas in search of better livelihood. This has increased urban population rapidly
causing urban sprawl in the peri-urban areas. Most of peri-urban areas around major towns in the
country are rapidly being transformed into residential areas for the workforce in this cities. In
some instances this leads to informal settlement cropping up around this towns. This has greatly
displaced agriculture in this places.

13
There has been massive conversion of prime agricultural land in peri-urban areas into real estates
and commercial developments in the few past decades. The demand for energy has resulted into
drastic reduction of forest through deforestation to burn charcoal. Vegetation cover have been
cleared to pave way for massive infrastructures that often end in concrete jungles. The country’s
land is also suffering from continuous land fragmentation where land is continuously being sub-
divided into uneconomical units. Farm lands in high potential areas are becoming smaller and
smaller and this has reduced the rate of investment on the land.
Fragmentation of water catchment areas is causing low rainfall levels making the regions drier
than normal causing changes in land use and land cover. Major land uses in Kenya include:
agricultural use, industrial /commercial use, infrastructure, human settlements, recreational areas,
pastoralism, fishing, mining, wildlife, forests, national reserves and cultural sites. The uses are
spread or distributed across areas ranging from medium and high to low rainfall areas
2.8 Agriculture and vision 2030. The Kenyan government adopted the Kenya Vision 2030 on July 2008 as the new blue print to
guide development covering the period 2008-2030. The Kenya vision 2030 envisioned Kenya
into a newly industrializing, middle income country providing a high quality of life to all its
citizens in a clean and secure environment. Agriculture was identified as a key sector in
achieving this vision. The agricultural sector contributes 25% of Kenya’s total GDP and another
27% indirectly. It provides employment to 40% of total population in Kenya, providing jobs to
70% of rural population.
In an effort to achieve the Kenya 2030 vision, the strategy for revitalizing agriculture (SRA)
2004-2014 was revised. This gave rise to Agriculture Sector Development Strategy (ASDS,
2010-2020) whose vision is food secure and a prosperous nation. The ASDS was tasked to
achieve 3 targets by 2020. These includes:
1. Reduction to less than 25% of the number of people living below absolute poverty lines
2. Reduction of food insecurity by 30%.
3. To raise addition 80 billion Kenya shillings per year to the GDP
The ASDS is anchored on two thrust:
1. Increasing agricultural productivity, commercialization and enhance competitiveness of
both agricultural products and enterprises
2. To develop and manage factors of production key to agriculture.

14
The most important and basic factor of production in agriculture is land. In Agricultural
production, the constraints are brought about by limited availability of productive land. Kenya
has an area coverage of approximately 587,000 km2 where 11,000 km2 is occupied by water. In
the remaining 576,000 km2, only 16% is compose of high to medium agricultural zones with
adequate and reliable rainfall. Approximately 85% of Kenya land mass is arid or semi-arid and
cannot be suitable for rain-fed farming owing to poor rainfall levels (Government of Kenya,
2010).
The vision 2030 has come up with some Flagship projects in an attempt to enhance agriculture in
the country. One of the flagship project of high significance to this project is the development of
agricultural land use master plan. This is in an attempt to safeguard potential arable agricultural
farms from being subjected into inappropriate uses. The agricultural land use master plan will
enhance agricultural productivity and protect massive prime agricultural land being converted
into other land use (Government of Kenya, 2008),
2.9 Linking agriculture and Sustainable development goals
The sustainable development goals also referred to as global goals are universal call to action in
an effort to end hunger and protect the planet in order to ensure that everyone enjoy peace and
prosperity. It is anchored in the spirit of partnership to make the right choices to improve life
without compromising the future generation. SDG includes all countries with each country
having a target according to its priorities.
Agriculture fall mainly in the second SDG goal to end hunger. This call for need to addresses
food security, nutrition and how to improve agriculture. The demand for food is increasing with
increase in population where the world population is projected to rise to 9.8 billion by 2050. The
world population facing chronic hunger began to increase in 2014 from 775 million to 777
million in 2015 and up to 815 million people in 2016 (FAO, 2017).
One of the key solution identified to end hunger is to improve agricultural productivity. This
suggestion has been to increase more land under cultivation, protect agricultural land from land
degradation, ensure access to market, subsidize production cost and innovate new farming
technologies to increase yields. However, changes in land use land cover have largely impacted
on agriculture negatively leading to reduced agricultural production. This has been one of the
major cause of the number of population experiencing rising hunger (FAO, 2016).

15
Agriculture is also linked to the first SDG goal which is to eradicate poverty. Economic activities
that are focused on agriculture to provide low incomes to the poor population and land less
labourers are very effective in reducing poverty (Rosegrant and Hazell, 2001). Investing in
agriculture is more effective in poverty reduction than investing in non-agricultural sectors. It is
3.2 times better in poverty reduction in low income countries and rich income countries
(Christiansen et al., 2010).
2.10 Land use land cover Mapping Land use and land cover spatial distribution is important to decision makers and planners for
planning and monitoring changes and developing critical strategies in response to these changes.
There has been development of land use mapping from local to national to global scales (Giri,
2012). The advance of air and space borne sensors for remote sensing and GIS system that is
able to integrate multi-source and multi-date data changing the face of land use mapping from
traditional mapping methods.
Satellite remote sensing has enabled synoptic view of landscape at all levels from local to global
levels. Remote sensing sensors on satellites can be able to capture a wider electromagnetic
spectrum far beyond the visible spectrum. This electromagnetic spectrum can be broken down
into various spectral bands which helps in showing variability of the earth surface due to
different reflectivity of the earth surface (Lillesand and Kiefer, 2006).
Remote sensing is able to facilitate observation of greater extent than ground based observation.
Remote sensors are able to have a wider coverage by the use of cameras, multispectral scanner,
RADAR and LiDAR sensors that have been mounted on a stable air and space-borne platforms.
In return, these sensors produce photographs, satellite imagery, RADAR and LiDAR datasets.
P.S Roy and Roy Arijit (2010) noted that, data acquired through remote sensing can be:
1. High resolution datasets
These are normally produced in an irregular manner in extents that are no larger than a
single state or province.
These are normally acquired through aerial photography imaging, LiDAR and by
employing high resolution satellites the likes of CartoSat, IKONOS and Quickbird.

16
2. Regional datasets
These are datasets that are produced at regular intervals from satellite such as Landsat,
SPOT etc.
3. Low resolution datasets
These are dataset produced across the entire surface on a daily basis.
The key element in mapping land use land cover changes is the ability to discriminate between
different land uses. Datasets obtained from remote sensing are used to map land use and land
cover changes showing greater variability on the earth surface. It is able to show spatial and
temporal dynamics of land cover change. The reflectance of various land cover at different times
can be monitored to detect change which can then be analysed to establish the amount, type and
location of these changes as well as forces driving these changes (Herold et al., 2003).
GIS refers to a computerised system that work with geographic data with capability to capture,
store, process, analyse, manipulate, retrieve and display the queried output or processed
data(Musa and Odera, 2014). GIS is used in conjunction with the Global Positioning System to
identify land use land cover changes. GIS provides a user friendly environment to analyse
remotely sensed data. Remote sensing ensures that GIS has up to date environmental data
(Ashbindu et al., 2001).
The combination of the three technologies (GIS, Remote Sensing and Global Positioning
System) have enabled analyses of both spatial and temporal phenomena and also monitor
changes. This enables visualization of multi-spectral, multi-resolution and multi-temporal
geographic data providing better understanding to decision makers.
2.11Case studies Geospatial Analysis of Land Use and Land Cover Transitions from 1986–2014 in a Peri-
Urban Ghana
This study was carried out at Bosomtwe district of the Ashanti region Ghana. Like any other
developing county, Ghana was experiencing high rate of urbanization at the time of this study.
This research noted that majority of Ghana population settled in the urban centers with
urbanization level at 50.9%. The increase in urbanization affected the peri-urban areas of Ghana
cities where they suffered high rates of conversion into other land uses.

17
Urbanization attracted re-settlement in peri-urban areas such as Bosomtwe district because of
relatively affordable rent, availability of fertile agricultural land and proximity to the city giving
hope to getting a job. Bosomtwe was predominantly an agricultural area located within the
equatorial zone and with two well-defined rainy seasons. Its close location to Kumasi Metropolis
made it highly vulnerable to land use land cover changes.
The research analyzed the transition of land use land cover from the year 1986 to 2014. The
research employed an integrated approach using remote sensing techniques and GIS tools. Four
Landsat images spread between 1986 and 2014 were used as shown in table 2.1.
Table 2.1: Bosomtwe Landsat Images (Appiah et al., 2010).
The research identified the various land use classes namely: - Dense Forest cover (DF), Low
Forest cover (LF), Built up/Bare lands and Concretes (BBC), Recent fallows and grasslands
(RFGL) and Water Body (WB). The images were classified using supervised maximum
likelihood classifier in Erdas imagine 13. The research also used Markov analytical techniques to
examine LULC transition and to make projections into the future. The challenges encountered
were cloud cover and land stripping of Landsat 7.
The result of these analysis were as shown in table 2.2.
Table 2.2: Bosomtwe Land Use Change (Appiah et al., 2010).
The study revealed that there was great loss of forest cover between 2002 and 2010. The built up/
bare land was observed to have 380% increment between 1986 and 2002. The use Markov
futuristic land dynamics by the year 2018 and 2028 projected that, dense forest cover were going
to decline drastically to low forest covers.

18
The research increased the consciousness of planners, policy makers and the general public about
the socio-ecological consequences of increased human land use pressure on the vegetal cover. It
was recommended that the Bosomtwe District assembly should ensure proper planning and
management of land amidst of the current trends in LULC.
Land Use Land Cover Change Detection Using Remote Sensing and Geographic
Information System in Raipur Municipal Corporation Area, Chhattisgarh
This research was carried out at Raipur Municipal Corporation Area Chhattisgarh, India.
According to census of India 2011, there has been high population increase which has resulted
into rapid urbanization. Chhattisgarh is the 9th largest state in India and the 2nd largest in forest
coverage. It produces 16% of India’s mineral. It is ranked 2nd of slums household to urban
households. Raipur is the capital city of Chhattisgarh. Raipur has been experiencing rapid
urbanization with slum population increasing drastically.
The research analyzed land use land cover changes and their impacts using two Landsat images
(1999 and 2016). The study identified eight land use classes namely: - settlement, roads,
cultivation, industry, drainage, lake, open land and vegetation. Image pre-processing was done
with Erdas and Arc GIS. The land use land cover map was created using visual screen
interpretation with the help of google earth. Visual interpretation keys such as tone, texture, size
and patterns were used. Arc GIS was used to digitize the satellite images and to create a spatial
database.
The results of this research are as sown in table 2.3.
Table 2.3: Raipur Land Use Change (Khan and Jhariya, 2016)
Class
Area in 1999 (%) Area in 2016 (%) Change in area 2016 (%)
Settlement
27.5 43.1 +15.6
Cultivation 56.8 37.9 -18.9
Industry 2.1 5.2 +3.1
Drainage 2.3 1.5 -0.8
Vegetation 2.9 2.5 -0.4
Open land 3.7 6.1 +0.9
Road 2.8 3.7 +2.4
Lake 2.2 1.4 -0.8

19
The research revealed that the settlement areas increased drastically at a rate of 15.6%. This
ultimately increased the anthropogenic activities creating pressure on the existing land. On the
other hand, it was noted that cultivated area decline by 18.9% leading to a reduction in
agricultural productivity. Industries increased by 3.1% as urbanization was taking place and
owing to the minerals found in the area. The level of vegetation decline by 0.4%. There was an
increase in road network by 2.4%. Figure 2.1 and 2.2 shows the distribution of land uses in 1999
and 2016 respectively
Figure 2.3: Raipur LULC map for year 1999(Khan and Jhariya, 2016)

20
Figure 2.4: Raipur LULC map for year 2016 (Khan and Jhariya, 2016)

21
CHAPTER 3: MATERIALS AND METHODS
3.1 Description of Study Area
3.1.1 Geographical location Kiambu County is one of the closest county in proximity to the Kenya’s capital city Nairobi. It is
constituted of central highlands of the former central province with a coverage area of 2,543.42
square kilometres. It boarders six other counties as shown in figure 3.1 below.
Figure 3.1: Geographical location of Kiambu County in the context of Kenya.

22
The county is located between latitudes 00 25’and 10 20’South of the Equator and Longitude 360
31’ and 370 15’ East. Out of 2, 543.5 square kilometer the area under forest cover is 476.3 square
kilometer (Kenya Population and Housing Census, 2009).Kiambu County is comprised of twelve
sub counties in which Kiambu sub-county is the area of study as shown in figure 3.2.
Figure 3.2: Kiambu sub-counties

23
The sub-county area coverage and number of wards is as shown in table 3.1.
Table 3.1: Area of county by sub-county
Source: (Government of Kenya, 2013)
3.1.2 Physical and Topographical Features According to Kiambu County Government ADP (2016/2017), there are four topographical zones
in Kiambu County.
a) Upper highland zone
This zone lies at 1,800-2,550 metres above sea level covering Lari constituency and some
parts of Aberdare ranges. It is a major water catchment area characterised by highly dissected
ranges that are steep and very wet.
b) Lower highland zones-
This zone lies between 1,500-1.800 metres above sea level covering Limuru and Kiambu and
some parts of Gatundu North, Gatundu South, Githunguri and Kabete constituencies. The
topography is characterized by hills, plateaus and high elevation plains.

24
c) Upper midland zones
This zone lies between 1,300 to 1,500 metres above sea level covering Juja and other
constituencies. The landscape in this zone is highly characterized by volcanic middle level
uplands.
d) Lower midland zones
This zone lies between 1,200-1,360 metres above the sea level partly covering Thika town,
Limuru and Kikuyu constituencies. It is characterised by steep slopes that are unsuitable for
farming with easily eroded soils
The soils are classified into three categories:
a) High level upland soils
This are very fertile soils which originate from volcanic rocks which supports growth of crops
such as tea, coffee, horticultural products, pyrethrum, vegetables, maize, beans, peas and
potatoes and livestock keeping. The category of soil can be found in Gatundu South, Gatundu
North, Githunguri, Kiambu, Kiambaa, Lari, Kikuyu, Kabete and Limuru Constituencies.
b) Volcanic footbridges soils
Tis are red to dark clays that are well drained with moderate fertility mostly suited for cash crop
such as tea, coffee and pyrethrum. A large extent of the county is covered by these soils.
c) Low fertility soils
These are sand or clay soils found in the middle zone and eastern part of the county which make
up the semi-arid areas. They are suited for drought resistant crops such as soya bean and
sunflower and supports ranching. These soils are found in some parts of Juja, Thika Town,
Ruiru, Kabete, Limuru, Gatundu North and Gatundu South Constituencies.

25
3.1.3 Population Kiambu county population was projected to hit 1,766,058 out of which 873,200 were males and
892,857 females. This was further project to hit 2,032,464 people by the end of 2017 (Kenya
Population and Housing Census, 2009)
Table 3.2: Population Density by Sub-Counties

26
3.1.4 Climate conditions Kiambu County have two rainfall seasons. The month of March (mid-march) to March the
county experiences long rainfall season. The cold season occur between June to August and is
characterized by drizzles and frost. The short rains are experienced between Mid-October to
November. The amount of annual rainfall received is dependent on altitude with high areas
receiving 2000mm and low areas the like of Thika town receiving as low as 600mm. The annual
average rainfall received by the county is 1,200 mm (Government of Kenya, 2015).
The temperature ranges from 70 C in the highland areas such as Limuru and some parts of
Gatundu North, Gatundu South, Githunguri and Kabete constituencies to 340 C in lower midland
zones found in some parts of Thika Town constituency (Gatuanyaga), Kikuyu, Limuru and
Kabete constituencies. The mean temperature is 26o C for Kiambu County. The lowest
temperature are experienced between July and August while the hottest months are January to
March (Government of Kenya, 2015).
3.1.5 Ecological Condition The county relies on surface and sub-surface (ground water) water which comprises of 90% of
water used in the county. The county is sub-divide into the following sub-catchment areas
(Government of Kenya, 2015)
1. Nairobi River Sub-catchment- Major rivers in this sub-catchment include: Nairobi,
Gitaru, Gitahuru, Karura, Ruirwaka, and Gatharaini. This covers the southern part of the
county.
2. Kamiti and Ruiru Rivers Sub-catchment-Major rivers in this sub-catchment include:
Riara, Kiu, Kamiti, Makuyu, Ruiru, Bathi, Gatamaiyu and Komothai. This covers the
north part of the county
3. Aberdare Plateau Sub-catchment-This sub-catchment comprises of Thiririka and
Ndarugu Rivers.
4. Chania River together with Thika and Kariminu Rivers which originates from the slopes
of Mt. Kinangop in the Aberdare ranges. The main streams in the county include:
Mugutha, Theta, Thiririka, Ruabora, Ndarugu and Komu.

27
3.2 Data Sources and Tools In order to meet the objectives of this study, acquisition of remotely sensed satellite images was
done. Images of the same area were obtained at different times and compared considering
temporal phenomena such as vegetation, farm lands, built up areas and water bodies to detect
land use land cover change.
3.2.1 Data Sources Landsat satellite images were downloaded because they have good spectral and temporal
resolution while their spatial resolution is moderate (Lillesand et al., 2004). Four multispectral
images for 1995, 2000, 2014 and 2018 were downloaded from USGS website
(https://glovis.usgs.gov/). ERDAS Imagine was used for layer stacking, sub-setting, image
classification, recording of features and accuracy assessments. ARC GIS 2010 was used for re-
projection and for analysis.
Table 3.3: Data type, source of data and its description.
NO DATA TYPE SOURCE OF DATA DESCRIPTION OF DATA
1. Multispectral
Images
USGS
(https://glovis.usgs.gov/)
1.Landsat TM:1995 Image (1995-01-30)
2.Landsat ETM+ :2000 Image (2000-02-21)
3.Landsat ETM+ :2014 Image (2014-01-29)
4.Landsat 8 (OLI) :2018 Image (2018-01-29)
3 Kenya
Population
Population census
(through
RCMRD)
1989, 1999 & 2009
4 Kenya
Counties
Kenya Data
(through RCMRD)
Shape file
5 Topographic
Maps
Scale 1: 50,000
Survey of Kenya Scanned and covering the
area of study
6 GPS Field Surveys Co-ordinates

28
DATA COLLECTION
Global Positioning
System data
(GPS)
Kenya County
Shape file
Multispectral
Satellite Images
Topographical map –
1:50,000
Layer stacking using
ERDAS
Re-project images and
shape files using
ARCGIS and export as
image
Geo-referencing Re-project and
subset/clip the area of
interest (AOI) i.e.
Kiambu Sub County
Geo-referencing
Information
Extraction
Accuracy
Assessment
Subset/clip
using Kiambu
Sub County as
AOI
Data Merging using
GIS (Geo-Database) ANALYSIS
Results, Discussions.
Conclusion and
Recommendation
Figure 3.3: Research Methodology

29
3.2.2 Tools This is the process of obtaining firsthand information through observation, measurements etc. It
provides information about a given phenomenon through firsthand experience. To carryout
ground truth exercise, Global Position System receivers were used to collect training sites. This
study used hand held GPS to collect coordinates training samples. Training samples refers to a
set of pixel which represent that which has been recognized as distinct pattern or potential class
(Campbell et al. 2015).
3.3 Data Pre-processing These are operations that are performed at the lowest level of abstraction with an aim removing
undesired distortions or enhancing important features on the image that require further
processing and analysis. Some analysis that were carried out includes; Adjusting displayed
contrast on the image, displayed brightness of the image and transparency of the image.
3.3.1 Sub-setting This is the process of image extraction which involves removing irrelevant areas of the image
and focusing on the region of interest. This was important as it helped in reducing the size of the
image file to cover only the area of interest (AOI) by eliminating extraneous data in the image. It
was done to speed up the processing rate since the data to be processed becomes smaller when
you subset ensuring only the AOI is processed.
This study used Erdas Imagine software to clip the satellite image obtained from Landsat satellite
to the area of interest.
3.3.2 Image Enhancement This refers to the conversion on the image quality with an aim of improving the level of feature
extraction and image interpretation. Images have low contrast resulting from low sensitivity of
detectors, weak signal from objects on the surface of the earth, similar reflection of different
objects and environmental condition at the time of recording.
The limitation of human eye to discriminate slight radiometric or spectral differences creates a
challenge in feature extraction and image interpretation. Digital enhancement was used to
amplify these changes to increase contrast between interested classes or features for better clarity
on the image scene.

30
LULC change detection required image enhancement to be done since the multi temporal images
had different spectral characteristics. In this study, the image enhancement involved creation of
false color composites that provided spectral knowledge and information about the area of study.
3.4 Information Extraction from the Images
3.4.1 Image Classification
This is a process that automatically categorizes image all pixel in an image of terrain into distinct
land cover classes. This process involves sorting out all the pixels in an image and categorizing
them into finite number of individual classes based on their DN (PIXEL) values. Classification is
the common technique used in feature extraction in remote sensing. It involves grouping levels
with homogeneous characteristic together thereby helping in discriminating between various
features in the image. Digital classification tries to categorize individual pixels on the basis of
spectral information (Bakx et al. 2012).
This study employed supervised classification technique to carry out image classification.
Supervised classification necessitated creation of training sites that were used as the basis of
classification. The classification clustered the pixel in the datasets into classes that corresponded
to the defined training sites. The research identified three land use land cover classes for the
purposes of classification and defined them as shown in table 3.4.
Table 3.4: Land use/land cover classes description.
No. Land use/land cover Description
1. Agricultural Land Both irrigated and rain fed arable land, cropland, farming and
fallow fields
2. Built-up Areas Residential, commercial, industrial, institutional, recreational
areas and road networks
3. Water Bodies Rivers and dams
The training sites were defined using ground truth data, topographical map and aerial photograph
that have been ground-verified. The maximum likelihood algorithms was used to do this
classification. Therefore point were classified on the basis of how close they are to each training
sample.

31
3.4.2 Integration with Ground truth and other Ancillary Data. Ground truth process was undertaken to ensure surface observation refers to what is actually on
the ground by correlating with the corresponding features on the image scene. This helped in
relating what exists in the image data to real features and materials on the ground.
Ground truth was done using a combination of three approaches:- Using field observation that
recorded what actually exist on the ground, using personal experience referred to as training sites
which were used as training samples to the software and finally topographical map of the area
was used to ensure that accuracy is observed by avoiding errors of omission or commission.
3.4.3 Post classification Post classification filtering was carried out after classification with an aim to generalizing dataset
in order to produce more homogeneous classes. This was done by removing stray pixel in the
image and smoothening class boundary or removing some patches of the classes to ensure high
level of homogeneity. This was done because of performance failures during image enhancement
and image classification.
3.4.4 Accuracy Assessment This refers to the validation process of image classification that was done by comparing the
output of a classified image with the reference data. This study used a confusion matrix table to
evaluate the image classification errors. The strength of a confusion matrix is that it identifies the
nature of the classification errors, as well as their quantities, to comparing the classification to
geographical data that are assumed to be true to determine the accuracy of the classification
process. This study measured the following image classification errors.
Producer’s accuracy
This is a measure of error of omission that indicates the probability of a reference pixel being
correctly classified. In computing producer’s accuracy the total number of correct pixel in a
given category were taken and divided by the total number of pixel in that category as derived
from the reference data (Column total)
Producer’s accuracy = Total number of correct pixel in a given category
Total number of correct pixel in a given category (3.1)

32
User’s Accuracy
This is a measure of error of commission that indicates the probability of a pixel classified on
map representing that category on the ground. It was computed by taking the total number of
correct pixel in a category and dividing it by the total number of pixels that were actually
classified in that category (row total),
User’s Accuracy = Total number of correct pixel in a given category
Total number of pixels that were actually classified in that category (3.2)
Overall Accuracy
The overall accuracy is a measure of the total correctly interpreted samples with respect to the
entire number of samples. Thus it gives an impression of how well the entire image has been
interpreted. It was calculated by taking the total number of pixel correctly classified and dividing
it with the total number of pixel.
Overall Accuracy = Sum of diagonal metric
Total number of pixels (3.3)
Kappa index
This is a measure of the agreement between interpreted image and reference data. It is computed
as follows.
Kappa Index = observed accuracy- chance agreement
1-chance agreement
3.5 Change Detection Land use land cover change analysis requires periodic assessment of the extents of changes
occurring in the area of interest. Change detection is considered as an earth observation
application that integrates spatial- temporal data (Alkema et al. 2012).
The study integrated GIS methodology and Remote sensing techniques to do change detection.
The approach combined raster and vector data overlays and uses GIS techniques for analysis of
LULCC. GIS allowed integration of data from different sources. The study employed image
differencing as the method of change detection in Erdas imagine.

33
CHAPTER FOUR: RESULTS AND DISCUSSIONS
4.1 Introduction
This chapter contains the results and discussion of results obtained from classified Landsat
images of Kiambu Sub-County. It contains a review of causes of land use land cover changes,
land use land cover maps and changes between at given intervals between 1995 to 2018 and
interpretation of the effects of these changes to the local economy of Kiambu sub-county.
4.2 Land Use Land Cover Map in Kiambu Sub-county
The ground truth data and Landsat images informed the following three classes land use
comprising of agricultural land, built up areas and water bodies. Agricultural land in this context
included arable land both irrigated and rain fed, permanent crop land, farming and fallow fields.
The built up area included residential areas, commercial areas, industrial areas and road
networks. Water bodies included rivers and dams. The observed distribution of land use land
cover in Kiambu sub-county is as represented below in the table 4.1.
Table 4.1: Land use land cover changes from 1995 to 2018
a) Land Use Land Cover Distribution in 1995
The agricultural land comprising of irrigated and rain fed agricultural land, permanent cropland,
farming and fallow field covers approximately 8429.67 Ha of land. This translate to 79.06 % of
the total land in Kiambu sub-county. This high coverage is attributed to the fact that large
volumes of land was under tea and coffee plantations and large scale farming. The soil ranged
from moderate to high fertility rates.
Land use / year 1995 2000 2014 2018
Area
(Ha)
Area
(%)
Area
(Ha)
Area
(%)
Area
(Ha)
Area
(%)
Area
(Ha)
Area
(%)
Agricultural land 8429.67 79.06 6118.47 57.37 5270.13 49.42 4376.52 41.04
Built Up Areas 2115 19.83 4429.26 41.53 5280.21 49.51 6191.28 59.06
Water bodies 118.35 1.11 117.99 1.11 114.21 1.07 95.22 0.89
Total 10663.02 100 10665.72 100.01 10664.55 100 10663.02 100.99

34
The built up areas covered 2115 Ha of the land which translate to 19.83% of the land. The land
cover in this context includes residential areas, commercial areas, industrial areas and road
networks. This low coverage is attributed to increased agricultural practices that were taking
place at the time and the area had less development (Mundia and Aniya, 2005). The slow rate of
economic growth between 1985 and 1995 as indicated in the National Development Plan, (2000)
led to low rates of urbanization hence low coverage for built up areas. Dams and rivers which are
classified as water bodies occupies the least coverage 118.35 Ha which is 1.11% of the total
land. The land use land cover distribution is as shown in figure 4.1
Figure 4.1: Land use land cover distribution in 1995.
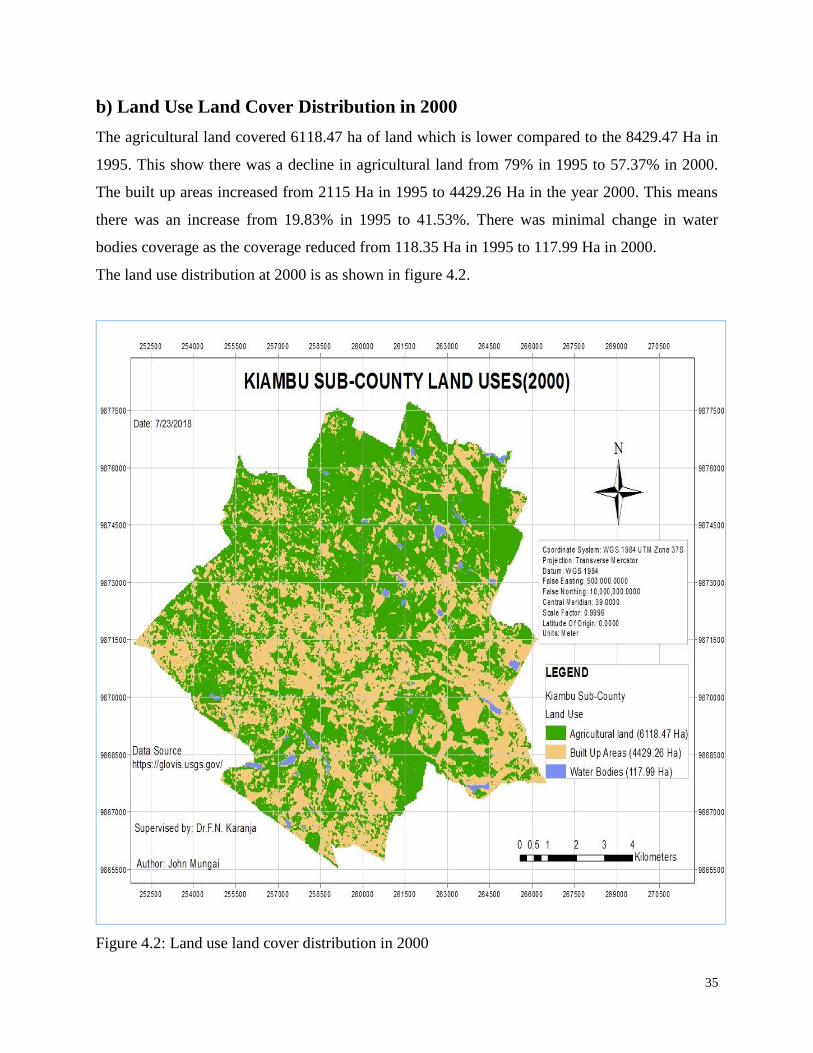
35
b) Land Use Land Cover Distribution in 2000
The agricultural land covered 6118.47 ha of land which is lower compared to the 8429.47 Ha in
1995. This show there was a decline in agricultural land from 79% in 1995 to 57.37% in 2000.
The built up areas increased from 2115 Ha in 1995 to 4429.26 Ha in the year 2000. This means
there was an increase from 19.83% in 1995 to 41.53%. There was minimal change in water
bodies coverage as the coverage reduced from 118.35 Ha in 1995 to 117.99 Ha in 2000.
The land use distribution at 2000 is as shown in figure 4.2.
Figure 4.2: Land use land cover distribution in 2000
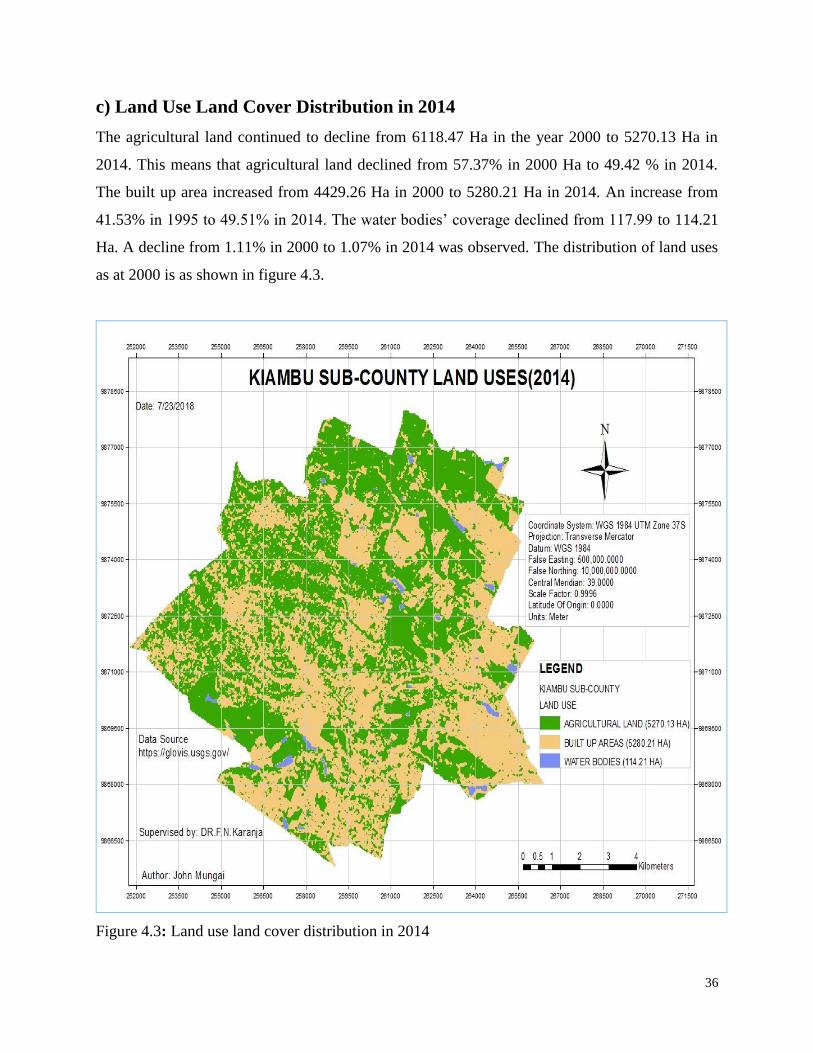
36
c) Land Use Land Cover Distribution in 2014
The agricultural land continued to decline from 6118.47 Ha in the year 2000 to 5270.13 Ha in
2014. This means that agricultural land declined from 57.37% in 2000 Ha to 49.42 % in 2014.
The built up area increased from 4429.26 Ha in 2000 to 5280.21 Ha in 2014. An increase from
41.53% in 1995 to 49.51% in 2014. The water bodies’ coverage declined from 117.99 to 114.21
Ha. A decline from 1.11% in 2000 to 1.07% in 2014 was observed. The distribution of land uses
as at 2000 is as shown in figure 4.3.
Figure 4.3: Land use land cover distribution in 2014

37
d) Land Use Land Cover Distribution in 2018
The size of agricultural further reduced from 5270.13 Ha in 2014 to 4376.52 Ha in 2019. The
percentage reduction was from 49.42 % to 41.04 Ha in 2018. The size of the built up areas on the
other hand continued to rise from 5280.21 Ha in 2014 to 6191.28 Ha in 2018. This means there
was an increase from 49.51% in 2014 to 59.06 % in 2018. The size of water bodies was also
noted to decline from 114.21 Ha in 2014 to 95.22 Ha. This shows a reduction from1.07% in
2014 to 0.89% in 2018. The distribution of land use at 2014 is as shown in figure 4.5.
Figure 4.4: Land use land cover distribution in 2018
4.3 Accuracy Assessment
The accuracy assessment for classified satellite images was carried out using stratified random
sampling method in Erdas Imagine. The classification used randomly sampled reference points
that are known to carryout classification. An error matrix for each classification was generated as
shown below. The overall accuracy together with the Kappa coefficient were calculated and
evaluated. This is as shown in table 4.2, 4.3, 4.4, 4.5 and 4.6.

38
Table 4.2: Accuracy assessment report for 1995
Class Name Reference
Totals
Classified
Totals
Number
Correct
Producer
Accuracy (%)
User
Accuracy (%)
Agricultural Land 17 22 17 100.00 77.27
Built Up Areas 16 11 11 68.75 100
Water Bodies 7 7 7 100 100
Table 4.3: Accuracy assessment report for 2000
Class Name Reference
Totals
Classified
Totals
Number
Correct
Producer
Accuracy (%)
User
Accuracy (%)
Agricultural Land 17 18 15 88.24 83.33
Built Up Areas 16 15 13 81.25 86.67
Water Bodies 7 7 7 100 100
Table 4.4: Accuracy assessment report for 2014
Class Name Reference
Totals
Classified
Totals
Number
Correct
Producer
Accuracy (%)
User
Accuracy (%)
Agricultural Land 17 16 15 88.24 93.75
Built Up Areas 16 17 15 93.75 88.24
Water Bodies 7 7 7 100 100
Table 4.5: Accuracy assessment report for 2018
Class Name Reference
Totals
Classified
Totals
Number
Correct
Producer
Accuracy (%)
User
Accuracy (%)
Agricultural Land 14 15 12 85.71 80.00
Built Up Areas 19 18 16 84.21 88.29
Water Bodies 7 7 7 100 100
Table 4.6: Overall accuracy and Kappa Coefficient Statistics
1995 2000 2014 2018
Overall Accuracy 87.50 87.50 92.50 87.50
Kappa Coefficient 0.8002 0.8010 0.8808 0.7998

39
4.4 Change Analysis
Change detection was carried out through image differencing. Two images were compared to
give the location of changes and the rate. The comparison was between the year 1995 and 2000,
2000 and 2014, 2014 and 2018 with the last one being 1995 and 2018.There has been a great
change in land use land cover in Kiambu sub-county with agriculture continuously decreasing
and built up areas increasing. Water bodies have been observed to decrease at a gradual rate.
a) Land use change between 1995 and 2000
During this period the sub-county experienced high rates of land use land cover. As shown in
table 4.2, agricultural land declined by 21.69 %. The amount of agricultural land converted to
built-up areas was 2311.2 Ha. This is attributed to population increase that was being
experienced in the area. The demand for housing lead to agricultural land being cleared to pave
way to infrastructure and housing demand of the increasing population. The increased population
was as a result of rapid migration from other regions to Kiambu because of its proximity to the
city. The rate of change is as shown in table 4.7 and figure 4.5.
Table: 4.7: Land use change between 1995 and 2000
Figure 4.5 Bar graph for land use change (1995-2000)
Land use / year 1995 2000 Rate of change
Area(Ha) Area (%) Area (Ha) Area (%) Area (Ha) Area (%)
Agricultural land 8429.67 79.06 6118.47 57.37 -2311.2 -21.69
Built Up Areas 2115 19.83 4429.26 41.53 2314.26 21.7
Water bodies 118.35 1.11 117.99 1.11 -0.36 -0.0036

40
The location of land use land cover changes is as shown in figure 4.6.
Figure 4.6: Land use land cover changes (1995-2000)
b) Land use change between 2000 and 2014
The agricultural land continued to decrease with 848. 34 Ha being converted to agricultural land.
This means the rate of change was 7.95% at a period of 14 years. The built up area on the other
hand increased by 7.98% converting 850.95 Ha of prime agricultural land into built up areas.
This change indicates agricultural land is continuously diminishing by being edged out by built
up areas. According to Musa and Odera (2014) this continued decrease in agricultural land is
closely linked to the increasing population which increase the demand for housing and urban
development.

41
Kiambu county population increased from1, 389,723 persons in 1999 to 1,623,282 persons in
2009 (https://www.citypopulation.de/php/kenya-admin.php?adm2id=22). Table 3.2 shows the
population projection indicating population growth in the sub-county.
Urban encroachment into peri-urban areas is another cause of this rapid conversion of
agricultural land into built up areas. Kiita (2013) observed that as Nairobi City was growing it
encroached into prime agricultural areas of Kiambu converting those areas into built up areas.
The rate at which land use land cover occurred is as shown in table 4.8.
Table 4.8: Land use change between 2000 and 2014
The rate of change in figure 4.7 indicates that, as agricultural land reduces the built up areas
increases.
Figure 4.7 Bar graph for land use change (2000-2014)
Land use / year 2000 2014 Rate of Change
Area (Ha) Area (%) Area (Ha) Area (%) Area (Ha) Area (%)
Agricultural land 6118.47 57.37 5270.13 49.42 -848.34 -7.95
Built Up Areas 4429.26 41.53 5280.21 49.51 850.95 7.98
Water bodies 117.99 1.11 114.21 1.07 -3.78 -0.04

42
The location of land use land cover changes is as shown in figure 4.8.
Figure 4.8: Land use land cover changes (2000-2014)
c) Land use change between 2014 and 2018
In this period there was more agricultural land being converted to built-up areas. The amount of
agricultural land that was converted to built-up areas was 893.61 Ha as compared to 848.34 Ha
in 2000-2014. This means that the amount of change in 2014-2018 was more than that in 2000-
2014 with approximately 45.27 Ha. This change was experienced at a period of 4 years. On the
other hand built-up areas increased by 911.07 Ha. The water bodies reduced by 18.99 Ha.

43
Table 3.2 show population increase from 2009 to 2017 showing a rapid increase in population
that has brought about increased human activities resulting in massive conversion of agricultural
land to built-up areas. The area of study has also invested on improving infrastructures which led
to high migration rates.
Table 4.9 shows the rate of change in 2014-2018
Table 4.9: Land use change between 2014 and 2018
The graph in figure 4.9 shows the rate of change for agriculture moving downward indicating a
decrease while the built up area is upward indicating increase. Water bodies are also seen to
decrease according to the graph.
Figure 4.9: Bar graph for land use change (2014-2018)
Land use / year 2014 2018 Rate of Change
Area (Ha) Area (%) Area (Ha) Area (%) Area (Ha) Area (%)
Agricultural land 5270.13 49.42 4376.52 41.04 -893.61 -8.38
Built Up Areas 5280.21 49.51 6191.28 59.06 911.07 9.55
Water bodies 114.21 1.07 95.22 0.89 -18.99 -0.18

44
The location of these changes in Kiambu sub-county is as shown in figure 4.10
Figure 4.10: Land use land cover changes (2014-2018)
d) Land use change between 1995 and 2018
The overall comparison was over a period of 23 years beginning 1995 to 2018. The amount of
land use land cover change experienced in this time was very high. Approximately 4053.15 Ha
of prime agricultural land was converted into built up areas thereby decreasing agricultural land
by 38.02%. This indicates that massive chunks of fertile and arable rain fed agricultural land
suffered at the expense of built up areas. Asamoah (2010) noted that, urban encroachment is as a
result of migration of people into the urban periphery causing conversion of agricultural land at
the rural-urban fringe. The clearing of agricultural land at the rural-urban fringe is driven by the
pressure of other land uses such as residential, commercial and industrial and the demand for
infrastructures such as roads, parking lots among others.

45
Kiambu sub-county bordering Nairobi city has been one of rural-urban fringe experiencing this
kind of change. As Nairobi city grows outwards its population seeks cheaper and affordable
dwelling units at Kiambu sub-county increasing the demand for housing which has led to
massive conversion of agricultural land into built-up areas (Kiita, 2013).
The built up areas increased by 39.23% which translates to 4076.28 Ha of land. This is a results
increased construction of housing units and improved infrastructure. The water bodies also
reduced from 118.35 Ha in 1995 to 95.22 Ha in 2018. The increased population has increased the
demand for water leading to high water extraction rates that has seen these water bodies shrink at
an alarming rate as shown in table 4.5
Table 4.10: Land use change between 1995 and 2018
These changes are demonstrated in figure 4.11.
Figure 4.11: Bar graph for land use change (1995-2018)
Land use / year 1995 2018 Rate of Change
Area (Ha) Area (%) Area (Ha) Area (%) Area (Ha) Area (%)
Agricultural land 8429.67 79.06 4376.52 41.04 -4053.15 -38.02
Built Up Areas 2115 19.83 6191.28 59.06 4076.28 39.23
Water bodies 118.35 1.11 95.22 0.89 -23.13 -0.22

46
The figure below depicts the location of these changes in Kiambu sub-county.
Figure 4.12: Land use land cover changes (1995-2018)
The following graph in figure 4.13indicates the land use land cover changes that has occurred
from 1995-2018.
Figure 4.13: Bar graph for land use change (1995-2018)

47
4.5 Review of causes of Land use land cover changes in Kiambu
Sub-county. Kiambu sub-county has continuously changed from being predominantly agricultural to other
rising land uses such as residential, commercial, industrial and recreational uses. This has mainly
been attributed to the following causes.
a) Population increase
Data obtained from Kenya National Bureau of Statistics indicates that from 1989 to 2009,
population in Kiambu sub-county continues to increase. This population growth has been
attributed to natural population growth and to a large extents by influx of immigrants from other
areas. This has increased demand for housing and other activities which has seen a large amount
of agricultural being cleared to pave way for developments. Table 4.11 shows population data.
Table 4.11: Population Census Data
1989 1999 2009
Kiambu sub-county 55,926 71,928 108,698
Source: Kenya National Bureau of Statistics
Projections obtained from Kiambu District economic planning Unit, 2011 shows that up to 2017,
population continues to increase. This is shown in table 4.12
Table 4.12: Population projections
YEAR 2012 2015 2017
Population Projections Population Projections Population Projections
Kiambu sub-county 118,259 128,660 136,098
Source: Kiambu District economic planning Unit, 2011
b) Low economic returns from agriculture
Farmers have been experiencing low returns from agricultural produce as compared to other land
uses making agriculture unattractive investments. The value of agricultural products are low
causing farmers to incur losses as the farming inputs continue to increase. The daily nation paper
of 25th June 2017 acknowledge that low returns from agricultural produce is forcing farmers to
subdivide their land and sell them or engage in other income earning activities that have more
income (https://www.nation.co.ke/lifestyle/dn2/Kiambu-to-plan-land-use)

48
The cost of farming inputs increased as a result of implementation of structural adjustment
programs (SAPs) reducing profits realized from agriculture (Thuo, 2013). This also means that a
farmer cannot afford to grow crops as prescribed by agricultural officers and therefore incurring
losses when their products gets rejected at the markets.
c) Increased demand for real estate developments
Housing has been a major challenge to Kenya as a nation. In the year 2012, the housing deficit
had accumulated to 2 million units with this number increasing with 200,000 units every year
(www.habitat.org). The government has not been able to meet the demand for housing. This has
created a booming business for real estate developers to supply housing to the residents to satisfy
this demand. Case example:
Eden Ville phase 1 where 15.75 Ha of agricultural land were cleared to pave way for the
development of 350 low density units where each settle on eighth an acre. Eden Ville phase 2 is
sets to occupy on a total acre of 42 acres for development of 404 maisonettes. Eden Ville phase
3 will occupy 37 acres for construction of high density apartments. All these was coffee
plantation cleared to pave way for development
Four way junction phase 1 comprises of 791 units while five star Meadow estate comprises of
116 units. Muthithi gardens, Golden palm gardens, palm valley and Waverley estates in Kiambu
sub-county are among many estates, where agricultural land has been cleared for housing.
Source: www.suraya.co.ke (2018)
Plate 4.1: Four way Junction Estate

49
d) Improved infrastructures.
Easy access to improved infrastructures tends to attract people due to reduced expense on fuel
and saves on time. Improved road network and social amenity infrastructures attracts investment
in a given region (Carmelita et al., 2002). The field study revealed that linear development is
common in Kiambu sub-county where many estates are constructed within easy access to the
main roads. Recently, there has been improvement in the road networks like Kiambu road and
introduction of roads like the northern by-pass. This has opened up the area for real estate
developers and have facilitated conversion of agricultural land to built-up areas as shown in plate
4.2.
Source: Google earth (2018)
Plate 4.2: Real Estate development along Kiambu Road.
5 Star Meadow Estate
Kiambu Road
Hibiscus court 1
Palm Valley Estate

50
e) Poor Marketing Strategies
There has been over exploitation of farmers by greedy middlemen who buy their farm outputs at
low prices because farmers lack knowledge. There is lack of strong co-operative society leading
to low returns from the produce. This has made farmers to lose hope in making a living out of
agriculture and they opt either to sub-divide and sell the land or develop the land for other land
uses. This is evident in neglected tea and coffee plantation and idle or bare land that was once
agricultural (https://www.nation.co.ke/lifestyle/dn2/Kiambu-to-plan-land-use).
Kiambu County Strategic Plan (2013-2017) noted that, most of agricultural products from the
sub-county are sold in their raw form. Lack of knowledge on processing for value addition has
led to huge losses for farmers. Lack of information in export markets on issues such as safety,
traceability, sanitary, maximum residual limits and phytosanitary standards has cause the
rejection of agricultural products at local and international markets. This has made farmers to
shift to other land use to earn a living.
f) Proximity to Nairobi city
Kiambu sub-county borders Nairobi city directly thus experiencing the effect of urban sprawl at
high levels. As the city grows in its population, it expands outwards encroaching into the prime
agricultural land in the peri-urban areas. This results in real estate’s developers moving in to
construct housing units in rural urban-fringes to meet the demand of population sprawl from the
city (Kiita, 2013). Kiambu sub-county has had firsthand experience of this effect, where its
agricultural land has been under immense pressure to give way to other land uses.
g) Change in climate
The main source of income in Kiambu sub-county is agriculture. According to Kiambu County
Strategic Plan (2013-2017), farming is mainly rain fed where farmers depend on the bimodal
rainfall. This means that there are two seasons of farming. Irrigation is only done at large scales
in coffee and tea plantations. This dependency on rain fed agriculture makes the area vulnerable
to climate change. Environmental pollution as a global problem has negatively affected global
climate which is ultimately felt at local levels. Changes in weather patterns and seasons for
farming has resulted to great losses to farmers. Crop and animal diseases resulting from climate
change has made farming a difficult enterprise and hence people has shifted to other economic
activities to generate income for their house holds resulting to land use land cover changes.

51
h) Poor Land Use Planning.
Pressure on agricultural land resulting from population increase has resulted to land being sub-
divided into small uneconomical units (Average of 0.36 Ha) that are not able to produce
sufficient food for the households. This subdivisions attracts informal settlements and other land
uses that results into land use land cover changes in this area. This was noted in Kiambu County
Strategic Plan (2013-2017).
The department of physical planning is Kiambu County is in the process of approving the county
spatial plan. In the meantime development applications on change of user have been approved
with no high level of coordinated land use planning.
4.6 Effects of land use land cover changes to the local economy of
Kiambu sub-county
Land use land cover changes has impacted positively and negatively to the economy of Kiambu
sub-county. Agricultural land has suffered a great reduction to pave way for residential,
commercial, industrial, institutional and recreational use. Some of the benefits realized incudes:
a) Job creation
Land use land cover changes into built up areas created employment in the construction
industries which employed a great number of both skilled and unskilled labor. Employments
opportunities indirectly created are those in transportation sectors because of increased
population, service industries, retail and wholesale shops and fresh product markets such as
grocery.
b) Increased housing units
The number of housing units continue to increase giving the tenants the luxury to choose where
to stay at their convenience. This has also benefited the land lords who are able to make returns
out their parcels of lands. This has also increased the number of commercial units which has
facilitated trade in the area. The government also benefit from levies taxed on construction
industries.

52
c) Increased service industries
The development of this area has attracted various services industries to set up their operation in
the region benefiting the residents. The residents do not need to travel to long distances to get
these services. Such services includes banks, hotels, restaurants, lodges, hospitals, institutions of
learning, supermarkets, whole sale and retail outlets, company branches etc.
d) Reduction of agricultural outputs
Population increase has led to the sub-division of prime agricultural land into small
uneconomical units. According to Kiambu county annual development plan (2017/18), the small
scale farming has an average of 0.36 Ha while those in large scale farming have an average of
69.5 Ha. This has greatly reduced agricultural production in the area as much of farming is
extensive rather than being intensive.
The major constraints leading to reduction in production of maize, beans, coffee and tea in this
area is the diminishing of prime agricultural land (Gachimbi et al., 2003). Thindigua, Kasirini,
Kirigiti and Kugeria are some of farms initially used for growing maize and coffee that are being
replaced by built up areas through construction of modern residential units for sale and rental
(https://www.nation.co.ke/lifestyle/dn2/-Kiambu-centres-in-rapid-growth)
Kiambu Sub-County has been able to produce perishable food stuff for its own resident and also
to feed the city of Nairobi. Some of the perishable food stuff grown are: kales, spinach,
cabbages, coriander and potatoes. Decline in these production poses a great threat to food
security in the area and also for the city. Reduction in cash crop such as coffee and horticulture
found in the area has led to reduction of agricultural exports and ultimately loss of foreign
exchange and employment (Kiita, 2013)
e) Loss of employment
According to Kiambu county spatial plan 2013-2017, approximately 70% of its resident draws
their income from agricultural related activities. Decline in the size of agricultural land has led to
retrenchment in agricultural sector with those relying on employment from agriculture for their
income facing a serious crisis. They have been forced to seek for non-farm form of employment
in the built up area which may demand skills that they do not have (Thuo, 2010).
Unfortunately the labour force in the built up areas continue to increase as while the existing job
opportunities continue to stagnate.

53
f) Appreciation of value of land
The proximity of Kiambu sub-county to Nairobi city over the years have affected the value of
land in Kiambu sub-county. However, the conversion of agricultural land into built up areas have
seen a huge number of labour force working in the city residing in Kiambu sub-county for easy
access to Nairobi by reducing transport cost and time for travelling.
In return this benefits have been felt by the owners of land by the appreciation of their land
parcels. In other instances speculation of urbanization according to the direction of urban sprawl
has made Kiambu sub-county an easy target because of its location causing the value of land to
appreciate.
Improvement in infrastructure also plays a major role in appreciation of land values. Improved
road networks such as highways are known to make accessibility easier, reduce travel time and
vehicle operating cost. This ultimately increases the demand for land parcels along, adjacent or
in close proximity to these roads (Carey, 2001). In the area of study parcels of land along,
adjacent or in close proximity with Kiambu road, northern By-pass and Kamiti road have had
their land values appreciate in the recent past.
g) Increment in Rent
Increasing population in the area of study continues to increase the demand for housing in this
area. The demand for housing in the region exceeds more than 5 times the supply that is
available (www.habitat.org). The appreciation of land values increases the amount of rent in a
given place. The amount of rent charged on the residential and commercial units in the area of
study is way high and unaffordable to low income earners.
For instance, a 3 bedroom master ensuite apartment at four way junction cost Ksh 65,000 for 108
m2 while a 4 bedroom cost 150,000 per month. In Eden Ville a 3 bedroom cost Ksh 100,000 per
month and a 4 bedroom cost Ksh 130,000 per month (www.the-star.co.ke).
h) Uncontrolled development
Increased population through natural growth and mass influx of immigrants in the areas puts
pressure on sub-division of agricultural land into uneconomical units. Unplanned sub-division
and uncoordinated sale of land has led to haphazard development in the area disrupting the
proposed pattern of development.

54
This often results in mixed patches of agricultural, residential, commercial, industrial,
institutional and recreational use that are not in harmony, poor in compatibility and that are
highly conflicting. This phenomena also impacts negatively on agriculture products through
pollution by domestic waste and industrial waste.
This is mainly brought about by lack of proper zoning guidelines and land use planning. It is
made worse by laxity or corruption in the institution mandated to control development in the area
of study. The ultimate results of unplanned development is the mushrooming of the informal
settlement that are characterized by high rate of crime, poverty and unemployment affecting the
entire area. This destroy the available land and make it unsafe for living, farming or conducting
business. A case example is the informal settlement at Githogoro Village in the boarder of
Kiambu sub-county and Nairobi County.
i) Pressure on existing resources.
Ideally infrastructures should be provided before any development can begin. However
developments are taking place without improving the capacity of existing infrastructures
(Mundia and Aniya, 2005). Developments along major roads like Kiambu road has created a lot
of pressure resulting into traffic jam in the peak hours. The access roads especially in the
residential areas that were coffee plantations are narrow straining the motorist.
The agricultural land is also under pressure to feed the growing population. This has resulted to
high use of fertilizers which results in high chemical nutrients in the soil. Crops face physical,
chemical and fungal threat from built up areas. This finally affects the safety of agricultural
products for consumption because of the levels of undesirable residuals.
Kiambu sub-county has limited sources for surface water. This means that boreholes are the
major sources of water supply in the region. Increase in population has led to high extraction of
ground water to levels that are not sustainable in the future. Clearing of trees to pave way for
development contribute to less water catchment in the area. Water sources are strained.
55
4.7 Discussion of the Results
The finding of this research have shown the general trend in land use land cover changes.
Agricultural land has been the most affected recording a decline in coverage year after year. The
research found out that 2311.2 Ha of agricultural land were converted into built up areas between
1995 and 2000. Another decline was seen between 2000 and 2014 where 848.34 Ha were
converted into built up area. This was repeated between 2014 and 2018 where another 893.61 Ha
were converted into built –up land use. Therefore, we can conclude that within a span of 23
years, 4053.15 Ha of prime agricultural land had been replaced by built up areas. This means that
38.04 % of agricultural land was cleared to pave way for other land uses.
The proximity of Kiambu sub-county to Nairobi has made it susceptible to problems associated
with urbanization and urban sprawl. As the city expands outward the sub-county has shouldered
the burden of housing the ever rising demand of housing at the expense of agriculture. The real
estate industry has become the most attractive and lucrative business making it so easy for
farmers to abandon agriculture and turn to housing sector.
The returns from agricultural yields have worsen the situation with farmers have low profit levels
and in some cases incurring huge losses. This has been as a result of over-exploitation by long
chains of middle men who take the advantage of lack of knowledge about the market by farmers
at the grass root levels. This has been more outspoken in the coffee sector. High cost of farming
inputs has further increased the production cost making the final product costly and ultimately
affecting the level of returns. The wrath of nature as a response to environmental pollution has
been felt in terms of climate change and change in weather patterns. This has reduced
agricultural production capacity leading to lower yields and low returns. This has forced farmers
to mercilessly sub-divide and abandon farming thereby converting prime agricultural land into
built up areas.
Poor land use planning and management by relevant agencies have escalated conversion of
agricultural land into other land uses. Approval for change of use into other land uses granted by
the county government has accelerated the rate at which agricultural is diminishing. Old and
outdated plans that needs to be reviewed has been in place leading to inappropriate land use
conversion. In other places there is lack of zoning guidelines leading to haphazard developments
at the expense of agricultural land. Poor enforcement of planning laws and guidelines by
development control agencies have resulted into illegal land uses at the expense of agriculture.

56
The built up areas on the other hand have been increasing since 1995 to 2018. Between the year
1995 to 2000 the built up areas increased by 2314.26 Ha. The period 2000 to 2014 also recorded
an increase by 850.95 Ha. Another increase was observed between 2014 and 2018 where built up
areas increased by 911.07 Ha. This means that between 1995 and 2018 the built up areas
increased by 4076.28 Ha. This translates to 39.23% increase in the size of built up areas.
The major driver of increase in built up areas has been rapid increase in population within the
sub-county. Increased population has been as a result of mass influx of immigrants from other
places into the sub-county plus the natural population increase. This has resulted into rise in the
demand of housing. The demand is far way beyond the supply which has led to more land being
converted to agriculture.
The demand for infrastructures such as roads and other social amenities has lead into increase in
the built up area. Better roads have attracted more business and investors to develop land in this
area. This is evident by the number of real estate developments along, adjacent and in close
proximity to Kiambu Road and the northern by-pass. Improved infrastructures have enabled
service delivery on time, reduced travel time and saves on money making the place a convenient
area to reside.
The sub-division of prime agricultural land that were once huge coffee plantations and large
scale farms into uneconomical units have increased the size of built up areas. This is because
outsiders move in and forsake the native agricultural practice and build their dwelling houses or
apartments for rental and sales. Case example of areas that were once agricultural land for large
scale production of maize and coffee that has been sub-divided to pave way for built up areas
include Kasirini, Thindigua, Kirigiti and Kugeria.
The appreciation of value of land in the sub-county due to its proximity to Nairobi, better access
and improved infrastructure has made sub-dividing and selling of agricultural land appealing to
farmers. Developers buy on speculation and later sell the parcels at super-normal profits. In
comparison with the gains emanating from agricultural land, farmers opt to sub-divide and sell
the land as small units and gain more returns. This has increased land proprietors increasing
human activities and ultimately increasing the built up areas.
The trend that was observed in this research is that, as agricultural land is continuously
diminishing, the built up areas continue to increase at accelerating rates. The amount of
agricultural land lost is almost equal to the amount of the built up areas being seen.

57
The trend observed in land use land cover changes poses a serious threat to food security in the
area. Initially the sub-county was predominantly agriculture providing foodstuff to its residence
and income to the farmers. It was able to produce for both subsistence and commercial purposes.
The sub-county acted as a food basket for the city dwellers. It ensured continuous supply of fresh
and perishable foodstuff to Nairobi. This was made possible by good infrastructure that ensured
that the products arrived in the market in good time and when they are fresh. It also ensured that
foodstuffs were affordable across the board from high to low income earners.
Unfortunately the conversion of agricultural land has reduced the production capacity of
agricultural farms due to reduction in sizes. The sub-county is no longer capable of feeding itself
leave alone feeding Nairobi city. This becomes a serious threat since the sub-county has to rely
on other region to curb its deficit. If this trend is not managed, it means that in the future the sub-
county will no longer be in position to feed itself at all.
In other instances changes in land use land cover had resulted in creating pressure on the existing
Resources. Increase in population for instance without change the previous state of resources
exerts high pressure. This is evident by the findings of this research in regards to waterbodies. In
1995 the water bodies’ coverage stood at 118.35 Ha. In the year 2000, they reduced by 0.36 Ha.
Another reduction of 3.78 Ha was noted between 2000 and 2014. The biggest reduction was
observed between 2014 and 2018 where the water bodies reduced by 18.99 Ha.
The sub-county has limited sources for surface water. It has very few rivers and streams and it
dams rely heavily on harvest of rain water. The water bodies cannot keep up with the rising
demand for water and this explain the continued shrinking of water bodies. In attempt to cope
with unlimited demand for water and limited supply the biggest percentage of the population rely
on boreholes. There has been extraction of underground water in levels that are not sustainable.

58
CHAPTER FIVE: CONCLUSION AND
RECOMMENDATIONS This chapter draws conclusions and makes recommendations from the results obtained and
observations carried out in the study.
5.1 CONCLUSION This study involved the analysis of land use land cover changes and their implication on peri-
urban agriculture. The study is useful in obtaining information regarding land use land cover
changes, the factors driving these changes and the effect that they have on agriculture in Kiambu
sub-county. The results obtained provides useful insights to planners and policy makers for
informed decision making.
The first objective of this research was to map land use land cover changes in the sub county.
The research revealed that there has been minimal attempt in detecting and monitoring land use
land cover change using remote sensing skills and GIS tools. The results obtained revealed that
agricultural land suffered most where it reduced drastically at the expense of other land uses and
mainly the built up areas. This poses a great threat to food security in the area since people
would initially access food stuff at cheaper prices. The major factor for drastic reduction of
prime agricultural land was noted to be increase in population and its proximity to the capital
city, Nairobi
The second objectives was to quantify the effects of land use land cover changes on agricultural
land. The study employed the use of remote sensing and GIS tools for change detection and
analysis. Satellite images obtained from Landsat satellite were classified to get the classes and
detect changes. The integration of remote sensing techniques and GIS tools enabled change
detection, monitoring and analysis necessary for making future projections. The research
technique employed were both quantitative and qualitative. Descriptive statistics and excel
analysis were also used in the study.
The third objective was review causes of land use land cover changes. The study identified low
returns from agricultural outputs, demand for real estate developments, improved infrastructure,
poor marketing strategies, population increase, proximity to Nairobi and poor land use planning
and climate change as the main drivers of these changes.

59
The final objective was to interpret the effects of land use land cover changes to the local
economy of Kiambu sub-county. The positive benefit resulting from these changes were
employment creation in construction and service industries, increase housing units and
appreciation of land values. The adverse effects includes; reduced agricultural production,
increment on rent, uncontrolled environment and mushrooming of informal settlement, increased
pressure on existing resources and infrastructures and loss of farm related job opportunities.
The study will be useful in determination of the problems emanating from conversion of
agriculture to built-up areas to satisfy other land uses such as residential, commercial,
institutional, industrial and recreational. This will help in better management of land as a
resource in order to be able to satisfy the needs of the current population while ensuring
sustainability. This will ensure that the current generation benefit without compromising future
generation from benefiting from the resource. Ultimately this will improve the quality of life of
those in the city and in the peri-urban areas.
In general the study points out that the trend in land use land cover change continues to reduce
the size of agricultural land by converting it into built-up areas. If proper development control
mechanism are not put into place, agricultural land will be driven into extinct and be replaced by
concrete jungles. This is a serious threat to food security of the residents and the surrounding
areas. There is need to monitor these changes through remote sensing and GIS tool and develop a
mechanism to ensure that as much as we have a rising demand for housing, we control
development to ensure food security.

60
5.2 RECOMMENDATIONS The recommendations are based on the results obtained from this study and are anchored to
appropriate land use management practices to regulate conversion of agricultural land to built-up
areas. The following recommendations will help to regulate this trend in land use land changes.
In mapping and monitoring land use land cover change, this research recommends the
following.
a) Establish A GIS and Remote Sensing Department.
This will help in continuous monitoring of the extent of land use land cover changes and their
effect on agricultural land. The county Government act 2012 stipulates that every county
government should establish Land Based GIS laboratory. If this is operationalized in the sub-
county they will be able to map and monitor land use land cover changes for decision making
b) Regularly Updating and Creation of Land Use Plans
Planners and policy makers should engage in regularly updating of old land use plans to be in
harmony with the current needs of the society. Some of land use plans are outdated and do not
meet the current needs of the society. Initially the amount of land available was high due to low
population. In the recent past this has changed and the size of population has increased
demanding a new approach in land use. In some instances, they will have to create new land use
plans to regulate the way land is used in the area. In areas where no plan exist at all it’s important
to create one. This will necessitate wide consultation with all stakeholders and public
participation to ensure that their needs and priorities are captured and incorporated in the plans in
ways that ensure appropriate land use management.
In quantify the effects of land use land cover changes on agricultural land and developing
appropriate mechanism to deal with the situation, a multi-disciplinary approach is used.
The following should be done.
a) Harmonization of Institutional and Legal Framework
There are various laws and policies that are used by different agencies and institution in land use
management. Over the years these frameworks have been conflicting in execution of land
management practices. These conflict have been noted more often between planning agencies
and other agencies such as surveying, engineering, architectural and environmental agencies.
61
Different acts of parliament and policies used by these agencies have loopholes that needs to be
revised to ensure that they are all in line and everyone is reading from the same script. This will
ensure that all institutions work as one body for different functions. This will ensure that all
agencies have the same statistics on levels of change as opposed to different statics because of
different parameters used by different agencies.
b) Enforcement of Development Control
This will help to solve the adverse effect of land use conversion. The existing development
control agencies needs to be strengthened in order to enforce development control. The zoning
guidelines and planning regulation forms the basis for development control and are in synchrony
with the existing land use plans. Development application by developers should be subjected to
these laws and regulation without being biased or corrupt. Approved development application
should be in compliance with these laws and those found to be violating these laws should be
prosecuted and sentenced in a court of law. This will ensure adherence to land use management
laws.
These agencies should be given powers and capacity to exercise development control. A visit to
Kiambu sub county offices revealed that the sub-county has 2 development control officer and
one planner in charge of development control. They have two days in a week for fieldwork to
check out those areas with illegal developments. With the robust development taking place in the
sub-county, this means that the sub-county is incapacitated in terms of technical personnel.
Again it was noted that the vehicle for site visit was one. This means more funds need to be set
aside to facilitate development control.
To deal with negative causes of land use land cover change and the ultimate effects of the
changes, this research recommends the following.
a) Enhance Agricultural Practices
The area of study has suffered from sub-division of land into small uneconomical units. This
means there is need rethink the farming practices used before and migrate to modern practices.
There is need to migrate from extensive farming to intensive farming. Since there is little we can
farm on, we should intensify agricultural practices to increase the yields to feed the ever growing
population. This means that the farmer need to be educated and train farmers on the modern
farming techniques in order to produce sufficient food for its residents.

62
Intensive farming involves high use of farming inputs. The Government should also reduce the
prices of farming inputs or subsidize them to levels affordable to farmer. One of the challenge to
farming have been high cost of farming inputs which are not affordable and in the end reduces
the returns for farmer.
b) Improve the Marketing Strategies for Agricultural Outputs
Farmers in the sub-county have been channeling their agricultural products to the market through
middlemen who have been exploiting them. These middlemen buy the products at very low
prices making small scale farmers to shy away from farming. There is need for these farmers to
form strong co-operative societies that will help them increase their bargain power on prices of
their commodity. They also need information on market prices and access to this market to
enable farmers to supply their products direct to avoid exploitation.
The government should promote small scale markets to enable farmers to sell their produce
directly to the neighbours instead of having to travel to Kiambu town. This will help in fresh and
perishable farm products that go bad before they reach to the market.
Training and setting up of value addition industries will also help farmer to pre-process the farm
output and increase their returns from agriculture. This will give them enough reason not to
convert their agricultural land to built-up areas.

63
REFERENCES Aguilar, A. and Ward, P. (2003). Globalization, regional development, and mega city expansion
in Latin America: Analysing Mexico City‘s peri-urban hinterland. Cities 20 (1); 3-21.
Alkema, D., Bijker, W., Ali, S., Zoltan, V., & Wouter, V. (2012). Data Integration The Core of
GIScience: a systems-based approach (pp. 373-349). Enschede, The Netherlands: ITC:
International Institute for Geo-Information Science and Earth Observation.
Appiah, D.O.; Forkuo, E.K.; Bugri, J.T.; Apreku, T.O. Geospatial Analysis of Land Use and
Land Cover Transitions from 1986–2014 in a Peri-Urban Ghana. Geosciences 2017, 7, 125.
Asamoah, B. (2010). Urbanisation and changing patterns of urban land use in Ghana:Policy
and planning implications for residential land use in Kumasi. Unpublished MSc
dissertation, Department of Planning, KNUST
Ashbindu S, H.S., Foresman, T. and Eugene, A. F. (2001). Status of world’s remaining closed
forests: An assessment using satellite data and policy options. A Journal of the Human
Environment, 67-69.
Bakx, W., Jansen, L., Schetselaar, E., Temofli, K., & Tolpekin, V. (2012). Image Analysis. The
Core of GIScience: A systems-based approach (pp. 206-213). Enschede, The Netherlands:
International Institute for Geo-Information Science and Earth Observation, ITC.
Bhatta, B. (2011). Remote sensing and GIS. New Delhi: Oxford University Press.
Campbell, J. B., Parece, T. E., & McGee, J. A. (2015). Remote Sensing Analysis in an ArcMap
Environment by Tammy Parece. Retrieved June/July, 2018, from
https://www.goodreads.com/book/show/26007234-remote-sensing-analysis-in-an-arcmap-
environment.
Carey J, (2001). Impacts of Highways on Property Values, Case Study of the Superstition Freeway
Corridor. Arizona Department of Transportation 206 South 17th Avenue, Phoenix, Arizona.
Carmelita, R.E.U. L., Tamura, T., Naoto, I. & Tsutomu, M. (2002) Cities and Sustainability:
Issues and Challenges on Land Use Planning. University of the Philippines.
Christiaensen, L., L. Demery, and J. Khul. 2010. The (Evolving) Role of Agriculture in Poverty
Reduction. UNU-WIDER. Working Paper No. 2010/36.
ELD (2015). The value of land: Prosperous lands and positive rewards through sustainable land
management. The Economics of Land Degradation Initiative, Bonn.
Ellis E., 2007. Land use and land cover change. Encyclopedia of Earth.

64
Estoque, R. C., & Murayama, Y. (2011). Spatio-temporal urban land use/cover change analysis
in a hill station: the case of Baguio city, Philippines. Procedia-Social and Behavioral
Sciences, 21, 326-335.
FAO, IFAD and WFP. 2015. The State of Food Insecurity in the World 2015. Meeting the 2015
international hunger targets: taking stock of uneven progress. Rome, FAO.
FAO. (2012). Growing greener cities in Africa. First status report on urban and peri-urban
horticulture in Africa. Rome, Italy: Food and Agriculture Organization of the United
Nations. Available from www.fao.org/ag/agp/greenercities/pdf/GGC-Africa.pdf
FAO. 2011. Urban and peri-urban agriculture. Rome
FAO. 2016. State of the World’s Forests 2016. Forests and agriculture: land-use challenges and
opportunities. Rome
FAO. 2017. The future of food and agriculture – Trends and challenges. Rome.
Gachimbi L.N., Maina F., Onduru D.D., & Muchena F.N. (2003). Agricultural production and its
constraints in Central Kenya: A Case Study of Kiambu District. Integrated Nutrient
Management to Attain Sustainable Productivity Increases in East African Farming Systems
(INMASP) Report No. Ke-09.
Giri, C. P. (2012). Remote sensing of land use and land cover: Principles and applications. Boca
Raton: CRC Press.
Government of Kenya, (2010). Agricultural Sector Development Strategy 2010-2020, Ministry of
Agriculture & Ministry of Livestock and Fisheries Development, Nairobi
Government of Kenya, (2008). Nairobi Metro 2030 Strategy, Ministry of National Planning and
Vision 2030. Kenya Vision 2030, Government Printer, Nairobi.
Government of Kenya, (2009). National Land Policy, Ministry of Lands. Nairobi. Government
Printers
Government of Kenya, (2011). Kiambu District Planning Unit, Kiambu.
Government of Kenya, (2013). Kiambu County draft integrated development plan 2013- 2017
Government printers, Nairobi.
Government of Kenya, (2013). Kiambu County Profile. Nairobi. Government Printers.
Government of Kenya, (2014). Kiambu County Physical Planning Unit, Kiambu.
Government of Kenya, (2015). Kiambu County Annual development plan 2016/2017 Government
printers, Nairobi.

65
Herold, M., Goldstein, N.C., Clarke, K.C., (2003). The spatiotemporal form of urban growth:
measurement, analysis and modelling. Remote Sensing Environment. 86, 286–302.
https://www.habitat.org/where-we-build/kenya
https://www.nation.co.ke/lifestyle/dn2/-Kiambu-centres-in-rapid-growth
https://www.nation.co.ke/lifestyle/dn2/Kiambu-to-plan-land-use-to-achieve-food-security
K.Kavitha, C.Prakasam, A.shanthakumri (2012)/. Research Scholar of geography, school of
earth and atmospheric science, Land use land cover change detection in midtrial district.
Kalantari, Zahra; Lyon, StveW.; Folkeson, Lennart; French, Helen K., et al. (2014).Quantifying
the hydrological impact of simulated changes in land use on peak discharge in a small
catchment. Science of the Total Environment, 466-467, 741 – 754
Kassim, A., & Weliwita, A. (2015). UN-HABITAT global activities report 2015: Increasing
synergy for greater national ownership. Nairobi, Kenya: United Nations Human
Settlements Programme.
Khan, Rubia & Jhariya, Dalchand. (2016). Land Use Land Cover Change Detection Using
Remote Sensing and Geographic Information System in Raipur Municipal Corporation
Area, Chhattisgarh. International Journal of Geo Science and Geo Informatics. 3. 1-4.
Kiita, E.M. (2013). An Investigation into Causes and Effects of agricultural Land Use
Conversions in The Urban Fringes: A Case Study of Nairobi-Kiambu Interface.
Unpublished Master’s thesis. Department of Real Estate and Construction Management,
University Of Nairobi.
Kim, H., Kjeldsen, T. R., Packman, J., Grebby, S., Rachel, D., & Miller, J. D. (2011). Assessing
the impact of urbanization on storm runoff in a peri-urban catchment using historical
change in impervious cover. Journal of Hydrology, 515 (2014) 59–70.
KNBS, (2009). Kenya Population and Housing Census, 2009. Kenya National Bureau of
Statistics.
Lee-Smith, D. (2014). Digging deeper: Inside Africa’s agricultural, food and nutrition dynamics.
Leiden: Brill.
Lillesand, T. M., Kiefer, R. W., & Chipman, J. W. (2006). Remote sensing and image
interpretation. Hoboken, NJ: John Wiley & Sons.
Maheshwari, B., Singh, V. P., & Thoradeniya, B. (2016). Balanced urban development: Options
and strategies for liveable cities. Cham: Springer.
66
Matuschkle, I. (2009). Rapid urbanization and food security: Using food density maps to identify
Future food security hotspots. Food and Agriculture Organizations of the United Nations
(FAO). Presented at the International Agricultural Economist conference, Beijing, China,
August 16-22.
Mundia, C.N., & Aniya, M. (2005). "Dynamics of land use/cover changes and degradation of
Nairobi City, Kenya,” Land Degradation & Development 17(1), 97-108.
Musa, M. K., & Odera, P.A. (2014). Land use land cover change (LULC) and its effects on food
security: Case study of Kiambu County, Kenya. 4th Annual International Conference
conducted at Kabarak University on 15th -18th July 2014.
Naab, F. (2012). Urbanization and its Impact on Agricultural Lands in Developing Cities: A
Case Study of Tamale Metropolis. Unpublished Master’s Thesis. College of Architecture
and Planning Kwame Nkrumah University of Science and Technology, Kumasi.
Piorr, A., Ravetz, J. & Tosics, I. (eds.) (2011). Peri-urbanization in Europe; Towards a European
Policy to Sustain Urban-Rural Futures; Synthesis Report.Frederiksberg: University of
Copenhagen/Academic Books Life Sciences.
Rosegrant and Hazel. 2001. Transforming the Rural Asian Economy: The Unfinished
Revolution. A 2020 Vision for Food, Agriculture, and the Environment. 2020 Brief 69,
May 2001.
Thuo, A.D.M (2010) “Community and social responses to land use transformations in the Nairobi
rural- urban fringe, Kenya,” Journal of Field Actions Science (Field Actions Science Report),
Special Issue 1, 2010.
Thuo, A.D.M (2013). Impacts of urbanization on land use planning, livelihood and environment
in the Nairobi Rural-Urban Fringe, Kenya. International Journal of Scientific &
Technology Research. 2(7).
U. M., & Bergman, K. F. (2014). Urban and peri-urban agriculture for food security in low
income countries (SLU-Global Report 2014:4, Rep.). Sweden: Taberg Media Group.
UN (2014). World Urbanisation Prospects: The 2014 Revision, Highlights. United Nations,
Department of Economic and Social Affairs, Population Division.
UNEP (2014). Assessing Global Land Use: Balancing Consumption with Sustainable Supply.
United Nations Environment Programme, Nairobi.

67
UN-Habitat (2010). State of the World Cities, Bridging the Urban Divide Report 2010/2011.
London: Earthscan.
United Nations, Department of Economic and Social Affairs, Population Division (2017). World
Population Prospects: The 2017 Revision, Key Findings and Advance Tables. Working
Paper No. ESA/P/WP/248.
United Nations, Department of Economic and Social Affairs, Population Division (2014). World
Urbanization Prospects: The 2014 Revision, Highlights (ST/ESA/SER.A/352).
United Nations, Department of Economic and Social Affairs, Population Division (2015). World
Population Prospects: The 2015 Revision, Key Findings and Advance Tables. Working
Paper No. ESA/P/WP.241.
Van der Esch S, Ten Brink B, Stehfest E, Bakkenes M, Sewell A, Bouwman A, Meijer J,
Westhoek H and van den Berg, M (2017). Exploring future changes in land use and land
condition and the impacts on food, water, climate change and biodiversity: Scenarios for
the Global Land Outlook. PBL Netherlands Environmental Assessment Agency, The
Hague.
Yadav, P.K., Kapoor, M. & Sarma, K. (2012). Land Use Land Cover Mapping, Change
Detection and Conflict Analysis of Nagzira-Navegaon Corridor, Central India Using
Geospatial Technology. International Journal of Remote Sensing and GIS, 1(2), 90–98.

68
APPENDICES
Appendix A: False colour composites A1: FALSE COLOUR COMPOSITE FOR THE YEAR 1995 A2: FALSE COLOUR COMPOSITE FOR THE YEAR 2000

69
A3: FALSE COLOUR COMPOSITE FOR THE YEAR 2014 A4: FALSE COLOUR COMPOSITE FOR THE YEAR 2018

70
Appendix B.Kiambu Sub-County Topographical Map

71
Appendix C: Similarity Report

72

73

74