SCHOOL OF ENGINEERING PhD THESIS - CORE
267
CRANFIELD UNIVERSITY H -l 1/ p AKMS HOSSAIN A Model for Sustainable Biomass Electricity Generation in Bangladesh SCHOOL OF ENGINEERING PhD THESIS
-
Upload
khangminh22 -
Category
Documents
-
view
4 -
download
0
Transcript of SCHOOL OF ENGINEERING PhD THESIS - CORE

CRANFIELD UNIVERSITY
H -l
1/ �p
AKMS HOSSAIN
A Model for Sustainable Biomass Electricity Generation in Bangladesh
SCHOOL OF ENGINEERING
PhD THESIS

CRANFIELD UNIVERSITY
&�\ /4Im.
b? �/:
SCHOOL OF ENGINEERING
PhD THESIS
Academic Year 2004-2005
AKMS Hossain
A Model for Sustainable Biomass Electricity Generation in Bangladesh
Supervisor: Dr. Ossama Badr
September 2005
This thesis is submitted in partial fulfilment of the requirements for the degree of Doctor of Philosophy
@ Cranfield University 2005. All rights reserved. No part of this publication may be reproduced without the written permission of the copyright holder.

ABSTRACT
Bangladesh, where only 20% of the total population are connected to grid electricity, has a promising scope to utilise biomass for decentralised electricity generation. In this study, sustainable biomass electricity generation model was developed for the country, by combining tech no-econometric and optimisation modelling techniques. The developed model addresses the biomass generation and availability, feasible technologies, cost and efficiency correlations, economic plant size, plant economics and sensitivity, and environmental and social impacts.
In 2003, the national total annual available biomass energy potential in Bangladesh varies from 183.848 to 223.776 TWh. The feasible technologies are: gasification based ICE-generator, anaerobic digestion based ICE-generator and direct combustion based steam turbine or Stirling engine-generator. Correlations of capital investment costs and overall conversion efficiencies with the plant electricity generating capacity have been developed. Direct combustion technology shows the highest electricity generation potential of 20.21 TWh/year; followed by gasification, of 14.30 TWh/year. Economic radius of biomass collection and size of the plants has been determined for maximum profitability. The biomass electricity plants economics have been estimated and compared with the diesel and dual-fuelled plants. Analysis shows that, anaerobic digestion and gasification-based electricity generation plants are economically feasible. Biomass electricity plant is highly sensitive to changes in biomass price, selling price of electricity, investment cost, plant lifetime, conversion efficiency and operating hours. The employment of the biomass electricity instead of diesel generator saves significant amount of the greenhouse gas emissions. It creates more employment than conventional and presents other socio-economic benefits as well.
Due to the combination of electricity generation potential, promising economics and low greenhouse gas emissions; gasification-based biomass electricity plant is recommended for the country. Biomass availability and plant economics vary between districts to districts. Computer programmes have been developed for district wise biomass electricity plant analysis.

ACKNOWLEDGEMENTS
I would like to express my sincere gratitude and heartiest thanks to my supervisor Dr. Ossama Badr, for his advice, generous help and support, and encouragement throughout the course of my study.
I am very grateful to the Department of Process and Systems Engineering and School of Engineering for waiving my tuition fees during the last two years of my study at Cranfield University. Special thanks and gratitude are due to my supervisor Dr. Ossama Badr, Professor Michel Sanderson (Head of the Department), and Professor Minno Patel (Head of School); all of whom helped me to continue my study at Cranfield.
I would also like to express my love and gratitude to my wife Surya Akter and to my little daughters Juwairiyah and Maimoonah for their support and patience during the time I spent working in this research study. I owe to my wife Surya, who provided a valuable support during my study at Cranfield.
Special thanks are due to Linda, Janet and Krystle of the Department of Process and Systems Engineering for their support during my study at Cranfield University. My thanks are also due to the members of staff of the Cranfield University Library for providing the requested information related to my study.
Also, I am grateful to BAEC, Bangladesh; for the support and co-operation during my research.
Last, but by no means least, I would like to thank my parents, parents-in-law and friends for encouraging me in keeping studying.
11

CONTENTS
Abstract i
Acknowledgments ii
Contents iii
Abbreviation ix
Notation A
CHAPTER 1 GENERAL INTRODUCTION AND THESIS OVERVIEW 1
1.1 Background 1
1.2 Objectives of the Current Study 3
1.3 Thesis Structures 3
CHAPTER2 ENERGY OVERVIEW OF BANGLADESH 5 2.1 Bangladesh: An Introduction 5 2.2 Commercial Primary Energy Resources and Use 7
2.2.1 Natural Gas 8 2.2.2 Oil 9 2.2.3 Coal 9 2.2.4 Peat 10 2.2.5 Hydro-power 10
2.3 Electricity Generation and Consumption 11
2.3.1 Electricity Generation 11
2.3.2 Electricity Consumption 13
2.4 Renewable Energy Utilisation 13 2.4.1 Wind Energy 14
2.4.1.1 Present Application 17 2.4.2 Solar Energy 18
2.4.2.1 Solar Thermal Systems 19
2.4.2.2 Solar Photovoltaic Systems 20
2.4.3 Small Hydro-power 22
2.4.4 Biomass Energy 23
2.4.4.1 Briquetting of Biomass 23
2.4.4.2 Biomass to Biogas 24
2.4.4.3 Gasification of Biomass 26
2.5 Conclusions 26
CHAPTER 3 BIOMASS TO ELECTRICITY: CONVERSION TECHNOLOGIES 28
3.1 Direct Combustion of Biomass 29
3.1.1 Electricity Generation by Direct Combustion of Biomass 29 3.2 Co-firing of Biomass 30
3.2.1 Options for Co-firing 30
iii

3.2.2 Electricity Generation by Co-firing of Biomass 30
3.3 Gasification of Biomass 31 3.3.1 Electricity Generation by Gasification of Biomass 31
3.4 Pyrolysis of Biomass 32 3.4.1 Fast Pyrolysis 33 3.4.2 Electricity Generation by Pyrolysis of Biomass 35
3.5 Anaerobic Digestion of Biomass 36 3.5.1 Electricity Generation by Anaerobic Digestion of Biomass 38
3.6 Fermentation of Biomass 38
3.6.1 Production of Ethanol and Methanol 38 3.6.1.1 Ethanol 38 3.6.1.2 Methanol 39
3.6.2 Electricity Generation by Fermentation of Biomass 39 3.7 Fuel Cells 40
3.7.1 Fuel Cell for Electricity Generation 41 3.8 Conclusions 42
CHAPTER4 BIOMASS ENERGY SYSTEMS MODELLING: A REVIEW 43 4.1 Introduction 43 4.2 Energy Systems Modelling 44
4.2.1 Biomass Energy Systems Modelling 46 4.2.1.1 Econometric Models 46 4.2.1.2 Optimisation Models 47 4.2.1.3 GIS Models 48 4.2.1 A Hybrid Models 49
4.3 Biomass Energy Systems Modelling in Bangladesh 50 4.4 Conclusions 52
CHAPTER5 BIOMASS GENERATION, CONSUMPTION, AND POTENTIAL FOR 54 ENE RGY IN BANGLADESH
5.1 Introduction 54
5.2 Land Use 54
5.3 Biomass Resources 56
5.3.1 Agricultural Residues 57
5.3.2 Animal Wastes and Poultry Droppings 57
5.3.3 Human Waste and Municipal Solid Waste 59
5.3.4 Forests and the Forestry-Industry 59
5.4 Total Energy Potential of Recoverable Biomass Resources 60
5.5 Biomass Consumption 62
5.6 Biomass Energy Available for Electricity Generation 63
5.6.1 Whole Country 63
5.6.2 District wise 64 5.7 Biomass Savings 65
iv

5.8 Seasonal Availability of Biomass Resources 5.8.1 Storage of Biomass Resources 5.8.2 Impact of Biomass Storage
5.9 Conclusions
CHAPTER 6 FEASIBLE TECHNOLOGIES, INVESTMENT COST, CONVERSION EFFICIENCIENCY AND ELECTRICITY GENERATION POTENTIAL 6.1 Techni cally Feasible Conversion Technologies and Methodology 6.2 Gasification
6.2.1 Properties of Biomass for Gasification and Combustion 6.2.2 Technology
6.2.2.1 Types of Gasifiers 6.2.2.1.1 Fixed bed Gasifier 6.2.2.1.2 Fluidised bed Gasifier
6.2.2.2 Prime movers 6.2.2.3 Gas Cleanup and Quality Requirements
6.2.3 Application 6.2.4 Potential Biomass Resources 6.2.5 Capital Investment Cost and Overall Efficiency
6.3 Anaerobic Digestion 6.3.1 Biomass Resources for Anaerobic Digestion
6.3.1.1 Animal and Poultry Wastes 6.3.1.2 Municipal Solid Waste 6.3.1.3 Sewage Sludge 6.3.1.4 Rice and Wheat Straw
6.3.2 Technology 6.3.2.1 Types of Digester 6.3.2.2 Prime movers
6.3.2.2.1 ' Internal Combustion Engines 6.3.2.2.2 External Combustion Engines
6.3.2.3 Accessories and Control Systems 6.3.2.4 Temperature of Digestion 6.3.2.5 Use of Digester Effluent
6.3.3 Biogas Production: Important Parameters 6.3.4 Co-digestion of Biomass Resources 6.3.5 Potential Biomass Resources
6.3.6 Capital Investment Cost and Overall Efficiency 6.4 Direct Combustion
6.4.1 Biomass Resources for Direct Combustion
6.4.1.1 MSW for Direct Combustion 6.4.1.2 Poultry Litter for Direct Combustion
6.4.2 Technology 6.4.2.1 Types of Burner/Combustor
66 67 69 69
71
71 74 74 75 75 75 77 78 78 80 82 83 89 89 89 89 90 90 91 91 94 94 94 95 95 96 96 97 98
100 104 105 105 106 106 106
V

6.4.2.2 Prime movers 107 6.4.3 Potential Biomass Resources 108 6.4.4 Capital Investment Cost and Overall Efficiency 109
6.5 Electricity Generation Potential 114 6.5.1 Operating Hours 114 6.5.2 Total Energy and Electricity Generation Potential 114
6.6 Use of Compression Ignition Engines: Cost and Efficiencies 115 6.6.1 Technology 115 6.6.2 Capital Investment Cost and Overall Efficiency 115
6.6.2.1 Diesel only Operation 115 6.6.2.2 Dual-fuel Operation 118
6.7 Conclusions 118
CHAPTER 7 SIZING OF BIOMASS ELECTRICITY PLANTS 120 7.1 Introduction 120 7.2 Overall Efficiency and Capacity of the Biomass Electricity Plants 120
7.2.1 Combined Gasifier / ICE - Generator 120 7.2.1.1 Gasifier and Producer Gas - fuelled ICE 120 7.2.1.2 Gasifier and Dual - fuelled ICE 121 7.2.1.3 Combined Gasifier/Gas turbine 122
7.2.2 Combined Anaerobic Digester / ICE - Generator 122 7.2.2.1 Biogas Digester and Biogas-fuelled ICE 122 7.2.2.2 Biogas Digester and Dual-fuelled ICE 123
7.2.3 Direct Burning/Heat Engine-Generator 123 7.2.3.1 Direct Combustion and Steam Turbine 123 7.2.3.2 Direct Combustion and Stirling Engine 123
7.3 Mathematical Modelling and Optimisation 123 7.3.1 Mathematical Modelling 123 7.3.2 Optimisation 124
7.3-2.1 Techniques of Optimisation 124 7.3.2.2 Steps of Optimisation 126
7.4 Optimisation Method Applied to Biomass Electricity Plants 126 7.4.1 Application 127
7.5 Biomass Electricity Plants Sizing 130 7.5.1 Energy Content of Mixed Biomass Resources 131 7.5.2 Default Parameters 132 7.5.3 Results 132
7.6 Conclusions 135
CHAPTER 8 ECONOMICS OF BIOMASS ELECTRICITY PLANTS AND 136 SENSITIVITY ANALYSIS 8.1 Introduction and Methodology 136 8.2 Biomass Resources and Technology 138
vi

8.3 Elements of Costs 138 8.3.1 Cost of Capital 139 8.3.2 Cost of Repair and Maintenance 139 8.3.3 Cost of Operation 140 8.3.4 Cost of Biomass Fuel 140
8.3.4.1 Cost of Production and Transportation 142 8.3.4.2 Cost of Storage and Pre-treatment 142 8.3.4.3 Cost of Biomass at Plant Gate 143
8.3.5 Others Fixed Costs 144 8.4 Economics for Diesel and Dual-fuel Mode of Operation 144
8.4.1 Diesel Fuel Operation 144 8.4.2 Dual-fuel Operation 145
8.5 Default Values - Financial and Technical 145 8.6 Results 145
8.6.1 Gasification-based Biomass Electricity Plant 146 8.6.2 Diesel Generator Plant 147 8.6.3 Dual-fuelled Generator Plant 147 8.6.4 Conclusions 148
8.7 Sensitivity Analysis 152 8.7.1 Introduction 152 8.7.2 Results 153
8.8 Conclusions 153
CHAPTER 9 IMPACT ANALYSIS: ENVIRONMENTAL AND SOCIO-ECONOMIC 156 9.1 Environmental Impact: Introduction and Methodology 156 9.2 Inefficient Use of Biomass Energy 157
9.2.1 Indoor Air Pollution and Health Effects 157 9.2.2 Interventions to Reduce Indoor Air Pollution 159
9.3 Environmental Impacts of Biomass Electricity 159 9.3.1 Pollutants and Global Warming Potential 160
9.4 Greenhouse Gas Emissions Mitigation of Biomass Electricity 164 9.5 Greenhouse Gas Emissions Mitigation Potential: Case Study 165 9.6 Socio-economic Impact: Introduction and Methodology 168 9.7 Socio-economic Benefits of Biomass Energy Activities 169 9.8 Socio-economic Impact: Evaluation and Case Study 172 9.9 Conclusions 175
CHAPTER110 CONCLUSIONS AND RECOMMENDATIONS 176 10.1 Conclusions 176 10.2 Recommendations for Future Work 180
REFERENCES 182
vii

APPENDIX A GLOSSARY 200
APPENDIX B COMPUTER PROGRAMME AND CD-ROM INSTRUCTIONS 202
APPENDIX C BIOMASS GENERATION BY DISTRICTS 206 C1 Generation Rates of Agricultural Crops 207 C2 Forests and Forestry-industry Residue 209 C3 Urban and Rural Population 212
C4 Farm Animals and Poultry Population 214 C5 References 217
APPENDIX D FEASIBLE TECHNOLOGIES: COST AND EFFICIENCIENCY 218 DI Gasification 219 D2 Anaerobic Digestion 224 D3 Direct Combustion 228 D4 Diesel Generators 231 D5 References 232
APPENDIX E RESULTS BY DISTRICT: KHULNA DIVISION 236
APPENDIX F RESULTS: DIVISION-WISE 251
viii

ABBREVIATIONS
AD Anaerobic Digestion BAEC Bangladesh Atomic Energy Commission BARD Bangladesh Academy for Rural Development BAU Bangladesh Agricultural University BCAS Bangladesh Centre for Advanced Studies BCSIR Bangladesh Council for Scientific and Industrial Research BDT Bangladeshi Taka (name of currency) BFB Bubbling Fluidised Bed BG Biogas BIT Bangladesh Institute of Technology BPDB Bangladesh Power Development Board BRAC Bangladesh Rural Advancement Committee BUET Bangladesh University of Engineering and Technology BWDB Bangladesh Water Development Board CES Centre for Energy Studies CFB Circulating Fluidised Bed CHP Combined Heat and Power C/N Carbon-to-nitrogen CoE Cost of Electricity DANIDA Danish International Development Agency DC Direct Combustion DESA Dhaka Electric Supply Authority DOE Department of Environment, Bangladesh DSS Decision Support System DU Dhaka University FAO Food and Agricultural Organisation GDP Gross Domestic Product GHG Greenhouse Gas GIS Geographical Information System GOB Government of Bangladesh GS Grameen Shakti GWP Global Warming Potential HHV Higher Heating Value HRSG Heat Recovery Steam Generator
ix

IC Internal Combustion ICE Internal Combustion Engine IFRD Institute of Fuel Research and Development IPP Independent Power Producer ktonne Kilo (1000) tonne LEAP Long-range Energy Alternative Planning LGED Local Government Engineering Department LHV Lower Heating Value MCFC Molten Carbonate Fuel Cell MC', Moisture Content (wet basis) MSW Municipal Solid Waste Mtoe Million tonnes of oil equivalent Mtonne Million tonne NGO Non Government Organisation O&M Operation and Maintenance PAFC Phosphoric Acid Fuel Cell PBP Pay Back Period PG Producer Gas
PV Photovoltaic RDF Refuse Derived Fuel REB Rural Electrification Board RERC Renewable Energy Research Centre SHS Solar Home Systems SIS Social Impact Studies SOFC Solid Oxide Fuel Cell SRE Sustainable Rural Energy TCoE Total Cost of Electricity TS Total Solid UNDP United Nations Development Program Vs Volatile Solid
x

NOTATIONS
AC Annualised capital cost (US$/yr)
ACd Ash content (dry basis) N
Ad Area of the district (kM2)
Ae Economic area of biomass collection (kM2)
cbs Price of biomass (US$/tonne)
CF Cash Flow (US$) CI Cash Inflow (US$) co Cash Out flow/Expenditure (US$) C'. Cost of repair and maintenance (US$/yr)
CRF Capital recovery factor
C. Cost of biomass storage (US$/tonne)
C, Cost of transportation (US$/tonne/km)
C. Mean annual per capita cost of operator (US$/capita/yr)
df De-rating factor
E Annual amount of generated electricity (kWhlyr) f. Present worth factor
FC Cost of fuel (US$/yr) Hb Lower heating value of biomass (kWh/tonne)
Hbg Lower heating value of the biogas (kWh/M3)
Hd Lower heating value of diesel (kWh/tonne)
Hsg Lower heating value of the producer gas (kWh/M3)
Real interest rate N Total capital investment (US$)
Is (SCI) Specific capital investment (US$/kW)
kf Co-efficient of others fixed cost N (as % of the total capital investment)
k, Co-efficient of repair and maintenance cost N (as % of the total capital investment)
Mb Mass flow rate of consumption of biomass fuel (tonne/yr)
xi

Mb Quantity of biomass needed to generate 1 kWh electricity in a dual-fuelled engine generator
Mbg Volume flow rate of the biogas produced
Md Quantity of diesel needed to generate 1 kWh electricity in a dual-fuelled engine generator
M59 Volume flow rate of the producer gas produced
n NP V N.
oc OFC p P.
Pi Qb
Qbg
Qd
Q9
Q-19
Q,
r re
rf Sue
t
W,
WUGE
WUGT
WUSE
Useful life of the plant Net Present Value Number of operators
Cost of operation Others fixed costs Electricity generating capacity of the plant Economic size of the plant
Profitability Index
(kg)
(m3/yr)
(kg)
(M3lyr)
(yr)
(uss)
(US$/yr) (US$/yr) (W) (W)
Thermal energy content of the biomass available (kWh) in the circular area (= CF7x
2 Hb)
Thermal energy content of the biogas generated (kWh)
Thermal energy input of diesel to a dual-fuelled engine- (kWh) generator to generate I kWh electricity Thermal energy input of producer gas to a dual-fuelled (kWh) engine-generator to generate 1 kWh electricity Thermal energy content of the producer gas generated (kWh)
Total thermal energy input of diesel and producer gas (or (kWh) biogas) to a dual-fuelled engine-generator to generate I kWh electricity Radius of biomass collection (km) Economic radius of biomass collection (km)
Diesel replacement factor
Selling price of generated electricity
Annual operating time of the plant Annual amount of biomass needed for storage
Useful work output (equivalent energy) of the gas engine
Useful work output (equivalent energy) of the gas turbine
Useful work output (equivalent energy) of the Stirling engine
(US$/kWh)
(hr/yr) (tonne/yr)
(kWh)
(kWh)
(kWh)
xii

rW(w Useful work output (equivalent energy) of (kWh) the steam turbine Efficiency of conversion of biomass fuel into M useful mechanical energy
17D Thermal efficiency of the digester N
17d Thermal efficiency of diesel engine M
'7dfe Thermal efficiency of dual-fuelled engine M
77, Efficiency of electricity generator M
17G Thermal efficiency of the gasifier M
17GE Thermal efficiency of the gas engine M
17GT Thermal efficiency of the gas turbine M
77o Overall conversion efficiency M
17SE Thermal efficiency of the Stirling engine M
77ST Thermal efficiency of the steam turbine M
a Density of the available biomass (tonne/km2/yr)
A Excess air factor
xiii

CHAPTER1 GENERAL INTRODUCTION AND THESIS OVERVIEW
1.1 Background
World energy demand is likely to grow faster than the increase in population. In 2004, the total world-wide consumption of commercial primary energy sources was estimated to be 10224 mtoe (BP Amoco, 2005). Of the total, fossil fuels amount to -88%, whereas the share of nuclear and hydro-electricity are small (see Table 1.1). There are two factors affecting the availability of fossil fuels - one is the limited nature of their reserves and the other is the security of supply. Eight countries have 81% of all the global crude oil reserves, six countries have 70% of all natural gas reserves and eight countries have 89% of all coal reserves. More than half of Asia, Africa and Latin America import over half of all their commercial primary energy needs (Sayigh, 1999 ).
New and renewable energies will therefore become one of the world's main energy sources. At present, renewable energy contributes only 11 % to world primary energy, it is expected that 60% of all world energy will come from renewable energy sources by the year 2070 (WREN, 2002).
Electricity is a necessary commodity for the economic and social development of nations. There are globally more than 2 billion people without access to any form of electricity and many more without the convenience of a grid connection (Harvey, 1995). It is quite possible that in 40 years time the former figure could increase to 5 billion.
Bangladesh, a least developing country in South Asia, has been experiencing a severe electricity crisis. Only 20% of the total population is supplied with grid electricity (EIA, 2004). In rural areas of the country, where -80% of the total population resides, the fraction drops to a mere 10%. Of the total installed electricity-generation capacity, 95% of the power plants use fossil fuels, of which share of natural gas is around 85%
Source Consumption
mtoe % of total Fossil fuels
Oil 3767.1 36.84
Coal 2778.2 27.17
Natural gas 2420.4 23.67
Nuclear energya 624.3 6.11
Hydro-electricitya 634.4 6.21
Total 10224.4 100.00
a converted on the basis of thermal equivalence assuming 38% conversion efficiency in a modem thermal power station to generate the same amount of electricity.
Table 1.1 World-wide consumption of commercial primary energy in 2004 (BP Amoco, 2005)

(BPDB, 2005). At an annual 10% growth rate of consumption, the national reserve of natural gas may not last more than 15-20 years (Bhuiyan et al. 2000). The World Bank has estimated that Bangladesh loses around US$1 billion per year in economic output due to power shortages and unreliable power supply (EIA, 2004). The Government of Bangladesh has a vision to electrify the whole of the country by the year 2020 (MOF, 2005).
Electrification of villages in remote areas usually requires large investment and leads to power losses associated in transmission and distribution networks. One of the great promises offered by the renewable energy technologies is their potential to provide electricity in areas not served by national power grids. The draft Renewable Energy Policy of Bangladesh, published in 2002, stated that renewable energy will take a vital role for off-grid electrification in the country. The main renewable energy resources in Bangladesh are biomass, solar, wind and hydro-power. Hydro-power potential of Bangladesh is low due to the relative flatness of the country. Most potential sites for wind power utilisation are situated in the coastal regions. Wind power generation and its application in Bangladesh have certain limitations due to lack of reliable wind speed data and seasonal variation of wind speed. The country has good prospects of utilising solar PV systems for electricity generation, but the high capital investment cost of solar PV is a big barrier for adopting such systems. Biomass is the major energy source in Bangladesh and biomass utilisation systems represent a proven option for small to medium-scale decentralised electricity generation.
Biomass refers to all forms of living matter (i. e. plants and animals), as well as the corresponding derived material (e. g. plant residues, human wastes and animal dung) on earth. It represents only a very small fraction of the total mass of the planet, but in human terms, it is an enormous store of the energy supplied principally by the Sun and is being replenished continually. Biomass is a versatile source of energy; it can be used as a solid fuel or converted into liquid or gaseous fuels. The utilisation of biomass, as a substitute for fossil fuels, plays an important role in C02 mitigation. If grown in a sustainable manner, the production and utilisation of biomass create no net accumulation Of C02 in the atmosphere (Yokoyama et al. 2000). During the next century, biomass-energy is expected to offer cost-effective and sustainable opportunities with the potential to meet 50% of world energy demands and the requirement of reducing carbon emissions from fossil fuels (IEA Bioenergy, 2005). Biomass energy systems can play an important role of a country's or region's development, i. e. education, employment and economic growth through business expansion (i. e. earnings), direct and indirect effects on GDP, support of traditional industries, rural diversification, and community empowerment.
Decentralized small-scale electricity production is currently a common practice in many countries of the world, especially where a well-established electricity grid is absent. The employment of biomass fuels is a proven option for decentralized small to medium- scale electricity generation. Bangladesh is ideally suited for the development of small- scale biomass energy systems (EIA, 2003). No study has been carried out to assess the technological and economical feasibility of biomass electricity generation in Bangladesh. This study proposes sustainable biomass electricity generation model for decentralized electricity generation in Bangladesh, by exploring the net biomass availability, feasible technologies, economic plant size, cost of electricity generation, sensitivity parameters and environmental and socio-economic impact analysis.
2

1.2 Objectives of the Current Study The objectives of this research work are:
4. Study the primary energy and electricity situation in Bangladesh
-1, Study the renewable energy sources, their potential and current utilisation in Bangladesh
A. Estimate the annual rate of biomass generation and recovery and amount available for electricity generation in Bangladesh
4. Review the available biomass-to-electricity generation technology and modelling techniques
4. Selection of the feasible conversion technologies for Bangladesh
. 4. Developing correlations for efficiency and capital investment costs of these feasible technologies with electricity generation capacity
. '&. Estimation of the electricity generation potential for each type of feasible technologies in the country
,; L Estimation of the economic size of the biomass electricity plant and optimum value of other parameters for each type of feasible technology Assessing the biomass electricity plant economics and comparing it with those for diesel and dual-fuelled (biogas or producer-gas and diesel) based electricity generating plants
4. Performing the sensitivity analysis, to identify the parameters having the highest influence on the economics of the biomass electricity plant
VL Carrying out environmental and socio-economic impact analyses of the biomass electricity plant
1.3 Thesis Structures
Geographical information together with econometric and optimization techniques has been used in this research study. Bangladesh is divided into six d ivisions/reg ions, in these divisions there are 64 districts. Biomass availability of each district has been estimated for investigating the possibility of installing decentralised biomass electricity generation plants. Capital investment costs and conversion efficiencies of the feasible technologies are important for economical analysis. No well established correlations were found in the literature. Costs and efficiency correlations with the plant electricity generating capacity have been developed for different types of prime mover using various biomass fuels. Economic size of the plant has been estimated for maximum profitability. Economic size, area of biomass collection, number of biomass electricity plants have been estimated for each district for all types of feasible technologies. Later, economical analysis, sensitivity, environmental and socio-economic studies have been performed. Matlab software has been employed for this study.
The thesis is divided into ten chapters and six appendices. Chapter 1 is the general introduction of the thesis which describes the background, objectives and thesis structure.
Chapter 2 reviews the energy situation in Bangladesh. Issues related to primary energy consumption and reserves, fuels and technology used for electricity generation,
3

electricity consumption, and renewable energy utilisation are presented. Chapter 3 reviews the technologies available for converting biomass into electricity. A brief description of each conversion technology, which includes principle of conversion, technology, scale of biomass electricity generation plant, advantages and disadvantages are presented.
Chapter 4 reviews the biomass energy systems modelling techniques. Existing modeling practices both in Bangladesh and in other countries have been reviewed and grouped. At the end of this chapter, techniques, which would be used to develop sustainable biomass electricity modeling for Bangladesh, have been discussed.
Chapter 5 presents the methods adopted for estimating the annual rate of biomass generation and recovery in Bangladesh. The annual amount of biomass available for electricity generation has been estimated for the whole country and for each individual district. Seasonal availability and storage options of the biomass resources have been discussed. Biomass savings through efficiency improvements of the traditional uses of biomass have also been presented.
Chapter 6 deals with discovering the feasible biomass energy technologies for Bangladesh. An in-depth analysis of the feasible technologies has been presented. Suitability and groupings of the available biomass resources has been performed for each type of the feasible technologies. Efficiency and costs correlations have been developed after examining the biomass electricity plants, especially in the developing countries. Finally, electricity generation potential for the whole country has been presented - for each type of the feasible technologies using different types of biomass.
In Chapter 7, a generalised profitability equation has been derived for all types of feasible technologies. Optimisation technique (i. e. maximising the profitability) has been applied to estimate the economic size of the biomass electricity plant.
Chapter 8 presents the economical analysis of the biomass electricity plants. Biomass electricity plant economics have been compared with those for the dual-fuelled systems and diesel generation systems. Sensitivity analyses have also been performed.
Chapter 9 presents the environmental and socio-economic impact study of the proposed biomass electricity plants. Impacts of the solid, gaseous and liquid effluents, of a biomass electricity plant, on the environment, have been investigated. The greenhouse gas emission savings potential has been estimated. In the second part of this chapter, various socio-economic benefits of the biomass electricity plants have been presented with examples of the installed plants in neighboring country.
Finally, Chapter 10 presents the conclusions of this research work, and recommendations for future work.
Of the appendices, Appendix A explains the glossary of terms used in the thesis. Appendix B describes outlines of the developed computer program and the procedures to be followed to use the attached CD-ROM, for district wise biomass electricity analysis in Bangladesh. Appendix C presents district wise biomass generation and Appendix D presents the capital investment cost and conversion efficiency of the installed biomass electricity plants in different parts of the world. Appendix E presents district wise results of biomass electricity analysis in Khulna division. Appendix F shows biomass energy and electricity potential by division.
4

CHAPTER 2 ENERGY OVERVIEW OF BANGLADESH
2.1 Bangladesh: An Introduction The People's Republic of Bangladesh, a south Asian country, is located between 23034'N and 26038'N latitudes and 88001'E and 9204VE longitudes (BBS, 2002). Bangladesh is bounded by India in the north, east and west and by the Bay of Bengal in the south, and shares a small border in the east, with Myanmar (Burma) - see Figure 2.1. The capital city is Dhaka. The country is divided into 6 divisions (regions): Dhaka, Chittagong, Rajshahi, Barisal, Sylhet and Khulna. In these regions, there are 64 districts (see Figure 2.1).
The total area of the country is 1.44 x 10¹¹ M2 (FAOSTAT, 2004). In 2003/2004, the population of Bangladesh reached 138.1 million (i. e. 959 people/kM2), making it the most densely-populated country in the world. 80% of the total population resided in rural areas. The annual population growth rate in 2003/2004 was 1.7% (BBS, 2002; World Bank, 2005).
The climate in the country follows a four-season cycle: winter (December-February), summer (March-May), monsoon (June-September) and autumn (October-November). In winter, the average maximum and minimum temperatures are 26.5"C and 13.5"C respectively, whereas the corresponding respective values in summer are 33.311C and 22.2*C (SDNBD, 2005a). Most of the rainfall occurs during the monsoon season. Annual rainfall ranges from 160 cm to 200 cm in the west, 200 cm to 400 cm in the south-east and 250 cm to 400 cm in the north-east (SDNBD, 2005a). In 2002/2003, adult (aged 15 and above) male and female literacy rate were 50.3% and 31.4% respectively (World Bank, 2005).
Bangladesh's economy grew at an average annual rate of 4% in the 1980s and 5% in the 1990s (EIU, 1999). The higher rate of growth in the 1990s has often been attributed to the rapid liberalization of the economy in the early years of the decade. Sectoral growth also improved in the 1990s with an annual average rate of 7% compared with 2% in the 1980s. Export growth followed a similar trend; reaching an annual average rate of 16% in the 1990s, compared with 7% in the 1980s (EIU, 1999). The sectors of the country's economy are agriculture and forestry, fishing, mining and quarrying, manufacturing, construction, electricity and gas, transport and communication, wholesale and retail trade, financial services, and other services (e. g. tourism, real state business).
During the last five years, Bangladesh averaged over 5% growth in the gross domestic product (GDP). In the financial year 2003/04, GDP grew at an average rate 5.5% - an increase of 20% than the previous year (Global Insight, 2005). The agriculture and forestry sector (including crop, fisheries and livestock), the single largest contributor to GDP growth - accounted for 31.5% of GDP in 1998/99, down from 34.5% in 1991/92. The crop sub-sector contributed 22.8% of GDP in 1998/99 compared with 27.9% in 1992/93 (EIU, 1999).
5

NFPAL' 91 0-
---IBANGLADESH Panchag1k; P Ira Kisharigarit Kjoch
rgaon 0f Gu; "i
N Pam ilpharn 0 r RA*46LAM saxout
+01NDIA III '*% Di pur R-4,.
OTUM
Gaibarýa 0
rip,
-2S c, 9.1aipur Hat OSherpur na Chhatak 26-
Farralka r Fau syl l3o'gr. 'P
ýýR si %mIansingh pu
0Na ar. )
It Nalor Swaiga"i t
Ralshat K
OTNVM I
I/N DI Aý t..
imb J,
a& -24
mpur Pabne Brah Na INDIA
0- Kustjýp MKganj, -
r7 ý4 - garwe
ram aýka ca) .0 ' Ra$)an 11 Aipl % <) Narayangarl
Jhor*, da 0
Cconilla L
surdwan r/ r /A Pal,,
L Madar 01(he BwVson/ý.
r"PUr -23-
It KHLAHIT
; SalKhulna aBn. SRI i
.0 --ý' t0aV Kdkata Chaina PI Raiewmal
(Calcutta) hall i (3 Re, n5jpur'
BR 16 at Chit 9
Diamond roan
Hill"
Harbour
Sa mao
sab IN Kutubalis 1. Gichan
0 M111fartaff I.
sJ GO)e 'S
0 National capital 0 ProvIncial caprW NIYANNIAR
0 Town. villeas B
.40FBENGAL4 Major airport Intemallonal boundary OVA ProwcIall boundary Main road
0 2's 60 7ý6 100 km t vaLvaoxv w4sap"w~ admoo"Wwwww
Railroad r--1 0 26 so 75 mi wo"ý vy ra Lmma Idoms
M- W 2711 A. 2 UNffrf) NAT"S Jýy 2CO4 CW bpi^ -%. A. *
Figure 2.1 Location, regions and districts of the People's Republic of Bangladesh (UN, 2004)
The national currency of the country is Taka, its exchange rate is, 1 US$ = Taka 63.945 (as on 06/07/2005). Per capita gross national income (GNI) is in the increasing trend: in 2003/2004 the per capita GNI was US$400.00; whereas, it was US$ 380.00 and US$ 370.00 in 2002/2003 and in 2001/2002 respectively (World Bank, 2005). Inflation rates during financial years 2002/2003 and 2003/2004 were 5.67% and 6.10% respectively (Global Insight, 2005). Total imports amounted to US$ 9,720 million and US$ 10,190 million, in 2002/2003 and in 2003/2004 respectively. Export earnings rose by 1.63%
6

during 2002/2003 to US$ 6,850 million, and it was US$ 7,350 million in 2003/2004 (Global Insight, 2005). Agriculture and the garments making industry are the two dominant sectors of export earnings.
2.2 Commercial Primary Energy Resources and Use
Indigenous commercial primary energy resources of Bangladesh consist of the known reserves of natural gas and coal, and a limited hydro-electric capacity. The entire reserves of exploitable indigenous fossil-fuels, with the exception of the coal reserve, are located in the eastern part of the country. This results in a gap of commercial- energy supply between the east and the west. Natural gas is the main commercial primary energy source of Bangladesh.
Total commercial primary energy consumption in Bangladesh increased at an average rate of 0.74 million tonnes of oil equivalent (mtoe) per year between 1992 and 2004 (see Figure 2.2). The trend is mainly due the increased consumption of natural gas and imported oil. The contribution of hydropower to total commercial primary energy consumption is almost constant. At the end of year 2004 and 2003, the total national commercial primary energy consumption was 16.8 and 15.8 mtoe respectively (BP Amoco, 2005). In 2004, the shares of natural gas, oil, coal and hydro-electricity were 70.8,25,2.4 and 1.8%, respectively (BP Amoco, 2005). Per capita annual energy consumption of commercial primary energy (i. e. fossil fuels and hydro electricity) in Bangladesh, in 2003, was 0.114 tonnes of oil equivalent (toe) (BP Amoco, 2005). This is one of the lowest in the world, compared with a world average of 1.556 toe/capita/year (BP Amoco, 2005; World Bank, 2004). In 2002, the average consumptions for low income countries and south Asian countries were 0.493 and 0.468 toe/capita, respectively (World Bank, 2004).
18
16 D Coal 9 DOM EM Natural gas j 14 00 Hydro-electricity ýO 0. E 12
0 10
8
E .1 6
0E4 E 0
2
0 1992 1993 1994 1995 1996 1997 1998 1999 2000 2001 2002 2003 2004
Year
Figure 2.2 Commercial primary energy consumption trends in Bangladesh (BP Amoco, 2005)
7

2.2.1 Natural Gas
Natural gas plays an important role in the growth of the national economy. 84.5% of power generation (BPDB, 2005) and the whole of the urea fertilizer manufacturing are based on natural gas. Up to June 2004,22 natural gas fields have been discovered in Bangladesh (MOF, 2005). The total estimated amount of gas within these fields is 804.71 billion M3, of which 580.78 billion M3 is believed to be recoverable (MOF, 2005). Up to June 2004, the cumulative total amount of gas produced was 157.03 billion M3 (see Table 2.1). So, as of June 2004, the net recoverable gas reserve is 423 billion M3.
Government of Bangladesh (GOB) allowed the participation of international oil companies in the exploration and development of the hydrocarbon sector. The total area of Bangladesh has been divided into 23 zones for rapid and easy exploration. At present, many international oil companies (e. g. Shell, Tullow, Cairn and Texaco) are exploring in different zones under prod uction-sharing contracts (MOF, 2005).
Power plants, fertiliser factories, other industries (e. g. brick factories, tea processing plants, steel mills and textile factories), commercial organisations (e. g. offices and business centre) and the domestic sector are the end user of natural gas in the country. Sector wise consumption of natural gas is shown in Figure 2.3.
Natural gas reserve and production (billion M) Name of the gas field Total estimated Recoverable Cumulative Net
reserve reserve production recoverable Bakhrabad 42.447 29.704 17.858 11.846 Habigonj 145.520 109.076 32.340 76.736 Jalalabad 33.839 23.701 5.401 18.300 Kailashtila 77.022 53.915 9.274 44.641 Meghna 4.842 3.370 0.933 2.437 Narshingdi 8.693 6.088 1.427 4.661 Rashidpur 56.690 39.672 9.189 30.483 Sylhet 19.369 13.564 4.915 8.649 Sangu 29.195 24.013 7.748 16.265 Salda Nadi 4.701 3.285 0.987 2.298 Titas 207.421 145.209 63.694 81.515 BeaniBazar 6.881 4.814 0.777 4.037 Fenchuganj 11.440 8.014 0.024 7.990 Begumgonj 1.331 0.934 - 0.934 Kutubdia 1.841 1.303 - 1.303 Semutang 6.428 4.248 - 4.248 Shahbazpur 18.831 13.167 - 13.167 Bibiana 89.056 67.989 - 67.989 Moulovibazar 12.714 10.194 - 10.194 Chatak 19.171 13.422 0.750 12.672 Kamta 2.039 1.416 0.597 3.084 Feni 5.239 3.681 1.119 0.297 Total 804.708 580.779 157.033 423.745
Table 2.1 Natural gas fields of Bangladesh (MOF, 2005)
8

Other industries 18.94%
Fertillser tactories 21.75%
Figure 2.3 Consumption of natural gas in 2003/04 (MOF, 2005)
2.2.2 Oil
Bangladesh's only oil deposits, discovered in December 1986, located at Haripur, in the district of Sylhet, has an estimated amount of total reserve of 1.4 million tonnes of which 0.84 million tones is believed to be recoverable. Up to July 1994, the cumulative total amount of crude oil produced was 0.0784 million tonnes of crude oil (REIN, 2003a). Since then, oil production ceased because of the reduction of pressure in the field and influx of water in the oil zone. In Bangladesh, oil is used mainly as a transport fuel, for some electricity generation and for industrial heating.
2.2.3 Coal
Substantial amount of coal reserves, in 7 fields, have been discovered in the north- western part of the country - see Table 2.2. The major coal deposits are at: Jamalgonj (in the Jaipurhat district), Baropukuria (in the Dinajpur district) and in Khalashpir (in the Rangpur district). The total amount coal reserve is estimated at 1,756 Mtonnes (REIN, 2005a).
Mining work has started only at Baropukuria. Baropukuria coal field was discovered in 1985 by Bangladesh Geological Survey Department. Coal extraction from Baropukuria deposit, at an estimated rate of 1 Mtonnes/year, is expected to commence in 2004/2005.70% of extracted coal will be used in a 250 MW coal-fired power plant (MOF, 2005; REIN, 2005a).
Coal field Depth of coal layer (m)
Type of coal Area (kM2)
Reserve (Mtonnes)
Jamalgonj, Jaipurhat 640-1158 Bituminous 11.66 1053 Baropukuria, Dinajpur 118- 506 Bituminous 5.25 300 Khalashpir, Rangpur 257- 451 Bituminous 5.75 400 Kuchma, Bogra 2381- 2876 Bituminous - - Dighirpara, Dinajpur 250 Bituminous 15.00 Phulbari, Dinajpur > 150 Bituminous - - Takerhat, Sunamgonj 45- 97 Lignite 3
Table 2.2 Coal fields of Bangladesh (REIN, 2005a)
Domestic Commercial 11.65% 1.15%
Power plants 46.51 %
9

In 1997, BHP Minerals (a US-Australian Company) - discovered a coal reserve at Phulbari in the Dinajpur district. Later, BHP Minerals transferred the rights to develop the coal field to Asia Energy Corporation (AEC) Bangladesh Ltd., a subsidiary of AEC, Australia. A preliminary study, conducted by AEC, concluded that coal extraction from Phulbari coal-field is technically and economically feasible. In 1998, an agreement was signed between the GOB and AEC to develop the field and extract the coal. AEC proposed to set up 2100 MW coal-fired power-generation facility. According to AEC plan, 2.9 Mtonnes of coal will be extracted per year to fuel a 700 MW power plant. After 7 years, the coal production will be increased to 9 Mtonnes/year and power plant capacity will be enhanced to 2100 MW (REIN, 2005a).
2.2.4 Peat
In Bangladesh, deposits of peat occur at shallow depths in different low lying areas of the Faridpur, Madaripur, Khulna, Sylhet, Maulavibazar, Myrnensing, Rangpur, Barishal, comilla and Dhaka districts. The total peat reserves have been estimated at 170 Mtonnes (REIN, 2003b).
Peat remains under water for about 6 months of the year, so drying the extracted peat is time consuming and involves cost. In 1985/86, a feasibility study for the extraction and utilisation of the peat resources of Bangladesh was carried out by M/S. SNC W. P., UK under the Canadian International Development Agency (CIDA) technical assistance programme. The study recommended the setting up of a pilot plant for the extraction and briquetting of peat and the installation of a 10 MW peat-fired power plant. Accordingly, peat utilisation and demonstration project was implemented by Petrobangla in the Madaripur district. During March-June 1993, about 300 tonnes of peat was extracted. Further 2000 tonnes of peat was extracted in the following session (REIN, 2003b). Efforts were made for marketing peat briquettes as domestic and brick- making fuel. However, the results were not encouraging and extraction was assessed as economically non-viable. Nevertheless, with the rise of the prices of fossil fuels, peat may prove viable in the future. In some rural areas, locally extracted peat is used for domestic cooking and in small industries.
2.2.5 Hydro-power
Due to relative flatness of the country, Bangladesh has got a limited hydro-power resource. The only 230 MW hydroelectric power plant, Kaptai Dam, located on the river Karnaphuli, at kaptai, in the Chittagong district, was commissioned on 30 March 1962 (REIN, 2003c). It has a catchment area of 11 X 103 kM2 and a capacity of 6.5 x 10⁹ M3. The plant is operated by Bangladesh Power Development Board (BPDB), and represents approximately 5% of the total installed capacity in 2003 (BPDB, 2005). In addition to power generation, the dam was supposed to provide additional benefits in terms of flood control, irrigation and drainage, navigation and enhanced forest resource harvesting. Most of these objectives have been served in various degrees except irrigation and drainage. Later, commercial fish farming and recreation activities have been introduced in the project.
10

2.3 Electricity Generation and Consumption In 1947 (i. e. the time of partition of the Indian sub-continent), power generation and distribution in Bangladesh (i. e. formerly East Pakistan) were undertaken by a number of private companies. The power supply to the then 17 provincial districts of East Pakistan was only within townships (with no transmission system). The generation voltage was 400 volts. The total generation capacity of the power utility companies put together was only 7 MW. In 1948, the Electricity Directorate was established in order to plan and improve the power supply situation. In 1959, the Water and Power Development Authority (WAPDA) was created, and in 1960 Electricity Directorate was merged with WAPDA to give more autonomy for the development of the basic infrastructure. During the 1960s, relatively higher capacity oil and gas fired plants were built in the Dhaka, Chittagong and Khulna districts; and the Kaptai Dam was constructed. The installation of Dhaka-Chittagong 132 kV transmission line was also completed during that period (REIN, 2003d; BPDB, 2005).
After the emergence of Bangladesh as an independent state, on the 16 December in 1971, BPDB was established in 1972 as a public organisation to boost the power sector with the responsibility for power generation, transmission and distribution of electricity throughout the country. During the 1970s, the GOB emphasized the importance of rural electrification for achieving a desirable social upliftment in the country. Organisational changes were made in the area of transmission and distribution of power in the country. In 1977, the Rural Electrification Board (REB) was created and in 1991 the government established the Dhaka Electric Supply Authority (DESA) to operate and develop the distribution system in and around Dhaka and bring about improvements in customer service, collection of revenue, and lessen the administrative burden on BPDB. To increase the efficiency of the distribution system and for better customer service, GOB implemented different reform programme. As a part of such programmes another two company the Power Grid Company of Bangladesh (PGCB) and the Dhaka Electric Supply Company (DESCO) were established in 1996 and 1997 respectively (BPDB, 2005). The distribution network area of DESA has been re- defined, with some area being allocated to DESCO for better management. On December 2002, all distribution networks were transferred to PGCB, the sole authority for operation, maintenance and extension of the distribution network of the country (MOF, 2005).
In order to develop the country's power sector, power generation and distribution was opened to both national and foreign private investments in 1996, followed by the formulation of 'Private Sector Power Generation Policy of Bangladesh' by the GOB. The involvement of Independent Power Producer (IPP) was made effective after October 1996. The country's first private power plant (with a 110 MW installed capacity) under private sector started contributing power to the national grid from October 1998 (MOF, 2005; BPDB, 2005).
2.3.1 Electricity Generation
In 2003, the total installed electricity-generation capacity was 4.68 GW and firm generation capacity was 3.7 GW (BPDB, 2005). Different types of power plants generate electricity and synchronize it with the national grid. In addition, there are some isolated diesel-engine power stations at remote areas and islands. The distribution of the total installed capacity of both BPDB and IPP according to plant type and fuel type
11

are shown in Figure 2.4. In 2003/2004, the total electricity generated was 20.061 TWh, of which 12.583 TWh was generated by the public sector (MOF, 2005). Per Capita electricity generation in 2002/2003 and 2003/2004 were 144 kWh and 154 kWh respectively (MOF, 2005).
The Jamuna-Padma-Meghna river system divides Bangladesh into two parts; east and west (see Figure 2.1). All natural gas fields are situated in the eastern part of the country. In this part, electricity is generated in gas-fired thermal power stations and a small percentage through hydropower. In the western part, imported liquid fuels are used for the generation of electricity. The fuel cost per kWh of the electricity generated in the western part is much higher than that in the eastern part. Low cost electricity, generated in the eastern part, is transferred to the western part through the 230 kV East-West Inter-connector transmission line. BPDB owns and operate the high voltage transmission network throughout Bangladesh. The transmission network is 5,976 km long, comprising 230 and 132 kV line. The total numbers of grid sub-stations in the country are 72,10 of them are 230 kV and 62 are 132 kV, with a total capacity of 8,827 MVA (BPDB, 2005).
Diesel Engines Combined Cycle Gas 5.09% Turbines 21.15 %
Steam Turbines
Hydro 47.61 %
4.91 %
Gas Turbines 21.24%
(a) According to plant type
Furnace Oil Hydro Diesel
6.2% 4.9% 4.4%
Natural Gas 84.5%
(b) According to fuel type
Figure 2.4 Installed Capacity of power plants in 2003 (BPDB, 2005)
12

Electricity generated from different power stations is distributed by BPDB, DESA, DESCO and REB. BPDB is responsible for the distribution of electricity in most areas of the country except Dhaka City and some rural areas. DESA and DESCO are responsible for distribution of electricity in Dhaka city, whereas REB is responsible for the remaining rural areas.
2.3.2 Electricity Consumption
Industrial and domestic sectors are the main consumers of the electricity (BPBD, 2005). Some industries (both small and large) in Bangladesh generate their own power. - Commonly, gas engines are used for this purpose. Only 20% of the population (25% in urban areas and 10% in rural areas) are connected to grid electricity, with the vast majority (i. e. 80%) being deprived of conventional electricity (EIA, 2004). With 80% of the total population of the country residing in rural areas, rural electrification is very important for the overall economic development of Bangladesh. REB has been supplying electricity to rural areas through a number of Rural Electrification Societies, known as 'Polly Biddut Samity' (PBS). As on June 2004,67 of these were operating commercially in the country. There are 53,94,736 customers, in 41,125 villages. This required the installation of distribution lines with a total length of 1,73,125 krn and 328, 33/11 kV grid substations (REB, 2004).
2.4 Renewable Energy Utilisation
In the context of Bangladesh, the main renewable energy resources are solar energy, biomass and wind power. There is some potential of mini/micro hydropower, which could meet some of the local needs of electricity. No major studies have been undertaken to explore the potential of tidal, wave and ocean thermal energy resources. In Bangladesh, many academic institutions, government departments, non- governmental organisation and private companies, such as BPDB, REB, Dhaka University (DU), Bangladesh Institute of Technology (BIT), Bangladesh University of Engineering and Technology (BUET), Bangladesh Atomic Energy Commission (BAEC), Local Government Engineering Department (LGED), Bangladesh Centre for Advanced studies (BCAS), Bangladesh Council of Scientific and Industrial Research (BCSIR), Bangladesh Rice Research Institute (BRRI), Bangladesh Rural Advancement Committee (BRAC), Rahim Afroaz and Grameen Shakti (GS) are involved in R&D programme related to renewable energy technologies.
The geographical location of Bangladesh is ideal for tapping solar energy effectively. Solar photovoltaic (PV) systems are gaining acceptability as a technology for electricity generation in remote and rural areas. Recently, there have been three substantial PV installations in Bangladesh for rural electrification. These are the REB 62 kWp solar electrification project in 4 isolated islands in the Narshingdi district; the Grameen Shakti and BRAC projects, where 42,000 and 10,456 numbers of small solar PV systems has been installed respectively in rural households (REIN, 2005b). A number of solar thermal heating systems have also been developed and fabricated in the country for research, development and demonstration purposes.
Biomass, unlike other renewable resources, is a versatile source of energy. It can be used as a solid fuel or converted into liquid or gaseous fuels. Biomass-to-power
13

technologies convert biomass fuels to heat and electricity using equipment similar to that used with fossil fuels. An agriculture-based country like Bangladesh has huge biomass resources. It is estimated that in Bangladesh, biomass (mainly agricultural residues, fuel wood and animal waste) satisfies 60% share in total energy consumption of the country (REIN, 2005e). 29.7 billion m3/day of biogas can be generated from the 220 million kg/day cattle dung produced by 22 million cattle heads, 0.525 million m3/day can be generated from poultry litter and 0.058 million m3/day can be generated from water hyacinth (Sarkar et al. 1999). LGED and BCSIR installed biogas plants in different parts of the country. Small scale biomass-to-electricity generation plants have been installed in the country. Annual amount of biomass generation, consumption and its availability for electricity generation is yet to be estimated.
Wind mapping for the country is yet to be completed. Study reveals that enormous prospect for harnessing power from the wind exists in the coastal regions of the country (Sarkar et al. 1999). Hybrid generation of electricity, using other energy sources as complementary to wind energy, has now been given some attention. This could be suitable for localised small grid systems or battery charging, especially in isolated areas with low wind regimes. A 10 MW wind power electricity generating project is being implementing by BPDB at Muhuri Dam, in the Feni district (REIN, 2005c).
The only hydroelectric power plant in the country is the 230 MW Kaptai Dam operated by BPDB. Several studies have been carried out by LGED, BPDB and Bangladesh Water Development Board (BWDB) to assess the potential and viability of small hydro- power utilisation in the country (REIN, 2005d).
2.4.1 Wind Energy
Little systematic wind speed studies have been undertaken in the country. Bangladesh have a 724 krn long coastline and many small islands (e. g. Saint Martin, Kutubdia, Swandip, and Hatia) in the Bay of Bengal, where strong south-westerly tradewind and sea-breeze prevail in the summer months and there is gentle north-easterly tradewind and land-breeze in the winter months.
Bangladesh Meteorological Department (BMD) is measuring wind speed at different locations in the country at low heights for weather forecasting purposes, which is not sufficient for assessing the potential of harnessing wind power. A seasonal variation of wind speed prevails in the country, with a strong potential during April to September, and very weak potential during the rest of the year. Between June 1994 and June 1995, BIVID measured wind speeds at a height of 20 m at Patenga in the Chittagong district, the most potential site for wind power harnessing in Bangladesh - see Table 2.3 (Sarkar et al. 1999).
More recently, different studies have been undertaken to assess the wind energy resource of the country. In one such project, BCAS in collaboration with LGED and the UK's Energy Technology Support Unit (ETSU) jointly established the Wind Energy Study (WEST). The study was financially supported by the British government and approved by Aid Management Office, Dhaka (AMOD) in September 1995. ETSU provided BCAS with the necessary technical assistance. LGED helped in the installation of the wind monitoring masts, and facilitated the collection and dispatch of data cards from the monitoring sites to BCAS headquarters at Dhaka on regular basis. After continuous measurement through 1996 and 1997 at 7 selected sites (see Figure 2.5), the final report was published in January 1998 - see Table 2.4 (REIN, 2005c).
14

Year Month Average wind speed (m/S)
1994 June 8.25 July 7.81 August 7.48 September 6.93 October 6.70
1995 January 6.43 February 6.45 March 7.37 April 7.92 May 8.47 June 1-10 8.69
Table 2.3 Wind speed at Patenga (at 20m height) (Sarkar et al. 1999)
ZIANGLADWjýý
Day of Nngol
-- -i
Nar"Al patem. Cher Fwnon
Ku*mu Kutubdia Cox's Bazw
Teknof
Figure 2.5 Coastal regions: prospective area for wind energy utilization
Table 2.4 shows that the average annual wind speed measured in 7 coastal stations range from 2.94 m/sec to 4.52 m/sec. The WEST study provides useful and important information. The final report recommended the following wind-energy utlisation R&D schemes (Islam, 2002b):
41ý A pilot wind turbine plant may be set up and be linked with the existing 250 kW diesel power station of BPDB at Kutubdia, to study the overall performance of a hybrid wind-diesel system in an isolated local grid.
'46 A demonstration wind power generating plant at Kuakata may be set up and connected to the existing grid to study the performance of such a system.
, A. A study may be undertaken to asses the performance of wind pumps for lifting water for drinking and crop irrigation at Kutubdia island.
4. The present wind map of the country may be updated by joint efforts of the BIVID and other interested groups, to estimate the wind energy potential.
GTZ of Germany in collaboration with REB of Bangladesh also conducted a parallel study. Wind speeds at Patenga, at a height of 20m are shown in Table 2.5. Wind speed
15

measurements by WEST (see Table 2.4) and GTZ (see Table 2.5) confirmed that wind speeds are much higher in summer months (due to monsoon wind) than in winter months.
For estimating the wind energy potential, long-term systematic wind speeds data is required. Under the Sustainable Rural Energy (SRE) programme, LGED in collaboration with BUET and BIT Chittagong, has started Wind Energy Resource Mapping (WERM) project. The study alms at assessing wind energy potential of the country by systematic observation of wind regimes in initially 20 different suitable locations, including the Chittagonj Hill Tracts region, over a longer period of time (Islam, 2002b; REIN, 2005c).
Year Month Monthly - average wind speed (in m/s) at the monitoring stations Patenga Emes Teknaf Noakhali Char Kua- Kutubdia
Bazaar Fassion' kata June 8.75 July 5.87 5.42 5.77
August 5.32 5.33 4.90 4.70 5.20 (4.60) 5.70 1996 September 3.36 3.69 3.46 2.94 3.34(2.80) 3.77 3.58
October 3.20 3.74 3.30 2.83 3.70 (3.07) 2.18 3.98
November December
2.61 2.97
2.93 1.78
2.29 1.44
1.91 1.35 3.09 (2.38)
1.98 3.35
3.23 3.38
January 3.25 2.33 1.99 1.31 2.80 (2.19) 3.18 3.67 February 2.66 1.99 1.90 1.90 2.69(2.02) 3.37 3.29 March 3.13 2.42 2.26 2.38 3.54(3.09) 4.84 3.53 April 2.88 1.84 1.65 2.25 3.29(2.28) 4.93 3.11
1997 May 4.96 3.97 3.09 3.99 4.81(3.71) 6.28 4.89 June 5.83 4.64 3.26 5.00 5.76(4.42) 7.31 5.90 July 5.67 4.80 4.33 4.92 5.22(3.94) 7.34 6.17 August 5.13 4.31 4.03 3.85 5.17(4.01) - 5.34 September - 2.96 1.83 2.77 3.08(2.20) - 3.97
Annual average 3.95 3.34 2.94 2.96 4.07(3.21) 4.52 4.21 a values between brackets represent corresponding values measured at 10 m height
Table 2.4 Monthly average wind speeds at 25 m height at 7 coastal stations measured by WEST (REIN, 2005c)
Month Year 1995 1996
January - - February - - March 6.7 - April 7.2 - May 7.7 8.0 June 8.1 6.9 July 8.0 8.4 August 7.4 3.5 September 6.8 3.9 October 6.2 3.2 November 4.4 2.6 December 4.2 2.2
Table 2.5 Monthly average wind-speeds (m/s) at Patenga measured by GTZ (Islam, 2002b)
16

2.4.1.1 Present Armlication
BPDB is being implementing a 10 MW grid connected wind energy-based electricity generating plant at Muhuri Dam, in the Feni district. Also, the installation of 0.90 MW pilot scale grid connected wind energy-based electricity generating plant is being planned by BPDB, at Moghnama Ghat in the Cox's Bazar district (REIN, 2005c; BPDB, 2005).
Small-scale wind turbine-generators have been installed by GS and BRAC in the coastal regions of the country. GS installed 2 such types at Chakoria in the Chittagong district: 300 W unit from Southeast Air Module, USA and 1 kW unit from LMW, the Netherlands. BRAC installed 11 wind turbine-generators in various coastal sites. These are DC operation type systems supplying power to some target groups to improve their standard of living (Hossain, 2005).
Due to seasonal variation of wind speed, wind power generation and its application has certain limit. However, most of potential sites for wind power harnessing in Bangladesh are situated in coastal regions, which are generally not connected to the national grid. So, wind-solar-diesel or wind-diesel hybrid power generators are more useful in these regions. 4 hybrid power stations (combination of wind turbines, diesel generator and solar PV) have been installed by GS in the coastal areas of the Barguna district. Three of these have a capacity of 1.5 kW while the fourth has a capacity of 10 kW (GS, 2001). Under the SRE programme, LGED installed 10 KWp wind-solar hybrid systems at St. Martins island (an island in the Bay of Bengal in the Chittagong district) - see Figure 2.6 (a). This is largest hybrid project in the country and was financed by UNDP. The generated electricity from the hybrid system is supplied to the hotels, markets and laboratory (REIN, 2005c).
LGED and BCAS have been working on assessing the viability of wind pump in Bangladesh. LGED installed a number of wind pumps, with a tower height of 8.4 m, at a different location, including Tangail, Kustia and Cox's Bazar districts (REIN, 2005c). Each of these indigenously manufactured wind pumps has a theoretical power output of 385 W at a wind speed of 4 m/s. BCAS installed a wind pump designed by the Intermediate Technology (IT) Group of the UK and manufactured in Pakistan (Hossain, 2005). The wind pump was located in an agricultural field at Patenga in the Chittagong district. The tower height is 12.5 m and the rotor has 12 blades - see Figure 2.6 (b).
Figure 2.6 Wind energy utilisation in Bangladesh
17
(b) A wind pump set installed by BCAS at Patenqa, Chittaqonq
(a) 10 kW,, wind-solar hybrid power system in St. Martin Island

Daily water delivery has been found to vary, and the average daily water output between November and January was about 8 M3. It appears that suitably designed wind pumps can be extensively used for irrigation of vegetables in winter months in the coastal region. Also it is possible to utilise them to draw underground fresh water for drinking purposes in coastal islands (Hossain, 2005).
2.4.2 Solar Energy
Bangladesh is ideally located for tapping solar energy effectively. Daily solar radiation varies from 3 to 6 kWh/M2. Maximum solar radiation is available during March-April and minimum radiation occurs during December-January. Solar radiation data in Dhaka City is shown in Figure 2.7. Being largely a flat country, this data may be taken as representative of the whole of Bangladesh (Sarkar et al. 1999). Monthly average solar radiation in different divisions, reported by CES (2005), is shown in Table 2.6. Solar thermal energy has traditionally been utilised in households and industrial activities in Bangladesh since early days (e. g. drying of crops and fish and production of salt from sea-water).
Currently, BUET, BAEC, BCSIR, DU, BPDB, GS, BRAC, REB, and a few other organisations are continuing their research to improve the performances of solar energy utilisation systems and expand their use to new application areas (e. g. solar water heaters and solar cookers).
6
Im -M
(m ý 2il L) :3 :3
LL
Month
Figure 2.7 Monthly average daily solar radiations for Dhaka city (Sarkar et al. 1999)
18

Month Monthl Dhaka
y average dail Raishahi
-T y radiation (in 7W-h/m
Sylhet Bogra ) at-the stated division
Barishal Jessor January 4.03 3.96 4.00 4.01 4.17 4.25 February 4.78 4.47 4.63 4.69 4.81 4.85 March 5.33 5.88 5.2 5.68 5.30 4.50 April 5.71 6.24 5.24 5.87 5.94 6.23 May 5.71 6.17 5.37 6.02 5.75 6.09 June 4.80 5.25 4.53 5.26 4.39 5.12 July 4.41 4.79 4.14 4.34 4.2 4.81 August 4.82 5.16 4.56 4.84 4.42 4.93
September 4.41 4.96 4.07 4.67 4.48 4.57 October 4.61 4.88 4.61 4.65 4.71 4.68 November 4.27 4.42 4.32 4.35 4.35 4.24 December 3.92 3.82 3.85 3.87 3.95 3.97
Annual Average 4.73 5.00 4.54 4.85 4.71 4.85
Table 2.6 Monthly average daily solar radiation recorded at different divisions of Bangladesh from 1988 to 1998 (CES, 2005)
In Bangladesh, PV power systems are being accepted gradually, but the slow progress achieved is due to their high initial capital cost. In 1981, BPDB installed 55 solar powered warning lights on 11 towers of the East-west Interconnector at Aricha in the Dhaka district (WEC, 2005). In 1983, to identify the marine routes at night, Bangladesh Inland Water Transport Authority (BIWTA) installed 125 solar-powered beacon lights (WEC, 2005). In 1988, BAEC installed the solar photovoltaic pilot project at Swandip Island (in the Bay of Bengal) for powering: beacon light on top of a watchtower; refrigerators in a veterinary hospital for storing life-saving vaccines; and a microphone and lighting in a local mosque (Islam, 2002a). Presently, BAEC is operating 2 solar PV water pumps: one at Savar in the Dhaka district; and another in the Moulovibazar district, to supply water in agricultural field. In these PV systems, there is no battery for storage of energy (Islam, 2002a). The Centre for Energy Studies (CES) of BUET is carrying out different studies on solar PV utilisation. Low-cost improved lanterns (capacity of 5/7.5/10 watt) for home lighting in rural areas is being designed and tested at the Renewable Energy Research Centre (RERC) of DU (REIN, 2005b).
2.4.2.1 Solar Thermal Systems
A variety of solar thermal systems have been developed and fabricated in the country, but these have not been commercialized. Examples of such systems include solar cookers, solar water heaters and solar dryers (Sarkar et al. 1999).
Solar cookers. Box type and parabolic reflector type solar cookers have been fabricated and tested in BCSIR and DU. Employing solar cookers is possible in Bangladesh for the 8 months of the year (i. e. October-May) when solar radiation is high. The remaining 4 months of the year (i. e. June-September) are often cloudy (Hussain et al. 1997). For cooking all over the year, an auxiliary fuel/energy source will be needed. In RERC of DU, a box type solar cooker has been developed where solar as well as electrical energy can be used as the source of energy. During bright sunshine hours the cooker is operated by solar energy and during the periods of low radiation intensity electricity of few watts is used as an auxiliary source (REIN, 2005b).
19

One parabolic reflector type solar cooker for a student hostel was designed and built by Institute of Fuel Research and Development (IFRD) of BCSIR. It has a 48 x 10 -3 M3 cooking pot and the surface area of the reflector is about 8 M2 (Sarkar et al. 1999).
Solar diyers. The Institute of Food Science and Technology (IFST) of BCSIR has developed a 1.85 mx0.6 m low cost cabinet type solar dryer. R&D works on solar dryers have been continuing at BAU, ANANDO, Bangladesh Rice Research Institute (BRRI) and at IFRD of BCSIR (WEC, 2005).
Solar water heaters. In Bangladesh, various types of solar water heating systems have been fabricated and tested for potential use in hospitals, hotels & industries. These systems can raise the water temperature in the range of 550-800C (REIN, 2005b). Different capacities of solar water heaters such as 500,200 and 100 liter has been designed and built at RERC (REIN, 2005b). Design of such systems ranges from a simple earthen vat covered with polythene sheets to a sophisticated selectively- coated flat plate collector with double glazing of toughened glass. Flat plate thermal collectors have been designed and fabricated using copper as well as corrugated galvanized iron sheets at RERC of DU (REIN, 2005b).
2.4.2.2 Solar Photovoltaic SvsteMs
Solar Photovoltaic is a proven viable option in remote areas of the country. Applications of solar PV in the country are: household electrification (e. g. Solar Home Systems), rural market electrification, health clinic electrification, street lighting, water pumping, micro enterprise (e. g. cellular phone service, tailoring shop) electrification and remote telecommunication. Solar Home Systems (SHS) are gaining popularity in the country. Example's of solar PV systems installed in Bangladesh is shown in Table 2.7.
Name of organisation
Type and number of solar PV systems and locations
Total installed electrical capacity
(W) GS 42,000 SHSs, installed all over the country 2150 BRAC 10,456 SHSs, installed all over the country 300.545
Capacity: 40 W (20%), 50 W (60%) and 7W (20%)
BPDB 300 SHSs at Juraicharl, in the Rangamati district 54 LGED In different coastal areas 19.6 SIRE Programme of UNDP 33.8 BCSIR 82 SHS's 1.5 REB SHSs Installed in the Narshingdi district 62 Thengamara Mohila Sabul Sangha (TIVISS)
762 SHSs Capacity: 30/40/50175 W
CMES 618 SHSs 2.85 UBOMUS 400 SHSs COAST Trust 352 SHSs Integrated Development Foundation
601 SHSs
Srizony Bangladesh_ 1,710 SHSs Shubashati 592 SHSs Singer Bangladesh Ltd. 31 SHSs - Anando SHSs installed in the khagrachari, Tangail and
Cox's Bazar districts 3.75
Table 2.7 Utilisation of solar PV systems in Bangladesh (REIN, 2005b; BPDB, 2005)
20

Some of the important solar PV installations, installed in the country are:
4ý With a joined financing by the French and Bangladeshi Governments, 62 kW, solar PV project was commissioned by REB in 1996/97, for the electrification of rural households and commercial enterprises in the 4 islands (Karimpur, Natunbazar, Alipur and Panchabati) of the Narshingdi district (REB, 2004). It is the single biggest solar PV project installed in the country. The project covered an area of 29 kmf with about 8,500 households in 21 villages. FONDEM of France carried out the initial design, and selected the site, based on a socio-economic study and site survey conducted by BCAS. Apex Inginierie of France supplied the solar modules and equipment. ARIVICO, a Bangladeshi engineering firm installed the entire system. A total of 795 PV systems of 5 variants (i. e. I to V), ranging in output from 6 W. to 92 W, were supplied/installed. These PV systems are divided into 2 broad categories: stand-alone systems and charging station-based systems (REB, 2004). In the stand-alone systems, the users are provided with all the components, i. e. PV modules, storage battery, controller, wiring and the loads (e. g. lanterns, lamps, TVs, fans and refrigerators). In the charging station-based systems, all the components, with the exception of the PV module, are provided to the users. This pilot project attracted the attention of a large number of international donor agencies (e. g. the World Bank, ADB, GEF, USAID, and CIDA) and has acted as a flagship venture in encouraging the promotion of solar PV and other renewable energy projects by public, private and NGO institutions and organisations.
.; L LGED has successfully completed the solar electrification of a market at Ganguita, in the Jhenaidah district. This project has been undertaken under the SRE programme of UNDP and implemented by LGED. The site has been selected for solar electrification because of its remote location (about 7 krn away from the nearest grid connection), where a5 kW diesel generator was used and operated previously by a private entrepreneur. This is the first centralised solar PV system in Bangladesh. The PV system has the capacity to produce 1.8 W, with daily energy output of 2 kWh, providing electricity to 45 shops, 3 small food processing facilities, one health centre and one bazaar mosque (REIN, 2005b). The responsibility of operation and maintenance has been entrusted with a local NGO, Shuboshoti.
-; L The successful installation of the solar market electrification project represented a milestone for the green energy movement in the country. Another centralised 1.725 W, solar electrification project was implemented by LGED under the SRE programme at Nalitabari in the Sherpur district. It provides solar electricity to 60 houses of sheltering people, and has been operating smoothly (REIN, 2005b).
Rahimafrooz Ltd., installed the following solar PV systems for rural applications (SDNBD, 2005b):
solar PV lanterns and vaccine refrigerators small and medium stand alone systems (< 3 W. ) centralised solar PV power plant railway signaling systems telecommunication systems navigation lightning systems
One of these is the 1.2 W, solar PV system to provide electricity to the telephone exchanges in the coastal island of Char Fassion and Monpura in the Bhola district,
21

with the financial assistance of the Government of Finland and Telegraph and Telephone Board of Bangladesh (SDNBD, 2005b).
BPDB is being implementing a solar PV project in the remote areas of Chittagong Hill Tracts region, in three phases. The project consists of (BPDB, 2005):
900 SHSs - each 120 W, capacity 30 sets of street light systems sets of submersible water pumps - 50,000 liters/day/pump 9 sets of vaccine refrigerators for the health clinics sets of 10 W. centralised solar PV market electrification systems - for electrification of more than 200 shops in each market
So far, the first phase of this project has been completed with the solar PV systems of - 300 SHSs, 10 street lights, 1 water pump, 2 vaccine refrigerators and one 10 kW centralised market electrification (BPDB, 2005).
2.4.3 Small Hydro-power
The only hydro-power plant of Bangladesh, has an installed capacity of 230 MW, comprising two 40 MW units and three 50 MW units. BPDB is considering a 100 MW capacity extension of this hydro-power plant (REIN, 2005d). The additional energy will be generated during the rainy season when most of the year's water is spilled.
World-wide small hydro-power projects become more popular for their cheapness, reliability and environmental friendliness. Bangladesh has carried out few investigations on its small hydropower resources. Small hydro projects will be economically viable if combined with an integrated project of flood control, irrigation and tourism. In 1984, six Chinese experts visited Bangladesh and identified 12 potential sites for small hydro- power generation. Out of these, only one site at Mahamaya Chara, in the Chittagong district, has been considered for development of an integrated project for flood control, irrigation and power generation (Islam, 2002b). A working group has been formed by the engineers of BPDB and BWDB to carryout groundwork of the project. The main objective of the project is to protect the land of about 10.5 kM2 from flood inundation during monsoon and to supply irrigation water during the dry season (REIN, 2005d; BPDB, 2005). A dam is thus proposed to be constructed on the Mahamaya Chara for this purpose. The reservoir water will be utilised for the generation of electricity by installing a water turbine at the foot of the dam.
A low cost 10 kW, small hydro-power plant was installed by a local tribal man Mr. Aung Thuwi Khoin, at Monjaipara, in the Bandarban District. In this project, locally fabricated wooden turbine wheel was used. Generated electricity is being supplied to 40 households. Khoin's innovation of indigenous micro hydro-power unit attracted attention of LGED and UNDID (of Bangladesh). Later, LGED and Mr. Khoin carried out joint study and identified 8 potential sites for small hydro-power generation, in the southern hilly areas of Bangladesh (Islam, 2002b; REIN, 2005d).
Amongst these potential sites, Bamer Chara Irrigation Project - in Bashkhali thana of the Chittagong district, has been implemented by LGED, with an intention to provide irrigation facilities to 3.55 x 10³ kM2 of land area. A large reservoir has been built to provide irrigation water during the dry season. Water enters the project area through a gated spillway and the downstream flow is controlled at by a conventional regulator. Currently LGED is examining the flow rate in the spillway and exploring the scope for
22

installing a small hydro power plant at the site. It is estimated that the proposed site has the potential to generate 20 MW of electricity (REIN, 2005d). On the other hand, recently BPDB has submitted the proposal to the GOB for necessary approval, to implement the following two small hydro-power projects (BPDB, 2005):
4.10 kW hydro-power plant at Barkal in the Rangamati district -L 25 kW hydro-power plant at the Teesta Barrage
2.4.4 Biomass Energy
Biomass, as a replacement of fossil fuels, has been attracting attention from the viewpoint Of C02 mitigation. If biomass is grown in a sustainable manner, its production and use creates no net accumulation of C02 in the atmosphere, because theC02 released during combustion is offset by theC02blo-chemically fixed by photosynthesis (Yokoyama et al. 2000).
Rural population use biomass for domestic cooking, animal fodder and bedding, and as housing construction materials. Inefficient open-type stoves are commonly in use. These are fed either by dry tree leaves, fuel-wood, agro-wastes, rice-husk or cow- dung. At present, the efficiency of utilisation of biomass as an energy source is very low. The amount of biomass that can be saved through efficiency improvement can serve as a source of additional energy. Some affluent rural people also use kerosene stoves, locally constructed biogas plants, and small amounts of imported coal. IFRD of BCSIR has been developing and disseminating various models of improved stoves for the rural areas of Bangladesh (Banu, 1996). BCSIR distributed 0.2 million improved stoves all over the country. 70-80% of these stoves are functioning (REIN, 2005e). Many NGOs are working in providing technical and financial assistance to the poor rural people to have some efficient combustion system.
Briquetting of rice husk is a new and fast growing technology in Bangladesh. Briquettes are made without the use of a binder, through the application pressure and temperature usually in screw type machines. Biogas production has been practiced in the country since 1972. Cattle dung, Poultry droppings and water hyacinth are important resources which has potential use in biogas production (REIN, 2005e).
2.4.4.1 Briqueftinq of Biomass
Rice husk briquettes are being used in the commercial and industrial sectors as well as in households, creating a new use for the husk in the country. Briquetting started in the Sylhet district in early 1980's by the employment of 2 imported machines (Moral, 2000). Briquetting technology is expanding very quickly mainly in the north-eastern part of the country where fuel-wood is more abundant and the demand for husk is less. Briquettes produced in the north-east are transported to the western region where fuel wood is less available and the use of briquettes is still economic in spite of the extra cost of transportation. Successful tests for briquetting of saw dust, wood chips, bark, wood waste, charcoal, coffee husk, coconut fibres, sunflower husk, bagasse, municipal solid waste, straw, and cotton seed husk have also been carried out (Sarkar et al. 1999).
As a result of the proven technical and economic viability of the technology, a total of 906 biomass briquetting machines are currently in operation (Moral, 2000). Of these, 889 machines are locally made and only 17 are imported. The distribution of briquetting machines is shown in Table 2.8. Production capacity of these briquetting machines
23

varies between 75 kg/hr and 150 kg/hr (Moral, 1999). The main problem encountered during the operation of the briquetting machines has been the rapid wear of the screws, which in some places technicians are addressing as best as they can with welding and grinding. BIT, Rajshahi has been conducting an extensive research on materials and energy efficiency of screw briquetting machines. It was found that heating the husk before feeding it to a briquetting screw is an effective way of reducing the electricity consumption as well as enhancing the screw life. 4 improved-design screw-type briquetting machines were fabricated by BIT for laboratory and field-testing. 2 machines were assembled in BIT laboratory for testing and demonstration purposes and other 2 were installed in a rural village to enhance the popularity of the technology as well as the products among the village people (Moral, 1999; Moral, 2000).
2.4.4.2 Biomass to Bioqas
The production biogas by the anaerobic digestion of biomass has drawn government attention and a systematic development has been carried out in this field. The IFRD of BCSIR has been carrying out different pilot projects since 1973. The agencies involved in biogas technology in Bangladesh are: Agricultural Chemistry Department of BAU, Bangladesh Academy for Rural Development (BARD), IFRD of BCSIR, Bangladesh Small & Cottage Industries Corporation (BSCIC), Danish International Development Agency (DANIDA), LGED, Department of Environment (DOE) of Bangladesh, Department of Livestock (DLS), GS and some other NGOs.
District Numbe of briquetting machines Locally manufactured Imported Total
Sylhet 233 15 248 Khulna 100 2 102 Dinajpur 90 - 90 Chittagong 103 103 Rajshahi 60 60 Jessore 42 42 Kustia 32 32 Faridpur 24 24 Barishal 23 23 Patuakhall 9 9 Rangpur 54 54 Myrnensing 16 16 Bogra 45 45 Comilla 21 21 Noakhali 11 11 Dhaka 4 4 Tangail 3 3 Pabna 19 19 Total 889 906
Table 2.8 Distribution of briquetting machines in Bangladesh (Moral, 1999)
24

Trends of the biogas technology in Bangladesh can be summarised as follows (Islam, 2002a; REIN, 2005e):
4. The first floating-dome type biogas plant was demonstrated in 1972 at BAU, Myrnensing. Later another plant, with a6 M3 digester volume was constructed to produce the gas requirements of a family of 6 members for lighting and cooking. In 1974, a biogas plant was constructed at BARD, Comilla. In 1976, IFRD constructed a family-size biogas plant at its campus.
4. Around 1980, IFRD started to construct cheaper biogas plants. The experts of iFRD installed over 70 biogas plants for rich farmers at the owner's cost. With a view to speeding up the dissemination, the IFRD has introduced 2-week long training courses on construction, operation and maintenance of biogas plants. 60 nominees from BSCIC, Bangladesh Rural Development Board (BRDB), the World Bank (Bangladesh Branch) and NGOs have been trained.
4. In 1981, Bangladesh DOE installed 110 plants of fixed-dome type and over 150 plants of floating-dome type under a government grant. 24 district-level officers of BSCIC were trained at the IFIRD. After completing the training course, BSCIC installed a number of plants at the owner's cost. DANIDA temporarily supported the installation of few trench and bag-type digesters.
,; L In 1986, LGED constructed its first biogas plant at the Kurigrarn district. It also arranged a seminar there, which was attended by 300 engineers, scientists and interested persons from other districts.
'4- In 1992, IFIRD in collaboration with Dhaka City Corporation constructed an experimental biogas plant of 85 M3 digester volume at Dholpur in the Dhaka district for the treatment of the city garbage. Charged with of 52.5 tonnes of garbage, the plant produced an average of 60 M3 biogas/day over period of 2 months and 40 tonnes of residue digestate, which is rich in plant nutrients (i. e. can be used as a biofertilizer).
4. In 1993, LGED constructed its first water hyacinth digestion biogas plant in the Madaripur district. In 1994, LGED constructed its first poultry droppings digestion biogas plant from in the Dhaka district. It also installed IVISW based biogas plants in 10 urban areas. By the end of 1994, LGED constructed about 200-biogas plants; out of which 8 were-floating dome type and the rests were fixed-dome type.
-4. Under the Fuel Saving Project of BCSIR, 161 plants were constructed through selected NGOs for farmers who paid a subsidized price. Recently BCSIR launched the biogas pilot plant project, financed by the GOB. Under this project a total 17,200 biogas plant has been installed in different areas of the country and 90% of these plants are functional. These plants are used for cooking, lighting and electricity generation.
Various types of biogas plants constructed by LGED are shown in Table 2.9. GS installed a number of bio-digester for producing biogas for cooking and for using residues in the field as an alternative to chemical fertilizer (REIN, 2005e). A4W. biogas generator has been installed by LGED at an orphanage institute in the Faridpur district. Biogas is produced from the poultry litre of 5000 poultry bird. There is a plan to increase the plant capacity to 10 W, by increasing the poultry bird population to 20,000 (REIN, 2005e). BRAC installed 2 biogas generators, each 800 W. capacity, at Shaturia and Shafipur in the Manikganj and Tangail districts respectively (REIN, 2005e). In both projects, cow manure was used for biogas production.
25

Biomass resources Types of Rates of biogas Number of biogas plant production biogas
(m3/day) plants Familv Woe bionas plant: Cow manure Fixed dome 3.40 - 4.25 700
Floating cover 3.40 - 4.25 6 5.66 - 8.50 259
Cow manure 11.04 - 12.18 55 16.42 - 22.09 45
Fixed dome 3.96 5 6.60 25
10.59 27 15.89 3 Human excreta 22.65 1 3.96 3
Water hyacinth Fixed dome 9.91 2 IVISW Fixed dome 10.76 15 Poultry dropping Fixed dome 11.89 20 gub-total family type biogas plants 1166 Community tvpe bioqas plants: Human excreta 8.50 102 Human excreta Fixed dome 7.08 20 Human excreta 11.33 2 Sub-total community type biogas plants 124 Total Biogas plants (Family and Community type) 1195
Table 2.9 Types of biogas plants installed by LGED (REIN, 2005e)
2.4.4.3 Gasification of Biomass in Banqladesh
BCSIR has designed and constructed an experimental down-draft gasifier for coconut- shell charcoal. Although charcoal produced from coconut shell is not a common product, it is estimated that over 80 ktonnes of coconut shell is available in the country annually (Sarkar et al. 1999). GS has installed a 10 kW,, gas engine-generator set based on a wood gasifier at Tetulia in the Panchagar district. The plant has been test run satisfactory both with cheap wood twigs, and even cheaper bamboo roots. Up to July 1999, GS provided 51 connections for supplying electricity to a neighbouring rural market and several households (GS, 2001).
2.5 Conclusions
Commercial primary energy resources of Bangladesh consist of the known reserves of natural gas and coal, and a limited hydro-electric capacity. Natural gas is the main commercial primary energy source of Bangladesh. The total estimated reserves of natural gas amount to 804.71 billion M3, of which 580.78 billion M3 is believed to be recoverable. In June 2004, the net recoverable gas reserve was estimated at only 423 billion M3 . Between 1992 and 1994, the total commercial primary energy consumption in Bangladesh increased at an average annual rate of 0.74 mtoe. The trend is mainly due the increased consumption of indigenous natural gas and imported oil. The
26

contribution of hydropower to total commercial primary energy consumption is almost constant. In 2004, the total national commercial primary energy consumption was 16.8 mtoe. In this, the shares of natural gas, oil, coal and hydro-electricity were 70.8,25,2.4 and 1.8%, respectively. Power plants and fertilizer factories are the main users of the natural gas in the country, consuming 46.51 and 21.75% of the total, respectively.
In 2003/2004, the total electricity generated was 20.061 TWh, of which 12.583 TWh was generated by the public sector. During the same period, per capita electricity generation was 154 kWh. The distribution of the total installed capacity of 4.68 GW according to fuel types used are 84.5% natural gas, 6.2% furnace oil, 4.9% hydro and 4.4% diesel. Bangladesh has been facing a power crisis for about a decade, mainly because of inadequate power generation capacity compared with demand and the aging infrastructure of many existing power generation facilities. The World Bank has estimated that Bangladesh loses around US$1 billion per year due to power shortages and unreliable power supply (EIA, 2004). The Government of Bangladesh has a vision to electrify the whole of the country by the year 2020. Electricity supply to low-load rural and remote areas is characterised by high transmission and distribution costs and transmission losses, and heavily subsidised pricing.
The main renewable energy resources in Bangladesh are biomass, solar, wind and hydro-power. Hydro-power potential of Bangladesh is low due to the relative flatness of the country. Most of potential sites for wind power utilisation are situated in coastal regions. Wind power generation and its application in Bangladesh have certain limitations due to lack of reliable wind speed data and the remarkable seasonal variation of wind speed. The country has good prospects of utilising solar PV systems for electricity generation, but the high capital investment cost of solar PV is a big barrier for adopting such systems.
Biomass is a versatile source of energy; it can be used as a solid fuel or converted into liquid or gaseous fuels. Biomass is the major energy source in Bangladesh. Anaerobic digestion and gasification technologies have been installed and operated in the country. Biomass utilisation systems represent a proven option for small-to medium- scale decentralised electricity generation. Estimation of the national, division-wise and district-wise biomass availability is important for assessing the potential and economics of decentralised biomass electricity generation in Bangladesh.
27

CHAPTER 3 BIOMASS TO ELECTRICIIY. CONVERSION TECHNOLOGIES
Biomass can be used to generate electricity, heat, liquid fuels for motor vehicles, or other alcohol fuels. In 1994, the total deployment of biomass electricity in the world was 127 TWh; and it is projected that in 2010, the deployment would be 291 TWh (Europa, 2005). Biomass-fuelled electricity generation is still marginal in developing regions, but it is projected to rise rapidly, nearly tripling from 10 TWh in 1995 to 27 TWh in 2020 (D'Apote, 2001). Accordingly, biomass consumption for power generation will also triple from 4 Mtoe to 12 Mtoe in 2020 (see Table 3.1). The technical concepts now being investigated for biomass electricity generation are as follows:
-& Direct combustion of biomass and steam turbine or Stirling engine
, A. Co-firing of biomass with coal or natural gas and steam turbine
Gasification of biomass and gas turbine or internal combustion engines
4. Pyrolysis of biomass (to produce 'biocrude' liquid fuel) and internal combustion engines or gas turbines
-&- Anaerobic digestion of biomass and internal combustion engines or gas turbines
Fermentation of biomass (to produce 'bio-ethanol' fuel) and internal combustion engines or gas turbines
. 4. Fuel-cell
Electricity can be produced from biomass in a variety of plant sizes, which is useful for power generation for decentralized applications at the village level as well for supply to the national grids. Brief descriptions of each technology are presented in the following sections.
Country/ Region Items 1995 2010 2020 China Biomass used In power generation (Mtoe) 0.1 0.2
Biomass-based power generation (TWh) 0.4 0.7 % of total electricity generation - 1.7 1.8
East-Asia Biomass used in power generation (Mtoe) 0.3 0.7 1.7 Biomass-based power generation (TWh) 0.3 0.6 1.5 % of total electricity generation 0.0 0.0 0.1
South-Asia Biomass used In power generation (Mtoe) - 2.0 3.1 Biomass-based power generation (TWh) 4.6 7.3 % of total electricity generation 0.4 0.4
Latin America Biomass used in power generation (Mtoe) 3.3 4.5 5.8 Biomass-based power generation (TWh) 9.6 13.1 17.1 % of total electricity generation 1.2 0.9 0.8
Africa Biomass used in power generation (Mtoe) 0.4 0.8 0.8 Biomass-based power generation (TWh) 0.3 0.6 0.6 % of total electricity generation 0.1 0.1 0.1
Total developing Biomass used in power generation (Mtoe) 4.0 8.1 11.7 countries Biomass-based power generation (TWh) 10.2 19.3 27.1
% of total electricity generation 0.3 0.3 0.3
Table 3.1 Biomass-based power generation in developing countries (D'Apote, 2001)
28

3.1 Direct Combustion of Biomass
The simplest method to generate electricity from biomass is to burn it, using air as the oxidant. The chemistry of complete oxidation of materials is:
C,, HYO + 02 10 C02 + H20 + Heat
An industrial biomass combustion system normally consists of fuel storage, feeding device, the combustor, ash removal device, heat recovery surface, flue gas cleaning facility and stack. Combustor design depends on the characteristics of biomass fuels.
3.1.1 Electricity Generation by Direct Combustion of Biomass
In principle, the energy system of biomass combustion is the same as that for fossil fuel combustion. Steam turbines and steam engines are used as proven technology to generate electricity through biomass combustion. Steam engines are available in the power range from approximately 50 W, to 1 MW, and steam turbines are available in the range of 0.5 MW, up to 500 MW, (IEA Bioenergy, 2003c). Units of these types are based on Rankine Steam Cycle. Biomass is burned in a boiler producing pressurized steam, which is expanded through a turbine to generate electricity (see Figure 3.1). Organic Rankine Cycle (ORC) using a thermal oil boiler instead of a costly steam boiler is also available in the range 0.5 MW to 2 MW (IEA Bioenergy, 2003c).
Steam engines can also be used for small-scale applications, enabling efficiencies of 6% - 10% in single-stage and 12% - 20% in multi-stage mode (IEA Bioenergy, 2003c). Externally fired Stirling engine is another way for small scale electricity generation by direct combustion of biomass. The heater of the Stirling engine is directly heated by the hot flue gas from the combustor. About 100 Stirling engines have been installed in India (13hattacharya, 1993).
Biomass
Figure 3.1 Schematic diagram of direct-fired biomass electricity generating system (EERE, 1999a)
L-Cmcity
29

3.2 Co-firing of Biomass
Co-firing of biomass in coal-fired plants and natural gas fired electricity generation plants is very promising technology. Co-firing of biomass in coal fired plants involves replacing a portion of the coal with biomass at an existing coal-fired power plant boiler. Table 3.2 shows the proximate and ultimate analyses of some biomass resources. Some physical and chemical properties of biomass residues (e. g. high MC, low bulk density, low melting point of ash and high volatile matter) complicate their processing for co-firing (Werther et al. 2000).
3.2.1 Options for Co-firing
The different options for co-firing of biomass are (Tillman, 2000): Blending biomass with coal on the fuel pile. It is the simple and least cost approach to blending biomass with coal. Some biomass can cause significant problems during blending of biomass with coal on the coal pile. For example, tree bark can be very stringy, and switch grass and straws when chopped to 25-50 mm in length can cause pluggage in the bunkers.
4. Co-firing with separate Injection. This method involves separately preparing the biomass, and then firing it in the boiler. This method involves more equipment than the first one, but can accomplish higher percentage co-firing in pulverized coal boilers. Gasification-based co-firing. In this type, biomass is first fed to a gasifier in order to generate producer gas. The gas is then fired in a boiler. It is the most capital- intensive approach to co-firing.
3.2.2 Electricity Generation by Co-firing of Biomass
Co-firing of biomass has been successfully demonstrated in the full range of coal boiler types, including pulverized coal boilers, stokers, and bubbling and circulating fluidized bed boilers (EERE, 1999b). For low level of co-firing up to 5-8% biomass, wood can be combined with coal prior to the pulverizer (Demirbas, 2003). For medium levels, 10- 15% biomass, a separate wood preparation and delivery system should be provided with the boiler operation based on coal characteristics (Demirbas, 2003). For moderately high levels, 25-50% biomass, a multi-fuel system, such as a fluid bed, should be used and for above 50% biomass, a boiler designed specifically for biomass operation should be used (Demirbas, 2003).
Fuel Pr imate analysis M Ultimat analysis (%) Moisture Volatile FCa Ash c H 0 NI S
Sunflower husP 9.10 69.1 19.9 1.9 51.4 5.0 43.0 0.6 Cotton husk 6.90 73.0 16.9 3.2 50.4 8.4 39.8 1.4 Mustard husk 5.60 68.6 22.0 3.9 46.1 9.2 44.7 0.4 0.20 Soya husk 6.30 69.6 19.0 5.1 45.4 6.7 46.9 0.9 0.10 Groundnut shell 7.88 68.1 20.9 3.1 50.9 7.5 40.4 1.2 0.02 Coconutshell 4.40 70.5 22.0 3.1 51.2 5.6 43.1 0.0 0.10 Sewage sludge 6.90 44.6 7.0 41.5 52.0 6.3 32.1 6.3 3.10 Wood 40.00 46.7
. 12.8
ý 0.5
, 50.7
. 5.9
. 43.1
, 0.2
, 0.04
a: fixed carbon; b: residues obtained during dry processing.
Table 3.2 Analysis of some agricultural and forest residues and coals (Werther et al. 2000)
30

In coal-fired suspension burners, the fuel has to be pre-treated in such a way that full combustion within the short residence time (i. e. 2-3 sec. ) in the combustion chamber is realized. Lumpy biomass fuel, which has not been pre-treated, will need a longer time to burn out, depending on the size and moisture content. If the agricultural residue is in- homogeneous, the combustion process is difficult to control (Werther et al. 2000).
The combustion temperature of coal-fired boilers is 850-9000C for fluidized bed combustors and 1000-12000C for suspension burners. The melting points of ashes of agricultural residue are often lower which could lead to slugging or fouling (Werther et al. 2000). Ash from coal combustor is often used as inert material in the cement industry. The co-firing of agricultural waste changes the composition of the ash, which may hinder its utilization in the cement industry (Werther et al. 2000).
3.3 Gasification of Biomass
Gasification is a technique to convert a solid fuel into a gaseous fuel in the presence of hot steam and limited amount of air or oxygen. The resulting gas (i. e. producer gas) obtained by a gasification process is a mixture whose main constituents are CO, H2, and CH4 together with C02 and N2. The energy content of the producer gas is 3-5 Mj/M3 (Larkin et al. 2004).
3.3.1 Electricity Generation by Gasification of Biomass
Gasification offers the advantages of feedstock flexibity and environmentally friendly technology for low-cost electricity production, compared to combustion technology (Stiegel and Maxwell, 2001). Gasification systems may be either direct or indirect. In direct gasifier systems, pyrolysis, gasification and combustion take place in one vessel; whereas in indirect gasification type, pyrolysis and gasification occur in one vessel, and char combustion takes place in a separate vessel (see Figure 3.2). In direct gasification, air and sometimes steam are introduced directly to the single gasifier vessel. In indirect gasification, an inert-heat transfer medium, such as sand, carries heat generated in the combustor to the gasifier to drive the pyrolysis and char gasification reactions (EERE, 1999c).
t. LLAN 800AS to
TAR GAS TuFAK
%loo m TV UtL
DWT
3AS . SSOR
AW ar-PUDUR
TO
SjrrOAND , lVAlilkWAlkR CtJL%
wwww ORIED,
BIOMASS
AFt z
PRESSURE GAS ALOUCIPON Imago:
I XHAA MI TO
ULAN
'CAY`Wý/ALLE @WAS
SUED C 7A. R
Lfto EEO *A-R FUFI
((WPRISSM
$MD %R WAMýWATf-IR It 'F=PIjKF
AIR owkH
AIR
Figure 3.2 Direct and indirect low pressure gasifiers (EERE, 1999c)
j

There are two ways of generating electricity by using the product gases - either using the internal combustion engines or gas turbines. The gasifier produces a low heat value producer gas with low tar and dust contents. The gas is further cleaned, using cooling and cleaning train. Cleaned gas is used to drive an ICE along with diesel. In India, technological advancement has been achieved in gasification of woody and non- woody biomass up to the MW level (Singh, 1998).
The options for generating electricity using gas turbines are: 4ý simple cycle gas turbine , -&. steam-injected gas turbine (SIGT) 4, inter-cooled steam-injected gas turbine (ISIGT) and -Aý combined cycle gas turbine (CCGT)
The combined-cycle is the most energy efficient power generating cycle (Williams and Larson, 1996). Pilot demonstration plants using fuel wood or sugarcane bagasee fuel, with electrical outputs in the 5- 10 MW range are being tested (Larkin et al. 2004). Schematic diagram of a high-pressure direct biomass gasifier combined cycle is shown in Figure 3.3. The main disadvantage of this plant is the need for a cleanup system for the control of corrosive gas phase compounds such as tar, acid gas and alkali metals (Belgiorno et al. 2003).
3.4 Pyrolysis of Biomass
Pyrolysis is a biomass conversion technique, through which biomass is converted to liquid (bio-oil or bio-crude), solid and gaseous fractions by heating the biomass in the absence of air or oxygen. Depending on the operating conditions, there are three types of pyrolysis process: conventional pyrolysis, fast pyrolysis and flash pyrolysis (Maschio et al. 1992).
Systorn Boundary
Clean Biogas to Gas Tirbire Combustion
Gas -Coolef Turbine
Biow Hot
Generator
Gas Direct Fiker
HRSG Ash
Boost Gerwator Sized and Dried: Compressor
Borass Biomass Ai,
E::: J- Steam Turbi"ie
Feed Prep. - --------- I Boile,
And Drying Condenser Feed Water
Slearn from Slewn Cycle
Wastewater Ash Blowdown (various sources
Figure 3.3 Biomass gasification combined cycle gas turbine system (EERE, 1999c)
32

Conventional pyrolysis occurs under a slow heating rate. This condition permits the production of solid, liquid or gaseous pyrolysis products in significant proportions. Fast pyrolysis can directly produce a liquid fuel from biomass, which can be readily stored or transported. Flash pyrolysis occurs under a fast heating rate with very low (<0.5 s) solid residence time. Different operating parameters of the above types of pyrolysis are summarized in Table 3.3. Fast pyrolysis is now an acceptable feasible and viable route to renewable liquid fuels (Bridgwater and Peacocke, 2000).
3.4.1 Fast Pyrolysis
Fast pyrolysis is a high temperature process, in which biomass is rapidly heated in the absence of air, vaporizes, and then rapidly cooled to get maximum amount of bio-oil. Bio-oil which is the main product is obtained in yields of up to 80% by weight of the dry feed together with by-product char and gas which are used within the process so there are no waste streams (Bridgwater and Peacock, 2000). Figure 3.4 and Figure 3.5 shows the fast pyrolysis process and its application.
Parameter P rolysis process Conventional Fast Flash
Operating temperature (OC) 300-700 600-1000 800-1000a Heating rate (OC/sec) 0.1-1 10-200 ýI 000 Solid residence time (sec) 600-6000 0.5-5 <0.5 Particle size (mm) 5-50 <1 Dust
up to 2000 uC with solar furnaces
Table 3.3 Operating parameters of different pyrolysis processes (Maschio et al. 1992)
GAS For export
BIONIASS
, Recyckgw)ramrr tridlor atkAser
Figure 3.4 Principles of typical fast pyrolysis process (PyNe, 2005)
ii

Figure 3.5 Application of fast pyrolysis product (PyNe, 2005)
The main components of a typical fluidized-bed fast pyrolysis system are (Brdgewater and Peacocke, 2000; PyNe, 2005):
4- Feed drying. Unless a naturally dry material such as straw is available, drying is usually essential to prevent water being included in the bio-oil.
4. Grinding. Particles have to be very small to fulfill the requirements of rapid heating and to achieve higher liquid yields.
4 Reactor configuration. The essential features of a fast pyrolysis reactor are: very high heating and heat transfer rates; and rapid cooling or quenching of the pyrolysis vapors.
4- Vapor residence time. The time and temperature profile between formation of pyrolysis vapors and their quenching influence the composition and quality of the liquid product. A few hundred milliseconds of vapour residence times are necessary for optimum yields. Longer residence times result in significant reductions in organic yields.
4. Liquid collection. Pyrolysis liquid is mostly in the form of aerosols rather than a true vapour. Quenching, i. e. contact with cooled liquid is effective but careful design and temperature control is needed to avoid blockage from differential condensation of heavy ends. Electrostatic precipitation has been shown to be very effective in recovering the aerosols.
The elemental and chemical composition of pyrolysis oils is very much dependent on the pyrolysis conditions under which they are produced - see Figure 3.6. Typical characteristics of fast pyrolysis liquid are shown in Table 3.4. They vary considerably according to the feed material and its characteristics.
14

Yield % by we& of dry feed
70%
60%
50% Organics
40%
30% Gas 20%
Water 10% Char 0% !
450 500 550 UXI
Reaction temperaurcý T
Figure 3.6 Typical yields of organic liquid, reactors water, gas and char from fast pyrolysis of wood (Bridgwater et al. 1999)
Physical property Typical value Moisture content 25.0% pH 2.5 Specific gravity 1.2 Elemental analysis (moisture free basis):
C 56.4% H 6.2% N 0.2% S <0.01%
Ash 0.1% 0 37.1%
Higher heating value (moisture free basis) 22.5 MJ/kg Higher heafing value - as produced 17.0 MJ/kg Viscosity (at 400C) 30-200 cp. Pour point -23. OOC
Table 3.4 Typical characteristics data of fast pyrolysis liquid (Bridgwater et al. 1999)
3.4.2 Electricity Generation by Pyrolysis of Biomass
Bio-oil has the advantage of being storable and transportable. Electricity can be produced from bio-oil by direct combustion, ICE and gas turbines. One of the big challenges for bio-oil is the cost, which is 10% to 100% more than fossil fuel (PyNe, 2005). Examples of the applications of pyrolysis liquid product for electricity generation: 4. Combustion: Bio-oil has been successfully used as a fuel by many organizations
both in pilot and commercial scale. Successful tests have been carried out at Canmet in Canada, at MIT in the USA, and by Neste in Finland, and the bio-oil is routinely used as a boiler fuel by Red Arrow in USA. Problems reported are the high viscosity, which is adjusted by addition of alcohol by Neste and by preheating by Canmet. In both cases, the boiler or furnace requires preheating with conventional fuels before switching over to bio-oil and a more complex start-up
35

sequence is therefore required as bio-oil is not miscible with fuel oil or diesel (Bridgwater and Peacocke, 2000).
'-L Engines: Successful tests have been carried out to run the dual-fuel engines with crude bio-oil without any pre-treatment. The organizations that have gained experience include Motori and Pasquali in Italy, Kannas University and MIT in USA, and Wartsila in Finland. Ormrod diesels, UK have succeeded in operating a 250 W. medium speed, dual fuel engine (Europa, 2005; Bridgwater and Peacocke, 2000).
4, Gas turbines: ENEL, Italy has studied the effect of bio-oil combustion in gas turbines in a static test rig. Long-term operational experience is required to establish optimum conditions (Bridgwater and Peacocke, 2000).
3.5 Anaerobic Digestion of Biomass
Anaerobic digestion is a process by which a mixed microbiological culture attacks a complex organic material in the absence of oxygen resulting in the generation of biogas together with solid and liquid effluents. Principal constituents of the biogas generated are CH4 and carbon dioxideC02. Manures from cattle and poultry, MSW, sewage sludge are the examples of biomass resources from which biogas are produced by anaerobic digestion. Depending on the specific composition of the organic material and the nutrients available, small amounts of other gases such as hydrogen, nitrogen and hydrogen sulfide may be produced, the reaction involved can be expressed as (IWM, 1998):
Organic Matter CH4 + C02 + N2 + NH3 + H2S
There are three effective temperature ranges for anaerobic digestion, each of which has its own favored group of bacteria and its own set of characteristic advantages and disadvantages. These are (IWM, 1998):
-A. cryophilic (<200C) -, L mesophilic (20-450C) 4. thermophilic (50-651C)
Anaerobic digestion under cryophilic condition is not generally adopted due to low rate of reaction. IWM (1998) reported that, practical anaerobic digestion systems are operated under either in mesophilic (usually 350C) or in thermophilic condition (usually 550C) conditions. The optimum mesophilic or thermophilic temperature might vary with the composition of biomass and the type of digester. In any anaerobic digestion system, the reactor temperature must be maintained at a relatively constant level to maintain the biogas production rate. The higher heat input required to maintain thermophilic conditions might not be economic and greater sensitivity to operating and environmental variables makes the higher-temperature operation more problematic than mesophilic digestion (IWM, 1998).
There are three main stages to anaerobic digestion. These are hydrolysis, acidogenesis and methanogenesis - see Figure 3.7.
36

Cellulosic material
I
G uc I oSe
Ao lc hols
Butyrates
Proteins
acids Aromabcs I
Lipids
'I, Long-chain fatty acids
I
t-chain fatty acids
Kero acids Kerbs cycle acids
41 Ae". 'ý
Pyruvic acid
Lactic acid I
:
I'-- Proplonic acid
Acetic aci;?
Formic acid
Methane and carbon dioxide
mem. f..
Hydrolysis
L
I Acidogenesis
Methanogenesis
,F 60.6 no.
Figure 3.7 Simplified descriptions of biochemical pathways in anaerobic digestion of biomass (Sýrensen, 2000)
Brief descriptions of each stage are as follows (IWM, 1998; Sýrensen, 2000):
-4. Hydrolysis. This is the first stage in which complex insoluble organic polymers, such as carbohydrates, cellulose, proteins and fats are broken down and liquefied by the extra-cellular enzymes produced by hydrolytic fermented bacteria (e. g. Clostridium, Eubacterium and Peptococcus). In this stage proteins are converted into amino acids and carbohydrates into simple sugars and fats into long-chain fatty acids.
4. Acidogenesis. This stage is characterized by the production of acetic acid, and volatile fatty acids which are derived from the protein, fat and carbohydrate components of the feed stock. pH falls as the amounts of these compounds increase. C02 and H2 are also evolved as a result of the catabolism of carbohydrates, with the additional potential for the production of methanol and/or other simple alcohols.
. -L Methanogenesis. Methane is produced in this stage through the breakdown of the products of previous stage. Methane is produced from a number of simple substrates, acetic acid, methanol, carbon dioxide and hydrogen.
37

3.5.1 Electricity Generation by Anaerobic Digestion of Biomass
Biogas is a versatile fuel. Biogas can be used for all applications designed for natural gas. Utilization of biogas in the internal combustion engines is a long established technology. Biogas is also burnt for lighting purposes to replace the use of kerosene oil in the rural areas in developing countries. China and India have long-term experience with small-sized biogas plants.
Diesel engines can be operated in dual-fuel mode of operation (diesel plus biogas). One of the big advantages of this type is that in case of shortfall in biogas supply; the engine switches over smoothly without interruption to conventional diesel operation. The blogas is mixed with the air before the mixture enters the combustion chamber, and at the end of the compression stroke a pilot quantity of diesel is injected to ignite the mixture. NOx emissions are usually low for biogas engines, whereas CO concentration is often more of a problem. But from the environmental point of view, CO is a far smaller problem than NOx because it is rapidly oxidized to C02. Less amount of NO., and CO is achieved with lean burn mixture (lEA Bioenergy, 2003b).
3.6 Fermentation of Biomass
Liquid fuels can also be produced from biological raw materials through anaerobic fermentation process. The liquid fuel (i. e. alcohol) is separated from other components by distillation. If the material is sugarcane, the fermentation reaction may be summarised as:
C6H1206 10.2 C2H50H + 2CO2
3.6.1 Production of Ethanol and Methanol
Ethanol
Ethanol can be produced from the following three main types of biomass feed stock (Wereko-Brobby and Hagen, 1996):
--L sugars (e. g. sugar cane, molasses); 4. starches (e. g. cassava, corn); and 4. cellulose (e. g. wood, agricultural residues)
Sugar-bearing feed-stock is attractive for ethanol production, as they already contain the simpler sugar forms such as glucose or fructose, which can be fermented to ethanol directly. Starches contain carbohydrates of greater molecule complexity and therefore have to be broken down to simpler sugars by another process, which will increase the capital and operating costs. Cellulose or carbohydrates have an even greater molecular complexity and have to be converted to fermentable sugars by acid or enzymatic hydrolysis (Wereko-Brobby and Hagen, 1996).
Production of ethanol involves pre-treatment of the feed stock, fermentation and ethanol distillation. If the feedstock is sugarcane, the cane is first washed, crushed and filtered to separate the bagasee. The sugar juice is further concentrated and sterilized
38

before fermentation. For starch-containing raw materials the pre-treatment also involves hydrolysis of the starch molecules by enzymes into fermentable sugar. Once the fermentable sugar is formed, processing is identical for sugar and starch materials. Conventional ethanol technology uses batch fermentation with common strains of yeast to produce an B-10% alcohol solution after 24-72 hours of fermentation (Wereko- Brobby and Hagen, 1996). The ethanol solution is then distilled in a multistage distillation column to a concentration of about 95%. If anhydrous alcohol is the desired product, which is the case when ethanol is used for blending with gasoline, benzene is added to a third distillation column to split the azeotrope ethanol and water forms at a 95% concentration of ethanol. The anhydrous ethanol contains 99.8% of ethanol (Wereko-Brobby and Hagen, 1996).
3.6.1.2 Methanol
High-cellulose content materials such as wood and agricultural residues are suitable for methanol production. The production technology for methanol is totally different from the ethanol production. Raw material is converted into a gaseous intermediates from which methanol can be synthesized. For economic reasons, methanol will probably be produced in large plants. The minimum economic capacity for a methanol production plant using biomass as feedstock is seldom considered to be lower than 3x1O5 tonnes of methanol/year (Wereko-Brobby and Hagen, 1996).
3.6.2 Electricity Generation by Fermentation of Biomass
Alcohol can be used as a liquid fuel in ICE-generator, to generate electricity either on its own or blended with petroleum (Larkin et al. 2004). The HHV of ethanol is 30 MJ/kg and its octane rating is 89-100 (Sýrensen, 2000). Properties of ethanol and methanol are fairly similar to gasoline (see Table 3.5). No adjustments to the engines are required for up to a 20% ethanol blend in gasoline (Wereko-Brobby and Hagen, 1996). On the other hand, straight ethanol has significantly different combustion properties to gasoline. So, it needs some modifications in the design of engine to use straight ethanol as fuel. Engines for straight ethanol combustion have been developed and introduced in Brazil (Wereko-Brobby and Hagen, 1996). Properties of diesel such as low octane number, high-vaporization heat, low viscosity make the alcohol unsuitable to use directly in existing diesel engines.
Property Fuel alcohols Gasoline Ethanol Methanol (for comparison)
Density kg/m" 789.0 793.0 720-750 Higher heating values (GJ/tonne) 29.7 22.3 46.47 Lower heating values (GJ/tonne) 27.0 19.7 43.6-43.9 Lower heating values (MJ/m') 21.3 15.6 About 32.0 Stoichiometric airtfuel ratio (kg/kg) 9.0 6.5 14.6 Boiling temperature at I bar (OC) 78.5 65.0 30.225 Heat of vaporization (KJ/kg) - 1110.0 400 Vapour pressure at 38*C - 32.0 62-90 Octane number 106.0 112.0 91-100
Table 3.5 Properties of fuel alcohol's compared with gasoline (Wereko-Brobby and Hagen, 1996)
39

Alcohol's have favorable combustion characteristics due to its high octane-rated performance. Internal combustion engines optimized for operation on alcohol fuels are 20% more energy efficient than when operated on gasoline, and an engine designed specifically to run on ethanol can be 30% more efficient (FAE, 2005). Engines designed to run on alcohol emits less oxides of nitrogen (NO, ) because the alcohols burn at lower temperatures than gasoline, and NO,, emissions drop with decreasing temperature (Wyman et al. 1993).
3.7 Fuel Cells
Fuel cells are electro-chemical devices that convert the chemical energy directly to electricity and heat. Fuel cell is like a battery: it consists of an anode and cathode separated by an ion-conducting electrolyte (see Figure 3.8). Hydrogen rich fuel gas is fed into the anode and oxygen (or air) over the cathode. Being encouraged by catalyst hydrogen dissociates into hydrogen ions and electrons.
Hydrogen ion passes through electrolyte to the cathode, and simultaneously the electrons move through an external circuit before they return to the cathode, to be reunited with the hydrogen and oxygen to form water. Fuel cell operates quietly and where hydrogen rich gas is used as a fuel it produces only water and heat as exhaust (cathode and anode effluent) (Shepherd and Shepherd, 2003; Larsen, 1993).
Fuel cells are highly efficient due to the direct conversion of energy into electricity. Their fuel to electricity efficiencies are typically above 40 - 60% (Batra and Bali, 2001). The fuel cell reaction is exothermic, so if co-generation is applied then the overall efficiencies can be up to 85 - 90% (Batra and Bali, 2001). Fuel cells are combined into groups (or'stacks') to achieve a useful voltage and power output.
Hydrogen rich gas
Anode
H2 2H* + e'
H+ H+ H+
Electrolyte
2H+ + Y2 02 + e- H20
Cathode
Anode effluent
/ Catalyst or support matrix
Air
circuit
&
Cathode effluent
Figure 3.8 Operating principle of a fuel cell (Larsen, 1993)
40

3.7.1 Fuel Cell for Electricity Generation
Fuel cells are ideal for residential electricity generation, either for grid or off-grid purposes (Shepherd and Shepherd, 2003). Fuel cells are classified according to the type of electrolyte used in the cell: alkaline fuel cell (AFC), phosphoric acid fuel cell (PAFC), molten carbonate fuel cell (MCFC), solid oxide fuel cell (SOFC) and polymer electrolyte fuel cell (PEFC) (Magistri, 2004). For power generation, the most promising technologies include the molten-carbonate fuel cells (MCFC) and solid oxide fuel cells (SOFC). SOFC's allow high tolerance to fuel contaminant and high temperature (lEA Bioenergy, 2003b). The operating temperatures, electrolyte and module sizes of the different types are shown in Table 3.6. Phosphoric acid fuel cells power plants in the range of 200 kW to 2 MW are operated in Japan, Switzerland and the USA. The largest unit of this type is 11 MW, operated by the Tokyo Electric Power Company (IEA Bioenergy, 2003b). MCFC's are a type of direct fuel cell which eliminates the use of external fuel processors. Fuels are converted into hydrogen- rich gas in the reforming anode which is part of the fuel cell stack (lEA Bioenergy, 2003b). The major steps followed for electricity generations from biomass-based fuel cell power plant are (Naumann and Myren, 1995): 4. conversion of biomass to methane-rich gas streams or liquid fuels 4. removing of impurities and converts the fuel gas to a hydrogen rich gas (i. e. fuel
processor), the detailed flow sheet for this step depends on the composition of the fuel gas and the requirement of the fuel cell generator
-& generation of electricity using this hydrogen rich gas in fuel cell
Table 3.7 shows some of the biogas contaminants and the issues of concerns for satisfactory fuel cell operation. Feeding the product gas of biomass gasification to a MCFC instead of a gas turbine allows one to lower the restrictions on the contaminants level, faced by the developers of the biomass power generation plants. The higher efficiency of the MCFC compared to the efficiency of the gas turbine results in higher overall efficiencies of a power plant. The estimated efficiency of the biomass gasification - MCFC is around 53%, which is considerably higher than that of combined cycle gas turbine (Labachyov and Richter, 1998).
Characteristics Type of Fuel Cell PAFC MCFC SOFC
Electrolyte Phosphoric Acid Molten Carbonate Solid Oxide Operating temperature CC) 200 650 1000 System efficiency (%) 40-45 50-57 45-50 Module size (electrical capacity) 200 kW -2 MW 2 MW 3- 100 kW
Table 3.6 Characteristics of fuel cells (lEA Bioenergy, 2003b)
Anaerobio-digester gas contaminant
Fuel cell power plant requirements*
Issues/concern
Sulfur (1-12S) _ - < 4.0 ppmv " Poison to fuel processor reforrning catalyst -
Halogens (F, CL, Br) < 4.0 ppmv' Corrosion of fuel processor components NI-13 < 1.0 ppmv Fuel cell stack performance H20 Remove moisture and
condensate Damage to fuel control valves. Transport of
I bacterial phosphates Bacteria/solids Remove all bacteria / solids I Fouling of fuel processor piping/beds
'Operating on biogas(60%CH, and 40%C02), ' With zinc oxide sulfur guard bed . 'With Optimal halogen guard bed in fuel processor.
Table 3.7 Anaerobic digester fuel contaminant limits for fuel cell applications (Spiegel and Preston, 2000)
41

3.8 Conclusions
There are mainly two types of biomass conversion techniques: thermo-chernical and bio-chemical conversion. Examples of the thermo-chemical conversion techniques are direct firing, co-firing (with coal or natural gas), gasification and pyrolysis. Anaerobic digestion and fermentation are the examples of the bio-chemical conversion techniques. Fuel cell converts the chemical energy directly and efficiently to electricity.
Biomass-to-electricity generation technologies are available in a variety of plant sizes, either for grid or small-to-mediurn scale decentralised applications. Direct combustion, co-firing, gasification and anaerobic digestion based biomass-to-electricity generation technologies are being used widely in many countries of the world.
Steam turbines and steam engines are used as proven technology to generate electricity through biomass combustion. Steam engines are available in the power range from approximately 50 W. to 1 MW, and steam turbines are available in the range of 0.5 MW, up to 500 MW.. Co-firing of biomass with coal is well established technology. Typical capacities of these types of plants range from 5 to 20 MW, at existing coal fired stations (Faaij, 2006).
Gasification and anaerobic digestion technologies are popular in many developing and developed countries. These technologies are used for decentralised off-grid biomass electricity generation in the developing countries. Gasification based combined cycle power plants represent a very promising prospect due to the higher efficiency that can be achieved. The technology has been demonstrated in the 5- 10 MW, range (Faaij, 2006).
42

CHAPTER 4 BIOMASS ENERGY SYSTEMS MODELLING: A REVIEW
4.1 Introduction
Many countries in the world do not have organised system to collect and analyse data for formulating biomass energy plans, policies, or strategies. Biomass energy planning is defined as to arrive at a set of agreed feasible and consistent targets for making policy for utilisation of biomass resources- mainly at national or decentralised level. Decentralized-area-based approach to planning is essential to properly understand biomass energy situation and to formulate proper site-specific plans (Heruela, 1998). Biomass energy planning which aim at the efficient, economical and sustainable supply and utilisation of biomass energy can be viable for many countries. A general framework of biomass energy planning technique is shown in Figure 4.1. The biomass energy planning is a continuous and iterative process (see Figure 4.1). Close interactions are important to review the results of different steps in the planning process, which lead to new analyses and projections. Models are used as tools, to assist planners to perform different analyses. Models simplify the reality for the sake of analysis. It is defined, or normally implicitly understood, as an algorithm for the prediction of the performance of a system as a function of a number of control parameters. The standard sequence of activities in modelling are: problem awareness, formulation of the problem, modelling, validation, problem solving, analysis of the results, presentation of the results, and implementation (Roos and Rakos, 2000).
Figure 4.1 Framework for biomass energy planning (RWEDP, 2000)
43

In modelling biomass energy systems, three features have to be considered (Roos and Rakos, 2000):
--L Biomass fuel sources and conversion techniques are more often than fossil-fuel systems dependent on local conditions concerning biomass feedstock supply and energy use, which restricts the applicability of a model that have been developed under one set of conditions to other situations.
4. There are few developed and documented full-scale biomass-energy systems in operation. Due to transport costs and low market penetration, few global markets for biomass fuels exist. Biomass fuels are frequently the by-products of some major activities e. g. forestry, agriculture and waste management.
4.2 Energy Systems Modelling
Different types of energy models exits, depending on the approach and objectives. Demand and supply analyses, economics, conversion technologies and optimisation these are the major issues analysed in different types of the modelling techniques.
Roos and Rakos (2000) reported that there are two basic energy modelling techniques: Process Models and Econometric Models. RWEDP (2000) reported the types of energy modelling techniques are as Econometric and Tech no-economic. Process models make explicit assumptions about costs, performances and relations between components in the energy system and calculate feasible energy strategies either by optimisation (e. g. minimisation of system costs) or by simulation of alternative scenarios.
Econometric models use historical data for statistical analysis and extrapolations of possible developments in the future. These are mainly demand models and are based on the assumptions that energy demand is driven by macro-economic indicators such as GDP, income, fuel prices (RWEDP, 2000). Future demand is forecasted by employing statistical data to establish relationships that describe the energy demand as a function of a number of macro-economic variables, mainly income and prices.
On the other hand, a techno-economic model analyse the energy-end uses (i. e. cooking, heating, lighting) and calculates the economics for each-end use, on the basis of technical, economic and social indicators (RWEDP, 2000). In this type of modelling technique, different scenarios are developed and analysed (simulation approach) to assess the impact of different factors which are related to energy or economic policy.
Optimisation model is considered as another separate broadest category of energy modelling technique (Heaps, 2002; Suganthi and Williams, 2000). Heaps (2002) described another type of modelling technique - accounting framework. Figure 4.2 explains the accounting framework and optimisation modelling techniques.
44

Accounting I Optimisation Framework II Model
Construct Create database plausible of technologies scenarios with costs.
Run Model: IýOnTbaýý Adjust m m bound and 'least cost systeV
a hurdle rates
Would Is so ution "I ifferent option realistic? lower costs
No
Leastcost/ Least cost/ plausible plausible scenario
II
scenario
Figure 4.2 Accounting frameworks and optimisation models in practice (Heaps, 2002)
In accounting frameworks, it explores the resource, environment and social cost implications of alternative future "what if" energy scenarios. In this type, the modeller explicitly accounts for outcomes of a decision. It has the advantages of simplicity, flexibility, lower data requirements and the capability of examining issues that go beyond technology choice. On the other hand, this type of modelling technique is less suitable where systems are complex and a least cost solution is needed. Accounting framework type of modelling technique has the similarity with the econometric (or techno-econometric) types of modelling techniques.
Geographical Information Systems (GIS) is another type of energy modelling technique. GIS are defined as a combination of computerized-cartography system (that stores map data) and a database management system. It is a powerful tool for collecting, sorting, retrieving, transforming and displaying spatial data. All possible geographical entitles can be modelled within a GIS environment as point, line, or polygon objects. Attributes are stored in the form of database fields and are referenced to the corresponding geographical objects. Each geographic object and its attributes represent a database record. A set of records referring to objects with the same attributes represents a table, which can be presented either as a map (geographic objects) or a browser (data field). GIS environments are not just extensions of the capabilities of conventional database systems, but a dynamic environment able to accommodate and handle complicate geographic data structures and provide comprehensive information (Volvontas et al. 2001; Rodriguez-Bachiller, 1995).
45

4.2.1 Biomass Energy Systems Modelling
Based on the review presented in section 4.2, biomass energy systems modelling practises have been categorised mainly as: econometric (or techno-econometric) models, optimisation model, GIS models and hybrid models (combination of more than one type of modelling techniques).
4.2.1.1 Econometric Models
Junginer (2000) developed a methodology for setting up fuel supply strategies for large-scale (between 10 and 40 MWO biomass-energy projects using agricultural and forestry residues, which explicitly takes risks and uncertainties regarding availability and costs in relation to time into account. The methodology has been demonstrated as a case study in the north-eastern part of Thailand. Biomass price and availability have been analysed under different risk scenarios. It was concluded that assessing the risks of biomass fuel supply is vital for biomass electricity plants. In this modelling methodology, the other issues (e. g. technology choice, plant economics, social and environmental impact) of the biomass electricity plant were not analysed.
Mitchel (2000) has developed an econometric model for biomass energy application, based on a decision support system (DSS), with special reference to harvesting wood for energy from conventional and short-rotation forests. This model estimates delivery costs for wood fuel from forests in the UK.
An integrated technical and economic model (i. e. tech no-econometric) was developed for biomass electricity generation at village level and applied to the Indian village of Malgudi in the Karnataka State (Bharadwaj et aL 2000). The biomass resources considered were rice straw and husk, sugarcane leaves and straw, sugarcane bagasse and coconut shells.
The International Energy Agency developed the Bioenergy Assessment Model (BEAM) in 1992, with the purpose to build a computer based model to compare various biomass production processes and conversion systems. BEAM is an econometric type modelling technique; where cost and technical performance analyses of integrated biomass energy systems can be performed in excel modules. Users can input/change the default values of some parameters, like exchange rate, project life, annual interest rate, inflation rate, and maintenance cost, overhead cost and labour cost. The outputs of the model are: technical and economic indices of different bio-energy systems; which include: unit production cost, technical performance, and financial parameters NPV including Payback period (Madlener and Myles, 2000). The model is particularly useful for developers designing biomass energy system and whilst it does indicate profit and expenditure, it does not specify a project's impact upon the local economy or environment. It is used to model a number of biomass electricity projects both in Europe and USA (Madlener and Myles, 2000).
Biomass Socio-Economic Multiplier (BIOSEM) is a software tool developed under the European Commission's Fifth Framework Programme. The objective was to construct a quantitative economic model to capture the income and employment effects arising from the deployment of biomass energy plants in rural communities. The model can be used to assess the merits of different policy packages on biomass energy production. This modelling technique is applicable for regional and local biomass energy project evaluation (Madlener and Myles, 2000).
46

Another computer programme BIOSIMS was developed by Parikka (2000) to calculate the amount of biomass available to use as a fuel. The model was developed using the Statistical Analysis System (SAS) software package. The model can be used for energy planning. The developed model was used for a case study for a region in Sweden. It was concluded that the model can be used for other countries (Parikka, 2000). The model does not address the technical and economical issues related to the biomass electricity systems.
The Long-range Energy Alternative Planning (LEAP) is an integrated energy- environment and greenhouse gas mitigation analysis model-building tool, developed by the Stockholm Environment Institute, Boston (Heaps, 2001). This software can create econometric models by analysing biomass consumption, conversion and resource availability in a given area or region. By using demand analysis tools and transformation tools, it is possible to simulate alternatives. Transformation analysis can be used to study inter-regional transportation of biomass fuels. LEAP contains an environmental database, which contains the data on emissions of materials to the atmosphere, water and soil for typical end-use and transformation devices, such as cook stoves, boilers and charcoal kilns (Heaps, 2001). The main disadvantage is that different types of biomass electricity technology options and related economic analyses are not included in the software. LEAP has been used for biomass energy analysis in Nepal (WECS, 2001) and in the Phrao district of Northern Thailand (Siteur, 1997).
Costs, environmental impacts and macro economic impacts of energy (crop, electricity generation) systems were assessed and compared in two industrialised countries, Ireland and the Netherlands, and one developing country, Nicaragua (Broek et al. 2002). The results were compared with electricity production based on fossil fuels. Techno-econometric modelling technique was used in this study. The study also looked at the possibility of biomass energy related trade between the countries considered. It was concluded that the country context can have large impacts on the performance of systems that produce electricity utilising energy crops. The study did not consider the utilisation of agricultural or forestry residues and only direct combustion or co-firing of biomass fuel was used as the conversion technology.
4.2.1.2 OrAlmisation Models
Different mathematical models were developed by researchers for the optimisation of single or multiple-variable biomass electricity plants (Kanniappan and Ramchandran, 1998; Kanniappan and Ramchandran, 2000; Krukanont and Prasertsan, 2003; Kumar et al. 2003; Krukanont and Prasertsan, 2004). A linear programming model was developed by Kanniappan and Ramchandran, (1998) to optimize the distribution of land for different crops in order to maximise the surplus biomass production. The model has two groups of linear constraints. The first group of constraints was designed for the minimum production requirements of cereals, pulses, oilseeds, sugar, vegetables, and residues as fuel and animal feed to provide the requirements of the area. The second group was built for the available resources such as land area, human labour, animal power, and tractor power. The developed li near-prog ramming model was linked to the Hyper Undo software package to achieve the optimal solution required. Three different scenarios were used: 4. availability of biomass according to the existing cropping pattern 4. biomass that can be generated through the model solution , -L biomass that can be generated through the model by way of increasing the total
irrigated area in the two agricultural seasons of the year by 10%
47

Kanniappan and Ramchandran (2000) developed multiple objectives optimisation model in order to make an area self sufficient in energy. The objectives functions used in the study are electricity consumption, commercial energy consumption, generation of electricity from biomass and food production of that area. The constraints are human power, animal power, tractor power, land area and energy requirement of the area (such as cooking energy, lighting energy and energy for other operations). The developed model was applied for a typical area in the Didigul district of Tamil-Nadu State in India.
Mathematical relationship of the biomass fuel cost as a function of various economical parameters was developed for direct combustion based co-generation plant (Krukanont and Prasertsan, 2003). It was concluded that the maximum affordable fuel cost is dependent on the fuel moisture content, area-based annual availability of biomass, the required financial return, size of the power plant, and the operation of the power plant. Optimal capacity of the biomass electricity plant was calculated for maximum affordable fuel cost, for a given location of known area based biomass availability density (Krukanont and Prasertsan, 2004). The model was used in a case study in the southern part of Thailand. GIS data of rubber growing was used to locate the appropriate sites and sizes of the rubber wood residue-fired power plants.
Optimal plant sizes were calculated on the basis of the minimum electricity generation cost using agricultural residues (grain straw), whole boreal forest and forest harvest residues in western Canada (Kumar et al. 2003). Only the direct combustion of biomass was considered in this study for modelling. Similar to the finding of Krukanont and Prasertsan (2004), the study revealed that the optimal size of power plant increases with increasing biomass yield per unit area. HOMER is an optimisation model software, for off-grid or small grid-connected distributed power supply system. It was developed by NREL, US Department of Energy. It determines the optimal architecture and control strategy of the electricity generation system based on the least cost system configuration (NREL, 2005). HOMER also performs sensitivity and environmental impact analyses. The software can be used to identify the cost-minimising combination of different power generating technologies (pure biomass and dual-fuelled with different combinations) - to suit the load profiles. The inputs for HOMER are the electricity demand load data, biomass availability data, basic cost and performance data for each component, fuel price and interest rate. Analyses of the biomass availability, consumption are not addressed by HOMER. Moreover, the selection of biomass to electricity conversion technology is limited to types.
4.2.1.3 GIS Models
For a GIS model, input data sources can be from existing maps, field observations, aerial photographs, satellite imagery, tables and reports. Applications of GIS models for biomass energy planning are to evaluate the biomass resources, biomass electricity plant site selection and to assess the accessibility of the forest resources for fuel wood collection. The low-cost GIS tool provides accurate, consistent and robust estimates that are easy to update on a periodical basis (Haider, 2001). The GIS technique has been used in a case study for decentralised biomass energy planning at the Phrao district in Northern Thailand (Siteur, 1995).
A computer based decision support system, BRAVO (Biomass Resource Assessment Version One) was used in estimating the costs of supplying the wood fuel to any of the
48

12 coal-fired power plants in USA for the Tennessee valley authority (Noon and Daly, 1996). BRAVO was developed in a GIS platform, which is capable for an efficient analysis of the transportation network, thus enabling accurate estimates of hauling distances and related costs. BRAVO modelling system was effective in determining the cost and supply of potential biomass fuels for co-firing within the study region. The study concluded that BRAVO could be used in other regions as well if the input GIS data are available.
Voivontus et al. (2001) proposed a GIS-based decision support system to estimate the potential for electricity production from agricultural residues in the island of CRETE in Greece. The model handles all possible restrictions and candidate power plants are identified using an iterative procedure that locates biomass energy units and determines the cultivated area that is needed for biomass collection. It was concluded that the main parameters that affect the locations and number of biomass energy conversion facilities are plant capacity and spatial distribution of the available biomass resources.
4.2.1.4 Hvbrid Models
Fiala et al. (1997) developed a mathematical model to determine the optimal electricity- generation plant capacity. Optimal plant size was calculated to achieve a NPV of zero. Based on the optimal plant size, technical and economical studies were performed for the whole of Italy considering only a specific type of conversion technology - direct combustion co-generation. Optimisation and econometric modelling techniques were both are used in this study.
Biomass-based economic energy supply structure was modelled by employing mixed- integer linear optimisation technique, integrated with a decision support system (Nagel, 2000a). Economic potential, type of feasible technology, plant economics, C02 emissions and biomass fuel supply risks are addressed in the model. The developed model was tested in the state of Brandenburg, Germany (Nagel, 2000b). It outlined the possibilities and boundaries for the use of biomass in Brandenburg. The conclusions of these two studies were: , 4ý attempt should be made to reduce the biomass fuel price; and -; L some economic measures such as C02 taxes, state subsidies for biomass energy
plants should be adopted.
A computer program was developed by Papadopoulos and Katsigiannis (2002) for the estimation of the monthly optimal composition of mixed solid biomass fuel by minimising a cost function. Technical and economic feasibility studies of the direct combustion based co-generation plant have been integrated in the program. The model was tested for a wide geographical area in the north-east part of Eastern Macedonia - Thrace region of Greece.
Freppaz et al. (2003) proposed a decision support system to assist the biomass management for energy supply at a regional level, by integrating the GIS, optimisation and econometric modelling techniques. The developed model was applied to a small mountain area in Italy as a case study, with particular attention to the available biomass, optimal size of plant, technological aspects and economic viability (i. e. cost of energy production).
49

4.3 Biomass Energy Systems Modelling in Bangladesh
The first effort to model the Bangladesh energy system has began in 1981 at the Planning Commission of the Government of Bangladesh (Bala, 1997). The result of that effort was an integrated model of the Bangladesh energy supply and demand - Rural Energy and Agricultural Development Analysis (RADA) - which has been used in projections for energy policy analysis.
Biomass generation and consumption in a Bangladeshi village were estimated and a sustainable rural energy planning model using the biogas plant was developed - see Figure 4.3. This study was concentrated only for one village (Biswas, 1995) and biomass electricity generation technology option is not included in it. Econometric type modelling technique was used in this study.
Bala (1997) presented a typical example of a demand-branch structure for Bangladesh employing LEAP. In this modeling approach, the boftom-up rural energy supply and demand structure analyses has been used for sustainable rural energy planning in Bangladesh. The C02 emissions of the rural energy systems were estimated using environmental database of LEAP. However, biomass electricity technology options and associated economics were not been considered.
Biomass energy production and consumption were studied in 21 clusters of the households (Biswas and Lucas, 1997b). In this study, econometric type of modelling technique was used to study the economic viability of the biogas technology at a village in Bangladesh. It was concluded that the creation of the market for local biogas would make the biogas generation project feasible (Biswas and Lucas, 1997b).
Analysis of the biomass energy supply and consumption in two villages was performed by Bari et al. (1998), using questionnaire survey methods. Different types of survey methods such as broad questionnaire survey, sample questionnaire survey and physical monitoring were used to determine the most effective method. The study showed that the broad questionnaire survey gives a fairly general picture of both biomass supply and use. Biomass utilisation for electricity generation and technology option were not addressed in this model. The main conclusion of this study was biomass fuel use vary with variations in different socio-economic groups and village.
The dynamic nature of the rural energy sector in Bangladesh has been described only to a limited extent. Alam et al. (1999) presented a quantitative dynamic model for rural household biomass consumption in Bangladesh. The model was used for simulation in both the basic and policy planning modes for the period 1981-2000. A comparison between the model results and the reported values were in good agreement with an error of less than 15%. An econometric modelling technique has been used in this study.
Biswas et al. (2001) developed an integrated, ecological, economic and social model for sustainable rural development in villages in Bangladesh. The model is capable to show how a local business or cooperative approach to renewable energy technology could help create income-generating activities for rural landless and marginal farmers and women from these households. To illustrate this, a hypothetical case study including the installation of a biogas plant was carried out (see Figure 4.4). This model is an example of hybrid type modelling, which involve econometric and optimisation modelling techniques.
50

LO m 0) TI»
cl;
cö cm 0
. r2 c3)
CL
(13
22
0 2 Ci
LL

Supporting organisation
Target groups Income generating activities
Benefits of sustainable development
External 0- Village Lighting Additional income for agency organisation and those who build and
, cooking maintain biogas plants. women or men Greatly reduce air
Bank pollution in kitchens.
Gas lighting - education Micro credit Cattle bank farming Improved social equity.
Figure 4.4 Simplified system using biogas as a cost study (Biswas et al. 2001)
4.4 Conclusions
The term 'sustainability' represents a state, and 'sustainable development' indicates a change. Sustainability is generally defined as meeting the needs of present generation without compromising the ability of future generations to meet their own needs. SERC (2005) described the term sustainability as the "fundamental principle of any energy policy: the long term maintenance of diverse and productive ecosystems upon which all life depends". For the development of third world countries, the term sustainable development does not merely refer to the change of an unsustainable economy into a sustainable one. For them, it reaches beyond that by including the pursuit of economic equity and growth (Siemons, 2002). Kartha and Larson (2000) outlined the factors related to biomass energy systems and sustainable development - see Figure 4.5).
Biomass energy situations and problems are site-specific. They vary from country to country, from province to province within countries. There is no universal too[ to model biomass energy systems. Most researchers developed their own models, which are applicable to a specific country or a region. The choice of the biomass energy system modelling technique largely depends on the objectives and scope of planning. The model should match the level of planning, e. g. macro-level planning or decentralised planning.
No well established biomass energy system modelling was found for Bangladesh. For developing a sustainable biomass electricity model for Bangladesh, different issues such as biomass generation, availability, technology, costs and environmental effects need to be integrated. GIS based information is yet to be established in Bangladesh. Biomass availability, technology choice, economics and environmental effect of biomass to electricity systems could be performed by econometric modelling technique together with the help of decision support system. Optimisation technique is needed to determine the economic size of the biomass electricity plant. So, a hybrid type biomass energy modelling techniques, which is a combination of tech no-econometric and optimisation techniques would be applicable for Bangladesh. Development of the
52

computer programme is required to integrate these for building decentralised sustainable biomass electricity modelling for Bangladesh.
Energy Services Running water Lighting Cooking Heating Cooling Irrigation Milling etc.
I
Electdcity Fuels Cogenerabon
Biomass Conversion Systems
Impacts on Economy, Equity, Social Structures, Empowerment and Environment
Sustainable Development
I Biomass Production I
Figure 4.5 Conceptual representation of biomass energy systems and linkages to sustainable human development (Kartha and Larson, 2000)
53

CHAPTER 5 BIOMASS GENERATION, CONSUMPTION, AND POTENTIAL FOR ENERGY IN BANGLADESH
5.1 Introduction Biomass energy is an important source of energy in most Asian countries. Substantial amounts of fuel wood, charcoal and other biomass energy such as agricultural residues, dung and leaves are used by households and industries. The main household applications are cooking and heating, whereas industrial applications range from mineral processing (e. g. bricks, lime, tiles and ceramics manufacturing), food and agro-processing, metal processing, textiles to miscellaneous applications such as road tarring and tire retreading. Besides these heating applications, biomass fuels (e. g. bagasse and oil palm residues) are widely used for electricity generation or the co-production of electricity and steam in industry (Koopmans and Koppejan, 1997).
The energy potential of biomass resources has been assessed in some Asian countries (e. g. in China, India, Srilanka, Thailand, and Malaysia) (Battacharya et al. 2003; Runqing and Junfeng, 2003; Yokoyama et al. 2000; and Perera et al. 2003). No such an assessment has been carried out for Bangladesh. The principal biomass resources in the country are agricultural wastes, animal waste, fuel wood, municipal solid waste and sewage sludge. In this chapter, country's total amount of available biomass resources, in 2003, has been estimated. To calculate the biomass generation rates; factors such as yield to residue ratio, moisture content and calorific value have been assumed to be the same as those employed or measured in neighboring Asian countries. Not all biomass residues generated can be utilized for energy. In some instances, it would not be economical to do so, such as when their wide dispersal or low bulk density makes recovery, transport, and storage too costly. Residues may be more valuable if used for purposes other than energy. One such use would be recycling residues onto the land, to help restore nutrients or reduce erosion. Residues might also be recovered for other domestic, industrial, or agricultural uses, such as for building materials, paper manufacturing, or animal fodder (Hall et al. 1993). Amount of biomass available for electricity generation was then estimated by deducting the biomass consumption from the amount of biomass which is recoverable. Amount recoverable is either less or equal to amount generated.
5.2 Land Use
The total land area of Bangladesh is 1.3017 x 10" M2, of which 61.6% is arable land (see Table 5.1). Bangladesh has a relatively low proportion of forest cover. In 2000, forests and woodlands represented only 10.2% of the total land area of the country compared with averages of 17.76 and 29.4% for Asia and the world, respectively (FAO Forestry, 2003). Most of the forest areas are located in the northern and eastern border parts of the country, as well as along the coast of the Bay of Bengal in the south (FAO Forestry, 2003).
54

Forests in Bangladesh are subject to heavy pressures in terms of both demands on wood production and competing land uses due to the large, increasing population. Total plantation area in the country was 3.32 x log M2 in 1990, of which 1.98 x 10' M2 were in the northern and eastern hill forests and 1.13 x 10⁹ M2 in coastal regions (FAO Forestry, 2003). The estimated-planted forest area in the country in 2000 was 6.25 x 10⁹ M2 (FAO Forestry, 2003) - see Table 5.2. In order to achieve a sustainable management of forest resources in Bangladesh, the Forest Master Plan (1993), developed by the Bangladeshi Ministry of Environment and Forest, suggested an annual planting target of about 1.8 x 10⁸ m2 during 1993 - 2002 and 2.1 X 10⁸ M2 during 2003 - 2012 (MEF, 1993). Potential areas for industrial plantation totaling about 7.0 x 10⁹ M2 exist in the Chittagong and Sylhet divisions (FAO Forestry, 2003).
Type of land use Area (10 7M2
Agricultural land: Arable landa 8019 Permanent cropSb 410 Permanent pasturec 600 Total 9029
Forests and woodlands 1334 Urban areas and mountains 2654 Total land area 13017
*land under temporary crops; b crops that occupy the land for long periods and need not be replanted after harvest; 0 land used permanently (; --5 years) for herbaceous forage crops
Table 5.1 Land use in Bangladesh in 2000 (FAOSTAT, 2004; FAO Forestry, 2003)
Area of plantation % of total area according to
Species group the type of plantation stated 10, M, % of total area Industrial Non industrial
Acacia spp. 32.0 5.1 48 52 Dalbergia 10.7 1.7 100 Eucalyptus 37.3 6.0 48 52 Gmelina 21.3 3.4 48 52 Mahoganies 5.3 0.8 100 Rubber 91.8 14.7 100 Teak 143.9 23.1 100 Other broad leafed 282.5 45.2 48 52
Total 624.8 100.0
Table 5.2 Plantation areas in Bangladesh in 2000 by species groups (FAO Forestry, 2003)
55

5.3 Biomass Resources
The economy of Bangladesh depends principally on agriculture. The main crops produced are rice, sugar cane, vegetables, wheat, jute, pulses, coconuts, maize, millet, cotton and groundnuts (see Table 5.3). Agricultural crops generate large quantities of residues. Such residues represent an important source of energy both for domestic as well as industrial purposes. Other sources of biomass in the country are farm-animal wastes and poultry droppings produced by the national herds (see Table 5.4), fuel wood from existing forests, tree residues, and saw dust from the forestry industry (see Table 5.5). The 138.1 million (World Bank, 2005) citizens of Bangladesh produce huge amounts of human waste and municipal solid waste (MSW) annually.
Crop Annual production ratea
Rice 39.090 Sugarcane 6.838 Vegetables (total) 1.837 Wheat 1.507 Jute 792.000 Pulses (total) 345.000 Coconut 88.000 Millet 57.000 Cotton b 45.000 Groundnut 34.000 Maize b 10.000
Annual production rates for rice, sugarcane, vegetables and wheat are In Mtonnelyear. For the rest of the agricultural crops the production rates are In ktonne/year.
b Annual production of rates of cotton and maize Is not available for 2003, so production rates of 2002 were used.
Table 5.3 Annual yield of agricultural crops in Bangladesh in 2003 (FAOSTAT, 2004)
Species Number of heads (millions)
Farm animals: Cattle 24.500 Buffaloes 0.850 Goats 34.500 Sheep 1.260
Poultry 153.000
Table 5.4 Number of heads of national herds of farm animals and poultry in Bangladesh in 2003 (FAOSTAT, 2004)
56

Biomass Annual production rate Moisture content Annual resource production
rate (Mtonne) Reference (% by Reference (Mtonne
mass) dry matter) Fuelwood 6.932 FAO Forestry (2003) 20 Yokoyama et al. (2000) 5.546 Tree residues 1.8218 Hashem (1996) - 1.821 Saw dust 0.118 Moral (2000) 20 Yokoyama et al. (2000) 0.094
' dry matter content
Table 5.5 Annual rates of waste generated by the forests and forestry industry in Bangladesh
5.3.1 Agricultural Residues
There are two types of agricultural-crop residues; field residues and processing residues. Studies in some neighboring Asian countries (Yokoyama et al. 2000; and Koopmans, 1998) produced useful residue-to-yield ratio for several agricultural crops. These ratios have been employed in this study, together with published productivity figures (FAOSTAT, 2004) for the individual crops (see Table 5.3), in order to estimate the rate of generation of the corresponding residues in Bangladesh (see Table 5.6).
Crop residues can be collected, mostly by bailing, either at the same time or after the primary crop has been harvested. Not all field residues are recoverable; some must be left to maintain soil quality and prevent soil erosion (Hall et al. 1993). The percentage of field residues of a crop to be recycled onto the land depends upon the specific local climatic and soil conditions (FAE, 2005). There is no available specific data concerning the common practices in Bangladesh or the neighboring Asian countries. However, in developed countries, it has been proved that only 35% of field crop residues can be removed without adverse effects on future yields (FAE, 2005). Crop-processing residues, on the other hand, have a 100% recovery factor. Accordingly, it is estimated that the total annual amount of recoverable agricultural-crop residues in Bangladesh is 41.994 million tonnes, of which 62.5% are field residues and 37.5% are process residues (see Table 5.6).
5.3.2 Animal Wastes and Poultry Droppings
Manure from cattle, goats, buffaloes and sheep are the common animal wastes in Bangladesh. The quantity of waste produced per animal per day varies depending on various factors (e. g. body size, type of feed and level of nutrition).
In 2003, total population of chicken and ducks in Bangladesh were 140 and 13 million heads respectively (FAOSTAT, 2004). There are two types of chicken, broiler and layer. Individual population data, however, is not available. Othman et al. (1996) reported that the average amount of droppings (on air-dry basis) produced by broiler and layer are 0.02 kg/bird/day and 0.03 kg/bird/day respectively. A conservative estimate of the national production rate of poultry droppings can be achieved by considering that all the chickens are of broiler type and production rate of ducks is the same as for chicken.
57

kl -am LO n (» v) (0 CD e Co (0 eMM c\I CD c4 M CY LO 00 le LO W) ci C, 4 r) 0 Co (3) le LO - tn -CO P- (0 (D
Z (D (D eD (D >
C%j Co v2 N C, 4 ý (D ý C) 0- 0 C, 4 C, 4 CO LO
c: Z U) c (D
cy cq
(D 0
C» c3) Ma) (» 0) nZ Z -Z I ,- .
e CD (D 0) (D (D 12 » (D c2. c3. c2. (D Q 0. (2.
0 00 C, 4 C*4 00 22-- ----2 2 ID
- Co m (0 cý4 T) CY «0 «a ', ' Gý Gý ci C, 4 C, 4 M (U ci CN ri r: r -0 0 C: ) - (D (D 0 (D Q Ch CD r_ r_ 0 (D (0 0 CD M Co CD C) C> (2 C> C: ) C> (U Co m C'd U) ci (N 0 Co M LY (lö CN CIJ C, 4 cn U) E r- -ý7 c: r- rr E E
0 0. 11. M 0- 22 9m 0- F- F- 0- a. M Co ýQ ED E0C a 9 ýA - - 0 OD0 EE
0 LU C2 WW (2 C W LU W . . L 0 W. 2 wwwC, c2. 0 0 00
000- lý 0 0 o 0 00 : rt
-2
ýe mw L) Q>> CY- 22
. 0, r- to CD 10 r4 LD " r4 CD (D 'e (» 00 LO -N N PZ 0 cý ý CN4 CY cýJ
E (D
Co «ý M (D M CO r4 t- to r- M r- C) p- Ict (1) (0 e') C%J (0 C, 4 (D cli ;ZMMC, 4 Ict LO N (0 M le CO rl -M
e (»
00 Z ;, >ý
- (» CO cý4 CI-4 cli le CM C» N M (0 (D p2 - uý (D - C, 4
M Co r- " (0 0 CD coe Lo (0 Lo (0 p2 C%J (0 (N LO M LD t- C, 4 (D r- CY M to r2 re -e Co r) M r_ (0 :3 el) -
C, 4 (0 CD ce N (0 0 le CN C) N (0 C, 4 cli N LO (D cl - LO r- (D
iß mu (0 N-- M
(D C [)ý (D 0
Cm r,
0 CD C> Lo
0
Q (D C) r4 ------ CN C, 4 ------ Co CD OD Co Co 00 20
Co Co Co CD OD OD C) C) (» M 0) 0) C) (» (D M c) 0) 0) » tu m
E Mc c» a) a) c» ch LD ko c» c» a) c» c) 0)
--- CD Q. ýý--ý" (1) Z: 5 e) U) U) 0 U) Co U) c4 CY mM0 cn Co CO U) Co
EE...... m Co mmm Cm >, EEEEEEED-IL 5UEEEEEE
2 J
o c2. a 92. CL CL 92. CL LU LU 00 CL 0. Cl CL (2. Cl. -le 0000000 () (j -be 000000 ) (D 00000000155 00000000 :222 -2 W. M2--: >222 ýe ýz id '0 - U) (D 0 Lii M p2 NeM0e c» r- el (» N-M cq N (» r-- ö rIlý C, 4 In ci (0 CO C'4 e rý N Ic! >ý N cý c; c4 ýý
C, 4 (D (D QQ
0
.0 jg 0 a) (D
U) e: > je
E CL M U) Co 0EEZ (0 = -, e Z Co
.2 in 3: cn u) M0 U) U) m a) U) 2 LD e Z ID 10 t5 -ýe --ýý CD
tß 0 M r- 32 u) u) 14 r- c: u) MM u) Lu 0)
-ý i§ -. Z) ýt *5 8 :, r- li mv fýi . - . cu M
9) (D -ccZZ0 OMM c r- 0) (D r- 0 :30 :p :p U) 8g (D a) U) (1) 8'8 e 1-- u) u) j2 a) , Mme j2 E
j 1 KY- cr_ 0 (5 o (1 2
M CD CD C, 4
cm
CL
2
Co
M c
0
.0
00 W)

The annual production rates of animal wastes and poultry droppings were estimated by employing the number of heads of the national herds (see Table 5.4) and the waste generation rate per head for the individual species as estimated in neighboring Asian countries (see Table 5.7). The recovery/collection factors for animal waste and poultry droppings were considered to be 60% and 50%, respectively (Narang et al. 1999; and Othman et al. 1996). Accordingly, it is estimated that the total annual amount of recoverable animal wastes and poultry droppings in Bangladesh is 20.619 million tonnes (see Table 5.7).
5.3.3 Human Waste and Municipal Solid Waste
The total rate of human waste generation by the 138.1 million citizens (World Bank, 2005) in Bangladesh has been estimated as 4.537 million tonnes of dry matter/year (i. e. 0.09 kg/capita/day) (Narang et al. 1999). Compared with an average MSW generation rate of 0.4 kg/capita/day in Indian cities (Narang et al. 1999), in urban areas of Bangladesh the rate is between 0.4 to 0.5 kg/capita/day (REIN, 2005e). In rural areas of the country, the generation rate is only 0.15 kg/capitalday (REIN, 2005e). Estimated rural and urban population are 108.56 and 29.54 respectively (see Appendix C) in 2003. Considering that human waste and MSW are 100% recoverable, the total annual amount of the biomass available from these two sources in Bangladesh is 14.793 million tonnes (see Table 5.8).
5.3.4 Forests and the Forestry-Industry
In Bangladesh, forests are subject to heavy pressures in terms of both demands on wood production and competing land uses due to the large, increasing population. Deforestation, environmental degradation, the growing demand for traditional energy and the lack of development in the forestry sector are serious concerns for the government and the people in general. Agriculture can no longer support any more labour. Employment of the ever-increasing rural labour force is dependent on the growth of rural industries, which, in turn, are very much dependent upon the existence of a sustainable supply of biomass fuel, especially fuel wood. The forest land is unevenly distributed in 64 districts. The locations of Bangladesh forest are shown in Table 5.9. Forest biomass includes tree components such as trunk, branches, foliage and roots. Tree trunks and main branches constitute what is commonly known as fuel wood. Twigs, leaves, bark, and roots are tree residues. The total fuel wood production in Bangladesh in 2003 was 6.932 million tonnes (FAO Forestry, 2003).
Rate of generation Waste recovery Biomass (kg of dry matter/head/day) (Mtonne dry rate (Mtonne dry
Value Reference matterlyear) matter/year)
Animal waste: Cattle 2.86 Narang et al. (11999) 25.576 15.345 Buffaloes 2.52 Narang et al. (1999) 0.782 0.469 Goats 0.55 Narang et al. (1999) 6.926 4.156 Sheep 0.33 Narang et al. (1999) 0.152 0.091 Subtotal 33.436 20.061
Poultry droppings 0.02 Othman et al. (1996) 1.117 0.558 Total
1 1 1 34.552 20.619
Table 5.7 Generation and recoverable rates of animal wastes and poultry droppings
59

Biomass Rate of generationo
Waste recovery
rate Moisture content Waste
recovery rate
(kg/capita/day) (Mtonne/ (Mtonne/ (% by Reference (Mtonne dry
, year) year) mass) matter/year) Human waste 0.09 4.537 , 4.537 4.537
MSW: 0.000 0.000 0.000 Urban 0.4 4.312 4.312 45.0 REIN (2005e) 2.372 Rural 0.15 5.944 5.944 45.0 REIN (2005e) 3.269
Subtotal MSW 10.256 10.256 5.641 Total 14.793 14.793 10.177
'Calculation of human waste generation rate is based on dry matter.
Table 5.8 Generation and recoverable rates of human waste and IVISW in Bangladesh in 2002 (Narang et al. 1999; REIN, 2005e)
Forest type Location (district) ..... ..
Mangrove forest (Tropical evergreen) Sundarbans Khulna, SatkhIra Coastal Cox's Bazar, Chittagong, Noakhali, Barishal,
Patuakhall, an adjacent coastal districts Hill forest (Tropical moist evergreen) Chittagong, Sylhet, Comilla, Rangamati,
Bandarbon, Khagracharl Plain land sal forest Dhaka, Tangail, Mymensingh, Dinajpur
I
(Tropical moist deciduous)
Table 5.9 Forest type and location (Hashem, 1996)
Estimates for the rate of supply of tree residues in recent years are not available; in 1992, it was 1.821 million tonnes (Hashem, 1996). Both wood processing residues (e. g. sawmill off-cuts and sawdust) and recycled wood (e. g. that derived from the demolition of buildings, pallets and packing crates) are important sources of energy. The annual amount of such recycled wood, on a sustainable basis, is, however, not known. It has been estimated that only about 20% of a tree, initially harvested for timber, results in sawn products. The remaining 80% is discarded, in equal proportions, as forest residues and process residues (i. e. bark, slabs, sawdust, trimmings and planer shavings) (Koopmans, 1998). Ply mills produce about the same amount of residues as sawmills (Koopmans, 1998). In 1998,0.118 million tonnes of sawdust was available for energy purposes (Moral, 2000). Considering 100% recovery rate, the annual amount of recoverable biomass from forests and forestry-industry in Bangladesh is 8.871 million tonnes (see Table 5.6).
5.4 Total Energy Potential of Recoverable Biomass Resources
The total annual generation and recoverable rates of biomass in Bangladesh is 148.983 and 86.276 million tonne/year, respectively (see Table 5.10). Agricultural residues represent 48.7% of the total recoverable biomass, followed by a 23.9% contribution from animal wastes and poultry droppings. Using the lower calorific values of the individual biomass components, the energy potential of the annually recoverable 86.276 million tonnes of biomass is estimated at 1125.345 PJ (or 26.794 mtoe) (see Table 5.11), which is equivalent to 312.596 TWh.
60

Biomass resource Rate of
generation (Mtonne/year)
Waste recovery rate (Mtonne/year)
Waste recovery rate (Mtonne dry
matter/year) Crop residues:
Field residues 75-035 26.261 22.699 Process residues 15.732 15.732 13.168
Animal wastes and poultry droppings 34.552 20.619 20.619 Human wastes and MSW 14.793 14.793 10.177 Forests and Forestry-industry 8.871 8.871 7.461
Total 148.983 86.276 74.124
Table 5.10 Annual generation and recoverable rates of biomass from different sources in Bangladesh
Biomass Recovery Recovery Lower calorific value rate rate' Energy
(ktonne/ (ktonne dry (GJ/ Reference content year) matter/ tonne) (PJ)
year) Field crop residues:
Rice straw 23190 20245 16.30 Yokoyama et al. (2000) 329.994 Wheat straw 923 854 15.76 RWEDP (2002a) 13.459 Sugarcane tops 718 359 15.81 Koopmans (1998) 5.676 Jute stalks 832 753 16.91 RWEDP (2002a) 12.733 Maize stalks 7 6 14.70 RWEDP (2002a) 0.088 Millet stalks 35 30 12.38 Koopmans (1998) 0.371 Groundnut straw 27 24 17.58 Koopmans and Koppejan (1997) 0.422
Cotton stalks 43 38 16.40 RWEDP (2002a) 0.623 Residues from 257 257 13.00 ICCEPT (2005) 3.341 vegetables Residues from 229 229 12.80 ICCEPT (2005) 2.931 pulses Subtotal 26261 22699 369.638
Process crop residues Rice husk 10437 9143 16.30 Yokoyama et al. (2000) 149.031 Rice bran 3244 2952 13.97 Koopmans (1998) 41.239 Sugarcane 1983 1011 18.10 Koopmans (1998) 18.299 Bagasse Coconut Shells 11 10 18.53 Koopmans (1998) 0.185 Coconut husks 36 32 18.53 Koopmans (1998 0.593 Maize cob 3 3 14.00 RWEDP (2002a) 0.042 Maize husks 2 2 17.27 RWEDP (2002a) 0.035 Groundnuthusks 16 15 15.66 Koopmans and Koppejan (1997) 0.235 Subtotal 15732 13168 209.659
Total agricultural-crop 41994 35867 579.297
residues
Other biomass: Animal waste 20061 20061 13.86 Parikh and Ramanathan (1999) 278.045 Poultry droppings 558 558 13.50 Othman et al. (1996) 7.533 Human waste 4537 4537 10.60 RWEDP (2002a) 48.092 MSW 10256 5641 18.56 RWEDP (2002a) 104.697 Fuelwood 6932 5546 15.00 RWEDP (2002a) 83.190 Tree residues 1821 1821 12.52 Hashem (1996) 22.799 Saw dust 118 94 1 18.00 RWEDP (2002a) I' 692
Total 1
1125.345
a moisture content are 20% by mass for residues from vegetables and pulses
Table 5.11 Energy potential of biomass resources in Bangladesh
61

5.5 Biomass Consumption
In Bangladesh, biomass is used as an energy source as well as for non-energy purposes. It is widely utilised in both rural and urban areas of the country, as a domestic fuel for cooking and heating. Many commercial and industrial facilities employ biomass for the provision of process heat. In addition, some quantities of biomass are used as animal fodder, animal bedding, building material, material for furniture making, and as an organic soil conditioner (i. e. fertiliser). There is no available data for the rates of biomass consumption for these non-energy uses. It is, however, believed that the amount of biomass involved represents a small proportion of the total consumption figure, and, therefore, will not be considered in this study.
The pattern of utilisation of biomass for energy varies according to the region of the country, the prevailing socio-economic conditions and the availability of commercial fuels (Alam, 1991; and Biswas and Lucas, 1997a). Figure 5.1 presents estimates for the annual rates of consumption of biomass for energy in Bangladesh.
Animal waste, 14%
Fuel wood, 18%
Tree residues, 5% Crop residues, 63%
(a) According to biomass source
Non agro-based industry Agro-based industry, 15.63% and commercial, 3.35%
Domestic cooking (urban), 16.51%
Domestic cooking
000
(rural), 64.51%
(b) According to consumer sector
Figure 5.1 Biomass consumption for energy in Bangladesh (Bose, 1996)
62

Domestic cooking, particularly in rural areas, represents the largest single consumer of biomass. Table 5.12 presents statistical data for total biomass energy consumption in some developing countries in Asia. Although the use of biomass energy per capita in Bangladesh exhibited an average decreasing trend between 1981 and 1991 and was below the regional average in 1991, the total biomass consumption has increased as a result of the rapid population growth. Many other developing Asian countries have experienced similar trends (RWEDP, 1997).
5.6 Biomass Energy Available for Electricity Generation 5.6.1 Whole Country
In 1991, the biomass consumption for energy was 276.6 PJ (or - 6.6 Mtoe) (see Table 5.12). At an average annual growth rate of 1.3% (see Table 5.12), the consumption in 2003 was estimated to be 319.75 PJ (or - 7.613 Mtoe). The total available recoverable biomass energy of the country in 2003 was estimated as 1125.345 PJ, which is equivalent to 26.794 Mtoe (see Table 5.11). Accordingly, in 2003,805.595 PJ or 223.776 TWh of biomass energy was available for the generation of electricity. In 1998, the total biomass energy consumption was estimated at 435.204 PJ (or - 10.362 Mtoe) (RWEDP, 2002a). Assuming the same average annual growth rate of 1.3%, the biomass consumption in 2003 would be 463.492 PJ (or - 14.484 Mtoe). This is equivalent to 3.356 GJ/capita/year. Based on this estimate, the amount of biomass energy available in 2003 was 661.853 PJ, which is equivalent to 183.848 TWh. Considering that the consumption of biomass for non-energy purposes is negligible, the annual available biomass energy potential in Bangladesh, varies from 183.848 to 223.776 TWh, for electricity generation in 2003.
Biomass annual consumption rate
Total Per capita Per unit of GDP Country Population GDP
(millions) (US$/capita) Average Average Average P. 1 annual (GJ/capita) annual (GJ/ US$) annual
growth rate growth rate growth rate M M M
Bangladesh 116.4 176 276.6 1.3 2.4 -1.2 13.5 -2.7 Bhutan 1.6 200 11.7 4.8 7.4 2.6 37.2 -1.6 Cambodia 8.6 5.4 2.7 0.6 0.0 China 1170.7 337 2017.8 2.7 1.7 1.2 5.1 -5.9 India 862.7 370 2823.7 2.7 3.3 0.6 8.8 -2.4 Indonesia 187.7 523 1464.8 2.2 7.8 0.2 14.9 -3.1 Lao PDR 4.3 310 38.5 2.8 8.9 -0.1 28.7 Malaysia 18.3 2449 90.2 2.7 4.9 0.0 2.0 -3.3 Myanmar 42.7 243 192.8 2.1 4.5 0.0 18.5 1.0 Nepal 20.1 166 205.7 6.2 10.2 3.3 61.6 1.6 Pakistan 121.5 341 296.2 4.4 2.4 1.1 7.1 1.5 Philippines 63.8 596 381.8 2.2 6.0 -0.3 10.0 1.0 Sri Lanka 17.4 455 89.4 2.5 5.1 1.0 11.3 1.6 Thailand 55.4 1334 526.4 0.8 9.5 -0.6 7.1 6.6 Vietnam 68.1 721 250.8 2.4 3.7 0.3 5.1
Table 5.12 Biomass energy consumption in some Asian developing countries in 1991 and the average annual rate of growth in the period 1981 - 1991 (RWEDP, 1997)
63

5.6.2 District wise
In previous section, total amount of biomass available for electricity generation in 2003 has been estimated for the whole country. District wise availability of the biomass resources are needed to model the sustainable small to medium-scale biomass electricity plant for off-grid decentralized electricity generation in Bangladesh. District wise generation rates are not available for all types of agricultural crops, considered in section 5.3. District wise generation rates of rice, wheat, jute, sugarcane, vegetables and pulses are available for year 1998 (see Appendix C). District wise rural and urban population and number of farm-animals and poultry heads are available for year 1998 and 1996 respectively (see Appendix C). In this study, district-wise population, generation rates of agricultural crops, and number of farm-animals and poultry heads has been estimated for year 2003 (see Appendix C), using the following relationship:
Wd in 2003 =
Wt in 2003
* Wd in 1998
Wt in 1998
where Wd
in 2003 Generation rates of agricultural crops/number of farm animals and poultry/urban or rural population in a district, in 2003
Wt in 2003 Generation rates of agricultural crops/number of farm animals and
poultry/ urban or rural population in the whole country, in 2003 Wd
in 1998 Generation rates of agricultural crops/number of farm animals and poultry/ urban or rural population in a district, in 1998/1996
Wt in 1998 Generation rates of agricultural crops/number of farm animals and
poultry/ urban or rural population in the whole country, in 1998/1996
There is no district wise biomass generation data from forests and forestry industry. District wise forestry area is available for 1998 (see Appendix C). District wise generation rates of biomass from forests and forestry industry in 2003 were estimated by assuming that the residues are proportional to the forested areas in the individual districts and that such area remain unchanged during the period 1998 - 2003 (see Appendix C).
Same methodology, which was used for the whole country, has been adopted to estimate the district wise availability of the biomass resources for electricity generation. Distribution of the number of heads of individual species of the farm animals are not available by districts (see Appendix C). As a conservative estimate, waste generation rate of per head buffalo was used as the waste generation rate of cattle and buffaloes together. Similarly, waste generation rate of per head of sheep was used as the waste generation rate of goats and sheep together. District wise biomass consumption rate data is not available. National rate of the biomass consumption data (i. e. 3.356 GJ/capita/year) has been used for estimating the district wise biomass availability, assuming that the difference between the national average rate of biomass consumption and rate of biomass consumption in any district is negligible. Figure 5.1 (a) was used to estimate the source wise biomass availability in any district. The biomass availability of districts Serajganj and Pabna is shown in Table 5.13. The negative figures of forestry residues indicate shortages. The reasons for choosing these two districts are their highest total biomass energy potential. Biomass availability for any other district has been estimated - see Appendix B and Appendix E.
64

Type of biomass resources Serajganj Pabna Ktonne dry PJ/year Ktonne dry PJ/year mattertyear mattertyear
Farm animal waste 240.10 3.328 224.23 3.108 Poultry droppings 10.73 0.145 8.40 0.113 IVISW 107.16 1.989 95.48 1.772 Human excreta 96.49 1.023 81.28 0.862 Agricultural waste 6957.83 113.590 6150.22 100.813 Forests and forestry-industry residues -151.12 -1.773 -127.32 -1.495 Total" 7261.19 118.300 6432.28 105.173
]
(32.861) (29.215) figures within the breast represents the biornass energy in TWhlyear
Table 5.13 Biomass available for electricity generation in district Serajganj and Pabna
5.7 Biomass Savings
In many developing countries, the efficiency of utilisation of biomass in traditional systems is very low. Tables 5.14 and 5.15 present reported figures for the efficiencies of typical household stoves used in Asia. A large amount of biomass can be saved annually In the country by using improved (i. e. more efficient) cooking stoves, furnaces, boilers and other devices consuming biomass fuels. Bhattacharya et al. (1999) estimated total biomass saving potential of 322 million tonnes annually, through efficiency improvement of biomass energy utilization, in selected seven Asian countries - India, Pakistan, Nepal, Philippines, Sri Lanka and Vietnam. Of the total savings, domestic cooking represents highest biomass savings, of about 152 million tonnes of fuel wood and 101 million tonnes of agricultural residues (13hattacharya et al. 1999).
The traditional mud cooking stoves used in Bangladesh exhibit overall efficiencies of only between 5 and 10% (Banu, 1996). A number of improved stoves have been developed at the IFIRD of BCSIR. These have been classified as (Banu, 1996):
improved stoves without chimney, which save 50-55% fuel compared to the traditional stove;
stoves with chimney, with a fuel saving of 60-65% ; and stoves with waste heat recovery.
Fuel Combustion efficiency Overall efficiency N N
Biogas 99 57 LPG 98 54 Kerosene 98 50 Fuelwood 90 23 Crop residues 85 14 Dung 85 11
Table 5.14 Efficiencies of typical household stoves in South Asia (RWEDP and UNEP, 2000)
65

Type of stove Biomass fuel Combustion efficiency
M
Heat transfer efficiency
M
Overall efficiency
M) Open and three stone fire places Fuelwood 90-92 20 18 Solid stoves with or without chimney Fuelwood 80-91 15-29 14-24
Agricultural residues 77-90 11-14 10-14 Animal waste 82-89 10 9
Portable ceramic or pottery stoves Fuelwood 89 33 29 Agricultural residues 86 22 19 Charcoal 85 20 17 Animal waste 88 15 13
Portable ceramic/metal stoves Fuelwood 91 24-29 21-26 Agricultural residues 91 24 22
Table 5.15 Efficiencies of household stoves in India (TERIIN, 2003)
IFIRD has been engaged in a pilot-scale dissemination of improved model biomass- fired stoves, capable of saving 50 - 70% of fuel compared with the traditional stoves all over the country (Banu, 1996). These improved stoves are gradually gaining popularity.
Biomass briquettes have the main advantages of easy transportation, better handling, cleaner and more efficient combustion, and higher volumetric calorific value of the fuel. It also produces a fuel that Is suitable for a variety of applications. Briquetting of sawdust and other agro-residues has been practised for many years in several countries. Briquettes can be produced with a density of 1200 to 1400 kg /M3 compared with a corresponding value of 500 - 700 kg /M 3 for common wood. Accordingly, the savings of diesel oil during the transportation of residues or wood are substantial: a 10 tonnes truck can transport 3-4 times more weight of briquette than loose biomass fuel (Grover, 1995). There are two types of machines used for briquetting the biomass; these are piston press (also called die and punch) and screw extruder. The screw extruder technology was successful in briquetting rice husk and saw dust in Europe, Japan, Malaysia, Taiwan and Thailand (Babu and Yuvaraj, 2001). The machines operating in Bangladesh are of heated-die screw extruder type (Moral, 2000).
5.8 Seasonal Availability of Biomass Resources
Agricultural crops considered In this study are rice, wheat, Jute, sugarcane, vegetables and pulses. Three different types of rice grow at different seasons in Bangladesh, whereas Jute and sugarcane grows once a year. Agricultural residues are available only at the time of harvest. Harvesting starts soon after the crop ripens. Different types of vegetables and pulses grow in Bangladesh throughout the year. It was assumed that the residues from vegetables and pulses are not seasonal dependent. The seasonal availability (see Table 5.16) of rice, wheat, jute and sugarcane are:
Rice. The local names of three different types of rice are: Amon, Aush, and Boro. Amon Is the monsoon crop; Boro is the winter crop; and Aush are the short pre- monsoon crop. The harvesting time of rice in different seasons are: Aush (July - August), Amon (November - January), and Boro (April - May).
Wheat. Annual crop In Bangladesh, the planting period of wheat is November - December and the harvesting period is March - April.
66

Jute. Jute is cultivated in the rainy season. Planting of jute usually starts at the end of February and continues till end of May, depending on the species. About four months after planting, harvesting begins (i. e. July to September).
Sugarcane. Sugarcane keeps the land occupied throughout the year. Cane is harvested by cutting down the plant stalk. In Bangladesh, the harvesting season of sugarcane extends from October to March.
There are some months when availability of biomass is less than the average quantity throughout the year and on the other hand there are some months when the availability of the biomass is higher than the average. Storage of agricultural crop residues are required, if a biomass electricity plant is designed based on the average availability.
5.8.1 Storage of Biomass Resources
There are two types of fuel storage systems, these are: open and covered storage systems. In open systems, the biomass fuel is stored either directly on the ground or on a concrete pad. The covered systems can include plastic on slab (or on ground), open sheds, closed sheds, silos, and air bags (Perlack et al. 1995). During designing of storage facility, the following factors must consider (Perlack et al. 1995 and Junginger, 2000):
the distance to the conversion plant physical and chemical properties of the biomass fuel
seasonal weather conditions and operational requirements of the plant
67

> 0 Z
c)
0)
m
LL.
m
in 2 :2 i2 a) 0 CL .
V 2 j5 1: 3 Ic:
4-
0 3: m
(13
W-w
T]
0 E m
2-1
Co
'7 Li) (1)
F-
00 I'D

5.8.2 Impact of Biomass Storage
For a biomass-based electricity generation plant with storage facility, it is very important to asses the viability of the storage facility of biomass. The main impacts to consider are:
" Economics. The parameters of economics are: cost of land, construction cost of the storage facility area, repair and maintenance costs. Construction of the facility is related to the properties of biomass. Another important thing to consider is that whether the storage area/facility can cope during the natural calamities (floods, storms) or not, which are common in Bangladesh.
" Safety and security. When arranging such type of facility one should also consider safety hazards which might cause. The main safety hazard to consider is fire. For some types of biomass, if it is kept open, the heat of sun might cause fire. This fire may spread the surrounding areas as well. Security is another issue to consider. If the biomass storage facility is located in an area where there is a shortage of biomass, then people might steal the biomass from the storage facility.
4 Operating conditions. Temperature and timing/period of the storage of biomass are very important to monitor. There might be some decomposition losses during the storage period (Perlack et al. 1995). Decomposition losses would be higher if the storage period is longer, but due to unavailability of these losses data, it can be assumed negligible for this study.
4 Environmental. For some type of wet biomass, odour might generate due to the storage. There Is no odour, if the biomass is dry.
5.9 Conclusions
Estimation of division-wise and district-wise biomass energy availability is important for assessing decentralised biomass electricity generation potential and economics. A methodology to estimate national and district-wise biomass generation, recovery and availability rates (both annual, seasonal or monthly) for electricity generation in Bangladesh, has been presented in this chapter.
The study indicates that In 2003, the national total annual generation and recoverable rates of biomass In Bangladesh were 148.983 and 86.276 Mtonnes, respectively. Of the total recoverable amount, agricultural residues represent 48.7%, followed by a 23.9% contribution from animal wastes and poultry droppings. In energy terms, the national annual amount of the recoverable biomass is equivalent to 312.596 TWh. Considering the present national consumption of biomass; the total available biomass resources for electricity generation vary from 183.848 to 223.776 TWh. The results obtained show that all districts, with the exception of Dhaka, has considerable amount of available resources of animal wastes, poultry wastes, MSW and human excreta. Currently, not all districts have the potential to utilise agricultural and forestry residues for electricity generation.
69

A large amount of biomass can be saved by employing improved (i. e. more efficient) cooking stoves, furnaces, boilers and other devices consuming biomass fuels. The traditional mud cooking stoves used in Bangladesh exhibit overall efficiencies of only between 5 and 10%. So, with the implementation of the ongoing improved-stoves installation program of the GOB and utilisation of more energy efficient devices, it is expected that most districts will have a considerable amounts of these residues for electricity generation. In 2003, Serajganj had the highest total biomass availability potential of 32.861 TWh, followed by Pabna with 29.215 TWh. Biomass availability by division has been presented In Appendix F. Biomass availability by districts (of khulna division) has been shown in Appendix E.
70

CHAPTER 6 FEASIBLE TECHNOLOGIES, INVESTMENT COSTS, CONVERSION EFFICIENCIENCY AND ELECTRICITY GENERATION POTENTIAL
6.1 Technically Feasible Conversion Technologies and Methodology
The utilisation of biomass fuel is a proven option for the small to medium-scale decentralised generation of electricity. Different types and sizes of biomass-based decentralised electricity generation has been practising in neighbouring countries such as India, Pakistan, Thailand, Sri Lanka, Nepal, China, Philippines and Indonesia. The technologies used in these countries are mainly anaerobic digestion, gasification and direct combustion. Amongst the neighbouring countries, India and China has vast experience of using these technologies for many years.
Anaerobic digestion Is a commercially proven technology. Digesters of various types and sizes are widely distributed in India and China. Biomass gasification is normally practised at a relatively small scale, but systems exist for power output capacities of up to 50 MW, (RWEDP, 2002a). TERIIN (2004) reported that a gasifier system can reduce fuel consumption by half and also helps in replacing 70-80% of the consumption of diesel oil of commonly employed diesel generators, resulting in reduced diesel imports. Commercial biomass gasifiers are now available in different sizes. Gasifiers have been manufactured locally in India, China, Thailand and Indonesia (RWEDP, 2002a).
Direct-fired biomass power plants have been installed in a number of countries in Asia. These plants have the option to deliver electricity to the grid, utilise the electricity to satisfy the power demand of a stand-alone production process, or a combination of both. In neighbouring Indonesia and Thailand, co-generation is normally practised in sugar factories, palm oil industry, and rice mills (RWEDP, 2002a). These industries have the potential to produce electricity in excess of their normal heat and power demand, which can be fed to the grid.
After reviewing the biomass electricity plants, presented in Appendix D, it is concluded that in developing countries, gasification-based biomass electricity generation technologies are more practised than the anaerobic digestion-based or direct combustion-based electricity generation technologies. Different types of Biomass-to- electricity conversion technologies are studied (see Chapter 3). Considering the technical knowledge of the rural population in Bangladesh, and examining the installed biomass electricity generating plants (Appendix D); the feasible technologies for small to medium-scale, off-grid biomass based electricity generation in Bangladesh are in the order of:
4. Gasification 4. Anaerobic digestion 4. Direct combustion
Table 6.1 shows the types of biomass and the energy conversion equipment for the three feasible technologies for small-to-medium scale electricity generation.
71

Conversion Biomass resource Equipment technology
Type Examples
Gasification Dry to moist Agricultural residues, Reciprocating engine solid biomass wood/forestry residues, Gasifier, Furnace, Boiler
poultry litter and MSW Steam turbine, Micro Gas turbine Anaerobic Moist to wet Manure, sewage sludge, Reciprocating engine digestion biomass MSW Digester, Furnace, Boiler
Steam turbine, Micro Gas turbine Direct Mainly dry solid Agricultural residues, wood/ Reciprocating engine combustion biomass forestry residues, and MSW Furnace, Boiler, Steam turbine
Table 6.1 Small to medium-scale biomass to electricity generation technologies
Reciprocating engines are of two types:
, -L Internal combustion engines. The different types of ICEs are: spark ignition engine and compression Ignition engine.
-L External combustion engines. Types of external combustion engines are: Stirling engines and Steam engines.
In this chapter, trends In capital investment costs and overall electricity generation efficiency of the feasible technologies are established from collated information of systems operating In both developing and developed countries (see Appendix D). All the cost figures were adjusted for year 2004 value. Cost data of any currency (other than US$) and for a specific year, was first converted to the US$, using the currency conversion factor for that year. A currency converter tool, Bank of Canada (2004), was used for this purpose. The converted value was adjusted to US$ in 2004, using the consumer price index (CPI) inflation calculator (BLS, 2004) of U. S. Department of Labour. The CPI Inflation calculator calculates current value of US$ amounts from years ago or the value of current US$ in an earlier period.
Generated best fit lines equations were used for plant sizing and for economical analysis. In some cases, data available from developing countries were not enough; best fit line generated for the developed countries was modified to use for the developing countries, by comparing the other technologies for which adequate data for both the developed and developing countries are available.
Diesel generators are used all over the world for the small-scale, off-grid electricity generation. Electricity generation plants employing dual-fuelled (diesel and biogas or producer gas) engines represent attractive options, because of the operational flexibility. To compare the economics of the different types of electricity generation plants, best fit lines for diesel and dual-fuelled engines electricity generation systems are also developed.
Figure 6.1 shows the methodology used for developing the costs and efficiency correlations and estimating the electricity generation potential for all types of feasible technologies. The different steps of the methodology are:
Conversion suitability and relevant properties of available biomass resources were discussed for each type of feasible conversion technologies. Available biomass resources were grouped for variety of biomass fuels with varying degree of moisture content for assured fuel supply and maximum electricity potential, without adversely affecting the efficiency, costs and reliability.
72

District wise and national total recoverable amount of biomass were estimated in Chapter 5. Energy potentials were calculated for each technology option, using the heating value of the biogas generated (in the case of anaerobic digestion technology option) and lower calorific value (for combustion and gasification technology option) of biomass resources. Using the biomass electricity plants data presented in Appendix D, trends for specific capital investment cost and overall electrical efficiency of the different technologies were generated. Mean conversion efficiencies data were estimated. Finally, electricity generation potential were estimated, using the mean conversion efficiency data of each technology option.
Quantity of Different Types Available Biomass Resources for Electricity Generation in Bangladesh: District wise
Technology ion I- Technology Option 2: Technology Option 3: Gasification-based Electricity Anaerobic Digestion-based Direct Combustion-based
opt (
Generation
II
Electricity Generation Electricity Generation
Study the Technology Details and Properties of Suitable
Biomass Resources
Study the Technology Details and Properties of Suitable
Biomass Resources
Study the Technology Details and Properties of Suitable
Biomass Resources
Selection of Biomass Resources for this Technoloov
Biomass Grouping and and its Energy Potential
Development of Correlations of Specific Capital Investment Costs and Overall Electrical Efficiency with the Electricity
Generating Capacity
Estimation of Mean Overall Electrical Efficiency
I
Selection of Biomass Resources for this Technology
Biomass Grouping and and its Energy Potential
Development of Correlations of Specific Capital Investment Costs and Overall Electrical Efficiency with the Electricity
Generating Capacity
Estimation of Mean Overall Electrical Efficienc
I
Selection of Biomass Resources for this Technolociv
Biomass Grouping and and its Enerav Potential
Development of Correlations of Specific Capital Investment Costs and Overall Electrical Efficiency with the Electricity
Generating Capacity
Estimation of Mean Overall Electrical Efficienc
I
Estimated Maximum Estimated Maximum Electricity Estimated Maximum Electricity Generation Potential Generation Potential for Electricity Generation Potential
for Gasification-based Anaerobic Digestion-based for Direct Combustion-based Technology Technology Technology
Figure 6.1 Methodology: energy and electricity potential
73

6.2 Gasification Gasification system consists of a reactor or gasifier into which biomass fuel is fed along with a limited (less than stoichiometric) supply of air. Heat for gasification is generated through partial combustion of the feed biomass fuel. Producer gas consists of a mixture of H2, CO, CH4, C02 and N2; of which C02 and N2 are non-combustible gases. Producer gas contains significant amount of tars, soot, ash and water (Stassen, 1995).
6.2.1 Properties of Biomass for Gasification and Combustion
The Important properties of biomass fuel for gasification and direct combustion are (Quaak et al. 1999; Wereko-Brobby and Hagan, 1996; Turare, 1997; Schmidt and Pinapati, 2000):
-4. Moisture content. Moisture content is expressed as a percentage of the biomass weight. The biomass weight can be determined to on a wet basis, dry basis, or dry- and-ash-free basis. Moisture content of biomass, on a wet basis, varies from less than 10% for straw to 50-70% for forestry biomass. High moisture content in biomass reduces reactor (for both in combustion and gasification) thermal efficiency, due to the requirement of additional fuel drying energy. The maximum allowable moisture content is 55% on wet basis, to ignite the biomass fuel. Moisture content level of about 20% and below is recommended for satisfactory combustion efficiencies. Biomass with moisture content of 5-30% by mass is gasifiable. For trouble free and economical operation of the gasifier, moisture content below 15% by mass is desirable.
--L Enerqv content or heatinq value. The most acceptable form of biomass fuel heating values for combustion and gasification purposes is lower heating values with specific reference to the actual moisture content of the fuel.
Ash content. Ash is the Inorganic part of biomass which remains in oxidized form after combustion or gasification of biomass fuel. Ash content is expressed in the same way as moisture content. However, ash content is commonly expressed on a dry basis. Both the total ash content and the composition of the ash in the biomass are Important. The ash composition affects the system's operation under high temperature combustion and gasification. Melting and agglomeration of ashes in reactor causes slugging and clinker formation, which leads to excessive tar formation or complete blocking of reactor. No slugging occurs with fuel having ash content below 5%. Wood chips contain 0.1% ash, while rice husk contains high amount of ash (16-23%). Ash is high in alkaline materials like potassium, sodium, calcium and magnesium. The land filling of ash affects the land usage and also the environment for its corrosive nature. Reactivity of the fuel,. The reactivity is defined as the rate of reduction of carbon dioxide to carbon monoxide. Fuels such as wood, charcoal and peat are far more reactive than coal. Reactivity influences the reactor design, as it dictates the height needed in the reduction zone. A number of elements, which act as catalysts, have a positive effect on the rate of gasification. For example, small quantities of potassium, sodium and zinc have a large effect on the reactivity of the fuel.
4. Particle size and size distribution. Size of the fuel affects the pressure drop across the reactor. The pressure drop is essential to draw the air and gas through gasifier. Large sizes of particles give rise to reduced reactivity of fuel, causing start-up
74

problem and poor gas quality. In general, for wood gasification wood chips ranging from 1Ox5x5 mm to 80x4Ox4O mm is preferable.
'46 Bulk density of the fuel. It is defined as the weight per unit volume of loosely tipped fuel. For biomass fuels it is expressed either on an oven dry weight basis (moisture content is zero) or as it is basis. Fuels with high bulk density are advantageous because they represent a high energy-for-volume value. Consequently, these fuels need less storage space. Low bulk density fuels sometimes give rise to insufficient flow under gravity, resulting in low gas heating values. Bulk densities can be increased by briquetting.
'J* Total solids and Volatile matter content. The term total solid is defined as the weight of the dry matter of a sample of biomass fuel, and expressed as a percentage of the weight of the wet biomass. Volatile matter is defined as the portion of dry biomass that is released when biomass is heated up to 400-5000C. High volatile matter content produces more tar, which causes problems to the operation of the prime mover. Amount of the volatile matters in the biomass fuel determines the design of reactor for removal of tar. Typically, biomass has a volatile matter content of up to 80% by mass, whereas, coal has a low volatile matter content of less than 20% by mass.
6.2.2 Technology
Figure 6.2 shows the different components of the gasification-based electricity- generation technology.
6.2.2.1 Tvpes of Gasifiers
There are two types of gasifiers: fixed bed gasifier; and fluidized bed gasifier
6.2.2.1.1 Fixed bed Gasifier
Fixed bed gasifiers are of three types: Updraft or Counter-current, Downdraft or Co- current, and Cross-draft. The selection of the type of gasifier unit will depend on the end use of the gas, the scale of operation and its feedstock.
BIOMASS
FUEL FEEDING
GAS ENGINE(S)
STACK
H
ASH
Figure 6.2 Schematic diagram of the biomass gasifier- based electricity generation (Bain, 2004)
75

Updraft gasifier. Biomass is fed at the top of the reactor and moves downward as a result of its conversion and removal of ashes. Air enters at the bottom and the gases produced pass upwards and exit near the top (see Figure 6.3). One of the big advantages is, the biomass fuel is dried up due to the internal heat exchange. Fuels with high moisture content (up to 60% wet basis) can be used in updraft gasifier (Quaak, et al. 1999).
Downdraft qasifier. Air and the producer gas flow downward (see Figure 6.3). Normally, these types of gasifiers have a constriction called throat to create a high temperature zone for adequate tar cracking and are mostly used for running internal combustion engines. The advantages of this type of gasifier are: reduced amount of the tar fraction in the product and shorter contact times. The disadvantages are: more uniform fuel sizes are required and are not suitable for operation with feed sizes less than 15 mm and above 50 mm, moisture content of the feed biomass must be less than 25% by mass (Wereko-Brobby and Hagan, 1996; Quaak et al. 1999).
Cross-draft qasifie . Figure 6.4 shows the schematic diagram of the cross-draft gasifier. This type of gasifier can be used for small-scale application. The drawback is, its minimal tar converting capability (Quaak et al. 1999).
Updra" (Couniercurrent) Downdratt (Cocurrent)
Biomass Product gas Biomass
41 Fixed Fixed bed bed of of
biomass biomass
I
Oxidant -Oxidant
Grate --Throat
Product gas + ash
Figure 6.3 Updraft and downdraft gasifiers (Bridgwater, 1995)
Feed
--Drying zone
Distillation zone
Hearth zone Air Gas
Reduction zone Grate Burning char
Ash pit
Figure 6.4 Cross-draft gasifier (Quaak et al. 1999)
76

6.2.2.1.2 Fluidised bed Gasifier
Fluidised bed gasifier (see Figure 6.5) was developed to overcome the operational problems of fixed bed gasification of fuels with high ash content (Quaak et al. 1999). Biomass fuel is fed into a suspended (bubbling fluidised bed) or circulating (circulating fluidised bed) hot sand bed. The fluidizing velocity in the circulating fluid bed is high enough to entrain large amount of solids with the product gas. The fluidizing material is usually silica sand, although alumina and other refractory oxides have been used to avoid sintering, and catalysts have also been used to reduce tars and modify product gas composition (Bridgwater, 1995). Twin fluidized bed gasifier is used to produce a gas of higher heating value (Bridgwater, 1995).
Bubbling Fluid Bed C. Irculating Fluid Bod
Product gas Gas-ash. b&C
Product gas malarial
Cyck), -
Boomess .... Biomass Ash F)utd bed
....... ....... ....... ..... * ...... .......
Ash
Feecler Fooder Oxidani Ash Oxiciant Ash
(a) Bubbling and circulating fluidised bed gasifiers
Product gas
Gas - criar ý ash ý some &and
g as Cyclone Recycle
as
Combustor Flue Hot sand & ash gas
Gasifier Free- ýýIuid -61ýa
board Scr. ý ........ Biomass
FýJuid bed Air IOLM Ash Foodw
Recycie gas Tý
Stea- Recycle tan
(b) Twin fluidized bed gasifier
Figure 6.5 Principles of fluid bed gasifiers (Bridgwater, 1995)
77

The advantages and disadvantages of fluidized bed gasifiers in comparison to fixed- bed gasifiers are (Quaak et al. 1999): Advantaqes:
Compact construction due to intensive mixing in the bed. Flexibility to change in moisture and ash content.
Disadvantaqes: High tar and dust content of the producer gas. Complex operation because of need to control the supply of both air and fuel simultaneously.
6.2.2.2 Prime movers
Gasifier and ICE or turbine is the most acceptable option for biomass electricity generation. In general, turbines are used for large-size plant. However, engine- generator sets are available for up to 50 MW,, output capacities (Bridgewater et al. 1998). The advantages of engines are (Bridgewater et al. 1998): " Robustness; " high efficiency at low sizes; " higher tolerance to contaminants; and " easy maintenance
Small combustion gas turbines that produce between 25 kW and 500 kW of electrical power are known as micro gas-turbines (CEC, 2002b). Most micro gas-turbines are single-stage; radial flow devices with high rotating speeds of 90,000 to 120,000 rpm (see Figure 6.6). Micro gas-turbines have good potential as the prime movers for small- scale decentralised electricity generation. The advantages of micro gas-turbines include: compact design, small number of moving parts, light weight and good efficiencies in CHIP application (CEC, 2002b; Lensu and Alakangas, 2004). Compact design and few moving parts lead to lower maintenance costs. Micro gas-turbine generators are of two types (CEC, 2002b):
-L Recuperated micro gas-turbines. Recovers the heat from the exhaust gas and the overall electrical efficiency of this type is in the range of 20-30%.
-L Un-recuperated micro gas-turbines. Un-recuperated micro gas-turbines have lower electrical efficiencies at around 15%.
6.2.2.3 Gas CleanuD and Quality Requirements
The level of contamination in producer gas varies, depending on the gasification process and type of biomass. Table 6.2 shows the contaminants, problems resulting from these contaminants and common cleanup methods. Product gas quality requirements for gas turbines and engines are:
For Turbine Operation. Product gas specifications to use as turbine fuel are summarised in Table 6.3. Alkali metals and sulphur pose major problems. Presence of 0.1% sulphur (by weight) in the biomass fuel, can lead to levels of sulphur in the producer gas of up to 100 ppm by weight and this level is not acceptable and will require reduction (Bridgwater, 1995). Tars are a potential problem if the gas has to be compressed (Bridgwater, 1995).
78

(a) Physical construction
(b) Process diagram
Figure 6.6 Micro gas-turbine (Lensu and Alakangas, 2004)
For ICE Operation. The engines have the advantage of having a higher tolerance to contaminants than gas turbines (see Table 6.4). Tar present in the producer gas can condensate and clog the gas supply lines and the gas-air mixtures; accumulate on the engine intake valves; and can lead to frequent changing the spark plugs, piston rings and cylinder liner. (Quaak et al. 1999; Bridgewater et al. 1998). Acids present in the poducer gas may cause severe corrosion and affect the properties of the lubricating oil (Bridgwater, 1995).
79

Contaminant Examples Problems Cleanup method Particulate Ash, char, fluid bed Erosion Filtration, scrubbing
material Alkali metals Sodium and potassium Hot corrosion Cooling, condensation,
compounds filtration, absorption Fuel nitrogen Mainly NH3and HCN NO. formation Scrubbing, SCRa Tars Refractory aromatics Clog filters, difficult to Tar cracking, tar removal
burn, deposit internally II Sulphur, chlorine H2S, HCL Corrosion, emissions Lime or dolomite I I scrubbing or bsorption
-selective catalytic reduction
Table 6.2 Producer gas contaminants and cleanup processes (Bridgwater, 1995)
Producer gas characteristics Value
Lower heating value (Mj/m) 4-6
Minimum gas hydrogen content (% vol. ) 10-20 Maximum alkali concentration (ppb by weight) 20-2000 Maximum temperature of producer gas ('C) 450-600 Tars at delivery temperature All in vapour form or none NH3 No limit HCI (ppm by weight) <0.5 S (1-12S + S02 etc. ) ppm by Weight) <1 N2 No limit Combinations: Total metals (ppm by weight)
Alkali metals + sulphur (ppm by weight) <1 <0.1
Maximum particulates (ash, char etc. ), in ppm by weight at particle size (pm) of: >20
10-20 4-10
<0.1 <1.0
<10.0
Table 6.3 Producer gas fuel specifications for turbines (Bridgwater, 1995)
Contaminants Tolerance level Dust (Mg/M3 gas) < 50 (preferably 5 mg/ml gas) Tars (Mg/M3 gas) < 500 Acids (Mg/M3 gas) < 50 (measured as acetic acid).
Table 6.4 Product gas contaminants tolerance level for ICEs (FAO, 1986)
6.2.3 Application
Biomass Technology Group (BTG) developed a farm-scale poultry dropping gasifier system in the Netherlands, including novel gas cleaning technology, for CHP applications. Fresh poultry droppings are prepared in batches of 3 M3 and dried to 85% dry matter content before entering the gasifier. The producer gas is used in an internal combustion engine. Main features are (BTG, 2004):
Capacity : 60 kW, + 100 kWt Overall electrical efficiency : 30% Annual poultry waste consumption : 900 tonnes (40% MC) Type of gasifier Bubbling fluidised bed Temperature of gasification 7000 C
80

MSW (as collected) with 20% (by wet) moisture content has a lower heating value of roughly 13 MJ/kg and has high ash content (10-12%) compared to coal (5-10%) (Klein, 2002). Combustible parts of MSW can be converted into gaseous fuel. After removing the non-combustible materials, the remaining MSW is shredded to size of less than 50 mm (Kumar, 2000). The moisture content of the feed to gasifier is maintained below 20% to maximise the heat recovery (Kumar, 2000). Figure 6.7 shows the schematic diagram MSW gasifi catio n- based electricity-generating plant.
CFB gasifiers are used for biomass electricity generation in China (see Table 6.5). Table 6.6 shows the performance of a CFB gasifier used in China. The most common types of gasifiers used in India are open top down draft gasifiers (Bharadwaj et al. 2000). A total of 42.8 MWe biomass-gasifier electricity-generating capacity so far been installed in India (Mukhopadhyay, 2004). Plants with an output capacity of up to 500 kWe are manufactured in India and are now being exported to Asia, Latin America, Europe and the USA (Mukhopadhyay, 2004). In China, 150 sets of biomass gasifier- electricity generation plants are in operation. The installed capacity of these plants are in the range of 200 - 1500 kWe (Leung et al. 2004).
TiPP-il g Ip I Floor
Figure 6.7 Schematic diagram of a MSW gasification-based electricity-generating plant (AES, 2004)
Up-draft
Ty
Open core
pe o gasifier Down-draft Circulating fluidised bed
Fuel type Tree bark, Rice husk Rice and corn Rice and corn straw, timber blocks straw rice husk, saw dust
Electricity-generating 2-30 60-200 60-200 400-2000 capacity (M)
3 LHV of gas ( MJ/ m 4.1 -5.3 3.8-4.6 3.8-4.6 4.6-6.3 0 Gasification temperature (C -1100 700-800 -1000 650-850
Efficiency of Gasifier" (% 70-75 50 75 65-75 Application Boiler fuel Electricity Domestic Boiler fuel and
aeneration cookinq electricitv qeneration cold gas efficiency
Table 6.5 Gasifiers and their applications in China (Leung et al. 2004)
81

Gasifier parameter and product gas Parameter values and product gas characteristics
Feed rate of fuel wood (kq/h) 1500.00 885.00 885.00 Feed rate of air (mj/h) 1650.00 1350.00 1610.00 Gasifier temperature (T) 775.00 800.00 940.00 Gas composition (% by volume) H2 7.59 6.33 7.04 CO 24.83 18.66 18.29 CH4 13.00 11.57 13.76 C2H4 5.91 5.58 3.63 C2H6 0.30 0.11 0.60 C21-12 0.27 0.27 0.55 N2 48.00 51.80 56.00 Lower heating value of gas (MJ/m) 6.36 5.30 5.01 1
Table 6.6 Performance of CFB gasifier as a function of feed rate and temperature of gasification (Wu et al. 2002)
6.2.4 Potential Biomass Resources
Gasifiers can be used for each individual type of resources, or a mixed biomass resources (see Table D1, in Appendix D). In the former type of gasification, the producer gas can be collected and stored at a central receiver from different gasifiers. The gas from the central storage could be used for electricity generation. Co- gasification of agricultural wastes, forestry residues, refuse derived fuel (RDF) and coal has been reported (Hotchkiss et al. 2002; Table D1 of Appendix D). Co-gasification of agricultural wastes and forestry residues is widely practiced (see Appendix D). Preparation of RDF from MSW involves extra costs, to make it suitable as a recipe for co-gasification with agricultural wastes and/or forestry residues. Co-gasification of biomass (agricultural wastes, forestry residues and RDF-fuel) with coal has been practiced for large scale electricity generation plants. No commercial experience of combining coal with agricultural wastes (and forestry residues) or MSW as a feedstock is available for small-to-medium scale plants (Hotchkiss et al. 2002).
Producer gas can be co-fired in the existing coal-fired plant, which has been deployed successfully in Finland and in the Netherlands (Faaij, 2006). Co-firing of producer gas with natural gas in a natural gas-fired plant is yet to be demonstrated (Faaij, 2006).
The potential biomass resources for gasification-based electricity generation systems in Bangladesh are:
Agricultural wastes Forestry residues Poultry droppings Combustible parts of MSW
For most types of biomass, the HHV, on a dry and ash free basis is in the order of 20.4 MJ/kg (± 15%) (Quaak et al. 1999). Other properties of the biomass fuels such as moisture content, bulk density, volatile matter content, ash content and size distribution are important in selecting the technology and mixing the biomass resources. Ash content in rice husk is 19% (dry mass), whereas it is 5-10% and 0.25-1.7% for diverse agricultural residues and fuel wood respectively (Quaak et al. 1999).
82

CFB gasifier has been operated successfully in China for gasification of fuel wood and agricultural wastes to generate electricity (Leung et al. 2004). All types of agricultural and forestry wastes can be used for gasification, necessary pre-treatment and cleaning methods of typical CFB gasification based electricity-generation systems are (Leung et al. 2004):
Producer gas cleaner : Dust separator, water scrubber Feed pre-treatment : Crushing Operation time (h/yr) : 5000 Lifetime (yrs) : 15
In Bangladesh, district wise availability of agricultural wastes and forestry residues varies widely (see Chapter 5). So, co-gasification of agricultural wastes and forestry residues would be appropriate for decentralised biomass electricity generation. Also, co-gasification would ensure uninterrupted feed supply to the gasifier and generate more electricity in a given district. For gasification-based biomass electricity-generation, biomass resources in Bangladesh have been grouped as follows:
*ýL Group A: Agricultural wastes and Forestry residues -ýL Group B: MSW (Combustible fraction) 4ý Group C: Poultry wastes
The national total and district wise availability of these biomass resources were estimated (see Chapter 5).
6.2.5 Capital Investment Cost and Overall Efficiency
Table D1 and Table D2 (in Appendix D) shows the specific investment costs of the gasifier-based electricity generation plants. The components of the capital investment costs of this type of conversion technology are:
, iý Gasifier, fuel handling system, gas clean up system; 4. Engine or turbine (steam or gas turbine); , ýL Generator and control system; , iL Land procurement, civil works; , 4ý Installation, commissioning and training;
Capital investment costs vary depending on whether the plant is only for electricity generation or for CHP production. All the investment costs were converted into US$, in September 2004 value (see Section 6.1). There is also a large difference in capital investment costs between gasifier power plants manufactured in developed countries and plants manufactured in developing countries. For example, in Indonesia, a 30 M. imported wood gasifier plant is estimated at US$ 61,800 (US$ 2060/kW. ); whereas a locally manufactured plant is estimated at US$ 31,380 (US$ 1046/kW. ) (Stassen, 1995).
Table D2, in Appendix D, shows the investment costs of the gasifier-based electricity generation plants manufactured in India. Freight, installation, training and commissioning costs need to be added with this to get the total capital investment cost. Stassen (1995) reported the value of US$ 196/kW, and US$ 126/kW, (in 1990 value) as freight and installation costs for 30 W. and 100 kW,, sized dual-fuelled generator plant respectively. This indicates that as the capacity of the plant increases, per unit cost of the freight and installation decreases. No correlation was found to estimate the
83

freight and installation cost for varying plant sizes. Assuming a little variation for a range of 150-500 W. dual-fuelled plants, an average fixed value of US$ 100/kW, has been used in this study as freight and installation cost (see Table D2, in Appendix D).
The training cost is not directly related to the number of total operators of the plant. The common practice is that the supplier (or manufacturer) arranges training of fixed number of operators, and this cost is included in the total cost of training and commissioning. Training and commissioning cost varies according to the range of plant capacity. In this study, it is assumed that this cost is constant for small- to medium- scale plant range. Stassen (1995) estimated a fixed value of US$ 2000 (in 1990) as training and commissioning cost for small- to medium-scale dual-fuelled (producer gas and diesel) generator plant. A similar cost figure, which is equivalent to US$ 2890 in September 2004, has been used in this study (see Table D2, in Appendix D) to cover training and commissioning cost of the plant.
The major factors which affect the capital investment cost and electrical efficiency of the gasification-based electricity-generating plants are: types of conversion equipment, types of biomass fuel and plant electricity-ge ne rating capacity (see Table D1 and Table D2, in Appendix D). Correlations between the specific capital investment costs and plant electricity-generating capacity; and between the electrical efficiency and plant electricity-generating capacity; were developed for gasification-based spark-ignition engine-generator systems (see Figure 6.8 and Figure 6-9) using the data presented in Table D1 and Table D2 (in Appendix D). The fuels used in these types of plants are either agriculture wastes or forestry residues alone or mixture of agricultural wastes and forestry residues. Similar correlations were also developed for gasification-based compression-ignition engine-generator systems (see Figure 6.10 and Figure 6.11). Trends have been generated using the data of both developed and developing countries. The best fit equations for the capital investment cost and for the overall electrical efficiency are:
SCI, park ignifion gasification plant=
4388.3(pr. 3529 (6.1)
l7spark ignition gasificadon plant-,: 0.3319[ln(P)]+ 14.981 (6.2)
SCI. orMression ignition gasification plant = 4592. j(p)-0.4035 (6.3)
17conTression ignition gasification plant = 1.9077[ln(P)1+10.459 (6.4)
Adequate data of specific capital investment cost and electrical efficiency for MSW and poultry litter gasification-based electricity-gene rating plants were not found to develop the correlation. In this study, correlations developed for the specific capital investment cost of the gasification-based spark-ignition engine-generator and gasification-based compression-ignition engine-generator plants using agricultural waste and forestry residues, would be used for plants using the IVISW and poultry litter as fuel.
The mean electrical efficiency of the data used to generate the electricity efficiency trend lines for gasification-based spark-ignition engine-generator and gasification- based compression-ignition engine-generator plants, using agricultural wastes and forestry residues, are 16.65% and 16.34%, respectively.
84

____________
__________
____________ .
__________
. .
.
________________
.
t
a C C C
0.
0)
4)
4)
cc
CD CD 0 CD c4 c4 Ir- V. -
(MMI$Sn); soo; uawlsa, %ul le4! dez) zilizeds
kr, 00

0 0 0 0
0. Co
cu 16.
m
16.
0
T- W) co LO r- LO CD W)
ui
Aouglolge JeOIJJ3813
IC 00

.
______________ ______________ ______________ _ "H
4
.
Q0 CD 0 W) c4 c4 9- V. -
(m)i/ssn) IS03 IUOWISGAUI lel! dL, 3 3ij! 3adS
0m
LM cý (n
E 0
m CL Co 0 m
0 m m
m
(L) -0 Z (L)
C) _c_- CD cm lý (0 0
0
c: (1)
E
76
0-
CL
r- 00

___________________ I - __________________
--- ___________ ________________
.
.
Q CM T-
CD
.
0- 00 >,
CL m 0 0)
CO (D
0)
W
r
0
0 C14
0 U) 0 v) 0 U) CD c4 C, 4 4- Ir-
(%) AZUGIOI. 4,9 IEDIJIZ813
(0
cm LL
00 00

6.3 Anaerobic Digestion
6.3.1 Biomass Resources for Anaerobic Digestion
The biomass resources suitable for the anaerobic digestion in Bangladesh are:
-& Animal wastes and poultry droppings -I. Organic fraction of the MSW -iL Sewage sludge 4ý Rice and wheat straw
6.3.1.1 Animal and Poultry Wastes
Animal and poultry wastes are widely used for anaerobic digestion both in developing countries and developed countries. The important factors for the utilisation of these wastes, as digester feeds, are:
'A, Availability of animal waste consistently all year round. The generation of animal waste is variable, depending on the climate and type of feed. This issue was discussed in Chapter 5 of this study.
4, Animal waste should be free from larger amounts of bedding and other materials (e. g. sand, stones, and straw). These materials can clog the influent and effluent pipes of the digester and destabilise the biogas production process (EPA, 2002a).
M; L Daily animal waste collection is desirable because of preserving the biogas production potential and conserving the nutrient value. Generally animal waste is collected at a common point. This point might be a pit, tank or pond. Digester is fed from this common point. Necessary preparations (e. g. adding water, mixing and separating from solids) of waste are made before feeding into the digester. Digester feeding should be in regular intervals; irregular feeding can disrupt the biological process and cause the process to operate inefficiently or to stop entirely (EPA, 2002a).
6.3.1.2 Municipal Solid Waste
Organic fractions of the MSW from household and municipal authorities provide potential feedstock for anaerobic digestion. Both the composition and definition of MSW varies from one country to another depending upon standard of living, cultural practices, and extent of recycling. MSW is heterogeneous material that contains a wide range of components but these can be grouped into three broad fractions:
Organic fraction - is the readily biodegradable organic matter such as kitchen waste, food residues, paper and cardboard, grass cuttings, tree clippings, and other garden wastes.
4. Combustible fraction - includes slowly biodegradable and stable organic matter such as coarse wood, plastics and other synthetic materials.
4. Inert fraction - typically includes stones, sand, glass and metals. Some of these products are suitable for recycling; the remainder can be land-filled.
89

RISE-AT (1998) reported that 30-60% by mass of IVISW is organic matter. In general, about 50% (by mass) of IVISW is organic matter (Braber, 1995). The organic fraction of MSW, in Bangladesh, is around 50-55% (see Table 6.7). The main steps in the treatment of MSW by anaerobic digestion (AD) are:
4. Separation: organic fraction of the MSW is separated. Mechanical separation techniques are used if the separation is not performed at the source of MSW (RISE-AT, 1998).
'4ý Anaerobic digestions. AD produces biogas for energy and partially deodorizes, stabilize and disinfect the digestate.
"L Post treatment. This completes the stabilization and disinfection of the digestate, removes residual contaminants, and produces a refined product. In the case of co- digestion of MSW and sewage sludge, the viruses and bacteria can remain in the digestate after the anaerobic digestion process. Waste treatment at 700C is recommended either before or after the digestion process (RISE-AT, 1998).
6.3.1.3 Sewaqe Sludqe
The digestion of sewage sludge provides sanitation, reduces the odour potential from the sludge and produces energy. It is usually delivered in liquid form at approximately 5% TS or dried to 20-25% TS (IWM, 1998). -The addition of 5% by mass sewage sludge to MSW has been proved to give good process performance and reactor stability, but better performance of anaerobic digestion can be achieved with a feedstock of 80/20 ratio (by mass) of MSW and sewage sludge (IWM, 1998).
6.3.1.4 Rice and Wheat Straw
The anaerobic digestion is possible for feed stocks with carbon-to-nitrogen (C/N) ratio of up to 45/1 (IWM, 1998). C/N ratios of the rice straw and wheat straw are 67 and 87 respectively (LGED, 2004). If the C/N ratio is very high, gas production will be low, because the nitrogen will be consumed rapidly by methanogens process for meeting protein requirements. So, the retention time for straw digestion is quite high. By mixing straw with other biomass resources of low C/N ratio would produce a reasonable C/N ratio.
Composition Fraction by mass ( %)
Paper 10.0 Glass 1.4 Metal 0.5 Plastic 2.6 Textile 2.5 Wood, Grass 22.0 Ash, Soil 40.0 Food waste 18.0 Others 3.0 Total 100
Table 6.7 Physical composition of IVISW at Dhaka, Bangladesh (REIN, 2005e)
90

6.3.2 Technology
Biogas-based electricity generation system components/subsystems (see Figure 6.12):
Biomass collection and transportation Digester
ýL Effluent storage Aý Biogas handling (piping and storage) 4. Biogas conversion equipment 4ý Generator and control system
consists of the following
Over 1.85 million animal waste digesters were installed in India by the mid 1990s, about one third of these were not operating in early 2000 for a variety of reasons, but mainly due to availability of feed material and delivery difficulties. In China, about 5 million family biogas plants were in operation in mid 1990s. In addition to these, there were 500 large scale digester operating at large pig farms and other sites, and some other 24,000 digesters operating at urban sewage treatment plants. There are several thousands biogas plants operating in other developing countries, most notably in South Korea, Brazil, Thailand, and Nepal (Kartha and Larson, 2000). In developed countries, most industrial and municipal digesters are mainly used for the environmental benefits they provide. An estimated 5000 digesters are installed in developed countries, primarily at large livestock processing facilities and municipal sewage treatment plants (Kartha and Larson, 2000).
6.3.2.1 Tvpes of Diqeste
The basic important requirement of a digester is that it should be air and water tight. Based on feeding the biomass, the digesters are of two types: Batch digester and Continuous fed digester.
A batch digester operates on a single charge until it is exhausted. At the end of the digestion process, the digester is emptied and reloaded for a new cycle. For this type, more than one digester is needed to guarantee the continuous supply of biogas. In a continuous fed digester, the feed material and digested slurry are added and removed at regular intervals. This type is less expensive, but requires close monitoring of feedstock solids. Commonly used continuous fed biogas digesters are (LGED, 2004; Kartha and Larson, 2000; and SIDdimensions, 1997):
(i) Floating-cover type digester: This type of was introduced commercially in India by the Khadi and Village Industries Commission (KVIC). The reactor walls are brick or concrete and the reactor is covered with a floating steel cylinder (see Figure 6.13). As the cylinder has a constant weight, it moves up when gas production is higher than consumption and vice versa.
(ii) Fixed-dome type digester: Fixed dome Chinese model biogas plant was built in China as early as 1936. It consists of an underground brick masonry compartment (fermentation chamber) with a dome on the top for gas storage (see Figure 6.13). Due to corrosion of the steel dome in floating type digester, the gas leakage problem happened. Fixed dome type design has become popular to avoid this problem.
91
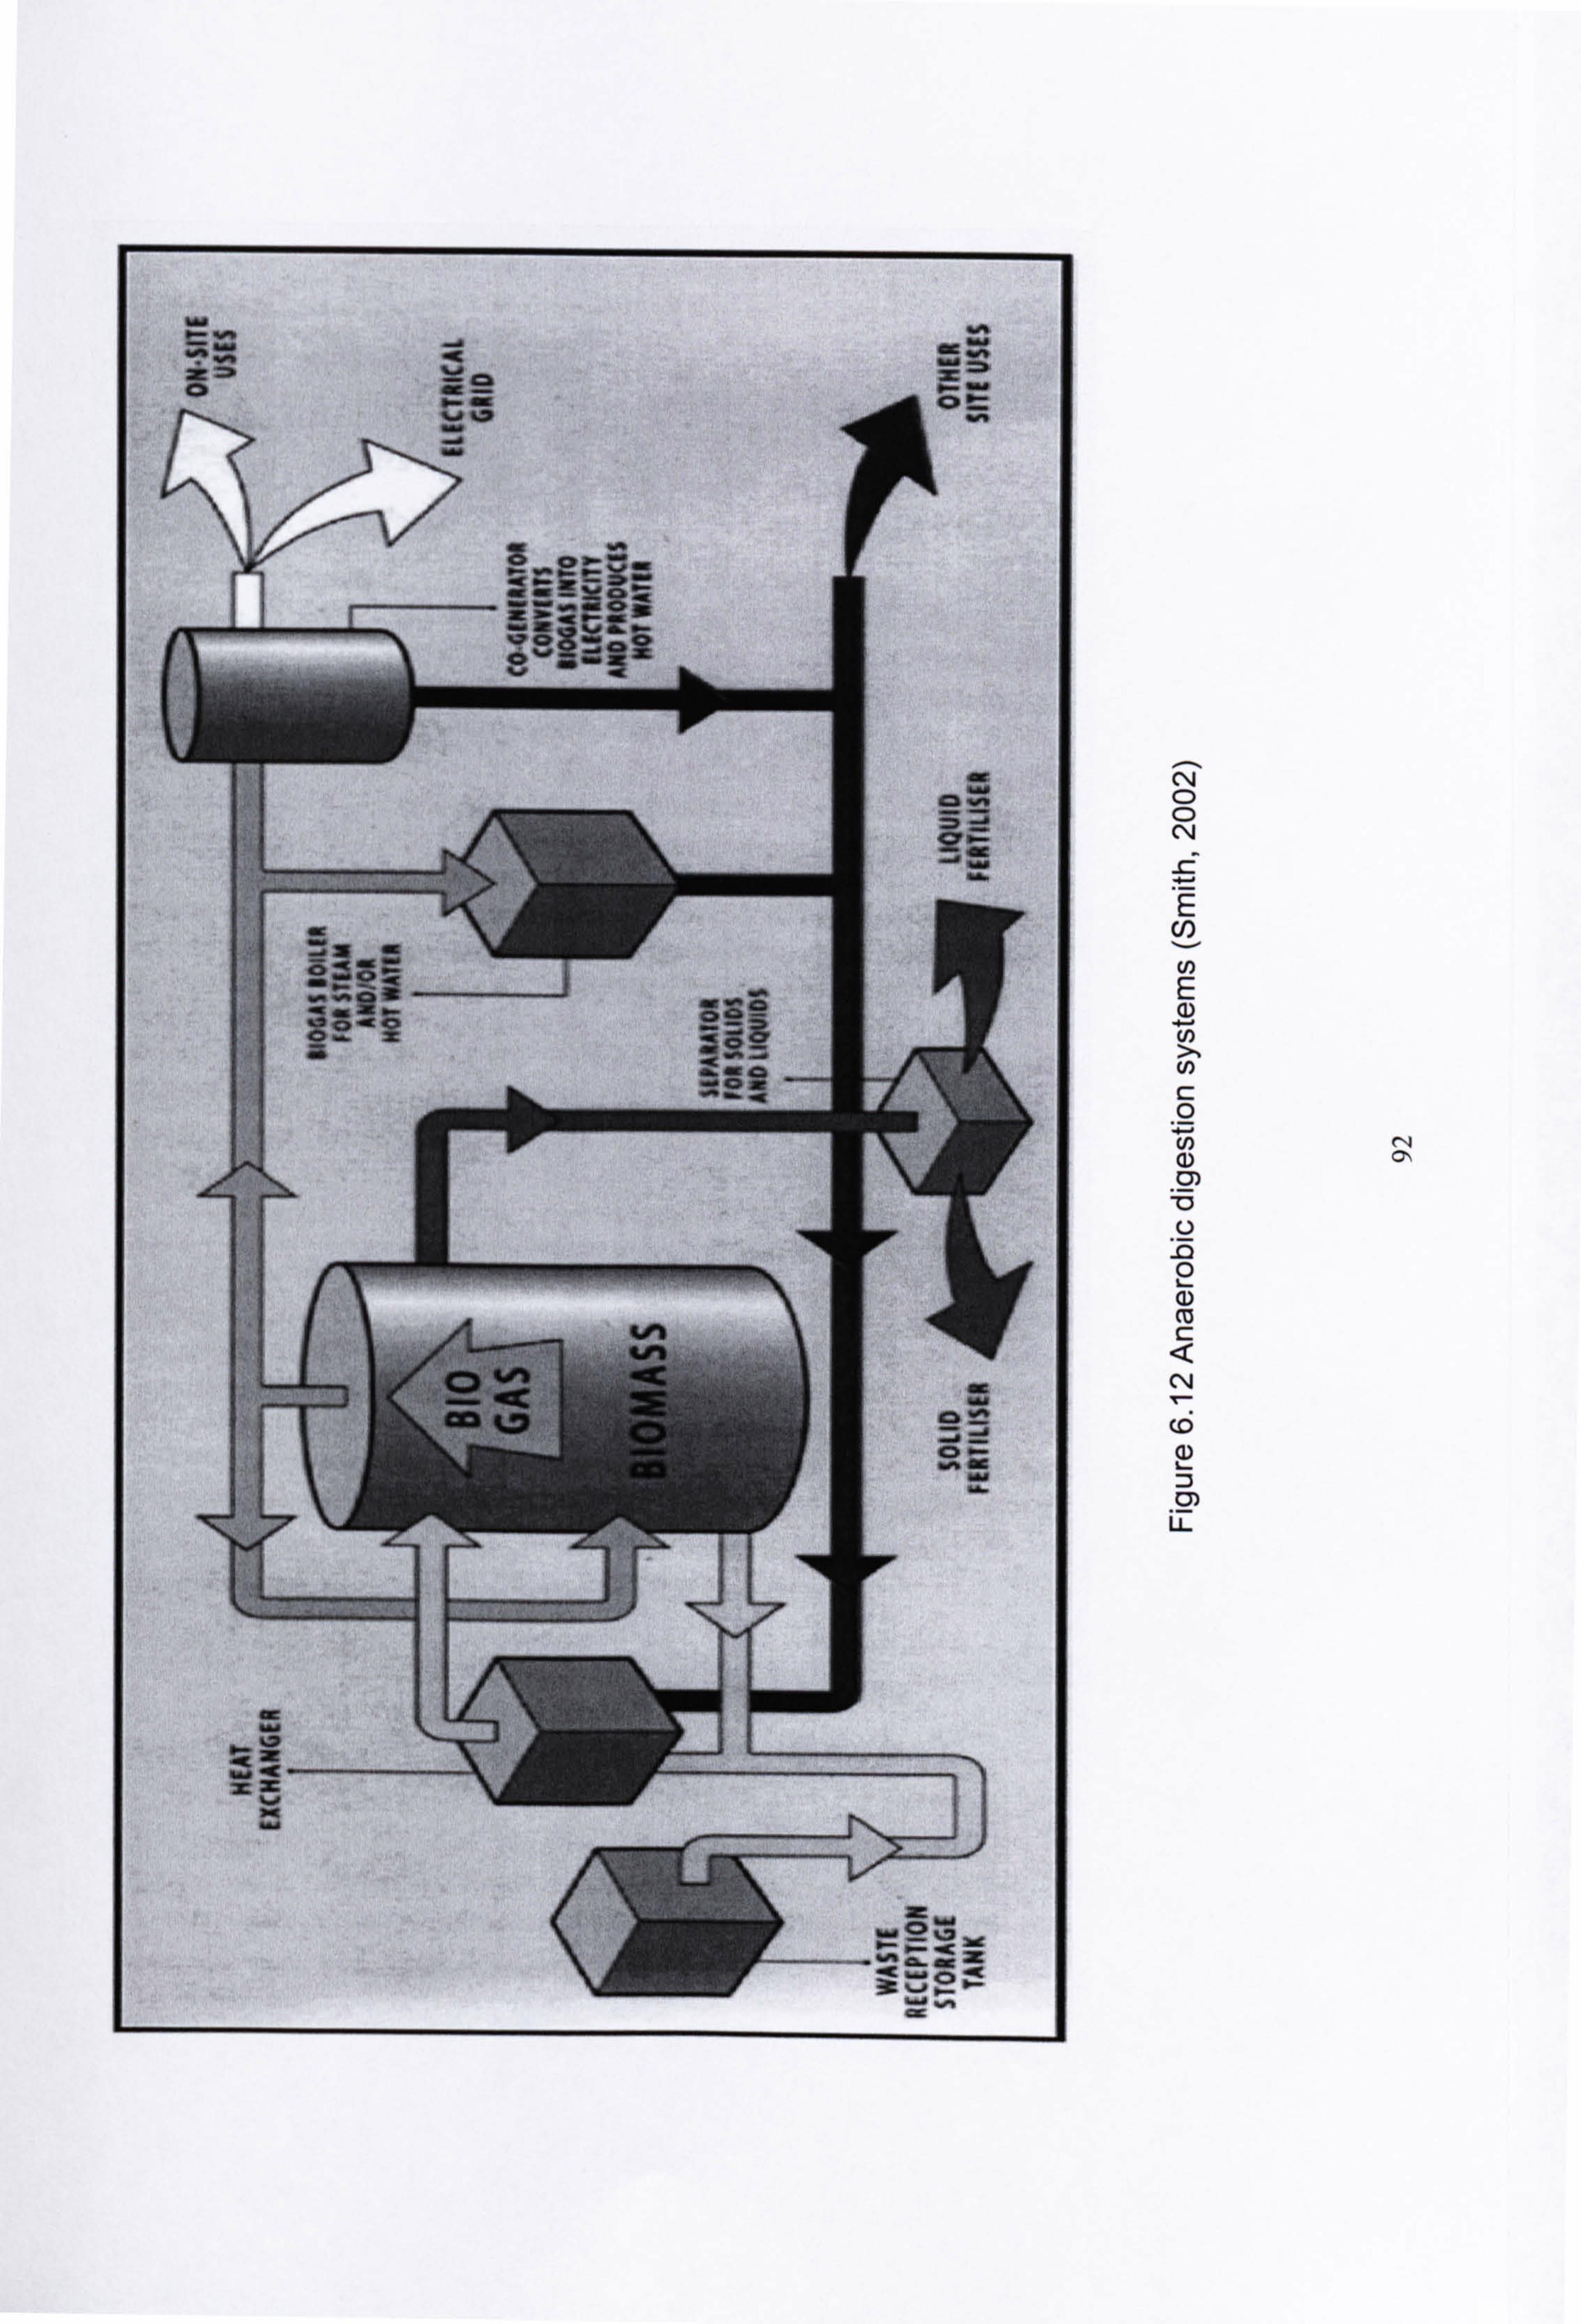
C\l C) C)
U)
(n E (D U) >N (n c 0 U) (1) 2y)
m 0
M C:
LL
r"I CN

Pressure inside the digester rises, when the rate of gas production is higher than that of gas consumption. In this case, the system expels some digester contents into the outlet compartment. In the opposite situation, when the consumption is higher than production, pressure inside the digester falls and the expelled materials in the outlet compartment run back to the digester.
(iii) Bag digester: This type of digester was first developed in the 1960s, in Taiwan. It consists of a long cylinder made of PVC. Bag type digester was developed to solve the problems experienced with brick and metal digesters.
(iv) Plug flow digester: This type of digester is similar to the bag digester. It consists of a trench lined with concrete or an impermeable membrane. The reactor is covered with either a flexible cover gas holder anchored to the ground or galvanized iron top. This type of design was first used in South Africa in 1957.
----------------------------------------------------- Gas outlet
Gas hokler Centrcd guiclee
Nuxing Pit Outlet pit
....... Partition on
ýwal
-------------------IL
14
---------------------
(a) Floating-cover digester
r ---------------------------------------------------- Removable manhole cover
sealed with clay
Inlet Gas Outlet Loose cover
Gas I M. .... max
........... S! Urr
Displacement tank
............ .............. ............. ............ let
... pipe
----------------------------------------------------
(b) Fixed-dome
Figure 6.13 Schematic diagram of commonly used biogas digester used in India and China (Kartha and Larson, 2000)
93

(v) Anaerobic filter: This type of digester was developed in the 1950's to use relatively dilute and soluble waste water with low level of suspended solids. It consists of a column filled with a packing medium. A great variety of non-biodegradable materials such as stones, plastic, coral, mussel shells, reeds, and bamboo rings were used as packing media. The methane forming bacteria form a film on the large surface of the packing medium and are not carried out of the digester with the effluent. (vi) Up flow anaerobic sludge blanket (UASB): This type of digester was developed in 1980, in the Netherlands. It is similar to the anaerobic filter type, in that it involves a high concentration of immobilized bacteria in the reactor. However, the UASB reactors contain no packing medium; instead, the methane forming bacteria are concentrated in the dense granules of sludge blanket which covers the lower part of the reactor. The feed liquid enters from the bottom of the reactor and biogas is produced while liquid flows up through the sludge blanket. Many full-scale UASB plants are in operation in Europe using waste water from sugar beet processing and other dilute wastes that contain mainly soluble carbohydrates.
6.3.2.2 Prime movers
Engines and micro gas turbines electricity generator sets are used to generate electricity by utilising the biogas as a fuel. Engines are of two types: internal combustion engines (ICEs), and external combustion engines.
6.3.2.2.1 Internal Combustion Engines
The most commonly used prime mover for biogas-based electricity generation is ICE. Types of ICEs are: Spark Ignition Engine: The octane number of gasoline and methane is 86 and 130 respectively (Barker, 2001). Methane is the major component of biogas, which makes it a suitable fuel for spark ignition engine. In terms of energy equivalents, 1.33-1.87 M3, and 1.5-2.1 M3 of biogas are equivalent to one litre of gasoline and diesel fuel, respectively (Marchaim, 1992). Electrical efficiency of this type of engine is around 25% at full load, falling off at part load (Picken, 1989). Manufacturers of bigger gas engine- generator set (>0.5 MW, ) offering the conversion efficiency of 35 - 40% of the input energy, which is very promising for biogas-based electricity-generating plants. (Tafdrup, 1995).
Compression Imition Enqine: In this type, certain percentage of diesel fuel needs to be injected for efficient combustion of biogas. Picken (1989) reported that a minimum of 7% by volume of the total fuel needs to be supplied as diesel oil. Electrical efficiency of this type of engine-generator set is 30 - 35% throughout the load range (Picken, 1989). This type of engine is very desirable when biogas production fluctuates. If the production of biogas is low, then the amount of diesel is increased and maintains the electricity generation. In case of malfunctioning of the digester or lack of biomass fuel supply, an immediate change to full diesel operation is possible.
6.3.2.2.2 External Combustion Engines
Types of external combustion engines are: Stirling Engine: In Stirling engine, combustion of the fuel takes place in an external boiler or furnace. Mechanical work is derived from the pressure changes that result
94

from the cyclic heating and cooling action of the enclosed working gas. Solid, liquid or gaseous (i. e. biogas) fuels derived from biomass can be used as a fuel. The advantages of Stirling engine are: high efficiency, which is up to 40%; and very low noise, being only about 10-20% of the level produced by an ICE with the same capacity (Lin et al. 1998).
Steam Enqine: Steam engine-generator systems can generate electricity from 20 kW upwards (Lensu and Alakangas, 2004). For >1 MW, capacity, steam turbines are used instead of steam engine due to its higher investment costs (for massive construction) (Lensu and Alakangas, 2004). The advantages of steam engines are: high reliability, low maintenance and simple control. Steam engines are not popular for biomass-based electricity generation due to its high capital investment cost and relatively low conversion efficiency.
6.3.2.3 Accessories and Control Svstems
The equipments used for biogas handling are: piping, valves, gas meters, pressure regulators, and gas scrubbers. Gas scrubbers are needed to remove the corrosive compounds (mainly H2S) present in the biogas. Scrubbing Of C02 from biogas is possible by methanation process, which is costly (Bari, 1996). Biogas containing more than 40% C02 needs scrubbing as it starts deteriorating the ICEs performance, provision should be made to flow adequate biogas for high C02 content (Bari, 1996).
The employment of reconditioned car engines could be a promising option to reduce the capital investment cost of the plant. Such spark ignition type engines need little modifications to use with biogas. The important modification is the replacement of the carburettor with a gas-air mixer with throttle valve to control biogas-air mixture for getting the better engine performance. However, in general, the electrical efficiency of the plant would drop with the use of a reconditioned car engine. There is a decrease in efficiency of 15-20%, when a spark ignition carburetted engine is converted to natural gas engine. This is due to the decrease in volumetric efficiency (because of gaseous fuel) and lower flame speed of air-gas mixture compared with air-gasoline mixture (Henharn and Makkar, 1998). For utilising reconditioned car compression ignition engines as dual-fuelled engines for biogas application, the modification of the engine is almost similar. Air and biogas mixes in a mixing chamber and then ignited by energy from the combustion of the sprayed diesel fuel.
Control systems are simple and readily available. Such systems are employed for protecting the engine and the electrical load by shutting the engine off, either in the case of any serious engine faults (e. g. high temperature, low level of oil/water, low biogas supply) or if the load is switched off. Moreover, control system shuts the engine off, if the load is too high or if the electricity generated is outside the specified voltage and frequency ranges.
6.3.2.4 Temperature of Digestion
Maintaining the digester temperature at the level desired is very important. The usual value of digester temperature is 350 C (Hall, 1989). In Bangladesh, the average ambient temperature during most of the year, is 30-350C, which is favourable for anaerobic digestion to occur. However, in winter periods, some form of heating is
95

needed to maintain the digester temperature. The most common methods of maintaining the digester at an elevated temperature are:
,; L Using some percentage of the biogas generated. , A. Utilising the exhaust gas from engine, through a heat exchanger. A. Using a water-cooled engine instead of an air-cooled engine.
6.3.2.5 Use of Diqester Effluent
The uses of the digester effluent are: 4. As fertilizer. The digester effluent is usually dried in the sun, either separately or in
combination with agricultural wastes before using it as a fertiliser (Marchaim, 1992). The organic components of the digester effluents are rich in nitrogen, phosphorus, potassium, and nutrients. Storage facilities are required to store the effluent.
4, Aquaculture. The digester effluent can be used to stimulate the growth of algae in fishponds and thereby provide feed for fish.
'4ý In mushroom production. In general, digester effluent is free from bacteria and pathogens and is a very good media for cultivation of mushroom. It has been reported that the mushroom production increased by 30%, as a result of using the digester effluent instead of normal cultivation practises (Henderson, 2004).
'ýL Seeds fermentation. Digester effluent also used for seeds fermentation. It has been proven that soaking seeds in digester effluent for 12 hours prior to germination rather than soaking in water increases corn sproutability from 92.5% to 95%, and increases early growth in the plants by 5% (Henderson, 2004).
6.3.3 Biogas Production: Important Parameters
The biogas produced is actually a mixture of mainly methane and carbon dioxide. Methane is a combustible gas. The energy content of biogas depends on the amount of methane it contains. Typical biogas composition and heating value reported by RISC- AT (1998) are: Methane (by vol. ) : 55 - 70 % Carbon dioxide (by vol. ) : 30 - 45% by vol. Hydrogen Sulphide (pprn by vol. ) : 200 - 4000 Energy content (Mj/M3) : 20 - 25
Factors, which effect AD processes, are:
Nutrients and Orqanic Fraction: Nitrogen is the main nutrient for the growth of methane forming bacteria. The necessary nutrients in the descending order of importance are nitrogen, sulphur, phosphorous, iron, cobalt, nickel, molybdenum, selenium, riboflavin, and vitamin B12 (IWM, 1998). C/N ratio between 20 and 30 is favourable for biogas production (Sýrensen, 2000).
Moisture Content: Moisture content of feedstock is an important parameter. Water provides the medium for chemical reactions, transport nutrients and allow the micro organisms to move from place to place. If moisture content is high, larger reactor
96

volume required (IWM, 1998). Reliable anaerobic digestion has been reported at digestate TS levels up to 50% (IWM, 1998). The ideal value of TS content is 5-20% (Hall, 1989).
Retention Time: Retention time depends on the ease of biodegradation, the concentration of biomass present and the contact time. On the other hand, the rate of degradation depends on the temperature of the process and the predominance of bacterial species. The range of retention time for single stage, mesophilic anaerobic digestion of MSW is 12-25 days (IWM, 1998).
pH: Ideal pH range for AD process should be in between 6.4 and 7.2 (IWM, 1998). If the C/N ratio is very low, nitrogen will be liberated and accumulated in the form of NH4. NH4 Will increase the pH value of the content in the digester. A pH value higher than 8.5, will start showing toxic effect on methanogen population (SDdimensions, 1997). Low pH can also inhibit acidogenic conversion of the substrate (IWM, 1998).
Reactor Mixing: Mixing improves the contact between micro-organisms and substrate and influences the ability of the bacteria to obtain nutrients. Also, mixing improves heat transfer and contributes to the maintenance of uniform temperature throughout the reactor. Mixing has little effect on the biogas production rate or quality but a great effect on the quality of the digestate and the working volume of the reactor (IWM, 1998).
Oxygen Sensitivit : AD process proceeds in the absence of oxygen. 5-15% by volume of methane in air is explosive (IWM, 1998), so care must be taken to avoid the dangerous mixtures of oxygen and biogas to occur in the system.
6.3.4 Co- digestion of Biomass Resources
It has been proven that biogas production could be increased by mixing materials with high C/N ratio with those of low C/N ratio (RISC-AT, 1998). Biogas production rates of animal waste and sewage sludge are 0.380 m3/kg VS and 0.265 M3 /kg VS respectively, however, a 16% increase in the biogas production rate (i. e. 0.407 m3/kg VS) is reported if this two biomass resources are co-digested at 50: 50 mixing ratio (see Table 6.8). RISC-AT (1998) reported that the joint treatment of MSW with animal manure/sewage sludge is a popular method in existing plants, which tends to be simpler and is economically more viable than an MSW - only treatment system. In China, as a means to balance C/N ratio, it is customary to load rice straw at the bottom of the digester upon which human waste is discharged (SIDdimensions, 1997). Similarly, at Machan Wildlife Resort located in Chitawan district of Nepal, feeding the digester with elephant dung in conjunction with human waste enabled to balance C/N ratio for smooth production of biogas (SIDdimensions, 1997). Overall merits of co-digestion are (Braun and Wellinger, 2004):
,; L Improved nutrient balance , 4ý Increased and steady biogas production throughout different seasons 4. Increased quantity of digestate to use as a fertilizer
97

Type of biomass Operating conditions: temperature CCY retention time (days)
Mixing ratio for co- digesti on
C/N ratio
Biogas production (m3lkg TS)
Reference
Animal waste 35/60 25 0.300 LGED (2004) Animal waste 20-25/60 25 0.200-0.250 LGED (2004) Animal waste -/40 - 0.380a Shah(1997) Animal waste 0.360 Nagamani and
Ramasamy(1999) Cow (bull) dung 35/- 0.250 Shannon(1996) Cow dung T5-5- 0.340 Omer and Fadalla (2003) Cow dung 30/55
_25_ 0.300 Devkota (2003)
Cow dung 35/55 25 1 0.450 Devkota (2003) Buffalo waste - I 0.540 Nagamani and Ramasamy
(1999) Poultry waste 1 - 0.480 Omer and Fadalla (2003) Poultry waste -/40 - OTT- -Shah (11997) Poultry (chicken) waste 35/32 2 5' 0.350-0.400 Shannon(1996) Sewage sludge 13 130 0.400 - Omer and Fadalla (2003) Sewage sludge /40
g
13 13 0.2652 Shah(1997) Sewage sludge 35/60 13 13 0.430 LGED (2004) Water hyacinth - 0.400 Omer and Fadalla (2003) Water hyacinth 30 - 0.160 LGED (2004) Green grass - 0.630 LGED (2004) Weeds -/40 - 0.277a Shah(1997)
- - Wheat straw 35/60 87 0.450 LGff D (2004) Wheat straw (chopped ground)
35/- - 0.400/ 0.550 Shannon(1996)
Vegetable wastes 0.250 IWM (1998) IVISW (30% biodegradable)
0.040 IWM (1998)
Biowasteso 409 0.100-0.200c RISE-AT (1998) Blowastee 0.100- 0.228' Schmidt and
Pinapati (2000) Biowastes" - - 0.125 IWM (1998) Animal waste + Weeds -/40 50: 50 - 0.363a (5)* Shah(1997) Poultry waste + Sewage sludge
-/40 50: 50 - 0.413' (1)* Shah(1997)
Animal waste + Poultry waste
-/40 50: 50 - 0.528a (6)* Shah(1997)
Animal waste + Sewage sludge
-/40 50: 50 - 0.407a (16)* Shah(1997)
Sewage sludge + Weeds -/40
I 50: 50
I -
I 0.3 ý'7Fa (3 -9r
I Shah(1997)
II *figures between brackets revresent the % increase in biogas production due to co-digestion over that for the average of two wastes digested separately. a blogas rate In mI kg volatile solid (VS) b ON data collected from reference source Sorensen (2000)
in m`1 kg blo waste; d bio wastes Is defined as the organic firaction of MSW 0 for whole MSW
Table 6.8 Biogas production rate as a function of the operating conditions and mixing ratio
6.3.5 Potential Biomass Resources
The retention time for wheat straw is 60 days for biogas produced to more than 90% of the total yield, whereas it is 30-40 days in the case of animal waste (LGED, 2004). Due to high retention time, seasonal availability dependence and relatively lower quantity of district wise availability (see Chapter 5), the rice and wheat straw were excluded from the current estimate of blogas production potential in Bangladesh. Based on the advantages of co-digestion presented in section 6.3.4, biomass resources in Bangladesh have been grouped primarily into the following two digestible mixtures: 4. Group A: Animal waste and poultry droppings 4. Group B: Organic fraction of MSW and sewage sludge
98

C/N ratio and IVIC are the two important parameters for designing a recipe for co- digestion. The effect of IVIC is more critical compared to the effect of C/N ratio, because too high or too low IVIC tends to stop the digestion process (Cochran and Carney, 1996). If there are limitations on the availability of one of the sources of biomass in the group, the mixing ratio is determined based on the availability of the biomass resource in short supply. District wise poultry droppings availability in Bangladesh, is not enough (see Chapter 5) to digest it alone. The ratio of animal waste to poultry waste availability in the whole of the country is 31: 1 (see Chapter 5). The CIN ratio of the animal waste, and poultry wastes are 25, and 18 respectively (LGED, 2004; Sorensen, 2000). Assuming the mixing ratio is equal to the availability ratio (i. e. 31: 1) and using the individual C/N ratio; the C/N ratio of group A mixture is estimated at 25, which is favourable for the production of biogas.
If the MC and amount of dry mass of a biomass resource is known, then the wet mass of biomass can be estimated as:
Quantity of wet mass = [Quantity of dry mass / (1 - MC)]
MC of poultry dropping varies, assuming an average MC of 50% for mixed type (boiler and layer) of poultry droppings; and MC of 83% for animal waste (see Table 6.9); the wet mass of the animal waste and poultry droppings for mixing ratio of 31: 1 are 182 kg and 2 kg, respectively. Based on this estimation, the overall MC of group A mixture becomes 84.3%.
The biomass availability ratio of sewage sludge and the organic fraction of MSW is 1.61 (see Chapter 5). The C/N ratios of sewage sludge and MSW are 13 and 40 respectively (RISE-AT, 1998; and Sorensen, 2000). So, based on the individual C/N ratio and mixing ratio of 1.61, the C/N ratio of group B biomass mixture becomes 23; which is favourable for biogas production. Using the moisture content reported in Table 6.9, the wet mass of the sewage sludge and MSW, for mixing ratio of 1.6: 11; are 8 kg and 1.8 kg, respectively. The overall MC for co-digestion becomes 73.6%.
The amount of water needed for maintaining specific moisture content of the mixed recipe can be calculated as:
w wm W. * (Mcf - mci) W. =Wf-Wi= I" (I-mci)- (-mcf)*(l-ýwc-i) (6.5)
Biomass Nitro en content Moisture content resources (% dry Reference (% by mass) Reference
Poultry wastes: Broiler Layer
1.6-3.9 4-10
(Cochran and Carney, 1996) 22-46
62-75
(Cochran and Carney, 1996)
Animal wastes 0.29 LGED (2004) 83 LGED (2004) IVISW 1.2 RWEDP (2002a)
M 45 REIN (2005e)
Sewage sludge 2.96 WP R2002a) 80 LGED (2004)
Table 6.9 Moisture content of biomass resources suitable for AD in Bangladesh
99

where W, Wet mass of initial mixture W, Dry mass of the mixture (TS) Wf Wet mass of the final mixture for the desired moisture content W" Mass of water to be added for the desired moisture content MCf Desired or final moisture content MCI Moisture content of the initial mixture
Bangladesh has many rivers, canals, and ponds. So, there is a big potential of the aquatic biomass (i. e. water hyacinth) in the country. No estimation is available of the availability of this biomass resource. But, a reasonable quantity could be used for anaerobic digestion. The C/N ratio of the water hyacinth is 25 (SIDdimensions, 1997). So, mixing water hyacinth with either group will keep the overall C/N ratio of the mixture in the optimal range.
Adequate experimental results of biogas production rates for different types of co- digestion mixtures (with various mixing ratio) are not available in the literature. Biogas production rates have been estimated as:
Group A: C/N ratio of the group A mixture is almost the same as the C/N ratio of the animal waste (i. e. 25). So, biogas production rate of the animal waste alone, i. e. 0.300 m3/ kg TS (LGED, 2004), could be considered as the biogas production potential of the group A biomass mixture.
Group B: The biogas production rates of sewage sludge and bio-wastes are 0.430 and 0.125 m3/kg of TS respectively (see Table 6.8). Based on the mixing ratio (i. e. 1.61), and individual biogas production rates, the biogas production rate of the mixture is estimated at 0.313 m3/kg TS.
As a conservative figure, the LHV of the biogas produced from either group of co- digestion mixtures were assumed to be 20 Mj/M3 (see section 6.3.3).
6.3.6 Capital Investment Cost and Overall Efficiency
The components of the capital investment costs of a biogas-based electricity generation system are the costs of:
4. the digester and biogas cleaning system; *'ý engine or gas turbine; 4. generator and control system; 4ý optional heat recovery system; -4. land procurement and civil works; 4. installation, commissioning and training;
Investment costs data reported in Table D3 and Table D4 (in Appendix D), were converted into US$, in September 2004 value (see Section 6.1). Biogas digesters built in the developing countries are either family or community scale (see Table D4, Appendix D). The specific capital investment widely varies depending on the scale and the technology employed. For the individual household scale, fixed dome digesters are 40 to 50% less capital intensive than floating-cover digesters (Karha and Larson, 2000).
100

Digester is a major component of the biogas plant and commonly constructed locally with locally available materials using local labour. So, there are significance variations in specific capital investment costs (US$/kW, ) of the biogas-based electricity- generating plants (see Table D3, in Appendix D). Some of the plants are used for CHP application. The capital investment cost of a CHP plant is higher than the corresponding costs for only an electricity-generating plant (see Table D3, Appendix D). From the review of the data presented, it can be concluded that the variation of the specific capital investment costs (US$/kW. ) are related to the following factors:
, iL electricity-generating capacity of the plant; 4. whether the plant is manufactured locally or imported; 4. types of conversion equipment; , 4, whether the plant is for electricity generation or for CHP application;
Factors which affect the electrical efficiency are (see Table D3, Appendix D):
4. electricity-generating capacity of the plant; ýL types of conversion equipment; 4. types of biomass (methane content varies as biomass varies);
Data for plants (see Table D3, in Appendix D), for only electricity generation were employed to generate the trend line. Correlations between the specific capital investment costs and plant electricity-generating capacity; and between the overall electrical efficiency and plant electricity-generating capacity were developed for biogas- based spark-ignition engine-generator plants (see Figure 6.14 and Figure 6.15). The variation in biogas quality due to different types of biomass feedstock's was assumed negligible. Due to lack of enough data, for plants in the developing countries; data for plants in developed countries (i. e. Europe and the USA) were used to develop the correlations (see section 6.1). The resulting equations for the specific capital investment cost and for the overall electrical efficiency are:
SCIbj. g. ý plant = 14317(Pr' 2706 (6.6)
17biogas plant =
20.103(py. 0862 (6.7)
Adequate data are not available to develop the investment cost and efficiency correlations for biogas-based compression-ignition engine-generator plants. The investment cost of the spark-ignition engine-generator plant is higher than the compression ignition engine-generator plant (Stassen, 1995). For example, specific capital investment cost of the 100 W, capacity spark-ignition engine-generator and compression ignition engine-generator plant are US$ 499 and US$ 419 (September 2004 value), respectively (Stassen, 1995). For 30 W, capacity plant, the corresponding costs are US$808 and US$688 (September 2004 value), respectively (Stassen, 1995). For the above two cases, specific investment ratio of the spark- ignition and compression-ignition engine-generation plant becomes 1.19 and 1.17 respectively, which can be rounded as 1.2. So, trend equation (6.6) could be adjusted to estimate the specific capital investment of the AD-based compression-ignition engine-generator plant, by dividing a factor of 1.2.
101

i i
_
0
0 CD (. 0
70 a)
0
(D < . 0) CO
LO ROM
0
4.0 ca
Co a) cn CL U) 0 m L- ED w 0
to (D cl) - L.
4)
0 CL U) 0 0 m
.0 a) a) a) E cy)
Z cn (D 4) c: > Fm c: C:
Q C) 0.
-Fu Q) It C:
(14 Q-. O M- 0 -F
. c-)
. 2)
(D 0- cl
(D U)
C. Ci (D L - =3 LM
U-
0 0Q00Q CD CD 000 CD 0 0 in (D 0 Lf) U) IV IV CV) (14 cm
(m)i/ssn) ISOO IUOLUISGAUI ILII! dLo Oilpeds

0 Q CM T-
C: 0
0 CM
m
70
a) (1) cu m C-: < 0
co -= cn (D a) CL 0 70
c co
0 (D CL
cu 0 r_ =
CD CD
L- 4)
CU LLJ
cn cn C: M cn E
. 1.0 -0 -a 0
0 (D
C: CY) LD a)
.0C:
LU
0 04
(6 D
. 2)
U-
0 00 U) 0
C14 CM
W AOU8131: 96
rn CD

The electrical efficiency of the gasification-based spark-ignition engine-generator plant is lower than the compression-ignition engine-generator plant (see Table D1, Appendix D). For example, electrical efficiency of the 30 W, and 100 W. spark-ignition engine electricity-generating plants are 16% and 17% respectively, whereas the corresponding values are 18% and 19% respectively in the case of compression-ignition engine electricity-generating plants (see Table D1, Appendix D). Using these data, electricity efficiency ratio of the gasification-based compression-ignition and spark-ignition generation plant becomes 1.125 and 1.118 respectively; which can be rounded as 1.12. Assuming the similar ratio for biogas-based plants, trend line equation (6.7) could be adjusted by a factor 1.12, to estimate the electrical efficiency of the AD-based compression-ignition engine-generator plant.
The capital investment cost of biogas plant depends on the local situation (Lettinga and Haandel, 2003). The cost of construction of a biogas-based electricity-generating plant depends to a large extent on the cost of labour, and due to the cheap labour in the developing countries, the investment cost of the plant is much cheaper than in developed countries. Also, the cost of construction materials of the digester in developing countries is cheaper than in the developed countries. The extra costs for the treatment of digestate slurries in the developed countries, can be avoided in developing countries, as in most cases this treatment is not necessary due to the absence of environmental legislation.
Adequate data for the capital investment costs of biogas-based electricity generation plants, installed in the developing countries are not available (see Table D3, Appendix D). It was observed that, in the case of the gasifier-based electricity generation plant, the capital investment costs in developed countries is 2 to 3 times higher than the corresponding costs in developing countries (see Table D1, Appendix D). The same factor was assumed to be applicable for the investment costs of the biogas-based electricity generating plant. As an example, in China, the specific capital investment cost of a 315 W, blogas-based plant is 1094 US$/kW,, whereas, in USA, the specific capital investment cost of a 360 W, biogas-based plant 3511 US$/kW, (see Table D3, in Appendix D). Ravindranath and Hall (1995) also reported a cost of US$ 1793/kW. for 5 W, anaerobic digestion-based electricity plant installed in India. The specific investment cost (US$/kW. ) decreases as the plant size increases (see Table D3, in Appendix D). So, as a conservative estimate, the capital investment costs of biogas- based electricity-generating plants in developing countries were considered to be 50% of the costs incurred in the developed countries.
Assuming a negligible variation in electrical efficiency, trend equation (6.7) could be used for developing countries as well. The mean electrical efficiency of the data used to generate the electricity efficiency trend line for spark-ignition engine-generator plant is 31.89%.
6.4 Direct Combustion
Biomass-based direct-combustion electricity generation plants are not common in developing countries. In developed countries, however, such plants are commonly utilised for large-scale grid electricity systems. There are only a few small-scale direct combustion based biomass electricity plants which are operating for off-grid applications in some of the developing countries (see Table D5, Appendix D).
104

6.4.1 Biomass Resources for Direct Combustion
Important properties of biomass fuel, for direct-combustion based electricity generation, was reported in section 6.2.1. Excess air factor (A) is defined as the ratio of the real air supply to the air which is theoretically needed for combustion. The optimum value of A depends on the type of furnace and type of biomass fuel (Quaak et al. 1999). Adiabatic flame temperature is very sensitive with A (see Figure 6.16). Effect of MC on adiabatic flame temperature is more compared to ash content (see Figure 6.16).
Direct combustion is best suited to biomass with low MC. Although it is possible to dewater the sewage sludge and animal waste, and then burn it in a boiler to generate electricity, this technology is still under development because of the inherent processing cost (Lewis and Hoecke, 1999).
6.4.1.1 MSW for Direct Combustion
MSW can be utilised as a fuel for direct combustion, with minimal processing (mass burning); or it can undergo moderate to extensive processing before being combusted as refuse-derived fuel (RDF). The technologies are:
(i) Mass burning. MSW is burned with only minor pre-sorting to remove oversize, hazardous, or explosive materials. MSW is not shredded or sized before combustion. The major components of a mass burn facility include:
4. MSW receiving, handling, and storage systems 4. A boiler and a flue gas cleaning system -A. Steam turbine and generator , 4. A condenser cooling water system -L A residue hauling and storage system
Small mass burn modular facilities are usually prefabricated and shipped fully assembled or in modules to the construction site.
zooo AOdw I%
Moulo% AC, 0=20%
MCv4M
J2
1.0 1-5 2-0 23 an 3S &0 Excess air
Figure 6.16 Adiabatic flame temperatures as a function of ash content, moisture content and excess air (Quaak et al. 1999)
105

(ii) Refuse derived fuel (RDF). RDF is produced by mechanically separating the non combustible and recyclable fraction. The extent to which non-combustible materials are removed varies. Most systems remove metals with magnetic separators; glass, grit, and sand are removed through screening. Some systems utilise air classifiers, trommel screens, or rotary drums to further refine the waste. The fuel may be sized for the specific requirements of the furnace or boiler. In some processes, RDF is compressed to pellets or cubes to produce a densified RDF (d-RDF). The RDF can then be used in one of several configurations (CEC, 2002a): 4ý Dedicated RDF boilers designed with travelling grate or fluidized-bed 4. Co-firing of RDF with coal or oil
The combined ash and residue typically ranges from 20 to 25% by mass of the incoming MSW fuel. Production of hazardous ash is avoided by preventing the elements which create hazardous waste, from entering the system. Ash could be mixed with soils for use as land-fill cover (CEC, 2002a).
6.4.1.2 Poultrv Lifter for Direct Combustion
Poultry litter is usually made up of wood shavings, shredded paper or straw, mixed with the poultry droppings. It has a calorific value of between 9-15 GJ/tonne, and has a moisture content of between 20-50% depending on the methods of husbandry used by farmers (ESRU, 2004). The first commercial-scale poultry litter-based direct- combustion electricity-generation plant was installed in UK (see Table 6.10). No such plant was found in developing countries (see Table D5, Appendix D). District wise availability of poultry waste is not promising to build poultry waste-based direct- combustion electricity-generation plant in Bangladesh (see Chapter 5).
6.4.2 Technology
6.4.2.1 Tvpes of Burner/Combustor
The combustion process consists of: drying, pyrolysis and reduction, combustion of the volatile gases above the fuel bed and combustion of the char in the fuel bed (Quaak et al. 1999). To improve the efficiency of the biomass combustion, pre treatment of the biomass (e. g. chipping, briquetting) is necessary (Wereko-Brobby and Hagan, 1996).
Name Location of the plant
Yearof commiss- loning
Output capacity (Mwý)
Fuel used
Consumption of fuel (ktonne/yr)
Technology used
Thetford Norfolk June, 1999 38.5 Poultry litter 420 Moving grate boiler and steam turbine
Eye Suffolk July, 1992 12.7 Poultry litter, 160 Moving grate boiler horse bedding and steam turbine (12%) and feathers (7%)
Westfield Scotland January, 2001 9.8 Poultry litter 110 BFB boiler and steam turbine
Glanford North November, 13.5 Meatand - Moving grate boiler Lincolnshire 1993 bone-meal and steam turbine
(MBM)a
a In May 2000 the plant was re-commissioned to bum MBM, can re-commission to combust poultry litter
Table 6.10 Poultry litter combustion-based power plants operating in UK (EPR, 2004)
106

Generally furnace and the boiler are integrated, and, in practice, such installations are jointly referred to as boiler. Depending on biomass characteristics, different types of boilers are used. For lumps and big pieces having moisture content below 50%, grate firing boiler are used (Quaak et al. 1999). On the other hand, granular biomass (saw dust, rice husk) can be more conveniently burned in a fluidised bed boiler (Quaak et al. 1999). Stoker and fluidised bed boiler technology is in commercial operation at numerous sites throughout the world (see Table D5, Appendix D).
The different types of furnaces/combustors (or boilers) are (Bain et al. 1998; Bhattacharya, 1993; Quaak et al. 1999):
Pile Burner. A pile burner typically consists of a two-stage combustion chamber: a lower pile section for primary combustion and an upper section for secondary combustion. The boiler is located above the secondary combustion chamber. Biomass fuel is piled up on a grate in the bottom. Combustion is completed in the secondary combustion zone. Feed is introduced either on top of the pile or through an underfeed arrangement using an auger. Ash is removed by manually dumping the ash from the grate after the ash is cooled. Pile burners typically have low thermal efficiencies (50 to 60%). It is simple and has the ability to handle wet, dirty biomass fuel.
Stoker combustor. Stoker combustor has a moving grate which permits continuous ash removal, thus eliminating the cyclic operation characteristic of the pile burners. The fuel is spread more evenly, normally by a pneumatic stoker, giving more efficient combustion. In basic stoker design, the bottom of the furnace is a moving grate. Bubblinq fluidized-bed combustor. In this type of combustor, the primary combustion air flows from the bottom. There are two zones; a zone containing freely moving sand particles supported by upward air and a freeboard zone above the fluidised bed. The particles remain suspended in the combustion air due to the balance of downward gravity force and the upward drag force due to flue gas flow. Hot flue gases from an external burner are used to preheat the fluidized bed to the fuel ignition temperature. For biomass, this temperature is around 5400 C. Combustion is completed in the freeboard space resulting in freeboard temperatures approaching 9800C. The important advantages of BFB boiler include low NO, formation due to low operating temperature and ability to burn even low grade fuels with high efficiency. For example, rice husk, which can not be burned efficiently in conventional combustion chambers, has been burned with 95-99% thermal efficiency in such beds.
Circulatinq fluidized-bed. In a CFB boiler, the air velocity is so high that the bed and fuel particles flow upward with the flue gas stream, forming a solid circulation loop. The light fuel particles burn during circulation, whereas the heavy particles burn until they are light enough to join the circulation stream. Heat exchange rates are high because of the intensive mixing in fluidised bed. Combustion temperature ranges from 7500C to 9500C. In a CFB boiler, it is easy to introduce a sorbet solid, such as limestone or dolomite, to control S02 emissions. CF13 temperatures are maintained at about 8700C, which helps to optimize the limestone-sulphur reactions. CFB boiler can handle varying feedstock with different composition, ash contents and moisture contents.
6.4.2.2 Prime movers
The steam/heat generated through direct firing of biomass can be used to drive a steam turbine or steam/Stirling engine. The simplest systems (up to 100 W. output
107

capacity) operate on an open cycle requiring a continuous supply of clean water for the boiler (RWEDP, 2002a). Boilers based on a closed cycle generally have higher efficiencies. The smallest available system of this type is of 200 kW output capacities (RWEDP, 2002a).
Stirling engines have been in use for small-scale, direct-combustion, off grid electricity generation. Biomass fired Stirling engine is a feasible technology in the range of 5 to 100 kW output capacities (Podesser, 1999). In this type of external combustion engine, the system is based on closed cycle, where a working gas (e. g. air, helium and nitrogen) is alternatively compressed in a cold cylinder volume and expanded in a hot cylinder volume (see Figure 6.17). Wood-processing industries commonly dump their wood wastes. A trend is now emerging in Indonesia and Malaysia to establish integrated wood-processing complexes, where wood wastes from processing are being used to supply energy for the complex (RWEDP, 2005).
6.4.3 Potential Biomass Resources
It has been proven that BFB and CFB boiler can burn many agricultural, municipal and forestry-based biomass resources (Schmidt and Pinapati, 2000). CFB boiler can burn biomass fuels with MC between 15 to 60% by mass (Schmidt and Pinapati, 2000). Fluidised bed combustor can burn biomass fuel with ash content up to 50% or even higher (Quaak et al. 1999).
From the review of the data presented in Table D5 (in Appendix D) and studying the availability of biomass resources in Bangladesh (see Chapter 5); the biomass resources to be considered for direct-combustion based electricity-generation systems in Bangladesh are:
4. Agricultural wastes -iL Forestry residues 4. Combustible fraction of MSW
Many direct combustion-based electricity-generating plants are designed with multiple type of fuel feeding capability (Schmidt and Pinapati, 2000). Burning of agricultural residues and fuel wood/ forestry residues together to generate electricity has been practised (see Table D3, in Appendix D). The available amount of the agricultural waste and forestry residues were estimated for the whole country and as well as for
r ---------------------------------------- air pra-heater air input
hot heat exchanger regenerator
economiser
sue gas generator G
air Stirling- biomas
furnaoe engine Cooler S
L ------------------- -------------
Figure 6.17 Schematic diagram of the Stirling engine operation (Lensu and Alakangas, 2004)
108

each district (see Chapter 5). District wise availability of either agricultural wastes or forestry residues alone is not promising for direct-combustion based electricity generation (see Chapter 5) in Bangladesh. Mixing the agricultural wastes and forestry residues would ensure the uninterrupted feed supply and generate more electricity for a given district. In Bangladesh, the combustible part of the MSW is 20% by mass of the total available MSW (REIN, 2005e).
Quantities of certain fuel constituents like K, Cl, Si, and S (in the case of agricultural wastes) and Ca and Mg (in case of forestry residues) in the mixed biomass fuel should be controlled before feeding to fluidised bed boiler; otherwise these constituents leads to agglomeration and hard deposition (on the boiler surfaces) by reacting with sand used in fluidised bed, at the boiler operating temperature of 800-9000C (Schmidt and Pinapati, 2000). One way of controlling is by controlling the mixing ratio of the biomass fuels.
So, the potential biomass resources have been grouped for direct-combustion based electricity-generation in Bangladesh, as: Aý Group : Agricultural waste and Forestry residues
-L Group B: Combustible fraction of MSW
In case of group A, the energy potential is not uniform in every month due to the seasonal availability of the agricultural residues (see Chapter 5). So, there are two options for utilising the biomass resources of group A:
-L Either, to design a plant based on the lowest monthly availability. In this case, there is no need to arrange biomass storage facilities.
4. Or, to design a plant based on the average monthly availability. In this case, there should be some arrangement for biomass storage facilities.
The second option was considered in this study for maximum electricity generation potential.
6.4.4 Capital Investment Cost and Overall Efficiency
The components of the capital investment costs of biomass-based direct combustion electricity-generation systems are:
4. fuel supply system; .; L boiler and gas cleaning system; 4. engine or steam turbine; -4. auxiliary systems (e. g. condenser, make-up water treatment, boiler feed water
pump and flue gas fan); 4. generator and control systems; '4ý land procurement, civil works; '-L installation, commissioning and training;
Table D5 (in Appendix D), shows the efficiency, capacity and capital investment costs (US$/kW,, ) for different types of the biomass-based direct combustion electricity- generation plants installed in different parts of the world. All the costs were converted into US$, in September 2004 value (see Section 6.1). The capital investment costs and
109

electrical efficiency varies widely mainly due to the variation of the conversion equipment, types of biomass fuel and plant electricity generating capacity (see Table D5, Appendix D). Trend lines of the capital investment costs and overall electrical efficiency of the direct-combustion based electricity-generation plants were generated (see Figure 6.18 and Figure 6.19), for direct-combustion based steam-turbine generator systems; utilising biomass fuel, either agriculture wastes or forestry residues alone or mixture of agricultural wastes and forestry residues. The best fit equations of the trend lines for the specific capital investment and overall electrical efficiency are:
SCI, tearn turbine direct combustion plant ý -628.87 In(P) + 8983.8 (6.8)
77steam turbine direct combustion plant = 3.395 In(P) - 4.8702 (6.9)
Figure 6.20 shows the correlation developed between the electrical efficiency and plant electricity-generating capacity of the direct-combustion based Stirling-engine generator system. Data are not available to generate the trend of capital investment cost. The best fit equation for the electrical efficiency is:
17Stirlingengine -,, ý 18.212(Py' 0815 (6.10)
Specific capital investment costs of the MSW-based direct-combustion plants are relatively higher, due to the addition of pre-treatment cost of MSW (see Table D5, Appendix D). On the other hand, the overall electrical efficiencies of this type of plants are lower than the plants utilising agricultural residues and fuel wood (see Table D5, in Appendix D). Adequate data are not available to develop the capital investment and efficiency correlations for MSW-based direct-combustion electricity-generating plants. As a close approximation, trend line equations developed for agricultural wastes and forestry-based direct-combustion plants would be used for MSW-based plants. The mean value of the overall electrical efficiency of the MSW based electricity generating plant is around 20% (see Table D5, Appendix D).
The mean electrical efficiency of the data used to generate the electricity efficiency trend lines for direct-combustion steam turbine generator and direct-combustion Stirling-engine generator plants are 24.4% and 24%, respectively.
110

CD CD (D Q (Z CD CD CD CD CD CD Q CD CD CD CD to Ul) le CI) c4 %-
0- L- 0
CD Q CD Q -2 =3 E
Ch _0
co z C:
cc .2 CL U) m '3
E 0
CD 0 CD co 4) C) r- CD Cl)
E 0 (D
-C 4 0
CD
C) cn , it 0
L) C: a) E U) CD
04 0
a-
co
CD CD
LL
(mussn) ISOD JUGLUISGAUI lel! de3 olpoeft

+
.
- .
(D
Ul)
Cc c
1
c c
C') c "t C c I
(D CD
04
0 0 0 0
r. %
V) 0 to CD 0 W) V) cle clq C%4 le-
(%), KOUGIDIJIG le3143013
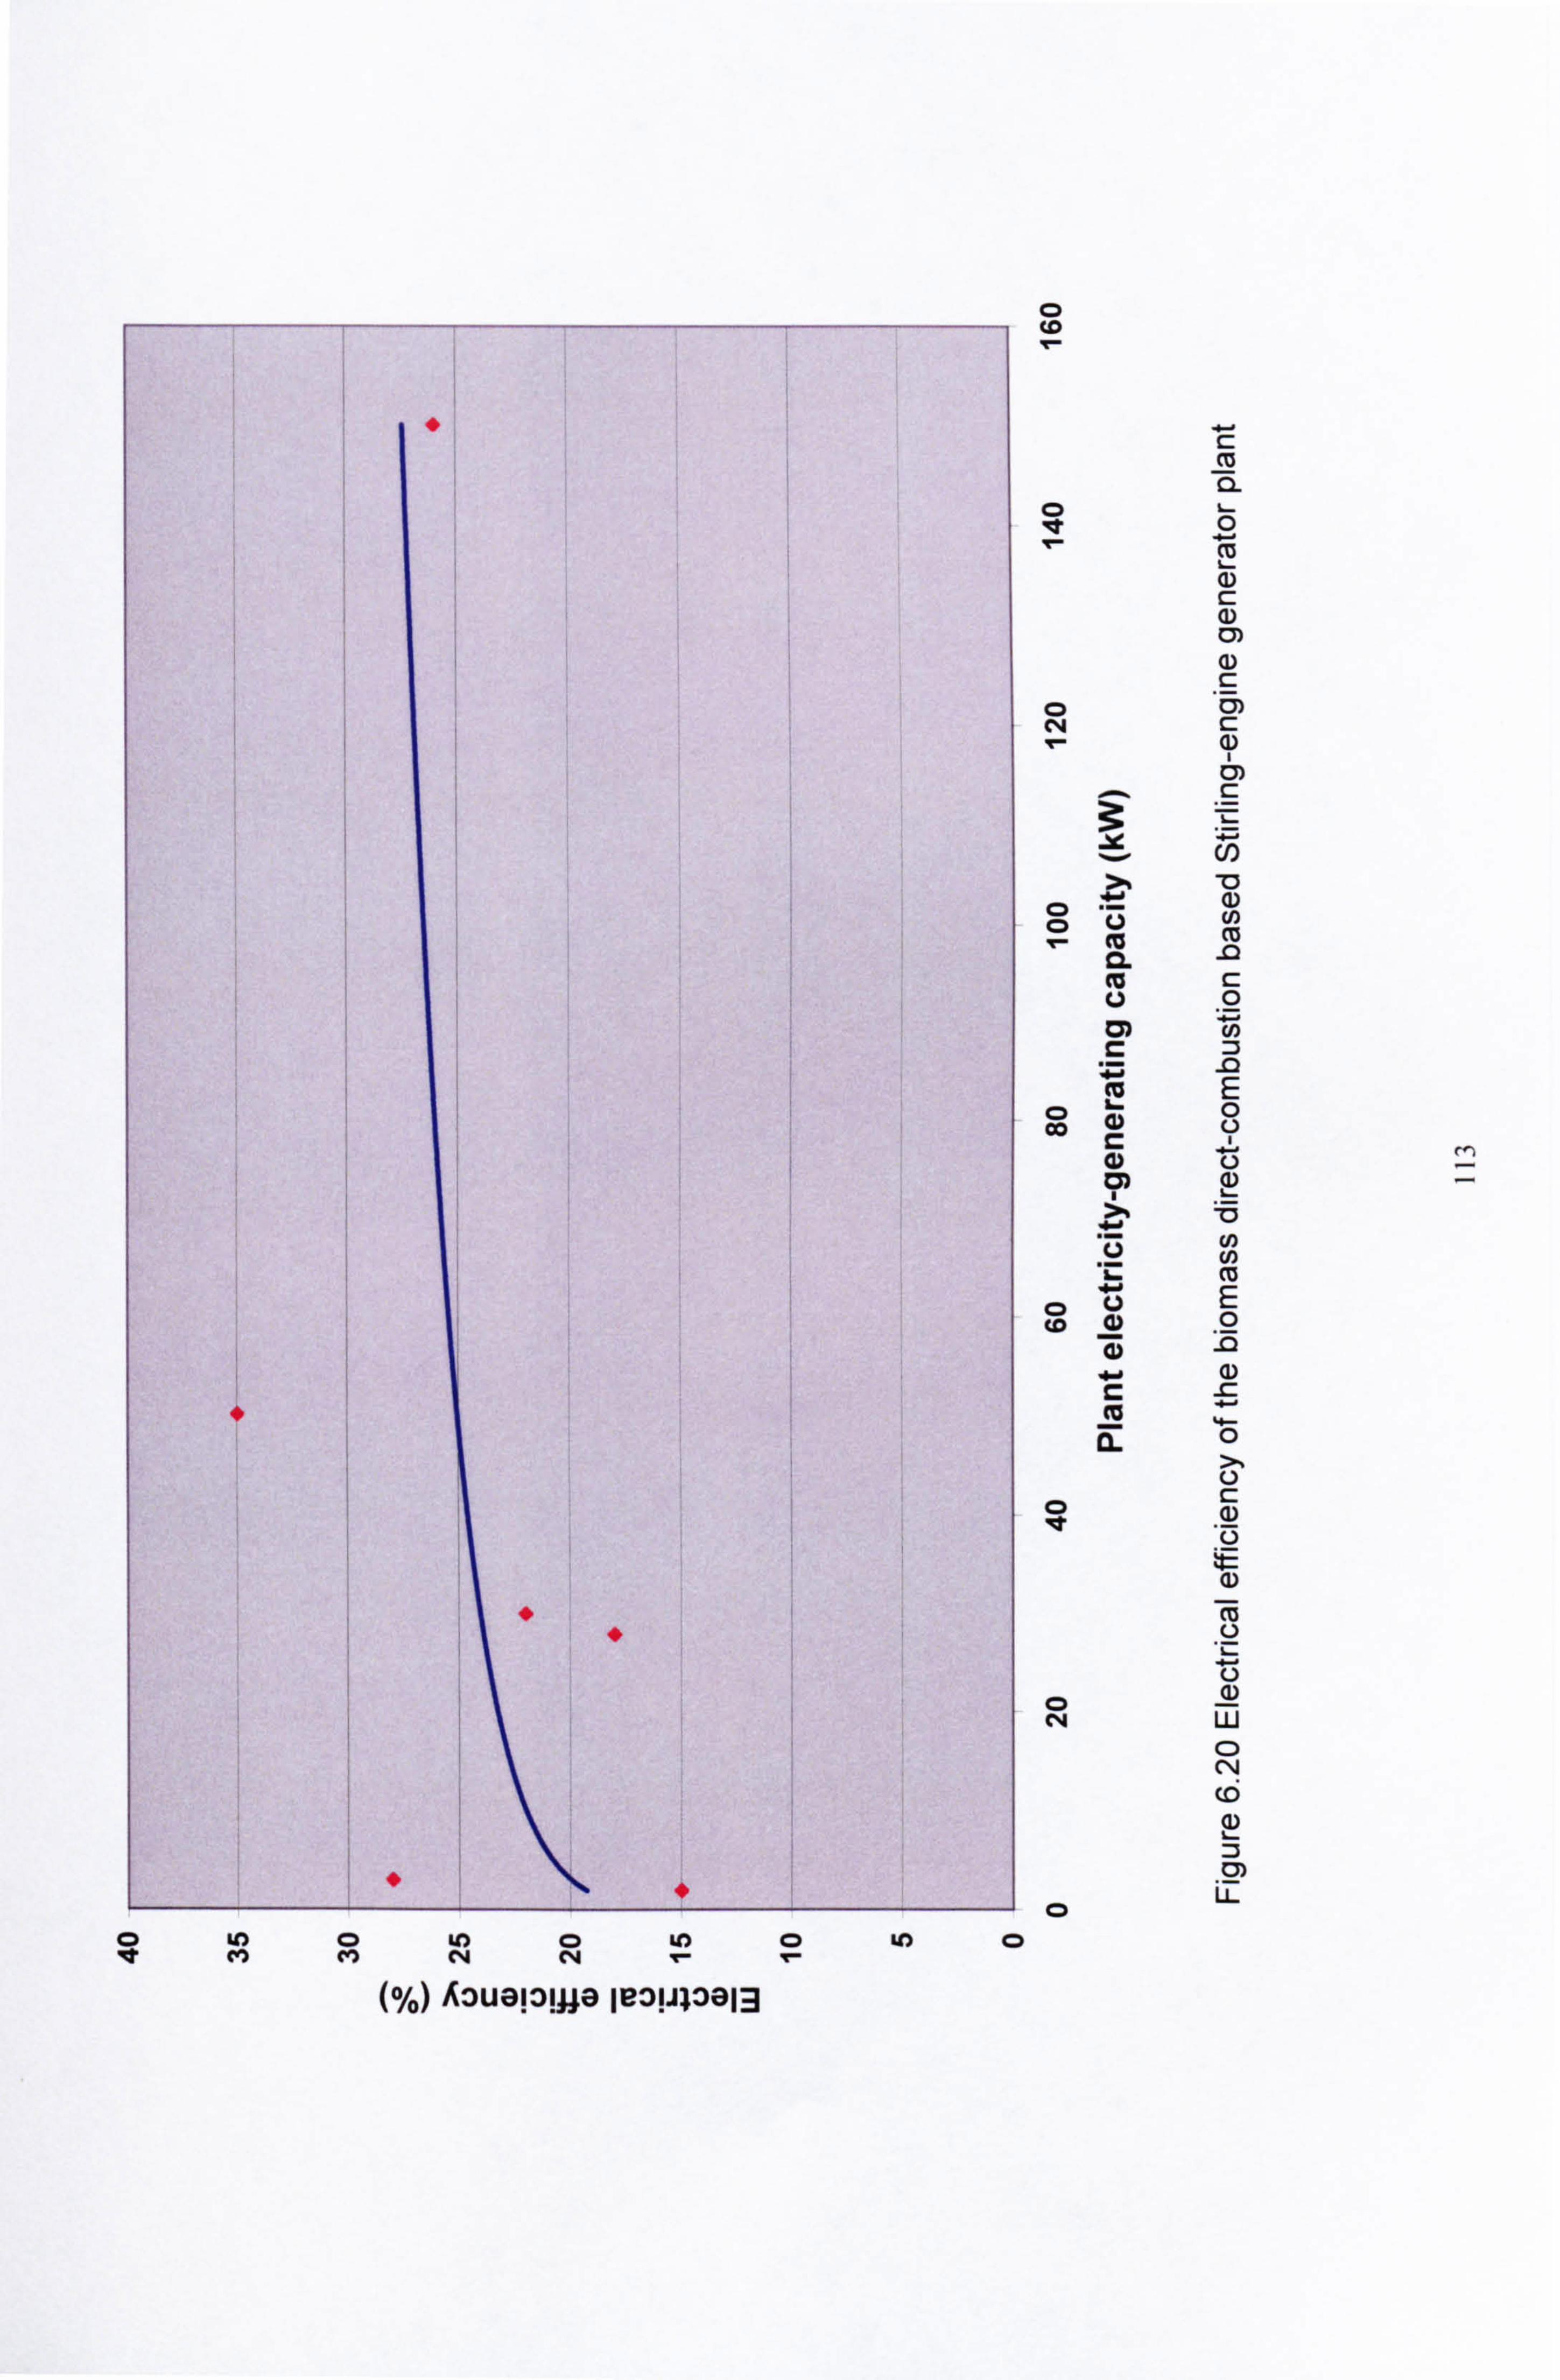
.
. .
CD (0 m-
CD ci
Q L- 0
cc
CM
0) C4 C:
6)
U) >4 70
W cn
a -0
E CD 0 eo C
Q co z -0 W
m FK 0
0
(D
-ffi
.2
04 LU
C)
(Ci a)
iz 0 W) Q to 0 LO 0 LD Q lqT co to N cm ýr- r.
(%) A=epiga IL'3lJl3a[3

6.5 Electricity Generation Potential
6.5.1 Operating Hours
Plant operating hour is an important parameter for assessing the potential and economics. This aim of this research is to asses the feasibility of the biomass electricity plants in rural and remote areas, where there is no grid electricity supply. In rural /remote areas, the electricity is used for:
" Household lighting and cooling, lighting the local market " Small scale commercial : bakeries, hotels/restaurants " Small scale industries: rice mill, sewing/garments factory " Deep tube well: irrigation pumps " Local clinic/hospital, local government offices " Entertainment: sport activities, cinema, television " Day schools, clubs and night school for adults The demand for electricity in household, market, entertainment and night school are in evening periods. On the other hand, for other users, electricity is needed mainly in day time period. So, by arranging proper load management (i. e. matching power supply to demand to maximise the efficiency of the utilised generating resources) the plant could be operated from 10 a. m. till 10 p. m., Le. 12 hrs/day to satisfy the electricity demand of the users.
6.5.2 Total Energy and Electricity Generation Potential
National total energy and electricity generation potential have been estimated (see Table 6.11) for different technology. For gasification and direct-combustion based technology option, energy potential of any specific biomass fuel or mixture of biomass fuel was calculated by multiplying the available amount of biomass fuel in a year with the lower caloric value (or energy content) of that biomass fuel (see Chapter 5). Whereas, in the case of anaerobic-digestion based technology, blogas was considered as fuel, instead of biomass (see Section 6.3.6) for developing the correlations. The amount of biogas generated from the available amount of biomass (in a year) was estimated for both the groups. Energy potential was then calculated by multiplying the total amount of biogas generated with the lower caloric value of biogas (i. e. 20 Mj/M3).
Technology Mean electrical Biomass utilisation Energy Electricity efficiency grouping potential generation potential
N (TWh/year Group A: Ag. wastes and 280.95 13.00
Gasification and forestry residuesa spark-ignition 16.65 Group B: MSW 20.94 0.96 en ine- enerator g g
Group C: Poultry litter 7.53 0.34
Anaerobic digestion Group A: Animal wastes 74.71 6.61
and s ark i iti 31 89 and poultry waste p - gn on . engine-generator Group B: Sewage sludge 46.06 4.08
and MSW
Direct combustion 24 40 Group A: Ag. wastes and '
280.95 19.04
and t t bi . forestry residues s eam ur ne 20-00 Group B: MSW 20.94 1.17_ ' based on average availability per month
Table 6.11 National total biomass energy availability and electricity generation potential: by technology
114

Finally, annual electricity-generation potential was calculated, by multiplying the potential energy with the mean overall electrical efficiency of each technology option. Direct combustion proved the highest electricity generation potential followed by gasification (see Table 6.11).
6.6 Use of Compression Ignition Engines: Cost and Efficiencies
6.6.1 Technology
Diesel engine-driven generators are used widely over the world. Commercial sizes with an electrical output from about 5 kW up to 30 MW are available (ITDG, 2004). Diesel fuel is available in most part of Bangladesh. In remote areas, however, its price is higher than in urban areas due to the addition of transportation costs.
6.6.2 Capital Investment Cost and Overall Efficiency
6.6.2.1 Diesel onlv Operation
The specific capital investment cost and overall electrical efficiency of the diesel engine-generator set depends mainly on the plant capacity and manufacturer/brand (see Tables D6 and D7 of Appendix D). Correlations between the specific capital investment costs and plant electricity-generating capacity; and between the overall electrical efficiency and plant electricity-gene rating capacity were developed for diesel generators of mixed brands. The trend lines (see Figure 6.21 and Figure 6.22) were generated as the best fit of the data presented in Tables D6 and D7 of Appendix D:
ScIdiesel generator plant-,: 607.63(P) -0.2883
77diesel generator plant -,, ý 2.6459[ln(P)] + 20.625 (6.12)
The costs of the diesel engine-generator sets are free on board price. Land procurement, civil works, installation, training and commissioning costs need to be added to know the total specific capital investment cost of this type of plant for economical analysis. The mean electrical efficiency of the data used to develop the efficiency trend is 32.38%.
115

_______ _______ _______ " - ---. _________ _______
- T 7
_ I. -
"/. . ---------
000C: ) 0 CD 0 41) 0 c4 c4
(miiissn); soo; uawzse, %ul lel! duz oiiizedQ
cm T-
C C C
o 0- co >%
CL cc 0 tm r_
r- 4)
C) it
cc CL
CM
"0 0
ýR

Z% cu 0. Co U
*J Co
An le le MmC, 4 c4 Ir» T. -
(0/0) AOU-IIDLU-1 le3143813

6.6.2.2 Dual-fuel Operation
A schematic diagram of a small-scale dual fuelled (diesel and producer gas) compression ignition engine electricity generation system is shown in Figure 6.23. Trend line equations of the electrical efficiency and capital investment cost of the dual- fuelled generator plants operating in dual fuel mode of operation (diesel plus producer gas or biogas) have been developed in section 6.2.5 and 6.3.6 respectively.
Biomas Air Filter
Hot Gases fM
Clean and Cool Gas
Air Dust Filter Electrical Power
Gasifier Cooling and Compression Ignition Cleaning System Engine Generator
Figure 6.23 Electricity generation in dual-fuel mode (Tripathi et al. 1997)
6.7 Conclusions
This original assessment of the technological feasibility of biomass electricity generation in Bangladesh revealed that feasible technologies are: 4. Gasification-based ICE-generator 4. Anaerobic digestion-based ICE-generator -, L Direct combustion-based steam turbine or Stirling-engine generator
A critical review of these feasible technologies for small- to medium-scale biomass electricity generation has been undertaken. Biomass groupings and utilisation strategies have been developed for each type of the feasible technologies based on biomass availability and properties in order to achieve the maximum electricity generation potential (see Figure 6.24).
Correlations of the capital investment costs and overall conversion efficiency, as functions of the electricity generation capacity, for the feasible technologies selected for small to medium-scale biomass electricity generation have been developed. These can be employed to assess the biomass electricity plant economics in Bangladesh and any other developing country.
118

Group A. Animal waste + Poultry wa
I
Anaeroblc digestion plus spark/ compression Igniflon engine
I
Group 8: MSW + Sewage I sludge
I
Group A: Agricuttural waste Forestry residues
Direct Combustion plus steam I turbine/Stiding enj
I
I Group B: MSW I
Group A: Agricultural waste Forestry residues
n plus spark/compression Group B: MSW ignition engine
I Group C: Pou" waste I
Figure 6.24 Feasible technologies and corresponding biomass resources
Electricity generation potential has been estimated for each individual district (see as an example Appendix E for the districts of the khulna division) as well as the whole of the country (see Appendix F) for each type of the feasible technologies using the mean overall electrical efficiency. For the entire of Bangladesh, the highest annual amount of electricity (i. e. 20.21 TWh) can be generated using the direct combustion technology, followed by gasification (i. e. 14.30 TWh). Anaerobic digestion has the potential to generate 10.69 TWh.
Diesel generators are commonly employed for decentralised electricity generation. For such systems, the capital investment costs and overall conversion efficiency as a function of the electricity generation capacity have also been developed in order to compare the biomass electricity plant economics with the diesel generator plant economics.
119

CHAPTER 7 SIZING OF BIOMASS ELECTRICITY PLANTS
7.1 Introduction
Biomass energy availability, costs and efficiencies of the technically feasible conversion technologies, and maximum electricity generation potential have been estimated in previous chapters. Electricity generation potential was estimated for national total and as well on district wise basis. The next step is to decide the size of biomass electricity plants. Optimisation techniques have been used to estimate economic plant sizes, economic radius of biomass collection and maximum number of plants (in a district) for different types of feasible technology options.
7.2 Overall Efficiency and Capacity of the Biomass Electricity Plants
The overall conversion efficiency i7o of the electricity generation plant can be written as:
E l7o - --2 77.,? 7, Qb
(7.1)
Assuming the area of biomass collection to be a circle of radius r (km), with the centre represented by the power plant location, then according to equation (7.1), the average output capacity P of the biomass-energy plant can be written as:
P= E= t7oQb = 170 anr 2 Hb
(7.2) ttt
The overall conversion efficiencies of the different types of technical ly-feasible conversion technologies are estimated in the following sections.
7.2.1 Combined Gasifier/ICE - Generator
There are different options under this technology. These are: 4. Gasifier and producer gas-fuelled IC engine , 4. Gasifier and dual-fuelled IC engine . iL Combined gasifier/Gas turbine-generator
7.2.1.1 Gasifier and Producer Gas -fuelled ICE
The overall efficiency of this type of conversion system can be written as:
17. --: 'IG 17GE77e (7.3)
120

The thermal efficiency of the gasifier is defined as:
Q, g mgHg
17G = Qb = MbHb
(7.4)
The gas engine thermal efficiency can be defined as:
17GE -`ý
WUGE
(7.5) m, gH, g
7.2.1.2 Gasifier and Dual-fuelled ICE
The thermal efficiency of the engine in dual-fuel operation (i. e. producer gas + diesel fuel) mode (r7df when fuelled by diesel fuel
.. ) is generally less than the efficiency 17d
only (Kapur et al. 1996). The overall efficiency of this type of conversion system can be written as:
17o --'ý 77GI7,17, --" 770*17, (7.6)
The thermal efficiency of the dual-fuelled engine can be written as:
'7dfe -"ý 17d df
where, df is a de-rating factor in efficiency due to the employment of the dual-fuel mode of operation
Total energy input to a dual-fuelled engine-generator system to generate 1 kWh of electricity can be expressed as:
(7.7) '7dfe l7e l7d l7edf
The performance of a dual-fuelled engine is characterised by a diesel substitution or diesel savings, which is known as diesel replacement factor (rf ). It indicates the proportion of diesel input that is replaced by the second fuel. So the energy input of diesel to the dual-fuelled engine to generate 1 kWh of electricity can be expressed as:
Qd = (I
- rf) (7.8) 170.
If the energy input of the producer gas is Qg , then:
Qg =i
[I - (I - rf (7.9)
? 7d? 7e df
121

The quantities of diesel (Md) and biomass (Mb) togenerate 1 kWh of electricity can be written as:
M Qd
- (I-rf)
Hd '7d'7eHd (7.10)
Mb =
Qg
=II- (i - rf)] 17GHb '7d'7,17GHb
[Tf
7.2.1.3 Combined Gasifier/Gas turbine
The overall efficiency of this type of conversion system can be defined as:
l7o 17Gl7GT'7e
The gas turbine cycle thermal efficiency can be defined as
17GT --"ý
WUGT
(7.13) m, gH, g
7.2.2 Combined Anaerobic DigesterlICE - Generator
Under this type of technology, there are two options: ýL Biogas digester and biogas-fuelled IC engine , ýL Biogas digester and dual-fuelled IC engine
7.2.2.1 Bioqas Digester and Bioqas-fuelled ICE
The overall efficiency of the system can be written as:
l7o ý- 17AGE77c (7.14)
The thermal efficiency of the digester is defined as:
17D = Qbg
=. MbgHbg
(7.15) Qb m. H.
The gas engine thermal efficiency can be defined as
qGE =
WUGE
(7.16) MbgHbg
122

7.2.2.2 Bioqas Diqester and Dual-fuelled ICE
Equations, similar to those presented in section 7.2.1.2 for the producer gas and dual- fuelled IC engine, are applicable for this type of conversion technology. In this case, the gasifier would be replaced by the digester.
7.2.3 Direct Burning/Heat Engine- Generator
Either a Stirling engine or steam turbine is used as prime mover.
7.2.3.1 Direct Combustion and Steam Turbine
The overall efficiency of this type of conversion system is:
l7o ý 17STqe (7.17)
The steam turbine cycle thermal efficiency can be defined as:
17ST 2-- WUST
(7.18) mbHb
7.2.3.2 Direct Combustion and Stirlinq Enqine
The overall efficiency of this type of conversion system can be written as:
17. = l7sE 17,, (7.19)
The Stirling engine thermal efficiency can be defined as:
17SE -'ý WUSE
(7.20) MbHb
7.3 Mathematical Modelling and Optimisation
7.3.1 Mathematical Modelling
Mathematical modeling is a description, in terms of mathematical relations, invariably involving some idealization, of the functions of a physical system (Bejan et al. 1996). System understanding, designing, optimisation, controlling and training are the main objectives of the mathematical modeling of a system (Cross and Moscardini, 1985).
The stages of mathematical modeling are (Cross and Moscardini, 1985):
Problem Identification.
123

voL The Gestation Stage. It includes the gathering of the background information, acquiring an understanding of the system under consideration, and sorting out relevant data. In this stage, it is very important to recognise that a solution is possible.
-a. The Model Building (formulation) Stage. Having exposed the important mechanisms and contributory factors, each is considered in turn and described mathematically to some extent. The modeller must ensure that the model matches the available data and within the physical constraints of the system.
I; L The Simulation Stage. After building the model, it is used to run an experiment to asses what would happen in a hitherto inexperienced situation. A set of simulation runs should be fairly carefully designed to observe the effects of parameter changes and, hence, identify which are the most critical with respect to both design and control.
4. The Pay-off Stage. In this stage, one can learn most about the modelling process itself. Having built the mathematical model, made recommendations and then observed either the construction or modification of the system, it is useful for the modeller to make an appraisal of just how well the model performed. In this stage, the modeller makes a balance recommendation regarding operation, design and/or control of the system. This allows one to see and appreciate any conceptual or even computational errors that lingered in the model.
7.3.2 Optimisation
Bejan et al. (1996) described the term optimisation as - the modification of the structure and the design parameters of a system to minimise the total levelised cost of the system products under boundary conditions associated with available materials, financial resources, protection of the environment, and government regulation, together with the safety, operability, reliability, availability, and maintainability of the system.
Optimisation criteria may be economic, technological and environmental. It is desirable to develop a design that is best with respect to more than one criterion. But it is impossible to find a solution that, for example, simultaneously minimises costs and environmental impact while maximising the efficiency and reliability (Bejan et al. 1996).
Selection of the independent variables is very important in formulating an optimisation problem. Types of variables are: the decision variables and the parameters. In optimisation studies, only the decision variables may be varied; the parameters are independent variables that are given one specific and unchanging value in any particular model statement (Bejan et al. 1996).
7.3.2.1 Techniques of Optimisation
The mathematical modeling for an optimisation problem consists of an objective function to be maximised or minimized (Bejan et al. 1996). For a complex optimisation study, it is desirable to break down the study into smaller sub systems and then to optimise the smaller sub systems individually (Bejan et al. 1996). The optimisation method can be categorized according to the nature of the objective function, the constraints, and the decision variables involved. The objective function may:
124

-4. contain a single decision variable or many decision variables -& be continuous or contain discontinuities 4. be linear or non linear
The most commonly used optimisation techniques are described below (Jelen, 1983; Boas, 1983 and Bejan et al. 1996):
viL Optimisation for a sinqle variable
The available techniques for this type of optimization system are:
" Analytical or Indirect. Analytical methods deal with the application of calculus. The first derivative vanishes at the optimal value. The sign of the second derivative determines the local maximum or local minimum. If a function is bounded in an interval (constrained function), the boundary points also can qualify as local optima.
" Graphical or Tabular. It is the most elementary method of finding a maximum or minimum point of an objective function. The graphical method has the advantage of distinguishing between mathematical maxima and minima, inflection points, and the highest and lowest values. By using this method, the user can recognise how responsive the optimum value is, to a variation in the independent variable.
" Incremental or Direct. The incremental method is instinctive and basic. It amounts to operating at one value of the independent variable, changing the variable somewhat, and determining the calculation or observation, whether the change is advantageous. This method is suitable for trial by experiment. Computers have enabled the application of incremental or direct methods. This method can easily treat problems involving objective functions with discontinuities, points of inflection, and boundary points.
4. Linear and nonlinear proc iraminq techniques
In linear programming technique, both the objective function and the constraints are linear. Nonlinear objective function and/or constraints are the most common type encountered in thermal optimization problems. In a problem, in which there are n independent variables and m equality constraints, attempt might be taken initially to solve each of these constraints explicitly for a set of n-m variables, and then express the objective function in terms of these variables. If all the equality constraints can be removed, and there are no inequality constraints, the objective function might then be differentiated with respect to each of the remaining n-m variables and the derivatives set equal to zero.
There are five major approaches for solving nonlinear programming problems, these are: Lagrange multiplier method, iterative quadratic programming methods, iterative linearization methods, penalty function methods, and direct search methods (Reklaitis et al. 1983; Edgar and Himmelblau, 1988; Papalambros and Wild, 1988; Pike, 1986; Beveridge and Schlechter, 1970).
4. DVnamic and Geometric proqramminq Dynamic programming is used in the same context as in linear programming. This method decomposes a multivariate interconnected optimisation problem into a sequence of sub problems that can be solved serially. Each of the sub problems
125

may contain one or a few decision variables. Geometric programming optimisation technique can handle a certain form of functions with fractional and negative exponents in an efficient manner (Reklaitis et al. 1983; Edgar and Himmelblau, 1988; Pike, 1986; Beveridge and Schlechter, 1970).
7.3.2.2 Steps of Optimisation
The general steps for formulating an optimisation problem are (Jelen, 1983): 4. deciding the exact objective to be optimized -; L setting the objective function using as many variables as are required -& setting up all the restraints and relationships between the variables , A. reduction of the objective function to independent variables (if possible)
solution of the objective function. If it contains single dependent variable only, the differentials can be set equal to zero to optimise the expression. Alternatively, if it contains more than one dependent variable in addition to independent variables, a Lagrange expression technique can be tried.
7.4 Optimisation Method Applied to Biomass Electricity Plants
In general, the objectives of any investments are (Schuyler, 1997): A. Build at lowest possible cost 4. Build at optimum life-cycle cost . iL Build for maximum return on investment
Benefit-cost analysis is a decision making process and this type of analysis is most applicable to public works project. To minimise the costs and maximise the profitability, is the main objective to optimise the design parameters in benefit-cost analysis. The term profitability can be defined as a measure of the total income for a project compared to the total outlay (Jelen and Black, 1983). Profitability measurement can be performed for a short period of time, or for the entire life of a project. The related terms used to measure the profitability are (Redden and Lavingia, 1997; Irvin, 1978):
4. Cash Flow (CF): Is the difference of income (inflow) and expenditure (outflow), and counted only at the time they actually occur.
4. Discounted Cash Flow (DCF): Method of evaluating an investment by estimating future cash flows. In this method, the time value of money is considered.
4. Net Present Value (NPV): NPV is the sum of the present values of all positive and negative cash flows, i. e., it is the present worth of the total profit of an investment. If NPV is positive, the investment is economically viable; if it is negative, the investment is not economically viable. It is considered desirable when NPV adequately remunerates the investment made.
14- Return on Investment (ROI): ROI or Internal Rate of Return (IRR) is a measure of profitability of any plant. IRR is defined as the interest rate that equates the present value of the future receipts of a project to the initial cost. Alternatively, it is the discount rate, at which NPV = 0. It is also known as Discounted Cash Flow Rate of Return.
126

Simple Payback Period: Another technique used to measure the profitability is the Payback Period (PBP), which is the time needed to get back the investment. It can be estimated as:
PBP =
7.4.1 Application
Total investment Annual Income (sales - operating cost)
A mathematical relationship with the radius of biomass collection as a design variable and the profitability as the objective function has been developed, which is applicable for all types of the feasible biomass electricity conversion technologies. Analytical method of optimisation for single variable has been used to maximise the profitability.
The Profitability Index (PI) defines the profit or loss of the investment operation per unit of total investment. PI is also known as Discounted Return on Investment. For assessing the investment proposals, IRR was a favourite ranking index in the 1960s. The PI is now recognised as more theoretically correct (Schuyler, 1997). PI is defined as:
P, = Present value of the cash flows
= NPV
(7.21) Original amount invested I
NPV can be calculated by discounting CF over the useful life of the plant by a present worth factor. Annual cash flow, NPV and present worth factor can be calculated as:
Annual Cash Flow = CF = CI - CO (7.22)
NPV CF f, -1 (7.23) n
(7.24)
(i) Cash Inflow from Sale of Biomass electricity
The selling income of the electricity generated can be written as:
CI = ES�, = Qb'IOS� =a72r 2 Hbl70sue (7.25)
(ii) Cost of Purchasing the Biomass
Cb = C; Zr2 Cbs (7.26)
127

(iii) Cost of Transporting the Biomass
If dr is a width of a little strip at a circular distance of r, then the amount of biomass available in that strip is:
dw = a2nrdr
The cost of transportation for transporting dwtonnes of biomass to the centre of the circle is:
dC, = 2C,,, ra; zrdr
If the transportation distance is not radial, then a constant b (>1) is applicable to use as the ratio of actual road length to the direct radial distance, so the above equation can be written as:
dC, = 2C,, a; zbr'dr (7.27)
By integrating equation (7.27), the equation for total transportation cost is:
r23 Ct = f2a; zbC,, r'dr =3a; zbC,, r (7.28)
0
(iv) Cost of Operation
C,,,, N. (7.29)
(v) Cost of Repair and Maintenance
C, = lk, (7.30)
(vi) Cost of Storage
C, = CA (7.31)
(vii) Others fixed cost (Overhead Cost)
This includes infrastructures repair and maintenance, staff traininglentertainment of visitors, and management expenses. This can be expressed as:
Cf = Ikf (7.32)
So, substituting all the cash flow terms, the equation (7.22) can be written as:
CF = (ES. J -(Cb + Ct + Cw + Cr + C3 + Cf) (7.33)
128

Consequently, using equation (7.21), (7.23) and (7.33), PI can be written as:
Pi _ JES.,
-(Cb +Ct +Cw+Cr +Cs +Cf)lfa -1 (7.34)
I
Substituting all the cash inflows and cash out flows in equation (7.34):
PI = [anr'Hbl7oS..
- (Cnr2C.,
+2 ; zr'bcC,, +C.,, N. +Ik, +C,, W, +Ikf f-
3 )l
1 (7.35)
Using the equation 7.2, total investment cost can be written as:
I= IP = anr
2 Hbl7OIs (7.36) t
Substituting I in equation (7.35) and rearranging, PI can be written as:
f,, tS. e Pi =
f. tCb, 2bftC,, r Lt C"" NY 2 - f. k, - f. kf -Lt
C" Wl 2 1, Hb? 70I, 3Hb'70,, C)Zr Hb, 70j, Hbl7ojs Mzr
f. t C,,, N. f. t C,, W, )2+
-- r- 2bf. tc ' r+
(f ts f. tCbs 'e -1-f. k,. -f. kf
; raHb? 701, 'raHb'70, s 3Hbr7oI, I. Hli7oIs
f at 2 (C. N. +C,, W, r- +(
2bf , tC"
r +(ftSe ftCbs
_ 1-f. kr -f. kf aa Hb? 7oI, 3H
bl7oIs Is Hb? 70I.,
(7.37)
The above equation can be written as:
where,
PI=Ar -2 +Br+C (7.38)
f t (C,,, N. + C,, W, ; rcHbi7oIs
2bf. tC,, 3Hbi7oI,
)
ts C
ýaue
_
fatcbs
-I- fak,
- fakf
I, Hbi7j, Assuming the termA, B and C are constant for specific type of biomass electricity
conversion technology plant and for specific type of biomass resources at a given
location, equation (7.38) can be written as PI = f(r). Equation (7.38) shows that the
129

second derivative of PI with respect to r is negative. So, the value of r (r, ) at which PI is maximum can be found by differentiating PI and putting the result equal to zero:
d(PI) =0 dr
which results in
ýA r='F=r, N BD
or
FýA- _ý3
(C,,, N. + C,, W, ) r =3 -3 (7.39) eNB ; zb crcý
If the proposed plant does not need any biomass storage, then C. = 0, so the equation (7.39) can be written as:
ý3 3C,,, N.
; Zbccý (7.40)
If the distance of the biomass transportation is radial (i. e. b =1), the equation (7.39) and (7.40) can be written as:
r3 (C,,,,, N,, + C. W,
e ; rcc, (7.41)
3 3C,,, N. ý
Tcct (7.42)
Corresponding biomass collection area can be calculated as: ; Zr2
e (7.43)
The electricity-generating capacity of the plant can be written as:
p= 77ocizr, 2Hb (7.44) et
7.5 Biomass Electricity Plant Sizing
Feasible conversion technologies and corresponding biomass resources have been discussed in Chapter 6. Due to the seasonal availability of the agricultural residues (see Chapter 5), storage facilities are needed for agricultural wastes and forestry residues-based plants. On the other hand animal wastes, poultry wastes and MSW
130

does not require any storage facilities. Since the size of the plant would determine the amount of storage, so it is difficult to estimate the cost of storage at this stage. As a first approximation, it has been assumed that the effect of storage cost on plant sizing is negligible.
Economic plant sizes and other parameters have been calculated for each type of the feasible conversion technologies using equations (7.42) to (7.44). The mean efficiencies (see Chapter 6) have been used to calculate the economic plant sizes. Later, the economic sizes were corrected by using the Correlations developed for the efficiencies (see Chapter 6) and are defined as corrected plant sizes.
For anaerobic digestion-based biomass electricity plant, the efficiency data used in Chapter 6 and in Appendix D was the electrical efficiency of the biogas operated ICE- generator plant. So, for calculating the overall efficiency of the anaerobic digester- based ICE-generator plant, the thermal efficiency data of the digester is needed, which can be estimated as:
17D -ý Biogas generation rate * Calorific value of the biogas
(7.45) Energy content of the biomass mixture
The lower calorific value of 20 Mj/M3 (see Chapter 6) has been used for biogas, generated from both the groups of biomass resources. Using equation (7.45), typical result shows that thermal efficiency of digestion of group A and group B types of biomass are 43% and 39%, respectively. The thermal efficiency of the anaerobic digester reported in the literature is in the range of 30 - 50% (Paul, 2004; Lusk, 2005; Vijayaraghavan et al. 2003), which logically verifies the estimation used in this study.
Biomass availability densities (a) were calculated in Chapter 5. Lower caloric value (Hb) or energy content of the biomass resources are reported in Section 7.5.1. Hours of plant operation have been discussed in Chapter 6. Values of other parameters (i. e. C,,, C,,,, N. ) have been estimated based on the general experiences in Bangladesh.
It was observed that after deducting the present consumption of the biomass resources, some of the district does not have enough agricultural and forestry resources to use it for electricity generation purposes. In this study, the figure zero was used for the district which does not have enough agricultural wastes and forestry residues for electricity generation potential.
7.5.1 Energy Content of Mixed Biomass Resources
For co-gasification and co-combustion, energy content of the mixed biomass resources can be calculated based on the availability ratio. If W, is the quantity of ih mixed biomass component and Hi is its corresponding lower calorific value, then the average Lower calorific value of a biomass mixture fuel H., containing a number z of components can be calculated as:
z2 H,,
v=EHjWj1ZWj (7.46) i=l i=l
131

and the expected energy content of the mixed biomass fuel is
r E=H., j: W, (7.47)
i=l
7.5.2 Default Parameters
The plant would be operated from 10 a. m. till 10 p. m. at night (see Chapter 6), i. e. 12 hrs/day (or 4380 hrs/year); this same number of operating hours has been used for all types of feasible technology. The type of transportation system of biomass fuel and costs depends on the infrastructures and the living standard of the people. This varies from country to country; and even from one region to another region in the same country. The transportation costs also depend on whether the study site situated in rural or urban area. In most developing countries the transportation of biomass is carried out by the following ways:
" Manually (human transportation) " Transportation by bullock cart " Transportation by human driven three wheeler (Human Hauler) " Transportation by truck (and tractor)
Adequate information on transportation costs is not available. Hence estimates had to be made. The transportation cost of the agricultural wastes has been reported as US$ 0.70/tonne per krn (Lin et al. 1998). In Bangladesh, due to the availability of cheap labour resources, the cost of the transportation is not high. Actual transportation distance is not radial. Considering this, a typical transportation cost of US$ 1/tonne/km has been estimated based on the experiences in Bangladesh (see Table 7.1).
The same cost data has been used for all types of biomass transportation. Stassen (1995) estimated the number of operators as 2 for 10-100 kW. capacity gasification- based biomass electricity plants. Tripathi et al. (1997) estimated the number of operators as 2 and 3 for 40-200 kW,, and 300-500 kW, capacity gasification-based biomass electricity plants, respectively. The activities of the operators in the gasification based plants and direct combustion based plants are almost similar. Whereas, the activities of the operators are more in the case of anaerobic digestion based plants because of the additional activities of the operation and controlling the different parameters of the biogas plant. So, it is reasonable to estimate the number of operators as 3 and 5 for gasification (or direct combustion) and anaerobic digestion based plants, respectively. The wages rates of the operators have been estimated based on the experiences in Bangladesh (see Table 7.1).
7.5.3 Results
Sample results of economic plant parameters are shown in Table 7.2 to Table 7.4 for gasification-based electricity-gene ration plant. Khagrachari, Dhaka and Feni districts have been selected for group A, group B and group C types of biomass respectively. These districts have been selected considering the biomass availability density potential, remote areas and demand for electricity (see Chapter 2 and Chapter 5). Results of other districts are available from the programme written in Matlab (see Appendix B and Appendix E).
132

Parameters Unit Conversion Technologya Gasification/ Direct Combustion/ Anaerobic Digestion
Generating hours (hrs/day) 12 (hrs/yr) 4380
Cost of trans ortation (US$/tonne/km) 1 No. of operators/employees 3(5) Cost of operator/labour (US$/capita/yr) 1000
a: data in bracketed figure is for anaerobic digestion based plant
Table 7.1 Default parameter values: technical and financial
The details of the biomass resources for respective districts and the results obtained are presented below.
(i) Group A:
The division, districts, types of biomass and technology are:
Name of the division : Chittagong Name of the district : Khagrachari Types of biomass : Agricultural wastes and forestry residues Type of technology : Spark-ignition engine-generator
Parameters Unit Value Biomass availability density (average) (tonne/km2/month) 37.98 Mean overall electrical efficiency M) 16.65 Total electrical energy potential in the district (TWh/yr) 0.89 Economic radius (km) 1.85 Economic capacity of the plant (M) 814.08 Area of biomass collection (km") 10.70 Number of the plants 252.00 Corrected overall electrical efficiency based on economic capacity using the trend line equation
17.21
Corrected capacity of the plant (M)
Table 7.2 Economic and corrected values of gasification based electricity generation using agricultural wastes and forestry residues
(ii) Group B:
The division, districts, types of biomass and technology are:
Name of the division Dhaka Name of the district Dhaka Types of biomass MSW Type of technology Spark-ignition engine-generator
133

Parameters Unit Value Biomass availability density (tonne /km2, /yr) 86.47 Mean overall electrical efficiency M 16.65 Total electrical energy potential in the district (TWh) 0.11 Economic radius (km) 3.21 Economic capacity of the plant (kW) 549.17 Area of biomass collection (km") 32.41 Number of the plants 45.00 Corrected overall electrical efficiency based on economic capacity using the trend line equation
(%) 17.07
Corrected capacity of the plant I (M) 563.18
Table 7.3 Economic and corrected values of gasification based electricity generation using MSW
(iii) Group C:
The division, districts, types of biomass and technology are:
Name of the division Chittagong Name of the district Feni Types of biomass Poultry waste Type of technology Spark-ignition engine-generator
Parameters Unit Value Biomass availability density (tonne /km /yr) 8.72 Mean overall electrical efficiency (%) 16.65 Total electrical energy potential in the district (TWh/yr) 0.005 Economic radius (km) 6.90 Economic capacity of the plant (kW) 185.86 Area of biomass collection (km) 149.58 Number of the plants 6.00 Corrected overall electrical efficiency based on economic capacity using the trend line equation
16.72
Corrected capacity of the plant I (M) 186.58
Table 7.4 Economic and corrected values of gasification based electricity generation using poultry waste
The sample results of the economic plant sizes are in the ranges of 200-800 kW (see Table 7.2 to Table 7.4), which matches well within the current practises of the biomass electricity plants in many developing countries (see Appendix D). Results show that the economic size of plant depends greatly on the biomass availability density. If the biomass availability density is higher, the plant size is also high. There are little variations between the corrected and economic plant sizes, which prove the effectiveness of the developed correlations. The corrected plant size would be used as a reference plant sizes for diesel and dual-fuelled generator plants
134

7.6 Conclusions
A generalised equation of economic radius of biomass collection has been developed for the maximisation of the profitability index. The equation is applicable for all types of the feasible biomass electricity generation technologies in Bangladesh. Economic plant sizes have been calculated using the biomass energy available within the economic radius and the estimated average overall electrical efficiency for each type of feasible technology. Appendix E presents the economic radius of biomass collection and economic plant size for each type of feasible technology option, in the districts of the Khulna division. The economic plant sizes calculated are within the range of plant capacities currently in operation. Economic plant sizes were corrected using the correlations developed in chapter 6. These however are very close to the economic plant sizes.
135

CHAPTER 8 ECONOMICS OF BIOMASS ELECTRICITY PLANTS AND SENSITIVITY ANALYSIS
8.1 Introduction and Methodology
In this chapter, economics of the biomass based electricity generation for different types of feasible technologies have been assessed. The economical parameters considered are: cost of electricity generation (CoE), simple PBP, NPV and PI.
Figure 8.1 shows the methodology used for economical analysis. Major inputs of economical analysis are: economic plant size, biomass availability density, electrical efficiency, capital investment cost and operating cost.
Inputs: district-wise biomass availability economic plant capacity, economic ra
biomass collection area and equations for electrical efficiency and capital Investment costs.
No Biomass
availability Reject density >0
+Yes
Corrected efficiency., corrected pla capacity and total capital Investment cos Sý
Default financial and technical values:
hours of operation, era -n number of employees -------
ýOmpintelnoakce, fuel
I and others fixed costs
'r Total cost of Electricity Generation (US$/yr)
I
I Total amount of electricity generated
(kWh/yr)
Cost of electricity generation (US$ / kWh)
No F Input: sale price/ I profit margin
F
Calculation of PBP, NPV and PI
Figure 8.1 Methodology showing district wise calculations of plant economics
136

Trend equations of conversion efficiency and capital investment costs developed in Chapter 6 have been used in this chapter. For a specific technology option, the corrected efficiency was calculated by using the economic plant size. This corrected efficiency was used to calculate the corrected plant size. This corrected plant size was used for economical analysis. Annual amount of electricity generated was estimated by multiplying the corrected plant capacity with the annual operating hours of the plant. CoE (in US$/kWh) was calculated by dividing the total cost of electricity generation with the annual amount of the electrical energy generated. An estimated selling price of electricity has been proposed by reviewing the literature. Later, PBP, NPV and PI of the different technology options have been calculated to assess the plant economics.
Diesel generators are popular for small-scale off-grid electricity generation. In the case of gasification or anaerobic digestion-based biomass electricity generation, two possible options of technology were considered, these are:
" Purely biogas/producer gas based spark ignition engine-generator " Dual fuelled (blogas/producer gas and diesel) based compression ignition engine-
generator
The economics of diesel and dual fuelled electricity generation have also been calculated and the results compared with the economics of pure biogas or pure producer gas based electricity generation (see Figure 8.2). On the other hand, economics of the direct combustion based biomass electricity generation technologies system have been compared with the economics of diesel generation system.
Through this economical analysis, it is possible to select the most economical electricity generation option in a specific district for specific biomass. Programmes have been written in Matlab to calculate and compare the economics of different technology options in all 64 districts of the country. A sensitivity analysis has been performed at the end of this chapter.
Plant economics for biogas or I producer gas alone
I
Anaerobic Digestion/ Plant economics for diesel generator Gasification
Plant economics for dual fuelled I operation
I
Plant economics for small scale steam turbine
Direct Combustion
Plant economics for diesel generator
Figure 8.2 Comparison of plant economics
137

8.2 Biomass Resources and Technology
Feasible biomass electricity conversion technologies and corresponding biomass resources have been discussed in Chapter 6. Economic analysis has been performed for all types of feasible technologies and for all biomass groupings (see Figure 8.3). So, for any specific district, same biomass resources have been used for more than one type of biomass electricity conversion technologies to assess plant economics.
8.3 Elements of Costs
The different elements of costs are discussed in Chapter 7. The total cost of electricity generation (TCoE) and the cost of electricity generation (CoE) can be calculated as:
TCoE= AC+OC+MC+FC+OFC (US$/yr) (8.1)
CoE = AC+OC+MC+FC+OFC (US$/kWh) (8.2)
E
Group A: Animal waste +
Anaerobic digestion plus Poultry waste
ýEconomýics
spark/compression ignition engine Group B: MSW+ Sewage
sludge ýEconomýics
Group A: Agricultural waste + Forestry residues
F--*[ ýcon om ýics
Direct Combustion plus steam turbine/Stirling engine
Group B: MSW F--+] Economics
Group A: Agricultural waste + Forestry residues
k-001 ýconomýics
Gasification plus spark/ compression ignition Group B: MSW Z7ýo-mics engine
t
Group C: Poultry waste EconomiccSs
Figure 8.3 Technologies and biomass resources for economical analysis
138

Simple PBP is the basic tool to compare the different investment projects. The better investment is the one with the shorter PBP. There are two main problems with the PBP measuring technique, these are:
A. It ignores any benefits that occur after the payback period and
oiL It ignores the time value of money.
NPV accounts for the time value of money by expressing future cash flows in terms of their value today. When choosing among mutually exclusive projects, the project with the largest (positive) NPV should be selected. The profitability index (M) is determined by dividing the NPV of each proposal by its initial investment. PI is known as benefit-cost ratio. The higher the PI number, the more financially attractive is the proposal. Simple PBP, NPV and PI have been calculated using the equations presented in Chapter 7. Present worth factor (f. ) was used to calculate the NPV and PI. The factor can be calculated as:
f. = [(l+i)" -1]
i(i + i)"
8.3.1 Cost of Capital
(8.3)
The levelised cost method has been used to assess the plant economics. The levelised cost is a constant annual cost that is equivalent in present value terms to the actual capital and variable costs of the project. Capital recovery factor (CRF) allows investment costs incurred in the construction phase of a plant to be discounted. CAF is defined as the ratio of the uniform end-of-period payment or receipt continuing for the coming n periods to the present sum of money. It is also known as the annuity rate and the amount depend on the real interest rate and lifetime of the plant. The CRF and the annual amount of the cost of the capital investment (AC) can be calculated as:
CRF = i(l+i)n
(8.4) [(1+ 0" -11
The term real interest rate is defined as the rate at which the investor gets loan from the bank for investment minus the inflation rate.
Annualised capital investment cost = AC =I CRF (US$/yr) (8.5)
8.3.2 Cost of Repair and Maintenance
Operation and maintenance (O&M) cost is the sum of the operation, repair and maintenance costs, which mainly depends on plant specific conditions (e. g. type and size of the plant, type of fuel). Table 8.1 shows the operation and maintenance costs of the different types of the biomass electricity plants.
Number of operators varies with the types of conversion technology systems (see Chapter 7). In this study, since different types of electricity conversion technology
139

systems has been studied; so, it would be more appropriate to calculate the cost of operation and cost of repair and maintenance separately. Also Table 8.1 shows the data of the two types of costs separately.
Most investigators reported that the annual operation and maintenance cost is in between 5-6% of the capital investment costs (see Table 8.1). The repair and maintenance costs are estimated as a percentage of the yearly investment costs (BIOS, 2004). Mitchell et al. (1995) reported the annual maintenance costs of only 2.5% of the capital investment costs. Kumar et al. (2003) reported the cost as 3% of the capital investment cost. So, in this study, a typical value of 3% of the capital investment costs has been used for repair and maintenance cost for all types of feasible technologies. A similar value has been used for diesel generator plant.
8.3.3 Cost of Operation
Elements of the cost of operation for different types of biomass electricity plants have been estimated in Chapter 7 for calculating the economic plant size.
For the same plant capacity, the number of operators is more in biomass electricity plants than in diesel generator plant. This is due to the additional work involved in the biomass electricity plants (e. g. fuel preparation, adding fuel and filter cleaning). The number of operators has been estimated as 3 and 5 for gasification (or direct combustion) and anaerobic digestion based plants (see Chapter 7). Stassen (1995) estimated that 1 operator is required for 10-100 W. diesel generator plant operation. In this study the size of the most diesel generator plants considered are in the range of 300-500 kW,. So, it is quite reasonable to assume the number of operators as 2 for diesel generator plant operation. The total cost of operation has been calculated by multiplying the wages rate of the operator with the total number of operators.
8.3.4 Cost of Biomass Fuel
The price of biomass varies, the reasons are:
" Variation of biomass sources " Cost of collection and transportation (infrastructures dependent) " Local demand for conventional use " Quantity of production " Government assistant/subsidy for biomass generation
The cost of biomass fuel (FC) at the plant gate is the sum of the followings:
Cost of biomass at production site Cost of transporting the biomass at the plant site Cost of storage and Cost of pre-treatment of biomass
140

C: ) C: ) (D CD C> C) m
c3) 0 cli
0 CN
0 C, 4
CD CY
C) C, 4 - ý -
- ;z
0 0 Lin 0
' 0 A (D 0 C, 4
0 CD
c> c> cc, 4)
c: r_ M c
m c
M r_ -le _2 (K3
m 0 C)
CY
I
cu
00 ,4
- -4- f. ) -
Co 0- (0
8 r- 0 'D 0 (0 N c» Co ý
: : e C, 4 c» Q)
Cý Lfý c3) (6 0 Lti I -I r; 6 Lr; Cý Ln r4
(D (D C)
"v (D 0
uý CD
C) q
m «a
E nt e cý (Z cý cý Cý cý . 20 ý: (n CD N ýt Mý
, ý N N lcr CD (D 0 CO C)
c2. (D -X (D N
(0 M CN - u3 C 4 r e
LO Co ci od Co 69 (D C>
C) 0
ci ö
A .0 LO 't
m 0 m M
(D CD
cý cý 0
e
c> 0 CD CD 0 Lo U. ) tE3 u-) Lo 0 CD 0 C: )
: 8 C: ) Lo Co m (0 e, r) ce (0 ý 8 8 1 1 ý Ul) 00
cý cý
cý
m ci uý c4 Ilý cý cý cý ce cý cý CL - O CD 1
m 0
M [u- G) ci
C%4 N CD CD
cm
U) 2 a) U)
c
.2 ul (0
jo :p (D Z
t 2
cm .2
:a Co m . r- -0 «o C»
02 (D Z Co
22 15 :3
j2 M " c3)
0 0 0 8
:3 0 03 m ZZ
c) Z e% a)
- :3
0 CL U) 0) -m 12 -E
m 0
. LD Z Z Z 2
U) a < LL 1 LL
c 0
0 - (0 ý5 .-m e Z r
.2 cm 2
0 0 8
E. 0 8:; = 00 gr cn "
2 00 > 0 c2. 0 0 c 00
E cr 0C , .0C (D L) (D
1< 10 10 (D 0 Q)
ýý - cm
! fl U)
S .6
cn
.0 4-- 0
(0
a
Co
-0
1-4 ItT

8.3.4.1 Cost of Production and Transportation
Some biomass resources are available free (e. g. human excreta, poultry waste and water hyacinth). Agricultural wastes and forestry residues incur costs of production, collection (i. e. transportation cost) and some form of pre-processing (e. g. drying, chipping, baling, and briquetting) costs. Similar transportation costs data, which were used for calculating the economic sizes of the plants, has been used for calculating the plant economics.
8.3.4.2 Cost of Storaqe and Pre-treatment
Some biomass resources are available all year round (animal waste, forestry residues). But most agricultural residues are only available during and after a brief period of harvesting. Seasonal availability of the different types of agricultural wastes in Bangladesh has been discussed in Chapter 5. Monthly average available amount of agricultural wastes have been used for calculating the plant capacity and economics. For ensuring uninterrupted electricity supply all year round, storage of these resources is needed.
The quantity of the agricultural residues need to storage (tonne/year) and the time period of the storage are the two important factors. These factors depend mainly on the monthly availability of the biomass resources and the requirement rate of the biomass electricity plant. In some months, the amount of available agricultural residues is less than the average amount and in some other months the availability of agricultural residues are more than the average. In June, there is no harvesting of the major agricultural crops in Bangladesh (see Chapter 5). So, in every month it is important to ensure that the average amount of biomass is available all year round. For back up and reliability of biomass supply, the actual quantity needed to be stored should be higher than the theoretical amount of biomass needed.
If space is available and the weather condition allows, the attractive option is to perform the pre-treatment (sizing, drying) and storage, at the production site of the biomass resources (Junginger, 2000). Pre-treatment costs vary with the type and quantity of feed to be processed and the amount of pre-treatment required for certain types of conversion technology. Typical values of the storage and pre-treatment costs of some biomass resources are shown in Table 8.2, which were used for a case study in Thailand. All the costs have been converted to US$ of 2004 value by taking into consideration of inflation rate.
Biomass resources
Density (kg/M3
Average storage period
(month)
Storage costs (US$/tonne/
month)
Pre-treatment (shredding/chipping) costs
(US$ ftonne)
Total costs (US$/tonne)
Rice straw 140 5 5.51 4.50 10.01
Sugarcane tops andleaves
147 3 2.98 1.76 4.74
Wood logs 500 1 0.31 2.76 3.61 Waste wood 500 1 0.31 2.76 3.01
Table 8.2 Storage and pre-treatment costs (in September 2004 value) (Junginger, 2000)
142

8.3.4.3 Cost of Biomass at Plant Gate
Biomass cost data available in the literature represents the total cost at plant gate and is expressed as either energy basis or mass basis. Shukla (11998) reported the price of biomass as 0.5 to 4 US$/ GJ. Quaak et al. (1999) estimated an average price of biomass of US$ 40/tonne (equivalent to US$ 2.82/GJ). It has been estimated that in Khon Kaen province of Thailand, the average price of most-processed based residues (rice husk, sugarcane bagasee, sawdust, eucalyptus bark) varies between 1.3 US$/GJ to 2.4 US$/GJ (October 2004 value) (Junginger, 2000). This variation is due to the assumed transportation costs and increased demand on biomass by other applications. Typical price of biomass in some Asian countries is shown in Table 8.3. All the costs have been converted to US$, in September 2004 value. For biomass fuels which are available free, only transportation and storagelpre-treatment (if needed) costs would be the price of biomass at the plant gate. Cost of forestry residues are higher than the cost of agricultural residues; for example price of fuel wood and rice husk are US$ 43/tonne and 13 US$/tonne respectively (see Table 8.3).
By reviewing the biomass price data presented in Table 8.3, an average price of US$ 30/tonne has been estimated for the mixed biomass (agricultural wastes and forestry residues) resources in Bangladesh. MSW can be used without any pre treatment for anaerobic digestion. On the other hand, pre-treatment is necessary to use MSW either for gasification or for direct combustion. There are no production and storage costs associated with the utilisation of the MSW. So, the price of the combustible parts of MSW would be less than the price of mixed biomass (agricultural wastes and forestry residues). A typical price value of US$20/tonne has been estimated for MSW either for gasification or for direct combustion.
The price of the biomass resources such as sewage sludge, MSW (untreated), poultry waste and animal waste is only associated with the transportation costs only. Using equation (7.28) of Chapter 7, the price of these biomass has been estimated in
US$/tonne as (= 2 r,, C,, ) (see Table 8.4). Transportation cost (Ct, ) was 3Ae 3
estimated as US$ 1/tonne/krn (see Chapter 7) for any types of biomass resources.
Country/ year Biomass costs' Costs in Reference resources (pertonne) September
2004 value (US$/tonne)
Indonesia Agricultural INR 8000-48000 4.40-60.00 RWEDP (2002a) /1990 residues = US$ 3.5 - 19.2 Bangladesh/ Fuelwood BIDT 2000 43.00 Banu(1996) 1996 = US$ 39 China /1998 Wood waste US$ 36 42.00 Zhenhong et al. (1998) China /1998 Com stalk and cob US$ 25 29.00 Zhenhong et al. (1998) China /1998 Rice husk US$ 11 13.00 Zhenhong et al. (1998) China/1998 Agricultural wastes Yuan 110 15.30 Lin et al. (1998)
U China/2002 Rice husk Yuan 80 = 9.6 10.24 1 Wu et al. (2002) India/1996 Agricultural wastes and US$14.08 16.95 Tripathi et al. (1997)
forestry residues 1
INR Indonesian Rupee; BDT: Bangladeshi Taka a conversion of INR to US$ is based on latest available currency conversion data of year 1995
Table 8.3 Cost of biomass in some Asian countries
143

Types of biomass resources Price of biomass (US$/ tonne)
Agricultural waste and forestry residues (mixed biomass) 30 Combustible parts of MSW 20 Animal waste/ Poultry waste/ Sewage sludge 2
rý Cb 3
MSW (untreated) 2 r, Ct,
1 13
Table 8.4 Estimated price of biomass at the plant gate in Bangladesh
8.3.5 Others Fixed Costs
The elements of the others fixed costs are reported in Chapter 7. Mitchell et al. (1995) estimated this cost as 2.5% of the capital investment cost per year for large scale (20 MW) biomass electricity plants. Kartha and Larson (2000) used this cost as 2% of the capital investment cost per year for a 10 MW biomass electricity plant. In this study, the size of the biomass electricity plant considered is in the scale of W, so a lower value would be appropriate. Typical figure of 1% of the capital investment cost per year have been used as others fixed costs.
8.4 Economics for Diesel and Dual-fuel Mode of Operation
Same methodology which was used for biomass electricity plants has been applied to calculate the economics of diesel and dual-fuelled electricity generator plants. Correlations developed for efficiency and cost with the plant electricity generating capacity of diesel and dual-fuelled (diesel and biogas/producer gas) engine-generator systems (see Chapter 6) have been used for economical analysis.
The plant electricity generating capacity either for diesel or dual-fuelled generator has been considered same as the plant size (i. e. corrected plant size) used for pure biogas or producer gas based plants.
8.4.1 Diesel Fuel Operation
GOB imports diesel at a cost of BDT 28/litre (-US$ 0.46/litre), but sells the same at BIDT 23/litre (-US$ 0.38/litrer) (GCC, 2005). Increase in the price of diesel would affect the agricultural sector in the country. GOB is counting loss every year to keep the diesel price at a low rate. Lower heating value of diesel is 42820 KJ/kg and the density of diesel is 850 kg/M3 (RWEDP, 2004; Murphy et al. 2004). Using these data, the price of diesel can be estimated as US$ 447.06 /tonne.
The cost function equation of diesel generator plant, developed in Chapter 6 was based on the free on board price of the plant. Freight, installation, training and commissioning costs need to be added to estimate the total capital investment cost. Stassen (1995) reported the value of US$ 117AW. and US$ 72/ W, (1990 value) as
144

freight and installation costs for 30 kW. and 100 kW. sized diesel generator plant respectively. This indicates that as the capacity of the plant increases, per unit cost of the freight decreases. No correlation was found to calculate the freight and installation costs for varying plant sizes. Most of the plant sizes considered in this study are in the scale of 300-500 kW,. Assuming a little variation for this range of plants, an average cost of US$ 50/ kW, has been used in this study as freight and installation cost. Stassen (1995) estimated a total fixed cost of US$ 1000 (1990 value) as training and commissioning cost of a diesel generator plant. A similar cost figure, which is equivalent to US$ 1445, in September 2004, has been used in this study as training and commissioning cost of the diesel generator plant.
8.4.2 Dual-fuel Operation
The value of the diesel replacement factor Qf ) is very important. In the case of the existing diesel generators, diesel replacement is possible up to 80% (TERIIN, 2004). Value of rf affects the thermal efficiency of the engine. Tripathi et aL (1997) and Kapur et al. (1996) assumed the value as 0.70 for the economical analysis of 3- 500 KW. dual-fuelled (diesel and producer gas) electricity generation plant. So, in this study, the same value of 0.70 has been assumed for economical analysis of the dual- fuelled generator. Equation 7.10 and 7.11 (see Chapter 7) has been used to calculate the diesel and biomass fuel consumptions, respectively.
8.5 Default Values - Financial and Technical
Information of the plant life of the different types of biomass electricity conversion technology system is not available in the literature. Shukla (1998) estimated a project lifetime of 20 and 25 years for 100 M. and 1 MW, biomass electricity plants, respectively. Stassen (1995) estimated the plant lifetime of 10 and 7 years for 10-100 kW. capacity diesel and producer gas (or dual-fuelled) based plant respectively. Whereas, Kartha and Larson (2000) estimated an average lifetime of 25 years for small-to-medium sized biomass electricity plants. By reviewing these data, a default value of 20 years plant life has been used in this study for all types of electricity generation plants.
An average inflation rate data of 6% has been used for Bangladesh (BB, 2005a). The nominal interest rate of the nationalised bank for borrowing money for small to medium scale industry is in between 10 to 10.5% (BB, 2005b). A maximum value of 10.5% has been used in this study. The defaults values of different technical and financial parameters used in this study are summarlsed in Table 8.5.
8.6 Results
Sample calculation and results of the economics analysis are shown in Table 8.6 to Table 8.8. The result for any conversion technology option and for any district can be obtained by running the programme written in Matlab (see Appendices B and E)
145

Parameters Unit Conversion Technology
Gasification/ Anaerobic Digest on/ Direct Combustion
Diesel Generator
Dual-fuelled Generator
Pl t ti h hrs/day) 12.0 12.0 12.0 an opera ng ours (hrs/yr) 4380.0 4380.0 4380.0 No. of operators 2.0 3(5)a Cost of repair and maintenance : as % of capital investment
N 3.0 3.0 3.0
Cost of operation (US$/cap ita/yr)
1000.0 1000.0 1000.0
Life of plant (yrs) 20.0 20.0 20.0 Nominal interest rate (%/yr) 10.5 10.5 10.5 Inflation rate (%/yr 6.0 6.0 . Others fixed costs : as % of capital investment
N i 1.0 1.0 1.0
3 bracketed figure Is for anaerobic digestion-based plant only
Table 8.5 Default values (technical and financial) used for different types of electricity generation technologies
8.6.1 Gas ificatio n -based Biomass Electricity Plant
Table 8.6 shows the result of the economical analysis for gasification based spark- ignition engine-generator systems. Khagrachari, Dhaka and Feni districts have been selected for group A, group B and group C types of biomass resources (see Figure 8.3) respectively. The reasons for selecting these districts have been discussed in Chapter 7. In Bangladesh, the tariff of the grid electricity varies with the amount of consumption. The higher the consumption, the higher is the tariff and vice versa. The average tariff of the grid electricity supplied by the REB to the residential customer is US$ 0.0563/kWh (Islam, 2002). In non-electrified area of the country where there is no existing grid connection, Islam (2002) estimated the average tariff as US$ 0.0763/kWh and US$ 0.08475/kWh for small-grid and off-grid electricity generation respectively.
Parameter Unit -Value Group A Group B Group C,, Corrected overall electrical efficiency 17.21 17.07 16.72 Corrected capacity of the plant (W) 829.71 563.18 186.58 Quantity of biomass consumption (tonne/yr 4876.67 2802.21 1304.32
st of capital investment (US$/yr) 26117.16 20325.05 9944.25 Cost of operation (US$/yr) 3000.00 3000.00 3000.00 Cost of biomass at plant gate (US$/yr) 146300.21 56044.13 6000.00 Cost of repair and maintenance (US$/Yr) 783.51 609.75 298.33 Others fixed costs (US$/yr) 261.17 203.25 99.44 Total cost of electricity generation (US$/yr) 176462.05 80182.18 19342.02 Total electrical eLemy-2enerated (kWhtyr) 3634141.50 2466727.36 817241.25 Cost of electricity generation (US$/kWh) 0.0486 T_ 0.0325 -ý0.0237 Net Present Value (US$) 1710952.4 1676371.34 6493 5.52 Simple Pay Back Period (yr) 2.15 1.77 2.16 Profitability Index 5.04 6.34 - 5.02
Table 8.6 Plant economics: gasification-based spark-ignition engine-generator
146

Since, the objective of this study is to assess small to medium-scale off-grid biomass electricity plant; so a value of US$ 0.08475/kWh has been used as selling price of electricity to calculate the NPV, simple PBP and PI of the plant.
8.6.2 Diesel Generator Plant
Plant economics are shown in Table 8.7, if the diesel generators are chosen instead of gasification-based plants. The cost of electricity generation is higher than the estimated selling price (see Table 8.7 and section 7.6.1); so calculation of NPV, simple PBP and PI has not been performed in the case of diesel generator plant.
8.6.3 Dual-fuelled Generator Plant
Table 8.8 shows the economics of gasification-based dual-fuelled (diesel and producer gas) ICE-generator plants.
'Parameter Unit Value - GroupA Group B Group C
Corrected overall electrical efficiency N 38.41 36.14 34.46 Corrected size of the plant (W) 829.71 563.18 186.58 Quantity of diesel consumption (tonne/yr) 795.49
- 554.76 199.38
Cost of capital investment (US$/yr) 85 82.88 6512.92 2758.53 Cost of operation (US$/Yr) 2000.00 2000.00 2000.00 Cost of diesel at plant gate (US$/yr) 355582.24 247975.95 89124.48 Cost of repair and maintenance (US$/yr) 266.49 195.39 82.76 Others fixed costs (US$/yr) 88.83 65.13 27.59
Total cost of electricity generation (US$/yr) 366820.43 256749.38 93993.35 Total electrical energy generated (kWh/yr) 3634141.50 2466727.36 817241.25
Cost of electricity generation (US$/kWh) --0.1009 0.1041 0.1150
Table 8.7 Plant economics: diesel generators
Parameters Unit It Value Group A Group B Group C
Corrected overall electrical efficiency N 23.32 21.68 20.47 Corrected capacity of the plant (W) 829.71 563.18 186.58 Diesel replacement factor N 70 70 70 Quantity of biomass consumption (kg/kWh) 0.6931 0.6014 0.9123 Quantity of diesel consumption (kg/kWh) 0.0657 0.0675 0.0732 Cost of capital investment (US$/yr) 19451.06 15437.04 7986.94 Cost of operation (US$/yr) 3000.00 3000.00 3000.00 Cost of biomass and diesel at plant gate (US$Iyr) 182242.88 104061.92 30166.91 Cost of repair and maintenance (US$Iyr) 583.53 463.11 239.61 Others fixed costs (US$/yr) 194.51 154.37 79.87 Total cost of electricity generation (US$/Yr) 205471.98 113835.35 41473.33 Total electrical energy generated (kWh/yr) 3634141.50 2466727.36 817241.25 Cost of electricity generation (US$/kWh) - 0.0565 ý 0.0461 0.0507 Net Present Value (US$) 1333593.32 1238613.00 361462.80 Simple Pay Back Period (yr) 2.07- 1- -- 1-. 8-1- f 2.90 Profitability Index 5.27 1 6.17 1 3.48
Table 8.8 Plant economics: dual fuelled generator
147

8.6.4 Conclusions
Result of the sample economical analysis shows that the cost of the pure gasification based electricity generation is lower than the other two options (i. e. diesel and dual- fuelled) for each types of biomass option. The cost of the pure gasification-based electricity generation is lower than the average tariff of electricity supplied by REB in the country (see section 8.6.1). On the other hand, the cost of electricity generation by the diesel generator is highest and also above the estimated selling price of the electricity (sees section 8.6.1). So, based on the cost of the electricity generation, pure gasification and duel-fuelled ICE-engine generator is far better than the electricity generation by diesel generator. Result also shows that NPV, PBP and PI vary significantly with technology and types of biomass resources. The NPV is highest for pure gasification based electricity generation utilising group A type of biomass resources; whereas it is lowest for dual-fuelled electricity generation utilising group C type of biomass resources. Amongst all options of gasification based ICE-generator plants, the PBP is lowest in the case of pure gasification based generator, utilising group B type of biomass resources. PI of the dual-fuelled electricity generation is higher than the pure gasification based electricity generation for group A type of biomass resources. But, in the case of group B and group C types of biomass resources, PI is higher for pure gasification-based electricity generation.
To compare the economics of the different types of electricity generation technologies, results of the economical parameters are shown in Figure 8.4 to Figure 8.6. All the available biomass resources in Khagrachari district were used to calculate the plant economics. Results shows that, of all the feasible technologies, CoE generation of the anaerobic digestion-based biomass electricity plant, using biogas, generated from animal waste and poultry waste as a fuel, is the lowest (see Figure 8.4). On the other hand, CoE generation of the direct combustion-based biomass electricity plant, using MSW fuel, is the highest, amongst all feasible technologies (see Figure 8.4). Moreover, it is estimated that CoE generation of direct combustion-based biomass electricity plant is higher than the corresponding CoE generation of the diesel generator plant (see Figure 8.4). Simple PBP, PI and NPV were not calculated for the direct combustion- based biomass electricity plant due to higher electricity generation cost compared to the estimated selling price in Bangladesh (see Figure 8.4 and section 8.6).
PBP is shortest for gasification-based dual-fuelled electricity generation plant, utilising group A type of biomass resources; whereas, PBP is highest for anaerobic digestion- based dual-fuelled electricity generation plant, utilising group B types of biomass resources (see Figure 8.5). On the other hand, PI is highest for gasification-based dual-fuelled electricity generation plant, utillsing group A type of biomass resources; whereas, and PI is shortest for anaerobic digestion-based dual-fuelled electricity generation plant, utilising group A type of biomass resources (see Figure 8.5). Figure 8.6 show that the NPV of the producer gas fuelled electricity generation plant, utilising group A type of biomass, is the highest.
So, considering the NPV and PI value, the gasification-based duel-fuelled electricity generation plant, utilising agricultural wastes and forestry residues as fuel, is attractive amongst all options of biomass electricity plant in the Khagrachari district. On the other hand, considering the CoE generation only, the anaerobic digestion-based electricity generation technology, utilising animal and poultry waste, is the most attractive option for the Khagrachari district.
148

014- ----------------- - -------------- -- ---------------
Producer Gas Diesel
0.12 Dual-fuelled
0.1
(n 0,08
2 006
0 004
002
0 Group A Group BG 'cup C
Biomass Resources
(a) Gasification
Biogas Diesel
0.1 Duakfuelled
0ý08
U)
c 0 0,06
c
w 004 0
002
0 Group Group B
Biomass Resources
(b) Anaerobic Digestion
016
014
012
oi (0
0 008
006
004
002
0
Direct Combustion Diesel
Biomass Resoixces
(c) Direct Combustion
Figure 8.4 Cost of electricity generation for different types of electricity generation technologies in the Khagrachari district
149

M P, od, cer Gý D, al fýll, d
ý-p A ý-p "'P
B-- .........
(a) PBP for Gasification
7 ms, ogal, Dual-fuelled
6
5
4
3
B,. - R---
(b) PBP for Anaerobic digestion
P, Wme, Gm D-1-fuelled
4
3
2
0 Q-p A G", B G-p C
B,. - R-,. -
(c) PI for Gasification
2
D- fýo.
14
12
1
08
6
02 0 ý-P B
R .....
(d) PI for Anaerobic digestion
Figure 8.5 PBP and PI for different types of technologies in the Khagrachari district
150

x 10, 18
16
14
12
lo
8
6
4
2
0
Producer Gas Dual-fuelled
ME
GrouP B
Biomass Resources
(a) Gasification
x io' 10 9
8
7
6
CL 4
3
2
1
0
Biogas Dual-fuelle
Id
Group A Group B
Biomass Resources
(b) Anaerobic digestion
Mý Group C
Figure 8.6 NPV for different types of electricity generation technologies in the Khagrachari district
151
Group A

8.7 Sensitivity Analysis 8.7.1 Introduction
Sensitivity analysis of an investment project involves the investigation of the impacts of varying the main parameters affecting the project within their expected levels. It is an important tool of cost-benefit analysis. In Bangladesh, gasification-based ICE-driven electricity generation technology shows the best option due to the combination of electricity generation potential and plant economics (see Sections 6.5.2 and 8.6). So, in this study, the sensitivity analysis has been performed only for this technology option. Impacts on the CoE and PI have been examined when a parameter value is changes from the default, or base, value selected.
Price of biomass has been estimated for the economic analysis. But, in real situation, price of biomass can increase or decrease. If the local demand on biomass is high and its generation is low, then the biomass price would increase. On the other hand, through the widespread of improved cooking stoves and other types of alternative resources (e. g. use of biogas for cooking, use of solar cookers) price of biomass would decrease. It is difficult to quantify exactly the extent of increase or decrease in the price of biomass. Although, a possible maximum price of biomass resources has been used as a default value (see Section 8.3.4.3), a± 20% variation in the biomass price has been assumed to measure the impact on biomass electricity plant economics, in the context of Bangladesh. The price of diesel fuel in Bangladesh is currently very low due to the subsidy provided by the GOB. However, the GOB is considering an increase in the price of diesel, to minimise the loss in revenue of the petroleum sector (GCC, 2005). So, an increase in the diesel fuel price by between 5% and 10% has been used for sensitivity analysis.
Capital investment cost is another important parameter to consider. The GOB is giving huge subsidies to the existing electricity sector. It would be logical for the Government to provide the subsidies as a tool to encourage entrepreneurs for investing in biomass electricity sectors. It is also possible to secure aid from various international donor agencies. Accordingly, a decrease in capital investment costs of between 10% and 20% has been used for the sensitivity analysis. However, capital investment cost might also increase due to the political and economic instability of the country (or in the world). An increase of 20% has been assumed for the sensitivity analysis.
Overall energy conversion efficiency and the selling price of electricity are the two important parameters affecting plant economics. Since, the efficiency data of the plants in operation has been used to develop the correlations, a wide variation is not expected. Only ± 10% variation in efficiency has been assumed. The GOB increases the electricity tariff almost every year. On the other hand, renewable energy utilisation for electricity generation is getting popular. So it is generally expected that the capital investment cost of biomass-to-electricity technology would decrease in the future with the increase in installed capacity and electricity production. In this study, a variation of ± 10% in the selling price of electricity has been assumed.
Parameters such as plant lifetime, repair and maintenance costs, plant operating hours and nominal interest rates can also vary from the default values. Due to lack of the adequate information, it is not possible to quantify the extent of variations. So, a typical assumption of ± 20% variations of these parameters has been made in this study.
152

8.7.2 Results
Table 8.9 shows the impacts of the parameters considered on the CoE and PI. The sensitivity analysis has been performed for plants employing producer gas and dual- fuel (producer gas and diesel) in ICEs, utilising group A of biomass resources, in the Khagrachari district of Chittagong division. The reference (or base) values are taken from Table 8.6 and Table 8.8. The results (impacts) are compared with the reference value and expressed as a percentage change to measure the magnitude of variation from the reference values.
The results show that in both type of electricity generation plants, the impact on the cost of electricity generation (CoE) is highest due to change in biomass price. Energy conversion efficiency followed by the capital investment cost stand as the second and third most influential parameters for a producer-gas electricity-generation plant. In the case of a dual-fuelled plant, the corresponding parameters are the energy conversion efficiency, price of diesel and capital investment costs (see Table 8.9). Impacts of variations in plant lifetime, maintenance cost, operating hours and interest rates are not so important (see Table 8.9).
The variation in the selling price of the electricity shows the highest impact on the profitability index (PI) of the plant for both types of electricity generation modes. Other parameters with considerable impacts on profitability index (PI) are capital investment cost, price of biomass (plus diesel for duel-fuelled plant), plant lifetime, conversion efficiency and operating hours (see Table 8.9).
8.8 Conclusions
In this chapter, a methodology was developed to assess the biomass electricity plant economics and compare it with those of diesel and dual-fuelled electricity generation plants, in the context of Bangladesh. Economic parameters used are cost of electricity generation, simple pay back period, net present value and the profitability index.
The availability of some of agricultural-crop residues is seasonal and an average annual value has been used for the economic analysis by considering the existence of storage facilities. Correlations for capital investment costs and overall energy conversion efficiency, developed in Chapter 6, have been employed. Size of the biomass electricity plant has been calculated for maximum profitability (see Chapter 7). Computer programmes has been developed for decentralised (i. e. district-wise) biomass electricity plant economics analysis, for each types of technologies (see Appendix B).
Total cost of the electricity generation is made up of contributions from capital investment, operation, fuel, repair and maintenance and others fixed costs. Plant life has been assumed as 20 years for all types of electricity generation options considered. Investment cost has been annualised using the capital recovery factor. The costs of different types of biomass fuel have been estimated, taking into account the price of biomass at the production site and the costs of transportation, storage and pre- treatment. Some biomass resources are incurred only transportation and pre-treatment costs. The results show that the unit cost of electricity generation by gasification and
153

CD 0 C, 4 le 00 00 nt (» Igt (0 m (0 N C» (1 M r- 00 Co Irý lq: c4 Cý (jý , Lo 0 C: ) (iý ci -: -: cý ei N 00 r_ -0 C, m LÄ? 0 m c» m ri ýi CD CD m (0 C: ) CD , . CN . Co . (M CL m CJ CV3 (1
- 0 r_ C» I
LO 0 (N r, - u3 C, 4 N 0 Lo M m - (0 00 U') N ý M a
(D :3 r4 llý 9 cý 1: q N Cý Llq lp (cý Cý Ilý cl cl cq (jý cý rIlý r_ G) 'ffl e (0 m le LO Co Ict LO Igt (0 Ci LO le LO Ul) Ln le le e 1
1 m 1 M (0 LO ý CD u3 gt 00 00 0 C) OD c3) 00 (D LO C: ) CO ý U) 0 e
. C, 4
. (0
. ce)
. cq (» * 0 , m , e , cý 9 9 uý -: cý Ci C: ) CO ü) (0 c3) cm r- r- N Lo 0 ý CN -7 Ln 0 0 0 - 0 0 0 0 0 . 0
(D L- c:
--l> (Z (D 0 m :3
' 0 W 0
r CL (j ýt 0 LD 0 1-t '
r- CD (0 ) Lg Lt) C: ) e (0 LO r- LO 0 ý N CO m (0 U ) fl- e (» (0 Co CO N (0 (0 (0 Co N (0
(D Lo (0 U') LO Lx) LO to LO LO LD U) LO LO LO U) LO Ul) LO LO LO
m :3 e
cý cý cý cý R cý 9 cý 0 .
CD . cý cý cý cý CD
. cý 9 cý cý cý a mte 0 0 0 0 0 0 0 0 0 0 0 0 0 0 0 0 O (D 0 0 E > Co
cq N CD CD (» (0 N C'4 (N N C» r- 0 C: ) m rl_ ce cq 0 CN C, 4 (D 0 C*4 ý "- r- (0 M e (0 Ilý C%i CD cý N (: ý oý 0) 12 N N ci ö ei 6 d ei (0 ce C, 3 m (0 CD 0 LD (0 Co m
C, r4 C, 4 ce) C'4 C, 4 cý
0
't N (0 e et "- CO N CO 0 ,
N ,
(0 M ý cl le 0 N 03 nt 0 C» ý 0 0 r- LO CD r, - C 4 C 4 00 r, - N (D 0 00 (N U) LO :3 u-) Ld cii -, i L6 --i (6 ei ui -i Lg. ) k6 e �i -, i L6
:3 2 . «0 8 (0 r- 0 0 LO (3) CY) OD 0) 0 0 LD (0 CD ý LO (0 CO M M 0 111: le cý cý le 9 cý N oý c: ý cý <e C, 4 cý c4 oý C, 4 cl IN Cl. C» (D (0 0 0 ý 4 Pl 9 N 00 1 (» 0 0 ý a N 0 0 ý C%4 ý ý a) 0)
r_ ä-0 m 1
t- 0) :3 m c2. 0
w 0
(0 (0 Lf) (0 (0 00 ý ý (0 -t (0 (0 00 r, - (0 Lo N r- rli CD OD (0 C: ) Co Co r- N C: ) le m
' 00 00 r- C) Co 00 N 0) C» 00
c2. (D e LO le e le le e 0 le U ) xt le le le 't Igt le 't ýt le E cý cý cý cý cý cý cý cý cý cý cý cý cý cý cý cý cý cý
>
0 (0 -. 2 -. 0- 1. -0 1. -0 äol 1.2 -. 0- 1. -0 1. -0 N. 01 ýO, Jl> N. 01 l-2 äol ". -le -. -0 äR IOR 0M C: ) 0 Ln CD C) CD 0 CD CD (D 0 C: ) C) CD C: ) C: ) 0 0 CD M CY C, 4 + - CIJ N ý - C'4 CN CN CIJ ci ci N CY + + + + + 8 + a + 8 + 6 +
> 0 0 U) 0 0 CO
m M
Z E u Z 2 E U) (0 0 0 0 >,
0 0 0 0 G) > c A u E
i2
ýu 0 0 15 (D 0 = G) >
]
Q)
TE
E U)
1 r_ r_ 0 a) 5 (2. (2. 0 0
rt 0- 12- 0 0 - u) 0 EL 2 2 0 0 Z Z
x a) 'D
cu 2 ca- _0 c
0
E
22 (0
Co IM
.0
hT
Itt tn -4

anaerobic digestion with an ICE-driven generator is less than the corresponding diesel- based electricity generation and the current selling price of electricity. Direct combustion technology offers the highest electricity generation potential (see Chapter 6). However, due to high capital investment cost (see Chapter 6), the cost of electricity generation is higher than the cost of electricity generation of a diesel generator with the same electricity generation capacity.
For any specific technology option, plant economics vary from one district to another; mainly due to the variation in types of biomass, biomass availability density and economic size of the plant. As a case study, the Khagrachari district was selected to study the plant economics. Amongst all options of electricity generation, cost of electricity generated from anaerobic digestion-based plant, utilising animal and poultry wastes as the feedstocks, is the lowest. On the other hand, the cost of electricity generation in a direct combustion-based plant, using IVISW as a fuel, is the highest.
For gasification-based, ICE-driven, electricity-generation technology option in the Khagrachari district, PBP is lowest and PI is highest for the dual-fuelled electricity generation option. In the case of anaerobic-digestion, ICE-driven, electricity-generation option, PBP is lowest and P1 is highest for biogas operated engine. Amongst all options of electricity generation, net present value is the highest for gasification-based ICE-driven generator, using producer gas generated from agricultural wastes and forestry residues. Gasification-based, dual-fuelled plant has the second highest NPV. So, considering the CoE, NPV, PBP and P1 value, the gasification-based, duel- fuelled electricity generation plant, utilising agricultural wastes and forestry residues as fuel, is the most attractive in the Khagrachari district.
Sensitivity analysis has been performed to identify the parameters having the highest influence on gasification-based biomass electricity plant economics. Parameters variations from the default value have been selected considering possible scenarios in the context of Bangladesh. Impacts on the CoE and PI have been assessed for both producer gas and dual-fuel (producer gas and diesel) electricity generation options. The analysis showed that, the highest impacts on CoE occurs as a result of change in biomass price, energy conversion efficiency and capital investment cost for the case of producer gas electricity generation option. In the case of dual-fuelled electricity generation plant, changes in biomass price, conversion efficiency, diesel price and capital investment cost have the most significant impacts. Impacts on CoE due to change in values of plant lifetime, maintenance cost, operating hours, and interest rates are not significant for both types of electricity generation plants. Parameters having the highest impacts on P1 are the selling price of electricity, capital investment cost, price of biomass (and diesel price for dual-fuelled plant), plant lifetime, conversion efficiency and operating hours. The sensitivity analysis proved that in case of possible worst scenario, gasification-based biomass electricity generation in Bangladesh is economically feasible.
155

CHAPTER 9 IMPACT ANALYSIS: ENVIRONMENTAL AND SOCIO-ECONOMIC
9.1 Environmental Impact: Introduction and Methodology
In general, renewable energy sources are considered as more environmentally favorable than many other sources. The environmental and socio-economic impacts of biomass energy systems are mainly due to the fact that such systems are land and labor intensive (Kartha and Larson, 2000). Impact assessment of biomass electricity projects may lead to the modification of proposed scenarios or development of new ones. Stages of the environmental impact assessment of a biomass energy project are (Remigio, 1997):
-; L Finding the expected positive and negative environmental changes. 4. Measuring/understanding the scale, extent and magnitude of these environmental
changes.
W& Understanding whether these changes are significant from the standpoint of maintaining ecosystem integrity or not.
OL The necessary steps could be under taken to minimise adverse environmental changes. Taking the necessary steps for informing various stakeholders (planners, decision makers, local communities, environmental NGOs) about what needs to be done as a result of the environmental impact assessment.
Indoor air pollution caused by the inefficient use of biomass for domestic applications poses great health risks in many developing countries. This also emits considerable amounts of atmospheric pollutants (i. e. greenhouse gases). Biomass electricity systems produce solid, liquid, and gaseous effluents. Some of these are environmentally beneficial. However, others need to be monitored and controlled to prevent any possible damage to the environment.
The main greenhouse gases are: water vapor, ozone, C02, CH4, N20, hydro fluorocarbons (HFCs), per fluorocarbons (PFCs), and sulfur hexafluoride (SF6)- In general, biomass is C02 neutral, but a considerable amount of the fossil fuels is needed for the production, harvesting, transporting, and processing of biomass. In comparison with traditional power plants, biomass electricity systems can reduce greenhouse gas emissions significantly.
Figure 9.1 shows the methodology used for the environmental impact assessment. The overall efficiencies of the biomass cooking stoves used in rural area are very low. Impacts on health due to inefficient combustion of biomass and the possible interventions to reduce indoor air pollution were investigated. The impacts on environment, due to solid, liquid and gaseous effluents of a biomass electricity plant were reviewed and compared to the impacts of a fossil-fuel based power plant. The proposed and base case scenarios are biomass electricity and diesel-generator plant respectively. The amount of greenhouse gas emissions savings potential was calculated due to the employment of the biomass electricity plant instead of the diesel plant.
156

-------------------------------
Impact of bio-energy utilisation
T
I F- II [--ýealth Impact of inefficient 7Eývironmental
impact of combustion of biomass
F
bio-electricity systems
Impacts of solid, liquid and gaseous effluents on the environment
-------------------------------
(a) General Impacts
----------------
Greenhouse gas emissions data of
----------------
base and proposed scenario
Yearly electrical energy generation of the proposed plant
Quantity of greenhouse gas emissions mitigation potential
Cost of electricity generation: base and proposed scenario
Cost of greenhouse gas emissio mitigation potential
--------------------------------
(b) Greenhouse Gas Emission Mitigation Potential
Figure 9.1 Environmental Impact: Methodology
In Bangladesh, it has been proven that unit cost of electricity generation of the direct- fired biomass electricity plant is higher than the cost of electricity generated by a diesel generator (see Chapter 8). The greenhouse gas emissions potential by direct-fired biomass electricity plant was then transferred to greenhouse gas emissions mitigation costs, using the cost of electricity generation data of direct-fired biomass electricity and diesel-generator plant.
9.2 Inefficient Use of Biomass Energy
9.2.1 Indoor Air Pollution and Health Effects
More than 2 billion people in the world depend on solid fuels (biomass and coal) for their energy needs. High levels of indoor air pollution occur due to cooking with these solid fuels in traditional stoves, and this indoor air pollution is responsible for 2.7% of the global burden of diseases (WHO, 2004). Table 9.1 shows the emissions generated by different types of fuels in a typical household stove in India.
157

Fuel Combustion efficiency -'
, Overall efficiencya
Emissions (g/MJ delivered energy) C02 I CO
- CH4 TNMOCO N20
Biogas 99.4 57.4 144 0.190 0.101 0.060 0.0017 LPG 97.7 53.6 126 0.609 0.002 0.189 0.0018 Kerosene 96.5 49.5 138 1.900 0.033 0.795 0.0008 Wood 90.1 22.8 305 11.400 1.470 3.130 0.0180 Tree root 92.9 18.9 530 13.500 2.340 3.350 1 0.0060 Crop residues 85.3 14.6 565 36.100 4.130 8.990 0.0280 Char fuels 84.8 14.0 710 64.000 2.370 5.600 0.0180 Dung 1 86.6 1 10.1 876 38.900 7.300 21.800 0.0220
a: Overall efficiency z Combustion efficiency * Heat transfer efficiency *, b: TNMOC: Total Non Methane Organic Compound;
Table 9.1 Emissions for major fuels used in Indian household stoves (Smith et al. 1998)
Some pollutants caused by inefficient burning of solid fuel are (Bruce et al. 2002):
.; L Particles (complex mixtures of chemicals as solids and liquid droplets)
.; L Carbon monoxide 'iL Nitrous oxides ýL Sulphur oxides (mainly from coal) 4. Formaldehyde -4ý Carcinogens (chemical substances known to increase the risk of cancer, such as
benzo[a]pyrene and benzene)
Pollutants present in indoor smoke are responsible for respiratory diseases, low birth weight and eye problems (Pandy, 1999). Small particles of diameter less than 10 microns and in particular less than 2.5 microns are able to penetrate deep into the lungs and appear to have the greatest health damaging potential. Table 9.2 shows the different health problems caused by the indoor air pollution. The extent of the damage due to indoor pollution depends on:
, ýL concentrations of pollutants in the indoor environment, which depends on the type of fuel and stove used, and the kitchen location
%L time that individuals spend in the polluted environment
Pollutant I, ", I Potential Health Effects Particulate matter: small particles less than Wheezing, exacerbation of asthma 10 microns, and particularly those less than Respiratory infections 2.5 microns aerodynamic diameter Chronic bronchitis and COPDa
Exacerbation of COPD 0 Excess mortality
Carbon monoxide * Low birth weight Increase in perinatal deaths
Benzo[a]pyrene Lung cancer Cancer of mouth, nasopharynx, and larynx
Nitrogen dioxide Wheezing and exacerbation of asthma Respiratory infections Reduced lung function in children
Sulphur dioxide Wheezing and exacerbation of asthma Exacerbation of COPD
Pollutant component uncertain Cataract
COPD: Chronic Obstructive Pulmonary Disease
Table 9.2 Pollutants and health effects caused by the indoor air pollution (Bruce et al. 2002)
158

9.2.2 Interventions to Reduce Indoor Air Pollution
There are various types of interventions to reduce indoor air pollution, such as changing the fuel, using efficient combustion devices, changing or modifying the design of kitchen/living area, and changing the behaviour of the user. Some of the important interventions are:
'A' Use of Alternative Fuels. By using more efficient fuels (such as - biogas, producer gas, solar energy) would result in the reduction of the indoor air pollution significantly.
4. Use of Improved Stoves. It has been proven that the use of improved cooking stoves increases the combustion efficiency which in turn reduces the air pollution. Examples of the improvement in efficiencies of the stoves are reported in Chapter 5.
I-L Improved Ventilation. Improved ventilation of the cooking and living area is another effective way of reducing exposure to pollution. Techniques available include the installation of chimneys, use of smoke hoods (with flues), eaves spaces, and installation of enlarged and repositioned windows in the kitchen. In comparison to chimney, smoke hoods have the advantage of being freestanding and independent of the stove. Effects of the improved ventilation were studied in Kenya which showed significant reduction of pollutants in indoor air pollution (ITDG, 2005):
" Substantial reductions (80% in some homes) in particulates and carbon monoxide emission achieved by installation of smoke hoods; and
" Emissions of particulate matters were reduced by 60%, due to enlargement of the eaves spaces in traditional houses.
-4. Change of behaviour. A change in user behaviour plays a big role in reducing pollution and exposure levels. Drying the biomass before use, removing the ash before starting a new fire and keeping children away from polluted areas are examples of required behavioural changes.
9.3 Environmental Impacts of Biomass Electricity
The environmental aspects of biomass energy use are diverse: from local impacts to global climate, and depends on the type and size of the technology itself. The related environmental changes due to the implementation of a biomass energy projects are:
(i) Soil Nutrients, Biodiversity and Erosion. The nutrients in the soil (i. e. phosphorous, potassium, nitrogen, calcium, magnesium, sulfur, iron, copper, chlorine, manganese, boron, zinc, and molybdenum) are taken up by plants and returned to the soil when the plants die or recycled. Unplanned utilisation of biomass resources can affect these naturally-balanced nutrient cycles. This impact on soil fertility can be reduced by establishing the maximum percentage of the recovery of agricultural residues and forestry residues. An effective way of minimising soil nutrient depletion is by allowing the most nutrient-rich parts of the plant (e. g. small branches, twigs, and leaves) to decompose in the field (Kartha and Larson, 2000). It has been estimated that in the western region of the corn belt of the USA, complete residue removal could cause a 10% decrease in crop yields and soil degradation (ABA, 2003).
159

Bacteria, fungi, worms, insects are the fundamental component of the soil. They help to break down the organic material and provide nutrients to plants, and they condition the soil by improving aeration and drainage. Crop residue serves a range of functions:
* control water and wind erosion; act as a storehouse of nutrients; stabilise soil structure and improves its texture; reduce bulk density; enhance infiltration and moisture retention; and provide energy for micro-organism activity, an essential factor in soil fertility.
Soil loss tolerances (the maximum level of soil erosion that will permit a high level of crop productivity to be sustained economically and indefinitely) vary almost from field to field, according to topography, climate, and soil type and, not least, according to the use to which the land is put. Soil erosion is already associated with many forms of intensive agriculture, and there is a danger that the removal of crop residues will hasten the destabilisation of the soil. As soil deteriorates, its ability to retain water is also affected; it become more susceptible to erosion and to drought and needs increased irrigation.
Rainfall water either infiltrates the soil or flows over the soil as surface runoff. Density of crops residues and porosity of soil determine whether to infiltrate or runoff.
(ii) Climate Change. A biomass energy system generates positive environmental impact in terms of climate change. Climate change due to the CH4, C02, and N20is a growing concern worldwide. Capturing methane from landfills, waste water treatment, and manure lagoons prevents the methane from being vented to the atmosphere. The methane is used to generate electricity or power motor vehicles. The carbon dioxide released while burning biomass is absorbed by the next crop growing.
Release0f S02and NOx from the combustion causes the acid rain. Biomass has very little or no sulfur content and on the other hand co-firing of biomass is another way of reducing the sulfur emission in the atmosphere. Biomass energy utilisation also reduces the landfill pressure. Instead of land filling, biomass can utilise for power generation or for ethanol production.
(iii) Impact of Biomass Storage. The storage of harvested biomass may also pose environmental problems. Wood fuel piles may become a source of pollution if pile leach ate directly enters surface or underground waters. Also the odours may emanate from decaying biomass that has been collected and stored for future use.
(iv) Material use. Due to the conversion of dilute energy flows to useful energy flows, biomass energy systems require larger amounts of materials per unit of useful energy production compared to conventional fossil fuel systems (OECD, 1988). These materials demands impose negative environment, either due to their production process, toxicity or disposal (OECD, 1988).
9.3.1 Pollutants and Global Warming Potential
Biomass power plants generate solid, liquid, and gaseous effluents. Combustion and gasification electricity generation plant generates ash as solid waste; the amount of ash depends on the type of biomass. For gasification systems, the amount of ash varies
160

between 1% (wood) and 20% (rice husk) by weight of the original biomass (Stassen, 1995). The ash from biomass normally contains extremely low levels of hazardous elements (EPA, 2005b). However, it should be disposed off properly.
The term Global Warming Potential (GWP) is used to compare global warming impacts of emissions of different greenhouse gases. It is defined as the ratio of radiative forcing (both direct and indirect), from one kilogram of greenhouse gas to one kilogramOf C02 over a period of time (normally 100 years) (EPA, 2004) - see Table 9.3.
C02 from the biomass does not result in a net increase in atmospheric concentration because the plants absorb it during photosynthesis. It is estimated that biomass combustion contributes as much as 20-50% of global greenhouse gas emissions (Smith et al. 1998). In developing countries use of inefficient cooking stoves generate a considerable amount of non C02 GHG gases. Carbon emissions from biomass fuel account for more than 50% of the total carbon emissions in most developing countries in Asia. This figure ranges from 54% in Pakistan to 95% in Nepal, in the case of South Asia (see Table 9.4). If the GWP is used as an indicator of contributions to the global warming effect, biomass energy accounts around 60% of the total GWP in these countries (see Table 9.4). CI-14is very effective greenhouse gas.
GHG, Atmospheric Lifetime (Years)
GWPa
C02 50-200 1 CH4 12 ±3 21 N20 120 310 HFC-23 1.5-264 140-11,700 CF4 50,000 6,500 Us 10,000 9,200 C4Fjo 2,600 7,000 C6F14 3,200 7,400 SFe 3,200 23,900
1100 year Ume horlzon.
Table 9.3 Global warming potentials and atmospheric lifetime (EPA, 2005a)
Country Fuel - GHG emission T Total GWP (ktonne of C) I Ktonne of CI - %of counE:
Bangladesh Bio fuels 13283 16042 76 Fossil fuels 5040 5184 24
Bhutan Bio fuels 442 461 94 Fossil fuels 27 28 6
India Bio fuels 187047 225029 57 Fossil fuels 159600 166699 43
Nepal Bio fuels 5237 5433 95 Fossil fuels 272 312 5
Pakistan Bio fuels 18628 22829 54 Fossil fuels 18178 19524 46
Sri Lanka Bio fuels 3209 3136 70 Fossil fuels 1118 1353 30
Region total Blo fuels 230605 272929 59 Fossil fuels 184235 193100 1 41
Note: Assuming that 60% of all biomass fuels come from sustainable supply.
Table 9.4 GWP of energy use in South Asia (except Maldives) in 1990 (RWEDP and UNEP, 2000)
161

Global warming causes sea level rise to which Bangladesh is most vulnerable. Figure 9.2 shows a three dimensional view of the country with the coastline and major rivers and the impacts of potential future sea level rise at 1.5 meters. This scenario was estimated in 1989. At the present expected rates of sea level rise, this stage will occur in about 150 years (UNEP, 2005).
Biomass plants emit C02, N20, and S02 as gaseous wastes. Compared to fossil-fuel systems, one of the big advantages of a biomass gasification plant is that it produces no S02 (Castro, 1999). Biomass plants offer the benefit of reducing NOx, S02, and C02 emissions (see Table 9.5).
In the case of updraft and open core gasifier systems, large amount of liquid waste (tar and particulates) is produced if wet gas cleaning systems are used. Liquid effluents can lead to contaminate local drinking water and killing of fish. Liquid effluent would be significantly less in the case of downdraft and cross draft gasification plant with dry gas clean up systems (Stassen, 1995).
In the case of anaerobic digestion plant, as the slurry remains in the digester for some days in anaerobic condition, the effluent becomes pathogen free and the outputs are smell-free combustible gas and a high-quality organic fertilizer. Table 9.6 highlights some of the environmental impacts (both positive and negative) of the feasible biomass electricity technologies.
Pointial Impact of sea-level dse on BangMah
Today Total population: 112 Million Total land area: 134,000 km2
1.5 m- Impact Total population affected: 17 Million (15%)
Total land area affected: 22,0M ICIT12 (16%)
0. «..
'4%'
G1RIJI Ar, sd. I w.
Figure 9.2 Impact of sea level rise in Bangladesh (UNEP, 2005)
162

Technology and fuel Emissions (kq / MWhe) Comments so, NOx CO
Stoker boiler 0.036a 0.955" 5.545" Based on 23 boilers in California (except
>ý SOA CM S? Fluidized bed 0.036 0.4090
D 0.077 Based on 23 boilers (a 0 E boiler in California. 0 ib Energy crops 0.023 0.500-1.000 0.105 Combustor flue gas
gasificationc goes through scrubber before gas turbine.
Stoker boiler 9.182 2.636 1.227 (bituminous coal) Pulverized boiler 6.500 3.132 0.159
w0 Co-firing (50% 5.545 2.805 0.159 biomass + 50%
(D coal) Fluidized-bed 1.682 1.227 4.364 boiler Reciprocating 0.003 3.6W- 1.3 357
-1 -5.9 09
CO tM engine Ogd 17.4
-2 0 Gas turbine 0.004 0.782 0.182
W0 Combined cycle 0.002 0.414 0.027 Z gas turbine
a: biomass: wood residues; b: biomass not specified; c: poplar; d: depends on load and air/fuel ratio
Table 9.5 Direct air emissions of biomass and fossil fuel technology (Bain et al. 2003)
Technologies Environmental Impacts
Positive I Negative / Concerns
Anaerobic 0 Pathogen destruction Incomplete pathogen Digestion 0 Less air pollution than diesel destruction
generator Handling safety of human No CH4 emission, due to land filling. excreta and animal waste Improved sanitation Fire hazards of blogas Less S02 emissions Blogas leakage to atmosphere Effluent fertiliser value GHG emissions savings
Direct 0 Wider choice of biomass utilisation Ash disposal problem Combustion 0 Less S02
emissions Emission of particulate matter a GHG emissions savings Fire hazards
Gasification 0 Very low S02 production 0 Ash disposal problem 0 GHG emissions savings 0 Waste water treatment
0 Oleakage
Table 9.6 Impacts of the feasible conversion technologies
163

9.4 Greenhouse Gas Emissions Mitigation
Biomass can reduce the C02 levels in the atmosphere in two ways (Hall and House, 1995):
viL By growing biomass to absorb C02 emissions from the atmosphere. 4. Using the biomass as an energy source substitutes for fossil fuels.
Although biomass is a renewable energy source, some amount of fossil fuel is used for biomass production, harvesting, transportation, and other various processes before feeding it to the power plant. Fossil fuel is needed by farm machinery, irrigation pumps, harvesting equipment, transport truck/tractor, processing equipment, and waste disposal equipment. The amount of fossil fuel needed varies depending on the type of biomass fuel. Energy ratio is a term used to analyse the emissions and is defined as the ratio of the biomass energy produced divided by the energy of the fossil fuel consumed. This ratio is generally higher for purpose grown crops, but low or negligible for many agricultural or forestry residues (Kartha and Larson, 2000). During calculation of the net greenhouse gas emissions, the entire life cycle systems of biomass fuel and fossil fuel systems should be considered. Figure 9.3 shows maximum and minimum greenhouse gas emissions for different types of electricity generation technologies using either fossil-fuel or renewable-energy, considering the entire upstream and down- stream energy chains of the life cycle. Biomass electricity plants shows considerable amount of greenhouse gas emissions mitigation potential compared to traditional power plants (see Figure 9.3).
It is assumed that the biomass feedstock is carbon neutral, which means that the carbon released during its combustion balances the carbon extracted by photosynthesis during its growth. GHG emissions can be calculated as tonnes of carbon dioxide equivalents (TC02 eq. /year) or as tonnes of carbon equivalents (TC eq. /year).
1400
1200
1000
2
800
600 cr w
p4 400 0 0
200
a
1290 Cl Maximum val6e 1234 Miý'imumvalue--', -
890 860
689
410
75 30,
10 to Ii it
Coal Oil Gas Hydro Nuclear Wind Solar PV Biomass
Figure 9.3 GHG emissions for full energy chain (Rogner and Khan, 1998)
164

GHG emission is most commonly expressed as TC02 eq. /year, and is calculated as (Mathias and Lacrosse, 1999):
, GHG Emission in C02 Equiva ent' 7 '. N2Q Emission x GW
L.,.
-, -,.,., -C02. EmissiOn.: tý-Pý. ý4Emission x,,, GWP 4t F-of N2Q
Greenhouse gas emissions mainly depend on: type of technology, type of fuel and efficiency of conversion technology. Table 9.7 shows the greenhouse gas emissions of the different types of electricity generation systems.
9.5 Greenhouse Gas Emissions Mitigation Potential: Case Study
Diesel generator has been used as a reference technology to estimate the green house gas savings potential. Biomass electricity technologies considered are: gasification, anaerobic digestion and direct combustion. Yearly greenhouse gas emission mitigation potential was calculated using the published C02 eq. emissions data of diesel and biomass electricity generation technologies.
Experimental results of the greenhouse gas data were not available for a wide range of efficiency and fuel choice. Greenhouse gas emissions mitigation potential was calculated by subtracting the emission of the proposed biomass electricity system from the emission of reference diesel-fuelled electricity generation system.
Electricity generation Conversion Total GHG References technology" efficiency emission
M (TC02
eq. /MWhe) Biomass gasifier and gas 45.0 0.060 Kartha and Larson (2000)
C: turbine (12%) cc
US 0. Biogas digester and diesel 20.0 0.220 Kartha and Larson (2000) ca generator (with 15% diesel) E 0 Biomass direct combustion 33.0 0.100 Kartha and Larson (2000)
and steam cycle (12%) 0) MSW gasification (15%) 27.2 0.115 Murphy and McKeogh (2004)
MSW incineration (15%) 15.3 0.220 Murphy and McKeogh (2004) Diesel generator 18.0 1.320 Kartha and Larson (2000)
30.0 0.903 ReTScreen (2005) Diesel generator D 30.0-50.0 0.651 EPA (2002b)
cc CL Coal fired combustion 22.0 1.000 Kartha and Larson (2000) 75 - 0.890 Murphy et al. (2004)
0.940 APPEA (2004)
U) Oil fired power plants - 0.720 Murphy et al. (2004) U) 0 Natural gas fired 25.0 -45.0 0.625 EPA (2002b) LL engine-generator
Natural gas combined cycle 35.0 0.410 Kartha and Larson (2000) 0.450 APPEA (2004)
a: bracketed figures are for biomass energy ratio; b: with catalytic converter
Table 9.7 Emission factors of the biomass and fossil fuel based electricity-generation technologies
165

If the cost of the biomass electricity generation is higher than cost of electricity generation of the diesel generator, then the amount of the greenhouse gas emissions saved can be expressed in terms of costs, which can be calculated as: Cost of greenhouse gas emission mitigation (US$/TC02 eq. ) = [CoE of biomass electricity systems (US$/MWh, ) - CoE of diesel generator systems (US$/MWh, )] [greenhouse gas emissions avoided (TC02 eq. /MWh, )]
Electrical efficiency of the diesel generators is around 35% (see Chapter 6). So, greenhouse gas emissions of diesel generator based electricity generation (reference system) has been assumed 0.9030 TC02 eq. /MWh,,, as closest available data (see Table 9.7). Greenhouse gas emissions of gasification, anaerobic digestion and direct combustion based biomass electricity generation systems have been estimated as 0.060,0.220 and 0.100 TC02 eq. /MWh, (see Table 9.7). As a case study, Khagrachad district has been selected for different types of electricity generation technologies, to estimate greenhouse gas emissions savings potential. Due to non-avai lability of data, the greenhouse gas emissions data of 0.220 TC02 eq. /MWh. has been used for pure biogas-based electricity generation system as well. Greenhouse gas emissions savings potential has been estimated for all 64 districts - see Appendix B and Appendix E.
The default parameters (i. e. number of the operating hour, capacity of the biomass electricity plant and cost of electricity generation for both biomass electricity and diesel generator) were reported and calculated in the previous chapters of this study. In Bangladesh, cost of direct combustion based biomass electricity generation is higher than cost of electricity generation by diesel generator (see Chapter 8). So, cost of emission mitigation potential has been calculated only for the direct combustion-based technology in Bangladesh. Agricultural wastes and forestry residues have been used as biomass fuel either for gasification or direct combustion-based electricity generation technologies. On the other hand, animal wastes and poultry droppings are used for anaerobic digestion-based electricity generation technology.
Gasification-based biomass electricity plant proves maximum amount of emissions avoided followed by direct combustion and anaerobic digestion-based biomass electricity generation systems (see Table 9.8). Moreover, in Khagrachari district, gasification-based plant shows the highest greenhouse gas savings potential, compared to anaerobic digestion and direct combustion based plant (see Table 9.8). District wise greenhouse gas savings potential has been estimated for each type of feasible technology - see Appendix B. Cost of emissions mitigation of the direct combustion-based biomass electricity plant has been calculated as US$ 27.77/ TC02 eq. (see Table 9.8). Mitigation cost can be used as a support to justify the installation of the direct combustion-based biomass electricity plant.
166

A=
c: o
'= U)
E
IT " a)
CD 00 C')
C) M 0 0) C5
(D 0 c) - 6
0 M 0 00 C5
CN
0 NT
ýT 00 6 ý: f C\I ce)
- C) ý)
. CD
V, C\j N 7 o
rý r-
C-4
0
M >
Tn 0 (1) m
C: 2
c) It co
0 CO co
0 M CD 0) 6
0 C) C'i (14 6
0 M co (D C5
It CI)
Cý CS U. )
C) - 6
cj CS
(0 CO CD C)
C) (0 co C: )
c 0
'Z-Z
(3) N 00
0 00 CI)
0 ce) C) cy) 6
CD CD (D c) 6
C) CI) 11, co C5
04 CD
ce) (c)
LO 0)
(o C5
CY) 0 o 7 c)
(D 00 'ýt CD
(Y) CY)
co
'E m Q)
"
0 0 F-
a- N
0 0 ý-
cr "
0 0 ý-
m
2
07
(1) C, 4
ý--
3: ý. c
c/ ::
))
3: -ýc
C/) :D
0
0 i-
C/ Z))
0) 0 0
-
0
C:
E, =)
t5 7FD
" (D a
CD
Zý -
0
CY) 0 -d
(D
a:
2 (1) E m (D Cj-
a >1
t (1) -5 C/) U)
E 0 n a)
0
_0 ý?
0
ýý C: 0
76 (1) a C) o
D o
0 - E z 73
. -
U) U) 0
(1) L) C: (1) 2 a) " 0
U) c
V)
(D 0) (1) U) D 0
E .2 -0 -o
o 8- o - 0
cn c
U)
co 0) (D U) =) 0
I < - il
-0 a) .0 - 0 > cu
c
cn
(10 0) a) (/) :3 0 = c
ýý 11
C: m -a a) =
c)
.0
c a) o) >1 0) - 41) C: (D
0
11
a -
(, ) 'C'
> (D V)
.0
cn c -
- (1) co 0)
(1) :D o
(1) a) - cn
0
0) o 75 C: I-- (-) Q)
-
I,, ) -0 CL)
a)
= :ý 0
w 0
L) 2 >1
: tf C. ) C-- -(. 5 a)
(I)
cu E .0 - n -0
0 c- 0-
= Z 0
Lu 0
C: 0 -Z5 0)
z_- - E c 0
cQ E (1) cu , CD (D cf) :3 0 = ac): 0)
o
0
cn U) 0
0
E C: 0 U) E a) cn
cn =3 0
_r_ C:
0)
CL U)
0
cu
E c 0 U) . U) E
Q) U) m 0
co
n
r-

9.6 Socio-economic Impacts: Introduction and Methodology
The objective of the socio-economic impact studies (SIS) is to examine the local, regional and national implications of a proposed project. Social impact analysis deals with the impacts of the proposed project on employment, health, education, security, urbanisation and standard of living. And economic impact analysis means - any contribution of the proposed project for financial benefits. Impacts analysis of the proposed project on income level, business activities, agricultural production and migration are examples of economic impact analysis. Through SIS, it is possible to predict the unwanted impacts of a proposed development in time to allow these to be avoided or adjusted. SIS is not a one time task, it is repeated regularly. SIS results may be classified as primary, secondary and tertiary impacts (see Figure 9.4). These impacts are interconnected.
Both the primary and secondary impacts generate tertiary impacts independently. Creation of new business activities due to increased income is an example of tertiary impact. New business activity creates more jobs and improves the standard of living. As a result, tertiary impact adds the primary and secondary impacts. The different stages of performing socio-economic impact studies (SIS) are (Barrow, 2000):
%; L Scopinci. This involves establishing the terms of reference, boundaries of study, and timeframe for completion/repetition of assessment, the budget, and the team. Seeking cooperation from the public to provide data is an important task in this stage.
'-'L Problem Identification. This stage is related to the identification of the impacted social groups/stakeholders.
4, Establish Alternatives. Deals with the development of the reasonable alternatives to the proposal based on the requirements of the society. Public meetings, questionnaires, and public data sources are the techniques which might be used to find out these alternatives.
Project Development
Changes in Socio-economic Structure: new employment; new technology; rising incomes;
population change
Changes in Local Living Conditions: inflation; new opportunities; health changes
Human Responses to Change (by individuals, groups and organisations): some reactive,
some proactive; some negative, some positive
Primary Impact
Secondary Impact
i
Tertiary Impact
I
Figure 9.4 Conceptual framework of social impact studies (Barrow, 2000)
168

Profiling and Proiection, Determination of what is likely to be impacted and who is affected (for proposed and alternative projects).
94ý Assessment. Determination of the magnitude of the impacts and ranking the impacts according to importance and how people will react.
, ýL Evaluation. Deals with rechecking the impacted group's concern and needs. In this stage, attempts are taken to establish indirect and cumulative impacts which are most likely to be effective.
-4. Mitigation. This stage deals with identifying the possible mitigation/adaptation. Measures to counter the unwanted impacts, which are identified.
-4. Management and Monitoring. The activities are: to adjust procedures and review the objectives, monitoring, decide when and how to conduct the next SIS and to check how accurate this SIS has been.
9.7 Socio-economic Benefits of Biomass Energy Activities
Local biomass energy impacts vary and depend mainly on: the technology, local economic structures and social profiles. Examples of the local economic structures are: income level and local infrastructures (e. g. number of schools, roads facilities and small industry). On the other hand, local social profile means the local employment opportunities, education, healthcare and migration attitude of the local population. Contributions of the biomass energy activities from the macro-economic point of view are (Domac et al. 2005):
, 4. Economic growth through business expansion or employment -ýL Import substitution of the fossil fuel (has a direct and indirect effects on GDP) 4. Efficiency improvements ,;; L Security of energy supply and diversification.
Since electricity is considered as a basic input of modern life, providing electricity to a non-electrified area has many positive socio-economic impacts. Some of the benefits in developing countries are:
4. Employment Creation. Electricity generation plant installation, operation creates direct employment. Some indirect and induced employments are also generated due to the establishment of new industries and other development activities.
4. Improved Health Care. Due to the supply of the electricity, the activities in a rural clinic, such as operating refrigerators and other medical equipments, and running the operation theatre, would lead to the improved heath care services. Electricity supply would also help running clinical service for longer hours to the benefit of rural people. Due to the supply of electricity, rural people can save fossil fuels (mainly kerosene) which are'used in lamps. Reduction of fossil fuel utilisation helps to reduce the indoor air emissions.
'4- Increased Literacy Rate. Supply of electricity helps to set up evening schools for illiterate adults who are at work during the day time. On the other hand, electricity helps to increase study habit, which has very positive effects on the future citizens of the rural population.
-4. Creation of Small Industries. Electricity supply helps to build small industries: agro- based or cottage industry. These industries create employment opportunity.
169

4. Higher Standard of Living and Access to Information. Electricity supply helps households to enjoy the benefits of having necessary electrical appliances (TV, cassette player, fans, and refrigerators). Rural people can access the information quickly through TV, satellite and internet. Information about weather is very important where floods, cyclones are very common in Bangladesh.
'4ý Urbanisation. Due to the supply of the electricity govern ment/private organizations would come forward to invest in various development projects aimed at poverty alleviation and human development. Establishment of different development projects improves the rural infrastructures as well. Migration to cities from rural area would reduce due to employment creation and better standard of living.
4. Increased Agricultural Production. Electricity supply helps to run deep-well pumps, which increases the agricultural production.
. 4. Women's Empowerment. Provision of electricity saves time for women to do extra work (e. g. weaving and sewing projects, poultry farming and by operating small shops) after finishing their household duties, which adds to family earnings. This also reduces the health hazards due to indoor air pollution.
, A. Increased Time for Local Business Activi . Shops, restaurants can open for a longer hours - which helps to increase the business activities.
0& Improvement of Security. Electricity helps to improve the security situation of the rural area.
-; L Energy Security/Self Reliance. Local community could become self reliant with respect to electricity. Use of bioelectricity would save diesel and kerosene, which would lead to the reduction of oil imports and promotion of self reliance at national level.
Employment is a function of biomass energy activities, and depends on (Domac et aL 2005): stages of the biomass energy system cycle and whether the system is labour- intensive or mechanized. Employment created by biomass energy activities are (IEA Bioenergy, 2003a): 4. Direct Employment. Employment creation due to biomass production and
transportation, plant construction, operation and maintenance.
-ýL Indirect Employmen . Jobs generated within the economy as a result of expenditures related to biomass fuel cycles. Indirect employment results from supporting and service industries.
4. Induced Employmen . Higher purchasing power due to increased earnings from direct and indirect employment may also create opportunities for secondary jobs.
Employment creation is one of the main elements for rural development. Use of biomass fuel creates more employment than using fossil fuel (see Table 9.9). Estimated employment due to biomass energy activities in some of the developing countries is shown in Table 9.10. Employment creation in biomass energy involves relatively low investment costs. Studies carried out in Brazil showed that biomass energy industries require an investment of between US$15000 and US$100000 per job generated, compared with about US$800000 per job in the petrochemical industry and over US$1 0 million per job for hydropower (see Table 9.11).
170

Type of fuel Amount of Employment' per TJ of fuel per TJ energy ( person-days)
Kerosene b 29 klitre 10 LPG
b 22 tonnes 10- 20
Coalc 43 tonnes 20- 40 ElectriCityd 228 MWh 80-110 Fuelwood' 62 tonnes 110-170 Charcoale 33 tonnes 200-350
a Employment covers growing, production, extraction, transmission, maintenance, distribution and sales. It excludes employment generated outside the country for fuels that are imported.
b Assuming that crude oil, kerosene and LPG are imported. c Varies on capital investment, energy value of the coal and the distance from demand centres. d Depends on production method, conversion efficiency, transmission and distribution. e Depends on the productivity of the site, efficiency of producers and distance from the market.
Table 9.9 Estimated employments by different fuel type (RWEDP, 2002b)
Country Estimated employment Nature of employment (person-years)
Pakistan 600,000 Whole sellers and retailers in the wood fuel trade. Involved in production, conversion and transportation. About three quarters are full time and the rest are part time.
India 3 to 4 million 700,000 households
Philippines (production) and Biomass energy production and trade. 140,000 (trade)
Brazil 800,000 Ethanol industry. 200,000 Charcoal industry.
Kenya and 30,000 Charcoal production only. Cameroon Ivory Coast 90,000 Charcoal production only.
Table 9.10 Estimated employments in biomass energy sector in some developing countries (lEA Bioenergy, 2003a)
Area of employment creation Investment cost required for employment creation (in 103 US$ / per employment)
Tree planting for electricity production 15-100 Ethanol production from agro based industry
12- 22
Petrochemical industry 800 Hydropower 10000
Table 9.11 Investment cost of employment in different energy sectors: north - eastern Brazil (Carpentieri et al. 1993)
171

9.8 Socio-economic Impact: Evaluation and Case Study
Socio-economic aspects of biomass energy system are diverse and are particularly important for formulating and implementing programs and projects at local level. Selected assessment criteria for evaluating the socio-economic impacts of a biomass energy projects is shown in Table 9.12 in four broad categories.
Ranking and scoring the socio-economic indicators or parameters are very important to compare the socio-economic impacts of different projects. lEA Bio-energy Task 29 member countries identified some socio-economic variables and scored those variables for estimating the importance on a scale from 1-high to 10-low (see Table 9.13). The importance factors of the socio-economic parameters were estimated based on the expert's comments of the member countries (Madlener and Myles, 2000).
Category Impact Quantitative indicators / Assessment criterion Basic needs Improved access to basic Families with access to energy services (cooking fuel,
services pumped water, electric lighting, milling, etc. ), quality, reliability, accessibility and cost.
Income Creation or displacement of Volume of industry and small-scale enterprise promoted, generating jobs, livelihoods. jobs/US$ invested, jobS/M2 used, salaries, seasonality, opportunities accessibility to local laborers, local recycling of revenue
(though wages, local expenditures, taxes), development of markets for local farm and non-farm products.
Gender or Impacts on labor, power, Relative access to outputs of biomass energy project. woman's access to resources. Decision making responsibility both within and outside of participation biomass energy project. Access to resources relating to
biomass energy activities. Land use Changing patterns of land Recent ownership patterns and trends (consolidation or competition ownership. Altered access to distribution of land holdings, privatization, common and land common land resources. enclosures, transferal of land rights/tree rights). Price tenure Emerging local and effects on alternate products. Simultaneous land uses
macroeconomic competition (co-production of biomass fuel, fodder and food). with other land uses.
Table 9.12 Selected indicators of socio-economic sustainability (Kartha and Larson, 2000)
Socio-Economic Variables Importance Factor
A. Employment created 1.6 4. Activity created 2.3 4. Economic gain 2.6 4. Increased incomes 3.1 4. Return on investment 3.1 4, Replication potential 3.9 4. Avoided unemployment 2.0 4. Support of related industries 4.3 4. Education 4.6 4. Health 5.9 4. Poverty alleviation 5.0 4. Conventional energy displaced 3.3 4. Stimulation of LFA 2.9 4. Rural diversification 4.4 4. Rural depopulation 3.9 4. Land management 4.9 4 Quality of life -
Table 9.13 Ranking of socio-economic variables (Madlener and Myles, 2000)
172

In this research study, no survey/field study was carried out to assess the socio- economic impacts of a biomass electricity plant. Some studies were carried in India. Socio-economic situation of the rural or remote area in India is almost identical to those is similar areas in Bangladesh. So, it is expected that the results of the socio-economic impact study of biomass electricity project found in India would almost be similar if the study is carried out in Bangladesh. The biomass electricity projects and results of the socio-economic impact studies carried out in India are:
(1) Gasification based power plant in Choftomollakhall Island of Sunderbans. West Bengal, India (Mukhopadhayah, 2004):
A 500 kW (4x125 kW) biomass gasification based power plant (set up by West Bengal Renewable Energy Development Agency, India) was installed to supply the electricity to four villages of Chottomollakhali Island and serving 225 household, commercial and industrial consumers. Households were completely dependent on kerosene and in very rare cases on solar power, whereas commercial units were dependant on power supply from privately owned few 10 kW diesel power generator sets. After the installation of the gasification plant, consumption of the kerosene and diesel fuel decreased significantly (see Table 9.14).
In post-gasifier period, commercial units as well as households benefited directly or indirectly. Some indirect benefits found were:
4, Household Sector. It was observed that some of the households could afford to buy durable consumer goods (e. g. radio, T. V. and electric iron) with the savings generated due to the operation of the gasification plant (see Table 9.14). Households were aware of children's comfort and enhancement of study hours. With gasifier power available up to 11: 00 PM, usual household activities like watching T. V, and other socialisation activities had increased. The households were demanding longer hours of service from the gasification plant for getting more socio-economic benefits.
V4. Commercial Sector. Business hours extended beyond 6: 30 PM or even 7: 00 PM (see Table 9.14), which was the standard closing time for the pre-gasifier period. Cheaper gasifier power had in turn increased power consumption through purchase and use of large number of lighting appliances reflected through their demand for a larger number of connected points compared with pre-gasifier scenario (see Table 9.14).
(11) Gasification based power plant in Gosaba island of Sunderbans, Wes Bengal. India (Ghosh et al. (2004):
A 500 kW (5 x 100 kW) biomass gasifier based power plant was installed in Gosaba island of Sundarbans, in July 1997, for electrification of five villages with more than 10000 inhabitants. Significant amount of the fossil fuel was saved due to the implementation of the project (see Table 9.15). It was also observed that the annual growth rate of commercial establishments increased from 1.8% in 1995 -1996 to 7.2% in 1998 -1999. The total number of direct and indirect employment generation was estimated at 300. The employment includes trade, transport, and operation and maintenance of the power plant.
173

Sources of power Consumer Commercial Household
_Fuel use for lighting Pre-Gasifier Post-Gasifier Pre-Gasifier Post-Gasifier
Kerosene None None 83 None Diesel plant 100 None None None
I Solar None None 17 None I Gasifier plant None 100 None 100
(a) Fossil fuel savings in post-gasifier regime
Consumer category Tariff rate of gasifier power per unit of consumption
(US$in2002)'"',, ý'-.
Total monthly savings in electricity bills (US$ in 2002)
Household 0.08 1.02-6.14 Commercial 0.09 0.50-4.48 Industry 0.10
(b) Electricity tariff structure and monthly savings in post-gasifier regime
Savings in monthly expenditure (US$ in 2002)
Number of units reporting, % in sample
0.02-1.02 9 18 1.02-2.04 10 20 2.04-3.07 15 30 3.07-4.09 9 18 4.09 and above 7 14
Increase in business hours (hrs)
Nil 1 2 <1 6 12 1-2 32 64 >2 11 22
Electricity Connection points (nos. )
Pre -gasifier Post -gasifier Pre -gasifier, Post -gasifier
1-4 45 12 90 24 5-10 5 35 10 70 >10 3
(c) Benefits of commercial units in post-gasifier regime
Table 9.14 Socio-economic impacts of biomass electricity in Sundarbans, India (Mukhopadhayah, 2004)
Energy consumption
Before installation of the power plant,
After installation of the power lant
Cooking Lighting Total I 'iCookinig, ý', 'Lighting Total
Gross (MJ) 7163 566 7729 6583 376 6959
Effective (MJ) 1
893 14 907 937 32 969
Table 9.15 Per capita annual energy consumption before and after installation of the biomass power plant (Ghosh et al. 2004)
174

9.9 Conclusions
The inefficient use of biomass causes dangerous indoor air pollution. Indoor air pollution is responsible for 2.7% of the global burden of diseases. Promoting clean and efficient biomass technologies is an effective measure in the battle against indoor air pollution and greenhouse gas emissions.
Environmental and social impact assessments of biomass electricity projects are very important and may lead to the modification of proposed scenarios or the development of new ones. Biomass energy systems have both positive and negative impacts. The environmental impacts of biomass energy systems on soil nutrition and erosion and climate change have been discussed in this chapter. The impacts of biomass storage and material use, on the environment have also been reviewed.
Biomass electricity generation systems produce solid, liquid, and gaseous effluents. Impacts of these effluents on environment have been presented and compared with the impacts of fossil-fuel based electricity generation plants. Combustion and gasification plants generate ash as a solid waste. The amount of ash generation depends on the type of biomass used. The ash from biomass normally contains extremely low levels of hazardous elements (EPA, 2005b). Compared with fossil-fuel electricity generation plants, biomass schemes offer the benefit of reducing NO., S02, and C02 emissions. One of the important advantages of biomass electricity plants is the very low amount of S02 emissions. S02 emissions increase the risk of acid rain. Effluents from biogas digesters are used as fertilizer in aqua-culture, mushroom production and seeds fermentation (see Chapter 6). Digester effluent should be pathogen free and effluent treatment at an elevated temperature would help in pathogen destruction. Also, the release of biogas would add to GHG emissions, this also increases the risk of fire hazards.
Up-draft gasification systems produce tar and particulates. The use of wet gas cleaning may lead to contamination of local surface water resources. Liquid effluent would be less in the case of downdraft and cross-draft gasification plant with dry gas clean up systems.
The greenhouse gas emissions savings potential as a result of the employment of the biomass electricity plant instead of the diesel generator plant was calculated. Amongst all options of biomass electricity generation in Bangladesh, gasification technology shows the highest reduction in GHG emissions. Implementation of biomass electricity projects would reduce the use of fossil fuel for lighting, which indirectly reduces greenhouse gas emissions. Therefore, biomass electricity generation presents significant amount of environmental and health benefits in Bangladesh.
Assessment criteria for evaluating the socio-economic impacts of biomass energy projects have been reviewed in the second part of this chapter. Biomass energy systems present many socio-economic benefits. Biomass energy activities create more employment and involve relatively low investment costs per employment, compared with many fossil fuel systems. Biomass energy systems can play an important role of a country's or region's development, i. e. education, employment and economic growth through business expansion, direct and indirect effects on GDP, support of traditional industries, rural diversification, and community empowerment.
175

CHAPTER 10 CONCLUSIONS AND RECOMMENDATIONS
10.1 Conclusions Electricity is a pre-requisite for technological progress and economic growth. Bangladesh has been facing a power crisis for about a decade, mainly because of inadequate power generation capacity compared with demand and aging infrastructures of many existing power generation facilities. Currently, power generation in the country is almost entirely dependent on natural gas. At the current annual rate of growth of consumption of 10%, the national proven reserve of natural gas may not last more than 15-20 years (Bhuiyan et al. 2000). Electricity supply to low-load rural areas is characterised by high transmission and distribution costs and transmission losses, and subsidised pricing.
In this study, a review of the country's primary energy reserves, production and consumption; electricity generation and consumption; and renewable energy utilisation have been carried out (see Chapter 2). GOB has recognised the importance of renewable energy in its 'Energy Planning Programme' and the drafting of the 'Renewable Energy Policy' (MOEM, 2002). Solar and wind energy in Bangladesh are characterised as high investment cost, seasonal and site dependent (see Chapter 2). Biomass is a major energy source in Bangladesh, which can be used for decentralised electricity generation. Worldwide, biomass-to-electricity generation has gained importance due to employment opportunity, reduction of reliance on fossil fuels and positive environmental benefits.
This research work is aimed at developing a sustainable biomass electricity generation model, especially in rural and remote areas of Bangladesh, the first of its kind in the country. The main contributions of this research work are:
4. Development of methodology to estimate the national and district wise amount of biomass availability for electricity generation in Bangladesh, and estimation of national and district wise biomass energy potential.
-'L Review of biomass energy models available in the literature to understand the modelling techniques used and decide the appropriate techniques needed for modelling biomass electricity in Bangladesh.
4. Identification of the technically feasible biomass electricity generation technologies for small- to medium-scale electricity generation in Bangladesh.
'-1L Development of correlations for efficiency and capital investment costs of these feasible technologies as functions of the electricity generation capacity.
4. Application of the optimisation techniques to estimate the optimal area of biomass collection and plant sizes, for all types of feasible technologies.
"L Development of methodology to analyse district-wise biomass electricity plant economics and comparison with diesel and dual-fuelled electricity generation plant.
4. Analysis of environmental and social impacts of biomass electricity in the context of Bangladesh.
176

Biomass energy systems models found in the literature have been studied and grouped based on the basic energy modelling techniques (see Section 4.2.1). Madlener and Myles (2000) reviewed the biomass energy models, but did not concentrate on grouping. This study revealed that the techniques used for biomass energy modelling are of four categories: econometric, optimisation, GIS and hybrid techniques (i. e. combination of more than one technique) (see Section 4.2.1). Furthermore, it has been found that biomass electricity modelling is country or region dependent, and there is no universal tool to model the biomass electricity generation of a country. Plant size and techno-economic analysis are two main issues dealt with in most of the developed biomass electricity models (see Section 4.2.1). It has been concluded that a hybrid type model, which is a combination of optimisation and techno-econometric techniques, is needed for developing biomass electricity model for Bangladesh (see Section 4.4).
In previous studies, only estimation of national total biomass generation rates (Koopmans and Koppejan, 1997; and Koopmans, 1998) and national total generation and recovery rates (Hossain, 2001) were carried out. Not all the recoverable biomass is available for electricity generation. Biomass is utilised in the country mainly as fuel for domestic cooking, and for generating process heat in industrial and commercial activities. Estimation of the national and district wise biomass availability is important for developing sustainable biomass electricity model. Some biomass resources are seasonal (see Section 5.8). This study developed a methodology to estimate both national and district-wise biomass generation, recovery and availability rates (both annual, seasonal or monthly) for electricity generation in Bangladesh. The study indicates that in 2003, the national total annual generation and recoverable rates of biomass in Bangladesh were 148.983 and 86.276 million tonnes, respectively (see Section 5.4). Of the total recoverable amount, agricultural residues represent 48.7%, followed by a 23.9% contribution from animal wastes and poultry droppings. In energy terms, the national annual amount of the recoverable biomass is equivalent to 312.596 TWh (see Section 5.4). Considering the present national consumption of biomass, the total available biomass resources for electricity generation vary from 183.848 to 223.776 TWh (see Section 5.6.1). The results obtained show that all districts, with the exception of Dhaka, has considerable amount of available resources of animal waste, poultry waste, IVISW and human excreta. Currently, not all the districts have the potential to utilise agricultural wastes and forestry residues for electricity generation. However, with the implementation of the ongoing improved stoves installation programme of the GOB and utilisation of energy efficient devices, it is expected that most districts will have a considerable amount of agricultural wastes and forestry residues available for electricity generation. In 2003, amongst all districts, Serajganj had the highest total biomass availability potential of 32.861 TWh; followed by Pabna with 29.215 TWh potential (see Section 5.6.2).
Selecting the appropriate technology is very important for biomass-based electricity generation in Bangladesh. In this work, the feasible technologies identified for Bangladesh are: gasification-based ICE-generator, anaerobic digestion-based ICE- generator, and direct combustion-based steam turbine or Stirling-engine generator (see Section 6.7). No well established correlations of capital investment costs and overall energy conversion efficiency, for the above types of feasible technologies for small to medium-scale electricity generation, are available in the literature. The general trend of the capital investment cost is that it decreases with the capacity of the plant. The overall electrical efficiency, however, increases with the capacity of the plant. This trend continues up to a certain capacity, after which the investment cost and electrical efficiency remain almost unchanged. Available published data were employed to develop correlations for the capital investment cost and overall conversion efficiency as
177

functions of the plant capacity (see Section 6.2.5,6.3.6,6.4.4 and 6.6.2). These correlations have been used for the economic analysis. Electricity generation potential have been estimated for each feasible technology considered. The results indicate that, in Bangladesh, the highest amount of electricity can be generated using the direct combustion-based biomass electricity generation technology, followed by the gasification-based technology (see Section 6.5.2).
In this study, optimisation techniques have been used for estimating the biomass collection area and plant size, for each feasible technology for electricity generation (see Chapter 7). Earlier studies (Fiala et al., 1997; Kumar et al., 2003; Krukanont and Prasertsan, 2003; and Krukanont and Prasertsan, 2004) used optimisation techniques only for specific conversion technologies (i. e. direct combustion and co-generation). Equations for economic radius of biomass collection and economic size of the biomass electricity plant have been derived for maximising the profitability index of the plant (see Section 7.4.1). The economic plant size increases with the biomass availability density (see Section 7.5.3). The results obtained demonstrate that the economic plant sizes estimated match plant sizes of small- to medium-scale biomass electricity generation plants installed in the developing countries (see Section 7.5.3 and Appendices D and E).
Based on the economic size, the biomass electricity plant economics have been assessed by employing a developed systematic methodology. The estimated economic parameters were compared with those for diesel and dual-fuelled (producer gas/biogas and diesel) electricity generation plant (see Chapter 8). Average availability of the agricultural residues has been used in economical analysis by considering storage facilities. The impact of the biomass storage facilities has also been studied (see Section 5.8.2). The analysis shows that in Bangladesh, biomass electricity is economically viable for two technologies: gasification and anaerobic digestion with an ICE-driven generator (see Section 8.6.4). Although, the electricity generation potential is highest for the direct combustion technology, due to high capital investment cost, the cost of electricity generation by direct combustion of biomass is higher than the cost of electricity generation by the employment of a diesel generator with the same electricity generation capacity (see Section 8.6.4).
Biomass electricity economics vary from one district to another, mainly due to the variation in types of biomass, biomass availability density and economic size of the biomass electricity plant (see Appendices E and F). Dual-fuelled biomass electricity plant has the main advantage of switching to full diesel or full biomass operation as needed. In the case of any malfunctioning of the gasifier (or digester) or shortages of biomass, the plant can be operated in a full diesel mode of operation. As a case study, for the Khagrachari district, it has been demonstrated that cost of electricity generation is cheaper, PBP is less and PI is higher for gasification based dual-fuelled electricity generation plant compared with anaerobic digestion based dual-fuelled electricity generation plant (see Section 8.6). So, from the reliability, economical and environmental point of view, gasification-based dual-fuelled biomass electricity plant is the first choice for the Khagrachari district (see Section 8.6).
The GOB provides a considerable subsidy to the electricity-generation sector. The tariff rate of electricity is much lower than the actual cost of the electricity supplied. The estimated selling price of the electricity generated from the biomass plant is reasonable and competitive with the grid electricity (see Section 8.6.1). The use of biomass for decentralised electricity generation in Bangladesh would help in reducing this subsidy significantly. Also, utilisation of biomass fuel for electricity generation would decrease
178

the money spent for importing the fossil fuels. Reduction in subsidy and import of fossil fuels would help to increase the GDP growth rate of the country.
Sensitivity analyses were carried out in Sections 8.7 and 8.8 to assess the impacts of possible changes in the values of a number of parameters on the CoE and PI for gasification-based biomass electricity plants. It was observed that the price of biomass and selling price of electricity has the highest impacts on the cost of electricity generation and profitability index, respectively, for both producer gas-fuelled and dual- fuelled electricity generation plant (see Section 8.7). Conversion efficiency followed by the capital investment cost stand as the second and third most influential parameters affecting the cost of electricity generation for a producer gas electricity generation plant. In the case of dual-fuelled electricity generation plant, parameters having the highest influence on the cost of electricity generation are the conversion efficiency, price of diesel and capital investment cost (see Section 8.7). Parameters having the most considerable impacts on profitability index (PI) are the capital investment cost, price of biomass (plus diesel for duel-fuelled plant), plant lifetime, conversion efficiency and operating hours (see Section 8.7). The sensitivity analysis proved that in case of possible worst scenario, gasification-based biomass electricity generation in Bangladesh is economically feasible (see section 8.7).
Promoting clean and efficient biomass technologies is an effective measure in the battle against greenhouse gas emissions. The inefficient use of biomass causes dangerous indoor air pollution in the country (see Section 9.1). Results proved that the biomass electricity plant reduces the greenhouse gas emissions significantly in comparison with diesel-based electricity generation (see Section 9.5). Of all the feasible technologies, gasification shows the highest greenhouse gas emissions savings potential (see Section 9.5). The use of biomass electricity reduces the use of fossil fuel for lighting, which indirectly reduces greenhouse gas emissions. So, implementation of biomass electricity generation would provide significant amount of environmental and health benefits in Bangladesh.
Impact analysis proved that a biomass electricity plant produces many positive social impacts, such as employment creation, increased literacy rate, improved health, energy security, higher standard of living, reduced migration and urbanisation (see Section 9.7). Supply of electricity in a non-electrified area helps to establish small-scale industries and increases agricultural production through the use of deep-well pumps driven by electricity. Increase in the agricultural production and setting up of new small- scale industries would help to increase the GDP growth rate of the country.
In Bangladesh, small- to medium-scale biomass electricity plants present a good prospect for supplying electricity economically and sustainably to rural and remote areas of the country. Biomass gasification based ICE-generator plant is recommended technology due to the high electricity generation potential and related economic and environmental advantages (see Sections 6.5.2,8.6.4 and 9.5). A computer program have been composed for district-wise sustainable biomass electricity analysis in 2003 (see Appendix B).
GOB has no plan of connecting all the homes in remote villages and isolated areas, business centres and other establishments to grid system in the near future. Implementation of biomass electricity plant would make a significant contribution towards the achievement of the government target of total electrification of the country by the year 2020.
179

10.2 Recommendations for Future Work
District-wise biomass consumption rate data for Bangladesh is not available. In this study, it was assumed that the pattern of consumption in individual districts mirrors the national average rate (see Section 5.6.2). Studies are needed to investigate the district- wise biomass consumption for a more accurate estimation of the corresponding biomass availability.
GIS database of each district is essential for selecting the appropriate sites for installing the biomass electricity plants. GIS database would also help to estimate the local electricity demand. Currently, LGED is working to develop the GIS database of each district. Future studies are recommended to add GIS database in the model developed in the current work.
Biomass electricity systems generates some hazardous liquid and solid wastes, which needs close monitoring or special treatment in certain cases before landfilling or disposal. In this study, waste disposal or waste handling techniques were not discussed and so the costs related to the disposal of wastes produced by the biomass electricity systems disposal have not been considered in assessing plant economics. Future studies are needed to investigate this issue in the context of Bangladesh.
Potential renewable energy sources of the country are: biomass, solar and wind. Prospects of wind energy are good in coastal areas and in remote islands. Although their operating costs are comparatively very small, the capital investment cost of the solar and wind electricity generation is quite high compared with biomass electricity plants (CBO, 2003). However, detailed research should be carried out to estimate the potential and assess the financial viability of solar and wind electricity generation in Bangladesh.
Combination of biomass with other renewable/conventional sources such as solar PV- biomass, solar PV-biomass-wind or solar PV-blomass-diesel could be a good option for decentralised electricity generation in coastal areas and in remote islands of Bangladesh. This option depends mainly on the availability of other renewable energy sources and investment cost. One of the most promising options is PV-biomass hybrid power plant. A combined PV and biomass-based electricity plant can meet all the power needs of any load situation. Biomass electricity is financially viable, but the solar PV is still costly. The viability of hybrid electricity generation in coastal and remote areas of the country needs further investigation.
In Bangladesh, a number of mixed bodies, such as the Government, NGOs and private organisations are working in the renewable energy sector. These organisations are working independently without any collaboration or co-operation. The GOB is encouraging the private sector to install small-scale power plants. Community-based biomass electricity plant was practised successfully in India. Community support (e. g. uninterrupted biomass supply, plant security and motivation of the local people to use clean energy) is vital for successful operation of biomass electricity plants. Biomass electricity plant installation strategy and funding arrangements are two important issues for implementing a biomass electricity project. This requires a further in-depth analysis.
180

Significant amount of the capital investment cost could be reduced if reconditioned car engines are used as prime movers. Detailed studies are needed to assess the utilisation viability of such engines.
Overall efficiencies of the traditional biomass utilisation systems used in the country are very low. The amount of biomass that could be saved by using improved cooking stoves, furnaces and boilers, and the production of biomass briquettes are considerable. Further research is needed to develop an integrated model which addresses both the efficiency improvement of the current biomass utilisation and biomass electricity generation model for the country.
181

REFERENCES
AES (2004). Investigation into Municipal Solid Waste Gasification for Power Generation. Advanced Energy Strategies (AES) Incorporation, USA.
Alam, M. S., Islam, K. K. and Huq, A. M. Z. (1999). Simulation of rural household fuel consumption in Bangladesh. Energy, 24,743-752.
Alam, S. (199 1). Integrated Modelling of a Rural Energy System: A System Dynamics Approach. PhD Thesis. Department of Electrical and Electronics Engineering, Bangladesh University of Engineering and Technology, Dhaka, Bangladesh.
ABA (2003). Biomass: Clean Energy for America's Future (www document). American Bioenergy Association (ABA). http: //www. biomass. orq/fact sheet 2. htm (accessed 20th May 2003).
APPEA (2004). Warning for WA. - choose gas for electricity generation or suffer dire consequences. Australian Petroleum Production and Exploration Association (APPEA) Limited. Australia.
Babu, D. and Yuvaraj, N. (2001). Biomass densification -a solid (fuel) solution. TERI Newswire, 7. Published by The Energy and Resources Institute, India.
Bain, R. L. (2004). Biomas Gasification Overview. In: Presentation operated for the US Department of Energy by Midwest Research Institute, National Renewable Energy Laboratory, Battelle, January 24.
Bain, R. L., Amos, W. A., Downing, M. and Perlack, R. L. (2003). Highlights of Bippower Technical Assessment: State of the Industry and the Technology. National Renewable Energy Laboratory, US Department of Energy.
Bala, B. K. (1997). Computer Modelling of the Rural Energy System and of C02 Emissions for Bangladesh. Energy, 22,999-1003.
Bank of Canada. (2004). Currency Converter (www document). Bank of Canada. http: //www. bankofcanada. ca/en/exchform. htm (accessed 20th September 2004).
Banu, L. B. (1996). Technologies for Efficient Use of Wood fuel: Improved Chulli, Compressed Husk, Briquetting and Other Technologies. In: National Training Course on 'Wood fuel in Bangladesh - Production and Marketing' Regional Wood Energy Development Programme in Asia, FAO, Bogra, Bangladesh, December 7-11.
Bari, M. N., Hall, D. 0., Lucas, N. J. D. and Hossain, S. M. A. (1998). Biomass energy use at the household level in two villages of Bangladesh: Assessment of Field Methods. Biomass and Bioenergy, 15,171-180.
Bari, S. (1996). Effect of carbon dioxide on the performance of biogas/diesel dual-fuel engine. Renewable Energy, 9,1007-1010.
182

Barker, J. C. (2001). Methane Fuel Gas from Livestock Wastes: A Summary. Publication Number: EBAE 071-80, North Carolina State University, USA.
Barrow, C. J. (2000). Social Impact Assessment -An Introduction. Arnold, England.
Batra, V. S. and Bali, S. (2001). Status of fuel cell technology. Energy Technology News, Issue 2 and 3. Published by Organisations for the Promotion of Energy Technologies (OPET), India.
BB (2005a). Inflation (www document). Bangladesh Bank, Ministry of Finance, Government of the People's Republic of Bangladesh. http: //www. banqladesh bank. orq/econdata/inflatn. html (accessed 12 th May 2005).
BB (2005b). Bank wise interest rates structures in Bangladesh (www document). Bangladesh Bank, Ministry of Finance, Government of the People's Republic of Bangladesh. hftp: //www. banqladesh-bank. or(i/r)ub/monthlv/econtrds/econtrdsxv. html (accessed 12'hMay 2005).
BBS (2002). National Data Bank Statistics (www document). Bangladesh Bureau of Statistics (BBS), Ministry of Planning, Government of the People's Republic of Bangladesh. http: //www. bbsgov. or-q/ (accessed 12 th June 2005).
Bejan, A., Tsatsaronis, G., and Moran, M. (1996). Thennal Design and Optimisation, John Wiley & Sons, Canada. 463 - 513.
Belgiorno, V., De Feo, G., Rocca, C. D. and Napoli, R. M. A. (2003). Energy from gasification of solid wastes. Waste Management, 23,1-15.
Benson, V. (2003). Bioenergy and Agriculture. In: Proceedings of the Growing the Rural Economy with Renewable Energy, Wind farming and Bidenergy - New Crops for Missouri Farms, Columbia Missouri, USA, March 6.
Beveridge, G. S. G. and Schlechter, R. S. (11970). Optimization: Theory and Practice. McGraw-Hill International Book Company, New York.
Bharadwaj, A., Diwekar, U., Robinson, A., Arunachalam, V. S. and Bannerjee, R. (2000). Electricity from Biomass for Rural India: techno-economic analysis. In: World Renewable Energy Congress V1, Brighton, UK, July 1-7.
Bhattacharya, S. C. (1993). State-of-the-art of Utilising Residues and Other Types of Biomass as Energy Source. RERIC International Energy Journal, 15,1-21.
Bhattacharya, S. C., Attalage, R. A., Leon, M. A., Amur, G. Q., Salam, P. A. and Thanawat, C. (1999). Potential of biomass fuel conservation in selected Asian countries. Energy Conservation and Management, 40,1141-1162.
Bhattacharya, S. C., Salam, P. A., Pham, H. L. and Ravindranath, N. H. (2003). Sustainable biomass production for energy in selected Asian countries. Biomass and Bioenergy, 25,471- 482.
Bhuiyan, M. M. H., Asgar, M. A., Mazumder, R. K. and Hussain, M. (2000). Economic evaluation of a stand-alone residential photovoltaic power system in Bangladesh. Renewable Energy, 21,403-410.
183

BIOS (2004). Techno-economic evaluation of selected decentralised CHP applications based on biomass combustion. BIOS BIOENERGIESYSTEME GmbH, Austria.
Biswas, W. K. (1995). Energy Consumption and Prospects of Renewable Energy Technologies in a Bangladeshi Village. MSc Thesis, Centre for Environmental Technology. Imperial College of Science, Technology and Medicine. UK.
Biswas, W. K. and Lucas, N. J. D. (1 997a). Energy consumption in the domestic sector in a Bangladesh village. Energy, 22,771-776.
Biswas, W. K. and Lucas, N. J. D. (1 997b). Economic Viability of Biogas Technology in a Bangladesh Village. Energy, 22,763-770.
Biswas, W. K., Bryce, P. and Diesendorf, M. (2001). Model for empowring rural poor through renewable energy technologies in Bangladesh. Ecological Science and Policy, 4,333-344.
BLS (2004). Overview of BLS Statistics on Inflation and Consumer Spending - CPI Inflation Calculator (www document). US Bureau of Labor Statistics. http: //Www. bis. qovlbls/inflation. htm (accessed 22 nd September 2004).
Boas, A. H. (1983). Linear, Dynamic, and Geometric Programming. In: Cost and Optimisation Engineering, edited by Jelen, F. C. and Black, J. H., McGraw - HILL International Book Company. 2 nd edition, 276 - 301.
Bose, S. K. (1996). Wood fuel Production Programs and Strategies of the Forest Department. In: National Training Course on 'Wood fuel in Bangladesh - Production and Marketing, Regional Wood Energy Development Programme in Asia, FAO. Bogra, Bangladesh, December 7-11.
BP Amoco (2005). BP Statistical Review of World Energy 2005. BP p. 1. c.
BPDB (2005). Bangladesh Power Development Board (www document). Ministry of Energy and Mineral Resources, Government of the People's Republic of Bangladesh. http: //www. bpdb. clov. bd (accessed 21't June 2005).
Braber, K. (1995). Anaerobic Digestion of Municipal Solid Waste: A modern waste disposal option on the verge of breakthrough. Biomass and Bidenergy, 9,365-376.
Braun, R. and Wellinger, A. (2004). Potential of Co-digestion. Energy from Biogas and Landfill Gas, IEA Bioenergy Task 37, International Energy Agency.
Bridgwater, A. V. (1995). The technical and economic feasibility of biomass gasification for power generation. Fuel, 74,631-653.
Bridgwater, A. V. and Peacocke, G. V. C. (2000). Fast pyrolysis process for biomass. Renewable & Sustainable Energy Reviews, 4,1-73.
Bridgwater, A. V., Beenackers, A. A. C. M. and Sipila, K. (1998). An Assessment of the Possibilities for Transfer of European Biomass Gasification Technology to China. Part 1. Prepared by IEA, EU, and China. Brussels, Belgium.
184

Bridgwater, A. V., Meier, D. and Radlein, D. (1999). An overview of fast pyrolysis of biomass. Organic Geochemistry, 30,1479-1493.
Broek, R. V. D., Wijk, A. V. and Turkeburg, W. (2002). Energy from crops of different settings -a country comparison between Nicaragua, Ireland and Netherlands. Biomass and Bidenergy, 22,79-98.
Bruce, N., Perez-Padilla, R. and Albalak, R. (2002). The health effects of indoor air pollution exposure in developing countries. World Health Organisation, Geneva, Switzerland.
BTG (2004). Energy from Poultry Litter (www document), Biomass Technology Group, Netherlands. hftp: //www. btqworld. com (accessed 20th December 2004).
Carpentieri, A. E., Larson, E. D. and Woods, J. (1993). Future biomass-based electricity supply in Brazil. Biomass and Bioenergy, 4(3), 149-179.
Castro, J. D. (1999). Gasification and Biogas Technologies. In: Wood Energy, Climate and Health-Intemational Expert Consultation. Regional Wood Energy Development Programme in Asia, FAO, Thailand, October 7-9.
CBO (2003). Prospects for Distributed Electricity Generation. Congress of United States Congressional Budget Office, Washington DC, USA.
CEC (2002a). Municipal Solid Waste Power Plants (www documents). California Energy Commission, USA. http: //www. enerqv. ca. qov/development/biomass/msw. htmi (accessed 22 nd March 2005).
CEC (2002b). Microturbines (www document). California Energy Commission. http: //www. enerav. ca. aov/distgen/equipment/microturbines/microturbines. htmi (accessed 23"' March 2005).
CES (2005). Renewable Energy (www document). Centre for Energy Studies (CES), Bangladesh University of Engineering
th and Technology.
http: //www. buet. ac. bd/ces/renewable-enerqv. htm (accessed 11 July2005).
Cochran, B. J. and Carney, W. A. (1996). Basic Principles of Composting. Louisiana State University Agricultural Centre, Louisiana State University, USA.
Cross, M. and Moscardini, A. 0. (1985). Learning the art of Mathematical Modelling. Ellis Horwood Limited, England.
D'Apote, S. L. (2001). The IEA Projection Study of Biomass Energy Use. Wood Energy News. 16,25-30. Published by Regional Wood Energy Programme in Asia (GCP/RAS/154/NET), FAO, Thailand.
Demirbas, A. (2003). Sustainable cofiring of biomass with coal. Energy Conversion & Management, 44,1465-1479.
Devkota, G. P. (2003). Biogas Installation and Training. In: Training course on: Biogas Construction Training Report, METTA Development Foundation, The Burma Sustainable Development Project, Myitkyina, Myanmar, October 30-November 14.
185

DG (2005). Technologies (www document). Distributed Generation (DG). httr): //www. distributed-qeneration. com/technolo-qies. htm (accessed 16 th May 2005).
Domac, J., Richards, K. and Risovic, S. (2005). Socio-economic drivers in implementing bioenergy projects. Biomass and Bioenergy, 28,97-106.
Edgar, T. F. and Himmelblau, D. M. (1988). Optimization of Chemical Processes. McGraw-Hill International Book Company, New York.
EERE (1999a). Direct Fired Biomass (www document). US Department of Energy. http: //www. eere. enemy. qov/consumerinfo/pdfs/direct fire bio. [)d (accessed 22 nd June 2005).
EERE (1999b). Biomass Co-firing (www document). US Department of Energy. http: //www. eere. enemy. aov/consumerinfo/pdfs/bio co fire. pdf (accessed 22 nd June 2005).
EERE (1999c). Gasification - Based Biomass (www document). US Department of qasification. pdf (accessed Energy. httr): //www. eere. enemv. qov/consumerinfo/pdfs/bio - 25th June 2005).
EIA (2003). Forecasts: International Energy Outlook 2002 (www document). Energy Information Administration (EIA). http: //www. eia. doe. Clov/oiaf/ieo (accessed 25'h July 2003).
EIA (2004). Country Analysis Briefs: Bangladesh (www document). Energy Information Administration (EIA). http: //www. eia. doe. gov/emeu/cabs/banqIa. html (accessed 7 th June 2005).
EIU (1999). Country Profile: Bangladesh 1999-2000. The Economist Intelligence Unit, UK.
EPA (2002a). AgSTAR Handbook. AgSTAR Programme. 2 nd edition. US Environmental Protection Agency.
EPA (2002b). Distributed Generation: The Hot New Way to Generate Power (www document). us Environmental Protection Agency. http: //www. er)a. ciov/alobalwarminq/ýýreenhouse/qreenhouse1 81distributed. html (accessed 25"' February 2005).
EPA (2004). Emissions. Global Warming - Emissions (www document). US Environmental Protection Agency. http: //vosemite. ei)a. -qov/oarlqlobalwarminq . nsf/content/e missions. html (accessed I 1th February 2005).
EPA (2005a). Global Warming Potentials and Atmospheric Lifetimes (www document). us Environmental Protection Agency. htti): //www. ei)a. qov/nonco2/econ-inv/table. html (accessed 23rd February 2005).
EPA (2005b). Electricity from Non-Hydroelectric Renewable Energy Sources, Clean Energy (www document). US Environmental Protection Agency. htti): //www. epa. gov/cleanenerqy/renew. htm#biomass (accessed 24h February 2005).
186

ESRU (2004). Biomass-using anaerobic digestion (www document). Energy Systems Research Unit, University of Strathclyde, UK. http: //www. esru. strath. ac. uk/EandE/ Web_sites/03-04/biomass/backg round %20info4. html (accessed 23 rd March 2005).
Europa (2005). Biomass Electricity-Detailed Information (www document). EU. http: //europa. eu. int/comm/enerqv transport/atlas/htmiu/bioedet. htmI (accessed 20 th June 2005).
Faaij, A. P. C. (2006). Bio-energy in Europe: changing technology choices. Energy Policy, 34,322-342.
FAE (2005). Renewable Energy. Distant Internet Education (www document). Foundation for Alternative Energy (FAE), Slovakia. http: //www. fns. uniba. sk/zp/fond/dieret/biomass. htmi (accessed 10 th June 2005).
FAO (1986). Wood gas as engine fuel. Forest Industries Division, Forestry Department. FAO, Rome, Italy.
FAO Forestry (2003). Country Information: Bangladesh (www document). FAO. http: //www. fao. orq/forestry/foris/Webview/forestry2/index. isp? siteld=5081&sitetreeld=18 308&lanqld=l&qeold=31 (accessed 11uJune 2005).
FAOSTAT (2004). FAOSTAT-Agriculture Data (www document). FAO. http: //faostat. fao. orqlfaostaVform? collection=LandUse&Domain=Land&serviet=l &hasb ulk=&version=ext&languaqe=EN (accessed 1 1'h June 2005).
Fiala, M., Pellizzi, G. and Riva, G. (1997). A model for the Optimal Dimensioning of Biomass-fuelled Electric Power Plants. International Journal of Agricultural Engineering Research, 67,17-25.
Freppaz, D., Minciardi, R., Robba, M., Rovatti, M., Sacile, R. and Taramasso, A. (2004). Optimizing forest biomass exploitation for energy supply at a regional level. Biomass and Bioenergy, 26,15-25.
GCC (2005). Bangladesh Considering Tax Breaks on Imported CNG Engines and Vehicles (www document). Green Car Congress (GCC). hfti): //www. qreencarconqress. com/2005/04/banqladesh cons. html (accessed 1 Vh May 2005).
Ghosh, S., Das, T. K. and Jash, T. (2004). Sustainability of decentralized woodfuel- based power plant: an experience in India. Energy, 29,155-166.
Global Insight (2005). WMRC Country Report., Bangladesh. World Market Reserach Centre (WMRC), Global Insight, USA.
Grover, P. D. (1995). Briquetting of Wood and Agro Residues. Wood Energy News, 10,12-14. Published by Regional Wood Energy Programme in Asia (GCP/RAS/154/NET), FAO, Thailand.
GS (2001). Programs (www document). Grameen Shakti (GS) Bangladesh. http: //www.
-qrameen-info. orqtqrameentqshakti/proqrams. html (accessed 13' July 2005).
187

Haider, S. W. (2001). Use of Satellite Imagery and GIS for Biomass Resource Assessment. Wood Energy News, 16 (2), 17-18. Published by Regional Wood Energy Programme in Asia (GCP/RAS/154/NET), FAO, Thailand.
Hall, C. W. (1989). Gas from Biomass, In: Biomass Handbook, edited by Kitani, 0. and Hall, C. W., Gordon and Breach Science Publications, 590-595.
Hall, D. 0. and House, J. 1. (1995). Biomass: a modern and environmentally acceptable fuel. Solar Energy Materials and Solar Cells, 38,521-542.
Hall, D. 0., Rosillo-Calle, F., Williams, R. H. and Woods, J. (1993). Biomass for Energy: Supply Prospects. In: Renewable Energy - Sources for Fuels and Electricity, edited by Johasson, T. B., Kelly, H., Reddy, A. K. N., Williams, R. H. and Burnham, L., Earthscan/Island Press, Washington DC, USA, 593-651.
Harvey, A. (1995). Renewable energy technologies in developing countries. In: The World Directory of Renewable Energy - Suppliers and Services 1995, edited by Cross, B., James and James Science Publishers Ltd., London.
Hashem, M. A. (1996). Wood fuel Utilization in Rural Industries. In: National Training Course on 'Woodfuel in Bangladesh - Production and Marketing', FAO, Bogra, Bangladesh, December 7-11.
Heaps, C. (2001). LEAP 2000: A New Tool for Sustainable Energy Analysis. Wood Energy News, 16 (2), 39-42. Published by Regional Wood Energy Programme in Asia (GCP/RAS/1 54/NET), FAO, Thailand.
Heaps, C. (2002). Integrated Energy-Environment Modelling and LEAP. SEI-Boston and Tellus Institute, Boston, USA.
Henderson, J. P. (2004). Anaerobic Digestion in Rural China (www document). City Farmer, Canada's Office of Urban
oth Agriculture, Canada.
http: //www. citvfarmer. orq/bloqasPaul. html (accessed 2 September 2004).
Henham, A. and Makkar, M. K. (1998). Combustion of simulated biogas in a dual-fuel diesel engine. Energy Conversion and Management, 39,2001-2009.
Heruela, C. (1998). Wood Energy Planning - Building Capacities in Asia, In: International Energy Agency Workshop on 'Biomass Energy., Data, Analysis and Trends, Paris, France, March 23-24.
Hossain, A. (2005). Wind Energy in Bangladesh. Sustainable Development Networking Programme Bangladesh, United Nations Development Programme. http: //www. sdnbd. om/sdi/issues/enerqv/index. htm (accessed 11 th July 2005).
Hossain, A. K. M. S. (2001). Utilisation of Biomass for Electricity Generation in Bangladesh. MSc Thesis, School of Engineering, Cranfield University, UK.
Hotchkiss, R., Livingston, W. and Hall, M. (2002). Waste/Biomass Co-gasification with Coal. Report No. COAL R216 DTI/Pub URN 02/867. Department of Trade and Industry, UK.
188

Hussain, M., Das, K. C. and Huda, A. (1997). The Performance of a Box -Type Solar Cooker with Auxiliary Heating. Renewable Energy, 12,151-155.
ICCEPT (2005). Biomass Energy Flow Charts (www document). Imperial College Centre for Energy Policy and Technology (ICCEPT). http: //www. iccept. ic. ac. uk/research/proiects/SOPAC/flowcon. htm (accessed 14 th June 2005).
IEA Bioenergy (2003a). Socid-economid Drivers in Implementing Bioenergy Projects: An Overview. IEA Bioenergy Task 29. International Energy Agency.
IEA Bloenergy (2003b). Biogas Upgrading and Utilisation. IEA Bioenergy Task 24, International Energy Agency.
IEA Bioenergy (2003c). Biomass Combustion and Co-fifing: An Overview. IEA Bioenergy Task 32, International Energy Agency.
IEA Bioenergy (2005). A Sustainable Solution (www document). International Energy Agency. http: //www. leabioenemv. com/1EABioenemv. php (accessed 21't June 2005).
Irvin, G. (1978). Modem Cost - Benefit Methods. The Macmillan Press Ltd, UK.
Islam, M. (2002a). Utilization of Renewable Energies in Bangladesh. Sustainable Development Networking Programme Bangladesh, United Nations Development Programme. httD: //www. sdnbd. orq/sdi/issues/enemv/index. htm (accessed 11 th Jul y 2005).
Islam, M. (2002b). Assessment of Renewable Energy Resources of Bangladesh. Sustainable Development Networking Programme Bangladesh, United Nations Development Programme. http: //www. sdnbd. om/sdi/issues/enerqv/index. htm (accessed 1 1th July 2005).
Islam, N. (2002). Remote Area Power Supply Systems: a framework for implementation and operation. In: Infrastructure Development Private Solutions for the Poor The Asian Perspective, Manila, Philippines, October 28-30.
ITDG (2004). Diesel. Knowledge and Information Services (www document). Intermediate Technology Development Group (ITDG), UK. http: //www. itdcl. or-q/home home text. asi)? id=tech nica I briefs (accessed 12ý September 2004).
ITDG (2005). Reducing exposure to indoor air pollution (www document). Intermediate Technology Development Group (ITDG), UK. http: //www. itdcl. orq/home text. ph p? id =smoke report 3 (accessed 2 nd June 2005).
IWM (1998). Anaerobic Digestion. The Institute of Waste Management, UK.
Jelen, F. C. (1983). Optimisation. In: Cost and Optimisation Engineering, edited by Jelen, F. C. and Black, J. H., McGraw Hill Book Company Limited. 2 Ad edition, 217 - 249.
Junginger, M. (2000). Setting Up Fuel Supply Strategies for Large-Scale Bio-Energy Projects Using Agricultural and Forest Residues. Regional Wood Energy Development Program in Asia, FAO. Bangkok, Thailand.
189

Kanniappan, P. and Ramachandran, T. (1998). Optimisation model for energy generation from agricultural residue. International Journal of Energy Research, 22, 1121-1132.
Kanniappan, P. and Ramachandran, T. (2000). Goal Programming model for sustainable electricity production from biomass. International Journal of Energy Research, 24,1-18.
Kapur, T., Kandpal, T. C. and Garg, H. P. (1996). Electricity Generation from Rice Husk in Indian Rice Mills: Potential and Financial Viability. Biomass and Bioenergy, 10, 393-403.
Kartha, S. and Larson, E. D. (2000). BIOENERGY PRIMER: Modemised Biomass Energy for Sustainable Development. Energy and Atmosphere Programme, United Nations Development Program. New York, USA.
Klein, A. (2002). Gasification: An Altemative Process for Energy Recovery and Disposal of Municipal Solid Wastes. MSc Thesis. Department of Earth and Environmental Engineering, School of Engineering and Applied Science, Columbia University, USA.
Koopmans, A. (1998). Biomass Energy Resources for Power and Energy. In: Options for Dendro Power in Asia: Report of the Expert Consultation, Regional Wood Energy Development Program in Asia, FAO, Manila, Philippines, April 1-3.
Koopmans, A. and Koppejan, J. (1997). Agricultural and Forest Residues-Generation, Utilization and Availability. In: Regional Consultation on 'Modem Applications of Biomass Energy, Regional Wood Energy Development Program in Asia, FAO, Kualampur, Malaysia, January 6-10.
KranzI, L., Huber, C., Resch, G., Schriefl, E., Tsioliaridou, E., Negro, E., Ragwitz, M. and Laia, C. (2004). Technology Evaluation, Altener Program, Contract No. : Altener contract 4.1030/Z/02-094, European Commission.
Krukanont, P. and Prasertsan, S. (2003). Implications of fuel moisture content and distribution on the fuel purchasing strategy of biomass cogeneration power plants. Biomass and Bioenergy, 24,13-25.
Krukanont, P. and Prasertsan, S. (2004). Geographical distribution of biomass and potential sites of rubber wood fired power plants in Southern Thailand. Biomass and Bioenergy, 26,47-59.
Kumar, A., Cameron, J. B. and Flynn, P. C. (2003). Biomass power cost and optimum plant size in western Canada. Biomass and Bidenergy, 24,445-464.
Kumar, S. (2000). Technology Options for Municipal solid waste to energy project. TERI Information Monitor on Environmental Sciences, 5(l), 1 -11. Published by The Energy and Resources Institute, India.
Larkin, S., Ramage, J. and Scurlock, J. (2004). Bioenergy. In: Renewable Energy - Power for a Sustainable Future, edited by Boyle, G., Oxford University Press, UK. 105-146.
190

Larsen, E. D. (1993). Technology for Electricity and Fuels from Biomass. Annual Review of Energy and Environment, 18,567-630.
Lensu, T. and Alakangas, E. (2004). Small-scale electricity generation from renewable energy sources. OPET Report No. 13, Contract No. NNE5/37/2002: OPET RES-e, European Commission.
Lettinga, G. and Haandel, A. V. (1993). Anaerobic Digestion for Energy Production and Environmental Protection. In: Renewable Energy - Sources for Fuels and Electricity, edited by Johasson, T. B., Kelly, H., Reddy, A. K. N., Williams, R. H. and Burnham, L., Earthscan/Island Press, Washington DC, USA, 593-651.
Leung, D. Y. C., Yin, X. L. and Wu, C. Z. (2004). A review on the development and commercialization of biomass gasification technologies in China. Renewable and Sustainable Energy Reviews, 8(6), 565 - 580.
Lewis, F. M. and Hoecke, D. A. (1999). Design and Operating Challenges in the Combustion of Human and Animal Waste. In: Proceedings of the Animal Waste Utilization Workshop. US Department of Energy, Federal Energy Technology Centre, Morgantown, West Virginia, USA. June 8-9.
LGED (2004). Design of Biogas Plant (www document). Sustainable Rural Energy, Local Government Engineering Department (LGED), Bangladesh. htti): Hlqed. orq/sre/Desiqný/ý2OBioqasý/ý20PIant. r)df (accessed on 100' September 2004).
Lin, D., Jingming, L. and Overend, R. (1998). Biomass Energy Conversion Technologies in China: Development and Assessment, China Environmental Science Press, Beijing, China.
Lobachyov, K. V. and Richter, H. J. (1998). An Advanced Integrated Biomass Gasification and Molten Fuel Cell Power System. Energy Conversion and Management, 39,1931-1943.
Lora, E. S. and Nogueira, L. A. H. (1998). Technonoeconomic Evaluation of Gasification Technologies for Small Scale Electricity Generation from Biomass. In: Expanding Bioenergy Partnerships, Proceedings of BIOENERGY '98, Great Lakes Regional Biomass Program. Madison, Wisconsin, USA, October 4-8.
Lusk, P. D. (2005). Anaerobic Digestion Economics. In: Dairy Anaerobic Digestion Workshop, Washington State University, Washington DC, February 25.
Madlener, R. and Myles, H. (2000). Modelling Socio-Economic Aspects of Bi6energy Systems: A survey prepared for 1EA Bioenergy Task 29. IEA Bioeenrgy Task 29, International Energy Agency.
Magistri, L. (2004). Pressurized Hybrid Fuel Cell Systems. In: Micro Energy Systems: Review of Technology, Issues of Scale and Integration, edited by Beith, R., Burdon, 1. P. and Knowles, M., Professional Engineering Publishing Limited, UK, 201 - 225.
Marchaim, U. (1992). Siogas processes for sustainable development Job No. T0541/E. FAO, Rome, Italy.
191

Maschio, G., Koufopanos, C. and Lucchesi, A. (1992). Pyrolysis, a Promising Route for Biomass Utilization. Bioresource Technology, 42,219-231.
Mathias, A. J. and Lacrosse, L. (1999). Emission Associated with Biomass Cogeneration. In: Wood Energy, Climate and Health - Intemational Expert Consultation. Regional Wood Energy Development Programme in Asia, FAO. Phuket, Thailand, October 7-9.
Mcgowin, C. R. and Wiltsee, G. A. (1996). Strategic Analysis of Biomass and Waste Fuels for Electric Power generation. Biomass and Bidenergy, 10,167-175.
MEF (1993). Forestry Master Plan. Report No: TA NO. 1355-BAN, UNDP/FAO BGD/88/025. Ministry of Environment and Forests (MEF), Government of the People's Republic of Bangladesh.
Mitchel, C. P. (2000). Development of decision support systems for bioenergy applications. Biomass and Bidenergy, 18,265-278.
Mitchell, C., Bridgwater, A. V., Stevens, D. J., Toft, A. J. and Watters, M. P. (1995). Technoeconomic Assessment of Biomass to Energy. Biomass and Bidenergy, 9, 205-226.
MOEM (2002). Draft Renewable Energy Policy of Bangladesh. Ministry of Energy and Mineral Resources (MOEM), Government of the People's Republic of Bangladesh.
MOF (2005). Bangladesh Economic Review 2005. Finance Division, Ministry of Finance (MOF), Government of the People's Republic of Bangladesh.
Moral, M. N. A. (1999). Briquetting of Biomass in Bangladesh. In: Training Workshop on Renewable Energy Education and Application for Rural Communities in Bangladesh, Dhaka, Bangladesh, November 27-December 03.
Moral, M. N. A. (2000). Briquetting of Biomass in Bangladesh. In: World Renewable Energy Congress V1, Brighton, UK, July 1-7.
Mukhopadhyay, K. (2004). An assessment of a Biomass Gasification based Power Plants in the Sundarbans. Biomass and Bioenergy, 27,253-264.
Murphy, J. D. and McKeogh, E. (2004). Technical, economic and environmental analysis of energy production from municipal solid waste. Renewable Energy, 29, 1043-1057.
Murphy, J. D., McKeogh, E. and Kiely, G. (2004). Technical/economic/ environmental analysis of biogas installation. Applied Energy, 77,407-427.
Nagamani, B. and Ramasamy, K. (1999). Biogas Production Technology: An Indian perspective. Current Science, 77. Published by the Current Science Association in collaboration with the Indian Academy of Science, India.
Nagel, J. (2000a). Biomass in energy supply, especially in the state of Brandenburg, Germany. Ecological Engineering, 16,103 - 110.
192

Nagel, J. (2000b). Determination of an economic energy supply structure based on biomass using a mixed-integer linear optimisation model. Ecological Engineering, 16, 91-102.
Narang, H. P., Parashar, D. C., Bhattacharya, S. C. and Salam, P. A. (1999). A Study of Biomass as a Source of Energy in India. RERIC International Energy Journal, 21, 11-23.
Naumann, S. T. and Myren, C. (1995). Fuel processing of biogas for small fuel cell power plants. Journal of Power Sources, 56,45-49.
Noon, C. E. and Daly, M. J. (1996). GIS-based resource assessment with BRAVO. Biomass and Bidenergy, 10,101 -109.
NREL (2005). HOMER (www document). National Renewable Energy Laboratory (NREQ, US Department of Energy. http: //www. nrel. gov/homer (accessed 25 th June 2005).
OECD (1988). Environmental Impacts of Renewable Energy. Organisation for Economic Co-operation and Development (OECD), Paris.
Omer, A. M. and Fadalla, Y. (2003). Biogas energy technology in Sudan. Renewable Energy, 28,499 - 507.
OPET (2004). Micro and small scale CHP from biomass. Technology paper No. 2; OPET RES-e: NNE5/37/2002, Organisations for the Promotion of Energy Technologies (OPET) Network, European Commission, Finland.
Othman, M. Y. H., Yatim, B. and Salleh, M. M. (1996). Chicken dung biogas power generating system in Malaysia. Renewable Energy, 9,930-933.
Pandy, M. R. (1999). Health Impacts of Woodfuel Emission and How to Improve Them. In: Wood Energy, Climate and Health - International Expert Consultation. Regional Wood Energy Development Programme in Asia, FAO. Phuket, Thailand, October 7-9.
Papadopoulos, D. P. and Katsigiannis, P. A. (2002). Biomass energy surveying and techno-economic assessment of suitable CHP system installations. Biomass and Bidenergy, 22,105-124.
Papalambros, P. Y. and Wilde, D. J. (1988). Principles of Optimal Design - Modelling and Computation. Cambridge University Press, Cambridge.
Parikh, J. K. and Ramanathan, R. (1999). Linkages among energy, agriculture and environment in rural India. Energy Economics, 21,561-585.
Parikka, M. (2000). Biosims -a method for the calculation of woody biomass for fuel in Sweden. Ecological Engineering, 16,73-82.
Paul, L. L. J. (2004). Market potential for opportunity fuels in DER/CHP applications, Resource Dynamics Corporation. In: CHP Subcontractors Review Meting. US Department of Energy, Oak Ridge National Laboratory, Washington DC, USA, April 22.
193

Perera, K. K. C. K., Rathnasiri, P. G. and Sugathapala, A. G. T. (2003). Sustainable biomass production for energy in Srilanka. Biomass and Bioenergy, 25,541-556.
Perlack, R. D., Wright, L. L., Huston, M. A. and Schramm, W. E. (1995). BiomassFuel from Woody Crops for Electric Power Generation. Report No: ORNL -6871, Oak Ridge National Laboratory, USA.
Picken, D. J. (1989). Internal Combustion Engines for Biomass. In: Biomass Handbook, edited by Kitani, 0. and Hall, C. W., Gordon and Breach Science Publishers. 600 - 604.
Pike, R. W. (1986). Optimization for Engineering Systems. Van Nostrand Reinhold, New York.
Podesser, E. (1999). Electricity Production in Rural Villages with a Biomass Stirling Engine. Renewable Energy, 16,1049-1052.
PyNe (2005). Overview (www document). Biomass Pyrolysis Network. IEA Bioenergy. http: //www. pvne. co. uk/ (accessed 4th July 2005).
Quaak, P., Knoef, H. and Stassen, H. (1999). Energy from Biomass: A Review of Combustion and Gasification Technologies, Energy Series, World Bank Technical Paper No. 422, The World Bank, Washington DC, USA.
Rahman, S. K. (1996). Conservative Advantages of Woodfuel (Production system) over other Resources for Sustainable Resource Management. In: National training course on 'Woodfuel in Bangladesh-Production and Marketing, FAO, Bogra, Bangladesh, December 7-11.
Ravindranath, N. H. and Hall, D. 0. (1995). Biomass, energy, and environment, Oxford University Press. New York, USA.
REB (2004). Rural Electriflcation Board (www document). Ministry of Energy and Mineral Resources, Government of the People's Republic of Bangladesh. http: //www. reb. qov. bd (accessed 8th July 2005).
Redden, P. and Lavingia, N. (1997). Profitability Analysis. In: The Engineer's Cost Hand book, edited by Westney, R., Marcel Dekker Inc., 375 - 402.
REIN (2003a). Conventional Energy Resources: Petroleum Resources in Bangladesh (www document). Renewable Energy Information Network (REIN), Local Government Engineering Department, Bangladesh. hftp: //www. lqed-rein. or-q/conventional energy/ energv Petroleum. htm (accessed 70'July 2005).
REIN (2003b). Conventional Energy Resources: Peat Reserves in Bangladesh (www document). Renewable Energy Information Network (REIN), Local Government Engineering Department, Bangladesh. htti): //www. lqed-rein. orql conventional energy energy peat. htm (accessed 5th July 2005).
REIN (2003c). Conventional Energy Resources: Hydro Power Energy of Bangladesh (www document). Renewable Energy Information Network (REIN), Local Government Engineering Department, Bangladesh.. http: //www. lqed-rein. or-q/conventional energy/ enerqv hydropower. htm (accessed 7 th July 2005).
194

REIN (2003d). Conventional Energy Resources: Power Generation in Bangladesh (www document). Renewable Energy Information Network (REIN), Local Government Engineering Department, Bangladesh. hftp: //www. lqed-rein. or-q/conventionaI ener_q power qeneration. htm (accessed 7th July 2005).
REIN (2005a). Conventional Energy Resources: Coal Reserves of Bangladesh (www document). Renewable Energy Information Network (REIN), Local Government Engineering Department, Bangladesh. httr): //www. lqed-rein. orq/conventional ener_q energy coal. htm (accessed 9th July 2005).
REIN (2005b). Solar Energy Programme (www document). Renewable Energy Information Network (REIN), Local Government Engineering Department, Bangladesh. http: //www. lqed-rein. orq/solar/index prosolar. htm (accessed 1 9th July 2005).
REIN (2005c). Wind Energy Programme (www document). Renewable Energy Information Network (REIN), Local Government Engineering Department, Bangladesh. http: //www. lqed-rein. orq/wind/index prowind. htm (accessed 1 9th July 2005).
REIN (2005d). Micro Hydro Resource Potentials in Bangladesh (www document). Renewable Energy Information Network (REIN), Local Government Engineering Department,
9th Bangladesh. htti): //www. lqed-rein. orq/micro hydro/index i)romihv. htm
(accessed 2 July 2005).
REIN (2005e). Biomass Resource (www document). Renewable Energy Information Network (REIN). Local Government Engineering Department, Bangladesh. hftp: //www. lqed-rein. orq/biomass/resource biomass. htm (accessed 16 th July 2005).
Reklaitis, G. V., Ravindran, A. and Ragsdell, K. M. (1983). Engineering Optimization. Wiley, New York.
Remigio, A. A. (1997). Environmental Impact Assessment for Wood Energy Projects. Wood Energy News 11,19-20. Published by Regional Wood Energy Programme in Asia (GCP/RAS/154/NET), FAO, Thailand.
ReTScreen (2005). RETScreen GHG Emission Reduction Analysis Model (Appendix - B). RETScreen International, Canada.
RISE-AT (1998). Review of Cuffent Status of Anaerobic Digestion Technology for Treatment of Municipal Solid Waste. Regional Information Service Centre for South East Asia on Appropriate Technology, Institute of Science and Technology Research and Development, Chaing Mai University, Thailand.
Rodriguez-Bachiller, A. (1995). Appendix D: Geographical Information Systems. In: Methods of Environmental Impact Assessment, edited by Morris, P. and Therivel, R. UCL Press Limited, London. 320 - 324.
Rogner, H. H. and Khan, A. (1998). Comparing Energy Options. 1AEA Bulletin, 40 (1), 2-6. International Atomic Energy Agency Journal.
Roos, A. and Rakos, C. (2000). The limits of modelling. Experiences with bioenergy in practice - could models have predicted this outcome? Biomass and Bi6energy, 18, 331-340.
195

Runqing, H. and Junfeng, L. (2003). Sustainable biomass production for energy in China. Biomass and Bidenergy, 25,483-499.
RWEDP (1997). Review of Wood Energy Data in RWEDP Member Countries. Field Document No. 47. Regional Wood Energy Development Programme in Asia, FAO, Thailand.
RWEDP (2000). Basics of Wood Energy Planning -a manual. Regional Wood Energy Programme in Asia (GCP/RAS/154/NET), FAO, Thailand.
RWEDP (2002a). Wood Energy Database (www document). Regional Wood Energy Development Program in Asia, FAO, Thailand. http: //www. rwedp. or-q/d database. htmi (accessed 1 01h May 2005).
RWEDP (2002b). Employment (www document). Regional Wood Energy Programe in Asia, FAO, Thailand. hftp: //www. rwedp. orq/employment. html (accessed 28th February 2005).
RWEDP (2005). Biomass Energy in ASEAN Member Countries (www document). ASEAN-EC Energy management Training Centre and COGEN Program, Regional Wood Energy Development Program in Asia, FAO. http: //www. rwedi). orq/acrobat/asean. i)d (accessed 11 th January 2005).
RWEDP and UNEP (2000). Reducing greenhouse gas emissions by promoting biomass energy technology in South Asia. Regional Wood Energy Development Program in Asia and United Nations Environmental Program.
Sýrensen, B. (2000). The Energy Conversion Process. In: Renewable Energy. its physics, engineering, environmental impacts, economy and planning aspects, edited by Sýrensen, B., Academic Press, UK. 325 - 518.
Sarkar, M. A. R., Obaidullah, M., Das, D. K. and Huq, A. M. A. (1999). Availability of Renewable Energy Resources in Bangladesh. In: Training Workshop on Renewable Energy Education and Application for Rural Communities in Bangladesh. Dhaka, Bangladesh, November 27- December 03.
Sayigh, A. (1999). Renewable Energy - the way forward. Applied Energy, 64,15-30.
Schmidt, D. D. and Pinapati, V. S. (2000). Opportunities for Small Biomass Power Systems. Energy and Environmental Research Centre, University of North Dakota, USA.
Schuyler, J. (1997). Investment Decision - Making. In: The Engineer's Cost Handbook, edited by Westney, R., Marcel Dekker Inc., 403 - 445.
SDdimensions (1997). A system approach to bidgas technology, Sustainable Development Department FAO, Rome, Italy.
SDNBD (2005a). Bangladesh: A very brief history (www document). Sustainable Development Networking Programme Bangladesh. United Nations Development Programme. htti): //www. sdnbd. orq/banciladesh. htm (accessed July 6th 2005).
196

SDNBD (2005b). Solar PV System in Bangladesh by Rahimafrooz (www document). Sustainable Development Networking Programme Bangladesh. United Nations Development
th Programme. http: //www. sdnbd. or-q/sdi/issues/ener-qv/index. htm
(accessed 13 July 2005).
SERC (2005). Crafting a Clean and Sustainable Energy Policy for Your State (www document). State Environmental Resource Centre (SERC), Wisconsin, USA. http: //www. serconline. or-q (accessed 12th May 2005).
Shah, N. (1997). The role of bio-energy utilisation in sustainable development. International Journal of Global Energy, 9,365-381.
Shannon, R. (1996). Biogas. In: Sixth International Permaculture Conference and Convergence, Perth and Bridgetown, Australia, September 27-October 7.
Shepherd, W. and Shepherd, D. W. (2003). Biological Energy and Chemical Energy. In: Energy Studies, edited by Shepherd, W. and Shepherd, D. W., Imperial College Press, London. 431- 455.
Shukla, P. R. (1998). Dendropower and Wood Fuel Production Systems: Economic Analysis and Implementation Strategies. In: Options for Dendropower in Asia: Report of the Expert Consultation, Regional Wood Energy Development Program in Asia, FAO, Manila, Philippines, April 1-3.
Siemons, R. V. (2001). A Development Perspective of Biomass-Fuelled Electricity Generation Technologies. PhD Thesis, Faculty of Economics and Econometrics. University of Amsterdam, Netherlands.
Singh, N. P. (1998). Dendro-Power in India. In: Options for Dendro Power in Asia: Report of the Expert Consultation, Regional Wood Energy Development Program in Asia, FAO, Manila, Philippines, April 1-3.
Siteur, J. (1995). Data Analysis Tools for Decentralised Wood Energy Planning. Wood Energy News, 10 (4), 10-11. Published by Regional Wood Energy Programme in Asia (GCP/RAS/154/NET), FAO, Thailand.
Siteur, J. (1997). Data Collection and Analysis for Area-based Energy Planning -A Case Study in Phrao Distrid, Northern Thailand. Regional Wood Energy Development Programme in Asia (GCP/RAS/1 54/NET), FAO, Thailand.
Smith, K. R., Uma, R., Kishore, V. V. N., Lata, K., Joshi, V., Zhang, J., Rasmussen, R. A. and Khalil, M. A. K. (1998). Greenhouse Gases from Small-Scale Combustion Devices in Developing Countries (www document). Eco Limited, London. http: //www. ecoharmony. com/qhq/stoves. htm (accessed 15 th February 2005).
Smith, N. A. V. (2002). Decision Support for New and Renewable Energy Systems Deployment. PhD Thesis, Energy Systems Research Unit, Department of Mechanical Engineering. University of Strathclyde, UK.
Spiegel, R. J. and Preston, J. L. (2000). Test results for fuel cell operation on anaerobic digester gas. Journal of Power Sources, 86,283-288.
197

Stassen, H. E. (11995). Small-scale Biomass Gasifier for Heat and Power. World Bank Technical Paper Number - 296, The World Bank, Washington DC, USA.
Stiegel, G. J. and Maxwell, R. C. (2001). Gasification technologies: the path to clean, affordable energy in the 21st century. Fuel Processing Technology, 71,79-97.
Suganthi, L. and Williams, A. (2000). Renewable energy in India -a modelling study for 2020 - 2021. Energy Policy, 28,1095-1109.
Tafdrup, S. (1995). Viable Energy Production and Waste Recycling from Anaerobic Digestion of Manure and Other Biomass Materials. Biomass and Bidenergy, 9 (1-5), 303-314.
TERIIN (2003). Renewables in India (www document). The Energy and Resources rd (I Institute, India. hftp: //www. teriin. orq/renew/estpot. htm (accessed 23 Ap 1 2003).
TERIIN (2004). Renewables in India (www document). The Energy and Resources Institute, India. http: //www. teriin. or-q/renew/tech (accessed 13 th December 2004).
Tillman, D. A. (2000). Biomass Co-firing: the technology, the experience, the combustion consequences. Biomass and Bloenergy, 19,365-384.
Tripathi, A. K., Iyer, P. V. R. and Kandpal, T. C. (1997). A Financial Evaluation of Biomass Gasifier Based Power Generation in India. Bioresource Technology, 61, 53-59.
Turare, C. (1997). Impact of fuel properties on gasification (www document). ARTES Institute, University of Flensburg, Germany. http: //members. tripod. com/-cturare/bio. htm (accessed 1 Oth March 2005).
UN (2004). General Maps: Bangladesh (www document). United Nations Cartographic Section. hftp: //www. un. orq/Depts/Cartoqraphic/map/profile/banqlade. pdf (accessed 6th July 2005).
UNEP (2005). Potential impact of sea level rise on Bangladesh (www document). United Nations Environmental Programme/GRID Arendal. htti): //www. qrida. no/climate/vital/33. htm (accessed 17th February 2005).
Vijayaraghavan, K., Shariff, A. R. M. and Soom, M. A. M. (2003). Conversion of Urban Waste To Energy By Anaerobic Digestion (www document). Resource centre on Urban Agriculture and Forestry, Malaysia. http: //www. ruaf. o[g/nolO/34 malaysia. html (accessed 6th June 2005).
Voivontas, D., Assimacopoulos, D. and Koukios, E. G. (2001). Assessment of biomass potential for power production: a GIS based method. Biomass and Bioenergy, 20,101- 112.
WEC (2005). Renewable Energy in South Asia: Country Reports - Bangladesh (www document). World Energy Council (WEC). http: //www. worldenerqv. orq/wec- qeis/publications/reports/renewable/country reports/chap 212. asp (accessed 11"' July 2005).
198

WECS (2001). A Country Case Study - Wood Energy planning: Nepal. Water and Energy Commission Secretariat (WECS), Nepal.
Wereko-Brobby, C. Y. and Hagan, E. B. (1996). Biomass Conversion and Technology. UNESCO Energy Engineering Series, John Wiley & Sons, UK.
Werther, J., Saenger, M., Hartge, E. U., Ogada, T. and Siagi, Z. (2000). Combustion of agricultural residues. Progress in Energy and Combustion Science, 26,1-27.
WHO (2004). Indoor Air Pollution (www document). World Health Organization (WHO). htti): //www. who. int/indoorair/en/ (accessed 1 oth December 2004).
Williams, R. H. and Larson, E. D. (1996). Biomass Gasifier Gas Turbine Power Generating Technology. Biomass and Bidenergy, 10,149-166.
World Bank (1996). China Renewable Energy for Electric Power. Report No: 15592- CHA, The World Bank, Washington DC, USA.
World Bank (2004). Data and Statistics (www document). The World th
Bank Group. http: //www. worldbank. or-q/data/countrydata/countrvdata. htmi (accessed 6 July 2005).
World Bank (2005). Country Data Profile - Bangladesh (www document). The World Bank Group. http: //devdata. worldbank. orq/external/CPProfile. asr)? SelectedCountrv =BGD&CCODE=BGD&CNAME=Banqladesh&PTYPE=CP (accessed 11' June 2005).
WREN (2002). Introduction to Renewable Energy (www document). World Renewable Energy Network. hfti): //www. wrenuk. co. uk/home. html#intro (accessed 23 rd June 2005).
Wu, C. Z., Huang, H., Zheng, S. P. and Yin, X. L. (2002). An economic analysis of biomass gasification and power generation in China. Bioresource Technology, 83,65- 70.
Wyman, C. E., Bain, R. L., Hinman, N. D. and Steves, D. J. (1993). Ethanol and Methanol from Cellulosic Biomass. In: Renewable Energy - Sources for Fuels and Electricity, edited by Johasson, T. B., Kelly, H., Reddy, A. K. N., Williams, R. H. and Burnham, L., Earthscan/Island Press, Washington DC, USA.
Yokoyama, S., Ogi, T. and Nalampoon, A. (2000). Biomass energy potential in Thailand. Biomass and Bidenergy, 18,405-410.
Zhenhong, Y., Chuangzhi, W. and LI, S. (1 998). An Assessment of the Possibilities for Transfer of European Biomass Gasification Technology to China. Part -2. Prepared by IEA, EU and China. Brussels, Belgium.
199

APPENDIX A GLOSSARY
Adiabatic Flame Temperature - It is defined as the theoretical temperature of the flue gas without any heat loss either by conduction or radiation.
Bag House - Emission control device consisting of a series of fabric filters through which flue gas is passed to remove particulate material prior to release in the atmosphere.
Bio-wastes/Blo-deq rad able Material - Fraction of IVISW which can be degraded or converted to simpler compounds by micro-organisms.
Biochemical Oxygen Demand - An indicator of water pollution, which represents the content of bio-chemically degradable substances in a water sample.
Bottom Ash - It the major portion of the total ash produced, which falls to the bottom of the combustion chamber and are mechanically removed.
Chemical Oxygen Demand - The amount of oxygen required for the complete oxidation of an organic matter in an effluent.
Capacity Factor - It is defined as the ratio of the actual energy produced by a plant during a year to the theoretical energy produced (if it were operated at full capacity throughout the year).
Discount Factor - Co-efficient commonly used to calculate the present value of future cash flows.
Fly Ash - All solid particles (e. g. ash, charred papers, cinders and soot) that rise with the hot gases from combustion rather than failing with the bottom ash. This is the minor portion (less than 10% by mass) of the total ash produced from the combustion of a solid waste.
Hydro Fluorocarbons (HFCs) - HFCs are man-made chemicals, many of which have been developed as alternatives to ozone-depleting substances (ODS) for industrial, commercial, and consumer products. The global warming potentials of HFCs range from 140 (HFC-152a) to 11,700 (HFC-23).
Inflation - The overall general upward price movement of goods and services in an economy.
Load Factor- It is defined as the ratio of the actual energy produced by a plant during the operational period of a year to the theoretical energy produced during the same period.
Mtoe - Thermal equivalence of any fuel expressed as million tonnes of oil equivalent. 1 Mtoe = 42 PJ.
200

Moisture Content (MC) - There are three parts in biomass: water (w), ash (a), and dry and ash free matter (claf). MC can be expressed as:
4. Wet basis: ratio of weight of water to the weight of total biomass
, -L Dry basis: ratio of the weight of water to the weight of ash and remaining material present in the biomass
-4ý Dry-ash-free basis: ratio of the weight of water to the weight of dry-ash-free matter of biomass.
Nominal Interest Rate - The rate at which the borrower gets the loan from the lending organisation for investment.
Octane Rating -A measure of a gasoline's resistance to exploding too early in the engine cycle, which causes knocking. The higher the rating, the lower is the chance of premature ignition.
Pathoqen -A disease causing organism.
Particulate Matter (PM) - Mixture of particles that can adversely affect human health, damage materials, and form atmospheric haze that degrades visibility. PIVI is usually divided into different classes based on size, ranging from total suspended matter (TSP) to PM-2. The smallest particles pose the highest human health risks.
Real Interest Rate - The real interest rate is the nominal interest rate minus the rate of inflation, and thus the interest rate is adjusted for inflation.
Sulfur Hexafluoride (SFe) - The global warming potential of SF6 is 23,900. S176 is used for: insulation and current interruption in electric power transmission and distribution equipment; in the magnesium industry to protect molten magnesium from oxidation and potentially violent burning; in semiconductor manufacturing to create circuitry patterns on silicon wafers; and as a tracer gas for leak detection.
201

APPENDIX B COMPUTER PROGRAMME AND CD-ROM INSTRUCTIONS
InDuts Statistical data - agricultural crops generation, forestry,
I
MSW, animal population, land, population, area
I
Default val Residue to prod ratio,
I
moisture content
I
Gross biomass generation by I biomass resource (or group)
I
Recovery Factors Soil nutrition, harvesting equipment,
harvesting cost and efficiency
Gross biomass recoverable by biomass resource (or group)
I
Current utilisation - biomass consumption
Net amount of biomass available for energy
Lower heating value of biomass/ energy content of biomass group
Net biomass energy available for electricity generati(
I
Conversion efficiency I
Total electricity generation potential
Figure 131 Flow-chart for estimation of district-wise biomass, generation, recovery and availability (by resource), and electricity generation potential
202

Specific technology, Area of each districts, biomass availability density by group, energy content of biomass fuel, equations for
economic radius of biomass collection and economic plant capacity.
Biomass availability density >0
No
J Reject I
Default alues Hours of plant operation, number of Yes
operators, per capita cost of operation, transportation cost of
biomass, mean electrical efficiency
Economic radius of biomass collection, Economic plant capacity, total maximum number of plants in a specific
district for the specific technology
Trend equations for efficiency and capital investment costs.
Corrected efficiency, corrected plant capacity and total capital investment costs
Default financial and technical values: interest rate, plant Cost of operation, cost of
lifetime, number of employees maintenance, cost of fuels
FI
and others fixed costs
Total cost of Electricity Generation (US$/yr)
II- -J
Total amount of electricity Other types of generated (kWh/yr)
biomass group or diesel (and dual -
ci Specific cost of biomass electrici fuelled) electri ity generation (US$/kWh) generation
t -FSale -price/profit
margin
I Calculation of PBP, NPV and PI I
Comparison of CoE, PBP, NPV and PI for different options of electricity generation utilising various biomass sources for the
specific technology option
Figure B2 Flow-chart for assessment of biomass electricity plant economics and comparison with diesel and dual-fuelled electricity plant
203

Inputs : Specific technology, Economic capacity of the plant
Default values GHG emissions data of base (diesel generation) and proposed biomass electricity generation technology,
hours of plant operation
Total GHG emissions of both the biomass and diesel I electricity generation technologies
I
Estimation of total GHG emissions mitigation potential due to the employment of biomass electricity
Figure B3 Flow-chart for assessing the environmental benefits of biomass electricity compared to diesel electricity generation
The necessary instructions for using the attached CD-ROM are:
,, 6 Check whether the Matlab software language is available in the computer 4, Open the Matlab and insert the CD-ROM in the CD drive
, %6 In the open dialogue box of Matlab, select the CD drive
,, 6 Open the folder
,, 6 Follow the steps shown in Figure B4 4, Open (make sure that in Files of type box option 'ALL MATLAB Files' appears) and
run the selected file
204

Biomass Electricity in Bangladesh: 64 Distrcits in 6 Divisions
---------------
i
--------------- Choose Division:
---------------------------- -- -
--------------- -------------- Choose Technology:
Gasification Anaerobic Dig Direct Combustion
-----------------------------
Choose Type of Analysis:
Biomass Biomass Electricity Environmental Availability Economics Benefits
Figure B4 Biomass electricity analysis by district
205

APPENDIX C BIOMASS GENERATION BY DISTRICTS
206

0 CL
2
cm 0
cu
0
c: 0
0
T- C)
r3 0
e r_
C, 4 0)
(4 V)
0) U')
Co r_
0 CY
r_ r
Le) 0 Lin
0 (0
cli 0 tr)
(» Co
(» N
0) OD
0) »
(4 »
t L
(D - M 0 a) N N (4 (Z M 0 U') (0 Ln (0
ý-- 0 C, 4
0 CY
(0 -
0 OD Z; 2 - CN
- C. 4 C, 4
ý r-
C) j;
r- 3
ý; ;Z
OD N
r- 0 0 CD
M KO U')
( c21 ýt C, 4
( C) (»
ir) CD e)
(0 (D (0
(Z LO M
(0 (D r-
cli zý
CO OD (0
r-- (4 C,
(0 CD u)
Cli (0 e
Ln 00 (0
CO
le M
C, 4 (0 M
(0 M M
e cm
le (D r_
ýe r. - 3 CJ
Co 9
M r- CO
r- Uli -
r- c4 C,
(D C) 0
00 r-
r- Lir) 0,
(3) ýe r4
00 (0 cd
f- LC) (»
(0 (0
D
(0 r- 0
(7) ;;
- r` 0
9 c9
(D >. m
r- e- o,
(» z9
C) C) 0
;ý 0)
0) U') (2
- C>
ý
t- LO (y
r- LO
(7) P-
r- LO l
(0 C'4
rq -
1-t r- uý 0 C) llt
C'4 re ý;
in -
- M ci Ln 40 a
ci le le (D 0) C) r4
0) r- In CY
- (Z CY r3 0
4 00 -
v) 0) C. 4
v3 LO
e -
) ce
CO C-4 -
, 't (14
e M
(0 OD
9 U')
M (D r)
0)
-
N C, 4
0) r- -
CY
C, 4 OD M &
r3 0 0
0 02 r-
W) e. Co
r4 (» r-
(D ýý e m
Ln 00 (0
- (C) CN
LO Co
r- (D CD
(M (» 0)
e - cq
a) (0 le
C) C. 2 N
00 LC) N
0) r- (3)
cq r- -
M ;; le CI) r-
G e
_M
ýt (0 (» (D
ýý 00
0 (D r)
0 (D ý
CO CI) (0 0) (
- r_ - (N ý
cm ýý (D C) (c) Lf) C, 4 4 - M CY (» -
A " M - - - (D in CD- - - r)
t CM
r- 0 -
(4 r - cq «) M C, 4
r- C, 4
"5 Co - rý
(0 0
r4 Co
r4 U')
tn c9
0 (0
r- Co
Co M
r_ U')
(" ce (D
ý , (0 0 g ri 0 vý N (» 0 e - c"
' <' <O ý; ý! 0) 00
cli n ý5 ei
1-t C) (0
N CY zý M LE)
LO M 00 M in
1
(D g
M C, 4
D C)
g g
OD D
ýý M -D '
M e
e hý
C'4 CY
Co C, 4
C: ) 0)
(0 le
M C, 4
ýt (n (9 (0 r,
1 1
t
1 1 1 1
M 0 C, 1 ( 4 «) le Co (» C 4 - LO e - N - e LO 't ýt
M 0 0
ý
LO Co Ln (0
(n (n -
(4 a
(4 v 0)
0 CY
tn M (0
Co 8
r, c>
M Ln (0
OD le
(3) (14 (0 (D
n (D
c4 ý5
c2 Co r- p2
to M r- f-
M Co (0
00 r- CO
M CY r)
r-- N 2
G
"' M (D
0) e C, 4
G
Co r_ (0 (0
r_ r_ f- M M M M M (3) cli 4 (0 U') r- cl e CIJ M LO to C) Co ? ci ý r- C, 4 C, 4 e LO C. 2 M e C, 4 N
M CM 00
a) (n U') (0 00 M r4
C, to Co
e 0
r- M
«) e2
0 a)
- ci
(0 - Lo
M r-
Ln (0 CO (0
M 00
P- ,
r4 C, 4 (30 0 o O _ C)
m 00 Co (D r- r- Ln 0 - r` - - M
c4 e
c> CD OD ý;
( 4 (N
M M
r- -
LE) r- (n
CO tr) 0) (0
C, 4 - N e
ß_ ý c4 - M - cq ý;
C: ) 00 e)
C> 00
(0 LD
N LO
CY r-
(14 -
le OD CM
Ln -
00 Z
c0 N
o
0 0)
M 0
(0 e 0)
00 LO r-
c> 0 LE) c» CY
(0 0 OD
» 0 0 e
r 0) 0 - 0 - to N t)
, M M C) N CO M V) (3)
r ,ý ( - - - N M
Co M OD
z9 t C 4 e2 (Z
0 CN
CO m
N M
m u)
0 e
0 r- M
(D N (M - " Cli OD M 4 l I I ,
OD (0 Co ;Z Ln 0 0 M OD cm N 0 M 0 0) (0 (» CY r4 r- (N - uýI CO CD (0 r- U') (4 OD (0 (0 0 0, (» 2 r2
(D (4 00
- M
(0 x
00 LO
C, 4 e
e C, 4
«) -
(0 (0 (0
Co ý2
M cq
- (0
le r)
C, 4 0
C) LO
OD C')
M LE)
(» (0
W) M
C) CIJ u; Lt)
OD M C. )
(0 P- , , r-
0 (0 4 (D
CO (0 CIJ - -
r- OD e2
CY ;:: - (» C)
C. ) 0
0 (0 2
2 (n 0 C) 0 - (0 2 2 0 OD 0 0 (D N r4 (0 Lt) M N Co - V) C, 1 - r. - - OD 't Co 0
4 0 N
(0 N Co (4 r-
0) (n W)
- -
- N 0
C) C, 4
LO Lr)
CY) M
Lo 0)
Co C: )
Co CD
to (D
't 0
CO (»
e CD
tr) r_
cz, C, 4
a OD
- (M
C, 4 Lil) cli le
I (D Cý4
Ln -
le cli
i ý N (0 U') V) C*4 , - 0 C» r-
00 C) f- C>
C) t--
00 r-
0 0 0 0 (
r- r-
0 (0
(0 (0
0 LO -e
CD 0 LO
M e
LO 0 (0
(N W)
t N
0 Lt) 0) Cm
Lt) 2
ý; 8 o IO ;Z ,m
C, 4 2
' to C*4 Ln C, 4 (0 -
- : C> (» (0 «) (3) C> t-
c CD
r- r. -
N LC)
P- C: ) (0 C, 4
OD (0
1
lin u ) N (7) -
Cm M
1 ý
- r- (D - 00 cc)
cq (» -
LO a) U') (D -
Ci C, 4 r2 le -
cq -
zý
0 (D
- U') 2 Ln ,7 -
g
M c,: ) CO
0 - M ýt «) CD C» C,
tr) < : > c > I ' C" l- cc)
- M M (N W) rq CI) (0 r_ 1 1 OD (» r
ý li N,
N 0 (0 2 (0» tt- C.
D" In
c4 to - e N M r- CO ;5 Al
N C'4 M - 2 CN - CY
C: ) ,t r-,
t c4 -
(D e2
p- 0
P. - -
M -
C, 4
00 (0 Co 24 r_ r` 00 (4 CY) 0 r_ (D 't LO r- (D r` le 0 0 0 (0 r` le pl e) N (D (»
.M (0 20
10 ri 1) 0
, (00
lti'o CD
c4
-
0 C, 4 ;Z
C) M a) 0) C, 4 Co ;Z r4 M ýý
A (0 CY uý U') N
- (0 "- 0 ,0 - 10 C, 4 CO» r4 a)
C 4 N - r. -
N Co
* C. 4
- - 0
(» Co
C) r-
(0 r-
N C: )
le C, 4
C, 4 M
n C, 4 CID
ry (7)
(D (Z e
OD CI)
Co C) (D
C) C, 4 M KO N (C) (0 (0 cli V) N M - - M c4 M V) OD N U') -
M
4-- Oo (U M
.I
« cm c: 2 M
m Z M M £- cm M
-e M
E Z
- 0 cm M M M 0 ci E Z ý3 M M
.
c (0 r- : 6 cn c 0 c Z E 1; T ,e 2 CL (D
«o M M
0 E :0 E A . cm E 0
- be -
M M . (2- '0 . - C, -, -, 7, - 0 M rý5 > , cu r 2. L . - = 0 . u 2 E
- 12 2 x E M le M c M N cl E m 0 '0 r- c E 0 M _ Z ýa m m M n CL 1 CL 1 M
m 1 CD 1 Q LL. - 2 1 0 Z 1 M üý 1 m 0 1 M u- 1 1 M (D
1 0 (D M 25
1 M
M 2
M 2
m 2 1 M M
Z M Z
Q) Z Co m U)
N 0

O) N *
O r-
LO 00
O) N 00 t in 0 0 0 (D - ý CD
CD C*4 LO
-t 0
0) m
S
N
- o) (
- C) (
- 0) 0 - 0 M LO
0 04
) N 0
r- to
CD V) C)
I
C ) kc)
CD 0)
t -
M cq
- 00
M a)
LO r- C14
4-t ýt
M CIJ
04 0)
C,
CA 04 CN 00 co D 0 0
- r- 0
(1) 0 -
(D co Cl)
0) -
0) C J -
- C-4
00 -
M CN r. -
(D -
00 C) LO ýý
04 Go
0 C) CN Ln 0
co '-*
P_ a)
0 0
CN Pl- u
LO ' 'o
0 '
0 00 ,
(: > " - "' co '
(" '* ýý 00 * co
rl 04 03
r. - (D V) (1)
0) 04 N
ýý Cl) cl)
- P. -
C , N 0) - 04
"' 't -
'D 0 (D -
CO CD
r. - 00
C , Co . co)
(D
04 0
co C-4 LO
(D 00 U)
C) 0 LO
N LO
co 00 --
U ) r-- r
(0 r.. a) m Cl) LO (D 0 - LO r- ce) (14 m Ce) -
t CD - r- CY) 0
IT
--t r-
(D 00
rl_ co
LO r.
0 C. 4
M M 0 c
04 0 0 00 0
00 ,
0 rý- M 00 M '
a) *
C-) N '
M LO tO 00 U) 0) C) Cl) 0) C. Lc)
- CY) - - .0 00 m
9 n oq ;c mr- ý; 0
to - :: - Cl)
- -4
U) LO
t - M C 4 to
CO -
t - (7) (3) 00
(0 r. -
(D 0)
0 0)
CO C*4
(0 0) t-- m
0) Cl)
CDO C> C14 m It (
- U') In ý4 - 0) CD CN U') (0 - (D - Lf)
- Co
Lf) -
0 0
V) 0 ce) N
0 00 0
0 N
0 N
f- N
- W
N t,
LO 0)
(D C*4
C14 Ul LO
- co 0
0) 9 Cl) '
r, - "' "- "' "' - - co ý, r, - ýý' * co C14
j (7) 0) C-4 0) 00 OC) co r- N r-
t) M -
N M
t - C*4 C, M
N U')
(D 0
LO Cl)
00 M
C) ;: V) CO .
co :3
(0 ;;
U-) It 0) G) 2
04 ;)
0) P, C*4 CO --t r-- Cl) '-t q - C )
cli r- (n
I
co
I
- 04
I
co I go
(3) 00 0) 0 (D M LO 00 tr) 00 " 1- 11 11 10 10 111 Oll 10 04 10 " 'It 1- 0) 00 r. - - M --t 0) 0 0) co - 00 LO -t U)
M Lo
CO r- --* r-
M co
C', a (D
r- 0 04 cli
CO r
N M 0)
M CF)
C) l
0 00
(0 -
04 (D - 0) (0
I C, (
0) I
;& (D c , I. - LO LO P, -, t lwt C14 - 8 c) 9 co 00
- A cl) C ) 1 - r- r- t ý
.0 tt V) C) CO < N C') -0 N r- c, 00 04 0 r- - - t-- c It It m
Cl) m co CIJ - 1-t co co
cn 04
0 0
Lf') V)
-t -
en !! t
cn 04
0) C-4
0 (D
- 0)
0 00
Irl (31
a 0 U. ) u 00
LS v 0)
0 0 co
co (D
0) 00
0 00
0 U')
llý 0
00 a)
0) a)
0 U')
00 (D
Cl) I-T Cl)
-t CD
ýý C. ) 0
C, (D N
CO (D
04 N U) ") A " 0) V i
0) W)
C') N co
r--
(-4 8 (D r- (D I C, 4
M ;: ;: Ce)
cq LO CO (D co
CY) w
LO N
OD co
co CD V) 0) V) r-- (D co -q C) co LO - 0) V) C*4 C*4
- U') CO to LO - r. - CD
LO (D cl) Go U) - 04 LO 04 04 C4
m Cr) P, C-4
co f- ;s co
LO tr) 00
co U)
co 0
U-) r-
00 0 Zg M
0 to 00
cl) CIJ
0 C3
'T O
LO 0
LO LO
P- Cl)
- LO ý3 (3)
r I (, )
03 - q C*4 CO
LO 0) 0)
r*- C', 0 0 0 21 -
I - A r- co Cl) 0) m
D CN
4 1-t 00 00 co V) -
LO t
04 ::
Cl) - r- C,
U) . Z;
11 Cl) 04 LO C4 M C) I-- 1 0) (D 47)
0 C,
cli C-4 a)
10 U')
N C14 0
0) CO 00
0 co
1. - ( M 0 0 Lo
e * LO 0 0 00 04 00 0
. 04 CD 0 It 0 co
m C, 4 co
r. _ I-*
V M CD
A '
(Cý P
D V) 3
CD -
c ) C, )
C, t4
000 - C,
q ýý
"t C,
U) .t
00 _
r - .t
CY) M
0) (o
U') m fl- v - t - ( ) cc)
C14 - r - C. )
r- -
(D r- cli
(o ý; Ce) Q C14
M LO Z - - cm
(D I I
C*4 W t W)
C) r- 04 0 CO LO M 0) '-t - (D 00 00 LO CO CO tf) CY) 0 - C-4 CO 0) 00 CO (. 0 -4 00 00 Cý (3) C)
Cl) C14
0) r-
M (D ;; ;5 0
(D CO C-)
r- 1- 04 t- 04
(0 0 - (C)
( (D -
ce) (D '
04 le 8 m m (0 U. ) * - C, 4
_ CO CO r-- C*4 P, A
ý - CD '-*
U) 0 (3)
1 - It
(D 00 (0
C , C*4 - cq
04 U) " "0
N C-) C 4 04
U) It CDI V-
m C. 4 C*4 - C-4 U') Cl) (D Cl) A
C3. U')
0) co
Cv) 0)
Lf) LO
Lf) --t
N (D
N 00
0 Cl)
LO 0
M Cl)
0 0
0 0)
LO 1,
0 CD
C) LO
0) 1jr)
;ý Lf) 00
ý LO
00 r-
LO (D M
C*4 0
0) C14 0)
r-- C,
Iq r. -
LO -
LO 04 0)
04 U')
0) N 90
N ce) 0
C) M
- 04
04 C-
Cl) - 8 C-4 Ce) 0 r- (3) 0) (0 (o r. - 9
co CV (D Cl) C) -
OD Lr) ý;
a) Lr) -
It (0 C*4 04 4 CD
I-t G)
C*4 04 - U)
C*4 r, -
;: C) M
0 -
1- ,
C) -
U) -
N (0
- r- 1,
C 4 ;1 04 1
co cv3 Go
co 2
LO (: )
(0 co
P. "D
9 - 0 LO 0 ý; 0) -4 r, P, ý 1
' 0 0 -
0) W r-- 04 0) .
4 (7) - 00 * tO - 0 ct CD 0 r-
1) (7)
CO o
--t 9
C 4 V CO
0) (D
("S 1
G-) -
L-0 Col lr
- C 4 0 0
r _ GO po- i Lo
(X) '
Lo (50 l
u ) 00
r- C)
A - (D
ýr A
r. - ýt
LO 0
00 - l
CY) CY) .
CY) (D
40 Q
CN (0 (D 04 0) 0) Lf) C-) 00 1
0 1 - N 04
(0 co 03
CD 0)
A 00 r--
1 - (7) c ) r. -
(D 0)
C4 co 04 (0
C*j 04 r-
Cl) C ) 0)
C ) rý
- co
CD, 0) G
M - (D LO (v) 04 to 8
Lf) C*4 Cl) CD 04 C*4 V) CD 00 00 m m m C. 1. - 00 17)
m
0) r-
00 N
0 rl-
CD r-
to N
0) co
CN 04 co
LO U')
Ln N
t- u)
Co Lr) 0)
N a) to
r. - N ;z CO) ýL) (D (
0) r. - t 00 C, -
f. - CD 00 LO m 0 M C)
- M P,
- 0) C,
(D P, 0 00 M
0) 03 LO (7)
Pý M 0)
- rý- LO
00 00
0) CO
co C*4 0) (D
U) ,
D ý;
m C. ) co
Lo m 0) 9
C 4 1: 1
co c) CD 10 't 8 LO
tc) cn
co Iq
(D N
cli -
m LO Iq m
M N
(D Cl)
CD (D C) Lf) I-t CN ;; 3 - Z; Cl)
N 0) C*
04 (0
(3) D
0 I
9 A ;; M
C4 CD
U, co
4 ( q 0) 04 V) (7) CD,
=
m
r_ M e
M -o m
= 2 m
m 'D -E
E f
-E c 0
m 01
, E
a m
. - = ý =,
. - c C 0 M 2 . E
ca MN
-E m
m 10 m 0 '6 m r = e
= z Lo CL - c m :3 P 0 u ýo cu E cm C: m 2 c .5 = U)
l ff -r E C), c m - M
i
m cu - CU - m -Fu (U
m m = m cu m m .T , -- . . s, - Icno U -5 ýlc ýd m z (n CD 0 0 -, ýlc -i z
l lz lz z a. CL Ce (Y U) ý- T- 12 (n ýj 12
U) 0
LL
c 0 W
0) z
U)
0 a (13
(D U)
Mn P
C: )
.0 U) CL 2
CD m te- 0
c: 0
cm %b. - 0
m
00 C) C14

CD C, 4
U) 2 0 LL
LL Ch (D
0
c 0
E
.r 3 Co (D
0 Jo- LL
r_ (0 0 Co U)
U) eý
2
cn . 1. D
LL
E 0 clq 0
ce - u) Co c 0 Co P- u
0 ý <
(» CO CD CD Igt ýN 't (0 N C'4 1- CO LO CO m (0 0 ý ý W! jý c4 I: cý (1 C? Ci Lrý ", I: Cý 9 ci ce (jý
:3 ci CD CD CO P- C» (0 cq CO CD 11- LO ý e C4 Lt) N 00 00 N M N 0
A .2 LO (3)
ý M
LO 0
CO C: )
le M
e LO
Izt (D
r- M
CD (0
(0 le
le ý
ýt N
M Cq
le u3
CD C)
OD nt OD
00 0)
CQ e m
0 0) r- LO
Lin C: ) N M r- (N C» (0
, LD C»
«e M m
lKt ýt ý M ý r- (D CO
r, -
- C 4 LO Y-- M
22 9)
- - i i i
l 1 1
1 1 l i ý ý
3Mý u2
t 0 M ýN
c (» M ý ý C) ' l r> LO LO Cl r, - CD 00 (0 CD ý 0
0 ý ý ý oý cý ri cý 9 t CD cý ci Cý le (: ý c4 lIcý cý -: 9 0 CD (D , CD CD CD e CD CD cö d 0 0 00 0 ý (0 0 0 T- 0 0 0 4- 0 %- C, 4
=, O- ri)
Co Co C» 0)
t* (0 M 9) ýý 0 0 C, 4
xt 1-t
" 00
N C, 4
M N
(» cli
0 (0 OD
(1 r-
r- LD
r4 C: )
M le
M M
N ý
CN (»
(0 C: ) ý r- (0 (» 0
(n 0) 0" - Co rY
m (N C) r-1 LO N
- (0 (» ý C, 2 C, 4 le LO C: )
LÜ (Z CD
(0 ý
C) ä
co (0
L- 4-.
C) 0 LO (0
(N N CO
ý cl N
(n mt (0 (
r r- U) M 00 le
N (0 l
ý u3 CIJ r, - M (1
- (0 '
- 0 LO LO
L CO (n Lo
0) U)
0 C: ) "- (D 00
N C: ) (1 0 r- a
gt e
e c>
0 oo
uý m
r2 m
rý (0
t C: )
OD C-4
Lo Lo
CM t-
c) "
'0 Zü 2 CD ö cý
CD 9
CD 9
0 cý
lKt -:
CD 9
(0 cý
(D cý
0 cý
C) cý
0
o C: ) cý
- cý
(0 ci
e Cý
C: ) cý cý ": t
0 cý c Z 2 CD O O O (D O 0 0 0 0 o o o (» o o �t o
M LL a)
c4 C) 0 CO 0 (D M t C, 2 0 ý CD LO (0 Izt (D (0 M CO N r- CO CO 0 r4 9 Gý c4 q: >ý "I: q-: cý "I: "I: uý lý Gý :: w-: Ilý -ý r�ý ce cý C cý CO 0 le le - (N 0 (0 (D CD 00 t- (n 0 C) C 0 ý 0 M 0 m
W) - CY Co LO M LO
M C, 4 CD
Lo 00 C, 4
c9
A
z-, - r_ r " cm (Z M b. - I 4- 0 m
- (U m
ffi m 2 L- Z
, m m "
- cu E
:3 CL
c 0 cm A
N (0 m
m 0 (U
Z CL -
= M
E L - :3 E (U cm
t. - :3 (U c3 G) (D (Z
0
2 0
- Z Ei c: m E 'X
t- E m (U
(0 M CIL
:2 Z .9 N C
g m
m cu
m
" cu
IM m
M 1
M
5
- M
0- . L- cu
m 1 .
[2 m
,
m
0 Z
C) 0
ci 1
0
0 a)
LL M
2 je M
-. 1 0
Z m
YI- (Z m
1 ,
ß-. M
LL M
(D l- 0
(D E -3 2
0

0 C) 0 CM (0 CD le CD 0 ý 0 (D 0 CD Ilt (» M CD 0 N (Z r1- 0 C) (D M e (D 0 0 0 0 C, 4 a) 0 4- 0 0 (0 le (D (0 0 - 00 M (D CO - 't 0) CD 0 CD OD C, 4 0 0 6 d c5 Cd Lfi Cý ýi d 6 6 cö oi ai ai 6 Cd ri C: 6 6 ci cli cý U) 0 6 ö Cd 6 6 ö CD r. -
(» ci (0 r*-
C) m
ý Co
ý ýr- 0 -
Lo C, 4 nt 00
C) LO
CO m
Co LO
CD CM (0
r, - ý cl
ý M
ýr- -
le r-
(» C: )
Ict m
0
(N (0
0 C: ) 0 (0 (D 0 m (D (0 ý C: 2 0 CD (D (0 0 0 CD CD C: ) - M C: ) 0 CD cý cý cý lxý cý cý 9 CD 0 ei (0 (3) CD Q cý (1 cý cý cý (: ý cý cý e) (D (D cý 9 7 9 (: ý
0 0 0 0 0 o 0 ö d ö cý cc; (D C) 0 le CD (D C: ) CD CO 0 0 0 0 0 0 0 0 0
Co Lin 0 (0 0 0 M r, - m (D (0 0 4t (0 (0 0 (0 LO 00 0 0 0 LO C, 4 0 0 cr)
CD N 0
Lü LO
r- C%j
(N r, - Co l
OD
LO (D
Lü 0
Lü (%1
-e C: )
th CD
Lü 0
Lä ý Ln
C: )
Lä rj
ri CD
Lä LO N zs C)
(» 00 r- LO
0 00 L
e OD
OD (0
(» C) (0 cli m
r, - C) Ilt
(» (»
Co - CO
m (0 p- (n OD
C, 4 CO Co
(D C) in ci
C) (0 ,
C) Co 00
0 OD (0
e2 ýt tý
CY) 00 C: ) (D pl Co
m C, 4
c cý c4 0
cý (D cý
C 4 cý
(0 9 N
C: ) C, 4 't - 0 "
ce CD C, 4 co
cý e 1�ý cz
cý CD 0 CY 0 c: D 0 c) rý cý d (0 m cýJ CD 0 (D (0 CD
0 0 0 Co 0 0 Co 0 0 m le r- e -t 0 (0 (0 CD e (D e (» 0 0 0 0 LO CD 0 0 0 cý liý Illý cý Ilý 9 0 cq m Co 1:: ý (: ý 9 rIlý -ý 9 c: ý (D (» cý -: cý cý cý -: c4 cý cý 0 0 0 (0 0 0 0 0 0 le (N Co 0 0 0 0 (D 0 0 0 co e- 0 0 0 CD T- r4 0 0 (D r, - le CD CM
le C, 4 (0
ci m .a u
im Co
. r_
Cm
c ;5
m - cl " C - fö :3
" -r- 3 ýv- E -
«r- , m
Z Cm :E c ar, 0 Je . :3 - 2 " (0 -0 0 - ro .
£2 2 CL Co Z c C M 2 *E 0 CM m
c]. 0 Cm c Cm
m
:3 0
cn :3 CF,
(D M (Z
" m
-2 9
-0 r-2- -L3, 0 E c3 0
Co
m m :3 M Z
M Z
Q) Z
M cý
m u)
m (0
m )-
m m
r- o )
(L) _c n
m 2
:3 2
(U 0 m Z
- m U)
Cm 0 m -9 0
*ia
(D > b
ýZ -FU
-. i 0 (Z Z
- m Z
m Z
C> 4
C14

0 't e (1 C) CO r3 0 00 OD fl- 0 (» r- 9- (1 0 0 LO 0 M CO
ai 0 CT; a; cli ai Cd lý cö oi (6 1 » ý M ý C, 4 r- (» (0 G) r, -
0 r- CO
Ln LO r-
r- (0 U)
(» N
el e)
CO ý
U) r- OD
tr) U') r- (N CD
f- 0 00 9- (0 0 (9 0 ý M N- 0 0 0 0 0 CD 0 0 (0 p- T- Cl CD ci 6 0 ä 6 6 cý d 4 c; ö
ý 0 " LO CO (0 r- Uý LO M (1 0 0 (N 0 (0 (» 00 m 0 r, Lä -e Lä r, 00 (0 e (D
IX) N le le C)
m M C»
M LO (1
ý 0 (» N-
r4 (0
OD C: )
(0 00 CO
(0 t (1 M (0 %- C, 4 ý C: )
CD (D
CY) C: )
ý 0 C: ) r- ý 0
0 0
10 ci 0
cý 11 C: )
9 0
cý -
cý 0
9 (D
9 ö d c6 0 M 0 o o o
CO 0 U) %- N (0 CO C) 0 (0 M - 00 0 CY) 0 9t 0 0 0) (D Co C, 4 Co ö Lri 4 4 ci (6 cxi ö cý (0 rz CD C, 4 U') 0
Co
m (0 cy (U N m m
E m Z cy E m cm
m M m m (0 ß.. :3 m CM k E 0
.
i m G) m
Z 0- CL ý cu
1: 2 Co 0 0
CO co ca
CV2 C: ) 0
U)
m U) (D
42 (Z
E 0 U) U) m E 0
.0 4- 0
0
E (0
U) w C, 4 C) (D
N

v 0
0 E 17 c Co
C: ) 0 CL
0
, c3 m r_ m cu c- r_ c
0 CL
C, 2 76
0F0
e r- M 0 M (0 le p- 't C'4 CY) r- N C'4 C) CD C» Vi 00 (1 rý 0 OD M LO (0 e2 r- LX2 CO C) cý CY) .
(D nt (D (» 0 M m Co
1
0 C)
LO Co
0 (0
gt cli
0 m
CD 00
Lo (0
rz 0)
od N
>ý OD
m gt
U. ) Igt
c> r1-
. 0 M ":
U') r-.: M (» ý p2 xt c 4 " Cq cq (0 LO " 1- ý C, 4 00 - C, 4 - C%J
e r-4 OD e M - Pl 0 (0 't 0 Ilt M C) N (0 C) (0 M CO C, 4 T- 0 0 U) OD M r*4 LO N N 0 0 (0 (0 CY) r-i N CD cs tr;
l (6 cý
- cý -
Cd oi Cd tz ei f.: Co e r- Ilt rz cs Cli cli 0 c: e r-4 e v M T-- cl LO C'4 C'4 M - LC) C, 4 OD el m m r-
Ci. 0 . . . . . . . . CL
- E2 cý " CO et c73
C) r, -
OD (14
N LO
m T-
le LO
N 00
0 ce)
N (n
OD r-
r, - OD OD CD
(3) C»
C) OD
00 0)
OD (0
Co OD
m Li. )
r- e
:i c» -e ci N (0 r-4 r, cn ai cd d ei Lci vi cd oi r-ý ei d OD CV) (0 rlý C%4 e ýt (0 N LO rY C, 2 't LO Cl r*- CO N (N CIJ C%4 Ce) e C, 4
C) ci (n LO e N et U') (D r, - xt M CD N - CO e r- N e rý 00 , - (0 (» N OD M (0 r, - M (D le C, 4 C» 00 - C%J - Ul OD " C 4 C, 4 N N CY) M (0 C, 4 0 C, 4 (0 e C» CD C» (» M et C, 4 - m , qt M " (» (0 LD r4 C) M C, 4 le - r1- 00 Ce) C> (N LO M C, 4 P- r2 M le 00 00 C) uý 0) OD 00 le (0 0 N LO (0 00 (n - clq ce N N (1 c» OD m r) (0 t- C, 4 - (D - 0 (» e C%J 0) (0 C) CO c14
0 (Z 0 CY3 " CD " " 0 C, 4 - -t le " - - - C'4 - e - (0 CD C%i C) 0 0 0 CD 0 C) C) C) r-4 C) C) CD 0 CD C) CD tr) 0 C) CD CD (0 0 0 CD
. 0
. 0 0 0 CD 0 0 0 0 (D CD 0 CD CD 0 0 0 CD (D
:3 ci ö 0 0 . 0 . 0 . 0 . 0 . 0 . 0 . 0 . 0 . 0 . 0 . 0 . 0 . 0 . 0 . 0 . 0 . 0 . 0 (2. 0 CL CO
1 1 1 1 1 1
-ru c» C» 0 e-
- - - . ,
CY) Co LD " P- rý- (0 N- 00 Le) (0 CY) 0 (0 " 00 ý 00 r- 0 cl LD le (0 (0 0 0 ;2 C: ) Co (» le - LO (0 N C, 4 C» CD N u3 m M C» m (0 OD Lx) (C) (n C» LO ce) N M r2 le (0 xt flo (N C) 0 (0 (n
0 LO C, 4 0 (D m C) 00 cli le Ilt N (0 LO U') OD (0 N C) (0 CD (0 CD e (D r, - r- (0 " LO r2 C, 4 e N M C, 4 C, 2 - e) gt - CO (0 r- e 2 3 0 00 N cli e LE) LO M Cl - Li) M 04 't LO le r- r4 N CO C, 4
12 r. - ý Lx) Q CO " 11- r- (0 Ict ý (» CM CD OD CM 0 C, 4 C) OD LO LL :3 C) n- ý 0 " CD 0 ý ý N M ý C) C: ) - " C) CD ý 0 CD " cý cý cý cý cý c: ý cý cý cý cý cý cý cý cý cý (: ý 9 ce cý cý cý cý CD 0 0 0 0 0 0 CD 0. O. CD. 01 0 0 0 0 CD 0 0 01 01 01
Co q 10 lxý 9 C, 1 -: T7 Icý 11 -: r": Co ID r- le r1- e le le C) %-
-r Co c» Int oi (0 Lo r, - N le c» T- r, N a) le
Lo Pl (» " c» (0 (0 (0 rZ N :
Lo bý Lo Lri H - cs rZ u
0 N ý ý %- CN N (0 e - - ý C, 4
e e r-
N ý
Co ý C, 4
CO C) C)
a) cq oý rý (0 OD N Co e OD ei Lo Ce e r4 N ei 00 (» r4 m C) c m CD e: Lin Co 0 Lo Ci ry C'4 Ci Lii rei cli ei d rz C T- 0
(Z nt C'4 - CI) N- M U') C, 4 "- ý M %- r- x- : - ý C%4
CL e '0 'r! oý r4 -: Gý r": cý ri 11 "1: >ý c4 CD (0 LO CO cý
cö ui e to Co c» e c» N Co e r- r- N m d ei cd (0 0 le (0 (14 CD - - - CN - - N r4 rli r- LO ý 0 co C, 4 N CIJ M e C, 4
0 c
-2
m Im
0
m N m
m o
:3
E *EI m 1.. :3
E :2 Z) Co m Ilý -"j (U ::, r-)- M -0 E r (0 .= CO m a 2 « - C 3) (* 'r: - 0 23 . c M - - E -x . E M -2 m cm r- 214 m «o . - " - 2 N
m rl.
ffl u E Z l (U m C C 0 0 0 m m 0 m m
1 ( U
1 m 0 m CL CL M M 0 L) 0 0 LL 2 -1 Z of 0 LL (D (D
C14 4
eq

M Co 00 r- r4 Co ' N r- C) Co (» CD N N (1 N a) Ilt M u-) N r-i le 't 0 CIJ 0 0 C) a) r- 00 N C) " U ) CO 0 qt N ti) c» N N M r- r, - CO CJ LO (0 OD (D (0 (0 M e OD ei (»
ui CY)
cö le
ai le
(d C
ci cli C%J
tz CD
6 C, 4
(6 e
Lii CO
cli OD
H (D
cli r-
ui r-
Lii Co
c"i c»
ei (D
H Co
6 CD
H 0
Cd e
ni c»
' ' , - 2 uý r4 C, 4 C, 4 T- Cl w- C'4 r- C, 4 C, 4 ce) N CY
0 ) C > CNJ
0 0 (N
p- 0
0) Igt p- 0 N le LO n- N C) 0 0 le OD (0 (0 N C, 4 LO (» 00 C, 4 Co 00 CM N ce) 0 0 CD CO CO C) 0 1- (0 0 U) CC! r- 0 Co 0 C, 4 LO gt e N nt (» (0 cq r, - LO cý r*I: Cý q pl- c4 ce 0i Cl
Cý -
Vli -
(d -
Ö (0
Cj CD
CC; M
d C-4
N 0 (0 ý e
N r4
OD N
0 gt
U3 N
C%4 xt
'-i C-J
CO (£; Ci d C-J
CO gt
, le
N C-J
CM N
e :
(0 cy
rq CY
P- Ci
LO rt 0 r- Ln -e r- f- N Co c» (Z M M (0 C: ) r- N le (0 00 ýt (n (0 ri 00 Igt N 0 (» 0) 00 0 e2 (» (M (» N LJO CO 0 U2 %- t- gt r- v2 M e- 00 LD (» LO N (D Ci cq Ci cý xý C, 4 r4 cli to ri r, 4 M M LO K
N 0
W) nt 0 CD 1. Zi cö Lti 1: c5 cli cý I-: i C. 6 7 ö M U) M N N N r4 M 0, ) to
C%j t e
N 0 CN4
(D ý M 't M
U) r- Cl Lil N (C) CO 4 ) 11- CO CD M
LO cq
M CN
OD N C: ) LO %
e N C j
(» 00 LO %- 0 CO le CO %- le (0 %- (0 %- (» CY> e 0 00 (0 - Igt (» M cli (0 CO LO Co (0 OD CD
r- (0
Co LO
M r-
ý5 N :.
r- OD
N p-
r, - 0 (n Ln
(0 00
Co CD
N CO
cq u) CO
LO u2
(D (»
(1 CO
le (0
(0 u2
(0 LO
e u3
0) C)
C) LD
C: ) cli
(0 't
C: ) (0
LO C, 4 00 OD
CO CD n
CO LO
(0 U-i
N M
(D "
e CO
M u2 r-
OD LO
(0 r-i
OD Lt)
r, - t
N (v)
el ýt
N " LO
LO C) CD
00 (0
LO (D
0 C» c»
CO Ilt
CD r-
CM Lin
M (n
N CD
Co (» Co
04 (» CD
(D ý 1-
M le
;ý (0 C, 4
Igt -
(» C)
p- 0
x- -
(D n
M ý
(D CIJ
C» rY
00 "
ce 0
r- ý
(0 C: )
LO 0
r, - 0 e
ý " M
0 CI)
LO ý
00 CD
- N
CD ý
C» ý
(0 ý
M 0 0 C: ) 0 0 (D 0 CD 0 C: ) 0 C) 0 0 C: ) C) ý 0 CD C) (D 0 CD 0 0 CD CD C: ) C: ) (D " c) 0 0 0 0 0 0 0 0 0 0 0 0 C: ) 0 CD 0
. 0
. (D
. 0
. C: )
. 0 0 0 C) 0 cý cý 0 c2 0 0 6 ö
1
ö
1
ö ci cs cý d 0 0
-
0 0 CD 0 C) 0 101 0 0. 0 . 0 . 0 . 101 . 0. . 0 0 0 Ö * 0 ' I'D ' c>
CY) N e OD '
Lo (0 LO 0 0 0 00 OD 0 M xt (0 ce) CV2 Co cli r, 1 ci N rli r- C, 4 (0 (0 Co N ý 00 (0 cn -
U ) ý CD C, 4 (0 (Z) rli (» rý ý C: ) 00 (0 le (0 N U-) (0 N M r, - N Co e (0 gt p3 't N M %
LO ,
(0 0
0 N
0 (0
LO r-
CO LO
(0 (»
0 v-
CO U)
UJ (0
p- OD
M (0
(Y) cq
(0 n
r1- CY)
" (0 't M
(C) LO
C) (»
le C)
CO -
Cl ct
, pl
N ce
N -
00 CO
Co OD
C'4 CD
gt C%j 00
ei 00
C) C» 00
C 4 t- CY)
CD N (7)
(» r, 4 C'4
ý CO r1-
r*j r- N
C» Lin gt
(0 00 (0
f- M N
Lin le C»
" C) Izt
e cr) ý
(0 n 00 :. (0
00 00 CD
r2 C) CO
e C, 4 N
e - (0
CF) CD 't
M - LO
(» cq 0 - CIJ M r, 4 00 (0 (1 e CO le le xt (n - CO N 0
cý CD cý
C cý
(D cý
M cý
(D 9
" cý
ý 9
0 cý
CD 9
C) cý
N cý
ý cý
0 cý
" cý
" cý
C) cý
" cý
0 cý
0 cý
CD cý
P2 ý cý
cq N cý
Co ý cý
(0 - 9
Co C: ) 9
r4 ý 0
r_ C) CD
OD " 0
(D " 0
(» c) 0 0. 0 0. 0. 01 0 0. 0. 0. (Di o OI CD 01 01 0 01 01 01 0 01 01 01 (D (DI C: )I CD
P. ý (0 (0 T-- CY (» 00 1- ct N uý -" >ý (0 (7) (0 Co 114: IC! (» r- vý 00 't nt rq (£ý ci r- CD ö 4 H ci (d M T- rz Lti l': d r4 ri rq ,
LO
- Lfi 4 . CY (0 - c; 0; " Lti C6 Co . e- Co ci : U) (0 CY N r2 e2 xt Co M M o M -e M (0 c» e
r4 M C, 4
r, - 00 U) r- 00 C) (0 C, 4
C, 4 C, 4
Co - 0 e c4
U') M
le le xý C, 4 le c4 N r4 liý C, 4 r7 �t - (0 M e Liý uý Cq fcý 00 Co M (0 114: Uý c: ý PI. r*- Ilý v
LO C, 4 H '
C') Co (3) le t- C"4 Lii C') N (0 4 r- Co Co - cd (c; cý CD (0 cq Z
ri :
c> e c ) T- u ) c» N- M C, 4 C, 4 C, 4 C, 4 e2 e2 C, 4 ý C, 4 ý C%j
M N r4 M Co 00 (0 '
c» c4 r..: cý N r1. N (n (» C» (0 CIJ 00 Igt r2 M Le) Cq L6 ai cý Cd Lii Lti U , t-
cs -t r- Lo U-3 Cý (D Lfi (n c» C: ) Lo d (0 cý ci -, i cc; ý- rz -4 �i rý 4 C, 4 CD v- N- C) (» r, - CO C) " C) M (D (1 C) LO N LO (0 r- N
C, 4 C, 4
(D C%4
[in (3) C'4 r. 4
cl r-
(0 (j) - :3 'E m E- c3) c: r m m cm 0 c (0 cm 0 C - - - .. M
2 :9 M m m CL 2 (0 - tu
E c
c) cm
0 m c 2 0 L-
2
- M *r- L- 0 CM :3
0 (0) (U C - :3 - ch c (0 32 Ö E (0 (D
ID -0 l
L--1 -- 1 1 1 Z Z Z üý
1
U) U) 1 h-
1 Co
1 0
1 -23 -
c» l) 0
Co Co . 5; c2
_M (D
>, 0 -5
ü Z ýZ
M . -i
0 Z Z
i
Z
i
rn --4 cli

(0 CY) P- 0 (0 m CY) (0 C» r- C» e rý La e r, - W) CO N C) oi r, ý: rz ci -4 H 6 Co ad cý 4 ai N e CO in Co m CY) (» r- (N Co C)
N C, 4 N C, 4 C, 4 N OD C, 1)
P- 0 (D M (0 CM P- C, 4 m N CY) r_ Co
. Co
. q -: cl N .
C) .
00 . vý r*-: cq 9
C, 4 - CO (0 0 N M CO r, - C) r- V) C, 4 le 00 LO M 1- r» " r- le LO
C) CM
(Y) rli 0 CY) r- " Lt) M 0 (0 N ri 0 (0 m 0 9. - M cl
1: (6 (6 (£; LO U-i
0 (0 C) N ui 0 LO Co Co N Le) (0 U') CO N C, 4 r- C) (0 Cl N 00 C) cn CY) LO (0 le N lqt (0 (0 0 (0 0 N- rýJ 0 r- r-
uý C, ýj N lqt le 0 T- (0 le r-J (0 (0 C) (C) N (0 r1. 0 CY) N Izt CY) 0 (0 CV) C, 4 " - «) 0 C) C: ) C) 0 (D 0 0 0 0 C 0 0 0 0 0 0 0 0 c: ) 0 0 6 ci d ci ci ö d ö ci d cý
(0 cq Le) N (N N m r4 C) rq C) N N
f- LO
ý; (» ci l
m cli 0 m OD C) CD C) LO C, 4
e m im
N le
(0 OD
N Co
CD 0
(n rl_
00 CY) le Cl (0 -t 00 V) " C, 1 00 r- cz r- U) -e 0) Co rý m 0 le V) CIJ (0 CO 00 C, 4 (0 " CD " " (D
0 0 0 0 0 0 0 0 0 0 0 ö ö d ö ci ö ci c> CI C2 0 4t (D (» T. - OD N M C) 9. - OD T- M
ai N 9t C) 0 LO Le) CO r_ 0 (0 " r- C%4 nt (0 ý t- LO M LO Lf) CY C, 4 C, 4 C, 4 N C, 4
C, 4
ný r- (N u3 e LO C; r.: N (0 e r4 (6 wi tz r4 4 C, 4 ri 11- le M r- - - - ýt r4
(0
ý .
U') .
cl <e q": <jý Le CY m cl <jý "I: ýt C, 4 0 r_ 0 P- m . (» . cm C) P- to M CO r- %t 0 N C: ) u3 le OD 0 e2
.c m 0 N 'EI x: Co m _c :E ß- E (0 (0 m
» (D
E rL cm
CM Z] > C E
m 0 C je CM 3 Z (D a = M CU W M (L) = (u m :3 -5. ,
-c 0m Z 0. 0- cr- W Co
- ý--
- 1:
-2 . u)
. co F- m
c1r) 0 C) C14
t5
-Cf)
0
M m C3. 0 CL
ca
CD co E
w CY)
r_ 0
-e- Co
-1
c2. 0
CL
0 CL
-ffi E
E m LL
Rt 0
. C2 «0
E
cli (D 0 CY
C) CD C: ) C: ) Li) m LO C, 4
0 CD C: ) CD (0 r- LD r2
0 CD CD C) C: ) C: ) ce) LO
Z Z: (0 (0 co ý c» CD Co (0 c» C) rý- Co v- le C) rý-
CD CD CO (O CO C, 4 le Co
C'4 C, 4
(1) 0
(D (U ?;
: 5 m l l i0 (-) ( i c
_0 M
cu m c
750 0 C: ) Cl. c cu
U) 0 LL
cu C)
0 C) C) 04
.0 cd E m
-M- m 0 k-
.o 9
C14

A (7) C) (0
(D 0 -
m N 11" M
pl 00 e)
0 'e ý
(1 CD CD
Ln N Co
M C4 ý
C) C: ) e
m ;5
e (C) r-
in (n 0
t C) 00
rý- (D
le OD -
P- CN
(» fl-
0 0 CD CD
Ul) (D
' m -
Co t -
Co CD 00
(ý) Cj
m _
00 -
CO -
CD le
C, 1 (n
Co r- M
C) "
Co a)
M CO
r_ r_ 0) - t - Co
- (0
C)
co CN CN
N N U )
cn Lo Co
Co e C, Lr)
0 rý- Co CO CN - 't
le 0 00 00
rý C%4 C) C)
M CO
CO r- C, 4 r- (n (N LO ui Co «) (N e> Lin LO C) C'4 b- >- (0 M OD
C, 4 OD
Co OD
[,
mm r- 0
m cj (0 r. - r4 CJ M r, - (0 cn Co (0 N E c. 4 cy m m " m r4 m ce) e v 2,4 cy cy e - -
- -
e C4
C) CO
LO CJ C4 (0 (D Ce) C'4
Co N
a) N 'e
LU
. ýl-
o (0
ý (» U') (» CD
C» t- in
(N
(0 00
Co N r
N (N
;Z m (n
0 CD
N kr)
r4 U')
(D 0)
CO LC)
- r-
0 00
e (0
U') CD
Co 0
e 00
Lo m
e r-
N (N
00 (»
C: ) CZJ
CD (0 e U')
m m
OD r-
(» CD
cm e
N CD
cy) CD s
m o (» r
2
CY CN ý5 0
- N
(0
CD N
r- 00
,
3 Co LX. )
0 e 11-
10 CD
ýý CD CY
cq 0
M r-
00 e
CD 0
rY (D
0 Co
(» N
rý- Co
r_ (0
M M N -
m Co co m
0) 0A 0 0 CD (D (D 0 CD 0 CD C 4 (D
-t CD 0 (D
CD c> 0
r3 0
CD a
(D 0
, c)
- 0
(D c
- (N - C) c> M 0 - " CD - C: ) (N 01:
b- (D CD O O O O O O
ý cý cý cý cý cý Ce cý g g g cý cý cý
j2 O O O O O O C> O 0 0 0 0 (D O O CD C> CD O C) C:, cD CD C> 0 0
(D .0
LL.
E Z 0
. 00
wo
It) e
(0 0 CY
C, 4 " Co
CD
r, - 0
Co
0
�, Co r-
m
- 0 -0
0
0 ýý
Ln C, 4 Li)
00 0
m 0)
N r- ,
LO r--
U') a m
c%j e
CD 0
C-14 U')
CN M
0 Co
N 00 ý (0
Lo Lr)
OD "
c LO 00
(0 r, -
- r-
e r-
C, 4 ce
N LO
" (0
(0 C)
ci v)
;2 r- Ln
(» Ch
n
M (D 3
«) -
m r-
CY C'4 m
(0 -t m
c> - N
(0 c\I a
r - CD m
(0 CD
rj (D CI)
m e CD
Co Lin -
cy Co (D
- U') U)
1 - (0 to
e N m
cm
a
00
N (0 m C%j
0)
» C'4 N m e r4
oo CN CN
00 m
CD CO V) M M r4
M C'4
CD -
M e
M M CY C, 4
N - ý 0C C) - c )
(3) 00 CY
Co 00 (0
(0 (0 0
f- 0) N (D ce
Lo rý
(D C, 4
ý (0)
- r_
m (Y)
- e
(0 C»
r- le
Co CY)
(n (D
c9 00
Co m
(Y) 1-t
h. f-
U') (D
r- U')
0 r, -
cli to
(0 Co
CD CD
3; le Co
0 m
c3) P-
(4 0
(0 8
(0 (E
«) C) Co N 0 r-
e 0
r- (n
- 00
(» OD
C-4 ý
V) U')
M (0
Co OD
r2 ý
0 KX3
- cy
CD (D
(» -
le CO
M LQ
U«) CO
00 e
ý N
Co (0
C'4 r)
LO 00
C) 00
N N
M 't
(0 Co
:r (»
(» L£,
" (N (» C) - OD (» (N C) (0 - (0 OD (0 C) e U)
t - N
Vý U) to
U) LO
co c» LO
e e
cý) (1)
CD 't
U, ) Ce (0
CD C, 4
_ (0
_ e e M
N c
e C)
e e
0 Ein 4 e
0 (0 CD 01 W C, 4
c m-
U) m
ý (3) :3 N
f- r-
u3 (N l
0 Lo
m N
r, (N
CD (0
u3 ci
r- -
' a)
' e
LO Co
Co (0
CY (0
(M CY
CD (N
ý tn
r- (»
e «)
r- ý
- CD
f- M
(0 (1)
(» C'4
N t-
N CO
CM -
r- 0)
ý N
M CD -
Lt) M -
ce N
CO (: > CL
(L) 0 C)
ý (0 " e -
M CO C)
M in
A - -
M C: )
(Z r-
CO C)
(» N
(0 e
V) Ul)
c> 11-
r- C, 4
(3) u3
- "t
3 (0 N rý- (N e CI) CIJ 00 '
;e ý m r-- Co m a C 0r c)
c) cý cý cý cý c c c c c - c
I
Lo m ý e CD
U ) e
C, 4 m ý ý 9 ý ý ý ý cý cý cý cý cý 9 cý cý cý cý cý cý cý cý
LL 0
E :3 r4 (» N N N M U') r- N m LO CD 0
CO CD M
LO LO
CO -
ýt (D
LO LO
- 00
CD C, 4
cq CD LO
0 C, 4
Lo (N cli
CD cn 0 Lo ,
(0 Z
c CN r4
M (» m
0 m
- 0
m N
0 0
m N
r- 0
rý m
m LO
m (0
N m
CN m N
m vý
(0 m
m "
le 0 -
m m m
e 't
m N
r- 1--
cli m
m cli
e m
V) m c> 0
e e N
U) - e
C 4 3
C%i 0
(M (0 m u3 e ,
M - m 0 0 Co M (N N lý e N M M e - M r- M 2co C 4 e ý CN C, 4 r4 C'4 ý - 0 ý CN C, 4 ý ý ý e
C)
c LO C: )
LO c, 3
Co (0
(D LO
r- r-
e ý
a «) OD
rý- (y)
r- ý
(0 (»
(0 LO
- CO
LO LO
M 00
(» (0
C'4 (»
ý Cq
CO 0
ý oo
(» -
(0 <: >
m CD
0 C%j
n (D C
M C4 (0
00 Cy
0 e) M '*
Ln CN
- LX')
e M
'e t«)
LO 'e
C» ('4
OD CID
1X3 LQ
M CO
r- 0)
N 'e
(0 W)
e Cy
co LO
N V)
r- 0
cD (D
0 OD
Lo CIJ
r-- CM
M ýt
C, 4 Co
e O>
n (D
C, 4 r-
N C) o
CM
m 0
zý CD r4 c,
N '*
o el
N -
ch le
(» C, 4
o ce c4 m
e N
m Co
C) ci
<: > c%j
e) -
- C, 4
p` M
cq (0 (0 M
LO M
e CY
00 le
C'4 LO
CIJ C, 4
M C, 4
CO -
N 0
0 CN - LO
- CN
C: ) CD C'4
cN CD r3
CD CD CO
0 (0
'01 c: - (0 to
ý (0 0 (»
00 (0 Co
CY LD (0
e LO
0 W)
(Y) (D
0 a 't
OD 01
Co U)
0 N
(» In
m 00
0 -
r. - N r-- (0
Lo m
Co Ln
rý CD
't CI)
LL) Co
00 C»
0 00
Co -
r, - C» cli 't
e CO
(D r, -
- r, -
0 (»
0 ce
Co <D
Co m
Lo -
CN -
(D m (0
a) r_ ý 0 C'4 CO (3) "
CO (0
Ln (»
ce N
r- C, 4
m (»
Co C, 4
r- ý
ý 00
c) Lin
(c) Co
r- Ict
cm le
-t (0
e le
c» m
e C>
C» Co
tc) 0
(3) 00
u3 -
;2 n (N
C, 4 e
(3) 04 -
CD e 00
Co r-
a) c»
; 0 CD 0 - 0 CD c) C, 4 (D - CD e (Z a (D - in
c d ci d d d c:; cý cý cý 6 cý d cý cs d ö LL 0
Lin 0
L13 Co
to m
ý (V)
(4 (»
(N CY
Ln Co
c4 -
0) W)
CO (D
(0 C)
0 (0
- 0)
CO e
(» (0
m (D
0 (D
(N CD
(0 1£3
(M 00
m -
C: ) t-
(n e
r) CO
(0 N
OD (D
00 C»
le (Z
0) -
m m
(Z CD C) m Z
to (0 Ln
(» e2
m Ln
CD N
(» (N
- (0
CD r4
Co le
- M
Co -
C, 4 a)
(0 -
c» 0)
ci m
m c9
m r-
(D CD
CIJ N
Cl CD
CY C)
CO CD
CN ý
ci LO
(0 m
- m -
Co U') CD
CO e N N -
C) M
(0 t
(» CJ
Z (» Co - e
(0 C-4
e cl -e
0 CN
m 00 (n
oo CY
Lo M
C-4 r-
<D C'4
r- - m c9 - e CN M
CD r)
- C'4
cm .t
e :f
(» U-3 cq
CD 'Kt e
(» Co Co *
(0 �: r
CD c»
(n r-
�t <D
CO c>
C 4 e CN N
4- C)
m
e r- :, N m 0
ri
m Z CM :3 r ' «c3
M c :3
M M Co
JNo _äe M :3 ci m E 1 0 cr,
= m M 2 E m m
E m m
:3 Z, " cm - C: 2. <L, "
a -r -
m cm
cy. :E
in c 5ý
r- C, 0
-, Z . c - Z = E :S U) 21 G, -r- *ö 0 - 2 ' c m ' m m :E
E )< E - Co Z
Je m
cm c m
. N 76 cl-
ca E
0
-r- m M - : ý5
C 0 C 4) E E E- *2 2 (u
.0 M 22.
a) M cm
Z :a m M M m --) I jl. al *cl. M M U ( ) (3 M ýe M
11 0 Z1
M X
m u
m (D
0 0 -- 2
(Z 2
m 2
:3 2 . - - 5 2 Z Z Z c2 l co coi
tn 4
C14

I-T M CO
0) - r-
1, - C) CO
0 00 M
lot Itt ý
0 Q 0)
N 00 N
00 r-
M A
LO CO r-
0) -T ý
r- CD CD
ý ý
r- 'T -w
M to It
It (0 U)
ý r- 00
(D rl- LO
00 - 00
-t 00 t-
ý 9
CN C14
CO r- Cv)
M M 0
00 00
00 t--
0 0) *
0 -
M N
ý C14
It 0)
(D 0)
M 00
t'- CO
LO '-T
M It
- U) CO
0) U)
-T C*4
0 (D
CO 00
0 -
r- U)
r- CO
(0 04
(. 0 0)
00 CO
C> 0)
C) C>
A
C) C. 0 r-
- Ce)
U) 00 Cl)
0) (D U)
C 4 C) 04
- r- LO
0) co 00
M U) 0 C)
CN Cl) CD
q M C14
(D Pý 0) 00 Pý U') N
0) q
to - M 0) u)
C14 - ý 04 Ict
0) -
C', 00 Cv) C14
0 ý
04 C14
U) M
C) C14
t C) C14
CO -
C14 c, 4
00 c, 4
CD M
C) C*4
C) 0)
CO) r-
Cl) U)
00 0)
00 -
0) Iýft
Lf) ý
0 Cl) 00
00 U) 04
r- 00
U'J ý
ý Cv)
r- N
0 Ul
r- 0)
00 LO
P- Cl)
ý r-
00 1'-
cl) 00
CO CD
V) N
LO 0
- ce)
r- -t
U) cl) co - co r-
CD M N
(D r- U)
0 U)
fl- (D
- CN (S
00 Cl
-t N
I, - (0 CO t
(D r
0 e
CD M 0 -
U) 00 '
0 l
04 LO 04 OD M M 0 CN 0 0 0 ý CO Cl) N ý -
- 0 -
N C ) -
00 CD
CN -
U ) -
(0 0
q -
C ) CV
0) -
0) C)
CO -
C) -
I-T -
00 - 0 0 0 0 0 0 0 0 0 0 0 0 0 0 0 0 0 0 0 0 0 o o c: ) O c: ) (D O O O
C;
-
6
-
C5
-
6 C; C; C;
.
C;
.
C;
.
c;
.
c;
.
C; C;
-
c;
-
C5
-
6
-
6
-
C; 6
.
C5
.
C;
.
ci ci
.
C; 6 6 C; c; 6 C;
(0 CO)
(0 Cl) C')
(0 0) r-
- CD C) 0
0 CO r-
- (D tO
CD 0 0
M 1ý- N
LO - C14
CO t-- CO
'IT CF) 0)
M 0 r-
(3) z9
0 - M
0 C*4 C
Cl) C) U)
0 P- l
00 00
M 00 e
0) 0)
CD N N
1
1-- 00
04 -
- Ce)
CD " Itt
M CO U')
0 00
0) u)
04 (D
M Rr
r- 00
04 M
U) ce)
0) (D r-
1ý- U)
r-- cl)
- 00
I, - O
(D CD
:r 0) 0)
CD N U')
CO U) 04
C ) LO (0
CO 'q C)
C ) N cl)
U) Iq 00
00 M N
04 M
C 4 (0 0
U) CN f-
0) - r-
ce) M 0)
U ) C14 cli I%. Cl) CD CY) 1ýý rýý (D CD 00 to U) 0) cr (D C) u. ) 0) 00 00 0) It 04 (0 M 00 Cl)
. I
M
I
ý
.
ý
I I I
CN T CO) C14 ý C14 Ce)
I
. .
I
.
I
.
I
.
I
CIJ 04
II
-
f
- -
II
ý cq
I
0 (D
Iýr 0)
co 00
co 8 fl- 0)
N C14
0 CO
A CC) (0
Cl) 00
M CO
CD -
rý- '-T
Lf) 00
CY M
IT 0) ý
N 00
0) C14
It N
CY 00
- M
", CN C14 0
00 ;ý 0 LO Itt co
- 11
(D co
0 rl-
(0
-g 00
g M
q Cl)
C') 0
ý C*4
m q
cz 0)
0, 00
g CD
0 ý
c, 04
I'. 8
U. ) -
0 C14
't U)
-0 CN
.0 CIJ U')
(3) It
CO 0) C\l
00 - -
4 Lf) IT
3
00 C)
04 CD co
CIJ (3) (D 04
ce) CO W')
C14 C. )
C? ) t-
0 Itt (D
C14 M
0 V,
M (0 00
M (D U) 0)
0 U)
U) r-
0) U')
-T (D
'cr CO
0) r-
(. 0 00
- LO
CO) CO
ýt t- CO
- 0)
Cl) Cl)
04 V)
- M
U') oo
r- N
0 0
N -
t- ý
M N
CY) (. 0
0 00
C14 'T
ý :t
U) CO
M 0
0 (D
0 0
0 cl)
ý 0
ý r-
0 'T
r- -
0 ce)
0) r. -
M C>
00 'T
ý 0
0) CO
Rt r--
rý- CD
CO ý-
N- -
M CO
0) r- LO
- r-
CD C)
M 00 00
C) 0)
04 Cl) u)
- qtr
00 -
0) cl)
C14 I--
C) :r
C14 fl- CO
LO 0)
C) 00
0 00
V) CN
N IRT
It I-T
Cl) M
0) -
1'- 00
U-) U')
I- CY)
IT - M
00 00 C)
0 - 0
Cl) 0
C14 0 0
- 0
0 CD 0
C) 0
C*4 0
Cf) 0
It 0
C14 C)
- 0
N CD
- 0 cl) 0
- 0
ý C)
C14 0
04 0
- 0
N CD
M 0 -
0 C14 0
C) 0 0
C) CD
C> 0
ci C; C; ci C; c; C; C; C5 C; C5 6 C; C; C; ci C; 6 C; C; C; C; ci 6 C; 6 C; c; C; C;
U) 0)
04 C) U')
CD N C)
CD ce) ý
CO co CO)
0 ce) P-
04 c) U)
V) (M f-
P- '-T C)
(3) 00 ( 0
r- V) Lf)
0
'-T
04 CO 04
CD A
CO CO
CD C) (D
00 ý
ýZ C14 N
0 --cr
IT - -
0) ý
04 ý
1- It
N -
0) "
11' - l
Cv) CO
CO CY)
C) CO
Itt V)
C-) Cl) C14
04 ý;
ý C) M
LO CO ý
LO r- C%J
N Ce)
co r-
. C14 V) V)
LO CO N; r
00 0) Ce)
- 0 ý V)
-ct ,T 04
- 00 fl- LO
V) CO
04 M CO
04 (D C14
r U) CD -
ý - '-T
0) CO ýQ
N ýT r--
CO CV) rl- l
C ) 00 Cv)
CO r- CO
- M Cf)
-t CY) C14
04 04 V) C) N V) 'T N c )
LO U) 1ý-
0) I- 04
0 N (D
0) 04 U')
CO N r-
0)
0)
M M co
Q Q LO
U) 11 -
00
(14
8
r-
(0 Lf) I-
0 Iýt N r-
0 (: ý
0 00
' t: r -
Ce) Itt
8 C) C)
r- C14
T r-
C14 C)
LO 0)
- - CC)
0 r-
Cl) -
04 1-t
CN U. )
CV) N
Nr CD
LO 0)
LO LO
00 U')
N to
N Itt,
0 04
00 00
CY) 00
00 CO
I-t It
fl- to
It 1, -
[1- 00
0) 0) -
U ) LO 00
co 0) -
- LO 00
0) ) 'T 'T
r. Cl) 0)
00 LO r-
(D U') LO
U ) r- CIJ
- q,
r-
C%J rl- N
CD N r--
0) - CD
LO I, - C14 Cv) 04 (0 'ýT M 0 N - It (D M Ul C14 'V CO) I'- M CII IT '-T N 0 (D U) 'q 11' M LO 0
r- 00 LO V*
0 r- V)
CD - Pý
CO Lf)
04 N
CY) CF) 00
Cf) It: r
CO 00
C14 ý
C) V,
0) ý
0) 00
00 C)
00 -, T LO
00 Ce)
r-- 00
r-- 04
N (o
N -
LO C)
LO U-)
CD 0)
0 CD r*-
N C) 00
9 0) r- -
'-t M V
U) CD
r- V
;! CN (3)
Cl) CD
C14 r-
0) -
00 0
N M
CO C14
0) CD
ýO N
04 -
N CO
U) P-
U'j 00 It
co V)
00 C)
1, - CO 00 (D
(0 It
00 0)
00 0
0 C) C)
N 0 0 Q
- 0
C) 0
a 0
0 0
ý 0
C*4 0
Cw) 0
C14 CD
- 0
- 0
ý 0
M 0
- 0
- Q
- C) 0 0
- 0
N 0
04 0
- C) 0 C) 0
C14 0 6 C6 C; 6 c; ci C; C; C5 C; c; C; c; C; c; C; C; C; 6 6 C; 6 6 C; ci 6
0 (D
A C14 ýt
V) M
C) CO
8 Lf) V)
CN CD
00 C14
0) N
CY) N
0 -
r- P-
Lf) (0
- 04
it) 00
(0 CD
0 CY)
CO U')
M CD
N CY)
Lf) CD
0 Cl)
CD It 0)
r- Cf)
0 t-
Cli 0)
It M oo
CO 00 1ý
CD 0) C)
00 00 0)
C) V -
t- 1--
Iq 04
U) U) 0
r- Ce) 00 CN
LO U) 00
(0 CO 04
0) r- 00
0) 0) M
C) t- 04
C) C> OD
00 r-- 00
00 0) P-
(D 0) V
CD 0 (D
04 C) 00
- 1- LO
C) 0) C-4
Q ;Z
o)
(0 - LO -
CD V 1-
N (D 04
-ýr (7) Cl)
00
(D V V) OD tr 04 T N cO C, 4 C, 4 co M Cq c, ) LO , zr v co v) v v
M
m
c (a :3 to 1- -C3 (o E -
* c ca cu co r- a :E " *E
C 0 cu -
tu N m
cu -E m 'D 2
0 V .a , = go EL
- a CU r -E :3 (a C 1
E 0
0 M a m cu E cu (a (u M co r- cu m a a
m 3 a > n cr, E
C7, (D
:3 0 = 0 3
CY Co co
- (o
Oll a
m
- -0 Q >
0 -2 D E 0
co 0 1ý -ý: Co cl = co .0 .0 M c Co
CO - ff
r cu (D M = M cu
=3 r
m -) 1ý4 12 1m lm lz U) co 0 0 n R -j z z zl z zl a o- a. 0ý cr U) ý- = m co-
m CD
(Z
Z Ci. 0
0
(Z 9
0
L- (D
.0
m
LO 0 12)
h-
\o

C5 References
BBS (2002). National Data Bank Statistics (www document). Bangladesh Bureau of Statistics (BBS), Ministry of Planning, Government of the People's Republic of Bangladesh. htti): //www. bbsqov. om/ (accessed 12 th June 2005).
BBS (2000). Zilawise Distribution of Holding Reporting of Livestock and Poultry Birds and Their Numbers, Chapter Five: Agriculture, Statistical Pocketbook of Bangladesh. Bangladesh Bureau of Statistics (BBS), Ministry of Planning, Government of the People's Republic of Bangladesh.
FAO Forestry (2003). Country Information: Bangladesh (www document). FAO. htti): //www. fao. orq/forestrv/foris/Webview/forestrv2/index. 'sp? siteld=5081 &sitetreeld=l 8 308&lanqld=l&qeold=31 (accessed 15"' June 2005).
FAOSTAT (2004). FAOSTAT - Agriculture Data (www document). FAO. http: //faostat. fao. or-q/faostat/form? collection=LandUse&Domain=Land&servlet=l &hasb ulk=&version=ext&lan-quaqe=EN (accessed 1 1'h June 2005).
World Bank (2005). Country Data Profile - Bangladesh (www document). The World Bank Group. htti): //devdata. worldbank. or-q/extemal/CPProfile. asr)? SelectedCountrv =BGD&CCODE=BGD&CNAME=Banqiadesh&PTYPE=CP (accessed 19th June 2005).
217

APPENDIX D FEASIBLE TECHNOLOGIES: COST AND EFFICIENCIENCY
218

c 0 -b-, cu
Co (9
O
CY) (»
-
= (U Z:
= (0 Z:
:E U) c
- - (D (»
«a c
10 c
m
c4 0 0
Co m (3)
C»
- Co
f; cu
m C» CY) *
- u2 (3)
- U') c3)
- U') (3)
- U') (7)
- Ul) m
- to C» u - -- m (0 C) C) 0 M M (» M C) CY)
Q c -, (0 -* Co
- 9) cu -
cu - V
- c a)
- r_ (D
(Z i- Z
- r_ Q)
- c (D
- c U)
- c 0)
c G)
c (1) (n (0 U) U) CL U) U) U) (0 0 U) U) U) (n U) U) (0 a) c m m (0 m m
0 2 m m m M cu
Eý6 CL 0>
CD (0 Co W) r- cli CN N 0 C) CD M Uli U3 cq CY
ci Z- (D f- 00 cli c3)
to Co Co Lo N ui -: ýe cö cd (0 C'4
0m ý; 1
CD b 0 CL
c ;2
08- m m 6
q 0 U')
11 111: r, - C, 4
1 cn e 0 1,1 0 , ei ci cö C, 4 c: D v) 0 r2
E (D E;
0
c E- 0
r- E- 0
r- E r- (D
r- C- 0
cE 0)
r- .5 r- r_ r_ r_ r- - 2ý ?
0 cr. 5r - Ct) G)
0 cr, nr *n- U) Q
cn (n c (0 0 U, c
U) (D
0
C
0 cr * r. r- (n 0
0 cr. r. c CO (L)
0 cm F, ) c U) 0
0 *: 2 c
0 : L- c
0
E 0 : tl_ c
00 0E
2 r- CL 0
2 r_ c2.0
(D s- c c2.0
G) -C CL 0
0) - (D -2
0) -c CL 0
G) -C CL 0
(D -c c2 0
cm -0 2
. 2)
0) CM
1 (D Im
»- (D 9ý. Ee E ': 2 E 1-2 E z22
r m a. E =E E ': E . E ZE:, - r
ma v c3" tu a r cu CM r r
Co 0 0 0 c:
L) LM Cl.
Co ol 0.
ca 0 CL
CO c2. (0 0
00 o «0 13 (U -s - CD
m 15 Z m 0 0
m U)
Ea E -25 0, ýc U) m
U) :3 « 3'
m e U)
Z .2 mm 0,1,
«a m (D
c3 0
«a 0
«a 0
«a C)
u) G) M
(D m
m (D
a 0 10
0 «o 0
m 0 0
ý: ýE 1 2
ig -Z»-
0 ý:
0 1 ý:
0 : -5
c31 >
u3) A -: S
ly- .2 CY-
0 ýi 0
ý: 0
ý: 0 E
0 0 c2 0 0
A U)
AM U)
AU (A
A (0 :3
m 'FA
m m m m
0 c 0
(D c 0
Q) c 0
G) c 0
- (U Z
G) c 0
M M c M
C%

LO
CY) C» 0 0) C» CD
CD 0
(» 0) (D 0 C» 0 00
C) :3 0) 0) m C» C)
(13 cli C: ) (3) (3) (3) 0
Z C) 0
Z a) C) (3) CD C: ) C, 4
0
(1) 0) 9) c 0
c Co s s 'M c
m M (D G) (D 0 m r_ 0 ci
Co
u) Co U) . . - c
m U) U)
Co U) U)
U) (0 «1-- E w 0
w1 9) (1) 1 U) 1 U) 2- (D 1
m m
(3) C, 4 ce)
P- P- m
" " M u-)
m (D rý le le
CO le
CO le
(N r-
(0 e,
(Z) (0 C>
Co lt
8 Co c3) M OD Co Co C, 4 (» m
00
Co 0 (0 (0 uý N 0 0) - cm Lin
cý
N
0 0 Ln 0 Ln 0 Lin cý LO Co (D C) C: ) 0 0 (0 (0 0 0 ce C, 3 ce le lqt e U') (0 N (3) N e
CD E
0 r- r-
' c 0
c 0
(D r E
r- 0
c 0
c 0 CD
r E c .2
c AD
0 c E-
0 r E-
a) r r-
c 0
a 0
c: 0
0 cm rn r- u) (D
0 Er, JS r- u) (D r- P LD)
- 0M r- c: A
r_ A
- C) CY, 0
: 22 r- Lm
A:! c M A
- 0E @C (1)
-. 0 cm U5c 0
- 0 u-, r- 4)
r- P
r_ 0
r_ 2)
2 r- CL 0 E zr,
2 r- CL 0 E" :e
0 c:
* 0
e 2, 92.0 E': 2
0) r_ -
G) r_
< L, c:
U) 2 r- CL. o E a
0) - r-
(D . r-
Co G) r- Cl c) E ýP
u) 2 r- CL 0 E2
in 2 r- C2.0 E 2
(D e (D 0 .
r- 4- 11 r- C-1 Co a 0-
cu c m
CY. m c, r
1
l) Co 9) M CL U) W
m c2. cm co
r 0 _ r : Co a. CL C
U) 0 Co a. CL C
U) (D 0 r- 0 r- :
0 r- m (2. Q
Co CM CL r- Co 0
M c2. u)
8 b t 1 10 11 0 6 18 1 1 11 9 8 18 8 61 1 Co
3: 0 :3
Je 150 (0 0)
10 0
m 0
:3 r_ m
8 M 0
«o 0
:3 m
0 T3
0 Z
M-
0 0 Co
3ý m
m 0 0 0 0 0 0 0 0
10 2 2
0 0 LL
c: N m c:
(0 r_
m r_
r_ c: :E :E :E
C> eq C14

,e (D
0 u
C, 4 '117 Ilt
CD cr)
Co 0 (» (N 0 Co C) CY
- OD (D C) - Co C)
Co Co r4 M c -ffi (»
- Co Co - Co C) (D
(Z C» CY)
G) 9) - Co
- -
(13 C) 04
> m . L-
c (0 c Z
0 > m
> (93
03 c a)
0) c Co r_
0 : 73
ý m
C) Co
N Co
0 0
00 C, 4
0 r4
r4 OD le
9 8 8 1
ul
C, 4 8 C, 4 LO C. 2 m C, 4
0 0 C, 4
CD 0
0 0
0 0
0 0
90
OCD 0 0
0 C)
0 C)
0 0
CD CD
O(D
CD CD (D P- CD 0 m e) LO n U') 0 (D
kc) CD CD LO U')
- c4
0 0 c 0 0 0 0 0 0 0 cu m m =ý UM 0 *e '2 2 :e =, = :P c3) t» 0) Am Am e 2) Am c m r_ Am 2) LM Am
03 -Le A
- 15 A
.
(D c
. a)
-d. C (D C i5 0
C -25 a) C i5
. (D c i5 (D
_X c u)
0 c <D
r
(D g0 0
a) c
-- 0 0 (D 5 (0 c2. c m CL c Co a)
Cl. C m Cl. r-
. m CL r-
. ma c2. r-
. m- c2. c:
. ma ia. r-
. m- CL Er, m CL r_
E5 -a jý 0 >
E Z 0 , - . E -U e 0
u) (P U) 0 ci j- c
U) M
0
0 E (1) -(g 8 8 1 0.2 0 ý: ,
8 * 8. 1. 0 cu ýE 3: * > ýi
, , 0 CM <2 1-
.- 8 a 0ý ý: CI) M . cu ýc
32 M LU
421
m m m U ,> ' m m m m m - 0
0x M 12 tr- cr. u- Q U-
1 ci U- 0 0 0
a D
U- 0
U- 0
U- 0
U- 0
-d _i5 m cu m E E M M M
V- m m :E :E 0 G) m m X-- m '0
C14

0) C) 0) 0
cy I ci
l a
E
r- &0
CD
cm CD
M a)
(D E
LO N 0 0
E «o M «a M. 9
0 92. a
45 75 z
10
a)
2> .a
U)
.0

0 0 0 <2 CD Co (D Co (0 0 0 0 (D
N r-
CD W)
CD Co
0 CD 3 «)
- V) 00
C%j
0 s 0
CD 00
(0 m
00
0
0 v-
C: ) C» Co
0) le
m ý cy A CY
0 t') C, 4
0 0 0
0 0
(D 0
CD ý
Ch C» Co "
m (0
CD C, 4 00 m
ý - C, 4 Co
0 Le) 0 LO
0 CD
C: ) e)
Co ci CD
0) OD
LO lzt
c
0 M O 0
(0 4
(3) k0 " ý5
ci Co 0 " v2 cli
9
Z, Lu 0 r- 0
C) U) "
Co (N 't
6 (7) 00 C, 4
0) c
0 (D CD (0 Co r4 CY)
Co
c4
(0 Co
ui CIY
00 Co Co CD f- 0 (3) (0 (D
r- le
0 Co CY
V) " tt)
Uli Ilt
(f) C)
(D im (0
0 0 (0
8 0 (» 00
8
CN cli
CN 9 (0 (DJ le le
8 0 (» 8
0
-ýI 0
13) Z
- te (0
-
U) -
(D C> (Z C'4
?E 'F 0
14. -
to M U)
E (D
E E E
8 c @0 (D m A w 0 u) = -C3 Q)
U) - of r . -
fo> U)
M c . - c :2
U) - in cm - j2 0 E
0 0 0 0 0 A w I: L 8 g
IV II
U ) ý -
(0 0) 0)
E
0 z 12 . G,
0
CiN r (D d) (D
"a m
. Smo c, S Cý Uý 16 0-00
CO o ('11" _jw
U)
mm0
m
. F=
U)
(Z E 0
.0
.0
en (14 C14

a 0
cn Q) 0) 6
2 (1) cu c
CY)
C
Co m (D 0
8 c
T c
m m CD C)
C) cu m c
2 0 0 cq cli 0 C4 0 cu < 0
Tli c
LU w - w
c0 CL) - «ä (D m :3ý:
,E Me .9ý a) > CL U) te
Co 0 4) 4)
> a) c c2 (0 -
0
(0 m (%A
Co le
CY Co m
m c, - ' C) 13 a
W 4) Co cli Co C, 4 cm
0 C) CL c: 0
W
(N 0
CD C: )
0 CD
CD
0
E> .r0 CL E
CL c c -Le 0A
En 0c
(U. e a ,0 r- - .2c E LD c
: t2 ý0c
cc o a) c- cc u) E c2. r c2. r- r m c2. r- r 2 c:, c2. Cr
' E sv2 CL: s. c:
0 MO E -ui M0 E M0 E c» 0
0
l " c» C (D
14- 0 l ýp -
(U Kn 0 (D
-Z - C
ts a: 2 3: c Co
M CL- cm cn (0 0) 0
m :E U) CL a0 C, 0
Q Z
c» cn G) 0 > cm
0 0
m :a
0.0) r< e: 0 M0 c: » u)
m 0.0 0 cm u). R (D cu cm
m cm
LL G)
E2 0 0) AM 0 2w--0 LD 0
m2 O(D
o. P 0 iß 2 r-- -0 = 2 m .2 m
< < < Co Co D
c: ci zo Em cm E 2 CL 0.8 io 1 8 8 8 1
11, C4 C14

C) C\l
0 C) N 0) Co
0 (10 m Co c (n m C> Q C) Q) C)
< LU w LLi
CL
w
C, 4 P-
u to C, 4 00 (0 't 03 (D C» le
r4 N Co
0) C%4
CD ce)
N ci
N ce)
0 LO r) 0
r- ce)
0 N LO Co
0 0 0 0 0
(0 't
0 id) -i - -
C) 0 (0 0 U') C: ) 0 C, 4 r4 CY r) e2
C (L) 0 15
M .- cn
r- 0) 0 r- m cm
C a) 0 r-
M. -
e (D 0 r- *e a m.
e0 0 (U
C (D 0 m
C G) 2. r- :2 '
r- 0 C) -, " ': e C 0)
! !
r- 0
CL r CL Cr MO
CL Cr CL r- r CL r cm r
r, m 91 r, M c2. E
u) . CM m: : c2.
:2 c2. r
MO
Je ec p CM c) 0 t E 0) B. 2- 0
Bt -co) .. ' 0
E- 0 m C»
Mm E
M 0) E U)
-k G., 0 m 3. l a). p u) 0 ý m ýc 0 ro m ä: El r- < 4
- r_ m
x tr_ x q_- (0 (D e:
0 LM 0
m C). cm
m c; --
0 CL cm
m m G)
m CL- -
0 a. 2 G) - CL 0 0
� oý cm AD
0e t» U) cm 00 06 Z
' gla 90a con 0.00
0) 0 lz a) 0 9)
0P0 -
m cm .2
0.0 m0 cm CO . 5z 0 0
e:
0) Lm m C» 2
,
. «0 C» (n '0 00
0 :2 i72 2.2 E Ei 2.2 ra i n 2 v- m 1--, 6 m a) 0 FD>=*u . m i72 x 2-3:
Co < <
U)
E
W)

C) C, 4
Q
0 0 c4 (U .5 cl. - Co
0 M m c Co C»
00 0) r_
m y7 0 m .
w > w
Je je 0
0 ll V3 V)
N N
C) Co Le) cý 8 0
0 0C 0 c: O c (D CL 0A M (D
A m :e e . L3 &
r- r CL r_ 0. c 3) (D U) M C c: CL
- U) 2 Cr Ci.
- , cl. Cr
m u) L CY 8c r- ,
c3" =c
.
üß (D 9t (0 (U :1 .
m (U
.2 LD 0) 2
cm 2
m m . m . m
CL 10
tö 0 m0
E
CL r- (0 m
w=
m 20 22 9,
10 Ci. Co ro Z0E
8.5 Z 09 ýB 0 rz r-
< (0 .2 (D ý; 4D 15 0'
ch 9. > p : ir3 75 . - CL 0
0A
E «0 0
r- 12 a) 00 on 0 u) M-b -ui r
.;. L-. L LI)
Co g> gl", 3 JM E F0 in- W, o', '
(0.0 0.0 0
Cl)
cu
0 E2 (D c (D 0)
Cf) cu
0
(f)
.0 0
co c C13 Cl) W co E 0 0
0
M
cu
S) 0 4H LU C-1) a CD
IC C4 N

C)
0 C. ) 0 - ý 0 C) 0 (0 - ý ý 0 0
0 0
0 0
N (D
(N C)
0 0
0 0
0 0
«a (0
M 0
M 0
c4 c: )
0 « (D N
(D N « «
(n 1
LL «
C) N
0 cli
0 r4 o M 1: 3 ý - a a 0 a ý ý -
W W 0) m cm 0 0 > je > w
Q) . c- . c- r- ý: . r-- .g . r--
E 0 0 ý:
cý U) U) U) U) U) 0 0 im Ir
0
m " c> 9
m 0 » N- Q) ta (0
1 le
c (0 N r- Co 00 Igt (0 't le xt
>0 CO C. 0 Z)
E
cx Co a)
r) 0 m E
N CY N ce le (0 (0 (D r_ 00 0 -
0
0) c 2. Z N
:3 cl. m Z im. CL
0 ci r
- r -
r - 12- Z .E Z .E co
(D z
(D z
(1) z
0 : , ,
0 2
Z m 7ö M
'ö *o
Z m
"0
r- 0
> 0
2 «o
r- (L) Q r
(D
(D E 0 (Z
n E (0 ---1 0
2 1» 9> 2 0 0 0 1D ID -o E E E E E E E
(D cm 0 *0 0 «o 0 0 0 0 0
0 -
25 h A 25 k5 25 25 25 IL U- LL LL LL U- LL U- LL
cn (D
0
-7a 0 CD
CD
(D CD
i3-
Cl) cu M 0
0
0
E U) (D
(a
(D
-0
r-

r_ 0
zrZ
m
0
ce) 0
ci 0 C) N 0 CD 0 0
a) m m Z - - 76 m (»
CD CD
CD 0
(D (D Co
(0 CY)
(0 C»
C*4 l"5 - 0
C» (3) o G)
(D 4) (D A Co
E m -2 r_ > > Co ri Mli m >
m 0 m m 2 2 2 : L--
c (D
i§ a)
.8 e r--
Co r-
Co -
m r- F. -Q)
CL mo
C) (D N
0) LO
V) C, 4
0 - r_
*b ' 5- (L) 1
1
m m m E ru- a) Ln -
Co Co CY N
(0 N
(0 e Co Co (0 N
(3) C, 4
OW .- 0 x . 0 (D (D CD (D r-
cm Co
ci e CD (D
0
1
ci E e- MM 2 u) (1) Co -tz m
E8 Z 2' Z je AD
0 0
in 0 r
u) ZZ 2.2-0 M
ý: e 0 ý: e c - CD) < 0 FD
0 cn 2 *1 9 . 6 8 ý-- (Z 4 U- Co ci U)
c C3) E cm r0 -
73 C c: :CMr E
cm c cm c c» c cm c a r_ w_ uo 0
E c- 3 E- c» E- E c- (0 -E E 0-E CL
Co rc - U) U)
. U) U)
.
U)
. U) (D m 9)
1 (n
. >- 00 U ) (D m -COil
p ig -25 15 15 « 15 c Z m :S
m E m E m E m E a C
m
0 Z c a) c (D c a) c (D Co .9
c G) < C) 0 lz 0 LL
CO
U) tu (D 0
c 0 > 2 CM m
00 C14 C14

8 C C) 0 C) 0
-ý -7 cu m m Co m m - C, 4 . M
CY) (» - N - rli
(3) - -
CD (D (4
C) 0 C\l
a) (1) Z 0 a) a 43) c> C) (D -
« c> Ch
e 0)
(D C>
m 2»'
- -
- C, 4 c Co N (» U
M - cu cu a c c c
(U 0 - - m m
> m m
(D E
> M ui >
m m w
E w 0 N
c N
L- l- V- T- . L- ý: Of Z cy
ý: ly- m <
Co m m 2 2
LO 0 C) m ce C) - Co - (D (0 Co N cli m Co «) C, 4
C, 4 CY C, 4 I N C'4 1 cn
0 0 0 c> C> C: ) 0 0 0 0 0
0 0 0
0 C)
0 Ch
CD (D
CD cli
C) OD
CD C: )
U') U')
0 CD
C: ) C)
(D (D
C: ) W)
(D i£'i
c4 N CY m CI) e2 le (0 Un
(D .b 0 ' 2 0 . 23
Em T] 3: G2
«t3 ,'
'0 0
73 0
«a 0
«o 0
3. 1
-) ZZ 2
m (0 (U (0 U) 12 ý: 9 U) ý:
LL
m 0 ý: 0 ý: 0 ý: 0 ý: 0 ý: to Z r_ 0 0 cn LL Co
CY) C 0) .
m r- (D m
c3) 0 (D 0 r
e U- A
2 2 2 0 Z 2 2 :3 Z) Z -- Z 2 ý 0) E 2E 0E f 0) E E -0 E E E 0-
«a E ' E M .
rM to T M 90 T U- m (1) (0 (D (0 0
u)
c 0)
c 0)
c a)
c G)
ii m c a) c «o
AM U) (D
(0 r 0 T] m m
IM U) W c2 u)
Lm . E- :0 .Z 0 *E 0 W
0)
0 0
x 0
E 12 0 0 12 c
j2 - m
_ 10 2
-m m U- k- w
Cý
C14

(0 CY) (0 0) (D C) CY)
G7 (»
0- CD
s 0
C» (» 0) (» a) C: ) 0
0 (D a)
G (0 le JA ja jg jg Z , -
0 - ,
9 v C 4
CD
EL
«a "c3 0 u _ tu (» Co (0 (0 (Z (0 Co C%i r_
M r_ CU
(D 0) w Z»»
a) E 0 8) 0 0 0 0) 2
w ý:
E m
E m
cy (0 ýD m Ln e (» (» (D C» m
Co le
CN (n
m m
1: r rý
i3 (14 LO
C» (0
ce 't
fl- OD
1
1
CN
1
1-
1
CY CY
1
C, 4 N 93
1
W) c4 6 1
Ce le "q r*.: (0 9
Co cý (Y)
CN , CY ei I
r4 n
0 C: ) cli
CD (1) 1
n N
11- C, 4
0 0 0 0 0 0 C,
c> c> 0
c3 0 0 0 0 0 0 (D C>
C) (D
0 0
CD CD
rý 0 (0 0 0 0 C: ) (D e
0 U)
CD
E Z, e: (D
2 U) G) (0
b c (A .2 LL - 0
0 T) 0
d (n 0 U)
m 0 0
0 (0 u- 3: 0 LL -2
L- 90
.- Co 0 (D " g (1) E
=M r- 0 E 0 =m
E - Co
C» «a 90 Co r- c cu c 0 0)
- - 0
i2 E M
.0 2 E E
(0 E A D 0
c2 * j, "E - uc) (D
r_ 0 . - (D m
LL m Co LL cf
5 (D m0Me cc in A (0 ö 0) * «o .2 :e
c >
-M0 c -A (
:2A
0 (n u) Co 2 EL E -U) ý:, 5 W. B 0 (0 Co Co 2 k- cm m- an
LLa (0
73 c c
0 13 c
< < < < CI) CO Z) Z
2' 2- r_ 750- vZ
a -
CL -
CL -
CL -r
(-) c () w cr_ w
2 P- Im (D
- a. ui
a. w
1 - w a. w
----
a. 2 lW
c2.
ci.
'0
,a r_ 0
cu .0
.0 E
U) m E 0 0
U)
(1)
F-
(Z ff) CN

D4 Diesel Generators
Brand/ Manufacturer
Electricity- generating
capacity (kW)
Electrical efficiency
N
Reference
5 25 ITDG (2004) 10 30 Siemons (2001) 10 23 Stassen (1995) 14 30 Jorapur and Rajvanshi (1995) 30 25 Stassen (1995) 40 30 Siemons (2001) 50 35 ITIDG (2004)
100 28 Stassen (1995) 160 35 Siemons (2001) 500 45 ITDG (2004)
Caterpillar Inc 1000 34 Willi (2001) Caterpillar Inc 7500 44 Willi (2001)
Table D6 Electrical efficiencies of diesel generators
Brand/ Manufacturer Electricity- generating Cose Reference
capacity (kW) (US$)
F(US$/kW)
- Imperial Diesel Generator
20 6500 325 Independent Power S7s te ms (2004)
Perkins 24 6840 285 GSO (2004) Perkins 32 7825 245 GSO (2004) Cummins Generator 32 8175 255 GSO (2004) Cummins Generator 40 9125 228 GSO (2004) Cummins Generator 50 9925 199 GSO j2004j Perkins 52 8885 171 GSO (2004) Cummins Generator 65 10925 168 GSO (2004) Perkins 80 11375 142 GSO (2004) Cummins Generator 85 13375 157 GSO (2004) Perkins 90 12350 137 GSO (2004) Perkins 120 15396 128 GSO (2004) CCP Daewoo 125 18225 146 CCP (2004) John Deere 125 19750 158 ADG (2004) CCP Daewoo 150 19750 132 CCP (2004) CCP Daewoo 200 22700 114 CCP (2004) CCP Daewoo 250 26150 105 CCP (2004) Cummins Generator 275 31750 115 GSO (2004) CCP Daewoo 300 33250 111 CCP (2004) CCP Daewoo 350 35500 101 CCP (2004) CCP Daewoo 375 44600 119 CCP (2004) CCP Daewoo 400 45100 113 CCP (2004) CCP Daewoo 450 45900 102 CCP j2004ý CCP Daewoo 500 63700 127 CCP (2004) CCP Daewoo 600 69500 116 CCP (2004) Kato 1050 105000 100 Utility Warehouse (2004)
All costs are In September 2004 value
Table D7 Cost of diesel generator systems
231

D5 References
ADG (2004). Diesel Generators (www document). All World Diesel Generators (ADG). http: //www. allworlddiesel-qen. com (accessed 10'h November 2004).
Ahmed, K. (1994). Renewable Energy Technologies -A review of the status and costs of selected technologies. Energy Series, World Bank Technical Paper No. - 240. The World Bank, Washington DC, USA.
Alanne, K. and Saari, A. (2004). Small scale CHP devices - Technical features. Renewable and Sustainable Energy Reviews, 8,401- 431.
Bhattacharya, S. C. (1993). State- of- the- art of Utilising Residues and Other Types of Biomass as Energy Source. RERIC International Energy Journal, 15,1-21.
Broke, R. V. D., Faaij, A. and Wijk, A. V. (1996). Biomass Combustion for Power Generation. Biomass and Bioenergy, 11,271-281.
CADDET (1995). Landfilled Gas Fuelled Power Plant Using a Lean-Burn Engine. Technical Brochure No -11, CADDET Centre for Renewable Energy, IEA and OECD.
Carlsen, H. (1996). Stirling Engines for Biomass: state of the art with focus on results from Danish products. In: Biomass for Energy and the Environment, Proceedings of the 9th European Bioenergy Conference, edited by Chartier, P. et al., Vol. 1,278-284. Copenhagen, Denmark, June 24-27.
CCP (2004). CCP Daewoo Diesel Generators (www document). Central California Power, USA. httr): //www. qensets. com/CCDS Daewoo Diesel Gensets. htm (accessed 18th November 2004).
Desi Power (2004). Advantages of decentralised biomass based power plants (www document). Power to the People, Desi Power, India, httr): //www. desipower. com/whý/-advnt-q biomass. htm (accessed 1 Oth October 2004).
Devkota, G. P. (2003). Biogas Installation and Training. In: Training course on: Biogas Construction Training Report METTA Development Foundation, The Burma Sustainable Development Project, Myitkyina, Myanmar, October 30-November 14.
EERE (2002). DOE and USDA to investigate power production from manure. EERE News, August 14, US Department of Energy, USA.
EPA (2003). Current status of Farm-scale Digesters. In: AgSTAR Digest, United States Environmental protection Agency (EPA). Washington DC, USA.
GSO (2004). New Generator Sets (www document). Gen th
Set One, USA. http: //www. qensetone. com/diesel-qas-qenerators. htm (accessed 16 October 2004).
Independent Power Systems (2004). Imperial Diesel Generator Specifications and Price List (www document). Independent Power Systems, USA. http: //www. independentpower. com/r)rice. htm (accessed 30th October 2004).
232

ITDG (2004). Diesel (www document). Intermediate Technology Development Group (ITDG), UK. hftp: //Www. itdq. or-q/docs/technical information service/diesel. pd (accessed 1 Oth November 2004).
Jorapur, R. M. and Rajvanshi, A. K. (1995). Development of a Sugarcane Leaf Gasifier for Electricity Generation. Biomass and Bidenergy, 8,91-98.
Kapur, T., Kandpal, T. C. and Garg, H. P. (1996). Electricity Generation from Rice Husk in Indian Rice Mills: Potential and Financial Viability. Biomass and Bioenergy, 14,573- 583.
Kartha, S. and Larson, E. D. (2000). BIOENERGY PRIMER: Modernised Biomass Energy for Sustainable Development Energy and Atmosphere Programme, United Nations Development Program. New York, USA.
Kirjavainen, M., Sipila, K., Savola, T., Salom6n, M. and Alangas, E. (2004). Small- scale biomass CHP technologies - situation in Finland, Denmark and Sweden. OPET Report No. 12, Contract No. NNE5/2002/52: OPET CHP/DH Cluster, European Commission.
Kranzl, L., Huber, C., Resch, G., Schriefl, E., Tsioliaridou, E., Negro, E., Ragwitz, M. and Laia, C. (2004). Technology Evaluation. Altener Programme, Contract No. : Altener contract 4.1030/Z/02-094, European Commission.
Lensu, T. and Alakangas, E. (2004). Small-scale electricity generation from renewable energy sources. OPET Report No. 13, Contract No. NNE5/37/2002: OPET RES-e, European Commission.
Leung, D. Y. C., Yin, X. L. and Wu, C. Z. (2004). A review on the development and commercialization of biomass gasification technologies in China. Renewable and Sustainable Energy Reviews, 8(6), 565 - 580.
Lin, D., Jingming, L. and Overend, R. (1998). Biomass Energy Conversion Technologies in China: Development and Assessment, China Environmental Science Press, Beijing, China.
Lora, E. S. and Nogueira, L. A. H. (1998). Technonoeconomic Evaluation of Gasification Technologies for Small Scale Electricity Generation from Biomass. in: Expanding Bidenergy Partnerships, Proceedings of BIOENERG Y '98, Vol. 1,473-488. Great Lakes Regional Biomass Program, Madison, Wisconsin, USA, October 4-8.
Martin, J. H. (2003). A Comparison of Dairy Cattle Manure Management with and without Anaerobic Digestion and Biogas Utilisation. AgSTAR Program, Environmental Protection Agency (EPA), USA.
Mcgowin, C. R. and Wiltsee, G. A. (1996). Strategic Analysis of Biomass and Waste Fuels for Electric Power generation. Biomass and Bioenergy, 10,167-175.
Omer, A. M. and Fadalla, Y. (2003). Biogas energy technology in Sudan. Renewable Energy, 28,499 - 507.
233

Picken, D. J. (1989). Internal Combustion Engines for Biomass. In: Biomass Handbook, edited by Kitani, 0. and Hall, C. W., Gordon and Breach Science Publishers. 600 - 604.
Podesser, E. (1999). Electricity Production in Rural Villages with a Biomass Stirling Engine. Renewable Energy, 16,1049-1052.
Quaak, P., Knoef, H. and Stassen, H. (1999). Energy from Biomass: A Review of Combustion and Gasification Technologies, Energy Series, World Bank Technical Paper No. 422. The World Bank, Washington, DC, USA.
Ravindranath, N. H. and Hall, D. 0. (1995). Biomass, energy, and environment, Oxford University Press. New York, USA.
RWEDP (2002). Wood Energy Database (www document). Regional Wood Energy Development Program in Asia, FAO. hftp: //www. rwedp. orq/d database. html (accessed on 21th September 2004).
Schmidt, D. D. and Pinapati, V. S. (2000). Opportunities for Small Biomass Power Systems. Energy and Environmental Research Centre, University of North Dakota, USA.
Singh, K. J. and Sooch, S. S. (2004). Comparative study of economics of different models of family size biogas plants for state of Punjab, India. Energy Conversion and Management, 45,1329-1341.
Siemons, R. V. (2001). Identifying a role for biomass gasification in rural electrification in developing countries: the economic perspective. Biomass and Bioenergy, 20,271- 285.
Stassen, H. E. (1995). Small-scale Biomass Gasifier for Heat and Power. World Bank Technical Paper Number - 296, The World Bank, Washington DC., USA.
Tafdrup, S. (1995). Viable Energy Production and Waste Recycling from Anaerobic Digestion of Manure and Other Biomass Materials. Biomass and Bidenergy, 9 (1-5), 303-314.
TERIIN (2004). Renewables in India (www document). The Energy and Research th Institute, India. htti): //www. teriin. orqlrenew/tech (accessed 13 December 2004).
Tripathi, A. K., Iyer, P. V. R. and Kandpal, T. C. (1997). A Financial Evaluation of Biomass Gasifier Based Power Generation in India. Bioresource Technology, 61,53- 59.
Utility Warehouse (2004). Diesel 1HF0 Engine Generator Index The Utility Warehouse, htti): //www. utilitvwarehouse. com/infol/dieselqenerator. htmi (accessed 12 th December 2004).
Willi, M. (2001). Reciprocating Engine Gen-sets in Distributed Generation Applications
- State-of-the-Art Development Building Blocks Enabling Technologies. Caterpillar Inc, USA.
234

World Bank (1996). China Renewable Energy for Electric Power. Report No: 15592- CHA, The World Bank, Washington DC, USA.
Wu, C. Z., Huang, H., Zheng, S. P. and Yin, X. L. (2002). An economic analysis of biomass gasification and power generation in China. Bioresource Technology, 83,65- 70.
235

APPENDIX E RESULTS BY DISTRICT: KHULNA DIVISION
El Gasification Electricity Group A: Agricultural wastes and forestry residues Group B-I Gasifiable/Combustible parts of IVISW and Group C: Poultry wastes
E1.1 Biomass Availability
2,
E C5
----------
Bagerhal Chuadenga Jessore Jhenaidah Khulna Kushfia Magura Meherpur Narail Satkh, ra
Districts of Khulna Drvision
a
236
L Mýqurý Wh, o, Na, ad Satkhird
Districts ot Kr)LIna Division

lf, ý
U 4-
:.
0 District, ot Khuina Lrvisjon
E1.2 Total Electricity Generation Potential
07
Me, e, p,, Narail Satkh,, a
u
a) 06- -:....... t .......... ...... . ...... ; ---------- ;ý......... I:
....................... .......... ------- a
,w04......... . ...... ---------- --------
0
----------
..............
---------- mom L
Bagerhad Chuadongs Jessors Jheý.. dah Khulna Kushlis Magure Meherýur Narad S@tkýlla
Oistricts of Khulna Dmsion
237

E1.3 Plant Sizing and Economics
14
12
10
LU
A
7M
sm
40
30
LLI
2u
E3, omass Resources
ECONOMIC PLANT CAPACITY
: i- I I,,,, fýescurces
239
I P, I (-
F, )NoNi, C HADIUS OF BIOMASS COLLECTION

COST OF ELECTRICITY GENERATION COMPARIOSON 014
A (GAS) B (GAS) C (GAS) A (DIESEL)
0 12 ..................... ........ ......... . ....... ............ --------- B (DIESEL) C (DIESEL) A (GAS AND
B (GAS AND C (GAS AND
---- ------- ........ ......... -------- --------------------
M
9
008 - -- - ----- --------- -------- ------ ------------
006 - ------- - ------
U. 1
ocw ------------ u
002ý mlim Maim mi III milli Mililill Ellin imm maim MAHE Milli
777, = 777 -Ito Magura Meherpur Na ra i,
ý' AIILýý ir Kruina Dwsion
SIMPLE PAYBACK PERIOD COMPARISON rA (GAS)
8 (GAS) C (GAS)
4b................ ......... ---------- I .......... I ......... =A (GAS AND DIESEL) mB (GAS AND DIESEL) mC (GAS AND DIESEL)
................... 4 ............................ .....................
... . ............... -
--- ------ --
-- -------- ----
I h- ýgs iosore Jhenaidah Khulna Kushtia Magura Meherpur Narail Satkhira
DistrictS ot Khulna DwSiOn
239

NET PRESENT VALUE COMPARISON
A (GAS) 6 (GAS) C (GASý A (GAS AND DIESEL 8 (GAS AND DIESEL C (GAS AND DIESEL
ic .
.......... 40
>
CIL ru
- ---------------
5
45
Ij
1 11
1
, J, h Kh. 1n. Kusht, a Magura Meherpur Narail S@tkh,, a
1), stricts of Khulra Division
Districts of Khulna DvAsion
240

E1.4 GHG Emissions Savings Potential
I, qý ý%ý, 1, ýSe AS EMISSION COMPARIOSGN
20M
ISM
05
1000
-p I,,, K-hl. a Map'. Meherpur Narail Satkh,, a
Dýbvi, tý, ot Khulna Division
E2 Anaerobic Digestion Electricity
Group A: Animal wastes and poultry wastes Group B; Organic part of MSW and Human excreta
E2.1 Biomass Availability
140
120
Im -
80-
so 'I,
41
.............. ---------- .......... ---------- ---------- --------------------
.... ------- ------- .......... ---------- ....................
-- -------- ---------- ---------- --------------------
241
ý-ý" ý'! . Magura Meherpur Narail SatkhlTa
L)jStriCtS ot Kruina DiviSion

40 Organic part of YISW Human excreta
35 ........... ......... ...... --- ---- -------- ....... .......... --------------------
30 -
C 25 ...... ---- ------- ....... -----------------------
IM
...... ------- ------- ------- ..............
- -------- ---
4)
---- ---- ....... ----- ...........
ýSnlij
I
ur
Ia
Magura Meherip Nara, l Satkhir
1,: [ t, wý hLjina Division
25
ui
Magura Meherpur Narail Saikýra
lýtý tt ut Kýulna Division
242

1;
1 08 c
C, 4 uj
r ` -, Iý Mýgwa Meherpur Nýrad Satkh,, a
oT ýnulna 'Division
E2.2 Total Electricity Generation Potential
11 1.
03
m 025
C,
-4 02
A 9
c
0
LLJ
0 01ý
0
.......... ---------- ---------- ---------- ---------------------
.......... ---------- ---------- ---------------------
----------- ----------
..........
--------- ---
243
h, -, I, h khul- k., htil Magura Meherpur Ndral, Sýtkhira
Districts of Khulna Division

E2.3 Plant Sizing and Economics
Lý: JNOMIC PADýUS OF BIOMASS COLLECTION
r Ct ft
L C-
600
NX,
4C
(0 (0 U
E 0
0
ii "'
Biomass Resoacoý,
ECONOMIC PLANT CAPACITY
Biom j, ýs Res ýurces
144

012
01
ýA 008
006
LU 004 15
0 u
002
COST OF ELECTRICITY GENERATION COMPARISON
SIMPLE PAYBACK PERIOD COMPARISON 7 A [ 3 ýOGAS )
Bý E ý ) OGAS S AND DIESEL) ' ý O
B E GAS AND DIESEL)
.............................. ---------- ---------- - --- ------------
Q- (D f
2 - ---------------
13ago, h. 1 Lh,, d,. g, J-bul. Jheýa, dýh Khulna Kusht, a Magura Meherpx Na, ad Satkhi, a Districts of Khulna Division
245
-7 -77 777, -77, -1- . 71-, Pur Narad Salkhi, a
Dit, tricts of Khulrid Divibiori

NE- F RESENT VAýUE COMPARISON 25 --T-- - T- A ýBIOGAS
6 (BIOGAS) A (BIOGAS AND DIESEL) B (BIOGAS AND DIESEL)
---------- ---- ------ ---------- -- - ---- ----------
- 0 -1 ------ --------------------
--- ---- - --- ------ --------------------
------------
Yýg-, Mýhwpu, Narail Satkh, ra
D, t, t7 ict, l )! mhuirld Division
L)iý, i[ tý- -ý: Diviýion
246
PROFITA131LITY INDEX COMPARISON

E2.4 GHG Emissions Savings Potential
V., ýi ASLIVISSION COMPARIOSON JUL
-- z T -ýA (B I OGý-E AS ELECTRICITY) =, AS ELEC ý
. ,
ý
c El (BIOGAS ELEC (B AS ELECTRICITY) OGAS ELEC 03 A (DIESEL ELEC SLLC =A (DIESE EE A (DIESEL ELECTRICITY) I B (DIESEL ELEC B (D SLLC, B (DIESEL ELECTRICITY) B (DIESE EE
2500 - ...... ... ... -- ------- ---------- -------------------
---- - -
-
-------- ----- ------
C 4 0
------ - ----- ---- ---- -
(A
uj lam -
---- -- -- -- sm 1- iam in IN is Sim iH* Big SIM *is In-fff- -10 --- ------- -
Ku, htia Magura Moherpur Narail Satkhira
ot Knulna Division
E3 Direct Combustion Electricity
Group A: Agricultural wastes and forestry residues Group B. Gasifiable/Combustible parts of IVISW
E3.1 Biomass Availability Biomass availability is same as for gasification (see E1.1).
247

E3.2 Total Electricity Generation Potential
08
06
04
02
c
-02 Bagerhal Chuadange Jessore . 1hanaidat, "ulna Kushfia Magura Meherpur Narall Salkhra
Districts of Khuina DnAsion
E3.3 Plant Sizing and Economics
'
9
a
7
LLJ
ý,, NOMI, ' NAVILl', OF BIOMASS COLLECTION
agurd Meho, p,,,
....................
, R, , mass Resources
Mehelp,

3 14
01.1
I ol
ui
u
Ii.
ECONOMIC PLANT CAPACITY
Bagerhal Chuadanga Jessore
------------------------- ihenaidah Khulna Kushtia
-------------- ---- Magura Meherpur Narail Satkhira
................... --------------------------------------
------------- --- ----------------------------------
................................ ......................................
--------------------------------
H I- m, j,.,, kesoLrcos
, i, triýts of Knuina Division
249
COST Gl- I-LFCTPICITY GENERATION COMPARIOSON

10.
cc
"',! "' IiAý ' ýl COMPARISON
, ,:, tý -ý, ýnulna Division
E3.4 GHG Emissions Savings Potential
ý-MltSIONS COMPARIOSON
3000 MA (DC ELECTRICýTY) 6 ýDC ELECTR C TY) A (DIESEL ELECTRICITY) B (DIESEL ELECTRICITY)
2SOO ........... I ...... .... ........ -- --------
---------- ---------- ------------------ 2000 9
0 u
------- ----- ---------- ---------- ------ (A 1500
------- ------- ---------- ------------------ 1000
sa, ... ---- - ------ ----
Satkh, ra 1,1- ý-, htia Magura Mehorpur NaraO
L) blflCtS ot \ýulna Dimsion
250

APPENDIX F RESULTS: DIVISION-WISE
Name of the
Availability of biomass for electricity generation (ktonne dry matter)
Division Agricultural wastes IVISW l A P lt H and forestry
residues Gasifiyablel Combustible
Organic fraction
nima wastes
ou ry wastes
uman excreta
Barisal -440.61 70.61 176.54 940.37
1 62.13 312.50
Chittagong 4584.69 221.68 554.20 1486.96 118.67 884.38
Dhaka -2240.35 385.72 964.30 2709.72 127.50 1397.85
Khulna 2848.38 132.00 329.99 1765.05 67.50 537.45
Rajshahi 12396.90 254.72 636.79 4179.45 150.63 1114.99 Sylhet -150.51 63.45 158.63 811.54 32.01 289.41
Table FI Division wise annual biomass availability for electricity generation: by source
Group A: Animal waste + Poultry wac
I
Anaerobic digestion plus spark/compression Ignition
I
engine
I
Group B: MSW + Sewage I sludge
I
Group A: Agricultural waste Forestry residues
Direct Combustion plus Sg
s firling e ig steam turbine/ Iýiong
Pengine
Group B: MSW
Group A: Agricultural waste Forestry residues
Gasification plus spark/ compression Ignition Group B: IVISW
engine H I Group C: Poul" waste I
Table F2 Feasible technology and biomass resources
251

CD r_ 9
m c4
0 (D c4
r_ 06
0a- 0 p
bs K ,. L < Ln
le Icý Cý
9 9 9 Co
U)
.E m - M -
- (0 -
Ln Ilt >ý m 1: 0
CL c4
Ilý ci Qý
m uý Qý
CY
r_ CY 0 9 CO lq: oý im a. cý 0 - (D 0 0
p *0R- 0 ö b8K zm LO <
tn - r- CD CL
Co
m CL m 0 le Ln 0
.0 . -b 9
0 Z < (4 tn
c cm 0 Co
c (0
0 i72 * 9 e 9 9 ý 9 Co Ck. (0 0) r_ - to In
ri Z r, 9 1.0 9 a (ll c4
- .02 M C) - cl -: C! . 6 ci 0 0 0 0
C» < CD ei
(D C, 4
(4 to 0
,D Air) a, C»
(D CL 2
cý i c4 ai cý
m (D
U) e m - - (0 "' ' 0
,q LC) 0) 9) . cý
1?
00: r4 5
- 90 U) KM
0 cu Jie
m c 75
m m U)
Z m r_ . - m E;
C) U)
B
'0
E
MO) 75
0
CY) 0 0 c
76
.0
2
0 0-
c 0
co
cu 2)
Q U) U) cu E .2 .0 -a :3
ca
0 Cl)
CY) U-
m
c4