PhD THESIS - IS MUNI
96
MASARYK UNIVERSITY IN BRNO Faculty of Science Petra JUSKOVÁ MICROFLUIDICS AND NANOTECHNOLOGY FOR BIOANALYTICAL APPLICATIONS Thin metal film elements in bioanalysis PhD Thesis Supervisor: Ing. František Foret, CSc. Brno, 2011
-
Upload
khangminh22 -
Category
Documents
-
view
0 -
download
0
Transcript of PhD THESIS - IS MUNI

MASARYK UNIVERSITY IN BRNO Faculty of Science
Petra JUSKOVÁ
MICROFLUIDICS AND NANOTECHNOLOGY FOR BIOANALYTICAL APPLICATIONS
Thin metal film elements in bioanalysis
PhD Thesis
Supervisor: Ing. František Foret, CSc. Brno, 2011

MASARYKOVA UNIVERZITA V BRN Ě Přírodovědecká fakulta
Petra JUSKOVÁ
MIKROFLUIDIKA A NANOTECHNOLOGIE PRO BIOANALÝZY
Tenkovrstvé kovové elementy v bioanalýze
Disertační práce
Školitel: Ing. František Foret, CSc. Brno, 2011

Bibliografická identifikace
Jméno a příjmení autora: Petra Jusková
Název disertační práce: Mikrofluidika a nanotechnologie pro bioanalýzy
Název disertační práce anglicky: Microfluidics and nanotechnology for bioanalytical applications
Studijní program: Chemie
Studijní obor (směr), kombinace oborů: Analytická chemie
Školitel: Ing. František Foret, CSc.
Rok obhajoby: 2011
Klíčová slova v češtině: tenká kovová vrstva, fotolitografie, biosenzor,
mikročástice, elektrochemie
Klíčová slova v angličtině: thin metal film, photolithography, biosensor,
microparticles, electrochemistry

© Petra Jusková, Masarykova univerzita v Brně, 2011

Dedicated to
my beloved friend
Mária Petrášová Filipová

Acknowledgements
I wish to thank, first and foremost, to Ing. František Foret, CSc. for the opportunity to carry
out my Ph.D. thesis in his research group and for his encouraging leadership.
Also I would like to thank, Prof. RNDr. Emil Paleček, DrSc. and RNDr. Veronika Ostatná,
PhD. from the Institute of Biophysics for their helpful comments and discussions.
Prof. Dr. Andreas Manz for allowing me to spend some time in his research group.
Finally, to all my friends supporting me during my study.

Prohlašuji:
Tuto práci jsem vypracovala samostatně. Veškeré literární prameny a informace, které
jsem v práci využila, jsou uvedeny v seznamu použité literatury.
Byla jsem seznámena s tím, že se na moji práci vztahují práva a povinnosti vyplývající
ze zákona č. 121/2000 Sb., autorský zákon, zejména se skutečností, že Masarykova univerzita
má právo na uzavření licenční smlouvy o užití této práce jako školního díla podle § 60 odst. 1
autorského zákona, a s tím, že pokud dojde k užití této práce mnou nebo bude poskytnuta
licence o užití jinému subjektu, je Masarykova Univerzita oprávněna ode mne požadovat
přiměřený příspěvek na úhradu nákladů, které na vytvoření díla vynaložila, a to podle
okolností až do jejich skutečné výše.
Souhlasím s prezenčním zpřístupněním své práce v Univerzitní knihovně Masarykovy
Univerzity Brno.
V Brně dne Petra Jusková

Abstrakt disertační práce
Hlavním cílem mé disertační práce byl návrh a příprava tenkých kovových filmů s možným
výužitím v bioanalýze.
První aplikace byla zaměřena na přípravu miniaturizovaných amalgámových elektrod.
Elektrody byly vytvořeny fotolitografickým způsobem na skleněném substrátu se svolenou,
méně než mikrometr tlustou kovovou vrstvou. Modifikace povrchu (Au, Ag) elektrolytickým
vyloučením rtuti byla testována pro analýzu proteinů. Elektrody byly připraveny ve formě
elektrodového pole, který umožňuje jejich další automatizaci a integraci s mikrofluidními
zařízeními. Morfologie a složení vytvořeného amalgámového filmu byly sledovány pomocí
rastrovacího elektronového mikroskopu (SEM) a energiově disperzní spektroskopie (EDS).
Elektrochemická charakterizace elektrod byla provedena pomocí cyklické voltametrie.
Analýza proteinů byla zaměřena na rozlišování mezi nativní a denaturovanou formou proteinu
pomocí chronopotenciometrické rozpouštěcí analýzy.
Zatímco první generace elektrodového pole obsahovala pouze elektrody amalgámové, v nové
verzi byli referenční, pomocná a amalgámová pracovní elektroda integrovány do jednoho
senzoru. Byl vyvinut a optimalizován protokol pro přípravu těchto miniaturních elektrod.
Činnost všech tří elektrod byla testována pro detekci proteinů; výsledky byly srovnatelné s
předchozím uspořádáním s externím připojením k pomocné a referenční elektrode.
Druhá část mé práce byla zaměřena na přípravu kovových částic s definovanými rozměry a
geometrií. První přístup využívá základní fotografický proces k přípravě stříbrných struktur
uvnitř gelové matrice. Druhá metoda přípravy využívá kombinaci vakuové depozice
kovových vrstev a litografie pro přípravu volně- stojících kovových částic. Byly připraveny
částice různých rozměrů a tvarů.

Dissertation Abstract
The main aim of my PhD thesis was design and microfabrication of thin metal films for
potential applications in bioanalysis.
First application was focused on preparation of the miniaturized mercury amalgam electrodes.
Electrodes were created using a photolithographic process on a glass substrate coated with a
desired metal layer (less then micrometer). Modification of the metal surface (Au, Ag) with
electrodeposited mercury was tested for protein analysis. Electrodes were prepared in a
microarray format allowing future automation and integration with microfluidic devices.
Morphology and composition of the created amalgam film were examined by scanning
electron microscopy (SEM) with energy-dispersive X-ray microanalysis (EDS).
Electrochemical characterization of the electrodes was performed using cyclic voltammetry.
Protein analysis was aimed at distinguishing between native and denaturated forms of the
protein using chronopotentiometric stripping analysis.
While the first generation of the electrode arrays contained only the amalgam electrodes an
improved version was further developed by integration of the counter, reference and amalgam
working electrodes into one sensor. Protocol for preparation of miniaturized electrodes was
developed and optimized. Performance of the three electrode system was tested for protein
detection with results comparable to previous setup with external connection to the reference
and counter electrodes.
Second part of my work was focused on preparation of the metal structures with defined
geometry and dimensions. First approach utilized basic photographic process to prepare silver
structures within the gel matrix. The second preparation method combined vacuum metal
deposition and lithography for preparation of freestanding, high–aspect ratio metal structures.
Particles of various dimensions and shapes were prepared.

Content
ABSTRAKT DISERTAČNÍ PRÁCE ......................................................................................................................... 8
DISSERTATION ABSTRACT ................................................................................................................................ 9
CONTENT ........................................................................................................................................................ 10
1 INTRODUCTION ..................................................................................................................................... 12
1.1 MEASUREMENTS BASED ON ELECTROCHEMICAL REACTIONS .................................................................................. 12
1.2 CONDUCTIVITY BASED SENSING ....................................................................................................................... 16
1.3 OPTICAL TECHNIQUES ................................................................................................................................... 20
1.3.1 Surface plasmon resonance detection (SPR) ................................................................................. 20
1.3.2 SPR imaging ................................................................................................................................... 21
1.3.3 Combined SPR detection systems .................................................................................................. 22
1.3.4 Signal enhancement by surface interaction- Surface enhanced Raman spectrometry (SERS) ...... 24
1.4 SAMPLE MANIPULATIONS .............................................................................................................................. 25
1.4.1 Dielectrophoresis ........................................................................................................................... 25
1.4.2 Electrowetting ............................................................................................................................... 26
1.4.3 Surface acoustic wave manipulation (SAW) .................................................................................. 27
2 AIMS OF THE WORK: ............................................................................................................................. 29
3 THEORETICAL BACKGROUND ................................................................................................................ 30
3.1 PHOTOLITHOGRAPHIC TECHNIQUE ................................................................................................................... 30
3.1.1 Photoresist deposition ................................................................................................................... 30
3.1.2 Soft bake ........................................................................................................................................ 31
3.1.3 Pattern transfer ............................................................................................................................. 31
3.1.4 Development ................................................................................................................................. 32
3.1.5 Hard bake ...................................................................................................................................... 32
3.2 STRUCTURING OF THE METAL SURFACES ........................................................................................................... 32
3.3 THIN METAL FILM DEPOSITION TECHNIQUES ...................................................................................................... 33
4 FABRICATION AND CHARACTERIZATION OF THE MERCURY AMALGAM WORKING ELECTRODES .......... 37
4.1 EXPERIMENTAL ............................................................................................................................................ 38
4.1.1 Materials and methods ................................................................................................................. 38
4.1.2 Adsorptive stripping (AdS) ............................................................................................................. 39
4.1.3 Adsorptive transfer stripping (AdTS) ............................................................................................. 39
4.1.4 Fabrication of amalgam working electrodes ................................................................................. 39
4.1.5 Amalgam formation ...................................................................................................................... 40
4.2 RESULTS AND DISCUSSION ............................................................................................................................. 43

4.2.1 Morphological characterization .................................................................................................... 43
4.2.2 Optimization of the fabrication process ........................................................................................ 46
4.2.3 Protein analysis ............................................................................................................................. 49
5 FABRICATION OF THE THREE ELECTRODE SENSOR WITH THE MERCURY AMALGAM WORKING
ELECTRODE ..................................................................................................................................................... 53
5.1 EXPERIMENTAL ............................................................................................................................................ 53
5.1.1 Materials and methods ................................................................................................................. 53
5.1.2 Fabrication of the metal substrate ................................................................................................ 54
5.2 RESULTS AND DISCUSSIONS ............................................................................................................................ 55
5.2.1 Three electrode system with central-unit working electrode ........................................................ 55
5.2.2 Optimization of the sensor preparation ........................................................................................ 56
5.2.3 Protein measurements .................................................................................................................. 60
6 FABRICATION OF THE METAL STRUCTURES WITH DEFINED PROPERTIES ............................................... 65
6.1 EXPERIMENTAL ............................................................................................................................................ 66
6.1.1 Materials and Methods ................................................................................................................. 66
6.2 RESULTS AND DISCUSSION.............................................................................................................................. 68
6.2.1 Preparation of the silver structures within the gel matrix ............................................................. 68
6.2.2 Exposure and development ........................................................................................................... 68
6.2.3 Optimization of the fabrication process ........................................................................................ 69
6.2.4 Fabrication process for the free-standing metal particles preparation......................................... 70
6.2.5 Properties of the prepared structures ........................................................................................... 71
6.2.6 Surface modification ..................................................................................................................... 74
6.2.7 Electrochemiluminescence reaction on the metallic particles ....................................................... 75
7 CONCLUSIONS ....................................................................................................................................... 79
8 REFERENCES .......................................................................................................................................... 81
CURRICULUM VITAE ....................................................................................................................................... 94
LIST OF PAPERS .............................................................................................................................................. 95
PRESENTATIONS AT CONGRESSES .................................................................................................................. 96

12
1 Introduction
Technology developments in the few past decades have created a number of application
opportunities for multidisciplinary research combining materials science, electronics and
chemistry. Advanced deposition and microfabrication techniques enable to prepare metal
surfaces with high precision and excellent control over their size and shape with several
nanometers resolution. Metal components of different types and functions can be found in
most of the analytical instruments. Surfaces with high optical quality serve as mirrors, beam
splitters, antireflective coatings, etc. Smooth metal coating copying the original is extremely
important for example in electron microscopy. Unique properties of the thin metal films can
be use for the chemical sensing and detection as well. Electrochemical detection systems
cover probably the most extensive part of the analytical applications of the metal films.
Following up the miniaturization trends, advanced microfabrication techniques allows
downscaling of the existing systems and development of the new instrumentation and
methods. Application of the metal surfaces among the optical methods is predominated by
the surface plasmon resonance (SPR) detection systems, offering the label-free and real time
measurements of the molecular interactions, covering broad range of potential chemistries to
be used for detection. Another attractive area where thin metal films recently found their
application is sample manipulation. Thin metal layers with specific geometries allow
manipulation and positioning of the liquid droplets or micro/nano-structures within the
miniaturized devices.
In my work, thin metal films were utilized for construction of the electrochemical sensor for
the protein analysis and for fabrication of the free-standing metallic structures with potential
bioanalytical use.
1.1 Measurements based on electrochemical reactions
Electrochemistry as a detection method plays an important role among modern analytical
techniques for small molecule detection as well as for biomolecular analysis [1].
Electrochemical sensing is one of the preferred detection schemes due to its sensitivity,
relative simplicity and, most importantly, low power requirement. Probably the most
successful application combining enzymatic reaction with electrochemical detection – the

13
glucose meter - also became the first personal analytical device with a billion dollar market
world-wide. While similar systems have been developed with the capability of performing
more than 20 clinical tests [2] their practical deployment is still rare. More recently new
attempts combining microfabrication and lab-on-a-chip concepts [3] aim at forming fully
integrated complex devices for monitoring multiple physiological and metabolic parameters.
Multiplexed methods are less invasive, less expensive and less complicated compared with
the use of multiple individual sensors. An example of such an approach represents lab on a
tube device integrating intraventricular catheter with pressure, temperature, oxygen and
glucose microsensors within the one spirally rolled tube [4].
Development of a platform for reliable, low cost point of care diagnostics is not a simple task.
Although, a number of applications have already been described [1], development of new
electrochemical designs and protocols is still a very active research area. Depending on the
specific application, electrodes are formed in different shapes and arrangements, as an array
of individually addressable electrode sensing systems [5, 6] or single electrochemical sensors
with all electrodes fully integrated [7-9] or externally connected [10]. Examples of such
electrodes are shown in the figure 1.1.
Among the metals compatible with microfabrication methods, platinum, silver and gold
represents the most frequently used electrode materials for deposition on glass, silicon or
polymer substrate often after deposition of ultrathin (few nm) chromium or titanium adhesion
layer. This is important in cases when the weak adhesion of the electrode material to
substrate results in mechanically unstable sensor. In cases when the thin metal adhesion layer
is not acceptable (electrode contamination) an adhesion layer of indium/tin oxide (INTO) is
also applicable. Gold electrodes are preferable for good chemical stability and high affinity to
thiol compounds allowing simple surface modification. Surface formation of self-assembled
monolayer with a suitable end group (amine, carboxyl) allows consecutive immobilization of
selected reagents such as aptamers and dendrimers [11-15], proteins [16], nucleic acids [17]
and other species [18]. Further electrochemical modifications allow selective labeling of
closely packed electrodes with sensing biomolecules [19, 20]. For example, electroreduction
of 4-nitrothiophenol on the electrode surface can control immobilization of proteins [21] or
reduction of diazonium salts can form aminophenyl and boronic acid groups used for binding
of particles or cells [22].

14
Fig. 1.1
Different arrangement and geometries of the electrodes.
a) Chip with the array of 16 electrochemical sensors and detailed view of the one three electrode system with
working (WE), reference (RE) and counter (CE) electrode. System was used for salivary biomarker detection
[23]. b) Similar single electrochemical sensor integrated with fluidic network designed for botulinum neurotoxin
detection [9]. c) System with three independent working electrodes (WE1-3) and one counter and reference
electrode for continuous detection of the cocaine [12]. d) Array of 16 working electrodes placed between
reference and counter electrode for amperometric detection of the Carcinoembryonic antigen [24]. e) Array of
the working electrodes for electrochemical impedance spectroscopy detection [47]. f) Design of an array of the
working electrodes and detailed view of the two from the five electrodes covered by the enzyme containing
hydrogel microstructures [26].
In contrast to more conventional approaches, e.g., with enzymes immobilized onto packed
beads, formation of the thin metal layer inside the microfluidic system allows assembling the
enzyme modified surface into specific positions with spatial and temporal programmability

15
and orientation control. For example, chitosan-mediated electrodeposition was tested for
assembled enzyme layers retaining their catalytic activity over multiple days [25].
Besides direct immobilization of the enzyme on the electrode surface, functional
biomolecules can be introduced into the system entrapped in a biocompatible hydrogel, e.g.,
polyethylene glycol (PEG) structures fabricated on top of electrodes [26] or by covalent
attachment of the enzyme to a gold electrode modified with a monolayer of gold nanoparticles
[27].
Linking of three-electrode electrochemical sensor arrays with microfluidics could lead to
completely integrated microsystems for point-of-care diagnostics. Such an electrochemical
cell with amperometric and impedance sensors was used for detection of carcinoembryonic
antigen in serum and for simultaneous detection of five breast cancer genetic markers on the
same chip [5]. In another arrangement, microfluidic sensor with human cytochrome P450 3A4
covalently bound to working electrode was used for electrochemical determination of
catalytic parameters of quinidine, nifedipine, alosetron and ondansetron [28]. Microfluidic
immunoassay platform with independently addressable three-electrode cells and fluid part for
reagents storage and transport was used for breast cancer markers detection in real samples
[29]. Combination of microfluidic transport with electrochemical sensing was also described
for detection of urinary proteins [30] and fast detection of extremely lethal toxic substances
such as botulinum neurotoxin [9].
Molecular diagnosis of viral infections is commonly connected with the polymerase chain
reaction (PCR) amplification process. Electrodes modified with target sequence capture
probes allow direct electrochemical analysis of amplicon mixtures without additional cleanup
steps [31]. Integration of the symmetric PCR, enzymatic single stranded DNA generation and
sequence specific electrochemical detection in a disposable monolithic chip was shown to
minimize sample losses and potential contamination [32]. Incorporation of the
electrochemical sensing system in a microfluidic flow-through quantitative qPCR device
allowed in situ detection of the amplified target nucleic-acid sequence (figure 1.2).
Electrochemical detection was based on electroactive DNA intercalator, methylene blue.
Since methylene blue complex with the amplicon is electroinactive, the intercalator signal at
the end of every cycle decreased. One scan of the square wave voltammetry method took just
a few seconds allowing quantification of the products cycle-by-cycle in real time [33].

16
Fig. 1.2
Design of the qPCR electrochemical sensing system for in situ detection of the amplified nucleic acid sequence.
Microfluidic device consists of the polydimethylsiloxane (PDMS) layer with the channels and the glass substrate
with the 11 electrochemical detection stations composed of the three platinum electrodes, working electrode
(WE), counter electrode (CE) and reference electrode (RE). Each station measure signal of the methylene blue
at the extension phase of selected PCR cycles [33].
1.2 Conductivity based sensing
Resistance measurements belong to the most robust techniques in electric engineering and
direct current resistance measurements represent by far the simplest sensor. Binding events
on the thin metal surface can be transformed into information about the adsorption/desorption
kinetics and nature of the interacting molecules. Correlation between surface resistivity and
the resistivity of a thin metal film is known [34, 35] and the influence of the surface resistance
is inversely proportional to the film thickness making it especially noticeable in the case of
ultrathin metal films. This phenomenon was first used for analytical purpose in gas sensors
[36]. Figure 1.3 indicates the sensor principle. In the case of less than 50 nm metal film,
surface resistance has bigger impact to the overall resistance and so does the
adsorption/desorption of the molecules on the surface [37-39].

17
Fig. 1.3
Change in the measured property as a function of the thickness in resistive gas sensors. When the thickness is
high (upper figure), the electrical resistance does not change because the inelastic scattering events in the bulk
dominate. When the thickness of the metal film is low (lower figure), the adsorbed target molecules can be
detected by measuring the change in the electrical resistance [37].
Resistance of the thin film can by affected not only by vapor dose but also by adsorption and
desorption of molecules from liquid solution. The degree of the resistance change strongly
depends on molecular character of measured species. For strongly absorbed molecules like
thiolates it was possible to achieve about 4% signal increase on the ~40 nm gold film. For
weakly adsorbed species the response may be too low to be measured. Response was higher
for softer Lewis bases and aliphatic thiolates. This change was attributed to the difference in
the extent of electronic interaction between aliphatic and aromatic thiols with the gold
surface. Behavior of the ultrathin Cu and Ag films was found to be similar as described for
the gold [40]. Sensitivity to adsorption was significantly affected by the metal film
morphology as well [41]. Compared to the SPR angle measurement, resistance change
seemed to be less sensitive on the non-interacting portions of the adsorbate molecule.
Whereas SPR angle shift is given by thickness of the absorbed layer, the increase in resistivity
depends on interactions of S-headgroup on the gold surface [42]. Resistance or alternating
current (AC) impedance measurement can be used to study the ligand exchange reactions
[43], interactions of immobilized cyclodextrins on gold surfaces with small charged guest
molecules [44] or temperature influence on the phase changes and desorption of self-
assembled alkanethiol monolayers [45]. Measurements of the organic layer resistivity can be
used for direct detection of the DNA chemisorbed at the gold surface. Sensor response
strongly depends on perpendicular or parallel orientation of the DNA probes bonded to the

18
gold support. Hybridization with the complementary oligonucleotide strand caused
increase/decrease in sensor conductance according to the probe alignment, while the addition
of non-complementary chain resulted in only a slight decrease or no conductivity change [46].
An alternative, measuring technique based on electrochemical impedance spectroscopy (EIS)
which has been commonly used to monitor corrosion and electrodepositing processes is
recently finding its application in biosensing methods as well. For example, binding of the
target protein to a capture probe immobilized on metal electrodes will cause a measurable
impedance change. In one approach the use of human immunoglobulin, IgE and its aptamer
selected as a receptor-ligand model system confirmed that electrochemical impedance
spectroscopy could be a promising approach for label-free quantitative measurements [47]. In
another recent study an array of miniaturized high density gold nano interdigitated electrodes
was suggested for monitoring protein binding behavior. The electrode array could be easily
integrated into disposable polymer microfluidic chip used for monoclonal anti-rabbit
immunoglobulin (IgG) detection [48]. Another microfluidic flow cell with interdigitated
platinum electrodes was utilized for real time DNA detection performing non-Faradaic
impedance spectroscopy. DNA probe was bound on the glass between the electrodes and
conductance was measured after hybridization with target sequence. System was tested to
detect pathogen DNA samples from Salmonella choleraesuis in dairy food and enabled
detection of unlabeled DNA down to concentrations of interest for food quality control [49].
A different conductometric platform for label-free measurement of molecular adsorption has
recently been described using platinum electrodes positioned in two microchannels and linked
by a short but wide nanoslit. This arrangement was used for conductometric measurements
and provides information about kinetics parameters of proteins adsorption. A conductance
change due to protein adsorption was evaluated using bovine serum albumin (BSA) as a
sample [50]. The effect of resistance change upon molecule adsorption could be further
enhanced by addition of functionalized particles into the detection system [51, 52].
One of the most attractive approaches for sensitive label free resistance based detection was
build up on the principle of a field effect transistor (FET), which is a common part used in
electronic circuits. Unlike a regular transistor where the small current flowing into the base
electrode causes larger current flow between the emitter and collector, the semiconductor

19
conductivity between the source and drain electrodes is controlled via a voltage applied to the
gate electrode separated by a thin insulating layer. In the ideal case the current control is
purely electrostatic. One of the first applications of the FET in chemistry was for ion selective
electrodes [53]. Recently, there is a renewed interest in using the FET principle in conjunction
with silicon nanowire (Si-NW) structures for biomolecule detection. Molecule binding on the
sensor affects charge accumulation or depletion near the Si-NW surface and can be measured
as changes in the Si-NW conductance. Applications of the technique as a label free, real time
sensor arrays was recently reviewed by Carlen and van den Berg [54]. Besides SiNW, carbon
nanotubes [55-59] and multisegment nanowires [60] have also been studied as a possible
sensing material in these sensors. Integrating of this concept into microfluidic device for DNA
amplification allowed detection of amplicons by their intrinsic charge [61]. Additional
sensitivity improvement has been achieved by integration of a helping gate electrode. This
double gate FET showed improvement of the sensitivity in the specific antigen-antibody
interaction for the detection of the avian influenza virus [62]. Another possible arrangement in
FET electrodes was described using an extended, thin metal film gate electrode [63].
Compared to previous designs, immobilization and detection of the molecules took place on
the extended gate electrode, formed at the bottom of a microfluidic channel. Utilization of
gold as a gate material allows binding of molecules on the gate through the thiol self-
assembled monolayers.
Fig. 1.4
FET sensor with an extended thin layer gold electrode.
Detection strategy is based on modification of the electrode surface with the probe molecules; interaction of the
probe with target biomolecule leads to variations in potential drop at the interface with the electrolyte. This
potential drop in turn modulates gate voltage applied thought the reference electrode also immersed in the
electrolyte [65].

20
Device with immobilized streptavidin was used for detection of streptavidin - biotin
complexes. Similar arrangement with the gate of commercial FET connected to an external
sputtered electrode was used for quantitative study of nonspecific adsorption/desorption of
positively and negatively charged proteins such as BSA and lysozyme [64]. Metal-oxide
semiconductor FET (MOSFET) with peptide aptamers covalently immobilized on the
extended gate can provide sensitive and label-free protein interaction detection. Sensitivity of
such a device (figure 1.4) to detect protein interactions was tested on CDK2 protein active in
proliferating cells [65].
1.3 Optical techniques
Besides electric conductivity there are several additional modes suitable for detection of
binding events on the metal layers. With the development of scanning probe microscopy a
whole new scientific field has evolved allowing direct observation of the binding molecules
[66]. In quartz crystal microbalance sensor (QCM) the metal layer is part of a resonator
changing its frequency characteristic due to the increase of the mass of the material binding
on its surface [67]. Thin metal layers typically also provide excellent optical properties
allowing monitoring of the surface binding events via reflection based measurements such as
in elipsometry [68], profilometry [69], or SPR [70]. Indeed, SPR represents one of the most
widely used tools to monitor and characterize biomolecular interactions. Integration of optic
and fluidic components in one system is becoming very popular and is often referred to as
optofluidics [71].
1.3.1 Surface plasmon resonance detection (SPR)
SPR is probably the most widely used optical method based on thin metal layer technology
[72]. Upon interaction of the incident radiation (visible to infrared region) with the electrons
of the metal layer electromagnetic waves (surface plasmon) propagate in a direction parallel
to the metal surface. At certain angle of incidence (depending on the material and wavelength
of the excitation radiation) the plasmon is exited resulting in the decrease of intensity of the
radiation reflected from the surface. SPR sensing is based on measuring changes of the
refractive index of thin molecular layer immobilized on the metal substrate originated from

21
adsorbtion/desorbtion of the molecules on this metal surface. Sensors based on SPR
technology offer direct label-free and real-time detection of various chemical and biological
substances, their binding kinetics and interactions [73-75]. Since the protein binding studies
are extremely important in biology and pharma industry the SPR technology was adapted by
several companies and numbers of SPR instruments are now commercially available [76].
Recently, development in SPR technology is focused on utilization of microfabrication
methods and nanotechnologies to build up novel, compact, low-cost and sensitive biosensors.
New materials or arrangements to obtain comparable selectivity and sensitivity performed in
miniaturized format and its integration into microfluidic devices are exploring [77].
Besides planar arrangement SPR sensors can be generated as microcavities by sputtering gold
layer over spherical particles aligned on a flat substrate. Microcavity SPR sensors can be
easily integrated with microfluidics allowing controlled sample flow to microchamber with
the sensor [78]. Another approach is based on resonant surface plasmon enhanced
transmission through the nanohole arrays with reduction of the sensing area only to exposed
gold region inside the nanoholes [79]. Nanohole array can be prepared also in the flow
through format enhancing transport of reactants to the sensing surface. Such a system has
been tested for real time monitoring of ovarian cancer biomarker specific antibody [80].
1.3.2 SPR imaging
In the simple SPR sensor the reflected light is detected by a single element detector at either
constant angle or wavelength. In the imaging version (SPRi) an array of sensing regions is
monitored with a CCD camera at the angle and wavelength of the incident light fixed. The
diagram of a SPRi sensing system in figure 1.5 shows the molecules patterned on the metal
surface as an array of the discrete spots. Upon interaction with the sample molecules different
SPR curves are obtained from each spot on the gold surface [81].
Effective application of multi-screening methods such as SPRi requires reproducible and well
defined multi-patterning technology. One of the possible methods is patterning based on the
microfluidic systems [82-86]. The performance of such a system for determination of binding
affinities of antibodies against protein targets was tested on the anti-human α-thrombin IgG
injected across the sensor surface at different concentrations [87].

22
Fig. 1.5
a) Schematic diagram of SPR imaging. b) Calculated SPR reflectance curve for a pure gold surface (solid line),
a reactant dot (dashed line) and adsorbed analyte molecules on a reactant dot (dotted line). c) The contrast of
the SPR image is based on the different reflectance rA>rR>rAu. [81].
The device consisted of parallel microfluidic channels, all with multiple gold sensing islands,
allowing simultaneous screening of up to 10 samples. The system was tested to detect
interactions of proteins, drugs and Fab fragments [88]. Technology of SPRi integrated into
polydimethylsiloxane (PDMS) flow cell was further used for analysis of interactions between
lipid−protein [89], lectin-carbohydrate [90], toxin−receptor [91] and aptamer–protein [92].
High-density multiplexed antibody arrays on gold surfaces were also used for simultaneous
detection of two low molecular weight protein biomarkers, β2-microglobulin and cystatin C
[93] and/or vascular endothelial growth factor at biologically relevant concentrations [94].
1.3.3 Combined SPR detection systems
In some designs the same sensor can be used for multiple independent sensing techniques. For
example combination of the SPR and fluorescence imaging within one hybrid microfluidic
biochip was used for single-celled pathogens detection. Pathogens were captured on the
functionalized array of the gold spots enclosed by a PDMS microfluidic flow chamber
delivering magnetically concentrated sample. This device arrangement allowed SPRi

23
measurements of the antibody-captured bacteria on the bottom of the biochip and epi-
fluorescence on the top [95].
In electrochemical SPR measurements, thin gold film serves as an optical surface and
simultaneously is used as the working electrode in a standard three-electrode electrochemical
experiment [96]. Integration of the surface acoustic wave (SAW) actuation into SPR sensing
system provides active mixing of the solution above the sensor thereby accelerate binding
kinetics and reduce and/or remove molecules nonspecifically bound to the surface as well.
SAW are oscillations generated using interdigitated transducers and propagating along the
device surface – see the section Sample manipulations. Both SPR sensors and SAW
transducers can be fabricated simultaneously on a single substrate by thin metal film
deposition. Final device comprises of glass prism in a classic Kretschmann SPR configuration
on which LiNbO3 piezoelectric substrate with interdigitated electrodes and SPR sensing
elements were placed. The integrated system shown in figure 1.6 was connected to a Teflon
microfluidic well and used in avidin-biotin assay with biotinylated BSA [97].
Fabrication of the carbon nanotube based FET sensor on a transparent substrate can serve as a
SPR sensor as well [98]. In this work biological events at the gate electrode were detected
and quantified simultaneously by measuring the changes in electrical conductance and SPR
curves.
Fig. 1.6
Scheme of the integrated device showing the SPR sensing surface and surface acoustic wave interdigitated
transducer (SAW IDT) electrodes on a common LiNbO3 piezoelectric substrate. SPR excitation and reflected
light paths that are coupled to the sensing surface via the prism, as well as the microfluidic well atop the SPR
sensing surface are also shown [97].

24
It is important to note that sample preparation and delivery techniques strongly influence the
overall performance of the analytical system. For example, integration of the SPRi method
with digital microfluidics (see the following sections) into one device allowed fast and
reproducible dispensing and transport of minute amounts of reagent solutions to specific
detection spots by applying an electrical potential to array of the gold electrodes [99].
1.3.4 Signal enhancement by surface interaction- Surface enhanced Raman spectrometry
(SERS)
In the previous sections the sensor signal couldn’t be generated without the interaction of the
analyte with the metal surface. In some cases the surface interaction can also amplify the
signal, which can be observed without such an interaction. For example Raman spectroscopy,
performed on samples in homogeneous solutions typically provides only a weak signal.
However, when the same solution is measured in a close proximity of a suitable metal layer or
nanoparticle signal enhancement by orders of magnitude can be achieved. Chemical and
electromagnetic effects amplifying the Raman scattering were recently demonstrated to
provide sensitivity approaching fluorescence measurements. The high sensitivity and label
free nature of the detection makes surface enhanced Raman spectroscopy (SERS) an effective
tool for qualitative as well as quantitative analysis of various biological samples [100-103].
Colloidal particles, mostly gold and silver, were extensively studied for their beneficial
enhancing properties [104 - 106]. SERS-active metal nanoparticles (Au) with reporter
molecules adsorbed to the metal surface, all encapsulated in a protective and functionalized
silica coat, are now also commercially available (Nanoplexbiotags, a trademark of Oxonica
Inc. - www.oxonica.com) [107].
Signal enhancement can be further improved by addition of a metal layer to the substrate
forming a sandwich configuration. Local electromagnetic field is thus enhanced by coupling
between the particles and the metal film as well as by coupling between the particles
themselves [108]. Similar format was also used for the prostate specific antigen immunoassay
detection. Particles with different characteristic feature of the Raman label could be used
simultaneously allowing detection of the multiple analytes [109].

25
Nano/microfabrication techniques utilizing thin metal film deposition play an important role
in generation of nanostructured SERS actives substrates. Nanospheres arranged on the solid
substrate served as a mask during deposition of metal layer. After the removal of the spheres
metal triangles formed on the substrate. The same process without removal of the spheres
resulted in metal substrate with the surface spheres completely covered by the metal layer.
Selective wet and dry etching method is a suitable fabrication process for such studies [110].
Oblique angle deposition can reproducibly produce uniform Ag nanorod arrays which in
connection with SERS spectrometry allow detection of differences between viruses, viral
strains, and viruses with gene deletions [111]. In a modified protocol oblique angle
polymerization was used to prepare nanostructured polymer. SERS active surface was then
generated by deposition of silver or gold layer onto the polymer film. Simple and inexpensive
fabrication process resulted in reusable substrates with possibility to control roughness of the
underlying polymer film. Resulting substrate was used for detection of both Gram-positive
(Bacillus cereus) and Gram-negative (Escherichia coli) bacteria [112]. SERS active substrates
consisting of gold nanohole arrays can be also prepared by electron beam lithography. This
fabrication process allows controlling and modifying nanohole dimensions and achieving the
optimal SERS enhancement. Nanopatterned metal structures were successfully used for
studying the orientation of proteins adsorbed on the metal surface [113].
In order to amplify signals of the biomolecules in low concentrations, combination of the
SERS spectroscopy with a preconcentration method can be performed. Electrokinetic
amplification technique can be incorporated into SERS system just by an electrode addition.
In this case the signal enhancement was based on movement of charged molecules towards
the oppositely charged SERS substrate [114]. In another approach, sample concentration
together with enhanced solution phase mixing by electrical field was used to detection of
DNA sequences associated with Dengue virus serotype 2 [115].
1.4 Sample manipulations
1.4.1 Dielectrophoresis
While the previous sections focused on applications of thin film metal layers for chemical
sensing there is also a large area where thin layer electrodes serve for manipulation of

26
particles or solutions. For example patterning the metal electrodes into geometries allowing
creation of inhomogeneous electric field within microfluidic devices is used in
dielectrophoresis for particle discrimination, separation, and/or fractionation [116].
Methodology can be used for sorting of living cells carried by liquid flow to different output
channels [117]. Trajectories of the cells and particles depend on the applied frequency and
electrode geometry [118-121]. Dielectric forces are due to differences in polarizability of the
analyzed particles. Selective dielectrophoretic separation requires cells with significantly
different dielectrophoretic properties. This can be achieved by selective cell labeling with
polymeric beads through the specific surface marker. Labeled target cells have different
dielectrophoretic response and can be successfully separated from the heterogeneous cells
mixture [122]. Dielectrophoresis can be used to trap small number or single cells, beads,
structures and molecules and allowing their interaction as well [123-125]. For example, a
microfluidic device with interdigitated–castellated microelectrodes allowed dielectrophoretic
entrapment, accumulation and electroorientation of the cardiac myocytes to construct tissue-
like structure with the potential therapeutic application [126]. Combination of the multi-
orifice flow fractionation and dielectrophoresis can be used for continuous separation of the
circulating tumor cells from the blood cells [127]. Manipulation and usage of on-chip
dielectrophoresis can be further simplified by wireless powering of the device allowed by
printed RF circuit [128]. Dielectrophoresis is a rapidly evolving area with the number of
applications growing exponentially.
1.4.2 Electrowetting
Unlike dielectrophoresis, which deals mainly with particles and structures dispersed in
liquids, electrowetting was developed for direct manipulation of discrete liquid droplets. The
technique is based on reversible variations of the contact angle between droplet and substrate
under the influence of electrostatic field [129, 130]. Electrodes are arrayed along the desired
motion path and are covered with an insulating layer. Upon application of a sufficiently large
electric field (tens to hundreds of volts) the droplet deform to such an extent that their
movement is initiated. The electrodes can be created either on two surfaces sandwiching the
droplet or, more recently, in an array of slightly interdigitated electrodes allowing the droplet
movement without the electrode sandwich arrangement - digital microfluidics (DMF) format.
Movement of the droplets toward successive actuated electrode is realized through

27
electrostatic forces generated by charges/dipoles accumulated on the interface between the
device surface and the surrounding medium allowing precise temporal and spatial control
[131]. Recently developed digital-channel hybrid microfluidic device was designed for
carrying out sequential chemical reactions followed electrophoretic separation. Device was
used for analysis of on chip fluorescently labeled amino acids standards and primary amines
in cell lysate. In another application, droplets with singly labeled FITC-Insulin and trypsin
were merged and incubated using DMF followed by separation of the digest fragments [132].
The second generation of these hybrid devices with multilayer architecture incorporates DMF
platform placed over the glass substrate with a microchannel network. Despite of more
difficult fabrication process, such a configuration allows dispensing droplets from reservoirs
with consecutive mixing of the aliquots, all with limited evaporation and negligible pipetting
errors. This new hybrid device was able to perform multistep enzymatic digestion of Alexa
Fluor 488 labeled BSA followed by electrophoretic separation [133]. In comparison to
conventional techniques this technique requires less reagent and sample volumes and can be
applied for a number of chemical unit operations including liquid-liquid microextraction
[134], extraction and purification of the proteins [135], enzymatic assays [136], proteomic
analyses with reduction, alkylation, and enzymatic digestion steps [137]. In a proteomic
application the sample preparation can also integrate crystallization with the MALDI matrix
for in-situ MALDI-MS [138]. Magnetic bead based immunoassay and real-time polymerase
chain reaction have also been demonstrated in the DMF format [139]. Recently a DMF
platform was used to create functional prototype of an artificial Golgi organelle. Since natural
organelle is responsible for the enzymatic modification of glycosaminoglycans immobilized
on proteins, the artificial one enables enzymatic modification of heparan sulfate chains
immobilized onto magnetic nanoparticles [140].
1.4.3 Surface acoustic wave manipulation (SAW)
Droplet actuation and manipulation can be also achieved by SAW devices capable to actuate
several droplets simultaneously [141]. SAW, generated by interdigitated transducers on the
surface of a piezoelectric crystal, is sensitive to surface, viscosity and conductivity changes.
Technology can be used in construction of the SAW based biosensors to highly selective
biomolecular detection [142], fluid manipulation including blood centrifugation [143],
droplets sorting and directing within microfluidic channels [144] or focusing particles inside
one droplet by asymmetric SAW propagation [145]. SAW microfluidic atomization can
28
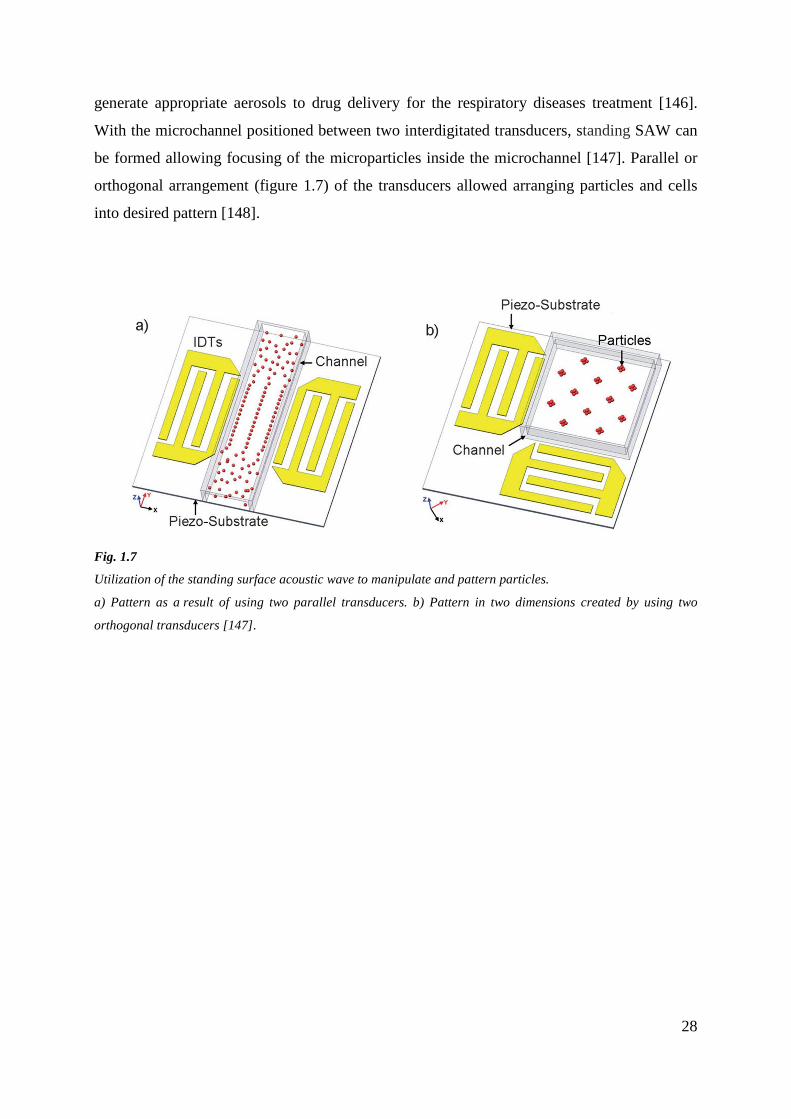
generate appropriate aerosols to drug delivery for the respiratory diseases treatment [146].
With the microchannel positioned between two interdigitated transducers, standing SAW can
be formed allowing focusing of the microparticles inside the microchannel [147]. Parallel or
orthogonal arrangement (figure 1.7) of the transducers allowed arranging particles and cells
into desired pattern [148].
Fig. 1.7
Utilization of the standing surface acoustic wave to manipulate and pattern particles.
a) Pattern as a result of using two parallel transducers. b) Pattern in two dimensions created by using two
orthogonal transducers [147].

29
2 Aims of the work:
• Design and microfabrication of nanostructured thin films for potential applications in
bioanalysis
• Construction of a simple disposable amalgam electrode array, providing easier and
faster manipulation, and consuming much less sample to achieve sensitivity
comparable to standard microelectrodes.
• Incorporation of the optimized amalgam electrode into three electrode system.
• Preparation of free-standing metal structures with a potential for application in
interaction and sensing elements in microfluidic devices for bioanalytical applications.

30
3 Theoretical background
3.1 Photolithographic technique
Photolithographic method enables reproducible transfer of a desired pattern design to the flat
substrates with photosensitive layer. Structures are transferred simultaneously over the entire
substrate surface with great control over the shape and size of the transferring structures.
Technique is frequently used for incorporation of the metal components into microfluidic and
microelectromechanical systems (MEMS) or creating of the small dimension constituents of
these devices. Basic photolithographic technique usually involves photoresist deposition, soft
bake, pattern transfer, development and hard bake.
3.1.1 Photoresist deposition
Prior to deposition of any chemical layer, surface of the substrate must be cleaned from all
contaminants like solvent stains and particles. Significant contaminations can be removed by
immersing into the piranha solution (H2O2: H2SO4 / 1:2). Washing in acetone with subsequent
isopropyl alcohol rinsing effectively removes organic contaminants from the surfaces.
Adhesion properties of the glass substrates are further improved by water desorption after
baking substrates at about 120 °C for several minutes.
First step in the photolithographic process itself is deposition of photoresist layer on the
pretreated substrates. Photoresists are organic polymers sensitive to ultraviolet (UV) radiation
and are available in two basic formats, as positive and negative type. Exposure of the positive
type weakens the polymer chains and makes exposed photoresist area more soluble in
developing solutions. Photochemical reaction of negative type leads to random cross-linkage
of the polymer chains and exposed photoresist become less soluble.
Most frequently used method for dispersion of the photoresist on the substrates is spin
coating. Scheme of the spin coating process is depictured on the figure 3.1. Substrate is held
by vacuum chuck and spun in a high speed, to make a uniform film of liquid photoresist.
Resulting polymer thickness is given by equilibration between centrifugal force and
evaporation of the photoresist solvent (both function of the spin speed) as well as photoresist

31
concentration and molecular weight [149]. Deposition process is sensitive to dust particles
and other impurities on the substrate surface which all affects homogeneity of the final
photoresist layer.
Fig.3.1
Basic principle of the spin-coating process.
Several droplets of the photoresist are deposited on the substrate and high speed spinning creates thin
photoresist layer on the surface.
3.1.2 Soft bake
After spin coating, wafers need to by soft baked (75 °C to 100°C for about10 minutes on the
hot plate or the oven, depending on the specific photoresist type) to remove solvents and
build-in stresses. Soft baking improves photoresist adhesion to the substrate and eliminates
risk of attaching mask to the photoresist layer and devaluation of it. On the other hand, long
baking leads to partial decomposition of the photoactive component.
3.1.3 Pattern transfer
Pattern transfer to soft baked photoresist is realized through illumination or exposure system.
The purpose of the illumination systems is to deliver light to the wafer with the proper
intensity, direction, spectral characteristics and uniformity across the wafer. Lithographic
mask with design opaque to ultraviolet light is during exposition to UV placed into direct
contact with photoresist surface. Structures on the future lithographic mask are most
commonly designed using computer software as (computer aided design) CAD files.
Exposing process with using of the photolithographic mask results in a latent image (1:1 ratio)
of the entire mask in the photoresist layer.
Another way of pattern transfer with ability to transfer structures with custom ratios is
through laser pattern generator (figure 3.2), device allows direct “writing” from computer file
without preparation of the photolithographic mask [150].

32
Fig. 3.2
Laser pattern generator, µPG 101(Heidelberg instruments, Heidelberg, DE) used for lithographic processes in
our department.
3.1.4 Development
Development process involves selective dissolving of the photoresist and results in the relief
image of the designed pattern. Development usually lasts less than one minute (inadequate
developing time can affect thickness of the photoresist layer and/or cause distortion of the
transferred pattern).
3.1.5 Hard bake
Residual developing solvents are removed with following hard baking (above 120°C; 20-30
minutes). Remaining photoresist is hardened with increased thermal and chemical stability
[151].
3.2 Structuring of the metal surfaces
Ability to transfer various patterns into polymer layer is frequently used for structuring of the
metal surfaces. Metal layers can form photoresist underlay, while developed photoresist
serves to selectively protect this layer from the metal etching solution. Resulting metal layer
then copies photoresist design. Figure 3.3 shows lithographic process used to form metal

33
structures for both, positive and negative photoresist type. Other, “Lift off” technique is
based on deposition of the metal layer on the substrate with the developed photoresist
template. Removing of the photoresist layer results in metal structures patterned on the
substrate. Technique performed using standard photoresists requires additional mechanical
operations to strip metal parts from the sidewalls of metal structures, what is reflected on the
quality of the transferred structures. Image reversal photoresists overcome this drawback by
creating the undercut, preventing the deposition of the metal on its sidewalls. Main advantage
of the “Lift off” method is that no metal etching solutions are using and is applicable for all
metals.
Fig.3.3
Lithographic processes for the positive and the negative photoresist type.
3.3 Thin metal film deposition techniques
Deposition of metal layers on other materials is one of the most often used technology
processes. Many industries, as distant as oil drilling and food packaging, benefit from the
modern thin film deposition processes. There are several physical and chemical methods for
creation of the thin metal films on the substrate material. (Silicon and glass substrates are

34
most preferred materials for bioanalytical sensors and microsystems fabrication and
prototyping.) While some, e.g., the wet chemical processes, are relatively simple and may not
require complicated machinery other processes rely on dedicated instruments where the
deposition proceeds in high vacuum.
For example in thermal or vacuum evaporator an electric heater is used to melt and vaporize
the metal specimen. Metal vapors then condense on the unheated surface of the coated
material. Conventional vacuum evaporation, electron beam and reactive evaporation with the
molecular beam epitaxy are main vacuum evaporative methods and are used for depositing of
wide range of metals and metal alloys.
Glow discharge technologies like plasma processes and sputtering utilizes various kinds of
glow discharges for deposition as well as etching of the thin films. Sputtering processes
involves removing atoms from the electrode surface due to ion bombarding and condensation
of the electrode material vapors on a substrate. Diode sputtering is performed with depositing
material (target) used as a cathode and with noble gas discharges. During reactive sputtering,
targets are sputter in presence of the reactive gases and synthesized compounds are deposited
on the substrate.
In my work, magnetron sputtering was used as the metal film deposition technique. This
technique utilizes magnetic field transverse to the electric field at target surface. Upon
interaction with the energetic ions generated in glow discharge plasma, target atoms and
secondary electrons are emitted from the target surface. Secondary electrons do not bombard
substrates, but play an important role in maintaining the plasma and since they are trapped in
cycloidal trajectories in the target (cathode) vicinity, they are enhancing the probability of the
electron-atom collisions, leading to the higher deposition rates (figure 3.4).
Additionally, trapped electrons do not contribute to increased substrate temperature so
temperature-sensitive materials like plastics can be also used as the substrates with the
minimal adverse effects. Thickness of the resulting metal layer is given by deposition time,
gas pressure and deposition current [152].
Gas-phase chemical processes represent another class of the deposition techniques and utilize
chemical processes occurring in the gas or vapor phases (liquid or solid reactants must be
vaporized).

35
Fig.3.4
Magnetron sputtering.
a) Magnetron sputtering device SCD 500. Device allows control deposition process through installed quartz
crystal film thickness monitor [153]. b) Cross section scheme of the sputtering process. Metal atoms are
removing from the target surface due to ion bombarding and condensate on the substrate.
Thin films of insulators, dielectrics, elemental and compound semiconductors and conductors
can be prepared by chemical vapor deposition resulting from the one reaction or the sequence
of different reaction steps. Thermal forming processes (thermal oxidation, nitridation,
polymerization) utilize substrate as a source for the metal or semiconductor constituent.
Electro-processes and mechanical techniques like spary pyrolysis or spray-on and spin-on
techniques belong to liquid-phase chemical techniques (thin film formation is performed from
the liquid phases). Second deposition technique utilized in my work is electroplating. Thin
metal layer is deposited from electrolyte solution containing ions of the desired metal by
current flow between cathode (in our case substrate) and anode, both immersed in the
solution. Process can be quantitatively described by Faraday’s laws and is suitable for many
metals and metal alloys with wide range of film thickness, from very thin films to very thick
coatings (electroforming). Thin oxide or hydrated oxide coatings can be formed on the
aluminum, tantalum, niobium, titanium, zirconium and silicon substrates using electrolytic
anodization. Substrate as an anode is oxidized, while hydrogen gas is evolved at the cathode.
36
Deposition of the metal layers on the non-conducting substrates like glass or plastics can be
performed by chemical reduction plating. Addition of the reducing agent to the desired metal
ion solution leads to metal deposition on substrate placed in the solution without current flow
need. Selective deposition is enabled also by electroless, autocatalytic plating. Metal ions
from the solution are reduced due to addition of the reducing agent on the suitable catalytic
surfaces like the substrates with the same metal as being plated.
Sputtering and thermal metal deposition, sometime in combination with chemical or galvanic
plating, are currently also used for creation of structured layers of thin metal films (nm to µm)
on insulating materials for use in chemical and biochemical sensors and analyzers. Here the
metal layers can be deposited on glass, ceramic or plastic surfaces. Patterning of the layers is
then achieved either using a mask during the deposition or via photolithography and
consecutive etching after the deposition.
As already mentioned there are many alternatives for creation of the thin films [154];
however, sputtering and thermal deposition are by large the most important techniques. While
at present most of the thin film based systems are applied for temperature measurement or gas
sensing [155, 156], measurements in liquid samples for chemical sensing or sample
manipulation are also of great practical interest.

37
4 Fabrication and characterization of the mercury amalgam
working electrodes
Rapid, sensitive, selective, and reproducible analyses of biological samples command
development of new analytical protocols and instrumentation. Growing demands in
biotechnology and medicine require techniques amenable to automation and parallelization
consuming very small amounts of biological material. While separations coupled to mass
spectrometry are irreplaceable, especially in the discovery phases of research [157, 158],
smaller, selective, and much less expensive detection techniques are required for screening
and diagnostic purposes.
Electrochemistry represents one of the promising methods for detection of proteins, nucleic
acids and their components in miniaturized systems [159, 160]. Various fabrication strategies
with different specificity and potentials for microelectrodes generation have been developed
(assembly and screen-printed techniques, photolithography, electrodeposition). Selection of
the proper technique mostly depends on the electrode design, geometry, surface modifications
and its particular application [161].
Mercury electrodes (bare solid amalgam, hanging mercury drop electrodes) could play an
important role in the bioanalysis. Practically all peptides and proteins produce electrocatalytic
signal, chronopotentiometric peak H (down to nanomolar and subnanomolar concentrations)
[162-165]. Although the mercury electrodes exhibits unique electrochemical features (namely,
the broad negative potential window conferred by a high hydrogen overvoltage), development
of new analytical tools based on nontoxic, environment-friendly materials is of great interest.
One of the promising materials for replacing liquid mercury is non-toxic solid amalgam.
Miniaturized amalgam electrodes prepared on the metals dissolving in mercury (Ag, Pt or Au)
was successfully used for parallel detection of trace metals, iodate and thiol detection [166-
168].
In my work, lithographic methods and preparation of vacuum deposited thin metal films was
utilized for fabrication of simple amalgam electrode array, suitable for bioanalytical
applications. Microarray format provides sufficient electrode density for parallel operation
and further integration into microfluidic devices with much less sample consumption.
Electrodes were prepared on glass substrate with deposited thin metal (gold, silver) layer.
Photolithographically patterned top photoresist layer served as an insulator and separate

38
electrodes one from another. Final amalgam electrodes were achieved by galvanic mercury
amalgam formation. Morphology and composition of the resulting amalgam film were
examined in detail using scanning electron microscopy (SEM) with energy-dispersive X-ray
microanalysis (EDS). Electrochemical properties of electrodes were tested with respect to
their size, material, stability and sensitivity using cyclic voltammetry and
chronopotentiometry. Measurements were aimed at detecting changes in the protein structure
such as proteins denaturation.
4.1 Experimental
4.1.1 Materials and methods
Borosilicate glass disks 3 in. ( 75 mm) in diameter, 1.5 mm thick, used as the insulating
substrate) were sputter coated with the layer of the desired base electrode material using a
vacuum sputter coater (SCD 500, Bal-TEC AG, Lichtenstein). All the sputter targets were
also obtained from Bal-TEC AG. Negative resist MaN-420 and developer ma-D 332S were
from Micro resist technology GmbH, Berlin, Germany. Lithographic processes further
included the use of a spin coater (WS-400B-6NPP/LITE, Laurell Technologies, North Wales,
PA) and a hot plate (PZ 28−2, H. Gestigkeit GmBH, Dusseldorf, Germany).
Mercuric acetate (99.999 %), perchloric acid (70 %), and all other chemicals were of p.a.
grade obtained from Sigma-Aldrich s. r. o., Prague, Czech Republic. Platinum wire (>99.99
%) used as an electrode during electroplating was from Safina, a. s., Czech Republic.
A photolithographic mask was designed using ZW CAD 2007 Professional software
(Techsoft s.r.o., Slovakia) and prepared on a plotter film HG NEW HPR-7S (Fujifilm, Japan),
using a photoplotter (FP 8000, CADware s.r.o., Liberec, Czech Republic).
A regulated constant current power supply was constructed locally. It allowed presetting the
output current in the range of 1 nA to 10 mA with the stability better than 10 ppm and the
maximum voltage limited to 5 V.
Morphological characterization and elemental analysis by the scanning electron microscopy
(SEM) micrograph was performed on a MIRA II LMU (TESCAN s.r.o., Brno, Czech
Republic) with qualitative and quantitative energy-dispersive X-ray microanalysis (EDS)

system QUANTAX (Bruker AXS Microanalysis GmbH, Berlin, Germany). Silicon wafers (3
in. diameter, 100) used as substrates for electrodes during the SEM analysis was obtained
from NESTEC (New Bedford, MA).
Electrochemical measurements were perf
Biophysics, Brno. AUTOLAB Analyzer (EcoChemie, The Netherlands)
measurements. The standard cell with a three
electrode as the reference electrode and a pl
All experiments were carried out at room temperature under air. In our measurements, we
applied cyclic voltammetry for determination of an electrochemically active surface of SAE
and adsorptive chronopotentiometric stripping analysis (AdCPSA) [
4.1.2 Adsorptive stripping (AdS)
The working electrode was immersed into a 20
albumin - BSA) in the background electrolyte for accumulation time,
potential, EA of −0.1 V (if not stated otherwise), followed by chronopotentio
No stirring accompanied the accumulation. The initial potential,
potential, Ef of −1.81 V (−2 V), and the stripping current,
amalgam electrodes and hanging mercury drop electrode (HMDE) re
4.1.3 Adsorptive transfer stripping (AdTS)
Protein modified amalgam working electrode was prepared as in AdS and then BSA modified
electrode was washed by 200 µ
blank background electrolyte and recording of chronopotentiograms.
4.1.4 Fabrication of amalgam working
First step in the fabrication process was preparation of the metal substrate for further mercury
deposition. Lithographic technique was used. Selected 3 in diamet
cleaned with piranha solution (4:1 mixture of concentrated sulfuric acid and 30 % hydrogen
peroxide), rinsed with deionized water, and dried on the hot plate at 80 °C. Next, it was
placed in the vacuum chamber of the sputtering
system QUANTAX (Bruker AXS Microanalysis GmbH, Berlin, Germany). Silicon wafers (3
) used as substrates for electrodes during the SEM analysis was obtained
from NESTEC (New Bedford, MA).
Electrochemical measurements were performed in collaboration with the
AUTOLAB Analyzer (EcoChemie, The Netherlands)
. The standard cell with a three-electrode system with an
electrode as the reference electrode and a platinum wire as the auxiliary electrode were used.
All experiments were carried out at room temperature under air. In our measurements, we
applied cyclic voltammetry for determination of an electrochemically active surface of SAE
iometric stripping analysis (AdCPSA) [162] for study of proteins.
tripping (AdS)
The working electrode was immersed into a 20 µL drop of the protein solution (bovine serum
BSA) in the background electrolyte for accumulation time, t
−0.1 V (if not stated otherwise), followed by chronopotentio
No stirring accompanied the accumulation. The initial potential, Ei of
−1.81 V (−2 V), and the stripping current, Istr of −40
amalgam electrodes and hanging mercury drop electrode (HMDE) respectively were used.
tripping (AdTS)
Protein modified amalgam working electrode was prepared as in AdS and then BSA modified
electrode was washed by 200 µL of the background buffer, followed by placing 20
electrolyte and recording of chronopotentiograms.
malgam working electrodes
First step in the fabrication process was preparation of the metal substrate for further mercury
. Lithographic technique was used. Selected 3 in diameter glass substrate was first
cleaned with piranha solution (4:1 mixture of concentrated sulfuric acid and 30 % hydrogen
peroxide), rinsed with deionized water, and dried on the hot plate at 80 °C. Next, it was
placed in the vacuum chamber of the sputtering instrument, and the layer of selected metal
39
system QUANTAX (Bruker AXS Microanalysis GmbH, Berlin, Germany). Silicon wafers (3
) used as substrates for electrodes during the SEM analysis was obtained
in collaboration with the Institute of
AUTOLAB Analyzer (EcoChemie, The Netherlands) was used during
Ag/AgCl/3 M KCl
atinum wire as the auxiliary electrode were used.
All experiments were carried out at room temperature under air. In our measurements, we
applied cyclic voltammetry for determination of an electrochemically active surface of SAE
] for study of proteins.
L drop of the protein solution (bovine serum
tA, at accumulation
−0.1 V (if not stated otherwise), followed by chronopotentiogram recording.
of −0.1 V, the final
−40 µA (−80 µA) for
spectively were used.
Protein modified amalgam working electrode was prepared as in AdS and then BSA modified
L of the background buffer, followed by placing 20 µL of the
First step in the fabrication process was preparation of the metal substrate for further mercury
er glass substrate was first
cleaned with piranha solution (4:1 mixture of concentrated sulfuric acid and 30 % hydrogen
peroxide), rinsed with deionized water, and dried on the hot plate at 80 °C. Next, it was
instrument, and the layer of selected metal

40
was deposited by the magnetron in the argon plasma discharge. Since gold and silver are
known to have lower adherence on glass, we have also tested application of a fine adhesion
layer of chromium or titanium ( 10 nm) onto which the final electrode material (Ag or Au)
was sputtered. Next, a 3.5 µm photoresist layer was deposited on the silver surface using a
spin coater (30 s, 1000 rpm) followed by “soft-baking” on the hot plate (5 min, 100 °C). The
basis for the SAE array was designed as exposed circles in the electrically insulating
photoresist layer. This array was formed by UV exposition (15 min) through a previously
prepared lithographic mask and removal of the unexposed photoresist.
Final metal spots were separated from one another by the insulating layer of the exposed
photoresist and further stabilized by “hard-baking” on hot plate (30 min, 100 °C). The
photoresist layer encloses metal spots, creating the small electrode wells shown in figure 4.1.
The hydrophobic nature of the insulating photoresist material defining the electrode size also
helped to confine the measured sample drop in the electrode area. Besides the design of the
array of spots, the lithographic mask also included two contact areas on both sides of the glass
substrate for electric connection.
Fig. 4.1
Cross section view of the electrode wells. Top, insulating photoresist layer defined the metal spots for further
mercury deposition.
4.1.5 Amalgam formation
The exposed circular silver or gold spots on the glass surface were further modified by
electrolytic mercury deposition. For mercury deposition these plating solutions were tested:
0.1M -0.05M Hg2(NO3)2 in 0.1M H2SO4
0.1 M Hg(NO3)2 in 0.03M HNO3 [169]
5 mM Hg(CH3COO)2 in 0.1 M HClO4 [170]
For amalgamation of the silver and gold spots we obtained best results with the 5 mM
Hg(CH3COO)2 in 0.1 M HClO4. Droplet of the plating solution was during electrolysis

41
deposited above the selected metal spot (figure 4.2) with controlling of the of the deposited
mercury amount by electrolysis time. Each electrode was modified from 20 µL of the plating
solution using a spiral Pt wire electrode and the constant current power supply. Using gold as
an electrode material, electroplating was performed in presence of 20 µL of 1 M H2SO4.
Fig. 4.2
Scheme of the amalgamation process.
Amalgam layer is creating during electrodepositing of the mercury from the plating solution.
According to the thickness of the supporting metal layer and deposited mercury amount, we
prepared electrodes with different mercury/metal ratios. Several possible deposition times are
listed at the table 4.1. For simplification, current efficiency is considered as 100 %, even when
process is less effective, current efficiency is reproducible; maintaining of the process
conditions leads always to the electrode with the same properties. Desired mercury amount
was calculated using Faraday’s laws of electrolysis which can be summarized:
� ��
�. � �. or � �
. �
�. �
For our application,
m is the mass of the mercury liberated at an metal substrate in grams [g]
M is the molar mass of the mercury, 200.59grams [g.mol-1]
F is Faraday constant, 96 485 C mol−1 [C mol−1 ]
z is the number of electrons transferred per mercury ion, for Hg2+, z = 2
t is the total time in seconds [s] when constant current I in amperes [A] was applied.
n is the number of moles of the mercury liberated at an metal substrate [moles]

42
electrode diameter [mm]
height of the Ag layer [nm]
deposition current [µA]
deposition time [s]
mercury amount [ng]
mass fraction, mercury [%]
0.4 600 1 16 17 2 0.4 600 1 122 127 14 0.4 600 1 163 170 18 0.4 600 1 245 260 24 0.4 600 1 327 340 30 0.4 600 1 654 680 46 6 350 225 90 21 054 17
0.8 350 1 327 340 16 0.4 350 1 82 85 16 0.2 350 1 20 21 16 0.4 650 1 82 170 18
Table 4.1
Table of achieved electrode properties depending on deposition conditions.
Surface of the electrode was after mercury deposition washed with deionized water and ready
for measurement. The final amalgam electrodes with a detailed view of the photoresist -
electrode periphery area can be seen in figure 4.3.
Fig. 4.3
(a) Metal (silver) substrate for amalgam formation; diameter 0.4 mm, Ag layer ∼ 350nm,
(b) Final electrode after electrodeposition of the mercury. (c) Detailed view of the final amalgam electrode.

43
4.2 Results and Discussion
4.2.1 Morphological characterization
Morphological characterization and elemental analysis of the resulting film were performed
using scanning electron microscope (SEM) with energy-dispersive X-ray microanalysis
(EDS). Glass substrates were not suitable for these analyses, because of the surface charging
in vacuum leading to the image distortion. For this reason, we have prepared electrodes, under
the same conditions as described above, on the silicon substrates.
Element composition of the cross section area of the prepared silver amalgam electrode was
investigated using electrode with 6 mm diameter. Surface of such electrode was large enough
to allow us breaking it into two pieces with minimal contamination of the created film.
Electrode was prepared according the condition described in the table 4.1. Cross section area
of the electrode is on the figure 4.4. We used this area to create element map (figure 4.4b) and
see the topographical distribution of the selected elements in this selected region. EDS
method was used. Analysis confirmed that mercury (green) was presented on the top of the
silver (red) surface.
Fig. 4.4
a) Cross section area of the amalgam electrode. b) Same area used for creation of the element map. Silicon
supporting layer is represented in blue color, silver in red and mercury in green.

44
The EDS quantitative line scan analysis of identified elements as well as their distribution
along the electrode diameter is in the figure 4.5. Scan line was positioned to cover the whole
electrode diameter, including a short photoresist border on both sides. This area is displayed
on the figure 4.5b by an arrow. Result of the analysis is depictured on the figure 4.5a. From
these results, it can be concluded that irrespective of the mercury concentration the electrode
profile is regular with amalgam uniformly dispersed all over the silver surface. Similar
observations were made also for the gold-mercury amalgam electrodes tested in this study.
Fig.4.5
a) Result of line scan analysis, suggesting that electrode profile is regular, with amalgam uniformly dispersed all
over the silver surface. b) Electrode area on which was analysis performed. Carbon content marks position of
the photoresist border.
Changes in electrode morphology during the amalgam formation were studied by SEM on the
set of electrodes with increasing amount of deposited mercury (controlled by deposition times
listed in the table 4.1). The mass fraction of mercury in the final amalgam layer ranged from
2 % to about 46 % (figure 4.6). Upon visual inspection (light microscope), even a small
amount of mercury caused apparent changes on the silver surface. With an increasing amount
of mercury, the electrode surface became rugged and small mercury droplets were formed.
Later, isolated mercury islands propagated from the electrode periphery to its center. Finally,
the islands merged at Hg content higher than 30 %. At this concentration, the amalgam
surface looked liquid like filling all the pores and gaps. It is worth stressing that, for

45
simplicity, we have operated only in the Hg content corresponding to the phase α in the
amalgam phase diagram [171]. Thus, one should expect only a homogeneous amalgam
surface with uniform morphology. On the basis of the electron micrography, this was not
always the case and formation of different phases was not excluded. The electrochemical
performance of the prepared electrodes was good and reproducible in the whole range of the
compositions; however, at mercury content higher than 35%, the mechanical stability
weakened.
Fig.4.6
SEM images presenting changes in the metal morphology during electroplating.
Mass fraction of the mercury in electrodes was a) 2 % Hg, b) 14 % Hg, c) 18 % Hg, and d) 24 % Hg, e) 30 %
Hg, f) 46 % Hg. The electrode surface with increasing amount of mercury became rough and porous (2−14 %
Hg), further amalgamation makes the surface more liquid like, with mercury filling all the pores and gaps (more
than 30 % Hg). The electrode with 24 % Hg content still pertains to both surface types, rough in the center and
liquid in the periphery as shown in d).

46
4.2.2 Optimization of the fabrication process
In afford to find optimal properties, several pattern designs and electrode diameters were
examined. Two of the tested arrangements are on the figure 4.7. Different electrode materials
were tested as well. As the electrode base material we decide for silver and gold. Both metals
are well known for bad adhesion to the glass substrate, so electrodes with and without
chromium adhesion layer were investigated. After a number of experiments, we have realized
that this procedure, commonly used in microfabrication practice [172], was not needed for
this application since the electrodes were not mechanically stressed during the measurement.
Omission of the adhesion layer simplified the preparation procedure and eliminated any
danger of electrochemical interferences from the metal underlay.
Fig.4.7
Different arrangements and properties of the tested electrodes.
a) array of the 8 x 5 electrode spots with diameter d =2, 1, 0.5, 0.25 and 0.1mm; thickness of the Au layer
~700nm, thickness of the adhesion Cr layer ~ 350nm. b) array of the 8 x 6 electrode spots with diameter d = 0.8,
0.4 and 0.2mm; thickness of the Ag layer ~350nm.
For the electrochemical characterization of prepared electrodes we used well establish
ruthenium electrochemical reaction. Cyclic voltammograms of the amalgam electrodes with
different diameters in presence of 1 mM ruthenium couple Ru[(NH3)6 ]3+/ Ru[(NH3)6 ]
2+ in
background electrolyte are in the figure 4.8. Repeatability of the electrochemical signal
measured on the two electrodes (2 mm diameter) from the same array is in the figure 4.9.

47
Fig. 4.8
Electrode size effect.
Cyclic voltammograms of 1 mM Ru[(NH3)6 ]3+/ Ru[(NH3)6 ]
2+ at the amalgam electrodes with different diameter
(d =2, 1, 0.5, 0.25mm) in 20 µl background electrolyte (50mM acetate, pH 5.1 ). Au amalgam, (Au film ~700
nm), Scan rate: 100mV/s
Fig.4.9
Electrode repeatability.
Two cyclic voltammograms of the amalgam electrodes with diameter 2 mm. Other details as in figure 4.8.

For future measurements we decided for electrode diameter 0.4 mm. These electrodes showed
very good electrochemical properti
(diameter) were easier to manipulation.
Depending on the sputtering instrument used, the sputtered metal layer thickness can vary.
This could lead to variation of the spatial mercury/metal ratio during the mercury electrolysis
in the next step. Indeed, with our sputtering instrument, the metal f
from the center to the edge of the glass substrate by
electrodes with identical thickness of the amalgam layer, it was best to arrange the electrodes
aligned in concentric circles. In this arrange
from the substrate center remained the same and so did the metal thickness. Better sputtering
equipment can provide perfectly uniform metal films, yielding a reproducible mercury/metal
ration across the whole substrate. While several thousand 0.4 mm spots can easily fit on the 3
in. diameter glass substrate, in this work, we have spaced the electrodes for easy access to the
20 µL sample drop. Thus, the final array contained 60 electrodes arranged in concent
circles as it is on the figure 4.10.
Fig. 4.10
Final arrangement of the electrode spots.
Electrodes with 0.4 mm diameter were aligned concentrically with electric contact pads on the side.
array is here positioned on the insulating pad
For future measurements we decided for electrode diameter 0.4 mm. These electrodes showed
very good electrochemical properties with sufficient sensitivity and compare to smaller ones
(diameter) were easier to manipulation.
Depending on the sputtering instrument used, the sputtered metal layer thickness can vary.
This could lead to variation of the spatial mercury/metal ratio during the mercury electrolysis
in the next step. Indeed, with our sputtering instrument, the metal film thickness decreased
from the center to the edge of the glass substrate by 20 %. Thus, for obtaining a set of
electrodes with identical thickness of the amalgam layer, it was best to arrange the electrodes
aligned in concentric circles. In this arrangement, the distance of each electrode in the circle
from the substrate center remained the same and so did the metal thickness. Better sputtering
equipment can provide perfectly uniform metal films, yielding a reproducible mercury/metal
ole substrate. While several thousand 0.4 mm spots can easily fit on the 3
in. diameter glass substrate, in this work, we have spaced the electrodes for easy access to the
L sample drop. Thus, the final array contained 60 electrodes arranged in concent
is on the figure 4.10.
Final arrangement of the electrode spots.
Electrodes with 0.4 mm diameter were aligned concentrically with electric contact pads on the side.
positioned on the insulating pad with two gold contacts on both sides.
48
For future measurements we decided for electrode diameter 0.4 mm. These electrodes showed
es with sufficient sensitivity and compare to smaller ones
Depending on the sputtering instrument used, the sputtered metal layer thickness can vary.
This could lead to variation of the spatial mercury/metal ratio during the mercury electrolysis
ilm thickness decreased
20 %. Thus, for obtaining a set of
electrodes with identical thickness of the amalgam layer, it was best to arrange the electrodes
ment, the distance of each electrode in the circle
from the substrate center remained the same and so did the metal thickness. Better sputtering
equipment can provide perfectly uniform metal films, yielding a reproducible mercury/metal
ole substrate. While several thousand 0.4 mm spots can easily fit on the 3
in. diameter glass substrate, in this work, we have spaced the electrodes for easy access to the
L sample drop. Thus, the final array contained 60 electrodes arranged in concentric
Electrodes with 0.4 mm diameter were aligned concentrically with electric contact pads on the side. Electrode

49
Experiments have shown that both gold and silver suits well, and silver was selected as the
preferred material. Fabrication of the silver array is less complicated and chemistry of the
silver amalgam is better known. Reproducibility of such an array of the electrodes is shown
on the figure 4.11.
Fig. 4.11
Cyclic voltammograms 1 mM Ru[(NH3)6 ]3+/ Ru[(NH3)6 ]
2 at the three different silver amalgam electrodes with
diameter 0.4 mm,silver layer ~650 nm in 20 µl background electrolyte (100mM acetate, pH 5.6 ).
4.2.3 Protein analysis
For protein analysis we decide for presented electrodes arranged into concentric cycles, with
the silver layer ~ 650 nm and mercury mass fraction ~16 %. All the measurements were
performed with the three electrode system from the sample solution deposited directly on the
silver amalgam working electrode with the platinum auxiliary electrode and silver chloride
reference electrode dipped into the solution (figure 4.12).

Fig. 4.12
Connection of the amalgam working electrodes
Detail view of the platinum counter electrode and Ag|AgCl|3 M KCl reference electrode. During measurements,
electrodes were immersed into sample solution deposited on the top of the amal
Proteins adsorbed at electrodes were detected (studied) using constant current
chronopotentiometric (CPS) analysis represented by CPS peak H, named after Jaroslav
Heyrovsky, hydrogen evolution and the high sensitivity to protein det
catalyzed hydrogen evolution [
mercury-containing electrodes [
measured with hanging mercury drop electrode (
electrocatalytic responses of BSA
electrodes. Five micromols of BSA was adsorbed either at HMDE or at single amalgam
electrode (diameter 0.4 mm) in 0.2 M McIlvaine buffer, pH 7, for accumulation potential,
1 min at accumulation potential,
types of electrodes.
Figure 4.13 shows a dependence of peak
large catalytic signal of BSA was observed in agreement with the previously published results
of professor Paleček group [163
concentration in a narrow range, followed by saturation level from about 350 nM. At SAE,
peak H of BSA increased linearly with BSA concentration up to about 1
off.
the amalgam working electrodes array to the autolab instrumentation.
Detail view of the platinum counter electrode and Ag|AgCl|3 M KCl reference electrode. During measurements,
electrodes were immersed into sample solution deposited on the top of the amalgam working electrode.
Proteins adsorbed at electrodes were detected (studied) using constant current
chronopotentiometric (CPS) analysis represented by CPS peak H, named after Jaroslav
Heyrovsky, hydrogen evolution and the high sensitivity to protein det
catalyzed hydrogen evolution [173] responsible for peak H has been observed solely with
containing electrodes [1, 162]. So far, peak H of proteins was predominantly
measured with hanging mercury drop electrode (HMDE)[162, 163, 174]. We compared the
electrocatalytic responses of BSA at HMDE with those obtained at prepared amalgam
electrodes. Five micromols of BSA was adsorbed either at HMDE or at single amalgam
electrode (diameter 0.4 mm) in 0.2 M McIlvaine buffer, pH 7, for accumulation potential,
1 min at accumulation potential, EA of −0.1 V. A well developed peak H was observed at both
Figure 4.13 shows a dependence of peak H on concentration of native BSA. At the HMDE, a
large catalytic signal of BSA was observed in agreement with the previously published results
163] showing a sigmoid curve with linear dependence on BSA
concentration in a narrow range, followed by saturation level from about 350 nM. At SAE,
of BSA increased linearly with BSA concentration up to about 1 µM and then leveled
50
Detail view of the platinum counter electrode and Ag|AgCl|3 M KCl reference electrode. During measurements,
gam working electrode.
Proteins adsorbed at electrodes were detected (studied) using constant current
chronopotentiometric (CPS) analysis represented by CPS peak H, named after Jaroslav
Heyrovsky, hydrogen evolution and the high sensitivity to protein detection. Protein
has been observed solely with
of proteins was predominantly
]. We compared the
at HMDE with those obtained at prepared amalgam
electrodes. Five micromols of BSA was adsorbed either at HMDE or at single amalgam
electrode (diameter 0.4 mm) in 0.2 M McIlvaine buffer, pH 7, for accumulation potential, tA,
was observed at both
on concentration of native BSA. At the HMDE, a
large catalytic signal of BSA was observed in agreement with the previously published results
r dependence on BSA
concentration in a narrow range, followed by saturation level from about 350 nM. At SAE,
of BSA increased linearly with BSA concentration up to about 1 µM and then leveled

51
Fig. 4.13
Dependence of peak H height on concentration of native BSA on HMDE (red) and amalgam electrode (black).
BSA was adsorbed at a working electrode for accumulation time, tA, 60 s at accumulation potential, EA of −0.1
V, followed by immediate chronopotentiogram recording in 200 mM McIlvaine, pH 7, using Istr of −40 µA
(amalgam electrode) and −80 µA (HMDE).
The sensitivity of determination of denatured BSA is very high [175]; low concentration of
native BSA can be detected at lower stripping currents (Istr of −10 µA) as documented in
figure 4.14b, showing a distinguished peak H of 5 nM BSA at tA 5 min. Using amalgam
electrode, BSA was tested by conventional adsorptive stripping (AdS, in situ) or adsorptive
transfer stripping (AdTS, ex situ) analysis. AdS chronopotentiograms were recorded with the
HMDE immersed into the protein solution. On the other hand, in AdTS, the protein-modified
HMDE was washed and transferred to the blank background electrolyte to record the
chronopotentiogram. Using conventional AdS CPS analysis 5 µM BSA produced a well-
developed peak H at −1.64 V, which differed only a little from peak H obtained by AdT CPS
analysis (figure 4.14a). A relatively small decrease of AdTS (ex situ) peak H (height) was
probably due to the removal of loosely bound protein molecules during washing. The results
observed with SAE, thus, did not significantly differ from those obtained earlier with HMDE
[162, 175].

52
Fig. 4.14
a)Peak H of 5 µM BSA at amalgam electrode using conventional adsorptive stripping, AdS (in situ) or
adsorptive transfer stripping (ex situ) analysis. b) AdS peak H of 5 nM native BSA (blue), electrolyte (black), tA
of 5 min; Istr of −10 µA; a,b) background electrolyte: 0.2 M McIlvaine buffer, pH 7. c) Peak H of 300 nM native
(black) and urea denatured (red) BSA in 50 mM Na-phosphate, pH 7; Istr of −30 µA. Higher buffer
concentrations (e.g., 0.2 M) result in higher electrocatalytic peak H, while lower buffer concentrations should be
used to detect changes in the protein structure. Denaturation of 14.4 µM BSA in 0.1 M Tris−HCl, pH 7.3, with 8
M urea was performed overnight at 4 °C. Other details as in figure 4.13.
Recent studies of the professor Paleček group showed that electrocatalytic peak H of different
proteins at HMDE is sensitive to local and global changes in protein structure and allows
discriminate between native and denatured forms of BSA and other proteins at HMDE [163,
175-177]. Similar results were obtained at our amalgam electrode with 300 nM native BSA
and urea-denatured BSA in 50 mM McIlvaine buffer, pH 7 (figure 4.14c). Denatured BSA
produced 3 times higher peak H at more positive potentials (about 20 mV) than native BSA.

53
5 Fabrication of the three electrode sensor with the mercury
amalgam working electrode
Next step towards creation of the simple and disposable electrochemical sensor was
miniaturization of the reference and counter electrode. Amalgam electrodes presented in
previous chapter showed very good electrochemical behavior, but for the operating was
external connection to the reference and the counter electrode still complicated.
To simplify manipulation with prepared working electrodes we designed three-electrode
electrochemical sensor with all electrodes integrated into one substrate. Measurements with
newly prepared sensor required just deposition of the sample droplet onto the sensor surface.
Fabrication process was based on the previously used preparation protocol for the array of the
working electrodes with addition of one more lithographic step.
5.1 Experimental
5.1.1 Materials and methods
Borosilicate glass slides (75 x 50 mm), ~1 mm thick were used as the substrate material for
the electrochemical sensors (Corning, Ted Pella, Redding, CA). Materials and equipment for
lithographic process and preparation of the mercury amalgam electrodes remained the same as
were used in previous section. All additionally used chemical were p.a. grade purchased from
Sigma-Aldrich s.r.o., Prague, Czech Republic.
Electrochemical measurements were performed with AUTOLAB Analyzer (EcoChemie, The
Netherlands). All experiments were performed at the air and room temperature.
Electrochemical behavior of prepared electrodes was studied using cyclic voltammetry and
adsorptive chronopotentiometric stripping analysis (CPS).

54
5.1.2 Fabrication of the metal substrate
Compare to fabrication process used for array of the working electrodes, main difference was
in utilizing of the two lithographic steps and two different lithographic masks. First
lithographic process was used for structuring of the metal layer which is divided into several
separated areas and the second one is to create electrode borders and determine shape and
dimensions of the future electrodes.
Fig. 5.1
Fabrication process for the three-electrode sensor.
a-c) First lithographic process. d-f) Second lithographic process. a) Glass substrate with the metal and
photoresist layers is irradiated through the first lithographic mask, b) structures in the metal layer uncovered
after development of exposed photoresist were subsequently etched away(c). Remaining photoresist is removed
(d) and another photoresist layer is deposited over the metal surface. e) Irradiation of this layer and subsequent
development (f) creates electrode borders.
Fabrication process, showed on the figure 5.1 starts with cleaning of the glass slide, used as
the substrate material for the electrode creation. We used piranha solution with subsequent
rinsing with the deionized water and drying on the hot plate at 80 °C. Prepared glass slide was
then coated with the selected metal/metals. We tested using of two metal layers, silver (300
and 600 nm) and silver with the gold underlay (gold-100 nm, silver-300 nm). According to
results from the previous experiments no adhesion layer was needed. Gold layer was tested as
the counter electrode material, which can be formed after etching off the top silver layer.

55
In the next step, using spin coater photoresist layer was deposited on the metal surface (for
both lithographic steps were used same deposition and baking conditions). After the soft
baking, photoresist layer was irradiated through the first lithographic mask. Unexposed
photoresist was removed during developing process and unprotected structure in the metal
layer was etched away. Etching solutions for the gold and silver portions were used as it is
listed in the table 6.1 (next section).
Remained photoresist layer was after metal etching removed by acetone and isopropanol
rinsing. Lithographic process result in metal layer structured into separated, not conductively
connected parts, assigned for individual types of the electrodes (working, counter and
reference electrode).
In the second photolithographic process was photoresist layer deposited over the structured
metal surface. Irradiation through the second lithographic mask and developing of the
exposed photoresist uncovered metal surface which after further modification formed final
electrodes.
5.2 Results and discussions
5.2.1 Three electrode system with central-unit working electrode
For the initial experiments, we created sensors with the united working, counter and reference
electrode, each of them with one electrical connection. Final sensors as well as lithographic
mask used for fabrication of this sensor are shown in the figure 5.2. After the first lithographic
step was metal layer on the substrate divided into nine separated areas. Each of these areas
serves as the base for creation of the one kind of the electrode (figure 5.2b). Thin metal lines
with the five squares serves as the base for future working electrodes (white area). Area above
and below squares will represent counter (green area) and reference electrode (orange area).

56
Fig. 5.2
Design of the sensor array prepared with the connected working electrodes.
a) Back side of the array. Metal layer divided into separated parts according the structure of the lithographic
mask (b). Areas used to create reference electrodes (orange), counter electrodes (green) and working electrodes
(white). c) Front part of the sensor after second lithographic step using lithographic mask with the final
electrode structure (e). d) Overlapping of the structures from the both masks forming the final sensor.
5.2.2 Optimization of the sensor preparation
Creation of the fully functional sensor requires surface modification of the metal areas
bordered by the photoresist layer. Process to prepare silver mercury amalgam working
electrode was already developed. Properties and dimensions of working electrode remained
same as was described and optimized before.
Reference Ag/AgCl electrode was formed by exposing of the silver layer to the solution of the
FeCl3. We tested different concentrations of the solution ranged from 0.2 to 1M FeCl3 [178,
179]. Creation of the AgCl film using less concentrated solution (0.2 M) required longer
reaction time, making process easier to control, therefore this concentration was used for
further experiments. Counter electrode was used without modification (silver surface) or as
the gold electrode, created by etching away the top silver layer. Experiments showed that this

process was damaging gold surface and etching solution was causing interference during
electrochemical measurements. Silver counter electrode provides satisfactory results with
much easier preparation; therefore this electrode was used for the further measurements.
Upon visual observation of the metal substrate for the electrodes creation, several undesirable
effects of the plating solution on the silver surface were found (figure 5.3). During
amalgamation process was plating solution deposited on the top of the sensor
applying constant current between working electrode (cathode) and Pt wire (anode)
amalgam layer formed. Reference and counter electrode was not involved in this process (no
current flow), but they remained in the contact with the plating
amalgamation process small amount of the mercury can be also deposited on these electrodes
(on the area in contact with the plating solution) causing lower reproducibility of the electrode
sensor properties.
First approach that we try to avoid this effect was connection of metal areas near the electrode
(future reference and counter electrode) as the anode instead of the Pt wire. This could
significantly simplify preparation process but we did not reached desired result; we were still
able to observed changes in metal structure upon contact with the plating solution. Our
observations showed that visible defects in the silver structure
deposition of the plating solution on the metal surface even without curren
electrodes. Followed exposure to the FeCl
layer predominately created on the surface without contact with the plating solution and
effected quality of the resulting reference electrode.
Fig. 5.3
Influence of the plating solution on the silver surface and homogeneity of created AgCl film.
a) Central sensor area with the droplet of the plating solution. b) This surface after a few seconds, when plating
solution was removed. c) Same area with
contact with the plating solution.
maging gold surface and etching solution was causing interference during
electrochemical measurements. Silver counter electrode provides satisfactory results with
much easier preparation; therefore this electrode was used for the further measurements.
n visual observation of the metal substrate for the electrodes creation, several undesirable
effects of the plating solution on the silver surface were found (figure 5.3). During
plating solution deposited on the top of the sensor
applying constant current between working electrode (cathode) and Pt wire (anode)
amalgam layer formed. Reference and counter electrode was not involved in this process (no
current flow), but they remained in the contact with the plating
amalgamation process small amount of the mercury can be also deposited on these electrodes
(on the area in contact with the plating solution) causing lower reproducibility of the electrode
o avoid this effect was connection of metal areas near the electrode
(future reference and counter electrode) as the anode instead of the Pt wire. This could
significantly simplify preparation process but we did not reached desired result; we were still
le to observed changes in metal structure upon contact with the plating solution. Our
observations showed that visible defects in the silver structure were formed immediately after
deposition of the plating solution on the metal surface even without curren
electrodes. Followed exposure to the FeCl3 solution resulted in the unequally formed AgCl
layer predominately created on the surface without contact with the plating solution and
quality of the resulting reference electrode.
Influence of the plating solution on the silver surface and homogeneity of created AgCl film.
a) Central sensor area with the droplet of the plating solution. b) This surface after a few seconds, when plating
solution was removed. c) Same area with the FeCl3 solution, difference in the AgCl film in area with and without
57
maging gold surface and etching solution was causing interference during
electrochemical measurements. Silver counter electrode provides satisfactory results with
much easier preparation; therefore this electrode was used for the further measurements.
n visual observation of the metal substrate for the electrodes creation, several undesirable
effects of the plating solution on the silver surface were found (figure 5.3). During
plating solution deposited on the top of the sensor and with
applying constant current between working electrode (cathode) and Pt wire (anode) was final
amalgam layer formed. Reference and counter electrode was not involved in this process (no
current flow), but they remained in the contact with the plating solution. During
amalgamation process small amount of the mercury can be also deposited on these electrodes
(on the area in contact with the plating solution) causing lower reproducibility of the electrode
o avoid this effect was connection of metal areas near the electrode
(future reference and counter electrode) as the anode instead of the Pt wire. This could
significantly simplify preparation process but we did not reached desired result; we were still
le to observed changes in metal structure upon contact with the plating solution. Our
formed immediately after
deposition of the plating solution on the metal surface even without current flow between
in the unequally formed AgCl
layer predominately created on the surface without contact with the plating solution and
Influence of the plating solution on the silver surface and homogeneity of created AgCl film.
a) Central sensor area with the droplet of the plating solution. b) This surface after a few seconds, when plating
solution, difference in the AgCl film in area with and without

58
Another possible way how to avoid this effect was using less volume of the plating solution
(7 µl instead of 20 µl). We were still able to prepare working electrode, but manipulation with
the device and plating process become more difficult and not always fully successful.
Finally, to avoid access of the plating solution to the surface of the surrounding metal areas
we used PDMS protective layer. This layer was formed by spin coating of the PDMS pre-
polymer (15s, 400 rpm) onto the Petri dish. Polymer was cured at 60 °C for 45 minutes and
cut into small pieces with the hole in the center (1.5 mm diameter). During electroplating was
PDMS in contact with the sensor and exposing just the central area for the working electrode
creation. This change in the fabrication process should eliminated non-homogeneities on the
reference electrode surface.
Resulting system was tested using cyclic voltammetry in the presence of the 20µl of
background electrolyte, 50 mM sodium phosphate buffer, pH 7. Comparison of the expected
(amalgam working electrode with external connection to the reference and counter electrode)
and obtained cyclic voltammograms showed is in the figure 5.4. Two additional peaks in the
cyclic voltammogram measured using our sensor indicated presence of some contamination
originated from the reference electrode.
Fig. 5.4
Expected (blue) and obtained (black) cyclic voltammograms of background electrolyte 50 mM Na-phosphate,
pH 7 at the sensor with amalgam working electrode. Step 2mV, Scan rate 50 mV/s
Two additional peaks (arrows) indicate presence of contamination from the reference electrode.

59
To remove this interference we decide to change fabrication protocol of the reference
electrode. We decide for electrodeposition of the AgCl layer. Four solutions were tested:
NaCl, HCl, KCl, all with concentration 0.1M and (1:1) mixture HCl+KCl. Current density for
initial experiments was chosen similar as for mercury deposition. In the mean of the prepared
AgCl film homogeneity, we achieved best result using mixture of the HCl and KCl solutions,
least homogeneous was film prepared using NaCl. For further preparation of the reference
electrode was also optimized deposition time. Effect of the increasing deposition time on the
deposited AgCl layer is in the figure 5.5.
This change in fabrication process helped us to remove unwanted signals from the
electrochemical measurements.
Fig. 5.5
Effect of the electrodeposition time on the homogeneity of the resulting AgCl film.
Plating solution: mixture of the KCl and HCl (0.05 M). Deposition current: 10 µA.

60
5.2.3 Protein measurements
Protein measurements were performed on sensors prepared according to these selected
conditions. Resulting sensor is on the figure 5.6.
Working electrode was prepared by electrodeposition of the mercury from the 20 µl of the
plating solution: 5 mM Hg(CH3COO)2 in 0.1 M HClO4 using 1µA current applied between Pt
wire and the future working electrode. Surface of the counter and reference electrode was
during amalgamation covered by PDMS protection layer, which was after the completed
deposition removed.
Reference electrode was prepared by electrodeposition of the AgCl layer from the 20 µl of
the plating solution containing 0.05 M KCl and 0.05 M HCl using 12.5 µA applied between
Pt wire and future reference electrode for 5 minutes.
Counter electrode was formed by silver surface with no further modification.
Fig. 5.6
Final sensor structure.
Working silver amalgam electrode in the centre (0.4 mm diameter), upper silver counter electrode and bottom
argentochloride reference electrode.
For the protein analysis we designed new arrangement of the sensors (figure 5.7). All of the
sixteen working electrodes were connected to potentiostat through the separated contact.
Reference electrodes and counter electrodes were for simplification of the fabrication process
connected through one joined contact area.

Fig. 5.7
Design of the sensor array prepared for protein analysis.
a) Metal layer divided into three separate parts according the structure of the lithographic mask. b) Center area
(orange) will serve as future reference elect
connection. Two areas aside from reference electrode will serve as counter electrodes (green). c) Front part of
the sensor after second lithographic step using lithographic mask with the fin
Reproducibility of the presented sensors was examining using cyclic
presence of ruthenium couple Ru[(NH
shown in the figure 5.8.
Fig. 5.8
Cyclic voltammograms of 1 mM Ru[(NH
electrolyte (50mM acetate, pH 5.1 ). Scan rate: 100mV/s
Design of the sensor array prepared for protein analysis.
a) Metal layer divided into three separate parts according the structure of the lithographic mask. b) Center area
(orange) will serve as future reference electrode. Each of the sixteen working electrodes (white) has its own
connection. Two areas aside from reference electrode will serve as counter electrodes (green). c) Front part of
the sensor after second lithographic step using lithographic mask with the final electrode structure shown in (d).
Reproducibility of the presented sensors was examining using cyclic voltammetry
presence of ruthenium couple Ru[(NH3)6 ]3+/ Ru[(NH3)6 ]2+. Resulting voltammograms are
Cyclic voltammograms of 1 mM Ru[(NH3)6 ]3+/ Ru[(NH3)6 ]
2+ at the three different sensors in 20
electrolyte (50mM acetate, pH 5.1 ). Scan rate: 100mV/s.
61
a) Metal layer divided into three separate parts according the structure of the lithographic mask. b) Center area
rode. Each of the sixteen working electrodes (white) has its own
connection. Two areas aside from reference electrode will serve as counter electrodes (green). c) Front part of
al electrode structure shown in (d).
voltammetry in the
Resulting voltammograms are
at the three different sensors in 20 µl background

62
Ability of the created sensor to protein analysis was tested by CPS analysis. First we put 20 µl
drop of background solution i.e. 50 mM Na-phosphate buffer, pH 7, followed by
chronopotentiogram recording. Then, 5 µM denaturated BSA (den BSA) was adsorbed at
accumulation potential, EA of -0.1 V for accumulation time, tA of 2 min at same sensor and
CPS peak H was recorded. At these experimental conditions we observed well developed
peak H at peak potential Ep -1. 7 V well separated from the background. Resulting
chronopotentiogram is in the figure. 5.9.
Fig. 5.9
Constant current chronopotentiometric stripping (CPS) peak H of 500 nM denBSA (blue) adsorbed working
electrode for, tA of 60 s at EA -0.1V from 50 mM Na-phosphate buffer, pH 7 (el, black), followed by
chronopotentiogram recording with, Istr -25 µA.
As described in previous chapter, chronopotenciometric peak H can be used for following of
conformational changes of proteins. We decided to continue with study of native and
denatured form of BSA. As was reported earlier we observed big difference between native
BSA (natBSA) and denBSA. 1 µM natBSA adsorbed 60 s was 10 times smaller than denBSA
adsorbed at different sensor. Peak potential of natBSA is about 20 mV shifted to negative
potentials in agreement with previous results observed at mercury electrode [176] (figure
5.10).

63
Fig.5. 10
CPS peak H of 1 µM natBSA (red) and denBSA (blue) adsorbed at two different working electrodes, tA of 60 s.
Other details as in Fig. 5.9.
Some authors concluded that proteins are denatured when adsorbed at metal surfaces
(including bare mercury) [180, 181]. Only few results contradicted this conclusion [182,162].
To prevent direct contact of protein with metal surface we created a dithiotreitol (DTT) self-
assembled monolayers (SAM) at our working electrode. Prevention of the protein contact
with the amalgam layer is important in the term of electric driven protein denaturation during
chronopotentiometric experiments. DTT was chosen because this reducing agent is frequently
added to protein solutions at millimolar concentrations to keep proteins in their reduced state.
Removal of DTT from protein solutions is time-consuming and laborious and the procedure is
potentially dangerous to the biological activity and native conformation of many intracellular
proteins. DTT-modified Hg electrodes were employed to study the effect not even of native
and denatured form of BSA [165] but also of oncogenic mutations on the tumor suppressor
protein p53 [164]. We prepared BSA·DTT modified working electrodes in two steps. First
DTT modified electrodes was prepared by immersion of the HMDE in 5 mM DTT for
accumulation time, tA, of 60 s at an accumulation potential, EA, of -0.1 V. Then DTT modified
electrode was transferred to 500 nM BSA in the background electrolyte (50 mM Na-
phosphate, pH 7) at EA -0.1 V, for tA 60 s BSA, followed by chronopotentiogram recording

64
with stripping current -25 µA. Also at DTT-modified electrode we were able to discriminate
between native and denatured form of BSA, where peak H of denBSA was about 5 times
higher than peak H of natBSA. In addition to peak H figure 5.11also shows a sharp peak S, at
less negative potentials than potential of peak H, due to reduction of Hg–S bonds. Peak S
appears also in chronopotentiogram of pure electrolyte (not shown).
Fig.5. 11
CPS peak H of 500 nM natBSA (red), and denatured BSA (blue) at DTT-modified electrode in 50 mM Na-
phosphate, pH 7. Other details as in Fig. 5.9. Preparation of DTT- modified electrode see in the text.
These results are encouraging but before making any conclusion about more or less general
applicability of peak H at sensor with the amalgam working electrode for investigation of
native and denatured proteins, more work, involving various proteins and experimental
conditions, will be necessary.

65
6 Fabrication of the metal structures with defined properties
Biological materials represent a very complex sample requiring specialized analytical
methods providing high sensitivity, selectivity and reproducibility. Exploiting new features of
micro/nanoparticles of diverse sizes, geometries and composition is one of the possible
strategies to improve performance of analytical methods. Particles can be used directly or
after proper functionalization in variety of bioanalytical formats; quantification tags for
optical and electrochemical detection, substrates for multiplexed bioassays or other signal
transducers [183].
Particular application and function of the particles determine selection of the fabrication
protocol. For example, solvent evaporation is a popular method to prepare polymer particles
[184, 185]. Introducing microfluidics into preparation process allows high throughput
generation of uniform structures with multitude of applications [186-189]. Particles shaped
from liquid precursors (monomers, solders) are solidified within the microfluidic device.
Combination of polymerizing monomers with functional additives, metals, fluorescent or
magnetic micro/nanoparticles leads to multifunctional optically and/or magnetically
functionalized particles [190]. Shape and size of prepared particles is determined by
properties of the microfluidic channel. Limitation of the method is that particles can be
prepared in the small range of the dimensions controlled by fabrication conditions. More
possibilities provide photochemical polymerization applying UV light through transparency
mask. This process allows prepare particles with shape determined by both the mask and the
channel topography [191- 193].
High resolution pattern transfer makes soft lithography a promising tool for constructing two
dimensional (2D) and three dimensional (3D) free-standing structures with potential
bioanalytical use [194, 195]. Using removable or soluble templates, high throughput
generation of uniform and well defined freestanding micro/nanostructures with shape and size
versatility can be achieved. Particles released from their sacrificial layer (substrate) can be
used in their primal form [195-200] or undergo controlled topology changes and form more
complex geometries. Particles can be folded from their precursors manually [201, 202], or
spontaneously due to magnetic interactions, different swelling of their components or change
their shapes upon temperature change [203-205].

66
Combination of micro/nanostructures with magnetic materials opens up another possibility for
self-assembling into directed topologies [203]. Controlled movement of magnetic particles
allows selection and separation of specifically labeled target cells, cell organelles and
biologically active compounds (nucleic acids, proteins, xenobiotics) directly from the crude
samples. Magnetic particles of wide diameter range (nanometers to micrometers) with
immobilized antibodies and other compounds are commercially available [206]. Various
methods for the production of magnetic particles, their functionalization and modification
have been already developed [207, 208]. Combination of their unique features with proper
surface modification makes them suitable tool for variety of clinical applications including
drug targeting, diagnostics and cancer therapy [209-211].
Here we are presenting new versatile strategy for fabrication of the microstructures using
photolithographic technique. In the first approach, a basic and commonly used dark-room
photographic process is used to transfer structures from the photomask to the gel substrate.
Instead of the photoresist layer, agarose gel containing photosensitive silver chloride is used.
Irradiation through the lithographic mask results in silver structures formed inside of the gel.
These metal structures can serve for the selective attachment of the biomolecules (for e.g.
through the thiol functional groups) in the selected areas.
To produce free-standing metallic particles combination of the thin metal film vacuum
deposition and lithography was used. Optimized fabrication process allowed easy and flexible
changes in material composition and properties of the resulting structures. Monometallic and
multimetallic particles of various dimensions and shapes were prepared. Particles with a
magnetic layer allowed controlled and addressable positioning in the microfluidic system.
Particles may present promising material for signal enhancement in electrochemical
applications or they may act as a potential part of immunosensors based on excellent optical
properties of the prepared particles.
6.1 Experimental
6.1.1 Materials and Methods
SeaPlaque® GTG® Agarose (Lonza Rockland, Inc., Rockland, USA) was used for preparation
of the gel matrix. Silver halide was prepared using AgNO3 (99%) and NaCl (99.5%), both

67
purchased from Sigma-Aldrich s.r.o. Prague, Czech Republic. Borosilicate glass slides (75 x
50 mm, ~1 mm thick) used for gel casting and as the substrates for free-standing structures
fabrication were obtained from Corning, Ted Pella, Redding, CA. Mask structure was
designed using Microsoft® PowerPoint and printed on the transparent foil using common
office laser printer. Photographic process included Fomadon LQR developer (used in mixture:
developer/water 1:9) and Fomafix fixer (used in mixture: fixer/water 1:4) solutions obtained
from Foma, Hradec Králové, Czech Republic.
Two kinds of photoresists were used for preparation of free-standing particles. Sacrificial
layer of negative photoresist, MaN-420 (Micro resist technology GmbH, Berlin, Germany)
was used after dilution with acetone (photoresist/acetone in ratio 1:3). The top layer of
positive photoresist was formed from Positiv 20 (CRC Industries Europe N. V., Zele,
Belgium) developed with 7g/dm3 NaOH solution. Selected metal material was first deposited
using a vacuum sputter coater SCD 500, Bal-TEC AG, Lichtenstein. The designed pattern for
particles creation was transferred to photoresist layer using tabletop laser pattern generator
µPG 101, Heidelberg Instruments Mikrotechnik GmbH, Heidelberg, Germany. Solutions used
for etching of the metal layers are listed in the table 6.1 All other instrumentation used in
lithographic process was the same as described in previous chapters. If not listed otherwise all
chemicals were of p.a. grade obtained from Sigma-Aldrich spol. s r.o., Prague, Czech
Republic.
Electrodes for the comparison of the emitted light during electrochemiluminescence reaction
(ECL) on the gold electrode with and without chromium adhesion layer were prepared by
sputter-coating of ~ 200 nm gold and ~ 200 nm gold with ~50 nm chromium layers on the
glass substrate (microscope slides) and then cut into approximately 1 cm wide stripes.
ECL measurements on the gold microparticles were performed using UV transparent capillary
(length: 8cm, diameter: 100 µm) with 50x 50 µm gold particles (~300nm gold layer). A
laboratory-assembled system, where ECL emission from one particle was collected by a
microscope objective 40 x 0.65 (Oriel, Stratford, CT) and detected by photomultiplier tube (R
647-01, Hamamatsu, Japan) was used together with a laboratory built high voltage power
supply (up to 6 kV) providing output pulses from 10 to 999 ms.

68
metal to be etched etching solution (reagents, ratio)
gold (Au) 4g KI, 1g I2 in water (40 ml)
nickel (Ni) 15 % FeCl3
chromium (Cr) 16.5 g (NH4)2Ce(NO3)6, 4.2 ml HClO4 (70 %) in water (100 ml)
silver (Ag) 1g K2Cr2O7, 5.8 g NaHSO4 in water (100 ml)
copper (Cu) 15 % FeCl3
Table 6.1
List of the composition of the etching solutions used during fabrication processes
6.2 Results and discussion
6.2.1 Preparation of the silver structures within the gel matrix
Agarose gel was prepared from calculated amount of the agarose powder added to the flask
with distilled water and the stir bar. The solution was brought to boil while stirring. After
dissolving of the agarose, NaCl and AgNO3 solutions were added. For preparation 20 ml of
photosensitive gel, 2 ml of the 1 M NaCl and 2 ml of the 1 M AgNO3 were added to the 16 ml
of the dissolved agarose. While still warm (approximately 50 °C - 60 °C) the gel was casted
between two glass slides with the thickness selected by plastic spacers. Due to
photosensitivity of the silver halide, preparation and manipulation with the agarose gel has to
be performed in the dark room.
6.2.2 Exposure and development
One of the glass slides covering solidified gel was replaced with the photomask (transparent
foil with black pattern). To obtain best results, the mask has to be in direct contact with the
gel. Air bubbles or impurities between the gel and mask cause distortion of the transferred
pattern. Exposure of the prepared photosensitive gel, same way as during photographic
process, creates negative latent image of the structures from the photomask in the gel
substrate. Developer solution based on hydroquinone turns this latent image into visible
picture composed of metallic silver. Unexposed silver chloride is removed from the gel using
fixer solution based on the sodium thiosulfate. Residues of the fixer solution are removed
from the gel by immersion into the distilled water. Resulting gel matrix containing silver
structures can be seen on the figure 6.1.

69
6.2.3 Optimization of the fabrication process
Fabrication process was optimized in the mean of exposure time and concentration of the
agarose gel. We tested several exposure times (3-60 seconds). Longer exposition times
shorten development process, but negatively affect the image quality. After preliminary
experiments the optimum exposition time was set to 5 seconds.
Fig. 6.1
Metal structures created within polymer matrix:
a) Squares with edge length range from 0.8 to 0.4 mm. b) Shape and size versatility of presenting method was
demonstrated by creating of miniaturized logotype within the same gel matrix. Logotype was written into the
rectangle with dimensions 8.6 mm to 14 mm.
Agarose concentration determines permeability as well as hardness of the prepared gel. Tested
concentration range was (1.5 – 4 w %). Best results were obtained using ~ 2 % agarose gel;
manipulation with low concentrated gel was difficult and gel was prone to cracking.
After the exposition and development the gels was cut into thin slices for microscopic
determination of the depth of the silver layer. Measurements showed that silver layer depth in
the agarose gel was ~ 300 µm.
Quality of the photomask was main limitation in presented process. More sophisticated
instrumentation can lead to structures copying original more accurately. Experimental work
was done when the photoplotter and laser pattern generator were not available in our
laboratory. Purchasing of these instruments enabled preparation of structures with much
higher resolution and the experiments with agarose embedded colloid silver were temporarily
abandoned in favor of the work with the free-standing metal particles.

70
6.2.4 Fabrication process for the free-standing metal particles preparation
Compared to chemical reduction of silver colloids the vacuum sputtering process provides a
more flexible way of depositing defined thickness of a variety of metal layers. The protocol
developed in this work starts with spin coating of the thin photoresist layer (30 seconds, 3000
rpm) on the glass substrate cleaned with piranha solution. Next, layer of selected metal/metals
was deposited on the top of the soft-baked photoresist (hot plate 60 minutes, 100 °C). Several
metals and their combination were tested (Ni, Cr, Au, Ag, Cu, Ni/Ag, Ni/Cu, Ni/Cr, Ni/Au)
with different thickness (50-200 nm thick Ni film, 50-150 nm Ni with 50 nm of Cu, Cr or
Ag). Nickel was selected for his magnetic properties which simplify manipulation with the
particles and allow their directed positioning. In the next step, top the photoresist layer (15 s,
400 rpm) was deposited on the metal surface and soft-baked for 60 minutes on the hot plate at
70 oC.
Fig. 6.2
Fabrication process.
First, photoresist layer is spin coated on the glass substrate; metal/metals and another photoresist layer are
deposited on the top of it. After exposition and development, uncovered metal portions are etched away.
Dissolving of both photoresists will release particles into solution.

71
Laser pattern generator was used to transfer particles design onto the top photoresist layer.
Mask was designed as an array of squares to maximize number of resulting particles. For
initial experiments, particles length ranged from 15 to 300 µm with 10 µm distances between
each square. Developing of the photoresist was followed by etching of unprotected
metal/metals and pouring substrate into 2 M NaOH solution. Photoresist was dissolved and
particles released from the substrate. While the magnetic particles are easily handled by using
a permanent magnet the transfer of non-magnetic particles into the buffer solution was
performed after centrifugation of the organic phase after the particle release. Scheme of the
fabrication process is described in the figure 6.2.
6.2.5 Properties of the prepared structures
Described fabrication process is applicable for various metals (limited just by availability of
the sputtering targets and etching solutions). For example, gold square particles with length
50 µm and thickness ~ 300 nm can be seen on the figure 6.3.
Fig. 6.3
Photographs of the resulting gold particles (gold layer ~ 300nm, square shape: 50 x 50µm) with three different
magnifications.
Shape of the prepared particles is not limited only to squares. Versatility of the method to
prepare particles of the various geometries was demonstrated on the puzzle shaped particles.
Three different structures were placed into the one photomask, resulting into mixture of the
diverse particles (figure 6.4).

72
Fig. 6.4
Puzzle shaped chromium particles ~ 200 x 200µm, chromium layer ~ 150 nm.
The developed method can be used for preparation of multimetallic particles as well. Gold is a
favorable metal for many bioanalytical applications due to its chemical stability and affinity
towards thiol compounds. Gold surface of the prepared particles could be used for attachment
of various biomolecules. Unfortunately, our sputtering device does not allow preparing high
quality metal layers. During metal etching gold layer starts to separate from the nickel
(figure.6.5a). Metal with similar properties as the gold, but with the lower chemical stability is
silver. Bimetallic structures composed of layer of silver and nickel could be prepared without
metal separation. Pictures of the silver/nickel and copper/nickel particles are in the figure
6.5b, c.
Fig. 6.5.
Bimetallic particles.
a) Au/Ni particles, rectangles (200-300 µm x 200-300 µm, gold layer ~50 nm, nickel layer ~ 150 nm), after
metal etching are nickel and gold layer separated from each other. b) Ag/Ni particles, square shape ( 300 x
300µm, silver layer ~ 50 nm, nickel layer ~ 150 nm), c) Cu/Ni particles, square shape ( 300 x 300 µm, copper
layer ~ 50 nm, nickel layer ~ 150 nm)
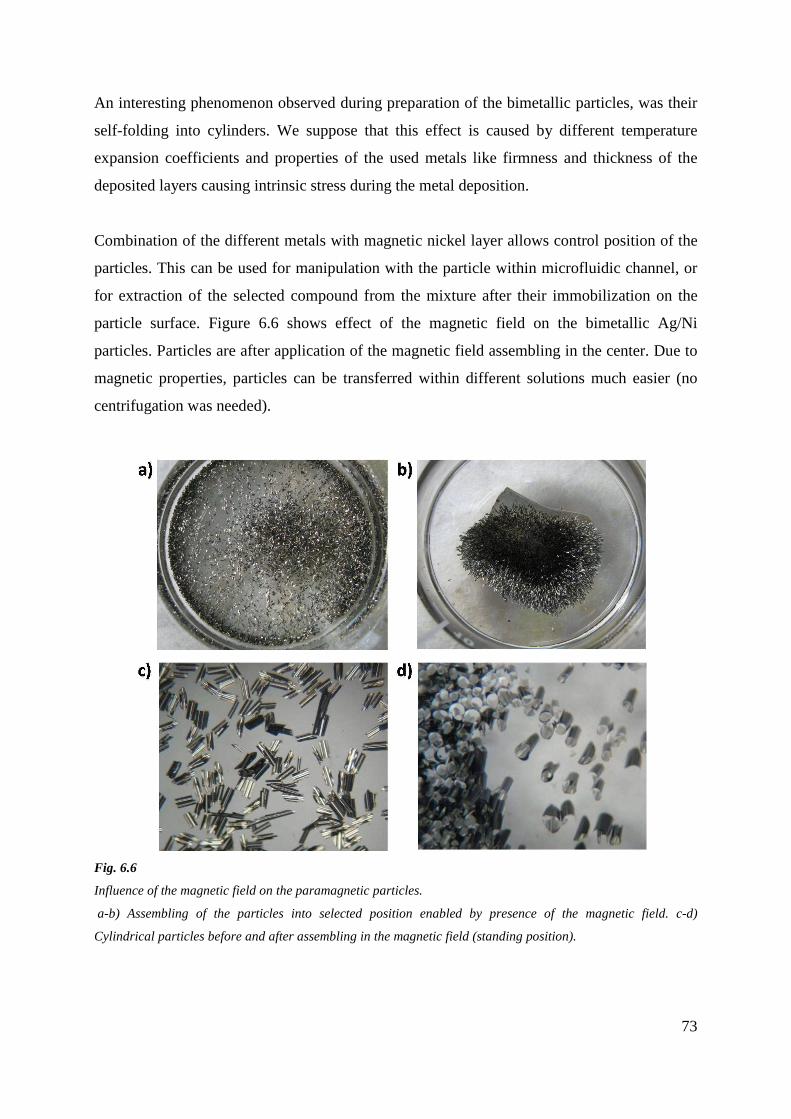
73
An interesting phenomenon observed during preparation of the bimetallic particles, was their
self-folding into cylinders. We suppose that this effect is caused by different temperature
expansion coefficients and properties of the used metals like firmness and thickness of the
deposited layers causing intrinsic stress during the metal deposition.
Combination of the different metals with magnetic nickel layer allows control position of the
particles. This can be used for manipulation with the particle within microfluidic channel, or
for extraction of the selected compound from the mixture after their immobilization on the
particle surface. Figure 6.6 shows effect of the magnetic field on the bimetallic Ag/Ni
particles. Particles are after application of the magnetic field assembling in the center. Due to
magnetic properties, particles can be transferred within different solutions much easier (no
centrifugation was needed).
Fig. 6.6
Influence of the magnetic field on the paramagnetic particles.
a-b) Assembling of the particles into selected position enabled by presence of the magnetic field. c-d)
Cylindrical particles before and after assembling in the magnetic field (standing position).

74
6.2.6 Surface modification
One potential application of the resulting particles employs their excellent reflexivity for a
sensing element in bio-sensors. To fulfill this purpose, surface modification of these particles
was studied. We tested immobilization technique based on strong histidine affinity towards
the nickel surface. Methods for protein purification [212-215], and immobilization based on
this affinity [216, 217] are well known. Biomolecules carrying polyhistidine-tag (trademark
name His-tag) are commercially available. We have used this affinity for selective
immobilization of the particles on the poly L histidine modified glass substrate. Before
modification, glass slide was activated in 2M NaOH solution overnight, rinsed with distilled
water and dried on the hot plate at 80 °C for 60 minutes. In the next step, 6.5 µl of 50 mg/ml
poly L histidine solution, prepared in 100 mM acetate buffer (pH 4.8) was deposited on the
glass substrate to form a circle (figure 6.7). After 120 minutes the substrate was washed in
acetate buffer and Ni particles, dispersed in acetated buffer were added. Particles were
preferable attached at the area where solution of the poly L-histidine was deposited. Particles
can be released in the buffer flow and repeatedly immobilized. Unfortunately, reproducibility
of presented results was limited and more work will be needed for practical application.
Fig. 6.7
Modification of the glass substrate with the poly L histidine solution.
a) Circle made of the poly L histidine solution deposited on the glass substrate. b) Washed substrate after
addition of the nickel particles. Centre of the circle was marked with the red dot, so the position of the histidine
solution can be recognize. Particles visibly prefer to attach on the modified area, creating sharp border between
modified and unmodified area (c).

75
6.2.7 Electrochemiluminescence reaction on the metallic particles
Next application of the metal nanoparticles was tested in collaboration with our partners at
KIST in Saarbrucken, Germany. Electrochemiluminescence (ECL) represents
chemiluminisence which can be triggered by application of the electrical field on the
electrode. Labeling of the molecules with ECL active species can be used as sensitive
detection method for various biomolecules [218-221]. Applying of the voltage on the
electrode in the presence of the ECL active label results in detectable light emission. Variety
of the commercial systems for ECL immunoassays and DNA probe assays were already
developed. Compared to fluorescence detection system which also requires labeling of the
selected molecules with the fluorescence active species, ECL detection method does not
require any external light source [222, 223].
Our goal was to observe ECL reaction on the free standing gold particles (50 x 50 µm square
shapes, gold layer ~ 300 nm). In our arrangement, particles were used as the bipolar [224],
floating electrodes therefore no direct connection of the particles to the power supply was
needed. Principles of the bipolar electrochemistry and their potential application in analytical
systems in combination with the ECL were already described in several publications [225-
227]. In short, floating electrode/electrodes have to be in contact with the solution when two
driving electrodes are used to create a linear potential gradient through this solution. Each
electrode floats to an equilibrium potential due to potential difference at the electrode/solution
interface, so both anodic and cathodic overpotentials will exist on each electrode. ECL
reaction is possible when those overpotentials exceed potentials necessary for the oxidation
and reduction of ECL reactants in the solution. ECL reaction on the two floating electrodes is
depictured on the figure 6.8a. Two glass slides with gold, gold/chromium layer were
immersed into the solution containing ECL active Tris(2,2′-bipyridyl) dichlororuthenium
hexahydrate (Ru(bpy)3 2+) and coreactant 2-(Dibutylamino) ethanol (DBAE) in the TRIS-
phosphate buffer, pH 7.5. The scheme of the reaction of the Ru(bpy)3 2+/DBAE ECL system
is on the figure 6.8b.

76
Fig. 6.8
a) ECL reaction on the two gold floating electrodes.
Stronger light emission was observed from the gold electrode when chromium layer was not used. Applied
voltage was ~4V/ cm. Testing solution: 25 mM DBAE, 200µM Ru(bpy)3 2+ in the 150 mM TRIS-phosphate buffer
(pH 7.5).
b) Reaction scheme and mechanism of the Ru(bpy)3 2+/ DBAE system.
Both reactants are electrooxidized on the anode surface, resulting in Ru(bpy)3 3+ and radical cation
DBAE•+which on deprotonation forms strongly reducing radical DBAE•. This radical reduces Ru(bpy)3 3+ to the
excited state Ru(bpy)3 2+* which relaxes into the ground state by emiting light (~620 nm) [228].
Since the main potential application of the ECL reaction on the nanoparticles is expected to be
in microfluidics the first experiments were conducted in a 100 µm id fused silica capillary (8
cm long) with transparent (acrylic) outer surface coating. The particles were carefully
positioned in the capillary filled with the solution containing ECL reactants, 5mM DBAE and
50 µM Ru(bpy)3 2+ in the 13 mM TRIS-phosphate buffer (pH of the resulting solution was
7.8). Laboratory assembled detection system used for the experiments is depictured on the
figure 6.9. Ar- ion laser was used to localize the particle within the capillary (reflection of the
laser beam) and adjust objective position to collect maximum of the emitted ECL light. The
whole system was enclosed in a black plastic box and covered with the black fabric during
measurements.

77
Fig. 6.9
System used for ECL measurements.
UV transparent capillary was fixed between two screws (48 mm from each other), enabling movement of the
capillary in the x, y direction. Both ends of the capillary were immersed in the eppendorf tubes (0.5 ml), which
served as reservoirs. Connection with the HV power supply was realized through the steel electrodes immersed
into the reservoirs. Particle was localized using laser beam reflection. Light emitted during ECL reaction was
collected by PMT tube.
The light emitted as a result of the ECL reaction was examined for different potentials applied
on the capillary and selected times. In the system with one particle, first light signal was
observed when 3500 V was applied on the capillary for at least 500 ms. (437.5 V/cm;
2.188V/ 50 µm particle).
Signals measured when 4000V, 3750V, 3500V were applied on the capillary are in figure
6.10. Starting at the time 10s, short voltage pulses were applied on the capillary. First pulse
was 100ms and every 5 seconds another pulse was applied with 100 ms longer duration.
Applying of the higher voltage allows detecting stronger light emission. When 4000V was
applied for at least 600 ms, plateau was formed on the top of the developed peaks. Collection
of the emitted light strongly depends on the position of the particle inside of the capillary,
affecting reproducibility of the signal for different particles.

Fig. 6.10
Dependence of the ECL emitted light on the applied voltage and the time range when voltage was applied.
Comparison of the light emission signals from the one gold particle, square shape 50 x 50µm, gold layer ~
300nm, when different voltage was applied between two driving electrodes. High voltage pulses in the
increasing time periods ranged from 100ms to 900 ms were applied and light emission signals collected. ECL
active solution: 5mM DBAE and 50 µM Ru(bpy)
The above described experiments clearly show the potential for ECL detection in microfluidic
channel dimensions.
Dependence of the ECL emitted light on the applied voltage and the time range when voltage was applied.
Comparison of the light emission signals from the one gold particle, square shape 50 x 50µm, gold layer ~
when different voltage was applied between two driving electrodes. High voltage pulses in the
increasing time periods ranged from 100ms to 900 ms were applied and light emission signals collected. ECL
active solution: 5mM DBAE and 50 µM Ru(bpy)3 2+ in the 13 mM TRIS-phosphate buffer (pH 7.8).
The above described experiments clearly show the potential for ECL detection in microfluidic
78
Dependence of the ECL emitted light on the applied voltage and the time range when voltage was applied.
Comparison of the light emission signals from the one gold particle, square shape 50 x 50µm, gold layer ~
when different voltage was applied between two driving electrodes. High voltage pulses in the
increasing time periods ranged from 100ms to 900 ms were applied and light emission signals collected. ECL
phosphate buffer (pH 7.8).
The above described experiments clearly show the potential for ECL detection in microfluidic

79
7 Conclusions
Main goal of my PhD thesis was design and preparation of analytical systems utilizing thin
metal films.
In the first part of my work, deposition of a silver layer on an insulating material (glass)
followed by electrolytic modification with mercury was used for simple, rapid, and
inexpensive preparation of a solid silver amalgam working electrode array. Fabrication
process allowed preparation of electrodes with various geometries in an array or a single
electrode arrangement, the composition of the mercury amalgam can be easily optimized by
precise timing of the electrolysis step. The performance of individual electrodes is comparable
to the standard mercury electrodes with the advantage of the batch-to-batch electrode
reproducibility. Additionally, unlike pure mercury, the amalgam is not toxic and, as with
every single use system, there is no danger of sample cross-contamination. Besides proteins,
DNA, RNA, can be easily specifically labeled to produce another type of electrocatalytic
signals [229, 230]. Additionally, amalgam working electrodes were successfully integrated
into small electrochemical sensor. While the present protocol uses a glass wafer as the
multisensor substrate, it can be easily substituted by many ceramic or plastic supporting
materials for volume preparation, leading to cost-effective disposable electrodes. Similar way,
prepared sensor can serve as the detection system in microfluidics.
In the second part of my work, two simple methods for controlled (in the mean of geometry
and dimension) preparation of the metal structures were presented. First method was based on
photographic process and photosensitivity of silver chloride. This method can represent
valuable tool for creation of the metal structures in microfluidics. Small channels with
complicated access could by easily modified by exposition through the lithographic mask.
Created metal film can be further used for biomolecules immobilization. Photographic
process with different chemistries based on gold particles (chrysotype) or iron compounds
(cyanotype) were already developed. Modification of those processes can be used to create
similar structures combining different materials inside one channel.
Another method utilizes lithographic technique to form metal film deposited onto dissoluble
layer into free-standing particles. Structures of various dimensions (from tenths of nanometers
to microns) and shapes were prepared. Mono and multimetallic magnetic particles were
prepared for controllable and addressable positioning in the microfluidic system. These
particles can be used for signal enhancement in conventional electrochemical applications or

80
as a part of newly developed sensors. To test this application, selective immobilization of the
particles on the glass substrate using poly L histidine surface modification was tested.
Finally, it was demonstrated that the prepared particles can serve well as floating electrodes in
the ECL reaction system.

81
8 References
[1] Palecek, E.; Scheller, F.; Wang, J. Electrochemistry of nucleic acids and proteins; Elsevier: Amsterdam, 2005.
[2] http://www.abbottpointofcare.com/ Accessed 1st September2011
[3] Nguyen, N. T.; Wereley, S. T. Fundamentals and applications of microfluidics, Artech House: Boston, London, 2006
[4] Li, C. Y.; Wu, P. M.; Jung, W.; Ahn, C. H.; Shutter, L. A.; Narayan, R. K. Lab on a Chip 2009, 9, 1988-1990.
[5] Henry, O.Y.; Fragoso, A.; Beni, V.; Laboria, N.; Sanchez, J. L. A.; Latta, D.; Von Germar, F.; Drese, K.; Katakis, I.; O'Sullivan, C.K. Electrophoresis 2009, 30, 3398-3405.
[6] Liao, J. C.; Mastali, M.; Gau, V.; Suchard, M. A.; Moller, A. K.; Bruckner, D. A.; Babbitt, J. T.; Li, Y.; Gornbein, J.; Landaw, E. M.; McCabe, E. R. B.; Churchill, B. M.; Haake, D. A. Journal of Clinical Microbiology 2006, 44, 561-570.
[7] Odijk, M.; Baumann, A.; Lohmann, W.; van den Brink, F. T. G.; Olthuis, W.; Karst, U.; van den Berg, A. Lab on a Chip 2009, 9, 1687-1693.
[8] Das, J.; Kelley S. O.; Analytical Chemistry. 2011, 83, 1167-1172.
[9] Lillehoj, P. B.; Wei, F.; Ho, C. M. Lab on a Chip 2010, 10, 2265-2270.
[10] Berganza, J.; Olabarria, G.; Garcia, R.; Verdoy, D.; Rebollo, A.; Arana, S. Biosensors & Bioelectronics 2007, 22, 2132-2137.
[11] Cheng, A. K. H.; Ge, B.; Yu, H. Z. Analytical Chemistry 2007, 79, 5158-5164.
[12] Swensen, J. S.; Xiao, Y.; Ferguson, B. S.; Lubin, A. A.; Lai, R. Y.; Heeger, A. J.; Plaxco, K. W.; Soh, H. T. Journal of the American Chemical Society 2009, 131, 4262-4266.
[13] Ferapontova, E. E.; Olsen, E. M.; Gothelf, K. V. Journal of the American Chemical Society 2008, 130, 4256-4258.
[14] Rowe, A. A.; Miller, E. A.; Plaxco, K. W. Analytical Chemistry 2010, 82, 7090-7095.
[15] Du, Y.; Chen, Ch.; Zhou, M.; Dong, S.;Wang, E. Analytical Chemistry 2011, 83, 1523-1529
[16] Pyun, J. C.; Kim, S. D.; Chung, J. W. Analytical Biochemistry 2005, 347, 227-233.
[17] Fan, C. H.; Plaxco, K. W.; Heeger, A. J. Proceedings of the National Academy of Sciences of the United States of America 2003, 100, 9134-9137.

82
[18] Wang, Z. Z.; Wilkop, T.; Cheng, Q. Langmuir 2005, 21, 10292-10296.
[19] Lai, R. Y.; Lee, S. H.; Soh, H. T.; Plaxco, K. W.; Heeger, A. J. Langmuir 2006, 22, 1932-1936.
[20] Mir, M.; Dondapati, S. K.; Duarte, M. V.; Chatzichristidi, M.; Misiakos, K.; Petrou, P.; Kakabakos, S. E.; Argitis, P.; Katakis, I. Biosensors & Bioelectronics 2010, 25, 2115-2121.
[21] Mendes, P. M.; Christman, K. L.; Parthasarathy, P.; Schopf, E.; Ouyang, J.; Yang, Y.; Preece, J. A.; Maynard, H. D.; Chen, Y.; Stoddart, J. F. Bioconjugate Chemistry 2007, 18, 1919-1923.
[22] Harper, J. C.; Polsky, R.; Wheeler, D. R.; Lopez, D. M.; Arango, D. C.; Brozik, S. M. Langmuir 2009, 25, 3282-3288.
[23] Ho, C. M.; Wei, F.; Liao, W.; Xu, Z.; Yang, Y.; Wong, D. T. Small 2009, 5, 1784-1790.
[24] Fragoso, A.; Laboria, N.; Kemmner, W.; Latta, D.; Nilsson, O.; Botero, M. L.; Drese, K.; O'Sullivan, C. K. Analytical Chemistry 2010, 82, 1712-1719.
[25] Luo, X. L.; Lewandowski, A. T.; Yi, H. M.; Payne, G. F.; Ghodssi, R.; Bentley, W. E.; Rubloff, G. W. Lab on a Chip 2008, 8, 420-430.
[26] Yan, J.; Pedrosa, V. A.; Simonian, A. L.; Revzin, A. Acs Applied Materials & Interfaces 2010, 2, 748-755.
[27] Zhang, S. X.; Wang, N.; Yu, H. J.; Niu, Y. M.; Sun, C. Q. Bioelectrochemistry 2005, 67, 15-22.
[28] Gilardi, G.; Fantuzzi, A.; Capria, E.; Mak, L. H.; Dodhia, V. R.; Sadeghi, S. J.; Collins, S.; Somers, G.; Hug, E. Analytical Chemistry 2010, 82, 10222-10227.
[29] Fragoso, A.; Latta, D.; Laboria, N.; von Germar, F.; Hansen-Hagge, T. E.; Kemmner, W.; Gartner, C.; Klemm, R.; Drese, K. S.; O'Sullivan, C. K. Lab on a Chip 2011, 11, 625-631.
[30] Liu, C. Y.; Rick, J.; Chou, T. C.; Lee, H. H.; Lee, G. B. Biomedical Microdevices 2009, 11, 201-211.
[31] Nebling, E.; Grunwald, T.; Albers, J.; Schafer, P.; Hintsche, R. Analytical Chemistry 2004, 76, 689-696.
[32] Ferguson, B. S.; Buchsbaum, S. F.; Swensen, J. S.; Hsieh, K.; Lou, X. H.; Soh, H. T. Analytical Chemistry 2009, 81, 6503-6508
[33] Fang, T. H.; Ramalingam, N.; Dong, X. D.; Ngin, T. S.; Zeng, X. T.; Kuan, A. T. L.; Huat, E. Y. P.; Gong, H. Q. Biosensors & Bioelectronics 2009, 24, 2131-2136.
[34] Fuchs, K. Proceedings of the Cambridge Philosophical Society. 1938, 34, 100-108.

83
[35] Sondheimer, E. H. Advances In Physics. 1952, 1, 1-42
[36] Barsan, N.; Koziej, D.; Weimar, U. Sensors and Actuators B-Chemical 2007, 121, 18-35.
[37] Riu, J.; Maroto, A.; Rius, F. X. Talanta 2006, 69, 288-301.
[38] Wohltjen, H.; Snow, A. W. Analytical Chemistry 1998, 70, 2856-2859.
[39] Joseph, Y.; Guse, B.; Yasuda, A.; Vossmeyer, T. Sensors and Actuators B-Chemical 2004, 98, 188-195.
[40] Zhang, Y. M.; Terrill, R. H.; Bohn, P. W. Analytical Chemistry 1999, 71, 119-125.
[41] Fried, G. A.; Zhang, Y. M.; Bohn, P. W. Thin Solid Films 2001, 401, 171-178.
[42] Zhang, Y.; Terrill, R. H.; Bohn, P. W. Journal of the American Chemical Society 1998, 120, 9969-9970.
[43] Venkataramanan, M.; Pradeep, T. Chemical Physics Letters 2000, 327, 299-304.
[44] Michalke, A.; Janshoff, A.; Steinem, C.; Henke, C.; Sieber, M.; Galla, H. J. Analytical Chemistry 1999, 71, 2528-2533.
[45] Venkataramanan, M.; Pradeep, T. Analytical Chemistry 2000, 72, 5852-5856.
[46] Hianik, T.; Gajdos, V.; Krivanek, R.; Oretskaya, T.; Metelev, V.; Volkov, E.; Vadgama, P. Bioelectrochemistry 2001, 53, 199-204.
[47] Xu, D. K.; Xu, D. W.; Yu, X. B.; Liu, Z. H.; He, W.; Ma, Z. Q. Analytical Chemistry 2005, 77, 5107-5113.
[48] Zou, Z. W.; Kai, J. H.; Rust, M. J.; Han, J.; Ahn, C. H. Sensors and Actuators a-Physical 2007, 136, 518-526.
[49] Berdat, D.; Rodriguez, A. C. M.; Herrera, F.; Gijs, M. A. M. Lab on a Chip 2008, 8, 302-308.
[50] Durand, N. F. Y.; Renaud, P. Lab on a Chip 2009, 9, 319-324.
[51] Javanmard, M.; Talasaz, A. H.; Nemat-Gorgani, M.; Pease, F.; Ronaghi, M.; Davis, R. W. Lab on a Chip 2009, 9, 1429-1434.
[52] Peter, M.; Schuler, T.; Furthner, F.; Rensing, P. A.; van Heck, G. T.; Schoo, H. F. M.; Moller, R.; Fritzsche, W.; van Breemen, A. J. J. M.; Meinders, E. R. Langmuir 2009, 25, 5384-5390.
[53] Koryta, J.; Stulik, K. Ion-Selective Electrodes; Cambridge University Press: Cambridge, 2009
[54] Carlen, E. T.; van den Berg, A. Lab on a Chip 2007, 7, 19-23.

84
[55] Chen, R. J.; Choi, H. C.; Bangsaruntip, S.; Yenilmez, E.; Tang, X. W.; Wang, Q.; Chang, Y. L.; Dai, H. J. Journal of the American Chemical Society 2004, 126, 1563-1568.
[56] Tang, X. W.; Bansaruntip, S.; Nakayama, N.; Yenilmez, E.; Chang, Y. L.; Wang, Q. Nano Letters 2006, 6, 1632-1636.
[57] Star, A.; Gabriel, J. C. P.; Bradley, K.; Gruner, G. Nano Letters 2003, 3, 459-463.
[58] An, T.; Kim, K. S.; Hahn, S. K.; Lim, G. Lab on a Chip 2010, 10, 2052-2056.
[59] Kong, J.; Franklin, N. R.; Zhou, C. W.; Chapline, M. G.; Peng, S.; Cho, K. J.; Dai, H. J. Science 2000, 287, 622-625.
[60] Wang, X.; Ozkan, C. S. Nano Letters 2008, 8, 398-404.
[61] Hou, C. S. J.; Godin, M.; Payer, K.; Chakrabarti, R.; Manalis, S. R. Lab on a Chip 2007, 7, 347-354.
[62] Ahn, J. H.; Choi, S. J.; Han, J. W.; Park, T. J.; Lee, S. Y.; Choi, Y. K. Nano Letters 2010, 10, 2934-2938.
[63] Kim, S. K.; Lim, H.; Chung, T. D.; Kim, H. C. Sensors and Actuators B-Chemical 2006, 115, 212-219.
[64] Goda, T.; Miyahara, Y. Analytical Chemistry 2010, 82, 1803-1810.
[65] Wang, L.; Estrela, P.; Huq, E.; Li, P.; Thomas, S.; Ferrigno, P. K.; Paul, D.; Adkin, P.; Migliorato, P. Microelectronic Engineering 2010, 87, 753-755.
[66] Birdi, K. S. Scanning Probe Microscopes: Applications in Science and Technology; CRC Press: Boca Raton, 2003
[67] Marx, K. A. Biomacromolecules 2003, 4, 1099-1120.
[68] Arwin, H. Sensors and Actuators a-Physical 2001, 92, 43-51.
[69] Yoshizawa, T. Handbook of optical metrology: Principles and applications; CRC Press: Boca Raton, 2009
[70] Homola, J. Surface plasmon resonance based sensors; Springer-Verlag: Berlin, Heidelberg, 2006
[71] Horowitz, V. R.; Awschalom, D. D.; Pennathur, S. Lab on a Chip 2008, 8, 1856-1863.
[72] Homola, J. Analytical and Bioanalytical Chemistry 2003, 377, 528-539.
[73] Pattnaik, P. Applied Biochemistry and Biotechnology 2005, 126, 79-92.
[74] Homola, J.; Yee, S. S.; Gauglitz, G. Sensors and Actuators B-Chemical 1999, 54, 3-15.

85
[75] Homola, J.; Sipova, H.; Zhang, S. L.; Dudley, A. M.; Galas, D.; Wang, K. Analytical Chemistry 2010, 82, 10110-10115.
[76] Zubritsky, E. Analytical Chemistry 2000, 72, 289a-292a.
[77] Hoa, X. D.; Kirk, A. G.; Tabrizian, M. Biosensors & Bioelectronics 2007, 23, 151-160.
[78] Amarie, D.; Alileche, A.; Dragnea, B.; Glazier, J. A. Analytical Chemistry 2010, 82, 343-352.
[79] Ferreira, J.; Santos, M. J. L.; Rahman, M. M.; Brolo, A. G.; Gordon, R.; Sinton, D.; Girotto, E. M. Journal of the American Chemical Society 2009, 131, 436-437.
[80] Eftekhari, F.; Escobedo, C.; Ferreira, J.; Duan, X. B.; Girotto, E. M.; Brolo, A. G.; Gordon, R.; Sinton, D. Analytical Chemistry 2009, 81, 4308-4311.
[81] Steiner, G. Analytical and Bioanalytical Chemistry 2004, 379, 328-331.
[82] Natarajan, S.; Hatch, A.; Myszka, D. G.; Gale, B. K. Analytical Chemistry 2008, 80, 8561-8567.
[83] Natarajan, S.; Katsamba, P. S.; Miles, A.; Eckman, J.; Papalia, G. A.; Rich, R. L.; Gale, B. K.; Myszka, D. G. Analytical Biochemistry 2008, 373, 141-146.
[84] Eddings, M. A.; Eckman, J. W.; Arana, C. A.; Papalia, G. A.; Connolly, J. E.; Gale, B. K.; Myszka, D. G. Analytical Biochemistry 2009, 385, 309-313.
[85] Raz, S.R., Liu, H., Norde, W., Bremer, M.G.E.G., Analytical Chemistry 2010, 82, 8485-8491.
[86] Jeon, S.; Kim, U. S.; Jeon, W.; Shin, C. B.; Hong, S.; Choi, I.; Lee, S.; Yi, J. Macromolecular Research 2009, 17, 192-196.
[87] Ouellet, E.; Lausted, C.; Lin, T.; Yang, C. W. T.; Hood, L.; Lagally, E. T. Lab on a Chip 2010, 10, 581-588.
[88] Krishnamoorthy, G.; Carlen, E. T.; Bomer, J. G.; Wijnperle, D.; deBoer, H. L.; van den Berg, A.; Schasfoort, R. B. M. Lab on a Chip 2010, 10, 986-990.
[89] Taylor, J. D.; Linman, M. J.; Wilkop, T.; Cheng, Q. Analytical Chemistry 2009, 81, 1146-1153.
[90] Linman, M. J.; Yu, H.; Chen, X.; Cheng, Q. Acs Applied Materials & Interfaces 2009, 1, 1755-1762.
[91] Phillips, K. S.; Wilkop, T.; Wu, J. J.; Al-Kaysi, R. O.; Cheng, Q. Journal of the American Chemical Society 2006, 128, 9590-9591.
[92] Wang, Z. Z.; Wilkop, T.; Xu, D. K.; Dong, Y.; Ma, G. Y.; Cheng, Q. Analytical and Bioanalytical Chemistry 2007, 389, 819-825.

86
[93] Lee, H. J.; Nedelkov, D.; Corn, R. M. Analytical Chemistry 2006, 78, 6504-6510.
[94] Li, Y.; Lee, H. J.; Corn, R. M. Analytical Chemistry 2007, 79, 1082-1088.
[95] Zordan, M. D.; Grafton, M. M. G.; Acharya, G.; Reece, L. M.; Cooper, C. L.; Aronson, A. I.; Park, K.; Leary, J. F. Cytometry Part A 2009, 75A, 155-162.
[96] Baba, A.; Taranekar, P.; Ponnapati, R. R.; Knoll, W.; Advincula, R. C. Acs Applied Materials & Interfaces 2010, 2, 2347-2354.
[97] Renaudin, A.; Chabot, V.; Grondin, E.; Aimez, V.; Charette, P. G. Lab on a Chip 2010, 10, 111-115.
[98] Oh, J.; Chang, Y. W.; Kim, H. J.; Yoo, S.; Kim, D. J.; Im, S.; Park, Y. J.; Kim, D.; Yoo, K. H. Nano Letters 2010, 10, 2755-2760..
[99] Malic, L.; Veres, T.; Tabrizian, M. Lab on a Chip 2009, 9, 473-475.
[100] Porter, M. D.; Lipert, R. J.; Siperko, L. M.; Wang, G.; Narayanana, R. Chemical Society Reviews 2008, 37, 1001-1011.
[101] Kneipp, J.; Kneipp, H.; Kneipp, K. Chemical Society Reviews 2008, 37, 1052-1060.
[102] Hudson, S. D.; Chumanov, G. Analytical and Bioanalytical Chemistry 2009, 394, 679-686.
[103] Vo-Dinh, T.; Allain, L. R.; Stokes, D. L. Journal of Raman Spectroscopy 2002, 33, 511-516.
[104] Nie, S. M.; Emery, S. R. Science 1997, 275, 1102-1106.
[105] Bell, S. E. J.; Sirimuthu, N. M. S. Journal of the American Chemical Society 2006, 128, 15580-15581.
[106] Han, X. X.; Jia, H. Y.; Wang, Y. F.; Lu, Z. C.; Wang, C. X.; Xu, W. Q.; Zhao, B.; Ozaki, Y. Analytical Chemistry 2008, 80, 2799-2804.
[107] Sha, M. Y.; Xu, H. X.; Natan, M. J.; Cromer, R. Journal of the American Chemical Society 2008, 130, 17214-17215.
[108] Daniels, J. K.; Caldwell, T. P.; Christensen, K. A.; Chumanov, G. Analytical Chemistry 2006, 78, 1724-1729.
[109] Grubisha, D. S.; Lipert, R. J.; Park, H. Y.; Driskell, J.; Porter, M. D. Analytical Chemistry 2003, 75, 5936-5943.
[110] Hering, K.; Cialla, D.; Ackermann, K.; Dorfer, T.; Moller, R.; Schneidewind, H.; Mattheis, R.; Fritzsche, W.; Rosch, P.; Popp, J. Analytical and Bioanalytical Chemistry 2008, 390, 113-124.

87
[111] Shanmukh, S.; Jones, L.; Driskell, J.; Zhao, Y. P.; Dluhy, R.; Tripp, R. A. Nano Letters 2006, 6, 2630-2636.
[112] Kao, P.; Malvadkar, N. A.; Cetinkaya, M.; Wang, H.; Allara, D. L.; Demirel, M. C. Advanced Materials 2008, 20, 3562-3565.
[113] Yu, Q. M.; Golden, G. Langmuir 2007, 23, 8659-8662.
[114] Cho, H. S.; Lee, B.; Liu, G. L.; Agarwal, A.; Lee, L. P. Lab on a Chip 2009, 9, 3360-3363.
[115] Huh, Y. S.; Chung, A. J.; Cordovez, B.; Erickson, D. Lab on a Chip 2009, 9, 433-439.
[116] Gascoyne, P. R. C.; Vykoukal, J. Electrophoresis 2002, 23, 1973-1983.
[117] Fiedler, S.; Shirley, S. G.; Schnelle, T.; Fuhr, G. Analytical Chemistry 1998, 70, 1909-1915.
[118] Morgan, H.; Hughes, M. P.; Green, N. G. Biophysical Journal 1999, 77, 516-525.
[119] Choi, S.; Park, J. K. Lab on a Chip 2005, 5, 1161-1167.
[120] Demierre, N.; Braschler, T.; Muller, R.; Renaud, P. Sensors and Actuators B-Chemical 2008, 132, 388-396.
[121] Wang, L.; Flanagan, L. A.; Jeon, N. L.; Monuki, E.; Lee, A. P. Lab on a Chip 2007, 7, 1114-1120.
[122] Hu, X. Y.; Bessette, P. H.; Qian, J. R.; Meinhart, C. D.; Daugherty, P. S.; Soh, H. T. Proceedings of the National Academy of Sciences of the United States of America 2005, 102, 15757-15761.
[123] Bocchi, M.; Lombardini, M.; Faenza, A.; Rambelli, L.; Giulianelli, L.; Pecorari, N.; Guerrieri, R. Biosensors & Bioelectronics 2009, 24, 1177-1183.
[124] Asbury, C. L.; Diercks, A. H.; van den Engh, G. Electrophoresis 2002, 23, 2658-2666.
[125] Zhou, R. H.; Wang, P.; Chang, H. C. Electrophoresis 2006, 27, 1376-1385.
[126] Yang, M.; Zhang, X. Sensors and Actuators a-Physical 2007, 135, 73-79.
[127] Jung, H. I.; Moon, H. S.; Kwon, K.; Kim, S. I.; Han, H.; Sohn, J.; Lee, S. Lab on a Chip 2011, 11, 1118-1125.
[128 ] Qiao W.; Chob, G.; Lo Y. Lab on a Chip 2011, 11, 1074-1080.
[129] Quilliet, C.; Berge, B. Current Opinion in Colloid & Interface Science 2001, 6, 34-39.
[130] Pollack, M. G.; Shenderov, A. D.; Fair, R. B. Lab on a Chip 2002, 2, 96-101.

88
[131] Miller, E. M.; Wheeler, A. R. Analytical and Bioanalytical Chemistry 2009, 393, 419-426.
[132] Abdelgawad, M.; Watson, M. W. L.; Wheeler, A. R. Lab on a Chip 2009, 9, 1046-1051.
[133] Watson, M. W. L.; Jebrail, M. J.; Wheeler, A. R. Analytical Chemistry 2010, 82, 6680-6686.
[134] Moon, H.; Wijethunga, P. A. L.; Nanayakkara, Y. S.; Kunchala, P.; Armstrong, D. W. Analytical Chemistry 2011, 83, 1658-1664.
[135] Jebrail, M. J.; Wheeler, A. R. Analytical Chemistry 2009, 81, 330-335.
[136] Miller, E. M.; Wheeler, A. R. Analytical Chemistry 2008, 80, 1614-1619.
[137] Luk, V. N.; Wheeler, A. R. Analytical Chemistry 2009, 81, 4524-4530.
[138] Chatterjee, D.; Ytterberg, A. J.; Son, S. U.; Loo, J. A.; Garrell, R. L. Analytical Chemistry 2010, 82, 2095-2101.
[139] Sista, R.; Hua, Z. S.; Thwar, P.; Sudarsan, A.; Srinivasan, V.; Eckhardt, A.; Pollack, M.; Pamula, V. Lab on a Chip 2008, 8, 2091-2104.
140] Martin, J. G.; Gupta, M.; Xu, Y. M.; Akella, S.; Liu, J.; Dordick, J. S.; Linhardt, R. J. Journal of the American Chemical Society 2009, 131, 11041-11048.
[141] Wixforth, A.; Strobl, C.; Gauer, C.; Toegl, A.; Scriba, J.; von Guttenberg, Z. Analytical and Bioanalytical Chemistry 2004, 379, 982-991.
[142] Lange, K.; Rapp, B. E.; Rapp, M. Analytical and Bioanalytical Chemistry 2008, 391, 1509-1519.
[143] Wilson, R.; Reboud, J.; Bourquin, Y.; Neale, S. L.; Zhang, Y.; Cooper, J. M. Lab on a Chip 2011, 11, 323-328.
[144] Franke, T.; Abate, A. R.; Weitz, D. A.; Wixforth, A. Lab on a Chip 2009, 9, 2625-2627.
[145] Li, H.; Friend, J. R.; Yeo, L. Y. Biomedical Microdevices 2007, 9, 647-656.
[146] Qi, A. S.; Friend, J. R.; Yeo, L. Y.; Morton, D. A. V.; McIntosh, M. P.; Spiccia, L. Lab on a Chip 2009, 9, 2184-2193.
[147] Shi, J. J.; Mao, X. L.; Ahmed, D.; Colletti, A.; Huang, T. J. Lab on a Chip 2008, 8, 221-223.
[148] Shi, J. J.; Ahmed, D.; Mao, X.; Lin, S. C. S.; Lawit, A.; Huang, T. J. Lab on a Chip 2009, 9, 2890-2895.
[149] Schubert, D. W.; Dunkel, T. Materials Research Innovations 2003, 7, 314-321.
[150] http://www.himt.de/factsheets/muepg101.pdf, Accessed 1st September 2011

89
[151] Madou, M. J. Fundamentals of microfabrication; CRC press: Boca Raton, 1997.
[152] Kelly, P. J.; Arnell, R. D. Vacuum 2000, 56, 159-172.
[153] O'Sullivan, C. K.; Guilbault, G. G. Biosensors & Bioelectronics 1999, 14, 663-670.
[154] Deepa, P. N.; Kanungo, M.; Claycomb, G.; Sherwood, P. M. A.; Collinson, M. M. Anal Chem 2003, 75, 5399-5405
[155] Comini, E. Anal Chim Acta 2006, 568, 28-40
[156] James, D.; Scott, S. M.; Ali, Z., O'Hare, W. T. Microchim Acta 2005, 149, 1-17
[157] Ceglarek, U.; Leichtle, A.; Brugel, M.; Kortz, L.; Brauer, R.; Bresler, K.; Thiery, J.; Fiedler, G. M. Molecular and Cellular Endocrinology 2009, 301, 266-271.
[158] Kolch, W.; Neususs, C.; Peizing, M.; Mischak, H. Mass Spectrometry Reviews 2005, 24, 959-977.
[159] Liepold, P.; Wieder, H.; Hillebrandt, H.; Friebel, A.; Hartwich, G. Bioelectrochem 2005, 67, 143-150.
[160] Chen, H.; Jiang, C. M.; Yu, C.; Zhang, S.; Liu, B. H.; Kong, J. L. Biosensors & Bioelectronics 2009, 24, 3399-3411.
[161] Huang, X. J.; O'Mahony, A. M.; Compton, R. G. Small 2009, 5, 776-788.
[162] Palecek, E.; Ostatna, V. Electroanalysis 2007, 19, 2383-2403.
[163] Palecek, E.; Ostatna, V. Chemical Communications 2009, 1685-1687.
[164] Palecek, E.; Ostatna, V.; Cernocka, H.; Joerger, A. C.; Fersht, A. R. Journal of the American Chemical Society 2011, 133, 7190-7196.
[165] Palecek, E.; Ostatna, V.; Cernocka, H. Journal of the American Chemical Society 2010, 132, 9408-9413.
[166] Uhlig, A.; Paeschke, M.; Schnakenberg, U.; Hintsche, R.; Diederich, H. J.; Scholz, F. Sensors and Actuators B-Chemical 1995, 25, 899-903.
[167] Lowinsohn, D.; Peres, H. E. M.; Kosminsky, L.; Paixao, T. R. L. C.; Ferreira, T. L.; Ramirez-Fernandez, F. J.; Bertotti, M. Sensors and Actuators B-Chemical 2006, 113, 80-87.
[168] Batz, N. G.; Martin, R. S. Analyst 2009, 134, 372-379.
[169] Xu, K. M.; Si, J. Y. Chinese Journal of Analytical Chemistry 2007, 35, 1147-1150.
[170] El Khakani, M. A.; Silva, P. R. M.; Le Drogoff, B.; Chaker, M.; Vijh, A. K. Sensors and Actuators B-Chemical 1999, 60, 161-167.

90
[171] Hudson, D. R. J. Phys. Chem. 1945, 49, 483– 506
[172] Beck, M.; Ling, T. G. I.; Bunk, R.; Forsen, E.; Tegenfeldt, J. O.; Zakharov, A. A.; Montelius, L. Microelectronic Engineering 2003, 67-8, 887-892.
[173] Heyrovsky, M. Electroanalysis 2004, 16, 1067– 1073
[174] Palecek, E.; Dorcak, V. Analytical Chemistry 2009, 81, 1543-1548.
[175] Palecek, E.; Ostatna, V. Electrochimica Acta 2008, 53, 4014-4021.
[176] Palecek, E.; Ostatna, V.; Uslu, B.; Dogan, B.; Ozkan, S. Journal of Electroanalytical Chemistry 2006, 593, 172-178.
[177] Palecek, E.; Ostatna, V.; Kuralay, F.; Trnkova, L. Electroanalysis 2008, 20, 1406-1413.
[178] Pavoni, S.; Sundermeier, C.; Perdomo, J.; HinkerS, H. Measurement 2007, 40, 708-716
[179] Lee, G. B.; Liu, C. Y.; Rick, J.; Chou, T. C.; Lee, H. H. Biomedical Microdevices 2009, 11, 201-211.
[180] Honeychurch, M. J. Bioelectrochem. Bioenerg. 1997, 44, 13–21.
[181] Scheller, F.; Janchen, M.; Prumke, H.-J. Biopolymers 1975, 14, 1553–1563.
[182] Santhanam, K. S. V.; Jespersen, N.; Bard, A. J. Journal of the American Chemical Society1977, 99, 274–276.
[183] Penn, S. G.; He, L.; Natan, M. J. Current Opinion in Chemical Biology 2003, 7, 609-615.
[184] Eniola-Adefeso, O.; Heslinga, M. J.; Mastria, E. M. Journal of Controlled Release 2009, 138, 235-242.
[185] Kumar, M. N. V. R.; Bakowsky, U.; Lehr, C. M. Biomaterials 2004, 25, 1771-1777.
[186] Seong, G. H.; Jeong, W. J.; Kim, J. Y.; Choo, J.; Lee, E. K.; Han, C. S.; Beebe, D. J.; Lee, S. H. Langmuir 2005, 21, 3738-3741.
[187] Zguris, J. C.; Itle, L. J.; Koh, W. G.; Pishko, M. V. Langmuir 2005, 21, 4168-4174.
[188] Lin, Y. C.; Yang, C. H.; Huang, K. S.; Lin, P. W. Sensors and Actuators B-Chemical 2007, 124, 510-516.
[189] Whitesides, G. M.; Siegel, A. C.; Bruzewicz, D. A.; Weibel, D. B. Advanced Materials 2007, 19, 727-733.
[190] Kumacheva, E.; Xu, S. Q.; Nie, Z. H.; Seo, M.; Lewis, P.; Stone, H. A.; Garstecki, P.; Weibel, D. B.; Gitlin, I.; Whitesides, G. M. Angewandte Chemie-International Edition 2005, 44, 724-728.

91
[191] Doyle, P. S.; Bong, K. W.; Pregibon, D. C. Lab on a Chip 2009, 9, 863-866.
[192] Kwon, S.; Lee, S. A.; Chung, S. E.; Park, W.; Lee, S. H. Lab on a Chip 2009, 9, 1670-1675.
[193] Doyle, P. S.; Bong, K. W.; Chapin, S. C. Langmuir 2010, 26, 8008-8014.
[194] Randall, C. L.; Leong, T. G.; Bassik, N.; Gracias, D. H. Advanced Drug Delivery Reviews 2007, 59, 1547-1561.
[195] Makarova, O. V.; Mancini, D. C.; Moldovan, N.; Divan, R.; Tang, C. M.; Ryding, D. G.; Lee, R. H. Sensors and Actuators a-Physical 2003, 103, 182-186.
[196] Whitesides, G. M.; Xu, Q. B.; Tonks, I.; Fuerstman, M. J.; Love, J. C. Nano Letters 2004, 4, 2509-2511.
[197] Whitesides, G. M.; Love, J. C.; Gates, B. D.; Wolfe, D. B.; Paul, K. E. Nano Letters 2002, 2, 891-894.
[198] Moore, D. F.; Hoole, A. C. F.; Heaver, A. Microelectronic Engineering 1993, 21, 459-462.
[199] Ohji, H.; Trimp, P. J.; French, P. J. Sensors and Actuators a-Physical 1999, 73, 95-100.
[200] Whitesides, G. M.; Yang, H.; Deschatelets, P.; Brittain, S. T. Advanced Materials 2001, 13, 54-58.
[201] Whitesides, G. M.; Brittain, S. T.; Schueller, O. J. A.; Wu, H. K.; Whitesides, S. Journal of Physical Chemistry B 2001, 105, 347-350.
[202] Whitesides, G. M.; Wu, H.; Brittain, S.; Anderson, J.; Grzybowski, B.; Whitesides, S.
Journal of the American Chemical Society 2000, 122, 12691-12699.
[203] Boncheva, M.; Andreev, S. A.; Mahadevan, L.; Winkleman, A.; Reichman, D. R.; Prentiss, M. G.; Whitesides, S.; Whitesides, G. M. Proceedings of the National Academy of Sciences of the United States of America 2005, 102, 3924-3929.
[204] Lee, L. J.; Guan, J. J.; He, H. Y.; Hansford, D. J. Journal of Physical Chemistry B 2005, 109, 23134-23137.
[205] Gracias, D. H.; Randall, C. L.; Leong, T. G.; Bassik, N. Advanced Drug Delivery Reviews 2007, 59, 1547-1561.
[206] Safarik, I.; Safarikova, M. Journal of Chromatography B 1999, 722, 33-53.
[207] Ma, Z. Y.; Liu, H. Z. China Particuology 2007, 5, 1-10.
[208] Tartaj, P.; Morales, M. P.; Gonzalez-Carreno, T.; Veintemillas-Verdaguer, S.; Serna, C. J. Journal of Magnetism and Magnetic Materials 2005, 290, 28-34.

92
[209] Ito, A.; Shinkai, M.; Honda, H.; Kobayashi, T. Journal of Bioscience and Bioengineering 2005, 100, 1-11.
[210] Sun, C.; Lee, J. S. H.; Zhang, M. Q. Advanced Drug Delivery Reviews 2008, 60, 1252-1265.
[211] El Haj, A. J.; Hughes, S.; Dobson, J. Journal of Biomechanics 2007, 40, S96-S104
[212] Janknecht, R.; Demartynoff, G.; Lou, J.; Hipskind, R. A.; Nordheim, A.; Stunnenberg, H. G. Proceedings of the National Academy of Sciences of the United States of America 1991, 88, 8972-8976.
[213] Paborsky, L. R.; Dunn, K. E.; Gibbs, C. S.; Dougherty, J. P. Analytical Biochemistry 1996, 234, 60-65.
[214] Mulchandani, A.; Stiborova, H.; Kostal, J.; Chen, W. Biotechnology and Bioengineering 2003, 82, 605-611.
[215] Mattiasson, B.; Kumar, A.; Wahlund, P. O.; Kepka, C.; Galaev, I. Y. Biotechnology and Bioengineering 2003, 84, 494-503.
[216] Corn, R. M.; Wegner, G. J.; Lee, N. J.; Marriott, G. Analytical Chemistry 2003, 75, 4740-4746.
[217] Iwata, H.; Kato, K.; Sato, H. Langmuir 2005, 21, 7071-7075.
[218] Wang, E. K.; Fang, L. Y.; Lu, Z. Z.; Wei, H. Biosensors & Bioelectronics 2008, 23, 1645-1651.
[219] Zhu, J. J.; Jie, G. F.; Liu, B.; Pan, H. C.; Chen, H. Y. Analytical Chemistry 2007, 79, 5574-5581.
[220] Xing, D.; Yan, G. H.; Tan, S. C.; Chen, Q. Journal of Immunological Methods 2004, 288, 47-54.
[221] Landers, J. P.; Cao, W. D.; Ferrance, J. P.; Demas, J. Journal of the American Chemical Society 2006, 128, 7572-7578.
[222] Xu, G. B.; Hu, L. Z. Chemical Society Reviews 2010, 39, 3275-3304.
[223] Richter, M. M. Chemical Reviews 2004, 104, 3003-3036.
[224] Crooks, R. M.; Mavre, F.; Anand, R. K.; Laws, D. R.; Chow, K. F.; Chang, B. Y.; Crooks, J. A. Analytical Chemistry 2010, 82, 8766-8774.
[225] Arora, A.; Eijkel, J. C. T.; Morf, W. E.; Manz, A. Analytical Chemistry 2001, 73, 3282-3288.
[226 ] Zhan, W.; Alvarez, J.; Crooks, R. M. Journal of the American Chemical Society 2002, 124, 13,265-13,270.

93
[227] Chow, K. F.; Mavre´ , F.; Crooks, R. M. Journal of the American Chemical Society 2008, 130, 7544-7545.
[228] Lin, Z. Y.; Xue, L. L.; Guo, L. H.; Qiu, B.; Chen, G. N. Electrochemistry
Communications 2009, 11, 1579-1582.
[229] Fojta, M.; Kostecka, P.; Trefulka, M. R.; Havran, L.; Palecek, E. Analytical Chemistry 2007, 79, 1022-1029.
[230] Palecek, E.; Trefulka, M.; Fojta, M. Electrochemistry Communications 2009, 11, 359-362.

94
Curriculum vitae
PERSONAL DATA Petra Jusková, born June 9, 1983 Nationality: Slovak EDUCATION 2001-2006 Magister`s degree study at Comenius University in Bratislava, Faculty of Natural Science, Department of Analytical Chemistry. Thesis title: Testing of chemometric deconvolution algorithms for overlapped peak profiles in diode-array detection 2006- PhD. Study at Masaryk University in Brno, Faculty of Science, Department of Analytical Chemistry. WORK EXPERIENCE 2006- Institute of Analytical Chemistry, Academy of Sciences of the Czech Republic in Brno. Department of Bioanalytical Instrumentation. Research area: basic techniques for fabrication of the microscale analytical instrumentation, development of applications for bioanalysis. STUDY STAYS: 2011 -Laboratory of Prof. Manz at Korea Institute of Science and Technology Europe Forschungsgesellschaft mbH, Germany (3 months)

95
List of papers
Fabrication and characterization of solid mercury amalgam electrodes for protein analysis,
Jusková, P; Ostatná, V; Paleček, E; Foret, F., Analytical Chemistry, 2010, 82 (7), pp 2690–
2695
Application of thin metal film elements in bioanalysis, Jusková, P; Foret, F. Journal of
Separation Science, 2011, DOI 10.1002/jssc.201100288

96
Presentations at congresses
Oral presentations Fabrication and characterization of micro solid amalgam electrodes (µSAE) for
bioanalytical applications. Jusková, P; Ostatná, V; Paleček, E; Foret, F., CECE 2009, 6th
International Interdisciplinary Meeting on Bioanalysis, Pécs 2009
Lithographically defined metal surfaces for bioanalytical applications. Jusková, P; Ostatná,
V; Paleček, E; Foret, F., ISC 2010, International Symposium on Chromatography, Valencia
2010
Poster presentations Thin film resistance sensor for detection in microfluidics. Jusková, P; Grym, J; Foret, F.,
Electrochemistry of Nucleic Acids and Proteins, Brno 2008
Micro solid amalgam electrodes (SAE) array, fabrication and characterization. Jusková, P;
Ostatná, V; Paleček, E; Foret, F., CECE 2008, 5th International Interdisciplinary Meeting on
Bioanalysis, Brno 2008
Micro solid amalgam electrodes (SAE) array for biomolecule detection. Jusková, P; Ostatná,
V; Paleček, E; Foret, F., MSB 2009. International Symposium on Microscale Bioseparations,
Boston 2009
Lithographically defined metal surfaces; modifications and applications. Jusková, P; Ostatná,
V; Paleček, E; Foret, F. Biological Surfaces and Interfaces, ESF-EMBO Symposium.
Sant Feliu de Guixols, 2009
Fabrication of free-standing metallic microstructures; modifications and applications.
Jusková, P; Foret, F., MSB 2010. International Symposium on Microscale BioSeparations,
Praha 2010