
PhD Thesis - accedaCRIS
256
PhD Thesis [ffeet of feeding gilthcad scabrcam (Sparus aurata) with dirrcrcnt Icvcls uf n-3 and n-6 lipids from vcgctablc oils on fish hcalth and resistancc to stress
-
Upload
khangminh22 -
Category
Documents
-
view
3 -
download
0
Transcript of PhD Thesis - accedaCRIS

PhD Thesis
[ffeet of feeding gilthcad scabrcam
(Sparus aurata) with dirrcrcnt Icvcls uf n-3
and n-6 lipids from vcgctablc oils on fish hcalth
and resistancc to stress

n jセAQ@
Anexo I
Da BEGOÑA ACOSTA HERNÁNDEZ, SECRETARIA DEL INSTITUTO UNIVERSITARIO DE SANIDAD ANIMAL Y SEGURIDAD ALIMENTARIA DE LA UNIVERSIDAD DE LAS PALMAS DE GRAN CANARIA,
CERTIFICA,
Que el Consejo de Doctores del Departamento en su sesión de
fecha 26 de noviembre de 2009 tomó el acuerdo de dar el
consentimiento para su tramitación , a la tesis doctoral titulada "Effect of feeding gilthead seabream (Sparus aurata) with different
levels of n-3 and n-6 lipids from vegetable oils on fish health and
resistance to stress", presentada por el doctorando D Rachid Ganga y dirigida por la Doctora Da Marisol Izquierdo López y el Doctor D.
Gordon Bell .
y para que así conste, y a efectos de lo previsto en el ArtO 73.2 del
Reglamento de Estudios de Doctorado de esta Universidad, firmo la
presente en Las Palmas de Gran Canaria, a veintiseis de noviembre de dos mil nueve.
Anexo 11
UNIVERSIDAD DE LAS PALMAS DE GRAN CANARIA
Departamento: Instituto Universitario de Sanidad Animal y Seguridad Alimentaria
Programa de Doctorado: Acuicultura
Título de la Tesis
"Effect of feeding gilthead seabream (Sparus a ura ta ) with different levels of n-3 and n-6 lipids from vegetable oils on fish health and resistance to stress",
Tesis Doctoral presentada por O Rachid Ganga
Dirigida por la Ooctora oa Marisol Izquierdo López y el Ooctor O. Gordon Bell.
El/la Ooctorando/a,
de Gran Canaria , a 26 de noviembre de 2009

Effect of feeding gilthead seabream (Sparus aurata) with different levels of
n-3 and n-6 lipids from vegetable oils on fish health and resistance to stress
Rachid Ganga
Grupo de Investigación en Acuicultura,
Instituto Canario de Ciencias Marinas
Universidad de Las Palmas de Gran Canaria (IUSA)
Being a thesis submitted for the degree of
Doctor of Phylosophy
In the University of Las Palmas de Gran Canaria, 2009
Directors:
Prof. Marisol Izquierdo López & Prof. Gordon Bell

“ En el nombre de Alá, el Compasivo, el Misericordioso, Él es
Quien ha sujetado el mar para que comáis de él carne fresca y
obtengáis de él adornos que poneros. Y ves que las naves lo
surcan. Para que busquéis Su favor. Quizás, así, seáis
agradecidos”
16 - Las abejas (Al nahl), verso 14. Revelado antes de Higrah
(Sagrado CORAN)

CONTENTS
List of tables
List of figures
List of abbreviations
Acknowledgments
1. General Introduction 1
1- Lipids as a constituent of fish diets………………………………………………1
1.1- Lipids and fatty acids……………………………………….....………….…1
1.2- Lipids functions in fish..…..……………………………………………...…2
1.3- Lipids sources in aquafeeds………………………………………..……….5
1.4- Vegetable oils and fish health………………………………….…………...8
1.5- Lipid nutrition and fish resistance to stress…….………………………..11
2- Stress in Fish….……………………………………….................……………...12
2.1- Stress responses…………………………………………......……….……..12
2.2- Head kidney as a key organ in stress response…………………………...15
2.3- Cortisol: as a stress hormone indicator in fish……………………......….17
2.4- Corticosteroids biosynthesis by interrenal cells…...………….……….....19
2.5- Cortisol roles in fish…………………………………………………..……20
3- Gilthead Seabream as a model species for this thesis.….…………………….20
4- Objectives……..…………………………………………………………………22
2. General materials and methods 39
2.1. Experimental conditions………..………….……………………………….…39
2.2. Studied species…………………… …......……………………………………41
2.3 - Trial I: part of RAFOA Project....…………………………...……...……….42
2.3.1- Animals and diets……………………………………...…………………42
2.3.2- Sampling procedure……………………………………...……………....45
2.3.3- Lipids extraction and analysis……………………………..……………45
2.3.4. Extraction, separation and enzyme immunoassay of PGE isomers..…46
2.3.5. Leptin immunoassay……………………………………………………..49
2.4. Trial II: Part of LINOSALUD project..……………………………………..51

2.4.1. Animals and Diets……………………......………………………….…...51
2.4.2. Sampling procedure……………………………………………………...54
2.4.3. Preparation and stimulation of head kidney tissue…………………….54
2.4.4. Stress Panels……………………………………………………………....55
2.4.5. Biochemical analysis…………………………………………………..….56
2.4.6. Cortisol measurements…………………………………………………...56
2.5. Statistical analysis…….……………………………..………………..…….57
3. Effect of feeding seabream (Sparus aurata) with a blend of soybean and linseed
oil on growth, feed utilization and body fatty acids composition…………………..59
4. Stress response in seabream (Sparus aurata) held under crowded conditions and
fed diets with different levels of inclusion of linseed and/or soybean oil…………..91
5. Effect of dietary lipids on plasma fatty acid profiles and prostaglandina and
leptin production in gilthead seabream (Sparus aurata)…………………………..119
6. Modulation of ACTH-induced cortisol release by polyunsaturated fatty acids in
interrenal cells from gilthead seabream, Sparus aurata…………………………...129
7. ACTH-stimulated cortisol-release by the head-kidney-interrenal tissue from
seabream (Sparus aurata) fed with linseed and soybean oil………………………137
8. General conclusions…………………………………………………………....….163
9. Summary………………………………………………….………………….……165
Resumen…………………………………………………………………………...167
Arabic summary…………………………………………………………………..171
10. Resumen ampliado…………….…..……...……………………………………..173
List of Publication……………………………………………………………………227
Curriculum vitae ……………………………………………………………………..229

List of Tables
Table 2.1: The types and % of oils in the experimental diets experiment
I………………………………………………………………………………………....43
Table 2.2: Main fatty acids of the different experimental diets (g/100 g fatty acid)
(5mm) ………………………………………………………………………………….44
Table 2.3: Main ingredients contents of the experimental diets (in %) experiment II....51
Table 2.4: Vitamins and minerals contents of the experimental diets………………….52
Table 2.5: The types and % of oils in the experimental diets…………………………..52
Table 2.6: Fatty acids profile of the experimental diets………………………………..53
Table 3.1: Main ingredients contents of the experimental diets………………………..63
Table 3.2: Proximate composition (% dry weight) of experimental diets and proportions
ferent lipid sources (% of oil inclusion) contained in the experimental diets...63 of the difTable 3.3: Fatty acid compositions of the experimental diets (g/100 g total fatty
acids)……………………………………………………………………………………64
Table 3.4: Growth and efficiency in utilization of feed by gilthead seabream fed the
experimental diets……......……………………………………………………………..69 Table 3.5: Fatty acid profile of muscle from gilthead sea bream fed the experimental diets…………………………………………………………………………………………...70
Table 3.6: Fatty acid profile of liver from gilthead sea bream fed the experimental
diets……………………………………………………………………………………..71
Table 3.7: Fatty acid profile of gills from gilthead sea bream fed the experimental
diets……………………………………………………………………………………..72
Table 4.1: Main ingredients of the experimental diets used……...……………………95
Table 4.2: Fatty acid composition of the experimental diets (g fatty acid/ 100g of total
fatty acids)…………………………………………………………………………......98
Table 4.3: Effect of feeding vegetable oils on HK fatty acids profile (g fatty acid/100g
total fatty acids)……………………………………………………………………….99
Table 4.4: Cortisol in plasma of fish from the crowding trial (ng/ml of plasma)……100
Table 4.5: Correlation coefficients between cortisol levels and different head kidney
fatty acids ……………………………………………………………………………102

Table 5.1: Fatty acid compositions of the 5 mm experimental diets…………………121
Table 5.2: Plasma polar lipid fatty acid compositions……………………………......122
Table 5.3: Plasma neutral lipid fatty acid compositions……………………………...123
Table 5.4: The ratio between fatty acid percent in plasma lipid classes and dietary
percentof the same fatty acid (% Fatty acid in plasma/%fatty acid in diet)…………..123
Table 5.5: Concentration of PGE2 and PGE3 in plasma from seabream fed experimental
diets……………………………………………………………………………………123
Table 6.1: Effect of two fatty acid concentrations (50 and 150 mM) and two incubation
times (1 h and 3 h) for three polyunsaturated fatty acids on cortisol secretion stimulation
factor……………………………………………………………………………….….130

List of Figures
Figure 1.1: The evolution and expectation of Fish Oil uses and needs from 1995 to
2015………...……………………………………………………………………………6
Figure 1.2: Evolution of different plants oils production…………………………….….7
Figure 1.3: A simplified representation of the central and peripheral components of the
stress response in fish….……………………………………………………………….15
Figure 1.4: Cross sections of paraffin embedded head kidney tissue of teleosts fish….16
Figure 1.5: A mechanistic model of ACTH-stimulated cortisol secretion in mammals.18
Figure 1.6: Representation of the steroidogenic pathways in teleost fish and the
important role of P450c17 in the formation of glucocorticoids and
androgens/oestrogens…………………………………………………………………..19
Figure 1.7: Gilthead seabream global production evolution in Europe during the last
decade…………………………………………………………………………………..21
Figure 2.1: A 1000 l acclimatization tank………………………………………….......40
Figure 2.2: A sample of the intensive 500l rearing tank……………………………….40
Figure 2.3: Adult gilthead seabream…………………………………………………...41
Figure 2.4: Geographical distribution of gilthead seabream………………………...…41
Figure 2.5: A sample of cage used for stress panel tests……………………………….56
Figure 3.1: Effect of different dietary oils on gilthead seabream body
weight…………………………………………………………………………………..66
Figure 3.2: Relationship between dietary fatty acid concentrations and liver fatty acid
concentrations of 18:2n-6, 18:3n-3, 20:5n-3 and 22:6n-3 in total lipids of gilthead
seabream fed either 100% FO, 70L, 100L, 70S, 100S or 50S50L……………………..73
Figure 4.1: Relationship between dietary fatty acid concentrations and head kidney fatty
acid concentrations of 18: 2n-6, 18:3n-3, 20:5n-3 and 22:6n-3 in total lipids gilthead
seabream fed either 100% FO, 70LO, 100LO, 70S, 100S 20LO50SO, 50LO20SO or
50S50L………………………………………………………………………………..100
Figure 4.2: Plasma cortisol evolution during the crowding period (pg/ml)…….…….101
Figure 5.1: Proportion (g/100 g total fatty acids) of blood leukocytes EPA, ARA and
EPA/ARA………………………………………………………………….………….123

Figure 5.2: Plasma concentration of PGE3 (pg/mL) from seabream fed the experimental
diets……………………………………………………………..…….……………....124 Figure 5.3: The relationship between PGE3 (pg/ml) and EPA (percent in polar lipids)
concentration in plasma from seabream fed the experimental diets…………………..124
Figure 5.4: Leptin concentration in plasma from seabream fed the four experimental
diets. ………………………………………………………..………….……..….…....124
Figure 5.5: Relation between plasma leptin and PGE2 in seabream fed the four
experimental diets with pink dots r2=0.8…………………………………………..…124
Figure 6.1: Absolute cortisol secretion (ng/g Hk/h) by sea bream head kidney (Hk) after
ACTH stimulation following incubation with…………………………………….…..131
Figure 6.2: Cortisol stimulation factor in sea bream head kidney alter ACTH stimulation
following incubation with different HUFA……………………...................................132
Figure 6.3: Absolute cortisol secretion (ng/g Hk/h) by sea bream head kidney (Hk) after
ACTH stimulation following incubation with different HUFA and INDO
supplementation……………………………………………………………………….132
Figure 6.4: Cortisol stimulation factor in sea bream head kidney alter ACTH stimulation
following incubation with different HUFA and INDO supplementation (different letters
for indicate significant differences among treatment)……………..................……….133
Figure 6.5: Comparison of cortisol stimulation factor in sea bream head kidney after
ACTH stimulation following incubation with different HUFA and including or not
(dotted bars) INDO supplementation…………………………………………………133
Figure 7.1: Effect of feeding vegetable oils on HK fatty acids profile (g fatty acid/100g
total fatty acids)………………………………………………………………………..144
Figure 7.2: Effect of Feeding LO and SO on HK cortisol release after ACTH
challenge………………………………………………………………………………145
Figure 7.3: Cortisol stimulation factor from fish fed different vegetable oils, after
challenging HK with ACTH…………………………………………………………...145
Figure 7.4: Effect of incubating head kidney tissue with INDO or NDGA on cortisol
release in control fish (FO)…………………………………………………………….146
Figure 7.5: Effect of incubating head kidney tissue with INDO or NDGA on cortisol
release in 70LO fed fish……………………………………………………………….147

Figure 7.6: Effect of incubating head kidney tissue with INDO or NDGA on cortisol
release in 100 LO fed fish……………………………………………………………..147
Figure 7.7: Effect of incubating head kidney tissue with INDO or NDGA on cortisol
release in 70 SO fed fish……………………………………………………………….148
Figure 7.8: Effect of incubating head kidney tissue with INDO or NDGA on cortisol
release in 100 SO fed fish……………………………………………………………...148
Figure 7.9: Cortisol Stimulation factor from all the treatment after incubating the HK
tissues with INDO or NDGA…………………………………………………….........149

LIST OF ABBREVIATIONS
ACTH Adrenocorticotrophic acid
ARA Arachidonic acid (20:4n-6)
ATP Adenosine triphosphate
cAMP Adenosine 3’, 5’-cyclic monophosphate
CE Cholesterol ester
COX Cyclooxygenase
CR Cathecolamine receptor
CRF Cortisol releasing factor
CRH Corticotropic releasing hormone
DHA Docosahexaenoic acid (22:6n-3)
DHGLA Dihomogammalinolenic acid (20:3n-6)
DPA Docosapentaenoic acid
EFA Essential fatty acid
EPA Eicosapentaenoic acid
FA Fatty acid
FAME Fatty acid methyester
FAO Food Agriculture Organization
FCR Food conversion ratio
FIFO Fish in fish out
FM Fish meal
FO Fish oil
GAS General adaptation syndrome
GC Gas chromatography
GLA Gamalinolenic acid
GR Glucocorticoid receptor
HPI Hipothalamus-Pituitary-Interrenal Cell
HSC Hypothalamus-Sympathetic nerves-Chromaffin
HUFA Highly unsaturated fatty acid

IFFO International Fishmeal and Fish Oil Organisation
INDO Indomethacin
LA Linoleic acid
LNA Linolenic acid
LO Linseed oil
LOX Lipoxygenase
LPH Lipotropic hormone
LT Leukotriene
LX Lipoxines
MDA Malonaldehyde
MSH Melanocyte stimulating hormone
NADPH Nocotinamide adenine dinucleotide phosphate
NDGA Nordihydroguaiaretic acid
NK Natural killer
NSB Non specific binding
OA Oleic acid
PBL Peripheral blood leucocytes
PC Phosphatidyl choline
PE Phosphatidyl ethanolamine
PG prostaglandin
PI Phosphatidyl inositol
PKA Protein kinase A
PPARs Peroxisome proliferators-activated receptors
PUFA Polyunsaturated fatty acid
RIA Radioimmunoassay
SAM Symoathetic-Adrenal-Medullar
SBM Soybean meal
SO Soybean oil
TBARS Thiobarbituric acid reactive substances

TFA Total fatty acids
TX Thromboxane
VM Vegetable meal
VO Vegetable oil

Acknowledgments
The following PhD thesis was part of the EU Framework V project, Researching
Alternatives to Fish Oil in Aquaculture (RAFOA), Q5RS-200-30058 and Spanish
project “Effecto de la sustitución parcial del aceite de pescado por aceite de lino en la
dieta sobre la salud y resistencia al estrés” (AGL2004-08151-CO302). During my PhD
work, I was granted from different institutions, I am very grateful to Dirección General
de Relaciones con Africa del Gobierno de Canarias, Agencia Española de Cooperación
Internacional (AECI) and CIHEAM for giving me this great opportunity. I was also
supported, in part, through an award to GR from the European Union Access to
Research Infrastructures (ARI) Action of the Improving Human Potential Programme
(contract HPRI-CT-2001-00180) during his stage in Institute of Aquaculture, University
of Stirling.
I wish to express my sincere gratitude to Prof Marisol Izquierdo for leading me
to the fascinating world of fish nutrition, for her great scientific, moral, professional
support and for opening me the way to be a friend. I am very grateful and I can only say
THANK YOU.
Part of the experiments of the thesis was done at the department of nutrition,
Institute of Aquaculture, University of Stirling. I am grateful for Prof Gordon Bell, for
the opportunity to work at his laboratory and his advices have been invaluable. I am
grateful to him for accepting to be a co-supervisor of the present thesis and his
availability all these years. Fiona McGhie is also acknowledged for her technical
support with the prostaglandins and leptins measurements. I wish to express my
gratitude to all the staff of the department of nutrition for their help and their assistance,
especially to Dr. James Henderson, Prof. D. Tocher, Dr. J. Good, Vasilis, Jorge and
Yannis for sharing a wonderful days.
A part of the in vitro experiment and cortisol analysis was done at the
department of Cell Biology, Physiology and Immunology, Universitat Autonòma de
Barcelona. I wish to thank Prof Lluis Tort for his assistance and supervision during the
in vitro experiment and cortisol analysis. My thanks also, to Sheila Ons, Cristina
Marquez, Laura Acerete, Adriana, Cristina and Carmen Doñate for their sincere
friendship and useful help.

I wish to thank Prof William Powell, Meakins Christies Laboratories, McGill
University, Montreal Canada, for opening me the doors of his laboratory to learn HPLC
techniques to separates Lipoxygenases metabolites, and his own house to share a few
moments with his family. I spend a very wonderful 3 months there. Thanks to Sylvie,
Chantal, Gail and Francois for making my training very productive and amazing at the
same time.
I wish to thank Dr. Daniel Montero, for his advices and his special consideration
to our relationship. Many thanks to Dr. Lidia Robaina, Dr, Juan Manuel Afonso, Dr.
Rafael Ginés, Dr. Maria Jose Caballero, Dr. Hipólito Fernandez, Dr. Juan Socorro, Dr.
Ricardo Haroun and Dr. Javier Roo for their useful help and advices. I did not have
enough time to know A. Valencia, but I am sure he was a great man God mercy to him.
I am very grateful to Prof Albert Tacon for his advices, constructive criticism and
through review of some parts of the thesis manuscript. I also thank him for his
confidence and his friendship.
I wish to thank also, all my former and present colleagues at Grupo de
Invesitgación en Acuicultura. Especially I wish to thank my brother in life Eyad and his
family for all the kindness and love during all these years, Eneko and Orestes for
sharing everything with me and showing me the right way to clam down and don’t
loose the path in difficult moments. Amaia, Eduardo, Mentor, Valeria, Yoryia, Tibiabin,
Mapi, Gercende, Tatiana, Mohamed, Silvia, Alex, Fran, Jezabel, Fefi, Davinia, Carmen,
Dominique, Lahoussine, Reda, Fatima-Zahra, Ada, Moneiba and Manolo for many
helpful advices and good conversations during all these years, and for understanding
me. We have gone through so many things together. With you I can be just me…
My warms thanks I owe to my parents and brothers, I am a result of all the love
and sacrifices you showed me during all these years. The words are not able to express
my deep thanks and respect. I wish that my father would be present, but I know that he
was always proud of us. I plead God to cover him with his mercy.


Chapter 1
General Introduction

Chapter 1 General Introduction
1
1- Lipids as a constituent of fish diets
1.1- Lipids and fatty acids
Lipids are a large and diverse group of naturally occurring organic compounds
that have in common a ready solubility in organic solvents (hydrocarbons, chloroform,
benzene, ethers and alcohols) and general insolubility in water. There is a great
structural variety among the lipids, having as a basic form a hydrocarbon chain with a
carboxylic group at one end and a terminal methyl group at the other (n or w carbon).
The acyl chain could be saturated or unsaturated and can be esterified to other
molecules; then, lipids include a diverse range of compounds, like fatty acids and their
derivatives, carotenoids, terpenes, steroids and bile acids.
Lipids constitute a heterogeneous group of compounds, and different
classifications are used to distinguish them. For chromatography purposes, lipids are
divided in two broad classes including complex lipids and simple lipids. The latter
include nearly all the commercially important fats and oils of animal and plant origin
such as, triacylglycerols, diacylglycerols, 2-monoacyl-sn-glycerols, sterols, waxes,
tocopherols and free fatty acids. Complex lipids including glycerophospholipids,
glycoglycerolipids, sphingomyelin, glycosphingolipids and eicosanoids. Otherwise,
according to their degree of polarity, lipids are separated into polar or neutral lipids.
Polar lipids including glycerophospholipids (currently named phospholipids),
glucoglycerolipids, sphingomyelin and glycosphingolipids, whereas neutral lipids
contain fatty acids and their derivative glycerolipids, sterols, waxes and tocopherols,
among others.
Fatty acids are the basic building block of the lipids, certain are essential
components of the diet, as they cannot be synthesised by animals and have specific
physiological and structural functions. Polyunsaturated fatty acids (PUFA) are fatty
acids containing more than 16 carbon atoms with two or more double bonds. The PUFA
most frequently found in nature are: docosahexaenoic acid (DHA; 22:6n-3),
docosapentaenoic acid (DPA; 22:5n-3 or n-6), eicosapentaenoic acid (EPA; 20:5n-3),
arachidonic acid (ARA; 20:4n-6), γ-linolenic acid (GLA; 18:3n-6), α-linolenic acid
(LNA; 18:3n-3) and linoleic acid (LA; 18:2n-6). These are important dietary nutrients
for mammals including humans (Simopoulos, 2000). Highly unsaturated fatty acids
(HUFA), such as DHA, DPA, EPA and ARA are those PUFA of 20 and more carbon
atoms in their aliphatic chain with 3 or more unsaturated bonds, and fish are the major

Chapter 1 General Introduction
2
dietary source of n-3 HUFA (Ackman, 1980; Sargent and Tacon, 1999). ARA generally
accounts for only 1-2% of the total fatty acids in fish phosphoglycerides, with the
notable exception of the phosphatidylinositols where ARA can be the major PUFA
(Izquierdo, 1996; Sargent et al., 1993), thus, fish have high nutritional requirements for
ARA, EPA and DHA (Sargent et al., 1997).
Fish naturally consume diets rich in (n-3) PUFA, however, the tissue fatty acid
compositions of cultivated fish is generally determined both by the type of dietary lipid
ingested and the ability of the individual fish species to modify that dietary input via
both pathways of catabolism and conversion including desaturation and elongation
(Henderson and Tocher, 1987; Sargent et al., 1989; Torstensen et al., 2000; Bell et al.,
2001, 2002). It is generally understood that marine fish are incapable of these
conversions (Tocher and Ghioni, 1999) and require preformed EPA, ARA and DHA in
their diets.
1.2- Lipid functions in fish
In common with other vertebrate so far studied including humans, fish have
obligatory dietary requirements for both (n-6) and (n-3) PUFA. In order to provide the
fish with adequate equilibrated diets, it is necessary to know the physiological and
metabolic functions of the different dietary nutrients. Furthermore, lipids have multiple
structural and physiological functions in fish, since fatty acids are the main cell
membrane constituents.
Furthermore, some fatty acids are also important precursors for a range of highly
biologically active mediators of fish metabolism and physiology. Thus, fatty acids can
act as second messengers required for translation of external signals, as they are
produced rapidly as a consequence of the binding of specific agonists to plasma
membrane receptors. Within cells, fatty acids can act to amplify or otherwise modify
signals to influence the activities of such enzymes as protein kinases, phospholipases,
and many more. They are involved in regulating gene expression, mainly targeting
genes that encode proteins with roles in fatty acid transport or metabolism via effects on
transcription factors, i.e. peroxisome proliferators-activated receptors (PPARs) in the
nuclei of cells, such effects can be highly specific to particular fatty acids. Indeed,
phospholipids play multiple roles in cells other than establishing permeability barriers,
they provide a matrix for the assembly and function of a wide variety of enzymes, they
participate in the synthesis of macromolecules, and they act as molecular signals to

Chapter 1 General Introduction
3
influence metabolic events.
The instability of biomembranes, including mechanical fragility and osmotic
leakiness is affected by its fatty acids composition. Therefore, environment may change
membrane fluidity, which acts as a sensitive receptor initiating cellular regulation
(Beney and Gervais, 2001). It is important that membrane fluidity is also affected by the
content of HUFA in constituent phospholipids, which due to their three dimensional
structure and lower hydrogen-hydrogen interactions, increase protein insertion. For
example, the fatty acid composition of phospholipids from membranes determines the
level of its fluidity (Bell et al., 1986), and considering that fish is a poikilotherm
organism, its membrane fatty acid content is crucial to adapt to the environmental
temperature changes. Furthermore, changes in the fatty acid composition of the cell
membranes could directly affect the activities of membrane-bound enzymes and
receptors, perturbing consequently different physiological processes (growth,
reproduction, immune system…etc).
The essential fatty acid (EFA) requirements of freshwater and marine fish
species have been extensively studied over the past 20 years and are known to vary both
quantitatively and qualitatively (Sargent et al., 1989, 1995, 2002). In freshwater fish,
EFA requirements can be met by supplying LA and/or LNA, although better
performances can be achieved by supplying the “bioactive” forms of the n-3 HUFA,
mainly EPA and DHA (Kanazawa, 1985). Dietary lipids provide essential PUFA
necessary for growth and development of cells and tissues (Sargent et al., 1995) and are
also a major source of energy (Sargent et al., 1989) yielding 9 Kcal/gr, promoting their
use to partially spare protein in aquaculture feeds and enhancing diet profitability
(Vergara et al., 1996; Morrow et al., 2004). In addition, fish phosphoglycerides are
naturally rich in DHA and EPA and it can be assumed that these fatty acids fulfil the
same structural role in biomembrane phosphoglycerides that ARA does in higher
terrestrial mammals (Sargent, 1995).
In fish, some reports show positive effects of n-3 FA on immune response, as the
increased activity of head kidney macrophages has been associated with higher levels of
dietary n-3 fatty acids in catfish (Blazer, 1991; Sheldon and Blazer, 1991). Ashton et al.
(1994) have found that head kidney supernatants derived from rainbow trout fed a diet
enriched with n-3 fatty acids had greater migration stimulating ability than supernatants
from fish fed an n-6 fatty acid enriched diet. Thereby, adequate amount of n-3 fatty
acids was found to be essential for the correct function of immune system.

Chapter 1 General Introduction
4
While long-chain PUFAs possess a wide range of cellular functions, one of their
most important is to supply precursors for the production of eicosanoids, which are
bioactive fatty acid metabolites that can modulate many immune functions (Gershwin et
al., 1985; Uhing et al., 1990). Eicosanoids are produced from C20 PUFA, especially
dihomo-gamma-linolenic-acid (20:3n-6; DHGLA), ARA and EPA, by the action of
cyclooxygenase (COX) and lipoxygenase (LOX) enzymes to yield a wide range of
bioactive compounds, including prostaglandins (PG) and thromboxanes (TX) produced
by the action of COX. LOX yields a range of monohydroxy fatty acids (e.g. 5 (S)-
hydroxy-eicosatetraenoic acid; 5-HETE derived from ARA), while di- and tri-hydroxy
fatty acids, such as leukotrienes (LT), lipoxins (LX), are also formed via epoxy
intermediates (Samuelson, 1983).
ARA is the major eicosanoid precursor in mammalian cells, giving rise to,
among other products, 2-series prostaglandins (Horrobin, 1983). Other C20 PUFAs, such
DHGLA and EPA are also substrates for eicosanoid production and yield
prostaglandins of the 1- and 3-series, respectively. Although DHGLA and EPA are
generally poorer substrates for prostaglandin synthetase than ARA (Crawford, 1983),
they both compete for the enzyme binding site and can reduce the production of ARA-
derived prostaglandins (Willis, 1981; Bell et al., 1994)
Eicosanoids have diverse pathophysiological actions including immune response
and inflammatory processes. Thus, they are involved in the regulation of the immune
system by their direct effects on cells such as macrophages and lymphocytes or their
indirect effects via cytokines (Rowley, 1995). PG, especially PGE2 are important in
modulating the function of immune cells and while PGE2 is required for normal
immune function, overproduction can be immunosuppressive (Kinsella et al., 1990).
Furthermore, the lipoxygenase product LTB4 is a powerful modulator of immune cell
function, augmenting proliferation of T and B cells, stimulating the release of cytokines
from monocytes and T cells, acting as a potent chemoattractant and inducing natural
killer (NK) cell activity (Kinsella et al., 1990; Claesson et al., 1992). LOX derivatives
are also shown to regulate and mediate the interactions between innate and adaptive
immunity of the host defence (Hedi and Norbert, 2004). Recent studies indicate that
some pathogens disable invertebrate immunity by inhibiting eicosanoid actions in
cellular immunity, indicating the key role of eicosanoids on immune defence (Dean et
al., 2002; Stanley and Miller, 2006). Dietary n-3HUFA levels influence patterns of
eicosanoid production in fish tissues, possibly as a consequence of changes in the

Chapter 1 General Introduction
5
EPA/ARA ratio in tissues (Bell et al., 1993).
1.3- Lipids sources in aquafeeds
Aquaculture has traditionally used products from industrial fisheries, namely
fish meal (FM) and fish oil (FO), to convert relatively cheap protein and oil into high
value products, a practice that is both scientifically and commercially sound (Bell et al.,
2002). However, the rapid development of aquaculture, which is expanding at over 10%
per year (Tidwell and Allan, 2002), together with the FO uses for domestic animals
feeds and pharmacological uses have greatly increased its cost and affected its
availability. Consequently, demand for these products is rapidly increasing and current
estimates suggest that aquaculture feeds will consume approximately 90% and 60-70%
of the world FO and FM supplies respectively by 2010 (Figure 1.1) (Allodi, 2007) and
it is expected that by 2012 the FO needs for aquaculture will exceed the total
production. Therefore, availability of FM and FO for aquafeeds is limited (Anon, 2002)
during stabilised periods of wild fisheries catches, and endangered when wild catches
decrease as a consequence of natural phenomena such as “El Niño” (Anon, 2002;
Naylor, 2004). Moreover, the continuous use of FM and FO may place added pressure
on natural resources and convert aquaculture to a net user rather than in a net
contributor to world fish supply, with disastrous consequences for the ecosystem
(Staniford, 2002; Milewski, 2002; New, 2002; Allan, 2004). Elsewhere, one of the long
continued debates in aquaculture is the use of FM and FO in feeds and the amount of
wild fish it takes to produce farmed fish, called Fish In-Fish Out (FIFO) ratios ranging
from 3:1 to 10:1 (International Fishmeal and Fish Oil Organisation: IFFO, 2008); and
the most recent review published by Tacon & Metian (2008) gave the FIFO for salmon
as 4.9:1, meaning that it takes 4.9 tonnes of wild fish to produce 1 tonne of salmon.
Moreover, the FO prices doubled during the last 5 years (Figure 1.1), and they continue
to rise making it more cost-effective to divert increasing proportions of these
ingredients to human consumption. Therefore, the restrictions in cost and availability
imposed on FM and FO have lead, during the last 15 years, to the gradual substitution
of these ingredients by alternative sustainable lipid and protein sources

Chapter 1 General Introduction
6
Figure 1.1: The evolution and expectation of Fish Oil uses and needs from 1995 to 2015. Based
on data from Allodi 2007.
This graph shows clearly the significant increase of FO use for aquaculture
during the last 15 years and its projection to increase in the future 5 years. The
noticeable drop in FO production in 1998 was due to “El Niño” phenomena. Thus, FO
uses for aquafeeds increased from less than 30% to more than 80% of total FO
production annually and it is expected that the all FO needs for aquafeeds could exceed
the total FO production by 2011. This pressure on the limited wild resources caused, FO
prices to double during the last decade (Figure 1.1) as the prices rose from 400 US
$/tonne in 2000 to more 750 US $/tonne today, and it is expected that it will continue to
increase up to 900 US $/tonne in 2015 (Tacon and Metian, 2008). In consequence,
alternatives to FO are urgently required, with vegetable oils as the prime candidates
(Bell and Waagbø, 2008)
Marine fish are mostly adapted to a carnivorous/piscivorous diet that is naturally
rich in n-3 HUFAs, developing a relative deficiency in the enzymes (desaturases and
elongases) responsible for the conversion pathway from LA and LNA to their HUFA
end products (Tocher and Ghioni, 1999; Ghioni et al., 1999; Zheng et al., 2009). As
with vertebrates, PUFA are essential in the diet of fish, but there are special
requirements for HUFAs such EPA and DHA, rather than shorter chain PUFA found in
VO (Tocher, 2003a,b).
At present, more than 100 million tonnes of vegetable oils are produced per year
including palm, soybean, linseed, rapeseed, olive and sunflower oils, with palm and

Chapter 1 General Introduction
7
soybean showing by far the biggest productions (Figure 1.2) (O’Mara, 1998). Vegetable
oils (VO) and vegetable meals (VM) frequently show more predictable productions and
prices than FO and FM, which can be an advantage in providing consistent aquafeed
production.
Figure 1.2: Evolution of different plants oils production, data compiled from Tacon et al., 2006.
Thus, the less sustainable FM and FO could be used for commodities or as
strategic ingredients, their inclusion in aquafeeds being dependant on the fish species
and life stage requirements as well as relative ingredient prices. Consequently VOs are
considered presently as the only viable, cost competitive alternative lipid source for
aquaculture diets and a number have been used as partial and complete replacement for
FO (Bell et al., 2005).
Sustainable protein source alternatives to FM include various vegetable meals
with crude protein contents of 20 to 50% (Hertrampf and Piedad-Pascual, 2000), with
soybean meal (SBM) currently representing the predominant choice. However, more
carnivorous fish have a limited ability to tolerate high SBM contents in their diets
(Kaushik, 1990; Torstensen et al., 2008) due to the poorer digestibility, lower
availability of some essential amino acids and inferior palatability of SBM in
comparison to FM as well as the presence of anti-nutritional factors. Regarding FO
substitution, several studies have pointed out the successful inclusion of different blends
of VOs in diets for different species without compromising their growth or feed
utilisation, the level of inclusion depending on the species (Bell et al., 2001; Caballero
et al., 2002, Montero et al., 2003; Izquierdo et al., 2003, 2005; Torstensen et al., 2005;
Mourente and Bell, 2006). For instance, it has been shown that it is possible to replace

Chapter 1 General Introduction
8
up to 60% of the FO by VOs in diets for seabream without compromising growth,
survival, feed utilization or fillet organoleptic properties, when fish are fed either for a
medium (3 months, Izquierdo et al., 2000, 2003) or long period (8 months) (Menoyo et
al., 2004; Izquierdo et al., 2005). However, the effect of those or higher substitution
levels on fish health and stress resistance have not been clearly determined.
1.4- Vegetable oils and fish health
Inclusion of vegetable lipid and protein sources in diets for cultivated fish is
considered as a sustainable solution for the aquaculture industry to cope with the
reduced availability of FO and FM. To fulfil this purpose, industry research must not
only determine the effect of replacing feed ingredients on standard farming parameters
like growth, survival rates or food conversion ratio (FCR), but also on the nutritional,
sensory, processing, and safety characteristics of aquaculture products (Barlow and
Pike, 2001). Besides, it is imperative that the impact of potential FM and FO
replacements on other factors such as health and welfare will be precisely assessed
(Barlow and Pike, 2001).
Nutrition is one of the main factors determining health and welfare status in
cultured fish. Dietary supply of amino acids, PUFA, enzyme co-factors and energy is
essential to support the fish immune system including lymphocyte proliferation and the
synthesis of effectors (e.g. immunoglobulins, lysozyme and complement) and
communication molecules (e.g. cytokines and eicosanoids). Moreover, nutritionally
adequate diets are recognized to improve the health of convalescent fish, whereas
feeding unbalanced diets can lead to gross malnutrition and increase stress and disease
susceptibility. Therefore, outbreaks of fish diseases commonly occur when fish are
stressed due to a variety of factors including poor nutrition. Thus, substitution of FM
and FO by vegetable sources may lead to nutritional imbalances that could affect fish
health and welfare.
Some studies have pointed out negative alterations on certain fish health
parameters and resistance to stress in fish fed with VO (Bell et al., 1993, 1996;
Montero et al., 2003; Jutfelt et al., 2007). For instance, feeding salmon with VOs
caused significant reductions in several non-specific immune parameters including
haematocrit, total white blood cell and RBC, and macrophage respiratory burst (Good et
al., 2001). Therefore, the effect of VO inclusion seems to depend on the type of VO, the
FO substitution level, the fish species and the culture conditions. In gilthead seabream,

Chapter 1 General Introduction
9
increase in FO substitution levels from 60 to 80% by vegetable oils significantly
reduces growth and feed conversion indices (Izquierdo et al., 2008) altering normal
hepatocyte and enterocyte morphology (Caballero et al., 2003), and negatively affecting
immune functions and post-stress plasma cortisol response (Montero et al., 2003). In
addition, inclusion of soybean or rapeseed oil with of 60% VO substitution reduced
macrophage phagocytic activity (Montero et al., 2003) whereas the reduction in the
EPA and DHA acids in diet has been shown to significantly inhibit serum alternative
complement pathway activity (Montero et al., 1998). However, little is known on the
mechanisms involved in the effect of PUFA on stress and disease resistance in cultured
fish, which seems to be mediated, at least partly, by the eicosanoid production in target
tissues. Indeed, changes in FA composition of phospholipids affect the quantity and the
spectrum of eicosanoid synthesis (Bell et al., 1992, 1993, 1994, 1996; Ashton et al.,
1994; Lall, 1998; Balfry and Higgs, 2001) and as in higher vertebrates, altered
eicosanoids production may affect immune cell composition and function (Kinsella and
Lokesh, 1990; Kelley and Daudu, 1993). Moreover, although these studies about the
effects of dietary VO on prostaglandin production in different tissues have been
conducted in freshwater and some Nordic marine fish species (Bell et al., 1994, 1995,
1996), no studies have been conducted until now on eicosanoid production in seabream,
or their alteration by dietary lipids.
Since the different vegetable oils employed as lipid sources to substitute FO
markedly differ in their fatty acid profiles, including the relative content of n-3 and n-6
fatty acids, their introduction in fish diets strikingly modify the fatty acid composition
of different tissues (Torstensen et al., 2000; Bell et al., 2001, 2002, Caballero et al.,
2002; Montero et al., 2003; Izquierdo et al., 2003, 2005), this in turn can lead to
differences in eicosanoid production and immune responses (Balfry & Higgs 2001;
Thompson et al., 1996; Balfry et al., 2006). Thus, Bell and colleagues (1993, 1996)
reported that Atlantic salmon fed a diet containing increased levels of sunflower oil
(rich in n-6, consequently with decreased n-3/n-6), produced more ARA-derived
eicosanoids compared with fish fed diets containing linseed or fish oil (with higher n-
3/n-6 ratio) which produced more EPA-derived eicosanoids. In addition, increased
activity of head kidney macrophages has been associated with higher levels of dietary n-
3/n-6 fatty acids in catfish (Sheldon and Blazer, 1991). Moreover, it is reported that
eicosanoids with a more suppressive influence on the immune system are derived from
n-3 HUFAs, which are more prevalent in diets containing high concentrations of LNA

Chapter 1 General Introduction
10
and the n-3 HUFA (Higgs et al., 1995). Indeed, reports have cautioned that the relative
ratios of fatty acids and eicosanoid precursors are the key to understand the effect of
dietary lipids on the immune system (Ashton et al., 1994).
Furthermore, feeding with decreased n-3/n-6 was associated with enhanced
respiratory burst activity of peripheral blood leucocytes (PBLs) (Balfry et al., 2006),
and increased bactericidal activity of macrophages from channel catfish (Ictalurus
punctatus). In addition, significantly higher natural-killer-like-cell activity has also been
seen in leukocytes isolated from rainbow trout (Onchorhynchus mykiss) (Kiron et al.,
1995a,b), and Atlantic salmon (Balfry et al., 2006) that were previously fed an n-3
enriched diet. Other previous reports have suggested that high antibody production is
associated with high dietary n-3 HUFA (Erdal et al., 1991; Waagbo et al., 1993).
Indeed, high dietary n-3/n-6 ratios resulted in increased B lymphocyte responses and
improved fish survival following a disease challenge (Thompson et al., 1996), and
higher numbers of thrombocytes in channel catfish, that consequently have reduced (n-
6) fatty acid derived eicosanoids (i.e., thromboxane B2) involved in blood clotting, and
compensate for this with elevated numbers of thrombocytes (Klinger et al., 1996).
Evidence suggests that changing the fatty acid composition of immune cells can
influence immune function by changing the physiology of the cell membrane but
perhaps more importantly by influencing the production of modulatory prostaglandins
and leukotrienes. This is supported by a number of studies showing a reduction in
production of PGE2 and leukotriene B4 (LTB4) by stimulated head kidney macrophages
from salmon fed a diet containing higher dietary n-3/n-6 ratio (Bell et al., 1993, 1996).
Montero et al. (2003) found that seabream fed higher n-3/n-6 by including LO in the
diet (rich in LNA, increasing n-3/n-6 ratio), decreased the numbers of circulating
erythrocytes. It is also demonstrated that dietary lipid determines the fatty acid profile
of macrophages and immune cells in cod (Waagbø et al., 1995), seabass (Farndale et
al., 1999) and seabream (Montero et al., 2003).
Nevertheless, the impacts that dietary fatty acids have on the immune response
are complex and depend on several factors that influence eicosanoid production
including competition between n-3 and n-6 fatty acid during metabolism for chain
elongation and desaturation. Therefore, there is a clear suggestion that the ratios of n-6
to n-3 fatty acids in the dietary lipids may play an important role in balancing the
composition of the fish cell membrane PUFAs (Bell et al., 1993, 1996, 2001; Caballero,
2002; Izquierdo et al., 2005), that subsequently modulate its immune parameters (Balfry

Chapter 1 General Introduction
11
et al., 2006).
The beneficial effects of fish lipids (rich in n-3 PUFA) in the control of
cardiovascular disease and neurological development are well documented in the
nutrition literature (Herbaut, 2006; Simopoulos, 2008). Furthermore, high dietary n-6
PUFA and n-6/n-3 PUFA ratios have been suggested to play a role in many Western
chronic diseases common in the developed world (Simopoulos, 2008; Yam et al., 1996).
Therefore, when substituting fish with a blend of VOs, care should be taken not only to
establish the correct blends in order to guarantee not only the fish growth, but also to
provide them with the adequate n-3/n-6 fatty acids ratios to allow normal function of its
physiological processes and to maintain the nutritional benefits of the fish to the human
consumer (Bell et al., 2001).
1.5- Lipid nutrition and fish resistance to stress
Previous studies have demonstrated the importance of feeding adequate levels of
different nutrients in fish to allow adaptation to any chronic or acute environmental
stress (Salte et al., 1988). Among several nutrients, dietary n-3 HUFA have been found
to increase resistance to both chronic and acute stress in seabream (Sparus aurata)
juveniles (Montero et al., 2001). In European eel (Anguilla anguilla) and Adriatic
sturgeon (Acipenser naccarii) dietary n-3 HUFA increased the tolerance to hypoxic
conditions (Mackenzie, 2001). Moreover, in adult seabream, feeding diets deficient in
n-3 HUFA increased basal plasma cortisol prior to confinment stress denoting the
stressor effect of the nutritional deficiency (Montero et al., 1998). Both DHA and EPA
have been found to be essential for improving resistance to handling stress in larvae of
several fish species such as red seabream (Pagrus major) (Izqueirdo et al., 1988;
Watanabe et al., 1989), Japanese flounder (Paralichthys olivaceous) (Izquierdo et al.,
1992; Furuita et al., 1999), as well as to temperature change stress in European sea bass
(Dicentrarchus labrax) (Person-Le Ruyet et al., 2004). Generally, the manipulation of
dietary fatty acid compositions affects the ability of larval fish to resist several stressors,
hence influencing survival following stress (Izquierdo et al., 1989; Watanabe et al.,
1989; Tuncer et al., 1993; Kanazawa, 1997; Gapasin et al., 1998; Koven et al., 2001a,b,
2003; Liu et al., 2002). Indeed, feeding n-3 HUFA has been also reported to enhance
crustacean’s resistance to stress conditions, such as osmotic shock (Palacios et al.,
2004; Sui et al., 2007), temperature fluctuation (Chim et al., 2001) and ammonia
(Martins et al., 2006).

Chapter 1 General Introduction
12
Dietary ARA elevation has also been found to increase overall survival
(Bessonart et al., 1999) and improve resistance to handling stress in larval gilthead
seabream (Koven et al., 2001a,b). An optimal concentration of dietary ARA was also
found to maximize stress resistance to a hypersaline challenge in larval summer
flounder (Willey et al., 2003) and striped bass (Harel et al., 2001).
Several studies have suggested that ARA is involved in the release of cortisol in
fish, although actual mechanisms have not been investigated (Gupta et al., 1985; Harel
et al., 2001; Koven et al., 2003). Koven et al. (2003) found that dietary intake of ARA
in combination with daily salinity changes were associated with elevated whole body
cortisol levels in the seabream larvae at the end of the experimental period. The authors
suggested that ARA enhanced the sensitivity of the HPI axis, and in combination with
daily stress this resulted in higher levels of cortisol. Thus, ARA has been found to
enhance resistance to stress in seabream larvae (Koven et al., 2001a,b), and high dietary
intake of ARA for the same species lowered the sensitivity of fish to acute stress, as
evidenced by decreased plasma cortisol levels and plasma osmolality (Van Anholt et
al., 2004).
However, the physiological mechanisms by which these fatty acids regulate fish
stress resistance or plasma cortisol levels are not clear. In mammals, certain studies
suggest that prostaglandins play an important role in mediating the corticosteroidogenic
action of ACTH (Kocsis et al., 1999), suggesting that the role of fatty acids in stress
response seems to be mediated by the production of eicosanoids. Evidence in fish
suggested also the mediation of these metabolites in cortisol release (Koven et al.,
2001a,b; Van Anholt et al., 2004)
2- Stress in Fish
2.1- Stress responses
The definition of stress varies among different authors, but it can be described as
a series of physiological changes occurring in the organism in order to recover
homeostasis threatened by either internal or external factors (stressors). Stress can also
be described as an internal hormonal response of a living organism caused by
environment or other external factors that move that organism out of its homeostasis
(Selye, 1973) by forcing a reallocation of energy within its system. Stress is
unavoidable in aquaculture and is one of the main arising problems for the modern
intensive aquaculture systems, where fish are frequently exposed to various stressors,
Chapter 1 General Introduction
13
such as grading, transportation and vaccination.
Stressful conditions have negative consequences on fish performance in
aquaculture, leading to growth reduction, immune-suppression and increased
susceptibility to infectious diseases, resulting in major economic losses to fish farmers.
The response of the fish to such stressors involves all levels of organization from the
cell (Hightower, 1991) to the individual organism (Barton and Iwama, 1991; Mommsen
et al., 1999) and to the structure of the population (Adams, 1990).
Under stress situations, fish undergoes a series of physiological reactions in an
attempt to recover the homeostasis which could lead to an adaptive response or to a
maladaptive response which compromises fish performances. These responses are
differentiated in three different types according to the so-called general adaptation
syndrome (GAS; Selye, 1975).
a) A primary response, the alarm reaction, which includes the organism’s
perception of the new altered state and the release of stress hormones and
neurotransmitters. Therefore, the catecholamines are released from the chromafin tissue
situated in the head kidney of teleosts and the endings of adrenergic nerves (Randall and
Perry, 1992). Cortisol is released from the interrenal tissue, located in the head kidney,
in response to several pituitary hormones, particularly the adrenocorticotrophic
hormone (ACTH) that in turn is liberated from the hypothalamus by the corticotropic
releasing hormone (CRH) (Donaldson, 1981; Vijayan et al., 2005; Alsop and Vijayan
2008).
b) A secondary response or stage of resistance, during which the organism
adjusts its metabolism to cope with the disturbance. Thus, the released stress hormones
activate a number of metabolic pathways including those implying the mobilization and
reallocation of energy, osmotic disturbance and increase in cardiac output, oxygen
uptake and transfer, resulting in alterations in regular blood chemistry and haematology
(Barton and Iwama, 1991, Iwama et al., 2006).
c) A tertiary response or stage of exhaustion may occur when the organism is
unable to adapt or overcome the changes caused by the stressor. Therefore, severe stress
can cause massive mortality, and sublethal stress may compromise several behavioural
and physiological functions (Campbell et al., 1992; Tort et al., 1996; Iwama et al.,
1997; Wendelaar Bonga, 1997; Ortuño et al., 2002; Vijayan et al., 2005). Thus, fish
growth and reproduction performances are reduced in stress situations (Barton et al.,

Chapter 1 General Introduction
14
1986; Mesa, 1994; Schreck et al., 2001), suppresses cellular immunity by affecting
inflammatory signaling pathways (Ortuño et al., 2002; Holland et al., 2003; MacKenzie
et al., 2006; Aluru and Vijayan, in press), and also it encourages infectious diseases and
can even cause death (Pankhurst and Van der Kraak, 1997).
The neuro-endocrine regulation of the stress response in fish is similar to that of
higher vertebrates and involves two regulatory axes (Figure 1.3) (Wendelaar Bonga,
1997; Barton, 2002):
Hypothalamus-Sympathetic nerves-Chromaffin (HSC) cell
axis, equivalent to the Sympathetic-Adrenal-Medullar (SAM) system in
vertebrates. As a result of the activation of the sympathetic nerve fibres,
which innervate the chromafin cells, stimulating the release of
catecholamines (epinephrine and norepinephrine) via cholinergic
receptors (Reid et al., 1996). Catecholamines, predominantly epinephrine
in teleostean fishes, are released rapidly to the circulation system in
response to stress stimulus (Randall and Perry, 1992) and are transported
to the different organs, altering the normal functions of the different
physiological processes (respiration, reproduction, immune
system…etc.) (Wendelaar Bonga, 1997).
Hipothalamus-Pituitary-Interrenal Cell (HPI) Axis: Is
equivalent to the Hipothalamus-Pituitary-Adrenal Axis, HPA in high
vertebrates. The HPI axis is the regulator of stress response in fish, once
activated in response to almost all forms of stress (Wendelaar Bonga,
1997). Briefly, in response to a stress situation, the hypothalamus
releases the Corticotropin Releasing Hormone (CRH) that acts on the
Pars distalis of the adenohypophysis, close to the roof of the mouth,
triggering the release of Adrenocorticotropin (ACTH), and, to a lesser
extent, α-melanocyte-stimulating hormone (g-MSH) and lipotropic
hormone (b-LPH), which are intermediate products of ACTH synthesis.
Afterwards, ACTH induces the production and release of cortisol, from
the interrenal cells located in the head kidney, to the circulation system
(Figure 1.3). Cortisol release is controlled through a negative feedback at
different levels of the HPI axis (Donaldson, 1981; Bradford et al., 1992;
Wendelaar Bonga, 1997).

Chapter 1 General Introduction
15
Figure 1.3: A simplified representation of the central and peripheral components of the stress
response in fish. Corticotropic releasing hormone (CRH), adrenocorticotrophic hormone (ACTH),
catecholamine receptor (CR), glucocorticoid receptor (GR).
According to the intensity and duration of the stress challenge, several types of
stress situations are recognized: acute, chronic, repetitive, irregular repetitive, etc. Acute
stress is produced by an intense stressor of short duration, whereas a chronic stress
situation implies a long-term disturbance that acts as an intense or mild stressor.
2.2- Head kidney as a key organ in stress response
Anatomically, fish don’t posses an adrenal gland as in mammals. Teleostean
kidney consists of a head and body kidney, deriving from pronephros and mesonephros
tissues, respectively. The external form of the fish kidney varies according to species.
The head kidney is an organ encased in bone, it must have taken up its position in the
head, and have penetrated both the air-bladder and the scapular arch, whereas many
nephrons and interstitial lymphoid tissue constitute the body kidney. The head kidney
contains the interrenal gland (homologous to the adrenal cortex in mammals)
responsible of cortisol release and the chromaffin cells (homologous to the adrenal
medulla), surrounding the postcardinal vein and its branches (Milano et al., 1997).
Chromaffin cells are located singly or in clusters in the walls of the postcardinal vein

Chapter 1 General Introduction
16
surrounded by the interrenal cells (Imagawa et al., 1996). The location of the interrenal
and chromaffin cells near the postcardinal vein facilitates their regulation by the
endocrine system via the bloodstream. The interrenal tissue exhibits considerable
morphological variation among taxonomic groups (Nandi, 1962), and it is considered as
the major endocrine, haematopoietic and lymphatic tissue in fish (Takashima and
Hibiya, 1995). Thus, head kidney is considered as a key tissue in stress response.
There is a little available information on the functions of the head kidney tissue
in fish, and recent studies are interested in using this organ in different experimental
preparations to study its functions. Variability in the size and number of cells of the
head kidney between individual fish (Pottinger et al., 1995) and the relatively large
numbers of fish required preclude the routine use of whole or fragmented head kidneys
in static or perfusion systems (Patiño et al., 1986; Benguira and Hontela, 2000, Rotllant
et al., 2000a,b) for in vitro screening tests for adrenotoxicants (example, figure 1.4).
Figure 1.4: Cross sections of paraffin embedded head kidney tissue of teleostean fish consisting
of haematopoetic tissue (HT), blood vessels (BV) and interrenal tissue (IT) containing the steroidogenic
cells (SC).

Chapter 1 General Introduction
17
2.3- Cortisol: as a stress hormone indicator in fish
The blood circulation level of cortisol is commonly used as an indicator of
degree of stress experienced by fish (Barton and Iwama, 1991; Wendelaar Bonga, 1997)
since, 1) cortisol is the major glucocorticoid in teleost fish and its plasma levels are
known to increase in response to a variety of stressors (Barton and Iwama, 1991), 2) it
is easily and reliably measured using radioimmunoassay (RIA) and enzyme-linked
immunosorbent assays and 3) it plays a critical regulatory role in many important
physiological processes (Mommsen et al., 1999). The pathway for cortisol release
begins in the HPI axis with the release of CRH by the hypothalamic neurosecretory
cells, which in turn stimulates the corticotrophic cells of the adenohypophysis to secrete
ACTH. Circulating ACTH, in turn, stimulates the interrenal cells embedded in the head
kidney to synthesize and release corticosteroids into the circulation for distribution to
target tissues (Figure 1.3).
The production of cortisol is under the control of the HPI (Wendalaar Bonga,
1997; Mommsen et al., 1999). For instance, cortisol releasing factor (CRF) secreted
from hypothalamic neurons stimulates the release of ACTH from the pituitary. This
pituitary peptide binds to melanocortin 2 receptor (MC2R) on the steroidogenic cells in
the interrenal tissue leading to corticosteroidogenesis (Aluru and Vijayan, 2009). It is
widely believed in mammals that ACTH stimulates cortisol secretion through adenosine
3’,5’-cyclic monophosphate (cAMP), which provides substrate cholesterol by activating
cholesterol ester hydrolase and facilitating transport of cholesterol to the side-chain
cleavage (scc) enzyme. Dempsher et al. (1984) have established a model of cortisol
release (Figure 1.5), thus ACTH binds to one or more specific receptors in the
adrenocortical cell membrane (MC2R, represented by A and B in the figure below)
which has the effect of activating adenylate cyclase (ACase). The cytosolic
concentration of cAMP increases, in turn a) activating cholesterol ester (CE) hydrolase,
which catalyses the conversion of cholesterol ester into free cholesterol, and b)
facilitating the transfer of cholesterol within the mitochondrion to a site accessible to the
scc enzyme. Furthermore, low density lipoprotein receptor-mediated uptake of plasma
cholesterol together with cytosolic cholesterol synthesis provide substrate for steroid
synthesis, and both these processes can be controlled by an intracellular pool of
cholesterol.
Furthermore, other studies have pointed out that the main pathway leading to

Chapter 1 General Introduction
18
corticosteroid synthesis by ACTH stimulation involves a signalling cascade integrating
G-proteins, adenyl cyclase, cAMP and protein kinase A (PKA) (Miller 1988, Schimmer
1995). Evidence suggests that cortisol exerts a negative feedback effect on the ACTH
secretion in the pituitary and also suppresses CRH synthesis in the hypothalamus. In
addition, there is also a negative feedback effect of ACTH on the secretion of CRH.
Therefore, the entire process can be thought of as a self-regulating system, as
summarised in the figure below. In addition, cholesterol modulates its own synthesis by
inhibiting beta-hydroxy-beta-methylglutaryl (HMG)-CoA reductase in the
adrenocortical cell (Dempsher et al., 1984).
Several biotic and abiotic stressors are known to modulate cortisol biosynthesis
in fish by altering the expression pattern of genes encoding proteins involved in the
functioning of the HPI axis (Alsop and Vijayan, 2009). In teleosts, multiple
glucocorticoid receptors (GRs) and one mineralocorticoid receptor (MR) are involved in
cortisol signalling (Vijayan et al., 2005; Prunet et al., 2006; Alsop and Vijayan, 2008).
11-deocycorticosterone was identified as a ligand for trout MR using in vitro reporter
assays, a physiological role for this ligand is lacking in vivo (Sturm et al., 2005;
McCormick et al., 2008). A distinct physiological role for multiple GR isoforms in
cortisol signalling has not been established in vivo (Bury et al., 2003).
Figure 1.5: A mechanistic model of ACTH-stimulated cortisol secretion in mammals (Dempsher
et al., 1984). Adenylate cyclase (ACase), cholesterol ester (CE), adenosine 3’,5’-cyclic monophosphate
(camp), Adenosine triphosphate (ATP).

Chapter 1 General Introduction
19
2.4- Corticosteroids biosynthesis by interrenal cells
Steroid hormones are important regulators of numerous physiological processes,
including glucocorticoids, mineralocorticoids and sex steroids, such as oestrogens and
androgens (Miller, 1988). However, only low levels of aldosterone have been found in
teleosts and the function of mineralocorticoids seems to be carried out by the
glucocorticoids (Wendelaar Bonga, 1997).
The steroid hormones are structurally similar and are synthesized from
cholesterol in the steroidogenic cells of the head kidney. Thus, cortisol is formed from
cholesterol via the intermediates pregnenolone, progesterone, 17-hydroxyprogesterone
and 11-deoxycortisol. 17-hydroxyprogesterone can be converted to either
corticosteroids by 21-hydroxylase or to sex steroids by 17-hydroxylase which thus is a
branch step in the steroid biosynthesis pathway. The 11-deoxycortisol formed by the
microsomal 17-hydroxyprogesterone 21-hydroxylase is eventually metabolised to
cortisol by the mitochondrial 11-hydroxylase (Figure 1.6). In fish the enzymes
responsible for cortisol production have been poorly examined. In mammals the 21-
hydroxylation of 17-hydroxyprogesterone is catalysed by microsomal cytochrome
P450c21 in cortisol producing adrenocortical cells (Miller et al., 1997). Production of
cortisol in extra interrenal tissues of fish is poorly examined. In mammals, the enzyme
responsible for conversion of 17-hydroxyrogesterone to progesterone is believed to be
another form of P450 than the P45021c that is responsible for the conversion of 17α-
hydroxyprogesterone to 11-deoxycortisol.
Figure 1.6: Representation of the steroidogenic pathways in teleost fish and the important role of
P450c17 in the formation of glucocorticoids and androgens/oestrogens. Enzymes implicated are 1)
P450scc, 2) 3β-HSD, 3) P450c17 (hydroxylase), 4) P450c17 (lyase), 5) P450c21 (Ruane, 2002).

Chapter 1 General Introduction
20
2.5- Cortisol roles in fish
While catecholamines induce rapid, short-term elevation in blood glucose
primarily through the glycogenolytic pathway (Vijayan and Moon, 1992), cortisol has a
key role in regulating many important physiological functions in teleosts. Thus, it is
involved in longer-term mobilization of non-carbohydrate energy stores (Wendelaar
Bonga, 1997) such as tissues protein and lipids, implying increases in plasma fatty acids
(Mazeaud et al., 1977). Besides its feedback actions on the corticotropic axis,
chronically elevated cortisol levels are responsible for the detrimental effects of stress
on vital physiological functions of fish, such as reproduction (Foo and Lam, 1993,
Small, 2004), osmoregulation (Redding et al., 1991; Mancera et al., 1994), growth
(Barton et al., 1987; Small, 2004) and immune system (Rottlant et al., 1997; Weyts et
al., 1998, MacKenzi et al., 2006; Aluru and Vijayan, in press). In freshwater fish, the
response to chronic stress may also include: loss of electrolytes, decreases in hematocrit
and hemodilution from catecholamine-induced increases in gill permeability (Randall
and Perry, 1992) or increased loss of ions through the urine (McDonald and Milligan,
1997).
Cortisol value levels vary and should serve as general guidelines since,
individual conditions, including species differences, strain genetic characteristics, prior
rearing history, and local environment will modify the plasma values of control and
stressed states (Barton et al., 2002). For instance, results of confinement studies in
rainbow trout, Oncorhynchus mykiss, (Pottinger et al., 1992) and Atlantic salmon,
Salmo salar (Fevolden et al., 1991) have indicated that the cortisol response to stress in
teleost fish is a highly individualized trait. Some individuals display a consistently high
cortisol stress response while others have a consistently low cortisol response. The
reasons for these differences are presently unclear. Furthermore, selective breeding
programs have demonstrated that stress responsiveness is heritable and that individual
responsiveness is stable over time (Fevolden et al., 1991; Afonso et al., 1998).
3- Gilthead Seabream as a model species for this thesis
Gilthead seabream is a marine fish species that has a long history in the
Mediterranean region, with evidence of fish capture and fattening dating back more than
2000 years. But, from 1980, the production started to grow rapidly, expanding from
1100 tonnes in 1985 to 8400 MT in 1990. This increase was supported by the

Chapter 1 General Introduction
21
development of new technologies and the availability of national and EU financial aids.
Nowadays, gilthead seabream constitutes one of the most important marine fish species
cultured in the Mediterranean, and the total European aquaculture production of
seabream attained approximately 140.000 tonnes in 2007, about 40.000 tonnes more
than 2005 (APROMAR, 2008) (Figure 1.7). In Spain, seabream is a much appreciated
fish species and has a high economic importance. Gilthead seabream production
techniques are therefore well developed and it constitutes an excellent model for
physiological studies in marine warm water species. However, since its culture is
relatively new in comparison to salmonids and other cold water species, many
physiological and nutritional aspects remain unstudied.
Figure 1.7: Gilthead seabream global production evolution in Europe during the last decade. APROMAR (2008)

Chapter 1 General Introduction
22
4- Objectives
The overall aim of this thesis is to promote the substitution of fish oil by
vegetable oils in on-growing diets for gilthead seabream without compromising fish
welfare by improving our knowledge on the mechanisms involved in the regulation of
stress resistance by dietary lipids.
For that purpose several objectives were addressed:
1- To determine the effect of high levels of fish oil substitution by n-3 or n-6
fatty acids rich vegetable oils on culture performance and fatty acid composition of
different tissues in gilthead seabream until commercial size.
2- To study the effect of fish oil substitution levels and n-3/n-6 fatty acid ratios
on seabream welfare and their resistance to several types of stress.
3- To investigate the effects of different levels of substitution of fish oil by
vegetable oils blends on gilthead seabream health and welfare in terms of plasma fatty
acid compositions and prostaglandin and leptin production.
4- To better understand the mechanisms involved in the regulation of stress
resistance by polyunsaturated fatty acids by studying the production and release of
cortisol in gilthead seabream interrenal cells incubated with adrenocorticotropic
hormone.
5- To clarify the effect of feeding vegetable oils along gilthead seabream on-
growing on welfare in terms of cortisol production and release by head kidney and the
physiological pathways involved.
To achieve these goals, tow feeding experiments along the whole on-growing
period and several “in vitro” studies were conducted. The results were organized in five
scientific studies that have been already published or submitted for publication. Some of
those studies were included in two research projects: RAFOA (2001-2005) funded by
the EU (Q5RS-2000-30058) and LINOSALUD (2005-2007) funded by the Spanish
Government (AGL2004-08151-CO302).

Chapter 1 General Introduction
23
References Ackman, R.G. (1980) Fish Lipids, part 1. In: Connell, J.J. (Ed) Advances in Fish
Science and Technology. Fishing News Books Ltd. Farnham, Surrey pp. 86-103
Adams, S.M. (1990) Status and use of biological indicators for evaluating the effects of
stress on fish. American Fisheries Society Symposium, 8:1-8.
Afonso, J.M., Montero, D., Robaina, L., Fernández, H., Izquierdo, M.S. and Ginés, R.
(1998) Selection programmes for stress tolerance in fish (Review). Cah Options
Méditerran, 34:235–245.
Allan, G. (2004) Fish for feed vs. fish for food. In: A.G. Brown (Ed) Fish, Aquaculture
and Food Security: Sustaining Fish as a Food Supply. Record of a conference
conducted by the ATSE Crawford Fund, Parliament House Canberra pp. 20-26.
Allodi, A. (2007) Sustainability - European Aquaculture Perspectives Will feed be a
bottleneck? FAO/FEAP Joint Workshop.
Alsop, D. and Vijayan, M.M. (2008) Development of the corticosteroid stress axis and
receptor expression in zebrafish. Am J Physiol Regul Integr Comp Physiol,
294:R711–R719.
Aluru, N. and Vijayan, M.M. (2009) Stress transcriptomics in fish: A role for genomic
cortisol signalling. General and Comparative Endocrinology, 164(2):142-150.
Anon (2002) Review and synthesis of the environmental impacts of aquaculture. The
Scottish Association for Marine Science and Napier University. Scottish
Executive Central Research Unit, Edinburgh, Scotland. 71 pages.
APROMAR (2008) Informe annual: La acuicultura marina de peces en España.
Technical report, Asociación Empresarial de Productores de Cultivos Marinos.
www.apromar.es
Ashton, I., Clements, K., Barrow, S.E. Secombes, C.J. and Rowley, A.F. (1994) Effects
of dietary fatty acids on eicosanoid generating capacity, fatty acid composition
and chemotactic activity of rainbow trout (Oncorhynchus mykiss) leucocytes.
Biochim Biophys Acta, 1214(3):253-62.
Balfry, S.K. and Higgs, D.A. (2001) Influence of dietary lipid composition on the
immune system and disease resistance of finfish. In: Lim, C., Webster, C.D.
(Eds.) Nutrition and Fish Health. Haworth Press In., New York. pp. 213-234.
Balfry, S.K., Oakes, J., Rowshandeli, M., Deacon, G., Skura, B.J. and Higgs, D.A.
(2006) Efficacy of equal blend of canola oil and poultry fat as an alternate
dietary lipid source for Atlantic salmon (Salmo salar L.) in sea water. II: effects

Chapter 1 General Introduction
24
on haematology and immunocompetence. Aquaculture Res, 37:192–199.
Barlow, S.M. and Pike, I.H. (2001) Sustainability of fish meal and oil supply, paper
presented at the Scottish Norwegian Marine Fish Farming Conference,
Sustainable Future for Marine Fish Farming, University of Stirling, Stirling,
Scotland. pp. 23-30.
Barton, B.A. (2002) Stress in fishes: A diversity of responses with particular reference
to changes in circulating corticosteroids. Integrative and Comparative Biology,
42:517-525.
Barton, B.A., Morgan, J.D. and Vijayan, M.M. (2002) Physiological and condition-
related indicators of environmental stress in fish. In: Adams S. M. (Eds.)
Biological Indicators of Aquatic Ecosystem Stress. Bethesda, USA: American
Fisheries Society. pp. 111-148.
Barton, B.A., and Iwama, G.K. (1991) Physiological changes in fish from stress in
aquaculture with emphasis on the response and effects of corticosteroids. Ann
Rev of Fish Diseases, 1:3-26.
Barton, B.A., Schreck, C.B. and Barton, L.D. (1987) Effects of chronic cortisol
administration and daily acute stress on growth, physiological conditions, and
stress responses in juvenile rainbow trout. Dis Aquat Org, 2:173-185.
Barton, B.A., Schreck, C.B. and Sigismondi, L.A. (1986) Multiple Acute Disturbances
Evoke Cumulative Physiological Stress Responses in Juvenile Chinook Salmon.
Transactions of the American Fisheries Society, 115:245-251.
Bell, G., Torstensen, B. and Sargent, J. (2005) Replacement of marine fish oils with
vegetable oils in feeds for farmed salmon. Lipid Technology, 17:7-11.
Bell, J.G., Ashton, I., Secombes, C.J., Weitzel, B.R., Dick, J.R. and Sargent, J.R. (1996)
Dietary lipid affects phospholipid fatty acid compositions, eicosanoid
production and immune function in Atlantic salmon (Salmo salar).
Prostaglandins, Leucotrienes and Eicosanoid Fatty Acids, 54:173-182.
Bell, J.G., Dick, J.R., McVicar, A.H., Sargent, J.R. and Thompson, K.D. (1993).
Dietary sunflower, linseed and fish oils affect phospholipid fatty acid
composition, development of cardiac lesions, phospholipase activity and
eicosanoid production in Atlantic salmon (Salmo salar). Prostaglandins,
Leucotrienes and Eicosanoid Fatty Acids, 49:665-673.
Bell, J.G., Henderson, R.J., Tocher, D.R., McGhee, F., Dick, J.R., Porter, A., Smullen,
R. and Sargent, J.R. (2002) Substituting fish oil with crude palm oil in the diet

Chapter 1 General Introduction
25
of Atlantic salmon (Salmo salar) affects tissue fatty acid compositions and
hepatic fatty acid metabolism. J Nutr, 132:222-230.
Bell, J.G., McEvoy, J., Tocher, D.R., McGhee, F., Campbell, P.J. and Sargent, J.R.
(2001) Replacement of fish oil with rape seed oil in diets of Atlantic salmon
(Salmo salar) affects tissue lipid compositions and hepatocyte fatty acid
metabolism. J Nutr, 131:1535-1543.
Bell, J.G., Tocher, D.R. and Sargent, J.R. 1994. Effect of supplementation with 20:3(n-
6), 20:4(n-6) and 20:5(n-3) on the production of prostaglandins E and F on the
1-, 2- and 3- series in turbot (Scophthalmus maximus) brain astroglial cells in
primary culture. Biochim Biophys Acta, 1221:335-3342.
Bell, J.G. and Waagbø, R. (2008) Safe and nutritious aquaculture produce: benefits and
risks of alternative sustainable aquafeeds. In: Holmer, M., Black, K.D., Duarte,
C.M., Marba, N., Karakassis, I. (Eds.) Aquaculture in the Ecosystem. Springer
Verlag BV. pp.185-225.
Bell, M.V., Henderson, R.J. and Sargent, J.R. (1986) The role of polyunsaturated fatty
acids in fish. Comparative Biochemistry and Phsysiology, 83B:711-719.
Beney, L. and Gervais, P. (2001) Influence of the fluidity of the membrane on the
response of organisms to environmental stresses. Appl Microbiol Biotech, 57:34-
42.
Benguira, S., and Hontela, A. (2000) ACTH- and cAMP-stimulated cortisol secretion in
interrenal tissue of rainbow trout (Oncorhynchus mykiss) exposed in vitro to o,p-
´DDD, p,p-´DDT and p,p-´DDD. Env Toxicol Chem, 19:842-847.
Bessonart, M., Izquierdo, M.S., Salhi, M., Hernández-Cruz, C.M., Gonzalez, M.M. and
Fernandez-Palacios, H. (1999) Effect of dietary arachidonic acid levels on
growth and survival of gilthead sea bream (Sparus aurata L.)
larvae. Aquaculture, 179:265–275
Blazer, V.S. (1991) Piscine macrophages function and nutritional influences: a review. J
Aquat Animal Health, 3:77-86.
Bradford, C.S., Fitzpatrick, M.S. and Schreck, C.B. (1992) Evidence for ultra-short-
loop feedback in ACTH-induced interrenal steroidogenesis in coho salmon:
Acute self expression of cortisol secretion in vitro. Gen Comp Endocrinol,
87:292-299.
Bury, N.R., Walker, P.A. and Glover, C.N. (2003) Nutritive metal uptake in teleost
fish. J Exp Biol, 206:11 -23.

Chapter 1 General Introduction
26
Caballero, M.J., Izquierdo, M.S., Kjorsvik, E., Montero, D., Socorro, J., Fernández, A.
and Rosenlund, G. (2003) Morphological aspects of the intestinal cells from
gilthead seabream (Sparus aurata) fed diets containing different lipid sources.
Aquaculture, 225:325-340.
Caballero, M.J., Obach, A., Rosenlund, G., Montero, D., Gisvold, M. and Izquierdo,
M.S. (2002) Impact of different dietary lipid sources on growth, lipid
digestibility, tissue fatty acid composition and histology of rainbow trout,
Oncorhynchus mykiss. Aquaculture, 214:253-271.
Campbell, P.M., Pottinger, T.G. and Sumpter, J.P. (1992) Stress reduces the quality of
gametes produced by rainbow trout. Biology of Reproduction, 47:1140-1150.
Chim, L., Lemaire, P., Delaporte, M., Le Moullac, G., Galois, R. and Martin, J.L.M.
(2001) Could a diet enriched with n-3 highly unsaturated fatty acids be
considered a promising way to enhance the immune defences and the resistance
of penaeid prawns to environmental stress? Aquac Res, 32:91-94.
Claesson, H.E., Odlander, B. and Jakobsson, P.J. (1992) Leukotriene B4 in the immune
system. Int J Immuno pharm, 14:441-449.
Crawford, M.A. (1983) A background to essential fatty acids and their prostanoid
derivatives. Br Med Bull, 39:210-213.
Dean, P., Gadsden, J.C., Richards, E.H., Edwards, J.P., Charnley, A.K. and Reynols, S.
(2002) Modulation by eicosanoids biosynthesis inhibitors of immune responses
by the insect Manduca sexta to the pathogenic fungus Metarhizium anisopliae. J
Invertebr Pathol, 79:93-101.
Dempsher, D.P., Gann, D.S. and Phair, R.D. (1984) A mechanistic model of ACTH-
stimulated cortisol secretion. Am J Physiol Regul Integr Comp Physiol,
246:R587-R596.
Donaldson, E.M. (1981) The pituitary-interrenal axis as an indicator of stress in fish. In:
Pickering, A.D. (Ed). Stress and fish. New York: Academic Press. pp. 11-47
Erdal, J.I., Evensen, O., Kaurstad, O.K., Lillehaug, A., Solbakken, R. and Thorud, K.
(1991) Relationship between diet and immune response in Atlantic salmon
(Salmo salar L.) feeding various levels of ascorbic acid and omega-3 fatty acids.
Aquaculture, 98:363-379.
Farndale, B.M., Bell, J.G., Bruce, M.P., Bromage, N.R, Oyen, F., Zanuy, S. and
Sargent, J.R. (1999) Dietary lipid composition affects blood leucocyte fatty acid
compositions and plasma eicosanoid concentrations in European sea bass

Chapter 1 General Introduction
27
(Dicentrarchus labrax). Aquaculture, 179:335–350.
Fevolden, S.E., Refstie, T. and Reed, K.H. (1991) Selection for high and low cortisol
stress response in Atlantic salmon (Salmo salar) and rainbow trout
(Oncorhynchus mykiss). Aquaculture, 95:53-65.
Foo, J.T. and Lam, T. (1993) Serum cortisol response to handling stress and the effect
of cortisol implantation on testosterone level in the tilapia, Oreochromis
mossambicus. Aquaculture, 115:145-158.
Furuita, H., Konishi, K. and Takeuchi, T. (1999) Effect of different levels of
eicosapentaenoic acid and docosahexaenoic acid in Artemia nauplii on growth,
survival and salinity tolerance of larvae of the Japanese flounder, Paralichthys
olivareus. Aquaculture, 170:59-69.
Gapasin, R.S.J., Bombeo, R., Lavens, P., Sorgeloos, O. and Nelis, H. (1998)
Enrichment of live food with essential fatty acids and vitamin C: effects on
milkfish (Chanos chanos) larval performance. Aquaculture, 162:269-286.
Gershwin, M.E., Beach, R.S. and Hurley, L.S. (1985) Nutrition and Immunity. New
York: Academic Press. 300 pp.
Ghioni, C., Tocher, D.R., Bell, M.V., Dick, J.R. and Sargent, J.R. (1999) Low C18 to
C20 fatty acid elongase activity and limited conversion of stearidonic acid,
18:4n-3, to eicosapentaenoic acid, 20:5n-3, in a cell line from the turbot,
Scophthalmus maximus. Biochem Biophys Acta, 1437:170-181.
Good, J.E., Bell, J.D., Thompson, K. and Williams, P.W. (2001) Assessment of immune
response in Atlantic salmon (Salmo salar) receiving alternative oil diets. In: An
abstract and poster presentation at the 5th Nordic Fish Immunology Symposium
June 2001, Institute of Pharmacy, University of Oslo, Oslo, Norway. p. 42.
Milano, G.E., Basari, F. and Chimenti, C. (1997) Adrenocortical and adrenomedullary
homologs in eight species of adult and developing teleosts: morphology,
histology and immunohistochemistry. Gen Comp Endocrinol, 108:483-496.
Gupta, O.P., Lahlou, B., Botella, J. and Porthé-Nibelle, J. (1985) In vivo and in
vitro studies on the release of cortisol from interrenal tissue in trout. I. Effects of
ACTH and prostaglandins. Experimental Biology, 43:201-212.
Harel, M., Gavasso, S., Leshin, J., Gubernatis, A. and Place, A.R. (2001) The effect of
tissue docosahexaenoic and arachidonic acids levels on hypersaline tolerance
and leucocyte composition in striped bass (Morone saxatilis) larvae. Fish
Physiol Biochem, 24:113-123.

Chapter 1 General Introduction
28
Hedi, H. and Norbert, G. (2004) 5-Lipoxygenase Pathway, Dentritic Cells, and
Adaptive Immunity. J Biomed Biotechnol, 2:99-105.
Henderson, R.J. and Tocher, D.R. (1987) The lipid composition and biochemistry of
freshwater fish. Prog Lipid Res, 26:281-347.
Herbaut, C. (2006) Omega-3 and health. Revue medicale de Bruxelles, 27(4):S355-
S360.
Hertrampf, J.W. and Piedad-Pascual, F. (2000) Handbook on Ingredients for
Aquaculture Feeds. Kluwer Academic Publishers, Dordrecht, The Netherlands.
513pp.
Higgs, D.A., Macdonald, J.S., Levings, C.D. and Dosanjh, B.S. (1995) Nutrition and
feeding habits in relation to the life history. In: Groot, C., L. Margolis and W. C.
Clark (Eds.). Physiological ecology of Pacific salmon, UBC Press, Vancouver.
p. 159.
Hightower, L.E. (1991) Heat shock, stress proteins, chaperones and proteotoxicity. Cell,
66:191-197.
Holland, J.W., Gould, C.R.W., Jones, C.S., Noble, L.R. and Secombes, C.J. (2003) The
expression of immune-regulatory genes in rainbow trout, Oncorhynchus mykiss,
during a natural outbreak of proliferative kidney disease (PKD). Parasitology,
126:1-4.
Horrobin, D.F. (1983) The regulation of prostaglandin biosynthesis by the manipulation
of essential fatty acid metabolism. Rev Pure Appl Sci, 4:339-383.
IFFO (2008) Advantages of using fishmeal and fish oil in feeds for aquatic animals.
International Fishmeal and Fish Oil Organisation. Available in: www.iffo.net.
Imagawa, T., Kitagawa, H. and Uehara, M (1996) The enervation of the chromaffin
cells in the head kidney of the carp, Cyprinus carpio; regional differences f the
connections between nerve endings and chromaffin cells. J Anat, 188:149-156.
Iwama, G.K., Pickering, A.D., Sumpter, J.P. and Schreck, C.B. (1997) Fish stress and
health in aquaculture. Soc. Exp. Biol. Sem. Ser. 62. Cambridge Univ. Press,
Cambridge, U.K.
Iwama, G.K., Afonso, L.O.B. and Vijayan, M.M. (2006) Stress in fishes. In: Evans,
D.H., Claiborne, J.B. (Eds). The physiology of fishes. 3aed. CRC, New York.
pp. 319-342.
Izquierdo, M.S., Arakawa, T., Kitajima, C., Takeuchi, T. and Watanabe, T. (1988)
Essential fatty acid requirement of larval Japanese flounder (Paralichthys

Chapter 1 General Introduction
29
olivaceus) and larval striped jack (Longirostris delicatissimus). Abstr Meet Jpn
Soc Sci Fish, p. 251.
Izquierdo, M.S., Arakawa, T., Takeuchi, T., Haroun, R. and Watanabe, T. (1992) Effect
of n-3HUFA levels in Anemia on growth of larval Japanese flounder
(Paralichthys olivaceus). Aquaculture, 150:73-82.
Izquierdo, M.S. (1996) Essential fatty acid requirements of cultured marine fish larvae.
In: Gajardo, G., Coutteau, P. (Eds) Improvement of the Commercial Production
of Marine Aquaculture Species Proceedings of a Workshop on Fish and Mollusc
Larviculture, Impresora Creces, Santiago, Chile. pp. 31–44.
Izquierdo, M.S., Robaina, L., Juárez, E., Oliva, R., Hernández-Cruz, C.M. and Afonso,
J.M. (2008) Regulation of growth, fatty acid composition and delta 6 desaturase
expression by dietary lipids in gilthead seabream larvae (Sparus aurata). Fish
Physiol Biochem, 34:117-127.
Izquierdo, M.S., Montero, D., Robaina, L., Caballero, M.J., Rosenlund, G. and Gines,
R. (2005) Alterations in fillet fatty acid profile and flesh quality in gilthead sea
bream (Sparus aurata) fed vegetable oils for a long term period. Recovery of
fatty acid profiles by fish oil feeding. Aquaculture, 250:431-444.
Izquierdo, M.S., Obach, A., Arantzamendi, L., Montero, D., Robaina, L. and
Rosenlund, G. (2003) Dietary lipid sources for sea bream and seabass: growth
performance, tissue composition and flesh quality. Aquaculture Nutrition,
9:397-407.
Izquierdo, M.S., Socorro, J., Arantzamendi, L. and Hernández-Cruz, C.M (2000) Recent
advances in lipid nutrition in fish larvae. Fish Physiol Biochem, 22:97-107.
Izquierdo, M.S., Watanabe, T., Takeuchi, T., Arakawa, T. and Kitajima, C. (1989)
Requirement of larval red sea bream Pagrus major for essential fatty acids.
Nippon Suisan Gakkaishi, 55:859-867.
Jutfelt, F., Olsen, R.E., Björnsson, B.T. and Sundell, K. (2007) Parr-smolt
transformation and dietary vegetable lipids affect intestinal nutrient uptake,
barrier function and plasma cortisol levels in Atlantic salmon. Aquaculture,
273:298-311.
Kanazawa, A. (1985) Essential fatty acid and lipid requirement of fish. In: Cowey C. B.
Mackie A. M. Bell J. G. (Eds.) Nutrition and Feeding in Fish, 1985:281-298.
Kanazawa, A. (1997) Effects of docosahexaenoic acid and phospholipids on stress
tolerance of fish. Aquaculture, 155:129-134.

Chapter 1 General Introduction
30
Kaushik, S.J. (1990) Use of alternative protein sources for the intensive rearing
carnivorous fishes. In: Flos, R., Tort, L. and Torres, P., Editors, 1990.
Mediterranean Aquaculture, Ellis Horwood, UK, pp. 125-138.
Kelley, D.S. and Daudu, P.A. (1993) Fat intake and immune response. Prog Food Nutr
Sci, 17:41-63.
Kinsella, J.E. and Lokesh, B. (1990) Dietary lipids, eicosanoids and the immune
system. Care Med, 18S:94-113.
Kinsella, J.E., Lokesh, B., Broughton, S. and Whelan, J. (1990) Dietary polyunsaturated
fatty acids and eicosanoids: Potential effects on the modulation inflammatory an
immune cells: An overview. Nutrition, 6:24-44.
Kiron, V., Fukuda, H., Takeuchi, T. and Watanabe, T. (1995a) Essential fatty acid
nutrition and defence mechanisms in rainbow trout Oncorhynchus mykiss. Comp
Biochem Physiol, 111A:361-367.
Kiron, V., Fukuda, H., Okamoto, N. and Takeuchi, T. (1995b) Protein nutrition and
defence mechanisms in rainbow trout Oncorhynchus mykiss. Comp Biochem
Physiol, 111A:351-359.
Klinger, R.C., Blazer, V.S. and Echevarria, C. (1996) Effects of dietary lipid on the
hematology of channel catfish, Ictalurus punctatus. Aquaculture, 147:225-233.
Kocsis, J.F., Rinkardt, N.E., Satterlee, D.G., Weber, H. and Carsia, R.V. (1999)
Concentration-dependent, biphasic effect of prostaglandins on avian
coticosteroidogenesis in vitro. General and Comparative
Endocrinology, 115:132-142.
Koven, W., Barr, Y., Lutzky, S., Ben-Atia, I., Weiss, R., Harel, M., Behrens, P. and
Tandler, A. (2001a) The effect of dietary arachidonic acid (20:4n−6) on growth,
survival and resistance to handling stress in gilthead sea bream (Sparus aurata)
larvae. Aquaculture, 193:107-122.
Koven, W., Van Anholt, R., Lutzky, S., Ben-Atia, I., Gamsiz, K., Weiss, R. and
Tandler, R. (2001b) The importance of arachidonic acid, as a modulator of stress
resistance through the hypothalamus–pituitary–interrenal axis, in different aged
gilthead sea bream larvae. In: Hendry, C.I., Van Stappen, G., Wille, M.,
Sorgeloos, P. (Eds) Larvi 01—Fish and Shellfish Larviculture Symposium
European Aquaculture Society, Special Publication 30, Oostende, Belgium. pp.
292–293.
Koven, W.M., Van Anholt, R.D., Lutzky, S., Ben Atia, I., Nixon, O., Ron, B. and

Chapter 1 General Introduction
31
Tandler, A. (2003) The effect of dietary arachidonic acid on growth, survival,
and cortisol levels in different-age gilthead sea bream larvae (Sparus aurata)
exposed to handling or daily salinity change. Aquaculture, 228:307–320.
Lall, S.P. (1998) Dietary lipids, immune function and pathogenesis of disease in fish.
The Eight International Symposium of Feeding and Nutrition in Fish, 1-4 June
1998, Las Palmas de Gran Canaria, Spain, p.169.
Liu, J., Caballero, M.J., Izquierdo, M.S., El-Sayed Ali, T., Hernández-Cruz, C.M.,
Valencia, A. and Fernández-Palacios, H. (2002) Necessity of dietary lecithin and
eicosapentaenoic acid for growth, survival, stress resistance and lipoprotein
formation in gilthead sea bream Sparus aurata. Fish Sci, 68:1165-1172.
MacKenzie, D.J. (2001) Effects of dietary fatty acids on the respiratory and
cardiovascular physiology of fish. Comp Biochem Physiol, 128:605-619.
MacKenzie, S., Iliev, D., Liarte, C., Koskinen, H., Planas, J.V., Goetz, F.W., Molsa, H.,
Krasnov, A. and Tort, L. (2006) Transcriptional analysis of LPS-stimulated
activation of trout (Oncorhynchus mykiss) monocyte/macrophage cells in
primary culture treated with cortisol. Mol Immunol, 43:1340–1348.
Mancera, J.M., Perez-Figares, J. and Fernández-Llebrez, P. (1994) Effect of cortisol on
brackish water adaptation in the euryhaline gilthead sea bream (Sparus aurata
L.). Comp Biochem Physiol, 107A:397-402.
Martins, T.G., Cavalli, R.O., Martino, R.C., Rezende, C.E.M. and Wasielesky, W.
(2006) Larviculture output and stress tolerance of Farfantepenaeus paulensis
postlarvae fed Artemia containing different fatty acids. Aquaculture, 252:525-
533.
Mazeaud, M.M., Mazeaud, F. and Donaldson, E.M. (1977) Primary and secondary
effects of stress in fish: some new data with a general review. Trans Am Fish
Soc, 106:1-212.
McCormick, S.D., Regish, A., O’Dea, M.F. and Shrimpton, J.M. (2008) Are we missing
a mineralocorticoid in teleost fish? Effects of cortisol, deoxycorticosterone and
aldosterone on osmoregulation, gill Na+, K+-ATPase activity and isoform
mRNA levels in Atlantic salmon. Gen Comp Endocrinol, 157:35-40.
McDonald, G. and Milligan, L. (1997) Ionic, osmotic and acid–base regulation in stress.
In: Iwama, G.J., Pickering, A.D., Sumpter, J.P., Schreck, C.B. (Eds) Fish stress
and Health in Aquaculture, University Press, Cambridge. pp. 119-144.
Menoyo, D., Izquierdo, M.S., Robaina, L., Ginés, R., López-Bote, C.J. and Bautista,

Chapter 1 General Introduction
32
J.M. (2004) Adaptation of lipid metabolism, tissue composition and flesh quality
in gilthead sea bream (Sparus aurata) to the replacement of dietary fish oil by
linseed and soybean oils. Br J Nutr, 92:41-52.
Mesa, M.G. (1994) Effects of multiple acute stressors on the predator avoidance ability
and physiology of juvenile chinook salmon. Transactions of the American
Fisheries Society, 123:786-793.
Milewski, I. (2002) Impacts of salmon aquaculture on the coastal environment: a
review. Conservation Council of New Brunswick. Available in:
http://conservationcouncil.ca/. 33 pp.
Miller, W.L. (1988) Molecular biology of steroid hormone synthesis. Endocrine
Reviews, 9:295-318.
Miller, W.L., Auchus, R.J. and Geller, D.H. (1997) The regulation of 17,20 lyase
activity. Steroids, 62:133-142.
Mommsen, T.P., Vijayan, M.M. and Moon, T.W. (1999) Cortisol in teleosts: dynamics,
mechanisms of action, and metabolic regulation. Rev Fish Biol Fish, 9:211-268.
Montero, D., Tort, L., Izquierdo, M.S., Robaina, L. and Vergara, J.M. (1998) Depletion
of serum alternative complement pathway activity in gilthead sea bream caused
by alpha-tocopherol and n-3 HUFA dietary deficiencies. Fish Physiol Biochem,
18:399-407.
Montero, D., Robaina, L., Socorro, J., Vergara, J.M., Tort, L. and Izquierdo, M.S.
(2001) Alteration of liver and muscle fatty acid composition in gilthead
seabream (Sparus aurata) juveniles held at high stocking density and fed an
essential fatty acid deficient diet. Fish Physiol Biochem, 24:63-72.
Montero, D., Kalinowski, T., Obach, A., Robaina, L., Tort, L., Caballero, M.J. and
Izquierdo, M.S. (2003) Vegetable lipid sources for gilthead seabream (Sparus
aurata): Effects on fish health. Aquaculture, 225:353-370.
Morrow, M.D., Higgs, D. and Kennedy, C.J. (2004) The effects of diet composition and
ration on biotransformation enzymes and stress parameters in rainbow trout,
Oncorhynchus mykiss. Comp Biochem Physiol, 137C:143-154.
Mourente, G. and Bell, J.G. (2006) Partial replacement of dietary fish oil with blends of
vegetable oils (rapeseed, linseed and palm oils) in diets for European sea bass
(Dicentrarchus labrax L.) over the whole production cycle: effects on flesh and
liver fatty acid composition and effectiveness of a fish oil finishing diet. Comp
Biochem Physiol, 145B:389-399.

Chapter 1 General Introduction
33
Nandi, J. (1962) The structure of the interregnal gland in teleost fishes. Univ Calif Publ
Zool, 65:129-212.
Naylor, R. (2004) Threats to aquatic environments: is aquaculture a solution? In: A.G.
Brown (Ed) Fish, Aquaculture and Food Security: Sustaining Fish as a Food
Supply. Record of a conference conducted by the ATSE Crawford Fund,
Parliament House Canberra. pp. 33-40.
New, M.B. (2002) Marine ingredients: challenges to their use in aqua feeds. Aqua
challenge: Workshop devoted to Aquaculture Challenges in Asia in response to
the Bangkok Declaration on Sustainable Aquaculture, Beijing, April pp. 27-30.
O’Mara, C.J. (1998) U.S. oil seed industry looks at trade issues. Inform, 9:132-136.
Ortuño, J., Esteban, M.A. and Meeguer, J. (2002) Effects of four anaesthetics on the
innate immune response of gilthead sea bream (Sparus aurata L.). Fish &
Shellfish Immunology, 12:49-59.
Palacios, E., Bonilla, A., Perez, A., Racotta, I.S. and Civera, R. (2004) Influence of
highly unsaturated fatty acids on the response of white shrimp (Litopenaeus
vannamei) postlarvae to low salinity. J Exp Mar Biol Ecol, 299:201-215.
Pankhurst, N.W. and Van Der Kraak, G. (1997) Effects of stress on reproduction and
growth of fish: In: Iwama, G.K., Pickering, A.D., Sumpter, J.P., Schreck, C.B
(Eds). Fish Stress and Health in Aquaculture. Cambridge Univ. Press,
Cambridge, UK. pp.73-79.
Patiño, R., Bradford, C.S. and Schreck, C.B. (1986) Adenylate cyclase activators and
inhibitors, cyclic nucleotide analogs, and phosphatidylinositol: Effects on
interrenal function of coho salmon (Oncorhynchus kisutch) in vitro. Gen Comp
Endocrinol, 63:230-235.
Person-Le Ruyet, J., Skalli, A., Dulau, B., Le Bayon, N., Le Delliou, H. and Robin, J.H.
(2004) Does dietary n-3 highly unsaturated fatty acids level influence the
European sea bass (Dicentrarchus labrax) capacity to adapt to a high
temperature? Aquaculture, 242:571-588.
Pottinger, T.G., Balm, P.H.M. and Pickering, A.D. (1995) Sexual maturity modifies the
responsiveness of the pituitary–interrenal axis to stress in male rainbow trout.
Gen Comp Endocrinol, 98:311-320.
Pottinger, T., Prunet, P. and Pickering, A. (1992) The effects of confinement stress on
circulating prolactin levels in rainbow trout (Oncorhynchus mykiss) in fresh
water. General and Comparative Endocrinology, 88:454-460.

Chapter 1 General Introduction
34
Prunet, P., Sturm, A. and Milla, S. (2006) Multiple corticosteroid receptors in fish:
From old ideas to new concepts. Gen Comp Endocrinol, 147:17-23.
Randall, D.J. and Perry, S.F. (1992) Catecholamines. In: Hoar, W.S., Randall, D.J.,
Farrell, A.P. (Eds) Fish Physiology. Academic Press, San Diego, CA. XIIB:
255-300.
Redding, J.M., Patino, R. and Schreck, C.B. (1991). Cortisol effects on plasma
electrolytes and thyroid hormones during smoltification in coho salmon
(Oncorhynchus kisutch). Gen Comp Endocrinol, 81:373-382.
Reid, S.G., Vijayan, M.M. and Perry, S.F. (1996) Modulation of catecholamine storage
and release by cortisol and ACTH in the rainbow trout, Oncorhynchus mykiss. J
Comp Physiol B, 165:665-676.
Rotllant, J., Balm, P.H.M., Ruane, N.M., Pérez-Sánchez, J., Wendelaar Bonga, S.E. and
Tort, L. (2000a) Pituitary proopiomelanocortin-derived peptides and
hypothalamic-pituitary-interrenal axis activity in gilthead sea bream (Sparus
aurata) during prolonged crowding stress: differential regulation of
adrenocorticotropin hormone and melanocyte-stimulating hormone release by
corticotrophin-releasing hormone and thyrotropin-releasing hormone. General
and Comparative Endocrinology, 119:152-163.
Rotllant, J., Balm, P.H.M., Wendelaar Bonga, S.E., Pérez-Sánchez, J. and Tort, L.
(2000b) A drop in ambient temperature results in a transient reduction of
interrenal ACTH responsiveness in the gilthead sea bream (Sparus
aurata L.). Fish Physiology and Biochemistry, 23:265-273.
Rowley, A.F., Knight, J., Lloyd-Evans, P., Holland, J.W. and Vickers, P.J. (1995)
Eicosanoids and their role in immune modulation in fish – a brief overview. Fish
& Shellfish Immun, 5:549-567.
Ruane, N.M. (2002) Stress and stress disorders in a teleost fish, the common carp
Cyprinus carpio L. PhD thesis, Fish Culture & Fisheries Group, Wageningen
Institute of Animal Sciences, Wageningen University, PO Box 338, 6700 AH
Wageningen, The Netherlands. ISBN: 90-5808-748-4. 1-160 pp.
Salte, R., Thomassen, M.S. and Wold, K. (1988). Do high levels of dietary
polyunsaturated fatty acids (EPA/DHA) prevent diseases associated with
membrane degeneration in farmed Atlantic salmon at low water temperatures?
Bulletin of the European Association of Fish Pathology, 8:63-65.
Samuelson, B. (1983) Leukotrienes: mediators of immediate hypersensitivity and

Chapter 1 General Introduction
35
inflammation. Science, 20:568-575.
Sargent, J.R., Bell, M.V. and Bell, J.G. (1995) Origins and functions of n-3
polyunsaturated fatty acids in marine organisms. In: Ceve G., Paltauf, F., (Eds)
Phospholipid Characterisation, Metabolism and Novel
Biological Applications—Champaign, IL: American Oil Society Press. pp. 248-
259.
Sargent, J.R., Tocher, D.R. and Bell, J.G. (2002) The Lipids. In: Halver, J. E. and
Hardy, R.W. (Eds). Fish nutrition (3rd ed.) San Diego: Academic Press. pp.
182-257.
Sargent, J.R, McEvoy, L.A. and Bell, J.G. (1997) Requirements, presentation and
sources of polyunsaturated fatty acids in marine fish larval feeds. Aquaculture,
155:117-128.
Sargent, J.R. and Tacon, A.G.J. (1999) Development of farmed fish: a nutritionally
necessary alternative to meat. Proc Nutr Soc, 58:377-383.
Sargent, J.R., Bell, J.G., Bell, M.V., Henderson, R.J. and Tocher, D.R. (1993)
Aquaculture: Fundamental and Applied Research. In: Lahlou,B. and Vitiello, P.
(Eds) Coastal and Estuarine Studies 43, American Geophysical Union,
Washington, D.C. pp. 103-124.
Sargent, J.R., Henderson R.J. and Tocher, D.R. (1989) The lipids. In: Halver, J.
(Ed), Fish Nutrition (2nd ed.), Academic Press, London pp. 153-217.
Schimmer, B.P. (1995) The 1994 Upjohn Award Lecture. Molecular and genetic
approaches to the study of signal transduction in the adrenalcortex. Canadian
Journal of Physiology and Pharmacology, 73:1097-1107.
Schreck, C.B., Contreras-Sanchez, W. and Fitzpatrick, M.S. (2001) Effects of stress on
fish reproduction, gamete quality, and progeny. Aquaculture, 197(1-4):3-24.
Selye, H. (1975) Confusion and controversy in the stress field. J Hum Stress, 1(2):37-
44.
Selye, H. (1973) The evolution of the stress concept. American Scientist, 61(6):692-699.
Sheldon, W.M. and Blazer V.S. (1991) Influence of dietary lipid and temperature on
bactericidal activity of channel catfish macrophages. J Aquat Anim Health, 3:87-
93.
Simopoulos, A.P. (2000) Human requirement for N-3 polyunsaturated fatty acids.
Poultry Science, 78:961-970.
Simopoulos, A.P. (2008) Omega-3 Fatty acids, exercise, physical activity and athletics.

Chapter 1 General Introduction
36
World review of nutrition and dietetics, 98:23-50.
Small, B.C. (2004) Small, Effect of dietary cortisol administration on growth and
reproductive success of channel catfish. J Fish Biol, 64:589-596.
Staniford, D. (2002) Sea cage fish farming: an evaluation of environmental and public
health aspects (the five fundamental flaws of sea cage fish farming). European
Parliament’s Committee on Fisheries public hearing on Aquaculture in the
European Union: Present Situation and Future Prospects. p. 44.
Stanley, D.W. and Miller, J.S. (2006) Eicosanoid actions in insect cellular immune
functions. Entomol Exp Appl, 119:1-13.
Sturm, A., Bury, N., Dengreville, L., Fagart, J., Flouriot, G., Rafestin-Oblin, M. E. and
Prunet, P. (2005). 11-deoxycorticosterone is a potent agonist of the rainbow
trout (Oncorhynchus mykiss) mineralocorticoid receptor.
Endocrinology, 146:47-55.
Sui, L., Wille, M., Cheng, Y. and Sorgeloos, P. (2007) The effect of dietary n-3 HUFA
levels and DHA/EPA ratios on growth, survival and osmotic stress tolerance of
Chinese mitten crab Eriocheir sinensis larvae. Aquaculture, 273:139-150.
Tacon, A.G.J. and Metian, M. (2008) Aquaculture feed and food safety: the role of FAO
and Codex Alimentarius. Annals of New York Academy of Science, 1140:50-59.
Takashima, F. and Hibiya, T. (1995) An Atlas Of Fish Histology: Normal And
Pathological Features, 2nd Ed. Gustav Fischer Verlag, Sttutgart, New York. pp.
342-364.
Thompson, K.D., Tatner, M.F. and Henderson, R.J. (1996) Effects of dietary (n-3) and
(n-6) polyunsaturated fatty acid ratio on the immune response of Atlantic
salmon, Salmo salar L. Aquac Nutr, 2:21-31.
Tidwell, J.H. and Allan, G.L. (2002) Fish as food: aquaculture’s contribution. World
Aquacult Soc, 33:44-48.
Tocher D.R. and Ghioni, C. (1999) Fatty acid metabolism in marine fish: low activity of
fatty acyl D5 desaturation in gilthead sea bream (Sparus aurata) cells. Lipids,
34:433-440.
Tocher, D.R. (2003) Metabolism and functions of lipids and fatty acids in teleost fish.
Reviews in Fisheries Science, 11:107-184.
Tocher, D.R., Bell, J.G., Dick, J.R. and Crampton, V.O. (2003a) Effects of dietary
vegetable oil on Atlantic salmon hepatocyte fatty acid desaturation and liver
fatty acid compositions. Lipids, 38:723-732.

Chapter 1 General Introduction
37
Tocher, D.R., Bell, J.G., McGhee, F., Dick, J.R. and Fonseca-Madrigal, J. (2003b)
Effects of dietary lipid level and vegetable oil on fatty acid metabolism in
Atlantic salmon (Salmo salar - L.) over the whole production cycle. Fish
Physiol Biochem, 29:193-209.
Torstensen, B.E., Espe, M., Sanden, M., Stubhaug, I., Waagbø, Hemre, G.I.,
Fontanillas, R., Nordgarden, U., Hervøy, E.M., Olsvik, P. and Berntssen,
M.H.G. (2008) Novel production of Atlantic salmon (Salmo salar) protein based
on combined replacement of fish meal and fish oil with plant meal and vegetable
oil blends. Aquaculture, 285(1-4):193-200.
Torstensen, B.E., Bell, J.G., Rosenlund, G., Henderson, R.J., Graff, I.E., Tocher, D.R.,
Lie, Ø. and Sargent, J.R. (2005). Tailoring of Atlantic salmon (Salmo salar L.)
flesh lipid composition and sensory quality by replacing fish oil with a vegetable
oil blend. J Agric Fd Chem, 53:10166-10178.
Torstensen, B.E., Lie, O. and Froyland, L. (2000) Lipid metabolism and tissue
composition in Atlantic salmon (Salmo salar L.) - effects of capelin oil, palm
oil, and oleic acid-enriched sunflower oil as dietary lipid sources. Lipids,
35:653-664.
Tort, L., Sunyer, J.O., Gómez, E. and Molinero, A. (1996) Crowding stress induces
changes in serum hemolytic and agglutinating activity in the gilthead sea
bream Sparus aurata. Veterinary Immunology and Immunopathology, 51:179-
188
Tuncer, H., Harrell, R.M. and Chai, T. (1993) Beneficial effects of n-3HUFA enriched
Artemia as food for larval palmetto bass (Morone saxatilis × M. chrysops).
Aquaculture, 110:341-359.
Uhing, R.J., Cowlen, M.S. and Adams, D.O. (1990) Mechanisms regulating the
production of arachidonate metabolites in mononuclear phagocytes. Curr Top
Membr Transp, 35:349-374
Van Anholt, R.D., Spanings, F.A.T., Koven, W.M. and Wendelaar Bonga, S.E. (2004)
Dietary supplementation with arachidonic acid in tilapia (Oreochromis
mossambicus) reveals physiological effects not mediated by
prostaglandins. General and Comparative Endocrinology, 139:215-226.
Vergara, J.M., Robaina, L., Izquierdo, M. and De La Higuera, M. (1996) Protein
sparing effect of lipids in diets for fingerlings of gilthead sea bream. Fisheries
Science, 62(4):624-628.

Chapter 1 General Introduction
38
Vijayan, M.M. and Moon, T.W. (1992) Acute handling stress alters hepatic glycogen
metabolism in food deprived rainbow trout (Oncorhynchus mykiss). Can J Fish
Aquat Sci, 49:2260-2266.
Vijayan, M.M., Prunet, P. and Boone, A.N. (2005). Xenobiotic impact on corticosteroid
signaling. In: Moon, T. W., Mommsen, T.P. (Eds.) Biochemical and Molecular
Biology of Fishes, Vol. 6. Environmental Toxicology, pp. 365-394.
Waagbø, R., Hemre, J., Holm, J. and Lie, O. (1995) Tissue fatty acid composition,
haematology and immunity in adult cod, Gadus morhua L., fed three dietary
lipid sources. J Fish Dis, 13:615-622.
Waagbø, R., Sandnes, K., Torrissen, O.J., Sandvin, A. and Lie, Ø. (1993) Chemical and
sensory evaluation of fillets from Atlantic salmon (Salmo salar) fed three levels
of N-3 polyunsaturated fatty acids at two levels of vitamin E. Food Chem,
46:361-366.
Watanabe, T., Izquierdo, M.S., Takeuchi, T., Satoh, S. and Kitajima, C. (1989)
Comparison between eicosapentaenoic and docosahexaenoic acids in terms of
essential fatty acid efficacy in larval red sea bream. Nippon Suisan Gakkaishi,
55:1635-1640.
Wendelaar Bonga, S.E. (1997) The Stress Response in Fish. Physiological Reviews,
77(3):591-625.
Weyts, F.A.A., Verburg-van Kemenade, B.M.L. and Flik, G. (1998) Characterization of
glucocorticoid receptors in peripheral blood leukocytes of carp (Cyprinus carpio
L.). Gen Comp Endocrinol, 111:1-8.
Willey S., Bengtson D.A. and Harel M. (2003) Arachidonic acid requirements in larval
summer flounder, Paralichthys dentatus. Aquac Int, 11:131-149.
Willis, A.L. (1981) Nutritional and pharmacological factors in eicosanoid biology. Nutr
Rev, 39:289-301.
Yam, D., Eliraz, A. and Berry, E.M. (1996) Diet and disease, the Israeli paradox.
Possible dangers of a high omega-6 fat diet. Israeli Journal of Medical Science,
32:1134-1143.
Zheng, X., Ding, Z., Xu, Y., Monroig, O., Morais, S. and Tocher, D.R. (2009)
Physiological roles of fatty acyl desaturases and elongases in marine fish:
Characterisation of cDNAs of fatty acyl Δ6 desaturase and elovl5 elongase of
cobia (Rachycentron canadum). Aquaculture, 290:122-131.

Chapter 2
General Materials and Methods

Chapter 2 Materials & Methods
39
CHAPTER 2
GENERAL MATERIALS AND METHODS
Two main feeding experiments are included in this chapter, the first trial aimed
to replace fish oil in diets for gilthead seabream with vegetable oils, without
compromising the health, welfare and growth performance of the fish, this experiment
was a part of the EU project RAFOA (Researching Alternatives to Fish Oils in
Aquaculture) Q5RS-2000-30058. The second experiment was included in the Spanish
Ministry of Education funded project LINOSALUD (Efecto de la Sustitución parcial del
aceite de pescado por aceite de Lino en la dieta sobre la salud yla resistencia a estrés de
dorada (Saprus aurata)) (AGL2004-08151-CO3 02/ACU). In both trials fish were
grown from juveniles to market size on diets containing different ratios of FO to VO
with the latter being either rapeseed (RO), linseed (LO) or palm oils (PO) for a period of
281 days in the first trial, and LO and Soybean oil (SO) for a period of 240 days in the
second trial. The blend of oils was formulated to replicate the FO in terms of saturated,
monounsaturated and polyunsaturated fatty acid concentrations and ratios except there
would be none of the HUFA found in FO.
The two feeding trials were carried out at the Marine Culture facilities of the
Grupo de Investigación en Acuicultura (ULPGC & ICCM) (Spain). The prostaglandins
and leptins analysis were done in the Fish Nutrition Department facilities, Institute of
Aquaculture, University of Stirling (Scotland). Part of the in vitro experiments, and all
the cortisol analysis were conducted in the facilities of Department of Cell Biology,
Physiology and Immunology, Universitat Autonòma de Barcelona, Bellaterra, Spain.
2.1. Experimental conditions
All the fish juveniles used in this thesis were provided by a local fish farm
(Alevines y Doradas, S.A.: ADSA, Las Palmas, Spain), maintained for 4 weeks of
acclimatising in 1000 l (Figure 2.1) tanks and distributed in 500 l experimental tanks
(Figure 2.2).

Chapter 2 Materials & Methods
40
Figure 2.1: A 1000 l acclimatization tank
Cynlinder conical tanks with a total volume of 500l are settled in pairs and
separated by a central drainage channel. Tanks have a diameter of 1.5 m and depth of
1.0 m in the central part (Figure 2.2). Water inlet is located on the tank bottom and
water outlet is located near the drop of the tank in the later side. Both inlet and lateral
water outlet can be modified with different movable accessories, throughout the culture
period according to the feeding sequence.
Figure 2.2: A sample of the intensive 500l rearing tank

Chapter 2 Materials & Methods
41
2.2. Studied species
Gilthead sea bream (Sparus aurata Linnaeus, 1758) (Figure 2.3), is a teleost,
belonging to Sparidae family, which has a total of 11 dorsal spines, 13-14 of dorsal soft
rays, 3 of anal spines; 11-12 anal soft rays. It is characterised by a body tall, with large
black spot on the gill cover. This fish has a large distribution (Figure 2.4), as it is
present in eastern Atlantic (by British Isles), strait of Gibraltar to Cap Verde and around
the Canary Islands, and it is also present in the Mediterranean. Seabream could be found
in sea grass beds and sandy bottoms as well as in the surf zone commonly to depths of
about 30m, but adults may occur to 150 m depth. It is a sedentary fish, either solitary or
in small aggregations. In spring, they often occur in brakfish water coastal lagoons and
estuaries. It is a mainly carnivorous species, but accessorily herbivorous, which feeds on
shellfish, including mussels and oysters (Bauchot et al., 1990). This is one of the most
important fishes in saline and hypersaline aquaculture.
Figure 2.3: Adult gilthead seabream
Figure 2.4: Geographical distribution of gilthead seabream (Fish base, 2009)

Chapter 2 Materials & Methods
42
2.3 - Trial I: part of RAFOA project
2.3.1- Animals and diets
Two thousand four hundred juveniles sea bream of initial weight 24 g were
maintained at Instituto Canario de Ciencias Marinas (ICCM). Fish were distributed
randomly into 16, 1000 l, polyethylene circular tanks (150 fish / tank, each diet assayed
in quadruplicate) supplied with continuous seawater (36 %o) flow and aeration. Fish
were fed under natural photoperiod (approximately 12:12 l/d). Water temperature and
dissolved oxygen during the experimental period ranged between 21.88-22.41ºC and
5.5-7.2 ppm, respectively. Baseline samples for lipid composition comprising livers and
fillet samples from 10 juveniles of average weight approximately 24 g were collected
just before feeding the experimental diets. After two weeks of fish acclimation to the
experimental tanks and control diet, the experimental diets were hand-fed until apparent
satiation three times a day at 9:00, 12:00 and 15:00h, six days per week. All individual
fish in each tank were weighted once per month and the ration adjusted accordingly.
Feed intake was determined daily. Fifteen fish were sampled for biochemical
parameters were taken at the beginning and at the middle (98 days) of the experimental
period.
Four iso-energetic and iso-proteic experimental diets were formulated with a
constant lipid content of about 22%. Two different blends included at a 60 %
substitution of dietary fish oil in FO diet were used for sea bream (Table 1), 15:60:25 by
volume in diet 60LO and 40:40:20 by volume in diet 60RO, of rapeseed, linseed and
palm oils, respectively. A 100LO diet with 100% substitution of fish oil by the blend in
diet 60LO was also included. The diets were prepared and delivered by Nutreco ARC.
The lipid and fatty acid composition of 5 mm grain size diet were analysed and are
shown in Tables 2. The control diet contained more saturates, DHA, EPA and ARA
than the other diets, with diet 100LO containing the lower levels of these fatty acids.
Whereas, diet 60LO and 60RO (with 60 % of substitution) had medium levels of EPA,
DHA and ARA, but diet 60RO was higher in monoenoic fatty acids and lower in n-3
(lower in 18:3n-3 and higher in 18:2n-6) to compare the difference in the n-9 & n-3
fatty acids utilization by sea bream, subsequently n-3/n-6 ratio lower than in diet 60LO.
Diet 100LO was lowest in EPA, DHA and ARA and highest in 18:2n-6 and monoenoic
(oleic acid).

Chapter 2 Materials & Methods
43
Conversion index (CI), specific growth rate (SGR) and hepatosomatic index
(HSI) were calculated according to the following formulas:
CI= Feed Intake/ Weight Gain
SGR= ((Ln Final Weight- Ln Initial Weight/ t))*100
With t= experimental period (days)
HIS= Liver weight/ total weight
Table 2.1: The types and % of oils in the experimental diets
FO 60 LO 60 RO 100 LO
Fish oil 100 40 40 -
Rapeseed oil - 10 24 17
Linseed oil - 35 24 58
Palm oil - 15 12 25

Chapter 2 Materials & Methods
44
Table 2.2: Main fatty acids of the different experimental diets (g/100 g fatty acid) (5mm)
FO 60LO 60RO 100LO
% Lipids (d.w) 20.24 21.36 22.79 25.14
14:0 5.92 3.05 2.93 0.79
15:0 0.50 0.28 0.24 0.08
16:0 19.30 14.99 15.95 15.92
16:1n-7 7.21 3.93 3.23 1.23
16:2n-6 - - - -
17:0 0.26 0.15 0.13 0.02
16:4n-3 0.17 0.04 0.03 0.02
18:0 3.37 3.21 3.36 3.40
18:1n-9 11.71 24.61 29.89 32.98
18:2n-6 5.84 11.87 12.50 13.67
18:3n-6 0.07 0.10 0.08 -
18:4n-6 0.17 0.03 0.03 -
18:3n-3 1.62 14.36 12.25 23.02
18:4n-3 2.18 1.28 0.87 0.17
20:0 0.21 0.24 0.32 0.23
20:1n-9 2.38 2.05 1.98 2.23
20:1n-7 - - - -
20:2n-6 0.15 0.10 0.08 0.03
20:4n-6 0.66 0.34 0.28 0.06
20:4n-3 0.54 0.27 0.21 0.05
20:3n-3 0.08 0.05 0.04 0.02
20:5n-3 11.90 6.10 4.86 1.06
22:0 0.08 0.10 0.24 0.13
22:1n-11 2.98 2.35 2.20 2.41
22:1n-7 - 0.02 - -
22:4n-6 0.18 - 0.03 0.01
22:5n-6 0.24 0.12 0.11 -
22:4n-3 - - 0.03 0.02
22:5n-3 1.17 0.56 0.47 0.08
22:6n-3 14.14 7.36 3.21 2.10
Saturated 30.01 22.22 23.33 20.63
Monoenoics 27.70 33.12 37.44 38.85
Σ n-3 32.23 30.27 25.22 26.57
Σ n-6 7.37 12.59 13.13 13.78
Σ n-9 14.56 26.81 31.91 35.22
Σ n-3 HUFA 27.84 14.34 11.82 3.33
n-3/n-6 4.37 2.40 1.92 1.93

Chapter 2 Materials & Methods
45
2.3.2. Sampling procedure
At the end of the feeding trial, day 281, fish were individually sampled from
each tank. Blood was collected from caudal veins in heparinised syringes from 6 fish
per each tank (18 fish per diet) and transferred to an eppendorf tube coated with lithium
heparin as an anticoagulant. The blood was centrifuged immediately at 3000 rpm for 10
min to sediment the cells. One millilitre of plasma was removed, 50 µl/ml of 2 M formic
acid was added and the acidified samples were frozen in liquid nitrogen (-80 °C) before
the eicosanoids analysis. 250 µl of plasma were removed and stored at -80 °C for leptin
analysis and the remainder plasma was pooled per each tank and stored at -80 °C for
fatty acid analysis.
Blood leukocytes separation was conducted on only 3 dietary treatments as
sufficient fish fed 100 LO diet were not available. Seven millilitres of blood was
collected from the caudal vein in heparinised syringes from 9 fish per diet and
transferred to clean glass tubes kept on ice. Blood was then centrifuged at 500 g for 10
min at 4 ºC. After elimination of supernatant cells were resuspended in 10 ml of HBSS
Ca–Mg-free and then centrifuged at 500 g for 10 min at 4 ºC. Cells were separated into
2 sub-samples which were resuspended in 6 ml of HBSS Ca–Mg-free, and carefully
layered over 6 ml of 46% Percoll and centrifuged at 450 g for 40 min at 4 ºC. The
leukocytes (white intermediate layer) were collected and washed with 10 ml of HBSS
Ca–Mg free. The leukocytes obtained from 3 fish were pooled and resuspended in 4 ml
of HBSS, 2 ml of chloroform were added and the sample was stored at -80 ºC prior to
lipid extraction.
2.3.3. Lipids extraction and analysis
Extraction of total lipid from plasma samples, diets and leukocytes was
performed by the method of Folch et al (1957) using a mixture of chloroform: methanol
(2:1)(v:v) containing 0.01% BHT, as an antioxidant, and KCl (0.88 %); 300 µl of
pooled plasma were used. Vigorous vortex mixer followed by centrifugation to assist
separation of chloroform and aqueous layers extracted the lipids from plasma, diet and
leukocytes samples. The lower layers is filtered through Whatman filter paper and dried
under a flow of nitrogen, total lipids were weighted. Neutral and polar fractions were
separated by adsorption chromatography on silica cartridges Sep-pak, (Waters, Milford,
MA) as described by Juaneda and Rocquelin (1985).

Chapter 2 Materials & Methods
46
Fatty acid methyl esters were produced from aliquots of total lipids extracted
from diet and plasma samples by acid-catalyzed transmethylation performed overnight
at 50°C as described by Christie (1982). Fatty acids methyl esters were separated and
quantified by Gas-chromatography (Shimadzu C-R5A, 30m*0,32mm Silice column
with Supleco-10) according to conditions described by (Izquierdo et al., 1990).
Individual methyl esters were identified by comparison with known standards and
published data.
2.3.4. Extraction, separation and enzyme immunoassay of PGE isomers
a. Purification of eicosanoids
The frozen plasma for eicosanoids analysis was thawed and centrifuged at 1000
x g for 5min to precipitate the debris. The supernatants were extracted using octadecyl
silyl (C18) “Sep-Pak” mini-columns (Millipor (UK), Watford) as described in detail by
Bell et al (1994). 200 µl of supernatants was applied to the column, which had been pre-
washed with 5 ml methanol and 10 ml distilled water. The column was washed
successively with 10 ml distilled water, 5 ml of 15% (v/v) ethanol and 5 ml
hexane/chloroform (65:35, v/v) before elution of prostanoids with 10 ml of ethyl
acetate. This extract was dried under nitrogen and resuspended in 100 µl methanol and
stored in a small glass vial in the deep-freezer (- 4 ºC) before analyzing by
immunoassay.
b. Separation of PGE3 by HPLC
PGE3 was separated by reverse-phase HPLC using a Spherisorb 5 µm C18
(ODS2) column. The chromatographic system was equipped with Waters Model M-45
pumps and Waters 680 monitored at 196 nm using a Pye-Unicam LC-UV detector to
determine elution of prostaglandin standards. An isocratic solvent system was used
containing 17 mM phosphoric acid/acetonitrile (70:30, v/v) at a flow of 0,75ml/min.
The remaining 50 µl of purified eicosanoids from plasma extract was injected to the
column and 2.25 ml fractions were collected using an LKB 2112 “Redirac”. Fractions
corresponding to PGE3 were applied to a C18 “Sep-Pak” which had been-prewashed as
described above, and the prostaglandin eluted in 5 ml ethyl acetate. Samples were dried
under nitrogen and redissolved in 100 µl of immunoassay buffer. Measurement of PGE3
was performed using enzyme immunoassay (EIA) kits for PGE2 according to the same
protocol described above (SPI-bio, Gif sur Yvette, France). The specificity of the kit

Chapter 2 Materials & Methods
47
antibodies used in this immunoassay with PGE2 is 100% but it is only 43% with PGE3,
which is counted when calculating results.
c. Prostaglandins E2 and E3 immunoassay
For prostaglandins E2: 50 µl of the methanol extract were taken, dried under
nitrogen and re-dissolved in 500 µl of EIA buffer and stored in the fridge ( 4°C). This
assay is based on the competition between PGE2 and a PGE2-acetylcholinesterase
(AchE) conjugated PGE2 (tracer) for a limited amount of PGE2 monoclonal antibody.
Because the concentration of PGE2 tracer is constant while the concentration of PGE2
varies depending on the sample, the amount of PGE2 tracer that is able to bind to PGE2
monoclonal antibody is inversely-proportional to the concentration of PGE2 in the well.
This antibody PGE2 complex binds to goat polyclonal anti-mouse IgG that has been
previously attached to the well. The plate is washed to remove any unbound reagents
and then Ellman’s Reagent (which contains the substrate to AchE) is added to the well.
The product of this enzymatic reaction has distinct yellow color and absorbs strongly at
412 nm. The intensity of this color, determined spectrometrically, is proportional to the
amount of PGE2 tracer bound to the well, which is inversely proportional to the amount
of free PGE2 present in well during the incubation. All assay-specific reagents were
prepared before starting the assay.
• EIA Buffer: Diluting the contents of the vial of EIA Buffer Concentrate with 90
ml of UltraPure water.
• Wash Buffer: Diluting the content of Wash Buffer Concentrate 1:400 with
UltraPure water and adding Tween (0.5ml/liter of Wash Buffer).
• Prostaglandin E2 standard: The concentrate of The PGE2 standard (10 ng) is
reconstituted with 1ml of EIA Buffer. Eight clean tubes (#1-8) were prepared;
360 µl EIA Buffer to tube #1 and 200 µl EIA Buffer to tubes # 2-8. 40 µl of the
bulk standard (10 ng/ml) is transferred to the tube # 1 and mix thoroughly.
Serially, the standard was diluted by removing 200 µl from # 1 and placing in
tube # 2, mixing. Next, removing 200 µl from tube 2 to tube # 3, mixing. The
process was repeated for tubes # 3-8. These diluted standards should not be
stored for more than 24 hours.
• Prostaglandin E2 AchE: The concentrate is diluted with 6 ml EIA Buffer, The
tracer dye is added at a final dilution of 1:100.

Chapter 2 Materials & Methods
48
• Prostaglandin E2 Monoclonal Antibody: The concentrate is diluted with 6 ml
EIA, the dye to the reconstituted antiserum is added at a final dilution of 1:100.
Once the immunoassay kits was opened, each plat contained eight Blanks (Blk), one
non-specific bindings wells (NSB), one maximum binding wells (B0), and eight point
standard curve (S1-S8). A test with different samples dilutions was run to choose the
best (80 µl).
Pipetting the reagents: different tips are used to pipet the buffer, standard, sample,
tracer, and antibody.
1. EIA Buffer: 100 µl EIA buffer were added to non-specific Binding (NSB) wells
and 50 µl to maximum binding (B0) wells.
2. Prostaglandin E2 Standard: 50 µl from tube # 8 to the lowest standar well (S8).
50 µl from tube # 7 were added to the next standard well (S7). The same
procedure was used until all standards were aliquoted.
3. Samples: 80 µl of sample were added per well.
4. Prostaglandin E2 AchE Tracer: 50 µl were added to each well except the Blank
(Blk) wells.
5. Prostaglandin E2 Monoclonal Antibody: 50 µl were added to each well except
the Non Specific Binding (NSB), and the Blank (Blk) wells.
6. The plate was covered with plastic film and incubated for 18 hours at 4°C which
increase the sensitivity of the assay.
7. Developing the plate: Before developing the plate, Ellman’s Reagent is
reconstituted with 20 ml of ultrapure water. This should be prepared and used
the same day it is prepared, and protected from light when not in use. The wells
were emptied and rinsed five times with Wash Buffer. 200 µl of Ellman’s
Reagent were added to each well and 5 µl of tracer to the Total Activity wells.
The plate is covered with plastic film and developed by using an orbital shaker
and dark during 75 min.
8. Reading the plate: Is accomplished at a wavelength between 405.
9. Calculating the results: The results were calculated manualy as follows:
• Average the absorbace readings from Blk wells.
• Substract average Blk from all the other wells.
• Substract NSB from all th other wells.
• Calculate %B/B0 (% Sample standard Bound/Maximum Bound) for the
remaining wells.

Chapter 2 Materials & Methods
49
• The standard curve is traced (%B/B0 with standard concentration on PGE2 en
pg/ml).
• The concentration of each sample in PGE2 is calculated.
2.3.5. Leptin immunoassay
a. Principle of the assay
This assay uses a cuantitative sandwich enzyme immunoassay technique. A
monoclonic antibody for leptin is applied to the plates. A monoclonal antibody (Human
leptin antibody) specific for leptin had been pre-coated onto a microplate. Standards and
samples are pipetted into the wells and any leptin present is bound by the immobilized
antibody. After washing away any unbound substances, an enzyme-linked monoclonal
antibody specific for leptin is added to the wells. Following a wash to remove any
unbound antibody-enzyme reagent, a substrate solution is added to the wells and color
develops in proportion to the amount of leptin bound in the initial step. The color
development is stopped and the intensity of the color is measured.
b. Reagents
• Leptin microplates: 96- well. Mircoplate of polystyrene (12 columns of 8 well)
with monoclínic antibody leptin.
• Leptin conjugate (Part 890574): 21 ml of antibody monoclonic against Leptin of
rate with preservatif.
• Leptin estandard (Part 890575): 10 ng of recombinant leptin human in buefferd
proteins with preservatif.
• Diluents Analysis RD1-19 (Part 895467): 11ml of buffered protein base with
preservatif.
• Calibrator diluente RD5P (5x) Concentrate (Part 895151): 21ml of solution
concentrate of buffered protein base with preservatif.
• Concentrate wash buffer (Part 895003): 21 ml of 25-fold concentrate of solution
buffered surfactant with preservatif.
• Dye reactivif A (part 895000): 12.5 ml of estabilized hyrdogen preoxidase.
• Dye reactif B (Part 895002): 12.5 ml de estabilized chromogen
(tetramethylbenzidine).
• Stop solution: 6 ml of 2 N Sulfiric acid.
c. Reagents preparation
All reagents are brought to the room temperature before the assay.

Chapter 2 Materials & Methods
50
• Wash Buffer: The concentrate vial is mixed gently and diluted into 1:25 with
deionized water. 500 ml of wash buffer were prepared.
• Substrate solution: Color reagent A and B were mixed together in equal volumes
and put in dark within 15 minutes before using.
• Calibrator Diluent RD5P (1X): the concentrat is diluted to 1:5. 100 ml were
prepared.
• Leptin standard: It is prepared 15 minutes before use. The concentrat is mixed
gently and diluted with 1 ml of deionized water. This reconstitution produces a
stock solution of 10.000 pg/ml. 8 tubes standard are prepared as expained above
(Prostaglandin standard).
d. Assay procedure
The frozen plasma were thawed and centrifuged at 1000 X g for 5 min to
precipitate the debris.
• 100 µl of assay diluent RD1-19 were added to each well.
• 100 µl of Standard are added to each stadanrd well.
• 100 µl of control were added to each well followed by 200 µl of Plasma sample.
Multi-channel pipette was used.
• The plate is covered and incubated for 2 hours at room temperature.
• All the wells were aspirated and washed with 400 µl of Wash buffer. This
process is repeated 4 times. At the last wash, the wells were bolted against clean
paper to remove any remaining wash buffer
• 200 µl of Leptin Conjugate were added to each well, the plate was covered with
new adhesive strip and incubated for 1 hour at room temperature.
• The wells were aspirated and washed as in step 5.
• 200 µl of Substrate Solution were added to each well and the plate was
incubated for 30 minutes at room temperature and protected from light.
• 50 µl of Stop Solution were added to each well.
• The plate is developped within 30 minutes in shaker and the optical density of
each well was determined using a microplate reader set to 450 nm.
• Calculation of results: The standard curve is drawn by ploting optical density for
the standards versus the concentration of the standards. The data is linearized
using a logaritmic transformation. The equation of standard curve is determined
and the final Leptin concentration in plasma is determined by simple application
of their absorbance in the standard curve equation.

Chapter 2 Materials & Methods
51
2.4. Trial II: Part of LINOSALUD project
2.4.1. Animals and Diets
Gilthead seabream (Sparus aurata) jnuveniles (45 g initial body weight) were
distributed in 45 tanks of 500l (50 fish/tank, each diet assayed in triplicate) supplied
with seawater at a temperature ranging from 20 ºC at the beginning of the experiment to
24.2 ºC at the end, and aeration. Tow thousand tow hundred fifty animals were used.
Eight iso-energetic and isonitrogenous diets with lipids content about 18 % were
formulated. Anchovy oil was the only added lipid source in Diet FO (fish oil). All the
other diets contained a blend of vegetable oils to substitute FO with different levels of
substitution as mentioned in the tables (2.3, 2.4, 2.5). The fatty acids composition of the
experimental diets total lipids is showed in Table 2.6. Fish were fed the experimental
diets until apparent satiation (3 times/day, 6 days/ week), until they reached the
commercial size after 26 weeks.
Feed intake was determined daily and all fish were individually weighed
monthly. CI and SGR were calculated following the formulas described above.
Mortalities were daily recorded and survival was monthly determined.
Table 2.3: Main ingredients contents of the experimental diets (in %)
% of dry weight
Oils (Fish oila/linseed/soybean)
South-american fish meal
Wheat
Soybean meal 47% b
Sunflower meal
Vitamins premixc
Minerals premixc
16.32
47.26
7.00
25.00
3.67
0.27
0.48
a South-american, anchovy oil.
b Soybean meal with 47% as a brut protein, “no GMO”
c Vitamin and mineral premixes prepared according to Proaqua A/S commercial standards

Chapter 2 Materials & Methods
52
Table 2.4: Vitamins and minerals contents of the experimental diets
Vitamins/ Minerals Units
1-Vitamins
A-Retinol
D3- Cholecalciferol
E- Tocopherol
C (Stay C)- Ascorbic acid
B1- Thiamin
B2- Riboflavin
B3- Nicotinic acid/Niacin
B5- Panthothenic acid
B6- Pyridoxin
B8- Biotin
B9- Folic acid
B12- Cyanocobalamin
K- Menadion
Inositol
2- Minerals
I
Zn
Fe
Cu
Mn
Mg
Co
Se
11200.0 IU/kg
112.0 IU/kg
280.0 mg/kg
336.0 mg/kg
9.0 mg/kg
15.7 mg/kg
179.2 mg/kg
31.4 mg/kg
13.4 mg/kg
0.5 mg/kg
4.5 mg/kg
0.036 mg/kg
6.7 mg/kg
44.8 mg/kg
4.5 mg/kg
44.8 mg/kg
67.2 mg/kg
3.6 mg/kg
14.6 mg/kg
136.1 mg/kg
0.2 mg/kg
0.06 mg/kg
Table 2.5: The types and % of oils in the experimental diets
FO 70L 100L 70S 100S 20L50S 50L20S 50L50S
FO 100 30 - 30 - 30 30
LO - 70 100 - - 20 50 50
SO - - - 70 100 50 20 50

Chapter 2 Materials & Methods
53
Table 2.6: Fatty acids profile of the experimental diets (% total identified fatty acids)
Fatty acids FO 70L 100L 70S 100S 20L50S 50L20S 50L50S
14:0 9.23 3.11 1.57 3.32 1.59 2.67 2.60 1.37
15:0 0.26 0.10 0.06 0.11 0.06 0.32 0.23 0.06
16:0ISO 0.11 0.04 0.03 0.05 0.03 0.01 0.06 0.03
16:0 22.21 12.19 10.21 15.84 13.69 15.46 12.16 11.75
16:1n-7 11.25 3.91 1.98 4.06 2.01 3.07 3.24 1.73
16:1n-5 0.38 0.14 0.09 0.16 0.09 0.07 0.10 0.08
16:2n-4 1.83 0.61 0.28 0.61 0.29 0.11 0.51 0.24
17:0 0.85 0.38 0.25 0.41 0.28 0.52 0.31 0.25
16:3n-4 2.00 0.66 0.29 0.67 0.31 0.59 0.54 0.24
16:3n-3 0.15 0.07 0.05 0.07 0.05 0.57 0.03 0.05
16:3n-1 0.12 0.05 0.04 0.06 0.04 0.07 0.07 0.03
16:4n-3 0.72 0.26 0.13 0.24 0.11 0.04 0.05 0.09
16:4n-1 - - - - - 0.25 0.29 -
18:0 3.85 3.96 3.99 3.43 3.20 10.20 3.49 3.74
18:1n-9 9.10 13.75 15.31 18.60 21.48 15.30 18.48 19.04
18:1n-7 3.16 1.57 1.36 2.15 1.77 1.15 1.37 1.36
18:1n-5 0.14 0.08 - 0.12 0.11 0.09 0.10 0.10
18:2n-6 4.06 12.38 16.21 29.93 38.51 22.25 18.50 27.25
18:2n-4 0.38 0.13 0.06 0.12 0.06 0.18 0.12 0.05
18:3n-6 0.36 0.13 - - 0.07 0.13 0.12 0.09
18:3n-4 0.04 - 0.04 0.18 0.09 0.70 0.12 0.05
18:3n-3 0.48 31.94 37.63 5.63 6.01 11.38 20.67 23.03
18:4n-3 1.94 0.76 0.40 0.73 0.40 0.06 0.75 0.36
18:4n-1 - - 0.03 - - - 0.08 -
20:0 0.28 0.21 0.19 0.28 0.28 0.72 0.26 0.24
20:1n-9 2.59 1.94 1.84 2.08 1.89 1.74 2.35 1.91
20:1n-7 0.26 0.13 0.09 0.13 0.10 0.11 0.15 0.09
20:2n-9 - 0.04 - 0.04 0.01 0.02 0.03 0.01
20:2n-6 0.19 0.11 0.08 0.11 0.09 0.10 0.04 0.08
20:3n-9 - - - - - 0.08 0.15 -
20:3n-6 0.25 0.09 0.04 0.06 0.03 0.08 0.08 0.03
20:4n-6 1.11 0.43 0.24 0.43 0.24 0.40 0.39 0.21
20:3n-3 - - 0.07 - - 0.06 0.08 -
20:4n-3 0.96 0.35 0.16 0.33 0.16 0.32 0.38 0.13
20:5n-3 10.05 4.00 2.07 3.77 2.06 3.85 3.99 1.73
22:1n-11 1.79 1.52 1.48 1.67 1.61 1.45 1.91 1.64
22:1n-9 - - 0.42 - - 0.33 0.52 -
22:4n-6 0.34 0.15 0.09 0.14 0.09 0.15 0.14 0.08
22:5n-6 - - - - - 0.64 0.75 -
22:5n-3 1.74 0.66 0.29 0.60 0.29 0.39 0.11 0.24
22:6n-3 7.82 4.16 2.92 3.87 2.91 4.35 4.69 2.63
Saturates 36.68 19.95 16.28 23.40 19.10 29.88 19.06 17.41
Monoenic 28.79 23.10 22.62 29.03 29.09 23.33 28.57 25.98
n-3 23.42 42.19 43.72 15.23 12.00 21.02 30.74 28.26
n-6 6.27 13.26 16.66 30.67 39.02 23.76 19.99 27.74
n-9 22.99 19.66 19.55 24.78 25.40 17.48 24.79 22.69
n-3 HUFA 20.57 9.17 5.50 8.57 5.42 8.97 9.24 4.73
n-3/n-6 3.74 3.18 2.62 0.50 0.31 0.88 1.54 1.02

Chapter 2 Materials & Methods
54
2.4.2. Sampling procedure
At the end of the feeding trial (after 26 weeks), 6 fish were individually sampled
from each tank. Fish were anaesthetized with 2-phenoxyethanol (1:1000 v/v), and blood
was collected from caudal veins in heparinised syringes from 6 fish per each tank (18
fish per diet) and transferred to an eppendorf tube coated with lithium heparin as an
anticoagulant. The blood was centrifuged immediately at 3000 rpm for 10 min to
sediment the cells, and the plasma was stored at -80ºC for basal cortisol analysis.
Samples of muscle, liver, gills and head kidney were stored at -80ºC for biochemical
analysis from all the dietary treatments.
2.4.3. Preparation and stimulation of head kidney tissue
At the end of the feeding period, 2 fish were randomly taken from each tank (6
per diet) in less than 1 minute, immediately anaesthetized with 2-phenoxyethanol
(1:1000 v/v) and blood collected with a hypodermic syringe from the caudal vein to
minimize the haemorrhage during the extraction of the tissue. HK tissue was removed
from two fish in each superfusion trial, and cut into very small fragments in Hepes
Ringer Medium, which was used as the superfusion medium. Afterwards, HK
homogenates were pooled and distributed in 8 superfusion chambers (volume: 0.2 ml)
in order to obtain an homogeneous aliquot in each of them. Tissues were superfused
with a Hepes (pH 7.4) Ringer’s solution containing 171 mM NaCl, 2 mM KCl, 2 mM
CaCl2H2O, 0.25 % (w/v) glucose, and 0.03 % (w/v) bovine serum albumin (Rotllant et
al., 2001). The system was temperature-controlled at 18 °C and superfusion medium
was pumped through the chamber at a rate of 75 µl/min by a Masterplex L/SR
multichannel peristaltic pump (Cole Parmer Intrument Co., Vernon Hills,
Illinois)(Rotllant et al., 2001).
Trials were started after 3 h of superfusion when cortisol reached stable baseline
levels (Rotllant et al. 2000a, b), in order to avoid deviations due to the different
dispersion of interrenal cells in the perfusion preparation and the individual differences
or the pre-stress level of each fish. After the stabilisation period of 3 h, tissues were
stimulated with ACTH at a concentration of 5 nM hACTH1-39 (Sigma) during 20 min.
Subsequently, perfusion was maintained for another 170 min, fraction samples being
collected every 20 min during this period. In a second series of experiments to clarify
the action mechanisms of HUFA and the implication of eicosanoids in this process,
tissues were incubated with a COX inhibitor (Indomethacin, INDO), or lipoxygenase

Chapter 2 Materials & Methods
55
(LOX) inhibitor (Nordihydroguaiaretic acid, NDGA) for 20 min at a concentration of 25
µM diluted in superfusion medium, and subsequently the tissues were stimulated with
ACTH as explained before and maintained for another 170 min collecting samples
every 20 min. In all series of experiments each treatment was assayed in quadruplicates.
Cortisol stimulation factor (SF) was calculated by comparison of maximum cortisol
released after ACTH stimulation with baseline cortisol released (maximum release-
baseline release)*100/(baseline release) (Rotllant et al., 2001).
2.4.4. Stress Panels
After the feeding period, 20 fish per tank were exposed to confinement stress.
Thus, fish were assigned in groups of up to 4 held placed into five floating small cage
(50x30x15cm) (Figure 2.5). 4 fish per tank were bled at the beginning of the tests and
considered as controls. The five cages, containing 4 fish each, were maintained in each
tank for different time intervals, consisting to encompass “early” and “late” response to
the stressor, based on primary and secondary stress responses of plasma cortisol. Thus,
after 2h one cage per tank was extracted carefully, opened and the fish blood was
sampled in less than 2 min of handling time, blood was obtained by caudal sinus
puncture with a 1 ml plastic syringe. Aliquots of blood samples were immediately
transferred to an Eppendorf tube coated with lithium heparin as anticoagulant. The
plasma was obtained by centrifugation at 3000 rpm for 10 min and stored at -80º C prior
to cortisol determination and the fish were liberated. The same procedure was repeated
after 5h, 24h, 48h and 1 week. This approach was taken to keep any acute disturbance to
remaining fish from fish removal as low as possible. Thus, total capture time was less
than 8 min per tank to minimize capture stress effects on analyzed parameters (Sumpter,
1997).

Chapter 2 Materials & Methods
56
Figure 2.5: A sample of cage used for stress panel tests.
2.4.5. Biochemical analysis
Dietary and fish tissues moisture, ash and protein were determined in triplicates
according to the Association of Official Analytical Chemists (AOAC) described
methods. Moisture was evaporated in an oven at 110 ºC until constant weight and the
difference from the initial weight was then calculated as before. The protein content was
calculated from the N content according to the Khedjal method. The sample was
distilled with NaOH at 40% in Kejeltek System 1003 distiller (Tecator, Höganäs,
Switzerland). Finally, the sample was validated with HCl (1 N) to measure N content
and protein content was calculated utilizing a nitrogen conversion factor of 6.75.
Extraction of total lipid from diets, fillets, liver, gills and head kidney was
performed by the method of Folch et al (1957) as explained in the experiment before.
2.4.6. Cortisol measurements
Cortisol concentration in the perfused fluid was determined by
radioimmunoassay (RIA) (Rotllant et al., 2001). The antibody, Biolink, S.L. (Costa
Mesa, California), was used in a final dilution of 1:6000. This antibody cross reactivity
is 100% with cortisol, 11.40% with 21-desoxycorticosterone, 8.90% with 11-
desoxycortisol and 1.60% with 17a-hydroxyprogesterone. The radioactivity was
quantified using a liquid scintillation counter. Cortisol levels are given as ng g-1
h-1
.

Chapter 2 Materials & Methods
57
2.5. Statistical analysis
Significance of difference (P<0.05) between dietary treatments was determined
by one-way analysis of variance (ANOVA) followed by Duncan multiple comparison
test (Sokal and Rolf, 1995). Analyses were performed using SPSS software (SPSS for
windows 13).
References
Adams, S.M. (1990) Status and use of biological indicators for evaluating the effects of
stress on fish. American Fisheries Society Symposium, 8:1-8.
Bauchot, M.L. and Hureau, J.C. (1990) Sparidae. P. 790-812. In Quero, J.C., Hureau,
J.C. Karrer, C., Post, A., Saldanha, L. (eds.).Check-list of the fishes of the
eastern tropical Atlantic (CLOFETA). JNICT, Lisbon; SEI, Paris; and
UNESCO, Paris. Vol. 2.
Bell, J.G., Tocher, D.R. and Sargent, J.R. (1994a) Effect of supplementation with 20: 3
(n-6), 20:4 (n-6) and 20:5 (n-3) on the production of prostaglandin E and F of
the 1-, 2- and 3-series in turbot (Scophthalmus maximus) brain astroglial cells in
primary culture. Biochim Biophys Acta, 1211:335-342.
Christie, W.W. (1982) Lipid analysis. Oxford: Pergamon Press.
Folch, J., Lees, M. and Sloane-Stanley, G.H. (1957) A simple method for the
isolation and purification of total lipids from animal tissues. J Biol Chem,
193:265-275.
Juaneda, P. and Rocquelin, G. (1985) Rapid and convenient separation of phospholipids
from rat heart using silica cartridges. Lipids, 20:40-41.
Izquierdo, M.S., Watanabe, T., Takeuchi, T., Arakawa, T. and Kitjima C. (1990)
Optimum EFA levels in artemia to meet EFA requirements of red seabream
(Pagrus major). In: Takeda, M., Watanabe, T. (Eds) The Current Status of Fish
Nutrition in Aquaculture. Tokyo: University. Fisheries. pp. 221-231.
Rotllant, J., Balm, P.H.M., Ruane, N.M., Pérez-Sánchez, J., Wendelaar Bonga, S.E. and
Tort, L. (2000a) Pituitary proopiomelanocortin-derived peptides and
hypothalamic-pituitary-interrenal axis activity in gilthead sea bream (Sparus
aurata) during prolonged crowding stress: differential regulation of
adrenocorticotropin hormone and melanocyte-stimulating hormone release by
corticotrophin-releasing hormone and thyrotropin-releasing hormone. General
and Comparative Endocrinology, 119:152-163.

Chapter 2 Materials & Methods
58
Rotllant, J., Balm, P.H.M., Wendelaar Bonga, S.E., Pérez-Sánchez, J. and Tort, L.
(2000b) A drop in ambient temperature results in a transient reduction of
interregnal ACTH responsiveness in the gilthead sea bream (Sparus aurata L.).
Fish Physiology and Biochemistry, 23:265-273.
Rotllant, J., Balm, P.H.M., Pérez-Sánchez, J., Wendelaar Bonga, S.E. and Tort, L.
(2001) Pituitary and interrenal function in gilthead sea bream (Sparus aurata L.,
Teleosteı´) after handling and confinement stress. General and Comparative
Endocrinology, 121:333-342.
Sokal, R.R. and Rolf, F.J. (1995) Biometry. The principles and practices of statistics in
biological research, 3nd ed, New York: W.H. Freeman.
Sumpter, J.P. (1997) The endocrinology of stress. In Iwama, G.K., Pickering, A.D.,
Sumpter, J.P. and Schreck, C.B. (eds.), Fish stress and health in aquaculture, pp.
95–118. Soc. Exp. Biol. Sem. Ser. 62, Cambridge Univ. Press, Cambridge, U.K.

Chapter 3
Effect of feeding seabream (Sparus aurata) with a blend of
soybean and linseed oil on growth, feed utilization and body
fatty acids composition
Rachid Ganga, Bell, J.G., Montero, D., Fernández-Vaquero, A.,
Atalah, E. and Izquierdo M.S.
To be submitted

Chapter 3 Growth, feed utilization and body fatty acids
59
Effect of feeding seabream (Sparus aurata) with a blend of soybean and linseed oil
on growth, feed utilization and body fatty acids composition
Rachid Ganga, Bell, J.G.1, Montero, D., Fernández-Vaquero, A.
2, Atalah, E. and
Izquierdo M.S.
Grupo de Investigación en Acuicultura (ULPGC & ICCM) P.O. Box 56. 35200. Telde,
Las Palmas. Canary Islands, Spain.
1Institute of Aquaculture, University of Stirling FK9 4LA, Scotland, UK. 2Biomar Iberia/ ProAqua Nutrition, S.A., A-62, Km, 99, ES-34210 Dueñas, Spain.
Abstract
Triplicate groups of gilthead seabream were fed eight practical-type diets in
which the added lipid was substituted with a blend of linseed oil (LO) and soybean oil
(SO) at different levels for a period of 26 weeks. Anchovy oil was the only lipid source
in the FO (fish oil) diet, whereas the other diets contained different levels of vegetable
oils, 70L (70% LO and 30 FO), 70S (70% SO and 30FO), 100L (100% as LO), 100S
(100% as SO), 50S20L (50% as SO, 20% as LO and 30% as FO), 20S50L (20% with
SO, 50% with LO and 30% with FO) and 50S50L (50% as SO and 50% with LO).
Results showed that substitution up to 70% or more of FO by vegetable oils in diets for
gilthead seabream, significantly reduced growth and affected feed utilization. Fatty acid
compositions of muscle lipid correlated with SO or LO inclusion in the diet, thus the
proportions of 18:2n-6, 18:3n-3 and 18:1n-9 all increased with increasing dietary VO
%. The concentrations of eicosapentaenoic acid (20:5n-3), docosahexaenoic acid
(22:6n-3) and arachidonic acid (20:4n-6) in muscle lipid were significantly reduced
(P<0.05), along with total saturated fatty acids, with increasing dietary VOs, while the
latter 2 fatty acids were less reduced in the muscle than in the diet, indicating their
selective retention. The elongase and Δ6 destaurase products from linoleic acid (18:2n-
6) and linolenic acid (18:3n-3) were also increased with increasing VOs. Diet-induced
changes in liver and gill fatty acid compositions were broadly similar to those in
muscle, with some exceptions. Limited supplies of marine fish oils require that
substitutes be found without compromising fish welfare. Thus, LO and SO can be used
successfully in the culture of gilthead seabream at levels less than 70% of dietary lipid
without compromising growth, but substantial reductions occur in muscle 20:5n-3,
22:6n-3 and the n-3/n-6 polyunsaturated fatty acid (PUFA) ratio, which will result in
reduced product quality for the consumer.
Key words: Gilthead seabream, Fish Oil, Linseed oil, Soybean oil, growth, EPA, DHA, n-3 HUFA, n-
3/n-6.

Chapter 3 Growth, feed utilization and body fatty acids
60
Introduction
Marine fish oils (FO), naturally rich in omega 3 highly unsaturated fatty acids
(HUFA) (>30%) which play very important roles in aquatic organisms, have been
traditionally used as a preferred lipid source in aquafeeds, due to its high digestibility
and content of essential fatty acids. Since those fatty acids also have beneficial effects
on human health (Craig-Schmidt, 2001), global consumer demand for seafood has
grown tremendously and aquaculture is playing an increasingly important role in
fulfilling the increased demand (Tacon, 2004; FAO, 2007a). Therefore, global demand
of FO for aquaculture has been increasing with fish production. Indeed, FO supply is
becoming a challenge for the aquafeeds industry, since its production relies on fisheries;
an overexploited source of HUFA (FAO, 2007b) and research on alternative lipid
sources has become a major goal for sustainable aquaculture development.
Vegetable oils (VO), more sustainable, reliable and, frequently, with more
competitive prices than FO, are seen as good alternative sources. VOs assayed in fish
feeds include linseed (LO) (Bell et al., 2003; Izquierdo et al., 2003, 2005; Benedito-
Palos et al., 2007; Jobling et al., 2008), rapeseed (Bell et al., 2001, Montero et al.,
2005), palm (Bell et al., 2002), soybean (SO) (Grisdale-Hellan et al., 2002) and
sunflower oils (Torstensen et al., 2000; Bransden et al., 2003). In gilthead seabream
(Sparus aurata), an important fish in Mediterranean aquaculture, it is possible to
partially replace FO by VO without compromising growth or feed utilization (Caballero
et al., 2002; Izquierdo et al., 2003, 2005; Montero et al., 2005). However, complete
substitution might be more difficult as the VO lack the n-3 HUFA essential for this
species (Ibeas et al., 1994). This means that, as in other marine fish (Watanabe et al.,
1983; Sargent et al., 1989; Castell et al., 1994), seabream has a very low Δ5 desaturase
and elongase activities to allow synthesis of eicosapentaenoic (20:5n-3; EPA) and
docosahexaenoic (22:6n-3; DHA) acids from their precursor linolenic (18:3n-3; LNA)
acid (Seiliez et al., 2003; Izquierdo et al., 2005, 2008). Therefore, seabream minimum
requirements for n-3 HUFA, particularly EPA and DHA should be included in diet in
order to maintain fish growth, health and welfare (Izquierdo et al., 2003, 2005; Montero
et al., 2003; Caballero et al., 2004), as well as filet quality (Kalogeropoulos et al., 1992;
Izquierdo et al., 2003, 2005). Moreover, certain VOs such as soybean oil, have a high
content in n-6 fatty acids, particularly linoleic acid (18:2n-6, LA) which are not present
in high amounts in marine environments.

Chapter 3 Growth, feed utilization and body fatty acids
61
Inclusion of those n-6 rich vegetable oils, with a low n-3/n-6 fatty acids ratio
(0.3-1) will produce diets with a n-3/n-6 fatty acids profile very different from FO (n-
3/n-6 of 9-6:1) (Robaina et al., 1998; Bransden et al., 2003) and the natural food of
marine fish. Indeed, feeding high lipid diets with a 60% FO replacement by certain
VOs, particularly soybean oil, increased lipid deposition in hepatocytes (Caballero et
al., 2002) and affected some immune parameters (Montero et al., 2003, 2008)
suggesting undesirable effects on fish health. A well balanced n-3/n-6 fatty acid ratio is
determinant for good human health (Simopoulos, 2008), since the functions and
efficiency of these fatty acids differ in many aspects of lipid metabolism such as
digestion, absorption and transport in fish (Izquierdo et al., 2000, 2001; Caballero et al.,
2006). In addition, energy production, cell membranes structural components and
signaling molecules and regulators of gene expression can all be affected by changes in
dietary fatty acids (Calder and Burdge, 2004; Yaqoob and Calder, 2007). Elsewhere, n-
6 and n-3 PUFA can influence mechanisms concerned with different physiological and
inflammatory processes in humans (Sanders, 1993), sometimes in opposing ways, so
high dietary n-6 PUFA and n-6/n-3 PUFA ratios have been suggested to play a role in
many chronic diseases endemic in Western populations (Simopoulos, 2008), thus
altered balance between the n-6 and n-3 series in aquaculture products may reduce the
beneficial effects of FO for human health. Producing fish rich in LA with consequently
higher n-6/n-3 ratio when feeding soybean oil (Caballero et al., 2002; Montero et al.,
2003, Izquierdo et al., 2005), not only reduces the health promoting properties of the
fish but worsens an already imbalanced human diet. Therefore, the challenge when
substituting FO with different VOs is to maintain high quality fish products by assuring
a high n-3/n-6 ratio in the aquaculture products available to the consumer.
The present study was conducted to better understand the consequences of
feeding commercial diets containing n-3 and/or n-6 fatty acid rich oils, and blends of
these oils giving different n-3/n-6 fatty acids ratios, on culture performance of gilthead
seabream, particularly in relation to feed utilization, fish growth, and lipid metabolism
in different tissues.

Chapter 3 Growth, feed utilization and body fatty acids
62
Materials and methods
Fish husbandry
Gilthead seabream (Sparus aurata) juveniles (45 g initial body weight) were
distributed in 39 tanks of 500 l (50 fish/tank with each diet assayed in triplicate).
Seawater was supplied in an open system (10 % renewal/h) at a temperature of 20-24.2
ºC. Fish were fed the experimental diets (Table 3.1) until apparent satiation (3
times/day, 6 days/week) for 26 weeks. Eight iso-energetic and isonitrogenous diets with
a lipid content of ~18 % were formulated and provided by Proaqua, S.A. (Dueñas,
Spain). Anchovy oil was the only added lipid source in the FO diet, whereas in the other
diets the FO was replaced by either LO, SO or blends of both oils (Table 3.2).
Feed intake (FI) was determined daily and all fish were weighed individually
every month. Feed conversion ratio (FCR = feed intake/weight gain) and specific
growth rate (SGR= ((Ln final weight- Ln initial weight)/t)*100, t=experimental period
(days)) were calculated monthly. Mortalities were recorded daily and survival was
determined monthly.
After 26 weeks of feeding, samples of muscle, liver and gills from 18 fish fed
each experimental diet were collected, immediately frozen and stored at -80 ºC until
they were analysed. Due to the complexity and the high number of samples produced,
and accordingly to the effect on fish growth, we chose only the 6 extreme diets for fatty
acid analysis (100FO, 70L, 100L, 70S, 100S, 50S50L). Lipids from diets, liver, gills
and muscle were extracted with chloroform: methanol (2:1 v:v) (Folch et al., 1957). The
fatty acids methyl esters were obtained by transesterification with 1% sulphuric acid in
methanol (Christie, 1982), purified by absorption chromatography on NH2 Sep-pak
cartridges (Water, S.A., Milford, Massachusetts) and separated, identified and
quantified by gas-liquid chromatography under the conditions previously described
(Izquierdo et al., 1990). Fatty acid methyl esters were identified by comparison to
external standards.

Chapter 3 Growth, feed utilization and body fatty acids
63
Table 3.1: Main ingredients contents of the experimental diets
% of dry weight
Oils (Fish oila/linseed/soybean) 16.32
South-American fish meal 47.26
Wheat 7.00
Soybean meal 47%b 25.00
Sunflower meal 3.67
Vitamins premixc 0.27
Minerals premixc 0.48
a South-American, anchovy oil.
b Soybean meal with 47% gross protein, “no GMO”
cVitamin and mineral premixes prepared according to Proaqua A/S commercial standards.
Table 3.2: Proximate composition (% dry weight) of experimental diets and proportions of the different
lipid sources (% of oil inclusion) contained in the experimental diets
Lipid source FO 70L 100L 70S 100S 50S20L 20S50L 50S50L
FO (Anchovy oil) 100 30 - 30 - 30 30 -
LO - 70 100 - - 50 50 50
SO - - - 70 100 20 20 50
Composition Dry Weight (%)
Lipid 17.97 17.97 17.51 16.22 17.59 15.51 17 17.67
Protein 44.35 46.97 45.83 47.42 47.51 47.62 44.83 46.35
Ash 4.06 5.22 4.61 5.05 5.42 5.5 4.55 4.83

Chapter 3 Growth, feed utilization and body fatty acids
64
Table 3.3: Fatty acid compositions of the experimental diets (g/100 g total fatty acids)
Fatty acids FO 70L 100L 70S 100S 50S20L 20S50L 50S50L
14:0 9.23 3.11 1.57 3.32 1.59 2.67 2.60 1.37
15:0 0.26 0.10 0.06 0.11 0.06 0.32 0.23 0.06
16:0ISO 0.11 0.04 0.03 0.05 0.03 0.01 0.06 0.03
16:0 22.21 12.19 10.21 15.84 13.69 15.46 12.16 11.75
16:1n-7 11.25 3.91 1.98 4.06 2.01 3.07 3.24 1.73
16:1n-5 0.38 0.14 0.09 0.16 0.09 0.07 0.10 0.08
16:2n-4 1.83 0.61 0.28 0.61 0.29 0.11 0.51 0.24
17:0 0.85 0.38 0.25 0.41 0.28 0.52 0.31 0.25
16:3n-4 2.00 0.66 0.29 0.67 0.31 0.59 0.54 0.24
16:3n-3 0.15 0.07 0.05 0.07 0.05 0.57 0.03 0.05
16:3n-1 0.12 0.05 0.04 0.06 0.04 0.07 0.07 0.03
16:4n-3 0.72 0.26 0.13 0.24 0.11 0.04 0.05 0.09
16:4n-1 - - - - - 0.25 0.29 -
18:0 3.85 3.96 3.99 3.43 3.20 10.20 3.49 3.74
18:1n-9 9.10 13.75 15.31 18.60 21.48 15.30 18.48 19.04
18:1n-7 3.16 1.57 1.36 2.15 1.77 1.15 1.37 1.36
18:1n-5 0.14 0.08 - 0.12 0.11 0.09 0.10 0.10
18:2n-9 0.04 0.02 - - - - 0.03 -
18:2n-6 4.02 12.36 16.21 29.93 38.51 22.25 18.47 27.25
18:2n-4 0.38 0.13 0.06 0.12 0.06 0.18 0.12 0.05
18:3n-6 0.36 0.13 - - 0.07 0.13 0.12 0.09
18:3n-4 0.04 - 0.04 0.18 0.09 0.70 0.12 0.05
18:3n-3 0.48 31.94 37.63 5.63 6.01 11.38 20.67 23.03
18:4n-3 1.94 0.76 0.40 0.73 0.40 0.06 0.75 0.36
18:4n-1 - - 0.03 - - - 0.08 -
20:0 0.28 0.21 0.19 0.28 0.28 0.72 0.26 0.24
20:1n-9 2.59 1.94 1.84 2.08 1.89 1.74 2.35 1.91
20:1n-7 0.26 0.13 0.09 0.13 0.10 0.11 0.15 0.09
20:2n-9 - 0.04 - 0.04 0.01 0.02 0.03 0.01
20:2n-6 0.19 0.11 0.08 0.11 0.09 0.10 0.04 0.08
20:3n-9 - - - - - 0.08 0.15 -
20:3n-6 0.25 0.09 0.04 0.06 0.03 0.08 0.08 0.03
20:4n-6 1.11 0.43 0.24 0.43 0.24 0.40 0.39 0.21
20:3n-3 - - 0.07 - - 0.06 0.08 -
20:4n-3 0.96 0.35 0.16 0.33 0.16 0.32 0.38 0.13
20:5n-3 10.05 4.00 2.07 3.77 2.06 3.85 3.99 1.73
22:1n-11 1.79 1.52 1.48 1.67 1.61 1.45 1.91 1.64
22:1n-9 - - 0.42 - - 0.33 0.52 -
22:4n-6 0.34 0.15 0.09 0.14 0.09 0.15 0.14 0.08
22:5n-6 - - - - - 0.64 0.75 -
22:5n-3 1.74 0.66 0.29 0.60 0.29 0.39 0.11 0.24
22:6n-3 7.82 4.16 2.92 3.87 2.91 4.35 4.69 2.63
Saturates 36.68 19.95 16.28 23.40 19.10 29.88 19.06 17.41
Monoenoics 28.79 23.10 22.62 29.03 29.09 23.33 28.57 25.98
n-3 23.42 42.19 43.72 15.23 12.00 21.02 30.74 28.26
n-6 6.27 13.26 16.66 30.67 39.02 23.76 - 27.74
n-9 22.99 19.66 19.55 24.78 25.40 17.48 24.79 22.69
n-3 HUFA 20.57 9.17 5.50 8.57 5.42 8.97 9.24 4.73
n-3/n-6 3.74 3.18 2.62 0.50 0.31 0.88 1.54 1.02

Chapter 3 Growth, feed utilization and body fatty acids
65
Statistical analysis
All the data were statistically treated using ANOVA and Tukey’s test at P<0.05 was
applied as a multiple sample comparison analysis using a SPSS Statistical Software
System 10.0 (SPSS Inc., Chicago, Illinois) (Sokal and Rolf. 1995).
Results
Lipid peroxidation products were determined as thiobarbituric acid reactive
substances (TBARS) and they showed no significant differences between the diets,
ranging between 8.56 and 3.85 µmole of malonaldehyde (MDA)/kg of wet diet. No
dietary effect was observed on TBARS concentration (P<0.05). The fatty acid profile of
the different diets reflected the inclusion level of different VOs (Table 3.3). Saturated
fatty acids decreased with higher FO replacement in the diets, ranging from 36.68 in FO
diet to 17.41 % in 50SO50LO diet. Total monounsaturates (MUFA; mainly oleic acid
(18:1n-9, OA) tend to be reduced with the inclusion of LO and to increase with the
inclusion of SO, ranging from 22.62 % in 100LO diet to 29.09 in 100S. LA in diet
increased with increasing VO inclusion, particularly SO, ranging from 4.02% in FO diet
to 38.51% in 100S diet, while LNA was also increased, particularly by LO inclusion,
ranging from 0.48% in FO diet to 37.63% in 100L diet. The percentages of ARA, EPA
and DHA were proportionally reduced by the replacement increase, ranging from 0.21,
1.73 and 2.63 %, respectively, in 50S50L diet to 1.11, 10.05 and 7.82%, respectively, in
FO diet. Thus, in diets with 70% FO substitution by plant oils the contents of ARA,
EPA and DHA were reduced by 56%, 62% and 46% respectively, while when
substituting up to 100% of FO, the reduction of these fatty acids was 74%, 83% and
62% compared to their respective values in the control diet.
All fish accepted all the experimental diets and no fish died during the feeding
period. All treatments showed good growth but, after 4 months of feeding fish fed FO
diet showed the highest final body weight (Figure 3.1). Monthly SGR increased with
temperature along the experiment being slower at the beginning and higher at the end of
the feeding period. Average SGRs were significantly lower in fish fed 70S20L, 20S50L
and 50S50L compared to the control diet (Table 3.4). CI ranged from 1.23 for fish fed
FO to 1.64 for fish fed 20L50S at the end of the trial (Table 3.4). Thus, fish fed the
control diet showed a significantly higher final weight, with 277.1 g, compared to the
other treatments. The weight gain followed a similar pattern with a significantly higher

Chapter 3 Growth, feed utilization and body fatty acids
66
value for fish fed the control diet and the lowest values for fish fed 100S and 50S50L
diets.
Figure 3.1: Effect of different dietary oils on gilthead seabream body weight (experiment I)
(n = 150). * Denotes significant differences (P < 0.05) between 100F and the rest of the experimental
groups.
Fatty acid compositions of fillet total lipid of sea bream after 26 weeks of
feeding the experimental diets are shown in Table 3.5. Total saturates (mainly 16:0) in
gilthead sea bream fillets were proportionally reduced by the inclusion of dietary plant
oils, but to a lower extent than in the diets. Total MUFA contents were similar in all
fillets but oleic acid was significantly higher in fillets from fish fed the VO diets
compared to the control treatment. Muscle contents of LA were also highest in fish fed
diets with partial substitution of dietary FO, due to the high levels of LA in SO and to a
lesser extent in LO diets. The same pattern was true for total n-6 PUFA since LA
constituted the main n-6 component. In contrast, ARA was significantly lower in fish
fed 70L, 70S, 100S and 50S50L compared to the FO. The content on LNA in flesh total
lipids was highest in fish fed 100L followed by fish fed 70L, then those fed 100S and
50S50L, and the lowest content was found in fish fed 70S and FO. EPA, DHA and total
n-3 HUFA were significantly highest in fish fed FO due to its highest content of these

Chapter 3 Growth, feed utilization and body fatty acids
67
fatty acids and decreased with increased substitution by VO. The end products of Δ6-
desaturase and elongase from LA, including 18:3n-6, 20:2n-6 and 20:3n-6, were
increased in muscle from fish fed SO. In addition the dead end product of C18/C20
elongase from LNA, 20:3n-3, was increased in fish fed LO.
The effects of the experimental diets on fatty acid compositions of liver were
qualitatively the same as described for flesh. However, a number of notable quantitative
differences occurred, particularly with respect to MUFA. Liver total lipid fatty acid
composition from sea beam fed the experimental diets is shown in Table 3.6. After the
feeding period, total saturates were significantly higher in fish fed FO. Total MUFA,
primarily OA, were significantly higher in liver total lipids from fish fed 100L, 70S,
100S and 50S50L compared to the FO diet, due to the higher inclusion of this fatty acid
in the blends of VO. LA was significantly higher in all liver total lipids from fish fed
VO and the highest content was registered in fish fed 100S. Total n-6 was significantly
higher in fish fed SO and 50S50L reflecting its higher content of LA. The liver total
lipid content of LNA was also affected by the feeding trial, as fish fed LO showed
significantly the highest contents on this fatty acid, followed by 50S50L. Liver total
lipid percentage of EPA, DHA and total n-3 HUFA was significantly higher in fish fed
FO as a consequence of the dietary abundance of these fatty acids. Liver content of
LNA also reflected the dietary input of this fatty acid, such that fish fed the LO diet
showed significantly the highest levels, followed by 50S50L and 100S. The Δ6-
desaturase and elongase products from LA and LNA, such as 18:3n-6, 20:2n-6, 20:3n-6
and 20:3n-3, were significantly increased in fish fed VO comparing to FO and
according to the amount of the precursor fatty acid in the diet.
Fatty acid composition from the gills showed a similar pattern (Table 3.7), thus
total saturates were significantly reduced when feeding seabream LO and SO compared
to the FO diet. This can be explained mainly by the high content in FO of 16:0. OA was
significantly increased in gills from fish fed all the experimental VO diets compared to
FO. LA was significantly increased in all fish fed the VO diets with the maximum
observed for the 100S diet. LNA was also increased significantly in fish fed LO
according to the level of inclusion and consequently total n-3 content was higher. ARA
was significantly reduced in gills from fish fed VO compared to FO, and the levels of
this FA were higher in this organ compared to the liver or muscle up to almost 2 fold.
EPA, DHA and total n-3HUFA were significantly decreased in fish fed LO and SO

Chapter 3 Growth, feed utilization and body fatty acids
68
compared to the control diet. The amounts of 18:3n-6, 20:2n-6 and 20:3n-6 were
increased in SO fed fish, while 20:3n-3 were increased in LO fed fish compared to FO.
The n-3/n-6 ratio was clearly affected by both the type and the level of inclusion of each
oil and higher n-3/n-6 ratios were observed in all the tissues of fish fed FO. However,
increasing dietary VO concentrations led to a progressive decrease in the n-3/n-6 ratio.
Diet induced changes on saturated and MUFA concentrations for all the tissues.

Chapter 3 Growth, feed utilization and body fatty acids
69
Table 3.4: Growth and efficiency in utilization of feed by gilthead seabream fed the experimental diets.
FO 70L 100L 70S 100S 50S20L 2
Initial
Weight
(g)
35.6±0.8 35.3±0.4 34.8±0.5 35±0.5 35.4±0.6 34.2±0.3 34
Final
Weight
(g)
277.1±23.87a 251.12±15.5
bc 249.9±14.5
bc 260.5±21.7
ab 232.8±18.73
c 243.1±35.47
bc 244.
%
Weight
Gain
671±14.2a 613.8±18.9
abc 610.7±10.5
abc 612.8± 8
b 553.3±12.3
c 612.8±12.8
abc 603.
SGR 0.73±0.01a 0.71±0.04
ab 0.71±0.01
ab 0.74±0.13
a 0.70±0.02
ab 0.71±0.06
ab 0.7

Chapter 3 Growth, feed utilization and body fatty acids
70
Table 3.5: Fatty acid profile of muscle from gilthead sea bream fed the experimental diets
Diets
Fatty
Acids Initial FO
70L 100L 70S 100S 50S50L
14:0 5.53 5.54±1.14 3.63±0.41 2.12±0.22 2.18±0.5 1.64±0.14 1.63±0.06
14:1n-7 - 0.52±0.03 0.26±0.13 0.22±0.05 0.04 0.03±0.02 0.04
14:1n-5 - - - - 0.07±0.02 0.04±0.03 0.05
15:0 0.56 0.64±0.11 0.37±0.06 - 0.23±0.05 0.2±0.02 0.19±0.02
15:1n-5 0.06 1.19±0.9 0.06±0.03 0.28±0.11 - 0.01±0.01 0.01±0.01
16:0ISO 0.05 0.44±0.32 0.13±0.08 0.11±0.1 0.11±0.04 0.1±0.06 0.07±0.06
16:0 22.97 21.66±2.4a 15.13±1.9
b 12.93±1.43
b 14.96±0.52
b 13.55±0.92
b 12.87±0.75
b
16:1n-7 6.69 7.86±5.06 5.81±0.23 3.32±0.3 3.62±1.05 2.65±0.24 2.58±0.01
16:1n-5 0.2 0.11±0.02 0.05±0.01 0.07 0.09±0.03 0.07±0.01 0.07
16:2n-6 0.91 0.32±0.39 0.15±0.04 0.15±0.03 0.4±0.16 0.26±0.02 0.25
16:2n-4 0.45 0.86±0.56 - 0.49±0.12 0.24±0.05 0.19 0.19
17:0 - 0.73±1.04 0.93±0.08 0.42±0.11 0.41±0.15 0.28±0.03 0.27
16:3n-4 1.18 1.73±1.07 0.65±0.1 0.3±0.17 0.04±0.01 0.05±0.03 0.07
16:3n-3 0.15 0.34±0.3 0.07±0.04 0.15±0.07 0.08±0.03 0.03±0.03 0.04
16:4n-3 0.05 1.11±0.49 0.3±0.11 0.23±0.25 0.14±0.02 0.11±0.09 0.12±0.03
16:3n-1 0.95 0.28±0.3 - 0.03 0.1±0.14 0.12±0.05 0.12±0.02
18:0 5.2 4.9±0.89a 4.35±0.67
a 4.38±0.44
a 3.35±0.24
b 3.45±0.52
b 3.39±0.2
b
18:1n-9 13.4 11.43±1.4c 16.14±1.1
b 17.33±1.49
ab 20.45±1.96
a 21.16±1.44
a 20.31±0.18
a
18:1n-7 2.66 3.06±0.52 2.31±0.14 1.63±1.18 2.22±0.19 1.62±0.36 1.76±0.05
18:1n-5 0.09 0.28 0.16±0.11 0.06±0.02 0.12±0 0.08±0.07 0.05±0.07
18:2n-9 0.13 0.39 0.15±0.09 0.11±0.1 0.07±0 0.06±0.05 0.05±0.07
18:2n-6 10.81 3.68±0.55c 10.92±0.5
b 13.45±0.1
b 29.58±5.01
a 27.86±5.2
a 25.05±0.12
a
18:2n-4 0.3 0.31±0.23 0.09 0.05± 0.04 0.09±0.05 0.05±0.02 0.06±0.01
18:3n-6 0.21 0.25±0.17 0.15±0.08 0.11±0.08 0.36±0.02 0.32±0.04 0.34±0.02
18:3n-4 0.22 0.3±0.2 0.6±0.09 0.45±0.37 0.16±0.1 0.04±0.04 0.06±0.03
18:3n-3 1.41 1.69±0.55d 21.46±0.6
b 31±2.05
a 4.26±0.73
d 12.89±7.38
c 17.5±0.37
c
18:3n-1 - 1.25±0.28 - 0.21 0.43±0.14 0.25±0.22 0.47±0.02
18:4n-3 1.21 1.41±0.31 0.2±0.03 0.45±0.21 0.06±0.03 0.03±0.02 0.04
18:4n-1 0.26 0.14±0.09 0.11± 0.07 0.08 0.19±0.01 0.19±0.02 0.19±0.01
20:0 1.05 0.51±0.49 0.17±0.1 - 1.43±0.07 1.64±0.29 0.84±0.78
20:1n-9 0.9 1.41±0.13 0.95±0.06 0.66±0.35 0.1±0.01 0.09±0.01 0.9±1
20:2n-9 0.17 0.19±0.09 0.25±0.02 0.58±0.48 0.12 0.11±0.01 0.29±0.27
20:2n-6 0.04
0.11±0.08
0.17±0.11
0.19 0.6±0.14 0.58±0.13 0.34±0.22
20:3n-6 0.19
0.13±0.05
0.18±0.06
0.20±0.1 0.28±0.03 0.22±0.04 0.26±0.1
20:4n-6 0.76 1±0.24ª 0.53±0.1b 1.09±0.61ª 0.49±0.24b 0.35±0.1b 0.42±0.22b
20:3n-3 0.07 0.08±0.05 0.82±0.1 0.89±0.35 0.16±0.03 0.44±0.24 0.49±0.16
20:4n-3 0.63 0.92±0.53 0.61±0.13 0.35±0.07 0.4±0.15 0.35±0.05 0.19±0.27
20:5n-3 7.56 7.43±1.44a 3.51±0.96
b 1.99±0.39
b 2.6±1.28
b 1.66±0.21
b 1.55±0.05
b
22:1n-11 0.82 0.66±0.27 0.31±0.27 0.22±0.19 0.88±0.04 0.45±0.48 0.71±0.44
22:4n-6 - 0.21±0.18 0.3±0.06 0.17±0.09 0.2±0.08 0.16±0.03 0.15±0.01
22:5n-3 3.02 3.68±0.49 1.76±0.54 0.99±0.2 1.46±0.61 0.94±0.09 0.86±0.01
22:6n-3 9.14 11.25±1.4a 6.57±2
ab 4.68±1.02
b 7.22±2.2
ab 5.69±1.13
b 5.18±0.39
b
Saturates 35.31 33.98±5.6ª 24.47±2.8b 19.85±2.13
b 22.57±1.38
b 20.76±0.83
b 19.19±1.81
b
Monoenoics 24.82 26.5±4.84 25.84±1.1 23.67±1.95 27.59±0.69 26.2±2.17 26.47±1.85
n-3 23.24 26.8±4.6bc
35.3±4.5ab
38.88±3.69a 16.38±3.5
c 22.13±7.69
bc 25.97±0.34
bc
n-6 12.99 5.7±0.6 12.4±0.41 14.76±0.68 31.92±4.66 29.75±5.24 26.81±0.05
n-3 HUFA 20.42 23.36±4a 13.28±3.7
b 7.89±1.35
b 11.84±4.21
b 9.08±1.35
b 8.27
b
n-3/n-6 1.79 4.89±0.98a 2.85±0.47
b 2.7±0.33
b 0.53±0.19
c 0.79±0.36
c 0.97±0.01
c
EPA/DHA 0.83 0.66 0.53 0.43 0.35 0.29 0.3
*Different letters in the same line denote statistically significant differences (P<0.05).

Chapter 3 Growth, feed utilization and body fatty acids
71
Table 3.6: Fatty acid profile of liver from gilthead sea bream fed the experimental diets
DIETS
Fatty Acids Initial FO 70L 100L 70S 100S 50S50L
14:0 2.91 6.9±0.4 2.54±1.17 1.76±0.09 2.7±0.61 1.61±0.07 1.7±0.34
14:1n-7 - 0.02±0.02 0.03±0.01 0.02 0.03±0.01 0.02 0.02±0.01
14:1n-5 - 0.17±0.05 0.1±0.06 - 0.1±0.03 0.05 0.07±0.01
15:0 0.34 0.9±0.2 0.74±0.4 0.56±0.3 0.85±0.17 0.46±0.05 0.78±0.26
15:1n-5 0.05 0.03±0.01 0.03±0.01 0.02±0.01 0.03±0.01 0.02 0.03±0.01
16:0ISO 0.03 0.19±0.1 0.16±0.14 0.02±0.03 0.03±0.01 0.02 0.17±0.04
16:0 23.16 18.7±5.1 14.53±1.26 13.76±0.82 18.12±3.46 18.9±0.41 15.44±1.89
16:1n-7 4.48 7.5±3.6 4.03±1.53 2.62±0.08 4±1.04 2.49 2.45±0.18
16:1n-5 0.22 0.15±0.08 0.08±0.03 0.09±0.05 0.14±0.03 0.11±0.01 0.11±0.01
16:2n-6 0.55 0.4±0.14 0.44±0.14 0.33 0.42±0.1 0.28 0.28±0.02
16:2n-4 0.6 0.9±0.55 0.41±0.05 0.41±0.09 0.46±0.1 0.37 0.39±0.01
17:0 - 1.8±0.93 0.39±0.13 0.3±0.01 0.4±0.08 0.29 0.3
16:3n-4 0.64 0.1±0.07 0.17±0.03 0.16±0.02 0.04 0.03 0.11±0.01
16:3n-3 0.01 0.15±0.03 0.09±0.02 0.08±0.01 0.08±0.02 0.06±0.01 0.07±0.01
16:4n-3 0.12 0.05±0.04 0.02±0.01 0.01±0.01 0.03±0.04 0.01 0.01±0.01
16:3n-1 0.32 0.2±0.13 0.06±0.01 0.04±0.01 0.05±0.02 0.03 0.03±0
18:0 11.34 5.9±0.17 6.59±1.32 6.88±1.82 5.99±1.25 7.23±0.19 7.27±2.63
18:1n-9 14.89 14.64±5.4b
17.36±0.73ab
18.85±1.56ab
24.58±2.2a
23.78±0.31a
23.43±2.18ª
18:1n-7 2.99 2.69±1.35 1.7±1.04 1.22±0.01 2.1±0.52 1.4±0.15 1.43±0.53
18:1n-5 0.09 0.17±0.03 0.11±0.02 0.08±0.01 0.18±0.01 0.16±0.01 0.14±0.02
18:2n-9 0.14 0.14±0.04 0.11±0.03 0.07±0.02 0.18±0.03 0.21±0.08 0.14±0.03
18:2n-6 9.21 5.19±2.82d
11.67±1.86c
13.23±0.56c
23.86±4.71a
26.57±0.14a
20.71±1.18b
18:2n-4 0.34 0.32±0.14 0.11±0.07 0.12±0.02 0.13±0.04 0.08±0.01 0.05±0.02
18:3n-6 0.28 0.29±0.01 0.39±0.11 0.21±0.01 0.74±0.26 1.6±0.22 0.93±0.42
18:3n-4 0.31 0.35±0.35 0.1±0.14 - 0.15±0.05 0.09 0.04±0.06
18:3n-3 1.02 4.09±4.4c
22.98±4.46ª 25.47±2.81a
2.85±0.37c
3.02±0.04c
12.76±0.7b
18:3n-1 - 1.46±0.58 0.43±0.6 0.63±0.1 0.33±0.05 0.35±0.03 0.78±0.25
18:4n-3 0.61 0.13±0.08 0.67±0.86 0.05 0.05±0.02 0.03 0.03
18:4n-1 0.29 0.2±0.04 0.16 0.16±0.02 0.18±0.04 0.19±0.01 0.17±0.02
20:0 0.11 1.71±0.57 0.84±0.11 0.83 1.38±0.14 1.32±0.02 1.24±0.02
20:1n-9 0.77 0.18±0.04 0.11±0.03 0.1±0.02 0.13±0.02 0.1 0.11
20:2n-9 0.31 0.01±0.02 0.02±0.03 - 0.01±0.02 - -
20:2n-6 0.05 0.16±0.02 0.12±0.02 0.12±0.03 0.19±0.03 0.27±0.03 0.18±0.03
20:3n-9 0.4 0.22±0.07 0.3±0.05 0.44±0.05 0.76±0.18 0.92±0.02 0.62±0.09
20:3n-6 0.31 0.21±0.05b
0.16±0.02b
0.17±0.01b
0.34±0.08b
0.56±0.05a
0.3±0.05b
20:4n-6 0.98 1.44±0.18ª 0.47±0.07b
0.43±0.08b
0.44±0.11b
0.35±0.02b
0.31±0.02b
20:3n-3 0.11 0.55±0.61c
1.17±0.31ab
1.8±0.14ª 0.19±0.02c
0.21±0.01c
0.73±0.08c
20:4n-3 0.77 0.88±0.24 0.64±0.03 0.64±0.02 0.33±0.07 0.28±0 0.2±0.29
20:5n-3 5.91 6.97±0.45ª 1.87±0.41b
1.38±0.33b
1.34±0.4b
1±0.05b
1±0.1b
22:1n-11 0.41 0.53±0.05 0.39±0.11 0.3±0.06 0.75±0.05 0.57±0.02 0.67±0.1
22:4n-6 0.18 0.25±0.14 0.13±0.02 0.11±0.01 0.09±0.02 0.09±0 0.07±0.01
22:5n-6 0.21 0.03±0.05 0.03±0.05 0.06±0 0.03±0.01 0.03±0 0.04±0.01
22:5n-3 4.51 3.28±0.71 1.47±0.27 1.22±0.01 1.02±0.26 0.84±0.05 0.74±0.14
22:6n-3 10.04 9.83±3.91ª 6.08±0.30ab
5.18±1.03ab
4.19±0.72b
3.99±0.21b
3.94±0.54b
Saturates 37.86 35.9±3.2 25.63±1.75 24.09±3.04 29.44±5.48 29.81±0.36 26.73±3.9
Monoenoics 23.9 26.08±0.1 23.94±3.6 23.36±1.66 31.95±0.96 28.6±0.46 28.39±3
n-3 23.1 25.93±0.5b
34.99±4.57ª 35.83±4.08a
10.08±1.37c
9.44±0.37c
19.48±0.29b
n-6 11.77 8.06±3.08d
13.59±1.81c
14.98±0.61c
26.68±5.06a
30.4±0.46ª 23.26±0.82b
n-3 HUFA 21.34 21.51±3.8ª 11.23±0.71b
10.22±1.25b
7.07±1.40c
6.32±0.32c
6.61±0.4c
n-3/n-6 1.96 3.22±1.25 2.57±0.01 2.39±0.18 0.38±0.09 0.31±0.01 0.84±0.02

Chapter 3 Growth, feed utilization and body fatty acids
72
Table 3.7: Fatty acid profile of gills from gilthead sea bream fed the experimental diets
Diets
Fatty Acids FO 70L 100L 70S 100S 50S50L
14:0 5.91±0.36 3.5±0.08 2.32±0.01 3.13±0.1 1.77±0.06 1.61±0.07
14:1n-7 0.15±0.02 0.08 0.06 0.09±0.01 0.05 0.06±0.01
14:1n-5 0.18±0.01 0.11 0.07 0.1±0.01 0.06 0.07±0.01
15:0 0.06±0.01 0.04 0.04 0.04±0.01 0.03±0.01 0.03±0.01
15:1n-5 0.66±0.08 0.43±0.03 0.34±0.02 0.34±0.02 0.34±0.02 0.36±0.08
16:0ISO 0.09 0.06 0.04 0.05 0.03 0.03
Me16:0 0.6±0.21 0.25±0.02 0.17 0.2±0.07 0.4±0.09 0.3±0.07
16:0 20.66±1.23a 16.34±0.27
bc 15.06±0.45
c 17.18±0.99
b 17.42±0.08
b 14.45±1.08
c
16:1n-9 10.86±0.68 6.09±0.06 3.75±0.02 5.68±0.27 3.22±0.18 3.38±0.47
16:1n-7 0.2 0.11 0.07 0.12±0.01 0.08 0.07±0.01
16:1n-5 0.23±0.01 0.14 0.11 0.11±0.02 0.05±0.01 0.06±0.01
16:2n-6 1.56±0.01 0.75 0.44±0.01 0.64±0.02 0.43±0.03 0.39±0.05
16:2n-4 0.55±0.04 0.37 0.31 0.3±0.02 0.16±0.08 0.12±0.03
17:0 1.19±0.14 0.61±0.01 0.39±0.01 0.53±0.02 0.3±0.01 0.32±0.04
16:3n-4 - 0.07 0.06±0.04 0.01±0.01 0.01 0.06±0.01
16:3n-3 0.07±0.05 0.09 0.08 0.07 0.05 0.06±0.01
16:3n-1 0.38±0.44 0.31±0.04 0.2±0.09 0.24±0.09 0.54±0.06 0.43±0.08
16:4n-3 0.45±0.15 0.17±0.01 0.25 0.25±0.04 0.38±0.09 0.33±0.07
16:4n-1 0.17±0.05 0.04±0.03 0.1±0.09 0.04±0.02 0.08±0.02 0.06±0.01
18:0 4.7±0.79 4.59±0.17 4.98±0.09 3.62±0.46 4.73±0.09 4.59±0.62
18:1n-9 11.95±0.18c
17.11±0.17b
20.5±0.1a
22.55±0.64ª 22.35±1.24ª 20.97±0.45ª
18:1n-7 3.48±0.01 2.31±0.02 1.85±0.01 2.68±0.15 2.35±0.04 2.21±0.28
18:1n-5 0.1±0.01 0.07 0.07 0.13 0.11±0.01 0.11±0.01
18:2n-9 0.05±0.02 0.03 0.03 0.05 0.05±0.01 0.11±0.01
18:2n-6 3.79±0.23e
10.12±0.12d
12.74±0.11c
23.92±0.9b
29.46±0.05ª 22.08±1.58b
18:2n-4 0.37±0.02 0.2 0.12 0.14 0.06 0.08±0.01
18:3n-6 0.29±0.01b
0.17c
0.15c
0.25±0.02bc
0.29±0.05b
0.4±0.05ª
18:3n-4 0.49±0.04 0.24 0.14 0.2±0.02 - 0.04±0.04
18:3n-3 1.51±0.07d
18.88±0.52b
24.03±0.31a
3.17±0.4d
3.28±0.12d
14.56±0.77c
18:3n-1 0.96±0.18 0.48±0.02 0.32±0.01 0.38±0.06 0.18±0.02 0.41±0.08
18:4n-3 0.16±0.03 0.09 0.05 0.06±0.01 0.02±0.02 0.01±0.02
18:4n-1 0.21±0.01 0.19±0.01 0.21 0.21 0.25±0 0.23±0.03
20:0 - - - 0.27±0.01 0.14±0.1 0.18±0.13
20:1n-9 0.71±0.15 0.68±0.11 0.82±0.02 1.6±0.1 1.15±0.18 1.31±0.3
20:1n-7 0.18 0.11±0.01 0.1 0.13 0.04±0.05 0.1±0.02
20:2n-9 0.1±0.02 0.07 0.06 0.09±0.01 0.07±0.01 0.1±0.01
20:2n-6 0.15±0.01d
0.24±0.01cd
0.3±0.01c
0.54±0.02b
0.8±0.03ª
0.61±0.07b
20:3n-6 0.18±0.01 0.1±0.01 0.08 0.17±0.03 0.22±0.05 0.24±0.03
20:4n-6 2±0.43a
0.95±0.05b
0.49±0.02b
0.56±0.12b
0.78±0.2b
0.6±0.09b
20:3n-3 0.12c
0.72±0.04b
0.94±0.01ª 0.13±0.01c
0.15±0.01c
0.62±0.07b
20:4n-3 0.84±0.13 0.48±0.01 0.34 0.33±0.05 0.18±0.01 0.35±0.06
20:5n-3 6.98±0.57a
2.99±0.1b
1.52±0.06c
1.94±0.27c
1.2±0.16c
1.33±0.26c
22:1n-11 0.26±0.04 0.24 0.27±0.01 1.08±0.13 0.69±0.07 0.86±0.1
22:1n-9 0.19 0.22 0.32±0.02 0.48±0.02 0.3±0.03 0.38±0.05
22:5n-6 0.33±0.03 0.16 0.1 0.12±0.01 0.05±0.04 0.06±0.04
22:4n-6 0.43±0.02 0.23±0.01 0.13 0.14±0.02 0.14±0.03 0.13±0.02
22:5n-3 2.83±0.46 1.55±0.06 0.81±0.01 1.1±0.19 0.68±0.07 0.68±0.15
22:6n-3 12.66±0.71a
7.22±0.22b
4.69±0.08c
4.84±0.58c
4.84±0.76c
4.47±0.89c
Saturates 32.53±1.63a
25.08±0.52b
22.78±1.61b
24.76±1.72b
24.41±0.09bc
21.18±1.23c
Monoenoics 29.15±0.96 27.71±0.39 28.31±0.62 35.1±1.37 30.8±1.99 29.93±1
n-3 25.63±1.74b
32.18±0.9ª 32.71±1.9ª 11.89±1.59c
10.78±1.46c
22.41±2.07b
n-6 8.55±0.19d
12.62±0.06c
14.36±0.37c
26.17±0.93b
31.95±0.39ª 24.27±1.66b
n-9 23.85±0.97c
24.2±0.33c
25.47±0.58bc
30.45±1.2ª 27.14±1.84b
26.24±0.48bc
n-3 HUFA 23.43±1.66a
12.95±0.5b
8.31±0.56c
8.35±1.29c
7.05±1.24c
7.45±1.71c
n-3/n-6 3±0.23 2.55±0.07 2.28±0.08 0.45±0.05 0.34±0.04 0.92±0.13

Chapter 3 Growth, feed utilization and body fatty acids
73
Figure 3.2: Relationship between dietary fatty acid concentrations and liver fatty acid
concentrations of 18:2n-6, 18:3n-3, 20:5n-3 and 22:6n-3 in total lipids of gilthead seabream fed either
100% FO, 70L, 100L, 70S, 100S or 50S50L.

Chapter 3 Growth, feed utilization and body fatty acids
74
Discussion
The present study was focused on the development of cost-effective feed
supplies, utilising alternatives to FO that could be used in the sustainable production of
aqua feeds without compromising fish growth performances. The results showed that
substituting FO with up to 70% or more with LO and SO as the only oil or as a blend of
oils significantly decreased fish final weight, except for the 70S treatment that showed
no difference to the control. Previous studies with seabream showed that it is possible to
substitute up to 60% of FO by rapeseed oil, LO or SO without affecting fish growth and
feed utilization, and that 80% substitution decreased fish growth performances
(Caballero et al., 2002; Montero et al., 2003; Izquierdo et al., 2003, 2005). The present
study, feeding seabream with intermediate substitution levels of 70% or more of its
dietary oil as VO significantly decreased growth and CI. These results confirmed again
the ability of gilthead sea bream to accept VOs in their diets in comparison with other
marine fish species (Regost et al., 2003a,b; Izquierdo et al., 2005).
The present study was unusual in using a diet with lower lipid content (around
18%) compared to the other previous seabream studies (Caballero et al., 2002; Montero
et al., 2003, 2005; Izquierdo et al., 2005) that used up to 22%. Consequently the total n-
3 HUFA provided in diets for the present study are supposed to be lower, while the role
of these essential fatty acids in different fish species at different stages of fish
development is well documented (Watanabe et al., 1982; Izquierdo, 1988; 1996, et al.,
2000; Sargent et al., 1999). Furthermore, FO and FM used in the present study were
from south-American origin known to be higher in n-3HUFA, especially EPA, but also
DHA, total saturated fatty acids, and lower MUFA content in comparison to those from
the northern hemisphere origin (Allen, 1995). For instance, southern hemisphere fish
oils can deliver similar levels of n-3HUFA at lower inclusion levels than the northern
hemisphere fish oils (Sargent et al., 2002). The VOs used in this study are rich in C18
fatty acids, n-3 (mainly LNA) and n-6 (mainly LA) fatty acids, in LO and SO
respectively. The inclusion of these oils alone (separately) or as a blend changed the n-
3/n-6 input in the diet and consequently changed their incorporation in different fish
tissues. Thus, there was a positive correlation between fish final weight and the dietary
n-3/n-6 ratio with r2=0.66, the same positive correlation was observed between final
weight and the n-3/n-6 ratio in muscle, liver and gills with r2= 0.71, 0.63 and 0.62,
respectively. Therefore, care should be taken when substituting FO with plant oils, to
maintain the correct n-3/n-6 derived from the different oils in order to assure good

Chapter 3 Growth, feed utilization and body fatty acids
75
growth performances. Although, Montero and colleagues (2008) have demonstrated that
fish fed VOs in the present experiment have decreased phagocytic activity, reduced
serum alternative complement pathway activity and elevated basal constitutive levels of
Mx transcript expression in the liver.
Previous studies in seabream have demonstrated that fatty acid compositions
reflect the dietary fatty acid composition (Montero et al., 1996; 2003; 2005, 2008;
Izquierdo et al., 2000; 2003, 2005). This was clearly shown in the present study, in
muscle, liver and gills. Specifically, in muscle and liver, positive correlations between
dietary and tissue FA concentration were shown for 18:2n-6, 18:3n-3, 18:1n-9, 20:4n-6,
20:5n-3 and 22:6n-3 (Figure 3.2). In agreement with these studies, the linear correlation
obtained in the present trial revealed differences between the relationships of dietary
and tissue FA for each individual FA. In particular, EPA and DHA were present in
higher concentrations in muscle compared to diet in all the treatments. In line with
previous studies, these suggest that when these FA were provided to the fish in low
concentrations they were selectively retained in the tissues (Bell et al., 2004; Montero et
al., 2005). The differences in retention and utilisation of specific FA in muscle and liver
are related to the different functions of FA in the two tissues. Liver is the primary lipid
storage organ in marine fish and this is largely FA stored as triacylglycerols while the
muscle tissue has most of its FA contained in membrane phospholipids. Since HUFA,
especially EPA and DHA, are vital for the function of cell membranes the retention of
these HUFA in phospholipids is generally more efficient than in triacylglycerols
(Izquierdo et al., 2000; Sargent et al., 2002).
HUFA levels significantly decreased in flesh, liver and gills from fish fed VO
compared to the control fish. Fatty acids deposited in the flesh reflected those ingested
in the diet. However, in particular, DHA and ARA levels in flesh were higher than in
diet, indicating a selective deposition and retention. DHA is known to be more abundant
in polar lipid of flesh (Izquierdo et al., 2005) with the content being double that of EPA.
The possible mechanisms underlying this selective deposition include the high
specificity of fatty acyl transferases for DHA and the relative resistance of DHA to β-
oxidation stemming from the complex catabolic pathway for this HUFA (Frøyland et
al., 2000). In spite of this selective retention of DHA, the contribution of the desaturase
and/or elongase activity upon its precursor (LNA) is very limited and, in consequence,
DHA and also EPA are essential and must be provided by the diet (Watanabe et al.,
1989; Watanabe, 1993; Ibeas et al., 1994; Izquierdo, 1996, et al., 2000; Montero et al.,

Chapter 3 Growth, feed utilization and body fatty acids
76
1998). Indeed, fish fed VOs showed a lower EPA in fillet than in the diets provided,
indicating that this fatty acid is not subject to specific retention. The same pattern was
found in previous studies and the authors suggested a preferential oxidation of EPA
over DHA in the muscle (Izquierdo et al., 1989a,b, 2005), since the mitochondrial
oxidation is predominant in the muscle (Froyland et al., 2000) and EPA had a high
affinity with this type of oxidation (mitochondrial beta-oxidation) (Madsen et al., 1998).
In addition, it has been demonstrated that DHA inhibits EPA incorporation into
phosphatidylcholine and phosphatidylethanolamine in sea bream larvae (Izquierdo et
al., 2000). Consequently, the fillet nutritional quality could be affected by high levels of
VO inclusion, due to the decrease of n-3 HUFAs, that are essential nutrients for human
health (Simopoulos, 1999; Sargent et al., 2001).
Humans are not very efficient at synthesizing very-long-chain PUFAs and it has
been postulated that this is because they have evolved with diets abundant in fish and
game meats, which are quite rich in these types of fats (Cordain et al., 2000, 2005). It is
thought that a deficiency of n-3 HUFA, especially EPA and DHA found in FO, can be
linked to many inflammatory diseases of the developed world, such as cardiovascular
disease and inflammatory disorders such as arthritis (Hibbeln et al., 2006). Furthermore,
DHA has been recognized as being vitally important for neural function, and a
deficiency of this HUFA has been linked to depression, cognitive disorders, and mental
illness (Conklin et al., 2007).
In turn, C18 fatty acids are selectively deposited in flesh, when present at high
concentrations in the diet (Bell et al., 2001, 2002, 2003; Caballero et al., 2002;
Izquierdo et al., 2003, 2005, 2008). This suggests that the monoenes, mainly 18:1n-9, as
well as LA and LNA, are readily oxidized when present at high concentrations
(Mourente and Bell, 2006). In muscle, liver and gills, 18:2n-6 and 18:3n-3 were found
in much lower concentrations than in the diet when the fish were fed the VO diets,
indicating that when these FA were abundant in the diet they were selectively utilized
for metabolism, probably for energy production (Hendersen and Sargent, 1985;
Stubhaug et al., 2006). Interestingly, the concentration of 18:1n-9 in liver and gills was
higher than in the diet, suggesting a preferential retention, whereas in muscle presented
a higher content than in the diet only for fish fed 70S and 100S. The selective retention
of this FA in seabream, rather than mobilization for catabolism, may reflect its
structural function in membrane phospholipids where it is often found in the sn-1

Chapter 3 Growth, feed utilization and body fatty acids
77
position of phospholipids with HUFA being favoured in the sn-2 position (Bell and
Dick, 1991).
LO is rich in 18:3n-3 and previous studies have shown an increased tissue
content of this fatty acid and total n-3 when it is included in the diet (Izquierdo et al.,
2003, 2005; Menoyo et al., 2007). In the present study, feeding seabream with diets
containing increasing levels of LO significantly increased their content of 18:3n-3 in
muscle, liver and gills in a parallel manner. This fatty acid has been demonstrated to be
beneficial for human nutrition by improving many physiological functions (Ferretti and
Flanagan, 1996; Newcomer et al. 2001; Maillard et al., 2002; Brouwer et al., 2004),
including cardioprotective effects, modulation of inflammatory response, and a positive
impact on both central nervous system function and behaviour (Stark et al., 2008). In
addition, it is shown that this fatty acid reduced the number of cardiac deaths by 70% in
Mediterranean consumers (De Lorgeril et al., 1994, 1999) and it is also used in
livestock feeding (Sanderson et al., 2002). While SO contains high levels of LA, and is
readily available at a favourable price, several authors claim that higher levels of n-6
fatty acids present in some VOs can unbalance the dietary n-3/n-6 ratio and induce
arrhythmias which subsequently can lead to cardiac dysfunctions (Jouven et al., 2001;
Leaf, 2001); Thus, its inclusion in diets for fish should be limited due to the greater
reduction of the n-3/n-6 ratio that arises when using the product. In the present study,
different tissues from seabream fed SO showed a linear deposition of n-6, mainly LA,
with increasing SO inclusion level with a high positive correlation (Figure 3.2). Thus,
tailoring the fatty acid composition of farmed fish to suit consumer preference,
particularly from the point of view of supplying healthy food, was considered when
substituting FO with VOs in diet for marine fish. Previous studies have shown that
feeding seabream with diets containing a higher content of LA or LNA rich oils,
significantly increased the contents of these fatty acids in the flesh and consequently
reduced its quality for the consumer (Bell et al., 2001, 2002, 2003; Caballero et al.,
2002; Montero et al., 2003, 2005; Izquierdo et al., 2003, 2005).
In fish fed SO and LO, the muscle, liver and gills presented higher levels of
products of Δ6 desaturation and elongation from their C18 precursors, including 20:2n-6
and 20:3n-6, in SO fed fish and 20:3n-3 in LO fed fish, suggesting a more efficient
elongase than desaturase activity, specially for n-3 series. This was also found in
another study (not published data) showing higher delta 6 desaturase activity in fish fed
LO comparing to rapeseed oil or FO diet in several tissues such as intestine, liver but

Chapter 3 Growth, feed utilization and body fatty acids
78
with lower levels in the muscle, denoting the important roles of the first 2 organs in
lipid metabolism. 20:3n-3 was 9 fold higher in fish fed LO compared to the control,
while 20:2n-6 was only increased 5 fold, while 20:3n-6 was only increased 2 fold,
which is in accordance with previous studies (Tocher et al., 2000; Menoyo et al., 2005).
Numerous mammalian studies have established that a fatty acid can compete and
influence the metabolism of another fatty acid (Garcia and Holman, 1965). In addition,
the n-3 PUFA are known to be usually more effective in inhibiting the metabolism of n-
6 PUFA than vice versa (Horrobin, 1991). The same effects were found in previous
studies analysing different tissues from the same species (Montero et al., 2005; Ganga
et al., 2005; Izquierdo et al., 2003, 2005) denoting the stimulation effect of VOs in
increasing the fatty acyl desaturation/elongation pathway (Bell et al., 2002; Tocher et
al., 2002, 2003). Therefore, in terms of product nutritional quality, there is a marked
effect of feeding VOs on seabream flesh quality expressed by its decreased content of n-
3 HUFAs.
Liver PUFA composition was affected by VO diets following a similar but more
extreme pattern than in the fish fillet (Montero et al., 2003; Izquierdo et al., 2003).
There was a selective retention of 16:0 and 18:1n-9 in VO treatments, which could be
considered as a lipid storage depot associated with reserves of metabolic energy rather
than an immediate synthesis of cell membrane phospholipids (Sargent et al., 2002).
Indeed, 16:0 and 18:1n-9 are the preferred substrates for β-oxidation in fish (Henderson
and Sargent, 1985, Torstensen et al., 2000). In addition, 18:1n-9, LA and LNA have
always shown lower concentrations in liver than in the diet (Bell et al., 1994, 2001,
2003; Caballero et al., 2002; Izquierdo et al., 2003, 2005) denoting their ready
oxidation when present at higher concentrations. As in flesh there is an increasing
amount of 20:2n-6, 20:3n-6 and 20:3n-3 in livers from fish fed VOs, denoting again the
presence of the desaturase and elongase activities in this metabolic tissue. The
decreased content of EPA and ARA when feeding VO, even when the levels of 20:3n-3
and 20:3n-3 are increased, may indicate that the Δ5 desaturase activity is very low if not
absent in marine fish (Ghioni et al., 1999; Tocher and Ghioni, 1999; Seiliez et al., 2003;
Izquierdo et al., 2008).
Gill fatty acids profiles showed the same parallel effects caused by the dietary
inputs with some exceptions, e.g. ARA content was 2 fold higher compared to the other
tissues. This organ has many vital physiological functions such as respiration and
osmoregulation. Thus, the fatty acid composition of this organ is determinant for its

Chapter 3 Growth, feed utilization and body fatty acids
79
optimal function. ARA is known to be the main eicosanoid precursor of highly active
hormones with many physiological functions (Horrobin et al., 1991; Bell et al., 1994).
Saturates were decreased in gills from fish fed different VOs compared to FO, while
MUFA were not significantly affected. Fish gill is a multifunctional organ that, in
addition to providing aquatic gas exchange, plays dominant roles in osmotic and ionic
regulation, acid-base regulation and excretion of nitrogenous wastes (Evans et al., 2005)
Thus all these functions need energy, largely from fatty acids, and especially saturates
and MUFA are considered as preferable for oxidation and energy production, as 16:0,
16:1 and 18:1n-9 have been demonstrated to be preferred substrates for β-oxidation
(Keissling, 1993; Henderson, 1996; Frøyland et al., 2000). In this experiment, MUFA
and saturates were more deposited in gills in comparison to the other tissues, suggesting
the role of these fatty acids might be to cope with the high energetic demands of this
organ. It is fairly well established that the ability of salmon to osmoregulate is directly
related to their diet and this may be mediated through changes in gill polar lipid
compositions, in particular ARA and EPA levels and the resultant effects on
prostaglandin production (Tocher et al., 2000).
Some scientists suggested that the retention efficiencies for the n-6 EFAs are
lower than n-3 fatty acids, and it is directly related to the quantities of n-6 EFAs present
in the diet. This suggests that the catabolic degradation of n-6 EFAs was relatively
lower when they were supplied in larger amounts via vegetable oils (Bendiksen and
Jobling, 2003) and this is in accordance with our results where we observed that the
incorporation of LA in muscle was slightly lower in 100SO compared to 70SO diets
(Table 3.5). The C18 fatty acids were incorporated more in the muscle compared to the
other tissues. Feeding seabream with VOs in previous studies has demonstrated that the
flesh content of n-3HUFA could be re-established by a finishing diet with FO for a
period of 3 months before harvesting (Izquierdo et al., 2005). Nevertheless, the lower
retention of n-6 fatty acids in comparison with n-3 EFAs may be indicative of higher
rates of oxidation of the n-6 fatty acids relative to n-3 fatty acids. The oxidation of DHA
in fish tissues is low, whereas LA is oxidized more readily (Henderson, 1996). In
addition, lipids that contain HUFAs are generally considered to be more easily digested
and absorbed than those containing less-unsaturated fatty acids (Henderson and Tocher,
1987; Higgs and Dong, 2000; Johnsen et al., 2000). As such, it is also possible that the
lower retention efficiency of the n-6 EFAs could also result from reduced digestion and
absorption in comparison with n-3 EFAs (Bendiksen and Jobling, 2003).

Chapter 3 Growth, feed utilization and body fatty acids
80
Tissue lipids of seabream are readily influenced by the fatty acid composition of
the diet. The present study clearly establishes linear correlations between the fatty acid
compositions of diets, and their incorporation in flesh and liver (Figure 3.2). These
correlations are of practical use for predicting outcomes of feeding different blends of a
given substituting oil in place of fish oil. They also reveal how different fatty acids in
dietary lipid are selected for or against retention relative to tissue lipids. Thus, when
substituting FO with VOs in diets for gilthead seabream, care should be taken to choose
the correct blend of VOs in order to maintain the adequate n-3/n-6 levels and guarantee
the final nutritional quality of the flesh. Given present concerns about imbalance of n-6
and n-3 PUFA in the diets of developed nations and the encouragement to consume oily
fish, such as mackerel, sardines, salmon and trout, it is important that cultured seabream
maintain a high level of essential (n-3) HUFA in the edible flesh.
References
Allen, D.A. (1995) Fish Oil Compositions. In Proceedings of a conference organised by
the SCI Oils & Fats Group in Hull, Uk 18-19 May 1995. Pages: 95-108. Edited
by Hamilton, R.J. and Rice, R.D.. PJ Barnes & Associates Bridgwater, UK.
Bell, J.G., Henderson, R.J., Tocher, D.R. and Sargent, J.R. (2004) Replacement of
dietary fish oil with increasing levels of linseed oil: modification of flesh fatty
acid compositions in Atlantic Salmon (Salmo salar) using a fish oil finishing
diet. Lipids, 39:223–232.
Bell, J.G., Henderson, R.J., Tocher, D.R., McGhee, F., Dick, J.R., Porter, A., Smullen,
R. and Sargent, J.R. (2002) Substituting fish oil with crude palm oil in the diet
of Atlantic salmon (Salmo salar) affects tissue fatty acid compositions and
hepatic fatty acid metabolism. J Nutr, 132:222–230.
Bell, J.G., McEvoy, J., Tocher, D.R., McGhee, F., Campbell, P.J. and Sargent, J.R.
(2001) Replacement of fish oil with rape seed oil in diets of Atlantic salmon
(Salmo salar) affects tissue lipid compositions and hepatocyte fatty acid
metabolism. J Nutr, 131:1535–1543.
Bell, J.G., Tocher, D.R. and Sargent, J.R. (1994) Effects of supplementation with 20:3n-
6, 20:4n-6 and 20:5n-3 on the production of the prostaglandins E and F of the 1,
2 and 3 series in turbot Scophthalmus maximus L. brain astroglial cells in
primary culture. Biochim Biophys Acta, 1211:335–342.

Chapter 3 Growth, feed utilization and body fatty acids
81
Bell, J.G., Tocher, D.R., Henderson, R.J., Dick, J.R. and Crampton, V.O. (2003)
Altered fatty acid compositions in Atlantic salmon (Salmo salar) fed diets
containing linseed and rapeseed oils can be partially restored by a subsequent
fish oil finishing diet. J Nutr, 133:2793–2801.
Bell, M.V. and Dick, J.R. (1991) Molecular species composition of the major diacyl
glycerophospholipids from muscle, liver, retina and brain of cod Gadus morhua.
Lipids, 26:565–573.
Bendiksen, E.A. and Jobling, M. (2003) Effects of temperature and feed composition on
essential fatty acid (n-3 and n-6) retention in Atlantic salmon (Salmo salar L.)
parr. Fish Physiol Biochem, 29:133-140.
Benedito-Palos, L., Saera-Vila, A., Calduch-Giner, J.A., Kaushik, S. and Pérez-
Sánchez, J. (2007) Combined replacement of fish meal and oil in practical diets
for fast growing juveniles of gilthead seabream (Sparus aurata L.): networking
of systemic and local components of GH/IGF axis. Aquaculture, 267:199-212.
Bransden, M.P., Carter, C.G. and Nichols, P.D . (2003) Replacement of fish oil with
sunflower oil in feeds for Atlantic salmon (Salmo salar L.) : effect on growth
performance, tissue fatty acid composition and disease resistance. Comparative
Biochemistry and Physiology Part B, 135:611-625.
Brouwer, I.A., Katan, M.B. and Zock, P.L. (2004) Dietary alpha-linolenic acid is
associated with reduced risk of fatal coronary heart disease, but increased
prostate cancer risk: a meta-analysis. J Nutr, 134:919-922.
Caballero, M.J., Gallardo, G., Robaina, L., Montero, D., Fernández, A. and Izquierdo,
M.S. (2006) Vegetable lipid sources affect in vitro biosynthesis of
triacylglycerols and phospholipids in the intestine of seabream (Sparus aurata).
British Journal of Nutrition, 95:448–454
Caballero, M.J., Izquierdo, M.S., Kjørsvik, E., Fernández, A.J. and Rosenlund, G.
(2004) Histological alterations in the liver of seabream, Sparus aurata L.,
caused by short- or long-term feeding with vegetable oils. Recovery of normal
morphology after feeding fish oil as the sole lipid source. Journal of Fish
Diseases, 27:531–541
Caballero, M.J., Obach, A., Rosenlund, G., Montero, D., Gisvold, M. and Izquierdo,
M.S. (2002) Impact of different dietary lipid sources on growth, lipid
digestibility, tissue fatty acid composition and histology of rainbow trout,
Oncorhynchus mykiss. Aquaculture, 214:253–271.

Chapter 3 Growth, feed utilization and body fatty acids
82
Calder, P.C. and Burdge, G.C. (2004) Fatty acids. In: Bioactive Lipids, pp. 1-36 (A.
Nicolaou and G. Kokotos, editors). Bridgewater : The Oily Press.
Castell, J.D., Bell, J.G., Tocher, D.R. and Sargent, J.R. (1994) Effects of purified diets
containing different combinations of arachidonic and docosahexaenoic acid on
survival, growth and fatty acid composition of juvenile turbot (Scophthalmus
maximus). Aquaculture, 128:315– 333.
Christie, W.W., 1982. Lipid Analysis. Pergamon Press, Oxford.
Conklin, S.M., Harris, J.I., Manuck, S.B., Yao, J.K., Hibbeln, J.R. and Muldoon, M.F.
(2007) Serum omega-3 fatty acids are associated with variation in mood,
personality and behavior in hypercholesterolemic community volunteers.
Psychiatry Res, 152:1–10
Cordain, L., Brand-Miller, J., Eaton, S.B., Mann, N., Holt, S.H.A. and Speth. J.D.
(2000) Plant-animal subsistence ratios and macronutrient energy estimations in
worldwide hunter-gatherer diets. Am J Clin Nutr, 71:682–692.
Cordain, L., Eaton, S.B., Sebastian, A., Mann, N., Lindeberg, S., Watkins, A., O'Keefe,
J.H. and Brand-Miller, J. (2005) Origins and evolution of the Western diet:
health implications for the 21st century. Am J Clin Nutr, 81:341–354.
Craig-Schmidt, M.C. (2001) Isomeric fatty acids: Evaluating status and implications for
maternal and child health. Lipids, 36:997-1006
Di Lorgeril, M., Renaud, S., Mamelle, N., Salen, P., Martin, J.L., Monjaud, I.,
Guidollet, J., Touboul, P. and Delaye, J. (1994) Mediterranean alpha-linolenic
acid-rich diet in secondary prevention of coronary heart disease. Lancet,
343:1454–1459.
Di Lorgeril, M., Salen, P., Martin, J.L., Monjaud, I., Delaye, J. and Mamelle, N. (1999)
Mediterranean diet, traditional risk factors, and the rate of cardiovascular
complications after myocardial infarction: final report of the Lyon Diet Heart
Study. Circulation, 99:779– 785.
Evans, D.H., Piermarini, P.M. and Choe, K.P. (2005) The multifunctional fish gill:
dominant site of gas exchange, osmoregulation, acid-base regulation, and
excretion of nitrogenous waste. Physiol Rev, 85:97-177.
FAO (Food and Agriculture Organization of the United Nations) (2007a) State of World
Aquaculture 2006. FAO Fisheries Technical Paper Nº. 500. FAO Fisheries
Department; Food and Agriculture Organization of the United Nations, Rome.

Chapter 3 Growth, feed utilization and body fatty acids
83
FAO (Food and Agriculture Organization of the United Nations) (2007b) Use of Wild
Fish and/or Other Aquatic Species to Feed Cultured Fish and its Implications to
Food Security and Poverty Alleviation. FAO Expert Workshop. FAO Fisheries
Department; Food and Agriculture Organization of the United Nations and
Marine Export Development Authority, Government of India, 16-18 November
2007, Kochi, India.
Ferretti, A. and Flanagan, V. (1996) Antithromboxane activity of dietary alpha-linolenic
acid: a pilot study. Prostaglandins and Leukotrienes Essential Fatty Acids,
54:451-455.
Folch, J., Lees, M. and Stanley, G.H.S. (1957) A simple method for the isolation and
purification of total lipids from animal tissues. J Biol Chem, 226:497-509.
Frøyland, L., Lie, O. and Berge, R.K. (2000) Mitochondrial and peroxisomal beta-
oxidation capacities in various tissues from Atlantic salmon Salmo salar. Aquac
Nutr, 6:85-89.
Ganga, R., Bell, J.G., Montero, D., Robaina, L., Caballero, M.J. and Izquierdo, M.S.,
2005. Effect of dietary lipids on plasma fatty acid profiles and prostaglandin and
leptin production in gilthead seabream (Sparus aurata). Comparative
Biochemistry and Physiology Part B: Biochemistry and Molecular Biology,
142:410–418.
García, P.T. and Holman, R.T. (1965) Competitive inhibitions in the metabolism of
polyunsaturated fatty acids studied via the composition of phospholipids,
triglycerides and cholesteryl esters of rat tissues. J Am Oil Chem Soc, 42:1137-
1141.
Ghioni, C., Tocher, D.R., Bell, M.V., Dick, J.R. and Sargent ,J.R. (1999) Low C18 to
C20 fatty acid elongase activity and limited conversion of stearidonic acid,
18:4n-3, to eicosapentaenoic acid, 20:5n-3, in a cell line from the turbot,
Scophthalmus maximus. Biochem Biophys Acta, 1437:170-181.
Grisdale-Helland, B., Ruyter, B., Rosenlund, G., Obach, A., Helland, S.J., Gisvold, M.,
Standal, H. and Røsjø, C. (2002) Influence of high contents of dietary soybean
oil on growth, feed utilization, tissue fatty acid composition, heart histlogy and
standard oxygen consumption of Atlantic salmon raised at two temperatures.
Aquaculture, 207:311-329.
Henderson, R.J. and Tocher, D.R. (1987) The lipid composition and biochemistry of
freshwater fish. Prog Lipid Res, 26:281–347.

Chapter 3 Growth, feed utilization and body fatty acids
84
Henderson, R.J. (1996) Fatty acid metabolism in freshwater fish with particular
references to polyunsaturated fatty acids. Archives of Animal Nutrition, 49:5-22.
Henderson, R.J. and Sargent, J.R. (1985) Chain length specificities of mitochondrial
and peroxisomal b-oxidation of fatty acids in rainbow trout (Salmo gairdneri).
Comp Biochem Physiol, 82B:79–85.
Hibbeln, J.R., Nieminen, L.R.G., Blasbalg, T.L., Riggs, J.A. and Lands, W.E.M. (2006)
Healthy intakes of n-3 and n-6 fatty acids: estimations considering worldwide
diversity. Am J Clin Nutr (Suppl), 83:1483s–1493s
Higgs, D.A. and Dong, F.M. (2000) Lipids and fatty acids. In: Stickney, R. (Ed.),
Encyclopedia of Aquaculture. Wiley-Interscience, London, pp. 476–496.
Horrobin, D.F. (1991) Interactions between n-3 and n-6 essential fatty acids (EFAs) in
the regulation of cardiovascular disorders and inflammation. Prostaglandins
Leukot Essent Fatty Acids, 44:127-131.
Ibeas, C., Izquierdo, M.S. and Lorenzo, A. (1994) Effect of different levels of n-3
highly unsaturated fatty acids on growth and fatty acid composition of juvenile
gilthead seabream (Sparus aurata). Aquaculture, 127:177–188.
Izquierdo, M.S., Montero, D., Robaina, L., Caballero, M.J., Rosenlund, G. and Ginés,
R. (2005) Alterations in fillet fatty acid profile and flesh quality in gilthead
seabrem (Sparus aurata) fed vegetable oils for a long term period. Recovery of
fatty acid profiles by fish oil feeding. Aquaculture, 250:431-444.
Izquierdo, M.S. (1996) Review article: essential fatty acid requirements of cultured
marine fish larvae. Aquac Nutr, 2:183–191.
Izquierdo, M.S., Robaina, L., Juárez-Carrilo, E., Oliva, V., Hernández-Cruz, C.M. and
Afonso, J.M. (2008) Regulation of growth, fatty acid composition and delta 6
desaturase expression by dietary lipids in gilthead seabream larvae Sparus
aurata. Fish Physiol Biochem, 34:117-127.
Izquierdo, M., Watanabe, T., Takeuchi, T., Arakawa, T. and Kitajima, C. (1990)
Optimum EFA levels in Artemia to meet the EFA requirements of red seabream
(Pagrus major). In: Takeda, M., Watanabe, T. (Eds.), The current Status of Fish
Nutrition in Aquaculture. Tokyo Univ. Fisheries, Tokyo, pp. 221– 232.
Izquierdo, M.S. (1988) Estudio de los requerimientos de ácidos grasos esenciales en
larvas de peces marinos. Modificación de la composición lipídica de las presas.
Thesis Doctoral, La Laguna University, Spain.

Chapter 3 Growth, feed utilization and body fatty acids
85
Izquierdo, M.S., Obach. A., Arantzamendi, L., Montero, D., Robaina, L. and Rosenlund
G. (2003) Dietary lipid sources for seabream and sea bass: growth performance,
tissue composition and flesh quality. Aquacult Nutr, 9:397–407.
Izquierdo, M.S., Socorro, J., Arantzamendi, L. and Hernandez-Cruz, C.M. (2000)
Recent advances in lipid nutrition in fish larvae. Fish Physiol Biochem, 22:97–
107.
Izquierdo, M.S., Tandler, A., Salhi, M. and Kolkkovski, S. (2001) Influence of dietary
polar lipids quantity and quality on ingestion and assimilation of labelled fatty
acids by larval gilthead seabream. Aquacult Nutr, 6:153–160.
Izquierdo, M.S., Watanabe, T., Takeuchi, T., Arakawa, T. and Kitajima, C. (1989a)
Optimal EFA levels in Artemia to meet the EFA requirements of red seabream
Pagrus major. In: Takeda, M., Watanabe, T. _Eds., The Current Status of Fish
Nutrition in Aquaculture. Japan Translation Centre, Tokyo, Japan, pp. 221–232.
Izquierdo, M.S., Watanabe, T., Takeuchi, T., Arakawa, T. and Kitajima, C. (1989b)
Requirement of larval red seabream Pagrus major for essential fatty acids.
Nippon Suisan Gakkaishi, 55:859–867.
Jobling, M., Leknes, O., Saether, B-J. and Bendiksen, E.A. (2008) Lipid and fatty acid
dynamics in Atlantic cod, Gadus morhua, tissues: Influence of dietary lipid
concentrations and feed oil sources. Aquaculture, 281:87-94.
Johnsen, R.I., Grahl-Nielsen, O. and Roem, A. (2000) Relative absorption of fatty acids
by Atlantic salmon Salmo Salar from different diets, as evaluated by
multivariate statistics. Aquacult Nutr, 6:255-261.
Jouven, X., Charles, M.A., Desnos, M. and Ducimetière, P. (2001) Circulating
nonesterified fatty acid level as a predictive risk factor for sudden death in the
population. Circulation, 104:756-761.
Kalogeropoulos, N., Alexis, M.N. and Henderson, R.J. (1992) Effect of dietary soybean
and cod-liver oil levels on growth and body composition of gilthead bream
(Sparus aurata). Aquaculture, 104:293– 308.
Keissling, A. (1993) Influence of ration and exercice on the performance and flesh
quality of cultured salmonids. Proc. Aquaculture Industry Development Rep.
Nutritional Interrelationships in Aquaculture, feeding and social behaviour in
salmonid fish. Ed. E. Ming. Vancouver, B.C., Canada, pp 14-22.
Leaf, A. (2001) Plasma nonesterified fatty acid concentration as a risk factor for sudden
cardiac death: the Paris prospective study. Circulation, 104:744-745.

Chapter 3 Growth, feed utilization and body fatty acids
86
Madsen, L., Froyland, L., Dyroy, E., Helland, K. and Berge, R.K. (1998)
Docosahexaenoic and eicosapentaenoic acids are differently metabolized in rat
liver during mitochondria and peroxisome proliferation. J Lipid Res, 39:583-
593.
Maillard, V., Bougnoux, P., Ferrari, P., Jourdan, M.L., Pinault, M., Lavillonnière, Body,
G., Le Floch, O. and Chajès, V. (2002) N-3 and N-6 fatty acids in breast adipose
tissue and relative risk of breast cancer in a case-control study in Tours, France.
Int J Cancer, 98 (1):78-83
Menoyo, D., Lopez-Bote, C.J., Biez, A., Obach, A. and Bautista, J.M. (2007) Impact of
n-3 fatty acid chain length and n-3/n-6 ratio in Atlantic salmon (Salmo salar)
diets. Aquaculture, 267:248-259.
Menoyo, D., López-Bote, C.J., Obach, A. and Bautista, J.M. (2005) Effect of dietary
fish oil substitution with linseed oil on the performance, tissue fatty acid profile,
metabolism, and oxidative stability of Atlantic salmon. J Anim Sci, 83:2853-
2862.
Montero, D., Grasso, V., Izquierdo, M.S., Ganga, R., Real, F., Tort, L., Caballero, M.J.
and Acosta, F. (2008) Total substitution of fish oil by vegetable oils in gilthead
seabream (Sparus aurata) diets: Effects on hepatic Mx expression and some
immune parameters. Fish & Shellfish Immunology, 24:147-155
Montero, D., Kalinowski, T., Obach, A., Robaina, L., Tort, L., Caballero, M.J. and
Izquierdo, M.S. (2003) Vegetable lipid sources for gilthead seabream (Sparus
aurata): effects on fish health. Aquaculture, 225:270–353.
Montero, D., Robaina, L., Caballero, M.J., Gines, R. and Izquierdo, M.S. (2005)
Growth, feed utilization and flesh quality of European sea bass (Dicentrarchus
labrax) fed diets containing vegetable oils: A time-course study on the effect of
a re-feeding period with a 100% fish oil diet. Aquaculture, 248:121–134.
Montero, D., Tort, L., Izquierdo, M.S., Robaina, L. and Vergara, J.M. (1998) Depletion
of serum alternative complement pathway activity in gilthead seabream caused
by α-tocopherol and n-3 HUFA dietary deficiencies. Fish Physiology and
Biochemistry, 18:399–407.
Montero, D., Tort, L., Izquierdo, M.S., Socorro, J., Robaina, L., Vergara, J.M. and
Fernández-Palacios, H. (1996) Effect of alphatocopherol and n - 3 HUFA
deficient diets on blood cells, selected immune parameters and proximate body
composition of gilthead seabream (Sparus aurata). In: Modulators of Immune

Chapter 3 Growth, feed utilization and body fatty acids
87
Response. The Evolutionary Trail (Stolen, J.S., Fletcher, T.C., Bayne, C.J.,
Secombes, C.J., Zelikoff, J.L., Twerdock, L., & Anderson D.P., eds.) pp. 251–
266. S.O.S.
Mourente, G. and Bell, J.G. (2006) Partial replacement of dietary fish oil with blends of
vegetable oils (rapeseed, linseed and palm oils) in diets for European sea bass
(Dicentrarchus labrax L.) over the whole production cycle: effects on flesh and
liver fatty acid composition and effectiveness of a fish oil finishing diet. Comp
Biochem Physiol, 145B:389-399.
Newcomer, L.M., King, I.B., Wicklund, K.G. and Standfor, J.L. (2001) The association
of fatty acid with prostate cancer. Prostate, 47:262-268.
Regost, C., Arzel, J., Cardinal, M., Rosenlund, G. and Kaushik, S.J. (2003b) Total
replacement of fish oil by soybean oil with return to fish oil in turbot (Psetta
maxima): II. Flesh quality properties. Aquaculture, 220:737–745.
Regost, C., Arzel, J., Robin, J., Roselund, G. and Kaushik, J. (2003a) Total replacement
of fish oil by soybean oil with return to fish oil in turbot (Psetta maxima):
Growth performance, flesh fatty acid profile, and lipid metabolism. Aquaculture,
217:465–482.
Robaina, L., Izquierdo, M.S., Moyano, F.J., Socorro, J., Vergara, J.M. and Montero, D.
(1998) Increase of the dietary n-3/n-6 fatty acid ratio and addition of phosphorus
improves liver histological alterations induced by feeding diets containing
soybean meal to gilthead seabream, Sparus aurata. Aquaculture, 161:281–293
Sanders, T.A.B. (1993) Marine oils: metabolic effects and role in human nutrition. Proc
Nutr Soc, 2:457-472.
Sanderson, P., Finnegan, Y.E., Williams, C.M., Calder, P.C., Burdge, G.C., Wooton,
S.A., Griffin, B.A., Millward, D.J., Pegge, N.C. and Bemelmans, W.J.E. (2002)
U.K. Food Standards Agency {alpha}-linolenic acid workshop report. Br J Nutr,
88:573-579.
Sargent, J., Bell, G., McEvoy, L., Tocher, D. and Estevez, A. (1999) Recent
developments in the essential fatty acid nutrition of fish. Aquaculture, 177:191–
199.
Sargent, J., Henderson, R.J. and Tocher, D.R. (1989) The lipids, In: Halver, J.E. (Ed.),
Fish Nutrition, 2a ed. Academic Press, London, pp. 154–209.

Chapter 3 Growth, feed utilization and body fatty acids
88
Sargent, J.R., Bell, J.G., McGhee, J., McEvoy, J. and Webster, J.L. (2001) The
nutritional value of fish. In: Kestin, S.C., Warriss, P.D. (Eds.), Farmed Fish
Quality. Fishing News Books. Blackwell Science Ltd., Oxford, pp. 3–12.
Sargent, J.R., Tocher, D.R. and Bell, J.G. (2002) The lipids. In: Halver, J.E., Hardy,
R.W. (Eds.), Fish Nutrition, 3rd ed. Elsevier, USA, pp. 181–257.
Seiliez, I., Panserat, S., Corraze, G., Kaushik, S. and Bergot, P. (2003) Cloning and
nutritional regulation of a Δ6-desaturase-like enzyme in marine teleost gilthead
seabream (Sparus aurata). Comparative biochemistry and physiology, Part B:
Biochemistry and Molecular Biology, 135:449-460.
Simopoulos, A.P. (1999) Essential fatty acids in health and chronic disease. Am J Nutr,
70:560S–569S.
Simopoulos, A.P. (2008) The importance of the omega-6/omega-3 fatty acid ratio in
cardiovascular disease and other chronic diseases. Experimental Biology and
Medicine, 233:674-688.
Sokal RR and Rolf SJ (1995) Biometry. In The Principles and Practice of Statistics in
Biological Research. Edn 3, p 419. New York: WH Freeman and Company.
Stark, A.H., Crawford, M.A. and Reifen, R. (2008) Update on alpha-linolenic acid.
Nutrition reviews, 66:326-332.
Stubhaug, I., Lie, Ø. and Torstensen, B.E. (2006) b-oxidation capacity in liver increases
during parr-smolt transformation of Atlantic salmon (Salmo salar L.) fed
vegetable- and fish oil. Journal of Fish Biology, 69:504-517.
Tacon, A.G.J. (2004) Use of fish meal and fish oil in aquaculture: a global perspective.
Aquatic Resources, Culture & Development, 1(1):3-14.
Tocher D.R., Mourente G., Van der Eecken A., Evjemo J.O., Diaz E., Wille M., Bell
J.G., and Olsen, Y. (2003) Comparative study of antioxidant defence
mechanisms in marine fish fed variable levels of oxidised oil and vitamin E.
Aquaculture International, 11:195–216.
Tocher, D. R. and Ghioni C. (1999) Fatty acid metabolism in marine fish: low activity
of fatty acyl delta5 desaturation in gilthead seabream (Sparus aurata) cells.
Lipids, 34(5):433-440.
Tocher, D.R., Bell, J.G., Dick, J.R., Henderson, R.J., McGhee, F., Mitchell, D. and
Morris, P.C. (2000) Polyunsaturated fatty acid metabolism in Atlantic salmon
(Salmo salar) undergoing parr– smolt transformation and the effects of dietary
linseed and rapeseed oils. Fish Phys Biochem, 23:59–73.

Chapter 3 Growth, feed utilization and body fatty acids
89
Tocher, J. Fonseca-Madrigal, J.G. Bell, J.R. Dick, R.J. Henderson, J.R. and Sargent, J.
(2002) Effects of diets containing linseed oil on fatty acid desaturation and
oxidation in hepatocytes and intestinal enterocytes in Atlantic salmon (Salmo
salar). Fish Physiol Biochem, 26:157–170.
Torstensen, B.E., Lie, O. and Froyland, L. (2000) Lipid metabolism and tissue
composition in Atlantic salmon (Salmo salar L.) effects of capelin oil, palm oil
and oleic acid-enriched sunflower oil as dietary lipid sources. Lipids, 35:653-
664.
Watanabe, T. (1993) Importance of docosahexanoic acid in marine larval fish. J World
Aquacult Soc, 24:152–161.
Watanabe, T., Izquierdo, M.S., Takeuchi, T., Satoh, S. and Kitajima, C. (1989)
Comparison between eicosapentaenoic and docosahexaenoic acids in terms of
essential fatty acid efficacy in larval red seabream. Nippon Suisan gakkaishi,
55(9):1635-1640.
Watanabe, T., Kitajima, C. and Fujita, S. (1983) Nutritional value of live organisms
used in Japan for mass propagation of fish: a review. Aquaculture, 34:115–143.
Watanabe, T., Ohta, M., Kitajima, C. and Fujita, S. (1982) Improvement of dietary
value of brine shrimp Artemia salina for fish larvae by feeding them on w3
highly unsaturated fatty acids. Nippon Suisan Gakkaishi, 48:1775–1782.
Yaqoob, P. and Calder, P.C. (2007) Fatty acids and immune function : new insights into
mechanisms. British Journal of Nutrition, 98 (1):S41-S45.

Chapter 3 Growth, feed utilization and body fatty acids
90

Chapter 4
Stress response in seabream (Sparus aurata) held under
crowded conditions and fed diets with different levels of
inclusion of linseed and/or soybean oil
Rachid Ganga, Bell, J.G., Montero, D., Fernández-Vaquero, A.,
Tort, L., Acerete, L., Benitez Santana, T. and Izquierdo, M.S.
To be submitted
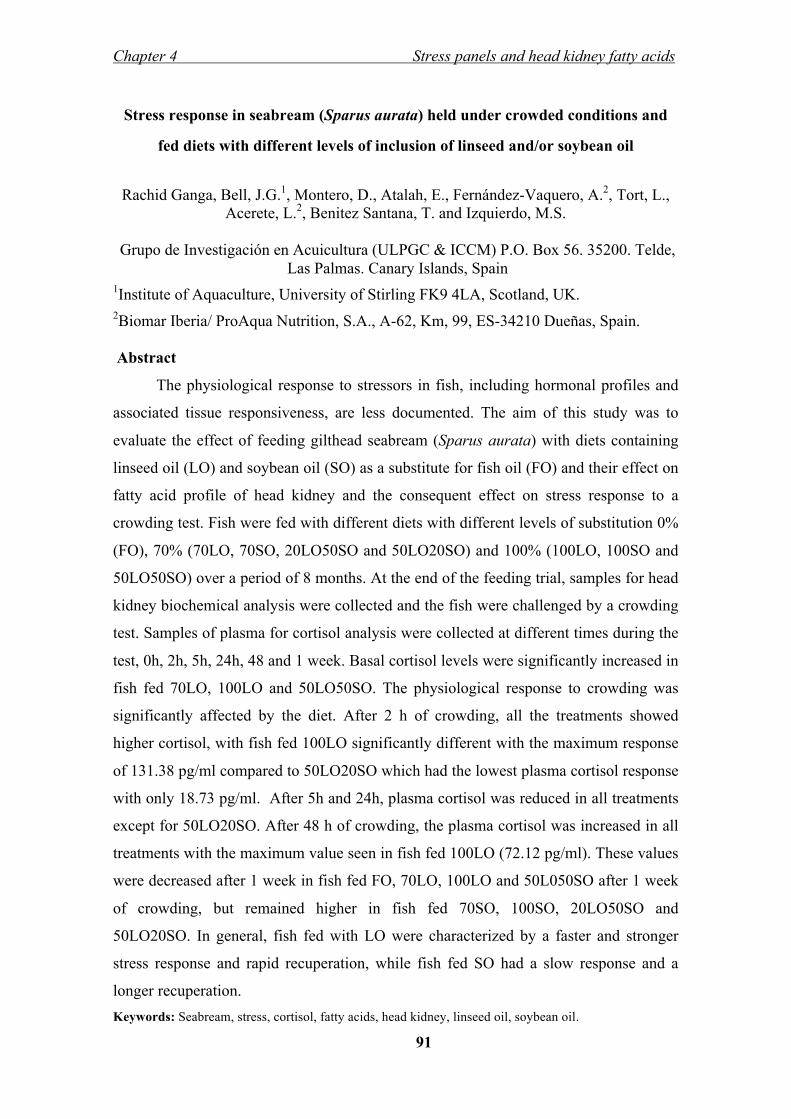
Chapter 4 Stress panels and head kidney fatty acids
91
Stress response in seabream (Sparus aurata) held under crowded conditions and
fed diets with different levels of inclusion of linseed and/or soybean oil
Rachid Ganga, Bell, J.G.1, Montero, D., Atalah, E., Fernández-Vaquero, A.2, Tort, L., Acerete, L.2, Benitez Santana, T. and Izquierdo, M.S.
Grupo de Investigación en Acuicultura (ULPGC & ICCM) P.O. Box 56. 35200. Telde,
Las Palmas. Canary Islands, Spain 1Institute of Aquaculture, University of Stirling FK9 4LA, Scotland, UK. 2Biomar Iberia/ ProAqua Nutrition, S.A., A-62, Km, 99, ES-34210 Dueñas, Spain. Abstract
The physiological response to stressors in fish, including hormonal profiles and
associated tissue responsiveness, are less documented. The aim of this study was to
evaluate the effect of feeding gilthead seabream (Sparus aurata) with diets containing
linseed oil (LO) and soybean oil (SO) as a substitute for fish oil (FO) and their effect on
fatty acid profile of head kidney and the consequent effect on stress response to a
crowding test. Fish were fed with different diets with different levels of substitution 0%
(FO), 70% (70LO, 70SO, 20LO50SO and 50LO20SO) and 100% (100LO, 100SO and
50LO50SO) over a period of 8 months. At the end of the feeding trial, samples for head
kidney biochemical analysis were collected and the fish were challenged by a crowding
test. Samples of plasma for cortisol analysis were collected at different times during the
test, 0h, 2h, 5h, 24h, 48 and 1 week. Basal cortisol levels were significantly increased in
fish fed 70LO, 100LO and 50LO50SO. The physiological response to crowding was
significantly affected by the diet. After 2 h of crowding, all the treatments showed
higher cortisol, with fish fed 100LO significantly different with the maximum response
of 131.38 pg/ml compared to 50LO20SO which had the lowest plasma cortisol response
with only 18.73 pg/ml. After 5h and 24h, plasma cortisol was reduced in all treatments
except for 50LO20SO. After 48 h of crowding, the plasma cortisol was increased in all
treatments with the maximum value seen in fish fed 100LO (72.12 pg/ml). These values
were decreased after 1 week in fish fed FO, 70LO, 100LO and 50L050SO after 1 week
of crowding, but remained higher in fish fed 70SO, 100SO, 20LO50SO and
50LO20SO. In general, fish fed with LO were characterized by a faster and stronger
stress response and rapid recuperation, while fish fed SO had a slow response and a
longer recuperation.
Keywords: Seabream, stress, cortisol, fatty acids, head kidney, linseed oil, soybean oil.

Chapter 4 Stress panels and head kidney fatty acids
92
Introduction
Finfish aquaculture has traditionally used diets containing large amounts of fish
meal (FM) and fish oil (FO), primarily as a cost-effective source of highly digestible
animal protein and lipids. Moreover, FO is an important dietary source of omega-3
fatty acids, and in particular the long chain polyunstaurated fatty acids (PUFA),
eicosapentaenoic acid (EPA, 20:5n-3) and docosahexaenoic acid (DHA, 22:6n-3)
(Ackman, 1989; Henderson and Tocher, 1987). In particular, FO is important in fish
nutrition as it is used as the main source of these essential fatty acids (EFA) required
for fish to ensure optimal growth, development and reproduction (Izquierdo et al.,
1989; Sargent et al., 1999). The steady increase in global production volume in
aquaculture of 8-10% a year (Tacon, 2004, 2006) has resulted in increasing prices and
limited availability of these ingredients in the market. Consequently, it is expected that
the demand for FO by aquaculture will probably exceed available resources over the
next decade (Pike and Barlow, 2003; Tacon, 2004, 2005). Therefore, recently much
interest has focused on researching alternatives to FO and FM in aquafeeds, and many
studies have reported the successful use of vegetable oils (VO) and vegetable proteins
as good substitutes without compromising fish growth or feed utilization (Bell et al.,
2001, 2002; Torstensen et al., 2000; Caballero et al., 2002; Montero et al., 2003, 2005;
Izquierdo et al., 2003, 2005).
VOs are devoid of C20 n-3 PUFA, including EPA and DHA while the levels of
C18 PUFA, linoleic acid (LA; 18:2n-6), linolenic acid (LNA; 18:3n-3) and
monounsaturated fatty acids (MUFA; mainly oleic acid OA, 18:1n-9) are high in VO.
Thus, including VOs in diets for marine fish have been found to lead to increased C18
PUFAs and reduced n-3 HUFA in the flesh of the fish, potentially compromising the
nutritional quality to consumers (Bell et al., 2001, 2002; Torstensen et al., 2000;
Montero et al., 2003, 2005; Izquierdo et al., 2003, 2005). In addition, modifying the
fatty acid profiles of fish tissue by reducing its HUFA content could have many
physiological and metabolic impacts in fish; since these components have important
roles in metabolism, cannot be synthesized de novo and, therefore, must be obtained
from the diet (Ghioni et al., 1999). Alteration of the phospholipid composition may
induce structural modifications that in turn modulate the functional properties of the
membranes (Wills, 1985; Christon et al., 1992), indicating the fundamental relationship
between nutrition and animal's responses to its environment.
PUFA/HUFA are membrane components, sources of energy and cell mediators

Chapter 4 Stress panels and head kidney fatty acids
93
that are essential for cell structure and function. It is well documented that dietary fat
can influence the fatty acid compositions of different fish tissues, including those of
cell membranes (Bell et al., 2001, 2002; Izquierdo et al., 2003). They may alter various
properties of the membranes such as integrity, fluidity, permeability, distribution and
numbers of receptor sites (Yaqoob, 1998). HUFAs are also precursors of a range of
highly active C20 compounds called eicosanoids, that are formed in small or even trace
amounts by virtually every tissue of the body and involved in a wide variety of
physiological functions (Bell et al., 1991). In broad terms they are produced in
response to stressful situations, both at cellular and whole body level. In fish, HUFA
are reported to modulate stress response (Montero et al., 1998, 2003; Tago et al.,
1999). Whereas, the mechanisms by which HUFA could modulate fish resistance to
stress are still unknown, some recent studies have suggested that these effects could be
mediated partly by eicosanoids (Koven et al., 2001a,b; Van Anholt et al., 2004a,b;
Ganga et al., 2006). Thus, incubating head kidney tissue with different HUFA in an in
vitro superfusion system affected significantly their ACTH-stimulated cortisol release,
and this effect was partly mediated by cycloxygenase (COX) and lipoxygenase (LOX)
metabolites (Ganga et al., 2006).
There is a trend towards increased concern in animal welfare and, recently, this
concern has expanded to include the welfare of fish. High densities are generally used
in intensive aquaculture compared to the wild fisheries (Turnbull et al., 2005) to
improve business profitability. Generally this practice is considered as a potential
source of stress, with a negative effect on fish growth rate and welfare (Lefrançois et
al., 2001; Ellis et al., 2002; Van de Nieuwegiessen et al., 2008, 2009), survival and
feeding rate (Rowland et al., 2006). In teleosts, the stress response comprises of a
number of physiological processes, which are largely regulated by the hypothalamus-
pituitary-interrenal (HPI) axis. Following exposure to a stressor, the hypothalamus
secretes corticotropin-releasing hormone (CRH), which stimulates the pituitary to
secrete adrenocorticotropin hormone (ACTH). Binding of ACTH to membrane
receptors of the steroidogenic cells activates a series of enzymatic reactions using
cholesterol as a substrate for the synthesis of cortisol (Patiño et al., 1986; Lacroix and
Hontela, 2001). Cortisol production is under the control of the HPI axis activation
(Wendelaar Bonga, 1997; Mommsen et al., 1999) and is considered a key response to
stress, in order to cope with the physiological changes and to recover homeostasis.
Several studies have reported a relationship between the stress response in fish under

Chapter 4 Stress panels and head kidney fatty acids
94
crowded conditions and increased plasma-cortisol levels (Montero et al., 1999; Ruane
and Komen, 2003; Trenzado et al., 2006; Van de Nieuwegiessen et al., 2008, 2009).
Although plasma cortisol response to stressors is well established in teleosts, the
magnitude and duration of this steroid response is dependent upon the type, intensity
and duration of the stressor as well as the history of the animal (Wendelaar Bonga,
1997; Iwama et al., 2006) as well as the feeding history being crucial in determining
the stress response. Under conditions of acute stress, cortisol elevation usually lasts
hours, but with chronic stress, such as prolonged confinement, values may remain high
for days or weeks (Pickering and Pottinger, 1989; Iwama et al., 2006), only returning to
basal values over considerable time (Pickering and Stewart, 1984).
The aim of the present study was to contribute to our understanding of how
feeding lipid from vegetable sources (LO and SO), rich in C18 fatty acids (mainly LA,
LNA and OA), could affect fatty acid metabolism and their incorporation in head
kidney tissue and their consequent effect on stress resistance caused by crowding. This
was studied by measuring the plasma basal and post-stress cortisol levels.
Materials and Methods
Fish and Diets
Two thousand two hundred and fifty juveniles of gilthead seabream (Sparus
aurata) (45 g initial body weight) were distributed in 45 tanks of 500 l (50 fish/tank,
each diet assayed in triplicate) supplied with seawater at a temperature ranging from
20-24.2 ºC and constant aeration. Five iso-energetic and isonitrogenous diets with lipid
content ~22 % were formulated. Anchovy oil was the only added lipid source in the
FO diet (fish oil). In the other diets, fish oil was replaced by linseed (LO) or soybean
oil (SO) oils at 70% (70LO and 70SO, 20LO50SO, 50LO20SO) or 100% (100LO,
100SO and 50LO50SO). Fish were fed the experimental diets containing different
ingredients (Table 4.1) until apparent satiation (3 times/day, 6 days/ week) for 240
days, when they reached commercial market size.

Chapter 4 Stress panels and head kidney fatty acids
95
Table 4.1: Ingredients of the experimental diets used
% of dry weight
Oils (Fish oila/linseed/soybean) 16.32
South-American fish meal 47.26
Wheat 7.00
Soybean meal 47%b 25.00
Sunflower meal 3.67
Vitamins premixc 0.27
Minerals premixc 0.48
a South-american, anchovy oil. b Soybean meal with 47% as a brut protein, “no GMO” c Vitamin and mineral premixes prepared according to Proaqua A/S commercial standards.
Biochemical analysis
Extraction of total lipid from diets and fish head kidney was performed by the
method of Folch et al. (1957) using a mixture of chloroform: methanol (2:1)(v:v)
containing 0.01% BHT, as an antioxidant, followed by phase partition with KCl (0.88
%). Vigorous vortex mixing followed by centrifugation to assist separation of
chloroform and aqueous layers extracted the lipids from diet and head kidney samples.
The lower layer was filtered through Whatman filter paper and dried under nitrogen,
total lipids were weighed following desiccation.
Fatty acid methyl esters were produced from aliquots of total lipids extracted
from different samples by acid-catalyzed transmethylation performed overnight at 50°C
as described by Christie (1982). Fatty acids methyl esters were separated and quantified
by gas-chromatography (GC; Thermo Finnigan) with He as a carrier gas using a fused
silica, carbowax 20M, 30m * 0.32 mm i.d. (df=0.27 m) column (Supleco, Bellefonte,
USA). The initial temperature of the column was set to 170ºC for 10min, and then it
was raised to 220ºC at 2.5 ºC/min and finally maintained at 215ºC for a further 5min.
The temperature of the injection port was 250ºC. The peaks in the chromatogram were
identified by comparison to a well-characterised external standard (Sigma). Individual
methyl esters were identified by comparison with known standards and published data.
Stress Panels
After the feeding period, 20 fish per tank were exposed to confinement stress.
Thus, fish were distributed in small floating cages (50x30x15cm) in 5 groups of 4 fish,

Chapter 4 Stress panels and head kidney fatty acids
96
another 4 fish per tank were used as control fish for basal plasma cortisol determination
just before confinement. Subsequently, all fish from different cages were sampled at 5
different time intervals (2h, 5h, 24h, 48h and 1 week) after the beginning of confinment
to encompass “early” and “late” response to the stressor. At each sampling time one
cage was carefully removed from each tank, opened and fish blood was sampled in less
than 2 min of handling time, blood was obtained by caudal sinus puncture with a 1 ml
plastic syringe. Aliquots of blood samples were immediately transferred to an
Eppendorf tube coated with lithium heparin as anticoagulant. The plasma was obtained
by centrifugation at 3000 rpm for 10 min and stored at -80º C prior to cortisol
determination and then the fish were liberated. The same procedure was repeated after
5h, 24h, 48h and 1 week. This approach was taken to keep any acute disturbance to the
remaining fish, from fish removal, as low as possible; both density groups were treated
in the same manner. Thus, total capture time was less than 8 min per tank to minimize
capture stress effects on analyzed parameters (Sumpter, 1997).
Cortisol measurements
Cortisol concentration in the perfused fluid was determined by
radioimmunoassay (RIA) (Rotllant et al., 2001). The antibody, Biolink, S.L. (Costa
Mesa, California), was used at a final dilution of 1:6000. This antibody cross reactivity
is 100% with cortisol, 11.40% with 21-desoxycorticosterone, 8.90% with 11-
desoxycortisol and 1.60% with 17a-hydroxyprogesterone. The radioactivity was
quantified using a liquid scintillation counter. Cortisol levels are given as ng/ml of
plasma.
Statistical analysis
Significance of difference (P<0.05) between dietary treatments was determined
by one-way analysis of variance (ANOVA) followed by Duncan’s multiple comparison
tests (Sokal and Rolf 1995). Analyses were performed using SPSS software (SPSS for
windows 13).
Results
Lipid peroxidation products were determined as thiobarbituric acid reactive
substances (TBARS) and they showed no significant difference between the diets,
ranging between 8.56 and 3.85 mmole of malonaldehyde (MDA)/kg of wet diet. No
dietary effect was observed on TBARS concentration (P<0.05).

Chapter 4 Stress panels and head kidney fatty acids
97
The control diet (FO), formulated with 100% FO, contained approximately 37%
total saturates, mainly 16:0, almost 29% total monounsaturated fatty acids with
approximately one-third as 18:1n-9, 6 % n-6 fatty acids, predominantly 18:2n-6, and
29% n-3 fatty acids predominantly n-3HUFA, mainly EPA (Table 4.2). Inclusion of
different VO levels resulted in increased percentages of 18:1n-9, 18:2n-6 and 18:3n-3
with concomitant decreased proportions of n-3 HUFA, total PUFA and long chain
monoenes. Thus, the levels of 18:1n-9, 18:2n-6 and 18:3n-3 increased to 15, 16 and
38% of total fatty acids, respectively, in the diet formulated with 100% LO, and to 21,
38 and 6% of total fatty acids, respectively, in the diet with 100% SO with an average
value of 5.5%. n-3HUFA in both diets. The 20LO50SO and particularly 50LO20SO diet
showed higher contents of n-3, n-6 and n-9 fatty acids. The diet 50LO50SO had
18.97%, 27.15% and 22.95% of 18:1n-9, 18:2n-6 and 18:3n-3 respectively, and
registered the lowest content on n-3 HUFA, with only 4.71%.
Fish HK fatty acid profile of total lipids reflected the dietary lipid composition
(Table 4.3). N-3 fatty acids were significantly increased in fish fed the LO diet, while n-
6 content was significantly increased in SO fed diet. N-9 fatty acids were also increased
in fish fed the LO and VO diets compared to control diet, due mainly to an increase in
OA. However, the content of n-3 HUFA was significantly (P<0.05) reduced in fish fed
the two vegetable oils separately, or as a blend, compared to control diet fed fish oil.
DHA was reduced by 45 % in HK of fish fed 70LO, 55 % in fish fed 100LO, 58 % in
fish fed 70SO, 61 % in fish fed 100SO, 35,5% in fish fed 20LO50SO, 19% in fish fed
50LO20SO and 64% in fish fed 50LO50SO. Similarly EPA was reduced by 64 % in
HK of fish fed 70LO, 76 % in fish fed 100LO, 73 % in fish fed 70SO, 80 % in fish fed
100SO, 57% in fish fed 20LO50SO, 42% in fish fed 50LO20SO and 82% in fish fed
50LO50SO. Regarding ARA, a 47 % reduction was found in fish fed 70LO, 16% in fish
fed 100LO, 88% in fish fed 70SO, 86% in fish fed 100SO, 45% in fish fed 20Lo50SO,
40% in fish fed 50LO20SO and 52% in fish fed 50LO50SO. Dietary inclusion of
vegetable oils reduced DHA/EPA ratios in fish HK, regardless of the type of oil used. In
fish fed LO and/or SO the end products of Δ6 desaturase and elongase from 18:2n-6 and
18:3n-3 (mainly 20:2n-6, 20:3n-6 and 20:3n-3) were increased in fish fed SO and LO
respectively compared to the control fish. Figure 1 shows a highpositive correlation
between dietary LA, LNA, EPA and their content in the head kidney with a r2=0.99,
0.93 and 0.91, respectively, and to a lesser extent dietary DHA was also positively
correlated with dietary DHA content in the head kidney with r2=0.71.

Chapter 4 Stress panels and head kidney fatty acids
98
Table 4.2: Fatty acid composition of the experimental diets (g fatty acid/ 100g of total fatty acids)
Fatty acids FO 70L 100L 70S 100S 20L50S 50L20S 50L50S
14:0 9.23 3.11 1.57 3.32 1.59 2.99 2.6 1.36 15:0 0.26 0.10 0.06 0.11 0.06 0.45 0.27 0.09 16:0ISO 0.11 0.04 0.3 0.05 0.03 0.04 0.08 0.09 16:00 22.21 12.19 10.21 15.84 13.69 27.42 12.21 11.87 16:1n-7 11.25 3.91 1.98 4.06 2.01 3.44 3.23 1.79 16:1n-5 0.38 0.14 0.09 0.16 0.09 0.21 0.10 0.08 16:2n-4 1.83 0.61 0.28 0.61 0.29 0.57 0.64 0.29 17:00 0.85 0.38 0.25 0.41 0.28 0.56 0.31 0.25 16:3n-4 2.00 0.66 0.29 0.67 0.31 0.62 0.53 0.24 16:3n-3 0.15 0.07 0.05 0.07 0.05 0.03 0.03 0.05 16:3n-1 0.12 0.05 0.04 0.06 0.04 0.07 0.07 0.03 16:4n-3 0.72 0.26 0.13 0.24 0.11 0.04 0.05 0.09 16:4n-1 - - - - - 0.26 0.28 - 18:00 3.85 3.96 3.99 3.43 3.20 7.69 3.48 3.73 18:1n-9 9.10 13.75 15.31 18.60 21.48 12.49 18.42 18.97 18:1n-7 3.16 1.57 1.36 2.15 1.77 1.23 1.37 1.35 18:1n-5 0.14 0.08 - 0.12 0.11 0.09 0.10 0.10 18:2n-9 0.04 0.02 - - - - 0.03 - 18:2n-6 4.02 12.36 16.21 29.93 38.51 16.40 18.42 27.15 18:2n-4 0.38 0.13 0.06 0.12 0.06 0.12 0.12 0.05 18:3n-6 0.36 0.13 - - 0.07 0.14 0.12 0.09 18:3n-4 0.04 - 0.04 0.18 0.09 0.18 0.12 0.05 18:3n-3 0.48 31.94 37.63 5.63 6.01 11.36 20.61 22.95 18:4n-3 1.94 0.76 0.40 0.73 0.40 0.75 0.75 0.36 18:4n-1 - - 0.03 - - 0.07 0.08 - 20:00 0.28 0.21 0.19 0.28 0.28 0.51 0.26 0.24 20:1n-9 2.59 1.94 1.84 2.08 1.89 1.65 2.34 1.90 20:1n-7 0.26 0.13 0.09 0.13 0.10 0.11 0.15 0.09 20:2n-9 - 0.04 - 0.04 0.01 0.02 0.03 0.01 20:2n-6 0.19 0.11 0.08 0.11 0.09 0.04 0.04 0.08 20:3n-9 - - - - - 0.10 0.15 - 20:3n-6 0.25 0.09 0.04 0.06 0.03 0.09 0.08 0.03 20:4n-6 1.11 0.43 0.24 0.43 0.24 0.43 0.39 0.20 20:3n-3 - - 0.07 - - 0.06 0.08 - 20:4n-3 0.96 0.35 0.16 0.33 0.16 0.34 0.38 0.13 20:5n-3 10.05 4.00 2.07 3.77 2.06 4.15 3.98 1.72 22:1n-11 1.79 1.52 1.48 1.67 1.61 1.33 1.91 1.63 22:1n-9 - - 0.42 - - 0.31 0.52 - 22:4n-6 0.34 0.15 0.09 0.14 0.09 0.15 0.14 0.08 22:5n-6 - - - - - 0.70 0.74 - 22:5n-3 1.74 0.66 0.29 0.60 0.29 0.24 0.11 0.23 22:6n-3 7.82 4.16 2.92 3.87 2.91 2.59 4.68 2.62 Saturates 36.68 19.95 16.28 23.40 19.10 39.17 18.86 17.45 Monoenoics 28.79 23.10 22.62 29.03 29.09 20.86 28.13 25.92 n-3 23.42 42.19 43.72 15.23 12.00 19.55 30.65 28.15 n-6 6.27 13.26 16.66 30.67 39.02 17.98 19.95 27.60 n-9 22.99 19.66 19.55 24.78 25.40 14.57 21.49 20.88 n-3 HUFA 20.57 9.17 5.50 8.57 5.42 7.38 9.22 4.71 n-3/n-6 3.74 3.18 2.62 0.50 0.31 1.09 1.54 1.02

Chapter 4 Stress panels and head kidney fatty acids
99
Table 4.3: Effect of feeding vegetable oils on HK fatty acids profile (g fatty acid/100g total fatty acids)
FO 70LO 100LO 70SO 100SO 20LO50SO 50LO20SO 50LO50SO
14:00 7.85±0.17 3.98±0.16 2.79±0.13 3.86±0.12 2.34±0.03 3.11±0.04 4.58±0.53 2.34±0.07
15:00 0.25 0.15±0.01 0.12±0.02 0.14 0.08±0.01 0.52±0.09 0.69±0.36 0.09±0.01
15:1n-5 0.49±0.33 0.45±0.03 0.33±0.03 0.54±0.06 0.33±0.05 0.07±0.05 0.03±0.02 0.35±0.06
16:0 ISO 0.13 0.23±0.03 0.29±0.09 0.10±0.03 0.04±0.03 0.11±0.03 0.11±0.03 0.08±0.01
Me16:0 0.16±0.03 0.14±0.01 0.10±0.01 0.12±0.01 0.09±0.01 - - 0.1
16:00 22.72±0.12 18.90±0.51 17.13±0.52 20.65±0.58 17.95±0.47 16.75±0.4 18.16±1.27 17.7±0.48
16:1n-9 0.07 0.06 0.28±0.01 0.05±0.03 0.07 - - 0.15±0.08
16:1n-7 12.33±0.2 5.79±0.15 3.69±0.07 5.76±0.12 3.35±0.01 5.18±0.1 7.11±0.44 3.26±0.06
16:1n-5 0.28 0.17±0.01 0.13±0.01 0.13±0.02 0.09±0.02 0.13±0.01 0.16±0.01 0.1±0.01
16:2n-6 0.34 0.19 0.15 0.20±0.01 0.18 0.21 0.21±0.02 0.16
16:2n-4 1.31±0.02 0.52±0.01 0.35 0.50 0.30 0.52 0.68±0.03 0.28
17:00 0.60 0.41±0.01 0.33±0.01 0.39 0.28 0.36±0.01 0.42±0.08 0.3±0.01
16:3n-4 1.21±0.02 0.49 0.35 0.49±0.01 0.34 0.08±0.01 0.11±0.02 0.32
16:3n-3 0.16 0.37±0.05 0.09±0.01 0.09 0.07 0.51±0.02 0.67±0.04 0.07
16:3n-1 0.35±0.09 - 0.39±0.06 0.28±0.03 0.25 0.03±0.03 0.04 0.33±0.04
16:4n-3 0.30±0.09 0.13±0.06 0.20±0.02 0.12±0.08 0.19 0.16±0.14 0.21±0.12 0.17±0.02
16:4n-1 0.02±0.02 0.05±0.01 0.02 0.02±0.02 0.02±0.02 0.31±0.1 0.26±0.09 0.02±0.02
18:00 4.57±0.12 5.94±0.1 5.91±0.23 4.94±0.07 4.60±0.17 5.77±1.35 4.31±0.76 5.5±0.13
18:1n-9 14.06±0.1e 19.94±0.4d 21.57±0.18c 23.50±0.31b 25.04±0.4a 20.39±0.9bc 20.72±1.2bc 24.64±0.35a
18:1n-7 3.98±0.01 2.52±0.05 2.05±0.06 2.94±0.07 2.51±0.03 1.62±0.45 2.38±0.28 2.33±0.05
18:1n-5 0.19±0.02 0.05±0.07 0.12 0.10±0.07 0.14 0.13±0.02 0.16±0.01 0.13
18:2n-9 0.06 0.04±0.01 0.03±0.01 0.02±0.02 0.05 0.04±0.04 0.02±0.01 0.03±0.02
18:2n-6 3.47±0.04f 9.50±0.17e 11.69d 20.62±0.46b 27.94±0.3a 20.52±0.4b 12.85±1.02c 19.63±0.27b
18:2n-4 0.35 0.17 0.11±0.03 0.12±0.01 0.07 0.14±0 0.14±0.08 0.07±0.01
18:3n-6 0.28 0.18 0.15±0.78 0.22±0.01 0.30±0.01 0.25±0.13 0.18±0.05 0.23±0.02
18:3n-4 0.55±0.02 0.14±0.1 0.07±0.02 0.13±0.09 - 0.17±0.15 0.53±0.12 -
18:3n-3 1.16±0.02f 16.39±0.55b 20.42±0.02a 2.79±0.14ef 3.19±0.13e 7.71±0.1d 6.3±1.13d 11.53±0.31c
18:3n-1 0.95±0.02 0.39±0.03 0.03 - - 0.01±0.01 - -
18:4n-3 0.15 0.06 0.31±0.01 0.28±0.02 0.22±0.02 0.44±0.02 0.14±0.25 0.26±0.02
18:4n-1 - 0.09±0.13 0.04±0.03 0.03±0.02 0.02±0.02 0.06 0.1±0.02 0.01±0.01
20:00 0.23 0.15±0.11 0.24 0.24 0.23 0.23±0.01 0.23±0.04 0.24
20:1n-9 1.80±0.04 1.54±0.02 1.47±0.04 1.84±0.02 1.66±0.01 2.03±0.01 3.05±0.28 1.74±0.03
20:1n-7 0.08±0.12 - 0.13±0.01 0.16 0.12 0.15±0 0.2±0.03 0.13
20:2n-9 0.10±0.01 0.09±0.01 0.05 0.08±0.07 0.05±0.04 0.1±0.05 0.03±0.05 0.04±0.03
20:2n-6 0.17 0.21±0.03 0.28±0.01 0.44±0.01 0.65±0.01 0.1±0.02 0.15±0.12 0.49±0.03
20:3n-9 - - 0.08±0.04 0.14±0.02 0.23±0.02 0.46±0.02 0.31±0.01 0.14±0.02
20:3n-6 0.18±0.01d 0.08±0.01e 0.34±0.01b 0.39±0.01a 0.29±0.01c 0.2±0.01b 0.13±0.04d 0.26±0.02c 20:4n-6 0.96±0.08a 0.81±0.03c 0.51±0.04b 0.11±0.01c 0.13±0.01c 0.53±0.06b 0.58±0.11b 0.46±0.03b
20:3n-3 0.11b 0.31±0.02b 0.51±0.13a 0.26±0.01b 0.19±0.01b 0.31±0.01 0.22b 0.23±0.02
20:4n-3 0.79±0.01 0.37±0.02 0.12±0.09 - 0.07±0.05 0.41±0.01 0.53±0.12 0.04±0.03
20:5n-3 5.07±0.08a 1.83±0.18cd 1.22±0.06de 1.38±0.09cde 1.03±0.1de 2.18±0.16bc 2.93±0.78b 0.92±0.07e
22:1n-11 1.12±0.03 0.99±0.02 0.93±0.02 1.19±0.02 1.06±0.02 1.23±0.06 1.96±0.19 1.14±0.01
22:1n-9 0.53 0.67±0.04 0.65±0.04 0.57±0.02 0.62±0.07 0.59±0.07 0.68±0.05 0.71±0.05
22:4n-6 0.25 0.12±0.01 0.09 0.07±0.05 0.03±0.04 0.14±0.01 0.16±0.04 0.05±0.03
22:5n-6 0.27±0.01 0.12±0.01 0.28±0.27 0.09±0.01 0.07±0.01 1.19±0.02 1.52±0.4 0.07±0.01
22:5n-3 2.40±0.04 0.94±0.07 0.41±0.29 0.75±0.05 0.59±0.06 0.08±0.01 0.07±0.03 0.5±0.04
22:6n-3 7.40±0.19a 4.07±0.28cd 3.35±0.09cd 3.08±0.23d 2.89±0.23d 4.77±0.33bc 5.98±1.34ab 2.69±0.19d
Saturates 36.6±0.18ª 29.8±0.76bc 26..7±0.9bcd 30.49±0.74b 25.6±0.66d 26.7±1.05cd 28.4±2.99bcd 26.16±0.7cd Monoenes 34.8±0.51a 32.03±0.5bc 31.2±0.14c 36.54±0.34a 34.8±0.37a 31.58±1.1c 36.55±2.07a 34.68±0.5ab
n-3 17.7±0.3b 24.73±1.15a 26.48±0.72a 8.82±0.57c 8.48±0.59c 16.56±0.3b 17.05±3.12b 16.41±0.69b
n-6 5.97±0.05f 11.02±0.23e 13.87±0.51d 22.33±0.46b 29.75±0.3a 23.06±0.4b 15.77±1.36c 21.33±0.38b
n-9 16.79±0.2e 22.55±0.43d 24.28±0.1cd 26.42±0.2ab 27.85±0.3ª 23.62±0.9cd 24.81±1.47bc 27.38±0.26a
n-3 HUFA 15.91±0.3ª 7.89±0.57bc 5.34±0.28cd 5.51±0.37cd 4.79±0.45c 7.74±0.51bc 9.72±2.21b 4.38±0.36d
n-3/n-6 2.96±0.02 2.24±0.06 1.91±0.04 0.4±0.02 0.28±0.02 0.72±0.02 1.07±0.11 0.77±0.02
DHA/EPA 1.46±0.02 2.23±0.07 2.76±0.05 2.24±0.09 2.80±0.07 2.18±0.02 2.06±0.16 2.94±0.05

Chapter 4 Stress panels and head kidney fatty acids
100
Figure 4.1: Relationship between dietary fatty acid concentrations and head kidney fatty acid concentrations of 18: 2n-6, 18:3n-3, 20:5n-3 and 22:6n-3 in total lipids gilthead seabream fed either 100% FO, 70LO, 100LO, 70S, 100S 20LO50SO, 50LO20SO or 50S50L.
Table 4.4: Cortisol in plasma of fish from the crowding trial (ng/ml of plasma)
FO 70 LO 100LO 70SO 100SO 20LO50SO 50LO20SO 50L50SO
0 H 2.4±0.8cD 6.9±5.8bc
C 21.1±12aC 1.4±0.5c
C 2.5±1.1cC 6.7±5.5c
B 14±8abcB 19.2±5.8ab
B
2 H 87.5±13.6b
cA
99.8±40.9ab
A 131.4±57.8a
A 43.1±13.4cdA
B 65.4±29.1bcd
A 26.5±13.9d
A 18.7±6.9dB 58.3±17bcd
A
5 H 10.2±7.1d
C 31.4±2.2bc
B
C 44.8±11.5ab
B
C 27.4±4.4bcd
B
C 50.7±6.7a
AB 24.3±5cdAB 23.2±6.6cd
A
B 32.4±11.4abc
A
24 H 11.8±2.3cC 15.5±2.9bc
C 27.9±13abC 13.9±7.1bc
C 20.9±11.6abcBC
25.5±3.6abA
B 21±8.1abc
AB 33.8±4.8aAB
48 H 48.7±21ab
B 64.8±18a
AB 72.1±30aB 46.5±12.3ab
A 58.1±24.6abA
B 34.9±17.1b
A 48.5±15.7abA 30.3±18.4b
A
B
1
week
17.6±4.3cC 20.5±6.3c
C 31.6±11.6bcC 48.8±17.4ab
A 52.4±9.9aAB 31.9±18.8bc
A 48.4±21.8ab
A 24.7±9.2cB
Different capital letters mean significant differences between values from the same column
Different small letters mean significant differences between values from the same line

Chapter 4 Stress panels and head kidney fatty acids
101
Figure 4.2: Plasma cortisol evolution during the crowding period (pg/ml)
Plasma cortisol
Cortisol production was increased significantly after confinement and
manipulation in all the treatments. Fish fed FO, 70LO, 100LO and 50LO50SO showed
significantly the highest cortisol levels after 2H of crowding and it decreased after 5H
or 24H of crowding but increased significantly after 48H of crowding followed by a
drop at 1 week. Fish fed 70SO, 20LO50SO and 50LO20SO showed a significantly
increased cortisol level after 2H of crowding followed by a decrease after 5H and 24H
of crowding, but it increased again to its maximum level 48H after crowding and
maintained these higher levels even after 1 week of crowding.
The plasma cortisol levels from fish within the same time of sampling, showed
differences between the dietary treatments for each time point. Fish fed 70LO, 100LO,
and 50LO50SO showed significantly higher basal plasma cortisol levels in comparison
to FO fed fish (Table 4.4), with fish fed diet 100LO registering the maximum levels, 9
fold higher than those of the FO fed fish. Two hours after handling and crowding
confinement, plasma cortisol was increased in all the treatments and in comparison
with control fish, those fed 100LO showed significantly higher values, while fish fed

Chapter 4 Stress panels and head kidney fatty acids
102
20LO50SO and 50LO20S also showed significantly higher plasma cortisol levels.
Accordingly, fish fed 70SO and 100SO also showed low cortisol values but not
significantly different from control fish. Five hours after handling and crowding
confinement, plasma cortisol levels were decreased in all the treatments, particularly in
control fish, whereas fish fed diets 70LO, 100LO, 100SO and 50LO50SO registered
significantly higher values than control fish. After 24 hours of crowding, plasma
cortisol levels in control fish were similar to those registered after 5 h, whereas there
was a reduction trend in all the other fish with values being still significantly higher
than controls in fish fed 100SO, 20LO50SO and 50LO50SO. After 48 hours of
crowding plasma cortisol levels increased in all treatments without significant
differences to controls. Finally, after 1 week of crowding plasma cortisol levels were
again similar to those obtained after 24 h, except in fish fed 70SO, 100SO and
50LO20SO which were higher than after 24 h and significantly higher than in control
fish.
Table 4.5: Correlation coefficients between cortisol levels and different head kidney fatty acids
0H 2h 5H 24H 48H 1 week
18:2n-6 0.06 -0.45 0.60 0.38 -0.30 0.67
18:3n-3 0.17 0.61 0.43 0.50 0.46 -0.39
20:5n-3 -0.14 -0.05 -0.82 -0.57 -0.09 -0.38
22:6n-3 -0.06 -0.13 -0.80 -0.50 -0.09 -0.32
20:4n-6 0.02 0.44 -0.46 -0.46 0.16 -0.69
n-3 0.09 0.64 -0.03 0.19 0.46 -0.66
n-9 0.30 -0.31 0.71 0.54 -0.12 0.66
N-3 HUFA -0.16 0.01 -0.81 -0.60 -0.04 -0.43

Chapter 4 Stress panels and head kidney fatty acids
103
Discussion
In common with all marine fish species studied to date, the cellular lipids for
seabream are enriched in n-3 HUFA reflecting an absolute dietary requirement for
DHA and EPA (Izquierdo, 1996; Izquierdo et al., 1990; Sargent et al., 1995, 1997,
1999). The reason for this requirement is the low activity of the Δ5 desaturase and/ or
C18 to C20 elongase enzymes in all marine fish that prevents synthesis from 18:3n-3
(Tocher and Ghioni, 1999; Bell and Sargent, 2003), and particularly in gilthead
seabream (Izquierdo et al., 2008). In addition, it is generally accepted that dietary fatty
acid profile is closely reflected in fatty acid composition of fish tissues (Rosenlund et
al., 2001; Bell et al., 2002; Caballero et al., 2002; Izquierdo et al., 2003, 2005). In the
present study, feeding LO and SO increased C18 fatty acids in the total lipids of
seabream head kidney and their Δ6 desaturase and elongase end products 20:2n-6,
20:3n-6 and 20:3n-3, whereas the content on n-3 HUFA was significantly reduced, in
agreement with previous studies from the same species and in different tissues
(Caballero et al., 2002, Montero et al., 2003, 2005; Izquierdo et al., 2003, 2005). The
fatty acid compositions of total lipid from head kidney suggested that while EPA is
incorporated at the same level as is present in the diet, DHA and ARA were selectively
incorporated into cellular lipids and retained (Linares and Henderson, 1991; Bell et al.,
2001) denoting the importance of these fatty acids in many physiological processes
(Lands, 1991; Bell and Sargent, 2003). 18:1n-9, 18:2n-6 and 18:3n-3 were selectively
utilized in flesh, when present at high concentrations in the diets, whereby dietary
concentrations were always higher in head kidney than in other tissues such as flesh
(Bell et al., 2001, Montero et al., 2005, Izquierdo et al., 2003, 2005), suggesting that
these C18 fatty acids are readily oxidised when present at high concentrations (Bell et
al., 2001). The relationship between the dietary LA, LNA and EPA and head kidney
content of these fatty acids, showed higher correlation with r2= 0.99, 0.93 and 0.91,
respectively, denoting the direct incorporation of these fatty acids in the head kidney
and that their content is determined by the dietary input. However, head kidney content
of DHA was relatively correlated with diet but even when its content is lower in the
diet, the levels in head kidney are still higher, suggesting selective uptake and retention

Chapter 4 Stress panels and head kidney fatty acids
104
The basal plasma cortisol in the control fish in this study were similar to those
found in the same species in previous studies (Montero et al., 1999, 2001, 2005). The
basal cortisol levels were significantly increased in fish fed 70LO, 100LO and
50LO50SO in accordance with previous studies in the same species in vivo (Montero et
al., 2003) confirming again the role of this oil rich in LA in increasing cortisol
secretion. The physiological changes in cortisol, are typical of changes found in fish
exposed to a variety of stressors and have been extensively documented (Maule et al.,
1989, Van de Nieuwegiessen et al., 2008, 2009). The response to stress is often
characterized as being composed of a primary and a secondary phase (Wendelaar
Bonga, 1997). These responses were different according to the dietary treatment.
Therefore, in fish fed FO, 70LO, 100LO and 50LO50SO, there was a rapid response to
the stress test, as plasma cortisol increase was most dramatic after 2 h of crowding but
had decreased markedly after 5 h, which is in accordance with the results found in
catfish (Davis et al., 2002) and this continued to decrease after 24 h. This may be due
to the inability of fish to continue secreting the hormone or an adjustment of the fish to
the somewhat mild, non-life threatening intensity of the stressor. Thereby, at 48 h the
plasma cortisol was significantly increased, followed by a decrease to lower levels after
1 week.
The same pattern was observed by Maule and colleagues (1989) who found that
plasma cortisol levels were increased significantly and reached its maximum 4 hours
after stress handling. These levels were decreased 24 hours after the handling stress, but
48 hours after stress plasma cortisol levels were increased again, and finally dropped to
levels similar to the control 4 days after the crowding challenge. However fish fed
70SO, 100SO, 20LO50SO and 50LO20SO, showed a later response to the crowding
stress, as 2 h after the challenge, the cortisol was increased significantly, but it
continued to increase slightly after 5 h and 24 h and reached its maximum after 48 h
and/or 1 week of crowding. This is in accordance with the in vitro results found with
the head kidney from the fish of the same trial and also with other previous studies
denoting the role of n-3 PUFA in increasing cortisol release by head kidney and the
role of n-6 (20:3n-6) in decreasing this response (Ganga et al., 2006). After crowding

Chapter 4 Stress panels and head kidney fatty acids
105
challenge as a acute stress, the fish fed SO generally registered a lower (but not
significant) response compared to FO which is in accordance with previous studies
(Ganga et al., 2006) where the 20:3n-6 was increased in head kidney from fish fed SO.
This fatty acid was found previously to decrease cortisol release in vitro (Ganga et al.,
2006).
However, numerous studies have elucidated the effects of stressors on
physiological responses in fish (Veiseth et al., 2006; Miller et al., 2007), and our results
demonstrated significant findings on how seabream respond to overcrowding in
relation to cortisol levels. 2 hours of crowding were sufficient such that seabream
responded to this challenge in order to cope with the new metabolic needs, and thus the
plasma cortisol concentrations were increased to different degrees in all the treatments,
and with fish fed LO showing the highest cortisol response in accordance with previous
studies (Montero et al., 2005). These cortisol concentrations were decreased 5 hours
post crowding and continued to decrease until 24 hours. This could be attributed to
physiological acclimation of fish after the initial handling stress, together with a
potential increase of cortisol degradation or decreased stressor influence (Pickering and
Pottinger, 1987; Barton et al., 2005; North et al., 2006; Trenzado et al., 2006). The
same response was reported in previous studies using Atlantic cod signaling a
significant increase in plasma cortisol levels 2 hours post crowding but returned to pre-
crowding levels 24 h after exposure (Caipang et al., 2008). Therefore, it is clear that
overcrowding as a stressor activated the HPI-axis (Pottinger et al., 1994), and
consequently elevated plasma cortisol as it was shown in earlier studies done using
same species (Ortuño et al., 2001, Barton et al., 2005). A similar response was seen in
salmonids (Pickering and Pottinger, 1989; Mazur and Iwama, 1993; Wiseman et al.,
2007; Fast et al., 2008), ayu (Plecoglossus altivelis) (Iguchi et al., 2003) and African
catfish (Clarias gariepinus Burchell) (Van de Nieuwegiessen et al., 2008, 2009)
showing that cortisol is an immediate and transitory response to overcrowding
(Caipang et al., 2008).
Moreover, after 48 hours of crowding the cortisol concentrations increased again
for all the treatments with the LO fed fish registering the highest concentrations as

Chapter 4 Stress panels and head kidney fatty acids
106
expected (Montero et al., 2005). Nevertheless after 1 week of crowding, the plasma
cortisol levels decreased in FO, 70LO and 100LO fed fish compared to their values at
48 hours, but remained at the same levels in the other treatments with 100SO
registering the highest concentration. This dietary effect on stress response could be
explained by the type and the quantity of different dietary fatty acids (Ganga et al.,
2006). While the mechanism of the stress response is still controversial in fish and it
depends on many factors. Crowding of brown trout caused increased cortisol levels for
the first 2 days, however by 6 days, plasma cortisol levels returned to values seen prior
to crowding (Pickering and Pottinger, 1987). In addition, recent observations indicated
that GR mRNA levels were lowered in sea bass (Dicentrarchus labrax) liver in
response to chronic crowding stress (Terova et al., 2005) suggesting that the stress
effect on the GR message may be either species-specific and/or dependent on the type,
intensity and duration of the stressor (Wiseman et al., 2007) It may be that there was a
specific response due to the specific fatty acids present in each VO (LO or SO) in the
present study. . However, it is thought that the adaptive significance of GR turnover is
autoregulated by cortisol (Sathiya and Vijayan, 2003) suggesting that GR response may
be an important part of the adaptive stress response that is regulated by plasma cortisol
level. Increased clearance rate of corticosteroids from the blood has been suggested as
one of the possible mechanisms to explain acclimation to chronic stress in salmonids
(Redding et al., 1984). Alternatively, the lack of increase in cortisol in long-term
stressed individuals may be due to a negative feedback of this daily increase in cortisol
on the HPI (Pickering, 1992; Pickering and Pottinger, 1987).
In the present study, the cortisol response to crowding was different according to
the dietary treatment with fish fed the LO diet registering the highest cortisol value.
This was supported by its highest correlation with the head kidney LNA content (r2=
0.61), and this in accordance with the results from a previous study showing increased
plasma cortisol levels when feeding seabream with diets rich in this fatty acid (Montero
et al., 2005).
The conserved stress response has adaptive value and is thought to allow
animals to regain homeostasis after a stressor insult (Mommsen et al., 1999; Iwama et

Chapter 4 Stress panels and head kidney fatty acids
107
al., 2006). Some reports have suggested that prolonged exposure to a stressor can lead
to allostasis, which is the ability of the body to return to physiological levels seen prior
to stress challenge (McEwen, 1998, Schreck, 2000). However, even though animals
chronically stressed seem to compensate physiologically to the stressor, their ability to
perform important functions at the whole organism level may be affected (Schreck,
2000). Therefore, many studies have identified effects of cortisol on different
physiologic processes, including osmoregulation, immune function, neuroendocrine
function and behaviour. Thus, cortisol supresses cellular immunity by affecting
inflammatory signaling pathways (Holland et al., 2003; MacKenzie et al., 2006; Aluru
and Vijayan, 2009). Moreover, 1h post-handling disturbance was found to increase the
activities of glycolytic enzymes that may be critical to cope with the increased liver
energy demand (Iwama et al., 2006; Wiseman et al., 2007). It is also demonstrated that
a 24 h restraint stress was shown to modulate Il-1β and its receptor expression in the
head kidney and brain of common carp, leading to the hypothesis that IL- 1β plays a
key role in the stress-mediated peripheral immune response as well as centrally in the
activation of the HPI axis (Metz et al., 2006).
It was also demonstrated that when subjecting seabream to confinement, the
fatty acid composition of the head kidney was affected and PUFA were decreased (Van
Anholt et al., 2004a). In the present study, we demonstrated that feeding fish with LO
and/or SO seriously affected the head kidney fatty acid composition by increasing C18
and decreasing n-3 HUFA, indicating the effect of feeding higher levels of LO and/or
SO in increasing plasma cortisol concentration over a long period (Montero et al.,
2005). Consequently the cortisol release after crowding stress was significantly
different between treatments. n-3 PUFA, in addition to affecting general properties of
cells as membrane components, play a role in modulating the production of both lipid
(eicosanoids) and protein (cytokines) mediators. Feeding fish with decreasing levels of
n-3 HUFA, by including LO in the diets, decreased significantly the plasma levels of
PGE3 (Ganga et al., 2005) known as an anti-inflammatory local hormone. Moreover, a
number of authors have attributed a DHA effect on stress resistance (Kanazawa, 1997;
Tago et al., 1999; Harel et al., 2001).

Chapter 4 Stress panels and head kidney fatty acids
108
These results indicate clearly that cortisol release is directly correlated to the
head kidney composition of different fatty acids, particularly n-3 HUFA (EPA and
DHA) with r2 =0.82 and 0.8, respectively after 5 h of crowding. This is in accordance
with previous results showing the stimulatory effect of EPA and DHA on cortisol
release in head kidney (Ganga et al., 2006). In another study, Welker and Congleton
(2004) found that feeding salmon juveniles with LO and SO in different proportions
showed that the highest cortisol levels were registered in fish fed SO. They suggested
that the cortisol response may have been influenced by the ratio of prostaglandin 1 and
2 series to prostaglandin 3-series precursor fatty acids provided by different diets
(Welker and Congleton, 2004) concluding that there is a relationship between dietary
lipid source and stress in chinook salmon (Oncorhynchus tshawytscha).
Many other studies have reported that dietary ARA improves fish survival and
resitance to stress (Castell et al., 1994, Bessonart et al., 1999; Koven et al., 2001a,b,
Van Anholt et al., 2004a,b). Neverthless, the mechanisms by which these HUFAs could
modulate the stress response are still unknown, but many recent studies have suggested
the implication of COX and LOX metabolites in this response (Koven et al., 2001a,b,
2003; Van Anholt et al., 2004a). Prostaglandin and PGE2, in particular, have been
shown to modulate the sensitivity of the mammalian HPA axis and consequently
change the stress response (Di Luigi et al., 2001). In a previous study, we demonstrated
that feeding seabream with higher levels of LO, increased significantly plasma PGE3
concentration (Ganga et al., 2005). Although less studied in fish, the prostaglandins
likely modulate the release of hypothalamic CRH and/or pituitary ACTH, as shown in
mammals (Abou-Samra et al., 1986). Furthermore, Koven et al., (2001a, b, 2003) have
demonstrated the importance of feeding diets rich in ARA to seabream larvae in
improving its response to stress and increasing their survival, and they suggested that
this response is mediated by COX metabolites derived from ARA.
In conclusion, high stocking densities could be considered as a chronic stress
factor that affects fish welfare in aquaculture (Wedemeyer, 1997, Van de
Nieuwegiessen et al., 2008, 2009), and good practices in aquaculture business are of
great importance to improve fish welfare and can minimize stress on farmed fish and

Chapter 4 Stress panels and head kidney fatty acids
109
maintain high standards of fish welfare (Terova et al., 2005). This study showed clearly
that feeding seabream with LO and SO as substitutes to FO resulted in a profound
alteration of head kidney fatty acids profiles. N-3 HUFA were decreased and OA, LA
and LNA were decreased. Short-term overcrowding (2 h) in seabream resulted in short
term increases in plasma cortisol. These alterations, affected the stress response to
crowding for all the dietary treatments with fish fed with higher contents of LO and/or
SO showing significantly higher plasma basal and post-stress cortisol levels. Thus,
when substituting fish oil with vegetable oils in diets for seabream, care should be
taken to guarantee that sufficient content of EFAs necessary for normal stress response
are provided to satisfy fish physiological requirements.
References
Abou-Samra, A.B., Catt, K.J, Aguilera, G. (1986) Role of arachidonic acid in the
regulation of adrenocorticotropin release from rat anterior pituitary cell cultures.
Endocrinology, 119:1427-1431.
Ackman, R.G. (1989) Nutritional composition of fats in seafood. Progress in Food and
Nutrition Science, 13:161–241.
Aluru, N., Vijayan, M.M. (2009) Stress transcriptomics in fish: A role for genomic
cortisol signalling. Gen Comp Endocrinol, 164(2-3):142-150
Barton, B.A., Ribas, L., Acerete, L. and Tort, L. (2005) Effects of chronic confinement
on physiological responses of juvenile gilthead sea bream, Sparus aurata L., to
acute handling. Aquacult Res, 36:172–179.
Bell, J.G., Henderson, R.J., Tocher, D.R., McGhee, F., Dick, J.R., Porter, A., Smullen,
R. and Sargent, J.R. (2002) Substituting fish oil with crude palm oil in the diet of
Atlantic salmon (Salmo salar) affects tissue fatty acid compositions and hepatic
fatty acid metabolism. J Nutr, 132:222-230.
Bell, J.G., McEvoy, J., Tocher, D.R., McGhee, F., Campbell, P.J. and Sargent, J.R.
(2001) Replacement of fish oil with rape seed oil in diets of Atlantic salmon
(Salmo salar) affects tissue lipid compositions and hepatocyte fatty acid
metabolism. J Nutr, 131:1535-1543.
Bell, J.G., McVicar, A.H., Park, M. and Sargent, J.R. (1991) High dietary linoleic acid

Chapter 4 Stress panels and head kidney fatty acids
110
affects fatty acid compositions of individual phospholipids from tissues of
Atlantic salmon (Salmon salar): association with stress susceptibility and
cardiac lesion. J Nutr, 121:163-172.
Bell, J.G. and Sargent,J.R. (2003) Arachidonic acid in aquaculture feeds: current status
and future opportunities. Aquaculture, 218:491–499.
Bessonart, M., Izquierdo, M.S., Salhi, M., Hernández-Cruz, C.M., Gonzalez, M.M. and
Fernandez-Palacios, H. (1999) Effect of dietary arachidonic acid levels on
growth and survival of gilthead sea bream (Sparus aurata L.)
larvae. Aquaculture, 179:265–275
Caballero, M.J., Obach, A., Rosenlund, G., Montero, D., Gisvold, M. and Izquierdo,
M.S. (2002) Impact of different dietary lipid sources on growth, lipid
digestibility, tissue fatty acid composition and histology on rainbow trout,
Oncorhynchus mykiss. Aquaculture, 214:253-271.
Caipang, C.M.A., Brinchmann, M.F., Berg, I., Iversen, M., Eliassen, R. and Kiron, V.
(2008) Changes in selected stress and immune-related genes in Atlantic cod,
Gadus morhua, following overcrowding. Aquaculture Research, 39:1533-1540.
Castell, J.D., Bell, J.G., Tocher, D.R. and Sargent, J.R. (1994) Effects of purified diets
containing different combinations of arachidonic and docodahexaenoic acid on
survival, growth and fatty acid composition of juvenile turbot (Scophthalmus
maximus). Aquaculture, 128:315-333.
Christie, W.W. (1982) Lipid analysis. Oxford: Pergamon Press.
Christon, R., Fernández, Y., Linard, A., Periquet, A., Deltour, P. and Mitjavila, S.
(1992) Diet-Induced Structural and Functional Modifications in the Pig Liver
Endoplasmic Reticulum Membrane- Effect of Polyunsaturated Fatty Acid
Defiency. J Nutr Biochem, 3:510-518.
Davis, K.B., Griffin, B.R. and Gray, W.L. (2002) Effect of handling stress on
susceptibility of channel catfish Ictalurus punctatus to Ichthyophthirius
multifiliis and channel catfish virus infection. Aquaculture, 214:55-66.
DI Luigi, L., Guidetti, L., Romanelli, F., Baldari, C., and Conte, D. (2001)
Acetylsalicylic acid inhibits the pituitary response to exercise-related stress in
humans. Med Sci Sports Exerc, 33:2029-2035.
Ellis T., North B., Scott A.P., Bromage N.R., Porter, M. and Gadd D. (2002) The
relationship between stocking density and welfare in farmed rainbow trout.
Journal of Fish Biology, 61:493-531.

Chapter 4 Stress panels and head kidney fatty acids
111
Fast, M.D., Hosoya, S., Johnson, S.C. and Afonso, L.O.B. (2008) Cortisol response and
immune-related effects of Atlantic salmon (Salmo salar Linnaeus) subjected to
short- and long-term stress. Fish & Shellfish Immunology, 24:194-204.
Folch, J., Lees, M. and Sloane-Stanley, G. H. (1957) A simple method for the isolation
and purification of total lipids from animal tissues. J Biol Chem, 193:265-275.
Ganga, R., Bell, J.G., Montero, D., Robaina, L., Caballero, M.J. and Izquierdo, M.S.
(2005) Effect of feeding gilthead seabream (Sparus aurata) with vegetable lipid
sources on two potential immunomodulator products: prostanoids and leptins.
Comp Biochem Physiol, 142:410-418
Ganga, R., Tort, L. Acerete, L., Montero, D. and Izquierdo, M.S . (2006) Modulation of
ACTH-induced cortisol release by polyunsaturated fatty acids in interrenal cells
from gilthead seabream, Sparus aurata. J Endocrinol, 190:39-45.
Ghioni, C., Tocher, D.R., Bell, M.V., Dick, J.R. and Sargent, J.R. (1999) Low C18 to
C20 fatty acid elongase activity and limited conversion of stearidonic acid,
18:4n-3, to eicosapentaenoic acid, 20:5n-3, in a cell line from the turbot,
Scophthalmus maximus. Biochem Biophys Acta, 1437:170-181.
Harel, M., Gavasso, S., Leshin, J., Gubernatis, A. and Place, A.R. (2001) The effect of
tissue docosahexaenoic and arachidonic acids levels on hypersaline tolerance
and leucocyte composition in striped bass (Morone saxatilis) larvae. Fish
Physiol Biochem, 24:113-123.
Henderson, R.J. and Tocher, D.R. (1987) The lipid composition and biochemistry of
freshwater fish. Prog Lipid Res, 26:281-347.
Holland, J.W., Gould, C.R.W., Jones, C.S., Noble, L.R. and Secombes, C.J. (2003) The
expression of immune-regulatory genes in rainbow trout, Oncorhynchus mykiss,
during a natural outbreak of proliferative kidney disease (PKD). Parasitology,
126:1-4.
Iguchi, K., Ogawa, K., Nagae, M. and Ito, F. (2003) The influence of rearing density on
stress response and disease susceptibility of ayu (Plecoglossus altivelis).
Aquaculture, 220 (1-4):515-523.
Iwama, G.K., Afonso, L.O.B. and Vijayan, M.M. (2006) Stress in fishes. In: Evans,
D.H.; Claiborne, J.B. (Eds). The physiology of fishes. 3aed. CRC, New York.
pp. 319-342.
Izquierdo, M.S. (1996) Essential fatty acid requirements of cultured marine fish larvae.
In: Gajardo, G., Coutteau, P. (Eds) Improvement of the Commercial Production

Chapter 4 Stress panels and head kidney fatty acids
112
of Marine Aquaculture Species Proceedings of a Workshop on Fish and Mollusc
Larviculture, Impresora Creces, Santiago, Chile. pp. 31–44.
Izquierdo, M.S., Robaina, L., Juárez, E., Oliva, R., Hernández-Cruz, C.M. and Afonso,
J.M. (2008) Regulation of growth, fatty acid composition and delta 6 desaturase
expression by dietary lipids in gilthead seabream larvae (Sparus aurata). Fish
Physiol Biochem, 34:117-127.
Izquierdo, M.S., Montero, D., Robaina, L., Caballero, M.J., Rosenlund, G. and Gines,
R. (2005) Alterations in fillet fatty acid profile and flesh quality in gilthead
seabream (Sparus aurata) fed vegetable oils for a long term period. Recovery of
fatty acid profiles by fish oil feeding. Aquaculture, 250:431-444.
Izquierdo, M.S., Obach, A., Arantzamendi, L., Montero, D., Robaina, L. and
Rosenlund, G. (2003) Dietary lipid sources for seabream and seabass: growth
performance, tissue composition and flesh quality”. Aquaculture Nutrition,
9:397-407.
Izquierdo, M.S., Watanabe, T., Takeuchi, T., Arakawa, T. and Kitajima, C. (1989)
Requirement of larval red seabream Pagrus major for essential fatty acids.
Nippon Suisan Gakkaishi, 55:859-867.
Izquierdo, M.S., Watanabe, T., Takeuchi, T., Arakawa, T. and Kitjima C. (1990)
Optimum EFA levels in artemia to meet EFA requirements of red sea bream
(Pagrus major). In: Takeda, M., Watanabe, T. (Eds) The Current Status of Fish
Nutrition in Aquaculture. Tokyo: University. Fisheries. pp. 221-231.
Kanazawa, A. (1997) Effects of docosahexaenoic acid and phospholipids on stress
tolerance of fish. Aquaculture, 155:129-134.
Koven, W., Barr, Y., Lutzky, S., Ben-Atia, I., Weiss, R., Harel, M., Behrens, P. and
Tandler, A. (2001b) The effect of dietary arachidonic acid (20:4n−6) on growth,
survival and resistance to handling stress in gilthead seabream (Sparus aurata)
larvae. Aquaculture, 193:107–122.
Koven, W., Van Anholt, R., Lutzky, S., Ben-Atia, I., Gamsiz, K., Weiss, R. and
Tandler, R. (2001a) The importance of arachidonic acid, as a modulator of stress
resistance through the hypothalamus–pituitary–interrenal axis, in different aged
gilthead seabream larvae. In: Hendry, C.I., Van Stappen, G., Wille, M.,
Sorgeloos, P. (Eds) Larvi 01—Fish and Shellfish Larviculture Symposium
European Aquaculture Society, Special Publication 30, Oostende, Belgium. pp.
292–293.

Chapter 4 Stress panels and head kidney fatty acids
113
Koven, W.M., Van Anholt, R.D., Lutzky, S., Ben Atia, I., Nixon, O., Ron, B. and
Tandler, A. (2003) The effect of dietary arachidonic acid on growth, survival,
and cortisol levels in different-age gilthead seabream larvae (Sparus auratus)
exposed to handling or daily salinity change. Aquaculture, 228:307–320.
Lacroix M. and Hontela A. (2001) Regulation of acute cortisol synthesis by cAMP-
dependant protein kinase and protein kinase C in a telost species, the rainbow
trout (O. mykiss). J Endocrinol, 169:71-78.
Lands, W.E.M. (1991). Biosynthesis of Prostaglandins. Ann Rev Nutr, 11:41-60
Lefrançois, C., Claireaux, G., Mercier, C. and Aubin, J. (2001) Effect of density on the
routine metabolic expenditure of farmed rainbow trout (Oncorhynchus mykiss).
Aquaculture, 195:269-277.
Linares, F. and Henderson, R.J. (1991) Incorporation of 14C-labelled polyunsaturated
fatty acids by juvenile turbot, Scophthalmus maximus (L.) in vivo. J Fish
Biol, 38:335–347.
MacKenzie, S., Iliev, D., Liarte, C., Koskinen, H., Planas, J.V., Goetz, F.W., Molsa, H.,
Krasnov, A. and Tort, L. (2006) Transcriptional analysis of LPS-stimulated
activation of trout (Oncorhynchus mykiss) monocyte/macrophage cells in
primary culture treated with cortisol. Mol Immunol, 43:1340–1348.
Maule, A.G., Tripp, R.A., Kaattari, S.L., Schreck, C.B. (1989) Stresss alters immune
function and disease resistance in Chinook salmon (Oncorhynchus tshawytsha).
Journal of Endocrinology, 120:135-142.
Mazur, C.F. and Iwama, G.K. (1993) Effect of handling and stocking density on
hematocrit, plasma cortisol, and survival in wild and hatchery-reared chinook
salmon (Oncorhynchus tshawytscha). Aquaculture, 112(4):291-299.
McEwen, B.S. (1998) Protective and damaging effects of stress mediators. N Engl J
Med, 338:171-179.
Metz, J.R., Peters, J.J. and Flik, G. (2006) Molecular biology and physiology of the
melanocortin system in fish: a review. Gen Comp Endocrinol, 148:150–162.
Miller, L.L., Wang, F., Palace, V.P. and Hontela, A. 2007. Effects of acute and sub
chronic exposures to waterborne selenite on the physiological stress response
and oxidative stress indicators in juvenile rainbow trout. Aquatic Toxicology,
83:263-271.
Mommsen, T.P., Vijayan, M.M. and Moon, T.W. (1999) Cortisol in teleosts: dynamics,
mechanisms of action, and metabolic regulation. Rev Fish Biol Fish, 9:211-268.

Chapter 4 Stress panels and head kidney fatty acids
114
Montero, D., Izquierdo, M.S., Tort, L., Robaina, L. and Vergara, J.M. (1999) High
stocking density produces crowding stress altering some physiological and
biochemical parameters in gilthead seabream Sparus aurata, juveniles. Fish
Physiology and Biochemistry, 20:53-60.
Montero, D., Kalinowski, T., Caballero, M.J., Obach, A., Tort, L., Robaina, L. and
Izquierdo, M.S . (2005) Effect of dietary vegetable lipid sources in gilthead
seabream (Sparus aurata) immune status and stress resistance”. Cah Options
Mediterr:103-112.
Montero, D., Kalinowski, T., Obach, A., Robaina, L., Tort, L., Caballero, M.J.,
Izquierdo, M.S. (2003) Vegetable lipid sources for gilthead seabream (Sparus
aurata): Effects on fish health. Aquaculture, 225:353-370
Montero, D., Robaina, L., Socorro, J., Vergara, J.M., Tort, L. and Izquierdo, M.S.
(2001) Alteration of liver and muscle fatty acid composition in gilthead
seabream (Sparus aurata) juveniles held at high stocking density and fed an
essential fatty acid deficient diet. Fish Physiol Biochem, 24:63-72
Montero, D., Tort, L. Izquierdo, M.S., Robaina, L. and Vergara, J.M. (1998) Depletion
of serum alternative complement pathway activity in gilthead seabream caused
by alpha-tocopherol and n-3 HUFA dietary deficiencies. Fish Physiol Biochem,
18:399-407.
North, B.P., Ellis, T., Turnbull, J.F., Davis, J. and Bromage, N.R. (2006) Stocking
density practices of commercial UK rainbow trout. Aquaculture, 259:260–267.
Ortuño, J., Esteban, M.A. and Meeguer, J. (2001) Effects of short-term crowding stress
on the gilthead seabream (Sparus aurata L.) innate immune response. Fish &
Shellfish Immunology, 11:187-197.
Patiño, R., Bradford, C.S., and Schreck, C.B. (1986) Adenylate cyclase activators and
inhibitors, cyclic nucleotide analogs, and phosphatidylinositol: Effects on
interrenal function of coho salmon (Oncorhynchus kisutch) in vitro. Gen Comp
Endocrinol, 63:230-235.
Pickering, A.D. (1992) Rainbow trout husbandry: management of the stress response.
Aquaculture, 100:125–139.
Pickering, A.D. and Pottinger, T.G. (1987) Crowding causes prolonged leucopenia in
fish despite interrenal acclimation. J Fish Biol, 30:701–712.
Pickering, A.D. and Pottinger, T.G. (1989) Stress responses and disease resistance in
salmonid fish: Effects of chronic elevation of plasma cortisol. Fish Physiol

Chapter 4 Stress panels and head kidney fatty acids
115
Biochem, 7:253–258.
Pickering, A.D. and Stewart, A. (1984) Acclimation of the interrenal tissue of the brown
trout, Salmo trutta L., to chronic crowding stress. J Fish Biol, 24:731–740.
Pike, I.H. and Barlow, S.M. (2003) Impact of fish farming on fish stocks. Fish Farmer,
26(1):14-16.
Pottinger, T.G., Knudsen, F.R. and Wilson, J. (1994) Stress-induced changes in the
affinity and abundance of cytosolic cortisol-binding sites in the liver of rainbow
trout, Oncorhynchus mykiss (Walbaum), are not accompanied by changes in
measurable nuclear binding. Fish Physiol Biochem, 12:499–511.
Redding, J.M., Patiño, R. and Schreck, C.B. (1984) Clearance of corticosteroids in
yearling coho salmon, Oncorhynchus kisutch, in fresh water and seawater and
after stress. Gen Comp Endocrinol, 54:433-443.
Rosenlund, G., A. Obach, E. Å. Bendiksen, M. Gisvold, and B. Ruyter (2001) Effect of
dietary fatty acid composition on Atlantic salmon (Salmo salar) when replacing
fish oils with vegetable oils. Pages 403–404 in Farmed Fish Quality. S. C.
Kestin and P. D. Warriss, eds. Fishing News Books, Blackwell Sci. Ltd.,
Oxford, UK.
Rotllant, J., Balm, P.H.M., Pérez-Sánchez, J., Wendelaar Bonga, S.E. and Tort, L.
(2001) Pituitary and interrenal function in gilthead sea bream (Sparus aurata L.,
Teleosteı´) after handling and confinement stress. General and Comparative
Endocrinology, 121:333–342.
Rowland, S.J., Mifsud, C., Nixon, M. and Boyd, P. (2006) Effects of stocking density
on the performance of the Australian freshwater silver perch (Bidyanus
bidyanus) in cages. Aquaculture, 253:301-308.
Ruane, N.M. and Komen, H. (2003) Measuring cortisol in the water as an indicator of
stress caused by increased loading density in common carp (Cyprinus carpio).
Aquaculture, 218:685–693.
Sargent, J.R., McEvoy, L., Estevez, A., Bell, J.G., Bell, M.V., Henderson, R.J. and
Tocher, D.R. (1999) Lipid nutrition of marine fish during early development:
Current status and future directions. Aquaculture, 179: 217-229.
Sargent, J.R., Bell, M.V., Bell, J.G. (1995) Origins and functions of n-3 polyunsaturated
fatty acids in marine organisms. In: Ceve G., Paltauf, F., (Eds) Phospholipid
Characterisation, Metabolism and Novel Biological Applications—Champaign,
IL: American Oil Society Press. pp. 248–259.

Chapter 4 Stress panels and head kidney fatty acids
116
Sargent, J.R., McEvoy, L.A. and Bell, J.G. (1997) Requirements, presentation and
sources of polyunsaturated fatty acids in marine fish larval feeds. Aquaculture,
155:117–128.
Sathiya, R. and Vijayan, M.M. (2003) Autoregulation of glucocorticoid receptor by
cortisol in rainbow trout hepatocytes. Am J Physiol Cell Physiol, 284:C1508-
C1515.
Schreck, C.B. (2000) Accumulation and long-term effects of stress in fish. In: Moberg,
G.P., Mench, J.A. (Eds) The biology of animal stress: basic principles and
implications for animal welfare. New York: CABI Publishing;pp. 147-158.
Sokal, R.R. and Rolf, F.J. (1995) Biometry. The principles and practices of statistics in
biological research, 3nd ed, New York: WHFreeman.
Sumpter, J.P. (1997) The endocrinology of stress. In Iwama, G.K., Pickering, A.D.,
Sumpter, J.P. and Schreck, C.B. (eds.), Fish stress and health in aquaculture, pp.
95–118. Soc. Exp. Biol. Sem. Ser. 62, Cambridge Univ. Press, Cambridge, U.K.
Tacon, A.G.J. (2004) Use of fish meal and fish oil in aquaculture: a global perspective.
Aquatic Resources, Culture & Development, 1(1):3-14.
Tacon, A.G.J. (2005) Aquaculture country statistical profile: China – an awakening and
hungry giant. International Aquafeed, 8(2):34-35.
Tacon, A.G.J., Hasan, M.R. and Subasinghe, R.P. (2006) Use of fishery resources as
feed inputs for aquaculture development: trends and policy implications. FAO
Fisheries Circular No. 1018, Rome, Italy.
Tago, A., Yamamoto, Y., Teshima, S. and Kanazawa, A. (1999) Effects of 1,2-di-20:5-
phosphatidylcholine (PC) and 1,2-di-22:6-PC on growth and stress tolerance of
Japanese flounder (Paralichthys olivaceus) larvae. Aquaculture, 179:231–239.
Terova, G., Gornati, R., Rimoldi, S., Bernarbini, G. and Saroglia, M. (2005)
Quantification of a glucocorticoid receptor in sea bass (Dicentrarchus labrax,
L.) reared at high stocking density. Gene, 357:144-151.
Tocher, D.R and Ghioni, C. (1999) Fatty acid metabolism in marine fish: low activity of
∆5 desaturation in gilthead sea bream (Sparus aurata) cells. Lipids, 34:433-440.
Torstensen, B.E., Lie, O. and Froyland, L. (2000) Lipid metabolism and tissue
composition in Atlantic salmon (Salmo salar L.) - effects of capelin oil, palm
oil, and oleic acid-enriched sunflower oil as dietary lipid sources. Lipids,
35:653-664.
Trenzado, C.E., Morales, A.E. and de la Higuera, M. (2006) Physiological effects of
Chapter 4 Stress panels and head kidney fatty acids
117
crowding in rainbow trout, Oncorhynchus mykiss, selected for low and high
stress responsiveness. Aquaculture, 258:583–593.
Turnbull, J., Bell, A., Adams, C., Bron, J. and Huntingfor, F. (2005) Stocking density
and welfare of cage farmed Atlantic salmon: application of a multivariate
analysis. Aquaculture, 243:121-132.
Van Anholt, R.D., Spanings, F.A.T., Koven, W.M. and Wendelaar Bonga, S.E. (2004a)
Dietary supplementation with arachidonic acid in tilapia (Oreochromis
mossambicus) reveals physiological effects not mediated by
prostaglandins. General and Comparative Endocrinology, 139:215–226.
Van Anholt, R.D., Spanings, F.A., Koven, W.M., Nixon, O., and Bonga, S.E. (2004b)
Arachidonic acid reduces the stress response of gilthead seabream Sparus aurata
L.. J Exp Biol, 207:3419-3430.
Van de Nieuwegiessen, P., Olwo, J., Khong, S., Verreth, J.A.J. and Schrama, J.W.
(2009) Effects of age and stocking density on the welfare of African catfish,
Clarias gariepinus Burchell. Aquaculture, 288:69-75.
Van de Nieuwegiessen, P.G., Boerlage, A.S., Schrama, J.W. and Verreth, J.A.J. (2008)
Assessing the effects of a chronic stressor, stocking density, on welfare
indicators of juvenile African catfish, Clarias gariepinus Burchell. Appl Anim
Behav Sci, 115:233–243.
Veiseth, E., Fjaera, S.O., Bjerkeng, B. and Skjervold, P.O. (2006) Accelerated recovery
of Atlantic salmon (Salmo salar) from effects of crowding by swimming. Com
Biochem Physiol, Part B, 144:351-358.
Wedemeyer G.A. (1997) Effects of rearing conditions on the health and physiological
quality of Åësh in intensive culture. In: Iwama, G.K., Pickering, A.D., Sumpter,
J.P., Schreck, C.B. (Eds) Fish Stress and Health in Aquaculture. Cambridge
University Press, Cambridge. pp. 35–72.
Welker, T.L. and Congleton, J.L. (2004) Relationship between dietary lipid source,
oxidative stress, and the physiological response to stress in sub-yearling chinook
salmon (Oncorhynchus tshawytscha). Fish Physiol and Biochem, 29:225-235.
Wendelaar Bonga, S.E. (1997) The Stress Response in Fish. Physiological Reviews,
77(3):591-625.
Wills, E.D. (1985) The role of dietary components in oxidative stress in tissues. In: Sies
H, (Ed) Oxidative Stress. London: Academic Press. pp. 197-218.
Wiseman, S.B., Osachoss, H., Bassett, E., Malhotra, J., Bruno, J., VanAggelen, G.,

Chapter 4 Stress panels and head kidney fatty acids
118
Mommsen, T.P. and Vijayan, M.M. (2007) Gene expression pattern in the liver
during recovery from an acute stressor in raibow trout. Comp Biochem Physiol,
Part D, 2:234-244.
Yaqoob, P. (1998) Monounsaturated fats and immune function. Brazilian Journal of
Medical and Biological Research, 31:453-465.

Chapter 5
Effect of dietary lipids on plasma fatty acid profiles
and prostaglandina and leptin production in gilthead
seabream (Sparus aurata)
Ganga, R., Bell, J.G., Montero, D., Robaina, L., Caballero, M.J.
and Izquierdo, M.S.
Comparative Biochemistry and Physiology, Part B 142:410-418

Effect of dietary lipids on plasma fatty acid profiles and prostaglandin
and leptin production in gilthead seabream (Sparus aurata)
R. Ganga a,*, J.G. Bell b, D. Montero a, L. Robaina a, M.J. Caballero a, M.S. Izquierdo a
a Grupo de Investigacion en Acuicultura. ULPGC & ICCM. P.O. Box 56, 35200, Telde, Las Palmas, Canary Islands, Spainb Institute of Aquaculture, University of Stirling, Stirling FK9 4LA, Scotland, UK
Received 7 April 2005; received in revised form 9 September 2005; accepted 10 September 2005
Available online 28 October 2005
Abstract
The aim of this study was to investigate the effects of different levels of substitution of fish oil by vegetable oils rich in oleic, linoleic and
linolenic acids on gilthead seabream plasma and leukocyte fatty acid compositions and prostaglandin (PG) and leptin production. Juvenile
seabream of 24 g initial body mass were fed four iso-energetic and iso-proteic experimental diets for 281 days. Fatty acid composition of plasma
lipids was markedly affected by the inclusion of vegetable oils (VO). ARA (arachidonate), EPA (eicosapentaenoate) and DHA (docosahexaenoate)
were preferentially incorporated into polar lipids of plasma, and DHGLA (di-homogammalinoleate) accumulated with increased vegetable oil
inclusion. Dietary treatments resulted in alterations of DHGLA/ARA ratios, but not ARA/EPA. ARA-derived PGE2 production in plasma was not
affected by vegetable oils, in agreement with similar eicosanoid precursor ratio (ARA/EPA) in leukocytes total lipids and plasma phospholipids
among fish fed with the different dietary treatments. Feeding vegetable oils leads to a decrease in plasma EPAwhich in turn reduced plasma PGE3
concentration. Moreover, PGE3 was the major prostaglandin produced in plasma of fish fed fish oil based diet. Such findings point out the
importance of EPA as a precursor of prostaglandins in marine fish, at least for the correct function of the blood cells, and correlates well with the
predominant role of this fatty acid in immune regulation in this species. A negative correlation was found between plasma PGE2 and leptin plasma
concentration, suggesting that circulating levels of leptin may act as a metabolic signal modulating PGE2 release. The present study has shown that
increased inclusion of vegetable oils in diet for gilthead seabream may profoundly affect the fatty acid composition of plasma and leukocytes,
specially HUFA (highly unsaturated fatty acids), and consequently the production of PGE3, which can be a major PG in plasma. Alteration in the
amount and type of PG produced can be at least partially responsible for the changes in the immune system and health parameters of fish fed diets
with high inclusion of VO.
D 2005 Elsevier Inc. All rights reserved.
Keywords: Leptin; Leukocytes; Seabream; Plasma; Prostaglandins; Polyunsaturated fatty acids
1. Introduction
Supply of fish oil (FO) and fish meal for aquaculture feeds
has shown a reduction due to stagnation in capture fisheries as
a consequence of over fishing and natural events such as El
Nino. FO production has suffered a decrease and fluctuations
which results in higher prices and uncertainty of its availability.
Some scientists expect that supplies of FO for aquaculture
production will become critical between 2005 and 2010 (Bell
and Sargent, 2003). Thus, there is a strong need for diversifi-
cation of feed ingredients used in aquaculture (Kaushik, 2000),
and considerable research efforts have been directed towards the
evaluation of other non-marine ingredients as a potential
substitutes in fish diets (Hardy et al., 2001).
Previous experience has shown that it is possible to replace
up to 60% of the FO by vegetable oils (VO) in diets for
seabream without compromising growth, survival, fish feed
utilisation or fillet organoleptic properties, when fish are fed
either for a medium (3 months, Izquierdo et al., 2000, 2003) or
long period (8 months) (Menoyo et al., 2004; Izquierdo et al.,
1096-4959/$ - see front matter D 2005 Elsevier Inc. All rights reserved.
doi:10.1016/j.cbpb.2005.09.010
Abbreviations: ARA, arachidonic acid; DHGLA, di-homogammalinoleic
acid; DHA, docosahexaenoic acid; EPA, eicosapentaenoic acid; FO, fish oil;
HUFA, highly unsaturated fatty acid; LA, linoleic acid; LNA, linolenic acid;
LO, linseed oil; NL, neutral lipid; OA, oleic acid; PL, polar lipid; PG,
prostaglandin; RO, rapeseed oil; VO, vegetable oil.
* Corresponding author. Tel.: +34 928 132 900; fax: +34 928 132 908.
E-mail address: [email protected] (R. Ganga).
Comparative Biochemistry and Physiology, Part B 142 (2005) 410 – 418
www.elsevier.com/locate/cbpb

in press). However, a substitution increased up to 80%,
significantly reduces growth and conversion indices (Izquierdo
et al., in press) altering normal hepatocyte and enterocyte
morphology (Caballero et al., 2003), and negatively affecting
immune functions and post-stress plasma cortisol response
(Montero et al., 2003). In addition, inclusion of soybean or
rapeseed oil with of 60% substitution reduced macrophage
phagocytic activity (Montero et al., 2003) whereas the
reduction in the eicosapentaenoic (EPA; 20:5n-3) and docosa-
hexaenoic (DHA; 22:6n-3) acids in diet has been shown to
significantly inhibit serum alternative complement pathway
activity (Montero et al., 1998). The role of dietary highly
unsaturated fatty acids (HUFAs) on immune regulation seems
to be mediated, at least partly, by the eicosanoid production in
target tissues. Eicosanoids are oxygenated derivatives of
polyunsaturated fatty acids produced from membrane phos-
pholipids by the action of phospholipases, cyclooxygenases
and lipoxygenases (Rowley et al., 1995). In broad terms,
eicosanoids are produced in response to stressful situations,
both at a cellular and whole body level (Sargent et al., 1999).
The principal substrate is arachidonic acid (ARA; 20:4n-6),
generating 2-series prostanoids and 4-series leukotrienes, that
have potent proinflammatory effects (Secombes, 1996). In
addition, EPA, DHA and di-homogammalinolenic (DHGLA;
20:3n-6) are also important eicosanoid substrates in fish due to
their high concentration in membrane phospholipids of aquatic
organisms (Henderson and Sargent, 1985). Non-esterified
ARA, through the action of cyclooxygenase enzymes, yields
2-series prostanoids (prostaglandins (PG) and thromboxanes)
and, through the action of lipoxygenase enzymes produce 4-
series leukotrienes and lipoxines (Lall, 2000). Alternatively, the
metabolic derivatives produced from non-esterified EPA are 3-
series prostanoids and 5-series leukotreines and lipoxines
whereas the 1-series prostanoids derived from DHGLA. These
compounds are known to play essential roles in the regulation
of many physiological and immunological processes in the
body (Balfry and Higgs, 2001). The effect of dietary VO on
prostaglandins production (in different fish organs) has been
previously documented in freshwater and some Nordic marine
fish species (Bell et al., 1991, 1992, 1993, 1994b; Henderson et
al., 1996), but no studies have been conducted until now on
eicosanoid production in seabream, or their alteration by
dietary lipids.
Leptin is known as a multifunctional hormone that plays
numerous important roles in homeostasis, immune function and
reproduction. Its major role pertains to the regulation of energy
balance by decreasing food intake and increasing energy
expenditure (Van Dijk, 2001). The level of secreted leptin is
proportional to body fat level and, through its action on
hypothalamic centers, leptin suppresses food intake and
increases energy expenditure (Frederich et al., 1995). The
reduction in energy availability leads to impairments in humoral
immunity and hence leptin has been proposed as a neuroendo-
crine signal between body fat and immunity regulating humoral
immune responses (Demas and Sakaria, 2005). Direct actions
of leptin on immune cells seem to affect disease resistance
through on hematopoiesis, proinflammatory response and other
immune cell functions (Gainsford and Alexander, 1999;
Fantuzzi and Faggioni, 2000). Leptin stimulates macrophages
and neutrophils, its production is increased during inflammation
and delays apoptosis of human mature neutrophils ‘‘in vitro’’
(Bruno et al., 2005). Leptins could also affect human Natural
Killer Cell lines function (Zhao et al., 2003). Moreover,
recently, Zerani et al. (2005) demonstrated the role of leptin
as a metabolic signal of PG release in rabbit. However few
studies have been conduct with leptin production in fish
(Volkoff et al., 2003), and no one of them deal with their
relation with dietary fat or prostaglandin production.
The aim of the present study was to investigate the effect of
different levels of substitution of fish oil by vegetable oils (rich
in oleic (OA), linoleic (LA) and linolenic (LNA) acids) on
seabream plasma and leukocyte fatty acid compositions and
effects on prostanoids and leptin production.
2. Materials and methods
2.1. Fish and husbandry
Two thousand four hundred juvenile seabream (Sparus
aurata), obtained from a local fish farm (ADSA, Las Palmas,
Spain) of 24g initial weight were maintained at the Instituto
Canario de Ciencias Marinas (ICCM) (Canary Islands,
Spain). Fish were distributed randomly into 16�1000 L
polyethylene circular tanks (150 fish/tank, each diet assayed
in quadruplicate) supplied with continuous seawater (36�)
flow and aeration. Fish were fed under natural photoperiod
(approximately 12:12 L/D). Water temperature and dissolved
oxygen during the experimental period ranged between 21.9–
22.4 -C and 5.5–7.2 ppm, respectively. After 2 weeks of
acclimation, the experimental diets were hand-fed until
apparent satiation three times a day at 9:00, 12:00 and
15:00 h, 6 days per week. Fifteen fish were sampled for
biochemical parameters at the beginning and after 98 days of
the experiment period.
2.2. Diets
Four iso-energetic and iso-proteic experimental diets were
formulated with a constant lipid content of ¨22%. Two
different VO blends, included at a 60% substitution of dietary
FO, were used for seabream. The diets contained rapeseed,
linseed and palm oils in ratio 15:60:25 in diet 60 LO and
40:40:20 in diet 60 RO. A 100 LO diet with 100% substitution
of fish oil by the blend in diet 60 LO was also included. The
diets were prepared by Nutreco ARC, Stavanger, Norway. The
fatty acid compositions of the 5 mm diets were analyzed and
were shown in Table 1.
2.3. Sampling procedure
After 281days, fish were individually sampled from each
tank for final sample collection. Blood was collected from the
caudal vein in heparinised syringes from 6 fish from 3 tanks
per diet (18 fish per diet) and transferred to an eppendorf tube
R. Ganga et al. / Comparative Biochemistry and Physiology, Part B 142 (2005) 410–418 411

coated with lithium heparin as an anticoagulant. The blood was
centrifuged immediately at 600�g for 10 min 4 -C to sediment
the cells. One milliliter of plasma was removed, 50 AL/mL of
2M formic acid was added and the acidified samples were
frozen in liquid nitrogen (�80 -C) prior to eicosanoid analysis.
250 AL of plasma was removed and stored at �80 -C for leptin
analysis and the remaining plasma was pooled per each tank
and stored at �80 -C for fatty acid analysis.
2.4. Blood leukocyte separation
This assay was conducted on only 3 dietary treatments as
sufficient fish fed 100 LO diet were not available. Seven
milliliters of blood was collected from the caudal vein in
heparinised syringes from 9 fish per diet and transferred to clean
glass tubes kept on ice. Blood was then centrifuged at 500 g for
10 min at 4 -C. After elimination of supernatant cells were
resuspended in 10 mL of HBSS Ca–Mg-free and then
centrifuged at 500 g for 10 min at 4 -C. Cells were separated
into 2 sub-samples which were resuspended in 6 mL of HBSS
Ca–Mg-free, and carefully layered over 6 mL of 46% Percoll
and centrifuged at 450 g for 40 min at 4 -C. Cells collected from
the white intermediate layer were resuspended in 10 mL of
HBSS Ca–Mg-free and centrifuged at 500 g for 10 min at 4 -C.
Collected cells were resuspended in 6 mL HBSS, Ca–Mg- free,
carefully layered over 6 mL of 46% Percoll and centrifuged at
450 g for 40 min at 4 -C. The leukocytes (white intermediate
layer) were collected and washed with 10 mL of HBSS Ca–Mg-
free. The leukocytes obtained from 3 fish were pooled and re-
suspended in 4 mL of HBSS, 2 mL of chloroform were added
and the sample was stored at �80 -C prior to lipid extraction.
2.5. Lipid analysis
Extraction of total lipid from diets, plasma samples and
blood leukocytes was performed by the method of Folch et al.
(1957). Neutral and polar fractions were separated by
adsorption chromatography on silica Sep-Pak cartridges
(Waters, Milford, MA) as described by Juaneda and Rocquelin
(1985). Fatty acid methyl esters were produced from aliquots of
total lipids extracted from diet, plasma samples and blood
leukocytes by acid-catalyzed transmethylation performed
overnight at 50 -C as described by Christie (1982).
Fatty acid methyl esters were separated and quantified by
gas–liquid chromatography (Shimadzu C-R5A gas chromato-
graph, 30 m�0.32 mm ID capillary column (Suplecowax-10,
Sigma-Aldrich, Madrid, Spain) according to conditions de-
scribed by Izquierdo et al. (1990). Individual methyl esters
were identified by comparison with known standards and
published data.
2.6. Extraction, separation and enzyme immunoassay of
eicosanoids
The frozen acidified plasma samples were thawed and
centrifuged (1000 g, 5 min) to precipitate cell debris. The
supernatants were extracted using octadecyl silyl (ODS, C18)
FSep-Pak_ mini-columns (Millipore (UK), Watford) by the
method of Powell (1982) and as described in detail by Bell et
al. (1994b). The final extract was redissolved in 100 AL of
methanol prior to HPLC. PGE3 was separated by reverse phase
HPLC using the methodology similar to that described in Bell
et al. (1994a). An isocratic solvent system was employed
containing 17 mM phosphoric acid/acetonitrile (70/30, v/v) at a
flow rate of 0.75 mL/min. Fifty microliters of the eicosanoid
plasma extracts was injected onto the column and 2.25 mL
fractions was collected using an Waters Fraction Collector
(Waters Ltd., Watford, UK). Fractions corresponding to the
PGE3 elution time were pooled and extracted as follows. The
pooled fractions were applied to a C18 FSep-Pak,_ which had
been pre-washed with 5 mL methanol and 10 mL distilled
water. The column was then washed with further 10 mL
distilled water and the PGE3 eluted in 5 mL of ethyl acetate.
Samples were dried under nitrogen and redissolved in
immunoassay buffer. Measurement of PGE3 was performed
using an enzyme immunoassay (EIA) kit for PGE2 according to
the manufacturers protocol (SPI-Bio, Gif sur Yvette, France).
The cross-reactivity of the PGE2 antibody with PGE3 was 43%.
The remaining 50 Al of the eicosanoid plasma extracts was
used to measure prostaglandin PGE2 concentration.
Table 1
Fatty acid compositions of the 5 mm experimental diets (g/100 g fatty acid)
FO 60 LO 60 RO 100 LO
%Lipids (dw) 20.24 21.36 22.79 25.14
14:0 5.92 3.05 2.93 0.79
16:0 19.30 14.99 15.95 15.92
16:1n-7 7.21 3.93 3.23 1.23
16:4n-3 0.17 0.04 0.03 0.02
18:0 3.37 3.21 3.36 3.40
18:1n-9 11.71 24.61 29.89 32.98
18:2n-6 5.84 11.87 12.50 13.67
18:3n-3 1.62 14.36 12.25 23.02
18:4n-3 2.18 1.28 0.87 0.17
20:1n-9 2.38 2.05 1.98 2.23
20:2n-6 0.15 0.10 0.08 0.03
20:3n-6 n.d. n.d. n.d. n.d.
20:4n-6 0.66 0.34 0.28 0.06
20:3n-3 n.d. n.d. n.d. n.d.
20:4n-3 0.54 0.27 0.21 0.05
20:5n-3 11.90 6.10 4.86 1.06
22:1n-11 2.98 2.35 2.20 2.41
22:5n-6 0.24 0.12 0.11 –
22:5n-3 1.17 0.56 0.47 0.08
22:6n-3 14.14 7.36 6.21 2.10
Saturateda 30.01 22.22 23.33 20.63
Monounsaturatesb 27.70 33.12 37.44 38.85
~n-3c 32.23 30.27 25.22 26.57
~n-6d 7.37 12.59 13.13 13.78
~n-9 14.56 26.81 31.91 35.22
~n-3 HUFA 27.84 14.34 11.82 3.33
n-3/n-6 4.37 2.40 1.92 1.93
dw—dry weight.
n =3. Values in the same row with different superscript letters are significantly
different ( P <0.05).a Includes 15:0, 17:0, 20:0 and 22:0.b Includes 22:1n-7.c Includes 20:3n-3 and 22:4n-3.d Includes 18:3n-6 and 22:4n-6.
R. Ganga et al. / Comparative Biochemistry and Physiology, Part B 142 (2005) 410–418412

2.7. Leptin immunoassay
Plasma leptin concentration was measured with an enzyme
immunoassay kit using a monoclonal antibody to human leptin
according to the manufacturers protocol (SPI-bio, Gif sur
Yvette, France).
2.8. Statistical analysis
Significance of difference (P <0.05) between dietary treat-
ments was determined by one-way analysis of variance
(ANOVA) followed by Duncan multiple comparison test.
Analyses were performed using SPSS software (SPSS for
windows 11.0).
3. Results
3.1. Fatty acid composition of plasma
The fatty acid compositions of plasma polar and neutral
lipids at the end of the trial are summarized in Tables 2 and 3.
In polar lipids, DHA was the most abundant fatty acid in fish
fed 100 FO, 60 RO and 60 LO, followed by 16:0 and 18:1n-9.
However in fish fed 100 LO, 18:1n-9 and 16:0 were the most
abundant fatty acids followed by DHA. 18:2n-6, 20:2n-6,
20:3n-6 and total n-6 fatty acids were all increased with
increasing dietary 18:2n-6. 18:3n-3 was also significantly
increased in fish fed vegetable oils. The elongase product of
18:3n-3, 20:3n-3, was also higher in fish fed 60 RO, 60 LO and
100 LO diets than in fish fed FO diet, despite the low dietary
content. 20:4n-3 was also high, but not significantly, in fish fed
VO. DHGLA was significantly higher and ARA lower
(P <0.05) in fish fed the diet with the highest level of 18:2n-
6 (100 LO) when compared with FO fed fish. Besides, EPA
content showed a significant reduction (P <0.05) in fish fed
either 60 RO or 100 LO, compared to fish fed FO. The ARA/
EPA ratio was relatively similar in the four treatments.
However, the DHGLA/ARA ratio was significantly lower in
fish fed FO (0.09) and increased with increasing dietary LA
and gammalinolenic acid (18: 3n-6) (GLA), being highest in
fish fed 100 LO (0.49). DHA and total n-3 PUFA contents
decreased, thought not significantly, according to their respec-
tive dietary levels, leading to a lower n-3/n-6PUFA ratio.
Fatty acid composition of neutral lipids was generally higher
in LA and GLA content, than that of polar lipids, LA being
greater in fish fed VO. Fish fed VO also exhibited higher
amounts of GLA, while those fed FO were significantly higher
in EPA and DHA. DHA/EPA was increased with feeding VO,
and ARA/EPAwas also slightly but not significantly increased.
Table 4 shows the relationship between the plasma content of
some fatty acids and its level in the diet. Oleic acid was
particularly incorporated into plasma neutral lipids compared
with polar lipids. The ratio of incorporation decreased with
increasing dietary content of this fatty acid, the highest ratio
being observed in fish fed FO (1.41) and the lowest in fish fed
100 LO (0.75). The ratio of incorporation of palmitic acid was
not different among the treatments, being slightly higher in polar
lipids. By contrast, ARA EPA and DHA were preferentially
incorporated into polar lipid, increasing with VO inclusion.
The ARA, EPA and EPA/ARA composition of total lipids
from blood leukocytes is shown in Fig. 1. Both palmitic and
oleic acids, followed by DHA and EPAwere the most abundant
fatty acids in these cells (data not shown). Fish oil substitution
with VO markedly affected fatty acid composition of blood
leukocytes by significantly reducing the EPA contents, and
slightly ARA ones. Incorporation of linolenic acid was always
lower than for linoleic acid. ARA/EPA values were only
slightly lower than those found in plasma polar lipids and
slightly higher than those found in plasma neutral lipids.
3.2. Plasma prostaglandin analysis.
Plasma PGE2 and PGE3 concentrations are shown in Table
5. The concentration of PGE2 was not significantly different
among the four treatments with the lowest value in fish fed FO
(33.72 pg/mL) and the highest in fish fed 60 RO (44.74 pg/
mL). However, the concentration of PGE3 decreased accord-
Table 2
Plasma polar lipid fatty acid compositions (g/100 g of total fatty acids)
(meanTSD)
Fatty acids FO 60 LO 60 RO 100 LO
12:0 1.59T0.36 1.61T0.72 1.44T0.51 1.38T0.85
14:0 2.15T0.16 1.32T0.74 1.01T0.19 0.90T0.34
16:0 22.91T0.93 18.76T4.33 23.30T1.29 21.97T1.78
16:1n-7 2.99T0.88 1.27T0.64 1.43T0.66 1.05T0.69
18:0 6.34T0.13 6.12T2.42 7.16T1.34 7.24T0.49
18:1n-9+18:1n-7 10.47T0.96 16.15T4.81 14.28T0.30 15.73T1.12
18:2n-6 6.04T2.64b 8.47T2.78a,b 8.07T1.89a,b 11.75T1.63a
18:3n-6 0.09T0.00 0.07T0.02 0.05T0.02 0.10T0.03
18:3n-3 0.59T0.23c 3.05T0.95a,b 2.19T0.06b,c 4.98T1.54a
18:4n-3 0.10T0.00 0.11T0.08 0.04T0.05 0.06T0.06
20:0 0.21T0.09 0.20T0.13 0.19T0.14 0.12T0.01
20:1n-9 0.53T0.04 0.70T0.13 0.67T0.01 0.81T0.25
20:2n-6 0.16T0.01 0.32T0.01 0.36T0.06 0.46T0.09
20:3n-6 0.12T0.02b 0.26T0.07a,b 0.31T0.12a 0.31T0.06a
20:4n-6 1.28T0.15a 1.02T0.15a,b 1.05T0.32a,b 0.65T0.12b
20:3n-3 0.09T0.00b 0.34T0.02a 0.38T0.16a 0.32T0.2a
20:4n-3 0.26T0.04 0.39T0.06 0.38T0.13 0.39T0.08
20:5n-3 9.02T0.90a 7.53T1.16a,b 6.87T0.82b 4.52T1.04b
22:1n-11 0.32T0.04 0.29T0.14 0.31T0.01 0.39T0.20
22:5n-6 0.47T0.02 0.64T0.28 0.51T0.30 0.29T0.04
22:5n-3 1.89T0.22 2.04T0.16 1.96T0.34 1.47T0.07
22:6n-3 28.63T3.56 26.28T3.20 26.03T4.86 22.95T1.77
Total saturates1 34.11T0.06 28.56T5.07 33.62T3.37 31.92T2.06
Total monoenes2 15.24T2.09 19.22T5.93 17.12T1.19 18.58T0.76
n-33 41.01T4.47 40.09T3.47 37.97T6.08 34.87T1.21
n-64 8.44T2.41 10.98T2.23 10.42T1.26 13.67T1.75
n-95 11.43T1.01 17.24T5.08 15.12T0.52 16.97T1.03
n-3 HUFA 39.99T4.71 36.68T4.53 35.64T6.28 29.69T2.65
n-3/n-6 4.86T1.37a 3.65T1.08a,b 3.64T1.03a,b 2.58T0.40b
DHA/EPA 3.22T0.01 3.45T0.01 3.85T0.02 5.01T0.03
ARA/EPA 0.14T0.00 0.14T0.00 0.15T0.03 0.14T0.01
DHGLA/ARA 0.09T0.004c 0.26T0.09b 0.28T0.02b 0.49T0.15a
1Includes 15:0, 17:0, and 22:0. 2Includes 16:1n-5, 18:1n-5, 20:1n-5, 20:1n-7,
22:1n-9, and 22:1n-7. 3Includes 22:4n-3. 4Includes 22:4n-6. 5Includes 18:2n-9,
18:3n-9, 20:2n-9, 20:3n-9 and 22:1n-9. Includes 16:2n-3, 16:2n-4, 16:4n-3 and
16:4n-1.
n =3�6. Values in the same row with different superscript letters are
significantly different ( P <0.05).
R. Ganga et al. / Comparative Biochemistry and Physiology, Part B 142 (2005) 410–418 413

ingly to the EPA content in the diet, being significantly lower
(P <0.05) in fish fed 100 LO (Fig. 2).
The correlation between PGE3 and its precursor (EPA) in
plasma, is shown in Fig. 3. A high correlation (r2=0.97) was
found between plasma PGE3 and EPA concentration with a
positive relationship (Y=3.26X +18.61).
3.3. Plasma leptin analysis
The production of the hormone leptin in plasma is shown in
Fig. 4. No significant differences were seen among the four
diets.
However, high negative correlation was also found between
plasma leptin and PGE2 (r2=0.85; Fig. 5).
4. Discussion
Fatty acid composition of plasma lipids was markedly
affected by the inclusion of VO. LA and LNA, main
components of vegetable oils, significantly increased in plasma
of fish fed VO, being preferentially incorporated into NL, as it
has been found in other cells and tissues of this specie
(Izquierdo et al., 2003, in press) and other species (Waagbo et
al., 1995). Interestingly, DHGLA also increased in fish fed VO,
with maximum values for the 100 LO group. DHGLA is the
predominant product of desaturation and elongation in salmo-
nids, feeding fish with diets containing high level of LA and
LNA (Bell et al., 1991, 2002; Tocher et al., 2000).
Plasma DHA content was even higher than in the diets,
being particularly incorporated in PL. Similar results were
found in cod (Gadus morhua) (Waagbo et al., 1995), European
sea bass (Dicentrarchus labrax) (Farndale et al., 1999) and
seabream (Caballero, 2002). Other previous studies have also
demonstrated that DHA was preferentially retained under
dietary essential fatty acids deficiency (Izquierdo, 1996;
Izquierdo et al., 2001; Montero et al., 2001), showing the
Table 3
Plasma neutral lipid fatty acid compositions (g/100g of total fatty acids)
(meanTSD)
Fatty acids FO 60 LO 60 RO 100 LO
12:0 4.70T2.09 3.14T1.09 3.34T0.69 2.97T0.90
14:0 5.52T3.28 2.42T0.55 2.31T0.46 2.43T0.40
16:0 22.36T0.53 16.96T0.36 18.15T1.11 18.77T1.07
16:1n-7 4.13T1.11 2.55T0.40 1.99T0.15 2.09T1.13
18:0 4.10T0.97 5.70T0.23 4.89T0.55 5.07T0.64
18:1n-9 + 18:1n-7 16.46T2.34 22.78T0.72 27.31T0.60 24.65T3.37
18:2n-6 6.34T2.35b 13.37T3.18a 11.09T3.26a,b 10.61T0.52a,b
18:3n-6 0.14T0.06 0.07T0.00 0.16T0.03 0.23T0.5
18:3n-3 1.06T0.09c 7.09T0.44a,b 6.39T0.33b 9.11T3.71a
18:4n-3 0.40T0.03 0.50T0.05 0.36T0.13 0.46T0.09
20:0 0.18T0.08 0.40T0.11 0.28T0.10 0.28T0.16
20:1n-9 1.51T0.18 1.46T0.04 1.54T0.13 1.33T0.06
20:2n-9 0.09T0.01 0.18T0.05 0.18T0.01 0.37T0.04
20:2n-6 0.18T0.02 0.32T0.16 0.27T0.02 0.28T0.03
20:3n-6 0.09T0.03 0.10T0.03 0.17T0.11 0.16T0.05
20:4n-6 0.52T0.14 0.30T0.01 0.34T0.10 0.49T0.23
20:3n-3 0.38T0.02 0.38T0.11 0.35T0.07 0.36T0.10
20:4n-3 0.42T0.22 0.33T0.05 0.30T0.08 0.25T0.03
20:5n-3 6.19T1.73a 3.27T0.17b 2.85T0.59b 2.68T1.64b
22:1n-11 1.12T0.04 0.89T0.13 0.83T0.04 0.70T0.05
22:5n-6 0.37T0.08 0.21T0.01 0.22T0.01 0.22T0.01
22:5n-3 2.37T0.65 1.36T0.05 1.32T0.20 1.02T0.44
22:6n-3 14.85T4.02a 10.67T1.00b 10.54T2.07b 10.15T2.09b
Total saturates1 38.08T6.91 29.45T0.70 29.68T1.68 29.84T1.42
Total monoenes2 25.28T3.47 29.36T0.69 33.22T0.62 29.81T1.96
n-33 26.32T6.13 24.05T1.40 22.52T3.01 24.92T1.54
n-64 8.19T1.90b 14.68T3.05a 12.43T3.14a,b 12.93T1.30a,b
n-95 18.88T2.71 25.35T1.02 29.84T0.77 26.99T2.99
n-3 HUFA 24.42T6.54 16.13T1.04 15.49T2.96 14.58T4.26
n-3/n-6 3.39T1.53a 1.68T0.44b 1.81T0.73b 1.93T0.08b
DHA/EPA 2.38T0.00 3.23T0.04 3.70T0.02 4T0.11
ARA/EPA 0.08 0.09 0.12 0.18
1Includes 15:0, 17:0, and 22:0. 2Includes 16:1n-5, 18:1n-5, 20:1n-5, 20:1n-7,
22:1n-9, and 22:1n-7. 3Includes 22:4n-3. 4Includes 22:4n-6. 5Includes 18:2n-9,
18:3n-9, 20:3n-9 and 22:1n-9. Includes 16:2n-3, 16:2n-4, 16:4n-3 and 16:4n-1.
n =3�6. Values in the same row with different superscript letters are
significantly different ( P <0.05).
Table 4
The ratio between fatty acid percent in plasma lipid classes and dietary percent
of the same fatty acid (% Fatty acid in plasma/%fatty acid in diet)
Fatty acid in plasma lipid classes FO 60 LO 60 RO 100 LO
Oleic acid (OA) Polar 0.89 0.66 0.48 0.48
Neutral 1.41 0.93 0.91 0.75
Palmitic acid Polar 1.19 1.25 1.46 1.38
Neutral 1.16 1.13 1.14 1.18
Arachidonic acid (ARA) Polar 1.94 3.00 3.75 10.83
Neutral 0.79 0.88 1.21 8.17
EPA Polar 0.76 1.23 1.41 4.26
Neutral 0.52 0.54 0.59 2.53
DHA Polar 2.02 3.57 4.19 10.93
Neutral 1.05 1.45 1.7 4.83
0
1
2
3
4
5
6
7
8
9
10
ARA EPA EPA/ARA
g/1
00g
to
tal F
.A.
FO
60LO
60RO
a
b b
Fig. 1. Proportion (g/100 g total fatty acids) of blood leukocytes EPA, ARA and
EPA/ARA. Columns assigned a different letter are significantly different
( P <0.05).
Table 5
Concentration of PGE2 and PGE3 in plasma from seabream fed experimental
diets (meanTSD)
Prostaglandins FO 60 LO 60 RO 100 LO
PGE2 (pg/mL) 33.72T6.52 41.87T7.18 44.74T16.47 35.15T4.58
PGE3/PGE2 1.45T0.33 1.00T0.22 0.91T0.46 0.96T0.12
N =3�6. Values in the same row with different superscript letters are
significantly different ( P <0.05). The specificity of the antibody was 100%
for PGE2 and 43% for PGE3.
R. Ganga et al. / Comparative Biochemistry and Physiology, Part B 142 (2005) 410–418414

importance of this fatty acid as a major structural component of
fish cell membranes (Watanabe, 1993; Sargent et al., 1995).
Selective incorporation of DHA into fish lipids is directly
related with the specificity of some PL synthesis enzyme
complexes such as 1-lysophosphatidylacylCoA transferase
(Gurr and Harwood, 1991; Caballero, 2002) and the affinity
for fatty acid binding proteins (FABP) (Sire and Vernier, 1981).
ARA, EPA and DHA were preferentially incorporated into
PL lipids of plasma, and DHGLA accumulated with the
increased VO inclusion. The higher content of EPA in plasma
PL suggest the selective incorporation of this fatty acid into
membrane lipids in agreement with the results found in sea
bass leukocytes (Farndale et al., 1999) and seabream anterior
kidney macrophages (Montero et al., 2003). A selective
deposition of ARA in PL was found at low dietary concentra-
tions in agreement with previous results found in other cellular
types of this specie (Montero et al., 2003; Fountoulaki et al.,
2003) or other species such as cod (Waagbo et al., 1995) or sea
bass (Farndale et al., 1999), and denoting the importance of this
fatty acid for optimal cell function. Besides, this fatty acid is
retained in essential fatty acid deficient fish (Izquierdo, 1996)
and is incorporated and retained in PI of seabream (Mourente
and Tocher, 1993) and turbot (Scophtalmus maximus) (Linares
and Henderson, 1991).
The dietary treatments employed in the present study have
resulted in profound alterations of DHGLA/ARA ratios (ratio
in table), but not in ARA/EPA (Table 2). ARA, EPA and
DHGLA are all precursors for eicosanoid production (Bell et
al., 1994a) and changes in the ratios of these HUFA had
important consequences for the quantity and spectrum of
eicosanoids produced by turbot (Bell et al., 1998). ARA-
derived PGE2 production in plasma was not affected by VO, in
agreement with similar eicosanoid precursor ratio (ARA/EPA)
in leukocytes total lipid and plasma phospholipids among fish
fed the different dietary treatments. However, reduction in
dietary ARA/EPA lead to a significant reduction in PGE2
concentration in heart, brain and kidney in turbot (Bell et al.,
1995). This controversy may be related to dietary, tissue or
species differences between both studies.
Interestingly, the production of PGE3 was significantly
different among fish fed the four experimental diets and
strongly correlated with plasma polar lipid concentrations of its
precursor, EPA. Moreover, PGE3 was the major prostaglandin
produced in plasma of fish fed FO, in contrast with previous
studies conducted ‘‘in vitro’’ in brain astroglial turbot cells and
pineal organ of Atlantic salmon (Salmo salar) (Bell et al.,
0
10
20
30
40
50
60
FO60LO
60RO100LO
Diet
Pla
sma
PG
E3
(pg
/ml a
ab ab
b
Fig. 2. Plasma concentration of PGE3 (pg/mL) from seabream fed the
experimental diets. Columns assigned a different letter are significantly
different ( P <0.05).
y = 3,26x + 18,61
R2 = 0,97
304 5 6 7 8 9 10
32
34
36
38
40
42
44
46
48
50
EPA in plasma (% in polar lipids)
Pla
sma
PG
E3
in p
g/m
l
PGE3
Lineal (PGE3)
Fig. 3. The relationship between PGE3 (pg/mL) and EPA (percent in polar
lipids) concentration in plasma from seabream fed the experimental diets with
pink dots r2=0.97 and line Y=3.26x +18.61.
20,5
21,0
21,5
22,0
22,5
23,0
23,5
FO60
LO60
RO
100L
O
Diet
Pla
sm
a le
pti
n (
pg
/ml)
Fig. 4. Leptin concentration in plasma from seabream fed the four experimental
diets.
y = -0,08x + 25,02
R2 = 0,85
21,20
0 10 20 30 40 50
21,60
21,40
21,80
22,00
22,20
22,40
22,60
PGE2
Lep
tin
Fig. 5. Relation between plasma leptin and PGE2 in seabream fed the four
experimental diets with pink dots r2=0.85.
R. Ganga et al. / Comparative Biochemistry and Physiology, Part B 142 (2005) 410–418 415

1994a; Henderson et al., 1996). Such findings remarks the
importance of EPA as a precursor of PG in marine fish, at least
for the correct function of their blood cells, and correlates well
with the predominant role of this fatty acid in immune
regulation in this specie (Montero et al., 1998). Nevertheless,
PG production markedly differs among tissues of the same
species. For instance, PGE2 production was higher in turbot
kidney macrophages than in blood leukocytes (Tafalla et al.,
1999). In the present study, feeding VO lead to a decrease in
plasma EPAwhich in turn reduced plasma PGE3 concentration.
PL fatty acid composition determines the physical properties of
cell membranes, influencing the activities of membrane-
associated proteins and enzymes (Spector and Yorek, 1985)
and the catalytic activity of the phospholipase A2 enzymes
(Bell et al., 1996). Since a previous study conducted in rainbow
trout (Salmo gairdneri) has demonstrated that blood erythro-
cytes are not capable of eicosanoid synthesis (Pettit et al.,
1989), plasma eicosanoids reflect principally leukocyte or
vascular products. Despite that the plasma PGE2 levels were
not being significantly different, the lower production in fish
fed FO may be explained by the higher content of EPA in the
PL of these fish, since this fatty acid is a potent competitor of
ARA. Hence, these results show that substitution of FO with
VO in diets for seabream modifies plasma PUFA composition
profoundly, affecting the 3-series prostaglandin production.
Increased in DHGLA in polar lipid fatty acid composition
could be related with the results obtained in PG production. For
instance, supplementation with both DHGLA and EPA signif-
icantly reduced ARA-derived prostaglandin production in
salmon (Bell et al., 1993) suggesting a competitive inhibition
by those fatty acids at the cyclooxygenase active site (Bell et al.,
1996). Also, phospholipase A2 activity, which is key to release
of eicosanoid precursor fatty acids from cell membranes, is
affected by dietary fatty acids. In salmon fed a diet with reduced
n-3/n-6 PUFA ratio, the phospholipase A activity was increased
in cardiac tissue compared to those fed fish oil (Bell et al., 1993).
The ability of DHGLA and EPA to attenuate the production of
ARA-derived eicosanoids is fundamental in the control of
pathophysiological processes in numerous inflammatory condi-
tions occurring in humans (Horrobin, 1992).
Recently, the interaction between leptin and prostaglandin
release has been described by Zerani et al. (2005) who
suggested that circulating levels of leptin may act as a
metabolic signal modulating PG release through mediation of
the nitric oxide synthase/nitric oxide system. In the present
study a negative correlation was found between plasma PGE2
and leptin plasma concentration in agreement with the results
found by Zerani et al. (2005). Moreover, Campbell et al. (1998)
demonstrated that leptin electrophoretic mobility depends
markedly on the free fatty acids in plasma, increases of oleic
acid inducing a decrease of leptin mobility. This may result in a
change of conformation of leptin and consequently may affect
the transport/binding of this protein to target tissues. In
agreement with these findings, oleic acid contents in plasma
neutral lipids were negatively correlated to leptin levels, which
in turn were negatively related with PGE2. Besides, an effect of
arachidonic acid increasing the release of leptin has been also
described (Fain et al., 2001), in agreement with the results
obtained in the present study, when fish with higher levels of
ARA in plasma neutral lipids showed the lower levels of
PGE2. However, further experiments are required to clarify the
interaction between plasma fatty acids and leptin levels.
In summary, the present study shown that increased
inclusion of VO in diets for seabream may profoundly affect
the fatty acid composition of plasma and leukocytes, especially
HUFA, and consequently the production of PGE3, which can
be a major PG in plasma. Alteration in the amount and type of
PG produced can be at least partially responsible for the
changes in the immune system and health parameters of fish
fed diets with high inclusion of VO (Blazer, 1992; Thompson
et al., 1996; Montero et al., 2003). Further research is needed to
clarify the effects of dietary fatty acids on plasma leptin levels
and its relation with prostaglandins production.
Acknowledgement
This experiment was part of the EU Framework V project,
Researching Alternatives to Fish Oil in Aquaculture (RAFOA),
Q5RS-200-30058. This study was also supported, in part,
through an award to GR from the European Union Access to
Research Infrastructures (ARI) Action of the Improving
Human Potential Programme (contract HPRI-CT-2001-00180).
References
Balfry, S.K., Higgs, D.A., 2001. Influence of dietary lipid composition on the
immune system and disease resistance of finfish. In: Lim, C., Webster, C.
(Eds.), Nutrition and Fish Health. Food Products Press, NY, pp. 214–234.
Bell, J.G., Sargent, J.R., 2003. Arachidonic acid in aquaculture feeds: current
status and future opportunities. Aquaculture 218, 491–499.
Bell, J.G., McVicar, A.H., Park, M.T., Sargent, J.R., 1991. High dietary linoleic
acid affects fatty acid compositions of individual phospholipids from tissues
of Atlantic salmon (Salmo salar): association with stress susceptibility and
cardiac lesion. J. Nutr. 121, 1163–1172.
Bell, J.G., Sargent, J.R., Raynard, R.S., 1992. Effects of increasing dietary
linoleic acid on phospholipid fatty acid composition and eicosanoid
production in leukocytes and gill cells of Atlantic salmon (Salmo salar).
Prostaglandins, Leukot. Essent. Fat. Acids 45, 197–206.
Bell, J.G., McVicar, A.H., Sargent, J.R., Thompson, K.D., 1993. Dietary
sunflower, linseed and fish oils affect phospholipid fatty acid composition,
development of cardiac lesions, phospholipase activity and eicosanoid
production in Atlantic salmon (Salmo salar). Prostaglandins, Leukot.
Essent. Fat. Acids 49, 665–673.
Bell, J.G., Tocher, D.R., Sargent, J.R., 1994a. Effect of supplementation with
20: 3 (n-6), 20:4 (n-6) and 20:5 (n-3) on the production of prostaglandin E
and F of the 1-, 2- and 3-series in turbot (Scophthalmus maximus) brain
astroglial cells in primary culture. Biochim. Biophys. Acta 1211, 335–342.
Bell, J.G., Tocher, D.R., MacDonald, F.M, Sargent, J.R., 1994b. Effects of diets
rich in linoleic (18:2n-6) and a-linolenic acids on the growth, lipid class and
fatty acid compositions and eicosanoid production in juvenile turbot
(Scophthalmus maximus L.). Fish Physiol. Biochem. 13, 105–118.
Bell, J.G., Castell, J.D., Tocher, D.R., MacDonald, F.M., Sargent, J.R., 1995.
Effects of different dietary arachidonic acid: docosahexaenoic acid ratios on
phospholipid fatty acid compositions and prostaglandin production in
juvenile turbot (Scophthalmus maximus). Fish Physiol. Biochem. 14,
139–151.
Bell, J.G., Farndale, B.M., Dick, J.R., Sargent, J., 1996. Modification of
membrane fatty acid composition eicosanoid production, and phospholipase
A activity in Atlantic salmon (Salmo salar) gill and kidney by dietary lipid.
Lipids 31 (11), 1163–1171.
R. Ganga et al. / Comparative Biochemistry and Physiology, Part B 142 (2005) 410–418416

Bell, J.G., Tocher, D.R., Farndale, B.M., Sargent, J.R., 1998. Growth, mortality,
tissue histopathology and fatty acid compositions, eicosanoid production
and response to stress, in juvenile turbot fed diets rich in g-linolenic acid in
combination with eicosapentaenoic acid or docosahexaenoic acid. Prosta-
glandins, Leukot. Essent. Fat. Acids 58, 353–364.
Bell, J.G., Henderson, R.J., Tocher, D.R., McGhee, F., Dick, J.R., Porter, A.,
Smullen, R.P., Sargent, J.R., 2002. Substituting fish oil with crude palm oil
in the diet of Atlantic salmon (Salmo salar) affects muscle fatty acid
composition and hepatic fatty acid metabolism. J. Nutr. 132, 222–230.
Blazer, V.S., 1992. Nutrition and disease resistance in fish. Annu. Rev. Fish
Dis. 2, 309–323.
Bruno, A., Conus, S., Schmid, I., Simon, H.U., 2005. Apoptotic pathways are
inhibited by leptin receptor activation in neutrophils. J. Immunol. 174,
8090–8096.
Caballero. M.J., 2002. Absorcion, transporte y utilizacion de los lıpidos
dieteticos en el intestino e hıgado de Dorada (Sparus aurata) y Lubina
(Dicentrarchus labrax). Tesis doctoral, Universidad de las Palmas.
247–252.
Caballero, M.J, Izquierdo, M.S., Kjørsvik, E., Montero, D., Socorro, J.,
Fernandez, A.J., Rosenlund, G., 2003. Morphological aspects of intestinal
cells from gilthead seabream (Sparus aurata) fed diets containing different
lipid sources. Aquaculture 225, 325–340.
Campbell, F.M., Gordon, M.J., Hoggard, N., Dutta-Roy, A.K., 1998.
Interaction of free fatty acids with human leptin. Biochem. Biophys. Res.
Commun. 247, 645–658.
Christie, W., 1982. Lipid Analysis. Pergamon Press, Oxford.
Demas, G.E., Sakaria, S., 2005. Leptin regulates energetic tradeoffs between
body fat and humoural immunity. Proc. Biol. Sci. 7 (272), 1845–1850.
Fantuzzi, G., Faggioni, R., 2000. Leptin in the regulation of immunity,
inflammation, and hematopoiesis. J. Leukoc. Biol. 68, 437–446.
Fain, J.N., Leffler, C.W., Cowan Jr., G.S., Buffington, C., Pouncey, L.,
Bahouth, S.W., 2001. Stimulation of leptin release by arachidonic acid and
prostaglandin E(2) in adipose tissue from obese humans. Metabolism 50,
921–928.
Farndale, B., Bell, G., Bruce, M., Bromage, N., Oyen, F., Zanuy, S., Sargent, J.,
1999. Dietary lipid composition affects blood leukocyte fatty acid
composition and plasma eicosanoid concentrations in European sea bass
(Dicentrarchus labrax L.). Aquaculture 179, 335–350.
Folch, J., Lees, M., Sloane-Stanley, G., 1957. A simple method for the
isolation and purification of total lipids from animal tissues. J. Biol.
Chem. 22, 497–509.
Fountoulaki, E., Alexis, M.N., Nengas, I., Venou, B., 2003. Effects of dietary
arachidonic acid (20:4n-6), on growth, body composition, and tissue fatty
acid profile of gilthead seabream fingerlings (Sparus aurata L.). Aquacul-
ture 225, 309–323.
Frederich, R.C., Hamann, A., Anderson, S., Lollmann, B., Lowell, B.B., Flier,
J.S., 1995. Leptin levels reflect body lipid content in mice: evidence for
diet-induced resistance to leptin action. Nat. Med. 1, 1311–1314.
Gainsford, T., Alexander, W.S., 1999. A role for leptin in hemopoieses? Mol.
Biotechnol. 11, 149–158.
Gurr, M.I., Harwood, J.L., 1991. Lipid Biochemistry. An Introduction, 4th edR
Chapman and Hall, London.
Hardy, R.W., Higgs, D.A., Lalla, S.P., Tacon, A.G.J., 2001. Alternative dietary
protein and lipid sources for sustainable production of salmonids. Fisken
Havet 8 (44 pp.).
Henderson, R.J., Sargent, J.R., 1985. Fatty acid metabolism in fish. In: Cowey,
C.B., Mackie, A.M., Bell, J.G. (Eds.), Nutrition and Feeding in Fish.
Academic Press, London, pp. 349–364.
Henderson, R.J., Bell, J.G., Park, M.T., 1996. Polyunsaturated fatty acids
composition of the salmon (Salmo salar L.) pineal organ: modification by
diet and effect on prostaglandin production. Biochim. Biophys. Acta 1299,
289–298.
Horrobin, D.F., 1992. Nutritional and medical importance of gamma-linolenic
acid. Prog. Lipid Res. 31, 163–194.
Izquierdo, M.S., 1996. Essential fatty acid requirement of marine fish larvae.
Aquacult. Nut. 2, 183–191.
Izquierdo, M., Watanabe, T., Takeuchi, T., Arakawa, T., Kitajima, C., 1990.
Optimum EFA levels in Artemia to meet the EFA requirements of red
seabream (Pagrus major). In: Takeda, M., Watanabe, T. (Eds.), The current
Status of Fish Nutrition in Aquaculture. Tokyo Univ. Fisheries, Tokyo,
pp. 221–232.
Izquierdo, M.S., Rosenlund, G., Montero, D., Obach, A., Caballero, M.J.,
Gisvold, M., Robaina, L., 2000. Alternative lipid sources for seabream and
seabass. The Ninth International Symposium on Nutrition and Feeding in
Fish. Miyazaki, Japan, 21–25 Mayo 2000.
Izquierdo, M.S., Tandler, A., Salhı, M., Kolkkovski, S., 2001. Influence of
dietary polar lipids quantity and quality on ingestion and assimilation
of labelled fatty acids by larval gilthead seabream. Aquacult. Nutr. 6,
153–160.
Izquierdo, M.S., Obach, A., Arantzamendi, L., Montero, D., Robaina, L.,
Rosenlund, G., 2003. Dietary lipid sources for seabream and seabass:
growth performance, tissue composition and flesh quality. Aquacult. Nutr.
9, 397–407.
Izquierdo, M.S., Montero D, Robaina L., Caballero, M.J., Rosenlund, G.,
Gines, R., in press. Aterations in fillet fatty acid profile and flesh quality in
gilthead seabream (Sparus aurata) fed vegetable oils for a long term period.
Recovery of fatty acid profiles by fish oil feeding. Aquaculture 250 (1–2).
Juaneda, P., Rocquelin, G., 1985. Rapid and convenient separation of
phospholipids from rat heart using silica cartridges. Lipids 20, 40–41.
Kaushik, S.J., 2000. Feed formulation, diet development and feed technology.
Cah. Options Mediterr. 47, 43–51.
Lall, S.P., 2000. Nutrition and health of fish. In: Cruz -Suarez, L.E., Ricque-
Marie, D., Tapia-Salazar, M., Olvera-Novoa, M.A., Civera-Cerecedo, R.
(Eds.), Avances en Nutricion Acuıcola V. Memorias del V Simposium
Internacional de Nutricion Acuıcola. Noviembre, 2000, Merida, Yucatan,
Mexico, pp. 13–23.
Linares, F., Henderson, R.J., 1991. Incorporation of 14C-labelled polyunsatu-
rated fatty acids by juvenile turbot, Scophthalmus maximus (L.) in vivo. J.
Fish Biol. 38, 335–347.
Menoyo, D., Izquierdo, M.S., Robaina, L., Gines, R., Lopez-Bote, C.J.,
Bautista, C.J., 2004. Adaptation of lipid metabolism, tissue composition
and flesh quality in gilthead seabream (Sparus aurata) to the fish oil
replacement,by linseed and soybean oils. Br. J. Nutr. 92, 41–52.
Montero, D., Tort, L., Izquierdo, M.S., Robaina, L., Vergara, J.M., 1998.
Depletion of serum alternative complement pathway activity in gilthead
seabream caused by alpha-tocopherol and n-3 HUFA dietary deficiencies.
Fish Physiol. Biochem. 18, 399–407.
Montero, D., Robaina, L., Socorro, J., Vergara, J.M., Tort, L., Izquierdo, M.S.,
2001. Alteration of liver and muscle fatty acid composition in gilthead
seabream (Sparus aurata) juveniles held at high stocking density and fed an
essential fatty acid deficient diet. Fish Physiol. Biochem. 24, 63–72.
Montero, D., Kalinowski, T., Obach, A., Robaina, L., Tort, L., Caballero, M.J.,
Izquierdo, M.S., 2003. Vegetable lipid sources for gilthead seabream
(Sparus aurata): effects on fish health. Aquaculture 225, 270–353.
Mourente, G., Tocher, D., 1993. Incorporation and metabolism of 14C-labelled
polyunsaturated fatty acids in juvenile seabream Sparus aurata L. in vivo.
Fish Physiol. Biochem. 10, 443–453.
Pettit, T.R., Rowley, A.F., Barrow, S.E., 1989. Synthesis of leukotriene B and
other conjugated triene lipoxygenase products by blood cells of the rainbow
trout, Salmo gairdneri. Biochim. Biophys. Acta 1003, 1–8.
Powell, W.S., 1982. Rapid extraction of arachidonic acid metabolites from
biological samples using octadecyl silica. Methods Enzymol. 86, 467–477.
Rowley, A.F., Knight, J., Lloyd-Evans, P., Holland, J.W., Vickerst, P.J., 1995.
Eicosanoids and their role in immune modulation in fish—a brief overview.
Fish Shellfish Immunol. 5, 549–567.
Sargent, J.R., Bell, J.G., Bell, M.V., Henderson, R.J., Tocher, D.R., 1995.
Requirement criteria for essential fatty acids. J. Appl. Ichthyol. 11,
183–198.
Sargent, J., Bell, G., McEvoy, L., Tocher, D., Estevez, A., 1999. Recent
developments in the essential fatty acid nutrition of fish. Aquaculture 177,
191–199.
Secombes, C.J., 1996. The nonspecific immune system: cellular defense. Fish
Physiol. 15, 63–105.
Sire, M.F., Vernier, J.M., 1981. Etude ultrastructurale de la synthese de
chylomicrons au cours de l’absorption intestinale des lipides chez la Truite.
Influence de la nature des acides gras ingeres. Biol. Cell 40, 47–62.
R. Ganga et al. / Comparative Biochemistry and Physiology, Part B 142 (2005) 410–418 417

Spector, A.A., Yorek, M.A., 1985. Membrane lipid composition and cellular
function. J. Lipid Res. 26, 1015–1035.
Tafalla, C., Medina, I., Figueras, A., Novoa, B., 1999. Production of
leukotriene B4 and prostaglandin E2 by turbot (Scophthalmus maximus)
leukocytes. Comp. Biochem. Physiol., B 123, 351–356.
Thompson, K.D., Tatner, M.F., Henderson, R.J., 1996. Effects of dietary (n-3)
and (n-6) polyunsaturated fatty acid ratio on the immune response of
Atlantic salmon, Salmo salar L. Aquacult. Nutr. 2, 21–31.
Tocher, D.R., Bell, J.G., Henderson, R.J., McGhee, F., Mitchell, D., Morris,
P.C., 2000. The effect of dietary linseed and rapeseed oils on polyunsat-
urated fatty acid metabolism in Atlantic salmon Salmo salar undergoing
parr-smolt transformation. Fish Physiol. Biochem. 23, 59–73.
Van Dijk, G., 2001. The role of leptin in the regulation of energy balance and
adiposity. J. Neuroendocrinol. 13, 912–913.
Volkoff, H., Eykelbosh, AJ., Peter, R.E., 2003. Role of Leptin in the control of
feeding of goldfish Carassius auratus: interactions with cholecystokinin,
neuropeptide Y and orexin A, and modulation by fasting. Brain Res. 972,
90–109.
Waagbo, R., Hemre, J., Holm, J., Lie, O., 1995. Tissue fatty acid composition,
haematology and immunity in adult cod, Gadus morhua L., fed three
dietary lipid sources. J. Fish Dis. 13, 615–622.
Watanabe, T., 1993. Importance of docosahexanoic acid in marine larval fish. J.
World Aquacult. Soc. 24, 152–161.
Zerani, M., Boiti, C., Dall’Aglio, C., Pascucci, L., Maranesi, M., Brecchia, G.,
Mariottini, C., Guelfi, G., Zampini, D., Gobbetti, A., 2005. Leptin receptor
expression and in vitro leptin actions on prostaglandin release and nitric
oxide synthase activity in the rabbit oviduct. J. Endocrinol. 185, 319–325.
Zhao, Y., Sun, R., You, L., Gao, C., Tian, Z., 2003. Expression of leptin
receptors and response to leptin stimulation of human natural killer cell
lines. Biochem. Biophys. Res. Commun. 300, 247–252.
R. Ganga et al. / Comparative Biochemistry and Physiology, Part B 142 (2005) 410–418418

Chapter 6
Modulation of ACTH-induced cortisol release by
polyunsaturated fatty acids in interrenal cells from
gilthead seabream, Sparus aurata
Ganga, R., Tort, L., Acerete, L., Montero, D. and Izquierdo, M.S.
Journal of Endocrinology, 190:39-45

Modulation of ACTH-induced cortisol release by polyunsaturated fattyacids in interrenal cells from gilthead seabream, Sparus aurata
R Ganga, L Tort1, L Acerete1, D Montero and M S Izquierdo
Grupo de Investigacion en Acuicultura, Instituto Canario de Ciencias Marinas, PO Box 56, 35200-Telde, Las Palmas, Canary Islands, Spain1Department of Cell Biology, Physiology and Immunology, Universitat Autonoma de Barcelona, Bellaterra 08193, Spain
(Requests for offprints should be addressed to R Ganga; Email: [email protected])
Abstract
Highly unsaturated fatty acids are essential components of
cellular membranes of vertebrates and can modulate
physiological processes, including membrane transport,
receptor function and enzymatic activities. In gilthead sea
bream, dietary deficiencies of essential fatty acids of marine
fish raise the basal cortisol levels and alter the pattern of
cortisol release after stress. The aim of the present study was to
clarify the effect of different essential fatty acids on
adrenocorticotropic hormone (ACTH)-induced cortisol
production and release in fish, through in vitro studies of sea
bream interrenal cells maintained in superfusion and
incubated with different types of fatty acids and eicosanoid
production inhibitors. Results showed the first evidence of
the effect of certain fatty acids on cortisol production by
ACTH-stimulated interrenal cells in fish. Both arachidonic
acid (ARA) and particularly eicosapentaenoic acid (EPA)
promoted cortisol production in sea bream interrenal cells.
Moreover, incubation with indometacin (INDO) reduced
the increased cortisol production induced by EPA and ARA,
suggesting mediation by their cyclooxygenase-derived
products. Docosahexaenoic acid stimulated cortisol pro-
duction to a lesser extent than that caused by EPA or ARA,
but the inhibitory effect of INDO was not as marked as it was
for the other fatty acids. In contrast, supplementation with
dihomogammalinoleic acid reduced cortisol production,
denoting the inhibitor effect of this fatty acid in cortisol
secretion.
Journal of Endocrinology (2006) 190, 39–45
Introduction
Highly unsaturated fatty acids with 20 or more carbon atoms
and three or more double bonds (HUFA) are essential
components of cellular membranes and can modulate
physiological processes, including membrane transport,
receptor function and enzymatic activities. Hence, dietary
fatty acids have been shown to have marked effects on a variety
of immunological and haemostatic parameters (Balfry et al.
2001, Montero et al. 2001). HUFA possess a wide range of
cellular functions. One of the most important functions is to
supply precursors for the synthesis of eicosanoids, which are
produced in response to various extracellular stimuli by two
main types of dioxygenase enzymes: cyclooxygenases (COX)
and lipoxygenases (Horrobin 1983). Following cell stimu-
lation, both arachidonic acid (ARA; 20:4n-6) and eicosapen-
taenoic acid (EPA; 20:5n-3) are released from the membrane
by the action of phospholipase A2. Later these fatty acids are
transformed by a range of lipoxygenases and cyclooxygenases
to yield prostaglandins (PG), leukotrienes, lipoxins and other
compounds, which can modulate several immune functions
(Uhing et al. 1990).
Eicosanoids have been found in a large range of freshwater
and marine fish (Matsumoto et al. 1989, Mustafa & Srivastava
1989) and in many tissues (Henderson & Tocher 1987, Bell
et al. 1994a, Tocher 1995). In fish, a preferred eicosanoid
precursor for cyclooxygenase seems to be ARA (20:4n-6)
(Tocher & Sargent 1987, Bell et al. 1994a, 1994b, 1998), but
EPA (20:5n-3) and dihomo-g-linolenic acid (DHGLA;
20:3n-6) are also important eicosanoid precursors which
can modulate production and biological efficacy of ARA-
derived eicosanoids (Horrobin 1983, Bell et al. 1994a, Ganga
et al. 2005). In addition, the high content of docosahexaenoic
acid (DHA; 22:6n-3) in cellular membranes affects eicosanoid
production (Nablone et al. 1990). This fatty acid is also
recognised as a precursor of certain biologically active
trioxilated derivatives (German et al. 1983, Hong et al.
2005). Therefore, the supply of precursor polyunsaturated
fatty acids with 18 or more carbon atoms and two or more
double bonds (PUFA) for eicosanoid synthesis is directly
related to the fatty acid composition of membrane
phospholipids, which in turn is influenced by dietary PUFA
intake and metabolism (Lands 1989).
In gilthead sea bream, dietary deficiencies on n-3 HUFA,
essential fatty acids for marine fish (Izquierdo 1996), raised
the basal plasma cortisol levels and altered the pattern of
cortisol release after stress (Montero et al. 1998). Cortisol is a
key corticosteroid hormone for homeostatic response to stress
39
Journal of Endocrinology (2006) 190, 39–45 DOI: 10.1677/joe.1.067700022–0795/06/0190–039 q 2006 Society for Endocrinology Printed in Great Britain Online version via http://www.endocrinology-journals.org

in all vertebrates, through its effects on metabolism and
immune function (Hontela 1997, Wendelaar Bonga 1997) as
well as the osmoregulation process (Wendelaar Bonga 1997).
Thus, the increase in plasma cortisol levels is regarded as the
most reliable method for differentiating between stressed and
non-stressed fish (Thompson et al. 1993, Yin et al. 1995,
Rotllant & Tort 1997). Moreover, feeding relatively low levels
of n-3 HUFA, although not affecting growth and feed
efficiency, significantly raised plasma cortisol levels (Montero
et al. 2003).
However, the physiological mechanisms by which these
HUFA regulate the hormone-induced plasma cortisol levels
are not clear. In fish, several studies have suggested that ARA is
involved in the release of cortisol, although the actual
mechanisms have not been investigated (Gupta et al. 1985,
Bessonart et al. 1999, Harel et al. 2001, Koven et al. 2003, Van
Anholt et al. 2004). In mammals, certain studies suggest that
PG play an important role in mediating the corticosteroido-
genic action of adrenocorticotropic hormone (ACTH) (Kocsis
et al. 1999), and thus the role of fatty acids in stress response
seems to be mediated by the production of eicosanoids.
The present study aims to clarify the effect of different
HUFA on ACTH-induced cortisol production and release by
gilthead sea bream interrenal cells.
Material and Methods
Animals
Sexually immature gilthead sea bream (Sparus aurata) of body
weight 54$7G11$2 g supplied by a Spanish fish farm
(Masnou, Barcelona, Spain) were kept for 2 weeks in two
fibreglass tanks of 1000 l held in a semi-closed seawater
circulation system equipped with physical and biological
filters. Water temperature was maintained at 16–18 8C, the
salinity at 35–40% and photoperiod at 12 h light:12 h
darkness. Fish were fed once a day with a commercial feed
until 24 h before the in vitro trials to avoid feed interference.
A total number of 30 fish were employed in the experiments.
Superfusion trials
After 2 weeks of acclimatisation, fish were randomly taken
from the tanks in less than 1 min, immediately anaesthetised
with 2-phenoxyethanol (1:1000 v/v) and blood collected
with a hypodermic syringe from the caudal vein to minimise
the haemorrhage. Head kidney tissue was removed from two
fish in each superfusion trial and cut into very small fragments
in Hepes Ringer medium, which was used as the superfusion
medium. Afterwards, head kidney homogenates were pooled
and distributed in eight superfusion chambers (volume:
0$2 ml) in order to obtain a homogeneous aliquot from
each of them. Tissues were superfused with a Hepes (pH 7$4)
Ringer’s solution containing 171 mM NaCl, 2 mM KCl,
2 mM CaCl2H2O, 0$25% (w/v) glucose and 0$03% (w/v)
bovine serum albumin (Rotllant et al. 2001). The system was
temperature-controlled at 15 8C and superfusion medium was
pumped through the chamber at a rate of 75 ml/min by a
Masterplex L/SR multichannel peristaltic pump (Cole
Parmer Instrument Co. Vernon Hills, IL, USA).
Trials were started after 3 h of superfusion when cortisol
reached a stable baseline level (Rotllant et al. 2000a, 2000b) due
to several factors such as the different dispersion of interrenal
cells in the perfusion preparation, individual differences and the
pre-stress level of each fish. After the stabilisation period of 3 h,
tissues were subsequently incubated with different fatty acids. A
series of preliminary tests were performed in quadruplicate, to
determine the adequate fatty acid concentration (50, 150 or
300 mM) and incubation time (1 or 3 h) for anyof the three fatty
acids assayed (ARA, EPA and DHA). Best cortisol stimulation
was found with fatty acid concentrations of 50 mM and an
incubation time of 1 h (Table 1) and these conditions were used
afterwards in all the research experiments. Both in these
preliminary tests and in the research experiments, perfusion
medium was supplemented with the corresponding concen-
tration of different fatty acids ARA, EPA, DHA and DHGLA
(diluted in less than 0$5% of ethanol/medium v/v) prior to
tissue incubation. In a second series of experiments to clarify the
action mechanisms of these fatty acids, tissues were incubated
with a COX inhibitor indometacin (INDO) for 20 min at a
concentration of 25 mM diluted in superfusion medium. After
incubation with the fatty acids, the perfused tissues were
stimulatedwith ACTHat a concentration of 5 nMhACTH1–39
(Sigma) for 20 min. Subsequently, perfusion wasmaintained for
another 170 min, fraction samples being collected every 20 min
during this period. Cortisol stimulation factor was calculated by
the comparison of maximum cortisol released after ACTH
stimulation with baseline cortisol released (maximum releaseK
baseline release)/(baseline release) (Rotllant et al. 2001). In all
the series of experiments, each treatment was assayed in
quadruplicate.
Cortisol measurements
Cortisol concentration in the perfused fluid was determined
by RIA (Rotllant et al. 2001). The antibody used for the assay
was purchased from Biolink, S.L. (Costa Mesa, CA, USA) in a
Table 1 Effect of two fatty acid concentrations (50 and 150 mM) andtwo incubation times (1 h and 3 h) for three polyunsaturated fattyacids on cortisol secretion stimulation factor
1 h 3 h
TreatmentControl 14$71G2$41 13$28EPA 50 mM 29$63G2$59 7$79G3$29
150 mM 7$79G3$29 –ARA 50 mM 22$26C6$29 11$75G4$16
150 mM 12$25G1$86 –DHA 50 mM 35$72G9$28 2$60G1$16
150 mM 4$47G0$28 –
R GANGA and others $ Modulation of ACTH-induced cortisol release40
Journal of Endocrinology (2006) 190, 39–45 www.endocrinology-journals.org

final dilution of 1:6000. This antibody cross reactivity is 100%
with cortisol, 11$40% with 21-desoxycorticosterone, 8$90%
with 11-desoxycortisol and 1$60% with 17a-hydroxypro-
gesterone. The radioactivity was quantified using a liquid
scintillation counter. Cortisol levels are given as ng/g/h.
Statistical analysis
Significance of difference (P!0$05) between dietary treat-
ments was determined by ANOVA, followed by Duncan’s
multiple comparison test (Sokal & Rolf 1995). Analyses were
performed using SPSS software (SPSS for Windows 11$5;
SPSS Inc., Chicago, IL, USA).
Results
The different incubation times and fatty acid concentrations
assayed showed that 1 h of incubation time and a concentration
of 50 mM of fatty acid were the best conditions to obtain the
highest effect of fatty acid on cortisol secretion stimulation
factor (Table 1). As expected, after the stabilisation period of
3 h, cortisol values remained at basal levels for these fish species
and no significant differences were found among basal values
for the different superfused tissues (Fig. 1).
The effects of supplementation with different HUFA on
cortisol secretion are illustrated in Fig. 1. The production of
cortisol by interrenal cells was modified when the medium
was supplemented with HUFA in comparison with the
control. Addition of n-3 fatty acids, DHA and EPA induced a
higher and earlier cortisol response to ACTH than the control
without fatty acid incubation. Addition of n-6 fatty acids
did not modify the time of cortisol response in comparison
to the control, but induced a higher response. Cortisol
response was higher when ARA, EPA or DHA was added to
fatty acid and lower when DHGLA was used. Such response
expressed as stimulation factor was significantly (P!0$05)
higher with EPA (33$71G4$5 basal secretion) and ARA
(28$7G4$47) incubation than control and DHGLA treat-
ment groups (Fig. 2). With DHA incubation, no significant
differences were found in the stimulation factor. By contrast,
DHGLA showed the lowest (P!0$05) stimulation factor
with an increase of only 8$95G2$17.
Supplementation of INDO, a COX inhibitor, induced the
stimulation of cortisol production by EPA and ARA observed
in the former set of experiments, with cortisol absolute values
not being different from those of the control (Fig. 3).
However, a significantly higher (P!0$05) cortisol peak was
obtained when the tissue was incubated with DHA, despite
the addition of INDO (Fig. 3).
Comparison of cortisol stimulation factorswhen INDOwas
added showed a significantly higher (P!0$05) cortisol
secretion in the tissue supplemented with EPA, ARA and
DHA (Fig. 4). Thus, the stimulation factor of cortisol
was 7$83G3$31 when tissue was supplemented with EPA,
6$97G4$56 with ARA, 13$67G2$66 with DHA and only
1$58G0$45 for control.
In addition, the comparison of cortisol stimulation factors
between experiments with or without INDO showed that
the addition of INDO significantly decreased ACTH-
stimulated cortisol secretion in all the treatment use of this
COX inhibitor (Fig. 5). However, this impaired stimulation
of cortisol production was lower in the DHA-supplemented
group in which INDO caused a 40$84% reduction in cortisol
secretion, giving values that were significantly different
(P!0$05) compared to EPA treatment where INDO caused
–50
0
50
100
150
200
250
200 250 300 350 400 450
Time in min
Cort
isol in
ng/g
Hk/h
Control EPA ARA DHA DHGLA
HU
FA
AC
TH
a
bc
bc
bc
c
a
a
ab
b
Figure 1 Absolute cortisol secretion (ng/g Hk/h) by sea bream head kidney (Hk) afterACTH stimulation following incubation with HUFA (different letters for a given timeindicate significant difference, P!0$05).
Modulation of ACTH-induced cortisol release $ R GANGA and others 41
www.endocrinology-journals.org Journal of Endocrinology (2006) 190, 39–45

a 76$76% reduction in cortisol secretion and a 75$71%
reduction with ARA treatment.
Discussion
Thepresent study showed thefirst evidenceof the effect ofHUFA
on cortisol production by ACTH-stimulated interrenal cells in
fish.These results are in agreementwith the observedmodulating
effect of dietary fatty acids in sea bream plasma cortisol levels
(Montero et al. 1998, 2001) and confirm the hypothesis of these
authors about the effective action of these fatty acids on the
cortisol secretion by the interrenal cells in gilthead sea bream.
Both ARA and EPA promoted ACTH-induced cortisol
production in sea bream interrenal cells used in the present
experiment. Dietary EPA has been shown to affect fish stress
resistance in several species. Although it promoted the growth
and survival of the red sea bream (Watanabe et al. 1989),
gilthead sea bream (Liu et al. 2002) and Japanese flounder
(Furuita et al. 1998), its effects on larval stress resistance seem to
depend on species and dietary levels. For instance, elevation of
dietary EPA increased red sea bream handling stress resistance
(Watanabe et al. 1989) and gilthead sea bream resistance to air
exposure and temperature shock, but not to salinity stress (Liu
et al. 2002).On the contrary, too high EPA levels reduced stress
resistance to air exposure in Japanese flounder (Furuita et al.
1998). ARA has also been shown to affect stress resistance in
several fish species. Dietary ARA levels of about 1% dryweight
feed are necessary not only for optimum growth and survival
of sea bream larvae (Bessonart et al. 1999), but also for
improved stress resistance after handling (Koven et al. 2003,
VanAnholt et al. 2004). Dietary ARA levels close to those used
by these authors did not affect the handling of stress resistance
in Japanese flounder, whereas higher ones reduced larval stress
resistance (Furuita et al. 1998).
These differences of the effects of dietary EPA or ARA on
stress resistance in different species may also be related to
different ratios among these fatty acids, since both are
competing substrates for cyclooxygenase enzymes (Izquierdo
et al. 2001). For instance, in Atlantic salmon, alteration in the
dietary ratio of n-3/n-6 fatty acids has been shown to prevent
stress susceptibility to transport (Bell et al. 1991). The present
0
5
10
15
20
25
30
35
40
45
Contr
ol
EP
A
AR
A
DH
A
DH
GLA
Treatment
Stim
ula
tion facto
r
d
a
ab
bc
c
Figure 2 Cortisol stimulation factor in sea bream head kidney afterACTH stimulation following incubation with different HUFA(different letters for different treatments indicate significantdifference, P!0$05 ANOVA).
0
50
100
150
200
250
200 250 300 350 400 450
Time in min
Cort
isol ng/g
Hk/h
Control
EPA
ARA
DHA
HU
FA
IND
O
AC
TH
a
b
b
b
Figure 3 Absolute cortisol secretion (ng/g Hk/h) by sea bream head kidney (Hk) afterACTH stimulation following incubation with different HUFA and INDO supplemen-tation (different letters for a given time indicate significant difference, P!0$05).
R GANGA and others $ Modulation of ACTH-induced cortisol release42
Journal of Endocrinology (2006) 190, 39–45 www.endocrinology-journals.org

study shows the first evidence found in fish that cyclo-
oxygenase-derived metabolites are involved in ACTH-
induced cortisol release by interrenal cells. The strong
reduction of cortisol release caused by INDO addition in
EPA and ARA supplemented groups suggested that the effect
of these fatty acids was, at least partly, mediated by their
cyclooxygenase-derived metabolites. Both fatty acids have
been found to be good precursors of cyclooxygenase-derived
PG in fish (Bell et al. 1994a, Ganga et al. 2005). In turn,
cyclooxygenase-derived PG have been shown to increase
in vitro cortisol release in interrenal tissue of female frogs during
ovulation (Gobbetti & Zerani 1993) and in human adrenal
cells as well (Vakharia & Hinson 2005).
Interestingly, DHA stimulation of ACTH-induced cortisol
production was lower than that caused by EPA or ARA.
Besides, the inhibitory effect of INDO in the DHA-
supplemented group was not so marked as in the other
treatments, suggesting that the action of DHA in cortisol
release from ACTH-stimulated interrenal cells is less
dependent on COX metabolites in gilthead sea bream.
Indeed, this fatty acid is a poorer substrate for COX than EPA
or DHA. The action of DHA on interrenal cells, whether it is
direct or mediated by its lipoxygenase derivatives, still has to
be elucidated since lipoxygenase metabolites have been
shown to modify the hormone-induced release of cortisol
in mammal adrenal tissues (Wang et al. 2000, Yamazaki et al.
2001). Using nordihydroguaiaretic acid, a lipoxygenase
inhibitor, cortisol secretion was inhibited in response to
ACTH in bovine adrenocortical cells (Wang et al. 2000).
DHA has long been known for its high value as an essential
fatty acid for marine fish (Watanabe 1982), particularly during
larval stages (Izquierdo et al. 1989) when it invariably
promotes growth, survival and stress resistance to a higher
extent than EPA or ARA in all the studied species (Watanabe
et al. 1989, Kanazawa 1997, Rodrıguez et al. 1997, Furuita
et al. 1999, Izquierdo et al. 2005). In gilthead sea bream,
dietary deficiencies of n-3 HUFA and especially DHA have
been shown to increase plasma cortisol levels after both acute
(net chasing) and chronic (high stocking density) stress
(Montero et al. 1998, 2001). Besides, imbalances in the
dietary n-3/n-6 fatty acids ratio induced by the inclusion of
vegetable oils in the diet have been shown to alter the release
of cortisol after stress in this species (Montero et al. 2003) and
in other species such as chinook salmon (Welker & Congleton
2003). The role of dietary oils on stress response in fish
remains unclear, but results indicate that dietary fatty acids
could be regulating the in vivo stress response through the
mechanisms discussed above. Moreover, vegetable oils in fish
diets have been shown to regulate COX-derived eicosanoids
directly (Ganga et al. 2005). Dietary supplementation of other
fatty acids such as ARA seems to be affecting plasma cortisol
levels after stress (Van Anholt et al. 2004), although the effect
on cortisol release in vivo is dose dependent, since high levels
of ARA in diet seem to be detrimental to chronic stress
resistance in larval gilthead sea bream (Koven et al. 2003).
Concentrations of fatty acids used in the present study were
those providing the maximum cortisol stimulation factor
(50 mM). However, higher concentrations reduced and even
inhibited cortisol secretion (Acerete L, Ganga R, Tort L &
Izquierdo MS. unpublished results), suggesting a concen-
tration dependency in the type of effect of these fatty acids.
This is the case in other organs such as testicles where medium
concentrations of ARA (3-30 mM) induced testosterone
production in testicular cells of male sea bass, whereas high
concentrations (300 mM) inhibited it (Asturiano 1999).
Despite the fact that no previous data has been published on
in vitro exposures of fish interrenal cells to fatty acids, cytotoxic
0
2
4
6
8
10
12
14
16
18
Control+INDO EPA+INDO ARA+INDO DHA+INDO
Treatment
Stim
ula
tio
n f
acto
r
b
a
aa
Figure 4 Cortisol stimulation factor in sea bream head kidney afterACTH stimulation following incubation with different HUFA andINDO supplementation (different letters for indicate significantdifferences among treatment).
0
5
10
15
20
25
30
35
40
45
Control EPA ARA DHA
Treatments
Stim
ula
tio
n f
acto
r
NO INDO
INDO
a
a
a
a
b
b b
b
Figure 5 Comparison of cortisol stimulation factor in sea breamhead kidney after ACTH stimulation following incubation withdifferent HUFA and including (filled bars) or not (dotted bars) INDOsupplementation (different letters for control or each fatty acidincubation indicates significant differences by INDO addition).
Modulation of ACTH-induced cortisol release $ R GANGA and others 43
www.endocrinology-journals.org Journal of Endocrinology (2006) 190, 39–45

effects at the membrane level have been found in mammalian
tissues, including renal cells (Zager et al. 1997). Particularly,
excess of ARA and its derived eicosanoids has been found to
cause apoptosis associated with oxidative stress in human
leukocytes (Pompeia et al. 2002). Studies are being conducted
at present to elucidate the effect of low and high physiological
concentrations of fatty acids on ACTH-induced cortisol
release by fish interrenal cells. Although this superfusion
method is widely used for studies of interrenal tissue in fish
(Rotllant et al. 2001), it prevents the possible control of blood
flow by COX-derived prostanoids. Nevertheless, new results
have shown the vasoregulatory function of COX-derived
products in fish (Stensløkken et al. 2002), none of them relate
though to interrenal tissues.
In summary, the role of ARA and EPA in the ACTH-
induced release of cortisol from gilthead sea bream interrenal
cells seems to be partly related to COX-derived metabolites
dependent on ARA and EPA, whereas the role of DHA seems
to be dependent on other factors. Both EPA and ARA as
single supplemented fatty acids increased the ACTH-induced
cortisol release from gilthead sea bream interrenal cells
whereas the effect of DHA was weaker. A well-balanced
supplementation of these three fatty acids could be necessary
to regulate cortisol release from interrenal cells in gilthead
sea bream.
Acknowledgements
The authors want to acknowledge the provision of fish by the
Granja Marina del Masnou. This study was supported by
grants AGL-2003-03112 (Ministry of Education) and Centre
de Referencia en Aquicultura (Generalitat Catalunya). The
authors declare that there is no conflict of interest that would
prejudice the impartiality of this scientific work.
References
Asturiano JF 1999 El proceso reproductivo de la lubina europea (Dicentrarchus
labrax L.), Efectos de los acidos grasos de la dieta: estudios in vivo e in vitro
PhD. Thesis. Valencia University, Spain, p. 251.
Balfry SK, Maule AG & Iwama GK 2001 Coho salmon Onchorhynchus kisutch
strain differences in disease resistance and non-specific immunity, following
immersion challenges with Vibrio anguillarum. Diseases of Aquatic Organisms
47 39–48.
Bell JG, McVicar AH, Park MT & Sargent JR 1991 High dietary linoleic acid
affects the fatty acid compositions of individual phospholipids from tissues
of Atlantic salmon (Salmo salar): association with stress susceptibility and
cardiac lesion. Journal of Nutrition 121 1163–1211.
Bell JG, Tocher DR & Sargent JR 1994a Effect of supplementation with
20:3(n-6), 20:4(n-6) and 20:5(n-3) on the production of prostaglandins E
and F of the 1-, 2- and 3-series in turbot (Scophtalmus maximus) brain
astroglial cells in primary culture. Biochimica et Biophysica Acta
1211 335–342.
Bell JG, Tocher DR, MacDonald FM & Sargent JR 1994b Effects of diets
rich in linoleic (18:2n-6) and a-linolenic acids on the growth, lipid class
and fatty acid compositions and eicosanoid production in juvenile
turbot (Scophtalmus maximus L.). Fish Physiology and Biochemistry
13 105–118.
Bell JG, Tocher DR, Farndale BM & Sargent JR 1998 Growth, mortality,
tissue histopathology and fatty acid composition, eicosanoid production and
response to stress, in juvenile turbot fed diets rich in g-linolenic acid in
combination with eicosapentaenoic acid or docosahexaenoic acid.
Prostaglandins, Leukotrienes and Essential Fatty Acids 58 353–364.
Bessonart M, Izquierdo MS, Salhi M, Hernandez-Cruz CM, Gonzalez MM
& Fernandez-Palacios H 1999 Effect of dietary arachidonic acid levels on
growth and survival of gilthead sea bream (Sparus aurata L.) larvae.
Aquaculture 179 265–275.
Furuita H, Takeuchi T & Uematsu K 1998 Effects of eicosapentaenoic and
docosahexaenoic acids on growth, survival and brain development of larval
Japanese flounder (Paralichthys olivaceus). Aquaculture 161 59–69.
Furuita H, Kooichi K & Takeuchi T 1999 Effect of different levels of
eicosapentaenoic acid and docosahexaenoic acid in Artemia nauplii on
growth, survival and salinity tolerance of larvae of the Japanese flounder,
Paralycthis olivaceous. Aquaculture 170 59–69.
Ganga R, Bell JG, Montero D, Robaina L, Caballero MJ & Izquierdo MS
2005 Effect of dietary lipids on plasma fatty acid profiles and prostaglandin
and leptin production in gilthead seabream (Sparus aurata). Comparative
Biochemistry and Physiology Part B: Biochemistry and Molecular Biology
142 410–418.
German B, Bruckner G & Kinsella J 1983 Evidence against a PGF4
prostaglandin structure in trout tissue—a correction. Prostaglandins 6
207–210.
Gobbetti A & Zerani M 1993 Prostaglandin E2 and prostaglandin F2 alpha
involvement in the corticosterone and cortisol release by the female frog,
Rana esculenta, during ovulation. Journal of Experimental Zoology 267
164–170.
Gupta OP, Lahlou B, Botella J & Porthe-Nibelle J 1985 In vivo and in vitro
studies on the release of cortisol from interrenal tissue in trout. I. Effects of
ACTH and prostaglandins. Experimental Biology 43 201–212.
Harel M, Gavasso S, Leshin J, Gubernatis A & Place AR 2001 The effect of
tissue docosahexaenoic and arachidonic acids levels on hypersaline
tolerance and leucocyte composition in striped bass (Morone saxatilis) larvae.
Fish Physiology and Biochemistry 24 113–123.
Henderson RJ & Tocher DR 1987 The lipid composition and biochemistry of
freshwater fish. Progress in Lipid Research 26 281–347.
Hong S, Tjonahen E, Morgan EL, Lu Y, Serhan CN & Rowley AF 2005
Rainbow trout (Oncorhynchus mykiss) brain cells biosynthesize novel
docosahexaenoic acid-derived resolvins and protectins—mediator lipido-
mic analysis. Prostaglandins, other lipid mediators 78 107–116.
Hontela A 1997 Endocrine and physiological responses of fish xenobiotics:
Role of glucocorticosteroid hormones. In Reviews in Toxicology. Environ-
mental Toxicology, pp 1–46. The Netherlands: ISO Press.
Horrobin DF 1983 The regulation of prostaglandin biosynthesis by the
manipulation of essential fatty acid metabolism. Revision of Pure Applied
Science 4 339–383.
Izquierdo MS 1996 Essential fatty acid requirements of cultured marine fish
larvae. Aquaculture Nutrition 2 183–191.
Izquierdo MS, Watanabe T, Takeuchi T, Arakawa T & Kitajima C 1989
Requirement of larval red seabream Pagrus major for essential fatty acids
(Nippon Suisan Gakkaishi). Bulletin of Japan Social Science Fish 55 859–867.
Izquierdo MS, Tandler A, Salhı M & Kolkkovski S 2001 Influence of
dietary polar lipids quantity and quality on ingestion and assimilation of
labelled fatty acids by larval gilthead sea bream. Aquaculture Nutrition 6
153–160.
Izquierdo MS, Montero D, Robaina L, Caballero MJ, Rosenlund G & Gines
R 2005 Alterations in fillet fatty acid profile and flash quality in gilthead
seabream (Sparus aurata) fed vegetable oils for a long term period, recovery
of fatty acid profiles by fish oil feeding. Aquaculture 250 431–444.
Kanazawa A 1997 Effects of docosahexaenoic acid and phospholipids on stress
tolerance of fish. Aquaculture 155 129–134.
Kocsis JF, Rinkardt NE, Satterlee DG, Weber H & Carsia RV 1999
Concentration-dependent, biphasic effect of prostaglandins on avian
coticosteroidogenesis in vitro. General and Comparative Endicronology 115
132–142.
Koven WM, Van Anholt RD, Lutzky S, Ben Atia I, Nixon O, Ron B &
Tandler A 2003 The effect of dietary arachidonic acid on growth, survival,
R GANGA and others $ Modulation of ACTH-induced cortisol release44
Journal of Endocrinology (2006) 190, 39–45 www.endocrinology-journals.org

and cortisol levels in different-age gilthead seabream larvae (Sparus auratus)
exposed to handling or daily salinity change. Aquaculture 228 307–320.
Lands WEM 1989 Differences in n-3 and n-6 eicosanaid precursors. In
Advances in Prostaglandin Thromboxane and Leukotriene Research, Vol 9,
pp 602-605. Eds B Samuelsson & PYK Wong. New York, NY,
USA: Raven Press.
Liu J, Caballero MJ, El-Sayed Ali T, Izquierdo MS, Hernandez Cruz CM,
Valencia A & Fernandez-Palacios H 2002 Necessity of dietary lecithin and
eicosapentaenoic acid for growth, survival, stress resistance and lipoprotein
formation in gilthead sea bream (Sparus aurata). Fish Science 68 1165–1172.
Matsumoto H, Iijima N & Kayama M 1989 The prostaglandin synthesis in
marine fish thrombocytes. Comparative Biochemistry and Physiology 93B
397–402.
Montero D, Tort L, Izquierdo MS, Robaina L & Vergara JM 1998 Depletion
of serum alternative complement pathway activity in gilthead seabream
caused by alpha-tocopherol and n-3 HUFA dietary deficiencies. Fish
Physiology and Biochemistry 18 399–407.
Montero D, Tort L, Robaina L, Vergara JM & Izquierdo MS 2001 Low
vitamin E in diet reduces stress resistance of gilthead seabream (Sparus
aurata) juveniles. Fish and Shellfish Immunology 11 473–490.
Montero D, Kalinowski T, Obach A, Robaina L, Tort L, Caballero MJ &
Izquierdo MS 2003 Vegetable lipid sources for gilthead seabream (Sparus
aurata): effects on fish health. Aquaculture 225 353–370.
Mustafa T & Srivastava KC 1989 Prostaglandins (eicosanoids) and their role in
ectothermic organisms. Advance Comparative Environmental Physiology 5
157–207.
Nablone G, Grynberg A, Chevalier A, Leonardi J, Termine E & Lafont H 1990
Phospholipase A activity of cultures rat ventricular myocytes is affected by
the nature of cellular polyunsaturated fatty acids. Lipids 25 301–306.
Pompeia C, Freitas JJS, Kim JS, Zyngier SB & Curi R 2002 Arachidonic acid
cytotoxicity in leukocytes: implications of oxidative stress and eicosanoids
synthesis. Biology of Cells 94 251–265.
Rodrıguez C, Perez JA, Diaz M, Izquierdo MS, Fernandez-Palacios H &
Lorenzo A 1997 Influence of the EPA/DHA ratio in rotifers on gilhead
seabream (Sparus aurata) larval development. Aquaculture 150 77–89.
Rotllant J & Tort L 1997 Cortisol and glucose responses after acute stress by
net handling in the sparid red porgy previously subjected to crowding stress.
Journal of Fish Biology 51 21–28.
Rotllant J, Balm PHM, Ruane NM, Perez-Sanchez J, Wendelaar Bonga SE &
Tort L 2000a Pituitary proopiomelanocortin-derived peptides and
hypothalamic-pituitary-interrenal axis activity in gilthead sea bream (Sparus
aurata) during prolonged crowding stress: differential regulation of
adrenocorticotropin hormone and melanocyte-stimulating hormone
release by corticotrophin-releasing hormone and thyrotropin-releasing
hormone. General and Comparative Endocrinology 119 152–163.
Rotllant J, Balm PHM,Wendelaar Bonga SE, Perez-Sanchez J & Tort L 2000b
A drop in ambient temperature results in a transient reduction of interrenal
ACTH responsiveness in the gilthead sea bream (Sparus aurata L.). Fish
Physiology and Biochemistry 23 265–273.
Rotllant J, Balm PHM, Perez-Sanchez J, Wendelaar Bonga SE & Tort L 2001
Pituitary and interrenal function in gilthead sea bream (Sparus aurata L.,
Teleosteı) after handling and confinement stress. General and Comparative
Endocrinology 121 333–342.
Sokal RR & Rolf SJ 1995 Biometry. In The Principles and Practice of Statistics
in Biological Research. 3rd edn, p 419. New York, NY, USA: WH Freeman
and Company.
Stensløkken KO, Sundin L & Nilsson GE 2002 Cardiovascular effects of
prostaglandin F2a and prostaglandin E2 in Atlantic cod (Gadus morhua).
Journal of Comparative Physiology B Biochemical, Systemic, and Environmental
Physiology 172 363–369.
Thompson I, White A, Fletcher TC, Houlihan DF & Secombes CJ 1993
The effect of stress on the immune system of Atlantic salmon (Salmo
salar L.) fed diets containing different amounts of vitamin C. Aquaculture
114 1–18.
Tocher DR 1995 Glycerophospholipid metabolism. In Biochemistry and
Molecular Biology of Fishes, vol. 4, Metabolic and Adaptational Biochemistry,
pp 119–1957. Eds W Hochachka & TP Mommsen. Amsterdam:
Elsevier Press.
Tocher DR & Sargent JR 1987 The effects of calcium ionophore A23187 on
the metabolism of arachidonic and eicosapentaenoic acids in neutrophils a
marine teleost fish rich in (n-3) polyunsaturated fatty acids. Comparative
Biochemistry and Physiology 87B 733–739.
Uhing RJ, Cowlen MS & Adams DO 1990 Mechanisms regulating the
production of arachidonate metabolites in mononuclear phagocytes.
Current Topics in Membranes Transport 35 349–374.
Vakharia K & Hinson JP 2005 Lipopolysaccharide directly stimulates cortisol
secretion by human adrenal cells by a cyclooxygenase-dependent
mechanism. Endocrinology 146 1398–1402.
Van Anholt RD, Spanings FAT, Koven WM & Wendelaar Bonga SE 2004
Dietary supplementation with arachidonic acid in tilapia (Oreochromisi
mossambicus) reveals physiological effects not mediated by prostaglandins.
General and Comparative Endocrinology 139 215–226.
Wang H, Walker SW, Mason JI, Morley SD & Williams BC 2000 Role of
arachidonic acid metabolism in ACTH-stimulated cortisol secretion by
bovine adrenocortical cells. Endocrine Research 26 705–709.
Watanabe T 1982 Lipid nutrition in fish. Comparative Biochemistry and
Physiology 73B 3–15.
Watanabe T, Izquierdo MS, Takeuchi T, Satoh S & Kitajima C 1989
Comparison between eicosapentaenoic and docosahexaenoic acids in terms
of essential fatty acid efficacy in larval red seabream (Nippon Suisan
Gakkaishi). Bulletin Japan Social Science Fish 55 1635–1640.
Wendelaar Bonga SE 1997 The stress response in fish. Physiology Review 77
591–625.
Welker TL & Congleton JL 2003 Relationship between dietary lipid source,
oxidative stress, and physiological response to stress in sub-yearling
Chinook salmon (Oncorhynchus tshawytsha). Fish Physiology and Biochemistry
29 225–235.
Yamazaki T, Higuchi K, Kominami S & Takemori S 2001 15-Lipoxygenase
metabolite(s) of arachidonic acid mediates adrenocotropin action in bovine
adrenal steroidogenesis. Endocrinology 137 2670–2675.
Yin Z, Lam TJ & Sin YM 1995 The effects of crowding stress on the non-
specific immune response in fancy carp (Cyprinus carpio L.). Fish and Shellfish
Immunology 5 519–529.
Zager RA, Iwata M, Conrad DS, Burkhart KM & Igarashi Y 1997 Altered
ceramide and sphingosine expression during the induction phase ischemic
acute renal failure. Kidney International 52 60–70.
Received in final form 23 March 2006Accepted 29 March 2006Made available online as an Accepted Preprint21 April 2006
Modulation of ACTH-induced cortisol release $ R GANGA and others 45
www.endocrinology-journals.org Journal of Endocrinology (2006) 190, 39–45

Chapter 7
ACTH-stimulated cortisol-release by the head-kidney
interregnal tissue from seabream (Sparus aurata) fed with
linseed and soybean oil
Ganga, R., Bell, J.G., Montero, D., Vraskou, Y., Ganuza, E., Tort,
L., Vaquero, A. and Izquierdo, M.S.
Submitted to British Journal of Nutrition

Chapter 7 Vegetable oils and head kidney cortisol release
ACTH-stimulated cortisol-release by the head-kidney-interrenall tissue from seabream (Sparus aurata) fed with linseed and soybean oil
Ganga, Rachid, Bell, J.G.1, Montero, D., Vraskou, Y., Ganuza, E., Tort, L.
2, Vaquero, A.
3
& Izquierdo, M.S.
Grupo de Investigación en Acuicultura, Instituto Canario de Ciencias Marinas, PO Box
56, 35200, Telde, Las Palmas, Canary Islands, Spain. 1Institute of Aquaculture, University of Stirling FK9 4LA, Scotland, UK.
2Departamento of Cell Biology, Physiology and Immunology, Unversitat Autonòma de
Barcelona, Bellaterra 08193, Spain 3
Biomar Iberia/ ProAqua Nutrition, S.A., A-62, Km, 99, ES-34210 Dueñas, Spain.
Abstract
The mode of action of highly unsaturated fatty acids (HUFA) in the regulation of
gilthead seabream (Sparus aurata) interrenal cortisol production was studied through in
vitro trials using a dynamic superfusion system. Fish were previously fed with different
diets containing several levels of inclusion of linseed oil (LO) or soybean oil (SO) for a
period of 26 weeks. Five diets were tested, with anchovy oil as the only lipid source for
the control diet (fish oil, FO), two different substitution levels (70 and 100%) were
tested using either linseed or soybean oils (70LO, 70SO, 100LO, 100SO). Fatty acid
compositions of the head kidney reflected the dietary input, thus EPA, DHA, ARA and
n-3 HUFA were significantly (P<0.05) reduced in fish fed VOs compared to the FO diet.
Feeding 70 % or 100% LO increased significantly (P<0.05) cortisol release in head
kidney after stimulation with adrenocorticotrophic hormone (ACTH), while feeding SO
decreased but not significantly this response. Cortisol stimulation factor was increased in
fish fed 70LO and 100LO diets compared to control. Moreover, inhibition of eicosanoid
production by incubating the head kidney tissue with indomethacin, (INDO) as a
cycloxygenase inhibitor, or nordihydroguaiaretic acid (NDGA), a lipoxygenase inhibitor,
significantly reduced (P<0.05) the cortisol release after ACTH stimulation in 70LO,
100LO and 100SO. Cortisol stimulation factor was reduced when incubating the head
kidney from FO, 70LO, 100LO with INDO or NDGA, while it was increased in 70SO.
This experiment described the modulation of cortisol release by dietary HUFAs and the
mediation of cyclooxygenase and/or lipooxygenase in their mechanism of action.
Key words: Gilthead seabream, HUFA, LO, SO, INDO, NDGA, cortisol, head kidney, superfusion
137

Chapter 7 Vegetable oils and head kidney cortisol release
Introduction
Marine teleosts have requirements for the essential long chain highly unsaturated
fatty acids of the n-3 series (HUFA), docosahexaenoic acid (DHA, 22:6n-3) and
eicosapentaenoic acid (EPA, 20:5n-3) (Watanabe et al., 1983a,b; Izquierdo et al., 1989,
Izquierdo, 1996). Other studies have also pointed out the importance of the long chain n-
6 HUFA, arachidonic acid (ARA, 20:4n-6), as essential for marine fish (Castell et al.,
1994; Bessonart et al., 1999). These three fatty acids, as components of phospholipids,
constitute a critical part of the cell membrane of most tissues and are responsible for
maintaining an adequate physiological response of the cells (Gurr and Harwood 1991;
Sargent et al., 1993a), being particularly important to promote stress resistance and
defence against pathogenic challenge (Montero et al., 1998).
Stress in fish is monitored by plasma cortisol levels which is a general indicator of
stressful conditions in vertebrates (Pickering and Pottinger 1989) and its release into the
circulation is controlled by the hypothalamus–pituitary–interrenal axis. The cortisol
release is preceded by the stimulation of the interrenal tissue by secretion of pituitary
hormones, in particular the adrenocorticotrophic hormone (ACTH) (Donaldson, 1981).
Although some other hormones have been shown to stimulate cortisol release from
interrenal tissue, ACTH is the dominant secretagogue (Schreck et al., 1989, Arnold-Reed
and Balment, 1991, Lamers et al., 1992).
The understanding of the pathways and intracellular messengers that regulate
cortisol synthesis in fish is very limited. The cortisol synthesis by ACTH has been found
to be dependent on cAMP as an intracellular second messenger in the coho salmon
(Oncorhynchus kisutch) (Patiño et al., 1986). In mammals, the main pathway leading to
corticosteroid synthesis by ACTH stimulation involves a signalling cascade integrating
G-proteins, adenylyl cyclase, cAMP and protein kinase A (PKA) (Schimmer, 1995).
Other pathways, involving protein kinase C (PKC) via stimulation by angiotensin II
(AII) or acetylcholine, both known secretagogues of cortisol in fish (Kloas et al., 1994),
share a role in the regulation of corticosteroid synthesis (Bird et al., 1990). Moreover,
PKA has been suggested to be a crucial stimulatory component in the ACTH-mediated
signalling pathway in fish adrenal steroidogenesis (Lacroix and Hontela 2001), whereas
PKC has been shown to have an inhibitory role in the acute cortisol response in fish
adrenocortical cells (Lacroix and Hontela 2001).
138

Chapter 7 Vegetable oils and head kidney cortisol release
How lipids and mainly HUFA could modulate cortisol release in vertebrates is not
well known. In a previous study, we showed that free HUFA modulate cortisol secretion
in seabream head kidney (HK) maintained in superfusion (Ganga et al., 2006). ARA,
EPA and DHA stimulated cortisol release by interrenal tissue while
dihomogamalinolenic acid (DHGLA; 20:3n-6) inhibited release Besides, it was
demonstrated that ACTH induced cortisol release is partly mediated by cycloxygenase
(COX) metabolites (Ganga et al., 2006). Moreover, PGE2 derived from ARA has been
shown to modulate the sensitivity of the hypothalamus–pituitary–adrenal (HPA) axis,
which is responsible for the release of cortisol in response to stress in mammals (Lands,
1991; Nye et al., 1997), and possibly also in the homologous hypothalamus–pituitary–
interrenal (HPI) axis in fish (Gupta et al., 1985).
Fish oil (FO) has been the main source of HUFA in aquafeeds, but in recent years,
due to the concerns about FO sustainability and cost, alternative oil sources are
frequently included in fish feeds. FO partial replacement by vegetable oils (VO) does not
affect fish growth or feed utilisation in several species (Torstensen et al., 2000; Bell et
al., 2001, 2002; Caballero et al., 2002; Izquierdo et al., 2003, 2005; Montero et al.,
2005). Nevertheless, high substitution levels by VO have been shown to alter fish
resistance to stressful conditions by increasing their cortisol levels (Montero et al.,
2003). However, little is known about the physiological mechanisms involved in the
regulation of stress by fatty acids.
Since vegetable lipids lack HUFA, its dietary inclusion may modify tissue
composition, altering cell membrane fluidity, receptor mediated cortisol response and
finally leading to a reduced functionality of the target organ. In addition, vegetable lipids
can reduce the availability of eicosanoid precursors ARA, EPA, DHGLA and DHA
leading to dysfunctional eicosanoid signalling (Balfry and Higgs, 2001; Tocher et al.,
2000) which may affect fish response to stress.
The aim of the present study was to clarify the effect of replacing FO by linseed
and soybean vegetable oils, in the gilthead seabream (Sparus aurata) stress response to
ACTH stimulation. For this purpose, the HK tissue was maintained in a superfusion
system and incubated with inhibitors of eicosanoid production. Accordingly, five diets
with different levels of FO substitution (0, 70 and 100), either with linseed oil (LO) or
soybean oil (SO) were fed to gilthead seabream juveniles.
139

Chapter 7 Vegetable oils and head kidney cortisol release
Materials and Methods
Animals
The study was carried out at Instituto Canario de Ciencias Marinas (ICCM,
Canary Islands, Spain), and fish were purchased from a local fish farm (ADSA, Canary
Islands. Spain). A total of seven hundred and fifty gilthead seabream (Sparus aurata),
with an average initial body weight of 45 g were randomly distributed in 500 l
polyethylene circular tanks (45 fish/tank, 3 tanks per diet). Tanks were supplied with
continuous seawater (36 ‰) flow and aeration. Fish were fed under natural photoperiod
conditions of approximately 12 h/12 h dark-light. Water temperature and dissolved O2
concentration during the experimental period ranged from 20.0 to 24.2 ºC, and from 5.04
to 8.7 ppm respectively.
Diets
Fish were fed the experiment diets (Table 2.3) until apparent satiation (3
times/day, 6 days/week), until they reached commercial market size after 26 weeks. Five
iso-energetic and isonitrogenous experimental were diets formulated to provide a lipid
content of 16 % were formulated. Anchovy oil was the only added lipid source in the FO
diet (100% fish oil). All the other diets contained vegetable oils: to substitute either 70%
of the anchovy oil by linseed oil (LO) in diet 70LO, by soybean oil (SO) in diet 70SO or
100% in diets 100LO (with LO) and 100SO (with SO). Fish oil was included in diets
70LO and 70SO at a level high enough to meet the EFA requirements of this species
(Kalogeropoulos et al., 1992).
Biochemical analysis
Lipid from the experimental diets and fish HK were extracted with chloroform:
methanol (2:1 v:v) as described by Folch et al.,(1957). The fatty acid methyl esters were
obtained by transesterification with 1 % sulphuric acid in methanol and purified by
absorption chromatography on NH2 Sep-pack cartridges (Waters. S.A. Milford,
Massachusetts) and separated and quantified by gas-liquid chromatography (Christie,
1982).
140

Chapter 7 Vegetable oils and head kidney cortisol release
Preparation and stimulation of head kidney tissue
At the end of the feeding period, 2 fish were randomly taken from each tank (6-8
per treatment) in less than 1 minute, immediately anaesthetized with 2-phenoxyethanol
(1:1000 v/v) and blood collected with a hypodermic syringe from the caudal vein to
minimize haemorrhage during the extraction of the tissue. HK tissue was removed from
two fish in each superfusion trial, and cut into very small fragments in Hepes Ringer
Medium, which was used as the superfusion medium. Afterwards, HK homogenates
were pooled and distributed in 8 superfusion chambers (volume: 0.2 ml) in order to
obtain a homogeneous aliquot in each of them. Tissues were superfused with a Hepes
(pH 7.4) Ringer’s solution containing 171 mM NaCl, 2 mM KCl, 2 mM CaCl2H2O, 0.25
% (w/v) glucose, and 0.03 % (w/v) bovine serum albumin (Rotllant et al.,2001). The
system was temperature-controlled at 18°C and superfusion medium was pumped
through the chamber at a rate of 75 ml/min by a Masterplex L/SR multichannel peristaltic
pump (Cole Parmer Intrument Co., Vernon Hills, Illinois).
Trials were started after 3 h of superfusion when cortisol reached a stable
baseline level (Rotllant et al., 2000a, b), in order to avoid deviations due to the different
dispersion of interrenal cells in the perfusion preparation and the individual differences
or the pre-stress level of each fish. After the stabilisation period of 3 h, tissues were
stimulated with ACTH at a concentration of 5 nM hACTH1-39 (Sigma) for 20 min.
Subsequently, perfusion was maintained for another 170 min, fraction samples being
collected every 20 min during this period. In a second series of experiments to clarify the
action mechanisms of HUFA and the implication of eicosanoids in this process, tissues
were incubated with a COX inhibitor (Indomethacin, INDO), or lipoxygenase (LOX)
inhibitor (Nordihydroguaiaretic acid, NDGA) for 20 min at a concentration of 25 µM
diluted in superfusion medium, and subsequently the tissues were stimulated with ACTH
as explained before and maintained for another 170 min collecting samples every 20
min. In all series of experiments each treatment was assayed in quadruplicates. Cortisol
stimulation factor (SF) was calculated by comparison of maximum cortisol released after
ACTH stimulation with baseline cortisol released (maximum release-baseline
release)*100/(baseline release) (Rotllant et al., 2001).
Cortisol measurements
Cortisol concentration in the perfused fluid was determined by
radioimmunoassay (RIA) (Rotllant et al., 2001). The antibody, Biolink, S.L. (Costa
141

Chapter 7 Vegetable oils and head kidney cortisol release
Mesa, California), was used in a final dilution of 1:6000. This antibody cross reactivity
is 100% with cortisol, 11.40% with 21-desoxycorticosterone, 8.90% with 11-
desoxycortisol and 1.60% with 17a-hydroxyprogesterone. The radioactivity was
quantified using a liquid scintillation counter. Cortisol levels are given as ng g HK-1
h-1
.
Statistical analysis
Significance of difference (P<0.05) between dietary treatments was determined
by one-way analysis of variance (ANOVA) followed by Duncan multiple comparison
test (Sokal and Rolf 1995). Analyses were performed using SPSS software (SPSS for
windows 13).
Results
Effect of vegetable oil inclusion on fatty acid compositions
Lipid peroxidation products were determined as thiobarbituric acid reactive
substances (TBARS) and they showed no significant difference between the diets,
ranging between 8.56 and 3.85 mmole of malonaldehyde (MDA)/kg of wet diet. No
dietary effect was observed on TBARS concentration (P<0.05).
Fatty acid composition of the diets reflected the inclusion of plant oils (Table
2.6). Total saturated fatty acids ranged from 16.28% in 100LO to 36.68% in FO diet.
Total monoenoics fatty acids (mainly oleic acid (18:1n-9, OA)) ranged from 22.62 % in
100LO to 29.09 % in 100SO diet. α-Linolenic acid (18:3n-3, LNA) increased with
increasing inclusion of LO, from 0.48 % in FO to 37.63% in diet 100LO. Similarly,
linoleic acid (18:2n-6, LA) increased, particularly with the increasing inclusion of
soybean oil, from 4.02 % in FO to 38.51% in 100SO. EPA and DHA were reduced by
the increased content of plant oils in the diets ranging from 10.05% in FO to 2.06 % in
100SO diet and from 7.82% in FO to 2.91% in 100SO, for EPA and DHA respectively.
ARA was also decreased by the plant oil inclusion ranging from 1.11% in FO to 0.24%
in 100LO diet.
Fish HK fatty acid profile of total lipids reflected the dietary lipid composition
(Figure 7.1). N-3 fatty acids were significantly increased in fish fed LO diet, while n-6
content was significantly increased in SO fed diet. N-9 was also increased in fish fed the
VO diet compared to control, due mainly to OA increase. However, the content in HUFA
142

Chapter 7 Vegetable oils and head kidney cortisol release
(EPA, ARA and DHA), mainly n-3 series, was significantly (P<0.05) reduced in fish fed
the two vegetable oils, compared to control diet fed fish oil, which were significantly
reduced. Then, a 45 % reduction was found in DHA from HK of fish fed 70LO, 55 % in
fish fed 100LO, 58 % in fish fed 70SO and 61 % fish fed 100SO in comparison to fish
oil fed fish. A 64 % reduction was found in EPA from HK of fish fed 70LO, 76 % in fish
fed 100LO, 73 % in fish fed 70SO and 80 % in fish fed 100SO in comparison to fish fed
fish oil. Regarding ARA, a 47 % reduction was found in fish fed 100LO, 16% in fish fed
70LO, 88% in fish fed 70SO and 86% in fish fed 100SO. As a consequence, the ratio
ARA/EPA was also markedly affected by the inclusion of vegetable oils and differed
depending on the dietary oil fed. Thus, lowest ARA/EPA ratio was found in HK of fish
fed 70SO, followed by 100SO, FO, 70LO and, finally, 100LO.
Fish fed LO have significantly higher content of OA, LA and mainly LNA
compared to fish fed the control diet. The fish fed SO showed significantly higher levels
of OA, LNA and mainly LA. However, the contents in HUFA, mainly EPA, ARA and
DHA, were significantly reduced in fish fed vegetable oils. In comparison to FO fish,
DHA was decreased by 45% in HK of 70LO fish, 55 % in 100LO fish, 58 % in 70SO
fish and 61 % 100SO fish. EPA was decreased by 64 % in HK of 70LO fish, 76 %
in100LO fish, 73 % in 70SO fish and 80 % in 100SO fish.
143

Chapter 7 Vegetable oils and head kidney cortisol release
Figure 7.1: Effect of feeding vegetable oils on HK fatty acids profile (g fatty acid/100g total fatty acids).
Effect of feeding vegetable oils on cortisol response to ACTH stimulation
Feeding fish with LO increased cortisol release in HK tissue after ACTH
stimulation; fish fed 100LO showed the highest cortisol release en two different peaks.
Fish fed 70SO and 100SO showed slightly lower, but not significant, cortisol response
after ACTH challenge (Figure 7.2). Therefore, fish fed SO diets rich in LA showed a
slight inhibition of cortisol response, whereas fish fed LO diets rich in LNA showed a
significant enhancement of cortisol release.
144

Chapter 7 Vegetable oils and head kidney cortisol release
Figure 7.2: Effect of Feeding LO and SO on HK cortisol release after ACTH challenge.
The overall cortisol release after ACTH challenge expressed as Cortisol SF
(Figure 7.3), was significantly highest in 100LO followed by 70LO. No significant
differences were found in cortisol SF of fish fed SO and FO diets. The correlation factor
between SF and ARA/EPA in HK was 98% reflecting the importance of both EPA and
ARA as eicosanoid precursors on cortisol secretion.
Figure 7.3: Cortisol stimulation factor from fish fed different vegetable oils, after challenging HK with
ACTH.
145

Chapter 7 Vegetable oils and head kidney cortisol release
Implication of COX and LOX metabolites in cortisol release
Cortisol release from HK after ACTH challenge was affected by the incubation
with eicosanoid inhibitors. Control fish decreased cortisol release after ACTH
stimulation when the HK tissue was incubated with both inhibitors (INDO or NDGA)
(Figure 7.4), denoting the implication of metabolites from both COX and LOX enzymes
in cortisol secretion.
Figure 7.4: Effect of incubating head kidney tissue with INDO or NDGA on cortisol release in control
fish (FO).
When the HK was incubated with INDO and NDGA, the cortisol release was
significantly decreased in fish fed 70LO diet, indicating the modulation of the cortisol
secretion by these two pathways, with this decrease being more pronounced when
NDGA was the used as inhibitor compared to INDO incubation (Figure 7.5).
146

Chapter 7 Vegetable oils and head kidney cortisol release
Figure 7.5: Effect of incubating head kidney tissue with INDO or NDGA on cortisol release in 70LO fed
fish.
In fish fed 100 LO, incubating tissue with INDO decreased the cortisol release.
Incubating tissue with NDGA decreased the cortisol release from this tissue, proving
again the COX and LOX role in the stress secretion. Also in this case, the response was
delayed and the use of NDGA was more effective in inhibiting the cortisol release than
INDO (Figure 7.6).
Figure 7.6: Effect of incubating head kidney tissue with INDO or NDGA on cortisol release in 100 LO
fed fish.
In fish fed 70SO incubating HK tissue with INDO increased cortisol release,
indicating another pathway of action in this fish species. NDGA incubation did not affect
cortisol release after ACTH stimulation (Figure 7.7). HK from fish fed 100SO diet
147

Chapter 7 Vegetable oils and head kidney cortisol release
showed also significantly decreased cortisol release after ACTH challenge when
incubated with INDO, there was also a slightly decreased cortisol release, but not
significant when the tissue was incubated with NDGA (Figure 7.8).
Figure 7.7: Effect of incubating head kidney tissue with INDO or NDGA on cortisol release in 70 SO fed
fish.
Figure 7.8: Effect of incubating head kidney tissue with INDO or NDGA on cortisol release in 100 SO
fed fish.
148

Chapter 7 Vegetable oils and head kidney cortisol release
Cortisol stimulation factor (SF) from the experiment using INDO and NDGA
(Figure 7.9) showed that incubating HK from FO fed fish with INDO reduced the
cortisol SF to 26 %, and when it was incubated with NDGA the SF was reduced to a 42
%. Also when the 70LO fed fish HK was incubated with INDO or NDGA, the cortisol
SF level was decreased by 39 % and 66 %, respectively. HK from 100LO fed fish
showed apparently the same level of decrease of the cortisol SF when incubated with
INDO or NDGA corresponding to 46 %. By contrast, in fish fed SO the action of the
COX and LOX inhibitor was different, such that incubating HK from fish fed 100SO,
with INDO, reduced the cortisol SF to a 20 % and the incubation with NDGA decreased
the cortisol SF to only 10 %. By comparison, the fish fed 70SO showed the opposite
response to the use of COX and LOX inhibitors, as when the tissue was incubated with
INDO the cortisol SF increased by about 3 fold and when it was incubated with NDGA,
the cortisol SF was increased by 60%.
Figure 7.9: Cortisol Stimulation factor from all the treatment after incubating the HK tissues with INDO
or NDGA.
Discussion
The EFA for marine fish comprise HUFA with carbon chain lengths of 20 and
22, for both the n-3 and n-6 series. Because the HUFA cannot be synthesised “de novo”
by the fish (Sargent et al., 1989) at a sufficient rate to meet the requirements, these EFA
must be provided in the diet. HUFA are essential for normal fish growth, for its cellular
149

Chapter 7 Vegetable oils and head kidney cortisol release
structure and function, including the maintenance of membranes and eicosanoid
metabolism (Henderson and Tocher, 1987). Replacing FO, in commercial diets, with VO
that contain very low levels of C20 and C22 PUFA, results in reduced tissue levels of
ARA, EPA and DHA (Bell et al., 1998; 2001, 2002; Montero et al., 2003, 2005). In this
experiment, at the end of the 26 week feeding period, the fatty acid profile from HK total
lipids from gilthead seabream reflected the dietary input. Thus, fish fed the SO had
significantly higher levels of LA and OA, and fish fed LO had significantly higher levels
of LNA and OA. In addition, since LO and SO contain large quantities of C18 fatty
acids, the n-6/n-3 fatty acid ratio was altered and this could affect fish health (Waagbo et
al.,1993, Montero et al.,2003, 2005). The contents of DHA and EPA, decreased
significantly in fish fed VO according to the level of inclusion, for instance EPA
decreased by about 80 % in fish fed 100SO and 76 % in fish fed 100LO compared to
controls, DHA was decreased by 61% in fish fed 100SO and 55% in fish fed 100LO.
Saturated and monounsaturated fatty acids, particularly 16:0, 18:1n-9, 20:1n-9 and
22:1n-11 are easily catabolised in fish to produce energy, while DHA and EPA are less
easily catabolised via ß-oxidation (Sargent et al., 2002). Thus, an increase in the OA, LA
and LNA contents in tissue from fish fed the VO could imply higher energy availability
in these fish to deal with homeostasis disturbances.
Under stress conditions, cortisol is secreted from interrenal cells of the HK
triggered by the corticotropin-releasing hormone (CRH) and ACTH hormonal cascade of
the HPI axis in fish. ACTH is well known to induce the production and release of
cortisol and is considered to be the major glucocorticoid stressor (Barton and Iwama,
1991), playing an important regulatory role in many important physiological processes
(Mommsen et al., 1999). Feeding gilthead seabream with 70LO and 100LO
significantly increased cortisol release from HK tissue after ACTH stimulation, in
accordance with previous results from in vivo studies (Montero et al., 2003). The levels
of cortisol found in this study for the control diet fed fish were similar to those reported
in our previous study (Ganga et al., 2006), whereas the results from HK of fish fed
100LO were 9 fold above the control response, indicating the negative effect of
including high levels of VO on diets for gilthead seabream.
It is well established that HUFA provided by the diet play an important role in
stress response in mammals as in fish. Enhancing the levels of dietary ARA promoted
150

Chapter 7 Vegetable oils and head kidney cortisol release
survival and resistance to stress in gilthead seabream larvae (Koven et al., 2001, 2003),
and feeding the ARA-supplemented diet resulted in a diminution in cortisol response
after net confinement compared to the fish fed a diet containing a low level of this fatty
acid (Van Anholt et al., 2004). In this study, the content of ARA in HK decreased by 55
% in fish fed 70LO and by 81 % in 100LO fed fish, which could be associated partly
with the increased cortisol levels seen in these treatments. However, a number of authors
have also demonstrated the importance of EPA and DHA in stress response and
stimulating cortisol release in fish (Kanazawa, 1997; Montero et al., 1998; Harel et al.,
2001; Liu et al., 2002, Ganga et al., 2006). In this experiment, the low dietary levels of
these important HUFAs in the diet lead to a parallel decrease in the HK causing a
significant modulation of cortisol release. These results demonstrated that feeding fish
with diets poor in these EFA affected cortisol release from HK after challenging the
tissue with ACTH, clearly denoting the importance of these nutrients in the correct
function of HK in response to stress situations.
The apparent contradiction in cortisol release levels found between fish fed the
LO or SO, could be explained according to the physiological mechanisms implicating
different FA provided by these oils. Once released from the membrane, free FA not only
acts as a precursor of eicosanoids but also acts directly as a ligand, affecting positively
or negatively the binding of steroid hormones to their specific intracellular receptors
(Sumida, 1995). In addition, FA can also co-regulate glucocorticoid-dependent gene
expression by modulating the activity of protein kinases involved in the phosphorylating
transcription factors (Sumida, 1995). Therefore, they may be playing a role in
modulating the intracellular steroid hormone signalling pathway to co-regulate a
glucocorticoid-sensitive promoter (Vallette et al., 1995). In human platelets, unsaturated
fatty acids such as palmitoleic acid (16:1), OA, LA, LNA and ARA were detected to
inhibit PLA2 activity (Ballou and Cheung, 1985), which is the key enzyme responsible
of liberating the COX and LOX substrate precursors from the membrane phospholipids.
On the other hand, the decrease in cortisol release in fish fed SO could be explained by
the higher content of OA and LA in their tissue. In rats, the maximal steroidogenic
response to ACTH was inhibited approximately 50 % by OA, concluding that the
modulation of steroidogenesis by these abundant naturally occurring lipids may be an
important component of the control mechanisms within the HPA pathway in disorders of
lipid homeostasis (Sarel and Widmaier, 1995). It is also demonstrated that OA and LA,
inhibited the action of ACTH on the adrenal gland, and the mechanism of action of these
151

Chapter 7 Vegetable oils and head kidney cortisol release
FA may be partly via inhibition of cAMP production (Matthys and Widmaier, 1998). By
contrast, the increased cortisol in HK from fish fed LO could be due to the effect of
higher content on LNA present in this tissue. It was demonstrated that reducing the LNA
in the diet for postmenopausal women reduced the cortisol release during stress (Spence
et al., 2003), denoting the role of this FA in stimulating cortisol release.
The mechanism by which these FA could modulate cortisol release in fish is still
a subject of many research studies and many hypotheses have been suggested. One of
the most important roles of these EFAs, is that they provide the eicosanoids precursors, a
well known series of hormones produced by the actions of the COX and LOX on these
FA, and which modulate many physiological and immunological processes. The
implication of the COX metabolites in cortisol release has been proved recently by in
vivo studies in fish (Koven et al., 2001, 2003; Van Anholt et al., 2004), and in our
previous in vitro study we demonstrated that incubating HK with a COX inhibitor,
significantly decreased cortisol release (Ganga et al., 2006). In mammals, there is clear
evidence that prostaglandins modulate the release of hypothalamic CRH and/or pituitary
ACTH (Abou-Samra et al., 1986; Zacharieva et al., 1992; Nasushita et al., 1997). For
example, it is known that prostaglandins, and PGE2 in particular, modulate the
sensitivity of the mammalian HPA axis and consequently change the stress response
(Nye et al., 1997; Bugajski et al., 2001). In turn, COX derived protaglandins have been
shown to increase in vitro cortisol release in interrenal tissue of female frogs during
ovulation (Gobbetti and Zerani, 1993) as well as in human adrenal cells (Vakharia and
Hinson, 2005).
In this study, incubating HK with INDO decreased cortisol release in control,
70LO, 100LO and 100SO fed fish, proving again the implication of prostanoids in
cortisol release in these fish. The implication of the LOX metabolites in cortisol release
was recently investigated but as far as we are aware, the present study is the first report
of the implication of LOX derivatives in the modulation of cortisol secretion by HK in
fish. Incubating the HK tissue with NDGA decreased the cortisol release in the majority
of the treatments. This is in accordance with the results from other studies proposing the
implication of the LOX pathway in stimulating ACTH release when ARA was added to
fish cells in vitro (Koven et al., 2003), and that LOX metabolites of ARA were reported
to stimulate GH (growth hormone) release in rat anterior pituitary cells (Abou-Samra et
152

Chapter 7 Vegetable oils and head kidney cortisol release
al., 1986; Won and Orth, 1994). More studies have pointed out the role of LOX products
in ACTH secretion and adrenal steroidogenesis in mammals (Wang et al., 2000,
Yamazaki et al., 2001).
Therefore, the two enzymes (COX and LOX) are both involved in cortisol
release and stress response. The mode of action of each enzyme could depend on the
availability of the precursor itself, and they may show antagonistic effects. Elsewhere,
some studies suggested a different hypothesis to establish an explication of this
relationship. Abou-Samra et al.,(1986) suggested an inhibitory effect of COX products
on ACTH release, down-regulating cortisol release, while LOX derivatives may have the
opposite effect, stimulating ACTH release and consequently up-regulating cortisol. In
addition, the stimulatory effect of Interleukine-3 on cortisol release is dependent on the
LOX pathway, while the effect of Interleukine-6 on adrenocortical cortisol secretion is
mediated through the COX pathway in bovine adrenocortical cells in primary culture
(Michl et al., 2000). However, other eicosanoids such as epoxygenase metabolites could
also be potential modulators of the HPI axis in fish, since they have been demonstrated
to stimulate ACTH and -endorphin secretion from rat pituitary cells (Cowell et al., 1991,
Won and Orth, 1994).
The understanding of the pathways and intracellular messengers that regulate
cortisol synthesis in fish is limited, and the way by which HUFA could modulate its
release in fish is a very new research target. Cortisol synthesis by ACTH has been
studied over a considerable time period, demonstrating the importance of cAMP as an
intracellular second messenger in the stimulation of cortisol production in the coho
salmon (Oncorhynchus kisutch) (Patiño et al., 1986). In mammals, it is well known that
the main pathway leading to corticosteroid synthesis in the adrenal gland involves
ACTH which stimulates a signalling cascade integrating G-proteins, adenylyl cyclase,
cAMP and protein kinase A (PKA) (Miller, 1988; Schimmer, 1995). Other pathways
involving protein kinase C (PKC) via stimulation by angiotensin II (AII) or
acetylcholine, both known secretagogues of cortisol in fish (Perrott and Balment, 1990;
Kloas et al., 1994), at least share a role in the regulation of corticosteroid synthesis,
during both chronic and acute stress (Bird et al., 1990). Subsequently, PKA has been
suggested to be a crucial stimulatory component in the ACTH-mediated signalling
pathway in fish adrenal steroidogenesis (Lacroix and Hontela, 2001), and in fish ovarian
follicular steroidogenesis in a similar cAMP-mediated pathway (Srivastava and Van der
Kraak, 1994a,b). Although, PKC has been shown to have an inhibitory role in the acute
153

Chapter 7 Vegetable oils and head kidney cortisol release
cortisol response in fish adrenocortical cells (Lacroix and Hontela, 2001), as activation
of PKC caused a dose-dependent decrease in ACTH-stimulated acute cortisol synthesis.
Studies with human and bovine adrenal cells have shown that stimulating PKC
suppresses cAMP-stimulated steroidogenesis (Mason et al., 1986; Naseeruddin and
Hornsby, 1990).
LA was found to stimulate PKC in cultured B16 mouse melanoma cells,
suggesting that the activation of PKC plays a pivotal role in the linoleic acid-induced
inhibition of melanogenesis in B16 cells (Ando et al., 1990). On the other hand, OA has
been found to stimulate PKC in platelet homogenates (Khan et al., 1992). Therefore,
relating these findings to our results, we could suggest that OA and LA, could inhibit
cortisol release in fish fed SO through stimulation of PKC which inhibits the cAMP-
mediated pathway of cortisol release.
Finally, studies carried out with fatty acids require great care in interpretation
because fatty acids can be hydrophobic or hydrophilic according to pH, quickly moving
between cell compartments, such as membranes, lipid-binding proteins, cytoplasm and
lipid droplets. Fatty acids can be found free or esterified and constantly move from one
form to another. Moreover, the elongation of shorter chain fatty acids and the oxidation
of fatty acids can also interfere with the levels of fatty acids in any given subcellular
compartment. For this reason, it is hard to predict the effect of these fatty acids on
cortisol release and have a clear explanation for the contradictory responses between LO
fed fish and SO fed fish, depending only on the diets fatty acid content. Other
physiologic processes could be implicated and interfere in this response. It is clear that
VO affected cortisol release in HK from gilthead seabream, this is due partly to the
action of COX and LOX enzymes converting the HUFA, present in the membrane, to a
biologically active eicosanoids. The presence of higher levels of C18 FA in the HK from
fish fed VO could activate other pathways related to cortisol release, due to the direct
action of these FA on PKC, PKA or cAMP. More studies are needed to clarify these
mechanisms involving all the pathways responsible for cortisol release in fish.
References
154

Chapter 7 Vegetable oils and head kidney cortisol release
Abou-Samra, A.B., Catt, K.J. and Aguilera, G. (1986) Role of arachidonic acid in the
regulation of adreno-corticotropin release from rat anterior pituitary cell
cultures. Endocrinology, 119:1427–1431.
Ando, H., Oka, M., Ichihashi, M., Mishima, Y. (1990) Protein kinase C and linoleic
acid-induced inhibition of melanogenesis. Pigment Cell Res, 3:200-206.
Arnold-Reed, D.E. and Balment, R.J. (1991) Atrial natriuetic factor stimulates in vivo
and in vitro secretion of cortisol in teleosts. Journal of Endocrinology, 128:R17–
R20.
Balfry, S.K. and Higgs, D.A. (2001) Influence of dietary lipid composition on the
immune system and disease resistance of finfish. In Nutrition and Fish Health,
pp 213-234. Eds Lim, C. & Cheung, W.Y. New York: Haworth Press.
Ballou, L.R. and Cheung, W.Y. (1985) Inhibition of human platelet phospholipases A2
activity by unsaturated fatty acids. Proc Natl Acad Sci USA, 82:371-375.
Barton, B.A. and Iwama, G.K. (1991) Physiological changes in fish from stress in
aquaculture with emphasis on the response and effects of corticosteroids. Annual
Review of Fish Diseases, 1:3-26
Bell, J.G., Tocher, D.R., Farndale, B.M. and Sargent, J.R. (1998) Growth, mortality,
tissue histopathology and fatty acid compositions, eicosanoid production and
response to stress, in juvenile turbot fed diets rich in gamma-linolenic acid in
combination with eicosapentaenoic acid or docosahexaenoic acid.
Prostaglandins Leukot Essent Fatty Acids, 58:353-364.
Bell, J.G., McEvoy, J., Tocher, D.R., McGhee, F., Campbell, P.J. and Sargent, J.R.
(2001) Replacement of fish oil with rapessed oil in diets of Atlantic salmon
(Salmo salar) affects tissue lipid composition and hepatocyte fatty acid
metabolism. J Nutr, 131:1535–1543.
Bell, J.G., Henderson, R.J., Tocher, D.R., McGhee, F., Dick, J.R., Porter, A., Smullen, R.
and Sargent, J.R. (2002) Substituting fish oil with crude palm oil in the diet of
Atlantic salmon (Salmo salar) affects tissue fatty acid compositions and hepatic
fatty acid metabolism, J Nutr, 132:222–230.
Bessonart, M., Izquierdo, M.S., Salhi, M., Hernández-Cruz, C.M., Gonález, M.M. and
Fernández-Palacios, H. (1999) Effect of dietary arachidonic acid levels on
growth and survival of gilthead sea bream Sparus aurata L. larvae. Aquaculture,
179:265–275.
155

Chapter 7 Vegetable oils and head kidney cortisol release
Bird, I.M., Walker, S.W. and Williams, B.C. (1990) Agonist-stimulated turnover of the
phosphoinositides and the regulation of adrenocortical steroidogenesis. Journal
of Molecular Endocrinology, 5:191-209.
Bugajski, J., Gadek-Michalska, A. and Bugajski, A.J. (2001) A single corticosterone
pre-treatment inhibits the hypothalamic-pituitary-adrenal responses to adrenergic
and cholinergic stimulation. J Physiol Pharmacol, 52:313-324.
Caballero, M.J., Obach, A., Rosenlund, G., Montero, D., Gisvold, M. and Izquierdo,
M.S. (2002) Impact of different dietary lipid sources on growth, lipid
digestibility, tissue fatty acid composition and histology of rainbow trout,
Oncorhynchus mykiss. Aquaculture, 214:253–271.
Castell, J.D., Bell, J.G., Tocher, D.R. and Sargent, J.R. (1994) Effects of purified diets
containing different combinations of arachidonic and docosahexaenoic acid on
survival, growth and fatty acid composition of juvenile turbot, Scophthalmus
maximus. Aquaculture, 128:315–333.
Christie, W.W. (1982) Lipid Analysis. Pergamon, Oxford
Cowell, A.M., Flower, R.J. and Buckingham, J.C. (1991) Studies on the roles of
phospholipase A2 and eicosanoids in the regulation of corticotrophin secretion
by rat pituitary cells in vitro. J Endocrinol, 130:21-32.
Donaldson, E.M. (1981) The pituitary–interrenal axis as an indicator of stress in fish. In
Stress and Fish, pp 11–47. Ed AD Pickering. London: Academic Press.
Folch, J., Lees, M. and Sloane-Stanley, G.H. (1957) A simple method for the isolation
and purification of total lipids from animal tissues. J Biol Chem, 226:497– 509.
Ganga, R., Tort, L., Acerete, L., Montero, D. and Izquierdo, M.S. (2006) Modulation of
ACTH-induced cortisol release by polyunsaturated fatty acids in interregnal
cells from gilhead seabream, Sparus aurata. Journal of Endocrinology, 190:39-
45.
Gobbetti, A. and Zerani, M. (1993) Prostaglandin E2 and prostaglandin F2 alpha
involvement in the corticosterone and cortisol release by the female frog, Rana
esculenta, during ovulation. Journal of Experimental Zoology, 267:164–170.
Gupta, O.P., Lahlou, B., Botella, J. and Porthé-Nibelle, J. (1985) In vivo and in vitro
studies on the release of cortisol from interrenal tissue in trout. I. Effects of
ACTH and prostaglandins. Exp Biol, 43:201-212.
156

Chapter 7 Vegetable oils and head kidney cortisol release
Gurr, M.I. and Harwood, J.L. (1991) Lipid Biochemistry, Chapman & Hll, London.
Harel, M., Gavasso, S., Leshin, J., Gubernatis, A. and Place, A.R. (2001) The effect of
tissue docosahexaenoic and arachidonic acids levels on hypersaline tolerance
and leucocyte composition in striped bass (Morone saxatilis) larvae. Fish
Physiol Biochem, 24:113-123.
Henderson, R.J. and Tocher, D.R. (1987) The lipid composition and biochemistry of
freshwater fish. Progress in Lipid Research, 26:281–347.
Izquierdo, M.S. (1996) Essential fatty acid requirements of cultured marine fish larvae.
Review article. Aquacult Nutr, 2:183–191.
Izquierdo, M.S., Watanabe, T., Takeuchi, T., Arakawa, T. and Kitajima, C. (1989)
Requirement of larval red seabream Pagrus major for essential fatty acids.
Nippon Suisan Gakkaishi, 55:859–867.
Izquierdo, M.S., Obach, A., Arantzamendi, L., Montero, D., Robaina, L. and Rosenlund,
G. (2003) Dietary lipid sources for seabream and seabass: growth performance,
tissue composition and flesh quality. Aquacult Nutr, 9:397–407.
Izquierdo, M.S., Montero, D., Robaina, L., Caballero, M.J., Rosenlund, G. and Ginés, R.
(2005 Alterations in fillet fatty acid profile and flesh quality in gilthead seabrem
(Sparus aurata) fed vegetable oils for a long term period. Recovery of fatty acid
profiles by fish oil feeding. Aquaculture, 250:431-444.
Kanazawa, A. (1997) Effects of docosahexaenoic acid and phospholipids on stress
tolerance of fish. Aquaculture, 155:129–134.
Kalogeropoulos, N., Alexis, M.N. and Henderson, R.J. (1992) Effect of dietary soybean
and cod-liver oil levels on growth and body composition of gilthead seabream
(Sparus aurata). Aquaculture, 104:293-308.
Khan, W.A., Blobe, G.C. and Hannun, Y.A. (1992) Activation of protein kinase C by
oleic acid. Determination and analysis of inhibition by detergent micelles and
physiologic membranes: requirement for free oleate. J Biol Chem, 267:3605-
3612.
Kloas, W., Reinecke, M. and Hanke, W. (1994) Role of the atrial natriuretic peptide for
adrenal regulation in the teleost fish Cyprinus carpio. American Journal of
Physiology, 267:R1034–R1042.
Koven, W.M., Barr, Y., Lutzky, S., Ben Atia, I., Weiss, R., Harel, M., Behrens, P. and
Tandler, A. (2001) The effect of dietary arachidonic acid (20:4n-6) on growth,
157

Chapter 7 Vegetable oils and head kidney cortisol release
survival and resistance to handling stress in gilthead seabream (Sparus aurata)
larvae. Aquaculture, 193:107–122.
Koven, W.M., Van Anholt, R.D., Lutzky, S., Ben Atia, I., Nixon, O., Ron, B. and
Tandler, A. (2003) The effect of dietary arachidonic acid on growth, survival,
and cortisol levels in different-age gilthead seabream larvae (Sparus aurata)
exposed to handling of daily salinity change. Aquaculture, 228:307-320.
Lacroix, M. and Hontela, A. (2001) Regulation of acute cortisol synthesis by cAMP-
dependant protein kinase and protein kinase C in teleost species, the rainbow
trout (Oncorhynchus mykiss). Journal of Endocrinology, 169:71-78.
Lamers, A.E., Flik, G., Atsma, W. and Wendelaar Bonga, S.E. (1992) A role for di-acetyl
á-melanocyte-stimulating hormone in the control of cortisol release in the teleost
Oreochromis mossambicus. Journal of Endocrinology, 135:285–292.
Lands, W.E.M. (1991) Biosynthesis of prostaglandins. Annu Rev Nutr, 11:41-60.
Liu, J., Caballero, M.J., Izquierdo, M., El-Sayed, A.T., Hernández-Cruz, C.M., Valencia,
A. and Fernández-Palacios, H. (2002) Necessity of dietary lecithin and
eicosapentaenoic acid for growth, survival, stress resistance and lipoptotein
formation in gilthead seabream Sparus aurata. Fisheries Science, 68:1165-1172.
Mason, J.I., Carr, B.R. and Rainey, W.E. (1986) The action of phorbol ester on
steroidogenesis in cultured human fetal adrenal cells. Endocrine Research,
12:447-467.
Matthys, L.A. and Widmaier, E.P. (1998) Fatty acids inhibit adrenocorticotropin
induced adrenal steroidogenesis. Horm Metab Res, 30:80–83.
Michl, P., Beikler, T., Engelhardt, D. and Weber, M.M. (2000) Interleukin-3 and
Interleukin-6 stimulate bovine adrenal cortisol secretion through different
pathways. Journal of Neuroendocrinology, 12:23-28.
Miller, W.L. (1988) Molecular biology of steroid hormone synthesis. Endocrine
Reviews, 9:295–318.
Mommsen, T.P., Vijayan, M.M. and Moon, T.W. (1999) Cortisol in teleosts: dynamics,
mechanism of action and metabolic regulation. Reviews in Fish Biology and
Fisheries, 9:211-268.
Montero, D. Tort, L., Izquierdo, M.S., Robaina, L. and Vergara, J.M. (1998) Depletion
of serum alternative complement pathway activity in gilthead seabream caused
158

Chapter 7 Vegetable oils and head kidney cortisol release
by a-tocopherol and n-3 HUFA dietary deficiencies. Fish Physiology and
Biochemistry, 18:399-407.
Montero, D., Kalinowski, T., Obach, A., Robaina, L., Tort, L., Caballero, M.J. and
Izquierdo, M.S. (2003) Vegetable lipid sources for gilthead seabream (Sparus
aurata): effects on fish health. Aquaculture, 225:353–370.
Montero, D., Robaina, L., Caballero, M.J., Gines, R. and Izquierdo, M.S. (2005)
Growth, feed utilization and flesh quality of European sea bass (Dicentrarchus
labrax) fed diets containing vegetable oils. A time-course study on the effect of a
re-feeding period with a 100% fish oil. Aquaculture, 248:121-134.
Naseeruddin, S.A. and Hornsby, P.J. (1990) Regulation of 11-_ and 17-_-hydroxylases
in cultured bovine adrenocortical cells: 3_,5_-cyclic adenosine monophosphate,
insulin-like growth factor-I, and activators of protein kinase C. Endocrinology,
127:1673–1681.
Nasushita, R., Watanobe, H. and Takebe, K. (1997) A comparative study of
adrenocorticoropin-releasing activity of prostaglandins E1, E2, F2α and D2 in
the rat. Prostaglandins, Leuko Essent Fatty Acids, 56:165–168
Nye, E.J., Hockings, G.I., Grice, J.E., Torpy, D.J., Walters, M.M., Crosbie, G.V.,
Wagenaar, M., Cooper, M. and Jackson, R.V. (1997) Aspirin inhibits
vasopressin-induced hypothalamic–pituitary–adrenal activity in normal humans.
J Clin Endocrinol Metab, 82:812–817.
Patiño, R., Bradford, C.S. and Shreck, C.B. (1986) Adenylate cyclise activators and
inhibitors, cyclic nucleotide analog, and phosphatidylinositol: Effects on
interregnal function of coho salmon (Oncorhynchus kisutch) in vitro. Gen Comp
Endocrinol, 63:230-235.
Perrott, M.N. and Balment, R.J. (1990) The renin-angiotensin system and the regulation
of plasma cortisol in the flounder, Platichus flesus. General and Comparative
Endocrinology, 78:414–420.
Pickering, A.D. and Pottinger, T.G. (1989) Stress responses and diseases response in
salmonid fish: effects of chronic elevation of plasma cortisol. Fish Physiol
Biochem, 7:253-258.
Rotllant, J., Balm, P.H.M., Pérez-Sánchez, J., Wendelaar Bonga, S.E. and Tort, L.
(2001) Pituitary and interrenal function in gilthead sea bream (Sparus aurata L.,
Teleosteí) after handling and confinement stress. General and Comparative
Endocrinology, 121:333–342
159

Chapter 7 Vegetable oils and head kidney cortisol release
Rotllant, J., Balm, P.H.M., Ruane, N.M., Pérez-Sánchez, J., Wendelaar Bonga, S.E. and
Tort, L. (2000a) Pituitary proopiomelanocortin-derived peptides and
hypothalamic-pituitary-interrenal axis activity in gilthead sea bream (Sparus
aurata) during prolonged crowding stress: differential regulation of
adrenocorticotropin hormone and melanocyte-stimulating hormone release by
corticotrophin-releasing hormone and thyrotropin-releasing hormone. General
and Comparative Endocrinology, 119:152–163.
Rotllant, J., Balm, P.H.M., Wendelaar Bonga, S.E., Pérez-Sánchez, J. and Tort, L.
(2000b) A drop in ambient temperature results in a transient reduction of
interrenal ACTH responsiveness in the gilthead sea bream (Sparus aurata L.).
Fish Physiology and Biochemistry, 23:265–273.
Sarel, I. and Widmaier, E.P. (1995) Stimulation of steroidogenesis in cultured rat
adrenocortical cells by unsaturated fatty acids. Am J Physiol, 268:R1484–R1490
Sargent, J.R., Henderson, R.J. and Tocher, D.R. (1989) The lipids. In Fish Nutrition,
Edn 2, pp 153-123. Eds Halver JE. San Diego ,CA: Academic Press.
Sargent, J.R., Bell, J.G., Bell, M.V., Henderson, R.J. and Tocher, D.R. (1993a) The
metabolism of phospholipids and polyunsaturated fatty acids in fish. In
Aquaculture: Fundamental and Applied Research, Coastal and Estuarine studies,
edn 43, pp 103-124. Eds Lahlou, B. and Vitello, P.. Washington DC: Amercian
Geophysical Union.
Sargent, J.R., Tocher, D.R. and Bell, J.G. (2002) The lipids. In Fish Nutrition, pp 181-
257. Eds JE Halver & Hardy RW. San Diego: Academic Press.
Schimmer, B.P. (1995) The 1994 Upjohn Award Lecture. Molecular and genetic
approaches to the study of signal transduction in the adrenal cortex. Canadian
Journal of Physiology and Pharmacology, 73:1097–1107.
Schreck, C.B., Bradford, C.S., Fitzpatrick, M.S. and Patiño, R. (1989) Regulation of the
interrenal tissue of fishes: non-classical control mechanisms. Fish Physiology
and Biochemistry, 7:259–265.
Sokal, R.R. and Rolf, S.J. (1995) Biometry. In The Principles and Practice of Statistics
in Biological Research. Edn 3, p 419. New York: WH Freeman and Company.
160

Chapter 7 Vegetable oils and head kidney cortisol release
Spence, J.D., Thornton, T., Muir, A.D. and Westcott, N.D. (2003) The effect of Flax
seed cultivars with differing content of α-linolenic acid and lignans on response
to mental stress. Journal of the American College of Nutrition, 22:494-501.
Srivastava, R.K. and Van Der Kraak, G. (1994a) Effects of activators of different
intracellular signaling pathways on steroid production by goldfish vitellogenic
ovarian follicules. General and Comparative Endocrinology, 93:181–191.
Srivastava, R.K. and Van Der Kraak, G. (1994b) Insulin as an amplifier of gonadotropin
action on steroid production: mechanisms and sites of action in goldfish
prematurational full-grown ovarian follicles. General and Comparative
Endocrinology, 95:60–70.
Sumida, C. (1995) Fatty acids: ancestral ligands and modern co-regulators of the steroid
hormone receptor cell signalling pathway. Prostaglandins Leukot Essent Fatty
Acids, 52:137-144.
Tocher, D.R., Bell, J.G., Henderson, R.J., Mc Ghee, F., Mitchell, D. and Morris, P.C.
(2000) The e¡ect of dietary linseed and rapeseed oils on polyunsaturated fatty
acid metabolism in Atlantic salmon (Salmo salar) undergoing parr-smolt
transformation. Fish Physiology and Biochemistry, 23:59-73.
Torstensen, B.E., Lie, O. and Froyland, L. (2000) Lipid metabolism and tissue
composition in Atlantic salmon (Salmo salar L.) —effects of capelin oil, palm
oil, and oleic acid-enriched sunflower oil as dietary lipid sources. Lipids,
35:653–664.
Vakharia, K. and Hinson, J.P. (2005) Lipopolysacharide Directly Stimulates Cortisol
Secretion by Human Adrenal Cells by a Cyclooxygenase-Dependent
Mechanism. Endocrinology, 146:1398-1402.
Vallette, G., Sumida, C., Thobie, N. and Nunez, E.A. (1995) Unsaturated fatty acids
synergistically enhance glucocorticoid-induced gene expresión. Cell Signal,
7:319-323.
Van Anholt, R.D., Spanings, F.A.T., Koven, W.M. and Wendelaar Bonga, S.E. (2004)
Dietary supplementation with arachidonic acid in tilapia (Oreochromis
mossambicus) reveals physiological effects not mediated by prostaglandins.
General and Comparative Endocrinology, 139:215-226.
Waagbo, R., Sandnes, K., Jorgensen, J., Engstad, R., Glette, J. and Lie, O. (1993) Health
aspects of dietary lipid sources and vitamin E in Atlantic salmon (Salmo salar).
161

Chapter 7 Vegetable oils and head kidney cortisol release
II. Spleen and erythrocyte phospholipid fatty acid composition, nonspecific
immunity and disease resistance. Fisk Dir Skr Ser Ernering, 6:63-80.
Wang, H., Walker, S.W., Mason, J.I., Morley, S.D. and Williams, B.C. (2000) Role of
arachidonic acid metabolism in ACTH-stimulated cortisol secretion by bovine
adrenocortical cells. Endocr Res, 26:705-709.
Watanabe, T., Tamiya, T., Oka, A., Hirata, M., Kitajima, C. and Fujita, S. (1983a)
Improvement of dietary value of live foods for fish larvae by feeding them on v3
highly unsaturated fatty acids and fat-soluble vitamins. Bull Jpn Soc Sci Fish,
49:471-479.
Watanabe, T., Kitajima, C. and Fujita, S. (1983b) Nutritonal values of live organism
review. Aquaculture, 34:115-143.
Won, J.G.S. and Orth, D.N. (1994) Role of lipoxygenase metabolites of arachidonic acid
in the regulation of adrenocorticotropin secretion by perfused rat anterior
pituitary cells. Endocrinology, 135:1496-1503.
Yamazaki, T., Higuchi, K., Kominami, S. and Takemori, S. (2001) 15-lipoxygenase
metabolite(s) of arachidonic acid mediates adrenocorticotropin action in bovine
adrenal steroidogenesis. Endocrinology, 137:2670-2675.
Zacharieva, S., Borissova, A.M., Andonova, K., Stoeva, I. and Matrozov, P. (1992) Role
of Prostaglandin E2 (PGE2) on the corticotropin-releasing hormone (CRH)-
induced ACTH release in healthy men. Horm Metab Res, 24:336-338.
162

Chapter 8
Conclusions

Chapter 8 Conclusions
163
Conclusions
1- Up to 70% of the dietary fish oil can be substituted by vegetable oils in on-
growing diets for gilthead seabream that contain South American fish oil and
fish meal as lipid and protein sources and a lipid content of about 17%, without
affecting seabream growth and survival. Higher percentage of substitution
causes growth retardation.
2- Membrane lipids of plasma and total lipids of muscle, liver and gills of sea
bream may be profoundly altered by giving diets with high content on VOs. N-3
HUFA content in fish fillet was markedly reduced by feeding VOs, what could
negatively affect its nutritional value for human consumption. Nevertheless,
feeding VOs affect fatty acid composition of liver in a higher extend than in
other tissues, whereas gills fatty acids profiles showed double ARA content than
the other tissues.
3- There was a selective retention of DHA and ARA in plasma phospholipids and
total lipids from muscle, liver and gills, confirming their importance in those
tissues.
4- Not only ARA, but also EPA was found to be an important precursor of
prostaglandines, and the dietary ratio between both fatty acids altered
prostaglandins production, what can affect numerous physiologic functions,
some of them related to fish health.
5- Plasma leptin concentration reflects feed intake, and is not significantly affected
by feeding VOs.
6- EPA and ARA as single supplemented fatty acids stimulate the ACTH-induced
cortisol release from seabream interrenal tissue.
7- DHA effect moderately stimulated interregnal tissue, while DHGLA inhibits
ACTH-induced cortisol release from the same tissue.
8- ACTH induced release of cortisol and the role of ARA and EPA is mediated by
COX and LOX-derived metabolites.
9- ACTH induced release of cortisol secretion by HUFA seems to be dependant on
the concentration and type of each fatty acid.
10- FO substitution by LO in diets for sea bream stimulated the ACTH-induced
cortisol release from interrenals tissue, mediated at least partly by COX and
LOX. In vivo, feeding LO increased basal and poststress plasma cortisol levels.

Chapter 8 Conclusions
164
11- Feeding various types of VOs affect differently stress response in sea bream,
with 70LO and 100LO increasing cortisol response after ACTH stimulation,
while SO decreasing this response. A well-balanced supplementation of these
dietary oils is important to regulate cortisol release and stress resistance.
12- Cortisol release is modulated by dietary HUFAs and this response is mediated
by cyclooxygenase and/or lipoxygenase metabolites.

Chapter 9
Summary

Chapter 9 Summary
Summary
The aim of this thesis was to investigate the effects of feeding different
vegetable oils on fish growth and fish health of gilthead seabream (Sparus aurata).
Article 1 describes how feeding seabream with diets containing high levels of
fish oil substitution by n-3 or n-6 fatty acids rich vegetable oils affects culture
performances and fatty acid composition of different fish tissues. Triplicate groups of
gilthead seabream were fed eight practical-type diets with a blend of LO and SO at
different levels during a period of 26 weeks. Substitution up to 70% or more of fish oil
by VOs reduced growth and affected negatively feed utilization. Fatty acid composition
of muscle, liver and gills were affected and correlated with the dietary input. EPA,
ARA, DHA and total n-3 HUFA were reduced in all the tissues while the C18 (LA and
LNA) fatty acids were increased in parallel with increasing VOs in diet affecting the
fish nutritional quality for the consumer. The elongase and Δ desaturase from C end products were also increased in all the tissues. Article 2 was focused on studying the effect of fish oil substitution levels and n-
3/n-6 fatty acids ratio on seabream welfare and resistance to stress. The fatty acids
composition of the head kidney was affected by the different dietary treatments; fish fed
VOs had increased amounts of C18 and lower amounts of n-3 HUFA. The physiological
response to crowding was affected by the diet. Fish fed LO registered higher basal
plasma cortisol concentration comparing with the other treatments. After 2h of
crowding all the treatments showed higher cortisol production while fish fed LO
showing dramatic levels. Cortisol pattern was influenced by the diet and LO fed fish
showed higher and faster response and a recuperation of normal levels after 1 week of
crowding. However, fish fed SO showed a lower and slower response but it takes more
time to recuperate the normal levels even after 1 week of crowding. Then, there is an
effect of feeding seabream with LO and/or SO on it response to stress.
In article 3, we studied the effects of different levels of substitution of fish oil by
vegetable oils blends on gilthead seabream health and welfare in terms of plasma fatty
acid composition and prostaglandin and leptin production. ARA, EPA and DHA were
preferentially incorporated into plasma polar lipids, and DHGLA accumulated with
increasing VO inclusion. ARA-derived PGE2 production in plasma was not affected by
VOs, in agreement with similar eicosanoids precursor ratio (ARA/EPA) in plasma
165

Chapter 9 Summary
phospholipids. Moreover, PGE3 was the major prostaglandin produced in plasma of fish
fed fish oil diets pointing out the importance of EPA as a precursor of prostaglandin in
marine fish. A negative correlation was found between plasma PGE2 and leptin plasma
concentration. Alteration in the amount and type of PG produced can partially be
responsible for the changes in the immune system and health parameters of fish.
Article 4 focuses on understanding the mechanisms implicated in the regulation
of stress resistance by polyunsaturated fatty acids by studying the production and
release of cortisol in gilthead seabream interrenal cells stimulated with
adrenocorticotropic hormone and the effect of eicosanoids production inhibitors. ARA
and particularly EPA promoted cortisol production in seabream interrenal tissue, while
the DHA effect was moderated. Moreover, incubation with indomethacin reduced this
increase in ARA and EPA treatment suggesting the implication of cyclooxygenase-
derived products in this release, while in DHA treatment was not marked. In contrast,
incubating head kidney tissue with DHGLA reduced cortisol production.
Article 5 describes the effect of feeding VOs along gilthead seabream on-
growing period on welfare in terms of cortisol production and release by head kidney
and the physiological pathways involved. Fatty acid compositions of the head kidney
reflected the dietary input, thus EPA, DHA, ARA and total n-3 HUFA were reduced in
fish fed VOs compared to FO diet. Feeding 70% or 100% LO, increased cortisol release
in head kidney after stimulation with ACTH, while feeding SO decreased this response.
However, inhibition of eicosanoids productions by incubating the tissue with
indomethacin or nordihydroguaiaretic acids reduced the cortisol release after ACTH
stimulation in 70LO, 100LO and 100SO. This study confirms the modulation of cortisol
release by dietary HUFA, and the mediation of cyclooxygenase and/or lipooxygenase in
heir mechanism of action. t
166

Chapter 9 Summary
Resumen
El fin de la presente tesis era investigar los efectos de alimentar diversos aceites
vegetales sobre el crecimiento y salud de la dorada (Sparus aurata).
El articulo 1 describe cómo alimentando la dorada con dietas que contienen
niveles altos de substitución del aceite de pescado, por los aceites vegetales ricos en
ácidos grasos de la serie n-3 o n-6, afecta al crecimiento y a la composición ácidos
grasos de los diversos tejidos del pez. 3 grupos de dorada fueron alimentados con ocho
dietas con una mezcla de LO y SO en diferentes niveles durante un período de 26
semanas. La substitución hasta el 70% o más del aceite de pescado con aceites vegetales
redujo el crecimiento y afectó negativamente a la utilización del alimento. Las
composiciones en ácidos grasos del músculo, el hígado y las branquias fueron afectadas
y correlacionadas con el aporte dietético. El EPA, ARA, DHA y n-3 HUFA totales
fueron reducidos en todos los tejidos mientras que los ácidos grasos C18 (LA y LNA)
fueron aumentados paralelamente al aumento de los VOs en la dieta lo que afectaba a la
calidad alimenticia de los peces para el consumidor. Los productos finales de la
elongaza y la ∆6 desaturaza de los C18 también fueron aumentados en todos los tejidos.
El articulo 2 fue centrado en estudiar el efecto del cociente de los niveles de la
substitución del aceite de pescados y de los ácidos grasos n-3/n-6 sobre el bienestar de
la dorada y su resistencia al estrés. La composición en ácidos grasos del riñón anterior
fue afectada por los diversos tratamientos dietéticos; los peces alimentados con los VOs
habían registrado un aumento en las cantidades de C18 y cantidades más bajas de n-3
HUFA. La respuesta fisiológica al confinamiento fue afectada por la dieta. Los peces
alimentados con las dietas LO registraron altos niveles basales de cortisol plasmático
comparando con los otros tratamientos. Después de 2h de confinamiento todos los
tratamientos demostraron una producción más alta del cortisol con los peces
alimentados con LO demostrando unos niveles dramáticos. El patrón del cortisol fue
influenciado por la dieta con los peces alimentados con LO demostrando una respuesta
más alta y más rápida y una recuperación de niveles normales después de 1 semana de
confinamiento, sin embargo, los peces alimentados con las dietas SO demostraron una
respuesta más baja y más lenta pero tarda más tiempo para recuperar los niveles
normales incluso después de 1 semana de confinamiento. Por lo tanto, hay un efecto de
alimentar la dorada con LO y/o SO sobre la respuesta al estrés.
167

Chapter 9 Summary
En el capítulo 3, estudiamos los efectos de diversos niveles de substitución del
aceite de pescados por mezclas de los aceites vegetales sobre la salud y el bienestar de
la dorada en términos de composición en ácidos grasos del plasma y la producción de
las prostaglandinas y de la leptina. El ARA, EPA y DHA fueron incorporados
preferencial en los lípidos polares del plasma, y el DHGLA fue acumulado con la
inclusión creciente de los VOs. la producción de la PGE2 derivada del ARA en plasma
no fue afectada por alimentar con los aceites vegetales, de común acuerdo con el
cociente similar del precursor de los eicosanoides (ARA/EPA) en fosfolípidos del
plasma. Por otra parte, la PGE3 fue la principal prostaglandina producida en el plasma
de los peces alimentados con dieta con aceite de pescado, lo que precisa la importancia
del EPA como precursor de la prostaglandina en peces marinos. Una correlación
negativa fue encontrada entre la concentración en plasma de la PGE2 y de la leptina. La
alteración en la cantidad y el tipo de las prostaglandinas producidas puede parcialmente
ser responsable de los cambios en los parámetros del sistema inmune y de la salud en
peces.
El capítulo 4 se centra en comprender los mecanismos implicados en la
regulación de la resistencia al estrés a través de los ácidos grasos poliinsaturados
estudiando la producción y la liberación del cortisol en las células interrenales de la
dorada estimuladas con la hormona adrenocorticotrópica y el efecto de los inhibidores
de la producción de los eicosanoides. El ARA y particularmente EPA promovieron la
producción del cortisol en el tejido interrenal de la dorada, mientras que el efecto del
DHA fue moderado. Por otra parte, la incubación con la indometacina redujo este
aumento en el tratamiento del ARA y de EPA, lo que sugería la implicación de los
productos derivados de la ciclooxígenasa en esta liberación, mientras que en el
tratamiento con DHA no fue marcado. En cambio, la incubación del tejido del riñón
anterior con DHGLA redujo la producción del cortisol.
El capítulo 5 describe el efecto de alimentar dorada con aceites vegetales durante
el período de crecimiento sobre el bienestar en términos de producción y liberación de
cortisol por el riñón anterior y de las vías fisiológicas implicadas. Las composiciones en
ácidos grasos del riñón anterior reflejaron el aporte dietético, así EPA, DHA, el ARA y
n-3 HUFA totales fueron reducidos en los peces alimentados con VOs comparando con
la dieta FO. Alimentando el 70% o el 100% LO, aumentó el cortisol en el riñón anterior
después del estímulo con ACTH, mientras que la alimentación con SO disminuyó esta
respuesta. Sin embargo, la inhibición de la producción de los eicosanoides incubando el
168
Chapter 9 Summary
169
tejido con indometacina o ácidos nordihydroguaiaretic redujo la producción de cortisol
después de la estimulación con ACTH en 70LO, 100LO y 100SO. Este estudio
confirma la modulación de la producción del cortisol por los HUFAs dietéticos, y la
ediación de la cicloxígenaza y/o del lipoxígenaza en su mecanismo de acción. m

Chapter 9 Summary
170

Chapter 9 Summary
و ة و ى ة ا وت ا ز ة ا ذ ر ا ا ة ة درا رو هدف هذ ا دا اك ا . ا
ة ا وت ا ز ة ا ر ات و ف ذات ا اك ة ا ذ ر ا ة ول درا ا ا
ة ب ة اض ده ى ا ة و ة هذا N‐3 و ‐Nا ى درا ة ر رآزت ا ك، و د ز ا
ذآورة ا ة ا ده اض ا زا رآ اك و و ا ى ر أ دام ا ا وي ها ف ا واع ا ا
دة ا و ول ا ان وز ك ذور ا ة ز اى و دال . أ ر % ا او اآ
ة ده اض ا ة ا رآ ا أن ادة ا آ ى ا ا ر أ و وا اض ا ة ا ا وت ا ز ا ك ز ا
ة ا اض و ا ا ة، آ د ف ا ا رت أ ا د وا ك EPA, D(A, ARA, n‐3 وا (UFA ى وي ة ا ده اض ا ة ا ا زادت ة ا ) C) LA, LNA ا رد
ة ا اك ة ذا ودة ا ى ا ر ا أ ة ا ا وت ا ز ة ا ادة اض ز ا ا ك، ه
ات ز ر ا ا ة ة ا ده ون(ا كر ذر ا ة أو ا ة ا را ة ة ) ا ده اض ا ى ا
)C (ة .ار ا
ك و ة ز ا دال ر ا أ ة ى درا وء ا ا ‐N‐3/Nا ا
ة ده اض ا ة ا ده اض ا رآ ا ك أن هاد، ذ او ك و ة ا ى ة ا وت ا ز ا
ف ة ا و ف ا رت ا ة ر ة ا ة . ك ة ازدادت آ ا وت ا ز ا ها ذ اك ا ا
ى ة و ة ا ده اض ا ة Cا ده اض ا ة ا رت . n‐3 (UFA وا آ ف أ ا أن ا آ
ا ان ك ذور ا ز ذ اك ا ا اص ، اك و ا ة و ا ا و ى ا
اص ان ا ا ا د رى، ف ا ة ا ار دم ا ا ز زول ا كور ة ا ر
ة ا رازات هرت ا ف أ ان ا ك ذور ا ز ة ذ ا ا دم ، ا ا ز زول كور ا
زول ى آور ز . ا ذ اك ا د أن ا ف ، ة ا و ر ا ا زول أ كور راز ا وك ا
وا ا زول كور اد ا زول كور ة ا ر ة و ر رازات هرت ا ان أ ك وع ذور ا د ا
راز ة ا ة و هرت ا أ و ول ا ز ذ اك ا ا ا اص، ا ا
اص وع ا ا د أ ى وى ا ى ا ودة ا ول ا ا أ ا و ا ا زول وأ كور . ا
ذور ز ك ز ا ز دال ا ر ا اك هاد اذا ه ة ا ى ا ا و ول ا ان او ز ك ا
د اك ا .ا
د اك ا ة ا ى را ة ا وت ا ز ة ا ك دال ز ا ر ا ا ا درس ا ا
د ا رو ات و اج هر ا وا ز ة ا ده اض ا ة ا رآ اس ة ك أ . PGوا ن ذ
ة ده اض ا ا D(Aو EPA وARAا ا أ ز ة دهون ا ك أ ا وا د راآ D(GLA ا
ف ة ا ا وت ا ز ة ا ادة اج . ز و أن ا ا ة PGEآ ر ARAا أ ا ز ا
ة ات ة وا ة ا وت ا ز ا دال دهون ا ARA/EPAا زول ا كور اج ا هد ر ا
ا ز ة ا ور ك . ا ى ذ اك PGE3وة ا ا ز ة د ا ا رو واع ا ى أ آا أ
171

Chapter 9 Summary
ة ا أه ك ف ز ا ا ة ذ ة EPAا ر اك ا د ا ا رو اج ا در ا . آ آ
ز رآ PGE ا ز ون ا ا ة هر ك ة . ة و ة و ر آ ا ا ك أن PGأ ة ا
كة ة ا ة و ا هاز ا ات ا رات ة ا ز ة ؤول .كون ا
ر ددة ة ا ده اض ا ا هاد ة ا او د ة د ات ا ه ا ى را رآز ا ا
ون ا هر ز ر ا ة ر ى ا ك ا ا زول كور راز ا اج وا ة ا ة درا وا ة
اج ات ا رو و كو وآو دeicosanoidsادر اك ا ة . ا ده اض ا ك أن ا ARAو ذ
ة ا دEPAو ة ا ر ى ا ك ا ا زول كور راز ا ى ا ان ر ا ا D(Aد . آان
ة ر ى ا ك ا ا ة ا ك ى ذ ة ا ا ت indomethacinا ا اع ر ات ARA&EPA هذا ا د ى ر ا ا COX ة ا ا اج رD(A هذا ا ا . هذا ا
ة ر ى ا ك ا ا ة ا ك ا زول D(GLAو كور اج ا . ا
ة ا وت ا ز ا د اك ا ة أ ذ ر ا ا درس و(ا ا رة ا ك ) ل ى وذ
ك ة ذ د ة ا و و ز رق ا ة وا ر ى ا ك ا ا رف زول كور اج ا ا أن . اس ا هرت ا أ
ى ا ك ا ا ة ده اض ا ا رآ ا ا ف و ها ا رآ ك ة D(A ،ARA ، EPAر
وع كn‐3 (UFAو ز ا ذاة ة ا ار ة ا وت ا ز ا ذاة اك ا وا ا ا أن . ا آ
دال زها ب% او % ا د ة ر ى ا ك ا ا زول كور اج ا د ا ز ان ك ذورا رد)ACT ز ا هذا ا و ول ا ز ة ذ ا ا اج . ، ك ، ا ى ذ ة eicosanoidsوة ا
ة ر ى ا ك ز بNDGAا ا د ا زول كور اج ا ت )ACT ا ا ,LO ا LO, SO
اض ا ا زول كور اج ا د ا ؤآد ة درا ةإذن هذ ا ر ددة ا ة ا UFA)ده
ة ا ف وو ة كو هCOXأو LOX ا ات . آ
172

Chapter 10
Resumen ampliado

Chapter 10 Resumen ampliado
173
CAPITULO 10
Resumen ampliado
10.1. Introducción general (1)
Los lípidos como componente de las dietas de los peces
Los lípidos y ácidos grasos
Los lípidos son un grupo grande y diverso de compuestos orgánicos naturales
que tienen en común una rápida solubilidad en tales solventes orgánicos (hidrocarburos,
cloroformo, benceno, éteres y alcoholes) e insolubilidad general en agua. Hay una gran
variedad estructural entre los lípidos, teniendo como forma básica cadenas de un
hidrocarburo con un grupo carboxílico en un extremo y un grupo metílico terminal en el
otro (carbón de n o de w). La cadena acil podía ser saturada o no saturada y puede ser
esterificada a otras moléculas; entonces, los lípidos incluyen una gama diversa de
compuestos, como los ácidos grasos y sus derivados, carotenoides, terpenos, esteroides
y ácidos de bilis.
Los lípidos constituyen un grupo heterogéneo de compuestos, y diversas
clasificaciones se utilizan para distinguirlos. Para los propósitos de la cromatografía, los
lípidos se dividen en dos clases amplias incluyendo los lípidos complejos y los lípidos
simples. Estos último consisten casi en todas las grasas y aceites comercialmente
importantes de origen animal y vegetal (planta) incluyendo, los triacilgliceroles, los
diacylglycerols, los 2 monoacyl-sn-gliceroles, los esteroles, las ceras, los tocoferoles y
los ácidos grasos libres. Los lípidos complejos incluyen los glicerofosfolípidos,
glucoglicerolípids, esfingomielina, glucosphingolípidos y eicosanoides. Si no, según su
grado de polaridad, los lípidos se separan a los lípidos polares o neutros. Lípidos polares
incluyendo los glicerofosfolípidos (actualmente nombrados fosfolípidos),
glucoglycerolípidos, esfingomielina y glucosphingolípidos, mientras que los lípidos
neutrales contienen los ácidos grasos y sus glicerolípidos, esteroles, ceras y tocoferoles
derivados, entre otros.
Los ácidos grasos son el bloque hueco básico de los lípidos, algunos son
componentes esenciales de la dieta, puesto que no pueden ser sintetizados por los

Chapter 10 Resumen ampliado
174
animales y tienen funciones fisiológicas y estructurales específicas. Los ácidos grasos
poliinsaturados (PUFA) son ácidos grasos que contienen más de 18 átomos de carbono
con dos o más dobles enlaces. Los PUFA lo más frecuentemente encontrados en la
naturaleza son: el ácido docosahexaenoico (DHA; 22:6 n-3), el ácido
docosapentaenoico (DPA; 22:5 n-3 o n-6), el ácido eicosapentaenoic (EPA; 20:5 n-3), el
ácido araquidónico (ARA; 20:4 n-6), el ácido -linolenic (GLA; 18:3 n-6), el ácido α-
linoleico (LNA; 18:3 n-3) y el ácido linoleico (LA; 18:2 n-6). Estos últimos son
alimentos dietéticos importantes para los mamíferos incluyendo los seres humanos
(Simopoulos, 2000). Los ácidos grasos altamente insaturados (HUFA), por ejemplo
DHA, DPA, EPA y ARA son esos PUFA de 20 y más átomos de carbono en su cadena
alifática con 3 o más insaturaciones, y los peces son la fuente dietética principal de los
n-3 HUFA (Ackman el al., 1980; Sargent and Tacon, 1999). El ARA respresenta
generalmente solamente 1-2% de los ácidos grasos totales en fosfoglicéridos de peces,
con la excepción notable de los fosfatidilinositoles donde el ARA puede ser el principal
PUFA (Sargent et al., 1993; Izquierdo, 1996), así, los peces tienen altos requerimientos
alimenticios para estos tres ácidos grasos (Sargent et al., 1997).
Los peces consumen naturalmente dietas ricas en (n-3) PUFA, sin embargo, la
composición de ácidos grasos de los tejidos de peces cultivados es determinada
generalmente por el tipo del lípido dietético ingerido y de la capacidad individual de la
especie de peces de modificar esta entrada dietética por ambas vías del catabolismo y de
la conversión incluyendo la desaturación y el la elongación (Henderson and Tocher,
1987; Sargent et al., 1989; Torstensen et al., 2000; Bell et al., 2001, 2002).
Generalmente, los peces marinos son incapaces de estas conversiones (Ghioni and
Tocher, 1999; Tocher et al., 1999) y requieren EPA ARA y DHA en sus dietas.
Funciones de los lípidos en peces
En común con otros vertebrados estudiados hasta ahora incluyendo los seres
humanos, los peces tienen unos requerimientos dietéticos obligatorios para (n-6) y (n-3)
PUFA. Para proveer los peces con dietas equilibradas y adecuadas, es necesario saber
las funciones fisiológicas y metabólicas de los diversos nutrientes dietéticos. Además,
los lípidos tienen funciones estructurales y fisiológicas múltiples en peces, puesto que
los ácidos grasos son los componentes principales de la membrana celular. Además,

Chapter 10 Resumen ampliado
175
algunos ácidos grasos son también precursores importantes para una gama de
mediadores altamente activos biológicamente en el metabolismo y la fisiología de los
peces. Así, los ácidos grasos pueden actuar como segundos mensajeros requeridos para
la traducción de señales externas, puesto que se producen rápidamente como
consecuencia del atascamiento de agonistas específicos a los receptores de la membrana
plasmática. Dentro de las células, los ácidos grasos pueden actuar para amplificar o para
modificar de otra manera las señales de influir las actividades de las enzimas tales como
de proteína quinazas, fosfolipasa, y muchos más. Están implicados en la regulación de
la expresión génica, apuntando principalmente los genes que codifican las proteínas con
papeles en el transporte o el metabolismo de los ácidos grasos vía efectos sobre factores
de la transcripción, es decir los receptores proliferadotes de la activación del
peroxisomo (PPARs) en los núcleos de las células, tales efectos pueden ser altamente
específicos a los ácidos grasos particulares. De hecho, los fosfolípidos desempeñan
unos papeles múltiples en las células con excepción de establecer barreras de la
permeabilidad, proporcionan una matriz para el montaje y la función de una gran
variedad de enzimas, participan en la síntesis de macromoléculas, y actúan como
señales moleculares para influir en los acontecimientos metabólicos.
La inestabilidad de las bio-membranas, incluyendo la fragilidad mecánica y
osmótica es afectada por su contenido en ácidos grasos. Por lo tanto, el ambiente puede
cambiar la fluidez de la membrana, que actúa como receptor sensible que inicia la
regulación celular (Beney and Gervais, 2001). Es importante que la fluidez de la
membrana también es afectada por el contenido en los HUFA presentes en los
fosfolípidos constitutivos, que debido a su estructura tridimensional y a las
interacciones más bajas del hidrógeno-hidrógeno, aumentan la inserción de la proteína.
Por ejemplo, la composición en ácidos grasos de los fosfolípidos de las membranas
determina el nivel de su fluidez (Bell et al., 1986), y considerando que el pez es un
organismo poiquilotermo, su contenido en ácidos grasos de sus membranas es crucial
para adaptarse a los cambios ambientales de temperatura. Además, los cambios en la
composición en ácidos grasos de las membranas celulares podrían afectar directamente
a las actividades de membrana limitando las enzimas y los receptores, y perturbando
proceso fisiológico por lo tanto diverso (crecimiento, reproducción, sistema inmune,…
etc).

Chapter 10 Resumen ampliado
176
Los requerimientos en los ácidos grasos esenciales (EFA) de las especies de
peces de agua dulce y marinos han sido estudiado extensivamente durante los últimos
20 años y varían cuantitativamente y cualitativamente (Sargent et al., 1989, 1995,
2002). En los peces de agua dulce, los requerimientos en los EFA pueden ser cumplidos
suministrando el LA y/o el LNA, aunque mejores resultados puedan ser alcanzados
suministrando las formas “bioactivas” de los n-3 HUFA, principalmente de EPA y de
DHA (Kanazawa, 1985). Los lípidos dietéticos proporcionan los PUFAs esenciales
necesarios para el crecimiento y el desarrollo de las células y de los tejidos (Sargent et
al., 1995) y son también una fuente de energía importante (Sargent et al., 1989)
produciendo 9 Kcalorias/gr, promoviendo su uso para ahorrar parcialmente el uso de la
proteína en los alimentos para la acuicultura bajando el coste de las dietas (Vergara et
al., 1996; Morrow et al., 2004). Además, los fosfoglicéridos de los peces son
naturalmente ricos en DHA y EPA y puede ser asumido que estos ácidos grasos
cumplen el mismo papel estructural en los fosfoglicéridos de la bio-membrane que el
ARA hace en altos mamíferos terrestres (Sargent, 1995).
En peces, algunos informes demuestran efectos positivos de n-3 FA sobre la
respuesta inmune, puesto que la alta actividad de los macrófagos principales del riñón
anterior ha sido asociada a altos niveles de los ácidos grasos dietéticos n-3 en el siluro
(Blazer, 1991; Sheldon and Blazer, 1991). Ashton y colaboradores (1994) han
encontrado que el sobrenadante principal del riñón anterior derivado de la trucha de
arco iris alimentada con una dieta enriquecida con los ácidos grasos n-3 tenía mayor
migración que la capacidad estimulante que el sobrenadante de peces alimentados con
una dieta enriquecida con ácidos grasos de la serie n-6. De tal modo, una cantidad
adecuada de los ácidos grasos n-3 fue encontrada ser esencial para la correcta función
del sistema inmune.
Mientras que PUFAs de larga cadena poseen una amplia gama de funciones
celulares, una de las más importantes es suministrar los precursores para la producción
de eicosanoides, que son los metabolitos bioactivos de ácidos grasos que pueden
modular muchas funciones inmunes (Gershwin et al., 1985; Uhing et al., 1990). Los
eicosanoides se producen a partir de los C20 PUFAs, especialmente ácido di-homo
gamma linolenico (20: 3n-6; DHGLA), ARA y EPA, por la acción de las enzimas
ciclooxígenasa (COX) y de la lipooxígenasa (LOX) para producir una amplia gama de
compuestos bio-activos, incluyendo las prostaglandinas (PG) y los tromboxanos (TX)

Chapter 10 Resumen ampliado
177
producidos por la acción de COX. La LOX rinde una gama de los ácidos grasos
monohidróxidos (e.g. 5 (S) - ácido hidroxi-eicosatetraenoico; 5-HETE derivado de
ARA), mientras que los di- y los ácidos grasos tri-hidroxis, tales como leucotrienos
(LT), los lipoxinos (LX), también se forman vía los intermediarios epoxy (Samuelson,
1983).
El ARA es el principal precursor de eicosanoides en las células de mamíferos,
dando lugar, entre otros productos, a las prostaglandinas de la serie 2 (Horrobin, 1983).
Otros C20 PUFAs, tales como DHGLA y EPA son también substratos para la
producción de eicosanoides y producen las prostaglandinas de la series 1- y 3-,
respectivamente. Aunque el DHGLA y el EPA son generalmente substratos más pobres
para la síntesis de la prostaglandina que el ARA (Crawford, 1983), ambos compiten
para el punto de enlace de la enzima y pueden reducir la producción de prostaglandinas
derivadas del ARA (Willis, 1981; Bell et al., 1994).
Los eicosanoides tienen diversas acciones patofisiológicas incluyendo la
respuesta inmune y los procesos inflamatorios. Así, estan implicados en la regulación
del sistema inmune por sus efectos directos sobre las células tales como macrófagos y
los linfocitos o sus efectos indirectos vía las cítokinas (Rowley, 1995). La PG,
especialmente la PGE2 es importante en la modulación de la función de las células
inmunes y mientras que PGE2 se requiere para la normal función inmune, su
superproducción puede ser inmunosupresiva (Kinsella et al., 1990). Además, el
producto LTB4 de la lipooxígenasa es un modulador de gran alcance de la función de la
células inmunes, aumentando la proliferación de las células de tipo T y B, estimulando
la liberación de las cítokinas de los monocitos y de las células T, actuando como un
potente quimo-attractante e induciendo la actividad natural de la célula natural killer
(NK) (Kinsella et al., 1990; Claesson et al., 1992). Los derivados de la LOX también
han demostrado regular y mediar las interacciones entre la inmunidad natural y
adaptativa para la defensa del anfitrión (Hedi and Norberto, 2004). Los estudios
recientes indican que algunos patógenos inhabilitan la inmunidad de los invertebrados a
través de la inhibición de las acciones de los eicosanoides en la inmunidad celular,
indicando el papel clave de los eicosanoides en la defensa inmune (Dean et al., 2002;
Stanley and Miller, 2006). Los niveles dietéticos de n-3 HUFA influyen sobre los
patrones de la producción de los eicosanoides en tejidos de peces, posiblemente como

Chapter 10 Resumen ampliado
178
consecuencia de cambios en el cociente de EPA/ARA en los tejidos (Bell et al., 1993,
1997).
Fuentes de los lípidos en dietas para peces
La acuicultura ha usado tradicionalmente productos provenientes de la industria
pesquera, como harina y aceite de pescado (FM y FO), para convertir la proteína y el
aceite relativamente baratos en productos de elevado valor, una práctica que esta
científicamente y comercialmente correcta (Bell et al., 2002). Sin embargo, el
desarrollo rápido de la acuicultura, que está creciendo por el 10% por año (Tidwell and
Allan, 2002), junto con las inclusiones del FO para las alimentaciones de los animales
domésticos y las aplicaciones farmacológicas, afectó marcadamente el coste y la
disponibilidad del FO. Por lo tanto, la demanda para estos productos está aumentando
rápidamente y las nuevas estimaciones sugieren que los alimentos para acuicultura
consumirán aproximadamente el 90% y el 60-70% de la producción de FO y FM
respectivamente en 2010 (Figura 1.1) (Allodi, 2007) y esta previsto que para 2012 las
necesidades de acuicultura en FO excederán la producción total. Como consecuencia, la
disponibilidad del FM y del FO para los alimentos de peces es limitada (Anon, 2002)
durante períodos estabilizados de pesca extractivas, y arriesgadas puesto que las
producción pesquera disminuye como consecuencia de fenómenos naturales tales como
“El Niño” (Anon, 2002; Naylor, 2004). Por otra parte, el uso continuo del FM y FO
puede convertir la acuicultura en una presión agregada sobre los caladeros que en un
contribuidor neto a suministrar pescado para el mundo, con las consecuencias
desastrosas para el ecosistema (Staniford, 2002; Milewski, 2002; New, 2002; Allan,
2004). Por otra parte, uno de los continuos largos debates en acuicultura es el uso de
FM y FO en los alimentos y la cantidad de pescados salvaje necesarios para producir
peces de cultivo, llamados los cocientes de Fish In-Fish Out (FIFO) que se extienden de
3:1 al 10:1 (organización internacional del aceite y de la harina de pescado: IFFO,
2008); y la revisión más reciente por Tacon y Metian (2008) encontró un IFFO para los
salmones de 4.9:1, significando que hay que usar 4.9 toneladas de pescados salvaje para
producir 1 tonelada de salmón de cultivo. Además, los precios del FO se han duplicado
durante los últimos 5 años (Figura 1.1), y continúan incrementándose haciendo más
rentable el uso de estos ingredientes para el consumo humano. Por lo tanto, las
restricciones en el coste y la disponibilidad impuestas sobre el FM y FO durante los

Chapter 10 Resumen ampliado
179
últimos 15 años han incitado a la substitución gradual y sostenible de estos ingredientes
por fuentes alternativas de lípidos y proteínas.
Figura 1.1: La evolución y la previsión de los usos y las necesidades en el aceite de pescado desde 1995 hasta 2015. Basado en datos de Allodi 2007.
Este gráfico demuestra claramente el aumento significativo del uso del FO para
la acuicultura durante los 15 años pasados y su proyección de aumentar en los próximos
5 años. La sensible disminución en la producción del FO en 1998 era debido al
fenómeno del “El Niño”. Así, las aplicaciones del FO para los alimentos crecientes de
menos del 30% hasta más del 80% de producción total del FO actualmente y esta
previsto que todas las necesidades en el FO para alimentos de peces van a superar la
producción total del FO en 2011. Como consecuencia de esta presión sobre los
limitados recursos naturales, los precios del FO se han duplicado durante la última
década, pasando de los 400 $/ tonelada en 2000 a más los 750 $/tonelada hoy, y de ella
se espera que continuarán aumentando hasta 900 E.E.U.U. $/tonelada en 2015 (IFFO,
2009). Como consecuencia, se requieren ingredientes alternativos al FO de manera
urgente, con los aceites vegetales siendo los primeros candidatos (Bell and Waagbø,
2008).
Los peces marinos son adaptados sobre todo a una dieta carnívora/piscívora que
sea naturalmente rica en n-3 HUFAs, desarrollando una deficiencia relativa en las
enzimas (los desaturasas y los elongasas) responsables de la vía de conversión del LA y

Chapter 10 Resumen ampliado
180
del LNA a sus productos finales de HUFAs (Ghioni et al., 1999; Tocher and Ghioni,
1999; Zheng et al., 2009). Igual como en los vertebrados, los PUFAs son esenciales en
dietas para peces, pero hay unos requerimientos especiales en HUFAs tales como el
EPA y el DHA, algo mas que PUFAs de cadena corta encontrados en los aceites
vegetales (VO) (Tocher, 2003).
Actualmente, más de 100 millones de toneladas de aceites vegetales se producen
por año incluyendo la palma, la soja, el lino, aceites de oliva y de girasol, con la palma
y la soja demostrando ser las producciones más grandes (Figura 1.2) (O'Mara, 1998).
Los aceites vegetales (VO) y las proteínas vegetales (VM) expresan con frecuencia
producciones y precios más fiables que los FO y FM, lo que representa una ventaja en
la producción de alimentos para peces.
Figura 1.2: Evolución de la producción de los diferentes aceite vegetales.
Así, se podrían utilizar menos FM y FO sostenibles para las materias o como
ingredientes estratégicos, su inclusión en dietas para peces dependiendo de la especie y
los requerimientos de la etapa de la vida de peces así como de los precios relativos de
los ingredientes. Por lo tanto los VOs se consideran actualmente como la única viable
fuente alternativa competitiva de lípidos con costes competitivos en dietas para
acuicultura y un número de trabajos ha utilizado como sustituto parcial y completo para
FO (Caballero et al., 2002, Izquierdo et al., 2003, 2005; Montero et al., 2003, 2005;
Bell et al., 2005a).

Chapter 10 Resumen ampliado
181
Las alternativas sostenibles de las fuentes de la proteína a FM incluyen varias
harinas vegetales con los contenidos proteínicos crudos de 20 a el 50% (Hertrampf and
Piedad-Pascual, 2000), con la harina de soja representando actualmente la opción
predominante. Sin embargo, los peces más carnívoros tienen una capacidad limitada de
tolerar alto contenido de la harina de soja (SBM) en sus dietas (Kaushik et al., 1990;
Torstensen et al., 2008) debido a la pobre digestibilidad de la misma, una disponibilidad
más baja de algunos aminoácidos esenciales y la baja palatabilidad de SBM con
respecto a FM así como la presencia de factores antinutritivos. Con respeto a la
substitución del FO, varios estudios han precisado la inclusión acertada de diversas
mezclas de VOs en las dietas para diversas especies sin afectar el crecimiento o la
utilización del alimento, con niveles de inclusión dependiendo de la especie (Bell et al.,
2001; Caballero et al., 2002, Montero et al., 2003; Izquierdo et al., 2003, 2005;
Torstensen et al., 2005; Mourente and Bell, 2006). Por ejemplo, se ha demostrado que
es posible substituir hasta el 60% de las FO con aceites vegetales (VO) en las dietas
para la dorada sin afectar al crecimiento, la supervivencia, la utilización del alimento o
las características organolépticas del filete, cuando los peces se alimentan durante un
periodo medio (3 meses, Izquierdo et al., 2000, 2003) o largo (8 meses) (Menoyo et al.,
2004; Izquierdo et al., 2005). Sin embargo, el efecto de estos o niveles más altos de la
substitución sobre la salud de los peces y resistencia al estrés no se ha determinado
claramente.
Aceites vegetales y salud de los peces
La inclusión de las fuentes vegetales de lípidos y de las proteínas en dietas para
peces de cultivo se considera como una solución sostenible a la industria de la
acuicultura para hacer frente a la problemática del FO y FM. Para satisfacer este
propósito, la investigación de la industria debe no sólo determinar el efecto de substituir
los dichos ingredientes sobre los parámetros estándares de cultivo como el crecimiento,
las tasas de supervivencia o el cociente de conversión del alimento (FCR), pero también
sobre las características nutricionales, sensoriales, de proceso, y de seguridad de los
productos de la acuicultura (Barlow and Pike, 2001). Además, es imprescindible que el
impacto de potenciales sustitutos de FM y FO en otros factores tales como la salud y el
bienestar serán determinados exactamente (Barlow and Pike, 2001).

Chapter 10 Resumen ampliado
182
La nutrición es uno de los factores principales que determinan el estado de salud
y de bienestar en peces de cultivo. El suministro dietético de aminoácidos, de PUFAs,
de cofactores de la enzima y de energía, es esencial para mantener el sistema inmune de
los peces incluyendo la proliferación de linfocitos y la síntesis de los determinantes (e.g.
inmunoglobulinas, lisozima y complemento) y de las moléculas de la comunicación
(e.g. los cítokinas y los eicosanoides). Por otra parte, las dietas adecuadas mejoran la
salud de peces convalecientes, mientras que alimentando peces con dietas
desequilibradas causan la desnutrición y aumentan la susceptibilidad al estrés y a las
enfermedades. Por lo tanto, los brotes de enfermedades en los peces ocurren
comúnmente cuando los peces están estresados debido a una variedad de factores
incluyendo la malnutrición (Lall, 2000). Así, la substitución inadecuada de FM y del FO
por otras fuentes de origen vegetal puede llevar a los desequilibrios alimenticios que
podrían afectar a la salud y al bienestar de los peces.
Algunos estudios han precisado alteraciones negativas en ciertos parámetros de
la salud de los peces y la resistencia al estrés en la alimentación de los peces con VO
(Bell et al., 1993, 1996; Montero et al., 2003; Jutfelt et al., 2007). Por ejemplo, los
salmones alimentados con VOs tienen reducciones significativas en varios parámetros
inmunes no específicos incluyendo el hematocrito, los glóbulos blancos totales y RBC,
y la actividad respiratoria del macrófago (Good et al., 2001). Por lo tanto, el efecto de la
inclusión de los VOs parece depender del tipo del VO, del nivel de la substitución del
FO, de la especie de peces o de las condiciones de cultivo. En dorada, el aumento en los
niveles de substitución de FO del 60 hasta el 80% por los aceites vegetales reduce
significativamente el crecimiento y los índices de conversión del alimento (Izquierdo et
al., 2007) alterando la morfología normal del hepatocito y del enterosito (Caballero et
al., 2003), y afectando negativamente las funciones inmunes y la respuesta post estrés
del cortisol plasmático (Montero et al., 2003). Además, la inclusión de la soja o del
aceite de colza con el 60% de substitución reduce la actividad fagocitaría del macrófago
(Montero et al., 2003) mientras que la reducción del EPA y del DHA en la dieta se ha
demostrado inhibir significativamente la actividad alternativa de la vía del complemento
del suero (Montero et al., 1998). Sin embargo, poco se sabe sobre los mecanismos
implicados en el efecto de PUFA sobre la resistencia al estrés y a las enfermedades en
peces de cultivo, que parece ser mediado, por lo menos en parte, por la producción de
eicosanoides en tejidos. De hecho, los cambios en la composición de los ácidos grasos

Chapter 10 Resumen ampliado
183
(AG) de los fosfolípidos afectan a la cantidad y al espectro de la síntesis de los
eicosanoides (Bell et al., 1992, 1993, 1994, 1995a, b, 1996; Ashton et al., 1994; Lall,
1998; Balfry and Higgs, 2001) y como en vertebrados superiores, la producción alterada
de los eicosanoides puede afectar a la composición y el funcionamiento de las células
inmunes (Kinsella and Lokesh, 1990; Kelley and Daudu, 1993). Por otra parte, a pesar
de estos estudios sobre el efecto de los VOs dietéticos sobre la producción de las
prostaglandinas en diversos tejidos se han conducido en peces de agua dulce y en ciertas
especies marinas nórdicas (Bell et al., 1992, 1994, 1996a), ningunos estudios han sido
conducidas hasta ahora en la producción de eicosanoides en dorada, o su alteración por
los lípidos dietéticos.
Puesto que los diferentes aceites vegetales empleados como fuentes de lípidos
para substituir al FO se diferencian marcadamente por su perfil en ácidos grasos,
incluyendo el contenido relativo en los ácidos grasos n-3 y n-6, su introducción en
dietas de peces modifican claramente la composición en ácidos grasos de los diferentes
tejidos (Torstensen et al., 2000; Bell et al., 2001, 2002, Caballero et al., 2002; Montero
et al., 2003; Izquierdo et al., 2003, 2005, 2007), esto a su vez puede llevar a las
diferencias en la producción de los eicosanoides y en la respuesta inmune (Balfry and
Higgs 2001; Thompson et al., 1996; Balfry et al., 2006). Así, Bell y colaboradores
(1992, 1993, 1996) divulgaron que el salmón del Atlántico alimentado con dietas que
contienen niveles crecientes de girasol (rico en n-6, por lo tanto con n-3/n-6
disminuido), producen más eicosanoides derivados del ARA comparados con los peces
alimentados con dietas que contenían el aceite de la lino o de pescado (con un cociente
más alto de n-3/n-6) que produjo más eicosanoides derivados de EPA. Además, la
actividad creciente de los macrófagos principales del riñón se ha asociado con niveles
más altos de los ácidos grasos dietéticos n-3/n-6 en el pez gato (Sheldon and Blazer,
1991). Por otra parte, se ha publicado que los eicosanoides derivados de n-3 HUFAs
tienen una influencia más represiva en el sistema inmune, y son más frecuentes en las
dietas que contienen altas concentraciones del ácido linolenic y de los n-3 HUFA
(Higgs et al., 1995). De hecho, algunos investigadores han advertido que los cocientes
relativos de ácidos grasos y de precursores de los eicosanoides son la clave para
entender el efecto de los lípidos dietéticos sobre el sistema inmune (Ashton et al.,
1994).

Chapter 10 Resumen ampliado
184
Además, alimentando peces con niveles bajos de n-3/n-6 fue asociado con alta
actividad respiratoria realizada de los leucocitos periféricos de la sangre (PBLs) (Balfry
et al., 2006), y a la actividad bactericida creciente de macrófagos del pez gato (Ictalurus
punctatus). Además, una actividad significativamente más alta de la Natural-killer-like-
cell también ha sido observada en los leucocitos aislados de la trucha arco iris
(Onchorhynchus mykiss) (Kiron et al., 1995), y de los salmones del Atlántico (Balfry et
al., 2006) que fueron alimentados previamente con una dieta enriquecida con n-3. Otros
informes anteriores han sugerido que la alta producción del anticuerpo está asociada a
alto n-3 HUFA dietético (Erdal et al., 1991; Waagbo et al., 1993). De hecho, los altos
cocientes dietéticos n-3/n-6 dieron lugar a respuestas crecientes del linfocito B y
mejoraron la supervivencia de los peces después de un desafío a la enfermedad
(Thompson et al., 1996), y a números más elevados de trombocitos en el pez gato, y
consecuentemente tenían bajo nivel de eicosanoides derivados de los ácidos graos de la
serie (n-6) (es decir, tromboxano) implicados en la coagulación de sangre, y compensan
esto con números elevados de trombocitos (Klinger et al., 1996). Hay evidencias que
sugieren que cambiando la composición en ácido grasos de las células inmunes pueda
influir en la función inmune cambiando la fisiología de la membrana celular pero quizás
más importantemente influenciando la producción de porstaglandinas y de los
leucotrienos. Esto es apoyada por un número de estudios que demuestran una reducción
en la producción de PGE2 y del leucotrieno B4 (LTB4) por los macrófagos estimulados
del riñón anterior de salmones alimentados con una dieta con un cociente dietético n-
3/n-6 más alto (Bell et al., 1993, 1996). Montero y colaboradores (2003) encontraron
que alimentando la dorada con un n-3/n-6 más alto incluyendo LO en la dieta (rica en
LNA, cociente cada vez mayor n-3/n-6), disminuyó los números de eritrocitos en la
circulación. También se ha demostrado que los lípidos dietéticos determinan el perfil de
los ácidos grasos de macrófagos y de las células inmunes en el bacalao (Waagbø et al.,
1995), la lubina (Farndale et al., 1999) y dorada (Montero et al., 2003).
Sin embargo, los impactos que los ácidos grasos dietéticos tienen en la respuesta
inmune son complejos y dependen de varios factores que influencien la producción de
eicosanoides incluyendo la competición entre los ácidos grasos de tipo n-3 y n-6
durante el metabolismo para la elongación y la desaturación de cadena. Por lo tanto, hay
una sugerencia clara que los cocientes de n-6 a los ácidos grasos n-3 en los lípidos
dietéticos pueden desempeñar un papel importante en el equilibrio de la composición en

Chapter 10 Resumen ampliado
185
PUFAs de la membrana celular de peces (Bell et al., 1993, 1996, 2001; Caballero et al.,
2002; Izquierdo et al., 2005), modulando posteriormente sus parámetros inmunes
(Balfry et al., 2006).
Los efectos beneficiosos de los lípidos de peces (ricos en n-3 PUFA) en el
control de la enfermedad cardiovascular y del desarrollo neurológico están bien
documentados en la literatura de la nutrición humana (Herbaut, 2006; Simopoulos,
2008). Por lo tanto, los altos cocientes dietéticos de n-6 PUFA y de n-6/n-3 PUFA se
han sugerido para desempeñar un papel en muchas enfermedades crónicas occidentales
(Simopoulos, 2008; Yam et al., 1996). Así, al substituir el aceite de pescado con una
mezcla de aceites vegetales, hay que tener cuidado para establecer una correcta mezclas
no sólo para asegurar el buen crecimiento de los peces, pero también proveer al animal
los cocientes adecuados de los ácidos grasos n-3/n-6 para la correcta función de sus
procesos fisiológicos y considerar las ventajas alimenticias del producto final para el
consumidor (Bell et al., 2001).
Nutrición lipídica y resistencia de los peces al estrés
Los estudios anteriores han demostrado la importancia de alimentar los peces
con niveles adecuados de diferentes nutrientes para garantizar la capacidad de los
mismos de adaptarse al estrés crónico o agudo del medio (Salte et al., 1988). Entre
varios nutrientes, los n-3 HUFA dietéticos aumentan la resistencia al estrés crónico y
agudo en juveniles de dorada (Sparus aurata) (Montero and Izquierdo, 1998; Montero
et al., 2001). En la anguila Europea (Anguila anguila) y el esturión Adriático (Acipenser
naccarii) n-3 dietético HUFA aumentan la tolerancia a las condiciones de hipoxia
(Mckenzie, 2001). Por otra parte, en adultos de dorada, alimentando los peces con
dietas deficientes en n-3 HUFA aumenta el cortisol plasmático basal antes del estrés por
el confinamiento, demostrando el efecto de la deficiencia alimenticia sobre el estrés
(Montero and Izquierdo, 1998). Se ha demostrado también que el DHA y el EPA son
esenciales para mejorar la resistencia al estrés causado por el manejo en las larvas de
varias especies de peces tales como la dorada roja (Pagrus major) (Izqueirdo et al.,
1988; Watanabe et al., 1989), platija japonesa (Paralichthys oliváceo) (Izquierdo et al.,
1992; Furuita et al., 1999), también como al estrés debido al cambio de temperatura en
lubina (Dicentrarchus labrax) (Persona-Le Ruyet et al., 2004). Generalmente, la
manipulación de la composición dietética en ácidos grasos afecta a la capacidad de las

Chapter 10 Resumen ampliado
186
larvas de peces de resistir a varios factores estresantes, por lo tanto influenciando la
supervivencia después del estrés (Izquierdo et al., 1989; Watanabe et al., 1989; Tuncer
et al., 1993; Kanazawa, 1997; Gapasin et al., 1998; Koven et al., 2001, 2003; Liu et al.,
2002). De hecho, alimentando con n-3 HUFA también se ha visto mejorar la resistencia
de los crustáceos a diferentes condiciones estresantes, tales como el choque osmótico
(Palacios et al., 2004; Sui et al., 2007), fluctuación de la temperatura (Chim et al.,
2001) y amoníaco (Martins et al., 2006).
La elevación del ARA en la dieta, también se ha demostrado mejorar la
supervivencia total (Bessonart et al., 1999) y la resistencia al estrés por el manejo en
larvas de dorada (Koven et al., 2001). Una concentración óptima del ARA en la dieta
también fue encontrada eficiente para mejorar la resistencia al estrés causado por un
desafío de híper-salinidad en las larvas de la platija de verano (Willey et al., 2003) y la
lubina estriada (Harel et al., 2001).
Varios estudios han sugerido que el ARA está implicado en la liberación del
cortisol en peces, aunque los mecanismos reales no se hayan investigado (Gupta et al.,
1985; Harel et al., 2001; Koven et al., 2003). Koven y colaboradores (2003)
encontraron que la ingestión dietética del ARA conjuntamente con cambios diarios de la
salinidad fue asociada con niveles elevados de cortisol en el cuerpo entero de las larvas
de dorada al final del período experimental. Los autores sugirieron que el ARA mejora
la sensibilidad del eje HPI, y conjuntamente con el estrés diario éste dio lugar a niveles
más altos de cortisol. Así, el ARA se ha encontrado ser importante para mejorar la
resistencia al estrés en larvas de la dorada (Koven et al., 2001a,b), y la alta ingestión
dietética del ARA para la misma especie bajó la sensibilidad de los peces al estrés
agudo, según lo evidenciado por los niveles del cortisol y la baja osmolalidad del
plasma (Van Anholt et al., 2004).
Sin embargo, los mecanismos fisiológicos por los cuales estos ácidos grasos regulan la
resistencia al estrés en los peces o los niveles de cortisol en plasma no están claros. En
mamíferos, ciertos estudios sugieren que las prostaglandinas desempeñen un papel
importante en la mediación de la acción corticosteroidogenasa de la Hormona
adrenocorticotrófica (ACTH) (Kocsis et al., 1999), sugiriendo que el papel de los ácidos
grasos en la respuesta al estrés es mediado por la producción de eicosanoides. En peces,

Chapter 10 Resumen ampliado
187
hay evidencias que sugieren también la mediación de estas moléculas en la liberación
del cortisol (Koven et al.,, 2001; Van Anholt et al., 2004).
El estrés en los peces
Respuestas al estrés
La definición del estrés varía entre diversos autores, pero puede ser descrita
como una serie de cambio fisiológicos que ocurren en el organismo para recuperar la
homeostasis amenazada por los factores internos o externos (estresantes). El estrés se
puede también describir como una respuesta hormonal interna de un organismo vivo
causada por el medio o otros factores externos que mueven ese organismo fuera de su
homeostasis (Selye, 1973) forzando una reasignación de la energía dentro de su sistema.
El estrés es inevitable en acuicultura y es uno de los grandes problemas crecientes para
los sistemas intensivos de la acuicultura moderna, donde los peces se exponen con
frecuencia a varios factores estresantes, tales como clasificación, transporte y
vacunación.
Las condiciones estresantes tienen consecuencias negativas en el
funcionamiento de los peces en acuicultura, causando la reducción del crecimiento, la
inmune-supresión y la susceptibilidad creciente a las enfermedades infecciosas, dando
como resultado unas pérdidas económicas importantes para las granjas de acuicultura.
La respuesta de peces a tales factores de estrés implica todos los niveles de organización
desde la célula (Hightower, 1991) hasta el organismo individual (Barton and Iwama,
1991; Mommsen et al., 1999) y a la estructura de la población (Adams, 1990).
Bajo situaciones de estrés, el pez experimenta una serie de reacciones
fisiológicas en un intento por recuperar la homeostasis que podría llevar a una respuesta
adaptativa o a una respuesta mal-adaptiva lo que afecta negativamente a las
características de los peces. Estas respuestas se distinguen en tres diversos tipos según
el llamado síndrome general de adaptación (GAS; Selye, 1975):
a) Una respuesta primaria, la reacción de alarma, que incluye la percepción del
nuevo estado alterado por el organismo y la liberación de las hormonas y de los
neurotransmisores de estrés. Por lo tanto, las catecolaminas son liberadas a partir del
tejido cromafino situado en el riñón anterior de los teleósteos y de los nervios
adrenérgicos (Randall and Perry, 1992). El cortisol se libera del tejido interrenal,

Chapter 10 Resumen ampliado
188
situado en el riñón anterior, en respuesta a varias hormonas pituitarias, particularmente
la ACTH que alternadamente es liberada del hipotálamo por la hormona de liberación
corticotrófica (CRH) (Donaldson, 1981; Vijayan et al., 2005; Alsop and Vijayan
2008a).
b) Una respuesta secundaria o etapa de resistencia, durante la cual el organismo
ajusta su metabolismo para hacer frente al disturbio sufrido. Así, las hormonas de estrés
liberadas activan un número de vías metabólicas incluyendo aquellas que implican la
movilización y reajuste de la energía, un aumento en el disturbio osmótico y en el ritmo
cardiaco, un aumento en la absorción de oxígeno y su transferencia, dando por resultado
alteraciones en la química y la hematología de la sangre (Barton and Iwama, 1991,
Iwama et al., 2006).
c) Una respuesta terciaria o etapa de agotamiento, puede ocurrir cuando el
organismo no puede adaptarse o superar los cambios causados por el factor estresante.
Por lo tanto, un estrés severo puede causar mortalidad masiva, y el estrés subletal puede
comprometer varias funciones del comportamiento y de la fisiología (Campbell et al.,
1992; Agravio et al., 1996; Iwama et al., 1997; Wendelaar Bonga, 1997; Ortuño et al.,
2002; Vijayan et al., 2005). Así, el crecimiento de los peces y las funciones de la
reproducción se reducen en las situaciones de estrés (Barton et al., 1986; Mesa, 1994;
Schreck et al., 2001), suprime la inmunidad celular afectando a las vías inflamatorias de
la señalización (Ortuño et al., 2002; Holanda et al., 2003; MacKenzie et al., 2006;
Aluru y Vijayan, en prensa), y también favorece enfermedades infecciosas e incluso
causa la muerte de los peces (Pankhurst and Van der Kraak, 1997).
La regulación neuroendocrina de la respuesta al estrés en peces es similar a la de
los vertebrados superiores e implica dos ejes reguladores (Figura 1.3) (Wendelaar
Bonga, 1997; Barton, 2002):
� EL eje de las células hipotálamo- simpatetico-nervioso-cromafino (HSC),
equivalente al sistema Comprensivo-Suprarrenal-Medular (SAM) en vertebrados.
Consecuentemente a la activación de las fibras de nervio comprensivas, que inervan las
células del cromafino, estimulando la liberación de catecolaminas (epinefrina y
noradrenalina) vía los receptores colinérgicos (Reid et al., 1996). Las catecolaminas,
como predominante la epinefrina en peces teleósteos, se liberan rápidamente a la
circulación en respuesta a un estímulo del estrés (Randall and Perry, 1992) y se

Chapter 10 Resumen ampliado
189
transportan a los diversos órganos, alterando las funciones normales de los diversos
procesos fisiológicos (respiración, reproducción, sistema inmune… etc.) (Wendelaar
Bonga, 1997).
� Eje de las células Hipotálamo-Pituitario-Interrenal (HPI): Es equivalente al eje
Hipotálamos-Pituitario-Suprarrenal, HPA en vertebrados superiores. El eje de HPI es el
regulador de la respuesta al estrés en peces, una vez activado en respuesta a casi todas
las formas de estrés (Wendelaar Bonga, 1997). Brevemente, en respuesta a una
situación de estrés, el hipotálamo libera la Hormona Liberadora de la Corticotropina
(CRH) que a su vez actúa en los Pars distalis de la adeno-hipófisis, cerca de la boca,
accionando la liberación de la hormona adreno-corticotropica (ACTH), y, en menos
cantidad, la hormona-estimulante de α-melanocyte ( -MSH) y la hormona lipotrópica
( -LPH), que son productos intermedios de la síntesis de la ACTH. Luego, la ACTH
induce la producción y la liberación del cortisol, a partir de las células interrenales
situadas en el riñón anterior, a la circulación (Figura 1.3). La liberación del cortisol es
controlado por una regeneración negativa en diversos niveles del eje HPI (Donaldson,
1981; Bradford et al., 1992; Wendelaar Bonga, 1997).
Figura 1.3: Una representación simplificada de los componentes centrales y periféricos de la respuesta al estrés en peces. Hormona liberadora de la corticotropina (CRH), hormona adreno-corticotropica (ACTH), receptor de la catecolamina (CR), receptor de glucocorticoides (GR).

Chapter 10 Resumen ampliado
190
Según la intensidad y la duración del desafío estresante, hay varios tipos de
situaciones de estrés: el estrés agudo, crónico, repetitivo, irregular repetitivo, …etc. El
estrés agudo es producido por un factor estresante intenso de duración corta, mientras
que una situación crónica del estrés implica un disturbio de largo plazo que actúe como
factor estresante intenso o suave.
El riñón anterior como órgano clave en la respuesta al estrés
Anatómicamente, los peces no poseen una glándula adrenal como en
mamíferos. El riñón de teleósteos consiste en una parte anterior separada del resto del
riñón (cuerpo del riñón), derivadas de los tejidos pronefros y mesonefros,
respectivamente. La forma externa del riñón de los peces varía según las especies. El
riñón anterior es un órgano encajonado en hueso, debe haber tomado su posición en la
cabeza, y ha penetrado la vejiga de aire y el arco escapular, mientras que muchos
nefrones y tejido linfoides intersticial constituyen el cuerpo del riñón entero. El riñón
principal contiene la glándula interrenal (homóloga a la corteza suprarrenal en
mamíferos) responsable de la liberación del cortisol y de las células de cromafin
(homólogas a la médula suprarrenal), rodeando la vena y sus ramas (Milano et al.,
1997) del postcardinal. Las células de cromafino se establecen solo o en racimos en las
paredes de la vena del postcardinal rodeada por las células interrenales (Imagawa et al.,
1995). La localización de las celulas interrenales y de las células de cromafino cerca de
la vena del postcardinal facilita su regulación por el sistema endocrino vía la circulación
sanguínea. El tejido interrenal exhibe la considerable variación morfológica entre los
grupos taxonómicos (Nandi, 1962), y es considerado como el principal tejido endocrino,
hematopoyético y linfático en peces (Takashima and Hibiya, 1995). Así, el riñón
anterior es considerado como el tejido clave en la respuesta al estrés.
Hay una poca información disponible sobre las funciones del tejido del riñón
anterior en peces, y los estudios recientes se han interesado en usar este órgano en
diversas preparaciones experimentales para estudiar sus funciones. La variabilidad en el
tamaño y el número de células del riñón anterior entre los peces individuales (Pottinger
et al., 1995) y relativamente una gran cantidad de peces es requerida lo que imposibilita
el uso rutinario de riñones anteriores enteros o en fragmentos en los sistemas estáticos o

Chapter 10 Resumen ampliado
191
de perfusión (Patiño et al.,, 1986; Benguira and Hontela, 2000, Rottlant et al., 2000)
para las pruebas in Vitro (figura 1.4)
Figura 1.4: Cortes de parafina del riñón anterior de los peces teleósteos consistiendo en tejido hematopoyético (HT), venas sanguíneas (BV) y el tejido interrenal (IT) conteniendo las células esteroidogenas (SC)
El Cortisol: como indicador de la hormona del estrés en peces
El nivel de la circulación del cortisol en sangre es de uso general como
indicador del grado del estrés en los peces experimentales (Barton and Iwama, 1991;
Wendelaar Bonga, 1997) puesto que, 1) el cortisol es el mayor glucocorticoide en peces
teleósteos y es demostrado que sus niveles en plasma aumentan en respuesta a una
variedad de factores estresantes (Barton and Iwama, 1991), 2) se mide fácilmente y
confiablemente usando el radioinmunoanálisis (RIA) y los análisis enzima-ligados del
inmunosorbente (ELISA; Gamperle et al., 1994) y 3) desempeña un papel regulador
crítico en muchos procesos fisiológicos importantes (Mommsen et al., 1999). La vía
para la liberación del cortisol comienza en el eje HPI con la liberación del CRH por las
células neurosecretoras hipotalámicas, lo que estimula las células corticotróficas de la
adenohipofisis para secretar la ACTH. La ACTH de la circulación, a su vez, estimula
las células interrenales encajadas en el riñón anterior para sintetizar y liberar los
corticoesteroides en la circulación para su posterior distribución a los tejidos finales
(Figura 1.3).
La producción de cortisol está bajo control del HPI (Wendalaar Bonga, 1997;
Mommsen et al., 1999). Por ejemplo, el factor de liberación del cortisol (CRF)
secretado de las neuronas hipotalámicas estimula la liberación de la ACTH de la
pituitaria. Este péptido pituitario se une al receptor 2 de la melanocortina (MC2R) en las

Chapter 10 Resumen ampliado
192
células esteroidogenicas en el tejido interrenal que lleva a la corticosteroidogenesis
(Aluru and Vijayan, 2008b). Se cree extensamente en mamíferos que la ACTH estimula
la secreción del cortisol a través de la adenosina 3 ', ' - el monofosfato cíclico 5 (cAMP),
que proporciona el colesterol del substrato activando la hidrólisis del éster de colesterol
y facilitando el transporte del colesterol a la enzima de la hendidura de la cadena lateral
(scc). Dempsher et al (1984) han establecido un modelo de liberación de cortisol
(Figura 1.5), así la ACTH se une a uno o más receptores específicos en la membrana
celular adrenocortical (MC2R, representado por A y B en la figura abajo) que tiene el
efecto de activar la adenilato ciclaza (ACase). La concentración citosolica del cAMP
aumenta, a su vez a) la hidroliza activadora del colesterol estera (CE), que cataliza la
conversión del éster de colesterol a colesterol libre, y b) facilitando la transferencia del
colesterol dentro de la mitocondria a un sitio accesible a la enzima scc. Por lo tanto, el
receptor lipoproteína de baja densidad participa en la absorción del colesterol
plasmático junto con la síntesis del colesterol citosolico proporcionando el substrato
para la síntesis de esteroides, y ambos estos procesos pueden ser controlados por un
pool intracelular de colesterol.
Figura 1.5: Un Modelo de la secreción del cortisol por la estimulación por ACTH en mamiferos (Dempsher et al., 1984). Adenylate cyclase (ACase), cholesterol ester (CE), adenosine 3’,5’-cyclic monophosphate (camp), Adenosine triphosphate (ATP).

Chapter 10 Resumen ampliado
193
Otros estudios han precisado que el camino principal que lleva a la síntesis del
corticoesteroide por el estímulo de ACTH implica una cascada de señales conteniendo
las G-proteínas, la adenil ciclasa, el cAMP y la proteína kinaza A (PKA) (Miller, 1988;
Schimmer, 1995). Hay evidencias que sugieren que el cortisol ejerza un efecto de
regeneración negativa sobre la secreción del ACTH en la pituitaria y también suprime la
síntesis de CRH en el hipotálamo. Además, hay también un efecto de la regeneración
negativa de la ACTH sobre la secreción de CRH. Por lo tanto el proceso entero se
puede considerar como sistema de auto-regulación, según lo resumido en la figura
anterior. Además, el colesterol modula su propia síntesis inhibiendo la beta-hidroxi-
beta-metilglutaril (HMG) – CoA reductasa en la célula adrenocortical (Dempsher et al.,
1984).
Varios factores de estrés bióticos y abióticos son conocidos como moduladores
de la biosíntesis del cortisol en peces alterando el patrón de la expresión de los genes
que codifican las proteínas implicadas en el funcionamiento del eje HPI (Alsop and
Vijayan, 2008a,b; Hontela and Vijayan, 2008). En teleósteos, varios receptores
glucocorticoides (GRs) y un receptor de mineralcorticoid (SR.) están implicados en la
señalización del cortisol (Vijayan et al., 2005; Prunet et al., 2006; Alsop and Vijayan,
2008a). La 11- deocycorticosterona fue identificada como liga para MR de la trucha
usando análisis in vitro, mientras que todavía carece encontrar un papel fisiológico para
esta liga in vivo (Sturm et al., 2005; McCormick et al., 2008). Un distinto papel
fisiológico para los múltiples isoformas de GR en la señalización del cortisol no se ha
establecido in vivo todavía (Bury et al., 2003).
Biosíntesis de los corticoesteroides por las células interrenales
Las hormonas esteroides son importantes reguladoras de numerosos procesos
fisiológicos, e incluyen los glucocorticoids, mineralocorticoides y los esteroides
sexuales, tales como estrógenos y andrógenos (Miller, 1988). Sin embargo, solamente
los niveles bajos de aldosterona se han encontrado en teleósteos y la función de los
mineralocorticoides parece ser realizada por los glucocorticoides (Wendelaar Bonga,
1997).
Las hormonas esteroides son estructuralmente similares y se sintetizan del
colesterol en las células esteroidogenicas del riñón anterior. Así, el cortisol se forma del
colesterol vía los intermediarios, la pregnenolona, la progesterona, la 17-

Chapter 10 Resumen ampliado
194
hidroxiprogesterona y el 11-deoxicortisol. La 17-hidroxiprogesterona se puede convertir
a los corticoesteroides por la hidroxilaza 21 o a los esteroides sexuales por la
hidroxilaza 17 que es así un paso de la rama en la vía de la biosíntesis esteroide. El 11-
deoxicortisol formado por la 17-hidroxiprogesterona microsomal 21-hidroxilaza es
metabolizada eventualmente al cortisol por la 11-hidroxilaza mitocondrial (Figura 1.6).
En peces, las enzimas responsables de la producción del cortisol se han examinado muy
poco. En mamíferos la 21-hidroxilación de la 17-hidroxiprogesterone es catalizada por
el citocromo microsomal P450c21 al cortisol producido por las células adrenocorticales
(Miller et al., 1997).
Figura 1.6: Representación de la vía esteroidogenica en peces teleósteos y el papel importante del P450c17 en la formación de los glucocorticoides y andrógenos/estrógenos.
Funciones del cortisol en peces
Mientras que las catecolaminas inducen la elevación rápida, a corto plazo de la
glucosa en sangre sobre todo a través de la vía glicogenolítica (Vijayan and Moon,
1992), el cortisol tiene un papel clave en la regulación de muchas funciones fisiológicas
importantes en los teleósteos. Así, está implicado a largo plaza en la movilización de las
reservas de energía no procedentes de carbohidratos (Wendelaar Bonga, 1997) como la
proteína y lípidos de los tejidos, lo que aumenta los ácidos grasos libres en plasma

Chapter 10 Resumen ampliado
195
(Mazeaud et al., 1977). Además de sus acciones en la regeneración en el eje
corticotrófico, los elevados niveles crónico de cortisol son responsables de los efectos
perjudiciales de estrés sobre las funciones fisiológicas vitales de peces, tales como la
reproducción (Foo et al., 1993, Small, 2004), la osmoregulation (Reddeing et al., 1991;
Mancera et al., 1994; McCormick, 2001), el crecimiento (Barton et al., 1987; Small,
2004) y el sistema inmune (Rottlant et al., 1997; Weyts et al., 1998, MacKenzi et al.,
2006; Aluru and Vijayan, en prensa). En peces de agua dulce, la respuesta al estrés
crónico puede también incluir: pérdida de electrólitos, disminuciones del hematocrito y
de la hemodilución por el aumento de la permeabilidad de la branquia inducido por la
catecolamina (Randall and Perry, 1992) o la pérdida creciente de iones a través de la
orina (McDonald and Milligan, 1997).
Los niveles del cortisol varían y deben servir como pautas generales puesto que,
las condiciones individuales, incluyendo diferencias entre las especies, las
características genéticas de la cepa, el historial de cultivo anterior, y el ambiente local
modifica los valores plasmáticos del control y de los estados estresados (Barton et al.,
2002). Por ejemplo, los resultados del confinamiento de la trucha arco iris,
Oncorhynchus mykiss, (Pottinger et al., 1992) y el salmón del Atlántico, Salmo Salar
(Fevolden et al., 1991) han indicado que la respuesta del cortisol al estrés en peces de
teleósteos es un rasgo altamente individualizado. Algunos individuos exhiben una
respuesta al estrés constantemente alta del cortisol mientras que otros tienen una
respuesta constantemente baja. Las razones de estas diferencias son actualmente
confusas. Además, los programas selectivos de la cría han demostrado que la
sensibilidad al estrés es hereditaria y que la sensibilidad individual es estable en el
tiempo (Fevolden et al., 1991; Afonso et al., 1998; Pottinger and Carrick, 1999a).
La dorada como especie modelo para esta tesis
La dorada es una especie marina, que tiene una larga historia en la región
mediterránea, con la evidencia de la captura y la cebadura de esta especie datados por
mas de 2000 años. Pero, a partir de los años 80, la producción comenzó a crecer
rápidamente, ampliándose desde 1.100 toneladas 1985 a 8400 MT en 1990 (FAO). Este
aumento fue apoyado por el desarrollo de nuevas tecnologías y la disponibilidad de las
ayudas económicas nacionales y de la UE. Hoy en día, la dorada constituye una de las

Chapter 10 Resumen ampliado
196
especies marinas más importantes cultivadas en el mediterráneo, y la producción
europea total de la acuicultura en dorada llega aproximadamente a 140.000 toneladas en
2007, cerca de 40.000 toneladas más de 2005 (APROMAR, 2008) (Figura 1.7). En
España, la dorada es una especie muy apreciada por el consumidor y tiene una alta
importancia económica. Las técnicas de la producción de la dorada están por lo tanto
bien desarrolladas y constituye un modelo excelente para los estudios fisiológicos en
especies marinas de aguas calientes. Sin embargo, puesto que su cultivo es
relativamente nuevo en comparación con los salmónidos y otras especies de agua fría,
sigue habiendo muchos aspectos fisiológicos y alimenticios con todo sin estudiar.
Figura 1.7: Evolución de la producción de la dorada en Europa durante la última década
10.2. Objetivos (2)
El objetivo general de esta tesis es promover la substitución del aceite de
pescados por los aceites vegetales en las dietas de engorde para la dorada sin afectar el
bienestar de los peces mejorando nuestro conocimiento en los mecanismos implicados
en la regulación de la resistencia al estrés por los lípidos dietéticos. Para ese propósito
varios objetivos fueron planteados:

Chapter 10 Resumen ampliado
197
1- Para determinar el efecto de niveles de la substitución del aceite de pescado por
aceites vegetales ricos en los ácidos grasos n-3 o n-6 sobre las características del cultivo
y la composición en ácidos grasos de diversos tejidos de dorada hasta el tamaño
comercial.
2- Para estudiar el efecto de la sustitución del aceite de pescado y los cocientes entre los
ácidos grasos n-3/n-6 sobre bienestar de la dorada y su resistencia a varios tipos de
estrés.
3- Para investigar los efectos de diversos niveles de substitución del aceite de pescados
por mezclas de los aceites vegetales sobre salud de la dorada y el bienestar en términos
de composiciones de ácido graso del plasma y de los leucocitos y producción de la
prostaglandina y de la leptina.
4- Para entender mejor los mecanismos implicados en la regulación de la resistencia al
estrés por los ácidos grasos poliinsaturados estudiando la producción y la liberación del
cortisol en células interrenales de la dorada incubados con la hormona
adrenocorticotrópica.
5- Para aclarar el efecto de alimentar los aceites vegetales en dietas para engorde de
dorada sobre el bienestar en términos de producción y liberación del cortisol por el
riñón anterior y las vías fisiológicas implicadas.
Para alcanzar estas metas dos largas pruebas de alimentación a lo largo del
período de engorde total y varios estudios “in vitro” fueron conducidas. Los resultados
fueron organizados en cinco estudios científicos que se han publicado o se han
presentado ya para la publicación. Algunos de esos estudios fueron incluidos en dos
proyectos de investigación: RAFOA (2001-2005) financiado por la UE (Q5RS-2000-
30058) y Linosalud (2005-2007) financiado por el gobierno español (AGL2004-08151-
CO302).
10.3. Materiales y métodos generales (3)
Dos grandes experimentos de alimentación principales se incluyen en este
capítulo, el primer experimento fue planteado para substituir el aceite de pescado en las
dietas para la dorada por aceites vegetales, sin dañar a la salud, bienestar y el
crecimiento de los peces, este experimento fue parte del proyecto RAFOA (Researching

Chapter 10 Resumen ampliado
198
Alternatives to Fish Oil for Aquaculture) Q5RS-2000-30058 de la UE. El segundo
experimento fue parte del proyecto financiado por el Ministerio de Educación y
Ciencias Español LINOSALUD (Efecto de la Sustitución parcial del aceite de pescado
por aceite de Lino en la dieta sobre la salud y la resistencia al estrés en dorada (Saprus
aurata)) (AGL2004-08151-CO3 02/ACU). En ambos experimentos los peces fueron
cultivados desde juveniles hasta la talla comercial con dietas que contienen diversos
cocientes del FO a los VOs, siendo los últimos el aceite de lino (LO), aceite de colza
(RO) y aceite de palma (PO) durante un periodo de 281 días en el primer experimento,
y el aceite de lino (LO) y el aceite de soja (SO) por un periodo de 240 días en el
segundo experimento. La mezcla de aceites fue formulada para replegar al FO en
términos de concentraciones en saturadas, monounsaturated y poliinsaturadas y
cocientes del ácido graso excepto que no hubiera ningún HUFA encontrado en FO. Los
dos experimentos de alimentación fueron realizadas en las instalaciones del Grupo de
Investigación en Acuicultura (ULPGC&ICCM, España). Las prostaglandinas y el
análisis de las leptinas fueron hechos en las instalaciones del departamento de la
nutrición de peces, instituto de la acuicultura, universidad de Stirling (Escocia). Parte de
los experimentos in vitro, y todo los análisis del cortisol fueron conducidos en las
instalaciones del departamento de biología celular, de fisiología y de inmunología,
Universitat Autonòma de Barcelona, Bellaterra, España.
Condiciones experimentales
Los juveniles de dorada usados en la presente tesis fueron suministrados por una granja
local de peces (Alevines y Doradas, S.A.: ADSA, Las Palmas, España), después los
juveniles fueron mantenidos durante 4 semanas de aclimatación en tanques de 1000 l
(Figura 2.1) y distribuidos en tanques experimentales de 500 l (Figura 2.2).

Chapter 10 Resumen ampliado
199
Figura 2.1: Tanque de aclimatación de 1000 l
Los tanques cónicos cilíndricos con un volumen total de 500 l se colocaron en
pares y fueron separados por un conducto de desagüe central. Los tanques tienen un
diámetro de 1.5 m y una profundidad de 1.0m en la parte central (Figura 2.2). La
entrada del agua se localiza en la parte inferior del tanque y la salida del agua se localiza
en el fondo del tanque en el lado posterior. La entrada y salida laterales del agua se
pueden modificar con diversos accesorios movibles, a través del período del cultivo
según la secuencia de alimentación.
Figura 2.2: Una muestra de los tanques de cultivo intensivo de 500 l

Chapter 10 Resumen ampliado
200
Especie estudiada
La dorada (Sparus aurata, Linnaeus 1758) (Figura 2.3), es un teleósteos,
perteneciendo a la familia de los esparidos, que tiene un total de 11 espinas dorsales,
13-14 de rayos suaves dorsales, 3 espinas dorsales anales; 11-12 rayos suaves anales. Es
caracterizada por un cuerpo largo, con el punto negro grande en la cubierta de la
branquia. Este pez tiene una distribución grande (Figura 2.4), así está presente en
Atlántico del este (por las islas británicas), estrecho de Gibraltar, Cabo verde y
alrededor de las islas Canarias, y está también presente en el mediterráneo. La dorada
podría ser encontrado en capas de hierba del mar y partes inferiores arenosas así como
en la zona de la resaca comúnmente a las profundidades de cerca de los 30m, pero los
adultos pueden ocurrir a profundidad de hasta 150 m. Es un pescado sedentario,
solitario o en pequeñas agregaciones. En primavera, se encuentran a menudo en lagunas
y los estuarios costeros de las aguas salobres. Es una especie principalmente carnívora,
pero puede ser herbívora, que alimenta con crustáceos, incluyendo mejillones y ostras
(Bauchot et al., 1990). Éste es uno de los peces más importantes de la acuicultura salina
y hipersalina.
Figura 2.3: Un ejemplar adulto de dorada

Chapter 10 Resumen ampliado
201
Figura 2.4: Distribución geografica de la dorada (Fish base, 2009)
10.3.1 - Experimento I: parte del proyecto RAFOA
Animales y dietas
Dos mil cuatrocientos juveniles de dorada con un peso inicial de 24 g fueron
mantenidas en Instituto Canario de Ciencias Marinas (ICCM). Los peces fueron
distribuidos aleatoriamente en 16 tanques circulares de polietileno de 1000 l (150 peces/
tanque, cada dieta probada en cuadruplicado) suministrados con flujos continuos de
agua de mar (con una salinidad del 36%0) y de aire. Los peces fueron alimentados bajo
fotoperiodo natural (aproximadamente 12:12 l/d). La temperatura del agua y el oxígeno
disuelto durante el período experimental se extendieron entre 21.88-22.41ºC y 5.5-7.2
PPM, respectivamente. Las muestras iniciales para la composición de lípidos del hígado
y músculo se recogieron a partir de 10 juveniles de peso medio aproximadamente de 24
g antes de empezar la alimentación con la dietas experimentales. Después de dos
semanas de aclimatación de los peces a los tanques experimentales y a la dieta control,
las dietas experimentales fueron suministradas a mano hasta la saciedad evidente tres
veces por día a las 9:00, 12:00 y 15:00 h, seis días por semana. Todos los peces
individuales en cada tanque fueron pesados una vez al mes y la ración fue ajustada. La
tasa de alimentación fue determinado diariamente. Quince peces fueron muestreados
para los parámetros bioquímicos tomados al principio y en el medio (98 días) del
período experimental.

Chapter 10 Resumen ampliado
202
Cuatro dietas experimentales iso-energéticas y iso-proteicas fueron formulados
con un contenido constante de lípidos de alrededor de 22%. Dos diversas mezclas
incluidas en una substitución del 60% del aceite de pescado dietético en la dieta 1
fueron utilizadas para la dorada (Tabla 1), 15:60:25 por volumen en la dieta 2 y el
40:40:20 por volumen en la dieta 3, de los aceites de colza, de lino y de palma,
respectivamente. Una cuarta dieta con 100% de substitución del aceite de pescado por la
mezcla usada en la dieta 2 también fue incluida. Las dietas fueron preparadas y
suministradas por Nutreco ARC. La composición de lípidos y de ácidos grasos de la
dieta del tamaño de grano de 5 milímetros fue analizada y se demuestra en la tabla 2. La
dieta control contuvo más saturados, DHA, EPA y ARA que las otras dietas, con la
dieta 4 conteniendo los niveles inferiores de estos ácidos grasos. Considerando que, las
dietas 2 y 3 (con el 60% de substitución) tenían niveles medios de EPA, DHA y ARA,
pero de la dieta 3 fue más alta en ácidos grasos monoenoicos y más baja en n-3 (más
baja en 18:3 n-3 y más alta en 18:2 n-6) para comparar la diferencia en la utilización de
los ácidos grasos de la serie n-9 y n-3 por la dorada, y posteriormente los cocientes n-
3/n-6 fueron más bajos que en la dieta 2. La dieta 4 era la más baja en EPA, DHA y
ARA y la más alta en 18:2 n-6 y los monoenoicos (principalemente el ácido oleico).
El índice de conversión (CI), la tasa de crecimiento específica (SGR) y el índice
hepatosomatico (HSA) eran calculados según las fórmulas siguientes:
CI= Tasa de alimentación / Ganancia de peso
SGR= [(Ln Peso final – Ln Peso incial)/ t)]*100
con t= el periodo del experimento (en días)
HSI = Peso del hígado / peso total

Chapter 10 Resumen ampliado
203
Tabla 2.1: Los diferente tipos y los % de los aceites usados en la dietas experimentales
FO 60 L 60 R 100 L
Aceite de pescado 100 40 40 -
Aceite de Colza - 10 24 17
Aceite de Lino - 35 24 58
Aceite de Palma - 15 12 25

Chapter 10 Resumen ampliado
204
Tabla 2.2: El contenido en los principales ácidos grasos de las dietas (g/100 g ácidos graos totales) (5mm)
FO 60L 60R 100L
% Lípidos (p.s.) 20.24 21.36 22.79 25.14 14:0 5.92 3.05 2.93 0.79
15:0 0.50 0.28 0.24 0.08
16:0 19.30 14.99 15.95 15.92
16:1n-7 7.21 3.93 3.23 1.23
16:2n-6 - - - -
17:0 0.26 0.15 0.13 0.02
16:4n-3 0.17 0.04 0.03 0.02
18:0 3.37 3.21 3.36 3.40
18:1n-9 11.71 24.61 29.89 32.98
18:2n-6 5.84 11.87 12.50 13.67
18:3n-6 0.07 0.10 0.08 -
18:4n-6 0.17 0.03 0.03 -
18:3n-3 1.62 14.36 12.25 23.02
18:4n-3 2.18 1.28 0.87 0.17
20:0 0.21 0.24 0.32 0.23
20:1n-9 2.38 2.05 1.98 2.23
20:1n-7 - - - -
20:2n-6 0.15 0.10 0.08 0.03
20:4n-6 0.66 0.34 0.28 0.06
20:4n-3 0.54 0.27 0.21 0.05
20:3n-3 0.08 0.05 0.04 0.02
20:5n-3 11.90 6.10 4.86 1.06
22:0 0.08 0.10 0.24 0.13
22:1n-11 2.98 2.35 2.20 2.41
22:1n-7 - 0.02 - -
22:4n-6 0.18 - 0.03 0.01
22:5n-6 0.24 0.12 0.11 -
22:4n-3 - - 0.03 0.02
22:5n-3 1.17 0.56 0.47 0.08
22:6n-3 14.14 7.36 3.21 2.10
Saturados 30.01 22.22 23.33 20.63 Monoenoicos 27.70 33.12 37.44 38.85
Σ n-3 32.23 30.27 25.22 26.57
Σ n-6 7.37 12.59 13.13 13.78
Σ n-9 14.56 26.81 31.91 35.22
Σ n-3 HUFA 27.84 14.34 11.82 3.33
n-3/n-6 4.37 2.40 1.92 1.93

Chapter 10 Resumen ampliado
205
Procedimiento de muestreo
En el final del experimento de alimentación, después de 281 días, los peces
fueron muestreados individualmente de cada tanque. La sangre fue recogida de las
venas caudales en jeringas heparinizados a partir de 6 peces por cada tanque (18 peces
por dieta) y transferidos a un tubo eppendorf cubriert con heparina de litio como
anticoagulante. La sangre fue centrifugada inmediatamente a 3000 RPM durante 10
minutos para sedimentar las células. Un mililitro de plasma fue recogido, se le
añadieron 50 µl/ml del ácido fórmico a 2M y las muestras acidificadas fueron
congeladas en el nitrógeno líquido (- 80°C) para el análisis de los eicosanoides. 250 µl
de plasma fueron recogidos y guardados al -80°C para el análisis de las leptinas y el
resto de plasma fue mezclado formando1 pool por cada tanque y guardado a - 80°C
para el análisis de los ácidos grasos.
La separación de los leucocitos de la sangre fue conducida en solamente 3
tratamientos dietéticos debido a que no se quedaron suficientes peces alimentados con
la dieta 100 LO. Siete mililitros de sangre fueron recogidos de la vena caudal en
jeringuillas heparinizadas a partir de 9 peces por dieta y transferidos a los tubos de
cristal limpios guardados en el hielo. La sangre fue centrifugada a 500 g durante 10
minutos a 4 ºC. Después de la eliminación del sobrenadante, las células flotantes fueron
suspendida de nuevo en 10 ml de HBSS sin Ca-Magnesio y entonces centrifugados a
500 g durante 10 minutos a 4 ºC, las células fueron separadas en 2 capas que fueron
suspendidas de nuevo en 6 ml de HBSS sin Ca-Magnesio, y acodadas cuidadosamente
sobre 6 ml de Percoll al 46% y centrifugadas a 450 g durante 40 minutos a 4 ºC. Las
celulas de la capa intermedia blanca fueron recogidas y suspendidos de nuevo en 10 ml
de HBSS sin Ca-Magnesio y centrifugados a 500 g durante 10 minutos a 4ºC. Las
células recogidas fueron suspendidas de nuevo en 6 ml HBSS sin Ca-Magnesio,
cuidadosamente acodados sobre 6 ml de Percoll al 46% y centrifugados a 450 g durante
40 minutos a 4 ºC. Los leucocitos (capa intermedia blanca) fueron recogidos y lavados
con 10 ml de HBSS sin Ca-Mg. Los leucocitos obtenidos a partir de 3 peces fueron
mezclados y suspendidos de nuevo en 4 ml de HBSS, 2 ml de cloroformo fueron
agregados y la muestra fue guardada a -80 ºC antes de la extracción de lípidos.

Chapter 10 Resumen ampliado
206
Extracción y análisis de los lípidos
La extracción de lípidos totales de las muestras, dietas y de leucocitos del
plasma fue realizada por el método de Folch et al., (1957) usando una mezcla de
cloroformo: metanol (2: 1) (v:v) conteniendo 0.01% BHT, como un antioxidante, y KCl
(al 0.88%); los 300 µl de plasma recogidos fueron utilizados. La extracción de los
lípidos fue facilitada por el uso de vortex, mezclador vigoroso, seguido por la
centrifugación lo que permitió la separación de cloroformo y las capas acuosas
extrayendo los lípidos de plasma, dieta y leucocitos. Las capas más bajas se filtraron
con el papel de filtro de Whatman y se secaron bajo flujo de nitrógeno, los lípidos
totales fueron pesados. Las fracciones neutrales y polares fueron separadas por
cromatografía de adsorción en los cartuchos Sept-pak de silicona, (las aguas, Milford,
mA) según lo descrito por Juaneda y Rocquelin (1985).
Los ésteres metílicos de los ácidos grasos fueron producidos de las partes
alícuotas de lípidos totales extraídos de dietas y de muestras de plasma por la
transmetilación ácida-catalizada realizadas durante la noche en 50 °C según lo descrito
por Christie (1982). Los ésteres metílicos de los diferentes ácidos grasos fueron
separados y cuantificados por la cromatografía de gases (Shimadzu C-R5A, columna de
30m*0,32m m Silice con Supleco-10) según las condiciones descritas por Izquierdo et
al., 1990. Los ésteres metílicos individuales fueron identificados por la comparación
con estándares conocidos y datos publicados.
Extracción, separación e immunoensayo de los isómeros de las prostaglandinas
- Purificación de eicosanoides
El plasma congelada para el análisis de los eicosanoides fue deshelada y
centrifugada a x 1000 g durante 5 min para precipitar los desechos. Los sobrenadantes
fueron extraídos usando las minicolumnas de “Sept-Pak” del sílice de octadecyl (C18)
(Millipor (Reino Unido), Watford) según lo descrito detalladamente por Bell et al,
(1994). 200 µl del sobrenadante fue aplicada a la columna, que había sido prelavada con
5 ml de metanol y 10 ml de agua destilada. La columna fue lavada sucesivamente con
10 ml de agua destilada, 5 ml de el 15% (v/v) etanol y 5 ml de hexano/cloroformo (65:
35, v/v) antes de la elución de los prostanoides con 10 ml de etil acetato. Este extracto

Chapter 10 Resumen ampliado
207
fue secado debajo del nitrógeno y suspendido de nuevo en 100 µl de metanol y
guardado en un pequeño frasco de cristal en al congelador (-4 ºC) antes de su análisis
por immunoensayo.
- Separación de la PGE3 con HPLC
La PGE3 fue separado por HPLC a fase revertida usando una columna del C18
(ODS2) de Spherisorb 5 µm. El sistema cromatográfico fue equipado de bombas de
agua modelo M-45 de 680 y los picos fueron vistos a 196 nanómetro usando un detector
de Pye-Unicam LC-UV para determinar la elución de los estándares de las
prostaglandinas. Un sistema isocratico fue utilizado que contenía 17 mM de ácido
fosfórico/el acetonitrilo (70: 30, v/v) con un flujo de 0,75ml/min. Los 50 µl de
eicosanoides sobrantes purificados del extracto de plasma fueron inyectados a la
columna y las fracciones de 2.25 ml fueron recogidas usando un LKB 2112 “Redirac”.
Las fracciones que correspondían a PGE3 fueron aplicadas al A.C. 18 “Sept-Pak” que
había sido prelavado como se describe anteriormente, y la prostaglandina fue disuelta
en 5 ml de etil acetato. Las muestras fueron secadas debajo de nitrógeno y redisueltas en
100 µl de buffer del immunoensayo. La cuantificación de la PGE3 fue realizado usando
los kits del immunoensayo de la enzima (EIA) para PGE2 según el mismo protocolo
descrito arriba (sur SPI-bio, del GIF Yvette, Francia). La especificidad de los
anticuerpos del kit usados en este immunoensayo es de 100% con la PGE2 y solamente
43% con PGE3, se tomo en cuenta al calcular resultados.
- Immunoensayo de las prostaglandinas E2 y E3
Para las prostaglandinas E2: 50 µl del extracto de metanol fue tomado, secado
debajo del nitrógeno y disuelto en 500 µl del buffer de EIA y guardado en el
refrigerador (a 4°C). Este análisis se basa en la competición entre PGE2 y un PGE2-
acetilcolinesterasa (AchE) PGE2 conjugado (el patrón) para una cantidad limitada de
anticuerpo monoclonal PGE2. Porque la concentración del patrón PGE2 es constante
mientras que la concentración de PGE2 varía dependiendo de la muestra, así la cantidad
del patrón PGE2 que pueda atado al anticuerpo monoclonal PGE2 y es inversamente
proporcional a la concentración de PGE2 en el posillo. Este complejo de anticuerpo
PGE2 se ata al anti-ratón policlonal IgG de cabra que se ha atado previamente al posillo.
La placa se lava para quitar cualquier reactivo desatado y entonces el reactivo de
Ellman (que contiene el substrato para AchE) se agrega al posillo. El producto de esta

Chapter 10 Resumen ampliado
208
reacción enzimática tiene color amarillo distinto y absorbe fuertemente a 412
nanómetro. La intensidad de este color, determinado espectrométricamente, es
proporcional a la cantidad del AchE PGE2 atada al posillo, que es inversamente
proporcional a la cantidad de PGE2 libre presente adentro bien durante la incubación.
Todos los reactivos específicos de ensayo fueron preparados antes de comenzar el
análisis.
- Buffer del EIA: el contenido del frasco del buffer se diluye con 90 ml de agua de
UltraPura.
- Buffer para lavado: Diluyendo el contenido del frasco concentrado al 1:400 con agua
UltraPura y se le añade del tween (0.5ml/liter del buffer para el lavado).
- Estándar de la prostaglandina E2: El concentrado del estándar PGE2 (10 ng) se
reconstituye con 1ml del buffer del EIA. Ocho tubos limpios (#1-8) fueron preparados;
poniendo de 360 µl del buffer del EIA al tubo #1 y 200 µl buffer del EIA a los tubos #
2-8. 40 µl del estándar bulk (10 ng/ml) se transfiere al tubo # 1 y se mezcla muy bien.
En serie, el estándar fue diluido quitando el µl 200 de # 1 y colocándolo en tubo # 2,
mezclándose. Después, quitando 200 µl del tubo 2 al tubo # 3, mezclándolo. El proceso
fue repetido para los tubos # 3-8. Estos estándares diluidos no se deben almacenar por
más de 24 horas.
- La prostaglandina E2 AchE: El concentrado se diluye con 6 ml del buffer del EIA, la
tinta se agrega en una dilución final del 1:100.
- Anticuerpo monoclonal de la prostaglandina E2: El concentrado se diluye con 6 ml
EIA, el tinte al antisuero reconstituido se agrega en una dilución final del 1:100. Una
vez que los kits del immunoensayo fueron abiertos, cada kit contiene ocho en blanco
(Blk), un posillo de liga no específica (NSB), un posillo de liga máxima (B0), y ocho
puntos de la curva estándar (S1-S8). Una prueba con diversas diluciones de las muestras
fue probada para elegir la mejor (µl 80).
Medir con una pipeta los diferentes reactivos: Se usaron diversas puntas para pipetear el
buffer, el estándar, la muestra, el patrón, y el anticuerpo.
1- El buffer del EIA: 100 µl del buffer del EIA fueron agregados a los posillos de la liga
no especifica (NSB) y 50 µl los posillos del ligad máxima (B0).

Chapter 10 Resumen ampliado
209
2- Estándar de la prostaglandina E2: 50 µl del tubo # 8 al posillo estándar más bajo (S8).
50 µl del tubo # 7 fue agregado al posillo siguiente del estándar (S7). El mismo
procedimiento fue utilizado hasta que todos los estándares fueron puestos.
3- Muestras: 80 µl de la muestra fue agregado por posillo.
4- el patrón de la prostaglandina E2 AchE: 50 µl fue agregado a todos los posillos
excepto a los blancos (Blk).
5- Anticuerpo monoclonal de la prostaglandina E2: 50 µl fue agregado a todos los
posillos excepto a la liga no específica (NSB), y al blanco (Blk).
6- La placa fue cubierta con la película de plástico e incubada durante 18 horas a 4°C lo
que aumentan la sensibilidad del análisis.
7- Desarrollar la placa: Antes de desarrollar la placa, el reactivo de Ellman se
reconstituye con 20 ml de agua ultrapura. Esto debe ser preparada y utilizado el mismo
día que se prepara, y se protege contra luz al guardar. Los posillos fueron vaciados y
aclarados cinco veces con el buffer de lavado. 200 µl del reactivo de Ellman fueron
agregado a todos los posillos y 5 µl del patrón a los posillos de la actividad total. La
placa se cubre con la película plástica y es desarrollada usando un agitador orbital en
oscuridad durante 75 min.
8- Lectura de la placa: Es realizada en una longitud de onda de 405 nm.
9- Cálculo de los resultados: Los resultados fueron calculados manualmente como
sigue: - Se sacó un promedio de las lecturas de la absorbancia de posillos Blk.
- Restar el Blk medio del resto de posillos.
- Restar NSB de todos los otros posillos.
– Se calculó el %B/B0 (% del estándar de la muestra ligada/máximo de liga) para los
posillos restantes.
- Se desciño remonta la curva estándar (%B/B0 con la concentración estándar en PGE2
en pg/ml).
- Finalmente, se calcularon las concentraciones de cada muestra en PGE2 y PGE3.
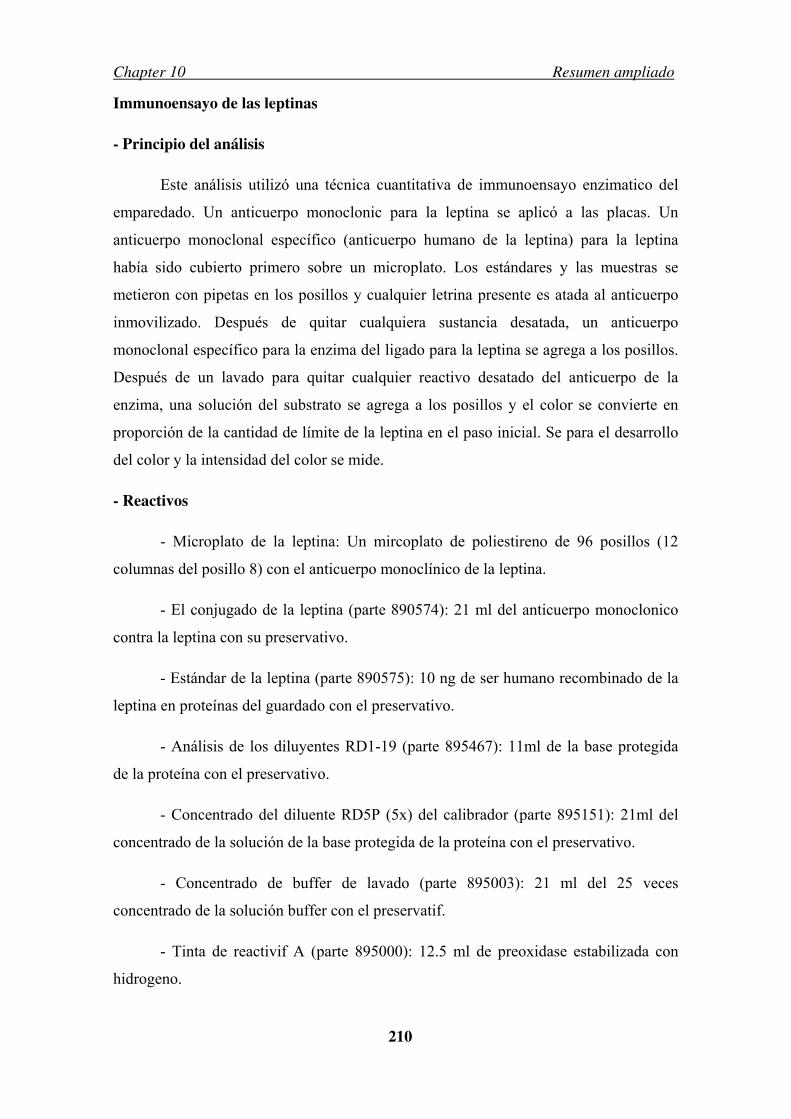
Chapter 10 Resumen ampliado
210
Immunoensayo de las leptinas
- Principio del análisis
Este análisis utilizó una técnica cuantitativa de immunoensayo enzimatico del
emparedado. Un anticuerpo monoclonic para la leptina se aplicó a las placas. Un
anticuerpo monoclonal específico (anticuerpo humano de la leptina) para la leptina
había sido cubierto primero sobre un microplato. Los estándares y las muestras se
metieron con pipetas en los posillos y cualquier letrina presente es atada al anticuerpo
inmovilizado. Después de quitar cualquiera sustancia desatada, un anticuerpo
monoclonal específico para la enzima del ligado para la leptina se agrega a los posillos.
Después de un lavado para quitar cualquier reactivo desatado del anticuerpo de la
enzima, una solución del substrato se agrega a los posillos y el color se convierte en
proporción de la cantidad de límite de la leptina en el paso inicial. Se para el desarrollo
del color y la intensidad del color se mide.
- Reactivos
- Microplato de la leptina: Un mircoplato de poliestireno de 96 posillos (12
columnas del posillo 8) con el anticuerpo monoclínico de la leptina.
- El conjugado de la leptina (parte 890574): 21 ml del anticuerpo monoclonico
contra la leptina con su preservativo.
- Estándar de la leptina (parte 890575): 10 ng de ser humano recombinado de la
leptina en proteínas del guardado con el preservativo.
- Análisis de los diluyentes RD1-19 (parte 895467): 11ml de la base protegida
de la proteína con el preservativo.
- Concentrado del diluente RD5P (5x) del calibrador (parte 895151): 21ml del
concentrado de la solución de la base protegida de la proteína con el preservativo.
- Concentrado de buffer de lavado (parte 895003): 21 ml del 25 veces
concentrado de la solución buffer con el preservatif.
- Tinta de reactivif A (parte 895000): 12.5 ml de preoxidase estabilizada con
hidrogeno.

Chapter 10 Resumen ampliado
211
- Tinta de reactivo B (parte 895002): 12.5 ml de cromógeno estabilizado
(tetrametilbenzidina).
- Parador de la solución: 6 ml de ácido sulfúrico de 2 N.
- Preparación de los reactivos
Todos los reactivo se sacan a la temperatura ambiente antes del análisis.
- El buffer del lavado: El frasco del concentrado se mezcla suavemente y se
diluye en 1:25 con agua desionizada. Se prepararon 500 ml del buffer para el lavado.
- Solución del substrato: El reactivo A y B del color fue mezclado junto en
volúmenes iguales y puesto en obscuridad en un tiempo de 15 minutos antes de usar.
- Diluyente RD5P (1X) del calibrador: el concentrado se diluye a 1:5. 100 ml
fueron preparados.
- Estándar de la leptina: Se preparó 15 minutos antes de usar. El concentrado se
mezcla suavemente y se diluye con 1 ml de agua desionizada. Esta reconstitución
produce una solución stock de 10.000 pg/ml. el estándar de 8 tubos se prepara según lo
explicado arriba (estándar de la prostaglandina).
- Procedimiento del análisis
El plasma congelada fue deshelada y centrifugada a 1000 *g durante 5 minutos
para precipitar los desechos.
- 100 µl del diluyente RD1-19 del análisis fue agregado a todos los posillos.
- 100 µl del estándar se agregaron a cada posillo estándar.
- 100 µl del control fue agregado a todos los posillos seguido por 200 µl de la
muestra. La pipeta de varios canales fue utilizada.
- La placa se cubre y se incuba durante 2 horas a temperatura ambiente.
- Todos los posillos fueron aspirados y lavados con 400 µl del buffer de lavado.
Este proceso se repite 4 veces. En el último lavado, los posillos fueron empernados
contra el papel limpio para quitar cualquier buffer del lavado restante.

Chapter 10 Resumen ampliado
212
- 200 µl de la conjugación de la leptina fue agregado a todos los posillos, la
placa fue cubierta con la nueva tira adhesiva e incubada para 1 hora a temperatura
ambiente.
- Los posillos fueron aspirados y se lavaron como en el paso 5.
- 200 µl de la solución del substrato fue agregado a todos los posillos y la placa
fue incubada durante 30 minutos a temperatura ambiente y protegida contra luz.
- 50 µl de la solución para parar la reacción fueron agregados a todos los
posillos.
- La placa se desarrolló en el plazo de 30 minutos en un agitador y se leyó la
densidad óptica de cada uno usando un lector de microplato fijado a 450 nanómetro.
- Se calcularon los resultados: La curva estándar fue dibujada poniendo la
densidad óptica para los estándares contra la concentración de los estándares.
Los datos se linearon usando una transformación logarítmica. La ecuación de la
curva estándar fue resuelta y la concentración final de la leptina en plasma fue
determinada por el uso simple de su absorbencia en la ecuación estándar de la curva.
10.3.2. Experimento II: Parte del proyecto LINOSALUD
Animales y dietas
Los juveniles de dorada (Sparus aurata) (peso corporal inicial de 45 g) fueron
distribuidos en 45 tanques de 500l (50 peces/tanque, cada dieta fue probada en
triplicado) suministrando agua de mar con una temperatura que se extendía de 20ºC al
principio del experimento a 24.2ºC al final, y la aireación, dos mil doscientos cincuenta
animales fueron utilizados. Ocho dietas iso-energéticas y iso-proteicas con un contenido
en lípidos cerca del 18% fueron formuladas. El aceite de la anchoa era la única fuente el
lípidos en la dieta FO (aceite de pescado). El resto de dietas contuvieron una mezcla de
aceites vegetales para substituir a FO con diversos niveles de substitución según lo
mencionado en las tablas (2.3, 2.4, 2.5). La composición en ácidos grasos de los lípidos
totales de las dietas experimentales se demuestra en tabla 2.6. Los peces fueron

Chapter 10 Resumen ampliado
213
alimentados con las dietas experimentales hasta la saciedad evidente (3 veces/día, 6 días
por semana), hasta que alcanzaran el tamaño comercial después de 26 semanas.
La tasa de alimentación era diario determinado y todos los peces fueron pesados
individualmente mensualmente. Los CI y SGR fueron calculados según las fórmulas
descritas arriba. Las mortalidades fueron registradas diariamente y la supervivencia fue
determinada mensualmente.
Tabla 2.3: Contenido principal de los ingredientes de las dietas experimentales (en %)
% en peso seco
Aceites (Pescadoa/lino/soja)
Harina de pescado suramericano
Trigo
Harina de Soja 47% b
Harina de Girasol
Premix de Vitaminasc
Premix de mineralesc
16.32
47.26
7.00
25.00
3.67
0.27
0.48
a Suramericano, aceite de anchoa. b Harina de Soja con 47% como proteína bruta, “no GMO” c premixes de Vitaminas y minerales preparados según los estándares comerciales de Proaqua A/S.

Chapter 10 Resumen ampliado
214
Tabla 2.4: Contenido en vitaminas y minerales de las dietas experimentales
Vitaminas/ Minerales Unidades
1- Vitaminas A-Retinol D3- Cholecalciferol E- Tocopherol C (Stay C)- Ascorbic acid B1- Thiamin B2- Riboflavin B3- Nicotinic acid/Niacin B5- Panthothenic acid B6- Pyridoxin B8- Biotin B9- Folic acid B12- Cyanocobalamin K- Menadion Inositol 2- Minerales I Zn Fe Cu Mn Mg Co Se
11200.0 IU/kg 112.0 IU/kg 280.0 mg/kg 336.0 mg/kg 9.0 mg/kg 15.7 mg/kg 179.2 mg/kg 31.4 mg/kg 13.4 mg/kg 0.5 mg/kg 4.5 mg/kg 0.036 mg/kg 6.7 mg/kg 44.8 mg/kg 4.5 mg/kg 44.8 mg/kg 67.2 mg/kg 3.6 mg/kg 14.6 mg/kg 136.1 mg/kg 0.2 mg/kg 0.06 mg/kg
Tabla 2.5: Tipo y % de los aceites usados en las dietas
FO 70L 100L 70S 100S 20L50S 50L20S 50L50S
FO 100 30 - 30 - 30 30
LO - 70 100 - - 20 50 50
SO - - - 70 100 50 20 50
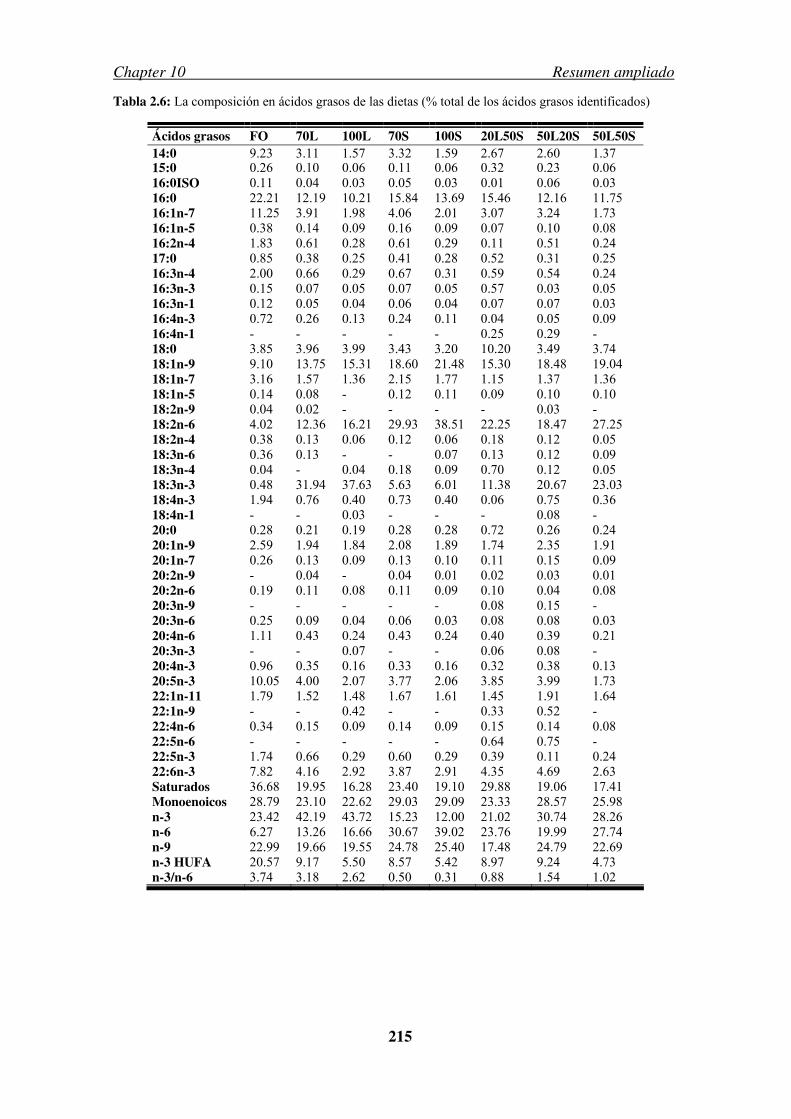
Chapter 10 Resumen ampliado
215
Tabla 2.6: La composición en ácidos grasos de las dietas (% total de los ácidos grasos identificados)
Ácidos grasos FO 70L 100L 70S 100S 20L50S 50L20S 50L50S 14:0 9.23 3.11 1.57 3.32 1.59 2.67 2.60 1.37 15:0 0.26 0.10 0.06 0.11 0.06 0.32 0.23 0.06 16:0ISO 0.11 0.04 0.03 0.05 0.03 0.01 0.06 0.03 16:0 22.21 12.19 10.21 15.84 13.69 15.46 12.16 11.75 16:1n-7 11.25 3.91 1.98 4.06 2.01 3.07 3.24 1.73 16:1n-5 0.38 0.14 0.09 0.16 0.09 0.07 0.10 0.08 16:2n-4 1.83 0.61 0.28 0.61 0.29 0.11 0.51 0.24 17:0 0.85 0.38 0.25 0.41 0.28 0.52 0.31 0.25 16:3n-4 2.00 0.66 0.29 0.67 0.31 0.59 0.54 0.24 16:3n-3 0.15 0.07 0.05 0.07 0.05 0.57 0.03 0.05 16:3n-1 0.12 0.05 0.04 0.06 0.04 0.07 0.07 0.03 16:4n-3 0.72 0.26 0.13 0.24 0.11 0.04 0.05 0.09 16:4n-1 - - - - - 0.25 0.29 - 18:0 3.85 3.96 3.99 3.43 3.20 10.20 3.49 3.74 18:1n-9 9.10 13.75 15.31 18.60 21.48 15.30 18.48 19.04 18:1n-7 3.16 1.57 1.36 2.15 1.77 1.15 1.37 1.36 18:1n-5 0.14 0.08 - 0.12 0.11 0.09 0.10 0.10 18:2n-9 0.04 0.02 - - - - 0.03 - 18:2n-6 4.02 12.36 16.21 29.93 38.51 22.25 18.47 27.25 18:2n-4 0.38 0.13 0.06 0.12 0.06 0.18 0.12 0.05 18:3n-6 0.36 0.13 - - 0.07 0.13 0.12 0.09 18:3n-4 0.04 - 0.04 0.18 0.09 0.70 0.12 0.05 18:3n-3 0.48 31.94 37.63 5.63 6.01 11.38 20.67 23.03 18:4n-3 1.94 0.76 0.40 0.73 0.40 0.06 0.75 0.36 18:4n-1 - - 0.03 - - - 0.08 - 20:0 0.28 0.21 0.19 0.28 0.28 0.72 0.26 0.24 20:1n-9 2.59 1.94 1.84 2.08 1.89 1.74 2.35 1.91 20:1n-7 0.26 0.13 0.09 0.13 0.10 0.11 0.15 0.09 20:2n-9 - 0.04 - 0.04 0.01 0.02 0.03 0.01 20:2n-6 0.19 0.11 0.08 0.11 0.09 0.10 0.04 0.08 20:3n-9 - - - - - 0.08 0.15 - 20:3n-6 0.25 0.09 0.04 0.06 0.03 0.08 0.08 0.03 20:4n-6 1.11 0.43 0.24 0.43 0.24 0.40 0.39 0.21 20:3n-3 - - 0.07 - - 0.06 0.08 - 20:4n-3 0.96 0.35 0.16 0.33 0.16 0.32 0.38 0.13 20:5n-3 10.05 4.00 2.07 3.77 2.06 3.85 3.99 1.73 22:1n-11 1.79 1.52 1.48 1.67 1.61 1.45 1.91 1.64 22:1n-9 - - 0.42 - - 0.33 0.52 - 22:4n-6 0.34 0.15 0.09 0.14 0.09 0.15 0.14 0.08 22:5n-6 - - - - - 0.64 0.75 - 22:5n-3 1.74 0.66 0.29 0.60 0.29 0.39 0.11 0.24 22:6n-3 7.82 4.16 2.92 3.87 2.91 4.35 4.69 2.63 Saturados 36.68 19.95 16.28 23.40 19.10 29.88 19.06 17.41 Monoenoicos 28.79 23.10 22.62 29.03 29.09 23.33 28.57 25.98 n-3 23.42 42.19 43.72 15.23 12.00 21.02 30.74 28.26 n-6 6.27 13.26 16.66 30.67 39.02 23.76 19.99 27.74 n-9 22.99 19.66 19.55 24.78 25.40 17.48 24.79 22.69 n-3 HUFA 20.57 9.17 5.50 8.57 5.42 8.97 9.24 4.73 n-3/n-6 3.74 3.18 2.62 0.50 0.31 0.88 1.54 1.02

Chapter 10 Resumen ampliado
216
Procedimiento del muestreo
Al final del experimento de alimentación (después de 26 semanas), 6 peces fueron
muestreados individualmente de cada tanque. Los peces fueron anestesiados con el
phenoxyethanol 2 (1:1000 v/v), y la sangre fue recogido de las venas caudales con
jeringas heparinizadas a partir de 6 peces por cada tanque (18 peces por dieta) y
transferido a un tubo de eppendorf cubierto con heparina de litio como anticoagulante.
La sangre fue centrifugada inmediatamente a 3000 RPM durante 10 minutos para
sedimentar las células, y el plasma fue guardado a -80 ºC para el análisis del cortisol
basal. Las muestras de músculo, hígado, branquias y de riñón anterior fueron guardadas
al -80ºC para el análisis bioquímico de todos los tratamientos dietéticos.
Preparación y estímulo del tejido de riñón anterior
En el final del período de alimentación, 2 peces fueron tomados aleatoriamente de cada
tanque (6 por dieta) en menos de 1 minuto, anestesiado inmediatamente con el
phenoxyethanol 2 (1: 1000 v/v) y se les saco sangre con una jeringuilla hipodérmica de
la vena caudal para reducir al mínimo la hemorragia durante la extracción. El tejido del
riñón anterior fue quitado a partir de dos peces por cada ensayo de perfusión, y cortado
en fragmentos muy pequeños en el medio de Hepes Ringer, que fue utilizado como el
medio de la perfusión. Luego, la mezcla de los riñones anteriores fue homogenizada y
distribuidos en 8 cámaras de perfusión (con un volumen de 0,2 ml) para obtener una
alícuota homogénea en cada una de ellas. La perfusión de los tejidos fue desarrollada
con una solución de Ringer’s Hepes (pH 7.4) que contenía 171 mM de NaCl, 2 mM de
KCl, 2 mM CaCl2H2O, la glucosa 0.25% (peso/volumen), y la albúmina del suero
bovino del 0.03% (peso/volumen) (Rotllant et al., 2001). La temperatura del sistema fue
controlada a 18 °C y el medio de perfusión fue bombeado a través de una bomba
peristáltica de varios canales de Masterplex L/SR con un flujo constante de 75 µl/min
(col Parmer Intrument Co., Vernon Hills, Illinois).
Los ensayos fueron comenzados después de 3 h de perfusión cuando el cortisol
alcanzó los niveles de una línea basal estable (Rotllant et al., 2000a, b), para evitar las
desviaciones debidas a la diversa dispersión de células interrenales en la preparación de
la perfusión y a las diferencias individuales o al nivel de la pre-estrés de cada pez.
Después del período de la estabilización de 3 h, los tejidos fueron estimulados con la
hormona adrenocorticotrófica (ACTH) con una concentración de 5 nanómetro

Chapter 10 Resumen ampliado
217
hACTH1-39 (sigma) durante 20 min. Posteriormente, las perfusión fue mantenido para
otros 170 minutos, y las muestras de las fracciones fueron recogidas cada 20 minutos
durante este período. En una segunda serie de experimentos para aclarar los
mecanismos de la acción de los HUFAs y la implicación de eicosanoides en este
proceso, los tejidos fueron incubados con un inhibidor de cicloxigenasa (COX)
(indometacina, INDO), o el inhibidor de la lipooxigenasa (LOX) (ácido
Nordihydroguaiaretic, NDGA) durante 20 minutos en una concentración de 25 µM
diluido con el medio de perfusión, y los tejidos fueron estimulados posteriormente con
ACTH como explicado antes y mantenidos para otros 170 minutos recogiendo muestras
cada 20 min. En toda la serie de experimentos, cada tratamiento fue probado por
cuadruplicado. El factor de estimulación del cortisol (SF) fue calculado por la
comparación del cortisol máximo liberado después del estímulo con la ACTH con la
línea basal (liberación máxima-liberación basal) *100/(liberación basal) (Rotllant et al.,
2001).
Los paneles de estrés
Después del período de alimentación, 20 peces por tanque fueron expuestos al
estrés por confinamiento. Así, los peces fueron asignados en grupos de hasta 4
mantenidos en cinco pequeñas jaulas flotantes (50x30x15cm) (figura 2.5). Se sacó
sangre a 4 peces por tanque al principio de las pruebas y fueron considerados como
controles. Las cinco jaulas, conteniendo 4 peces cada una, fueron mantenidas en cada
tanque para diversos intervalos de tiempo, consistiendo para abarcar la respuesta
“temprana” y la “tarde” al factor estresante, basado en las respuestas al estrés primarias
y secundarias del cortisol plasmático. Así, después 2h una jaula por cada tanque fue
extraída cuidadosamente, abierta y se sacó sangre a los peces en menos de 2 minutos de
manejo, la sangre fue obtenido de la puntura caudal del sino con una jeringuilla de
plástico de 1 ml. Las alícuotas de muestras de sangre fueron transferidas
inmediatamente a un tubo de Eppendorf cubierto con heparina de litio como
anticoagulante. El plasma fue obtenido por centrifugación a 3000 RPM durante 10
mínimos y guardado al -80º C para la determinación del cortisol y los peces fueron
liberados. El mismo procedimiento fue repetido después de 5h, 24h, 48h y 1 semana.
Este procedimiento fue tomado para evitar cualquier disturbio agudo a los peces
restantes durante el muestreo de los peces. Así, el tiempo total de la captura fue menos

Chapter 10 Resumen ampliado
218
de 8 minutos por tanque para reducir al mínimo los efectos del estrés de la captura sobre
los parámetros analizados (Sumpter, 1997).
Figura 2.5: Una muestra de la jaula usada para el panel de estrés
Análisis bioquímico
La humedad de las dietas y de los tejidos de peces, la ceniza y la proteína total
fueron determinados en triplicados según la asociación de los métodos descritos por los
analíticos oficiales de los químicos (AOAC). La humedad fue evaporada en un horno de
110 ºC hasta alcanzar un peso constante y la diferencia del peso inicial entonces era
calculada como antes. El contenido proteínico fue calculado del contenido de N según
el método de Khedjal. La muestra fue destilada con NaOH al 40% en el destilador del
sistema de Kejeltek 1003 (Tecator, Höganäs, Suiza). Finalmente, la muestra fue
validada con el ácido clorhídrico (HCl) (1N) medir el contenido de N y el contenido
proteínico fue calculado utilizando un factor de conversión del nitrógeno de 6.75.
La extracción de los lípidos totales de las dietas, músculo, hígado, branquias y
del riñón anterior fue realizada por el método de Folch et al., (1957) como esta
explicado en el experimento anterior.

Chapter 10 Resumen ampliado
219
Análisis del cortisol
La concentración del cortisol en el líquido inundado fue determinada por
radioinmunoanálisis (RIA) (Rotllant et al., 2001). El anticuerpo, Biolink, S.L. (Costa
Mesa, California), fue utilizado en una dilución final del 1:6000. Esta reactividad
cruzada del anticuerpo es 100% con cortisol, 11.40% con el desoxycorticosterone 21,
8.90% con el desoxycortisol 11 y 1.60% con 17α-hydroxyprogesterone. La
radioactividad fue cuantificada usando un contador de centelleo líquido. Los niveles del
cortisol se dan como ng/g/ h.
Análisis estadístico
La significación de la diferencia (P<0.05) entre los tratamientos dietéticos fue
determinado por el análisis de varianza unidireccional (ANOVA) seguido por la prueba
de comparación múltiple de Duncan (Sokal y Rolf 1995). Los análisis fueron realizados
usando el software SPSS (SPSS para Windows 13).
10.4. Resúmenes de los experimentos (4)
Capitulo 3: Efecto de alimentar de la dorada (Sparus aurata) con una mezcla del
aceite de soja y de lino sobre el crecimiento, la utilización del alimento y la
composición en ácidos grasos del pez
Los grupos triplicados de dorada fueron alimentados con ocho dietas de tipo-
práctico en las cuales los lípidos agregados fueron substituidos con una mezcla de aceite
de lino (LO) y del aceite de soja (SO) en diversos niveles por un período de 26 semanas.
El aceite de la anchoa fue la única fuente de lípidos en la dieta FO (aceite de pescado),
mientras que las otras dietas contuvieron diversos niveles de aceites vegetales, 70L (el
70% LO y 30 FO), de 70S (el 70% SO y 30FO), de 100L (el 100% como LO), de 100S
(el 100% como SO), de 50S20L (el 50% SO, el 20% como LO y el 30% como FO), de
20S50L (el 20% SO, el 50% con LO y el 30% con las FO) y de 50S50L (el 50% como
SO y el 50% con LO). Los resultados demostraron que la substitución hasta el 70% o
más del FO por los aceites vegetales en las dietas para dorada, redujeron

Chapter 10 Resumen ampliado
220
significativamente el crecimiento y afectaron la utilización del alimento. Las
composiciones en ácidos grasos de los lípidos del músculo demostraron una correlación
con la inclusión de SO o de LO en la dieta, así las proporciones del 18:2 n-6, del 18:3 n-
3 y del 18:1 n-9 aumentaron todas con el aumento del % VO dietético. Las
concentraciones del ácido eicosapentaenoico (20: 5n-3), ácido docosahexaenoico (22:
6n-3) y ácido araquidónico (20: 4n-6) en los lípido del músculo fueron
significativamente reducidos junto con los ácidos grasos saturados totales, con el
aumento del VO dietético, mientras que los últimos 2 ácidos grasos fueron reducidos
menos en el músculo que en la dieta, indicando su retención selectiva. Los productos de
la elongasa y de la ∆6 destaurasa del ácido linoleico (18: 2n-6) y ácido linolenic (18:
3n-3) también fueron aumentados con el aumento de VOs. La dieta indujo cambios,
aproximadamente similar a los del músculo, en las composiciones en ácidos grasos del
hígado y en las branquias con algunas excepciones. Las fuentes limitadas de aceites de
pescados marinos requieren que los substitutos estén encontrados sin dañar el bienestar
de los peces. Así, LO y SO se pueden utilizar con éxito en la alimentación de la dorada
con niveles menos del 70% de los lípidos dietéticos sin afectar el crecimiento, pero las
reducciones substanciales ocurren en el 20:5 n-3 del músculo, el 22:6 n-3 y el cociente
poliinsaturado de los ácidos grasos n-3/n-6 (PUFA), que darán lugar a reducción de la
calidad del producto final para el consumidor.
Capitulo 4: La respuesta al estrés en doradas (Sparus aurata) mantenidas bajo
condiciones de confinamiento y alimentadas con dietas con diversos niveles de
inclusión del aceite de lino y/o de soja
La respuesta fisiológica a los factores de estrés, incluyendo perfiles hormonales y
sensibilidades asociadas del tejido. El objetivo de este estudio fue evaluar el efecto de
alimentar la dorada (Sparus aurata) con dietas que contenían aceite de lino (LO) y el
aceite de soja (SO) como substituto para el aceite de pescado (FO) y su efecto sobre el
perfil de los ácidos grasos del riñón anterior y el efecto consiguiente sobre la respuesta
al estrés después de una prueba de confinamiento. Los peces fueron alimentados con
diversas dietas con diferentes niveles de substitución, el 0% (FO), el 70% (70LO, 70SO,
20LO50SO y 50LO20SO) y 100% (100LO, 100SO y 50LO50SO) durante 8 meses. Al
final del experimento de alimentación, las muestras para el análisis bioquímico del

Chapter 10 Resumen ampliado
221
riñón anterior fueron recogidas y los peces fueron sometidos a un desafío de
confinamiento. Las muestras de plasma para el análisis del cortisol fueron recogidas en
diversas horas durante la semana de la prueba, de 0h, de 2h, de 5h, de 24h, 48 y 1
semana. Los niveles básales del cortisol fueron significativamente aumentados en los
peces alimentados con 70LO, 100LO y 50LO50SO. La respuesta fisiológica al
confinamiento fue afectada significativamente por la dieta. Después de 2 h de
confinamiento, todos los tratamientos demostraron un cortisol más alto, con los peces
alimentados con 100LO teniendo la máxima respuesta con 131.38 pg/ml comparados
con 50LO20SO cuáles tenían la respuesta más baja del cortisol plasmático con
solamente 18.73 pg/ml. Después de 5h y de 24h, el cortisol plasmático fue reducido en
todos los tratamientos a excepción de 50LO20SO. Después de 48 h de confinamiento, el
cortisol plasmático fue aumentado en todos los tratamientos con el valor máximo
registrado en los peces alimentados con 100LO (72.12 pg/ml). Estos valores fueron
disminuidos después de 1 semana confinamiento en los peces alimentados con FO,
70LO, 100LO y 50L050SO, pero fueron mantenidos en los peces alimentados con
70SO, 100SO, 20LO50SO y 50LO20SO. Los peces alimentados con LO fueron
caracterizados generalmente por una respuesta al estrés más rápida y más fuerte y una
recuperación rápida, mientras que los peces alimentados con SO tenían una respuesta
lenta y una recuperación más larga.
Capitulo 5: Efecto de lípidos dietéticos sobre los perfiles en ácidos grasos del
plasma y la producción de la prostaglandina y de la leptin en dorada (Sparus
aurata)
El objetivo de este estudio fue investigar los efectos de diversos niveles de
substitución del aceite de pescado por aceites vegetales ricos en ácido oleico, linoleico y
linolénico sobre las composiciones en ácidos grasos del plasma y de los leucocitos de la
dorada y la producción de la prostaglandina (PG) y de la leptina. Los juveniles de
dorada con un peso inicial de 24 g fueron alimentados con cuatro dietas experimentales
iso-energética y iso-proteicas durante 281 días. La composición en ácidos grasos de los
lípidos del plasma fue muy afectada por la inclusión de los aceites vegetales (VOs). El
ARA (arachidonate), EPA (eicosapentaenoate) y DHA (docosahexaenoate) fueron
incorporados preferencial en los lípidos polares del plasma, y el DHGLA (di-

Chapter 10 Resumen ampliado
222
homogammalinoleate) fue acumulado con la inclusión creciente de los aceites
vegetales. Los tratamientos dietéticos dieron lugar a alteraciones de los cocientes de
DHGLA/ARA, pero no a ARA/EPA. La producción de la PGE2 derivada del ARA en
plasma no fue afectada por la inclusión de los aceites vegetales, de común acuerdo con
el cociente similar del precursor de eicosanoides (ARA/EPA) en lípidos de los
leucocitos y fosfolípidos totales del plasma de los peces alimentados con los diferentes
tratamientos dietéticos. La alimentación con aceites vegetales lleva a una disminución
de la concentración del EPA lo que a su turno redujo la concentración de la PGE3 en el
plasma. Por otra parte, la PGE3 fue la principal prostaglandina producida en el plasma
de los peces alimentados con FO. Los presentes resultados precisan la importancia del
EPA como precursor de las prostaglandinas en peces marinos, por lo menos para la
función correcta de las células sanguíneas, y correlacionan muy bien con el papel
predominante de este ácido graso en la regulación inmune en esta especie. Una
correlación negativa fue encontrada entre la PGE2 del plasma y la concentración de ls
leptina, sugiriendo que los niveles de circulación de leptina pueden actuar como una
señal metabólica que modula la liberación de la PGE2. El actual estudio ha demostrado
que la inclusión creciente de los aceites vegetales en la dieta para dorada puede afectar
profundamente la composición en ácidos grasos del plasma y de los leucocitos,
especialmente los HUFA (ácidos grasos altamente insaturados), y por lo tanto la
producción de la PGE3, que puede ser una PG importante en plasma. La alteración en la
cantidad y el tipo de PG producidos puede ser por lo menos parcialmente responsable
de los cambios en el sistema inmune y los parámetros de la salud de los peces
alimentados con dietas con la alta inclusión de VO.
Capitulo 6: Modulación de la liberación del cortisol a través de la inducción por la
ACTH por los ácidos grasos poliinsaturados en células interrenales de dorada,
Sparus aurata
Los ácidos grasos altamente insaturados son componentes esenciales de las
membranas celulares de vertebrados y pueden modular diferentes procesos fisiológicos,
incluyendo transporte a través de la membrana, la función del receptor y las actividades
enzimáticas. En dorada, las deficiencias dietéticas en ácidos grasos esenciales para los
peces marinos aumentan los niveles básales del cortisol y alteran el patrón del

Chapter 10 Resumen ampliado
223
liberación del cortisol después del estrés. El objetivo del actual estudio fue aclarar el
efecto de los diversos ácidos grasos esenciales en la producción y la liberación del
cortisol inducido por la hormona adrenocorticotrópica (ACTH) en peces, a través de
estudios in vitro de las células interrenales de dorada mantenidas en perfusión y
incubadas con diferentes tipos de ácidos grasos y de inhibidores de producción de los
eicosanoides. Los resultados demostraron la primera evidencia del efecto de ciertos
ácidos grasos sobre la producción del cortisol por las células interrenales estimuladas
con ACTH en peces. El Tanto el acido araquidónico (ARA) y particularmente el ácido
eicosapentaenoico (EPA) promovieron la producción del cortisol en células interrenales
de la dorada. Por otra parte, la incubación con la indometacina (INDO) redujo la
elevada producción del cortisol inducida por el EPA y ARA, sugiriendo la mediación
por los productos derivados de la ciclooxigenasa. El ácido Docosahexaenoico estimuló
la producción del cortisol en un grado inferior que lo causado por EPA o el ARA, pero
el efecto inhibitorio de INDO no fue tan marcado como lo fue para los otros ácidos
grasos. En cambio, la suplementación con el ácido dihomogamalinoleico redujo la
producción del cortisol, denotando el efecto inhibidor de este ácido graso en la
secreción del cortisol.
Capitulo 7: La liberación del cortisol después de la estimulación con ACTH por el
tejido interrenal del riñon anterior de dorada (Sparus aurata) alimentada con
aceites de lino y de soja
El modo de acción de los ácidos grasos altamente insaturados (HUFA) en la
regulación de la producción por las células interrenales del cortisol de la dorada (Sparus
aurata) fue estudiado con ensayos in vitro usando un sistema dinámico de perfusión.
Los peces fueron alimentados previamente con diversas dietas que contenían varios
niveles de inclusión del aceite de lino (LO) o del aceite de soja (SO) por un período de
26 semanas. Cinco dietas fueron probadas, con el aceite de anchoa como la única fuente
de lípidos para la dieta control (aceite de pescado, FO), dos diversos niveles de la
substitución (70 y 100%) fueron probadas usando los aceites de la lino o de soja (70LO,
70SO, 100LO, 100SO). Las composiciones en ácidos grasos del riñón anterior
reflejaron la inclusión dietética, así EPA, DHA, el ARA y n-3 HUFA estaban
perceptiblemente (P<0.05 ) reducido en peces alimentados con VOs comparados con la

Chapter 10 Resumen ampliado
224
dieta FO. La alimentación con el 70% o el 100% LO aumentó significativamente la
liberación del cortisol en el riñón anterior después del estímulo con la hormona
adrenocorticotrofica (ACTH), mientras que la alimentación con SO disminuyó pero no
significativamente esta respuesta. El factor de estimulación del cortisol fue aumentado
en los peces alimentados con las dietas 70LO y 100LO comparando con el control. Por
otra parte, la inhibición de la producción de los eicosanoides incubando el tejido del
riñón anterior con la indometacina (INDO) como inhibidor de la cicloxigenase, o ácido
nordihydroguaiaretico (NDGA), un inhibidor de la lipooxigenasa, redujo
significativamente (P<0.05 ) la liberación del cortisol después del estímulo con ACTH
en 70LO, 100LO y 100SO. El factor de estimulación del cortisol fue reducido al incubar
el riñón anterior de los tratamientos FO, 70LO y 100LO con INDO o NDGA, mientras
que fue aumentado en 70SO. Este experimento describió la modulación de la liberación
del cortisol por los HUFAs dietéticos y la mediación de la ciclooxigenasa y/o del
lipooxigenasa en su mecanismo de acción.
10.5. Conclusiones (5)
1- Se pueden substituir hasta el 70% del aceite de pescado dietético por los aceites
vegetales en las dietas de engorde para la dorada que contienen el aceite de pescado y
harina de pescado de origen suramericano con un contenido en lípidos de cerca del
17%, sin afectar el crecimiento y la supervivencia. Un porcentaje más alto de la
substitución causa el retraso del crecimiento.
2- Los lípidos de la membrana del plasma y los lípidos totales del músculo, del hígado y
de las branquias de la dorada pueden ser profundamente alterados después de alimentar
con dietas con altos contenidos en aceites vegetales. El contenido de N-3 HUFA en
músculo de peces fue seriamente reducido cuando estan alimentados con VOs, lo que
podría afectar negativamente a su valor alimenticio para el consumo humano. Sin
embargo, la alimentación con VOs afectó la composición en ácidos grasos del hígado de
manera mas alta que en otros tejidos, mientras que los perfiles de los ácidos grasos de
las branquias demostraron el contenido doble del ARA que en los otros tejidos.
3- Hubo una retención selectiva de DHA y ARA en los fosfolípidos del plasma y los
lípidos totales del músculo, hígado y branquias, confirmando su importancia en estos
tejidos.

Chapter 10 Resumen ampliado
225
4- No sólo el ARA, pero también el EPA fue encontrado ser un precursor importante de
las prostaglandinas, y el cociente dietético entre ambos ácidos grasos alteró la
producción de las prostaglandinas, los que puede afectar a numerosas funciones
fisiológicas, algunas de ellas relacionadas con la salud de los peces.
5- La concentración de la leptina del plasma refleja la tasa de alimentación, y no es
afectada significativamente por la alimentación con los VOs.
6- El EPA y ARA como solos ácidos grasos implementados estimulan la liberación del
cortisol estimulado por la ACTH del tejido interrenal de la dorada.
7- El DHA estimuló de manera moderada el tejido interrenal, mientras que el DHGLA
inhibió la liberación del cortisol estimulado por la ACTH del mismo tejido.
8- La ACTH indujo la liberación del cortisol y el papel del ARA y de EPA es mediado
por derivados de la COX y LOX.
9- La ACTH indujo la liberación del cortisol por los HUFAs parecen ser dependientes
de la concentración y el tipo de cada ácido graso.
10- La substitución del FO por LO en las dietas para la dorada estimuló la liberación del
cortisol inducido por la ACTH del tejido interrenal, y es mediado por lo menos en parte
por la COX y LOX. In vivo, la alimentación con el LO aumentó los niveles básales y
post estrés del cortisol en plasma.
11- La alimentación con diferentes tipos de VOs afectó de manera diferente a la
respuesta al estrés, con una respuesta cada vez mayor del cortisol en peces alimentados
con 70LO y 100LO después de la estimulación con ACTH, mientras que el SO
disminuyo esta respuesta. Una suplementación bien equilibrada de estos aceites
dietéticos es importante para regular la liberación del cortisol y la resistencia al estrés.

Chapter 10 Resumen ampliado
226
12- La liberación del cortisol es modulada por los HUFAs dietéticos y esta respuesta es
mediada por los derivados de la COX y/o de la LOX.

List of Publications
227
LIST OF PUBLICATIONS
Ganga, R., Tort, L. Acerete, L., Montero, D. and Izquierdo, M.S. (2006)
Modulation of ACTH-induced cortisol release by polyunsaturated fatty acids in
interregnal cells from gilthead seabream, Sparus aurata. J. Endocrinol., 190:39-45.
Ganga, R., Bell, J.G., Montero, D., Robaina, L., Caballero, M.J. and Izquierdo,
M.S. (2005) Effect of feeding gilthead seabream (Sparus aurata) with vegetable lipid
sources on two potential immunomodulator products: prostanoids and leptins. Comp.
Biochem. Physiol., 142:410-418.
Atalah, E., Hernández-Cruz, C.M., Ganuza, E., Benítez-Sanatana, T., Ganga, R.,
Vegra-Orellana, O., Roo, J., Fernández-Palacios, H. And Izquierdo, M.S. (2009)
Importance of relative levels of dietary ARA and EPA for culture performance of
gilthead sea bream (Sparus aurata). Europ. Aquacul. Soc. Spec. Publ. 38, 171-174.
Ganuza, E., Benítez-Sanatana, T., Atalah, E., Vega-Orellana, O., Ganga, R. and
Izquierdo, M.S. (2008) Crypthecodinium Chin and Schizoch ytrium sp. as potencial
substitutes to fisheries-derived oils from seabream (Sparus aurata) microdiets.
Aquaculture, 277:109-116.
Montero, D., Grasso, V. Izquierdo, M.S., Ganga, R., Real., F., Tort. L.,
Caballero, M.J. and Acosta, F. (2008) Total substitution of fish oil by vegetable oils in
gilthead sea bream (Sparus aurata) diets: effects on hepatic Mx expression and some
immune parameters.. Fish & Shellfish immunol, 24:147-155.
Ganga, R., Montero, D., Vaquero, A., Tort, L. Adn Izquierdo, M.S. (2008)
Effect of feeding vegetable oils on growth and ACTH-induced cortisol release by
interrenal tissue form gilthead seabream, Sparus aurata. XIII International Symposium
of Fish Nutrition and Feeding, June 2008, Florianópolis, Brazil. P.51
Ganga, R., Bell, J.G., Montero, D., Robaina, L., Caballero, M.J. and Izquierdo,
M.S. Effect of dietary lipids on plasma fatty acid profiles and prostaglandin and leptin

List of Publications
228
production in gilthead seabream, Sparus aurata. XII International Symposium of Fish
Nutrition and Feeding, June 2006, Biarritz, France. P.182.
Montero, D., Caballero, M.J., Ganga, R., Mathlouthi, F., Tort, L., Robaina, L.
and Izquierdo, M.S. (2008) Replacing fish oil by vegetable oils in marine fish: an
overview of the effects on fish health. XIII International Symposium of Fish Nutrition
and Feeding, June 2008, Florianópolis, Brazil. P.50
Grasso, V., Montero, D., Izquierdo, M.I., Ganga, R., Real, F., Tort, L., Acosta,
F. and Caballero, M.J. Total substitution of fish oil by vegetable oils in Sparus aurata
diets: Effect on hepatic MX expresión and some immune parameters. XIII International
Symposium of Fish Nutrition and Feeding, June 2008, Florianópolis, Brazil. P.170.
Vega-Orellana, O.M., Ganuza, E., Ganga, R., Benítez-Santana, T., Atalah, E.,
Montero, D. and Izquierdo, M.S. Effect of starvation and confinement stress on the
digestive enzymes of sea bass (Dicentrarchus labrax) juveniles. XIII International
Symposium of Fish Nutrition and Feeding, June 2008, Florianópolis, Brazil. P.205.
Benítez-Santana, T., Juárez-Carrillo, E., Betancor, M.B., Ganuza, E., Atalah, E.,
Vega-Orellana, O., Ganga, R., Hernández-Cruz, C.M. and Izquierdo, M.S. Effect of
dietary fatty acids on growth performance, biochemical composition and behaviour of
Sparus aurata larvae. XIII International Symposium of Fish Nutrition and Feeding,
June 2008, Florianópolis, Brazil. P. 292.
Atalah, E., Hernández-Cruz, C.M., Montero, D., Ganuza, E., Benítez-Sanatana,
T., Ganga, R., Roo, J., Fernández-Palacios, H. and Izquierdo, M.S. Enhancement of
gilthead sea bass larval growth by dietary vitamina E in relation to different levels of
Essentials fatty acids. XIII International Symposium of Fish Nutrition and Feeding,
June 2008, Florianópolis, Brazil. P. 294.
Izquierdo, M.S., Ganga, R., Tort, L., Acerete, L., Montero, D. and Robaina, L.
Modulation of ACTH induced cortisol by polyunsaturated fatty acids in interrenal cells
from gilthead seabream, Sparus aurata. XII International Symposium of Fish Nutrition
and Feeding, June 2006, Biarritz, France. P.51.

Curriculum Vitae
Rachid Ganga was born on December 6th
, 1977 in Sidi Ifni, Morocco. He obtained his
Agronomic Engineer diploma, in Agronomy specialized in marine resources at Hassan
II Agronomic and Veterinary Institute, Rabat 2002. As an undergraduate student he
developed a research study about the socio-economic impact of artisanal fisheries in the
region of Sidi Ifni. After graduation, he was granted by Instituto Agronomico
Mediterraneo de Zaragoza to begin a Masters Degree in Aquaculture at Universidad de
Las Palmas de Gran Canaria. On June 2003 he visited the department of fish nutrition at
the Institute of Aquaculture, University of Stirling (Scotland) for a training period of 10
weeks, analysing samples of sea bream plasma, to determine their PGE2, PGE3 and
Leptins. This training was supervised by Prof. Gordon Bell, and granted by EU project
(RAFOA). Once he finished his Masters on April 2004, Rachid Ganga began his first
PH.D. experiment on June 2004 at the department of Cell Biology, Physiology and
Immunology, Universitat Autonóma de Barcelona, Spain, and on October 2004 he
began an aquaculture program at the University of Las Palmas about feeding vegetables
oils in diets for sea bream and their effects on fish resistance to stress and fish health.
He presented his DEA (Diploma de Estudios Avanzados) on December 2006. During
his PH.D. work, he improved his laboratory skills with a short–course on Fish Welfare
(Aqua TT grant) at the University of Varese (Italy) on September 2005 and a training of
3 months period (January to March 2007) on HPLC techniques at Meakines –
Laboratories, McGill University, Montreal, Canada under the supervision of Prof.
William Powell.
The thesis has been structured and supervised by Prof. Marisol Izquierdo. Through the
entire research period Prof. Gordon Bell was a co-supervisor of the present thesis and
Prof. Lluis Tort participated in the supervision of the in vitro experiment done at
Universitat Autonóma de Barcelona, and in the discussion of all the cortisol results.

Powered by TCPDF (www.tcpdf.org)Powered by TCPDF (www.tcpdf.org)Powered by TCPDF (www.tcpdf.org)