Last Title Description: KEY: AM1=10-11:30am, PM1=1-2:30pm, PM2 ...
Upload
independentCategory
view
2download
0
Aerosol Science 35 (2004) 1151–1172www.elsevier.com/locate/jaerosci
Speciation and origin of PM10 and PM2.5 in Spain
X. Querola ;∗, A. Alastueya, M.M. Vianaa, S. Rodrigueza, B. Artinanob,P. Salvadorb, S. Garcia do Santosc, R. Fernandez Patierc, C.R. Ruizd,J. de la Rosae, A. Sanchez de la Campae, M. Menendezf , J.I. Gilf
aInstituto de Ciencias de la Tierra del CSIC, C/Lluis Sol�e i Sabar��s s/n, 08028 Barcelona, SpainbCIEMAT, Avda. Complutense 22, 28040 Madrid, Spain
cInstituto de Salud Carlos III, Ctra. Majadahonda-Pozuelo, km2, 28220 Majadahonda, SpaindInstituto de Carboqu��mica CSIC, C/Mar��a de Luna, 12, 50015 Zaragoza, Spain
eDpto. de Geolog��a, Univ. Huelva, Campus Universitario de la R�abida, La R�abida, 21819, Huelva, Spainf Dpto. Mineralog��a y Petrolog��a, Universidad del Pa��s Vasco, Aptdo. 644, 48080 Bilbao, Spain
Received 19 January 2004; received in revised form 19 April 2004; accepted 20 April 2004
Abstract
This work summarizes the results of a series of comprehensive studies on particulate matter (PM) carriedout in Spain from 1999 to 2001. Monitoring sites were selected in accordance with di8erent climatic andgeographic conditions as well as anthropogenic in9uences, varying from rural background to urban curb-sidesites. Measurements were carried out with gravimetric high-volume samplers and with automatic devices fordi8erent PM grain sizes, focusing on PM10 and PM2.5. A simultaneous meteorology study was performedto assess the in9uence of air masses and to detect long-range transport processes, especially African dustoutbreaks, a8ecting the PM levels in the Iberian Peninsula and the Canary Islands. Mean values, chemicalcompositions and source apportionment analyses were obtained and discussed as a function of the di8erentmonitoring sites and during PM episodes.? 2004 Elsevier Ltd. All rights reserved.
Keywords: PM10; PM2.5; Chemical speciation; Source apportionment; Ambient air
1. Introduction
Given the close relationship between particulate matter (PM) air pollution and the adverse ef-fects on health reported in several epidemiological studies, the standards for this air pollutant were
∗ Corresponding author. CSIC, Environmental Geochemistry, C/Lluis Sole i Sabaris sn, 08028 Barcelona, Spain.Tel.: +34-934095410; fax: +34-934110012.
E-mail address: [email protected] (X. Querol).
0021-8502/$ - see front matter ? 2004 Elsevier Ltd. All rights reserved.doi:10.1016/j.jaerosci.2004.04.002
1152 X. Querol et al. / Aerosol Science 35 (2004) 1151–1172
reviewed at the end of the 1990s in Europe (Directive 1999/30/EC). The resulting new standardsestablished daily and annual limit values for PM10 (deFned as the mass of particulate matter whichpasses through a size selective impactor inlet with a 50% eHciency cut-o8 at 10 �m aerodynamicdiameter) levels, which will become progressively more restrictive from 2001 to 2010. The suitabil-ity of these criteria is under revision, and both the PM10 limit values and the PM pollution indicatormay be subject to modiFcation.
The monitoring of the airborne particulate matter pollution is fraught with diHculty given thatPM is a complex mixture of substances in solid or liquid states with di8erent properties (e.g. sizedistribution, gas–solid/liquid partitioning, toxicity, etc.) and origins (including natural sources). Theprecise properties that need to be monitored for health protection are still open to discussion (WHO,2003). To date, air quality standards have been deFned in terms of the bulk PM mass concentrationbelow a given cut size (e.g. PM10 & PM2.5 in United States), and the chemical mass balance hasbeen the most commonly used method for assessing PM source contributions (Wilson et al., 2002).
In addition to the local emissions, there are several factors in9uencing PM levels and compositionthat undergo regional variations in Europe. Mineral dust may exert a considerable in9uence onPM levels in areas a8ected by natural dust resuspension, desert dust transport (RodrNOguez, Querol,Alastuey, Kallos, & Kakaliagou, 2001), or low-rainfall rates favoring dust accumulation (e.g. streetsin urban areas). Moreover, long-range transport of pollutants could also have an in9uence on PMlevels of a given area in the Northern EU (TarrasNon et al., 2003). Sea-spray may signiFcantlycontribute to PM levels at coastal sites. Furthermore, temperature and humidity exert an in9uence onthe gas-particle partitioning of low vapor pressure species (e.g. ammonium nitrate and semivolatileorganic species), and consequently on the load of these species in the PM phase (MNeszNaros, 1999and references therein).
The decision taken by the European Commission to revise the standards for PM has led to arenewed interest in the characterization of PM in the di8erent regions of Europe (Putaud et al.,2004) and also to a better understanding of PM pollution problems. This paper presents a summaryof the results obtained from a PM study carried out in di8erent geographical and climatic areas ofSpain, focusing on the PM10 and PM2.5 compositional changes as a function of ambient conditionsand of the type of monitoring site (from rural background to urban curb-side sites). A segregatedchemical mass balance of PM10 & PM2.5 is performed.
2. Methodology
2.1. The study areas
Six geographical zones in Spain were deFned and selected covering di8erent climatic conditionsand anthropogenic activities. Five areas were located in the Iberian Peninsula: (1) Galicia in theNorthwest is a humid and well-ventilated area frequently a8ected by westerly winds and frontalsystems; (2) the Basque Country (Euskadi) adjacent to the Cantabrian coast in the North; (3) theEastern area bordering the Mediterranean sea is dominated by the coastal circulations interactingwith topography frequently resulting in atmospheric layering and recirculation of polluted air masses(Gangoiti, MillNan, Salvador, & Mantilla, 2001; MillNan, Salvador, Mantilla, & Kallos, 1997; MillNanet al., 2000); (4) the Central area in the plateau acts as the core of thermal low-pressure systems in
X. Querol et al. / Aerosol Science 35 (2004) 1151–1172 1153
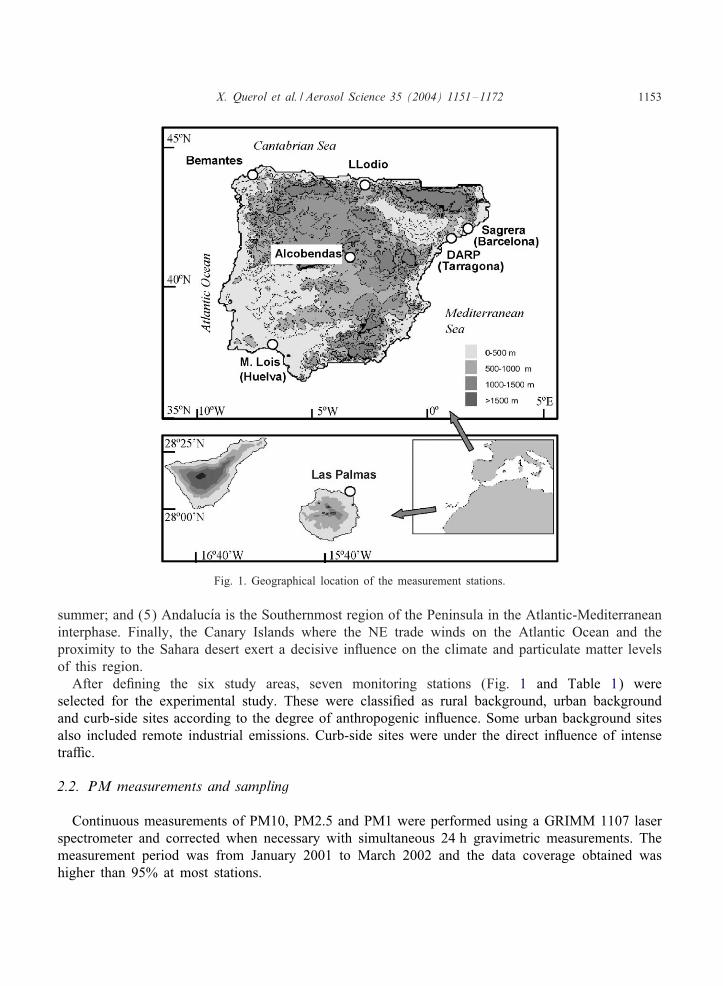
Fig. 1. Geographical location of the measurement stations.
summer; and (5) AndalucNOa is the Southernmost region of the Peninsula in the Atlantic-Mediterraneaninterphase. Finally, the Canary Islands where the NE trade winds on the Atlantic Ocean and theproximity to the Sahara desert exert a decisive in9uence on the climate and particulate matter levelsof this region.
After deFning the six study areas, seven monitoring stations (Fig. 1 and Table 1) wereselected for the experimental study. These were classiFed as rural background, urban backgroundand curb-side sites according to the degree of anthropogenic in9uence. Some urban background sitesalso included remote industrial emissions. Curb-side sites were under the direct in9uence of intensetraHc.
2.2. PM measurements and sampling
Continuous measurements of PM10, PM2.5 and PM1 were performed using a GRIMM 1107 laserspectrometer and corrected when necessary with simultaneous 24 h gravimetric measurements. Themeasurement period was from January 2001 to March 2002 and the data coverage obtained washigher than 95% at most stations.
1154 X. Querol et al. / Aerosol Science 35 (2004) 1151–1172
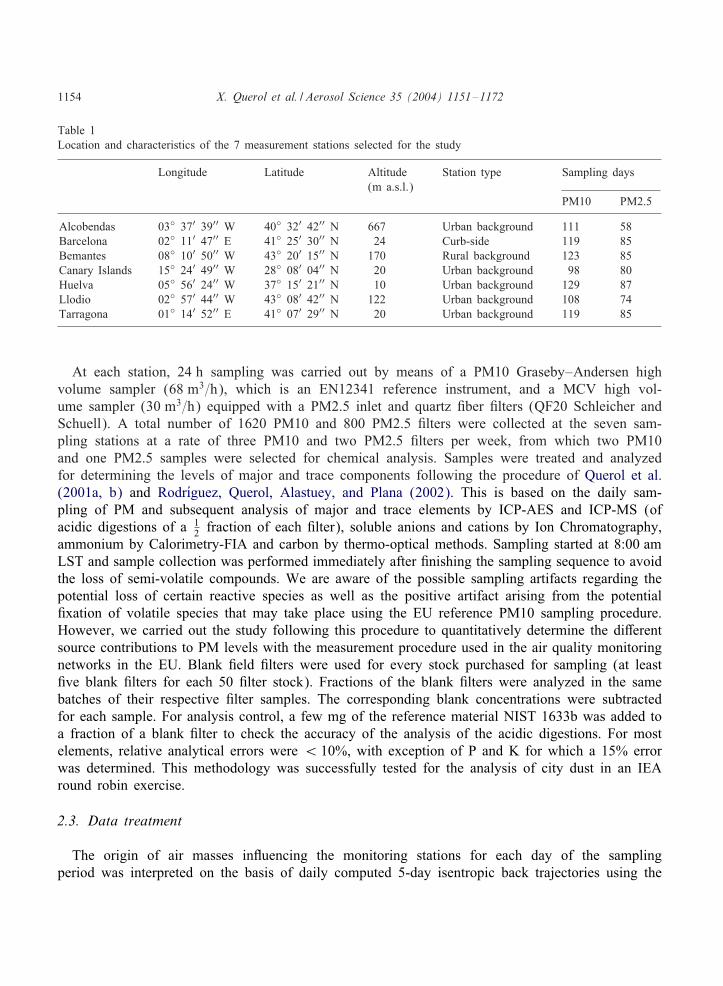
Table 1Location and characteristics of the 7 measurement stations selected for the study
Longitude Latitude Altitude Station type Sampling days(m a.s.l.)
PM10 PM2.5
Alcobendas 03◦ 37′ 39′′ W 40◦ 32′ 42′′ N 667 Urban background 111 58Barcelona 02◦ 11′ 47′′ E 41◦ 25′ 30′′ N 24 Curb-side 119 85Bemantes 08◦ 10′ 50′′ W 43◦ 20′ 15′′ N 170 Rural background 123 85Canary Islands 15◦ 24′ 49′′ W 28◦ 08′ 04′′ N 20 Urban background 98 80Huelva 05◦ 56′ 24′′ W 37◦ 15′ 21′′ N 10 Urban background 129 87Llodio 02◦ 57′ 44′′ W 43◦ 08′ 42′′ N 122 Urban background 108 74Tarragona 01◦ 14′ 52′′ E 41◦ 07′ 29′′ N 20 Urban background 119 85
At each station, 24 h sampling was carried out by means of a PM10 Graseby–Andersen highvolume sampler (68 m3=h), which is an EN12341 reference instrument, and a MCV high vol-ume sampler (30 m3=h) equipped with a PM2.5 inlet and quartz Fber Flters (QF20 Schleicher andSchuell). A total number of 1620 PM10 and 800 PM2.5 Flters were collected at the seven sam-pling stations at a rate of three PM10 and two PM2.5 Flters per week, from which two PM10and one PM2.5 samples were selected for chemical analysis. Samples were treated and analyzedfor determining the levels of major and trace components following the procedure of Querol et al.(2001a, b) and RodrNOguez, Querol, Alastuey, and Plana (2002). This is based on the daily sam-pling of PM and subsequent analysis of major and trace elements by ICP-AES and ICP-MS (ofacidic digestions of a 1
2 fraction of each Flter), soluble anions and cations by Ion Chromatography,ammonium by Calorimetry-FIA and carbon by thermo-optical methods. Sampling started at 8:00 amLST and sample collection was performed immediately after Fnishing the sampling sequence to avoidthe loss of semi-volatile compounds. We are aware of the possible sampling artifacts regarding thepotential loss of certain reactive species as well as the positive artifact arising from the potentialFxation of volatile species that may take place using the EU reference PM10 sampling procedure.However, we carried out the study following this procedure to quantitatively determine the di8erentsource contributions to PM levels with the measurement procedure used in the air quality monitoringnetworks in the EU. Blank Feld Flters were used for every stock purchased for sampling (at leastFve blank Flters for each 50 Flter stock). Fractions of the blank Flters were analyzed in the samebatches of their respective Flter samples. The corresponding blank concentrations were subtractedfor each sample. For analysis control, a few mg of the reference material NIST 1633b was added toa fraction of a blank Flter to check the accuracy of the analysis of the acidic digestions. For mostelements, relative analytical errors were ¡ 10%, with exception of P and K for which a 15% errorwas determined. This methodology was successfully tested for the analysis of city dust in an IEAround robin exercise.
2.3. Data treatment
The origin of air masses in9uencing the monitoring stations for each day of the samplingperiod was interpreted on the basis of daily computed 5-day isentropic back trajectories using the
X. Querol et al. / Aerosol Science 35 (2004) 1151–1172 1155
HYSPLIT model (Draxler & Hess, 1998a, b) and ECMWF synoptic charts (surface and upperlevels). Furthermore, African dust outbreaks a8ecting the Iberian Peninsula were also detected withthe aid of daily TOMS-NASA aerosol index maps, SKIRON (Athens University) and NAAPS(Naval Research Laboratory-Marine Meteorology Division) models dust concentration maps andSeaWIFS-NASA satellite imagery.
Four groups of components were considered: OC+EC (organic plus elemental carbon), mineraldust (Al and Si oxides, CO2−
3 , Ca, Mg, P, Fe, K and some other trace elements), marine (SO2−4 marine,
Cl− and Na) and secondary inorganic phases (SO2−4 non-marine, NH+
4 and NO3).As a Frst approach to the interpretation of the PM sources, we considered a heavy traHc site
located at a major street-canyon. The PM load at such a site may be divided into three di8erentcontributions: contribution from the local traHc from the road on which the site is located, theurban background contribution and that from the regional background. The addition of these threecontributions results in the PM levels recorded at the traHc site (Lenschow et al., 2001). Thus,the PM levels and components (OC+EC, mineral, marine and secondary) measured at a roadsidestation may be broken down into the following contributions: (1) regional background; (2) citybackground (background levels of emissions such as traHc, construction, demolition and domesticheating); and (3) road traHc contribution (motor emissions and tire, pavement and brakes abrasionproducts) exclusively from the street-canyon where the station is located.
A varimax rotated Factor Analysis was also performed to identify the main sources a8ecting thePM composition at each sampling site. The factors with eigenvalues greater than one were extractedand identiFed as particle sources, based on the interpretation of their loadings. After the identiFcationof the main sources, the respective quantitative contributions were derived using the methodologydescribed by Thurston and Spengler (1985). Multilinear Regression Analysis was applied, using PMconcentration values as the dependent variable and absolute factor scores as independent variables.Estimations of the daily source contributions were obtained as the product of the daily absolutefactor scores and the multi-linear regression coeHcients.
3. Results and discussion
3.1. PM levels and components
In addition to the 2001 data presented in this study for Tarragona, Barcelona, Bemantes (ACoruna), Llodio (Alava), Huelva, Las Palmas de Gran Canaria and Alcobendas (Madrid), Fndingsfrom prior studies (mid-1999 to mid-2000), obtained by using the same sampling and analyticalmethodology, were also included in the discussion for a better spatial and sitting coverage. Theseadditional data were collected at roadside sites from Madrid-Escuelas Aguirre (ArtNOnano, Salvador,Alonso, Querol, & Alastuey, 2003) and L’Hospitalet-Barcelona (Querol et al., 2001b) and at a ruralbackground site (Monagrega, RodrNOguez et al., 2002).
3.1.1. PM levelsTable 2 shows the annual mean of PM10 and PM2.5 levels and their components according to
the type of station. Based on these data, on the aforementioned studies and on those from the 2001
1156 X. Querol et al. / Aerosol Science 35 (2004) 1151–1172
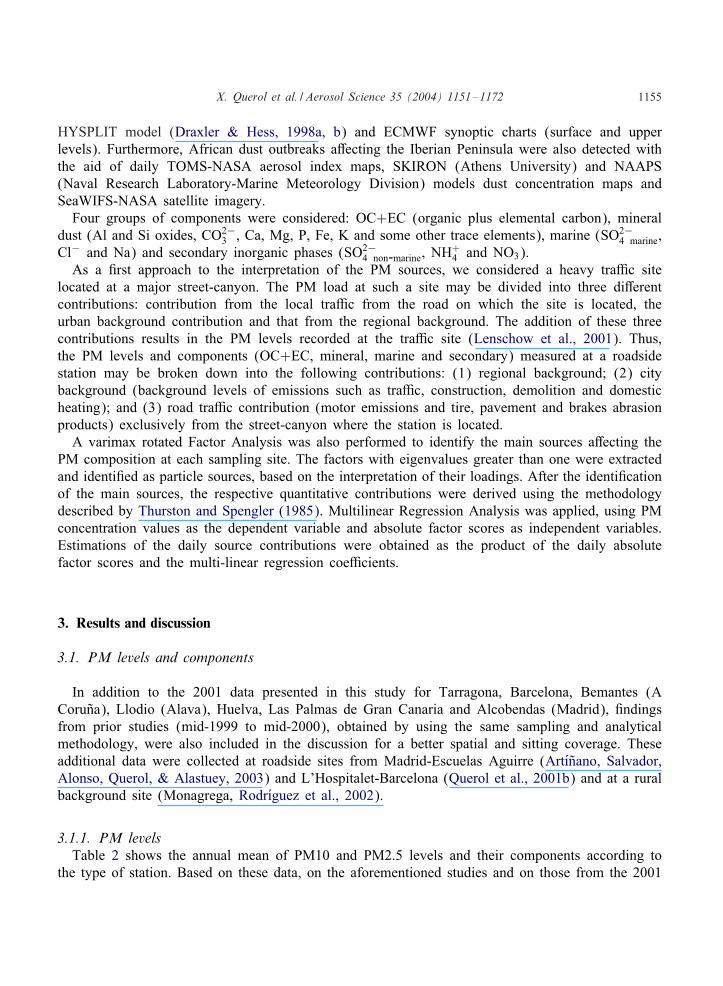
Table 2PM10 and PM2.5 composition in di8erent sites from Spain
Monagrega Bemantes Tarragona Huelva Alcobendas Llodio Canary Madrid L’Hospitalet BarcelonaRural background Urban background stations Curb-side sites
Year 1999–2000 2001 2001 2001 2001 2001 2001 1999–2000 1999–2000 2001
PM10 (�g=m3) 20.7 18.9 37.4 37.5 32.2 31.7 44.4 47.7 49.8 46.2N 132 87 88 91 84 85 88 69 115 90OC+EC 2.1 4.2 7.3 5.3 8.7 6.8 6.6 15.1 11.1 9.4Mineral 5.2 2.5 9.2 11.8 8.6 7.3 11.6 15.2 12.9 15.2Marine 0.7 2.6 2.3 2.8 1.2 2.3 11.5 0.8 2.3 2.4Unaccounted 5.2 4.4 8.4 9.7 7.3 6.7 9.8 8.9 8.2 8.4Secondary 7.5 5.2 10.2 7.9 6.4 8.7 4.9 7.7 15.3 10.8inorganicnmSO2−
4 3.7 3 4.9 4.7 2.9 5.4 2.7 4.4 6.8 4.9NO−
3 2.5 0.9 3.9 1.8 2 1.5 1.6 2.1 5.8 3.9NH+
4 1.3 1.3 1.5 1.5 1.5 1.6 0.8 1.2 2.7 2
PM2,5 (�g=m3) ND 13.5 21.8 19.3 24.9 23.9 18.4 34.1 34.5 27.6N 45 43 49 34 44 47 38 63 45OC+EC ND 3.8 6.5 5.0 9.3 6.9 6.6 14.4 11.2 10.2Mineral ND 1.5 1.9 2.7 2.7 2.3 3 5.6 4.2 4.2Marine ND 1 1 0.8 0.6 1.2 1.6 0.5 0.9 0.7Unaccounted ND 2.8 5.2 5.3 7.0 6.1 4.2 7.1 5.2 4.2Secondary ND 4.4 7.2 5.5 5.3 7.4 3 6.5 13 8.3inorganicnmSO2−
4 ND 2.9 3.9 3.6 2.7 4.9 1.9 3.8 5.8 4.2NO−
3 ND 0.4 1.9 0.5 1.3 0.8 0.4 1.3 4 2.3NH+
4 ND 1.2 1.4 1.4 1.4 1.7 0.7 1.4 3.2 2.0
N , number of samples; OC+EC, organic + elemental carbon; nmSO2−4 , non-marine sulfate, ND: no data.
regional background stations of the Spanish EMEP network, the ranges of PM10 and PM2.5 levelsin Spain for the three station categories may be summarized as follows:
• Regional background levels of PM are close to 15 �g PM10=m3 in the Atlantic regions and20 �gPM10=m3 in the other regions, and 9–14 �g PM2:5=m3 for the whole territory.
• Urban background levels of PM10 and PM2.5 range from 30 to 40 and from 17 to 25 �g=m3,respectively.
• At roadside stations, PM10 and PM2.5 levels range between 45 and 50, and 25 and 35 �g=m3,respectively.
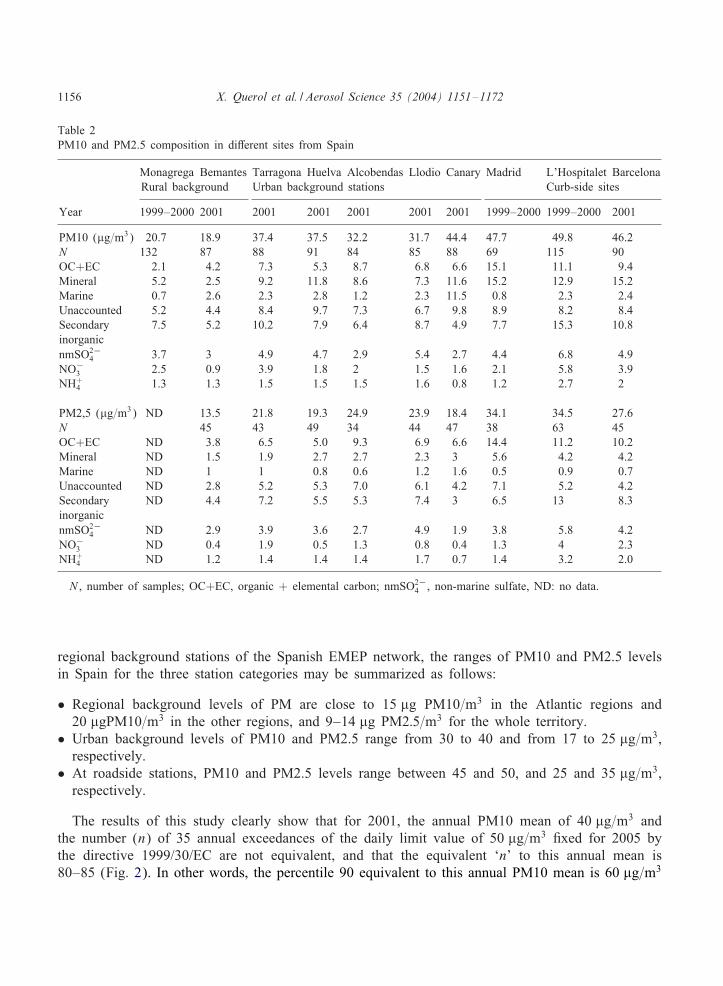
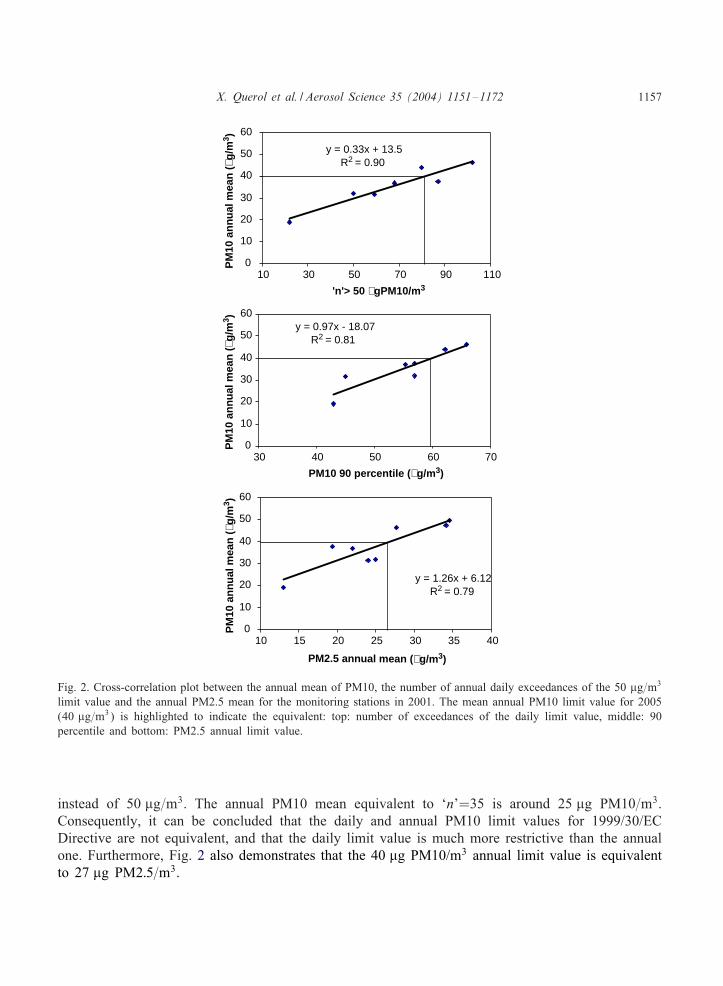
The results of this study clearly show that for 2001, the annual PM10 mean of 40 �g=m3 andthe number (n) of 35 annual exceedances of the daily limit value of 50 �g=m3 Fxed for 2005 bythe directive 1999/30/EC are not equivalent, and that the equivalent ‘n’ to this annual mean is80–85 (Fig. 2). In other words, the percentile 90 equivalent to this annual PM10 mean is 60 �g=m3
X. Querol et al. / Aerosol Science 35 (2004) 1151–1172 1157
y = 1.26x + 6.12R2 = 0.79
0
10
20
30
40
50
60
10 15 20 25 30 35 40
PM2.5 annual mean (µg/m3)
PM
10 a
nn
ual
mea
n (
µg/m
3 )
y = 0.33x + 13.5R2 = 0.90
0
10
20
30
40
50
60
10 30 50 70 90 110
'n'> 50 µgPM10/m3
PM
10 a
nn
ual
mea
n (
µg/m
3 )
y = 0.97x - 18.07R2 = 0.81
0
10
20
30
40
50
60
30 40 50 60 70
PM10 90 percentile (µg/m3)
PM
10 a
nn
ual
mea
n (
µg/m
3 )
Fig. 2. Cross-correlation plot between the annual mean of PM10, the number of annual daily exceedances of the 50 �g=m3
limit value and the annual PM2.5 mean for the monitoring stations in 2001. The mean annual PM10 limit value for 2005(40 �g=m3) is highlighted to indicate the equivalent: top: number of exceedances of the daily limit value, middle: 90percentile and bottom: PM2.5 annual limit value.
instead of 50 �g=m3. The annual PM10 mean equivalent to ‘n’=35 is around 25 �g PM10=m3.Consequently, it can be concluded that the daily and annual PM10 limit values for 1999/30/ECDirective are not equivalent, and that the daily limit value is much more restrictive than the annualone. Furthermore, Fig. 2 also demonstrates that the 40 �g PM10/m3 annual limit value is equivalentto 27 �g PM2:5=m3.
1158 X. Querol et al. / Aerosol Science 35 (2004) 1151–1172
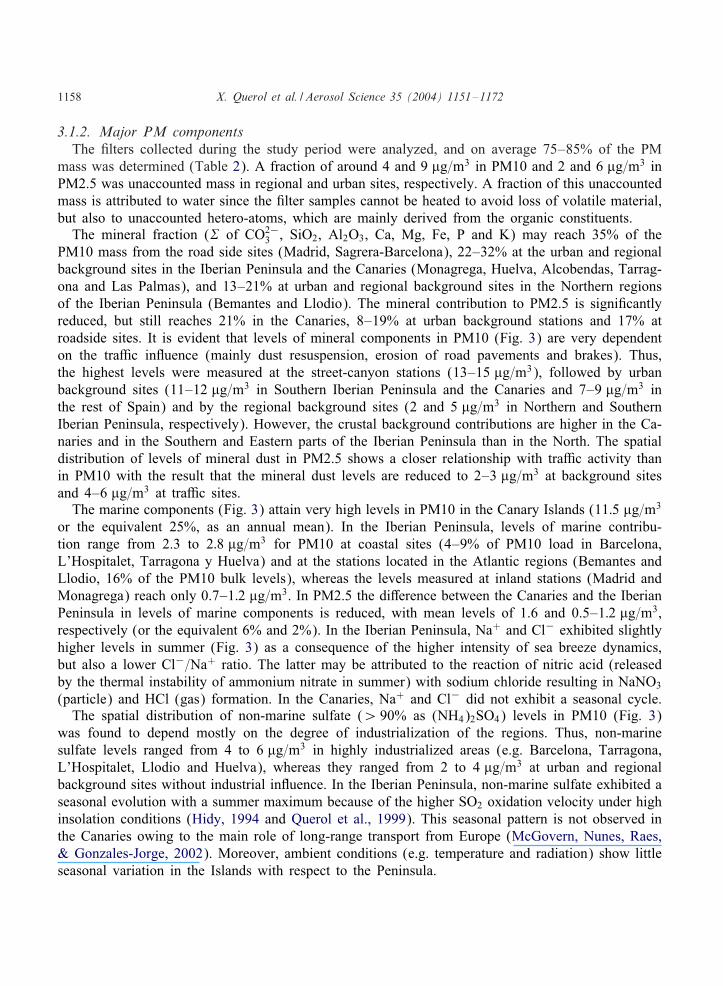
3.1.2. Major PM componentsThe Flters collected during the study period were analyzed, and on average 75–85% of the PM
mass was determined (Table 2). A fraction of around 4 and 9 �g=m3 in PM10 and 2 and 6 �g=m3 inPM2.5 was unaccounted mass in regional and urban sites, respectively. A fraction of this unaccountedmass is attributed to water since the Flter samples cannot be heated to avoid loss of volatile material,but also to unaccounted hetero-atoms, which are mainly derived from the organic constituents.
The mineral fraction (� of CO2−3 , SiO2, Al2O3, Ca, Mg, Fe, P and K) may reach 35% of the
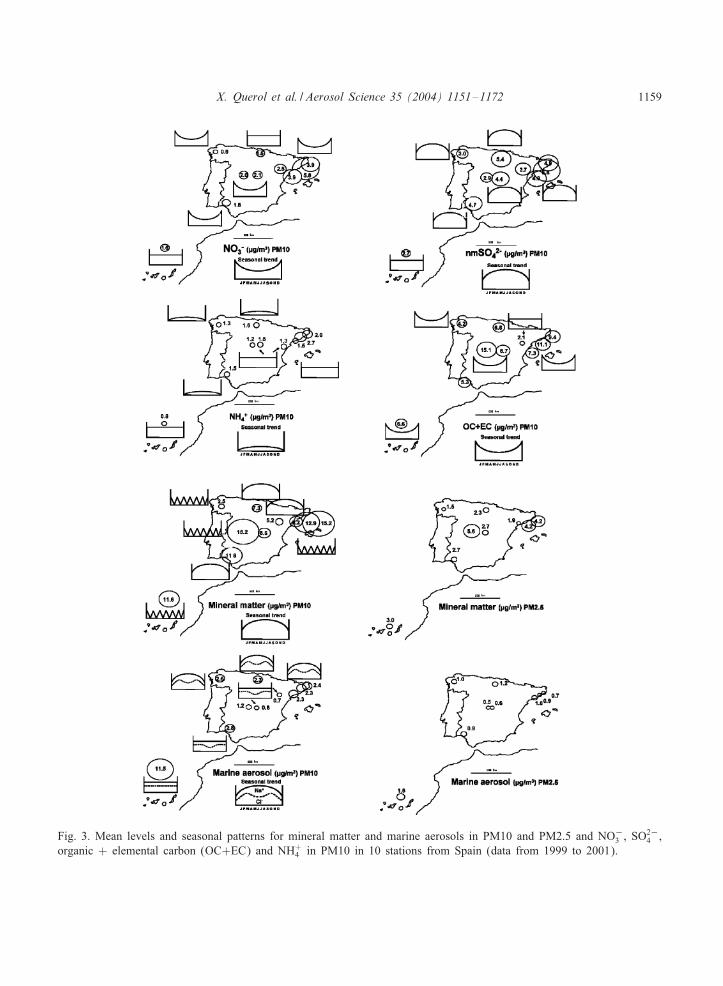
PM10 mass from the road side sites (Madrid, Sagrera-Barcelona), 22–32% at the urban and regionalbackground sites in the Iberian Peninsula and the Canaries (Monagrega, Huelva, Alcobendas, Tarrag-ona and Las Palmas), and 13–21% at urban and regional background sites in the Northern regionsof the Iberian Peninsula (Bemantes and Llodio). The mineral contribution to PM2.5 is signiFcantlyreduced, but still reaches 21% in the Canaries, 8–19% at urban background stations and 17% atroadside sites. It is evident that levels of mineral components in PM10 (Fig. 3) are very dependenton the traHc in9uence (mainly dust resuspension, erosion of road pavements and brakes). Thus,the highest levels were measured at the street-canyon stations (13–15 �g=m3), followed by urbanbackground sites (11–12 �g=m3 in Southern Iberian Peninsula and the Canaries and 7–9 �g=m3 inthe rest of Spain) and by the regional background sites (2 and 5 �g=m3 in Northern and SouthernIberian Peninsula, respectively). However, the crustal background contributions are higher in the Ca-naries and in the Southern and Eastern parts of the Iberian Peninsula than in the North. The spatialdistribution of levels of mineral dust in PM2.5 shows a closer relationship with traHc activity thanin PM10 with the result that the mineral dust levels are reduced to 2–3 �g=m3 at background sitesand 4–6 �g=m3 at traHc sites.
The marine components (Fig. 3) attain very high levels in PM10 in the Canary Islands (11:5 �g=m3
or the equivalent 25%, as an annual mean). In the Iberian Peninsula, levels of marine contribu-tion range from 2.3 to 2:8 �g=m3 for PM10 at coastal sites (4–9% of PM10 load in Barcelona,L’Hospitalet, Tarragona y Huelva) and at the stations located in the Atlantic regions (Bemantes andLlodio, 16% of the PM10 bulk levels), whereas the levels measured at inland stations (Madrid andMonagrega) reach only 0.7–1:2 �g=m3. In PM2.5 the di8erence between the Canaries and the IberianPeninsula in levels of marine components is reduced, with mean levels of 1.6 and 0.5–1:2 �g=m3,respectively (or the equivalent 6% and 2%). In the Iberian Peninsula, Na+ and Cl− exhibited slightlyhigher levels in summer (Fig. 3) as a consequence of the higher intensity of sea breeze dynamics,but also a lower Cl−=Na+ ratio. The latter may be attributed to the reaction of nitric acid (releasedby the thermal instability of ammonium nitrate in summer) with sodium chloride resulting in NaNO3
(particle) and HCl (gas) formation. In the Canaries, Na+ and Cl− did not exhibit a seasonal cycle.The spatial distribution of non-marine sulfate (¿ 90% as (NH4)2SO4) levels in PM10 (Fig. 3)
was found to depend mostly on the degree of industrialization of the regions. Thus, non-marinesulfate levels ranged from 4 to 6 �g=m3 in highly industrialized areas (e.g. Barcelona, Tarragona,L’Hospitalet, Llodio and Huelva), whereas they ranged from 2 to 4 �g=m3 at urban and regionalbackground sites without industrial in9uence. In the Iberian Peninsula, non-marine sulfate exhibited aseasonal evolution with a summer maximum because of the higher SO2 oxidation velocity under highinsolation conditions (Hidy, 1994 and Querol et al., 1999). This seasonal pattern is not observed inthe Canaries owing to the main role of long-range transport from Europe (McGovern, Nunes, Raes,& Gonzales-Jorge, 2002). Moreover, ambient conditions (e.g. temperature and radiation) show littleseasonal variation in the Islands with respect to the Peninsula.
X. Querol et al. / Aerosol Science 35 (2004) 1151–1172 1159
Fig. 3. Mean levels and seasonal patterns for mineral matter and marine aerosols in PM10 and PM2.5 and NO−3 , SO2−
4 ,organic + elemental carbon (OC+EC) and NH+
4 in PM10 in 10 stations from Spain (data from 1999 to 2001).
1160 X. Querol et al. / Aerosol Science 35 (2004) 1151–1172
A clear spatial gradient was observed for the levels of nitrate in PM10 (Fig. 3), with no signiF-cant relationship with the distribution of emission sources. Thus, the mean annual levels of nitratemeasured range from 0.9 to 1:8 �g=m3 for the Atlantic (Las Palmas, Bemantes, Huelva, and Llodio),from 2.0 to 2:5 �g=m3 for Central (Monagrega, Madrid, Alcobendas) and from 3.9 to 5:8 �g=m3 forthe Mediterranean (Barcelona, L’Hospitalet and Tarragona) regions. This spatial distribution showsa low relationship with road traHc or industrial density given that sites with similar industrial devel-opment (Huelva and Tarragona) have very di8erent nitrate levels. The above spatial gradient maybe related to one or both for the following reasons:
(a) The relatively low dispersive atmospheric conditions prevailing in the Mediterranean basin(MillNan et al., 1997) compared with those in the Atlantic regions (the latter characterized by frequentAtlantic advection).
(b) Higher ammonia (NH3) emissions in the Eastern regions. The presence of this gas has beencited as the major cause for high ammonium nitrate levels in central Europe. Ambient air NH3
levels were not measured, but it should be pointed out that the highest mean annual concentrationsof NH+
4 were measured at the Barcelona and L’Hospitalet sites (2.0–2:7 �g=m3 with respect to0.8–1:6 �g=m3 at the other sites).
Nitrate exhibited a marked seasonal evolution characterized by a summer minimum at all siteswith the exception of the Canaries and Llodio (Fig. 3). This seasonal trend is attributed to the lowthermal stability of ammonium nitrate in the warm season (Stelson, Friedlender, & Seinfeld, 1979;MNeszNaros and HorvNath, 1984; Willison, Clarke, & Zeki, 1985; Seidl et al., 1996). Higher nitratelevels in winter are favored by the higher stability of ammonium nitrate (in cool conditions) and thereduced dispersive conditions in the boundary layer. In the Canaries the lower seasonal temperaturecontrast reduces the changes in nitrate levels to a minimum. At Llodio, the seasonal trend of nitrateis less abrupt probably as a consequence of the signiFcant summer breeze transport of atmosphericpollutants from the coastal industrial zones along the NerviNon valley.
Levels of organic and elemental carbon (OC+EC, Fig. 3) are higher (10–15 �g=m3) at street-canyon stations (Madrid, Barcelona and L’Hospitalet), intermediate at urban background stations(5–9 �g=m3; Llodio, Tarragona, Huelva, Las Palmas and Alcobendas), and lower at the regionalbackground sites (2–4 �g=m3). The seasonal trend of levels of OC+EC presents a winter maxi-mum as a consequence of the lower atmospheric dispersion in the Iberian Peninsula and in theCanaries.
The above described spatial variation for OC+EC and secondary inorganic species in PM10also applies to PM2.5. However, it should be pointed out that lower NO−
3 levels were recordedin PM2.5 than in PM10, mainly in summer. This is mainly because of the occurrence of NaNO3
and/or Ca(NO3)2 in the 2.5–10 �m fraction. The proportion of sodium and calcium nitrate over bulknitrate levels is higher in summer due to the lower thermal stability of ammonium nitrate, and theconsequent prevalence of nitric acid. Most of the nitrate in PM10 occurs as sodium nitrate owingto the high Na+ concentrations in the Canaries.
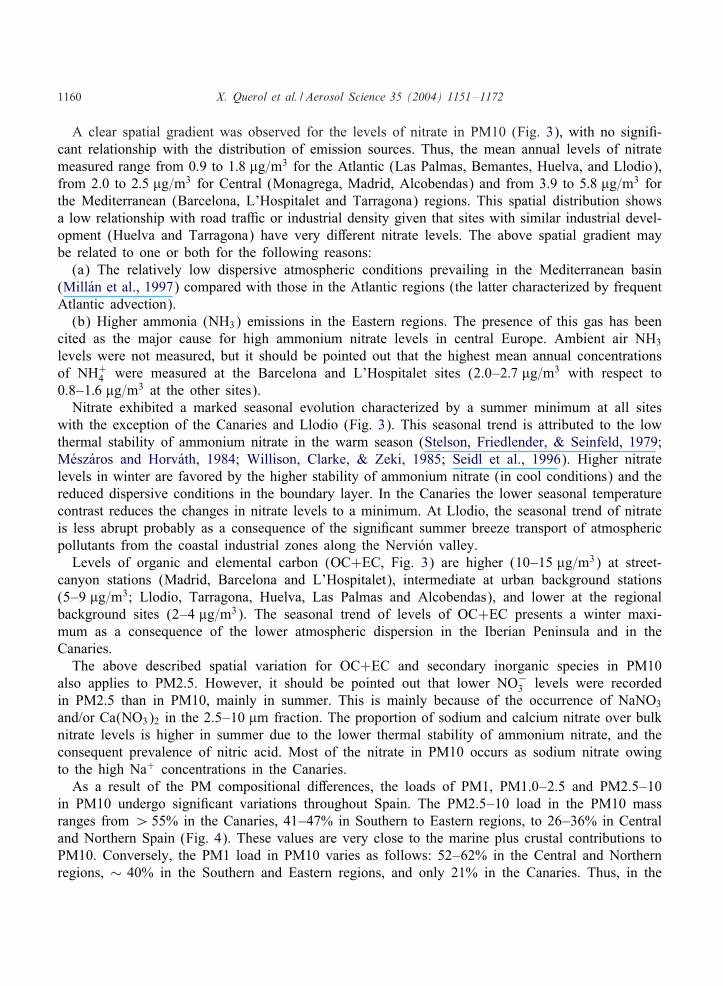
As a result of the PM compositional di8erences, the loads of PM1, PM1.0–2.5 and PM2.5–10in PM10 undergo signiFcant variations throughout Spain. The PM2.5–10 load in the PM10 massranges from ¿ 55% in the Canaries, 41–47% in Southern to Eastern regions, to 26–36% in Centraland Northern Spain (Fig. 4). These values are very close to the marine plus crustal contributions toPM10. Conversely, the PM1 load in PM10 varies as follows: 52–62% in the Central and Northernregions, ∼ 40% in the Southern and Eastern regions, and only 21% in the Canaries. Thus, in the
X. Querol et al. / Aerosol Science 35 (2004) 1151–1172 1161
Fig. 4. Annual (2001) mass contributions of PM1, PM1–2.5 and PM2.5–10 in PM10, (January to December 2001)recorded in seven measurement sites of Spain.
Northern regions, the PM1/PM10 ratios are 50% higher than those in Southern and Eastern regions,and up to three times higher than those in the Canaries.
Slightly higher concentrations of ammonium were obtained in PM2.5 than in PM10 (simultaneoussampling) because of losses of NH4Cl (gas) from the PM10 Flter during the sampling (NH4NO3 +NaCl → NaNO3 (particle) + NH4Cl (gas)). This negative artifact is much less pronounced in thePM2.5 Flter given the major coarse mode of occurrence of NaCl (mostly retained by the impactorinlet).
3.1.3. Trace elementsLevels of trace elements were relatively low at all sites (Tables 3 and 4). Pb levels in PM10
were in the range 20–100 ng=m3 at urban and industrial sites and 8 ng=m3 at the Bemantes ruralbackground site (¡ 500 ng=m3, the EU limit value for 2010). The highest levels of Sn, Zn, Mn, Ni,Cr and Mo were recorded at Llodio (4–20 times higher than at the other sites) probably becauseof the emissions from steel and paint plants located near this site. Similarly, the highest levels ofCu and As were recorded at Huelva (3–5 times higher than at the other sites), probably because ofthe emissions from the nearby metallurgical industry. Levels of V measured in Barcelona are threetimes higher with respect to the other sites probably because of the in9uence of the emissions of anearby fuel-oil power plant.
1162 X. Querol et al. / Aerosol Science 35 (2004) 1151–1172
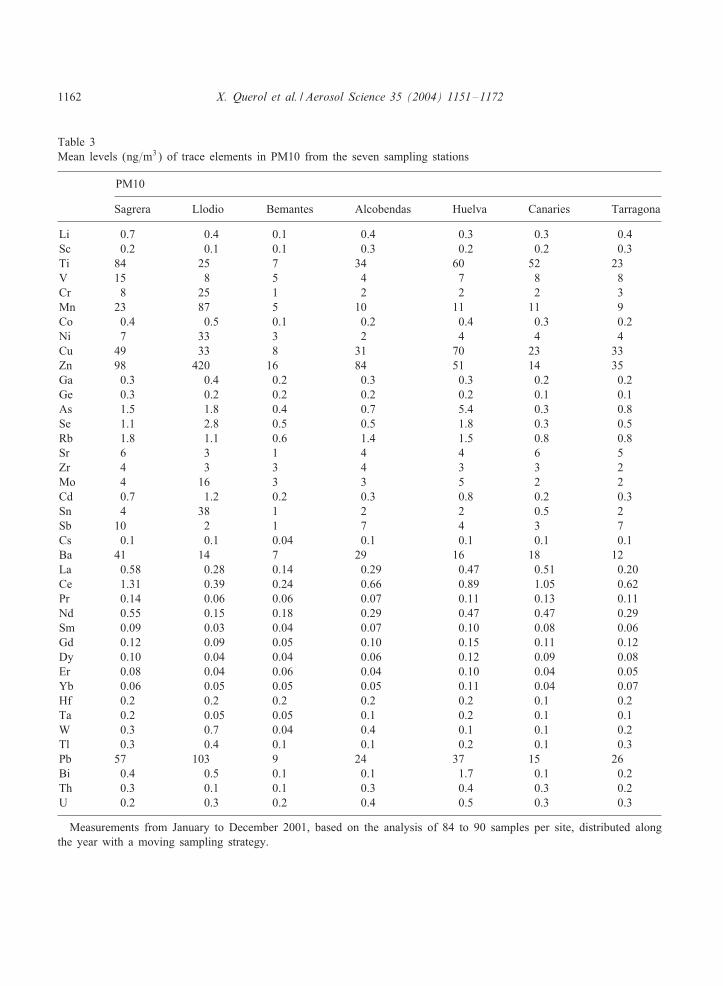
Table 3Mean levels (ng=m3) of trace elements in PM10 from the seven sampling stations
PM10
Sagrera Llodio Bemantes Alcobendas Huelva Canaries Tarragona
Li 0.7 0.4 0.1 0.4 0.3 0.3 0.4Sc 0.2 0.1 0.1 0.3 0.2 0.2 0.3Ti 84 25 7 34 60 52 23V 15 8 5 4 7 8 8Cr 8 25 1 2 2 2 3Mn 23 87 5 10 11 11 9Co 0.4 0.5 0.1 0.2 0.4 0.3 0.2Ni 7 33 3 2 4 4 4Cu 49 33 8 31 70 23 33Zn 98 420 16 84 51 14 35Ga 0.3 0.4 0.2 0.3 0.3 0.2 0.2Ge 0.3 0.2 0.2 0.2 0.2 0.1 0.1As 1.5 1.8 0.4 0.7 5.4 0.3 0.8Se 1.1 2.8 0.5 0.5 1.8 0.3 0.5Rb 1.8 1.1 0.6 1.4 1.5 0.8 0.8Sr 6 3 1 4 4 6 5Zr 4 3 3 4 3 3 2Mo 4 16 3 3 5 2 2Cd 0.7 1.2 0.2 0.3 0.8 0.2 0.3Sn 4 38 1 2 2 0.5 2Sb 10 2 1 7 4 3 7Cs 0.1 0.1 0.04 0.1 0.1 0.1 0.1Ba 41 14 7 29 16 18 12La 0.58 0.28 0.14 0.29 0.47 0.51 0.20Ce 1.31 0.39 0.24 0.66 0.89 1.05 0.62Pr 0.14 0.06 0.06 0.07 0.11 0.13 0.11Nd 0.55 0.15 0.18 0.29 0.47 0.47 0.29Sm 0.09 0.03 0.04 0.07 0.10 0.08 0.06Gd 0.12 0.09 0.05 0.10 0.15 0.11 0.12Dy 0.10 0.04 0.04 0.06 0.12 0.09 0.08Er 0.08 0.04 0.06 0.04 0.10 0.04 0.05Yb 0.06 0.05 0.05 0.05 0.11 0.04 0.07Hf 0.2 0.2 0.2 0.2 0.2 0.1 0.2Ta 0.2 0.05 0.05 0.1 0.2 0.1 0.1W 0.3 0.7 0.04 0.4 0.1 0.1 0.2Tl 0.3 0.4 0.1 0.1 0.2 0.1 0.3Pb 57 103 9 24 37 15 26Bi 0.4 0.5 0.1 0.1 1.7 0.1 0.2Th 0.3 0.1 0.1 0.3 0.4 0.3 0.2U 0.2 0.3 0.2 0.4 0.5 0.3 0.3
Measurements from January to December 2001, based on the analysis of 84 to 90 samples per site, distributed alongthe year with a moving sampling strategy.
X. Querol et al. / Aerosol Science 35 (2004) 1151–1172 1163
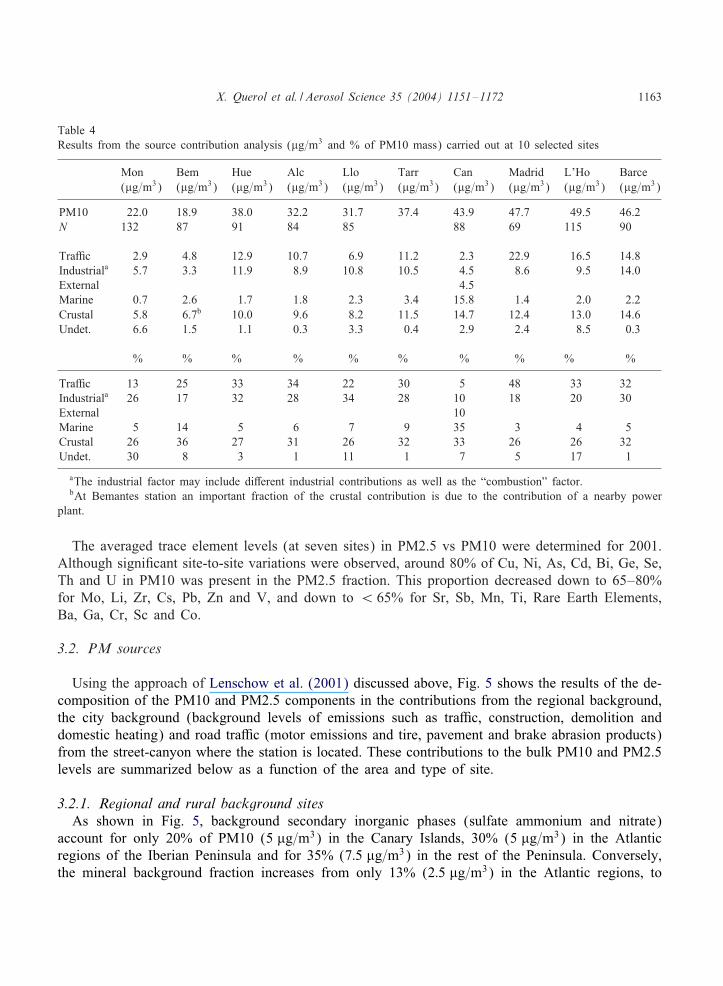
Table 4Results from the source contribution analysis (�g=m3 and % of PM10 mass) carried out at 10 selected sites
Mon Bem Hue Alc Llo Tarr Can Madrid L’Ho Barce(�g=m3) (�g=m3) (�g=m3) (�g=m3) (�g=m3) (�g=m3) (�g=m3) (�g=m3) (�g=m3) (�g=m3)
PM10 22.0 18.9 38.0 32.2 31.7 37.4 43.9 47.7 49.5 46.2N 132 87 91 84 85 88 69 115 90
TraHc 2.9 4.8 12.9 10.7 6.9 11.2 2.3 22.9 16.5 14.8Industriala 5.7 3.3 11.9 8.9 10.8 10.5 4.5 8.6 9.5 14.0External 4.5Marine 0.7 2.6 1.7 1.8 2.3 3.4 15.8 1.4 2.0 2.2Crustal 5.8 6.7b 10.0 9.6 8.2 11.5 14.7 12.4 13.0 14.6Undet. 6.6 1.5 1.1 0.3 3.3 0.4 2.9 2.4 8.5 0.3
% % % % % % % % % %
TraHc 13 25 33 34 22 30 5 48 33 32Industriala 26 17 32 28 34 28 10 18 20 30External 10Marine 5 14 5 6 7 9 35 3 4 5Crustal 26 36 27 31 26 32 33 26 26 32Undet. 30 8 3 1 11 1 7 5 17 1
aThe industrial factor may include di8erent industrial contributions as well as the “combustion” factor.bAt Bemantes station an important fraction of the crustal contribution is due to the contribution of a nearby power
plant.
The averaged trace element levels (at seven sites) in PM2.5 vs PM10 were determined for 2001.Although signiFcant site-to-site variations were observed, around 80% of Cu, Ni, As, Cd, Bi, Ge, Se,Th and U in PM10 was present in the PM2.5 fraction. This proportion decreased down to 65–80%for Mo, Li, Zr, Cs, Pb, Zn and V, and down to ¡ 65% for Sr, Sb, Mn, Ti, Rare Earth Elements,Ba, Ga, Cr, Sc and Co.
3.2. PM sources
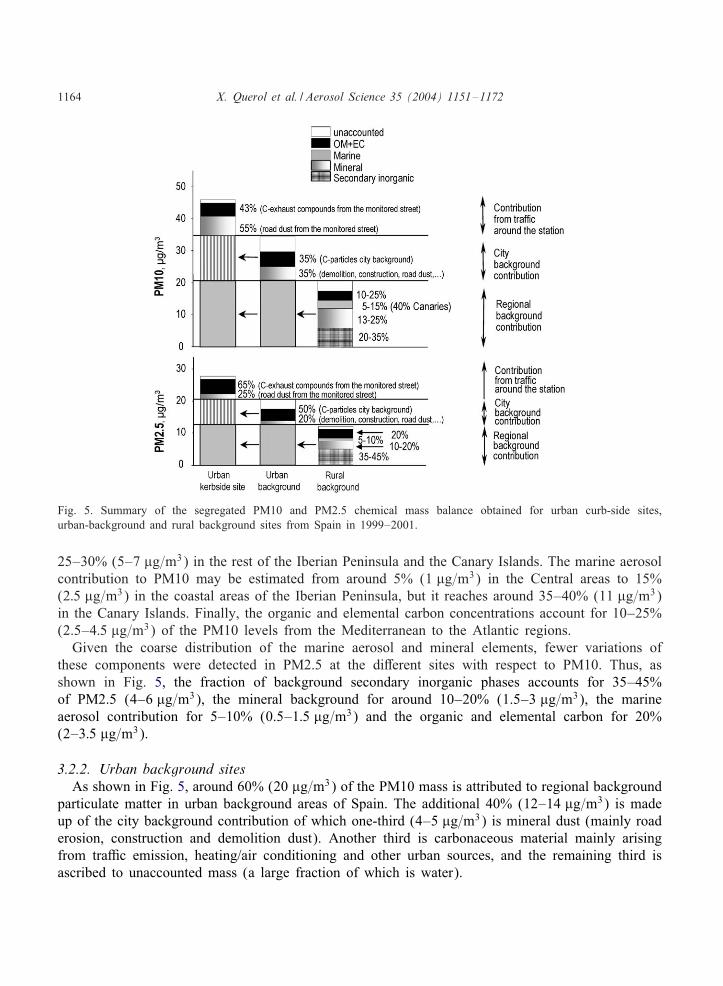
Using the approach of Lenschow et al. (2001) discussed above, Fig. 5 shows the results of the de-composition of the PM10 and PM2.5 components in the contributions from the regional background,the city background (background levels of emissions such as traHc, construction, demolition anddomestic heating) and road traHc (motor emissions and tire, pavement and brake abrasion products)from the street-canyon where the station is located. These contributions to the bulk PM10 and PM2.5levels are summarized below as a function of the area and type of site.
3.2.1. Regional and rural background sitesAs shown in Fig. 5, background secondary inorganic phases (sulfate ammonium and nitrate)
account for only 20% of PM10 (5 �g=m3) in the Canary Islands, 30% (5 �g=m3) in the Atlanticregions of the Iberian Peninsula and for 35% (7:5 �g=m3) in the rest of the Peninsula. Conversely,the mineral background fraction increases from only 13% (2:5 �g=m3) in the Atlantic regions, to
1164 X. Querol et al. / Aerosol Science 35 (2004) 1151–1172
Fig. 5. Summary of the segregated PM10 and PM2.5 chemical mass balance obtained for urban curb-side sites,urban-background and rural background sites from Spain in 1999–2001.
25–30% (5–7 �g=m3) in the rest of the Iberian Peninsula and the Canary Islands. The marine aerosolcontribution to PM10 may be estimated from around 5% (1 �g=m3) in the Central areas to 15%(2:5 �g=m3) in the coastal areas of the Iberian Peninsula, but it reaches around 35–40% (11 �g=m3)in the Canary Islands. Finally, the organic and elemental carbon concentrations account for 10–25%(2.5–4:5 �g=m3) of the PM10 levels from the Mediterranean to the Atlantic regions.
Given the coarse distribution of the marine aerosol and mineral elements, fewer variations ofthese components were detected in PM2.5 at the di8erent sites with respect to PM10. Thus, asshown in Fig. 5, the fraction of background secondary inorganic phases accounts for 35–45%of PM2.5 (4–6 �g=m3), the mineral background for around 10–20% (1.5–3 �g=m3), the marineaerosol contribution for 5–10% (0.5–1:5 �g=m3) and the organic and elemental carbon for 20%(2–3:5 �g=m3).
3.2.2. Urban background sitesAs shown in Fig. 5, around 60% (20 �g=m3) of the PM10 mass is attributed to regional background
particulate matter in urban background areas of Spain. The additional 40% (12–14 �g=m3) is madeup of the city background contribution of which one-third (4–5 �g=m3) is mineral dust (mainly roaderosion, construction and demolition dust). Another third is carbonaceous material mainly arisingfrom traHc emission, heating/air conditioning and other urban sources, and the remaining third isascribed to unaccounted mass (a large fraction of which is water).
X. Querol et al. / Aerosol Science 35 (2004) 1151–1172 1165
In the case of PM2.5 (Fig. 5), the regional background accounts for 60–70% (11–13 �g=m3) of theurban background levels. The additional 30–40% (8–10 �g=m3) is attributed to the city backgroundinput of which 20% (1:5 �g=m3) is made of city mineral dust, 50% (4 �g=m3) of carbonaceousmaterial and the remaining 30% (3 �g=m3) to unaccounted mass. It should be pointed out thataround 20–35% of the PM10 city background mineral dust input is present in PM2.5, whereas80–90% of carbonaceous particle input is also present in PM2.5.
3.2.3. Curb-side sitesAt curb-side sites the regional and urban background particulate inputs are estimated to reach
33–50 and 25–30% of the PM10 mass, respectively. The additional 20–30% (10–12 �g=m3) issupplied by local traHc from the monitored street. As shown in Fig. 5, at least 85% of this curbcontribution is made up of road dust (6:5 �g=m3) and carbonaceous particles from exhaust emissionsand tire abrasion (6 �g=m3).
As for the urban background sites, 30–35% of the PM10 local road dust input at curb-side sitesis present in PM2.5, whereas ¿ 90% of the curb PM10 carbonaceous particle input at these sitesis also present in PM2.5. In the case of PM2.5 (Fig. 5) contributions of regional, urban back-ground and local curb emissions are similar to those reported for PM10 (35–50/25–35/25–33%,10–13/7–11/7–10 �g=m3). At least 65% (5:5 �g=m3) of this curb contribution is ascribed to car-bonaceous particles from exhaust emissions and to tire abrasion, and 25% (2 �g=m3) to road dustfrom the monitored street.
3.2.4. Industrial contributionData listed in Table 2 show that at some urban background and curb-side sites, a signiFcant fraction
of PM10 and PM2.5 is made up of secondary inorganic species, which is much higher than thosedetermined at regional and at most urban background sites. This is probably an artifact introduced bythe fact that two of the three curb-side sites and one urban background site investigated are locatedin highly industrialized areas in the Mediterranean region (Barcelona and Tarragona) where higherlevels of sulfate, and especially of nitrate are usually recorded. Bearing in mind the di8erences inthe levels of secondary inorganic species, it may be concluded that the surplus mass of inorganicsecondary material ranges from 3 to 8 �g PM10=m3 and 1–6 �g PM2.5 in highly industrializedareas. The carbonaceous fraction is only slightly in9uenced by industrial emissions since the ratioof organic and elemental carbon to inorganic secondary species ranges from 1.2 to 1.9 in PM10 and1.3–2.2 in PM2.5 in Madrid, Alcobendas and in the Canaries, whereas this ratio is constant in therange 0.7–0.8 in PM10 and 0.7–1.1 in PM2.5 at the aforementioned industrialized urban sites.
3.3. Source apportionment
Bearing in mind all the above PM10 and PM2.5 contributions reported for regional background, ur-ban background and curb-side sites (Figs. 5 and 6), it becomes evident that the natural contributionaccounts for 15–20, 20–25 and 30–40% of PM10 (7–9 �g=m3) in the Iberian Peninsula, respec-tively. In the Canary Islands, this natural fraction increases markedly up to 45–65% (18–19 �g=m3,Fig. 5) of the PM10 mass measured at urban and regional background sites. The natural inputin PM2.5 is considerably reduced but is still present in around 11–25% of the bulk PM2.5 mass
1166 X. Querol et al. / Aerosol Science 35 (2004) 1151–1172
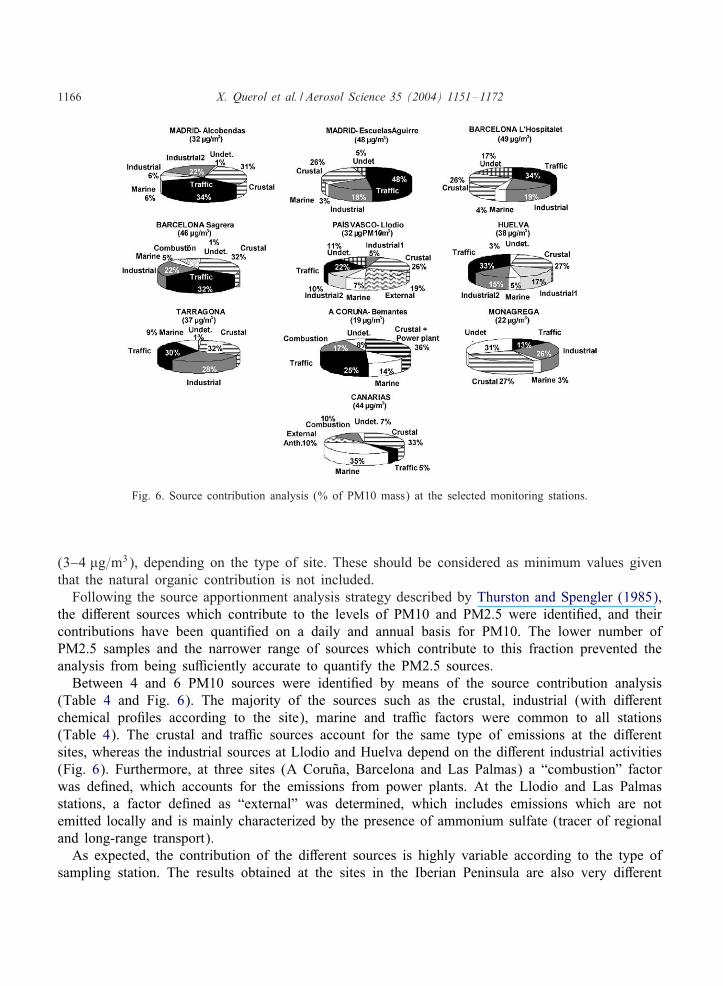
Fig. 6. Source contribution analysis (% of PM10 mass) at the selected monitoring stations.
(3–4 �g=m3), depending on the type of site. These should be considered as minimum values giventhat the natural organic contribution is not included.
Following the source apportionment analysis strategy described by Thurston and Spengler (1985),the di8erent sources which contribute to the levels of PM10 and PM2.5 were identiFed, and theircontributions have been quantiFed on a daily and annual basis for PM10. The lower number ofPM2.5 samples and the narrower range of sources which contribute to this fraction prevented theanalysis from being suHciently accurate to quantify the PM2.5 sources.
Between 4 and 6 PM10 sources were identiFed by means of the source contribution analysis(Table 4 and Fig. 6). The majority of the sources such as the crustal, industrial (with di8erentchemical proFles according to the site), marine and traHc factors were common to all stations(Table 4). The crustal and traHc sources account for the same type of emissions at the di8erentsites, whereas the industrial sources at Llodio and Huelva depend on the di8erent industrial activities(Fig. 6). Furthermore, at three sites (A Coruna, Barcelona and Las Palmas) a “combustion” factorwas deFned, which accounts for the emissions from power plants. At the Llodio and Las Palmasstations, a factor deFned as “external” was determined, which includes emissions which are notemitted locally and is mainly characterized by the presence of ammonium sulfate (tracer of regionaland long-range transport).
As expected, the contribution of the di8erent sources is highly variable according to the type ofsampling station. The results obtained at the sites in the Iberian Peninsula are also very di8erent
X. Querol et al. / Aerosol Science 35 (2004) 1151–1172 1167
from those obtained in the Canary Islands. TraHc contributions to PM10 levels at urban backgroundstations in the Peninsula vary from 22 to 34% (7–15 �g=m3), but may reach 48% (23 �g=m3) attraHc sites (Table 4, Fig. 6). This contribution reaches only 5% (2 �g=m3) at the urban backgroundsite in the Canaries. TraHc contributions attain 11–25% of the PM10 levels (3–5 �g=m3) at therural stations in the Iberian Peninsula.
The industrial factor also exhibits important variations as a function of the study area. In thePeninsula, this contribution at urban background stations under industrial in9uence ranges from 20to 34% (9–12 �g=m3). At rural sites with industrial in9uence, these contributions account for 15–25%of the PM10 mass (3–6 �g=m3). It should be noted that the highest industrial contribution to ruralsites is registered at Monagrega. In this particular case, these contributions were mainly composed ofSO2−
4 and NO−3 , which are related to summer regional episodes, and therefore comprise both local
and regional industrial contributions (26% of the PM10 mass, 6 �g=m3). In the Canaries, industrialemissions only account for 10% of the PM10 mass (4:5 �g=m3). This contribution is similar to thatdetermined for the external anthropogenic emissions (10%).
Natural sources have a much higher in9uence on PM10 levels in the Canary Islands than inthe Peninsula. The marine source represents 35% of the PM10 mass in the Canaries (12 �g=m3),but only 3–15% in the Peninsula (0.7–3:4 �g=m3). In the Central regions (Madrid and Mona-grega), this fraction contributes with only 0.5–1:0 �g=m3 whereas in the coastal areas it reaches2–3 �g=m3.
Finally, the crustal load in PM10 ranges from 24–36% at all sites, including the one in the Ca-nary Islands (33%). However, in absolute values, the contribution of the crustal factor is maximalin the Canary Islands 11–15 �g=m3. In this case, a high proportion of the crustal contribution hasan African origin (mean daily dust loads reaching 100–600 �g PM10=m3 are often recorded duringthe frequent African episodes, known locally as “calima”). The crustal component at the Barcelonastation attained similar values (15 �g=m3). However, this is due to road dust resuspension and otherurban mineral emissions rather than to African contributions. Moreover, crustal contributions at urbanstations (Escuelas Aguirre, Huelva, Tarragona, Llodio, L’Hospitalet) are high (8–12 �g=m3). If wesubtract the 5:5 �g=m3 crustal contribution detected at the Monagrega rural station from the urbanbackground levels of crustal material, it may be concluded that there is a crustal contribution of2–7 �g=m3 at urban sites. This contribution is therefore related to the mineral city backgroundarising from anthropogenic activities (demolition, construction, road works, traHc). If we subtractthe levels of crustal components recorded at urban background from those attained at roadsidesites, it can be concluded that the local pavement erosion of the monitored road accounts for3–5 �g=m3 of crustal input to the annual PM10 mean levels. Thus, an important proportion ofthe crustal load quantiFed with the receptor modeling may be attributed to urban anthropogenicsources such as traHc. Road dust may be deposited onto the pavement and, in the absence of rainepisodes, the resuspension of this dust could increase the crustal load of PM10. The source recep-tor model will not always associate this dust with traHc tracers such as nitrate or carbonaceousaerosols.
The same emission sources found to be responsible for major variations of PM10 levels wereidentiFed for PM2.5 using the factor analysis. However, as discussed above, the marine and thecrustal factor contributions were markedly reduced with respect to PM10. However, in relativevalues, the crustal contribution may still account for around 20% of the PM2.5 mass, especially atcurb-side sites.
1168 X. Querol et al. / Aerosol Science 35 (2004) 1151–1172
3.4. Chemical speciation of peak PM10 and PM2.5 episodes
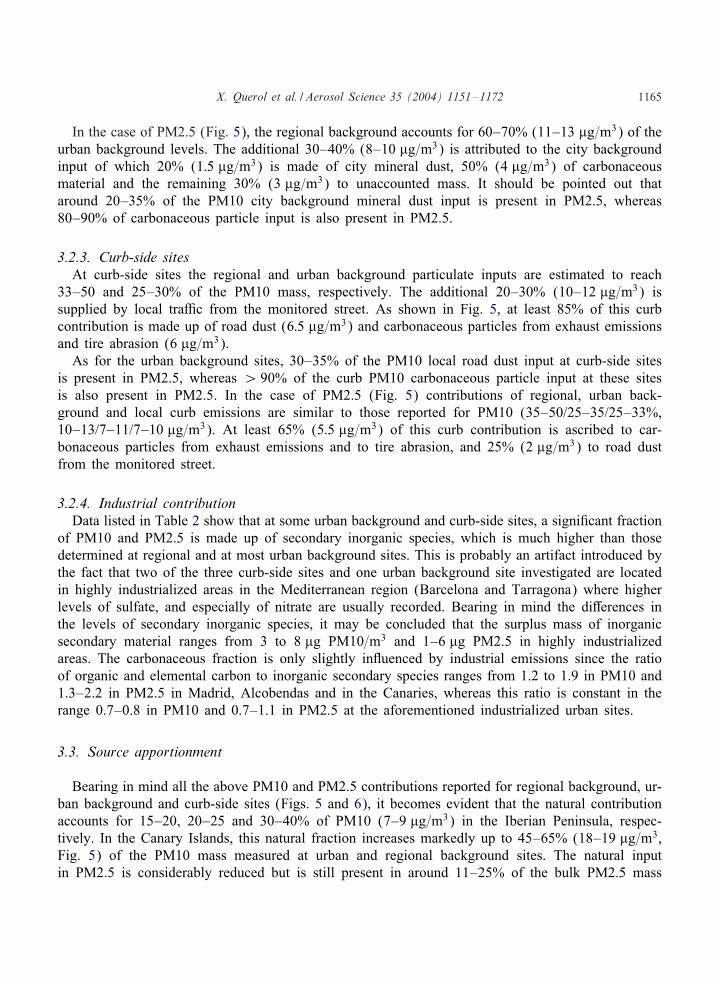
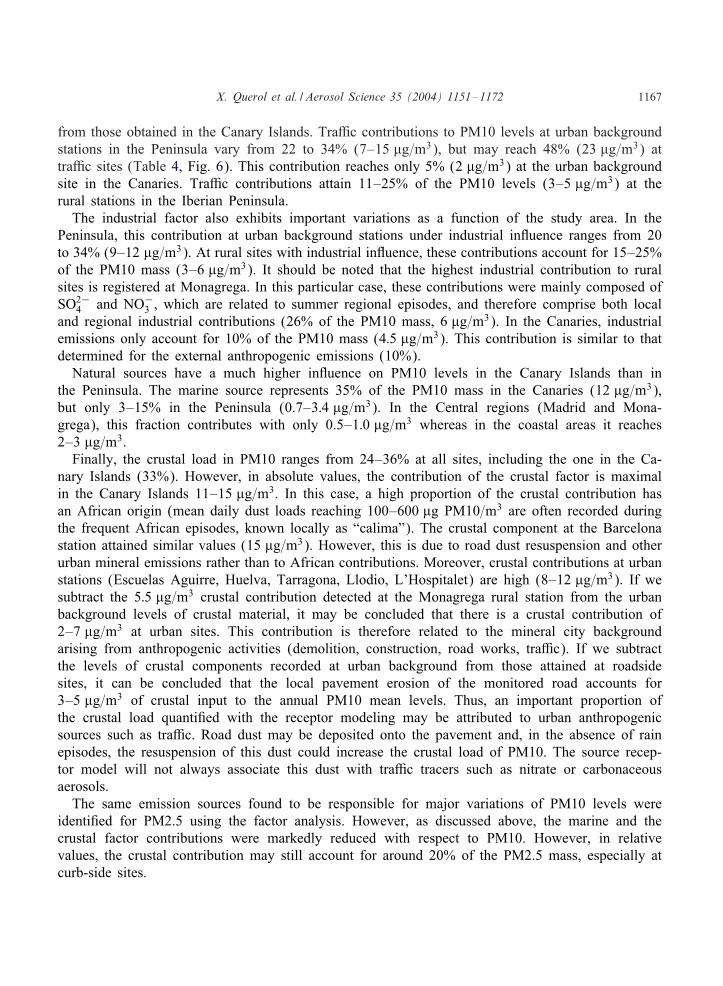
In order to determine the major causes of the exceedances of the limit value for 2005 and2010 (EU Directive 1999/30/EC, 50 �g=m3), the mean levels of PM10 components for days withPM10¿ 50 �g=m3 at the following sites are shown in Fig. 7: Barcelona (curb-side site with indus-trial in9uence, data from 2001), Madrid (curb-side site, data from 1999 to 2000), Llodio (industrialurban background station, data from 2001) and the Canary Islands (urban background station, datafrom 2001). The results show the prevalence of three PM10 fractions at the sites studied: mineraldust, secondary inorganic phases and carbonaceous components. In the Canary Islands, the mineralfraction and the marine aerosol are clearly dominant during the days that exceed the limit value, withmean levels of 33 and 18 �g=m3 (42 and 23% of the bulk PM10 levels), respectively. The proximityof the African continent and the Atlantic in9uence account for the very high natural contributionmeasured during these days at this site. At the industrial sites (Llodio and Barcelona), the secondaryinorganic species account for 14–26 �g=m3 (22–44%) of the bulk PM10 load on the days exceedingthe limit value. The high traHc in9uence in Barcelona also accounts for a large contribution ofmineral dust (24 �g=m3, 37% of PM10 mass) and carbonaceous matter (14 �g=m3, 21%). Finally,the carbonaceous (21 �g=m3) and mineral (22 �g=m3) fractions constitute 63% of PM10 on the daysexceeding the limit value at the curb-side site in Madrid given that traHc is the main contributor toPM on those days.
On the days exceeding 35 �g PM2:5=m3 (8–15 days at curb-side sites and from 1 to 6 days aturban background sites over around 50 days per site, Fig. 7), the anthropogenic local contributionis still dominant at all sites with the exception of the Canary Islands. Thus, at Las Palmas 64% ofPM2.5 mass is attributed to mineral dust on those days, whereas secondary inorganic species andorganic and elemental carbon only account for 15%. These proportions are inverted at the urbanbackground and traHc sites in the Iberian Peninsula, where secondary inorganic and carbonaceousmaterial accounts for 62–72% of the PM2.5 mass on the days exceeding 35 �g PM2:5=m3. It shouldbe pointed out that mineral matter accounts for around 20% of the PM2.5 mass on those days atcurb-side sites.
Sporadically, African dust outbreaks over Spain may induce very high PM10 and PM2.5 levels. Inthe Canary Islands, daily PM10 and PM2.5 levels may reach up to 400 and 80 �g=m3, respectively,during these events, with ¿ 80% of the PM mass being composed of mineral dust.
Typical PM2.5/PM10 ratios registered during African dust outbreaks reach 0.4 in the CanaryIslands and Huelva, 0.5 in Barcelona and Alcobendas and 0.7 in Llodio and Bemantes. Consequently,the simultaneous measurement of PM10 and PM2.5 levels is not suHcient to detect dust outbreakssince the PM2.5/PM10 ratio varies regionally. The dust outbreaks also in9uence levels of PM2.5 andPM1. Mean daily PM10 and PM2.5 levels up to 199 and 74 �g=m3 were recorded in the CanaryIslands. The di8erence in PM2.5/PM10 ratios is probably attributed to the fact that the dust outbreaksa8ecting Northern Spain occur mainly in winter following anticyclone trajectories over the Atlantic(Viana, Querol, Alastuey, Cuevas, & RodrNOguez, 2002). Thus, the air masses are transported overconsiderable distances with the result that important grain size segregation takes place. Furthermore,recent studies have demonstrated that in February–March, the dust plume is made up of a mixtureof carbonaceous aerosols from biomass combustion and dust (Kaufman et al., 2003). However, inEastern and Southern Spain, the dust outbreaks also occur in spring and summer with direct andshorter transport from the Sahara.
X. Querol et al. / Aerosol Science 35 (2004) 1151–1172 1169
Fig. 7. Chemical speciation of days exceeding the PM10 daily limit value (50 �g=m3) and 35 at urban background,curb-side and industrial sites. SIA: secondary inorganic aerosols.
4. Conclusions
Wide variations in PM levels were found among the di8erent geographical areas in Spain. Thesevariations also depend on the type of monitoring site, i.e. rural background, sub-urban or industrial
1170 X. Querol et al. / Aerosol Science 35 (2004) 1151–1172
background, and curb-side or street-canyon stations. PM levels range from 15–20 �g PM10=m3
in rural areas, to 45–50 �g PM10=m3 at curb-side stations. The variation of PM2.5 ranges from9–14 �g PM2:5=m3 at rural background stations to 25–35 �g PM10=m3 at curb-side sites.
The chemical composition of PM10 and PM2.5 exhibits geographical variations as well as seasonalpatterns. The carbonaceous aerosol is the major contribution to PM10 and PM2.5 size fractions,presenting a clear winter maximum. The mineral contribution is the second major component ofPM10 although it is reduced in PM2.5. There is a marked traHc in9uence on levels of mineralcomponents, the highest levels being recorded at curb-side or street-canyon sites. A considerablein9uence of the geographical features on the mineral levels in PM10 and PM2.5 was detected. Thehighest urban background levels were recorded in the Canaries.
Secondary inorganic compounds constitute the second major component of PM2.5. NO−3 levels
exhibit a winter maximum. Moreover, this component shows a distinct trend, increasing towards theEastern part of the Peninsula. Atmospheric characteristics such as higher photoreactivity and regionaldynamics contribute to this e8ect.
Based on a source apportionment study, traHc, industry and natural sources were found to accountfor 30–50, 15–35 and 15–30% of PM10 mass in most urban areas. Nevertheless, contribution fromdi8erent sources is highly dependent on the type of location.
From the point of view of daily limit value, the mineral contribution is dominant in the CanaryIslands on the days of PM10 exceedance because of their proximity to the African continent. Thiscontribution also accounts for a large part of the PM10 mass at traHc sites although carbonaceousaerosol may account for the major part (62%) of the PM10 mass at curb-side sites. Secondaryinorganic compounds are however more signiFcant in PM2.5 and at industrial and heavy traHc sites.
Acknowledgements
This study has been partially Fnanced by the Spanish Ministry of the Environment, the Min-istry of Science and Technology (REN2001-0659-C03-03) and the Department of Environment ofthe Autonomous Government of Catalunya (Generalitat de Catalunya). The authors would like tothank the regional Governments of the Xunta de Galicia, Comunidad AutNonoma de Madrid, Juntade AndaluciNa, Generalitat de Valencia, Generalitat de Catalunya, Gobierno AutNonomo de Canariasand PaNOs Vasco (Euskadi) for their support and collaboration. NASA /Goddard Space Flight Center,SeaWIFS-NASA Project SKIRON-University of Athens and Navy Research Laboratory-USA are alsoacknowledged for their contribution with TOMS, satellite images, SKIRON dust maps and NAAPsaerosol maps, respectively. Meteorological analyses were provided by the NOAA-Cires Climatic Di-agnostic Center Boulder (CO), from their Web site http://www/cdc.noaa.gov/. The authors gratefullyacknowledge the NOAA Air Resources Laboratory (ARL) for the provision of the HYSPLIT trans-port and dispersion model and/or READY website (http://www.arl.noaa.gov/ready.html) used in thispublication.
References
ArtNOnano, B., Salvador, P., Alonso, D. G., Querol, X., & Alastuey, A. (2003). Anthropogenic and natural in9uence on thePM10 and PM2.5 aerosol in Madrid (Spain). Analysis of high concentration episodes. Environmental Pollution, 125,453–465.
X. Querol et al. / Aerosol Science 35 (2004) 1151–1172 1171
Draxler, R. R., & Hess, G. D. (1998a). Description of the HYSPLIT 4 modelling system. NOAA Technical MemorandumERL ARL-224.
Draxler, R. R., & Hess, G. D. (1998b). An overview of the HYSPLIT 4 modelling system for trajectories, dispersion anddeposition. Australian Meteorological Magazine, 47, 295–308.
Gangoiti, G., MillNan, M., Salvador, R., & Mantilla, E. (2001). Long range transport and re-circulation of pollutants inthe western Mediterranean during the project. Regional cycles of air pollution in the West-Central Mediterranean area.Atmospheric Environment, 35, 6267–6276.
Hidy, G. M. (1994). Atmospheric sulphur and nitrogen oxides. New York: Academic Press Limited.Kaufman, Y. J., Koren, I., Remer, L. A., TanrNe, D., Ginoux, P., & Fan, S. (2003). Dust transport and deposition observed
from the Terra-MODIS spacecraft over the Atlantic ocean. Proceedings of the second workshop on mineral dust,10–12 September 2003, Paris.
Lenschow, P., Abraham, H. J., Kutzner, K., Lutz, M., PreuY, J. D., & ReichenbZacher, W. (2001). Some ideas about thesources of PM10. Atmospheric Environment, 35(Suppl.1), 123–133.
McGovern, F.M., Nunes, M.J., Raes, F., & Gonzales-Jorge, H. (2002). Marine and anthropogenic aerosols at Punta DelHidalgo, Tenerife, and the aerosol nitrate number paradox. Journal of Geophysical Research 107(D24)(4766) 1–10.
MNeszNaros, E. (1999). Fundamentals of atmospheric aerosol chemistry. Budapest, Hungary: AkadNemiai Kiado.MNeszNaros, E., & HorvNath, L. (1984). Concentration and dry deposition of atmospheric sulphur and nitrogen compounds
in Hungary. Atmospheric Environment, 18, 1725–1730.MillNan, M., Mantilla, E., Salvador, R., CarratalNa, A., Sanz, M. J., Alonso, L., Gangoiti, G., & Navazo, M. (2000). Ozone
cycles in the Western Mediterranean basin: Interpretation of monitoring data in complex coastal terrain. Journal ofApplied Meteorology, 39, 487–508.
MillNan, M., Salvador, R., Mantilla, E., & Kallos, G. (1997). Photo-oxidant dynamics in the Mediterranean basin in summer:Results from European research projects. Journal of Geophysical Research, 102, 8811–8823.
Putaud, J. P., Raes, F., Van-Dingenen, R., Baltensperger, U., BrZuggemann, E., Facchini, M. C., Decesari, S., Fuzzi,S., Gehrig, R., Hansson, H. C., HZuglin, C., Laj, P., Lorbeer, G., Maenhaut, W., Mihalopoulos, N., MZuller, K.,Querol, X., RodrNOguez, S., Schneider, J., Spindler, G., ten Brink, H., THrseth, K., Wehner, B., & Wiedensohler, A.A. (2004). European aerosol phenomenology. 2: Chemical characteristics of particulate matter at kerbside, urban, ruraland background sites in Europe. Atmospheric Environment, 38, 2579–2595.
Querol, X., Alastuey, A., Lopez-Soler, A., Plana, F., Mantilla, E., Juan, R., Ruiz, C. R., & Orden, A. L. (1999).Characterisation of atmospheric particulates around a coal-Fred power station. International Journal of Coal Geology,40(2–3), 175–188.
Querol, X., Alastuey, A., RodrNOguez, S., Plana, F., Mantilla, E., & Ruiz, C. R. (2001a). Monitoring of PM10 and PM2.5around primary particulate anthropogenic emission sources. Atmospheric Environment, 35, 845–858.
Querol, X., Alastuey, A., RodrNOguez, S., Plana, F., Ruiz, C. R., Cots, N., MassaguNe, G., & Puig, O. (2001b). PM10and PM2.5 source apportionment in the Barcelona metropolitan area, Catalonia, Spain. Atmospheric Environment, 35,6407–6419.
RodrNOguez, S., Querol, X., Alastuey, A., Kallos, G., & Kakaliagou, O. (2001). Saharan dust contribution to PM10 andTSP levels in Southern and Eastern Spain. Atmospheric Environment, 35(14), 2433–2447.
RodrNOguez, S., Querol, X., Alastuey, A., & Plana, F. (2002). Sources and processes a8ecting levels and composition ofatmospheric aerosol in the Western Mediterranean. Journal of Geophysical Research 107(D24) 12-1–12-4.
Seidl, W., Brunnemann, G., Kins, E., KZolher, E., Reusswig, K., Ruoss, K., Seiler, T., & Dlugi, R. (1996). Nitrate in theaccumulation mode; data from measurement campaigns in eastern Germany. In: M. Kulmala, & P. E. Wagner, (Eds.),Nucleation and atmospheric aerosols (pp. 431–434). New York: Pergamon Press.
Stelson, A. W., Friedlender, S. K., & Seinfeld, J. H. (1979). A note on the equilibrium relationship between ammoniaand nitric acid and particulate ammonium nitrate. Atmospheric Environment, 13, 369–371.
TarrasNon, L., Jonson, J. E., Fagerli, H., Benedictow, A., Wind, P., Simpson, D., & Klein, D. H. (2003). TransboundaryacidiGcation, eutrrophication and ground level ozone in Europe. Source-receptor relationship. Status report 1/2003,Part III, EMEP, convention on long-range transboundary air pollution, co-operative programme for monitoring andevaluation of long range transmission of air pollutants in Europe., Nowegian Meteorological Institute (194pp).
Thurston, G. D., & Spengler, J. D. (1985). A quantitative assessment of source contribution to inhalable particulate matterpollution in metropolitan Boston. Atmospheric Environment, 19(1), 9–25.

1172 X. Querol et al. / Aerosol Science 35 (2004) 1151–1172
Viana, M., Querol, X., Alastuey, A., Cuevas, E., & RodrNOguez, S. (2002). In9uence of African dust on the levels ofatmospheric particulates in the Canary Islands air quality network. Atmospheric Environment, 36, 5861–5875.
WHO. (2003). Health aspects of air pollution with particulate matter, ozone and nitrogen dioxide. Report on a WHOworking group, Bonn (Germany), January 2003.
Willison, M. J., Clarke, A. G., & Zeki, E. M. (1985). Seasonal variations in atmospheric aerosol concentration andcomposition at urban and rural sites in Northern England. Atmospheric Environment, 19, 1081–1089.
Wilson, W. E., Chow, J. C., Claiborn, C., Fusheng, W., Engelbrecht, J., & Watson, J. G. (2002). Monitoring of particulatematter outdoors. Chemosphere, 49, 1009–1043.
Copyright © 2022 FDOKUMEN