Factors determining the fluctuation of fluoride concentrations in PM10 aerosols in the urbanized...
10
RESEARCH ARTICLE Factors determining the fluctuation of fluoride concentrations in PM10 aerosols in the urbanized coastal area of the Baltic Sea (Gdynia, Poland) Anita Lewandowska & Lucyna Falkowska & Joanna Jóźwik Received: 12 October 2012 / Accepted: 21 February 2013 # The Author(s) 2013. This article is published with open access at Springerlink.com Abstract Fluoride concentrations were determined in PM10 samples collected in the urbanized coastal area of the Baltic Sea (Gdynia) in the period between 1 August 2008 and 8 January 2010. F - concentrations remained within the range of 0.4– 36.6 ng·m -3 . The economic transformations which have taken place in Poland increasing ecological awareness have had an excellent effect on the levels of fluoride pollution in the air of the studied region. In our measurements, fluoride concentra- tions increased in wintertime, when air temperature dropped, at low wind speeds (<1 m·s -1 ) and with low dispersion of pollut- ants originating from local sources (traffic, industry, domestic heating). At times when wind speed grew to >10 m·s -1 , fluo- rides were related to marine aerosols or else brought from distant sources. Apart from wind speed and air temperature, other significant meteorological parameters which determined the variability of F - turned out to be air humidity and precip- itation volume. Aerosols were washed out effectively, even with small precipitation (h =4 mm), and if a dry period lasted for several days, their concentrations grew rapidly to over 30.0 ng·m -3 . Keywords PM10 . Fluoride . Synoptic conditions . Air mass influence . Coastal zone Introduction Fluorine occurs in the environment in the air, in the soil and in living organisms. Fluorides are released into the environment naturally through the weathering and dissolution of minerals, in emissions from volcanoes and in marine aerosols. Fluorides are also released into the environment via coal combustion and from various industrial processes, including steel manu- facture, primary aluminium, copper and nickel production, phosphate ore processing, phosphate fertilizer production and use, glass, brick and ceramic manufacturing, and glue and adhesive production. The use of fluoride-containing pes- ticides, as well as the controlled fluoridation of drinking-water supplies, also contributes to the release of fluoride from an- thropogenic sources (WHO 2002). Airborne fluoride exists in gaseous and particulate forms emitted from both natural and anthropogenic sources. The gaseous fluorides include hydrogen fluoride, carbon tetrafluo- ride (CF 4 ), hexafluoroethane (C 2 F 6 ) and silicon tetrafluoride. Particulate fluorides include cryolite, chiolite (Na 5 Al 3 F 14 ), cal- cium fluoride, aluminium fluoride and sodium fluoride. Fluoride released as gaseous and particulate matter is deposited in the general vicinity of an emission source (Low and Bloom 1988). Natural sources of atmospheric fluorides are volcanic eruptions and geysers, and it is estimated that emissions from those sources amount to between 60 Gg and 6 Tg F - ·year -1 (Franzaring et al. 2007). Another 20 Gg F - ·year -1 is intro- duced into the atmosphere through marine aerosols. The fate of inorganic fluorides in the atmosphere is primarily influenced by vaporization, aerosol formation, wet and dry deposition and hydrolysis (Viswanathan et al. 2009). Fluorides adsorbed on particulate matter in the atmo- sphere are generally stable and are not readily hydrolyzed, although they may be degraded by radiation if they persist in the atmosphere. Fluoride in aerosols can be transported over large distances by wind or as a result of atmospheric turbu- lence. The distance travelled is determined by the deposition velocity of both the gaseous hydrogen fluoride and the fluorides in particulate form. The long-range transport Responsible editor: Gerhard Lammel A. Lewandowska (*) : L. Falkowska : J. Jóźwik Institute of Oceanography, University of Gdańsk, Al. Marszałka J. Piłsudskiego 46, 81-378 Gdynia, Poland e-mail: [email protected] Environ Sci Pollut Res DOI 10.1007/s11356-013-1592-2
-
Upload
independent -
Category
Documents
-
view
2 -
download
0
Transcript of Factors determining the fluctuation of fluoride concentrations in PM10 aerosols in the urbanized...
RESEARCH ARTICLE
Factors determining the fluctuation of fluoride concentrationsin PM10 aerosols in the urbanized coastal area of the Baltic Sea(Gdynia, Poland)
Anita Lewandowska & Lucyna Falkowska &
Joanna Jóźwik
Received: 12 October 2012 /Accepted: 21 February 2013# The Author(s) 2013. This article is published with open access at Springerlink.com
Abstract Fluoride concentrations were determined in PM10samples collected in the urbanized coastal area of the Baltic Sea(Gdynia) in the period between 1 August 2008 and 8 January2010. F− concentrations remained within the range of 0.4–36.6 ng·m−3. The economic transformations which have takenplace in Poland increasing ecological awareness have had anexcellent effect on the levels of fluoride pollution in the air ofthe studied region. In our measurements, fluoride concentra-tions increased in wintertime, when air temperature dropped, atlow wind speeds (<1 m·s−1) and with low dispersion of pollut-ants originating from local sources (traffic, industry, domesticheating). At times when wind speed grew to >10 m·s−1, fluo-rides were related to marine aerosols or else brought fromdistant sources. Apart from wind speed and air temperature,other significant meteorological parameters which determinedthe variability of F− turned out to be air humidity and precip-itation volume. Aerosols were washed out effectively, evenwith small precipitation (h=4 mm), and if a dry period lastedfor several days, their concentrations grew rapidly to over30.0 ng·m−3.
Keywords PM10 . Fluoride . Synoptic conditions .
Air mass influence . Coastal zone
Introduction
Fluorine occurs in the environment in the air, in the soil and inliving organisms. Fluorides are released into the environment
naturally through the weathering and dissolution of minerals,in emissions from volcanoes and in marine aerosols. Fluoridesare also released into the environment via coal combustionand from various industrial processes, including steel manu-facture, primary aluminium, copper and nickel production,phosphate ore processing, phosphate fertilizer productionand use, glass, brick and ceramic manufacturing, and glueand adhesive production. The use of fluoride-containing pes-ticides, as well as the controlled fluoridation of drinking-watersupplies, also contributes to the release of fluoride from an-thropogenic sources (WHO 2002).
Airborne fluoride exists in gaseous and particulate formsemitted from both natural and anthropogenic sources. Thegaseous fluorides include hydrogen fluoride, carbon tetrafluo-ride (CF4), hexafluoroethane (C2F6) and silicon tetrafluoride.Particulate fluorides include cryolite, chiolite (Na5Al3F14), cal-cium fluoride, aluminium fluoride and sodium fluoride.Fluoride released as gaseous and particulate matter is depositedin the general vicinity of an emission source (Low and Bloom1988). Natural sources of atmospheric fluorides are volcaniceruptions and geysers, and it is estimated that emissions fromthose sources amount to between 60 Gg and 6 Tg F−·year−1
(Franzaring et al. 2007). Another 20 Gg F−·year−1 is intro-duced into the atmosphere through marine aerosols.
The fate of inorganic fluorides in the atmosphere isprimarily influenced by vaporization, aerosol formation,wet and dry deposition and hydrolysis (Viswanathan et al.2009). Fluorides adsorbed on particulate matter in the atmo-sphere are generally stable and are not readily hydrolyzed,although they may be degraded by radiation if they persist inthe atmosphere. Fluoride in aerosols can be transported overlarge distances by wind or as a result of atmospheric turbu-lence. The distance travelled is determined by the depositionvelocity of both the gaseous hydrogen fluoride and thefluorides in particulate form. The long-range transport
Responsible editor: Gerhard Lammel
A. Lewandowska (*) : L. Falkowska : J. JóźwikInstitute of Oceanography, University of Gdańsk, Al. Marszałka J.Piłsudskiego 46, 81-378 Gdynia, Polande-mail: [email protected]
Environ Sci Pollut ResDOI 10.1007/s11356-013-1592-2
effectiveness depends on the particle size and is easier forthe finest fraction of aerosols (Sloof et al. 1989).
Fluorine participates in the metabolism of plants, animalsand humans (Machoy et al. 1995). In small concentrations, itis a necessary element, while high concentrations are toxicfor mammals. The harmless daily dose of fluorine for anadult human is about 1 mg, but as little as about 5 mg maylead to chronic fluorine poisoning, known as fluorosis, asthis element accumulates in the system—mainly in the teethand bones (Whitford 1990).
In the Tri-city agglomeration (Gdansk-Sopot-Gdyniametropolitan area), studies on fluorides in aerosols werecarried out in the 1990s. They returned high values exceed-ing the daily fluoride limit of 3 μg·m−3, established in 1990by the ordinance of the Minister of EnvironmentalProtection, by up to 900 % (Jaśkowski et al. 2001). Themost controversial source of fluorides in the region was thena stack of phosphogypsum, a by-product of sulphuric acidproduction, belonging to the Gdansk Phosphoric FertilizersProducer. Located on Sobieszewo Island, to the south-westof the test station, it was closed down by the end of 2009 byorder of the Gdansk city authorities. In view of the health ofthe inhabitants of Gdansk and its vicinity, it seems importantto determine the concentration of fluorides in PM10 aerosolsagain, now that the highest potential source of these ions hasbeen eliminated.
The main purpose of the research described herein was toplug gaps in the knowledge concerning the seasonal con-centration variation of fluoride in PM10 in the urbanizedcoastal zone, where fluoride can be both of natural andanthropogenic origin. The intention, therefore, was to assessthe relationship between fluoride concentration in PM10and synoptic condition (wind speed, air temperature, relativehumidity, wet deposition amount) as well as to identify thevarious sources of fluorides in the region, including the roleof the sea.
Materials and methods
Sampling
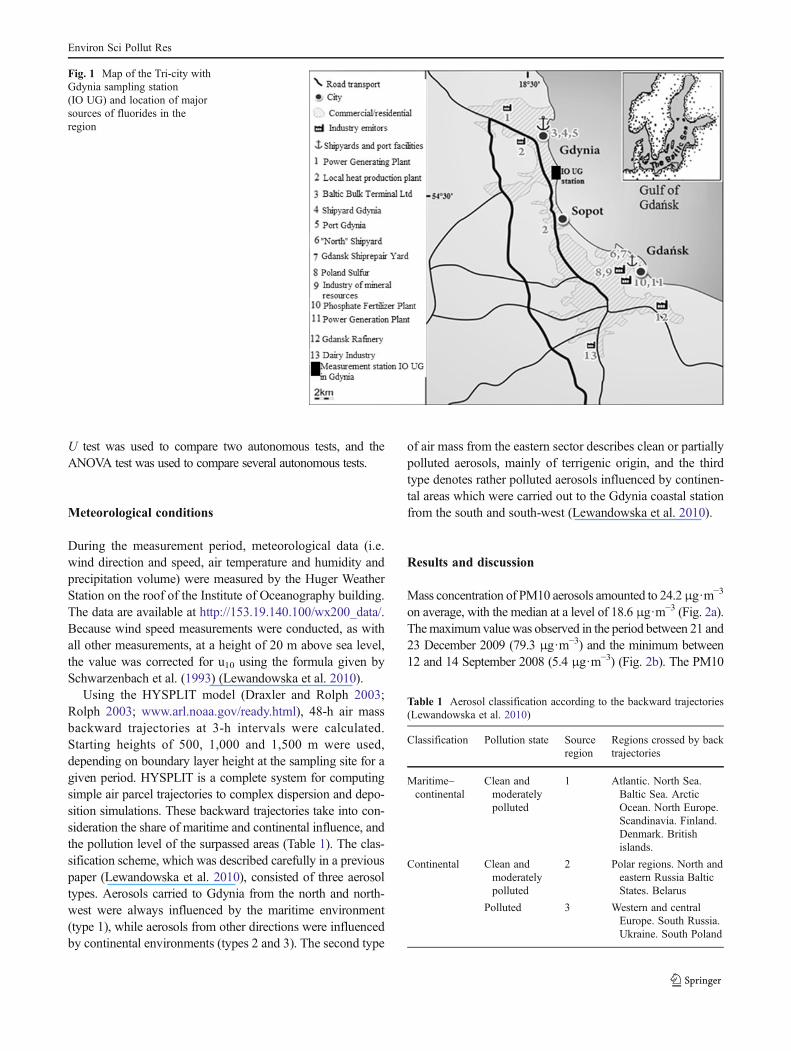
PM10 samples for fluoride determination were taken between1 August 2008 and 8 January 2010 in 48-h cycles.Measurements were performed in Gdynia, around 1,000 mfrom the Baltic Sea coast, on the roof of the Institute ofOceanography building (φ=54°51' N, l=18°54' E) (Fig. 1).The height of the building (20 ma.s.l.) enables measurementsto be taken from above the levels of neighbouring tree canopiesand buildings. Gdynia is a city with a population of around 250thousand people, located close to agricultural and industrialcentres (e.g. shipyards, food processing and chemical plants,including phosphogypsum, and port facilities). Two other large
cities—Gdansk and Sopot—are in close proximity to Gdynia.Altogether, the population of the so-called Tri-city agglomer-ation is nearly one million.
PM10 samples were collected by means of a LowVolume Sampler (LVS-3) with PM10 inlet produced byATMOSERVICE (Poland) and INGENIEURBÜRONORBERT DERENDA (Germany). The inlet correspondswith the European standard CEN EN 12341, as well as VDI2463 paragraph 7 and 8, TA-LUFT and VDI-2465 para-graph 1 and 2 standards, and is treated as a reference inlet.The air flow was maintained at a level of 2.3 m3·h−1.Temperature and humidity in the sampler were controlledby means of a heating and ventilation system.
All 210 samples were collected onWhatman Q-MA filters,47 mm in diameter and with a nominal pore size of 2.2 μm,which were heated at a temperature of 550 °C for a minimumof 6 h using a furnace, in order to eliminate volatile impuritiesand reduce blank values. This kind of filter is commonly usedall over the world and is recommended by the WorldMeteorological Organization for the collection of PM10 sam-ples. The detection limit for PM10 was 0.17 μg·m−3 for 30replicates. The reproducibility uncertainty of the PM10 meth-od was 4.1 % (at a certainty level of 99 %).
After sampling, concentrations of PM10 (in μg·m−3) wereobtained by dividing the difference of filter weights (beforeand after sampling) by the sampled air volume. All proceduresconnected with weight measurements were performed with anaccuracy of 10−5g using the XA balance (RADWAG) at atemperature of 23±2 °C and a relative humidity of 40±5 %.
Chemical analysis of fluoride in PM 10
The analysis of fluoride ions in PM10 samples was conductedusing the ion chromatographymethod on the 850 ProfessionalIC chromatograph byMetrohm, in accordance with the PolishNorm PrPN-EN No 10304–1 (PN 1995). A Metrosep A Supp7–250 anion column (6.1006.630) was used. In the case of thestudied ions, the detection limit amounted to 0.2 ng·m−3, andthe reproducibility uncertainty, at a certainty level of 99 %,taking into account 42 blank samples, was at a level of 2.7 %.
Prior to commencing the analysis, round pieces of 1 cmin diameter were cut out of the filters, submerged in 12 cm3
of deionised milli-Q water and placed in a ultrasonic bathfor 30 min in order to extract the components from the filterinto a solution. Next, the samples were analyzed using anion chromatograph. In the present study, a 3.6 mM sodiumcarbonate solution was used as an eluent. The flow of thesolution through the column was 0.9 cm−3·min−1.
Statistical methods of data analysis and result compilation
In the event of tests of significance, the Szapiro–Wilk test wasused in order to check data parameterization, the Mann–Whitney
Environ Sci Pollut Res
U test was used to compare two autonomous tests, and theANOVA test was used to compare several autonomous tests.
Meteorological conditions
During the measurement period, meteorological data (i.e.wind direction and speed, air temperature and humidity andprecipitation volume) were measured by the Huger WeatherStation on the roof of the Institute of Oceanography building.The data are available at http://153.19.140.100/wx200_data/.Because wind speed measurements were conducted, as withall other measurements, at a height of 20 m above sea level,the value was corrected for u10 using the formula given bySchwarzenbach et al. (1993) (Lewandowska et al. 2010).
Using the HYSPLIT model (Draxler and Rolph 2003;Rolph 2003; www.arl.noaa.gov/ready.html), 48-h air massbackward trajectories at 3-h intervals were calculated.Starting heights of 500, 1,000 and 1,500 m were used,depending on boundary layer height at the sampling site for agiven period. HYSPLIT is a complete system for computingsimple air parcel trajectories to complex dispersion and depo-sition simulations. These backward trajectories take into con-sideration the share of maritime and continental influence, andthe pollution level of the surpassed areas (Table 1). The clas-sification scheme, which was described carefully in a previouspaper (Lewandowska et al. 2010), consisted of three aerosoltypes. Aerosols carried to Gdynia from the north and north-west were always influenced by the maritime environment(type 1), while aerosols from other directions were influencedby continental environments (types 2 and 3). The second type
of air mass from the eastern sector describes clean or partiallypolluted aerosols, mainly of terrigenic origin, and the thirdtype denotes rather polluted aerosols influenced by continen-tal areas which were carried out to the Gdynia coastal stationfrom the south and south-west (Lewandowska et al. 2010).
Results and discussion
Mass concentration of PM10 aerosols amounted to 24.2μg·m−3
on average, with the median at a level of 18.6 μg·m−3 (Fig. 2a).Themaximum valuewas observed in the period between 21 and23 December 2009 (79.3 μg·m−3) and the minimum between12 and 14 September 2008 (5.4 μg·m−3) (Fig. 2b). The PM10
Fig. 1 Map of the Tri-city withGdynia sampling station(IO UG) and location of majorsources of fluorides in theregion
Table 1 Aerosol classification according to the backward trajectories(Lewandowska et al. 2010)
Classification Pollution state Sourceregion
Regions crossed by backtrajectories
Maritime–continental
Clean andmoderatelypolluted
1 Atlantic. North Sea.Baltic Sea. ArcticOcean. North Europe.Scandinavia. Finland.Denmark. Britishislands.
Continental Clean andmoderatelypolluted
2 Polar regions. North andeastern Russia BalticStates. Belarus
Polluted 3 Western and centralEurope. South Russia.Ukraine. South Poland
Environ Sci Pollut Res
concentrations measured at the IO UG station in Gdynia werewithin the range typical of other large European cities in Austria,Germany, Switzerland or Holland (from 24 to 38 μg·m−3)(Querol et al. 2004). In Gdynia, PM10 aerosol concentrationsin excess of the permitted value set for a 24-h period(50μg m−3) occurred at different wind speeds and from differentdirections of advection. However, such events always hap-pened during the cold period. It was determined that therewere three types of episodes of high concentration of PM10aerosols: local, regional and long-distance origin. A detailedcharacterization of the changeability of PM10 concentrationsin the atmosphere over Gdynia during the discussed studyand a description of high-concentration episodes of aerosolssmaller than 10 μm in diameter has been presented byLewandowska and Falkowska (2013).
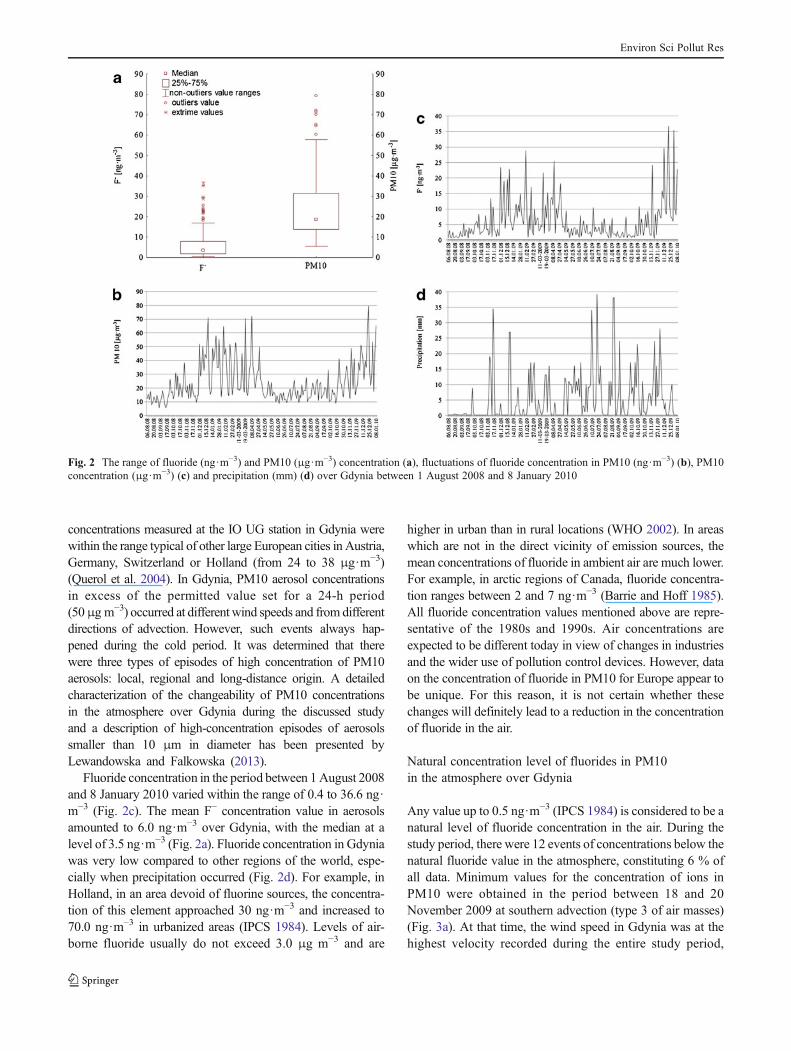
Fluoride concentration in the period between 1August 2008and 8 January 2010 varied within the range of 0.4 to 36.6 ng·m−3 (Fig. 2c). The mean F− concentration value in aerosolsamounted to 6.0 ng·m−3 over Gdynia, with the median at alevel of 3.5 ng·m−3 (Fig. 2a). Fluoride concentration in Gdyniawas very low compared to other regions of the world, espe-cially when precipitation occurred (Fig. 2d). For example, inHolland, in an area devoid of fluorine sources, the concentra-tion of this element approached 30 ng·m−3 and increased to70.0 ng·m−3 in urbanized areas (IPCS 1984). Levels of air-borne fluoride usually do not exceed 3.0 μg m−3 and are
higher in urban than in rural locations (WHO 2002). In areaswhich are not in the direct vicinity of emission sources, themean concentrations of fluoride in ambient air are much lower.For example, in arctic regions of Canada, fluoride concentra-tion ranges between 2 and 7 ng·m−3 (Barrie and Hoff 1985).All fluoride concentration values mentioned above are repre-sentative of the 1980s and 1990s. Air concentrations areexpected to be different today in view of changes in industriesand the wider use of pollution control devices. However, dataon the concentration of fluoride in PM10 for Europe appear tobe unique. For this reason, it is not certain whether thesechanges will definitely lead to a reduction in the concentrationof fluoride in the air.
Natural concentration level of fluorides in PM10in the atmosphere over Gdynia
Any value up to 0.5 ng·m−3 (IPCS 1984) is considered to be anatural level of fluoride concentration in the air. During thestudy period, there were 12 events of concentrations below thenatural fluoride value in the atmosphere, constituting 6 % ofall data. Minimum values for the concentration of ions inPM10 were obtained in the period between 18 and 20November 2009 at southern advection (type 3 of air masses)(Fig. 3a). At that time, the wind speed in Gdynia was at thehighest velocity recorded during the entire study period,
Fig. 2 The range of fluoride (ng·m−3) and PM10 (μg·m−3) concentration (a), fluctuations of fluoride concentration in PM10 (ng·m−3) (b), PM10concentration (μg·m−3) (c) and precipitation (mm) (d) over Gdynia between 1 August 2008 and 8 January 2010
Environ Sci Pollut Res
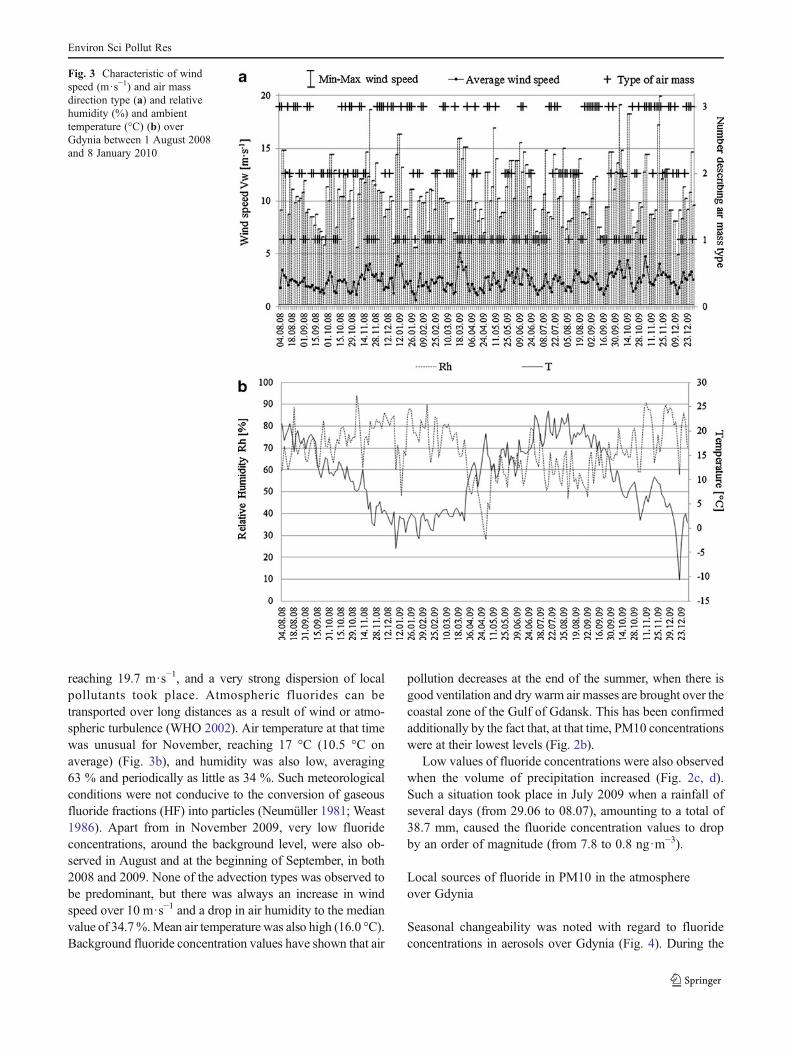
reaching 19.7 m·s−1, and a very strong dispersion of localpollutants took place. Atmospheric fluorides can betransported over long distances as a result of wind or atmo-spheric turbulence (WHO 2002). Air temperature at that timewas unusual for November, reaching 17 °C (10.5 °C onaverage) (Fig. 3b), and humidity was also low, averaging63 % and periodically as little as 34 %. Such meteorologicalconditions were not conducive to the conversion of gaseousfluoride fractions (HF) into particles (Neumüller 1981; Weast1986). Apart from in November 2009, very low fluorideconcentrations, around the background level, were also ob-served in August and at the beginning of September, in both2008 and 2009. None of the advection types was observed tobe predominant, but there was always an increase in windspeed over 10 m·s−1 and a drop in air humidity to the medianvalue of 34.7%.Mean air temperature was also high (16.0 °C).Background fluoride concentration values have shown that air
pollution decreases at the end of the summer, when there isgood ventilation and dry warm air masses are brought over thecoastal zone of the Gulf of Gdansk. This has been confirmedadditionally by the fact that, at that time, PM10 concentrationswere at their lowest levels (Fig. 2b).
Low values of fluoride concentrations were also observedwhen the volume of precipitation increased (Fig. 2c, d).Such a situation took place in July 2009 when a rainfall ofseveral days (from 29.06 to 08.07), amounting to a total of38.7 mm, caused the fluoride concentration values to dropby an order of magnitude (from 7.8 to 0.8 ng·m−3).
Local sources of fluoride in PM10 in the atmosphereover Gdynia
Seasonal changeability was noted with regard to fluorideconcentrations in aerosols over Gdynia (Fig. 4). During the
Fig. 3 Characteristic of windspeed (m·s−1) and air massdirection type (a) and relativehumidity (%) and ambienttemperature (°C) (b) overGdynia between 1 August 2008and 8 January 2010
Environ Sci Pollut Res
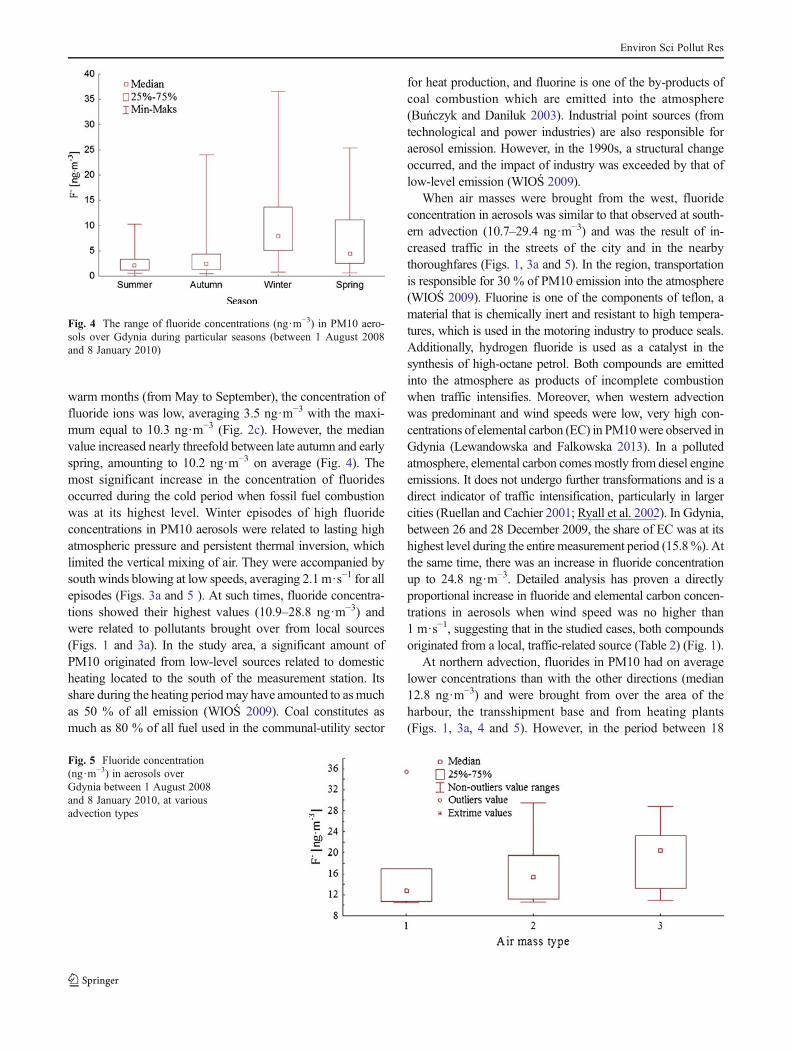
warm months (from May to September), the concentration offluoride ions was low, averaging 3.5 ng·m−3 with the maxi-mum equal to 10.3 ng·m−3 (Fig. 2c). However, the medianvalue increased nearly threefold between late autumn and earlyspring, amounting to 10.2 ng·m−3 on average (Fig. 4). Themost significant increase in the concentration of fluoridesoccurred during the cold period when fossil fuel combustionwas at its highest level. Winter episodes of high fluorideconcentrations in PM10 aerosols were related to lasting highatmospheric pressure and persistent thermal inversion, whichlimited the vertical mixing of air. They were accompanied bysouth winds blowing at low speeds, averaging 2.1 m·s−1 for allepisodes (Figs. 3a and 5 ). At such times, fluoride concentra-tions showed their highest values (10.9–28.8 ng·m−3) andwere related to pollutants brought over from local sources(Figs. 1 and 3a). In the study area, a significant amount ofPM10 originated from low-level sources related to domesticheating located to the south of the measurement station. Itsshare during the heating periodmay have amounted to asmuchas 50 % of all emission (WIOŚ 2009). Coal constitutes asmuch as 80 % of all fuel used in the communal-utility sector
for heat production, and fluorine is one of the by-products ofcoal combustion which are emitted into the atmosphere(Buńczyk and Daniluk 2003). Industrial point sources (fromtechnological and power industries) are also responsible foraerosol emission. However, in the 1990s, a structural changeoccurred, and the impact of industry was exceeded by that oflow-level emission (WIOŚ 2009).
When air masses were brought from the west, fluorideconcentration in aerosols was similar to that observed at south-ern advection (10.7–29.4 ng·m−3) and was the result of in-creased traffic in the streets of the city and in the nearbythoroughfares (Figs. 1, 3a and 5). In the region, transportationis responsible for 30 % of PM10 emission into the atmosphere(WIOŚ 2009). Fluorine is one of the components of teflon, amaterial that is chemically inert and resistant to high tempera-tures, which is used in the motoring industry to produce seals.Additionally, hydrogen fluoride is used as a catalyst in thesynthesis of high-octane petrol. Both compounds are emittedinto the atmosphere as products of incomplete combustionwhen traffic intensifies. Moreover, when western advectionwas predominant and wind speeds were low, very high con-centrations of elemental carbon (EC) in PM10were observed inGdynia (Lewandowska and Falkowska 2013). In a pollutedatmosphere, elemental carbon comesmostly from diesel engineemissions. It does not undergo further transformations and is adirect indicator of traffic intensification, particularly in largercities (Ruellan and Cachier 2001; Ryall et al. 2002). In Gdynia,between 26 and 28 December 2009, the share of EC was at itshighest level during the entire measurement period (15.8%). Atthe same time, there was an increase in fluoride concentrationup to 24.8 ng·m−3. Detailed analysis has proven a directlyproportional increase in fluoride and elemental carbon concen-trations in aerosols when wind speed was no higher than1 m·s−1, suggesting that in the studied cases, both compoundsoriginated from a local, traffic-related source (Table 2) (Fig. 1).
At northern advection, fluorides in PM10 had on averagelower concentrations than with the other directions (median12.8 ng·m−3) and were brought from over the area of theharbour, the transshipment base and from heating plants(Figs. 1, 3a, 4 and 5). However, in the period between 18
Fig. 4 The range of fluoride concentrations (ng·m−3) in PM10 aero-sols over Gdynia during particular seasons (between 1 August 2008and 8 January 2010)
Fig. 5 Fluoride concentration(ng·m−3) in aerosols overGdynia between 1 August 2008and 8 January 2010, at variousadvection types
Environ Sci Pollut Res
and 20 December 2009, when there was no atmosphericprecipitation over four consecutive days, the highest fluorideconcentration (36.6 ng·m−3) in PM10 aerosols in the whole ofthe study period was determined (Fig. 2c, d). Another inter-esting instance of an increase in fluoride concentration inaerosols up to the value of 35.4 ng·m−3 was observed atnorthern advection around New Year's Day (between 30December 2009 and 1 January 2010). At that time, fluorinecompounds were emitted into the atmosphere probably fromfireworks set off in large numbers. Pyrotechnical mixtures arerich in both calcium fluoride, commonly known as fluorite(CaF2), and in cryolite (Na3AlF6) (http://pyrocreations.com).That night, the wind velocity had not exceeded 1.0 m·s−1, andthe distribution of pollutants was very poor. Additionally,since 28 December, there had been no atmospheric precipita-tion (Figs. 2d and 3a).
Biomass combustion influence on fluoride in PM10in the atmosphere over Gdynia
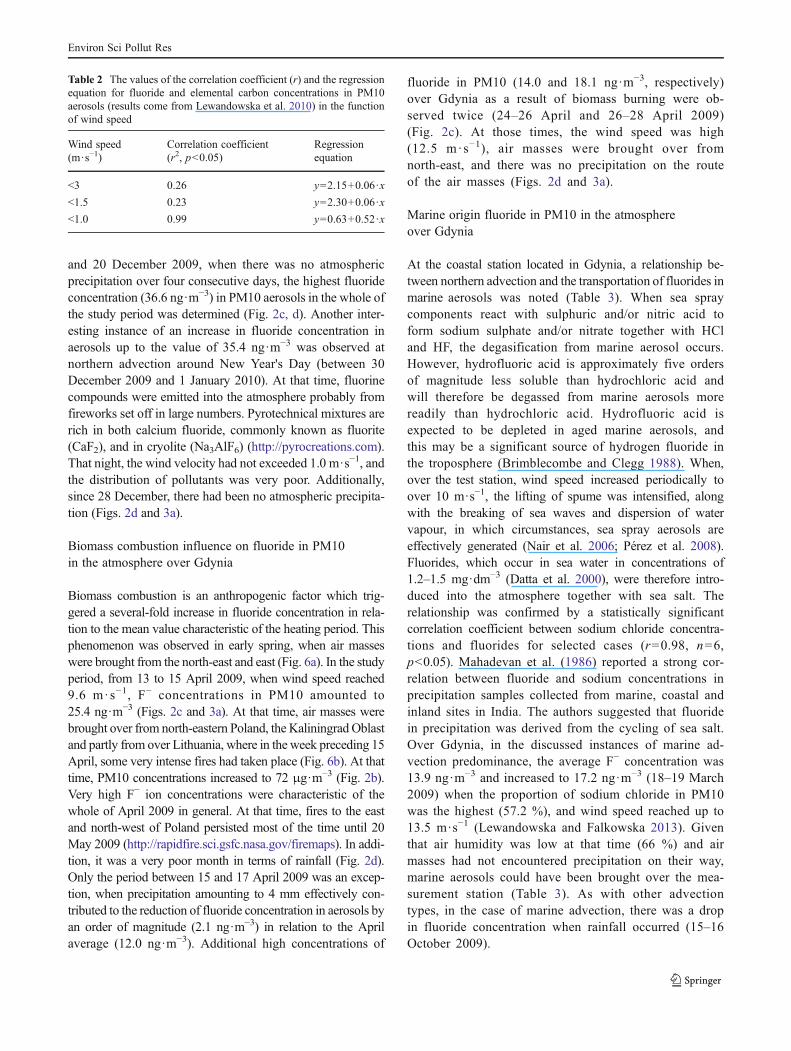
Biomass combustion is an anthropogenic factor which trig-gered a several-fold increase in fluoride concentration in rela-tion to the mean value characteristic of the heating period. Thisphenomenon was observed in early spring, when air masseswere brought from the north-east and east (Fig. 6a). In the studyperiod, from 13 to 15 April 2009, when wind speed reached9.6 m · s−1, F− concentrations in PM10 amounted to25.4 ng·m−3 (Figs. 2c and 3a). At that time, air masses werebrought over from north-eastern Poland, the Kaliningrad Oblastand partly from over Lithuania, where in the week preceding 15April, some very intense fires had taken place (Fig. 6b). At thattime, PM10 concentrations increased to 72 μg·m−3 (Fig. 2b).Very high F− ion concentrations were characteristic of thewhole of April 2009 in general. At that time, fires to the eastand north-west of Poland persisted most of the time until 20May 2009 (http://rapidfire.sci.gsfc.nasa.gov/firemaps). In addi-tion, it was a very poor month in terms of rainfall (Fig. 2d).Only the period between 15 and 17 April 2009 was an excep-tion, when precipitation amounting to 4 mm effectively con-tributed to the reduction of fluoride concentration in aerosols byan order of magnitude (2.1 ng·m−3) in relation to the Aprilaverage (12.0 ng·m−3). Additional high concentrations of
fluoride in PM10 (14.0 and 18.1 ng·m−3, respectively)over Gdynia as a result of biomass burning were ob-served twice (24–26 April and 26–28 April 2009)(Fig. 2c). At those times, the wind speed was high(12.5 m · s−1), air masses were brought over fromnorth-east, and there was no precipitation on the routeof the air masses (Figs. 2d and 3a).
Marine origin fluoride in PM10 in the atmosphereover Gdynia
At the coastal station located in Gdynia, a relationship be-tween northern advection and the transportation of fluorides inmarine aerosols was noted (Table 3). When sea spraycomponents react with sulphuric and/or nitric acid toform sodium sulphate and/or nitrate together with HCland HF, the degasification from marine aerosol occurs.However, hydrofluoric acid is approximately five ordersof magnitude less soluble than hydrochloric acid andwill therefore be degassed from marine aerosols morereadily than hydrochloric acid. Hydrofluoric acid isexpected to be depleted in aged marine aerosols, andthis may be a significant source of hydrogen fluoride inthe troposphere (Brimblecombe and Clegg 1988). When,over the test station, wind speed increased periodically toover 10 m·s−1, the lifting of spume was intensified, alongwith the breaking of sea waves and dispersion of watervapour, in which circumstances, sea spray aerosols areeffectively generated (Nair et al. 2006; Pérez et al. 2008).Fluorides, which occur in sea water in concentrations of1.2–1.5 mg·dm−3 (Datta et al. 2000), were therefore intro-duced into the atmosphere together with sea salt. Therelationship was confirmed by a statistically significantcorrelation coefficient between sodium chloride concentra-tions and fluorides for selected cases (r=0.98, n=6,p<0.05). Mahadevan et al. (1986) reported a strong cor-relation between fluoride and sodium concentrations inprecipitation samples collected from marine, coastal andinland sites in India. The authors suggested that fluoridein precipitation was derived from the cycling of sea salt.Over Gdynia, in the discussed instances of marine ad-vection predominance, the average F− concentration was13.9 ng·m−3 and increased to 17.2 ng·m−3 (18–19 March2009) when the proportion of sodium chloride in PM10was the highest (57.2 %), and wind speed reached up to13.5 m·s−1 (Lewandowska and Falkowska 2013). Giventhat air humidity was low at that time (66 %) and airmasses had not encountered precipitation on their way,marine aerosols could have been brought over the mea-surement station (Table 3). As with other advectiontypes, in the case of marine advection, there was a dropin fluoride concentration when rainfall occurred (15–16October 2009).
Table 2 The values of the correlation coefficient (r) and the regressionequation for fluoride and elemental carbon concentrations in PM10aerosols (results come from Lewandowska et al. 2010) in the functionof wind speed
Wind speed(m·s−1)
Correlation coefficient(r2, p<0.05)
Regressionequation
<3 0.26 y=2.15+0.06·x
<1.5 0.23 y=2.30+0.06·x
<1.0 0.99 y=0.63+0.52·x
Environ Sci Pollut Res
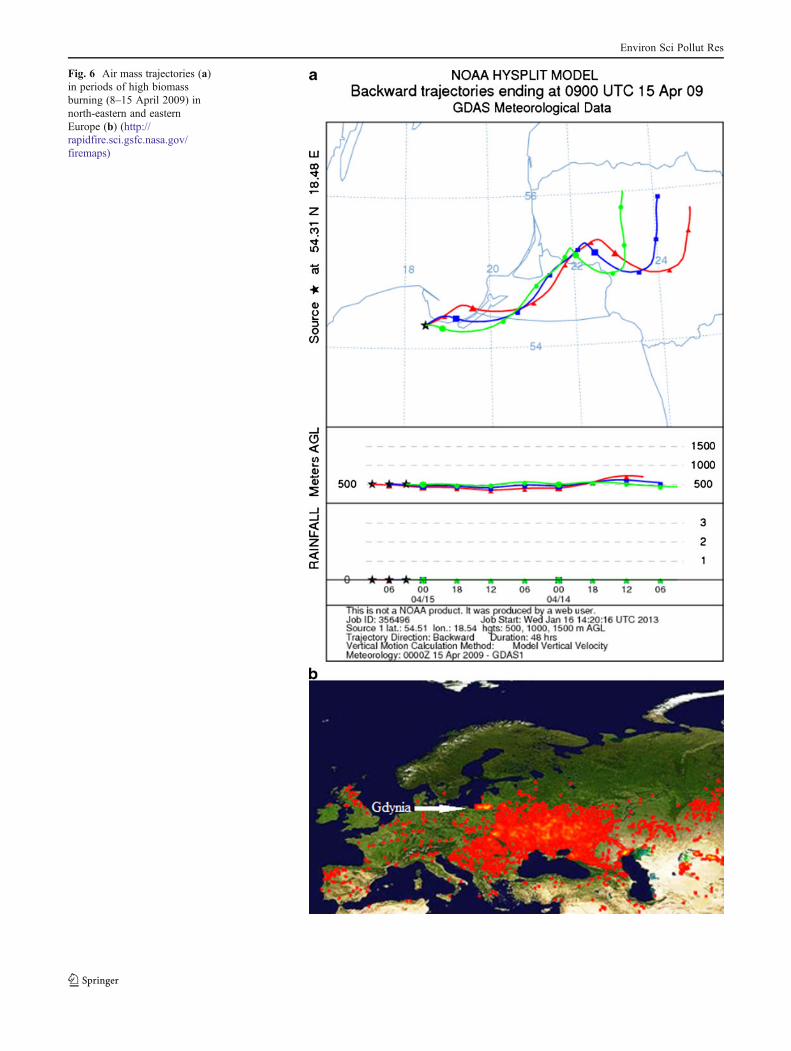
Fig. 6 Air mass trajectories (a)in periods of high biomassburning (8–15 April 2009) innorth-eastern and easternEurope (b) (http://rapidfire.sci.gsfc.nasa.gov/firemaps)
Environ Sci Pollut Res

Conclusions
Fluoride concentrations in aerosols ranged between 0.4and 36.6 ng ·m−3, values which testify to the low
importance of this element to air pollution in the coastalzone of the Gulf of Gdansk when compared with otherregions of the world. When dry and warm air masseswere brought over the study area from southern Europe,
Table 3 The characteristics of high fluoride concentrations in marine aerosols over Gdynia in 2009
Sampling period
F-
[nmol·m-3] NaCl
[nmol·m-3] Meteorological
condition Trajectory of air masses
20-22.02 2009
0.89 429.2 T -0.51(-9.3-9.6) Rh 71(33-97) u10 2,0 (0-10.0)
18-19.032009
0.90 440.4 T 3.4 (0.1-11.4)Rh 67(32-97) u10 2,0 (0-13.5)
1-2.04 2009
0.67 205.9 T 9.5 (-1.8-19.7) Rh 55 (24-97) u10 2,0 (0-10.1)
4-6.04 2009
0.72 165.0 T 11.1(1.9-21.5) Rh 50 (22-87) u10 2,0 (0-12.3)
23-24.04 2009
0.74 238.5 T 17.1 (1.9-22.6) Rh 32 (23-66) u10 2,0 (0-12.5)
15-16.102009
0.57 53.1 T 6.3 (-2.5-15.4)Rh 69 (31-97) u10 2,0 (0-10.4)
Symbols: T-air temperature [°C], Rh- air humidity [%], u10- wind speed [m·s-1] correction calculated using the formula given by Schwarzenbach etal. (1993); Data of NaCl is presented in Lewandowska and Falkowska (2013)
Environ Sci Pollut Res
fluorides occurred in PM10 aerosols in natural back-ground concentrations. Compared to earlier results, thepresent ones do not indicate a health threat to the in-habitants of the region.
The wide range of fluoride concentrations in aerosols (twoorders of magnitude) testifies to significant changeability in theinfluence of origin sources. The influence of anthropopressurewas the most pronounced in the heating season, when com-bustion processes were intensified in the communal-utilitysector. Transportation and traffic were also linked to higherfluoride concentrations. It was found that in all cases, localsources were predominant at low wind speeds and low pollut-ant dispersion in the region. When wind speed increased toover 10 m·s−1, distant sources started playing a significant rolein the formation of fluoride concentrations in PM10 overGdynia. Those sources were related to fires and biomasscombustion as well as to marine aerosol emission.
Meteorological factors determining fluoride concentrationin PM10 aerosols, beside temperature and wind velocity,turned out to be air humidity and precipitation volume.Fluorides were effectively washed out together with aerosolseven by a little precipitation (h=4mm), and their concentrationgrew rapidly whenever a dry period persisted for some time.
Open Access This article is distributed under the terms of the CreativeCommons Attribution License which permits any use, distribution, andreproduction in any medium, provided the original author(s) and thesource are credited.
References
Barrie LA, Hoff RM (1985) Five years of air chemistry observations inthe Canadian arctic. Atmos Environ 19(12):1995–2010
Buńczyk A, Daniluk A (2003) Thermal power in Poland—preliminaryresults. Bulletin of the Energy Regulatory Office 6:33
Brimblecombe P, Clegg SL (1988) The solubility and behavior of acidgases in the marine aerosol. J Atmos Chem 7:1–18
Datta DK, Gupta LP, Subramanian V (2000) Dissolved fluoride in thelower Ganges–Brahmaputra–Meghna River system in the BengalBasin, Bangladesh. Environ Geol 39:1163–1168
Draxler RR, Rolph GD (2003) HYSPLIT (HYbrid Single-ParticleLagrangian Integrated Trajectory) Model access via NOAAARL READY Website (http://www.arl.noaa.gov/ready/hysplit4.html). NOAA Air Resources Laboratory, Silver Spring,MD
Franzaring J, Klumpp A, Fangmeier A (2007) Active biomonitoring ofairborne fluoride near an HF producing factory using standardisedgrass cultures. Atmos Environ 41:4828–4840
IPCS (1984) Fluorine and fluorides. Geneva, World Health Organization,International Programme on Chemical Safety (EnvironmentalHealth Criteria 36)
Jaśkowski J, Leśnikowska K, Terlecki J, Prokop A (2001) Fluoride.Fluorosis in the Pomeranian province. Fluor. Fluoroza
w województwie pomorskim. http://simpgda.webpark.pl/pliki/(in polish).fluor.doc
Lewandowska A, Falkowska L (2013) High concentration episodes ofPM10 in the air over the urbanized coastal zone of the Baltic Sea(Gdynia—Poland). Atmos Res 120–121:55–67
Lewandowska A, Falkowska L, Murawiec D, Pryputniewicz D, BurskaD, Bełdowska M (2010) Elemental and organic carbon in aerosolsover urbanized coastal region (southern Baltic Sea, Gdynia). SciTot Environ 408(20):4761–4769
Low PS, Bloom H (1988) Atmospheric deposition of fluoride in thelower Tamar Valley, Tasmania. Atmos Environ 22(9):2049–2056
Machoy Z, Dąbrowska ED, Samujło D, Ogoński T, Raczyński J,Gabczyńska Z (1995) Relationship between fluoride content Inbones and age In European elk (Alces alces L.). Comp BiochemPhysiol 111C:117–120
Mahadevan TN, Meenakshy V, Mishra UC (1986) Fluoride cycling innature through precipitation. Atmos Environ 20:1745–1749
Nair PR, George SK, Sunilkumar SV, Parameswaran K, Salu J,Annamma A (2006) Chemical composition of aerosols over pen-insular India during winter. Atmos Environ 40:6477–6493
Neumüller O (1981) Römpps Chemie Lexikon, 8th ed. Vol. 2.Stuttgart, Franck’sch Verlagshandlung
Pérez N, Pey J, Querol X, Alastuey A, López JM, Viana M (2008)Partitioning of major and trace components in PM10–PM2,5–PM1at an urban site in southern Europe. Atmos Environ 42:1677–1691
PN (Polish Norme) (1995) Determination of dissolved fluoride, chlo-ride, nitrite, orthophosphate, bromide, nitrate and sulphate usingion chromatography. Polish Committee for Standardization, thestandard number BS EN ISO 10304–1
Querol X, Alastuey A, Ruiz CR, Artiñano B, Hansson HC, HarrisonRM, Buringh E, ten Brink HM, Lutz M, Bruckmann P, Straehl P,Schneider J (2004) Speciation and origin of PM10 and PM2.5 inselected European cities. Atmos Environ 38:6547–6555
Rolph GD (2003) Real-time Environmental Applications and Displaysystem (READY) Website (http://www.arl.noaa.gov/ready/hysplit4.html). NOAA Air Resources Laboratory, Silver Spring,MD
Ruellan S, Cachier H (2001) Characterization of fresh particulate vehicularexhaust near a Paris high flow road. Atmos Environ 35:453–468
Ryall DB, Derwent RG, Manning AJ, Redington AL, Cirden J,Milington W, Semmonds PG, Doherty S, Carslaw N, Fuller GW(2002) The origin of high particulate concentration over theUnited Kingdom, March 2000. Atmos Environ 36:1363–1378
Schwarzenbach RP, Gschwend PM, Imboden DM (1993) Environmentalorganic chemistry. John Wiley &Sons, New York
Sloof W, Eerens H, Janus J, Ros J (1989) Integrated criteria document:Fluorides. Bilthoven, National Institute of Public Health andEnvironmental Protection (Report No. 758474010)
Viswanathan G, Jaswanth A, Gopalakrishnan S, Sivailango S (2009)Mapping of fluoride endemic areas and assessment of fluorideexposure. Sci Tot Environ 407:1578–1587
Weast R (1986) CRC handbook of chemistry and physics, 1985–1986.CRC Press, Boca Raton, Florida
Whitford GM (1990) The physiological and toxicological characteris-tics of fluoride. J Dent Res 69:539–549
WIOŚ (2009) Annual assessment of air quality in the Pomeranianprovince in 2008, Pomeranian Voivodship Inspector forEnvironmental Protection in Gdańsk 45 pp. (in Polish)
WHO (2002) Environmental Health Criteria 227. Fluorides. WHO,Geneva, pp 20–61
Environ Sci Pollut Res