Impacts of Torrefaction on PM10 Emissions from Biomass ...
10
Impacts of Torrefaction on PM 10 Emissions from Biomass Combustion Zihao Wang, Dunxi Yu * , Jingkun Han and Jianqun Wu State Key Laboratory of Coal Combustion, Huazhong University of Science and Technology, Wuhan, 430074, China * Corresponding Author: Dunxi Yu. Email: [email protected] Received: 06 February 2021 Accepted: 06 May 2021 ABSTRACT Typical biomass torrefaction is a mild pyrolysis process under conditions of ordinary pressure, low temperature (200–300°C) and inert atmosphere. Torrefaction is considered to be a competitive technology for biomass pre- treatment, but its impacts on the emissions of particulate matter from biomass combustion are worthy of further study. In this paper, three kinds of biomass, i.e., bagasse, wheat straw and sawdust were selected for torrefaction pretreatment and the impacts of torrefaction on the emission characteristics of PM 10 from biomass combustion were investigated. The combustion experiments were carried out on a drop tube furnace. The combustion-gen- erated particulate and bulk ash samples were collected and subjected to analyses by various techniques. The results show that torrefaction tends to result in a reduction of PM 1 (particulates with an aerodynamic diameter less than 1 μm) emissions from combustion, but the extent of reduction is dependent on biomass type. The reduc- tion of PM 1 from the combustion of torrefied biomass is mainly because that the torrefaction process removes some Cl and S from the biomass, thereby suppressing the release of alkali metals and the emissions of PM 1 during the combustion process. As for PM 1–10 (particulates with an aerodynamic diameter within 1–10 μm), its emis- sions from combustion of torrefied biomasses are consistently reduced, compared with their untreated counter- parts. This observation is primarily accounted for the enhanced particle coalescence/agglomeration in combustion of torrefied biomasses, which reduces the emissions of PM 1–10 . KEYWORDS Biomass; combustion; torrefaction; particulate matter 1 Introduction Coal still accounts for a significantly high proportion (>50%) in China’ s energy structure. Its energy utilization has caused adverse impacts on the ecological environment and human health, and the pursuit of new alternative energy has become a hot topic [1]. Biomass, with a huge global reserve, is considered as renewable carbon neutral energy [2,3]. Its utilization in the power sector has attracted significant attention [4]. Combustion is considered the most direct way to obtain energy from biomass [5]. However, biomass has many shortcomings in the direct combustion process. In terms of physical properties, biomass has high moisture content, poor grindability and low energy density, which limits its large-scale utilization. On the other hand, biomass usually contains high contents of AAEMs (alkali and alkali earth metals), Cl and S [6], which may aggravate the ash-related problems in the process of combustion. Meanwhile, the This work is licensed under a Creative Commons Attribution 4.0 International License, which permits unrestricted use, distribution, and reproduction in any medium, provided the original work is properly cited. DOI: 10.32604/EE.2021.016107 ARTICLE ech T Press Science
-
Upload
khangminh22 -
Category
Documents
-
view
1 -
download
0
Transcript of Impacts of Torrefaction on PM10 Emissions from Biomass ...
Impacts of Torrefaction on PM10 Emissions from Biomass Combustion
Zihao Wang, Dunxi Yu*, Jingkun Han and Jianqun Wu
State Key Laboratory of Coal Combustion, Huazhong University of Science and Technology, Wuhan, 430074, China*Corresponding Author: Dunxi Yu. Email: [email protected]
Received: 06 February 2021 Accepted: 06 May 2021
ABSTRACT
Typical biomass torrefaction is a mild pyrolysis process under conditions of ordinary pressure, low temperature(200–300°C) and inert atmosphere. Torrefaction is considered to be a competitive technology for biomass pre-treatment, but its impacts on the emissions of particulate matter from biomass combustion are worthy of furtherstudy. In this paper, three kinds of biomass, i.e., bagasse, wheat straw and sawdust were selected for torrefactionpretreatment and the impacts of torrefaction on the emission characteristics of PM10 from biomass combustionwere investigated. The combustion experiments were carried out on a drop tube furnace. The combustion-gen-erated particulate and bulk ash samples were collected and subjected to analyses by various techniques. Theresults show that torrefaction tends to result in a reduction of PM1 (particulates with an aerodynamic diameterless than 1 μm) emissions from combustion, but the extent of reduction is dependent on biomass type. The reduc-tion of PM1 from the combustion of torrefied biomass is mainly because that the torrefaction process removessome Cl and S from the biomass, thereby suppressing the release of alkali metals and the emissions of PM1 duringthe combustion process. As for PM1–10 (particulates with an aerodynamic diameter within 1–10 μm), its emis-sions from combustion of torrefied biomasses are consistently reduced, compared with their untreated counter-parts. This observation is primarily accounted for the enhanced particle coalescence/agglomeration in combustionof torrefied biomasses, which reduces the emissions of PM1–10.
KEYWORDS
Biomass; combustion; torrefaction; particulate matter
1 Introduction
Coal still accounts for a significantly high proportion (>50%) in China’s energy structure. Its energyutilization has caused adverse impacts on the ecological environment and human health, and the pursuitof new alternative energy has become a hot topic [1]. Biomass, with a huge global reserve, is consideredas renewable carbon neutral energy [2,3]. Its utilization in the power sector has attracted significantattention [4].
Combustion is considered the most direct way to obtain energy from biomass [5]. However, biomass hasmany shortcomings in the direct combustion process. In terms of physical properties, biomass has highmoisture content, poor grindability and low energy density, which limits its large-scale utilization. On theother hand, biomass usually contains high contents of AAEMs (alkali and alkali earth metals), Cl and S[6], which may aggravate the ash-related problems in the process of combustion. Meanwhile, the
This work is licensed under a Creative Commons Attribution 4.0 International License, whichpermits unrestricted use, distribution, and reproduction in any medium, provided the originalwork is properly cited.
DOI: 10.32604/EE.2021.016107
ARTICLE
echT PressScience
emissions of particulate matter, especially PM10 (particulates with an aerodynamic diameter less than 10 μm),are the main factor in the formation of haze. Therefore, pretreatment has often been adopted for theimprovement of biomass quality, and to facilitate its large-scale utilization.
As a promising pretreatment technology of biomass, torrefaction can significantly improve its calorificvalue, hydrophobicity, grindability and other characteristics through pyrolysis of raw biomass in an inertatmosphere at 200–300°C [7–9]. The moisture content of the torrefied biomass is usually below 3%, andthe low heating value is usually above 15 MJ/kg. Meanwhile, the grindability of the torrefied biomass isclose to that of some kinds of coal. The improvements of the characteristics of torrefied biomassreduce the cost of biomass utilization and improve the combustion stability. In addition, numerous studies[10–12] have shown that Cl, S and other elements in biomass will migrate and be released to a certainextent during the torrefaction process. These changes caused by torrefaction process are likely to affectthe emission characteristics of PM10 during torrefied biomass combustion.
In the existing literatures, focuses on the impacts of torrefaction on PM10 emission during biomasscombustion are limited. Wang et al. [13] compared PM10 emission from raw rice straw and torrefied ricestraw (300°C). It was found that PM0.3, PM0.3–1 and PM1–10 produced by the torrefied rice straw werereduced by 55%, 55% and 16%. Yani et al. [14] studied the emission behaviors of PM10 from thecombustion of raw and torrefied mallee leaf (220, 250, 280°C). It was found that the amount of PM1
produced by the torrefied mallee leaf decreased. Han et al. [15] found that torrefaction promoted themigration of alkali metals to PM1+ in the process of the combustion of torrefied rice husk (270°C), which ledto the decrease of the yields of PM1. These investigations are often limited to single biomass. Considering thegreat differences in the composition of different types of biomass [16], it is quite necessary to test thegeneralization of the conclusions obtained with a wider range of biomasses in the same reaction system.
This paper selected three biomasses of common interest for the investigation: bagasse (hereafter denoted asBG), wheat straw (hereafter denoted as WS) and sawdust (hereafter denoted as SD). They were torrefied at270°C after being crushed and screened. The torrefied samples were termed as TBG, TWS and TSD,respectively. The raw and torrefied samples were combusted in a drop tube furnace (DTF). The particulatematter and the bulk ash samples were collected for subsequent analysis. By characterizing the particle sizedistribution, element composition and particle morphology, the effects of torrefaction on the emissioncharacteristics of PM10 from biomass combustion were explored. The underlying mechanisms were elucidated.
2 Experimental
2.1 Sample Preparation and Torrefaction TestsThe torrefaction experiment was carried out in a fixed-bed reactor. It consists of air intake section,
temperature control section, heating section and water-cooling section. Before the torrefaction experiment,the raw biomass was first ground by a knife mill and sieved to below 100 μm. The raw biomass wasplaced in a covered porcelain boat and the porcelain boat was placed in a calibrated constant temperaturezone of the fixed-bed reactor with N2 continuously introduced at a flow rate of 3 L/min to ensure aninert atmosphere in the reactor. The temperature of the reactor was raised to 270°C at a heating rate of15 °C/min, and kept at 270°C for 30 min. Then the porcelain boat was taken out and placed in aN2-flowed container to quench to room temperature. The mass yields of the residue solids from thetorrefaction of BG, WS and SD were 75.5%, 72.5%, and 81.3%, respectively.
2.2 Sample AnalysesProximate analysis of samples was performed according to the standard GB/T 28731-2012. Ultimate
analysis was performed according to standard ASTM D5373, and the composition of ash was measuredby X-Ray Fluorescence Spectrometry (XRF). In view of the obvious contents of AAEMs in each sample,and the important role they played in the emissions of PM10, the raw and torrefied samples were all
1268 EE, 2021, vol.118, no.5
digested by a mixed solution of nitric acid, hydrogen peroxide and hydrofluoric acid, and then the mixedsolution was analyzed by Inductively Coupled Plasma-Mass Spectrometry (ICP-MS) to performquantitative analysis of AAEMs. The results will be discussed below.
2.3 Combustion Tests and Sample AnalysisThe combustion tests of raw and torrefied biomass were carried out in a drop tube furnace whose
configuration has been detailed elsewhere [17]. The drop tube furnace system consists of feeding section,reaction section, air inlet section and temperature control section. The feeder is a vibrating powder feederproduced by Sanki. The reaction tube of this system is a corundum tube with a length of 2000 mm andan inner diameter of 56 mm. The furnace body of this system is heated by a silicon carbide rod and thelength of the constant temperature zone of the furnace body is 1500 mm. The air inlet section iscomposed of a gas cylinder, a pressure reducing valve and a mass flowmeter. According to the actualcombustion temperature of the pulverized coal furnace and at the same time providing a reference for thestudy of co-firing of biomass and coal, the experimental temperature was set at 1300°C. The experimentalatmosphere was air with a flow rate of 10 L/min. The samples were fed into the furnace at a rate of0.1 g/min, and the residence time of samples in the furnace was about 2 s. The flue gas generated bycombustion was extracted by a vacuum pump and passed through a sampling tube with water coolingand N2 quenching to avoid secondary reactions. The particles from combustion were collected by acyclone separator and a Dekati Low Pressure Impactor (DLPI) with a heating system. The temperature ofthe heating system was set to 135°C to prevent the acid condensation [18]. Particles with aerodynamicdiameter larger than 10 μm (PM10+) were collected by the cyclone separator. Particles collected by DLPIwere defined as PM10, and separated into 14 stages of which the particles collected at Stages 1–8 werecorresponded to PM1 and those at Stages 9–14 were corresponded to PM1–10. The experiments of eachcondition were conducted at least 3 times to ensure data accuracy. The bulk ash from combustion wascollected by fiberglass filters. The particle collection experiments and the bulk ash collection experimentswere carried out separately. The particle size distributions of PM10 were obtained by weighing theparticles collected in each stage of DLPI with an electronic balance (accuracy of 0.001 mg). Thecomposition and microscopic morphology of particles and bulk ash were characterized by ScanningElectron Microscope with an Energy Dispersive Spectrometer (SEM-EDS).
3 Result and Discussion
3.1 Properties of the Torrefied BiomassTab. 1 shows the basic fuel properties of the raw and torrefied biomass. Compared with BG,WS and SD, the
contents of volatile matter and moisture of TBG, TWS and TSD are significantly reduced, and the mole ratio ofC/H and C/O increases by 23%, 27%, 19% and 24%, 36%, 22%, respectively. This means that there will be lessenergy loss during the combustion of torrefied biomass. According to the formula: element release rate = 1–(element content of torrefied sample *mass yield)/(element content of raw sample), it can be calculated that Nis basically not released during torrefaction process. S is released by 50%, 54%, 49% and Cl is released by67%, 5%, and 19%, respectively. In view of the fact that the presence of Cl and S can promote the release ofalkali metals and the generation of particulate matter during combustion, the release of Cl and S in thetorrefaction process is likely to affect the generation of particulate matter during combustion process.
From the analysis of ash composition, it shows that the main component of BG and TBG ashes is SiO2
(about 60%). The WS and TWS ashes contain high levels of SiO2 (about 40%), K2O (20%) and CaO (10%).On the other hand, CaO is the most important component of SD and TSD ashes, accounting for about 45%.The many differences of different types of biomass may have important impacts on the generation of PM10
from combustion.
EE, 2021, vol.118, no.5 1269
3.2 Particle Size Distributions (PSDs), Yields and Element Compositions of PM10
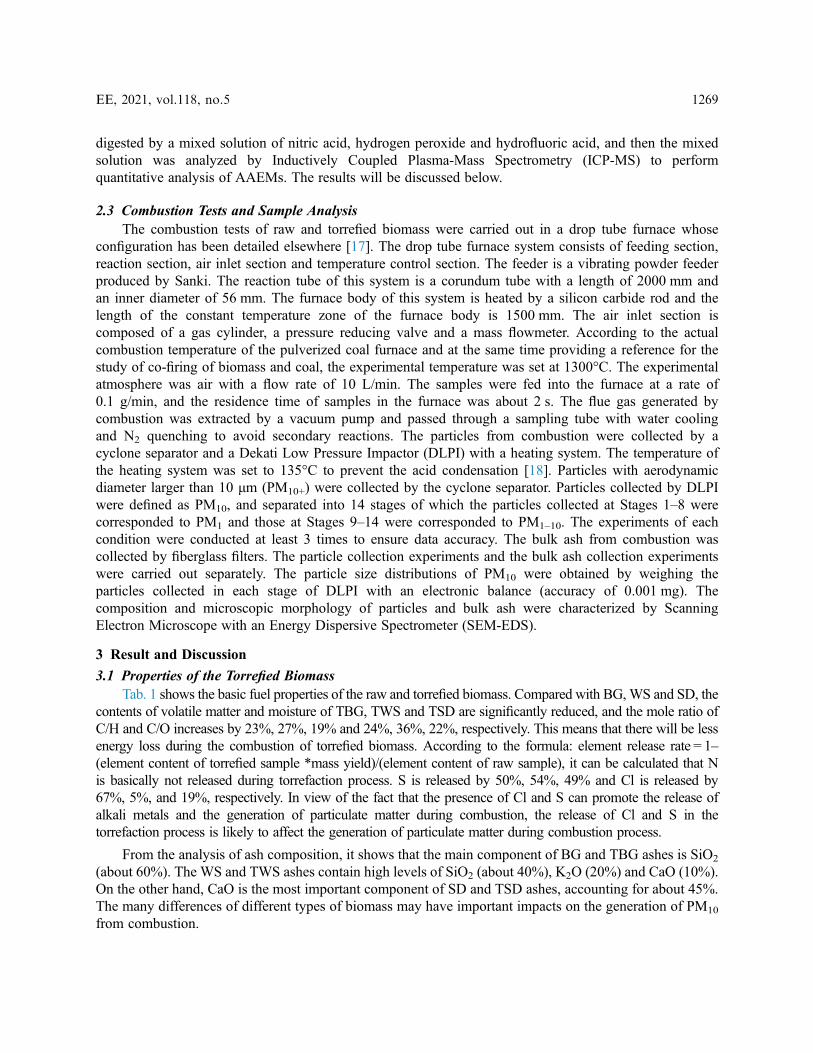
The particle size distributions of PM10 are shown in Fig. 1, and the results are based on the ash content ofthe samples. It can be concluded that the particle size distributions of PM10 produced by the combustion ofthese samples are approximately bimodally distributed, and the dividing point of the fine and coarse modes isaround 1 μm, which is consistent with previous studies [19] and also in line with the generation mechanismof PM10 [20]. The PM1 is principally formed by vaporization-condensation, while PM1–10 is mainly formedthrough fragmentation of char and excluded minerals, coalescence/agglomeration of included minerals andash particles. For BG and TBG, the peaks of the fine mode and coarse mode are located near 0.05 μm and4.4 μm, respectively (Fig. 1a), but the two peaks of PSDs of TBG are lower than those of BG. On the otherhand, the particle size distribution of PM1 from the combustion of TBG is generally below that from thecombustion of BG. For WS and TWS, the fine mode and coarse mode peaks are located around 0.08 μmand 4.4 μm, respectively (Fig. 1b), and the particle size distribution of PM1–10 from the combustion ofTWS is generally below that from the combustion of WS. The peaks of fine mode and coarse mode ofSD and TSD are located around 0.05 μm and 4.4 μm, respectively (Fig. 1c), and the particle sizedistributions of fine mode are similar as for SD and TSD, while the coarse mode peak decreasessignificantly for the combustion of TSD.
Table 1: Fuel properties of different biomasses (ad, wt, %)
Samples Proximate analysis Ultimate analysis
Ash Volatile matter Fixed carbon Moisture C H O* N S Cl
BG 5.82 75.96 14.24 3.98 45.14 5.76 38.75 0.40 0.15 0.046
TBG 7.17 67.91 24.03 0.89 50.81 5.28 35.20 0.55 0.10 0.020
WS 11.73 68.20 15.27 4.80 40.90 5.55 35.50 1.08 0.44 1.003
TWS 15.39 57.51 25.90 1.20 46.88 5.01 29.92 1.32 0.28 1.310
SD 8.09 72.64 17.01 2.26 44.21 5.63 38.83 0.68 0.30 0.012
TSD 9.87 67.27 22.10 0.76 48.32 5.17 34.76 0.93 0.19 0.012
Samples Na2O MgO Al2O3 SiO2 P2O5 SO3 Cl K2O CaO Fe2O3
BG n.a. 3.57 5.53 61.09 5.76 4.40 n.a. 7.71 6.64 5.30
TBG n.a. 2.98 5.44 58.92 5.57 4.15 n.a. 8.71 7.34 6.89
WS n.a. 4.10 4.32 41.54 3.19 7.31 9.72 18.57 9.94 1.31
TWS n.a. 3.37 4.00 37.01 3.16 8.29 11.02 20.35 11.16 1.64
SD n.a. 4.67 5.66 24.01 4.09 7.88 n.a. 6.36 44.59 2.74
TSD n.a. 5.65 6.38 17.34 4.70 8.78 n.a. 6.98 47.77 2.40Note: *:by difference.
Figure 1: Particle size distributions of PM10 from combustion of different biomasses
1270 EE, 2021, vol.118, no.5
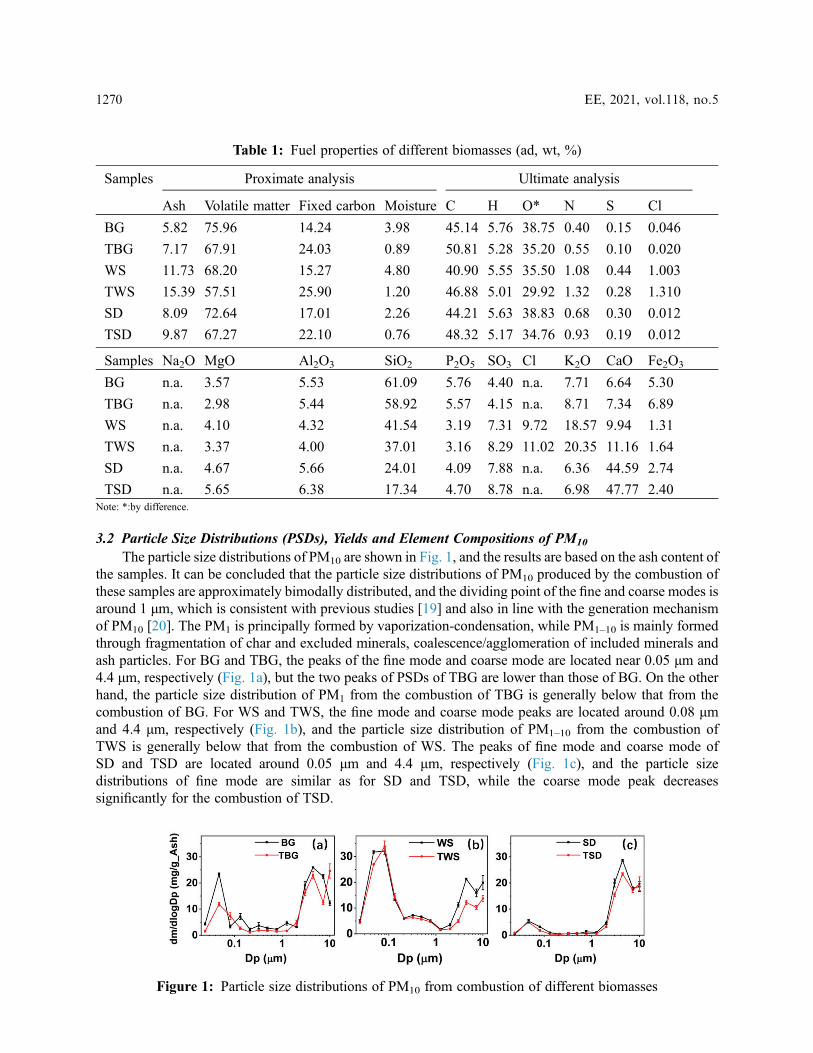
Due to the different emission mechanisms of fine and coarse modes particles, PM10 is divided into PM1
and PM1–10 for further research. Fig. 2 shows the yields of PM1 and PM1–10 based on the ash content toexplore the yields capacity of PM10 of these samples. The yields of PM1 and PM1–10 from thecombustion of BG, WS and SD are 11.4 mg/g_Ash, 24.0 mg/g_Ash, 2.9 mg/g_Ash and 16.1 mg/g_Ash,12.2 mg/g_Ash, 15.4 mg/g_Ash. Compared with BG, the yields of PM1 from the combustion of TBGdecrease by about 40%. Compared with WS and SD, the yields of PM1 from the combustion of TWS andTSD also show a decreasing trend, but the reduction degrees are not as obvious as the reduction degreeof TBG. In addition, compared with raw biomass, the yields of PM1–10 produced by the combustion oftorrefied biomass are also reduced to varying degrees. Compared with BG, WS and SD, the yields ofPM1–10 from TBG, TWS and TSD are reduced by approximately 19%, 40% and 13%, respectively. Theresult indicates that torrefaction process may promote the coalescence/agglomeration of PM1–10 or inhibitthe breaking of particles in the combustion process. On the other hand, our group’s existing research [13]on the raw and torrefied rice straw showed that compared with raw rice straw, the yields of PM1 andPM1–10 from the combustion of torrefied rice straw (300°C) were also reduced. And our group’s existingresearch [15] on the rice husk also showed that torrefied rice husk produced less amount of PM1.
In order to further understand the characteristics of PM10 of these samples, the elemental compositionsof PM1, PM1–10 and PM10+ were tested and characterized, and the results are shown in Fig. 3. Thecompositions of PM1 in each sample are mainly composed of easily vaporized elements such as Cl, S, Naand K, which is consistent with the mechanism that PM1 is mainly formed by the vaporization andcondensation of alkali metal salt. For WS and TWS, PM1 is mainly composed of alkali chlorides. For SDand TSD with low content of Cl and high content of S, PM1 contains more alkali sulfates. For BG, TBG,WS and TWS, the main elements in PM1–10 from combustion are Si, Ca, Fe, and K, while PM1–10 fromthe combustion of SD and TSD mainly contains Ca. The kinds of the main elements of PM10+ from thecombustion of each sample are similar to those of the corresponding PM1–10. On the other hand, it isworth noting that compared with SD and TSD, the contents of K and Si of PM1–10 and PM10+ from thecombustion of the other four samples are more obvious, which may have an impact on the generationof PM1–10.
3.3 The Impacts of Torrefaction on the Transformation of Elements in PM10
In order to explore the reasons for the different emission characteristics of PM10 from the combustion ofraw and torrefied biomass, the yields of each element in PM1 and PM1–10 were analyzed and compared. The
Figure 2: Ash-based yields of PM1 and PM1–10 from combustion of different biomasses
EE, 2021, vol.118, no.5 1271
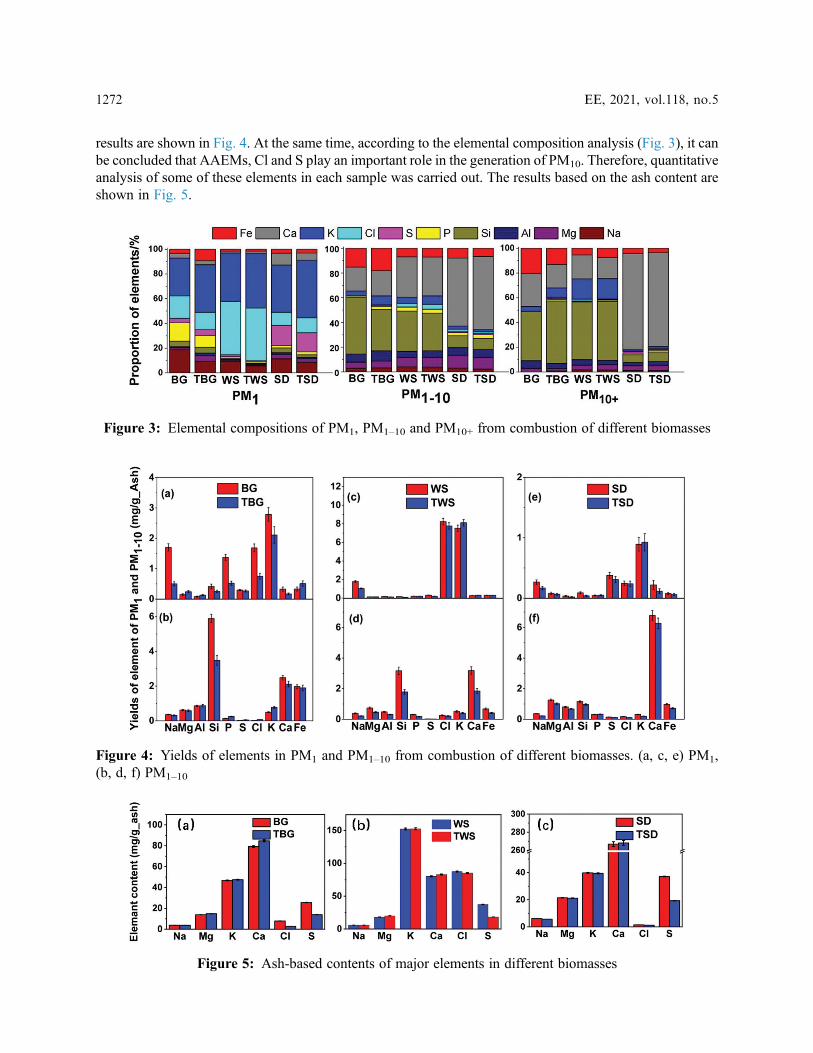
results are shown in Fig. 4. At the same time, according to the elemental composition analysis (Fig. 3), it canbe concluded that AAEMs, Cl and S play an important role in the generation of PM10. Therefore, quantitativeanalysis of some of these elements in each sample was carried out. The results based on the ash content areshown in Fig. 5.
Figure 3: Elemental compositions of PM1, PM1–10 and PM10+ from combustion of different biomasses
Figure 4: Yields of elements in PM1 and PM1–10 from combustion of different biomasses. (a, c, e) PM1,(b, d, f) PM1–10
Figure 5: Ash-based contents of major elements in different biomasses
1272 EE, 2021, vol.118, no.5
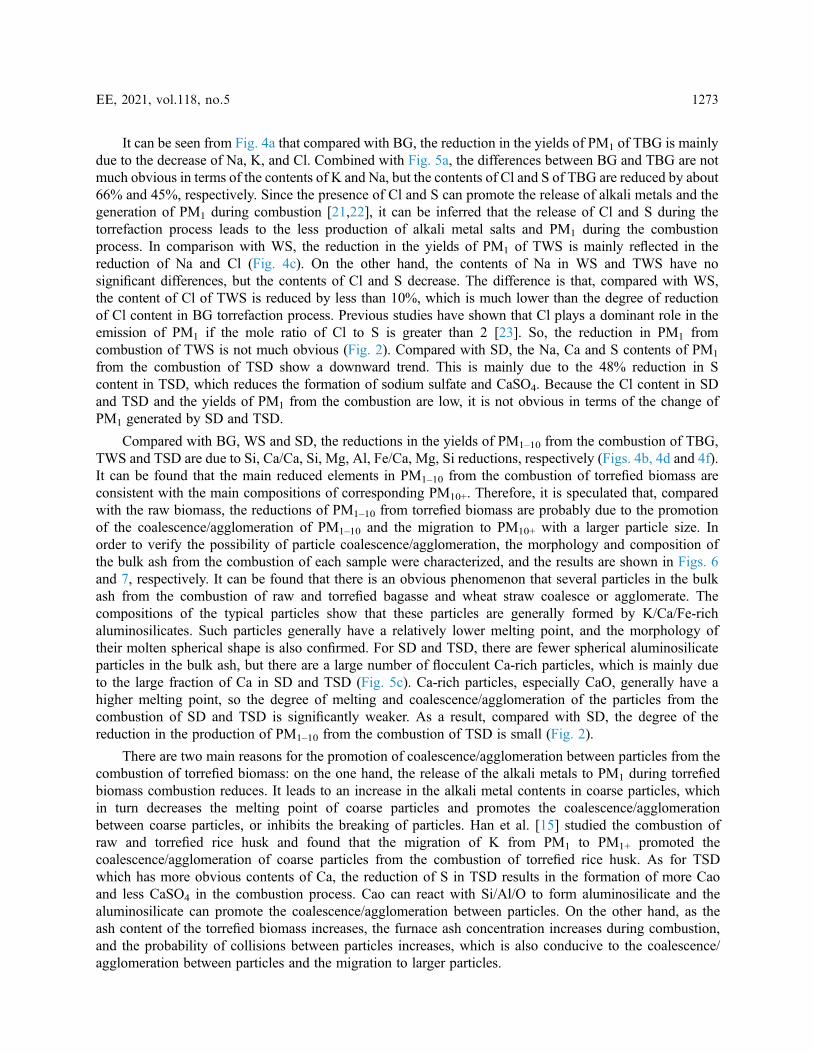
It can be seen from Fig. 4a that compared with BG, the reduction in the yields of PM1 of TBG is mainlydue to the decrease of Na, K, and Cl. Combined with Fig. 5a, the differences between BG and TBG are notmuch obvious in terms of the contents of K and Na, but the contents of Cl and S of TBG are reduced by about66% and 45%, respectively. Since the presence of Cl and S can promote the release of alkali metals and thegeneration of PM1 during combustion [21,22], it can be inferred that the release of Cl and S during thetorrefaction process leads to the less production of alkali metal salts and PM1 during the combustionprocess. In comparison with WS, the reduction in the yields of PM1 of TWS is mainly reflected in thereduction of Na and Cl (Fig. 4c). On the other hand, the contents of Na in WS and TWS have nosignificant differences, but the contents of Cl and S decrease. The difference is that, compared with WS,the content of Cl of TWS is reduced by less than 10%, which is much lower than the degree of reductionof Cl content in BG torrefaction process. Previous studies have shown that Cl plays a dominant role in theemission of PM1 if the mole ratio of Cl to S is greater than 2 [23]. So, the reduction in PM1 fromcombustion of TWS is not much obvious (Fig. 2). Compared with SD, the Na, Ca and S contents of PM1
from the combustion of TSD show a downward trend. This is mainly due to the 48% reduction in Scontent in TSD, which reduces the formation of sodium sulfate and CaSO4. Because the Cl content in SDand TSD and the yields of PM1 from the combustion are low, it is not obvious in terms of the change ofPM1 generated by SD and TSD.
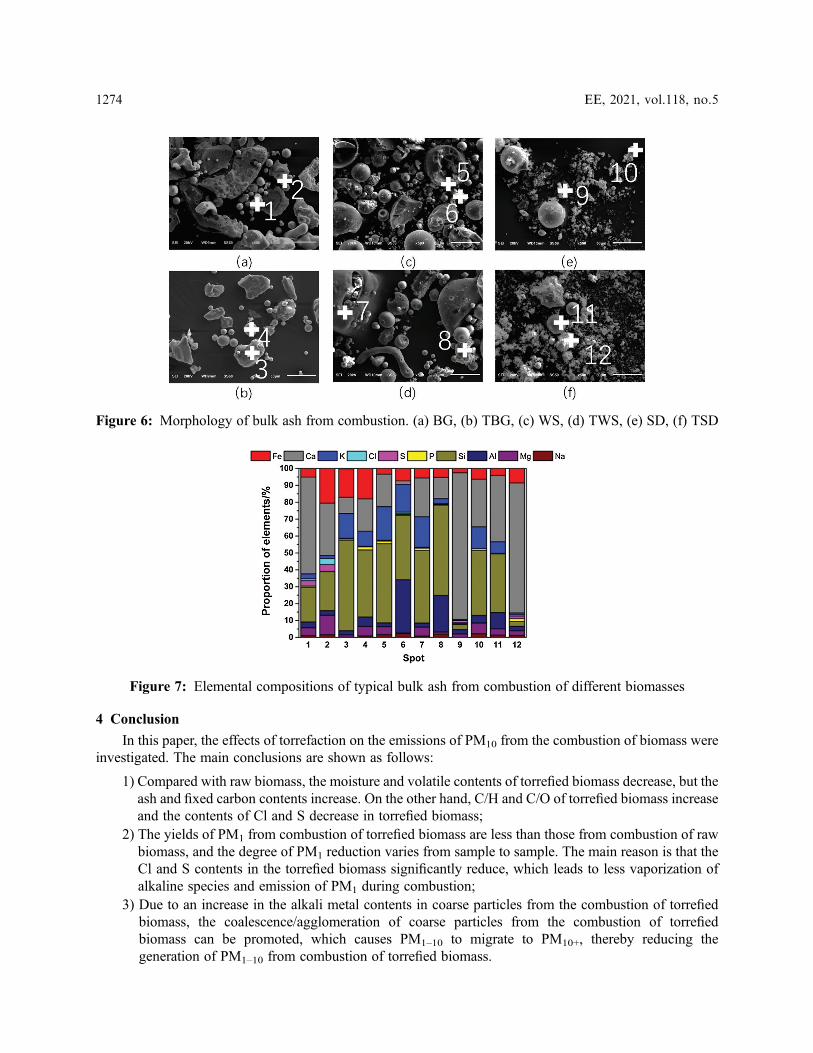
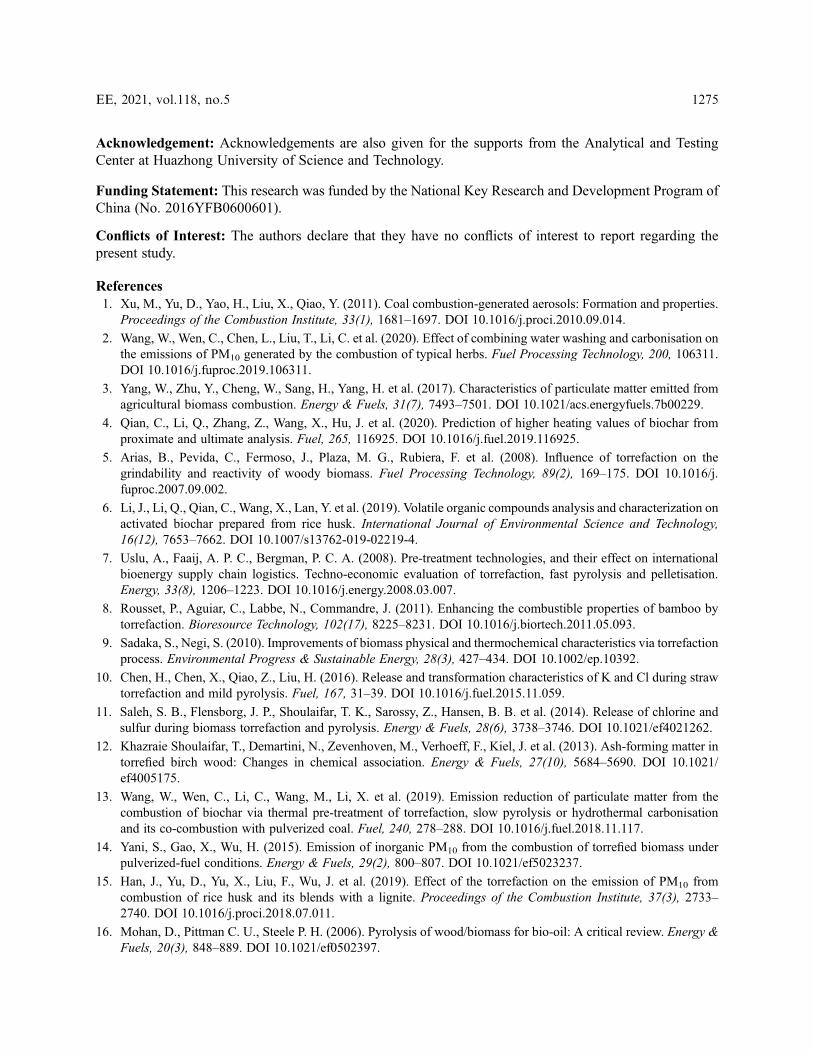
Compared with BG, WS and SD, the reductions in the yields of PM1–10 from the combustion of TBG,TWS and TSD are due to Si, Ca/Ca, Si, Mg, Al, Fe/Ca, Mg, Si reductions, respectively (Figs. 4b, 4d and 4f).It can be found that the main reduced elements in PM1–10 from the combustion of torrefied biomass areconsistent with the main compositions of corresponding PM10+. Therefore, it is speculated that, comparedwith the raw biomass, the reductions of PM1–10 from torrefied biomass are probably due to the promotionof the coalescence/agglomeration of PM1–10 and the migration to PM10+ with a larger particle size. Inorder to verify the possibility of particle coalescence/agglomeration, the morphology and composition ofthe bulk ash from the combustion of each sample were characterized, and the results are shown in Figs. 6and 7, respectively. It can be found that there is an obvious phenomenon that several particles in the bulkash from the combustion of raw and torrefied bagasse and wheat straw coalesce or agglomerate. Thecompositions of the typical particles show that these particles are generally formed by K/Ca/Fe-richaluminosilicates. Such particles generally have a relatively lower melting point, and the morphology oftheir molten spherical shape is also confirmed. For SD and TSD, there are fewer spherical aluminosilicateparticles in the bulk ash, but there are a large number of flocculent Ca-rich particles, which is mainly dueto the large fraction of Ca in SD and TSD (Fig. 5c). Ca-rich particles, especially CaO, generally have ahigher melting point, so the degree of melting and coalescence/agglomeration of the particles from thecombustion of SD and TSD is significantly weaker. As a result, compared with SD, the degree of thereduction in the production of PM1–10 from the combustion of TSD is small (Fig. 2).
There are two main reasons for the promotion of coalescence/agglomeration between particles from thecombustion of torrefied biomass: on the one hand, the release of the alkali metals to PM1 during torrefiedbiomass combustion reduces. It leads to an increase in the alkali metal contents in coarse particles, whichin turn decreases the melting point of coarse particles and promotes the coalescence/agglomerationbetween coarse particles, or inhibits the breaking of particles. Han et al. [15] studied the combustion ofraw and torrefied rice husk and found that the migration of K from PM1 to PM1+ promoted thecoalescence/agglomeration of coarse particles from the combustion of torrefied rice husk. As for TSDwhich has more obvious contents of Ca, the reduction of S in TSD results in the formation of more Caoand less CaSO4 in the combustion process. Cao can react with Si/Al/O to form aluminosilicate and thealuminosilicate can promote the coalescence/agglomeration between particles. On the other hand, as theash content of the torrefied biomass increases, the furnace ash concentration increases during combustion,and the probability of collisions between particles increases, which is also conducive to the coalescence/agglomeration between particles and the migration to larger particles.
EE, 2021, vol.118, no.5 1273
4 Conclusion
In this paper, the effects of torrefaction on the emissions of PM10 from the combustion of biomass wereinvestigated. The main conclusions are shown as follows:
1) Compared with raw biomass, the moisture and volatile contents of torrefied biomass decrease, but theash and fixed carbon contents increase. On the other hand, C/H and C/O of torrefied biomass increaseand the contents of Cl and S decrease in torrefied biomass;
2) The yields of PM1 from combustion of torrefied biomass are less than those from combustion of rawbiomass, and the degree of PM1 reduction varies from sample to sample. The main reason is that theCl and S contents in the torrefied biomass significantly reduce, which leads to less vaporization ofalkaline species and emission of PM1 during combustion;
3) Due to an increase in the alkali metal contents in coarse particles from the combustion of torrefiedbiomass, the coalescence/agglomeration of coarse particles from the combustion of torrefiedbiomass can be promoted, which causes PM1–10 to migrate to PM10+, thereby reducing thegeneration of PM1–10 from combustion of torrefied biomass.
Figure 7: Elemental compositions of typical bulk ash from combustion of different biomasses
Figure 6: Morphology of bulk ash from combustion. (a) BG, (b) TBG, (c) WS, (d) TWS, (e) SD, (f) TSD
1274 EE, 2021, vol.118, no.5
Acknowledgement: Acknowledgements are also given for the supports from the Analytical and TestingCenter at Huazhong University of Science and Technology.
Funding Statement: This research was funded by the National Key Research and Development Program ofChina (No. 2016YFB0600601).
Conflicts of Interest: The authors declare that they have no conflicts of interest to report regarding thepresent study.
References1. Xu, M., Yu, D., Yao, H., Liu, X., Qiao, Y. (2011). Coal combustion-generated aerosols: Formation and properties.
Proceedings of the Combustion Institute, 33(1), 1681–1697. DOI 10.1016/j.proci.2010.09.014.
2. Wang, W., Wen, C., Chen, L., Liu, T., Li, C. et al. (2020). Effect of combining water washing and carbonisation onthe emissions of PM10 generated by the combustion of typical herbs. Fuel Processing Technology, 200, 106311.DOI 10.1016/j.fuproc.2019.106311.
3. Yang, W., Zhu, Y., Cheng, W., Sang, H., Yang, H. et al. (2017). Characteristics of particulate matter emitted fromagricultural biomass combustion. Energy & Fuels, 31(7), 7493–7501. DOI 10.1021/acs.energyfuels.7b00229.
4. Qian, C., Li, Q., Zhang, Z., Wang, X., Hu, J. et al. (2020). Prediction of higher heating values of biochar fromproximate and ultimate analysis. Fuel, 265, 116925. DOI 10.1016/j.fuel.2019.116925.
5. Arias, B., Pevida, C., Fermoso, J., Plaza, M. G., Rubiera, F. et al. (2008). Influence of torrefaction on thegrindability and reactivity of woody biomass. Fuel Processing Technology, 89(2), 169–175. DOI 10.1016/j.fuproc.2007.09.002.
6. Li, J., Li, Q., Qian, C., Wang, X., Lan, Y. et al. (2019). Volatile organic compounds analysis and characterization onactivated biochar prepared from rice husk. International Journal of Environmental Science and Technology,16(12), 7653–7662. DOI 10.1007/s13762-019-02219-4.
7. Uslu, A., Faaij, A. P. C., Bergman, P. C. A. (2008). Pre-treatment technologies, and their effect on internationalbioenergy supply chain logistics. Techno-economic evaluation of torrefaction, fast pyrolysis and pelletisation.Energy, 33(8), 1206–1223. DOI 10.1016/j.energy.2008.03.007.
8. Rousset, P., Aguiar, C., Labbe, N., Commandre, J. (2011). Enhancing the combustible properties of bamboo bytorrefaction. Bioresource Technology, 102(17), 8225–8231. DOI 10.1016/j.biortech.2011.05.093.
9. Sadaka, S., Negi, S. (2010). Improvements of biomass physical and thermochemical characteristics via torrefactionprocess. Environmental Progress & Sustainable Energy, 28(3), 427–434. DOI 10.1002/ep.10392.
10. Chen, H., Chen, X., Qiao, Z., Liu, H. (2016). Release and transformation characteristics of K and Cl during strawtorrefaction and mild pyrolysis. Fuel, 167, 31–39. DOI 10.1016/j.fuel.2015.11.059.
11. Saleh, S. B., Flensborg, J. P., Shoulaifar, T. K., Sarossy, Z., Hansen, B. B. et al. (2014). Release of chlorine andsulfur during biomass torrefaction and pyrolysis. Energy & Fuels, 28(6), 3738–3746. DOI 10.1021/ef4021262.
12. Khazraie Shoulaifar, T., Demartini, N., Zevenhoven, M., Verhoeff, F., Kiel, J. et al. (2013). Ash-forming matter intorrefied birch wood: Changes in chemical association. Energy & Fuels, 27(10), 5684–5690. DOI 10.1021/ef4005175.
13. Wang, W., Wen, C., Li, C., Wang, M., Li, X. et al. (2019). Emission reduction of particulate matter from thecombustion of biochar via thermal pre-treatment of torrefaction, slow pyrolysis or hydrothermal carbonisationand its co-combustion with pulverized coal. Fuel, 240, 278–288. DOI 10.1016/j.fuel.2018.11.117.
14. Yani, S., Gao, X., Wu, H. (2015). Emission of inorganic PM10 from the combustion of torrefied biomass underpulverized-fuel conditions. Energy & Fuels, 29(2), 800–807. DOI 10.1021/ef5023237.
15. Han, J., Yu, D., Yu, X., Liu, F., Wu, J. et al. (2019). Effect of the torrefaction on the emission of PM10 fromcombustion of rice husk and its blends with a lignite. Proceedings of the Combustion Institute, 37(3), 2733–2740. DOI 10.1016/j.proci.2018.07.011.
16. Mohan, D., Pittman C. U., Steele P. H. (2006). Pyrolysis of wood/biomass for bio-oil: A critical review. Energy &Fuels, 20(3), 848–889. DOI 10.1021/ef0502397.
EE, 2021, vol.118, no.5 1275
17. Yu, Y., Xu, M., Yao, H., Yu, D., Qiao, Y. et al. (2007). Char characteristics and particulate matter formation duringChinese bituminous coal combustion. Proceedings of the Combustion Institute, 31(2), 1947–1954. DOI 10.1016/j.proci.2006.07.116.
18. Gao, X., Wu, H. (2010). Effect of sampling temperature on the properties of inorganic particulate matter collectedfrom biomass combustion in a drop-tube furnace. Energy & Fuels, 24(8), 4571–4580. DOI 10.1021/ef100701r.
19. JimÉnez, S., Ballester, J. (2006). Particulate matter formation and emission in the combustion of different pulverizedbiomass fuels. Combustion Science and Technology, 178(4), 655–683. DOI 10.1080/00102200500241248.
20. Garcia-Maraver, A., Zamorano, M., Fernandes, U., Rabacal, M., Costa, M. (2014). Relationship between fuelquality and gaseous and particulate matter emissions in a domestic pellet-fired boiler. Fuel, 119, 141–152. DOI10.1016/j.fuel.2013.11.037.
21. Wang, X., Hu, Z., Adeosun, A., Liu, B., Ruan, R. et al. (2018). Particulate matter emission and K/S/Cltransformation during biomass combustion in an entrained flow reactor. Journal of the Energy Institute, 91(6),835–844. DOI 10.1016/j.joei.2017.10.005.
22. Johansen, J. M., Jakobsen, J. G., Frandsen, F. J., Glarborg, P. (2011). Release of K, Cl, and S during pyrolysis andcombustion of high-chlorine biomass. Energy & Fuels, 25(11), 4961–4971. DOI 10.1021/ef201098n.
23. Kassman, H., Bäfver, L., Åmand, L. (2010). The importance of SO2 and SO3 for sulphation of gaseous KCl–Anexperimental investigation in a biomass fired CFB boiler. Combustion and Flame, 157(9), 1649–1657. DOI10.1016/j.combustflame.2010.05.012.
1276 EE, 2021, vol.118, no.5