The spatial variability of PM2.5 over Europe using satellite POLDER-3/PARASOL data
Subscriber access provided by - UC Berkeley Library
Environmental Science & Technology is published by the American Chemical Society.1155 Sixteenth Street N.W., Washington, DC 20036Published by American Chemical Society. Copyright © American Chemical Society.However, no copyright claim is made to original U.S. Government works, or worksproduced by employees of any Commonwealth realm Crown government in the courseof their duties.
ArticleQuantification of Global Primary Emissions of PM2.5, PM10,and TSP from Combustion and Industrial Process Sources
Ye Huang, Huizhong Shen, Han Chen, Rong Wang, Yanyan Zhang, Shu Su, Yuanchen Chen, NanLin, Shaojie Zhuo, Qirui Zhong, Xilong Wang, Junfeng Liu, Bengang Li, Wenxin LIU, and Shu TaoEnviron. Sci. Technol., Just Accepted Manuscript • DOI: 10.1021/es503696k • Publication Date (Web): 27 Oct 2014
Downloaded from http://pubs.acs.org on November 6, 2014
Just Accepted
“Just Accepted” manuscripts have been peer-reviewed and accepted for publication. They are postedonline prior to technical editing, formatting for publication and author proofing. The American ChemicalSociety provides “Just Accepted” as a free service to the research community to expedite thedissemination of scientific material as soon as possible after acceptance. “Just Accepted” manuscriptsappear in full in PDF format accompanied by an HTML abstract. “Just Accepted” manuscripts have beenfully peer reviewed, but should not be considered the official version of record. They are accessible to allreaders and citable by the Digital Object Identifier (DOI®). “Just Accepted” is an optional service offeredto authors. Therefore, the “Just Accepted” Web site may not include all articles that will be publishedin the journal. After a manuscript is technically edited and formatted, it will be removed from the “JustAccepted” Web site and published as an ASAP article. Note that technical editing may introduce minorchanges to the manuscript text and/or graphics which could affect content, and all legal disclaimersand ethical guidelines that apply to the journal pertain. ACS cannot be held responsible for errorsor consequences arising from the use of information contained in these “Just Accepted” manuscripts.
1
Quantification of Global Primary Emissions of PM2.5, PM10, and TSP from 1 Combustion and Industrial Process Sources 2
Ye Huang, Huizhong Shen, Han Chen, Rong Wang, Yanyan Zhang, Shu Su, Yuanchen Chen, 3 Nan Lin, Shaojie Zhuo, Qirui Zhong, Xilong Wang, Junfeng Liu, Bengang Li, Wenxin Liu, Shu 4 Tao* 5
Laboratory for Earth Surface Processes, College of Urban and Environmental Sciences, 6 Peking University, Beijing 100871, China. 7 8 * Corresponding author: phone and fax: +86-10-62751938; email: [email protected] 9 10 The authors declare no competing financial interest. 11
Page 1 of 19
ACS Paragon Plus Environment
Environmental Science & Technology
2
ABSTRACT 12
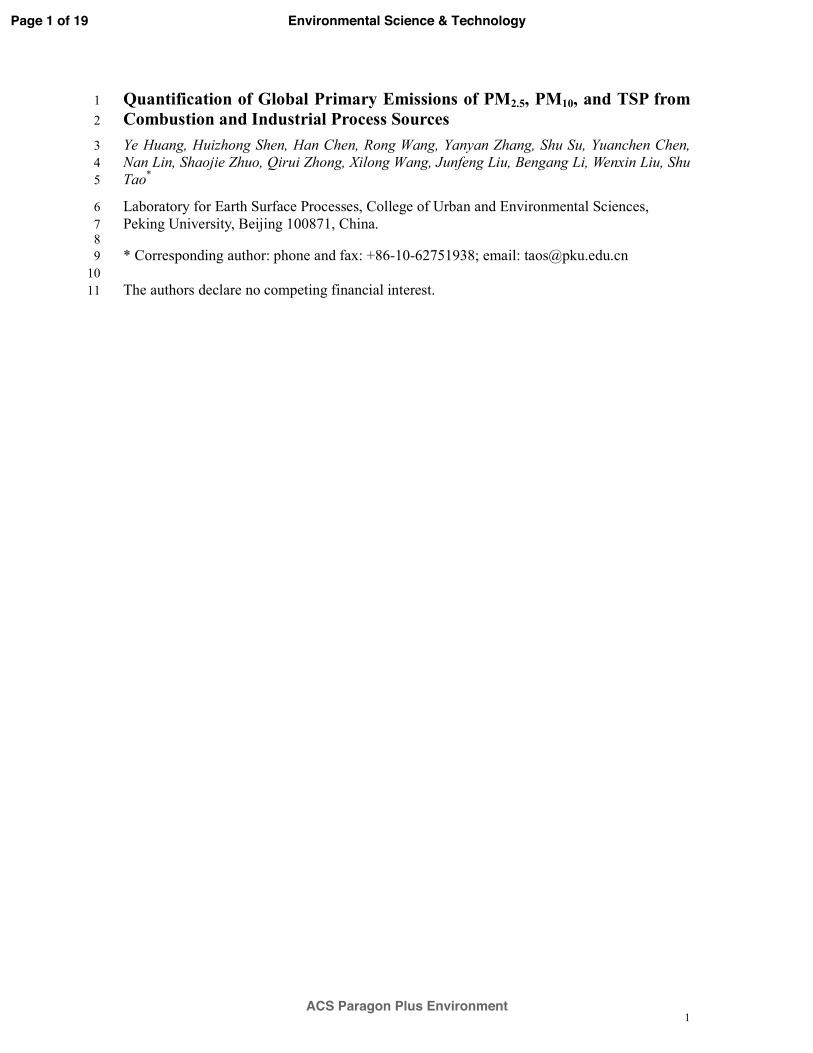
Emission quantification of primary particulate matter (PM) is essential for assessment of its 13 related climate and health impacts. To reduce uncertainty associated with global emissions of 14 PM2.5, PM10, and TSP, we compiled data with high spatial (0.1°×0.1°) and sectorial (77 15 primary sources) resolutions for 2007 based on a newly released global fuel data product 16 (PKU-FUEL-2007), and an emission factor database. Our estimates for developing countries 17 are higher than those previously reported. Spatial bias associated with large countries could be 18 reduced by using sub-national fuel consumption data. Additionally, we looked at temporal 19 trends from 1960 to 2009 at country-scale resolution. Although total emissions are still 20 increasing in developing countries, their intensities in terms of gross domestic production or 21 energy consumption have decreased. PM emitted in developed countries is finer owing to a 22 larger contribution from non-industrial sources, and use of abatement technologies. In contrast, 23 countries like China, with strong industry emissions and limited abatement facilities, emit 24 coarser PM. The health impacts of PM are intensified in hotspots and cities owing to 25 covariance of sources and receptors. Although urbanization reduces the per person emission, 26 overall health impacts related to these emissions are heightened because of aggregation 27 effects. 28
29
30 31 32 33 34 Corresponding author phone and fax: 0086-10-62751938, email: [email protected] 35 The authors declare no competing financial interest. 36 37 Word count for text: 5179 38 Word count for 5 figures: 1800 = 600+300x4 39 Total word count: 6979 40
41
90°N
60°N
30°N
0°
30°S
60°S
90°S 180° 150° 120° 90°W 30°W 30°E 60°W 0° 60°E 90°E 120°E 180°E 150°E
2009 1960
70
0
TOC Art
Page 2 of 19
ACS Paragon Plus Environment
Environmental Science & Technology
3
INTRODUCTION 42
Particulate matter (PM) in air affects both climate1 and health.2 Frequent occurrences of thick 43 haze in eastern China have raised extensive health concerns in recent years.3,4 Based on the 44 data collected by the American Cancer Society as a part of the Cancer Prevention Study II, 45 Pope et al. estimated that a 10 µg/m3 increase in PM2.5 (particles with aerodynamic size less 46 than 2.5 µm) within a range from 5 to 30 µg/m3 in air could lead to a 6 and 8% increase in 47 cardiopulmonary and lung cancer mortalities, respectively, for people aged 30 or older;2 while 48 in 2005, 376 thousands premature deaths were attributed to exposure to PM2.5 in China.5 49 Additionally, PM in air may cause changes in surface temperature,6 solar radiation,7 cloud 50 properties,8 and precipitation,9 leading to major effects on climate. It was estimated that 51 32-73% of ambient PM were from primary source.10,11 Wildfire, dust, and sea salt were major 52 natural sources. Both health and climate impacts of PM are size dependent. Evidences from 53 both epidemiological and in-vitro studies suggest that fine, especially untrafine particles are 54 more toxic.12,13 For climate impact, finer particles have longer residence time and are more 55 effective in scattering solar radiation.14,15 56
A series of efforts were made to quantify primary emissions of PM from various sources on 57 global,16,17 regional,18,19 and country20-25 scales. These inventories provide essential input for 58 modeling fate, spatiotemporal distributions, and effects of PM. Much effort has been invested 59 to reduce uncertainties in these PM emission inventories, e.g., emissions of PM are compiled 60 for developing and developed countries, using different emission factors (EFs), defined as 61 mass of pollutant emitted per unit fuel consumed or material produced.26 Country and period 62 specific EFs for given sources have been adopted to account for variation in fuels, facility 63 type, operational status, environmental conditions, and other factors through time.20,27-29 The 64 technology division method was developed and applied to describe the impact of abatement 65 technologies.19,24,30-32 Still, source complexity and lack of data lead to large uncertainties in 66 inventories. As one of many examples, primary organic aerosol may evaporated after emitted 67 into the atmosphere,33 causing difficulty in emission estimation. 68
Recently, a global fuel consumption data product (PKU-FUEL-2007) with high spatial 69 (0.1°×0.1°) and source (64 fuel types) resolutions was compiled based on sub-national fuel 70 consumption data for many large countries. Using sub-national instead of national fuel data 71 reduces the spatial bias due to uneven per-person fuel consumption within countries.34 Using 72 this new data product and an EF database with recently published data, 0.1°×0.1° gridded 73 global emission inventories for TSP (total suspended particles), PM10 (particles with 74 aerodynamic size less than 10 µm), and PM2.5 from combustion and industrial process sources 75 were compiled for 2007 in this study (PKU-PM-2007, http://inventory.pku.edu.cn/). Dust and 76 sea salt were excluded in this study because totally different approaches have to be used.35-36 77 Although there is growing concern on ultrafine particles with sizes less than 100 nm, the 78 emission of them is difficult to be quantified at this stage due to data availability. Historical 79 PM emissions from 1960 to 2009 were compiled at country-scale resolution. The uncertainty 80 in these inventories was characterized. The spatial and temporal distributions, changes in 81 emission intensities and fine to coarse PM ratios, and their potential health impacts are 82 discussed. 83
METHODOLOGY 84
Emission estimation. Emissions of TSP, PM10, and PM2.5 from a specific sources were 85 calculated as products of the source strength (quantities of fuel consumed or material 86 produced) and EFs for that particular source; 77 sources were included and listed in Table S1. 87
Page 3 of 19
ACS Paragon Plus Environment
Environmental Science & Technology
4
In addition to the 65 combustion sources,34 12 material production sources were incorporated, 88 including five processes involved in iron and steel industry (sintering, pig iron production, 89 open hearth furnace, convertor, and arc furnace),37 as well as production of lime, glass, 90 ferroalloy, lead, magnesium, zinc,38 and fertilizers.39 Detailed source information is given in 91 Table S1. For years other than 2007, annual fuel consumptions in individual countries are 92 from Shen et al.,40 except for coal consumptions in energy, industrial, and residential sectors 93 in China41 and several sources associated with industrial processes.38,39 94
EFs. EFs reported in the literature are associated with large uncertainty due to differences 95 among facilities and fuels, environmental and operation conditions, burning stages and so on. 96 Our strategy was to collect as many data as possible, from which distributions of the EFs can 97 be derived for Monte Carlo simulation to characterize uncertainty associated (Table S1). 98 More than 2500 EFs collected from the literature were compiled into a database. For fuels 99 used in transportation, country and time specific EFs were projected, using a series of 100 regression models.42,43 The models for TSP are provided in Table S2, while fixed 101 relationships between PM2.5 and TSP (0.85) and between PM10 and TSP (0.91) were applied.44 102 The EFs for coal combustion in energy and industrial sectors were ash content corrected20,25 103 based on coal ash contents (log normal distributed with a standard deviation (SD) of 0.18 for 104 log transformed ash content) from the literature.30,28,45-49 For all other sources, arithmetic 105 means were used. For the sources with abatement facilities, the EFs for specific technologies 106 (cyclones, wet scrubbers, electrostatic precipitators, or fabric filters) were calculated using 107 their unabated EFs and removal efficiencies (Table S3).18,20,24,25 108
Technology splits. The overall EFs for specific country categories and specific year were 109 different and were derived using technology split method.31 For the energy and industry 110 sectors, penetration rates for pulverized coal-fired boilers, stokers, and various control 111 technologies were taken from Bond et al.31 with slight modification (Tables S4 and S5). 112 Bituminous coal consumed in the residential sector of China was subdivided into chunk coal 113 and honeycomb briquette, each with a different EF.28,47,50-52 For all other countries, use of 114 honeycomb briquette was negligible.54 The fractions of biomass fuels consumed in 115 woodstoves and fireplaces were taken from Bond et al.,31 while ratios of improved woodstove 116 were from Shen et al.40 The fractions of shaft, precalciner, and other kilns were fitted using an 117 S-curve (Table S6).24,54 A large uncertainty (50%) was set to technologies with uniform 118 distributions were assumed. 119
Non-compliance rate. The results of a reliable survey conducted in Jiangsu, China, suggest 120 that SO2 scrubbers perform well, over 90% of the time.55 Considering that PM control 121 facilities are often better maintained than SO2 scrubbers, we assumed a non-compliance rate 122 of 5% (0-10%, uniformly distributed) for all developing countries. 123
Spatial distribution mapping. The spatial distribution mapping of the emissions was 124 conducted based on 0.1°×0.1° grid map of fuel consumption database (PKU-FUEL-2007)34 125 and corresponding EFs. In brief, the fuel inventory was generated based on sub-national fuel 126 data for some countries (county data for China, the United States, and Mexico, 0.5°×0.5° grid 127 data for 36 Europe countries, and provincial/state data for India, Brazil, Canada, Australia, 128 Turkey, and South Africa) and national data for others for most fuels. These data were 129 disaggregated into 0.1°×0.1° grids using total population, rural population, and gross domestic 130 production as proxies, depending fuel categories. Data for wildfire, aviation, shipping, power 131 stations, natural gas flaring, and agricultural waste were from the literature.34 Detailed 132 description can be found in a previous paper.34 For production of cement, lime, coke and 133 aluminum, the geolocations of the sources were directly from the literature.38 Except cement 134 production in China, which was disaggregated based on provincial production56 and industrial 135
Page 4 of 19
ACS Paragon Plus Environment
Environmental Science & Technology
5
coal consumption as a proxy.34 For other non-combustion industrial processes, activity 136 strengths for all countries from the literature were disaggregated using industrial coal 137 consumptions as proxy.34 138
Uncertainty analysis. A Monte Carlo simulation was conducted to characterize overall 139 uncertainty. Variations in source strengths, EFs, coal ash contents, fractions and efficiencies of 140 control technologies, as well as the non-compliance rate were modeled. Values of these 141 parameters were randomly selected from predefined distributions based on literature 142 values25,40 or those as mentioned in previous parts. Our results are presented as interquartile 143 ranges below. To quantify relative contributions of various parameters to the overall 144 uncertainty, simulations were conducted for each parameters in turn with other parameters 145 fixed. 146
Calculation of Relative Potential Health Effect. As a normalized dimensionless indicator, 147 the Relative Potential Health Effect (RPHE) was proposed by Shen et al. for polycyclic 148 aromatic hydrocarbons.40 A slightly modified method was applied in this study for PM2.5. In 149 brief, the RPHE in a grid was proportional to the total population of the grid and the sum of 150 the emission contributions of the grid and 120 surrounding grids (11×11 grid in total). The 151 contributions of the 25 grids were weighted inversely to distances to the central grid and the 152 global RPHE were normalized. 153
RESULTS AND DISCUSSION 154
Global Emission and Source Profiles. 155
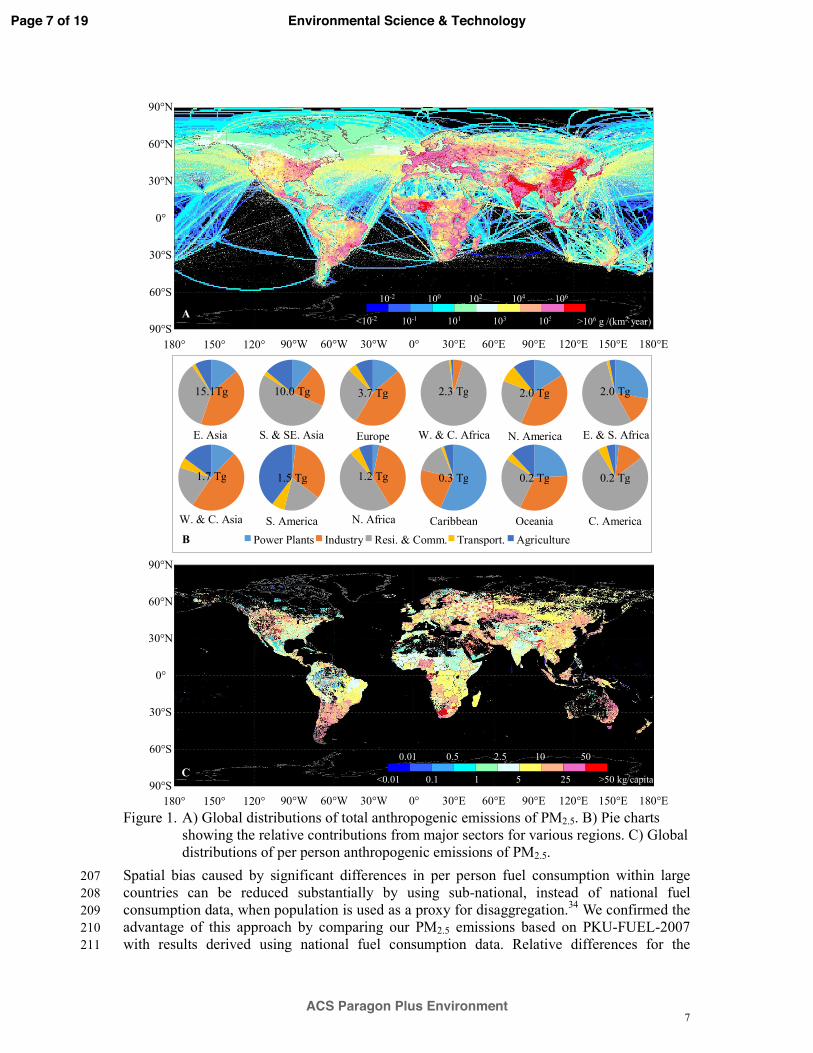
Annual total global emissions of TSP, PM10, and PM2.5 for 2007 were estimated to be 162 156 (123–224), 99 (80–130), and 78 (64–101) Tg, respectively. Of which, anthropogenic sources 157 accounted for 105 (74–158), 55 (42–78), and 40 (31–56) Tg of these fractions. Although our 158 results were broadly similar to those from EDGARv4.216 and HATP_V2,17 relatively large 159 differences were found for individual countries and sectors, reflecting differences in EFs, 160 noncompliance rates, and coal ash contents. For instance, anthropogenic PM10 (2007) and 161 PM2.5 (2008) in developing countries were estimated to be 49.4 and 32.4 Tg in this study, 162 respectively. These values were 4.7 and 12.9% higher than those reported in EDGARv4.2 and 163 HTAP V2, respectively, even though some minor (less than 2% of the total) sources such as 164 solvent and other product use and direct soil emissions in DEGARv4.2 and HTAP V2 were 165 not included in our inventory. 166
The calculated relative variations of the distributions from Monte Carlo simulation, defined as 167 the differences between the 75th and the 25th percentiles divided by medians, were 41.8, 14.6, 168 3.1, 1.2, and 2.1% for EFs, fuel quantities, non-compliance rate, technology split rate, remove 169 efficiency, and ash content, respectively, indicating dominant contribution of EFs. Among the 170 various sources shown in source profiles (Figure S1), wildfires were the largest single source 171 globally, followed by residential biomass burning, power generation, and cement production. 172 In total, biomass burning, including wildfires, residential fuels, and agriculture wastes, 173 accounted for 45.2 (TSP), 59.9 (PM10), and 67.6% (PM2.5) of the total global emission. Power 174 generation contributed 14.0, 9.5, and 6.4% of TSP, PM10, and PM2.5, respectively. Unlike 175 incomplete combustion products, such as black carbon and polycyclic aromatic hydrocarbons, 176 40,57 rather small fractions (0.8-1.4%) of primary PM were from motor vehicles. 177
Per person average annual global emissions of primary TSP, PM10, and PM2.5 from all sources 178 for 2007 were 25.0, 15.6, and 12.4 kg, respectively. Even though per person fuel consumption 179 in developed countries was higher,34 their per person PM emissions were significantly lower 180 (6.6, 5.4, and 4.4 kg) than those in developing countries (18.8, 9.6, and 6.9 kg). This is 181
Page 5 of 19
ACS Paragon Plus Environment
Environmental Science & Technology
6
primarily because of differences in source profiles and EFs (Figure S2). Strong dependences 182 on biomass fuels, active cement production, and relatively high EFs for anthropogenic sources 183 led to high per person PM emission in developing countries. In China, for example, more than 184 130 million rural households still use wood and crop residues for cooking and heating, 185 contributing greatly to primary PM emission.58 Likewise, 78.5% of cement is produced in 186 developing countries, where emission control facilities are often not installed.25,59 In contrast, 187 major PM emission sources in developed countries, including industrial boilers and motor 188 vehicles are well controlled. 189
Spatial Distribution. 190
Geographical distributions of total and per person anthropogenic emissions of PM2.5 for 2007 191 are shown in Figure 1. The relative contributions from major sectors for various regions are 192 shown as pie charts. Of the total emission of anthropogenic PM2.5, excluding shipping and 193 aviation, 87.7% was from developing countries, with major contributions from China (14.3 194 Tg), India (5.5 Tg), Nigeria (1.6 Tg), Indonesia (1.3 Tg), and Russia (0.99 Tg). In contrast, 195 among-country differences and spatial variations of per person emissions were much less 196 marked. This reflects a correlation between densely populated and hot emission regions. The 197 average per person anthropogenic PM2.5 emission for developed countries (4.4 kg) was also 198 much lower than that for developing countries (6.9 kg). Among other reasons, biomass fuels 199 with very high EFs were extensively used in residential areas of developing countries.60 The 200 penetration rate of fabric filters in coal-fired power stations in China 25 was much lower than 201 that in the United States.61 Spatial distributions of total and per person anthropogenic 202 emissions of primary PM10 and TSP are shown in Figure S3. Although their general patterns 203 are similar to those for PM2.5, differences between developed and developing countries are 204 larger than those for PM2.5, because coal-fired power stations, cement production, and heavy 205 industry in developing countries all emit coarser PM. 206
Page 6 of 19
ACS Paragon Plus Environment
Environmental Science & Technology
7
Spatial bias caused by significant differences in per person fuel consumption within large 207 countries can be reduced substantially by using sub-national, instead of national fuel 208 consumption data, when population is used as a proxy for disaggregation.34 We confirmed the 209 advantage of this approach by comparing our PM2.5 emissions based on PKU-FUEL-2007 210 with results derived using national fuel consumption data. Relative differences for the 211
90°N
60°N
30°N
0°
30°S
60°S
90°S 180° 150° 120° 90°W 30°W 30°E 60°W 0° 60°E 90°E 120°E 180°E 150°E
A
E. Asia
15.1Tg
W. & C. Asia
1.7 Tg
S. & SE. Asia
10.0 Tg
S. America
1.5 Tg
Europe
3.7 Tg
W. & C. Africa
2.3 Tg
N. Africa
1.2 Tg
Caribbean
0.3 Tg
Oceania
0.2 Tg
N. America
2.0 Tg
E. & S. Africa
2.0 Tg
C. America
0.2 Tg
Power Plants Industry Resi. & Comm. Transport. AgricultureB
<10-2
10-2
10-1
100
101
102
103
104
105
106
>106 g /(km2⋅year)
90°N
60°N
30°N
0°
30°S
60°S
90°S 180° 150° 120° 90°W 30°W 30°E 60°W 0° 60°E 90°E 120°E 180°E 150°E
C <0.01
0.01
0.1
0.5
1
2.5
5
10
25
50
>50 kg/capita
Figure 1. A) Global distributions of total anthropogenic emissions of PM2.5. B) Pie charts
showing the relative contributions from major sectors for various regions. C) Global distributions of per person anthropogenic emissions of PM2.5.
Page 7 of 19
ACS Paragon Plus Environment
Environmental Science & Technology
8
countries with sub-national fuel data are shown in Figure S4; values ranged from 6 (Brazil) to 212 96% (Mexico) difference in spatial distribution. 213
Our fine spatial resolution allowed us to compare emissions between urban and rural areas for 214 anthropogenic sources in all countries (Table S7). Despite the fact that most industrial and 215 transport sources locate in urban areas, residential fuel consumptions are quite different 216 between rural and urban areas, especially in developing countries. Rural residents rely more 217 on solid fuels, like crop residue, firewood, and coal, emitting large quantities of PM. In 218 contrast, urban residents use cleaner fuels, like natural gas, liquefied petroleum gas, and 219 electricity.62 As a result, per person annual primary PM emission in rural areas are much 220 higher than those in urban areas. Further, this difference in developed countries (12 and 2.8 kg 221 PM2.5 for rural and urban areas) is larger than that in developing countries (8.4 and 4.6 kg 222 PM2.5 for rural and urban areas). Recent rapid economic growth and urbanization in 223 developing countries brought millions of rural residents to cities. In China alone, more than 224 260 million people have moved to urban areas over the past three decades. This trend will 225 continue for years to come.63 Thus, urbanization in developing countries will lead to a 226 significant reduction in PM emission in the future. Our estimates suggest that annual emission 227 of PM2.5 will be reduced by around 3800 ton per million people as rural residents migrate to 228 cities, climbing up the energy ladder. 229
Temporal Variation. 230
Since spatially-resolved fuel consumption data is only available for 2007, annual PM 231 emissions from 1960 to 2009 could only be derived at country-scale resolution in this study. 232 Temporal trends for total PM2.5 emissions from six sectors (left panels) and eight source types 233 (right panels) are shown in Figure S5. We show estimates for the global total (with 234 uncertainty ranges), developed countries, developing countries, and specifically for China, 235 and the United States. Globally, emission of PM2.5 increased continuously from 1960 through 236 the 1980s, and then it was relatively constant until 1996, before decreasing slowly, with strong 237 fluctuations owing to fast changes in economic and energy demands.60 In comparison with 238 EDGARv4.2 (Figure S6), our temporal trends in total anthropogenic PM10 emissions were 239 similar, with significant differences for countries with high emissions, reflecting differences 240 in our technology division and EFs. 241
The overall trends were very different between developed and developing countries (Figure 242 S7). In 1960, anthropogenic PM2.5 emissions were mainly from Europe (32.2%), east Asia 243 (22.6%), North America (18.5%), and south and southeast Asia (12.9%). Post 1960, emissions 244 decreased in Europe and North America, but increased in Asia, making this continent the 245 predominant emission region (66.7%). In developed countries, emissions were reduced in the 246 transportation (gasoline) and industry (coal and processes) sectors. For example, since the 247 1990s, emissions in the United States decreased owing to the implementation of Clean Air 248 Act and other regulations.64,65 In developing countries, increased emissions over the past 50 249 years were related to coal-based industrial activities. In China, for example, coal consumption 250 has increased from 60 MT in 1960 66 to 2118 MT in 2009,60 resulting in enhanced PM 251 emission. Although the number of motor vehicles has risen in recent years in China and other 252 developing countries, 67,68 PM2.5 emission from this source did not show a significant increase, 253 reflecting the rapid implementation of emission regulations and controls. For instance, the 254 China IV standard, equivalent to Euro IV was introduced in Beijing (2008),69 Shanghai 255 (2009),70 Guangzhou (2010),71 and across China (2011) (GB17691-2005 and 256 GB18352.3-2005),72,73 much earlier than in developed countries with respect to its developing 257 status (i.e., per person GDP). Emission histories in other developed and developing countries 258 followed similar trends to those above (Figure S8). 259
Page 8 of 19
ACS Paragon Plus Environment
Environmental Science & Technology
9
Figure S9 shows a time series of annual emissions of PM10 and TSP for global, developed 260 countries, and developing countries. Slight differences to the trends for PM2.5 were found. In 261 developed countries, emissions of both PM2.5 and PM10 increased before 1970, partly owing 262 to the increase in number of motor vehicles; there was no such trend for TSP, which is 263 primarily of industrial origin.18,24 264
Temporal changes in per person annual PM2.5 emissions from 1960 to 2009 in eight 265 representative countries are shown in Figure S10; we plotted these as totals from all sources, 266 as well as separately for industrial fuel use, industrial processes, and residential fuel 267 consumption. Per person PM2.5 emissions in residential sectors of all eight countries 268 decreased over time, with different rates primarily reflecting replacement of solid fuels (coal 269 and biomass fuels) with cleaner ones (e.g., electricity, liquified petroleum gas, natural gas, and 270 biogas). Additionally, decreases occurred on implementation of centralized heating systems in 271 cities.74 For example, coal consumption in the UK dropped from 48.6 to 24.5 Tg from 1960 to 272 1970,60 while coal used in urban households in China decreased from 65.6 to 37.5 Tg from 273 1995 to 2007.62 For the industrial sector, per person annual PM2.5 emissions in developed 274 countries peaked around 1960–1970, declining continuously since this time because of 275 enforcement of stricter regulations and improvements in abatement technologies.31 A drop in 276 energy demand associated with the shock therapy period60 in the former Soviet Union led to a 277 sharp decrease in PM2.5 emission. Meanwhile, increasing emissions are seen in China and 278 India, the two largest transition economies, because of rapid industralization. 279
Emission Intensity. 280
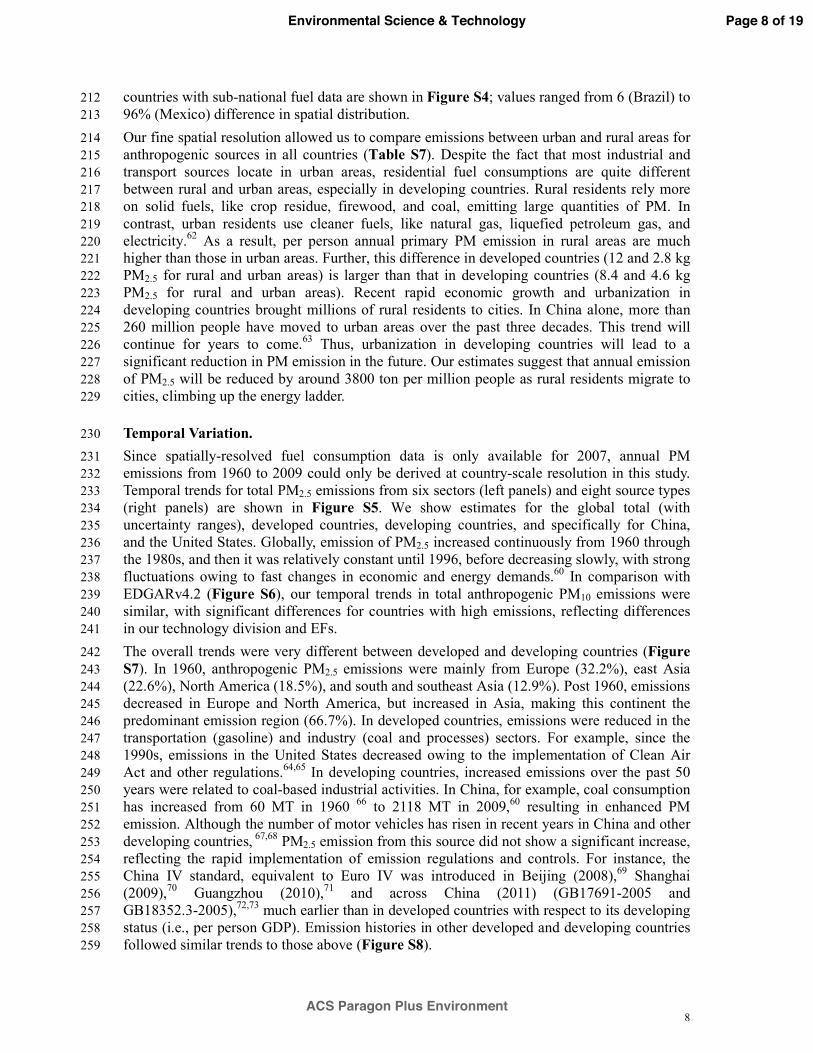
We calculated emission intensities, i.e., anthropogenic emission (excluding shipping and 281 aviation) per unit of fuel consumption (EIFUEL) or emission per unit of GDP (EIGDP) to 282 characterize how well emission was controlled and their respective fuel efficiencies. Globally, 283 the average EIGDP for PM2.5, PM10, and TSP values for 2007 data were 0.61, 0.84, and1.59 284 g/USD; while their average EIFUEL values were 90.9, 125, and 236 kg/TJ, respectively. Spatial 285 distributions for EIFUEL and EIGDP for PM2.5, PM10, and TSP are shown in Figure S11. Similar 286 spatial distribution patterns were observed for all three PM size categories. In developing 287 countries, both EIFUEL and EIGDP values were significantly higher than those in developed 288 countries. Using PM2.5 as an example, 2007 EIFUEL values for low, lower middle, upper 289 middle, and high income countries75 were 279, 197, 126, and 27.8 kg/TJ; while EIGDP values 290 were 3.5, 1,7, 1,1, and 0.15 g/USD, respectively. The differences in EIFUEL reflect extensive 291 use of biomass fuel and coal in residential sectors, as well as the lack of effective abatement 292 facilities in energy and industry sectors in developing countries.24,25,30 Dominant secondary 293 industries with relatively low energy efficiency and high energy consumption led to relatively 294 low EIGDP values in developing countries. For example, 86.6% of bricks53 and 78.5% of 295 cement38 are produced in developing countries. 296
Temporal trends for EIFUEL and EIGDP for the three PM size fractions for the global total, the 297 four economic categories listed above, as well as China, and the United States are shown in 298 Figure 2. Although emission intensities are significantly different for developing and 299 developed countries; they have all decreased at different rates since the 1960s. 300
Page 9 of 19
ACS Paragon Plus Environment
Environmental Science & Technology
10
EIGDP decreased faster than EIFUEL for the majority of countries, reflecting the global reduction 301 in energy consumption per unit GDP. In general, emission intensities were negatively 302 correlated with income. There were a few exceptions, e.g., EIFUEL for PM10 and TSP for upper 303 middle income countries, including China, are higher than those for lower-middle and low 304 income countries. This likely reflects emissions from heavy industry in China. In contrast, for 305 PM2.5, even though ElFUEL for China was among the highest before 1986, it decreased at an 306 accelerted pace from 1986 to 2009 from 324 to 152; while values for low and lower middle 307 income countries decreased at a much slower rate. These changes reflect a rapid increase in 308 energy efficiency, penetration of abatement technologies in the industrial sector,25,45 and 309 replacement of solid fuels with cleaner ones in the residential sector.60,62 310
Size Distribution. 311
It is well documented that PM2.5 penetrates more deeply into the lungs compared with coarse 312 particles.76,77 Epidemiological surveys also suggest that PM2.5 is more strongly associated 313
Globe Low income Lower middle income Upper middle income High income
China The United States
TSP
PM10
PM2.5
EIG
DP,
g/U
SD
EIG
DP,
g/U
SD
EIG
DP,
g/U
SD
Year
10-1
101
103
1960 1970 1980 1990 2000 2010
10-1
101
103
1960 1970 1980 1990 2000 2010
10-1
101
103
1960 1970 1980 1990 2000 2010
EIfu
el, k
g/TJ
EI
fuel, k
g/TJ
EI
fuel, k
g/TJ
Year
300
0
600
1960 1970 1980 1990 2000 2010
400
0
800
1960 1970 1980 1990 2000 2010
900
0
1800
1960 1970 1980 1990 2000 2010
PM2.5
PM10
TSP
Figure 2. Time series of EIFUEL (right panel) and EIGDP (left panel) values for PM2.5, PM10,
and TSP. Results are shown for the global total, the four economic categories low, lower middle, upper middle, and high income countries, as well as China and the United States.
Page 10 of 19
ACS Paragon Plus Environment
Environmental Science & Technology
11
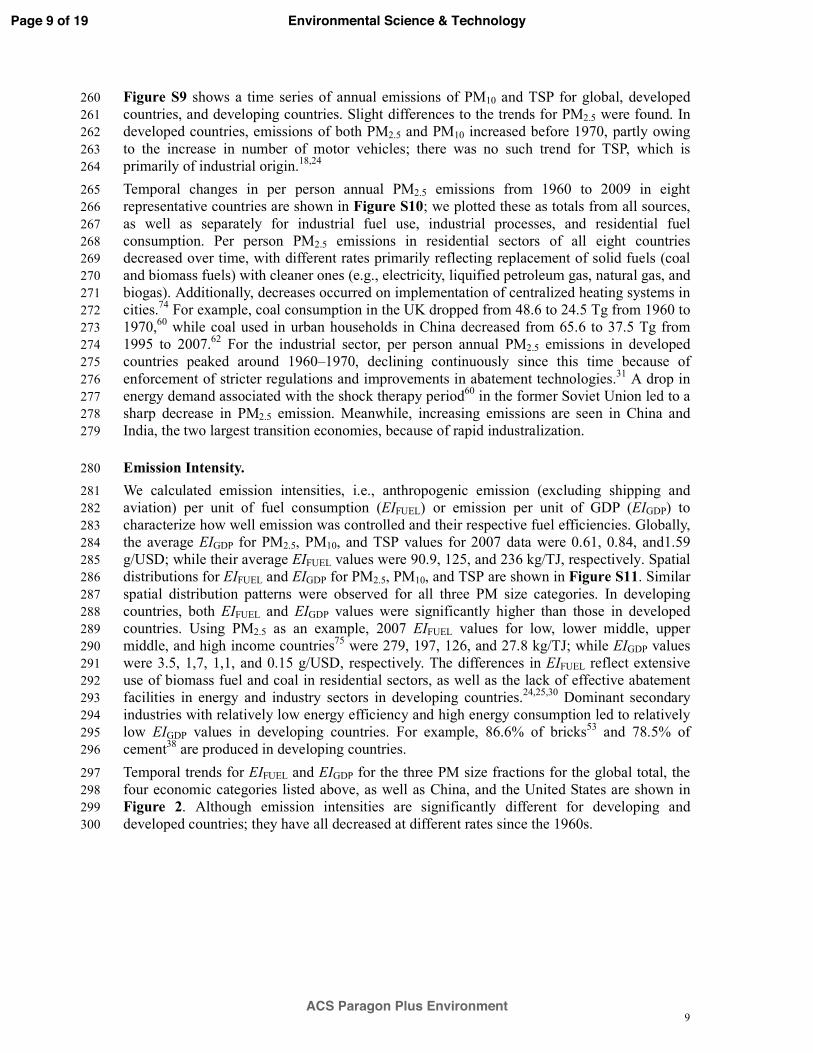
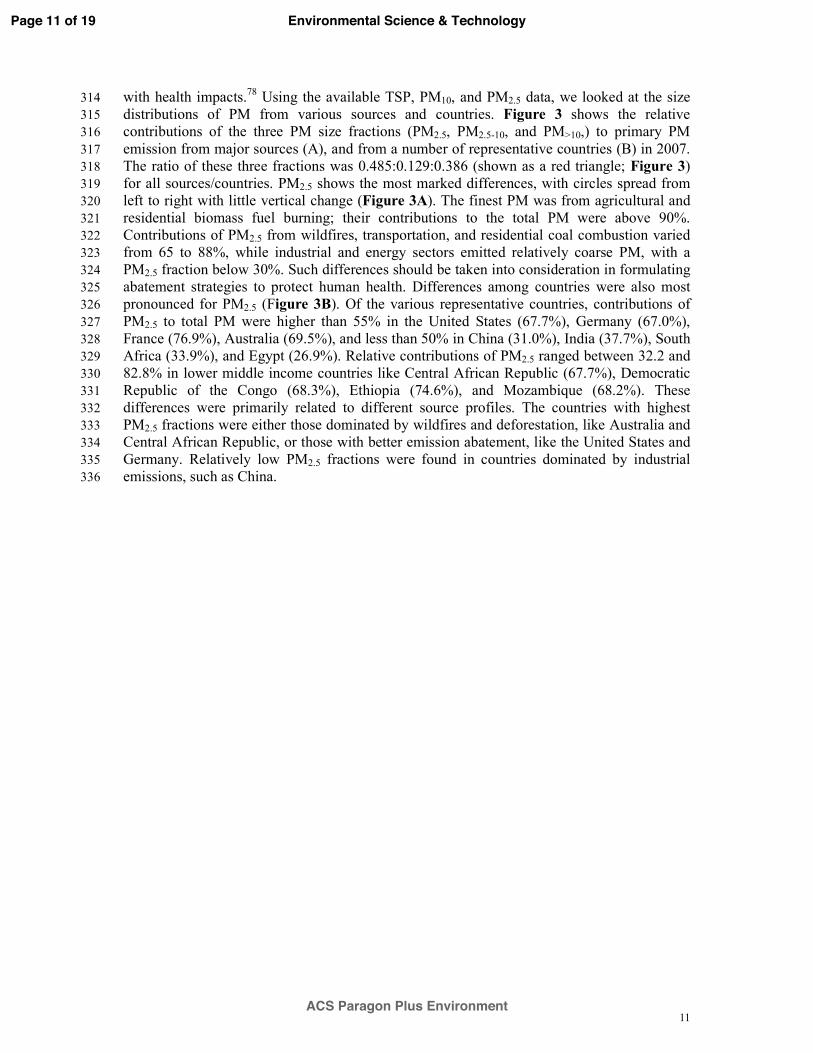
with health impacts.78 Using the available TSP, PM10, and PM2.5 data, we looked at the size 314 distributions of PM from various sources and countries. Figure 3 shows the relative 315 contributions of the three PM size fractions (PM2.5, PM2.5-10, and PM>10,) to primary PM 316 emission from major sources (A), and from a number of representative countries (B) in 2007. 317 The ratio of these three fractions was 0.485:0.129:0.386 (shown as a red triangle; Figure 3) 318 for all sources/countries. PM2.5 shows the most marked differences, with circles spread from 319 left to right with little vertical change (Figure 3A). The finest PM was from agricultural and 320 residential biomass fuel burning; their contributions to the total PM were above 90%. 321 Contributions of PM2.5 from wildfires, transportation, and residential coal combustion varied 322 from 65 to 88%, while industrial and energy sectors emitted relatively coarse PM, with a 323 PM2.5 fraction below 30%. Such differences should be taken into consideration in formulating 324 abatement strategies to protect human health. Differences among countries were also most 325 pronounced for PM2.5 (Figure 3B). Of the various representative countries, contributions of 326 PM2.5 to total PM were higher than 55% in the United States (67.7%), Germany (67.0%), 327 France (76.9%), Australia (69.5%), and less than 50% in China (31.0%), India (37.7%), South 328 Africa (33.9%), and Egypt (26.9%). Relative contributions of PM2.5 ranged between 32.2 and 329 82.8% in lower middle income countries like Central African Republic (67.7%), Democratic 330 Republic of the Congo (68.3%), Ethiopia (74.6%), and Mozambique (68.2%). These 331 differences were primarily related to different source profiles. The countries with highest 332 PM2.5 fractions were either those dominated by wildfires and deforestation, like Australia and 333 Central African Republic, or those with better emission abatement, like the United States and 334 Germany. Relatively low PM2.5 fractions were found in countries dominated by industrial 335 emissions, such as China. 336
Page 11 of 19
ACS Paragon Plus Environment
Environmental Science & Technology
12
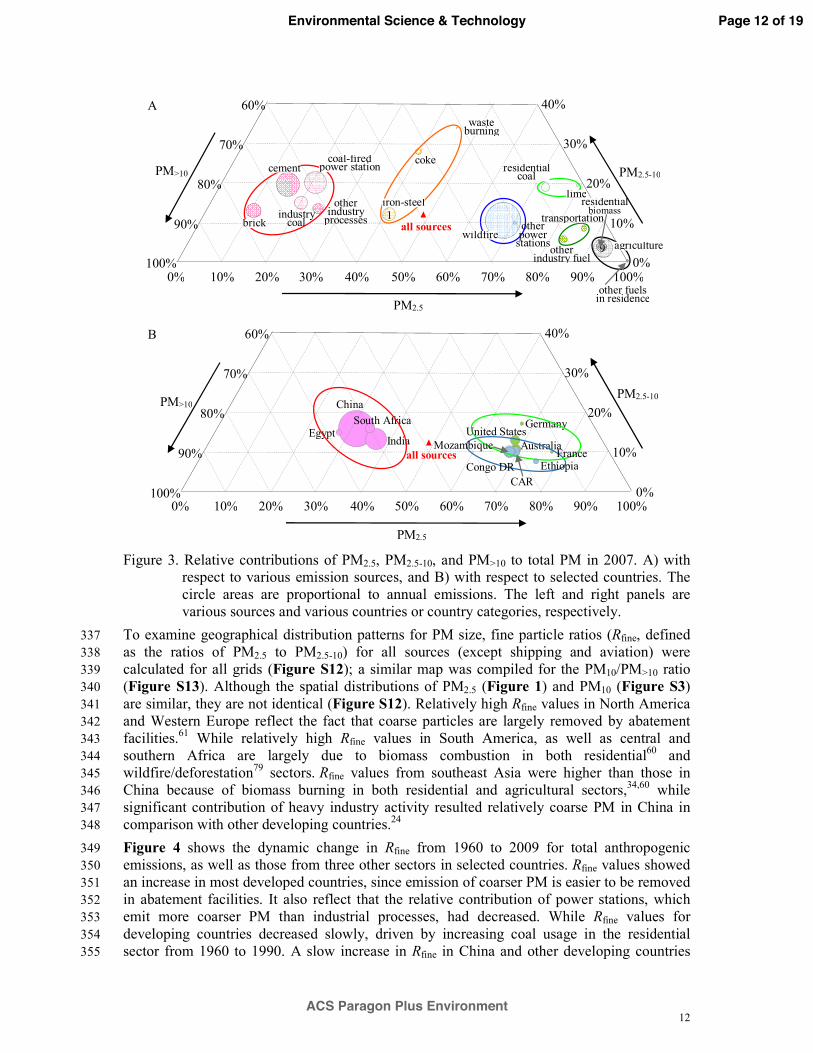
To examine geographical distribution patterns for PM size, fine particle ratios (Rfine, defined 337 as the ratios of PM2.5 to PM2.5-10) for all sources (except shipping and aviation) were 338 calculated for all grids (Figure S12); a similar map was compiled for the PM10/PM>10 ratio 339 (Figure S13). Although the spatial distributions of PM2.5 (Figure 1) and PM10 (Figure S3) 340 are similar, they are not identical (Figure S12). Relatively high Rfine values in North America 341 and Western Europe reflect the fact that coarse particles are largely removed by abatement 342 facilities.61 While relatively high Rfine values in South America, as well as central and 343 southern Africa are largely due to biomass combustion in both residential60 and 344 wildfire/deforestation79 sectors. Rfine values from southeast Asia were higher than those in 345 China because of biomass burning in both residential and agricultural sectors,34,60 while 346 significant contribution of heavy industry activity resulted relatively coarse PM in China in 347 comparison with other developing countries.24 348
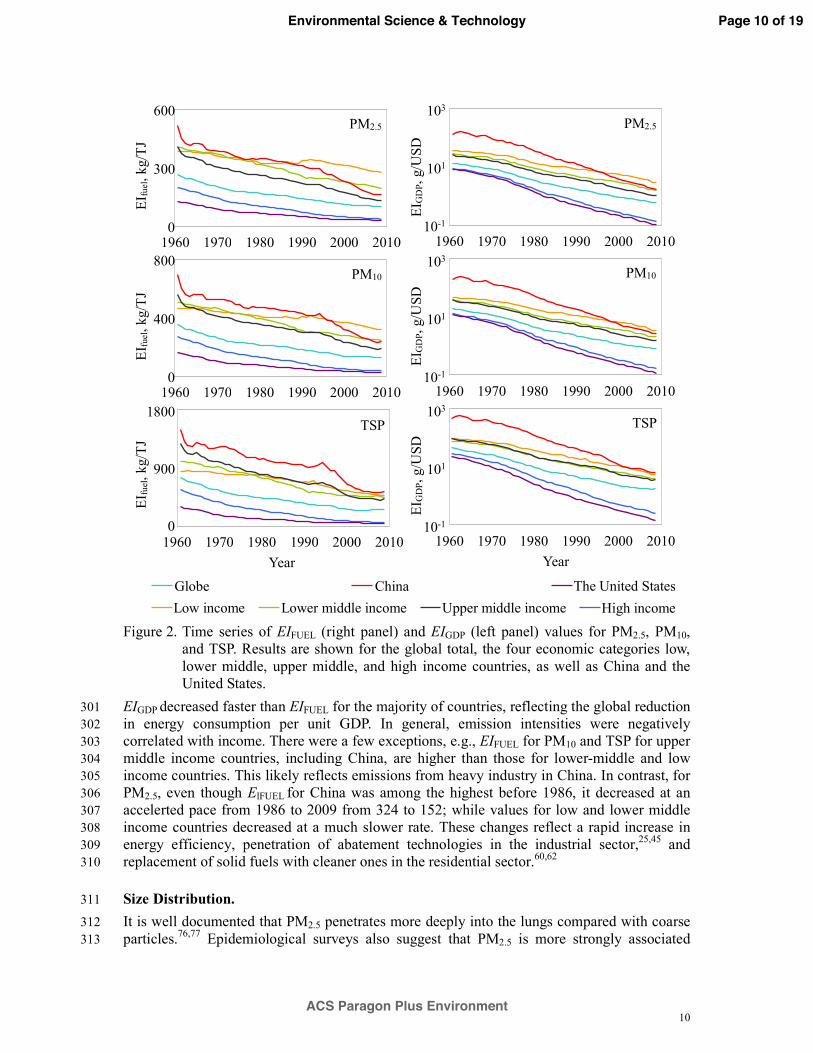
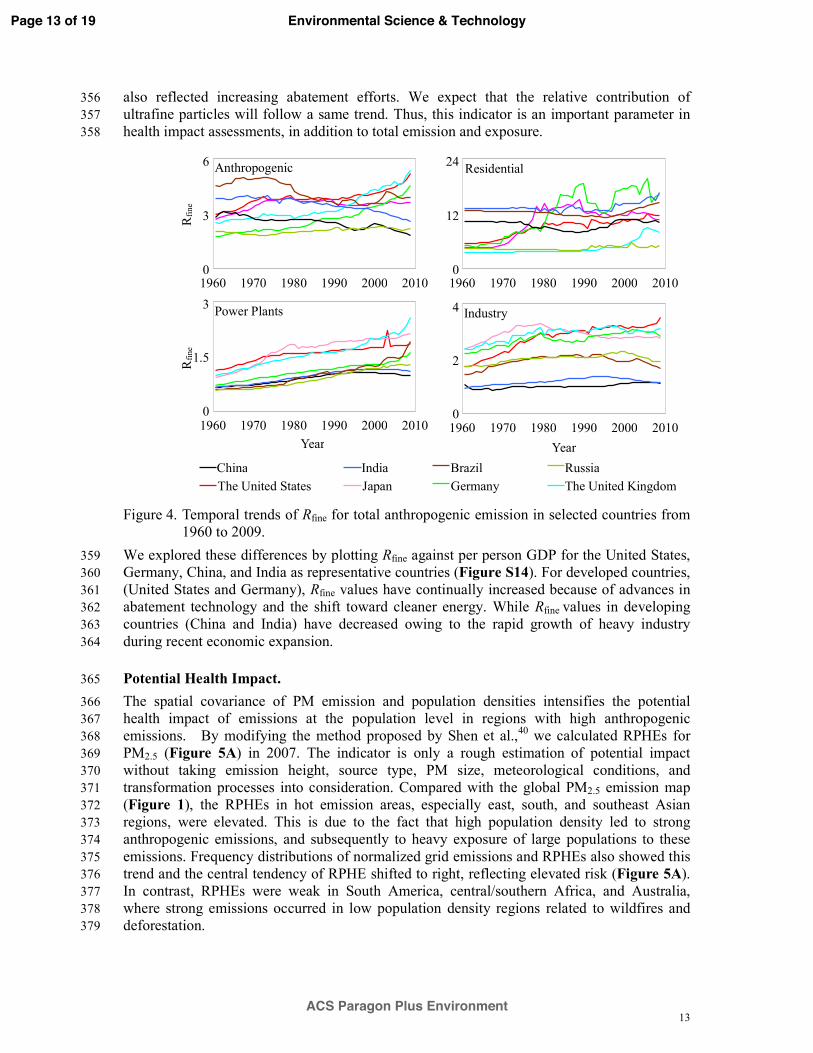
Figure 4 shows the dynamic change in Rfine from 1960 to 2009 for total anthropogenic 349 emissions, as well as those from three other sectors in selected countries. Rfine values showed 350 an increase in most developed countries, since emission of coarser PM is easier to be removed 351 in abatement facilities. It also reflect that the relative contribution of power stations, which 352 emit more coarser PM than industrial processes, had decreased. While Rfine values for 353 developing countries decreased slowly, driven by increasing coal usage in the residential 354 sector from 1960 to 1990. A slow increase in Rfine in China and other developing countries 355
industry coal
other industry
processes
PM2.5
PM2.5-10PM>10
0% 90%10% 20% 30% 40% 50% 60% 70% 80% 100%
40%
30%
20%
10%
0%
60%
70%
80%
90%
100%
1
9
all sourcesbrick
cement coal-fired
power station
other fuels in residence
coke
waste burning
residential biomass
other industry fuel
lime
transportation
agriculture
A
iron-steel
wildfire
residential coal
other power
stations
B
PM2.5
PM2.5-10PM>10
0% 90%10% 20% 30% 40% 50% 60% 70% 80% 100%
40%
30%
20%
10%
0%
60%
70%
80%
90%
100%
China
India
CAR
AustraliaEgypt
GermanySouth Africa
all sources FranceEthiopiaCongo DR
United StatesMozambique
Figure 3. Relative contributions of PM2.5, PM2.5-10, and PM>10 to total PM in 2007. A) with
respect to various emission sources, and B) with respect to selected countries. The circle areas are proportional to annual emissions. The left and right panels are various sources and various countries or country categories, respectively.
Page 12 of 19
ACS Paragon Plus Environment
Environmental Science & Technology
13
also reflected increasing abatement efforts. We expect that the relative contribution of 356 ultrafine particles will follow a same trend. Thus, this indicator is an important parameter in 357 health impact assessments, in addition to total emission and exposure. 358
We explored these differences by plotting Rfine against per person GDP for the United States, 359 Germany, China, and India as representative countries (Figure S14). For developed countries, 360 (United States and Germany), Rfine values have continually increased because of advances in 361 abatement technology and the shift toward cleaner energy. While Rfine values in developing 362 countries (China and India) have decreased owing to the rapid growth of heavy industry 363 during recent economic expansion. 364
Potential Health Impact. 365
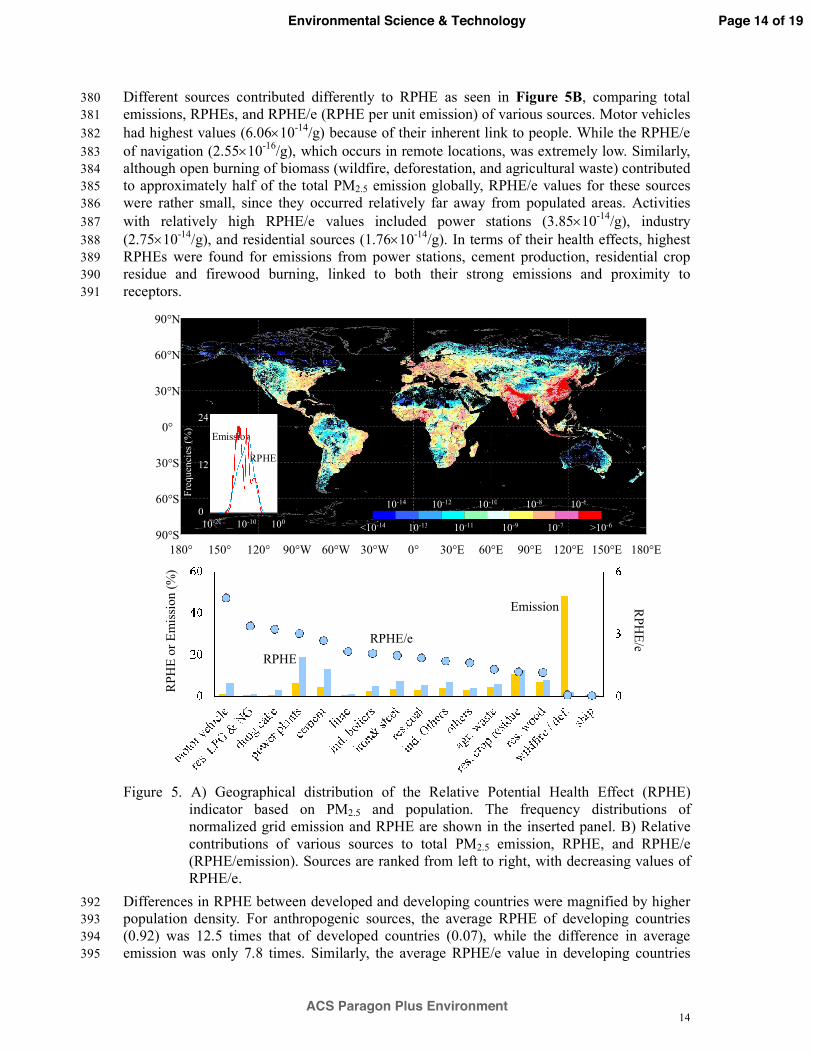
The spatial covariance of PM emission and population densities intensifies the potential 366 health impact of emissions at the population level in regions with high anthropogenic 367 emissions. By modifying the method proposed by Shen et al.,40 we calculated RPHEs for 368 PM2.5 (Figure 5A) in 2007. The indicator is only a rough estimation of potential impact 369 without taking emission height, source type, PM size, meteorological conditions, and 370 transformation processes into consideration. Compared with the global PM2.5 emission map 371 (Figure 1), the RPHEs in hot emission areas, especially east, south, and southeast Asian 372 regions, were elevated. This is due to the fact that high population density led to strong 373 anthropogenic emissions, and subsequently to heavy exposure of large populations to these 374 emissions. Frequency distributions of normalized grid emissions and RPHEs also showed this 375 trend and the central tendency of RPHE shifted to right, reflecting elevated risk (Figure 5A). 376 In contrast, RPHEs were weak in South America, central/southern Africa, and Australia, 377 where strong emissions occurred in low population density regions related to wildfires and 378 deforestation. 379
Rfin
e R
fine
Year
Power Plants
Anthropogenic
0
3
6
1960 1970 1980 1990 2000 2010
0
1.5
3
1960 1970 1980 1990 2000 2010
Year
Industry
Residential
0
12
24
1960 1970 1980 1990 2000 2010
0
2
4
1960 1970 1980 1990 2000 2010
Brazil Russia GermanyThe United States
ChinaJapan India
The United Kingdom
Figure 4. Temporal trends of Rfine for total anthropogenic emission in selected countries from 1960 to 2009.
Page 13 of 19
ACS Paragon Plus Environment
Environmental Science & Technology
14
Different sources contributed differently to RPHE as seen in Figure 5B, comparing total 380 emissions, RPHEs, and RPHE/e (RPHE per unit emission) of various sources. Motor vehicles 381 had highest values (6.06×10⁻¹⁴/g) because of their inherent link to people. While the RPHE/e 382 of navigation (2.55×10⁻¹⁶/g), which occurs in remote locations, was extremely low. Similarly, 383 although open burning of biomass (wildfire, deforestation, and agricultural waste) contributed 384 to approximately half of the total PM2.5 emission globally, RPHE/e values for these sources 385 were rather small, since they occurred relatively far away from populated areas. Activities 386 with relatively high RPHE/e values included power stations (3.85×10⁻¹⁴/g), industry 387 (2.75×10⁻¹⁴/g), and residential sources (1.76×10⁻¹⁴/g). In terms of their health effects, highest 388 RPHEs were found for emissions from power stations, cement production, residential crop 389 residue and firewood burning, linked to both their strong emissions and proximity to 390 receptors. 391
Differences in RPHE between developed and developing countries were magnified by higher 392 population density. For anthropogenic sources, the average RPHE of developing countries 393 (0.92) was 12.5 times that of developed countries (0.07), while the difference in average 394 emission was only 7.8 times. Similarly, the average RPHE/e value in developing countries 395
90°N
60°N
30°N
0°
30°S
60°S
90°S 180° 150° 120° 90°W 30°W 30°E 60°W 0° 60°E 90°E 120°E 180°E150°E
10-14
10-13
10-12
10-11
10-10
10-9
10-8
10-7
10-6
>10-6<10-14
Freq
uenc
ies (
%)
0
12
24
10-20 10-10 100
RPHE
Emission
RPHE
Emission
RPH
E or
Em
issio
n (%
) R
PHE/eRPHE/e
Emission
RPHE
Figure 5. A) Geographical distribution of the Relative Potential Health Effect (RPHE)
indicator based on PM2.5 and population. The frequency distributions of normalized grid emission and RPHE are shown in the inserted panel. B) Relative contributions of various sources to total PM2.5 emission, RPHE, and RPHE/e (RPHE/emission). Sources are ranked from left to right, with decreasing values of RPHE/e.
Page 14 of 19
ACS Paragon Plus Environment
Environmental Science & Technology
15
(2.6×10⁻¹⁴/g) was higher than that in developed countries (1.6×10⁻¹⁴/g), because of the 396 differences in source types and population proximity to these sources (e.g., the relatively high 397 contributions from residential solid fuel consumption in developing countries). 398
Based on the high-resolution maps generated in this study, RPHE and RPHE/e were 399 determined separately for urban and rural areas.34 Although average per person emission of 400 PM2.5 in rural areas was higher than that for urban areas, both RPHE and RPHE/e in urban 401 areas (0.73 and 5.7×10⁻¹⁴/g) were higher than for rural areas (0.26 and 9.6×10⁻¹⁵/g). Again, 402 this reflects highly concentrated sources and receptors in cities. This is especially true for 403 developed countries because of their higher urbanization rates. Thus, aggregation effects 404 related to rapid urbanization in the past decades and in the near future, has caused and will 405 continue to cause high health risks, despite reductions in the per person PM2.5 emission. 406 Studies to quantify the influence of urbanization on emissions and their associated health risks 407 using atmospheric transport and population exposure models are urgently needed. 408
Sub-nationally disaggregated fuel consumption data (PKU-FUEL-2007) was used for PM 409 inventories in this study;34 hence, spatial bias in emission data, and their associated health 410 risks (RPHEs) could be calculated with a reduced uncertainty by taking into account uneven 411 spatial distributions of per person fuel consumption and emission. Figure S15 compares 412 spatial distributions of RPHEs derived from both sub-nationally and nationally disaggregated 413 activity data for selected countries: China, the United States, India, Canada, and Australia. 414 The reduction in spatial bias of RPHEs was similar to that for emissions, but was enhanced 415 because emissions from adjacent grids are also taken into account in RPHE calculations. With 416 nationally disaggregated results, the overestimation or underestimation of RPHE were 417 obvious. In the case of China, RPHEs were overestimated in Tibet, Qinhai, northern Inner 418 Mongolia, and Guangdong; while they were underestimated in most other regions, especially 419 in the three northeastern provinces. It appears that the sub-national aggregation method 420 greatly reduced spatial bias, not only for emissions, but also for estimations of their 421 health-related effects. 422
ACKNOWLEDGMENTS 423 Funding for this study was provided by the National Natural Science Foundation of China 424 (41390240, 41130754, and 41390240) and the 111 Program. 425
ASSOCIATED CONTENT 426
Supporting Information. Materials, including our source list, EFs for various sources, 427 regression models for EFs, PM removal efficiency and parameters for technology split, PM 428 source profiles, geographical distributions for total and per person anthropogenic PM 429 emissions, relative differences between sub-nationally and nationally disaggregated emissions, 430 rural and urban anthropogenic PM2.5 emissions for 222 countries/regions, time trends for total 431 PM2.5 emissions from six sectors and eight source types, comparison with other inventories, 432 relative contributions of 12 global regions to PM2.5 emissions, time trends for PM2.5 emission 433 from motor vehicles, time trends for PM10 and TSP from all sources, time trends for per 434 person PM2.5 emissions in eight representative countries, geographical distributions of 435 emission intensity, Rfine and PM10/PM>10 ratios, relationship between Rfine and per person GDP, 436 spatial distributions of RPHEs derived from the sub-nationally and nationally disaggregated 437 activity data are all available free of charge at http://pubs.acs.org. 438
REFERENCES 439 (1) Quaas, J.; Boucher, O.; Bellouin, N.; Kinne, S. Satellite-based estimate of the direct and indirect 440
aerosol climate forcing. J. Geophys. Res. 2008, 112, D05204; DOI: 10.1029/2007JD008962. 441
Page 15 of 19
ACS Paragon Plus Environment
Environmental Science & Technology
16
(2) Pope III, C. A.; Burnett, R. T.;Thun, M. J.; Calle, E. E.;Krewski, D.; Ito, K.; Thurston, G. D. Lung 442 cancer, cardiopulmonary mortality, and long-term exposure to fine particulate air pollution. JAMA. 443 2002, 287(9), 1132-1141. 444
(3) Tao, M.; Chen, L.; Su, L.; Tao, J. Satellite observation of regional haze pollution over the North 445 China Plain. J. Geophys. Res. 2012, 117, D12203; DOI:10.1029/2012JD017915. 446
(4) Wang, L. T.; Wei, Z.; Yang, J.; Zhang, Y.; Zhang, F. F.; Su, J.; Meng, C. C.; Zhang, Q. The 2013 447 severe haze over southern Hebei, China: model evaluation, source apportionment, and policy 448 implications. Atmos. Chem. Phys. 2014, 14(6), 3151-3173. 449
(5) Nawahda, A.; Yamashita, K.; Ohara, T.; Kurokawa, J.; Yamaji, K. Evaluation of premature 450 mortality caused by exposure to PM2. 5 and ozone in East Asia: 2000, 2005, 2020. Water Air Soil 451 Pollut. 2012, 223(6), 3445-3459; DOI: 10.1007/s11270-012-1123-7. 452
(6) Giorgi, F.; Bi, X. Q.; Qian, Y. Indirect vs. direct effects of anthropogenic sulfate on the climate of 453 east Asia as simulated with a regional coupled climate-chemistry/aerosol model. Climatic Change. 454 2003, 58, 345–376. 455
(7) Qian, Y.; Kaiser, D. P.; Leung, L. R.; Xu, M. More frequent cloud-free sky and less surface solar 456 radiation in China from 1955 to 2000. Geophys. Res. Lett. 2006, 33, L01812; DOI: 457 10.1029/2005GL024586. 458
(8) Kawamoto, K.; Hayasaka, T.; Uno, I.; Ohara, T. A correlative study on the relationship between 459 modeled anthropogenic aerosol concentration and satellite-observed cloud properties over east 460 Asia, J. Geophys. Res. 2006, 111, D19201; DOI: 10.1029/2005JD006919. 461
(9) Huang, Y., Chameides, W. L., and Dickinson, R. E.: Direct and indirect effects of anthropogenic 462 aerosols on regional precipitation over East Asia, J. Geophys. Res. 2007, 112, D03212; DOI: 463 10.1029/2006JD007114, 2007. 464
(10) Wang, X. H.; Bi, X. H.; Sheng, G. Y.; Fu, J. M. Chemical composition and sources of PM10 and 465 PM2.5 aerosols in Guangzhou, China. Environ. Monit. Assess. 2006, 119,425-439. 466
(11) Hang, N. T.; Kim Oanh, N. T. Chemical characterization and sources apportionment of fine particulate 467 pollution in a mining town of Vietnam. Atmos. Res. 2014, 145-146, 214-225. 468
(12) Schwartz, J.; Neas, L. M. Fine particles are more strongly associated than coarse particles with 469 acute respiratory health effects in schoolchildren. Epidemiol. 2000, 11, 6-10. 470
(13) Li, N.; Sioutas, C.; Cho, A.; Schmitz, D.; Misra, C.; Sempf, J.; Wang, M.; Oberley, T.; Froines, J.; 471 Nel, A. Ultrafine particulate pollutants induce oxidative stress and mitochondrial damage. 472 Environ. Health Persp. 2003, 111, 455-460. 473
(14) Perrino, C. Atmospheric particulate matter. Proceedings of a C.I.S.B. Minisymposium, 2010. 474 (15) Seinfeld, J. H.; Pandis, S. N. Atmospheric chemistry and physics: from air pollution to climate 475
change. John Wiley & Sons, 2006. 476 (16) European Commission, Joint Research Centre (JRC)/Netherlands Environmental Assessment 477
Agency (PBL). Emission Database for Global Atmospheric Research (EDGAR), release version 478 4.2. 2011; http://edgar.jrc.ec.europa.eu. 479
(17) Janssens-Maenhout, G.; Dentener, F.; Van Aardenne, J.; Monni, S.; Pagliari, V.; Orlandini, L.; 480 Klimont, Z.; Kurokawa, J.; Akimoto, H.; Ohara, T.; Wankmueller, R.; Battye, B.; Grano, D.; 481 Zuber, A.; Keating, T. EDGAR-HTAP: a Harmonized Gridded Air Pollution Emission Dataset 482 Based on National Inventories. Ispra (Italy): European Commission Publications Office. 2012, 483 JRC68434, EUR report No EUR 25 299 - 2012, ISBN 978-92-79-23122-0, ISSN 1831-9424. 484
(18) Klimont, Z.; Cofala, J.; Bertok, I.; Amann, M.; Heyes, C.; Gyarfas, F. Modelling particulate 485 emissions in Europe. A Framework to Estimate Reduction Potential and Control Costs. IR-02-076, 486 IIASA, Austria, 2002; http://www. iiasa. ac. at/rains/reports. html. 487
(19) Zhang, Q.; Streets, D. G.; Carmichael, G. R.; He, K. B.; Huo, H.; Kannari, A.; Klimont, Z.; Park, I. 488 S.; Reddy, S.; Fu, J. S.; Chen, D.; Duan, L.; Lei, Y.; Wang, L. T.; Yao, Z. L. Asian emissions in 489 2006 for the NASA INTEX-B mission. Atmos. Chem. Phys. 2009, 9, 5131-5153; DOI: 490 10.5194/acp-9-5131-2009. 491
(20) U.S. Environmental Protection Agency. Clearinghouse for Inventories & Emissions factors; 492 http://www.epa.gov/ttn/chief/index.html (accessed October 11, 2012). 493
(21) National Atmospheric Emissions Inventory (NAEI); http://naei.defra.gov.uk/data_warehouse.php 494 (accessed September 27, 2012). 495
(22) Reddy, M. S.; Venkataraman, C. Inventory of aerosol and sulphur dioxide emissions from India: 496
Page 16 of 19
ACS Paragon Plus Environment
Environmental Science & Technology
17
I—Fossil fuel combustion. Atmos. Environ. 2002, 36(4), 677-697. 497 (23) Zhang, Q.; Streets, D. G.; He, K.; Klimont, Z. Major components of China's anthropogenic 498
primary particulate emissions. Environ. Res. Lett. 2007, 2(4), 045027. 499 (24) Lei, Y.; Zhang, Q.;He, K. B.; Streets, D. G. Primary anthropogenic aerosol emission trends for 500
China, 1990–2005. Atmos. Chem. Phys. 2011, 11(3), 931-954; DOI: 10.5194/acp-11-931-2011. 501 (25) Zhao, Y.; Nielsen, C. P.; Lei, Y.; McElroy, M. B.; Hao, J. Quantifying the uncertainties of a 502
bottom-up emission inventory of anthropogenic atmospheric pollutants in China. Atmos. Chem. 503 Phys. 2011, 11(5), 2295-2308; DOI: 10.5194/acp-11-2295-2011. 504
(26) Junker, C.; Liousse, C. A global emission inventory of carbonaceous aerosol from historic records 505 of fossil fuel and biofuel consumption for the period 1860–1997. Atmos. Chem. Phys. 2008, 8(5), 506 1195-1207; DOI: 10.5194/acp-8-1195-2008. 507
(27) Zhang, J. J.; Morawska, L. Combustion sources of particles: 2. Emission factors and measurement 508 methods. Chemosphere 2002, 49(9), 1059-1074. 509
(28) Chen, Y.; Zhi, G.; Feng, Y.; Fu, J.; Feng, J.; Sheng, G.; Simoneit, B. R. Measurements of emission 510 factors for primary carbonaceous particles from residential raw‐coal combustion in China. 511 Geophys. Res. Lett. 2006, 33(20). 512
(29) Shen, G. F.; Wei, S. Y.; Wei, W.; Zhang, Y. Y.; Min, Y. J.; Wang, B.; Wang, R.; Li, W.; Shen, H. Z.; 513 Huang,Y.; Yang, Y. F.; Wang, W.; Wang, X. L.; Wang, X. J.; Tao, S. Emission factors, size 514 distributions, and emission inventories of carbonaceous particulate matter from residential wood 515 combustion in rural China. Environ. Sci. Technol. 2012, 46(7), 4207-4214. 516
(30) Bond, T. C.; Streets, D. G.; Yarber, K. F.; Nelson, S. M.; Woo, J. H.; Klimont, Z. A 517 technology-based global inventory of black and organic carbon emissions from combustion. J. 518 Geophys. Res. 2004, 109, D14. 519
(31) Bond, T. C.; Bhardwaj, E.; Dong, R.; Jogani, R.; Jung, S. K.; Roden, C.; Streets, D. G.; 520 Trautmann, N. M. Historical emissions of black and organic carbon aerosol from energy-related 521 combustion, 1850-2000. Glob. Biogeochem. Cycles 2007, 21, GB2018, DOI: 522 10.1029/2006GB002840 523
(32) Klimont, Z.; Cofala, J.; Xing, J.; Wei, W.; Zhang, C.; Wang, S.; Kejun, J.; Bhandari, P.; Mathur, 524 R.; Purohit, P.; Rafaj, P.; Chambers, A.; Amann, M. Projections of SO2, NOx and carbonaceous 525 aerosols emissions in Asia. Tellus B 2009, 61(4), 602-617. 526
(33) Robinson, A.L.; Donahue, N.M.; Shrivastava, M. K.; Weitkamp, E. A.; Sage, A. M.; Grieshop, A. 527 P.; Lane, T. E.; Pierce, J. R.; Pandis, S. N. Rethinking organic aerosols: semivolatile emissions 528 and photochemical aging. Science 2007, 315, 1259-1262. 529
(34) Wang, R.; Tao, S.; Ciais, P.; Shen, H. Z.; Huang, Y.; Chen, H.; Shen, G. F.; Wang, B.; Li, W.; 530 Zhang, Y. Y.; Lu, Y.; Zhu, D.; Chen, Y. C.; Liu, X. P.; Wang, W. T.; Wang, X. L.; Liu, W. X.; Li, 531 B. G.; Piao, S. L. High-resolution mapping of combustion processes and implications for CO2 532 emissions. Atmos. Chem. Phys. 2013, 13(10), 5189-5203. 533
(35) Ginoux, P.; Prospero, J. M.; Torres, O.; Chin, M. Long-term simulation of global dust 534 distribution with the GOCART model: correlation with North Atlantic Oscillation. Environ. 535 Modell. Softw. 2004, 19, 113-128. 536
(36) Mahowald, N.; Lamarque, J. F.;Tie, X.; Wolff, E. Sea salt aerosol response to climate change: last 537 glacial maximum, preindustrial and doubled carbon dioxide climates. J. Geophys. Res. 2006, 111, 538 D05303. 539
(37) World Steel Association; http://www.worldsteel.org (accessed March 8, 2012). 540 (38) U.S. Geological Survey. (USGS) Commodity Statistics and Information; 541
http://minerals.usgs.gov/minerals/pubs/commodity (accessed March 8, 2012). 542 (39) International Fertilizer Industry Association (IFA); http://www.fertilizer.org/(accessed March 28, 543
2013). 544 (40) Shen, H. Z.; Huang, Y.; Wang, R.; Zhu, D.; Li, W.; Shen, G. F.; Wang, B.; Zhang, Y. Y.; Chen, 545
Y. C.; Lu, Y.; Chen, H.; Li, T. C.; Sun, K.; Li, B. G.; Liu, W. X.; Liu, J. F.; Tao, S. Global 546 Atmospheric Emissions of Polycyclic Aromatic Hydrocarbons from 1960 to 2008 and Future 547 Predictions. Environ. Sci.Technol. 2013, 47(12), 6415-6424. 548
(41) Wang, R.; Tao, S.; Wang, W. T.; Liu, J. F.; Shen, H. Z.; Shen, G. F.; Wang, B.; Liu, X. P.; Li, W.; 549 Huang, Y.; Zhang, Y. Y.; Lu, Y.; Chen, H.; Chen, Y. C.; Wang, C.; Zhu, D.; Wang, X. L.; Li, B. 550 G.; Liu, W. X.; Ma, J. M., Black Carbon Emissions in China from 1949 to 2050. Environ. 551
Page 17 of 19
ACS Paragon Plus Environment
Environmental Science & Technology
18
Sci.Technol. 2012, 46(14), 7595-7603. 552 (42) Shen, H. Z.; Tao, S.; Wang, R.; Wang, B.; Shen, G. F.; Li, W.; Su, S. S.; Huang, Y.; Wang, X. L.; 553
Liu, W. X.; Li, B. G.; Sun, K. Global time trends in PAH emissions from motor vehicles. Atmos. 554 Environ. 2011, 45(12), 2067-2073. 555
(43) Wang, R.; Tao, S.; Shen, H. Z.; Wang, X. L.;, Li, B. G.; Shen, G. F.; Wang, B.; Li, W.; Liu, X. P.; 556 Huang, Y.; Zhang, Y. Y.; Lu, Y.; Ouyang, H. L. Global emission of black carbon from motor 557 vehicles from 1960 to 2006. Environ. Sci. technol. 2012, 46(2), 1278-1284. 558
(44) Sánchez-Ccoyllo, O.R.; Ynoue, R. Y.; Martins, L. D.; Astolfo, R.; Miranda, R. M.; Freitas, 559 E. D.; Borges, A. S.; Fornaro, A.; Freitas, H.; Moreira, A.; Andrade, M. F. Vehicular 560 particulate matter emissions in road tunnels in Sao Paulo, Brazil.Environ. Monit. 561 Assess. 2009, 149, 241-249. 562
(45) State Environmental Protection Administration of China. Handbook of Industrial Pollution 563 Emission Rates. China Environmental Science Press, Beijing, China, 1996. 564
(46) Yi, H. H.; Hao, J. M.; Duan, L.; Tang, X. L.; Ning, P.; Li, X. H. Fine particle and trace element 565 emissions from an anthracite coal-fired power plant equipped with a bag-house in China. Fuel 566 2008, 87, 2050-2057. 567
(47) Chen, Y. J.; Sheng, G. Y.; Bi, X. H.; Feng, Y. L.; Mai, B. X.; Fu, J. M. Emission factors for 568 carbonaceous particles and polycyclic aromatic hydrocarbons from residential coal combustion in 569 China. Environ. Sci. technol. 2005, 39 (6), 1861-1867. 570
(48) Oanh, N. T. K.; Albina, D. O.; Ping, L.; Wang, X. K., Emission of particulate matter and 571 polycyclic aromatic hydrocarbons from select cookstove-fuel systems in Asia. Biomass Bioenergy 572 2005, 28, (6), 579-590. 573
(49) Tewalt, S.J.; Belkin, H.E.; SanFilipo, J.R.; Merrill, M.D.; Palmer, C.A.; Warwick, P.D.; Karlsen, 574 A.W.; Finkelman, R.B.; Park, A.J., comp. Chemical analyses in the World Coal Quality Inventory, 575 version 1: U.S. Geological Survey Open-File Report 2010-1196, 2010; 576 http://pubs.usgs.gov/of/2010/1196/pdf/of2010-1196.pdf. 577
(50) Liu, Y.; Zhang, Y. X.; Wei, Y. J.; Dou, H.; Gu, D. S.; Zeng, L. M.; Shao, M. Measurement of 578 emission factors of carbonaceous aerosols from residential coal combustion. Acta Scien. Circumst. 579 2007, 27(9), 1409-1416. 580
(51) Zhi, G. R.; Chen, Y. J.; Feng, Y. L.; Xiong, S. C.; Li, J.; Zhang, G.; Sheng, G. Y.; Fu, J. Emission 581 characteristics of carbonaceous particles from various residential coal-stoves in China. Environ. 582 Sci. technol. 2008, 42 (9), 3310-3315. 583
(52) Zhi, G. R.; Peng, C. H.; Chen, Y. J.; Liu, D. Y.; Sheng, G. Y.; Fu, J. M. Deployment of Coal 584 Briquettes and Improved Stoves: Possibly an Option for both Environment and Climate. Environ. 585 Sci. technol. 2009, 43 (15), 5586-5591. 586
(53) United Nations Industrial Development Organization (UNIDO). International Yearbook of 587 Industrial Statistics 2008; Edward Elgar Publishing: Cheltenham, U.K., 2008. 588
(54) Worrell, E.; Price, L.; Martin, N.; Hendriks, C.; Meida, L. O. Carbon dioxide emissions from the 589 global cement industry. Annu. Rev. Energy Env. 2001, 26, 303-329. 590
(55) Monthly report on the operation of SO2 scrubbers at coal power plants; Jiangsu Department of 591 Environmental Protection: Nanjing, China, 2007-2009. 592
(56) Cementchina.net; http://www.cementchina.net/ (accessed March 8, 2012). 593 (57) Wang, R.; Tao, S.; Balkanski, Y.; Ciais, P.; Boucher, O.; Liu, J. F.; Piao, S. L.; Shen, H. Z.; Vuolo, 594
M. R.; Valari, M.; Chen, H.; Chen, Y. C.; Cozic, A.; Huang, Y.; Li, B. G.; Li, W.; Shen, G. F.; 595 Wang, B.; Zhang, Y. Y. Exposure to ambient black carbon derived from a unique inventory and 596 high-resolution model. Proc. Natl. Acad. Sci. U.S.A. 2014, 111 (7), 2459-2463. 597
(58) China Health and Nutrition Survey (CHNS); http://www.cpc.unc.edu/projects/china. 598 (59) Xu, Y. A., Improvements in the Operation of SO2 Scrubbers in China's Coal Power Plants. 599
Environ. Sci. Technol. 2011, 45(2), 380-385. 600 (60) International Energy Agency (IEA). IEA World Energy Statistics and Balances; 601
http://www.oecd-ilibrary.org/statistics (accessed May 25, 2012). 602 (61) U. S. Energy Information Administration. Form EIA-767 and EIA-860; 603
http://www.eia.gov/electricity/data/detail-data.html. 604 (62) National Bureau of Statistics and National Energy Administration. China Energy Statistical 605
Yearbook, 1989−2008; China Statistics Press: Beijing, 2009. 606
Page 18 of 19
ACS Paragon Plus Environment
Environmental Science & Technology
19
(63) The World Bank and the Development Research Center of China’s State Council. Urban China: 607 Toward Efficient, Inclusive and Sustainable Urbanization. 2014; 608 http://www.worldbank.org/en/country/china/publication/urban-china-toward-efficient-inclusive-s609 ustainable-urbanization. 610
(64) U. S. Environmental Protection Agency. History of the Clean Air Act. 2010; 611 http://www.epa.gov/air/caa/requirements.html. 612
(65) Domenici, P. Clean Air Act Amendments of 1977. Nat. Resources J. 1979, 19: 475. 613 (66) United Nations Statistics Division. United Nations Energy Statistics, 1950−1995; New York, 614
1995. 615 (67) He, K. B.; Huo, H.; Zhang, Q.; He, D. Q.; An, F.; Wang, M.; Walsh, M. P. Oil consumption and 616
CO2 emissions in China's road transport: current status, future trends, and policy implications. 617 Energ. Policy 2005, 33(12), 1499-1507. 618
(68) State Statistical Bureau of China. Statistical Yearbook of China. China Statistics Press, Beijing, 619 2009. 620
(69) China National Radio ; http://www.cnr.cn/gundong/201201/t20120125_509092713.shtml 621 (accessed October 11, 2013). 622
(70) China securities Journal; http://www.cs.com.cn/xwzx/05/200910/t20091027_2244716.htm 623 (accessed October 11, 2013). 624
(71) Guangzhou China; 625 http://www.guangzhou.gov.cn/node_2190/node_2207/2010/06/12/1276310797336552.shtml 626 (accessed October 11, 2013). 627
(72) Limits and measurement methods for exhaust pollutants from compression ignition and gas 628 fuelled positive ignition engines of vehicles ( Ⅲ , Ⅳ , Ⅴ ). GB17691-2005; 629 http://www.zhb.gov.cn/image20010518/3882.pdf (accessed October 11, 2013). 630
(73) Limits and measurement methods for emissions from light-duty vehicles ( Ⅲ , Ⅳ ). 631 GB18352.3-2005; 632 http://kjs.mep.gov.cn/hjbhbz/bzwb/dqhjbh/dqydywrwpfbz/200707/W020110127402088768173.p633 df (accessed Octorber 11, 2013). 634
(74) District Heating and Cooling: Environmental Technology for the 21st Century; International 635 Energy Agency: Paris, 2002. 636
(75) World Bank list of economies; http://data.worldbank.org/about/country-classifications/country- 637 and-lending-groups (accessed July 19, 2014). 638
(76) Pope, C. A.; Dockery, D. W. Health effects of fine particulate air pollution: Lines that connect. J. 639 Air Waste Manage. Assoc. 2006, 56(6), 709-742. 640
(77) Oberdorster, G.; Oberdorster, E.; Oberdorster, J. Nanotoxicology: An emerging discipline 641 evolving from studies of ultrafine particles. Environ. Health Perspect. 2005, 113(7), 823-839. 642
(78) Chen, R. J.; Li, Y.; Ma, Y. J.; Pan, G. W.; Zeng, G.; Xu, X. H.; Chen, B. H.; Kan, H. D. Coarse 643 particles and mortality in three Chinese cities: The China Air Pollution and Health Effects Study 644 (CAPES). Sci. Total Environ. 2011, 409(23), 4934-4938. 645
(79) van der Werf, G. R.; Randerson, J. T.; Giglio, L.; Collatz, G. J.; Mu, M.; Kasibhatla, P. S.; 646 Morton, D. C.; DeFries, R. S.; Jin, Y.; van Leeuwen, T. T. Global fire emissions and the 647 contribution of deforestation, savanna, forest, agricultural, and peat fires (1997-2009). Atmos. 648 Chem. Phys. 2010, 10 (23), 11707-11735. 649
650
Page 19 of 19
ACS Paragon Plus Environment
Environmental Science & Technology
Copyright © 2022 FDOKUMEN