Taxing International Emissions Trading
36
TAXING INTERNATIONAL EMISSIONS TRADING Valeria Costantini - Alessio D’Amato - Chiara Martini Maria Cristina Tommasino - Edilio Valentini - Mariangela Zoli Working Paper n° 143, 2011
Transcript of Taxing International Emissions Trading

TAXING INTERNATIONAL EMISSIONS TRADING
Valeria Costantini - Alessio D’Amato - Chiara Martini
Maria Cristina Tommasino - Edilio Valentini - Mariangela Zoli
Working Paper n° 143, 2011

I Working Papers del Dipartimento di Economia svolgono la funzione di divulgare tempestivamente, in
forma definitiva o provvisoria, i risultati di ricerche scientifiche originali. La loro pubblicazione è
soggetta all'approvazione del Comitato Scientifico.
Per ciascuna pubblicazione vengono soddisfatti gli obblighi previsti dall'art. l del D.L.L. 31.8.1945, n.
660 e successive modifiche.
Copie della presente pubblicazione possono essere richieste alla Redazione.
REDAZIONE:
Dipartimento di Economia
Università degli Studi Roma Tre
Via Silvio D'Amico, 77 - 00145 Roma
Tel. 0039-06-57335655 fax 0039-06-57335771
E-mail: [email protected]

TAXING INTERNATIONAL EMISSIONS TRADING
Valeria Costantini - Alessio D’Amato - Chiara Martini
Maria Cristina Tommasino - Edilio Valentini - Mariangela Zoli
Comitato Scientifico:
Fabrizio De Filippis
Anna Giunta
Paolo Lazzara
Loretta Mastroeni
Silvia Terzi

1
Taxing International Emissions Trading
Valeria Costantini, University Roma Tre - Italy1 Alessio D’Amato, University Tor Vergata - Italy Chiara Martini, University Roma Tre - Italy Maria Cristina Tommasino, ENEA - Italy Edilio Valentini, University “G. D’Annunzio” Chieti-Pescara - Italy Mariangela Zoli, University Tor Vergata - Italy
Abstract Most tradable permit regimes have ignored the role of emission allowance taxation whereas the OECD and the European Union have emphasized the need for further investigation of the related efficiency and effectiveness consequences. The aim of our paper is to take a first step in this direction. We illustrate a theoretical model featuring I representative competitive firms/countries. Our theoretical results show that accounting for permit taxation implies a distortion in the equilibrium price as well as an impact on emissions distribution across countries. The specific features of these distortions are then investigated through a Computable General Equilibrium model in which several options for taxes on net sellers’ permit revenues and defiscalization of net buyers’ permit costs are simulated. Welfare analysis is performed, suggesting that the design of permit taxation is relevant in determining how welfare gains and losses are distributed across countries.
JEL codes: H230; Q580. Keywords: international emissions trading, permit taxation, computable general equilibrium model.
1. Introduction
In the context of international environmental negotiations, cap-and-trade systems are regarded as
a cost-effective instrument for achieving abatement targets. Despite the fact that an extensive
literature has examined various aspects of the functioning of permit markets, the tax treatment of
revenues that arise in a permit trading market has not been fully addressed to date. Not
accounting for permit revenues/cost taxation issues however may lead to wrong conclusions in
terms of their efficiency and effectiveness as well as their impact on industry relocation decisions
(Estrada et al., 2009).
In this paper we aim to contribute to the literature on cap-and-trade regimes by investigating
how the tax treatment of emission allowances may affect the permit market in terms of cost
effectiveness, abatement decisions and welfare effects.
Most existing tradable permit systems have ignored the role of corporate and personal income
tax and Value Added Tax (VAT), implicitly assuming that tradable permits would be outside
1 Corresponding author [email protected]. We are grateful for helpful comments we received from participants to the 2011 EAERE and SIE conferences held in Rome, the 2011 GCET conference held in Madrid, the 2011 SIEP conference held in Pavia. Suggestions received by Simone Borghesi, Ester Camiña, Bouwe Dijkstra, Iñaki Bilbao Estrada and Massimiliano Mazzanti are also gratefully acknowledged.

2
these fiscal regimes or that the impact of taxes would be neutral. For instance, Directive
2003/87/EC establishing a Greenhouse Gas (GHG) allowance trading scheme within the
European Union makes no reference to the accounting and fiscal repercussions of the allocation
and transfer of emission permits. This is surprising, as the fiscal treatment of emission permits
turns out to be a crucial aspect (Kane, 2009), especially when regulated countries differ in terms of
the accounting nature of emission rights, the burden of initial allocation and transfer, the
deductible character of penalties resulting from non-fulfilment of the delivery obligation and the
tax breaks for emission rights transfers. As Fisher (2006) notes, the existence of tax differentials
raises relevant design questions in emission control policies by affecting the allocation of
abatement efforts within multinationals, across countries and across firms.
In this work the effects of the tax treatment of emission allowances are first analysed
theoretically and then investigated through numerical simulations performed with a Computable
General Equilibrium (CGE) model, allowing us to examine complex features of the international
emissions trading system.
In the analytical model, we consider I countries and I representative competitive firms, one in
each country. Firms take emission permit taxation as well as permit endowment as given and
choose their emissions level and their selling or buying behaviour accordingly. Our results show
that permit taxation involves distortions both in the equilibrium permit price and in the
distribution of the environmental target across countries. Emissions trading taxation in a given
country implies an upward shift in the equilibrium price as well as an increase in that country’s
emissions and a decrease in other countries’ emissions. As a consequence, the effect of permit
taxation on tax revenues depends on countries’ position in the permit market: if a country is a net
buyer of permits, its tax revenue is always decreasing both in its own tax rate and in other
countries’ tax rates; on the other hand, if a country is a net seller of permits, its tax revenue is
always increasing in other countries’ tax rates but it may decrease in its own tax rate. The entity
of all these effects depends in a complex way on countries’ specific characteristics, as technology,
competitiveness, and energy mix. Countries’ specificities are therefore explicitly considered in
simulations carried out in the CGE model, based on a modified version of the GTAP-E model,
where international emissions trading (IET) is allowed and permit fiscal treatment is explicitly
modelled. Finally, the cost effectiveness assessment of permits taxation is completed with a
welfare evaluation based on equivalent variation effects occurring in net sellers and net buyers.
According to our analysis we can argue that adverse welfare effects induced by taxation are
minimized for buyers when sellers impose the highest tax rate whilst no fiscal deduction is
allowed to net buyers.
Despite simulations are based on realistic parameter values and results are not far from real life
in many respects, they should be intended as qualitative, rather than quantitative, suggestions
3
about the potential effects of permit taxation in an ideal world emissions trading market featuring
heterogeneous countries. In this respect, our paper has relevant policy implications, although
more specific geographical and economic features must be included in simulations to make our
insights suitable for applied IET designs.
From a theoretical point of view, the bulk of existing contributions considering emissions
trading jointly with tax issues deals with the pros and the cons of overlapping regulatory
instruments (Böhringer et al., 2008; Borghesi, 2010; Brechet and Peralta, 2007; Eichner and
Pethig, 2009; Gruell and Taschini, 2011; Johnstone, 2003). In a slightly different modelling
framework, Fischer (2006) investigates the interaction between multinational taxation and
abatement activities under an IET scheme, mainly focusing on the impact of differentiated
corporate income tax on abatement efforts by taking the equilibrium permit price as exogenous.
To the best of our knowledge the only contributions that have explicitly addressed the impact
of emissions trading revenues taxation are Kane (2009) and Yale (2008). The former provides a
very detailed descriptive analysis on how different options for the fiscal treatment of permits affect
firms’ behaviour on emission trading markets, i.e. their buying (or selling) and banking (or
borrowing) permits. The study also highlights that the fiscal treatment of abatement costs is an
important component to be considered in the analysis of the taxation of emission trading markets,
and concludes that heterogeneous tax treatment regimes among firms or jurisdictions are very
likely to affect allocative efficiency in a multi-periods context.
The latter theoretically examines the extent to which income taxation interferes with cap-and-
trade environmental regulation, reaching two opposite conclusions according to the time horizon
under scrutiny. Within a single tax period, taxing returns from permits does not distort firms’
choices at the margin between using and selling permits or between buying permits and abating.
Conversely, taxes may distort firms’ decisions regarding whether and to what extent they find
permit banking convenient. This is particularly true when permits are provided for free and their
value is excluded from taxable income (holders with a zero basis in their permits). In this case, the
permit price will rise up to the point where tax exemption is capitalized into the price of permits.
Accordingly, tax rules can modify the relative costs of abatement in present and future periods by
affecting the cost-effective allocation of emission reduction.
Our contribution departs from Yale (2008) by theoretically and empirically modelling an
international permit market where permit price as well as emissions abatement decisions are
endogenous. By this framework we can easily show that, differently from Yale (2008), emission
trading taxation leads to distortions even in a static context.
A policy oriented report by Copenhagen Economics (2010) further focuses on cost distortions
related to the existence of differentiated tax treatment of permits across member States in the EU,
concluding that such distortions are not expected to be significant. This work however is based on

4
limiting assumptions such as, for instance, that equilibrium prices are fixed. We generalize
Copenhagen Economics (2010) by performing a broader welfare analysis and adopting a
framework where the IET market functioning is modelled in a more realistic way, as all variables
(including equilibrium price) are endogenously defined. In this setting the price and welfare
impacts of permit taxation turn out to be significant.
Our paper fits in the stream of literature that evaluates emissions trading performance and
design using general equilibrium modelling strategies, as recent works by Böhringer et al. (2011)
and Carbone et al. (2009), in order to better capture the role of countries’ specific features as well
as the role of alternative climate/energy policy designs. Our findings are also relevant in the
debate upon environmental tax reform (Ekins, 2011; Ekins and Salmons, 2010; Ekins et al., 2011a,
2011b), as tax revenues from fiscal treatment of emission permits may be exploited for enhancing
investment efforts in green technologies or for reducing potential negative distribution effects due
to climate change policies. This last point leaves room for further research questions which could
be investigated in the future.
The rest of the paper is organized as follows: Section 2 presents the theoretical model whereas
Section 3 provides some details on the CGE model used for numerical simulations. Section 4
describes the results from simulations and in Section 5 we provide some specific comments on
welfare effects. Section 6 concludes.
2. The theoretical model
We consider a stylized model representing a set of I countries, indexed by . There are a
large number of atomistic identical firms in each country; we can therefore assume that each
country features one representative firm, labelled firm i ( ). Each firm generates polluting
emissions . Firm i’s benefits from pollution, , are assumed to be increasing and strictly
concave in emissions, i.e. and . The shape of synthesizes the effect
related to each firm/country’s industrial and technological features.
Each firm i receives an exogenous amount of emission permits, , that can be traded on a
perfectly competitive international market. Given the after-trade price p arising in the permit
market, each firm chooses the level maximizing the net benefits from pollution, defined as
,

5
where is the tax rate on revenues (costs) generated by , i.e. the amount of permits sold
(when ) or bought (when ). Note that our model is general enough so that we do not
need to specify the nature of permit trading taxation. Possible examples for our purposes could be
the application of (or exemption from) VAT, or differentiated income taxation.
The first order condition of the firm’s maximization problem is
(1)
This condition suggests that, whenever ( ; and ) the taxation
(defiscalization) of revenues (costs) arising from permit trading generates a violation of the cost
effectiveness condition (i.e. ).2 Though expected, this result deserves
further consideration. Indeed, as Kane (2009) underlines, it is not obvious that cost effectiveness
continues to hold when permit taxation is in place. Condition (1) offers simple but rigorous proof
of such an assumption provided that tax rates are different for at least two countries: in fact, if
for any , we go back to the same conclusions yielded by Yale (2008) within a
single tax period.
By totally differentiating (1) we get:
which implies the following comparative statics results:
(2)
and
. (3)
The signs in (2) and (3) define how the level of changes when, for a given level of , p
increases and when, for a given level of p, increases respectively. Both results can be easily
2 In the rest of the paper we will refer to a fiscal policy oriented to reduce the cost of acquiring permit in a net buyer country as defiscalization or rebate interchangeably.

6
explained: when p increases, the net benefit of polluting decreases because buying (selling) permits
becomes more expensive (remunerative); on the other hand, because the net cost of a
permit, for any given permit price, is lowered by taxation, thus reducing the opportunity cost of
emissions. From a deeper analysis of (2) and (3), we can observe the following:
Remark 1. The reactivity of w.r.t. p decreases with and with the concavity of whereas the
reactivity of w.r.t. increases with p and decreases with the concavity of .
As it is reasonable, a country in which marginal benefits from emissions decrease more with
emissions themselves (due, for example, to a mature technology) will ceteris paribus react less to
changes in the permit price and/or in the tax rate. On the other hand, a country featuring a lighter
tax burden will react more to changes in price. From Remark 1, we would expect tax and
technological features to play a crucial role in affecting the effectiveness and efficiency of a cap and
trade program.
The equilibrium in the permit market is defined by the following condition:
. (4)
By totally differentiating (4), we get:
.
If we assume that , , we can rewrite the total differential as
,
so that the equilibrium price increases with tax rates of any country i, that is,

7
. (5)
We can then derive the following observation:
Remark 2. The reactivity of p w.r.t. increases with and decreases with .
Since the intensity of both and depends on the concavity of , Remark 2
suggests that the reactivity of p w.r.t. also depends on the concavity of the benefit functions in
all involved countries/firms. However, the overall effect of the concavity of (or loosely
speaking, the effect of industrial characteristics of country i) is indeterminate in this theoretical
framework, unless some ad hoc specifications are introduced on the functional form of .
Indeed, a change in for some affects the absolute values of both at the numerator
and at the denominator.
We now turn to the overall effect of permit taxation. Eq. (3) tells us that there is a positive
direct effect. Nonetheless, there is also an indirect effect passing through the equilibrium price of
permits. By equations (2) and (5) we know that an increase in implies an increase in which,
in turn, implies a reduction of . The overall impact can then be rewritten as:
where the first addendum on the right hand side is the direct effect whereas the second addendum
is the indirect effect, driven by the permit price in equilibrium. After substituting (3), (2) and (5)
into the expression for , we can rewrite the overall effect of on as follows:

8
. (6)
We can conclude from (6) that an increase in the tax rate in any country i increases equilibrium
emissions in the same country. In other words, the positive direct effect always dominates the
negative indirect (or equilibrium) effect.
By looking at the effect of a country taxation on emissions produced by another country, we
can also observe from (5) that there is a negative relation between the emissions level of any
country and the tax rate imposed by the i-th country:
(7)
since and .
The impact of changes in can be summed up as follows.
Remark 3. An increase in in any country , ceteris paribus, generates an increase in emissions (and
permit demand) in country i and a decrease in emissions (and permit demand) in all other countries.
We turn now to evaluate the effect of permit taxation on the related tax revenue, defined as
.
The marginal effect of an increase in the tax rate on Ri is
(8)
which allows us to state that:

9
Remark 4. If country i is a net seller (i.e. ), its revenue increases if
whereas, if country i is a net buyer (i.e. ), its revenue always decreases (i.e. the rebate increases) with
the tax rate.
In other words, when a country is a net seller of permits, the revenue increases if the impact of
a change in the tax rate on the tax base (i.e. permits sold) is sufficiently small and/or the change in
unit tax revenue is sufficiently large.
It should be noted that there is also a tax related spillover, indeed
(9)
implying that:
Remark 5. The revenue in country j always increases with if country j is a net seller, whereas if country j
is a net buyer, its revenue decreases (i.e. the rebate increases) with if .
Remarks 1-5 put forward how equilibrium price, emission abatement decisions and tax
revenues change when the tax rate in a given country changes. A significant role played by
countries’ specificities is also suggested.3 When we move to the impact of changes in tax rates in
several (i.e. more than one) countries, we can observe more complex effects, and the same holds
with respect to welfare analysis. Instead of resorting to specific functional forms - that could be an
option open to a certain degree of arbitrariness - we examine how the international permit price
reacts to variations in the tax regimes of different countries through CGE simulations, where we
will introduce some elements of realism in order to achieve a deeper understanding of the involved
mechanisms.
!"
A graphical intuition of previous theoretical results is available in Appendix 1, examining the case of homogenous taxation across countries.

10
3. The CGE model for numerical simulations
In this paper we rely on the CGE GTAP-E model as an energy-environmental version of the
standard GTAP model specifically designed to simulate policies in the context of carbon emissions
mitigation. It includes an explicit treatment of energy demand, inter-factor and inter-fuel
substitution, carbon dioxide emissions accounting; it also features climate policies in terms of both
domestic actions, such as carbon taxes, and flexible mechanisms, such as emissions trading
(Burniaux and Truong, 2002; Mc Dougall and Golub, 2007).
Emissions trading is modelled by defining bloc-level emissions and quotas assuming that only
regulated countries can exchange permits in an international market. By exogenously defining
abatement targets for each regulated country, a carbon tax value can be endogenously computed
so that each country meets its commitments at the lowest domestic cost. When emissions trading
is allowed, carbon tax represents the equilibrium value of the marginal cost of abatement, which is
equalized across countries that participate in IET; such value identifies the equilibrium permits
price.
Each country is characterized by a specific abatement cost function. On this basis - and
considering its abatement target - the country becomes a net seller (buyer) if the permit price is
higher (lower) than the domestic abatement cost.
The standard GTAP-E formulation does not account for taxation related to emissions trading
revenues and costs, nor it considers how it affects equilibrium CO2 emissions. Hence a series of
specific modifications to the model equations have been implemented4.
Another significant adjustment is related to the fact that the theoretical model assumes that
each country features a single representative firm, and the selling or buying choices are taken by
representative firms with the aim of maximizing profits. In our CGE model, on the other hand,
abatement decisions are taken in a decentralized way by private agents, namely heterogeneous
firms and consumers that are located in countries participating to the IET. The amounts of abated
emissions by private agents are then summed up and compared with the emissions target at
national level, leading to an aggregate selling or buying behaviour at each country level. In order
to translate private agents’ decisions into the national abatement level, in this GTAP-E version,
the emission permits are taxed by acting directly in the demand price function.5 To simulate the
impact of IET taxation, the carbon equilibrium price (nominal carbon tax given by the
international market) faced by agents is increased by an ad valorem permit tax, thus influencing
the fossil fuel consumption behaviour of each economic agent. More precisely, the tax rate
4 For a flavour of how the theoretical model in Section 2 translates into GTAP-E see Figure A1 in Appendix 1. 5 In more detail, the taxation on revenues from the emission permits’ sale is modelled as directly affecting the emission permit price, and the same approach is adopted concerning the defiscalization of the costs related to emission permits’ purchase.

11
introduced into the GTAP-E model is uniform among economic sectors and differentiated
between countries, allowing the effects related to homogeneous or heterogeneous rates to be
simulated.
In this paper, according to Antimiani et al. (2011), two major changes in the standard GTAP-E
version are also introduced, enhancing the robustness of simulation results.
First of all, we adopt the updated GTAP Database version 7.1 (base year 2004) as well as the
latest version of the combustion-based CO2 emissions data provided by Lee (2008) for all GTAP
sectors and regions6.
Second, some elasticity parameters in the energy nests have been replaced with those proposed
by Beckman and Hertel (2010) for the substitution elasticity between the capital-energy composite
and the other endowments as well as for the Armington elasticities according to Hertel et al.
(2007).7
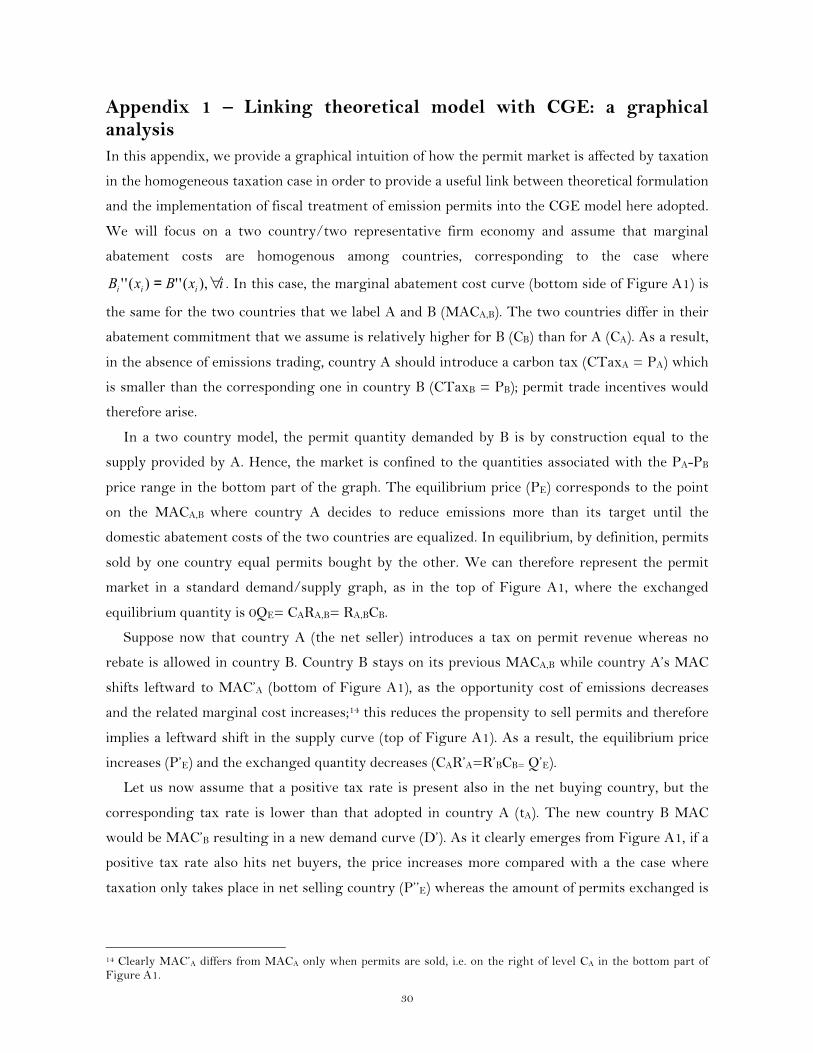
The model settings include an aggregation of 21 sectors and 21 regions (Table A1 in Appendix
2). With regard to regional aggregation, we consider as an ideal case a complete Kyoto Protocol
environment with 11 regulated countries/regions featuring country-specific CO2 reduction
commitments by 2012, where regional aggregation follows a simple criterion based on differences
in abatement targets. Therefore, the EU is considered as a single region since its bargaining
power has been exploited by obtaining a single abatement target (-8% compared with 1990
emission levels) whereas Croatia and Switzerland are treated separately since they have
negotiated two distinct emission targets.8
As far as sectoral aggregation is concerned, we single out energy sectors such as coal, crude oil,
gas, refined oil products and electricity as well as other energy intensive sectors (cement, paper,
steel and aluminium) since they are candidates for the main sources of production reallocation, and
other manufacturing non-energy intensive sectors as described by the IEA Energy Balances.
In order to compare economic and environmental effects of abatement decisions consistent with
our ideal Kyoto environment, a 2012 baseline has been constructed based on the GTAP 7.1
database that uses year 2004 data. To this end, we have considered a business as usual scenario for
emissions data with slow adoption of clean technologies according to IEA Business as Usual
6 Emissions in our version do not account for all other GHG emissions since they only relate to fossil fuels combustion, thus providing a lower bound estimate of the abatement targets. The underestimation is quite homogeneous across regions and sectors with the exceptions of the agriculture and chemicals sectors. 7 For a comprehensive discussion of substitution elasticities in the energy sector, see Koetse et al. (2008), Okagawa and Ban (2008), while Panagarya et al. (2001) and Welsch (2008) discuss the role of import demand elasticities in international trade. In our model parameters for substitution elasticities in the production function are:
,
, , , referred in the order to the nests including: capital and energy, electric and non electric energy, coal and non coal energy sources, non coal energy sources.
8 Considering the Rest of the World, we singled out the major emerging economies such as Brazil, China, India, Mexico, and South Africa. Nonetheless, in our simulations we are not interested in investigating the effects on non-regulated countries, since the IET mechanism is allowed in regulated countries only. Final regional and sector aggregation is described in Table A1 in Appendix 2."

12
Scenario (IEA, 2010b), economic projections to 2012 based on International Monetary Fund and
World Bank information on effective growth rates after the financial and economic crisis.
We have also accounted for potential distortions arising when transition economies are allowed
to sell permits in the carbon market. The huge potential supply by these countries would produce
substantial distortions, partially invalidating the role of an IET scheme. These uncertainties may
be included in the so-called “hot air” debate which also addresses the role of other flexible
mechanisms required by the Protocol (World Bank, 2010). In order to reduce potential market
failures brought about by this feature, we have adopted a partial adjustment to emission targets
for Belarus and Former Soviet Union (FSU). For these specific countries, the emissions level by
year 2012 - rather than the usual 1990 period - has been taken as the reference to which the 0%
target scheduled in the Protocol must be applied, reducing their potential permit supply
substantially.
As noted in the introduction, though linked to relatively realistic parameters, our simulations
are not to be intended as “real life” policy scenarios. Rather, we aim at using numerical simulations
to assess specific consequences of permits taxation that cannot be analysed in our simple
theoretical framework.
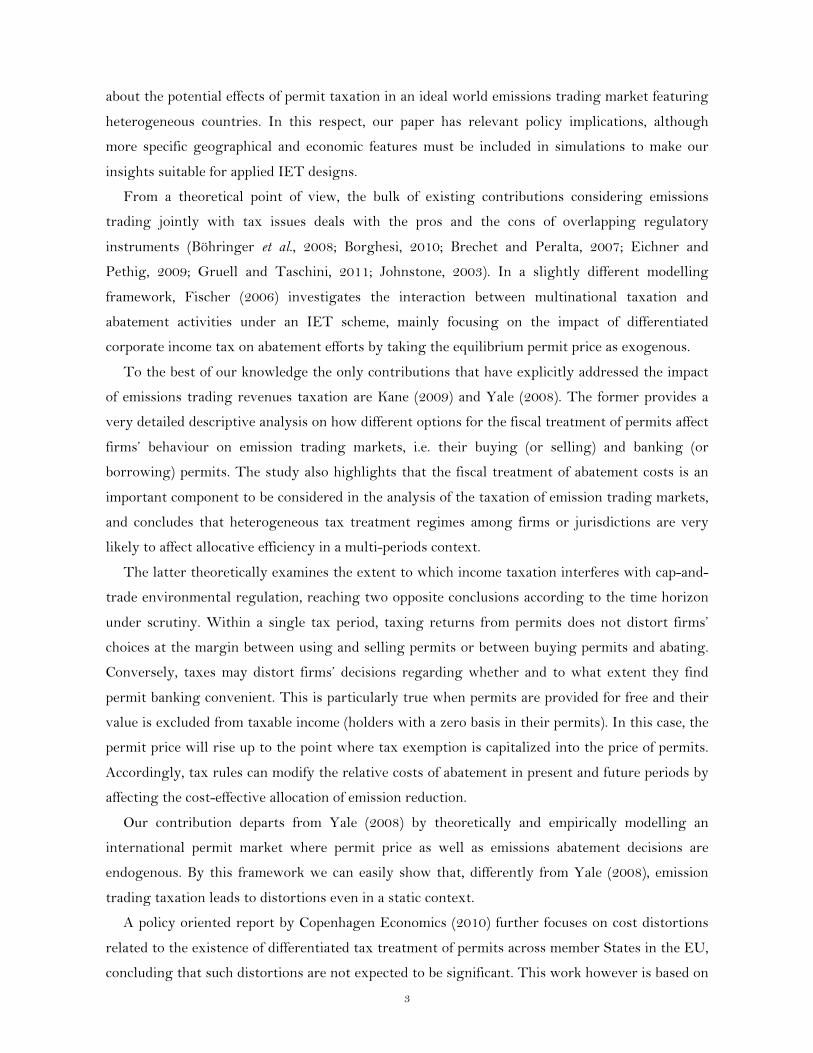
4. Simulation results
The different simulations we propose follow the main results obtained in the theoretical paper and
are summed up in Figure 1.
The baseline simulation considers an IET system without taxation of carbon permits (hereafter
referred as IET no Tax). This simulation represents the baseline for assessing the relative impact
of different options for fiscal treatment of emission permit revenues compared with a no tax
situation.
Starting from this benchmark, from the first set of simulations (Table 1) we can assess the
impact of the introduction of a tax rate on emission permit revenues (or a rebated tax rate on
permits costs) compared with an IET no tax situation. In particular, we test the overall effects on
the permit equilibrium price as well as on emission abatement decisions when homogeneous tax
rates across countries are implemented (simulation 1 for a low tax rate, simulation 2 for a high tax
rate). We then assess the effects related to the magnitude of the gap between the tax rates in net
selling and net buying countries, specifically assuming that tax rates are at their maximum level in
net selling countries while rebates are reduced in net buyers (simulations 3-4). In this case, the
gap only depends on net buyers’ decisions concerning the fiscal treatment of emission permit
purchase costs. These simulations are related to the partial equilibrium analysis addressed in
13
Remarks 1 and 2 (see Section 2) and allow the effects of permit fiscal treatment on the final
equilibrium price and on the market dimension to be disentangled.
Figure 1- Diagram of performed simulations
Following this line of reasoning, we also examine the case in which no taxation is in force for
net buyers while the tax rate for net sellers assumes its maximum and minimum value
(simulations 5-6). By taking the same tax rate for all seller countries and the same rebate rate for
all buyers we can single out the specific impact of technological features, summed up by ,
on equilibrium price and permit quantities. All these simulations allow the direct and indirect
effect predicted by Remark 3 to be considered simultaneously.
It is worth noting that all tax and rebate rates are taken in the range of 15%-35%, as a purely
exemplificative exercise.9 Since the tax and rebate rates act as an ad valorem on the equilibrium
price, when taxation levels are homogeneous, the average tax rate corresponds to a simple mean of
the nominal tax rates applied in abating countries. On the contrary, when tax rates are
heterogeneous, the average tax rate corresponds to a weighted average of the nominal tax
revenues, where weights are given by the net permit value at the equilibrium market price,
formally defined as
9 The range adopted in simulations design has been taken in line with the corporate tax rates reported by the OECD for the most recent year (http://www.oecd.org/document/60/0,3746,en_2649_34897_1942460_1_1_1_1,00.html). Although the range can be considered almost realistic, the effective tax and rebate rates have been associated with our CGE regions randomly, without specific coherence with those rates reported in the OECD data country by country."

14
(10)
where is the total amount of permits sold/bought by country i, given by the difference
between emission targets and current emissions.
Table 1- Alternative homogeneous tax rates
As far as the baseline simulation (IET no tax) is concerned, we can single out net sellers and
net buyers by comparing the abatement targets (first column in Table 2) with the effective
emission levels in an IET context (second column). We have four net sellers, namely Belarus, EU,
FSU and Switzerland, whereas all other regulated countries reduce CO2 emissions to a lower
extent compared with their abatement targets, matching the difference by buying permits on the
international market (as illustrated by simulated MACs in Figures A2 and A3 in Appendix 3).10
The corresponding equilibrium price equals 22.86 US$ per ton of CO2 which is reasonably
consistent with the permit price values registered in the European Union carbon market (ETS)
corresponding approximately to 19-20 US$ per ton of CO2 on average for 2010.11
The homogeneous taxation case allows us to conclude that the higher the tax rate, the higher
the equilibrium price of permits. Indeed, the introduction of a 15% homogeneous taxation
10 Country-specific MAC curves are represented in Figures A2 and A3 in the Appendix 3 for small and large economies modelled in our GTAP-E version. Domestic marginal abatement costs for each national emissions target may be compared with the permit equilibrium price derived in an IET scenario, thus obtaining information on the relative position of each country in the carbon market within a general equilibrium context."11 Countries result as net sellers or buyers depending on multiple dimensions such as the current energy mix, the production structure as well as the specific abatement targets. Hence, our simulations are only representative of what could happen on the permits market for sellers and buyers in general, not at a country-specific level. Results may in fact change according to different model settings or simulation designs.

15
(simulation 1) implies an increase in the price of permits from 22.86 to 27.05. Increasing the tax
rate to a (homogenous) 35% (simulation 2) implies a further increase of the equilibrium price to
35.82. The increase in the equilibrium price is not, in general, the same as the tax rate, so that we
can confirm (as shown in the theoretical model, see equation (5)) that the economic structure of
involved countries plays indeed a role. More specifically, the price increase is 18% when a 15% tax
rate is introduced and around 57% when a 35% tax rate is introduced.
Table 2- Emission levels (tons of CO2) and permit price with homogeneous tax and rebate rates
By looking at simulations 1 to 4 in Table 2, we can conclude that there is a more general direct
link between the equilibrium permits price and the average tax rate. Turning to abatement levels,
and again coherently with our theoretical predictions (see equation (1)) in a fully homogeneous
case, emission abatement decisions remain fairly constant both for net sellers and buyers. On the
other hand, when net buyers’ taxation changes with respect to net sellers, a significant decrease in
abatement seems to be matched to increases in the gap between net buyers and net sellers’
taxation (see, in particular, simulations 3, 4 and 5).
Specific country features explain the relative strength of the indirect price effect and of the
effect directly related to taxation in terms of abatement decisions. Although the direct tax-related
effect always prevails, consistently with eq. (6) and Remark 3, net sellers feature a differentiated
impact in terms of emissions increase. The relative position of MACs for these countries explains
this result. If we compare Belarus with Switzerland (Figure A2) and FSU with EU (Figure A3) it
is worth noting that in both cases the portions of the MAC curves which are above the IET no
Tax equilibrium price diverge, with Switzerland and FSU showing higher abatement costs

16
compared with Belarus and EU respectively, giving a flavour of the role played by countries’
technological features12.
We finally turn to the effect of changes in tax rates on the (positive or negative) revenue (Table
3). In the homogeneous tax case, as expected, an increase in the tax rate (simulations 1 and 2)
implies a gain for net sellers and a loss for net buyers, due to the equilibrium permits price
increase brought by a higher tax rate. From Table 3 we can also conclude that lowering the tax
rate for net buyers reduces the loss for the corresponding countries but also generates lower gains
for net sellers due to a decrease in the equilibrium price of allowances.
Table 3- Net permit value, revenues and rebates with homogeneous tax and rebate rates
Our simulations lead to results which are more clear cut than in Remark 4: revenue always
increases with the tax rate for net sellers, while (negative) revenue decreases with the tax rate for
12 The MAC curve for FSU remains slightly above the MAC curve for EU up to the equilibrium price in the IET no Tax case, and then starts to grow more rapidly for abatement efforts corresponding to domestic carbon tax levels above the calculated equilibrium price. This result is hardly surprising if we consider that within the EU aggregate all new EU member States are included, which are characterized by low abatement costs. In addition, specialization patterns in the productive structure may also help explaining the relative higher costs for FSU above a threshold level.

17
net buyers. Additional interesting results can be singled out if we set the tax rates for net sellers
at 35% in line with simulation 2 and reduce the corresponding rates for net buyers to 25%, 15%
and 0% respectively. We can conclude that the larger the tax wedge, the smaller the permits price,
the larger emissions and the smaller the revenue for net permits sellers. By contrast, quite
reasonably, for net permits buyers we observe that an increasing tax difference implies smaller
emissions and a lower absolute value for the (negative) revenue.
The extreme cases in which a tax rate is imposed by net sellers whereas net buyers rates are set
to zero seems to confirm previous results in terms of the related price impact. Also, net sellers
react consistently with the theoretical model (Remark 1), reducing their abatement efforts
(increasing their emissions). Emissions for net permits buyers react in the opposite way, given the
overall target.
The second set of simulations (Table 4) considers a case where the tax rate for net buyers is set
to 0 (i.e. no rebate takes place), while a uniform 15% tax rate for sellers is taken as a benchmark
(simulation 6 from Table 1). This baseline is then compared with cases where one of the net sellers
imposes a larger tax rate (i.e. a tax rate equal to 35%). This exercise allows us to consider the
relative impact of country specific features, including heterogeneous tax rates, on the permit
market for net sellers.
Looking at abatement decisions (Table 5), net sellers’ behaviour respects the condition ,
since the emission level for a country with (tax rate equal to 35%) is always higher than
the benchmark case (simulation 6) where an homogenous 15% tax rate is applied. In this way, we
can single out the direct and indirect effect of the tax and price channel on abatement decisions.
Also, results in Table 5 show that the theoretical result
holds in our simulations, as an
increase in the tax rate in one country always leads to decreases in emissions in other countries.
As expected, the impact is less significant when the tax rate is increased in relatively small
countries.
The same holds with respect to the impact in terms of the equilibrium price of permits: when
the tax is increased in relatively small sellers, the change in the permits price is small.
Interestingly, when the tax is increased in the EU, the price increases from 24.49 to 25.80, while
when the increase takes place in the Former Soviet Union increases slightly less (to 25.74). This
happens in spite of the (much) larger average tax rate arising when the tax increase takes place in
the FSU, being the latter the largest net seller. Such outcome suggests how specific features of
involved countries might affect the equilibrium outcome.

18
Table 4- Alternative heterogeneous tax rates with no rebate
Table 5- Emission levels (tons of CO2) and permit price with heterogeneous tax rates (no rebate)
Results in Table 6 confirm that each country’s revenue is increasing in own tax rate, with the
exception of Switzerland where apparently the condition
is not
respected (see Remark 4). This result, however, can be explained by considering the relatively low
influence of small economies’ taxing decisions on the equilibrium permit price. The prevailing
force is then likely to be associated with domestic emission abatement decisions, implying that the
right hand side of the above inequality is larger than the left hand side. Finally, it is also clear
from Table 6 that each net seller’s revenue increases with other countries taxation; the absolute
value of the impact depends on each country’s dimension, larger countries featuring a larger
impact on permits market and, therefore, on other countries’ revenue.

19
The third set of simulations (Table 7) completes our analysis by assessing the impact of tax
rates heterogeneity among net buyers, while keeping a homogenous tax rate for net sellers.
Table 6- Net permit value, and revenues with heterogeneous tax rates (no rebate)
Table 7- Alternative heterogeneous rebate rates (homogeneous tax)

20
We address the links among emissions, equilibrium price and revenues taking as a benchmark
the case where a homogeneous 15% tax rate is present in net buying countries (simulation 4). For
the sake of simplicity, simulations are classified according to a decreasing average tax rates for net
buyers.
Looking at Table 8, we can see that theoretical results, Remarks 1 and 2 in particular, are again
confirmed by simulations. Indeed, the equilibrium price of permits and emissions in the country
featuring a relatively high tax rate are larger, whilst emissions in other countries are lower and
the significance of the impact is lower the lower the dimension of the involved country.
Turning to the impact on public revenue, we find again a non monotonic relationship: revenue
decreases in all cases (i.e., increases in absolute value) and the reduction is larger the larger the
dimension of the buyer (simulation 11).
Table 8- Emission levels (tons of CO2) and permit price with heterogeneous rebate rates (homogeneous tax)
Interestingly, Table 9 confirms the existence of a revenue related spillover effect or, in other
terms, a change in the tax rate in one country implies a change in other countries’ revenue, being
them net sellers or net buyers. The sign of the relationship is expected to depend on the condition
summed up in Remark 5.
Summing up, simulation results mainly confirm our theoretical insights, but also extend them
to account for countries specificities.
Additional conclusions stemming from simulations can be briefly summarized as follows:
• the change in equilibrium permits price can be significantly larger than the tax rate change
(simulation 2). Though not explicitly modelled, we can expect that a 57% increase in the
equilibrium permits price can lead to a significant change in regulated firms’ behaviour in the long
run (in terms of the adopted energy technology for instance);

21
• countries can be expected to benefit or lose from increases in their own as well as other
countries’ tax rates; Switzerland, for example, as a net seller of permits, exhibits a decreasing tax
revenue in its own tax rate, given its small impact on the equilibrium permits price;
• countries’ features, such as marginal costs, tax rates and initial endowments, can significantly
affect the impact of taxation on the permits market.
Table 9- Net permit value, revenues and rebates with heterogeneous rebate rates
Clearly, not all results coming from different simulation settings have been reported here. The
choice of specific simulations turned out to be useful in order to arrange the welfare analysis
performed in the next section. We have dropped other simulations such as, for instance, the case
for asymmetric tax rates in which a 0 tax rate was imposed for net sellers while a 35% tax rate was
imposed for net buyers. We should note however that other possible combinations of tax rates do
not affect our results in qualitative terms.
5. Welfare analysis
The impact of permit taxation on welfare is expected to depend both on “pure” cost effectiveness
considerations and on broader effects related to the interaction of the permit market with the
whole economy.

22
Let us first discuss some broad considerations on the cost effectiveness of carbon market
taxation for net sellers and buyers. In Figure 2 we represent the simplest case where permits are
taxed in selling countries and buyers do not apply any rebate.
We focus on a two country/two representative firm economy and assume that marginal
abatement costs are homogenous among countries, corresponding to the case where
. In this case, the marginal abatement cost curve is the same for the two
countries that we label A and B (MACA,B). The two countries differ in their abatement
commitment that we assume is relatively higher for B (CB) than for A (CA). As a result, in the
absence of emissions trading, country A should introduce a carbon tax (CTaxA = PA) which is
smaller than the corresponding one in country B (CTaxB = PB); when emissions trading is instead
allowed, incentives to trade arise.13
In a two country model equilibrium, the permit quantity demanded by B is by construction
equal to the supply provided by A. Hence, the market is confined to the quantities associated with
the PA-PB price range. The equilibrium price (PE) corresponds to the point on the MACA,B where
country A decides to reduce emissions beyond its target until the domestic abatement costs of the
two countries are equalized.
We first derive the standard cost effectiveness property of emissions trading by comparing
abatement costs and permit revenues in the two cases, with and without IET. Country A (the
seller) will face a total abatement cost equal to 0ACA or to 0DRA,B in the case of domestic actions
or participation in a carbon market, respectively. In the case of IET, the increasing total
abatement cost is more than compensated by permit revenue (CABDRA,B) leading to a net gain
equal to the area ABD. On the contrary, country B will face a reduction in total abatement costs
equal to RA,BDECB covered only partially by payments for emission allowances on the carbon
market (RA,BDFCB), resulting in a net gain (DEF). We can therefore demonstrate the (standard)
cost effectiveness result for IET with regard to domestic actions (no IET).
Turning to the case where emissions trading taxation is present, let us assume that country A
imposes a tax rate on permits sold in the carbon market; the corresponding MAC curve shifts to
the left and the new equilibrium price increases to P’E , with country B buying less permits. The
new net gain compared with a no IET case for buyers will result in IEL with a net loss equal to
DILF. For country A, the final result is not obvious. The new MAC’A corresponds to a net gain
compared with a no IET case given by the area AGH, which has to be compared with area ABD.
The difference is determined by the relative size of areas BGHM and AMD. For country A, we
should also consider a pure revenue effect, which results in a net public revenue for country A
government, equal to the area TGHS. Net loss from raising abatement costs is instead given by
13 For a more detailed analysis see Appendix 1.

23
the areas AUS+SND, since a portion of the negative effect (namely the area UMNS) is
compensated by public revenue gains. Net selling country A can therefore experience a net gain
or loss depending on the comparison between gains TBMU+BGHN and losses AUS+SND. The
net impact depends on the extent to which the tax rate is transferred on the market equilibrium
price, or in other words, the relative elasticity of supply and demand curves, which in turn depends
on MAC curves.
Figure 2 - Effects of permit taxation on abatement costs for sellers and buyers
The net result for regulated countries as a whole is not obvious as well. The area QILF is by
construction equal to BGHN, so the corresponding gains and losses compensate reciprocally. We
are left with gains equal to area TBMU in country A and losses equal to AUS+SND in country A
and to DIQ in country B. In Figure 2, global losses are characterized by light grey, while global
gains are in dark grey. As it clearly emerges, no general conclusion can be derived.
Other factors may enter the picture as well. Indeed, the welfare analysis performed so far only
tells us one part of the story, since it only considers abatement costs and revenue related effects (in
a partial equilibrium setting as described in the theoretical model) whereas a general equilibrium
approach would provide more realistic MAC curves, also considering sector specialization as well
as terms of trade effects including non-regulated countries.
To this end, let us now enrich the discussion by turning to the global welfare effects and using
the net equivalent variation in a general equilibrium framework, derived from CGE simulation

24
results. In this way, apart from the already mentioned permits value and permits revenue effects,
we can also include the allocative efficiency effects of different abatement decisions (when
allocation of emission reductions changes according to different tax treatment) and terms of trade
effects related to the world market (related to changes in export to import relative prices), as
discussed by Hanslow (2000) and Hurt and Hertel (2000). Equivalent variations for all simulations
have been ranked according to the welfare changes relative to a domestic policy scenario without
emissions trading for two aggregate regions representing net sellers and net buyers.
Figure 3 shows different effects for sellers and buyers for three extreme cases compared to a
domestic policy simulation: the IET no Tax case; the case where tax rates are homogeneous
between sellers and buyers and set at the maximum level (Max Tax Rate - simulation 2); the case
where sellers impose the highest tax rate while no rebate is allowed for net buyers (Max Tax Lag
- simulation 5).
Figure 3 - Net welfare effects for countries participating in IET
The Max Tax Lag case shows the highest welfare gains at a global level with respect to a
domestic policy scenario, since total gains are higher than in the other two cases. The IET no Tax
case corresponds to the best scenario in welfare terms for net buyers since their welfare gains in
relation to a domestic policy scenario are maximized compared with all other cases.
Net sellers gain the most when a homogeneous tax rate is applied and the higher the tax rate,
the higher their welfare improvement. Moreover, the increase in net sellers’ equivalent variation is
larger when the distance between the tax and rebate rate is lower. As a result, highest gains for
net sellers are associated to the 35% homogenous tax rate with full rebate (Max Tax Rate); in this
case, net buyers are going to lose the most (compared with a no tax situation).
This specific result may well be explained by the combination of allocative efficiency effects
with effects related to permits value and defiscalization costs in the net buyers group. From
Figure 2, introducing a full rebate corresponds to a left-side shift of the MACB, thus resulting in a
-10.000
0
10.000
20.000
30.000
No Tax Max Tax Rate Max Tax Lag
Welfare effects
Total IET Net Sellers Net Buyers

25
net permit equilibrium price that is higher than in the IET no tax situation. Accordingly
abatement costs for net buyers increase, due to the higher permits value, and generates a larger
impact on public revenue in the net buying countries as well.
A decomposition of equivalent variation into its main components (Figures 4-5) helps
discovering the determinants of the welfare impact related to ETS taxation.
Figure 4 – Decomposition of welfare effects for net sellers
As Figure 4 shows, net selling countries experience the largest permits value under the Max
Tax Rate simulation, where the permits price is the largest possible. The same holds, as expected,
with respect to permits related revenue. In general, both permits value and permits revenues are
larger when emissions trading takes place as compared to the domestic policy case. The terms of
trade for sellers improve, leading to a larger welfare (with the largest effect again associated to the
Max Tax Rate case). Finally, allocative efficiency per se is damaged by permits taxation, as net
sellers perform additional emission reduction with respect to the optimal domestic level.
From Figure 5 we can conclude, as it is reasonable, that all changes underlined so far are
somewhat reversed in sign if we focus on net buying countries.
Summing up, when the overall welfare equivalent variations are scrutinized, the socially
desirable design of emissions trading taxation at a global level requires homogenous tax rates and
no rebate. Thus, the resulting equilibrium solution maximizing welfare gains seems to be
simulation 5, with the highest tax rate imposed by sellers and no rebate allowed by net buyers.
Finally, we can remark that allocative efficiency effects for net sellers are strongly driven by
domestic tax decisions. By considering simulations 7-10, where only net sellers adopt a tax
regime on emission permits, there is a direct relation between domestic tax rate and welfare (Wi)
in the form , where the relative magnitude of this relation is mainly explained by
country-specific features. For instance, when EU or FSU adopt a 35% tax rate whereas all other
sellers have a 15% rate (scenarios 7 and 8 respectively), the allocative efficiency gains are
-25.000
-5.000
15.000
35.000
No Tax Max Tax Rate Max Tax Lag
Net Sellers
Permits value Allocative efficiency
Terms of trade Permits revenue

26
relatively higher for EU than for FSU, and this is clearly explained by differences in MACs for the
two countries where permit equilibrium prices are higher than in an IET no tax situation.
Figure 5 – Decomposition of welfare effects for net buyers
6. Concluding remarks
Emissions trading is increasingly used in practice due to its desirable theoretical properties, the
most well-known being its ability to achieve a given emission reduction target at the lowest cost.
A substantial amount of literature has recently tested the robustness of these results to several
extensions. We put ourselves in this stream, by taking a first step in the evaluation of
environmental and welfare performance of emissions trading when permit revenues taxation and
permit costs rebates are explicitly accounted for.
This paper is intended to be a starting point. However, the main message of our work is both
theoretically and policy relevant. From a theoretical point of view, we add to the existing
literature by explicitly assessing the impact of permit taxation on equilibrium price and emissions
as well as on tax revenues. We complement theoretical results by developing a CGE simulation
model where the net buying or selling behaviour of countries as well as welfare effects are
investigated. Differently from previous works, we show that the design of permit trading taxation
is not expected to be neutral in terms of environmental effectiveness and economic efficiency.
Welfare analysis also suggests that the welfare optimum might not coincide with the most
preferred option for buyers or sellers.
From a policy perspective, our paper can have several applications and extensions. First of all,
our modelling strategy can be useful in addressing specific IET design issues, by adapting
parameter values and geographical settings to specific environmental quality problems and areas
(such as the case of the European ETS). Second, our paper suggests an additional source of
“green” revenues; this is likely to be an important side effect of IET taxation when considering it
-25.000
-5.000
15.000
35.000
No Tax Max Tax Rate Max Tax Lag
Net Buyers
Permits value Allocative efficiency
Terms of trade Permits revenue

27
in the broader view of environmental fiscal reforms. In this respect, our model already includes the
evaluation of welfare consequences related to raising public revenue, as clarified in Section 5, but a
more detailed analysis of the recycling of such revenue deserves further investigation.
Finally, given the significant impact on the equilibrium price of permits (up to 57% with respect
to the no taxation scenario), we can expect another side effect of IET taxation to be an increase in
incentives towards technological progress. This latter topic can be fruitfully explored by
extending our modelling strategy to a dynamic setting.

28
References
Antimiani A., Costantini, V., Martini, C., Salvatici, L., Tommasino, M.C., (2011), Cooperative and non-cooperative solutions to carbon leakage, Working Paper No. 136, Department of Economics, University Roma Tre, Italy.
Beckman, J.F., Hertel, T.W., (2010), Validating energy-oriented CGE models, GTAP Working Paper No. 54., GTAP, Purdue University.
Böhringer, C., Dijkstra, B., Rosendahl, K.E., (2011), Sectoral and regional expansion of emissions trading, Discussion Papers No. 654, May 2011, Statistics Norway, Research Department.
Böhringer, C., Koschel, H., Moslener, U., (2008), Efficiency losses from overlapping regulation of EU carbon emissions, Journal of Regulatory Economics, Vol. 33, pp. 299-317.
Brechet, T., Peralta, S., (2007), The race for polluting permits, CORE Discussion Paper 2007/27 and CEPR 6209.
Burniaux, J.M., Truong, T., (2002), GTAP-E: an energy-environmental version of the GTAP model, GTAP Technical paper No. 16.
Carbone, J.C., Helm C., Rutherford, T.F., (2009), The case for international emission trade in the absence of cooperative climate policy, Journal of Environmental Economics and Management, Vol. 58, pp. 266-280.
Copenhagen Economics, (2010), Tax treatment of ETS allowances, Report prepared for EC DG TAXUD, October 2010.
EEA, (2010), Annual European Union greenhouse gas inventory 1990-2008, EEA Inventory report, Luxembourg.
Eichner, T., Pethig, R., (2009), CO2 emissions control with national emissions taxes and an international emissions trading scheme, European Economic Review, Vol. 53, pp. 625-635.
Ekins, P., (2011), The price mechanism and eco-efficiency: The role of green fiscal reform, Journal of Industrial Ecology, Vol. 15, pp. 663-666.
Ekins, P., Salmons, R., (2010), Making reform happen in environmental policy, in making reform happen: lessons from OECD countries, OECD, Paris, pp.129-157.
Ekins, P., Pollitt, H., Barton, J., Blobel, D., (2011a), The implications for households of environmental tax reform (ETR) in Europe, Ecological Economics, Vol. 70(12), pp. 2472-2485.
Ekins, P., Summerton, P., Thoung, C., Lee, D., (2011b), A major environmental tax reform for the UK: Results for the economy, employment and the environment, Environmental and Resource Economics, Vol. 50, pp. 447-474.
Estrada, I.B., Fargas Mas, L.M., Ansòtegui, A.I.M., (2009), Emission rights and corporate income tax in the EU, INTERTAX, Vol. 37, Issue 11.
Fischer, C., (2006), Multinational taxation and international emissions trading, Resource and Energy Economics, Vol. 38, pp. 139-159.
Gruell, G., Taschini, L., 2011, Cap-and-trade properties under different hybrid scheme designs, Journal of Environmental Economics and Management, Vol. 61, pp. 107-118.
Hanslow, K.J., (2000), A general welfare decomposition for CGE models, GTAP Technical Paper No. 19.
Hertel, T.W., Hummels, D., Ivanic, M., Keeney, R., (2007), How confident can we be of CGE-based assessments of free trade agreements?, Economic Modelling, Vol. 24, pp. 611-635.
Hurt, K.M., Hertel, T.W. (2000), Decomposing welfare changes in the GTAP model, GTAP Technical Paper No. 5.
IEA, (2010a), CO2 Emissions from fuel combustion- Highlights, International Energy Agency Statistics, Paris.
IEA, (2010b), World Energy Outlook, International Energy Agency, Paris. Johnstone, N., (2003), The use of tradable permits in combination with other environmental policy
instruments, OECD Environmental Directorate, ENV/EPOC/WPNEP(2002)28/ FINAL, OECD, Paris.
Kane, M., (2009), Taxation and global cap and trade, New York School of Law Colloquium on Tax Policy and Public Finance, NYU School of Law, U.S.

29
Koetse, M., de Groot, H., Florax, R., (2008), Capital-energy substitution and shifts in factor demand: a meta-analysis. Energy Economics, Vol. 30, pp. 2236-2251.
Lee, H., (2008), An emissions data base for integrated assessment of climate change policy using GTAP.
Ludena, C., (2007), CO2 Emissions in GTAP-E: Ready-for-aggregation GTAP 6.0 data. McDougall, R., Golub, A. (2007), GTAP-E Release 6: A revised energy-environmental version of
the GTAP model, GTAP Technical Paper No. 15. Okagawa, A., Ban., K., (2008), Estimation of substitution elasticities for CGE Models. Discussion
Paper 08-16, Graduate School of Economics and Osaka School of International Public Policy, Osaka, Japan.
Panagarya, A., Shah, S., Mishra, D., (2001), Demand elasticities in international trade: are they really low?, Journal of Development Economics, n. 64, pp. 313-342.
Sorrell, S., Sijm, J., (2003), Carbon trading in the policy mix, Oxford Review of Economic Policy, Vol. 19, pp. 420-437.
Welsch, H., (2008), Armington elasticities for energy policy modeling: evidence from four European countries, Energy Economics, Vol. 30, pp. 2252-2264.
World Bank, (2010), State and trends of the carbon market 2010, Carbon Finance at the World Bank, Environment Department, World Bank, Washington DC., USA.
Yale, E., (2008), Taxing cap and trade environmental regulation, The Journal of Legal Studies, Vol. 37, pp. 535-550.
30
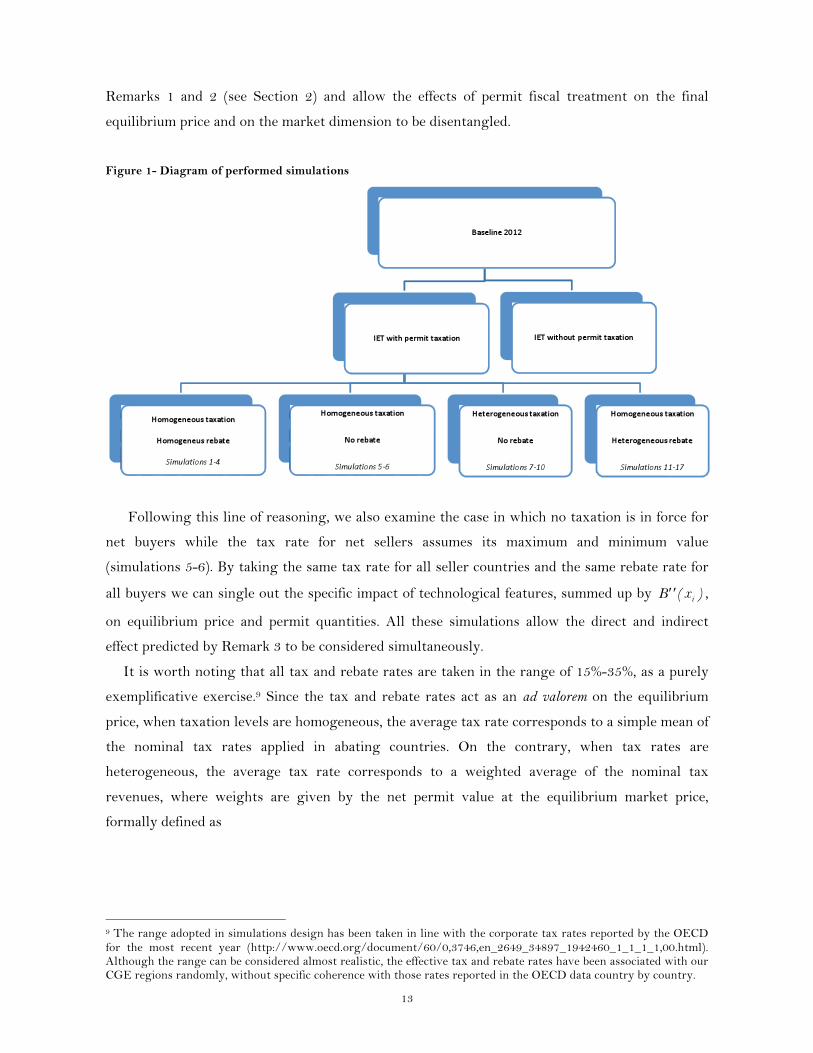
Appendix 1 – Linking theoretical model with CGE: a graphical analysis
In this appendix, we provide a graphical intuition of how the permit market is affected by taxation
in the homogeneous taxation case in order to provide a useful link between theoretical formulation
and the implementation of fiscal treatment of emission permits into the CGE model here adopted.
We will focus on a two country/two representative firm economy and assume that marginal
abatement costs are homogenous among countries, corresponding to the case where
. In this case, the marginal abatement cost curve (bottom side of Figure A1) is
the same for the two countries that we label A and B (MACA,B). The two countries differ in their
abatement commitment that we assume is relatively higher for B (CB) than for A (CA). As a result,
in the absence of emissions trading, country A should introduce a carbon tax (CTaxA = PA) which
is smaller than the corresponding one in country B (CTaxB = PB); permit trade incentives would
therefore arise.
In a two country model, the permit quantity demanded by B is by construction equal to the
supply provided by A. Hence, the market is confined to the quantities associated with the PA-PB
price range in the bottom part of the graph. The equilibrium price (PE) corresponds to the point
on the MACA,B where country A decides to reduce emissions more than its target until the
domestic abatement costs of the two countries are equalized. In equilibrium, by definition, permits
sold by one country equal permits bought by the other. We can therefore represent the permit
market in a standard demand/supply graph, as in the top of Figure A1, where the exchanged
equilibrium quantity is 0QE= CARA,B= RA,BCB.
Suppose now that country A (the net seller) introduces a tax on permit revenue whereas no
rebate is allowed in country B. Country B stays on its previous MACA,B while country A’s MAC
shifts leftward to MAC’A (bottom of Figure A1), as the opportunity cost of emissions decreases
and the related marginal cost increases;14 this reduces the propensity to sell permits and therefore
implies a leftward shift in the supply curve (top of Figure A1). As a result, the equilibrium price
increases (P’E) and the exchanged quantity decreases (CAR’A=R’BCB= Q’E).
Let us now assume that a positive tax rate is present also in the net buying country, but the
corresponding tax rate is lower than that adopted in country A (tA). The new country B MAC
would be MAC’B resulting in a new demand curve (D’). As it clearly emerges from Figure A1, if a
positive tax rate also hits net buyers, the price increases more compared with a the case where
taxation only takes place in net selling country (P’’E) whereas the amount of permits exchanged is
14 Clearly MAC’A differs from MACA only when permits are sold, i.e. on the right of level CA in the bottom part of Figure A1.

31
closer to the no tax case (CAR’’A=R’’BCB= Q’’E). In an extreme case where tA=tB, MAC’B will
coincide with the new MAC’A.
Figure A1- Permit taxation with homogeneous abatement costs
This would result in a net equilibrium price increase of the same magnitude as the tax rate so
that the after tax price and the quantity exchanged in equilibrium would not change compared
with a no tax situation.
32
Appendix 2 – Regional and Sector aggregation in the GTAP-E
Table A1- Regional and Sector aggregation

33
Appendix 3 – Estimated MAC curves for different abatement levels
Figure A2 – MAC curves for small countries participating in IET calculated by GTAP-E
Figure A3 – MAC curves for large countries participating in IET calculated by GTAP-E