Taxing Wages 2019
20
ANNEX. METHODOLOGY AND LIMITATIONS │ 621 TAXING WAGES 2019 © OECD 2019 ANNEX. Methodology and limitations Methodology Introduction The personal circumstances of taxpayers vary greatly. This Report therefore adopts a specific methodology to produce comparative statistics covering taxes, benefits and labour costs across OECD member countries 1 . The framework of the methodology is as follows: The Report focuses on eight different household types which vary by composition and level of earnings. Each household contains a full-time adult employee working in one of a broad range of industry sectors of each OECD economy. Some of the households also have a spouse working less than full-time. The annual income from employment is assumed to be equal to a given fraction of the average gross wage earnings of these workers. Additional assumptions are also made regarding other relevant personal circumstances of these wage earners in order to calculate their tax/benefit position. The guidelines described in the following paragraphs form the basis for the calculations shown in Parts I and II. Annex Table 1 sets out the terminology that is used. Where a country has had to depart from the guidelines, this is noted in the text and/or in the country chapters contained in Part II of the Report. The number of taxpayers with the defined characteristics and the wage level of the average workers differ between OECD economies. Taxpayer characteristics The eight household types identified in the Report are set out in Annex Table 2. Any children in the household are assumed to be aged between six and eleven inclusive. The household is assumed to have no income source other than from employment and cash benefits. The range of industries covered The standard assumption for calculating average wage earnings is based on Sectors B-N of the International Standard Industrial Classification of All Economic Activities (ISIC Revision 4, United Nations) 2 (see Annex Table 3). Many countries (for more detailed country information, see Table 1.8) have now adopted this approach
-
Upload
khangminh22 -
Category
Documents
-
view
0 -
download
0
Transcript of Taxing Wages 2019

ANNEX. METHODOLOGY AND LIMITATIONS │ 621
TAXING WAGES 2019 © OECD 2019
ANNEX. Methodology and limitations
Methodology
Introduction
The personal circumstances of taxpayers vary greatly. This Report therefore adopts a
specific methodology to produce comparative statistics covering taxes, benefits and
labour costs across OECD member countries1. The framework of the methodology is as
follows:
The Report focuses on eight different household types which vary by composition
and level of earnings.
Each household contains a full-time adult employee working in one of a broad
range of industry sectors of each OECD economy. Some of the households also
have a spouse working less than full-time.
The annual income from employment is assumed to be equal to a given fraction of
the average gross wage earnings of these workers.
Additional assumptions are also made regarding other relevant personal
circumstances of these wage earners in order to calculate their tax/benefit
position.
The guidelines described in the following paragraphs form the basis for the calculations
shown in Parts I and II. Annex Table 1 sets out the terminology that is used. Where a
country has had to depart from the guidelines, this is noted in the text and/or in the
country chapters contained in Part II of the Report. The number of taxpayers with the
defined characteristics and the wage level of the average workers differ between OECD
economies.
Taxpayer characteristics
The eight household types identified in the Report are set out in Annex Table 2. Any
children in the household are assumed to be aged between six and eleven inclusive.
The household is assumed to have no income source other than from employment and
cash benefits.
The range of industries covered
The standard assumption for calculating average wage earnings is based on Sectors B-N
of the International Standard Industrial Classification of All Economic Activities (ISIC
Revision 4, United Nations)2 (see Annex Table 3). Many countries (for more detailed
country information, see Table 1.8) have now adopted this approach

622 │ ANNEX. METHODOLOGY AND LIMITATIONS
TAXING WAGES 2019 © OECD 2019
Annex Table 1. Terminology
General terms
Average worker (AW) An adult full-time worker in the industry sectors covered whose wage earnings represent the average for workers.
Single persons Unmarried men and women.
Couple with two children Married couple with two dependent children between six to eleven years of age inclusive.
Labour costs h u of gro w g rn ng ploy r ’ oc l cur y con r bu on n p yroll taxes.
Net take-home pay Gross wage earnings less the sum of personal income tax and employee social security contributions plus cash transfers received from general government.
Personal average tax rate ( tax burden)
The sum of personal income tax and employee social security contributions expressed as a percentage of gross wage earnings.
Tax wedge The sum of personal income tax, employee and employer social security contributions plus any payroll tax less cash transfers expressed as a percentage of labour costs.
Elasticity of income after tax P rc n g ch ng n ‘ f r- x’ nco follow ng n ncr n on curr ncy un of income before tax (defined more precisely as one minus a marginal tax rate divided by one minus a corresponding average tax rate).
Terms used under the income tax
Tax reliefs A generic term to cover all the means of giving favourable income tax treatment to potential taxpayers.
Tax allowances Amounts deducted from gross earnings to arrive at taxable income.
Tax credits Amounts which a taxpayer may subtract from his tax liability. They are described as p y bl f h y c n xc x l b l y ( o h r ‘r fun bl ’ n ‘non-w bl ’ r u ).
Standard tax reliefs Reliefs unrelated to the actual expenses incurred by taxpayers and automatically available to all taxpayers who satisfy the eligibility rules specified in the legislation are counted as standard reliefs. These also include deductions for compulsory social security contributions.
Basic relief Any standard tax relief available irrespective of marital or family status.
Marriage allowance Additional tax relief given to married couples. (In some countries, this is not distinguished from the basic relief which may be doubled on marriage).
Non-standard tax reliefs Reliefs wholly determined by reference to actual expenses incurred.
Average rate of income tax Amount of income tax payable after accounting for any reliefs calculated on the basis of the tax provisions covered in this Report, divided by gross wage earnings.
Schedule rate The rate which appears in the schedule of the income tax and in the schedule of social security contributions.
Terms used under cash transfers
Cash transfers Cash payments made by general government (agencies) paid to families usually in respect of dependent children.
StatLink 2 http://dx.doi.org/10.1787/888933925614
Annex Table 2. Characteristics of taxpayers
Marital status Children Principal earner Secondary earner
Single individual No children 67% of average earnings
Single individual No children 100% of average earnings
Single individual No children 167% of average earnings
Single individual 2 children 67% of average earnings
Married couple 2 children 100% of average earnings
Married couple 2 children 100% of average earnings 33% of average earnings
Married couple 2 children 100% of average earnings 67% of average earnings
Married couple No children 100% of average earnings 33% of average earnings
StatLink 2 http://dx.doi.org/10.1787/888933925633

ANNEX. METHODOLOGY AND LIMITATIONS │ 623
TAXING WAGES 2019 © OECD 2019
Annex Table 3. International Standard Industrial Classification of All Economic Activities
Revision 3.1 (ISIC Rev. 3.1)
A Agriculture, hunting and forestry
B Fishing
C Mining and quarrying
D Manufacturing
E Electricity, gas and water supply
F Construction
G Wholesale and retail trade; repair of motor vehicles, motorcycles and personal and household goods
H Hotels and restaurants
I Transport, storage and communications
J Financial intermediation
K Real estate, renting and business activities
L Public administration and defence; compulsory social security
M Education
N Health and social work
O Other community, social and personal service activities
P Activities of private households as employers and undifferentiated production activities of private households
Q Extraterritorial organisations and bodies
Revision 4 (ISIC Rev.4)
A Agriculture, forestry and fishing
B Mining and quarrying
C Manufacturing
D Electricity, gas, steam and air conditioning supply
E Water supply; sewerage, waste management and remediation activities
F Construction
G Wholesale and retail trade; repair of motor vehicles and motorcycles
H Transportation and storage
I Accommodation and food service activities
J Information and communication
K Financial and insurance activities
L Real estate activities
M Professional, scientific and technical activities
N Administrative and support service activities
O Public administration and defence; compulsory social security
P Education
Q Human health and social work activities
R Arts, entertainment and recreation
S Other service activities
T Activities of households as employers; undifferentiated goods- and services-producing activities of households for own use
U Activities of extraterritorial organizations and bodies
StatLink 2 http://dx.doi.org/10.1787/888933925652
This approach broadly corresponds to the previous calculation based on sectors C-K incl.
defined in the International Standard Industrial Classification of All Economic Activities
(ISIC Revision 3.1, United Nations) which was adopted in the 2005 edition of Taxing
Wages. The reasons for moving to a broadened average wage definition were set out in
the Special Feature of Taxing Wages 2003-2004.

624 │ ANNEX. METHODOLOGY AND LIMITATIONS
TAXING WAGES 2019 © OECD 2019
Defining gross wage earnings
This section sets out the assumptions underlying the calculation of the average earnings
figures for ‘the average worker’. The gross wage earnings data have been established
using statistical data and the methodologies for calculating the earnings data in each
country are set out in Annex Table 4. Further information on the calculation of the
earnings figures is provided in the country chapters in Part II. The sources of the
statistical data for each country are set out in Annex Table 5.
The main assumptions are as follows:
The data relate to the average earnings in the relevant industry sectors for the
country as a whole.
The calculations are based on the earnings of a full-time adult worker (including
both manual and non-manual). They relate to the average earnings of all workers
in the industry sectors covered. No account is taken of variation between males
and females or due to age or region.
The worker is assumed to be full-time employed during the entire year without
breaks for sickness or unemployment. However, several countries are unable to
separate and exclude part-time workers from the earnings figures (see Annex
Table 4). Most of them report full-time equivalent wages in these cases. In four
countries (Chile, Ireland, Slovak Republic and Turkey), the wages of part-time
workers can be neither excluded nor converted into full-time equivalents because
of the ways in which the earnings samples are constructed. As a result, average
wages reported for these countries will be lower than an average of full-time
workers (for example, an OECD Secretariat analysis of available Eurostat
earnings data for selected European countries has shown that full-time employees’
earnings in 2014 were on average 12% higher than earnings of all employees and
4% higher than earnings of all employees expressed in full-time equivalent units).
Also, in most of the OECD countries where sickness payments are made by the
employer, either on behalf of the government or on behalf of private sickness
schemes, these amounts are included in the wage calculations. It is unlikely that
this has a marked impact on the results since employers usually make these
payments during a short period and the amounts usually correspond very closely
to normal hourly wages.
Two of the household types include a second earner at 33% of average earnings.
Such individuals are more likely to be working part-time rather than full-time (as
shown in the Special Feature of the 2005 edition). However, the Special Feature
also showed that the assumption of all employees working full-time does not
significantly affect the tax rates calculated in Taxing Wages, except in the case of
Belgium for married couples where the spouse is earning 33% of the average
wage level. This is because any special provisions made for part-time workers
tend to be either of minor importance or not applicable for the household types
currently presented in Taxing Wages.
The earnings calculation includes all cash remuneration paid to workers in the
industries covered taking into account average amounts of overtime, cash
supplements (e.g. Christmas bonuses, thirteenth month) and vacation payments
typically paid to workers in the covered industry sectors. However, not all
countries are able to include overtime pay, vacation payments and cash bonuses
according to the definition.

ANNEX. METHODOLOGY AND LIMITATIONS │ 625
TAXING WAGES 2019 © OECD 2019
The earnings figures include supervisory and/or management employees, though
some countries are not able to do this. In such countries, the reported averages are
lower than would otherwise be the case (for example, an OECD Secretariat
analysis of available Eurostat earnings data for selected European countries has
shown that excluding this type of workers can reduce average earnings by 10% to
18%).
Fringe benefits – which include, for example, provision of food, housing or
clothing by the employer either free of charge or at below market-price – are,
where possible, excluded from the calculation of average earnings. This could
affect comparability of tax wedges – as the reliance on fringe benefits may vary
between countries and over time. However, the lack of comparability is limited as
fringe benefits rarely account for more than 1-2% of labour costs and are
normally more common among high-income employees than in the income
ranges covered by Taxing Wages (33% to 167% of average earnings). Annex
Table 4 shows that some Member countries are not able to exclude fringe benefits
from the earnings figures reported and used in Taxing Wages. The decision to
exclude was been taken because:
‒ these types of benefits are difficult to evaluate in a consistent way (they may
be valued at the actual cost to the employer, their value to the employee or
their fair market value).
‒ in most countries, they are of minimal importance for workers at the average
wage level.
‒ the tax calculations would be significantly more complicated if the tax
treatment of fringe benefits were to be incorporated.
Employers’ contributions to private pension, family allowance or health and life
insurance schemes are excluded from the calculations, though the amounts
involved can be significant. In the United States, for example, these contributions
can account for more than 5% of the earnings of employees. The country chapters
in Part II indicate of the existence of schemes which may be relevant for an
average worker.
626 │ ANNEX. METHODOLOGY AND LIMITATIONS
TAXING WAGES 2019 © OECD 2019
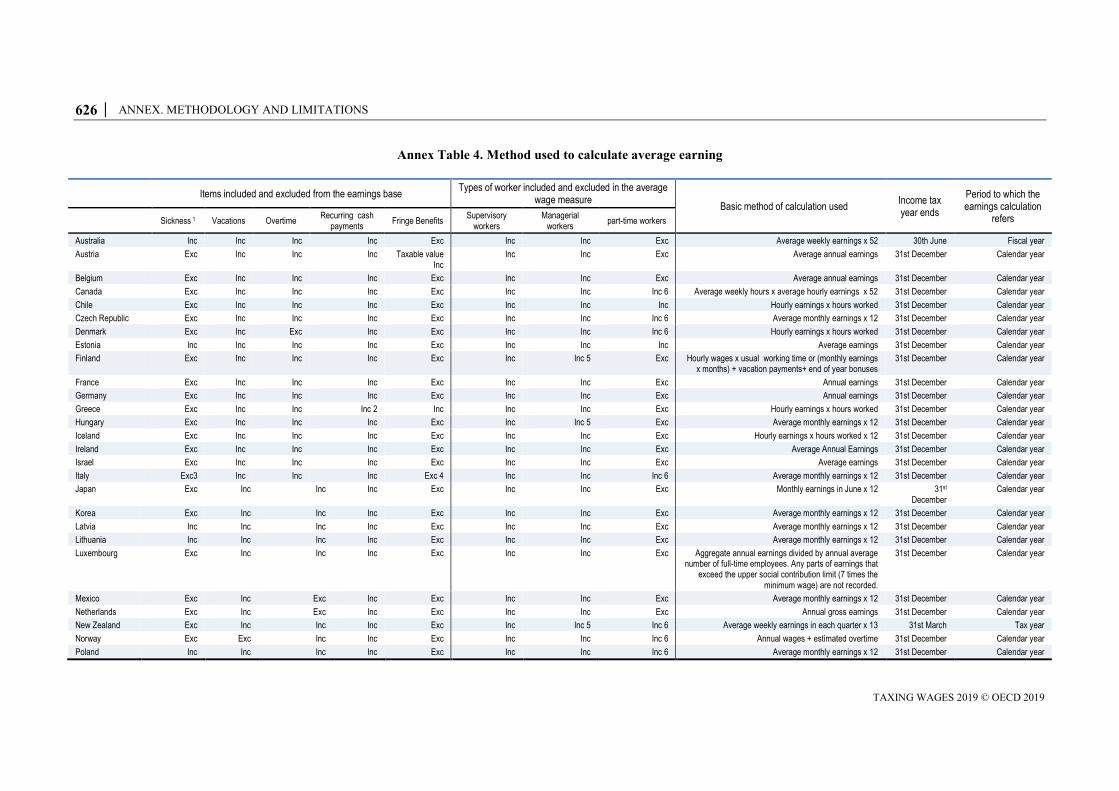
Annex Table 4. Method used to calculate average earning
Items included and excluded from the earnings base Types of worker included and excluded in the average
wage measure Basic method of calculation used
Income tax year ends
Period to which the earnings calculation
refers Sickness 1 Vacations Overtime Recurring cash
payments Fringe Benefits
Supervisory workers
Managerial workers
part-time workers
Australia Inc Inc Inc Inc Exc Inc Inc Exc Average weekly earnings x 52 30th June Fiscal year
Austria Exc Inc Inc Inc Taxable value Inc
Inc Inc Exc Average annual earnings 31st December Calendar year
Belgium Exc Inc Inc Inc Exc Inc Inc Exc Average annual earnings 31st December Calendar year
Canada Exc Inc Inc Inc Exc Inc Inc Inc 6 Average weekly hours x average hourly earnings x 52 31st December Calendar year
Chile Exc Inc Inc Inc Exc Inc Inc Inc Hourly earnings x hours worked 31st December Calendar year
Czech Republic Exc Inc Inc Inc Exc Inc Inc Inc 6 Average monthly earnings x 12 31st December Calendar year
Denmark Exc Inc Exc Inc Exc Inc Inc Inc 6 Hourly earnings x hours worked 31st December Calendar year
Estonia Inc Inc Inc Inc Exc Inc Inc Inc Average earnings 31st December Calendar year
Finland Exc Inc Inc Inc Exc Inc Inc 5 Exc Hourly wages x usual working time or (monthly earnings x months) + vacation payments+ end of year bonuses
31st December Calendar year
France Exc Inc Inc Inc Exc Inc Inc Exc Annual earnings 31st December Calendar year
Germany Exc Inc Inc Inc Exc Inc Inc Exc Annual earnings 31st December Calendar year
Greece Exc Inc Inc Inc 2 Inc Inc Inc Exc Hourly earnings x hours worked 31st December Calendar year
Hungary Exc Inc Inc Inc Exc Inc Inc 5 Exc Average monthly earnings x 12 31st December Calendar year
Iceland Exc Inc Inc Inc Exc Inc Inc Exc Hourly earnings x hours worked x 12 31st December Calendar year
Ireland Exc Inc Inc Inc Exc Inc Inc Exc Average Annual Earnings 31st December Calendar year
Israel Exc Inc Inc Inc Exc Inc Inc Exc Average earnings 31st December Calendar year
Italy Exc3 Inc Inc Inc Exc 4 Inc Inc Inc 6 Average monthly earnings x 12 31st December Calendar year
Japan Exc Inc Inc Inc Exc Inc Inc Exc Monthly earnings in June x 12 31st December
Calendar year
Korea Exc Inc Inc Inc Exc Inc Inc Exc Average monthly earnings x 12 31st December Calendar year
Latvia Inc Inc Inc Inc Exc Inc Inc Exc Average monthly earnings x 12 31st December Calendar year
Lithuania Inc Inc Inc Inc Exc Inc Inc Exc Average monthly earnings x 12 31st December Calendar year
Luxembourg Exc Inc Inc Inc Exc Inc Inc Exc Aggregate annual earnings divided by annual average number of full-time employees. Any parts of earnings that
exceed the upper social contribution limit (7 times the minimum wage) are not recorded.
31st December Calendar year
Mexico Exc Inc Exc Inc Exc Inc Inc Exc Average monthly earnings x 12 31st December Calendar year
Netherlands Exc Inc Exc Inc Exc Inc Inc Exc Annual gross earnings 31st December Calendar year
New Zealand Exc Inc Inc Inc Exc Inc Inc 5 Inc 6 Average weekly earnings in each quarter x 13 31st March Tax year
Norway Exc Exc Inc Inc Exc Inc Inc Inc 6 Annual wages + estimated overtime 31st December Calendar year
Poland Inc Inc Inc Inc Exc Inc Inc Inc 6 Average monthly earnings x 12 31st December Calendar year
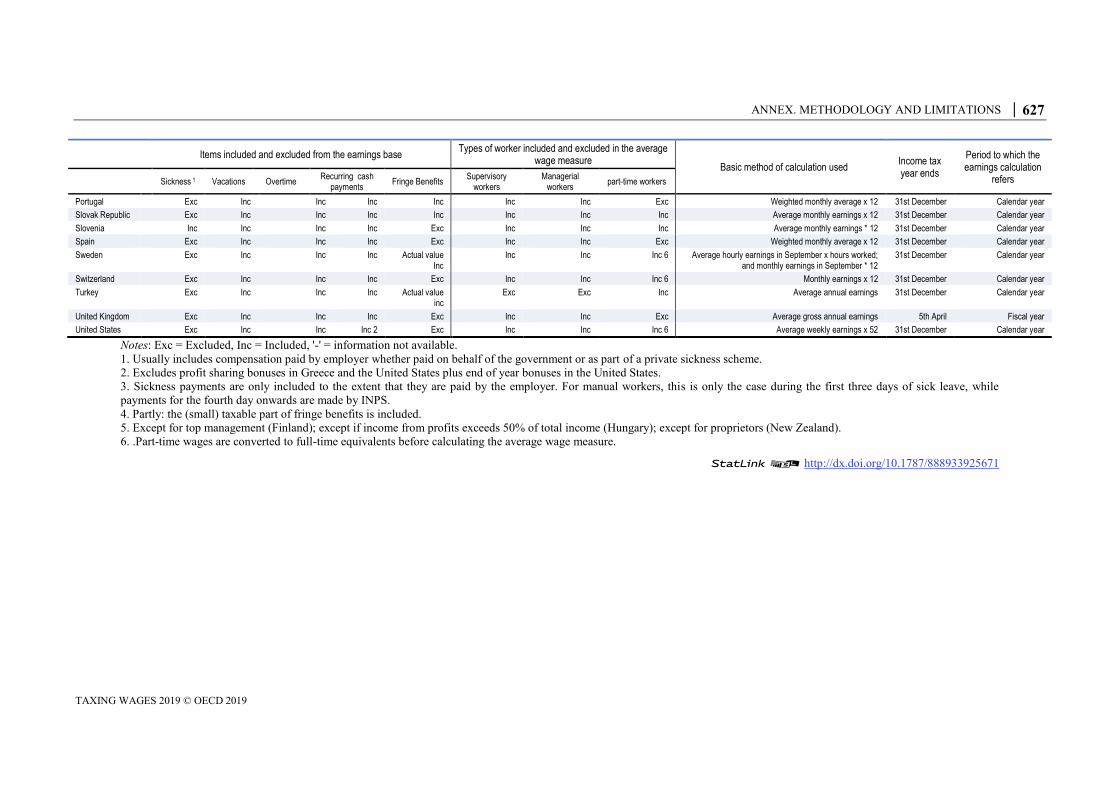
ANNEX. METHODOLOGY AND LIMITATIONS │ 627
TAXING WAGES 2019 © OECD 2019
Items included and excluded from the earnings base Types of worker included and excluded in the average
wage measure Basic method of calculation used
Income tax year ends
Period to which the earnings calculation
refers Sickness 1 Vacations Overtime Recurring cash
payments Fringe Benefits
Supervisory workers
Managerial workers
part-time workers
Portugal Exc Inc Inc Inc Inc Inc Inc Exc Weighted monthly average x 12 31st December Calendar year
Slovak Republic Exc Inc Inc Inc Inc Inc Inc Inc Average monthly earnings x 12 31st December Calendar year
Slovenia Inc Inc Inc Inc Exc Inc Inc Inc Average monthly earnings * 12 31st December Calendar year
Spain Exc Inc Inc Inc Exc Inc Inc Exc Weighted monthly average x 12 31st December Calendar year
Sweden Exc Inc Inc Inc Actual value Inc
Inc Inc Inc 6 Average hourly earnings in September x hours worked; and monthly earnings in September * 12
31st December Calendar year
Switzerland Exc Inc Inc Inc Exc Inc Inc Inc 6 Monthly earnings x 12 31st December Calendar year
Turkey Exc Inc Inc Inc Actual value inc
Exc Exc Inc Average annual earnings 31st December Calendar year
United Kingdom Exc Inc Inc Inc Exc Inc Inc Exc Average gross annual earnings 5th April Fiscal year
United States Exc Inc Inc Inc 2 Exc Inc Inc Inc 6 Average weekly earnings x 52 31st December Calendar year
Notes: Exc = Excluded, Inc = Included, '-' = information not available.
1. Usually includes compensation paid by employer whether paid on behalf of the government or as part of a private sickness scheme.
2. Excludes profit sharing bonuses in Greece and the United States plus end of year bonuses in the United States.
3. Sickness payments are only included to the extent that they are paid by the employer. For manual workers, this is only the case during the first three days of sick leave, while
payments for the fourth day onwards are made by INPS.
4. Partly: the (small) taxable part of fringe benefits is included.
5. Except for top management (Finland); except if income from profits exceeds 50% of total income (Hungary); except for proprietors (New Zealand).
6. .Part-time wages are converted to full-time equivalents before calculating the average wage measure.
StatLink 2 http://dx.doi.org/10.1787/888933925671

628 │ ANNEX. METHODOLOGY AND LIMITATIONS
TAXING WAGES 2019 © OECD 2019
Annex Table 5. Source of earnings data, 2018
Country Type of sample Source
Australia Quarterly survey of firms resulting in a representative sample of wage and salary earners in each industry.
u r l n Bur u of c “ v r g kly rn ng u r l ” n "L bour Forc u r l ".
Austria Annual Wage Tax Statistics. "Lohnsteuerstatistik".
Belgium Data collected or estimated on the basis of an annual establishment survey and social insurance registers of employees.
Statistics Division of the Ministry of Economy (Federal Public Service, Economy, SMEs, Self-employed and Energy). Same source as for Eurostat "Annual gross earnings" data.
Canada Monthly survey of all firms. c C n “ urv y of ploy n P yroll n Hour ”.
Chile Monthly sample of businesse with 10+ employees. National Statistics Institute of Chile (INE).
Czech Republic Employer survey data. National Statistical Office.
Denmark Danish Employers Confederation survey of earnings. Annual Report Danish Employers Confederation (Dansk Arbejds Giverforening).
Estonia - Statistics Estonia/Ministry of Finance.
Finland (1) Finnish Employers Federation survey of hourly and monthly earnings; (2) Survey for unorganized employers "Structure of Earnings Statistics" published by the Central Statistical Office.
“ g c ” publ h by h C n r l c l Off c .
France Social insurance registers covering all employers. INSEE, "Déclarations Annuelles des Données Sociales" (DADS).
Germany Survey carried out by the Federal Statistical Office. National Statistical Office.
Greece Survey carried out by National Statistics Service and Social Security Institutions.
National Statistical Service Labour Statistics. Same source as for Eurostat "Annual gross earnings" data.
Hungary Monthly surveys among enterprises with at least five employees.
Central Statistical Office.
Iceland Monthly survey of earnings in the private sector market.
Statistics Iceland.
Ireland Quarterly surveys of industrial employment, earnings and hours worked.
Central Statistics Office.
Israel - Central Bureau of Statistics.
Italy Quarterly indicators of wages in industry and services (OROS).
National Institute of Statistics.
Japan Basic survey on wage structure of all establishments with more than 10 employees.
Ministry of Health, Labour and Welfare, Annual Report.
Korea Labour Force Survey at Establishments. Ministry of Employment and Labour.
Latvia Average monthly wages and salaries (DSG01) The Latvian Central Statistical Bureau.
Lithuania - Statistics Lithuania.
Luxembourg Monthly aggregated files of Social security services. National Statistical Office and Social Security Services.
Mexico Administrative data from the Mexican Social Security Institute (Instituto Mexicano del Seguro Social (IMSS)).
The National Minimum Wage Commission (Comisión Nacional de Salarios Mínimos (CONASAMI)).
Netherlands Survey "Employment and Wages". Central Bureau of Statistics, Statline.
New Zealand The quarterly employment survey is a sample survey of significant business with an employment count of 1 or more.
Statistics New Zealand INFOS.
Norway Sample of enterprises based on published sector statistics for 3rd quarter – except agriculture, forestry and fishing and private households.
Statistics Norway Wage.
Portugal April and October survey of earnings carried out by the Ministry of Labour.
Ministry of Labour.
Poland Estimates for different sectors. Monthly Statistical Bulletin.
Slovak republic Quarterly and annual statistical data. Slovak Statistical Office.
Slovenia Monthly survey of employees. Statistical Office of the Republic of Slovenia.
Spain Quarterly survey of firms. In u o N c on l c “ ncu r r l Co L bor l” (L bour Co urv y).
Sweden September survey of Swedish employers. Statistics Sweden.
ANNEX. METHODOLOGY AND LIMITATIONS │ 629
TAXING WAGES 2019 © OECD 2019
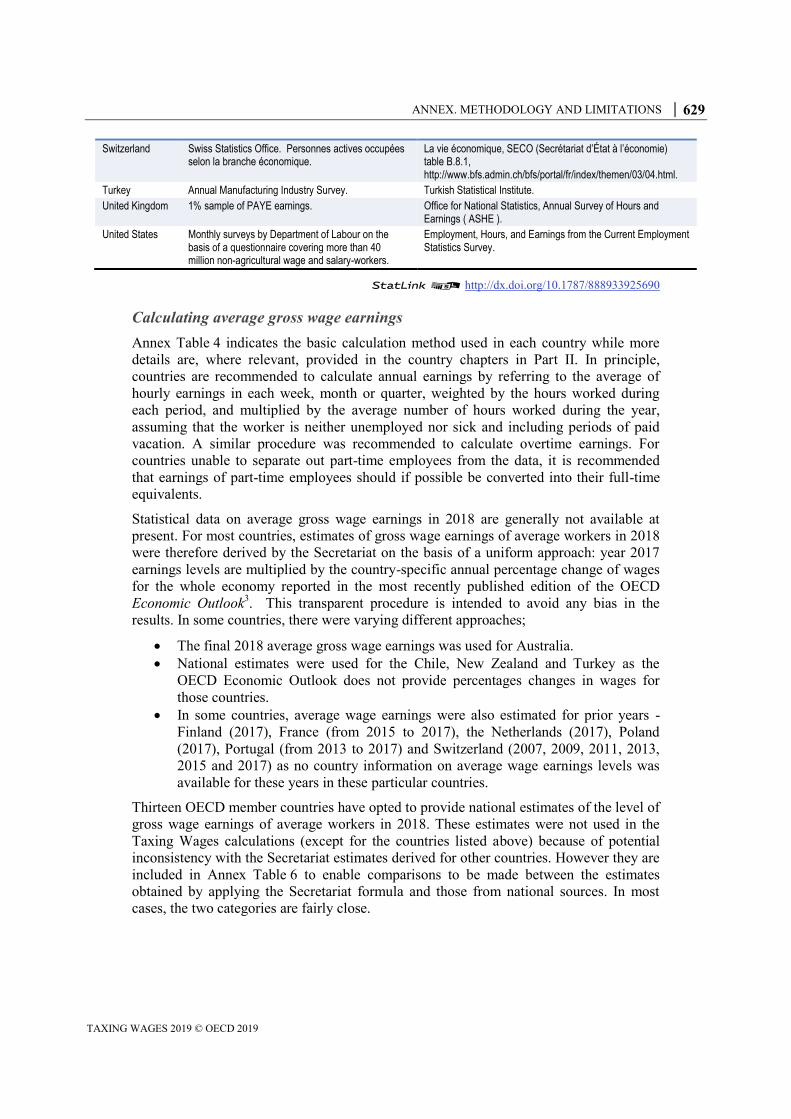
Switzerland Swiss Statistics Office. Personnes actives occupées selon la branche économique.
L v écono qu CO ( cré r ’É à l’écono ) table B.8.1, http://www.bfs.admin.ch/bfs/portal/fr/index/themen/03/04.html.
Turkey Annual Manufacturing Industry Survey. Turkish Statistical Institute.
United Kingdom 1% sample of PAYE earnings. Office for National Statistics, Annual Survey of Hours and Earnings ( ASHE ).
United States Monthly surveys by Department of Labour on the basis of a questionnaire covering more than 40 million non-agricultural wage and salary-workers.
Employment, Hours, and Earnings from the Current Employment Statistics Survey.
StatLink 2 http://dx.doi.org/10.1787/888933925690
Calculating average gross wage earnings
Annex Table 4 indicates the basic calculation method used in each country while more
details are, where relevant, provided in the country chapters in Part II. In principle,
countries are recommended to calculate annual earnings by referring to the average of
hourly earnings in each week, month or quarter, weighted by the hours worked during
each period, and multiplied by the average number of hours worked during the year,
assuming that the worker is neither unemployed nor sick and including periods of paid
vacation. A similar procedure was recommended to calculate overtime earnings. For
countries unable to separate out part-time employees from the data, it is recommended
that earnings of part-time employees should if possible be converted into their full-time
equivalents.
Statistical data on average gross wage earnings in 2018 are generally not available at
present. For most countries, estimates of gross wage earnings of average workers in 2018
were therefore derived by the Secretariat on the basis of a uniform approach: year 2017
earnings levels are multiplied by the country-specific annual percentage change of wages
for the whole economy reported in the most recently published edition of the OECD
Economic Outlook3. This transparent procedure is intended to avoid any bias in the
results. In some countries, there were varying different approaches;
The final 2018 average gross wage earnings was used for Australia.
National estimates were used for the Chile, New Zealand and Turkey as the
OECD Economic Outlook does not provide percentages changes in wages for
those countries.
In some countries, average wage earnings were also estimated for prior years -
Finland (2017), France (from 2015 to 2017), the Netherlands (2017), Poland
(2017), Portugal (from 2013 to 2017) and Switzerland (2007, 2009, 2011, 2013,
2015 and 2017) as no country information on average wage earnings levels was
available for these years in these particular countries.
Thirteen OECD member countries have opted to provide national estimates of the level of
gross wage earnings of average workers in 2018. These estimates were not used in the
Taxing Wages calculations (except for the countries listed above) because of potential
inconsistency with the Secretariat estimates derived for other countries. However they are
included in Annex Table 6 to enable comparisons to be made between the estimates
obtained by applying the Secretariat formula and those from national sources. In most
cases, the two categories are fairly close.

630 │ ANNEX. METHODOLOGY AND LIMITATIONS
TAXING WAGES 2019 © OECD 2019
Annex Table 6. Estimated gross wage earnings, 2017-2018 (in national currency)
Average wage
2017 Average wage 2018 (Secret. estimates)
Average wage 2018 (country estimates)
EO 2018 (issue 2) forecasted rates for 20181
Australia2 83 336 84 533 85 778 1.4
Austria 46 002 47 120 47 152 2.4
Belgium 47 527 48 455 2.0
Canada 51 626 53 350 3.3
Chile2 9 348 496 9 669 058
Czech Republic
355 633 383 304 371 636 7.8
Denmark 412 045 421 547 422 346 2.3
Estonia 14 992 16 103 16 044 7.4
Finland 43 245 43 984 1.7
France 38 600 39 436 2.2
Germany 49 100 50 546 2.9
Greece 20 841 21 214 1.8
Hungary 3 730 608 4 138 492 10.9
Iceland 8 760 000 9 152 462 4.5
Ireland 45 500 46 774 2.8
Israel 147 912 153 221 152 124 3.6
Italy 30 755 31 292 1.7
Japan 5 145 307 5 188 742 0.8
Korea 45 853 704 48 166 599 48 723 012 5.0
Latvia 10 980 11 881 11 856 8.2
Lithuania 10 216 11 121 10 890 8.9
Luxembourg 58 238 59 497 2.2
Mexico 116 276 122 208 123 018 5.1
Netherlands 50 730 51 567 1.6
New Zealand2 58 824 60 360
Norway 578 745 596 477 3.1
Poland 50 573 54 191 7.2
Portugal 17 998 18 343 1.9
Slovak Republic
11 419 12 131 6.2
Slovenia 18 839 19 671 19 230 4.4
Spain 26 550 26 923 1.4
Sweden 435 821 453 539 4.1
Switzerland 89 599 90 908 1.5
Turkey2 41 843 46 921
United Kingdom
38 575 39 328 2.0
United States 53 376 54 951 3.0
1. Increase of compensation per employee in the total economy (Economic Outlook No 102).
2. The country AW estimate is used instead of the OECD Secretariat's AW estimate in the Taxing Wages calculations.
StatLink 2 http://dx.doi.org/10.1787/888933925709
Annex Table 7 indicates the exchange rates and purchasing power parities of national
currencies for 2018 that are used to calculate comparative earnings figures across
countries in the report.

ANNEX. METHODOLOGY AND LIMITATIONS │ 631
TAXING WAGES 2019 © OECD 2019
Annex Table 7. Purchasing power parities and exchange rates for 2018
Monetary unit Exchange rates1 Purchasing power parities
Australia AUD 1.34 1.43
Austria EUR 0.85 0.78
Belgium EUR 0.85 0.78
Canada CAD 1.30 1.25
Chile CLP 641.90 403.86
Czech Republic CZK 21.73 12.48
Denmark DKK 6.31 6.82
Estonia EUR 0.85 0.54
Finland EUR 0.85 0.87
France EUR 0.85 0.77
Germany EUR 0.85 0.75
Greece EUR 0.85 0.58
Hungary HUF 270.22 139.03
Iceland ISK 108.27 137.62
Ireland EUR 0.85 0.78
Israel ILS 3.60 3.66
Italy EUR 0.85 0.69
Japan JPY 110.44 100.07
Korea KRW 1100.19 852.69
Latvia EUR 0.85 0.50
Lithuania EUR 0.85 0.45
Luxembourg EUR 0.85 0.87
Mexico MXN 19.18 9.34
Netherlands EUR 0.85 0.79
New Zealand NZD 1.45 1.45
Norway NOK 8.13 10.43
Poland PLN 3.61 1.72
Portugal EUR 0.85 0.58
Slovak Republic EUR 0.85 0.48
Slovenia EUR 0.85 0.57
Spain EUR 0.85 0.63
Sweden SEK 8.69 8.85
Switzerland CHF 0.98 1.17
Turkey TRL 4.84 1.56
United Kingdom GBP 0.75 0.69
United States USD 1.00 1.00
1. Average of 12 months daily rates.
StatLink 2 http://dx.doi.org/10.1787/888933925728
Coverage of taxes and benefits
The Report is concerned with personal income tax and employee and employer social
security contributions payable on wage earnings. In addition, payroll taxes (see section on
Payroll taxes) are included in the calculation of the total wedge between labour costs to
the employer and the corresponding net take-home pay of the employee.
The calculation of the after-tax income includes family benefits paid by general
government as cash transfers (see section on Family cash benefits from general
government). Income tax due on capital income and non-wage labour income, several
direct taxes (net wealth tax, corporate income tax) and all indirect taxes are not

632 │ ANNEX. METHODOLOGY AND LIMITATIONS
TAXING WAGES 2019 © OECD 2019
considered in this Report. However, all central, state and local government income taxes
are included in the data.
In this Report, compulsory social security contributions paid to general government are
treated as tax revenues. Being compulsory payments to general government they clearly
resemble taxes. They may, however, differ from taxes in that the receipt of social security
benefits depends upon appropriate contributions having been made, although the size of
the benefits is not necessarily related to the amount of the contributions. Countries
finance compulsory public social security programmes to a varying degree from general
tax and non-tax revenue and earmarked contributions, respectively. Better comparability
between countries is obtained by treating social security contributions as taxes, but they
are listed under a separate heading so that their amounts can be identified in any analysis.
Calculation of personal income taxes
The method by which income tax payments are calculated is described in the country
chapters in Part II. First, the tax allowances applicable to a taxpayer with the
characteristics and income level related to gross annual wage earnings of an average
worker are determined. Next, the schedule of tax rates is applied and the resulting tax
liability is reduced by any relevant tax credits. An important issue arising in the
calculation of the personal income tax liability involves determining which tax reliefs
should be taken into account. Two broad categories of reliefs may be distinguished:
Standard tax reliefs: reliefs which are unrelated to actual expenditures incurred by
the taxpayer and are automatically available to all taxpayers who satisfy the
eligibility rules specified in the legislation. Standard tax reliefs are usually fixed
amounts or fixed percentages of income and are typically the most important set
of reliefs in the determination of the income tax paid by workers. These reliefs are
taken into account in the calculations – they include:
‒ The basic relief which is fixed and is available to all taxpayers or all wage
earners, irrespective of their marital or family status;
‒ The standard relief which is available to taxpayers depending on their marital
status;
‒ The standard child relief granted to a family with two children between the
ages of six to eleven inclusive;
‒ The standard relief in respect of work expenses, which is usually a fixed
amount or fixed percentage of (gross) wage earnings; and,
‒ Tax reliefs allowed for social security contributions and other (sub-central
government) income taxes are also considered as standard reliefs since they
apply to all wage earners and relate to compulsory payments to general
government.4
Non-standard tax reliefs: These are reliefs which are wholly determined by
reference to actual expenses incurred. They are therefore neither fixed amounts
nor fixed percentages of income. Examples of non-standard tax reliefs include
reliefs for interest on qualifying loans (e.g. for the purchase of a house), private
insurance premiums, contributions to private pension schemes, and charitable
donations. These are not taken into account in calculating the tax position of
employees.
Standard reliefs are separately identified and their impact on average tax rates is
calculated in the results tables shown in the Country chapters. The latter include a brief
description of the main non-standard reliefs in most cases.

ANNEX. METHODOLOGY AND LIMITATIONS │ 633
TAXING WAGES 2019 © OECD 2019
State and local income taxes
Personal income taxes levied by sub-central levels of government – state, provincial,
cantonal or local – are included in the scope of this study. State income taxes exist in
Canada, Switzerland and the United States. Since 1997, Spain has an income tax for the
Autonomous Regions. Local income taxes are imposed in Belgium, Denmark, Finland,
Iceland, Italy, Japan, Korea, Norway, Sweden, Switzerland and the United States. In
Belgium, Canada (other than Quebec), Denmark, Iceland, Italy, Korea, Norway and Spain
they are calculated as a percentage of taxable income or of the tax paid to central
government. In Finland, Japan, Sweden and Switzerland, local government provides
different tax reliefs from central government. In the United States, the sub-central levels
of government operate a separate system of income taxation under which they have
discretion over both the tax base and tax rates. Except for Canada, Spain and Switzerland,
the rate schedule of these sub-central taxes consists of a single rate.
When tax rates and/or the tax base of sub-central government income taxes vary within a
country, it is sometimes assumed that the average worker lives in a typical area and the
income taxes (and benefits) applicable in this area are presented. This is the procedure
followed in Canada, Italy, Switzerland and the United States where the tax base and tax
rates vary very widely throughout the country. Belgium, Denmark, Finland, Iceland and
Sweden have preferred to select the average rate of sub-central government income taxes
for the country as a whole. The local rates do not vary in practice in Korea and Norway.
Japan and Spain have used the widely prevalent standard schedule.
Social security contributions
Compulsory social security contributions paid by employees and employers to general
government or to social security funds under the effective control of government are
included in the coverage of this Report. In most countries, contributions are levied on
gross earnings and earmarked to provide social security benefits. In Finland, Iceland and
the Netherlands, some contributions are levied as a function of taxable income (i.e. gross
wage earnings after most/all tax reliefs). Australia, Denmark and New Zealand do not
levy social security contributions.
Contributions to social security schemes outside the general government sector are not
included in the calculations. However, information on “non-tax compulsory payments” as
well as “compulsory payment indicators” is included in the OECD Tax Database, which
is accessible at www.oecd.org/ctp/tax-database.htm
Payroll taxes
Payroll taxes have a tax base that is either a proportion of the payroll or a fixed amount
per employee. In the OECD Revenue Statistics, payroll taxes are reported under heading
3000. Fifteen OECD countries report revenue from payroll taxes: Australia, Austria,
Canada, Denmark, France, Hungary, Iceland, Ireland, Israel, Korea, Latvia, Lithuania,
Mexico, Poland, Slovenia and Sweden.
Payroll taxes are included in total tax wedges reported in this publication, given that they
increase the gap between gross labour costs and net take-home pay in the same way as
income tax and social security contributions do. The main difference with the latter is that
the payment of payroll taxes does not confer an entitlement to social security benefits.
Also, the tax base of payroll taxes may differ from the tax base of employer social
security contributions. For example, certain fringe benefits may only be liable to payroll

634 │ ANNEX. METHODOLOGY AND LIMITATIONS
TAXING WAGES 2019 © OECD 2019
tax. Because this Report presents the standard case, the payroll tax base can be –
depending on the relevant legislation – gross wage (excluding fringe benefits and other
items of compensation that vary per employee), gross wage plus employer social security
contributions, or a fixed amount per employee.
Six of the OECD member countries include payroll taxes in the Taxing Wages
calculations: Australia, Austria, Hungary, Latvia, Lithuania and Sweden. The other
countries reporting payroll tax revenue in Revenue Statistics have not included these
taxes in the calculations for the present Report for a variety of reasons.
Family cash benefits from general government
Tax reliefs and family cash transfers universally paid in respect of dependent children
between the ages of six to eleven inclusive who are attending school are included in the
scope of the study. If tax reliefs or cash transfers vary within this age range, the most
generous provisions are adopted, except that the case of twins is explicitly disregarded.
The implications of this are illustrated below - suppose the child benefit programme of a
country is structured as follows:
Age group Benefits per child
Children 6-8 100 units
Children 9-10 120 units
Children 11-14 150 units
The most favourable outcome arises in the case of 11-year old twins: 300 units. However,
as the case of twins is excluded, the best outcome (given that children are between 6 and
11) now becomes 270 units (one child 11 years old, one child 9 or 10 years old). This
amount would be included in the country table. Often, the amount in benefits is raised as
children grow older. The calculations assume that the children have been born on 1
January so the annual amount received in child benefits may be calculated from the
benefit schedule that is in place at the start of the year with any revisions to these amounts
during the year being taken into account.
Relevant cash payments are those received from general government. In some cases, the
cash benefits include amounts that are paid without consideration to the number of
children.
Payable tax credits
Payable (non-wastable) tax credits are tax credits that can exceed tax liability, where the
excess, if any, can be paid as a cash transfer to the taxpayer. In principle, these credits can
be treated in different ways according to whether they are regarded as tax provisions or
cash transfers or a combination of these. The Special Feature in the 2016 edition of
Revenue Statistics discusses these alternative treatments and the conceptual and practical
difficulties that arise in deciding which is the most appropriate approach for the purpose
of reporting internationally comparable tax revenue figures. It also provides figures which
show the impact of different treatments on tax to GDP ratios.5
Based on this review, the Interpretative Guide of the Revenue Statistics requires that
only the portion of a payable tax credit that is claimed to reduce or eliminate a
taxpayer’s liability (the ‘tax expenditure’ component)6 should be deducted in the
reporting of tax revenues;

ANNEX. METHODOLOGY AND LIMITATIONS │ 635
TAXING WAGES 2019 © OECD 2019
the part of the tax credit that exceeds a taxpayer’s tax liability and is paid to the
taxpayer (the ‘cash transfer’ component) should be treated as an expenditure item
and not deducted in the reporting of tax revenues.
However, additional information is provided in Revenue Statistics on aggregate tax
expenditure components and aggregate transfer components of payable tax credits to
show the effect of alternative treatments.7
In Taxing Wages, the situation is different as the full amount of the payable tax credit is
taken into account in the income tax calculation.
Strict consistency with the Revenue Statistics would require that only the tax expenditure
component be offset against derived income tax, with the excess (if any) treated as a cash
transfer. However, this approach would diminish rather than strengthen the informational
content of the derived results in Taxing Wages. In particular, limiting tax credit claims to
tax expenditure amounts would yield a zero income tax liability and zero average income
tax rate where cash refunds are provided. Where tax credits claims are not constrained in
this way, negative income tax liabilities and negative average income tax rates would
result where cash transfers are provided. Arguably, these negative amounts more clearly
convey the taxpayer’s position (which is improved relative to the no-tax situation). Also,
not including the cash transfer portion of payable tax credits in the ‘cash transfers from
general government’ item of the country tables permits greater transparency of the latter
which focuses on ‘pure’ cash transfers only.
However, in order to improve the informational content of country tables as regards
payable tax credits, the memorandum item reporting at the bottom of the relevant country
tables shows tax expenditure amounts on one line, with a second line showing cash
transfer amounts. Where more than one payable tax credit program applies, the figures
represent aggregates covering all the programs. Total program costs in each of the
household cases considered can be derived by adding the tax expenditure and cash
transfer amounts.
The calculation of marginal tax rates
In all except one case, the marginal tax rates are calculated by considering the impact of a
small increase in gross earnings on personal income tax, social security contributions and
cash benefits. The exception is the case of a non-working spouse where the move from
zero to a small positive income is unrepresentative of income changes and therefore of
little interest. So, for this case, the marginal rates for the spouse are calculated by
considering the impact of an income increase from zero to 33% of the average wage.
Limitations
General limitations
The simple approach of comparing the tax/benefit position for eight model families
avoids many of the conceptual and definitional problems involved in more complex
international comparisons of tax burdens and transfer programmes. However, a drawback
of this methodology is that the earnings of an average worker will usually occupy a
different position in the overall income distribution in different economies, although the
earnings relate to workers in similar jobs in various OECD Member countries.
Because of the limitations on the taxes and benefits covered in the Report, the data cannot
be taken as an indication of the overall impact of the government sector on the welfare of

636 │ ANNEX. METHODOLOGY AND LIMITATIONS
TAXING WAGES 2019 © OECD 2019
taxpayers and their families. Complete coverage would require studies of the impact of
indirect taxes, the treatment of non-wage labour income and other income components
under personal income taxes and the effect of other tax allowances and cash benefits. It
would also require that consideration be given to the effect on welfare of services
provided by the state, either free or below cost, and the incidence of corporate and other
direct taxes on earnings and prices. Such a broad coverage is not possible in an
international comparison of all OECD countries. The differences between the results
shown here and those of a full study of the overall impact on employees of government
interventions in the economy would vary from one country to another. They would
depend on the relative shares of different kinds of taxes in government revenues and on
the scope and nature of government social expenditures.
The Report shows only the formal incidence of taxes on employees and employers. The
final, economic incidence of taxes may be quite different, because the tax burden may be
shifted from employers onto employees and vice versa by market adjustments to gross
wages.
The income left at the disposal of a taxpayer may represent different standards of living in
various countries because the range of goods and services on which the income is spent
and their relative prices differ as between countries. In those countries where the general
government sector provides a wide range of goods and services (generous basic old age
pension, free health services, public housing, university education, etcetera), the taxpayer
may be left with less cash income but may enjoy the same living standards as a taxpayer
receiving a higher cash income but living in a country where there are fewer publicly
provided goods and services.
Some specific limitations on the income tax calculation
The exclusion of non-wage income and the limited number of tax reliefs covered mean
that the average rates of income tax in the tables in this publication do not necessarily
reflect the actual rates confronting taxpayers at these levels of earnings. Actual rates may
be lower than the calculated rates because the latter do not take into account non-standard
expense-related reliefs. On the other hand, actual rates may be higher than calculated
rates because the latter do not take into account tax on non-wage income received by
employees.
The decision not to calculate separately average rates of income tax taking into account
the effect of non-standard tax reliefs was taken because:
In many cases, expense-related reliefs are substitutes for direct cash subsidies. To
take into account these reliefs while ignoring any corresponding direct subsidies
would distort comparisons of take-home pay plus cash transfers;
The special tax treatment of certain expenses may be linked to special treatment
of any income associated with these expenses (e.g. the tax treatment of social
security contributions and pension income) which is beyond the scope of this
study;
A few countries were unable to estimate the value of these reliefs and even those
countries which could do so could not limit their estimates to taxpayers with the
characteristics assumed in the above part on methodology; and,
Not all countries could calculate separately the reliefs available to different
household types. Where a split is provided between single individuals and
ANNEX. METHODOLOGY AND LIMITATIONS │ 637
TAXING WAGES 2019 © OECD 2019
families with children, there are large differences in the value of the reliefs
typically received by these two categories of households.
Limitations to time-series comparisons
The calculations of the tax burden on labour income in OECD countries reported in the
2004 and previous editions of Taxing Wages, are based on an average earnings measure
for manual full-time workers in the manufacturing sector (the ‘average production
worker’).
Any analysis of the results over time has to take into account the fact that the earnings
data do not necessarily relate to the same taxpayer throughout the period. The average
earnings are calculated for each year. As such, the results do not reflect the changing
earnings and tax position of particular individuals over time but rather to the position of
workers earning a wage equal to average earnings in the covered industry sectors in each
particular year. This, in turn, may mean that the earnings levels referred to may be at
different points in the income distribution over the period covered and changes in tax
rates may be influenced by these trends.
There have been changing definitions of the average worker over time. From the 2005
edition, Taxing Wages has reported tax calculations under a broadened average worker
definition that includes all full-time employees covering industry sectors C-K (reference
to ISIC Rev.3.1). The implications of adopting this new definition for time-series
comparisons are discussed in the 2005 edition of Taxing Wages. As of the 2010 edition of
the Taxing Wages Report, many countries have started reporting average wage earnings
for full-time employees covering industry sectors B-N of the ISIC Rev.4 industry
classification (which broadly corresponds to sectors C-K in ISIC Rev.3.1).
A Note on the Tax Equations
Each country chapter contains a section describing in a standard format the equations
under-pinning the calculations required to derive the amounts of income tax, social
security contributions and cash transfers. These algorithms represent in algebraic form the
legal provisions described in the chapter and are consistent with the figures shown in the
country and comparative tables. This section describes the conventions used in the
definition of the equations and how they could be used by those wishing to implement the
equations for their own research.
The earlier sections of the country chapters describe how the tax and other systems work
and present the values of the parameters of those systems such as the levels of allowances
and credits, and the schedule of tax rates.
In the first part of the equations section is a table showing a brief description of each
parameter (such as “Basic tax credit”), the name of the parameter as used in the algebraic
equation (“Basic_cred”) and the actual value for the relevant year (such as “1098”).
Where there is a table of values – for example a schedule of tax rates and the associated
thresholds of taxable income – a name is given to the entire table (for example
“tax_sch”). These variable names are those used in the equations.
After each table of parameters is the table of equations. The four columns contain
information as follows:
The first two columns give a description and a variable name for the result of the
equation on that row of the table. These always include the thirteen main financial

638 │ ANNEX. METHODOLOGY AND LIMITATIONS
TAXING WAGES 2019 © OECD 2019
value entries in the country tables. Additional rows define any intermediate values
which are calculated either to show the detail included in the tables (such as the
subdivision of total tax allowances into the different categories) or values which
make the calculation clearer.
The third column shows the range of the calculation in that row. This is necessary
to allow for the different way that tax may be calculated for married couples. The
options are:
‒ B The calculation is carried out separately for both the principal earner and
the spouse using their individual levels of earnings. This applies in the case of
independent income tax and usually also in respect of social security
contributions.
‒ P The calculation applies for the principal earner only. An example is where
the principal earner can use any of the basic tax allowance of the spouse
which cannot be set against the income of the spouse.
‒ S The calculation applies for the lower earning spouse only.
‒ J The calculation is carried out only once on the basis of joint income. This
applies to systems of joint or household taxation and is also usual for the
calculation of cash transfers in respect of children.
The final column contains the equation itself. The equation may refer to the
variables in the parameters table and to variables which result from one of the
rows of the equations table itself. Use is also made of the two standard variables
“Married”, which have the value 1 if the household consists of a married couple
and 0 in the case of a single individual, and “Children” which denotes the number
of children. Sometimes there is a reference to a variable with the affix “_total”
which indicates the sum of the relevant variable values for the principal earner
and the spouse. Similarly, the affixes “_princ” and “_spouse” indicate the value
for the principal earner and spouse, respectively.
In the equations a number of functions are used. Some of these are used in the same way
as in a number of widely available ‘spreadsheet’ computer packages. For example,
MAX(X,Y) and MIN(X,Y) find the maximum and minimum of the two values,
respectively. IF(condition X,Y) chooses the expression X if the condition is true and the
expression Y if it is false. Boolean expressions are also used and are taken to have the
value 1 if true and 0 if false. As an example, (Children=2*CB_2 is equivalent to
IF(Children=2, CB_2,0).
There are also three special functions commonly used which denote calculations often
required in tax and social security systems. These are:
Tax (taxinc, tax_sch): This calculates the result of applying the schedule of tax
rates and thresholds in “tax_sch” to the value of taxable income represented by
“taxinc”. This function may be used in any part of the equations, not just in the
income tax calculation. For some countries it is used for social security
contributions or even for allowance levels which may be income dependent.
Positive (X): This gives the result X when this value is positive and zero
otherwise. It is therefore equivalent to MAX(0,X).
Taper (value, income, threshold, rate): This gives the amount represented by
“value” if “income” is less than “threshold”. Otherwise, it gives “value” reduced
by “rate” multiplied by (income- threshold), unless this produces a negative result
in which case zero is returned. This provides the calculation which is sometimes
required when a tax credit, for example, is available in full provided that total
ANNEX. METHODOLOGY AND LIMITATIONS │ 639
TAXING WAGES 2019 © OECD 2019
income is below a threshold but is then withdrawn at a given rate for each
currency unit in excess of the threshold until it is withdrawn completely.
In some circumstances, there are country specific special functions. These functions
involve programming that is designed to simplify the tax calculations. The programming
underlying these functions is based on the description of the particular measure given in
the relevant country chapter found in Part II. For example, the Earned Income Credit in
the United States is calculated using the function called EIC.
Anyone wishing to make their own implementation of the equations will have to write
functions corresponding to these special functions or make appropriate modifications to
any equations that use them.
Notes
1 The statistical data for Israel are supplied by and under the responsibility of the relevant Israeli
authorities. The use of such data by the OECD is without prejudice to the status of the Golan
Heights, East Jerusalem and Israeli settlements in the West Bank under the terms of international
law.
2 Not all national statistical agencies use ISIC Rev.3.1 or ISIC Rev.4 to classify industries.
However, the Statistical Classification of Economic Activities in the European Community
(NACE), the North American Industry Classification System (NAICS) and the Australian and
New Zealand Standard Industrial Classification (ANZSIC) include a classification which is
broadly in accordance with industries C-K in ISIC Rev.3.1 or industries B-N in ISIC Rev.4.
3 The wage estimates reported in the Economic Outlook are prepared by the Economics
Department (ECO) of the OECD. They are consistent with the December 2018 issue of the
Economic Outlook.
4 In this case, the amount of tax relief is related to actual social security contributions paid by the
employee or withheld from his wage – thus in this respect this item deviates from the general
definition of standard tax relief under which relief is unrelated to actual expenses incurred.
5 OECD, Revenue Statistics1965–2017, p. 62.
6 This characterisation must be viewed as informal, as the determination of tax expenditures
requires the identification of a benchmark tax system for each country, or preferably, a common
international benchmark. In practice it has not been possible to reach agreement on a common
international benchmark for such purposes.
7 See Table 1.6 in OECD Revenue Statistics 2018.

ORGANISATION FOR ECONOMIC CO-OPERATIONAND DEVELOPMENT
The OECD is a unique forum where governments work together to address the economic, social andenvironmental challenges of globalisation. The OECD is also at the forefront of efforts to understand and tohelp governments respond to new developments and concerns, such as corporate governance, theinformation economy and the challenges of an ageing population. The Organisation provides a settingwhere governments can compare policy experiences, seek answers to common problems, identify goodpractice and work to co-ordinate domestic and international policies.
The OECD member countries are: Australia, Austria, Belgium, Canada, Chile, the Czech Republic,Denmark, Estonia, Finland, France, Germany, Greece, Hungary, Iceland, Ireland, Israel, Italy, Japan, Korea,Latvia, Lithuania, Luxembourg, Mexico, the Netherlands, New Zealand, Norway, Poland, Portugal, theSlovak Republic, Slovenia, Spain, Sweden, Switzerland, Turkey, the United Kingdom and the United States.The European Union takes part in the work of the OECD.
OECD Publishing disseminates widely the results of the Organisation’s statistics gathering andresearch on economic, social and environmental issues, as well as the conventions, guidelines andstandards agreed by its members.
OECD PUBLISHING, 2, rue André-Pascal, 75775 PARIS CEDEX 16
(23 2019 02 1 P) ISBN 978-92-64-31374-3 – 2019