Firm characteristics, labor sorting, and wages
34
Munich Personal RePEc Archive Firm characteristics, labor sorting, and wages Francisco Alcala and Pedro J. Hernandez Universidad de Murcia October 2005 Online at http://mpra.ub.uni-muenchen.de/1226/ MPRA Paper No. 1226, posted 20. December 2006
-
Upload
independent -
Category
Documents
-
view
0 -
download
0
Transcript of Firm characteristics, labor sorting, and wages
MPRAMunich Personal RePEc Archive
Firm characteristics, labor sorting, andwages
Francisco Alcala and Pedro J. Hernandez
Universidad de Murcia
October 2005
Online at http://mpra.ub.uni-muenchen.de/1226/MPRA Paper No. 1226, posted 20. December 2006
FIRM CHARACTERISTICS, LABOR SORTING, AND WAGES∗
FRANCISCO ALCALÁ† AND PEDRO J. HERNÁNDEZ‡
November 2006
Abstract
We analyze in a simple model the consequences of efficiency heterogeneity at the firm level for the sorting of workers with different skills into firms with different characteristics. We show that more efficient firms tend to produce higher quality output in equilibrium, which then translates into higher relative demand of education and unmeasured skills. The model provides an integrated explanation within a competitive framework for the observed correlations between several establishment characteristics (size, employees’ average education, capital/labor ratio, and remoteness of selling markets) and average wages. We test the implications of the model using Spanish employer-employee matched data that allow to simultaneously control for establishment and worker characteristics. We find that average education in the establishment is increasing in the remoteness of its main market. Establishment’s size, remoteness of main market, and co-workers’ average education have significant, robust and quantitatively important positive joint effects on wages. The national-market orientation effects (with respect to local-market orientation) on labor composition and wages are at least as important as the international-market effects (with respect to national-market orientation). All wage premia are non-decreasing on worker education and most of them are strictly increasing, suggesting that unmeasured skills are relatively more important for high-education workers. Keywords: Quality Competition, Exporting Firms, Unobservable Skills, Wages. (JEL: J24, J31, I20).
∗ We acknowledge financial support from the Spanish Ministry of Education and Science (PNICDI cofinanced by the FEDER) under projects SEJ2005-07200 (both authors), and SEJ2005-08783-C04-02 (Pedro J. Hernández). Part of this research has been conducted while Francisco Alcalá was visiting the Economics Department at NYU which he thanks for its hospitality, . † Universidad de Murcia. E-mail: [email protected] . ‡ Universidad de Murcia. E-mail: [email protected] .
1. INTRODUCTION
There is by now a sizeable empirical literature pointing out that some characteristics of firms are associated with larger average wages. In particular, it has been claimed that larger establishments, exporters, firms with high capital/labor ratio, and firms with high average education employees pay higher wages.1 This line of research is opening the door to a large series of possible determinants of workers’ pay, but it is also suggesting that largely heterogeneous workers are matched with heterogeneous establishments following some systematic patterns that are connected to the cited observable establishment characteristics. Yet, we are still far away from being confident that we fully understand the mechanisms for these establishment-wage and sorting effects, and the empirical evidence that has been offered so far is still weak in several respects.2 In this paper we try to contribute to the literature on both the theoretical and the empirical grounds. First, we build a simple model emphasizing firm-efficiency heterogeneity and quality competition, which can explain all the cited correlations between employers’ characteristics and wages within a unifying framework. Second, we test the model’s implications on establishments’ labor composition and wage effects, taking care of individuals’ observable characteristics and extending the evidence in several directions.
Most explanations offered for the establishment-characteristics wage effects are informal and apply only to the firm size effect. They may be classified according to whether or not they imply deviations from competitive labor markets. It has been argued that efficiency wages, internal labor markets, and monopoly rents that are shared with employees are relatively more important in large firms. On the other hand, competitive arguments tend to point out that large firms have more profitable conditions to use new and capital intensive technologies, which require more skilled labor that is paid according to its larger productivity. An additional specific argument put forward for the employees’ average education effect is the high complementarity between skilled workers (Kremer (1993) and Kremer and Maskin (1996)). In 1 Abowd and Kramarz (1999) is a general survey on studies linking firm and worker data. The existence of a positive firm-size wage premium is probably the most extensively documented firm characteristic effect, and has been analyzed among others by Idson and Oi (1999) and Troske (1999). Oi and Idson (1999), and Lallemand, Plasman, and Rycx (2005) provide reviews of the theoretical arguments and the empirical results. The hypothesis that exporter firms pay larger wages has also received extensive treatment by a recent literature starting with Bernard and Jensen (1995), which is surveyed in Schank, Schnabel and Wagner (2006). The effect of average co-workers’ education on individual wages is analyzed in Bayard and Troske (1999), Troske (1999), and in Battu, Belfield and Sloane (2003). For the relationship between the capital/labor ratio and average wages in the establishment see Abowd, Kramarz, and Margolis(1999), Troske (1999), and Arai (2003). 2 Note that the starting point of the large literature on the complexities and the consequences of the matching process between workers and firms is a large heterogeneity among both workers and firms. However, we know very little about the possible patterns of who matches with whom in terms of broad characteristics.
1
this paper we take a competitive approach and built a model that analyzes the consequences of efficiency heterogeneity at the firm level for the sorting of workers with different skills into firms with different characteristics. We assume that firms compete in prices as well as in quality. Workers differ by measured and unmeasured characteristics (education and other skills, respectively). In equilibrium, workers are paid their marginal productivities, and firms’ price and quality choices jointly determine establishments’ observable characteristics and the optimal composition of its labor force.
The general implication of the model is that under very reasonable assumptions quality
competition implies that more skilled and educated workers are sorted into more efficient firms. The reason is that in equilibrium more efficient firms choose to produce higher quality goods. In equilibrium, more efficient firms are also larger and sell in more distant markets. As a result, the model predicts that we should observe: (1) average education of employees tends to be higher in larger firms and firms selling in more distant markets; (2) firms with higher average education, larger size or selling in more distant markets pay higher average wages to workers, even after controlling for workers’ education. Thus, the model provides an integrated explanation for the observed correlations between the cited establishment characteristics and wages. The model also points at the relevant parameters that determine the relationship between the capital/labor ratio and average wages (conditional on education), and the pattern followed by establishment-characteristics premia with respect to worker education. Our model may be related to the recent literature that emphasizes the importance of taking into account efficiency heterogeneity at the plant level to explain several important facts related to international trade and the dynamics of aggregate productivity (Metrick (2003), and Bernard et al. (2003)). As in these papers, the existence of trade costs induces only the most productive firms to self-select into exporters. This paper extends the implications of efficiency heterogeneity on firms’ labor composition and wages.
In the second part of the paper, we test the implications of the model using Spanish data from the Encuesta de Estructura Salarial (Wage Structure Survey) of 2002. This survey contains matched data for more than 150,000 workers and 15,000 establishments, and includes most relevant characteristics of individuals (such as education, genre, age, years in the current firm, type of contract, etc.) and establishments (location, industry, size, market orientation, etc.). We explain the details on the data and the sample in Section 3.
In Section 4 we use these data to analyze the model’s implications on the relationship
between establishment’s characteristics (in particular, establishment’s main market –or market orientation- and size) and the educational composition of its labor force. Bernard and Jensen (1997) provide evidence that the ratio of non-production to production workers is larger in
2
exporting firms. Similarly, Maurin, Thesmar, and Thoenig (2002) argue that the tasks related to product development, marketing, and customizing have a potentially very different content depending on whether they are performed for the domestic or a foreign market, so that the very act of exporting requires a skill upgrading of these activities. Using data on the occupational structure, they show that the fraction of high-skill jobs increases with the share of exported output, particularly in the development/marketing areas. Our results also show that average education in establishments whose main market is the European Union is larger than in establishments oriented to the domestic market. Moreover, the difference is considerably larger when comparing establishments whose main market is the Rest of the World (non-EU countries) with domestic-market oriented establishments. However, there is also a substantial difference in average education between local-market establishments and national-market establishments, which has not been uncovered so far. This difference is larger than the difference between national-market and European-market establishments, and is at least as important as the difference between national-market and Rest of the World-market establishments. Similar results are obtained using the fraction of college graduates in the establishment instead of the mean of employees’ schooling years. Thus, it appears to be more of a sequence of echelons in the effect of market orientation (from the local to the national market, and then to the European and eventually to the World market) than a binary exporting versus non-exporting effect. This is consistent with our theoretical model, where decisions on which markets to serve and how much human capital to hire depend on establishment efficiency.3 Indeed, the difference in efficiency needed for a firm to move on from the local market to the national market may be higher than the difference needed to go on to export. Furthermore, our empirical analysis shows that, once we control for two-digit industries, larger size does not necessarily imply a higher relative demand for high-education workers. Notwithstanding, size do is positively related to high average education conditional on the establishment having a non-local market orientation.
In Section 5 we test the model’s implications on wages. The common shortcoming to
almost all studies on the exporting status premium is that they use average data at the plant or firm level and therefore cannot control for individual worker characteristics. Since, as we already noted, employees’ average education is positively correlated with the exporting status, the results are likely to be biased. The exception is Schank, Schnabel and Wagner (2006) who use linked employer-employee data from Germany. However, these authors rely on imputed data for white-collar workers and obtain results that are in contradiction with other evidence and with ours. Furthermore, analyses of the firm-size wage premium typically fail to control for market orientation (or for the less demanding exporting status variable) with which firm 3 Which is also consistent with Bernard and Jensen (1999) analysis that efficiency is the cause of the exporting status.
3
size is highly correlated. Our data set will allow us to simultaneously controlling for all the usual worker characteristics and the cited establishment characteristics.
We obtain that all the variables suggested by the theoretical model have the expected
signs, are jointly statistically significant, and have an important quantitative impact. According to our preferred estimation, workers in establishments whose main market is the whole country obtain average wages 10.5-percent higher than wages in local-market establishments. This wage premium rises to 18.1-percent and to 20.3-percent when the main market is either the EU or the rest of the world (non-EU countries), respectively. Thus, as with the analysis on establishments’ labor composition, the wage premium for national-market establishments (with respect to local establishments) is at least as important as the premium for international-market establishments (with respect to national ones), which again has been the only one analyzed by the literature. Including all of our establishment characteristics reduces the coefficient on worker’s years of schooling by more than one third, which is consistent with the common presumption that education coefficients partially capture the effect of unmeasured skills. Working in establishments with the good characteristics (those that our model associates with high skills sorting) brings about a wage premium that is almost comparable to the education premium. For example, according to our preferred model estimates, working in a medium size establishment whose main market is the national market brings about the same wage premium (23.9-percent) over the reference group (small local establishments) than 5.2 additional years of schooling. The results are robust to changing the way in which individuals’ education as well as establishments’ average education are measured in the model, and to the inclusion of proxies controlling for other possible effects that have been suggested by the literature. More specifically, we include proxies for the potential bargaining power of workers and unions, and for the effect of internal labor markets in large establishments.
In the last subsection of Section 5 we address the question of whether establishment-
characteristics wage premia show any specific pattern with respect to worker education. This is an important question not only because it helps understanding the wage structure, but also because it provides indications about whether unmeasured skills are more important (i.e., more productive and valuable) for high-education or for low-education workers. We obtain that all the establishment characteristics we are considering have positive and significant wage effects on all education groups, and that the effects are non-decreasing in education in all cases and strictly increasing in most cases.4 For example, the coefficients on co-workers’ average
4 These results are in contrast with the very short literature that has explored the issue; e.g., Battu, Belfield and Sloane (2003), Lallemand, Plasman and Rycx (2005), and Shank, Schnabel and Wagner (2006). Nonetheless, except in the first reference, the comparison being carried out is not between education groups but between blue-collard and white-collard workers.
4
education and on establishment’s market orientation obtained for the sub-sample of college graduates double and in some cases triple the coefficients obtained for the sub-sample of workers not having completed secondary studies. This brings about very large establishment wage premia for college graduates. As a final example, consider the case of a college-degree worker employed in a medium-size establishment exporting most of its production to the European Union and with co-workers’ average education in the 75th percentile of the corresponding distribution. This worker obtains an average wage 86.4-percent higher than an individual with the same education and working in a small local-market establishment situated in the 25th percentile of the distribution on establishments’ average-education. The same comparison of establishment characteristics but for workers without completed secondary studies brings about a premium of 29.8-percent. Thus, unmeasured skills seem to be much more valuable for high-education workers. In Section 6 of the paper we summarize and conclude.
2. THE MODEL In this Section we build a partial equilibrium model where efficiency-heterogeneous firms compete in prices and quality, and employ workers with heterogeneous measured and unmeasured characteristics. The aim of the model is to analyze the relationships between firm’s observable equilibrium characteristics and, first, establishments’ labor composition, and second, average wages paid by the firm to workers with the same observable characteristics. Demand and Technology Firms are indexed by j and may sell their output in different markets, which are indexed by h. Consumers are identical in all markets but markets may differ in size. Mh is the size of market h (Mh may be thought of as the number of consumers in that market). Demand for firm j in market h, , depends on firm j’s price and quality in that market ≥1, and on market
size according to the following inverse demand function:
hjy h
jp hjq
(1) ( );/)( h
hj
hj
hj Myqp σδ +=
where5
5 The assumption that is just a normalization on quality. We take q=1 to be the minimum quality for the good to be of any use (so that demand is strictly positive at a zero price if and only quality is above this
( ) 00)1( =+ σδ
5
( )( )
.2'/'')/( ;0')/(/
,0''/,0'/
;00)1(22
<−<≡∂∂
≤≡∂∂>≡∂∂
=+
σσσσ
δδδδ
σδ
hhjh
hj
hj
hj
MyMy
Output is obtained by using capital and labor, which may be educated or non-educated,
and skilled or unskilled. Skill is the characteristic representing workers’ productive capacities that are observable by firms but are unmeasured by conventional statistics (so that we cannot control for them in the empirical analysis). Education is observable by firms and measured by statistics. Hence possible combinations sum up to four types of workers: is the number of
educated and skilled workers employed by firm j, are the non-educated and skilled
workers, are the educated and unskilled workers, and are the non-educated and
unskilled workers. We also use the following notation: , , . Firm j has the following production function:
ESjl
NSjl
EUjl NU
jl
ESj
EUj
Ej lll +≡ NS
jNUj
Nj lll +≡ N
jEjj lll +≡
(2) ( ) ( ) ( ) ( ) ( )
;1;1,,,,
;
/1
<≥
⎟⎟
⎠
⎞
⎜⎜
⎝
⎛++++=
ργγγγγ
ρ
γ
ρ
γ
ρ
γ
ρ
γ
ρ
γ
ρ
ESEUNSNUK
j
ESjES
j
EUjEU
j
NSjNS
j
NUjNU
j
jKjj ESEUNSNUK q
laq
laq
laq
laqKa
Ay
where is the firm-specific efficiency parameter. For any choice of output quality , this is
a conventional CES production function. Increasing output quality comes at the cost of lower output per worker. Moreover, producing high quality goods out of unskilled and uneducated labor may be difficult or even impossible. Unskilled non-educated work becomes a decreasingly good substitute for skills and education when it comes at producing higher quality. We formalize this idea by assuming that productivity of unskilled and uneducated labor decreases faster than that of skilled and educated labor, as quality increases:
jA jq
6
2'/'')/( <− σσh
hj Mylevel). The condition on the curvature of the (per capita) inverse demand functionσ is the
standard assumption that guarantees the second order conditions of profit maximization. 6 In many cases, devoting more time per unit of output is not sufficient to produce higher quality output. It is also indispensable to use above-average skills (besides having the appropriate education). For example, it is unlikely that a low skilled architect is able to design innovative solutions to outstanding architectural problems whatever the time provided for the project; similarly, it is unlikely that the service provided in a top restaurant by a highly skilled waiter can be matched by low skilled waiters just by increasing their number. In such cases, unskilled workers’ marginal productivity goes to zero as the quality being targeted increases. As a result, it has been assumed in the literature that only workers with certain minimum human capital would be able to produce goods of a given quality (e.g., Stokey, 1991). In our model we only need the weaker assumption that productivity
6
.; NUEUESNUNSES γγγγγγ <<<<
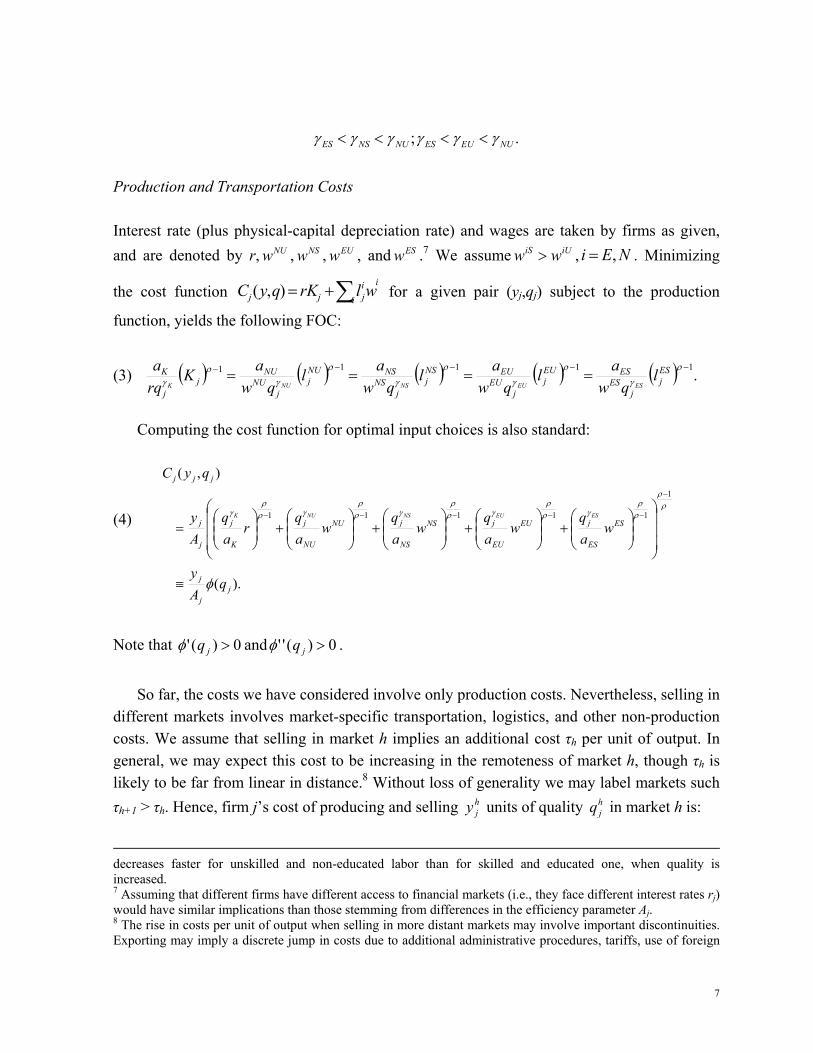
Production and Transportation Costs Interest rate (plus physical-capital depreciation rate) and wages are taken by firms as given, and are denoted by r, , , , and .NUw NSw EUw ESw 7 We assume ,iUiS ww > NEi ,= . Minimizing
the cost function for a given pair (yi
iijjj wlrKqyC ∑+=),( j,qj) subject to the production
function, yields the following FOC:
(3) ( ) ( ) ( ) ( ) ( ) .11111 −−−−− ====ρ
γ
ρ
γ
ρ
γ
ρ
γρ
γESj
jES
ESEUj
jEU
EUNSj
jNS
NSNUj
jNU
NUj
j
K lqw
alqw
alqw
alqw
aKrqa
ESEUNSNUK
Computing the cost function for optimal input choices is also standard:
(4)
).(
),(1
11111
jj
j
ES
ES
jEU
EU
jNS
NS
jNU
NU
j
K
j
j
j
jjj
qAy
waq
waq
waq
waq
raq
Ay
qyC
ESEUNSNUK
φ
ρρ
ρρ
γρρ
γρρ
γρρ
γρρ
γ
≡
⎟⎟⎟
⎠
⎞
⎜⎜⎜
⎝
⎛
⎟⎟⎠
⎞⎜⎜⎝
⎛+⎟
⎟⎠
⎞⎜⎜⎝
⎛+⎟
⎟⎠
⎞⎜⎜⎝
⎛+⎟
⎟⎠
⎞⎜⎜⎝
⎛+⎟
⎟⎠
⎞⎜⎜⎝
⎛=
−
−−−−−
Note that 0)(' >jqφ and 0)('' >jqφ .
So far, the costs we have considered involve only production costs. Nevertheless, selling in
different markets involves market-specific transportation, logistics, and other non-production costs. We assume that selling in market h implies an additional cost τh per unit of output. In general, we may expect this cost to be increasing in the remoteness of market h, though τh is likely to be far from linear in distance.8 Without loss of generality we may label markets such τh+1 > τh. Hence, firm j’s cost of producing and selling units of quality in market h is: h
jy hjq
decreases faster for unskilled and non-educated labor than for skilled and educated one, when quality is increased. 7 Assuming that different firms have different access to financial markets (i.e., they face different interest rates rj) would have similar implications than those stemming from differences in the efficiency parameter Aj. 8 The rise in costs per unit of output when selling in more distant markets may involve important discontinuities. Exporting may imply a discrete jump in costs due to additional administrative procedures, tariffs, use of foreign
7
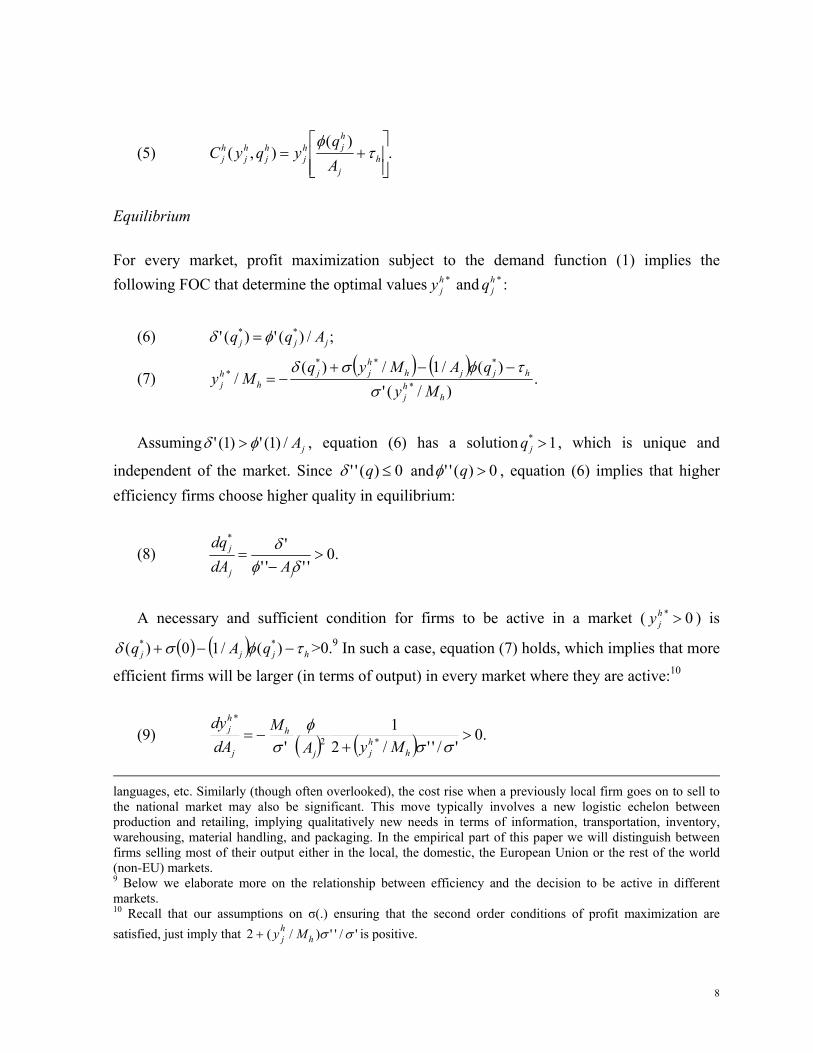
(5) .)(
),(⎥⎥⎦
⎤
⎢⎢⎣
⎡+= h
j
hjh
jhj
hj
hj A
qyqyC τ
φ
Equilibrium For every market, profit maximization subject to the demand function (1) implies the following FOC that determine the optimal values and : *h
jy *hjq
(6) ;/)(')(' **
jjj Aqq φδ =
(7) ( ) ( )
.)/('
)(/1/)(/ *
****
hhj
hjjhhjj
hhj My
qAMyqMy
στφσδ −−+
−=
Assuming jA/)1(')1(' φδ > , equation (6) has a solution , which is unique and
independent of the market. Since
1* >jq
0)('' ≤qδ and 0)('' >qφ , equation (6) implies that higher efficiency firms choose higher quality in equilibrium:
(8) .0''''
'*
>−
=δφ
δ
jj
j
AdAdq
A necessary and sufficient condition for firms to be active in a market ( ) is 0* >h
jy
( ) ( ) hjjj qAq τφσδ −−+ )(/10)( ** >0.9 In such a case, equation (7) holds, which implies that more
efficient firms will be larger (in terms of output) in every market where they are active:10
(9) ( ) ( ) .0'/''/2
1' *2
*
>+
−=σσ
φσ h
hjj
h
j
hj
MyAM
dAdy
languages, etc. Similarly (though often overlooked), the cost rise when a previously local firm goes on to sell to the national market may also be significant. This move typically involves a new logistic echelon between production and retailing, implying qualitatively new needs in terms of information, transportation, inventory, warehousing, material handling, and packaging. In the empirical part of this paper we will distinguish between firms selling most of their output either in the local, the domestic, the European Union or the rest of the world (non-EU) markets. 9 Below we elaborate more on the relationship between efficiency and the decision to be active in different markets. 10 Recall that our assumptions on σ(.) ensuring that the second order conditions of profit maximization are satisfied, just imply that is positive. '/'')/(2 σσh
hj My+
8
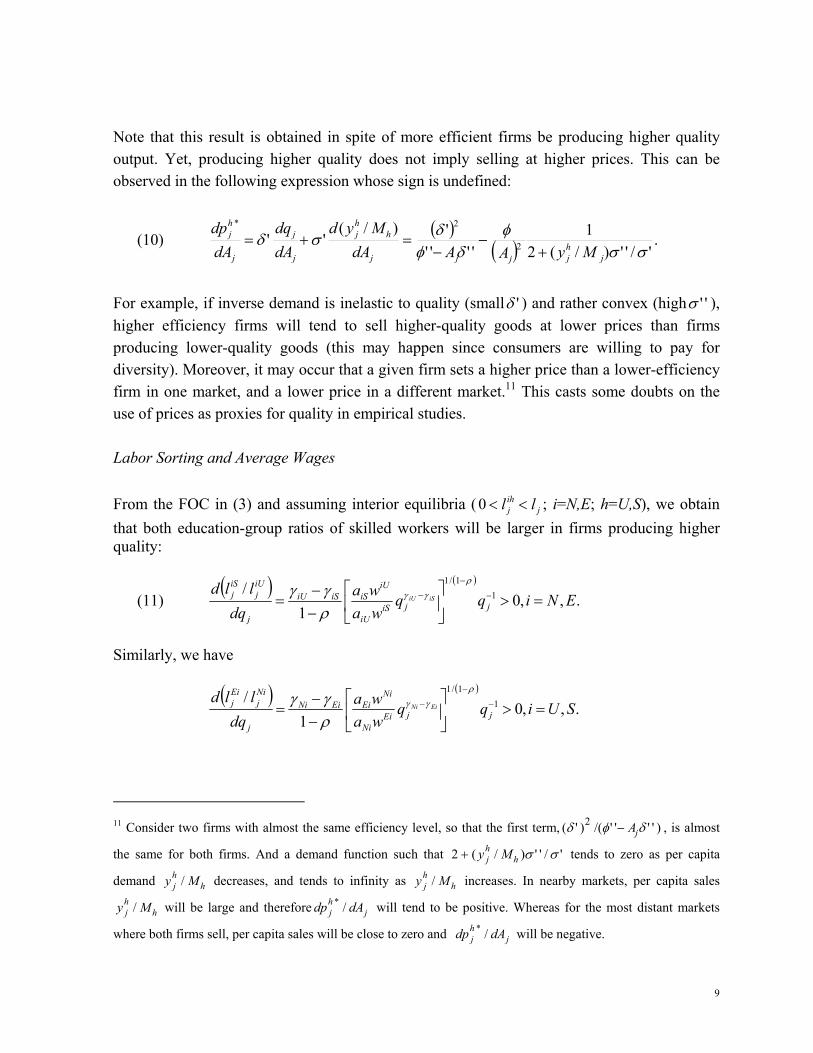
Note that this result is obtained in spite of more efficient firms be producing higher quality output. Yet, producing higher quality does not imply selling at higher prices. This can be observed in the following expression whose sign is undefined:
(10) ( )( ) .
'/'')/(21
''''')/(
'' 2
2*
σσφ
δφδσδ
jhjjjj
hhj
j
j
j
hj
MyAAdAMyd
dAdq
dAdp
+−
−=+=
For example, if inverse demand is inelastic to quality (small 'δ ) and rather convex (high ''σ ), higher efficiency firms will tend to sell higher-quality goods at lower prices than firms producing lower-quality goods (this may happen since consumers are willing to pay for diversity). Moreover, it may occur that a given firm sets a higher price than a lower-efficiency firm in one market, and a lower price in a different market.11 This casts some doubts on the use of prices as proxies for quality in empirical studies. Labor Sorting and Average Wages From the FOC in (3) and assuming interior equilibria ( ; i=N,E; h=U,S), we obtain that both education-group ratios of skilled workers will be larger in firms producing higher quality:
jihj ll <<0
(11) ( ) ( )
.,,01
/ 11/1
ENiqqwawa
dqlld
jjiSiU
iUiSiSiU
j
iUj
iSj iSiU =>⎥
⎦
⎤⎢⎣
⎡−−
= −
−
−
ργγ
ργγ
Similarly, we have
( ) ( )
.,,01
/ 11/1
SUiqqwawa
dqlld
jjEiNi
NiEiEiNi
j
Nij
Eij EiNi =>⎥
⎦
⎤⎢⎣
⎡−−
= −
−
−
ργγ
ργγ
11 Consider two firms with almost the same efficiency level, so that the first term, , is almost
the same for both firms. And a demand function such that tends to zero as per capita
demand decreases, and tends to infinity as increases. In nearby markets, per capita sales
will be large and therefore will tend to be positive. Whereas for the most distant markets
where both firms sell, per capita sales will be close to zero and will be negative.
)''''/()'( 2 δφδ jA−
'/'')/(2 σσhhj My+
hhj My / h
hj My /
hhj My / j
hj dAdp /*
jhj dAdp /*
9
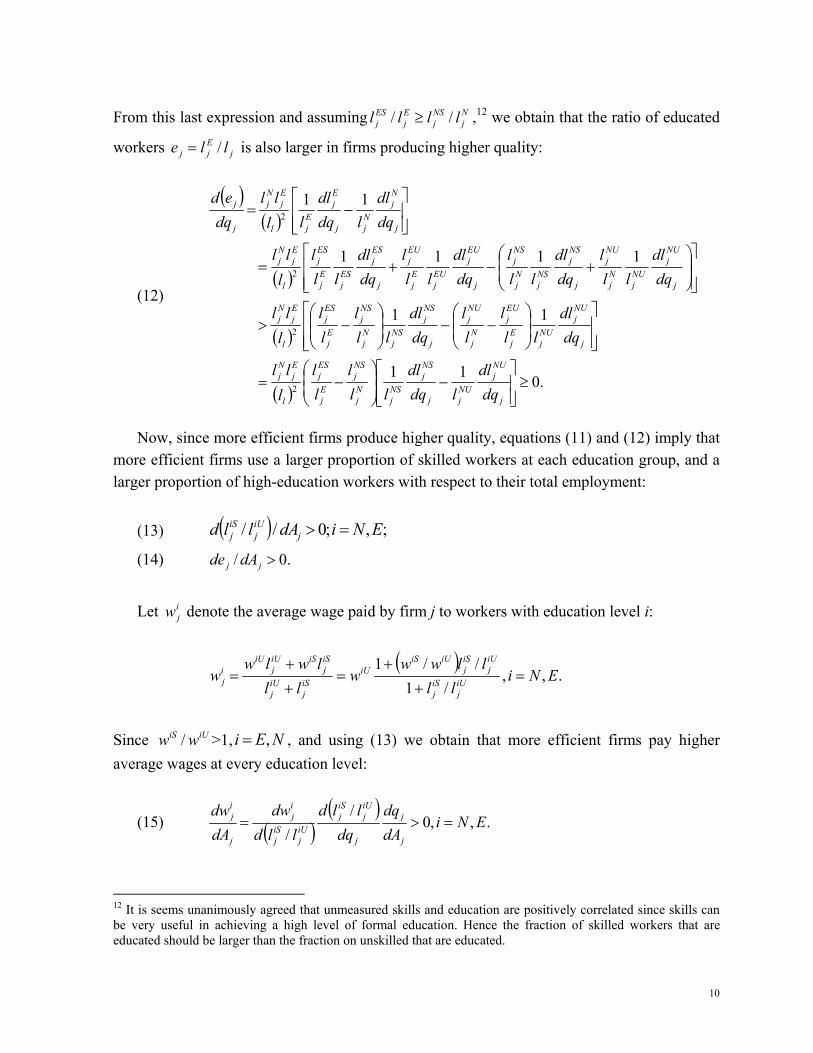
From this last expression and assuming ,Nj
NSj
Ej
ESj llll // ≥ 12 we obtain that the ratio of educated
workers is also larger in firms producing higher quality: jEjj lle /=
(12)
( )( )
( )
( )
( ).011
11
1111
11
2
2
2
2
≥⎥⎥⎦
⎤
⎢⎢⎣
⎡−⎟
⎟⎠
⎞⎜⎜⎝
⎛−=
⎥⎥⎦
⎤
⎢⎢⎣
⎡⎟⎟⎠
⎞⎜⎜⎝
⎛−−⎟
⎟⎠
⎞⎜⎜⎝
⎛−>
⎥⎥⎦
⎤
⎢⎢⎣
⎡⎟⎟⎠
⎞⎜⎜⎝
⎛+−+=
⎥⎥⎦
⎤
⎢⎢⎣
⎡−=
j
NUj
NUjj
NSj
NSj
Nj
NSj
Ej
ESj
l
Ej
Nj
j
NUj
NUj
Ej
EUj
Nj
NUj
j
NSj
NSj
Nj
NSj
Ej
ESj
l
Ej
Nj
j
NUj
NUj
Nj
NUj
j
NSj
NSj
Nj
NSj
j
EUj
EUj
Ej
EUj
j
ESj
ESj
Ej
ESj
l
Ej
Nj
j
Nj
Njj
Ej
Ejl
Ej
Nj
j
j
dqdl
ldqdl
lll
ll
lll
dqdl
lll
ll
dqdl
lll
ll
lll
dqdl
lll
dqdl
lll
dqdl
lll
dqdl
lll
lll
dqdl
ldqdl
llll
dqed
Now, since more efficient firms produce higher quality, equations (11) and (12) imply that
more efficient firms use a larger proportion of skilled workers at each education group, and a larger proportion of high-education workers with respect to their total employment:
(13) ( ) ;,;0// ENidAlld jiUj
iSj =>
(14) .0/ >jj dAde
Let denote the average wage paid by firm j to workers with education level i: i
jw
( )
.,,/1
//1ENi
llllww
wll
lwlww iU
jiSj
iUj
iSj
iUiSiU
iSj
iUj
iSj
iSiUj
iUij =
++
=++
=
Since >1,iUiS ww / NEi ,= , and using (13) we obtain that more efficient firms pay higher average wages at every education level:
(15) ( )( )
.,,0/
/ENi
dAdq
dqlld
llddw
dAdw
j
j
j
iUj
iSj
iUj
iSj
ij
j
ij =>=
12 It is seems unanimously agreed that unmeasured skills and education are positively correlated since skills can be very useful in achieving a high level of formal education. Hence the fraction of skilled workers that are educated should be larger than the fraction on unskilled that are educated.
10
Note that the positive relationship between efficiency and average wages depends crucially on the endogenous positive relationship between efficiency and quality. Should we assume that output quality is exogenous and the same for all firms, firms would choose the same labor composition no matter their efficiency. Firm Characteristics and Average Wages
As noticed above, in equilibrium, not all firms are active in all markets since profits would otherwise be negative. Let 0>hA denote the minimum efficiency level for a firm to be active
in market h. This threshold is given by the value of the efficiency parameter implying zero profits per unit of output at the maximum possible price (i.e., for ), given optimal
quality decisions
0=hjy
)(*h
hj Aq and transport cost to market h:
( ) .))(()/1(0))(( **
hhhjhh
hj AqAAq τφσδ +=−
Thus if firm j’ sells in market h’ but firm j’’ does not, it must be the case that '''' jhj AAA ≥> .
The efficiency threshold hA for being active in market h is increasing in the cost of bringing
the product to that market:
(16) .0))((/)(/ *2 >=∂∂ hhjhhh AqAA φτ
As a result, the remoteness of the markets where a firm sells in is informative about its higher efficiency. This also has implications on firm size. We already noted that more efficient firms have larger sales in every market. Now, since more efficient firms also sell in a larger number of markets, their total size in terms of output, ∑ <∈
=}:{ jh AAhh
hjj yy , is larger.
As noted in the Introduction, there is also some empirical evidence on a positive
relationship between the capital/labor ratio and average wages. In our model, this relationship depends on the technological assumptions about the relationship between quality and physical capital. A sufficient condition for quality and the capital/labor ratio to be positively related is (to see this, just follow the argument used to obtain (11) and (12)). Under this
condition, the capital/labor ratio would be positively associated with high average wages for every education level. We will not pursue this issue in the empirical part of the paper, however, since our data set does not include information about establishments’ physical capital.
ESK γγ ≤
11

The general implication of the model is that under very reasonable assumptions quality
competition implies that more skilled and educated workers are sorted into more efficient firms. The reason is that in equilibrium more efficient firms choose to produce higher quality goods. Since more efficient firms also tend to have larger size and sell in more distant markets in equilibrium, we should observe that: first, average education of employees tends to be higher in larger firms and firms selling in more distant markets; and second, firms with higher average education, larger size and selling in more distant markets tend to pay higher average wages to every education group. We empirically test these hypotheses in the following sections.13
An important final question is which pattern, if any, do firm-characteristics wage premia
have with respect to worker’s education. This amounts to ascertaining the sign of . As can it be observed in expression (17) below, that this sign depends on
most parameters of the model, as well as on the distribution of skills in every education group, and the differences in wages, on which we can only make conjectures. Yet, the sign will tend to be positive the larger are the differences in productivity and wages within educated workers (between skilled and unskilled educated workers) with respect to the difference within non-educated workers (i.e., the larger the difference
jNj
Ej dAwwd /)/(
)()( NSNUESEU γγγγ −−− , and the larger the
difference ( ) ( ) Nj
NUNSEj
EUES wwwwww // −−− ).
(17) ( )( ) .1
/1/1
//
/
1)/()/(
/)/(
11
2
⎟⎟⎟⎟⎟⎟
⎠
⎞
⎜⎜⎜⎜⎜⎜
⎝
⎛
−
⎥⎥⎥⎥
⎦
⎤
⎢⎢⎢⎢
⎣
⎡
−−
⎟⎟⎠
⎞⎜⎜⎝
⎛
++
−−
=
⎥⎦
⎤⎢⎣
⎡−=
−
−
−ρ
γγ
γγ
γγγγ
NSNU
ESEU
jNSNU
NUNS
jESEU
EUES
NSNU
ESEUEUj
ESj
NUj
NSj
Nj
NUNS
Ej
EUES
jNj
Ej
jNj
jEj
Ej
Nj
jNj
Ej
j
Nj
Ej
qwawa
qwawa
llll
wwwwww
dAdww
dAdwdAdw
ww
dAdww
dAwwd
Furthermore, the model predicts that firm-characteristics wage premia should all change in the same direction as we compare them for different education groups. The reason is that given any sign for , the sign of the relationship between Aj
Nj
Ej dAwwd /)/( j and any of the firm
13 In our simple model, the only difference across firms is in the linear efficiency parameter. Note that this implies that firm characteristics would be perfectly correlated although in a non-linear way. Additional differences in the production function across industries and firms, idiosyncratic demand shocks, etc, may however destroy this non-linear correlation between characteristics.
12
characteristics (size, remoteness and average education) is always positive. In the empirical part of the paper we assess and compare the firm-characteristics wage premia for every education group. 3. DATA AND DESCRIPTIVE STATISTICS In the rest of the paper we test some implications of the model. The source of our data is the Spanish Encuesta de Estructura Salarial for 2002 (Wage Structure Survey, EES-2002) elaborated by the Instituto Nacional de Estadística (INE). This survey is conducted by the Spanish National Institute of Statistics (INE) following a two-stage stratified sampling methodology. In the first stage, establishments with at least ten workers are stratified by economic activity, firm size and region. Agriculture and the public sector are excluded. In the second stage, workers at every establishment are randomly selected. The survey contains matched employer-employee data for more than 15,000 employers and 150,000 employees. The main limitation of the survey is that it does not keep track of the same employers and employees for different years, so that we are able to perform only a cross-section analysis.
The survey provides information about the region where the establishment is located, industry, size (groups; i.e., discrete variable), collective bargaining if any, and market orientation (the main broad market for establishments’ output; it distinguishes between local, national, European Union and Rest of the World markets). We exclude from the sample firms in industries that do not have any exporting establishment (building, production and distribution of electrical energy, gas and water, education, health, social work and other social activities, and personal service activities). This leaves us with a sample of 11,567 establishments from 36 three-digit industries (main subsections of the National Classification of Economic Activities) for our analysis on average education in establishments.
The survey then provides information on the individual characteristics of workers
randomly selected at every establishment, such as education, sex, age, years working in the current establishment, type of contract, full/part-time job, etc. In our analysis on wages, we further restrict the sample to male workers with full-time jobs and indefinite contracts.14 We also exclude workers who went through transitory labor incapacity or were included in job promotion programs. In this way, we isolate the establishment-characteristics effect on wages from other circumstances such as gender discrimination, positive discrimination policies,
14 Spanish legislation distinguishes between temporary (or “fixed term”) contracts and indefinite (regular) contracts. Temporary contracts were introduced to promote employment. They can be readily terminated once the contract is over, and are mainly used to hire young workers in their first employment.
13
underemployment, etc. All this depuration brings about a sample of 35,602 workers and 9,120 establishments.
Table 1 reports the main descriptive statistics on establishments’ characteristics according to the EES-2002. Establishments whose main market is the EU or the rest of the world only add up to about 6.5-percent of the total. Most firms have less than 50 workers (71.3-percent) and only 11-percent employ 200 or more workers. Although the percentage of workers with a college degree is 10.5, only 27.6-percent of the establishments in the sample include at least one worker with a college degree among their surveyed employees. The percentage of workers with a college degree in this last subset of establishments is 34.2. This suggests that the data on the fraction of college graduates should be treated as censored data.
The relationship between establishment size and market orientation shows a very strong
pattern: the fraction of establishments with the smallest size is monotonically decreasing in market remoteness. The opposite occurs with the other two size groups. Establishments selling most of their production in non-local markets employ more educated labor and a larger fraction of workers with a college degree. In particular, the fraction of college graduates in firms exporting most of their output to countries outside the EU is almost three times higher than in firms selling in local markets. It may be surprising, however, the low average education and the low fraction of educated workers in establishments exporting most of their production to the EU market, compared to establishments oriented to the national market. This may be due to a Spanish specialization within the EU in rather low-skilled industries, which in turn would be the consequence of having a relatively low endowment of college graduates within the EU (before the enlargement from 15 to 25 members in 2004). The econometric analysis in the next Section lends support to this hypothesis by showing that once we control for two-digit industries the average education as well as the fraction of college-educated workers in establishments selling most output to the EU is larger than in national-market establishments.
Finally, establishments selling in more-distant markets tend to pay higher wages. For
example, establishments selling most of their output in international markets other than the EU pay wages 66.5-percent higher than those paid by establishments selling in local markets. Again, there is some exception, however, since establishments oriented to the national market pay the same average wage than those oriented to the EU market. Clearly, the higher average education in national-market oriented establishments may be the reason. The econometric analysis of Section 5 brings about substantially different results in this respect.
14
4. ESTABLISHMENT CHARACTERISTICS AND EMPLOYEES’ EDUCATION In this Section we test empirically whether larger establishments and establishments selling in more remote markets do in fact employ workers with higher average education or having a college degree in larger proportion. We use weighted least squares to estimate the following equation, where the left-hand-side variable is the mean years of schooling of establishment
j’s employees (or, alternatively, the fraction of college-educated employees), and where the covariates of interest are dummies for establishments’ size and establishments’ market orientation (defined as the main destination of output):
je
(18) ;32 6543210 jjWjEjNjjjj vZMMMSSe +++++++= ααααααα
In this equation, S2 is a dummy for firms employing between 50 and 199 workers, and S3 for firms employing more than 199 workers. The dummies for market orientation are MN for establishments selling most of their output in the national market, ME for the European Union market, and MW for rest of the world (i.e., non-EU countries). The reference group for estimation is establishments with a number of employees between 10 and 49, and selling most of their output in the local market. Zj is a vector of other controls that includes dummies for establishment location (17 regions) and also dummies for establishment industry when noted (36 industries). is the error term. jv
Results are reported in Table 2. The left-hand-side variable for the results in columns (1)-
(3) is the average years schooling of the establishment’s employees. Column (1) shows that all variables are positive and statistically significant at 1-percent, except ME. Since the type of good being produced is likely to be an important determinant of the demand for human capital and the optimal size of the establishment, we include dummies that control for industry in the specification in column (2). Industry dummies tend to increase the size and significance of the coefficients on market orientation. All the dummies for market orientation are now positive, very significant, quantitatively very important, and (statically) monotonically increasing in market distance, as predicted by the theoretical model. In particular, average education in establishments selling most of their production in the national or in the EU markets is about one year higher than in local-market establishments; and it is 2.1 years higher in establishments exporting most of its production to countries outside the EU (average schooling in the whole sample is 8.9: Table 1). The differences between local-market and national-market establishments had not been explored in the literature. As observed in the Introduction, the result that national and European market orientation effects are similar, and that the difference between local and national-market establishments is as important as the difference
15
between national and World-market establishments is important, as it suggests that the main reason for the skill upgrading is not the exporting status. According to our analytical model, the reason is a common cause for both the establishment’s decisions on employees’ education and exporting status, which is efficiency. The difference in efficiency needed for a firm to move on from the local market to the national market may be higher than the difference needed to go on exporting. Therefore, the difference in labor composition between local and national-oriented establishments may also be more prominent.
Furthermore, the two dummies for establishment size become negative though not
statistically significant in column (2). Thus, not controlling for establishment’s industry may bring about misleading results on the effects of market orientation and size. The non-significant results on the size effects suggest that there may be other reasons different from higher efficiency that also give rise to a larger establishment size (e.g., past efficiency; which may bring about a current large size if size is more persistent than efficiency, due to sunk investments, importance of self-financing, demand inertia, etc.). Large firms for reasons unrelated to efficiency would fail to employ higher average education workers, but should also fail to be oriented to non-local markets. In other words, size may still be a signal of efficiency (and therefore bring about higher average education in the establishment) for establishments oriented to the national o international markets. We test this hypothesis in column 3 where we interact size with market orientation. Since the number of firms with sizes S2 and S3 that sell only in local markets is too small (see Table 1) we include all of them together in one single group. Results are reported in column 3. The coefficients for large sizes conditional on selling most of their production in national or international markets, are now positive and significant. Large national and international establishments employ workers with average schooling about 0.7 years higher than small national and international establishments (the coefficient for non-local establishments of size S2 is somewhat larger than for the one for size S3, but the difference is not statistically significant). Note that the coefficients for market orientation not conditional on size, experience only a minor reduction. In contrast, there is now a significant negative coefficient for large establishments selling mostly in the reference market (the local one). Therefore, larger establishment size per se does not imply more demand for educated workers, but only when combined with other characteristics signaling high efficiency, such as national and international market orientation.
In columns (4) to (6) of Table 2 we check for the robustness of our results using now the
fraction of college-educated employees in the establishment as the left-hand-side variable. Since about 70-percent of the establishments in the sample do not include interviews to college-educated workers, least squares estimates may be inconsistent due to censured data problems. We therefore estimate a Tobit model by maximum likelihood. The qualitative
16
results are very similar to those already reported.15 Size effects become insignificant when including industry dummies in column (5), and turn out positive and significant again in column (6) when they are conditional on national and international market orientation. The most appreciable differences are that the coefficients on market orientation are now strictly increasing in distance as long as industry dummies are included in the equation, and that the negative coefficient for large establishments in the reference (the local) market is now not significant at 5-percent but only at 10-percent level.
5. ESTABLISHMENT CHARACTERISTICS AND WAGES We now test our model’s implications on wages. The wage equation is based on the usual Mincerian equation where the log of the employee’s hourly wage is a function of his education and potential experience. Accordingly, we include worker’s schooling years (Y), and potential experience (PE) which is defined as the difference between employee’s age and the expected age to complete his studies according to their official length. We also include tenure (T) which is defined as the number of years the individual has been working for its current employer. We then include establishment characteristics already used in the previous section: two dummies for firms’ size (S2 and S3), three dummies for market orientation (MN, ME and MW) and a vector Zj of other controls for establishment characteristics (35 dummies for three-digit industries, and 16 dummies for regions). Additionally, we also include co-workers’ average years of schooling (e).16 Thus the wage equation is:
(19) ;'32
)()(ln
11109876
254
23210
ijjWjEjNjjjj
ijijijijijij
uZIIIeSSTTPEPEYw
++++++++
+++++=
θββββββ
ββββββ
where wij is worker i’s hourly wage in establishment j, and uij is the residual. We also estimate an equation with establishment fixed effects jπ ,
(20) ,')('')(''''ln 2
542
3210 ijjijijijijijij uTTPEPEYw +++++++= πββββββ
which are then regressed on firm characteristics (see equation (21) below). We use the sub-sample of men with full-time job and indefinite contracts, as described in Section 3. The initial
15 Recall that the coefficients from a Tobit models do not reflect the marginal effects of the right-hand-side variables and therefore are not comparable with the LS estimates. 16 We also considered average potential experience of co-workers as a further right-hand-side establishment characteristic, but always found it to be not statistically significant.
17
advantage of our study over previous ones is that we use directly observed matched data on individuals’ wages and characteristics and on establishments’ characteristics. 5.1. Main Results
Results are reported in Table 3. In columns (1)-(4) we estimate equation (19) using weighted least squares and adding successively different establishment characteristics. In the specification in column (1) we only include workers’ characteristics (schooling, potential experience, and tenure) and 16 dummies for regions that control for geographical differences some factors such as unemployment, composition of labor supply, and price level. In column (2) we add establishment size dummies. In column (3) we add co-workers average schooling, and market orientation. In our preferred specification in column (4) we also include 35 dummies for industries.
All the variables suggested by our theoretical model have the expected signs, are jointly
statistically significant at the 1-percent level, and have an important quantitative impact on wages.17 According to estimation (4), workers in establishments whose main market is the whole country obtain average wages 10.5-percent higher than wages in local-market establishments. This wage premium rises to 18.1-percent and to 20.3-percent, respectively, when the main market is either the EU or the rest of the world (non-EU countries). As with the analysis on establishments’ labor composition in the previous section, the difference between local and national-market establishment effects is at least as important as the difference between national and international-market establishment effects which so far had been the only one analyzed by the literature. Co-workers education also has an important quantitative impact. Increasing co-workers education by one standard deviation brings about a wage increase of 6.9-percent; and moving from an establishment in the 10-th percentile of the establishments’ distribution across employees’ mean education (5 schooling years), to an establishment in the 90-th percentile (13.2 schooling years), increases worker’s wage by 20.8-percent. The size wage premia are 12.1-percent and 15.6-percent for size-S2 and size-S3, respectively. Comparing the effects implied by coefficients in column (2) with those in column (4), we observe that the estimated wage premium for size-S2 establishments falls by 30.4-percent, whereas the premium for size-S3 drops by 45.6-percent. These large reductions make clear the importance of a joint estimation of all establishment-characteristics effects. Overall, the large quantitative wage effect of these establishment characteristics suggests, according to our model, that unmeasured skills have a considerable productive importance.
17 Including establishment characteristics in the wage equation also gives raise to an important increase in explanatory power. Adjusted R2 rises by 21.4-percent in column (4) with respect to column (1). Note that specification in column 1 already includes 16 regional dummies.
18
Including all of our establishment characteristics also reduces the coefficient on worker’s
years of schooling by more than one third, which is consistent with the common presumption that education coefficients partially capture the effect of unmeasured skills. Working in establishments with the good characteristics (those that our model associates with high skill sorting) brings about a wage premium that may be as important as a high-education premium. For example, according to our estimates in column (4), working in a medium size (S2) establishment whose main market is the national market brings about the same wage premium (23.9-percent) over the reference group (small local establishments) than 5.2 additional years of schooling.
In column (5) of Table 3 we report the estimates of the establishment fixed effects model
of equation (20). To carry out this estimation we remove from the sample establishments where only one employee was surveyed, so that we have at least two observations to estimate each establishment fixed effect. Thus, the sample is now reduced to 33,646 workers and 7,164 establishments. It is of no surprise that this specification brings about the best fit as measured by the adjusted R2. Fixed effects are of little help in understanding the causes of wage differences, however. Notwithstanding, we can now regress the estimated fixed effects jπ̂
from equation (20) on the observable establishment characteristics.18 In this way we can assess how much of establishment fixed effects can be explained by the observable establishment characteristics, and check for the robustness of our previous estimates of their effects. Hence we estimate the following equation:
(21) .''''''3'2'ˆ 1098765 jjWjEjNjjjjj ZMMMeSS ηθββββββπ +++++++=
Table 4 reports the results from this equation. Taking the results for the most
comprehensive specification (column 3) as the reference, observable establishment characteristics explain 30-percent of the variation in the estimated establishment fixed effects. All coefficients are statistically very significant and their values are very similar to the corresponding models in Table 3. 5.2. Robustness
18 This two-step procedure to assess the impact of establishment characteristics is similar to that followed by Abowd et al. (1999).
19
We now estimate the models in equations (19) and (20)-(21) using dummies for broad categories of education (HS for completed secondary studies, and U for a college degree) instead of years of schooling to control for employee’s education. We also use the fraction of co-workers with a college degree (e2) instead of co-workers’ average years of schooling. Results are qualitatively very similar and are reported in Table 5 (specification in each column corresponds, respectively, to the same column in Table 3). Again, they show that being employed by a good-characteristics establishment may be as important for worker’s income as formal education. For example, according to the results in column (4) of Table 5, a college degree implies a 31.1-percent wage premium over completed high school. This premium is somewhat lower than the one obtained by an employee of a medium size (S2) national-market establishment with a fraction of college-degree employees that is one standard deviation above average (using as reference the wage of an worker with the same individual observable characteristics working in a small local-market establishment with average fraction of college-degree co-workers).
There have been suggested some alternative explanations for the establishment-size wage
premium. In Table 6 we include additional controls and interactions that help controlling for some of the alternatives. In column (1) we add a dummy for firm-level contracting (which is the way strong bargaining power workers and unions in large market power establishments may increase wages). Firm-level contracting is highly significant. It increases average wages by 7.6-percent and its inclusion reduces the coefficient on the S3-size premium in 2.5 percentage points.19 Yet, all coefficients remain significant and quantitatively high (in fact, the coefficients for market orientation tend to be now somewhat larger).
Second, internal labor markets have also been suggested as a potential source of higher
average wages in larger firms. Large firms may provide better opportunities for internal promotion and more in the job training which then needs to be rewarded to reduce turnover; hence average wages should be larger for the same level of formal education. Notice however that these benefits would not be obtained by the employee from the outset, but only as time goes by working for the same firm. Therefore, this effect should show up as a larger payoff of tenure in larger firms. We test this hypothesis in column (2) by including interaction terms of tenure with S2 and S3. Only the interaction with the largest size turns out positive and statistically significant. Tenure in S3 establishments is about 20-percent more profitable than in small establishments. Inclusion of this interaction term reduces the S3-size premium by 3.1
19 This estimate is very consistent with the results in the analysis on firm-level contracting by Card and De la Rica (2006). They point out that firm-level contracting is more likely to occur where there is (or was) a strong union presence.
20
percentage points (thereby eliminating the previous small difference between the S2-size and the S3-size coefficients), and leaves almost unaltered the rest of coefficients.
In column (3) we simultaneously include both the additional control and the interactions
terms. The sign and size of the coefficients are similar to those in the previous columns, though only the coefficient for firm-level contracting retains statistical significance. The simultaneous inclusion of all these controls has only a minimal impact on the estimates for market orientation and co-workers education we have been analyzing. It reduces the estimated premium for S3-size establishments by more than six percentage points however. 5.3. Establishment Characteristics and Wages by Education Groups Do establishment-characteristics wage effects show any pattern with respect to worker’s education? This an important question not only because it helps understanding the wage structure, but because –according to our model- it also provides indications about whether unmeasured skills are more important for high-education or for low-education workers when it comes at producing quality output. According to our model, the possible patterns depend –among other parameters- on the relative importance of skills for producing quality (when comparing productivity of educated and non-educated workers). Our theoretical also predicts that regardless of whether establishment-characteristics wage premia are increasing or decreasing in worker’s education, all establishment-characteristics wage effects should show the same pattern. We now investigate this issue by estimating equation (19) for each major education group. We include in the equation the additional firm-level contracting variable and the interaction size-tenure terms from the last subsection since they already proved their potential relevance.
We divide the sample into three sub-samples: workers without completed secondary education, workers with completed secondary education, and workers with a college degree. Results are shown in Table 7. All the coefficients for the three establishment characteristics we are analyzing have the expected positive signs and are significant at the 1-percent level in all sub-samples and equations. Whenever the difference is statistically significant, the coefficient for the S3-size is higher than the one for S2-size and the coefficients for market orientation are increasing in the remoteness of the market.
The differences in the estimated coefficients across education groups are sizable and
follow a systematic pattern. All our establishment-characteristics wage premia either are increasing in the level of education or the difference in coefficients is not statistically
21
significant (this occurs in the comparison of the S3 and the MN coefficients between the secondary and the university samples). For example, the coefficients on co-workers’ average education and market orientation for college graduates double or even triple those for primary-education workers.20 To give a sense of the importance of establishment premia for wages of individuals with different education, we may consider the establishment premium for an individual working in a S2-size establishment exporting most of its production to the EU and with employees’ average education in the 75th percentile of the corresponding distribution (the reference would be the wage of an individual working in a small local-market establishment that is situated in the 25th percentile of the average-education characteristic). An individual in an establishment with those characteristics obtains a wage premium of 29.8-percent if he has not completed secondary education, and a premium of 86.4-percent if he has a college degree. According to our model, these results tend to suggest that unmeasured skills of high-education workers are more productive (and therefore more valuable) than those of low-education workers.
Finally, the results on experience and tenure warrant some comments. The wage impact of
potential experience is sharply increasing in education. However, the impact of tenure (as measured by its general coefficient) is not. This pattern is reinforced by the results on the interactions between tenure and establishment size. Large firms are likely to offer better opportunities for internal promotion, learning, and on-the-job training that would tend to increase wages over time. Nevertheless, this effect only emerges as positive and significant in the case of least educated workers. For higher education individuals, the coefficients turn out negative and sometimes significant. Note that this does not mean that tenure has a negative impact on some wages since the sum of any of these interaction terms and the general coefficient for tenure, is always positive. These results suggest that in medium and large size
20 As observed in the Introduction, there are very few works investigating the pattern followed by establishment-characteristics wage premia with respect to individuals’ education. Following a different methodology (i.e., using interaction terms between individual’s education and co-workers’ average education, instead of dividing the sample by education groups), Battu, Belfield and Sloane (2003) obtain that the establishment average-education wage premium is decreasing in worker’s own education in the UK, though they recognize that this runs counter to their theoretical prediction. Lallemand, Plasman and Rycx (2005) analyze the size wage premium and conclude that it is generally larger for blue-collar workers. To the extent that the blue-collard versus white-collard comparison can be related to our education-groups comparison, our results also point in the opposite direction. Firm-level contracting and the highly significant revenues to tenure that low-education workers enjoy in large firm seem responsible for a large share of the wage premium that low-education workers obtain in large firms. Additional results not included in the table show that these factors can be responsible for the difference in results (i.e., when not controlling for these effects, workers with the lowest education obtain the largest firm-size premium). Finally, our results for the market orientation premium tend to contradict those of Schank et al. (2006) who obtain that the premium for white-collard workers is statistically and quantitatively almost insignificant, and lower than for blue-collard workers. However, this result is not obtained using direct data but relies on imputed data on white-collard wages. Moreover, it is also in contradiction with Bernard and Wagner’s (1997) evidence that white-collard workers are the group responsible for almost all the exporting premium.
22
firms, internal promotion may be more important in low-education levels than in high levels, and that these firms may attribute a high value to experience in other firms (on average, a value only slightly lower than to the experience within the firm). 6. CONCLUDING COMMENTS
We have analytically studied the implications of establishments’ efficiency heterogeneity for the sorting of workers with different measured and unmeasured characteristics into establishments with different observable characteristics. Our theoretical model shows that more efficient firms tend to produce higher quality goods, employ a larger fraction of skilled and more-educated workers, have larger size, and sell in more distant markets. Therefore, since skills other than education are unmeasured in most empirical analysis, firms with the cited characteristics will be observed to pay higher average wages to workers with the same education level. Thus, the model is able to provide a simple integrated explanation for some observed correlations between establishment characteristics and wages within a competitive framework. It also points out to some additional testable implications about establishment demand composition and the pattern of establishment wage premia with respect to worker education.
Our empirical results are favorable to all the implications of the model and extend the
available empirical evidence in several directions. We estimate the joint effects of a notable set of establishment characteristics, using direct employer-employee matched observations and controlling for the usual individual characteristics. Market orientation has a significant and quantitatively important positive effect on the demand for human capital that is increasing in market remoteness. Moreover, in non-locally oriented establishments, establishment-size also implies higher average employees’ education. Size, main-market remoteness, average employees’ education, and firm-level contracting also have a significant positive and quantitatively important effect on wages. Yet, the importance of market orientation does not only appear on the difference between exporting and non-exporting firms, as suggested so far by the literature. We showed that the differences in labor composition and in wages between national-market establishments and local establishments are at least as wide as the differences between export-oriented establishments and national-market-oriented establishments. The establishment characteristics we include in the wage equation reduce the estimated education wage premium by more than one third, thereby adding evidence in favor of the usual conjecture that, to a possible large extent, the estimated coefficients on education are capturing the productive value of other unmeasured skills.
23

All the establishment characteristics we analyzed are important for the wages of all workers whatever their education level. However, they are not equally important. Establishment-characteristics effects are increasing (though sometimes not strictly) in workers’ education. For example, the coefficients on co-workers’ average education and market orientation for college graduates double or even triple those for workers with only primary education. The sum of all the establishment wage premia may be as important for a college graduate as the education premium. Following the interpretation suggested by our theoretical model, unmeasured skills seem much more valuable for high-education workers than for the less educated. REFERENCES Abowd, J.M., Kramarz, F. and Margolis, D.N. (1999): "High Wage Workers and High Wage
Firms", Econometrica, 67 (2), 251-333. Abowd, J.M., Kramarz, F. (1999): "The Analysis of Labor Markets using Matched Employer-
Employee Data", in O.C. Ashenfelter and D. Card (editors), Handbook of Labor Economics, Elsevier, Amsterdam, The Netherlands, vol. 3B, 2629-2710.
Arai, M. (2003): “Wages, Profits, and Capital Intensity: Evidence from Matched Worker-Firm Data,” Journal of Labor Economics, 21(3), 593-618.
Bayard, K. and Troske, K.R. (1999): “Examining the Employer-Size Wage Premium in the Manufacturing, Retail Trade, and Service Industries Using Employer-Employee Matched Data”, American Economic Review, Papers and Proceedings, 89 (2), 99-103.
Battu, H., Belfield C.R. and Sloane, P.J. (2003): “Human Capital Spill-Overs Within the Workplace”, Oxford Bulletin of Economics and Statistics, 65 (5), 575-594.
Bernard, A.B., J. Eaton, J.B. Jensen, and S.S. Kortum (2003): “Plants and Productivity in International Trade,” American Economic Review, 93, 1268-1290.
Bernard, A.B., and Jensen, J.B. (1995): "Exporters, Jobs, and Wages in U.S. Manufacturing: 1976-1987," Brookings Papers on Economic Activity, Microeconomics, 67-119.
Bernard, A.B., and Jensen, J.B. (1997): “Exporters, Skill Upgrading, and the Wage Gap,” Journal of International Economics, 42, 3-31.
Bernard, A.B. and Jensen, J.B. (1999): “Exceptional exporter performance: cause, effect, or both?” Journal of International Economics, 47, 1-25.
Bernard, A.B., and Wagner, J. (1997): "Exports and Success in German Manufacturing." Weltwirtschaftliches Archiv/Review of World Economics, 133, 134-157.
24
Card, D., and De la Rica, S. (2006): "The effect of Firm-level Contracts on the Structure of Wages: Evidence from Matched Employer-Employee Data," forthcoming in Industrial and Labor Relations Review.
Idson, T.L., and Oi, W.Y., (1999): "Workers Are More Productive in Large Firms," American Economic Review, 89, 104-108.
Lallemand, T., Plasman, R., and Rycx, F. (2005): “The Establishment-Size Wage Premium: Evidence From European Countries,” DULBEA Working Paper No 05-07.RS, Université Libre de Bruxelles.
Maurin, E., Thesmar, D. and Thoening, M. (2002): “Globalization and the Demand for Skill: an Export Based Channel”, CEPR Discussion Paper Series No. 3406, London.
Melitz, M.J. (2003): “The Impact of Trade on Intra-Industry Reallocations and Aggregate Industry Productivity,” Econometrica, 71, 1695-1725.
Oi, W.Y. and Idson, T.L. (1999): “Firm size and wages”, in O.C. Ashenfelter and D. Card (editors), Handbook of Labor Economics, Elsevier, Amsterdam, The Netherlands, vol. 3B:2165-2214.
Schank, T., Schnabel C., and Wagner, J. (2006): “Do exporters really pay higher wages? First evidence from German linked employer-employee data,” University of Lüneburg Working Paper Series in Economics No. 28.
Stokey, N.L. (1991): “Human Capital, Product Quality, and Growth,” Quarterly Journal of Economics, 106(2), 587-616
Troske, K.R. (1999): “Evidence on the Employer Size-Wage Premium from Worker-Establishment Matched Data”, Review of Economics and Statistics, vol. 81(1), 15-26.
25
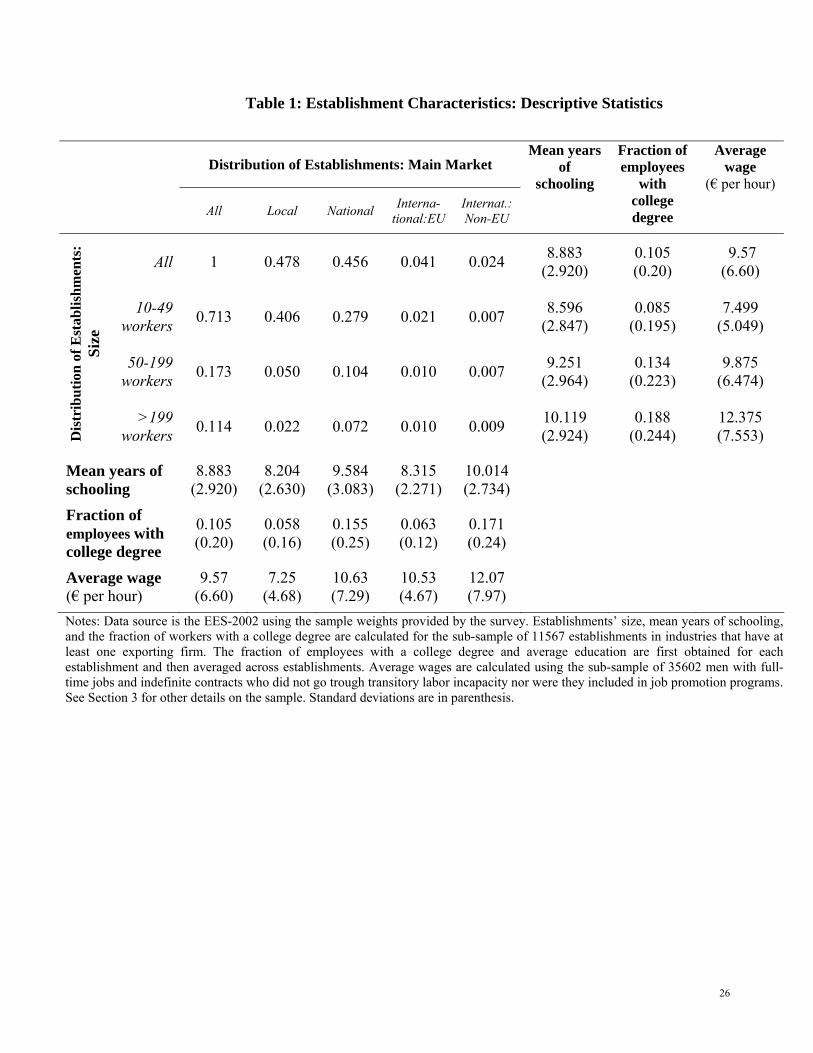
Table 1: Establishment Characteristics: Descriptive Statistics
Notes: Data source is the EES-2002 using the sample weights provided by the survey. Establishments’ size, mean years of schooling, and the fraction of workers with a college degree are calculated for the sub-sample of 11567 establishments in industries that have at least one exporting firm. The fraction of employees with a college degree and average education are first obtained for each establishment and then averaged across establishments. Average wages are calculated using the sub-sample of 35602 men with full-time jobs and indefinite contracts who did not go trough transitory labor incapacity nor were they included in job promotion programs. See Section 3 for other details on the sample. Standard deviations are in parenthesis.
Distribution of Establishments: Main Market
All Local National Interna- tional:EU
Internat.:Non-EU
Mean years of
schooling
Fraction of employees
with college degree
Average wage
(€ per hour)
All 1 0.478 0.456 0.041 0.024 8.883 (2.920)
0.105 (0.20)
9.57 (6.60)
10-49 workers 0.713 0.406 0.279 0.021 0.007 8.596
(2.847) 0.085
(0.195) 7.499
(5.049)
50-199 workers 0.173 0.050 0.104 0.010 0.007 9.251
(2.964) 0.134
(0.223) 9.875
(6.474)
Dis
trib
utio
n of
Est
ablis
hmen
ts:
Size
>199 workers 0.114 0.022 0.072 0.010 0.009 10.119
(2.924) 0.188
(0.244) 12.375 (7.553)
Mean years of schooling
8.883 (2.920)
8.204 (2.630)
9.584 (3.083)
8.315 (2.271)
10.014 (2.734)
Fraction of employees with college degree
0.105 (0.20)
0.058 (0.16)
0.155 (0.25)
0.063 (0.12)
0.171 (0.24)
Average wage (€ per hour)
9.57 (6.60)
7.25 (4.68)
10.63 (7.29)
10.53 (4.67)
12.07 (7.97)
26

Table 2: Establishment Characteristics and Employees’ Education
(1) (2) (3) (4) (5) (6)
S2 0.288** (0.104)
-0.002 (0.102) 0.110**
(0.015) 0.040** (0.013)
S3 0.844** (0.136)
-0.141 (0.139) 0.223**
(0.017) 0.005
(0.016)
S2+S3 -0.507** (0.159) -0.038*
(0.020)
MN1.128** (0.090)
1.094** (0.094)
0.937** (0.106)
0.179** (0.013)
0.202** (0.012)
0.176** (0.013)
ME0.043
(0.147) 0.999** (0.146)
0.823** (0.154)
0.073** (0.030)
0.322** (0.028)
0.294** (0.029)
MW1.546** (0.195)
2.106** (0.180)
1.877** (0.192)
0.236** (0.034)
0.462** (0.031)
0.429** (0.032)
(MN+ME+MW)×S2 0.727** (0.193) 0.106**
(0.025)
(MN+ME+MW)×S3 0.614** (0.207) 0.071**
(0.026) Adjusted R2 0.112 0.266 0.268 Pseudo R2 0.126 0.300 0.301 Observations 11567 11567 11567 11567 11567 11567 Industry dummies No Yes Yes No Yes Yes Notes: In columns (1) to (3) the left-hand-side variable is average schooling years of the employees in the establishment. The estimation method is Weighted Least Squares using the sample weights provided by the survey. In columns (4) to (6) the left-hand-side variable is the fraction of college-educated employees in the establishment, and the estimation method is Maximum likelihood using a Tobit model and the sample weights provided by the survey. A constant and dummies for 16 regions are always included. Dummies for 35 industries are included only when noted. Robust standard errors are in parenthesis. See Section 3 for details on the data source and sample. ** means significant at 1 percent; and * at 10 percent.
27
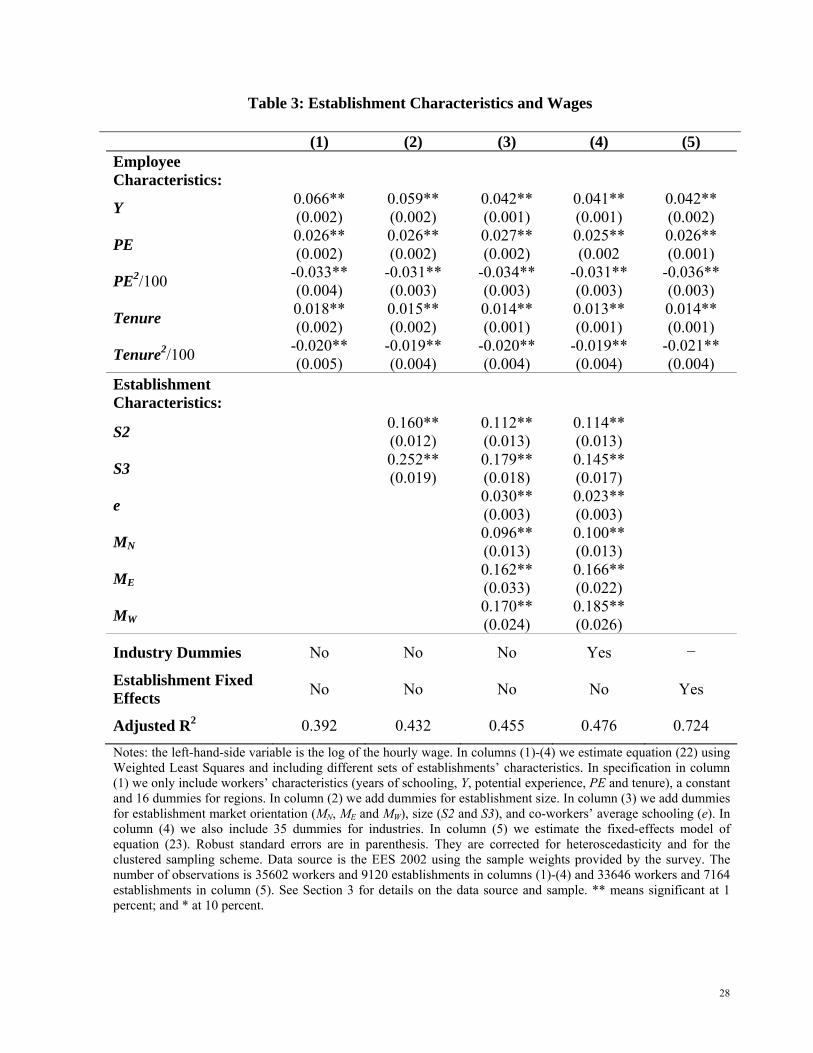
Table 3: Establishment Characteristics and Wages
(1) (2) (3) (4) (5)
Employee Characteristics:
Y 0.066** (0.002)
0.059** (0.002)
0.042** (0.001)
0.041** (0.001)
0.042** (0.002)
PE 0.026** (0.002)
0.026** (0.002)
0.027** (0.002)
0.025** (0.002
0.026** (0.001)
PE2/100 -0.033** (0.004)
-0.031** (0.003)
-0.034** (0.003)
-0.031** (0.003)
-0.036** (0.003)
Tenure 0.018** (0.002)
0.015** (0.002)
0.014** (0.001)
0.013** (0.001)
0.014** (0.001)
Tenure2/100 -0.020** (0.005)
-0.019** (0.004)
-0.020** (0.004)
-0.019** (0.004)
-0.021** (0.004)
Establishment Characteristics:
S2
0.160** (0.012)
0.112** (0.013)
0.114** (0.013)
S3
0.252** (0.019)
0.179** (0.018)
0.145** (0.017)
e
0.030** (0.003)
0.023** (0.003)
MN 0.096**
(0.013) 0.100** (0.013)
ME 0.162**
(0.033) 0.166** (0.022)
MW 0.170**
(0.024) 0.185** (0.026)
Industry Dummies No No No Yes _
Establishment Fixed Effects No No No No Yes
Adjusted R2 0.392 0.432 0.455 0.476 0.724 Notes: the left-hand-side variable is the log of the hourly wage. In columns (1)-(4) we estimate equation (22) using Weighted Least Squares and including different sets of establishments’ characteristics. In specification in column (1) we only include workers’ characteristics (years of schooling, Y, potential experience, PE and tenure), a constant and 16 dummies for regions. In column (2) we add dummies for establishment size. In column (3) we add dummies for establishment market orientation (MN, ME and MW), size (S2 and S3), and co-workers’ average schooling (e). In column (4) we also include 35 dummies for industries. In column (5) we estimate the fixed-effects model of equation (23). Robust standard errors are in parenthesis. They are corrected for heteroscedasticity and for the clustered sampling scheme. Data source is the EES 2002 using the sample weights provided by the survey. The number of observations is 35602 workers and 9120 establishments in columns (1)-(4) and 33646 workers and 7164 establishments in column (5). See Section 3 for details on the data source and sample. ** means significant at 1 percent; and * at 10 percent.
28
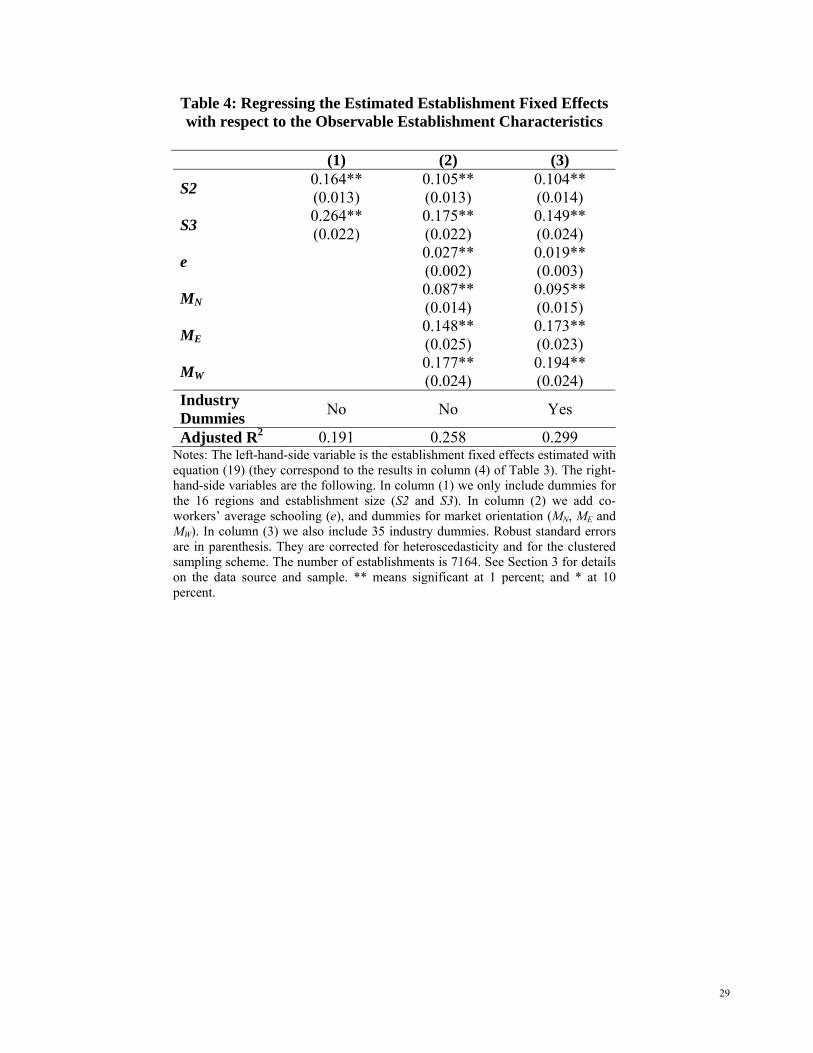
Table 4: Regressing the Estimated Establishment Fixed Effects with respect to the Observable Establishment Characteristics
(1) (2) (3)
S2 0.164** (0.013)
0.105** (0.013)
0.104** (0.014)
S3 0.264** (0.022)
0.175** (0.022)
0.149** (0.024)
e 0.027** (0.002)
0.019** (0.003)
MN 0.087**
(0.014) 0.095** (0.015)
ME 0.148**
(0.025) 0.173** (0.023)
MW 0.177**
(0.024) 0.194** (0.024)
Industry Dummies No No Yes
Adjusted R2 0.191 0.258 0.299 Notes: The left-hand-side variable is the establishment fixed effects estimated with equation (19) (they correspond to the results in column (4) of Table 3). The right-hand-side variables are the following. In column (1) we only include dummies for the 16 regions and establishment size (S2 and S3). In column (2) we add co-workers’ average schooling (e), and dummies for market orientation (MN, ME and MW). In column (3) we also include 35 industry dummies. Robust standard errors are in parenthesis. They are corrected for heteroscedasticity and for the clustered sampling scheme. The number of establishments is 7164. See Section 3 for details on the data source and sample. ** means significant at 1 percent; and * at 10 percent.
29
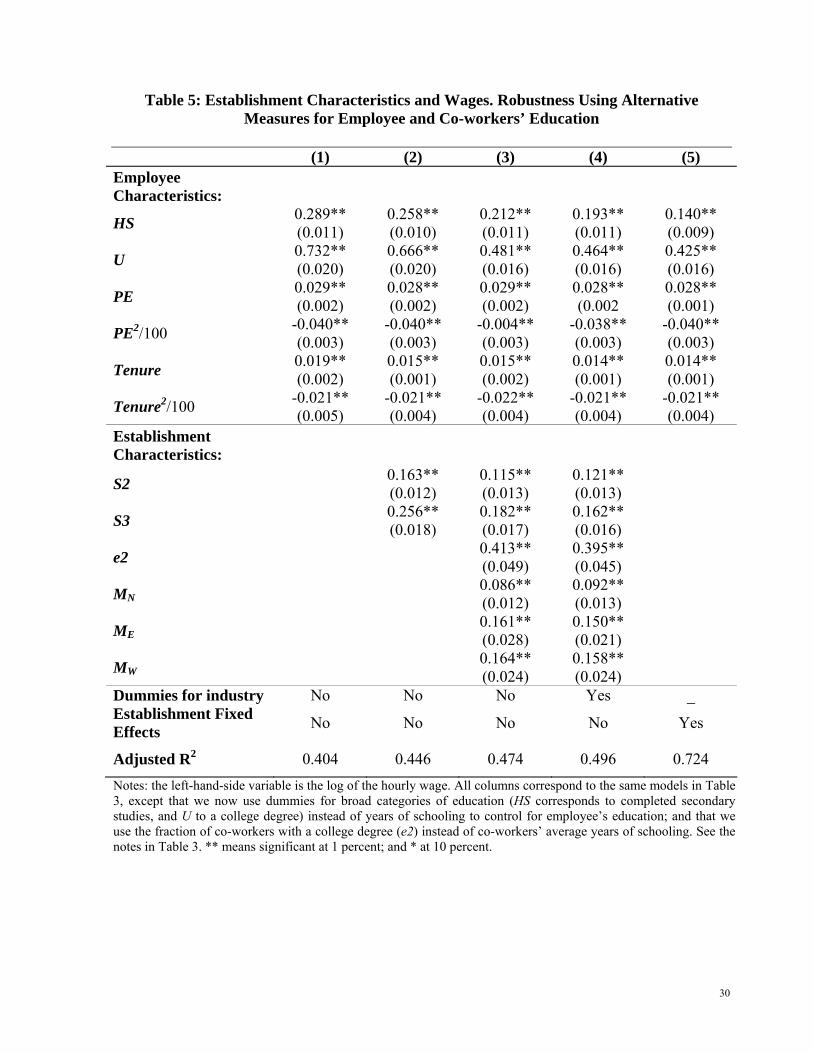
Table 5: Establishment Characteristics and Wages. Robustness Using Alternative
Measures for Employee and Co-workers’ Education
(1) (2) (3) (4) (5) Employee Characteristics:
HS 0.289** (0.011)
0.258** (0.010)
0.212** (0.011)
0.193** (0.011)
0.140** (0.009)
U 0.732** (0.020)
0.666** (0.020)
0.481** (0.016)
0.464** (0.016)
0.425** (0.016)
PE 0.029** (0.002)
0.028** (0.002)
0.029** (0.002)
0.028** (0.002
0.028** (0.001)
PE2/100 -0.040** (0.003)
-0.040** (0.003)
-0.004** (0.003)
-0.038** (0.003)
-0.040** (0.003)
Tenure 0.019** (0.002)
0.015** (0.001)
0.015** (0.002)
0.014** (0.001)
0.014** (0.001)
Tenure2/100 -0.021** (0.005)
-0.021** (0.004)
-0.022** (0.004)
-0.021** (0.004)
-0.021** (0.004)
Establishment Characteristics:
S2
0.163** (0.012)
0.115** (0.013)
0.121** (0.013)
S3
0.256** (0.018)
0.182** (0.017)
0.162** (0.016)
e2
0.413** (0.049)
0.395** (0.045)
MN 0.086**
(0.012) 0.092** (0.013)
ME 0.161**
(0.028) 0.150** (0.021)
MW 0.164**
(0.024) 0.158** (0.024)
Dummies for industry No No No Yes _ Establishment Fixed Effects No No No No Yes
Adjusted R2 0.404 0.446 0.474 0.496 0.724 Notes: the left-hand-side variable is the log of the hourly wage. All columns correspond to the same models in Table 3, except that we now use dummies for broad categories of education (HS corresponds to completed secondary studies, and U to a college degree) instead of years of schooling to control for employee’s education; and that we use the fraction of co-workers with a college degree (e2) instead of co-workers’ average years of schooling. See the notes in Table 3. ** means significant at 1 percent; and * at 10 percent.
30
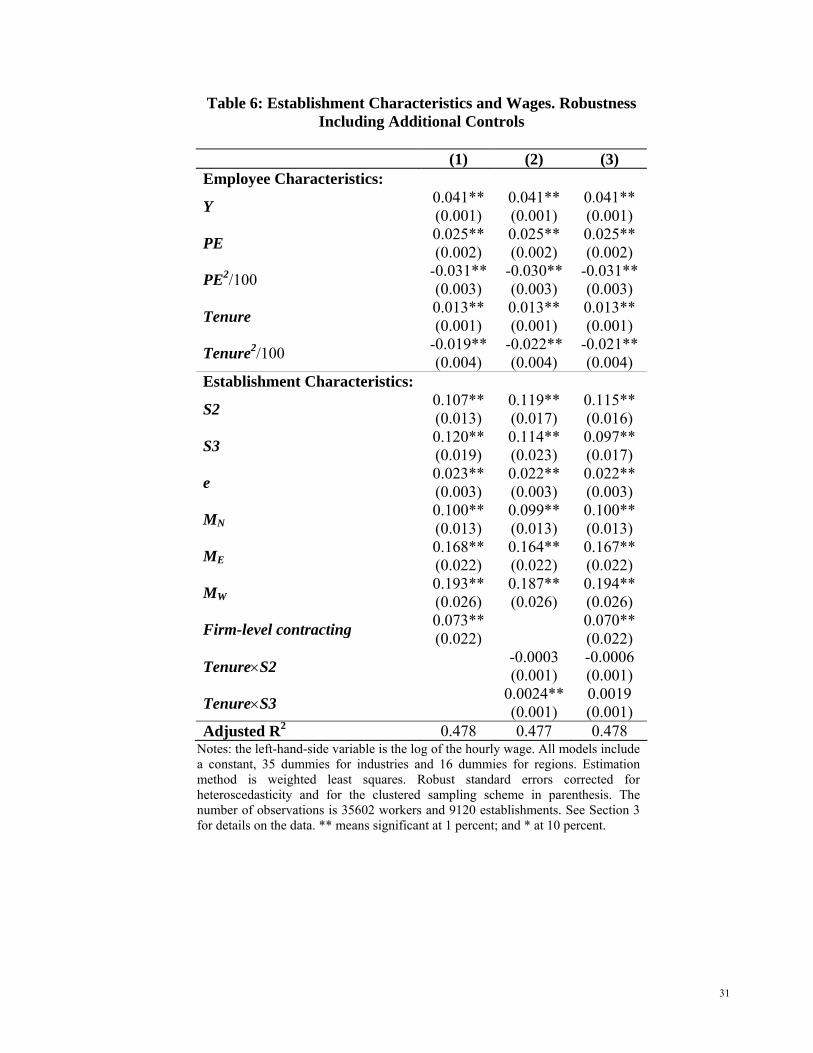
Table 6: Establishment Characteristics and Wages. Robustness
Including Additional Controls
(1) (2) (3) Employee Characteristics:
Y 0.041** (0.001)
0.041** (0.001)
0.041** (0.001)
PE 0.025** (0.002)
0.025** (0.002)
0.025** (0.002)
PE2/100 -0.031** (0.003)
-0.030** (0.003)
-0.031** (0.003)
Tenure 0.013** (0.001)
0.013** (0.001)
0.013** (0.001)
Tenure2/100 -0.019** (0.004)
-0.022** (0.004)
-0.021** (0.004)
Establishment Characteristics:
S2 0.107** (0.013)
0.119** (0.017)
0.115** (0.016)
S3 0.120** (0.019)
0.114** (0.023)
0.097** (0.017)
e 0.023** (0.003)
0.022** (0.003)
0.022** (0.003)
MN0.100** (0.013)
0.099** (0.013)
0.100** (0.013)
ME0.168** (0.022)
0.164** (0.022)
0.167** (0.022)
MW0.193** (0.026)
0.187** (0.026)
0.194** (0.026)
Firm-level contracting 0.073** (0.022) 0.070**
(0.022)
Tenure×S2 -0.0003 (0.001)
-0.0006 (0.001)
Tenure×S3 0.0024** (0.001)
0.0019 (0.001)
Adjusted R2 0.478 0.477 0.478 Notes: the left-hand-side variable is the log of the hourly wage. All models include a constant, 35 dummies for industries and 16 dummies for regions. Estimation method is weighted least squares. Robust standard errors corrected for heteroscedasticity and for the clustered sampling scheme in parenthesis. The number of observations is 35602 workers and 9120 establishments. See Section 3 for details on the data. ** means significant at 1 percent; and * at 10 percent.
31
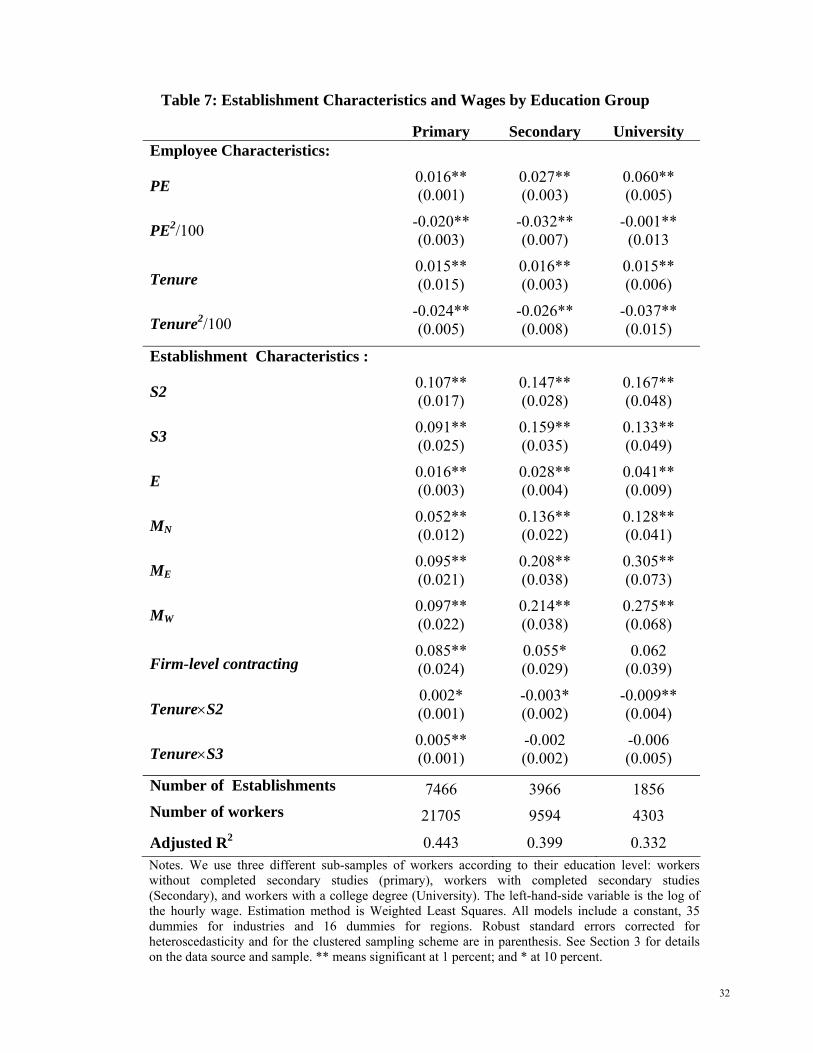
Table 7: Establishment Characteristics and Wages by Education Group
Notes. We use three different sub-samples of workers according to their education level: workers without completed secondary studies (primary), workers with completed secondary studies (Secondary), and workers with a college degree (University). The left-hand-side variable is the log of the hourly wage. Estimation method is Weighted Least Squares. All models include a constant, 35 dummies for industries and 16 dummies for regions. Robust standard errors corrected for heteroscedasticity and for the clustered sampling scheme are in parenthesis. See Section 3 for details on the data source and sample. ** means significant at 1 percent; and * at 10 percent.
Primary Secondary University Employee Characteristics:
PE 0.016** (0.001)
0.027** (0.003)
0.060** (0.005)
PE2/100 -0.020** (0.003)
-0.032** (0.007)
-0.001** (0.013
Tenure 0.015** (0.015)
0.016** (0.003)
0.015** (0.006)
Tenure2/100 -0.024** (0.005)
-0.026** (0.008)
-0.037** (0.015)
Establishment Characteristics :
S2 0.107** (0.017)
0.147** (0.028)
0.167** (0.048)
S3 0.091** (0.025)
0.159** (0.035)
0.133** (0.049)
E 0.016** (0.003)
0.028** (0.004)
0.041** (0.009)
MN0.052** (0.012)
0.136** (0.022)
0.128** (0.041)
ME0.095** (0.021)
0.208** (0.038)
0.305** (0.073)
MW0.097** (0.022)
0.214** (0.038)
0.275** (0.068)
Firm-level contracting 0.085** (0.024)
0.055* (0.029)
0.062 (0.039)
Tenure×S2 0.002* (0.001)
-0.003* (0.002)
-0.009** (0.004)
Tenure×S3 0.005** (0.001)
-0.002 (0.002)
-0.006 (0.005)
Number of Establishments 7466 3966 1856 Number of workers 21705 9594 4303
Adjusted R2 0.443 0.399 0.332
32