Chemical Characterization of Ambient Pm10 Aerosol in a Steel City, Rourkela, India
7
Research Journal of Recent Sciences _________________________________________________ ISSN 2277-2502 Vol. 2(1), 32-38, January (2013) Res.J.Recent Sci. International Science Congress Association 32 Chemical Characterization of Ambient Pm 10 Aerosol in a Steel City, Rourkela, India Kavuri N.C. and Paul K.K. Department of Civil Engineering, National Institue of Technology, Roukela-769008, Odisha, INDIA Available online at: www.isca.in Received 3 rd October 2012, revised 5 th November 2012, accepted 20 th November 2012 Abstract A comprehensive study for ambient particulate air pollution was carried out between January 2011 and December 2011 in a steel city, Rourkela to investigate the PM 10 aerosol mass concentration and its major metallic and anionic characterization. The 8 hourly average concentration of PM 10 varied from 80.88μg/m 3 to 225.93μg/m 3 . Major heavy metals obtained are iron (102.14 ng/m 3 ), aluminium (50.53 ng/m 3 ) and zinc (41.90 ng/m 3 ), while sulphate (1920 ng/m 3 ) dominates the anionic species. Both heavy metals and anions followed the same seasonal trend as PM 10 showing a lower concentration during summer and monsoon and higher values during winter and spring. These seasonal variations can be explained by the nature of sources, climatic characteristics of the city and anthropogenic activities near monitoring sites. Spearman rank correlation study was performed between PM 10 and its major chemical constituents. Ambient particulate iron of the steel city has obtained inverse spearman rank correlation with Ni, Zn, Cu and Al. Keywords: Aerosol, PM 10 , heavy metals, anions, steel city. Introduction Chronic exposure to air pollutants is a worldwide problem 1 . Air pollution especially those in south and southeast Asia has been of considerable interest from both scientific and regulatory perspectives because of its impact on global atmospheric chemistry, climate change 2,3 , rapid population growth and urbanization 4 . Atmospheric aerosol is termed as tiny liquid or solid particulate matter suspended in the air. Aerosols have received increasing attention due to the roles that they play in environmental processes 2,5 . Atmospheric aerosols play both direct and indirect roles in various atmospheric phenomena 6 . The direct effect includes absorption or scattering of solar irradiance by aerosols while indirect influence modifies the cloud microphysical properties 7 . The scattering type of aerosols incorporating inorganic and organic materials increase the atmospheric albedo resulting decrease in atmospheric irradiance to the earth surface causing cooling effect 8 . The interaction of these aerosols with soil might bring about changes in physical as well as chemical nature of top layer of soil as well as reduce the Air Pollution Tolerance Index (APTI) of plants 9,10 . Aerosols are unique among air contaminants because of their potential complexity in terms of both chemical composition and physical properties 11 . Particulate matter with aerodynamic diameters less than or equal to 10 μm (PM 10 ) have been found to be associated with health problems such as increased in daily mortality and asthma 12,13 . Moreover, atmospheric electric conductivity is reduced in an aerosol polluted atmosphere as compared to that in a clean atmosphere 14 . Several studies have examined the composition and sources of PM 10 aerosols 15,16 . Some of the main constituents of aerosols that can hazardous to health are found to be heavy metals like mercury, lead, nickel etc. Beside industries, other causatives of heavy metals pollution are found to be wastes that are generated by different sections such as e-waste, solid waste in urban areas 17,18 . Researches on aerosols have attained equal importance in recent years due to its impact on the climate and environment. The PM 10 sampling was carried out at three sites in steel city, Rourkela between January 2011 to December 2011 inorder to study the respirable fraction, seasonal effects and their correlation on chemical composition of the aerosols. An effort was made to estimate the aerosol chemical characteristics. The widespread concern of ambient particulate air pollution led the present study to focus on characterization of atmospheric trace metals and soluble ions in aerosols over the Indian steel city. Also, the investigation of aerosol chemistry in the steel city of India to date is limited for PM 10 , more investigation is needed to understand the chemical composition of aerosol. Methodology Study Area: A steel city, Rourkela (22°12' N, 84°54' E) of mean sea level about 219 m is selected as a study area in the present research work. It is located in Sundargarh district of the State of Odisha, India at the heart of a rich mineral belt and surrounded by a range of hills and encircled by rivers. As per 2011 census report of India, population of Rourkela is 6,89,298. It has a tropical climate having average annual rainfall between 160 and 200 mm.
Transcript of Chemical Characterization of Ambient Pm10 Aerosol in a Steel City, Rourkela, India
Research Journal of Recent Sciences _________________________________________________ ISSN 2277-2502
Vol. 2(1), 32-38, January (2013) Res.J.Recent Sci.
International Science Congress Association 32
Chemical Characterization of Ambient Pm10 Aerosol in a Steel City,
Rourkela, India
Kavuri N.C. and Paul K.K.
Department of Civil Engineering, National Institue of Technology, Roukela-769008, Odisha, INDIA
Available online at: www.isca.in Received 3rd October 2012, revised 5th November 2012, accepted 20th November 2012
Abstract
A comprehensive study for ambient particulate air pollution was carried out between January 2011 and December 2011 in a
steel city, Rourkela to investigate the PM10 aerosol mass concentration and its major metallic and anionic characterization.
The 8 hourly average concentration of PM10 varied from 80.88µg/m3 to 225.93µg/m
3. Major heavy metals obtained are iron
(102.14 ng/m3), aluminium (50.53 ng/m
3) and zinc (41.90 ng/m
3), while sulphate (1920 ng/m
3) dominates the anionic species.
Both heavy metals and anions followed the same seasonal trend as PM10 showing a lower concentration during summer and
monsoon and higher values during winter and spring. These seasonal variations can be explained by the nature of sources,
climatic characteristics of the city and anthropogenic activities near monitoring sites. Spearman rank correlation study was
performed between PM10 and its major chemical constituents. Ambient particulate iron of the steel city has obtained inverse
spearman rank correlation with Ni, Zn, Cu and Al.
Keywords: Aerosol, PM10, heavy metals, anions, steel city.
Introduction
Chronic exposure to air pollutants is a worldwide problem1. Air
pollution especially those in south and southeast Asia has been
of considerable interest from both scientific and regulatory
perspectives because of its impact on global atmospheric
chemistry, climate change2,3
, rapid population growth and
urbanization4. Atmospheric aerosol is termed as tiny liquid or
solid particulate matter suspended in the air. Aerosols have
received increasing attention due to the roles that they play in
environmental processes2,5
. Atmospheric aerosols play both
direct and indirect roles in various atmospheric phenomena6.
The direct effect includes absorption or scattering of solar
irradiance by aerosols while indirect influence modifies the
cloud microphysical properties7. The scattering type of aerosols
incorporating inorganic and organic materials increase the
atmospheric albedo resulting decrease in atmospheric irradiance
to the earth surface causing cooling effect8. The interaction of
these aerosols with soil might bring about changes in physical as
well as chemical nature of top layer of soil as well as reduce the
Air Pollution Tolerance Index (APTI) of plants9,10
. Aerosols are
unique among air contaminants because of their potential
complexity in terms of both chemical composition and physical
properties11
.
Particulate matter with aerodynamic diameters less than or equal
to 10 µm (PM10) have been found to be associated with health
problems such as increased in daily mortality and asthma12,13
.
Moreover, atmospheric electric conductivity is reduced in an
aerosol polluted atmosphere as compared to that in a clean
atmosphere14
. Several studies have examined the composition
and sources of PM10 aerosols15,16
. Some of the main constituents
of aerosols that can hazardous to health are found to be heavy
metals like mercury, lead, nickel etc. Beside industries, other
causatives of heavy metals pollution are found to be wastes that
are generated by different sections such as e-waste, solid waste
in urban areas17,18
. Researches on aerosols have attained equal
importance in recent years due to its impact on the climate and
environment.
The PM10 sampling was carried out at three sites in steel city,
Rourkela between January 2011 to December 2011 inorder to
study the respirable fraction, seasonal effects and their
correlation on chemical composition of the aerosols. An effort
was made to estimate the aerosol chemical characteristics.
The widespread concern of ambient particulate air pollution led
the present study to focus on characterization of atmospheric
trace metals and soluble ions in aerosols over the Indian steel
city. Also, the investigation of aerosol chemistry in the steel city
of India to date is limited for PM10, more investigation is needed
to understand the chemical composition of aerosol.
Methodology
Study Area: A steel city, Rourkela (22°12' N, 84°54' E) of
mean sea level about 219 m is selected as a study area in the
present research work. It is located in Sundargarh district of the
State of Odisha, India at the heart of a rich mineral belt and
surrounded by a range of hills and encircled by rivers. As per
2011 census report of India, population of Rourkela is 6,89,298.
It has a tropical climate having average annual rainfall between
160 and 200 mm.

Research Journal of Recent Sciences ______________________________________________________________ ISSN 2277-2502
Vol. 2(1), 32-38, January (2013) Res. J. Recent Sci.
International Science Congress Association 33
Figure-1
Map of study area
Three monitoring sites have been selected for the present
ambient air quality study as shown in figure 1.
Aerosol Sampling: Environmental monitoring and assessment
has become an important part of environmental impact
statement in satisfying the requirements of national
environmental policy act. Variations in ambient air quality data
are caused by changes in the pollutant emission rate, and
meteorological and topographical conditions of the place. Mass
concentration of aerosol is a measure of air quality and aerosol
source strength at a particular location. The radioactive and
other environmental impacts of aerosol strongly depend on their
chemical composition, apart from their size distribution19
. Its
evaluation is the fundamental requirement towards assessment
of the nature and extent of air quality variables. The PM10 is
being monitored in the present study during January 2011 to
December 2011 at Rourkela with the help of a respirable dust
sampler (NETEL, NPM-HVS/R) on the quartz microfiber filter
paper.
Chemical Analysis: The PM10 concentrations were measured
gravimetrically by weighing the particulate mass deposited on
the quartz microfiber filters and calculating the total volume of
air sampled. Filter papers were stored in envelope and kept in
desiccator containing dry silica gel for 24 h before and after the
sample collection20,21
. The amount of air sampled through the
weighted filter paper is recorded and the filters are placed in
appropriately labelled envelope and transported along with
blank filter to the laboratory for analysis. Field and laboratory
blank filter samples were routinely analysed for PM10 to
evaluate analytical bias and precision20
.
After gravimetric analysis, a known portion of the exposed
quartz microfiber filters were digested in HNO3 (nitric acid) and
used for trace metal analysis22
. After digestion a colourless
solution was obtained that was evaporated to dryness. Reagent
blank was also prepared by using unexposed filter following the
same procedure. Cool filtrate was made to a known volume
using freshly prepared distilled water and is analyzed for metal
constituents using Atomic Absorption Spectrophotometer
(Perkin Elmer, AA200) for copper (Cu), chromium (Cr), zinc
(Zn), lead (Pb), potassium (K), magnesium (Mg), nickel (Ni),
and iron (Fe). During sample analysis, standard solution was
repeatedly aspirated to ensure that the calibration was within the
limits of control chart. An intensive quality control program was
implemented to maintain the accuracy and precision throughout
the study. This study also includes the analysis of F- and SO4
2-.
The concentration of F-
was measured by using the Thermo
Scientific Orion 9409BN Half-Cell Fluoride and Orion
9609BNWP combination fluoride electrodes, whereas the
concentration of SO42-
was determined by adding barium
chloride to the solution upon which it gives a thick white
precipitate of barium sulphate which can be measured
spectrophotometrically. Blank samples were also prepared from
the unexposed filter papers in the same procedure as that of
exposed filter samples and analysed for the anionic species.
Data Analysis: Correlation analysis helps in detecting unseen
relationships between different parameters in the data. These
statistical techniques are now being used in wide verity of
applications, even in the detection of earthquakes23
. Statistical
analysis was carried out on PM10 and its characterized metallic
and anionic species. In this study, the Spearman rank correlation
analysis has been performed between measured aerosol and its
metallic and anionic species to investigate the relationships
between them. The Spearman rank correlation coefficient (r)
measures the relationship between two variables, the extent to
Research Journal of Recent Sciences ______________________________________________________________ ISSN 2277-2502
Vol. 2(1), 32-38, January (2013) Res. J. Recent Sci.
International Science Congress Association 34
which one variable increases as the other also increases,
regardless of the numerical size of the increase.
Results and Discussion
The population growth in India with increasing urbanization and
industrialization, the aerosol mass concentration over the Indian
sub-continent is found to increase24
. The knowledge of aerosol
loading is important as it can change the weather and climatic
patterns. In order to understand the aerosol loading, continuous
monitoring for longer duration is required. There is a scarcity of
literature expressing aerosol characterization in Indian steel city
data. The statistical summary of metallic and anionic mass
concentration of PM10 is tabulated and presented in table 1 for
the study period. The 8-hrly average values of PM10 are in the
range of 80.88 µg/m3 to 225.93 µg/m
3 during January 2011 to
December 2011. The occurrence and prevalence of heavy
metallic and anionic contamination have been increased by
anthropogenic activities. In addition to industrial emissions,
large vehicular traffic also contributed to the high level of PM10
aerosol.
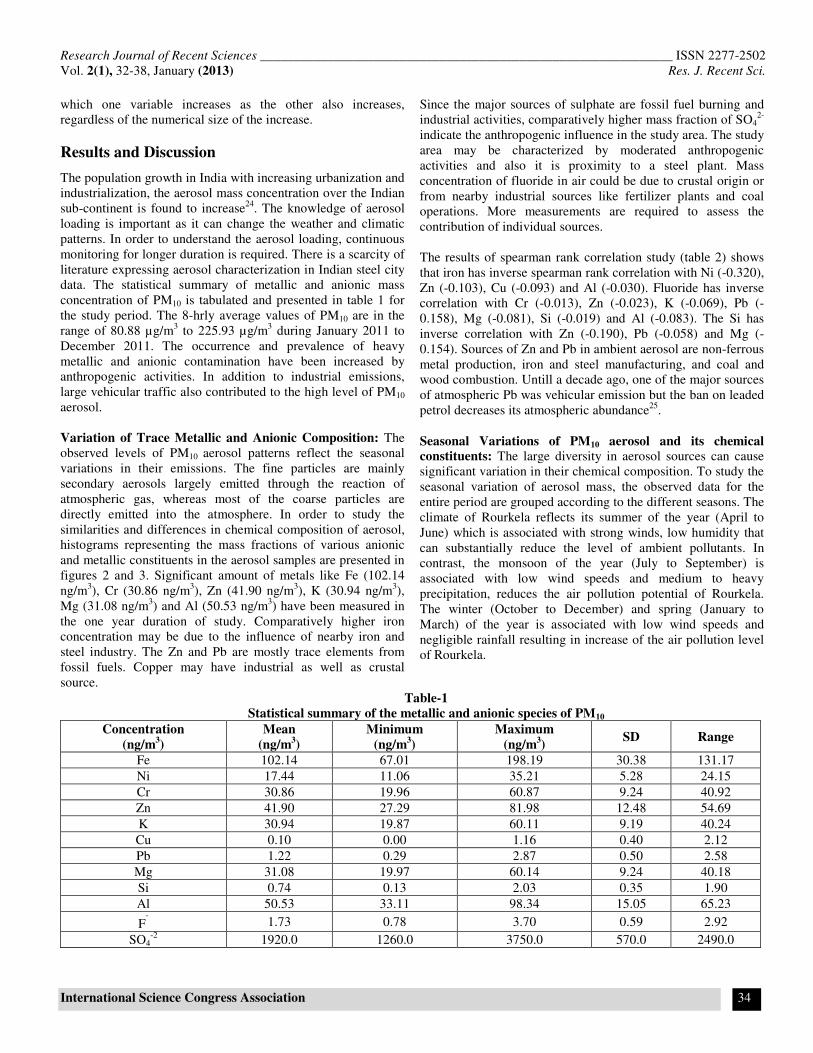
Variation of Trace Metallic and Anionic Composition: The
observed levels of PM10 aerosol patterns reflect the seasonal
variations in their emissions. The fine particles are mainly
secondary aerosols largely emitted through the reaction of
atmospheric gas, whereas most of the coarse particles are
directly emitted into the atmosphere. In order to study the
similarities and differences in chemical composition of aerosol,
histograms representing the mass fractions of various anionic
and metallic constituents in the aerosol samples are presented in
figures 2 and 3. Significant amount of metals like Fe (102.14
ng/m3), Cr (30.86 ng/m
3), Zn (41.90 ng/m
3), K (30.94 ng/m
3),
Mg (31.08 ng/m3) and Al (50.53 ng/m
3) have been measured in
the one year duration of study. Comparatively higher iron
concentration may be due to the influence of nearby iron and
steel industry. The Zn and Pb are mostly trace elements from
fossil fuels. Copper may have industrial as well as crustal
source.
Since the major sources of sulphate are fossil fuel burning and
industrial activities, comparatively higher mass fraction of SO42-
indicate the anthropogenic influence in the study area. The study
area may be characterized by moderated anthropogenic
activities and also it is proximity to a steel plant. Mass
concentration of fluoride in air could be due to crustal origin or
from nearby industrial sources like fertilizer plants and coal
operations. More measurements are required to assess the
contribution of individual sources.
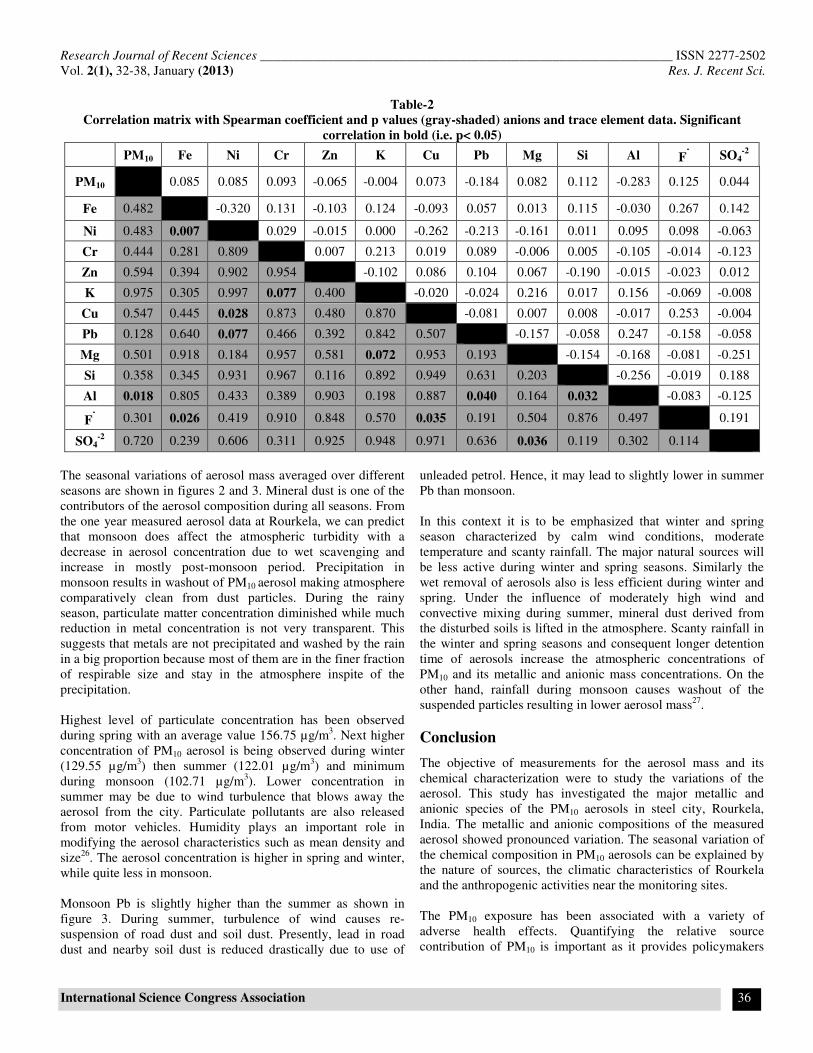
The results of spearman rank correlation study (table 2) shows
that iron has inverse spearman rank correlation with Ni (-0.320),
Zn (-0.103), Cu (-0.093) and Al (-0.030). Fluoride has inverse
correlation with Cr (-0.013), Zn (-0.023), K (-0.069), Pb (-
0.158), Mg (-0.081), Si (-0.019) and Al (-0.083). The Si has
inverse correlation with Zn (-0.190), Pb (-0.058) and Mg (-
0.154). Sources of Zn and Pb in ambient aerosol are non-ferrous
metal production, iron and steel manufacturing, and coal and
wood combustion. Untill a decade ago, one of the major sources
of atmospheric Pb was vehicular emission but the ban on leaded
petrol decreases its atmospheric abundance25
.
Seasonal Variations of PM10 aerosol and its chemical
constituents: The large diversity in aerosol sources can cause
significant variation in their chemical composition. To study the
seasonal variation of aerosol mass, the observed data for the
entire period are grouped according to the different seasons. The
climate of Rourkela reflects its summer of the year (April to
June) which is associated with strong winds, low humidity that
can substantially reduce the level of ambient pollutants. In
contrast, the monsoon of the year (July to September) is
associated with low wind speeds and medium to heavy
precipitation, reduces the air pollution potential of Rourkela.
The winter (October to December) and spring (January to
March) of the year is associated with low wind speeds and
negligible rainfall resulting in increase of the air pollution level
of Rourkela.
Table-1
Statistical summary of the metallic and anionic species of PM10
Concentration
(ng/m3)
Mean
(ng/m3)
Minimum
(ng/m3)
Maximum
(ng/m3)
SD Range
Fe 102.14 67.01 198.19 30.38 131.17
Ni 17.44 11.06 35.21 5.28 24.15
Cr 30.86 19.96 60.87 9.24 40.92
Zn 41.90 27.29 81.98 12.48 54.69
K 30.94 19.87 60.11 9.19 40.24
Cu 0.10 0.00 1.16 0.40 2.12
Pb 1.22 0.29 2.87 0.50 2.58
Mg 31.08 19.97 60.14 9.24 40.18
Si 0.74 0.13 2.03 0.35 1.90
Al 50.53 33.11 98.34 15.05 65.23
F-
1.73 0.78 3.70 0.59 2.92
SO4-2
1920.0 1260.0 3750.0 570.0 2490.0
Research Journal of Recent Sciences ______________________________________________________________ ISSN 2277-2502
Vol. 2(1), 32-38, January (2013) Res. J. Recent Sci.
International Science Congress Association 35
Figure-2
Seasonal variations of heavy metals
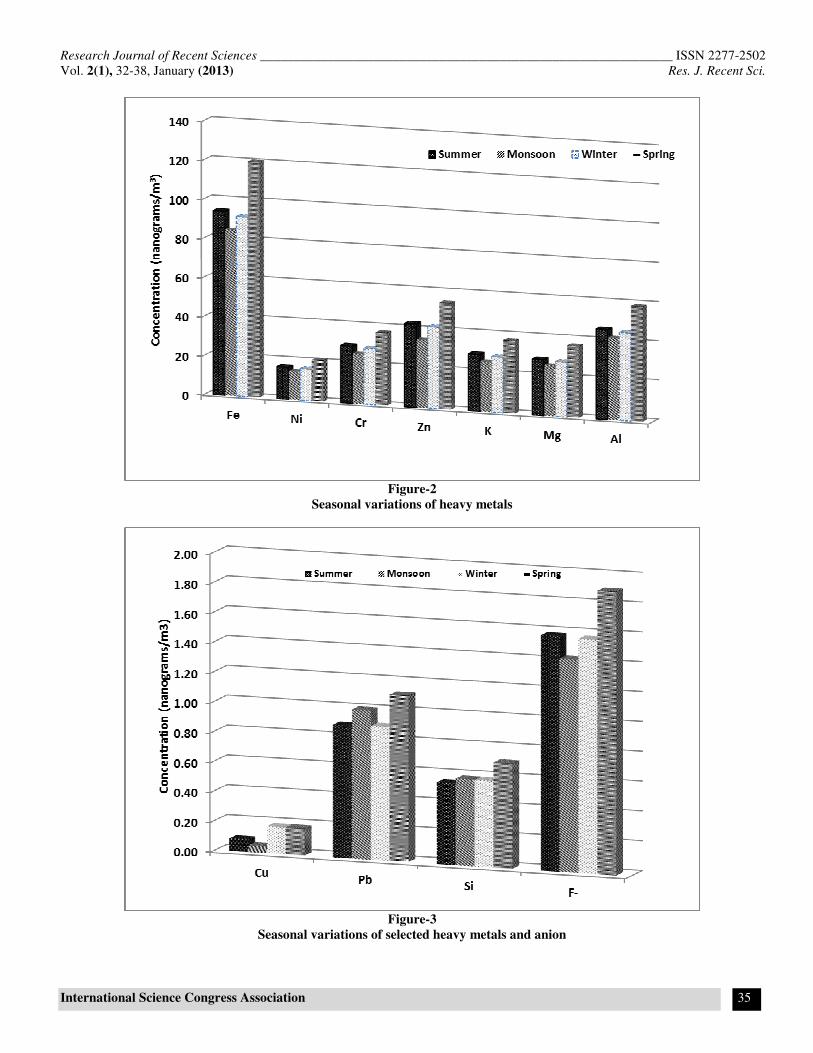
Figure-3
Seasonal variations of selected heavy metals and anion
Research Journal of Recent Sciences ______________________________________________________________ ISSN 2277-2502
Vol. 2(1), 32-38, January (2013) Res. J. Recent Sci.
International Science Congress Association 36
Table-2
Correlation matrix with Spearman coefficient and p values (gray-shaded) anions and trace element data. Significant
correlation in bold (i.e. p< 0.05)
PM10 Fe Ni Cr Zn K Cu Pb Mg Si Al F
-
SO4-2
PM10 0.085 0.085 0.093 -0.065 -0.004 0.073 -0.184 0.082 0.112 -0.283 0.125 0.044
Fe 0.482
-0.320 0.131 -0.103 0.124 -0.093 0.057 0.013 0.115 -0.030 0.267 0.142
Ni 0.483 0.007
0.029 -0.015 0.000 -0.262 -0.213 -0.161 0.011 0.095 0.098 -0.063
Cr 0.444 0.281 0.809
0.007 0.213 0.019 0.089 -0.006 0.005 -0.105 -0.014 -0.123
Zn 0.594 0.394 0.902 0.954
-0.102 0.086 0.104 0.067 -0.190 -0.015 -0.023 0.012
K 0.975 0.305 0.997 0.077 0.400
-0.020 -0.024 0.216 0.017 0.156 -0.069 -0.008
Cu 0.547 0.445 0.028 0.873 0.480 0.870
-0.081 0.007 0.008 -0.017 0.253 -0.004
Pb 0.128 0.640 0.077 0.466 0.392 0.842 0.507
-0.157 -0.058 0.247 -0.158 -0.058
Mg 0.501 0.918 0.184 0.957 0.581 0.072 0.953 0.193
-0.154 -0.168 -0.081 -0.251
Si 0.358 0.345 0.931 0.967 0.116 0.892 0.949 0.631 0.203
-0.256 -0.019 0.188
Al 0.018 0.805 0.433 0.389 0.903 0.198 0.887 0.040 0.164 0.032
-0.083 -0.125
F-
0.301 0.026 0.419 0.910 0.848 0.570 0.035 0.191 0.504 0.876 0.497
0.191
SO4-2
0.720 0.239 0.606 0.311 0.925 0.948 0.971 0.636 0.036 0.119 0.302 0.114
The seasonal variations of aerosol mass averaged over different
seasons are shown in figures 2 and 3. Mineral dust is one of the
contributors of the aerosol composition during all seasons. From
the one year measured aerosol data at Rourkela, we can predict
that monsoon does affect the atmospheric turbidity with a
decrease in aerosol concentration due to wet scavenging and
increase in mostly post-monsoon period. Precipitation in
monsoon results in washout of PM10 aerosol making atmosphere
comparatively clean from dust particles. During the rainy
season, particulate matter concentration diminished while much
reduction in metal concentration is not very transparent. This
suggests that metals are not precipitated and washed by the rain
in a big proportion because most of them are in the finer fraction
of respirable size and stay in the atmosphere inspite of the
precipitation.
Highest level of particulate concentration has been observed
during spring with an average value 156.75 µg/m3. Next higher
concentration of PM10 aerosol is being observed during winter
(129.55 µg/m3) then summer (122.01 µg/m
3) and minimum
during monsoon (102.71 µg/m3). Lower concentration in
summer may be due to wind turbulence that blows away the
aerosol from the city. Particulate pollutants are also released
from motor vehicles. Humidity plays an important role in
modifying the aerosol characteristics such as mean density and
size26
. The aerosol concentration is higher in spring and winter,
while quite less in monsoon.
Monsoon Pb is slightly higher than the summer as shown in
figure 3. During summer, turbulence of wind causes re-
suspension of road dust and soil dust. Presently, lead in road
dust and nearby soil dust is reduced drastically due to use of
unleaded petrol. Hence, it may lead to slightly lower in summer
Pb than monsoon.
In this context it is to be emphasized that winter and spring
season characterized by calm wind conditions, moderate
temperature and scanty rainfall. The major natural sources will
be less active during winter and spring seasons. Similarly the
wet removal of aerosols also is less efficient during winter and
spring. Under the influence of moderately high wind and
convective mixing during summer, mineral dust derived from
the disturbed soils is lifted in the atmosphere. Scanty rainfall in
the winter and spring seasons and consequent longer detention
time of aerosols increase the atmospheric concentrations of
PM10 and its metallic and anionic mass concentrations. On the
other hand, rainfall during monsoon causes washout of the
suspended particles resulting in lower aerosol mass27
.
Conclusion
The objective of measurements for the aerosol mass and its
chemical characterization were to study the variations of the
aerosol. This study has investigated the major metallic and
anionic species of the PM10 aerosols in steel city, Rourkela,
India. The metallic and anionic compositions of the measured
aerosol showed pronounced variation. The seasonal variation of
the chemical composition in PM10 aerosols can be explained by
the nature of sources, the climatic characteristics of Rourkela
and the anthropogenic activities near the monitoring sites.
The PM10 exposure has been associated with a variety of
adverse health effects. Quantifying the relative source
contribution of PM10 is important as it provides policymakers
Research Journal of Recent Sciences ______________________________________________________________ ISSN 2277-2502
Vol. 2(1), 32-38, January (2013) Res. J. Recent Sci.
International Science Congress Association 37
critical information needed to formulate successful pollution
reduction programs. The measured metallic and anionic
components in the PM10 aerosols could be attributed to crustal
and anthropogenic activities. There is a need for better
understanding of aerosol distribution and require source
apportionment to have an idea of the various sources and their
contribution.
Acknowledgment
Authors acknowledge Department of Science and Technology
(DST), Government of India, New Delhi for sponsoring and
funding this study as Fast Track Scheme for Young Scientist.
References
1. Seangkiatiyuth K., Surapipith V., Tantrakarnapa, K. and
Lothongkum A.W., Application of the AERMOD modeling
system for environmental impact assessment of NO2
emissions from a cement complex, J. Environ. Sci., 23,
931–940 (2011)
2. Bellouin N., Boucher O., Haywood J. and Reddy M.S.,
Global estimate of aerosol direct radiative forcing from
satellite measurements, Nature, 438(7071), 1138-1141
(2005)
3. Lelieveld J., Crutzen P., Ramanathan V., Andreae M.O.,
Brenninkmeijer C.A.M., Campos T., Cass G.R., Dickerson
R.R., Fischer H., de Gouw J.A., Hansel A., Jefferson A.,
Kley D., de Laat A.T.J., Lal S., Lawrence M.G., Lobert
J.M., Mayol-Bracero O., Mitra A.P., Novakov T., Oltmans
S.J., Prather K.A., Reiner T., Rodhe H., Scheeren H.A.,
Sikka D. and Williams J., The Indian Ocean experiment:
widespread air pollution from South and Southeast Asia,
Science, 291, 1031-1036 (2001)
4. Lawrence M.G. and Lelieveld J., Atmospheric pollutant
outflow from southern Asia: a review, Atmos.Chem. Phys.,
10, 11017-11096 (2010)
5. Buseck P.R., Jacob D.J., Posfai M., Li J. and Anderson
J.R., Minerals in the air: an environmental perspective, Int.
Geol. Rev., 42(7), 577-593 (2000)
6. Charlson R.J., Schwartz S.E., Hales J.M., Cess R.D.,
Coakley J.A., Hansen J.E. and Holmann D.J., Climate
forcing by anthropogenic aerosols, Science, 255, 423-430
(1992)
7. Toon B.D., How pollution suppress rain, Science, 287,
1763-1764 (2000)
8. Das N., Baral S.S., Sahoo S.K., Mohapatra R.K., Ramulu
T.S., Das S.N. and Chaudhury G.R., Aerosol physical
characteristics at Bhubaneswar, East coast of India, Atmos.
Res., 93, 897-901 (2009)
9. Srivastava K.P. and Singh V.K., Impact of Air-Pollution on
pH of soil of Saran, Bihar, India, Res.J.Recent Sci., 1(4), 9-
13 (2012)
10. Chouhan A., Iqbal S., Maheshwari R.S. and Bafna A.,
Study of air pollution tolerance Index of plants growing in
Pithampur Industrial area sector 1, 2 and 3, Res.J.Recent
Sci., 1(ISC-2011), 172-177 (2012)
11. Balasubramanian R., Qian W., Decesari S., Facchini M.C.
and Fuzzi S., Comprehensive characterization of PM2.5
aerosols in Singapore, J. Geophys. Res., 108 (D16), 4523-
4540 (2003)
12. Dockery D.W. and Pope C.A., Acute respiratory effects of
particulate air pollution, Annu. Rev. Publ. Health., 15, 107-
132 (1994)
13. Anderson K.R., Avol E.L., Edwards S.A., Shamoo D.A.,
Peng R.C., Linn W.S. and Hackney J.D., Controlled
exposures of volunteers to respirable carbon and sulphuric
acid aerosols, J. Air. Waste. Manage, 42, 771-776 (1992)
14. Deshpande C.G. and Kamra A.K., Extension of
Atmospheric Aerosols Over Ocean Around Peninsular
India In The Southwest Monsoon Season, J. Aerosol. Sci.,
26, 1169-1174 (1995)
15. Chow J.C., Watson J.G., Fujita E.M., Lu Z. and Lawson
D.R., Temporal and spatial variations of PM2.5 and PM10
aerosol in the Southern California Air Quality Study,
Atmos. Environ., 28, 2061-2080 (1994)
16. Thurston G.D. and Spengler J.D., A quantitative assessment
of source contributions to inhalable particulate matter
pollution in metropolitan Boston, Atmos. Environ., 19(1),
9-25 (1985)
17. Sharma P., Fulekar M.H. and Pathak B., E-Waste- A
Challenge for Tomorrow, Res.J.Recent Sci., 1(3), 86-93,
(2012)
18. Mane T.T. and Hingane H.N., Existing Situation of Solid
Waste Management in Pune City, India, Res.J.Recent Sci.,
1 (ISC-2011), 348-351 (2012)
19. Nair P.R., Rajan R., Parameswaran K., Abraham A. and
Jacob S., Chemical composition of aerosol particles over
the Arabian Sea and Indian Ocean regions during the
INDOEX (FFP-98) cruise—preliminary results, Curr. Sci.
India, 80, 171-175 (2001)
20. Karar K., Gupta A.K., Kumar A. and Biswas A.K.,
Characterization and identification of the sources of
chromium, zinc, lead, cadmium, nickel, manganese and
iron in PM10 particulates at the two sites of Kolkata, India,
Environ. Monit. Assess., 120(1-3), 347-360 (2006)
21. Karar K. and Gupta A.K., Seasonal variations and chemical
characterization of ambient PM10 at residential and
industrial sites of an urban region of Kolkata (Calcutta),
India, Atmos. Res., 81, 36-53 (2006).
22. Katz M. et al (Eds), Methods of Air Sampling and
Analyses, 2nd Edition, American Public Health
Association, Washington DC, (1977)
Research Journal of Recent Sciences ______________________________________________________________ ISSN 2277-2502
Vol. 2(1), 32-38, January (2013) Res. J. Recent Sci.
International Science Congress Association 38
23. Gwal A.K., Jain S., Panda G., Gujar Y.S., Raghuwanshi S.
and Vijay S.K., Study of Ionospheric Perturbations during
Strong Seismic Activity by Correlation Technique using
NmF2 Data, Res.J.Recent Sci., 1(1), 2-9 (2012)
24. Singh R.P., Dey S., Tripathi S.N., Tare V. and Holben B.,
Variability of aerosol parameters over Kanpur, northern
India, J. Geophys. Res., 109(D23206), 1-14 (2004)
25. Rastogi N. and Sarin M.M., Quantitative chemical
composition and characteristics of aerosols over western
India: one-year record of temporal variability, Atmos.
Environ., 43, 3481-3488 (2009)
26. Suresh T. and Desa E., Seasonal variations of aerosol over
Dona Paula a coastal site on the west coast of India, Atmos.
Environ., 39(19), 3471-3473 ( 2005)
27. Vinoj V., Satheesh S.K., Babu S.S. and Moorthy K.K.,
Large aerosol optical depths observed at an urban location
in southern India associated with rain-deficit summer
monsoon season, Ann. Geophys., 22, 3073-3077 (2004)