flaw-crooks-fluctuation-theorem-ecs-18-104.pdf - Edelweiss ...
Advances insuperresolutionoptical fluctuationimaging (SOFI)
Thomas Dertinger1*, Alessia Pallaoro2, Gary Braun2, Sonny Ly3,Ted A. Laurence3 and Shimon Weiss1,4,5*1 Department of Chemistry and Biochemistry, University of California Los Angeles, Los Angeles, CA 90095, USA2Department of Chemistry and Biochemistry, University of California, Santa Barbara, CA 93106, USA3 Lawrence Livermore National Laboratory, Livermore, CA 94550, USA4Department of Physiology University of California Los Angeles, UCLA, Los Angeles, USA5California NanoSystems Institute University of California Los Angeles, UCLA, Los Angeles, USA
Abstract. We review the concept of superresolution optical fluctuation imaging (SOFI),discuss its attributes and trade-offs (in comparison with other superresolution methods), andpresent superresolved images taken on samples stained with quantum dots, organic dyes, andplasmonic metal nanoparticles. We also discuss the prospects of SOFI for live cellsuperresolution imaging and for imaging with other (non-fluorescent) contrasts.
1. Introduction to superresolution 1
2. Superresolution optical fluctuation imaging 4
3. SOFI theory 5
4. Applications 7
4.1. SOFI using various optical platforms 7
4.2. SOFI with plasmonic metal nanoparticles 7
4.3. SOFI with organic dyes 9
5. Discussion 9
6. Conclusion 10
7. Acknowledgements 11
8. References 11
1. Introduction to superresolution
Fluorescence microscopy has contributed significantly to almost all areas of science. The use of
fluorescence in microscopy applications offers chemically specific labeling and straightforward
acquisition of high-contrast images. Specifically, the non-invasiveness of fluorescence
microscopy made it a popular tool among biologists and medical scientists. With the emergence
* Authors for Correspondence : Shimon Weiss, 607 Charles E. Young Drive East, Los Angeles, CA
90095-1569, USA. Email : [email protected] and Thomas Dertinger, Dresdener Str. 14, 10999 Berlin,
Germany. Email : [email protected]
Quarterly Reviews of Biophysics, Page 1 of 12. f Cambridge University Press 2013 1doi:10.1017/S0033583513000036 Printed in the United States of America

of superresolution microscopy in the last decade, it seems that the last obstacle in optical
microscopy has been overcome, namely the diffraction limit. As all electromagnetic waves are
prone to diffraction, a fundamental limit is given regarding the smallest structure that can still be
resolved with light using far-field optics. This diffraction barrier has been described by Ernst
Abbe in 1873 (Abbe, 1873). He was the first to connect the resolution capabilities of a micro-
scope with the wavelength of light and the numerical aperture of the microscope. It took until
1994 when Hell and Wichmann published a theoretical paper, proposing how to overcome the
diffraction limit in far-field optics (Hell & Wichmann, 1994). The paper described a modified
laser-scanning confocal microscope that exploited the quantum nature of the transition from
the fluorescent (‘on ’) to the non-fluorescent (‘off ’) state of fluorescent molecules to carve-out
a smaller point-spread-function (PSF) than the one supported by the diffraction limit. They
also argued in this paper that the resolution enhancement over the diffraction barrier could in
principle be unlimited.
By 1999/2000 Klar and Hell have managed to implement this concept in the laboratory and
demonstrate far-field superresolution (Klar, 2000 ; Klar & Hell, 1999). This was no small feat.
The paradigm-shifting concept did not go unnoticed. In a commentary to the 2000 PNAS paper,
we wrote : ‘The work by Klar et al. has the potential to transform the fluorescence microscopy
‘Renaissance ’ we are currently experiencing into an ‘Enlightenment Millennium. ’ Our percep-
tion of the ideas put forward by Abbe over a century ago will certainly be transformed. The
powerful concept of wedding nonlinear microscopies with tailored fluorophores ’ photophysical
properties will continue to produce innovative methodologies and open novel windows into
cellular dynamics. The few predictions listed above are only a small subset of what is to follow,
and this beautiful story is not going to end here : the technique has even more to offer beyond
live-cell imaging and biology. Spatial and temporal manipulations of the amplitude and phase of
short pulses could provide coherent control of chemical reactions on the nanometer scale. Such
capabilities could find uses, for example, in controlling photoresist chemistry for ultrahigh-
resolution lithography, electrooptics, and magnetooptics data storage and many other nano-
technology applications. Keep your eyes open ! ’ (Weiss, 2000).
In retrospect, our predictions were not too far off. Once the general idea took hold that the
classical resolution limit can be broken, a whole suite of alternative superresolution techniques
rapidly evolved, which were, however, all based on the very same ‘on’/‘off’ concept [for which
Hell later coined the term superresolution microscopy via REversible Saturable OpticaL
Fluorescence Transitions (RESOLFT)].
Today, all ‘ true ’ superresolution microscopy techniques (i.e. techniques which rely on the
‘on’/‘off’ properties of the label) can be roughly divided into two classes : methods like
STimulated Emission Depletion (STED) microscopy, which essentially is carving-out a smaller
effective PSF from a densely labeled region by turning ‘off’ a sub-population of fluorescent
molecules at the PSF’s rim, and methods based on the accurate localization of single molecules,
by turning ‘on’ a very small sub-population of fluorescent molecules per movie frame. The latter
class comprises methods such as Photo-Activated Localization Microscopy (PALM) (Betzig et al.
2006), or Stochastic Optical Reconstruction Microscopy (STORM) (Rust et al. 2006) and variants
thereof, such as Ground State Depletion Imaging (GSDIM) (Folling et al. 2008) and direct
STORM (dSTORM) (Heilemann et al. 2008). This class we will refer to as single-molecule
localization techniques (SML).
A notable exception from the dependence of the photophysics of the label is structured
illumination SIM (Gustafsson, 2000). However, SIM is limited to a resolution enhancement of
2 T. Dertinger et al.

maximum a factor of two, and despite it is commonly seen as a superresolution technique, it
remains the regime of linear wave optics. In this review we will not focus on this technology.
Spectacular results have been published and seemingly no task is too difficult for super-
resolution imaging. Superresolution at 60 Hz has been demonstrated on cultured neurons
resolving vesicle diffusion inside the synaptic gap (Westphal et al. 2008). A proof-of-concept for
the unlimited resolution capability of STED has been given by squeezing the resolution down to
6 nm (Rittweger et al. 2009). At the same time, SML methods have achieved very impressive
results, such as the elucidation of the previously unknown organization of the integrin-based
cell-adhesion complexes (Kanchanawong et al. 2010).
It is quite clear that superresolution microscopy will significantly contribute to future appli-
cations and insight of biological problems, which could not be addressed using conventional
microscopy. At the same time, we should all be fully aware that superresolution microscopy
comes with real costs, penalties and trade-offs.
Besides the monetary aspect (early commercial SR instruments are expensive !),
superresolution imaging methods have their inherent drawbacks and challenges. For example,
the extreme high light intensity levels required in STED microscopy for efficiently de-exciting
fluorescent molecules may often exceed the tolerance level of living specimens, leading to the
build-up of phototoxic products and eventually cell death. In contrast, SML methods usually
require much lower light intensities but require long acquisition times that limit their ability to
capture live cell dynamics (van de Linde et al. 2010). Furthermore, to be able to perform a
superresolution measurement using SML, one needs a single-molecule sensitive detector and of
course the expertise to work in the single-molecule regime, which by far are not common
knowledge. Also, problems arising from refractive index changes inside the sample are affecting
the alignment and imaging properties of a superresolution setup, much more so than on a
conventional imaging platform. For example, in the STED case, a refractive index mismatch
might lead to an incomplete depletion of the fluorescent molecules, therefore, reducing the
resolution. Aberrations of all kinds are problematic for both STED and SML methods.
Recognizing these, Janelia farm scientists are currently working on adaptive optics solutions for
aberration correction (Ji et al. 2010) and for light scattering in tissue (unpublished). They are also
working on novel schemes to minimize light exposure and unnecessary bleaching (Planchon et al.
2011). Another problem that is hard to address in SML methods is how to discern underlying
cellular dynamics which is faster than the temporal resolution of these methods. SML methods
deliver sharp images, but whether these represent anything but artifacts remains in the hands of
the expert experimenter. A priori knowledge of the sample, its dynamics, label density, and
morphology of the labeled organelle/cellular structure are essential for correct interpretation of
the data. Last but not least, superresolution requires specific probes, or to be more accurate
specific probe properties. There is already a considerable body of work that point out to the
potential problems and proposals for their solutions (Hotta et al. ; Lee et al. 2010 ; Wolter et al.
2011). Nonetheless, when compared with conventional fluorescence microscopy, super-
resolution techniques remain very challenging to the non-experts. As each method has its own
specific attributes and drawbacks, it might prove useful to have a whole suit of superresolution
methods at hand, enabling the experimenter to choose a method that best fits his specific
application.
The strength of conventional fluorescence imaging lies in its ability to monitor live cells and
the underlying dynamics. The hope is, of course, that superresolution fluorescence imaging could
do the same. This, however, is a very challenging task. Many live cell dynamical phenomena are
Advances in SOFI 3

fast. Even ‘slow’ diffusion processes turn out to be very fast on a small scale. In general, shorter
acquisition times require from the fluorophores to emit more photons within a shorter period of
time. For SML-based methods, this requirement is difficult to satisfy, since at the same time most
fluorophores need to be in the ‘off’ state. Despite these limitations, several live cells super-
resolution imaging results have been published (Biteen et al. 2008 ; Klein et al. 2011 ; Lee et al.
2010 ; Wombacher et al. 2010). Most recently, live cells SML imaging has been achieved with sub-
second acquisition times (Jones et al. 2011).
Due to the limitations discussed above, it might be necessary to trade-off speed with (super)
resolution. The question that we would like to address then is, what is the optimal trade-off?
Below we introduce the concept of superresolution optical fluctuation imaging (SOFI) and argue
that it offers a very favorable trade-off for live-cell imaging. In Section (2) we introduce the SOFI
concept, in Section (3) the theory behind it, in Section (4) we show applications of SOFI using
various imaging platforms and different types of probes. In Section (5) we discuss the prospects
of SOFI and its future developments, and give conclusion in Section (6).
2. Superresolution optical fluctuation imaging
We have been pursuing an approach to superresolution imaging that utilizes an alternative
strategy. Rather than simultaneously or sequentially switching the molecules, we derive super-
resolved information from temporal, stochastic ‘on ’ and ‘off’ fluorescence dynamics (‘blinking ’)
or any other stochastic fluctuation. The core idea behind SOFI is to find a way that blindly
disentangles fluorescence (and possibly even non-fluorescent) fluctuations stemming from
individual molecules. In this context it is important to note that fluorescence fluctuations can be
understood in the most general way. A fluctuation arising from any fluorescence property might
be used for SOFI, as long as it can be recorded. This could be polarization changes, color
changes, or simply a bright and a dim fluorescent state or any combination thereof. The key to
resolution enhancement by SOFI is that any fluorescent molecule does not interact with its
neighbors – i.e. emitters fluctuate stochastically and independently of each other. This seems to
be a natural assumption for labeling densities that are more dilute than the FRET and Dexter
regimes (the average distance between probes is>10 nm). This assumption is a key requirement
for SOFI ; any synchronization or coupling of fluctuations (by external fields or by interactions
with neighbors) would compromise the SOFI approach.
A straightforward measure of independently fluctuating stochastic signals is the correlation
function. Intuitively, it is clear that a single fluctuating emitter will give rise to a highly correlated
signal, whereas a mixed signal, composed of a superposition of signals coming from two or more
independent emitters, will be less correlated. Moreover, when correlating the fluctuations of a
signal (as opposed to measuring its amplitude), a non-correlated signal will yield a zero value,
while any residual correlation will yield a positive value. The key feature of the correlation
function, which is the linchpin of SOFI, is its nonlinearity (with respect to its arguments).
This nonlinearity emphasizes strong, ‘pure ’ (correlated) contributions and diminishes ‘mixed ’
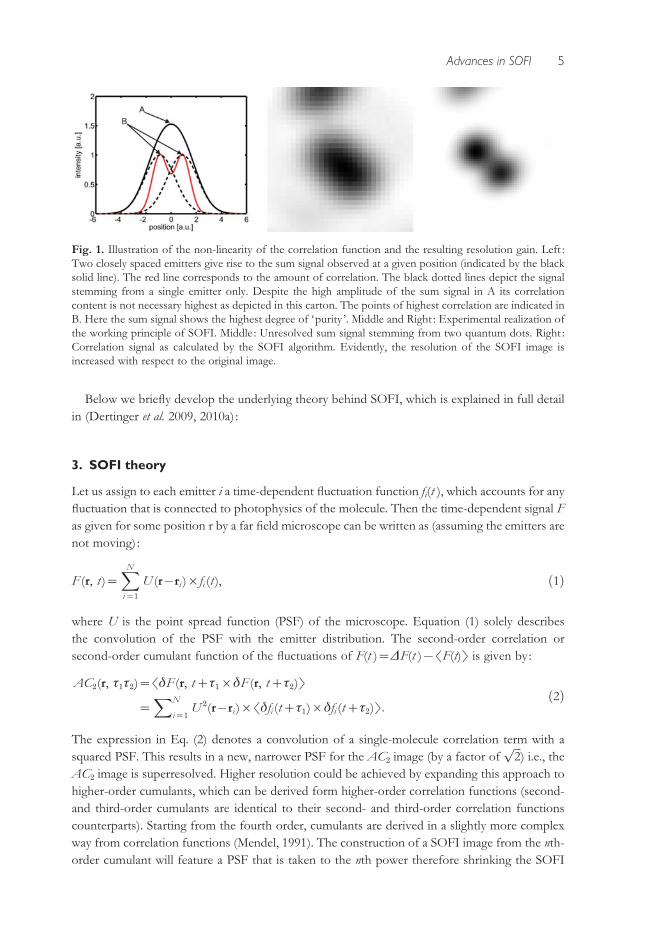
(uncorrelated) contributions, as illustrated in Fig. 1. The basic procedure for acquiring a SOFI
image therefore consists of recording a movie (capturing the probes ’ fluctuations) and subjecting
it to a simple correlation analysis. A specific realization of SOFI therefore could be the exploi-
tation of the antibunching term in the correlation function of light emitting probes as has been
recently suggested (Schwartz & Oron, 2012).
4 T. Dertinger et al.
Below we briefly develop the underlying theory behind SOFI, which is explained in full detail
in (Dertinger et al. 2009, 2010a) :
3. SOFI theory
Let us assign to each emitter i a time-dependent fluctuation function fi(t ), which accounts for any
fluctuation that is connected to photophysics of the molecule. Then the time-dependent signal F
as given for some position r by a far field microscope can be written as (assuming the emitters are
not moving) :
F (r, t )=XN
i=1
U (rxri )rfi (t ), ð1Þ
where U is the point spread function (PSF) of the microscope. Equation (1) solely describes
the convolution of the PSF with the emitter distribution. The second-order correlation or
second-order cumulant function of the fluctuations of F(t )=DF(t )xnF(t)m is given by :
AC2(r, t1t2)=ndF (r, t+t1rdF (r, t+t2)m
=XN
i=1U 2(rxri )rndfi (t+t1)rdfi (t+t2)m:
ð2Þ
The expression in Eq. (2) denotes a convolution of a single-molecule correlation term with a
squared PSF. This results in a new, narrower PSF for the AC2 image (by a factor offfiffiffi2
p) i.e., the
AC2 image is superresolved. Higher resolution could be achieved by expanding this approach to
higher-order cumulants, which can be derived form higher-order correlation functions (second-
and third-order cumulants are identical to their second- and third-order correlation functions
counterparts). Starting from the fourth order, cumulants are derived in a slightly more complex
way from correlation functions (Mendel, 1991). The construction of a SOFI image from the nth-
order cumulant will feature a PSF that is taken to the nth power therefore shrinking the SOFI
Fig. 1. Illustration of the non-linearity of the correlation function and the resulting resolution gain. Left :
Two closely spaced emitters give rise to the sum signal observed at a given position (indicated by the black
solid line). The red line corresponds to the amount of correlation. The black dotted lines depict the signal
stemming from a single emitter only. Despite the high amplitude of the sum signal in A its correlation
content is not necessary highest as depicted in this carton. The points of highest correlation are indicated in
B. Here the sum signal shows the highest degree of ‘purity ’. Middle and Right : Experimental realization of
the working principle of SOFI. Middle : Unresolved sum signal stemming from two quantum dots. Right :
Correlation signal as calculated by the SOFI algorithm. Evidently, the resolution of the SOFI image is
increased with respect to the original image.
Advances in SOFI 5
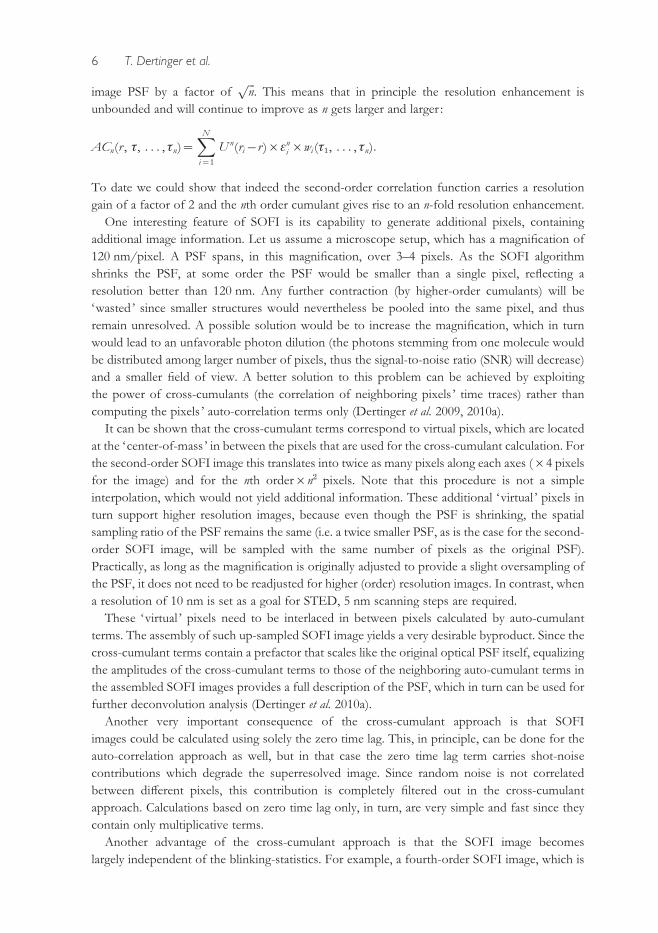
image PSF by a factor offfiffiffin
p. This means that in principle the resolution enhancement is
unbounded and will continue to improve as n gets larger and larger :
ACn(r , t, . . . , tn)=XN
i=1
Un(rixr )renirwi (t1, . . . , tn):
To date we could show that indeed the second-order correlation function carries a resolution
gain of a factor of 2 and the nth order cumulant gives rise to an n-fold resolution enhancement.
One interesting feature of SOFI is its capability to generate additional pixels, containing
additional image information. Let us assume a microscope setup, which has a magnification of
120 nm/pixel. A PSF spans, in this magnification, over 3–4 pixels. As the SOFI algorithm
shrinks the PSF, at some order the PSF would be smaller than a single pixel, reflecting a
resolution better than 120 nm. Any further contraction (by higher-order cumulants) will be
‘wasted ’ since smaller structures would nevertheless be pooled into the same pixel, and thus
remain unresolved. A possible solution would be to increase the magnification, which in turn
would lead to an unfavorable photon dilution (the photons stemming from one molecule would
be distributed among larger number of pixels, thus the signal-to-noise ratio (SNR) will decrease)
and a smaller field of view. A better solution to this problem can be achieved by exploiting
the power of cross-cumulants (the correlation of neighboring pixels ’ time traces) rather than
computing the pixels ’ auto-correlation terms only (Dertinger et al. 2009, 2010a).
It can be shown that the cross-cumulant terms correspond to virtual pixels, which are located
at the ‘center-of-mass ’ in between the pixels that are used for the cross-cumulant calculation. For
the second-order SOFI image this translates into twice as many pixels along each axes (r4 pixels
for the image) and for the nth orderrn2 pixels. Note that this procedure is not a simple
interpolation, which would not yield additional information. These additional ‘virtual ’ pixels in
turn support higher resolution images, because even though the PSF is shrinking, the spatial
sampling ratio of the PSF remains the same (i.e. a twice smaller PSF, as is the case for the second-
order SOFI image, will be sampled with the same number of pixels as the original PSF).
Practically, as long as the magnification is originally adjusted to provide a slight oversampling of
the PSF, it does not need to be readjusted for higher (order) resolution images. In contrast, when
a resolution of 10 nm is set as a goal for STED, 5 nm scanning steps are required.
These ‘virtual ’ pixels need to be interlaced in between pixels calculated by auto-cumulant
terms. The assembly of such up-sampled SOFI image yields a very desirable byproduct. Since the
cross-cumulant terms contain a prefactor that scales like the original optical PSF itself, equalizing
the amplitudes of the cross-cumulant terms to those of the neighboring auto-cumulant terms in
the assembled SOFI images provides a full description of the PSF, which in turn can be used for
further deconvolution analysis (Dertinger et al. 2010a).
Another very important consequence of the cross-cumulant approach is that SOFI
images could be calculated using solely the zero time lag. This, in principle, can be done for the
auto-correlation approach as well, but in that case the zero time lag term carries shot-noise
contributions which degrade the superresolved image. Since random noise is not correlated
between different pixels, this contribution is completely filtered out in the cross-cumulant
approach. Calculations based on zero time lag only, in turn, are very simple and fast since they
contain only multiplicative terms.
Another advantage of the cross-cumulant approach is that the SOFI image becomes
largely independent of the blinking-statistics. For example, a fourth-order SOFI image, which is
6 T. Dertinger et al.

calculated solely from the use of autocorrelations (no virtual pixels) will require four different
time lag inputs in the correlation integral (in order to omit shot noise they will all have to be
different). However, if the characteristic blinking time is faster than four frames (i.e. four time
lags) no correlated photon events from the same emitter will be found, leading to a break-down
of the SOFI algorithm. In contrast, the cross-cumulant SOFI approach does not require infor-
mation from four consecutive frames, but the signals from four adjacent pixels in the same frame
(covering the same PSF). Therefore, the ideal blinking rate for XC-SOFI images is on the order
of the frame rate, but slower or faster dynamics will be processed efficiently too.
4. Applications
In this section, we will provide an overview of SOFI capabilities.
4.1 SOFI using various optical platforms
As mentioned above, SOFI works on all imaging platforms that can provide a time-lapse (movie)
acquisition mode. In Figure 2, we show examples of SOFI acquired on different microscopes
(conventional lamp-based Widefield microscope, TIRF microscope, and a confocal scanning
microscope).
Even though SOFI can be done on a confocal scanning microscope, this mode is certainly not
the most suitable mode of SOFI, since the strength of SOFI is in its parallel acquisition and
parallel image processing.
4.2 SOFI with plasmonic metal nanoparticles
Since the SOFI algorithm works for all stochastically fluctuating signals, we tested its super-
resolving power for metallic nanoparticles typically used for surface-enhanced Raman scattering
(SERS) measurements. Plasmonic metal nanoparticles, as used for SERS experiments, provide
extremely bright and photostable probes that may be used for long-term imaging. We have
developed SERS biotags (SBTs) of dimers and trimers of metal nanoparticles that are stable in
biological conditions (Braun et al. 2009; Laurence et al. 2009, 2012 ; Pallaoro et al. 2010, 2011).
During our measurements, we observed that these nanoplasmonic probes undergo dramatic,
long-term blinking behavior. We have not determined whether these fluctuations are related to
movement of single Raman tags (Jiang et al. 2003 ; Nie, 1997) or rotational motion of the
nanoparticles (Laurence et al. 2012) or another cause (the cause for the blinking is currently
under investigation). Regardless of the origin, dramatic blinking of these very bright, non-
photobleaching signals provides the perfect candidate probes for SOFI. We imaged SBTs
attached to a glass surface in aqueous solution and dry, and observed blinking behavior in both
conditions. The SBTs were excited by a defocused 637 nm diode laser (Stradus 637-140, Vortran
Laser, Sacramento, California, USA) and imaged using a CCD camera (Andor iXon). The movies
of the blinking SBTs were processed using the SOFI algorithm. Figure 3 clearly demonstrates
contrast enhancement and superresolution for the SOFI-processed data (middle panel and cross-
section in right panel ; the inset in the middle panel shows a transmission electron microscopy
(TEM) image of an individual SBT, scalebar : 10 nm).
The starting material for the SBTs is 50 nm monomers obtained from Ag citrate
reduction in house synthesis (Lee & Meisel, 1982) that are aggregated via phosphate and
Advances in SOFI 7

hexamethylenediamine addition and stabilized by a combination of polyvinylpyrrolidone
(40 kDa) and modified bovine serum albumin. The SBTs are infused with the resonant Raman
reporter thionin and functionalized with cell targeting peptides.
Fig. 2. SOFI performed on various microscopes. All images are showing the tubulin network of NIH 3T3
fibroblasts immune-stained with infrared emitting quantum dots. The images on the left column correspond
to the original images as acquired by the respective microscope (2000 frames). The middle column shows
the corresponding second-order SOFI images and the right columns depict line profiles taken along the
cross-sections as indicated in the magnified areas of each image (blue line : conventional image, red line :
SOFI image). Evidently, the resolution is increased by SOFI in all cases (manifesting features that were not
resolved in the original images). Upper panel : Widefield microscope. Scalebar : 5 mm. Distance between
black lines in the cross-sections plot is 234 nm. Middle panel : TIRF microscope. Scalebar : 5 mm. A stray
light contribution (left side of the original image) is automatically removed by the SOFI algorithm since
stray light lacks fluctuations and therefore yields a zero value in the SOFI image. Quantum dots previously
hidden in the stray light become clearly visible. Distance between black lines in the cross-sections plot :
245 nm. Lower Panel : Spinning Disk Confocal microscope. Scalebar 5 mm. Distance between black lines in
the cross-sections plot is 266 nm.
8 T. Dertinger et al.

4.3 SOFI with organic dyes
The previous examples where acquired using bright and photostable quantum dots or plasmonic
metal nanoparticles. However, despite many advantageous properties of these probes, organic
dyes are often the probes of choice for biological applications. It is not surprising, but never-
theless an important result that SOFI does work also on emission fluctuations exhibited by
organic dyes. Here the problems of bleaching and weaker signals pose some difficulties for SOFI
analysis. The bleaching problem can be overcome by block-wise processing of the acquired
SOFI movie, such that in each block (of several frames only) the bleaching is negligible. Thus
instead of having a single SOFI image, one ends up having many SOFI images (all of them are
quite noisy), which can be added up to a final, less noisy, SOFI image (Dertinger et al. 2010b).
This is shown in Fig. 4.
5. Discussion
We claimed above that in principle, high-order cumulants could yield higher SOFI resolution.
But to what order cumulants should be calculated in practice? Even though SOFI has seemingly
unlimited resolution capability, there are ‘ real world ’ limits. As it turns out, there are difficulties
in trying to quantify these limits, since the underlying theory for cumulants is highly non-linear
Fig. 4. SOFI image of the tubulin network of immunostained HELA cells. Organic dyes (Alexa 647) have
been used as probes and the blinking was induced by a specific ‘blink ’ buffer and a second laser (Heilemann
et al. 2008, 2009). Left : Original fluorescence image. Middle : SOFI image. The boxed regions are shown
magnified in the upper right corner of each image. The cross-section plot (right) is taken along the dotted
line as indicated in the magnified views. Blue line : original intensity profile. Red line : SOFI intensity profile.
Scalebar 5 mm.
Fig. 3. SOFI performed on nanoplasmonic probes. Left : Conventional microscope image. Middle : SOFI
image ; inset : TEM image of an SBT, scalebar : 10 nm. Right : Cross-section plot along the dashed-white line
profile indicated in the images. The peak-to-peak distance is about 300 nm for the resolved feature.
Scalebar : 1 mm.
Advances in SOFI 9

and analytical calculations regarding the achievable resolution enhancement are not straight
forward. A more sophisticated theory would need to address the following questions : given a
blinking rate, what is the optimal acquisition frame rate? Given a SNR per frame and a blinking
rate, what is the optimal cumulant order for the calculations, beyond which the data set does not
provide enough statistics and does not support a complete decorrelation of the higher-order
cumulant terms? Although these aspects of the theory have not been worked out as of
yet, resolution enhancement of up to four times have been experimentally demonstrated
(Geissbuehler et al. 2011). This modest enhancement falls short of the enhancement attainable
by SML methods (which routinely achieve r10 enhancement factors (at least in localization
precision). If so, what are the advantages of SOFI, if any, as compared with other super-
resolution techniques? When is it advisable to use SOFI instead of STED or SML methods?
In general, the higher the desired resolution, the more overall photons are needed (and the
better the SNR has to be). The high resolution afforded by SML methods stems from thresh-
olding low S/N events (low signal from individual molecules as compared with background
signal). Thresholding also eliminates false localizations. This, however, comes with a penalty :
SML methods work only down to a certain SNR under which the number of successful locali-
zations dramatically drops (van de Linde et al. 2010 ; Wolter et al. 2011), at which point the
approach is no longer workable for superresolution imaging. In contrast, SOFI has been shown
to work at a five times lower SNR as compared with dSTORM (Geissbuehler et al. 2011). This in
turn allows for faster frame rates and shorter acquisition times. Furthermore, SML methods
require probes that exhibit long ‘off’ times (y1000 times longer as compared to the ‘on’ time)
in order for the algorithm to work properly. SOFI, on the other hand, could provide super-
resolution at almost any arbitrary ‘on’/‘off’ ratio.
Thus, SOFI could provide added value to superresolution imaging when conditions are not
optimal for SML: when (i) short acquisition times are needed, (ii) the ‘on’/‘off’ ratio of the
probes cannot be tuned as needed and/or the labeling density is too high, or (iii) the SNR is not
adequate for SML-based methods. It is clear, although, that relaxing these requirements will
compromise the resolution attainable by SOFI as compared with the one attainable by the SML
methods or STED as mentioned above. Another limitation of SOFI is the brightness scaling of
higher-order cumulants, resulting in a very large dynamic range (large contrast) that cannot be
displayed in an appealing way (the best look-up tables are the ones that exhibit a low contrast).
The obstacle, however, has been very recently overcome by using balanced cumulants as
explained in (Geissbuehler et al. 2012).
6. Conclusion
We have reviewed the most recent newcomer to the superresolution tool-kit, SOFI. SOFI has
already demonstrated unique attributes and favorable trade-offs, providing an easy and affordable
way for achieving superresolution imaging. Future applications of SOFI will address rapid live
cell imaging and three-dimensional (3D) superresolution imaging. SOFI is inherently a 3D
method, but some technical aspects have to be addressed first before this important capability
can be demonstrated (Dertinger et al. 2012). A true breakthrough in SOFI utilization is expected
when proper blinking properties will be engineered into fluorescent proteins. We anticipate that
the SOFI approach will be utilized beyond fluorescence imaging by taking advantage of polar-
ization fluctuations and other non-fluorescent stochastic blinking phenomena.
10 T. Dertinger et al.

7. Acknowledgements
We thank Robert Vogel for preparing samples and taking the quantum dots data (used in Fig. 2),
Mike Heilemann and Markus Sauer at the University of Wuerzburg for providing us with the raw
organic dye data (used in Fig. 4) and Martin Moskovits for advice and support. Part of this work
(S. Ly and T. Laurence) was performed under the auspices of the U. S. Department of Energy
by Lawrence Livermore National Laboratory under Contract DE-AC52-07NA27344. Part of
this work (A. Pallaoro and G. Braun) was supported by the Institute for Collaborative
Biotechnologies through Grant DAAD19-03-D-0004 from the US Army Research Office. This
work (T. Dertinger and S. Weiss) was supported by NIH grant no. 5R01EB000312 and NIH
grant no. 1R01GM086197.
8. References
ABBE, E. (1873). Contributions to the theory of the
microscope and the microscopic perception (Translated
from German). Archiv fur Mikroskopische Anatomie 9,
413–468.
BETZIG, E., PATTERSON, G. H., SOUGRAT, R., LINDWASSER,
O. W., OLENYCH, S., BONIFACINO, J. S., DAVIDSON,
M. W., LIPPINCOTT-SCHWARTZ, J. & HESS, H. F. (2006).
Imaging intracellular fluorescent proteins at nanometer
resolution. Science 313, 1642–1645.
BITEEN, J. S., THOMPSON, M. A., TSELENTIS, N. K.,
BOWMAN, G. R., SHAPIRO, L. & MOERNER, W. E. (2008).
Super-resolution imaging in live Caulobacter crescentus
cells using photoswitchable EYFP. Nature Methods 5,
947–949.
BRAUN, G. B., LEE, S. J., LAURENCE, T., FERA, N., FABRIS,
L., BAZAN, G. C., MOSKOVITS, M. & REICH, N. O.
(2009). Generalized approach to SERS-active nanoma-
terials via controlled nanoparticle linking, polymer
encapsulation, and small-molecule infusion. Journal of
Physical Chemistry C 113, 13622–13629.
DERTINGER, T., COLYER, R., IYER, G., WEISS, S. &
ENDERLEIN, J. (2009). Fast, background-free, 3D super-
resolution optical fluctuation imaging (SOFI). Proceedings
of the National Academy of Sciences of the United States of
America 106, 22287–22292.
DERTINGER, T., COLYER, R., VOGEL, R., ENDERLEIN, J. &
WEISS, S. (2010a). Achieving increased resolution and
more pixels with superresolution optical fluctuation
imaging (SOFI). Optics Express 18, 18875.
DERTINGER, T., HEILEMANN, M., VOGEL, R., SAUER, M. &
WEISS, S. (2010b). Superresolution optical fluctuation
imaging with organic dyes. Angewandte Chemie
(International Edition in English) 49, 9441–9443.
DERTINGER, T., XU, J., FOROUTAN, N. O., VOGEL, R. &
WEISS, S. (2012). SOFI-based 3D superresolution
sectioning with a widefield microscope. Optical
Nanoscopy 1, 2.
FOLLING, J., BOSSI, M., BOCK, H., MEDDA, R., WURM, C. A.,
HEIN, B., JAKOBS, S., EGGELING, C. & HELL, S. W.
(2008). Fluorescence nanoscopy by ground-state
depletion and single-molecule return. Nature Methods 5,
943–945.
GEISSBUEHLER, S., DELLAGIACOMA, C. & LASSER, T. (2011).
Comparison between SOFI and STORM. Biomedical
Optics Express 2, 408–420.
GEISSBUEHLER, S., BOCCHIO, N. L., DELLAGIACOMA, C.,
BERCLAZ, C., LEUTENEGGER, M. & LASSER, T. (2012).
Mapping molecular statistics with balanced super-res-
olution optical fluctuation imaging (bSOFI). Optical
Nanoscopy 1, 4.
GUSTAFSSON, M. G. (2000). Surpassing the lateral resol-
ution limit by a factor of two using structured illumi-
nation microscopy. Journal of Microscopy 198, 82–87.
HEILEMANN, M., VAN DE LINDE, S., MUKHERJEE, A. &
SAUER, M. (2009). Super-resolution imaging with small
organic fluorophores. Angewandte Chemie (International
Edition in English) 48, 6903–6908.
HEILEMANN, M., VAN DE LINDE, S., SCHUTTPELZ, M.,
KASPER, R., SEEFELDT, B., MUKHERJEE, A., TINNEFELD, P.
& SAUER, M. (2008). Subdiffraction-resolution fluor-
escence imaging with conventional fluorescent probes.
Angewandte Chemie (International Edition in English) 47,
6172–6176.
HELL, S. & WICHMANN, J. (1994). Breaking the diffraction
resolution limit by stimulated emission: stimulated-
emission-depletion fluorescence microscopy. Optics
Letters 19, 780–782.
HOTTA, J. I., FRON, E., DEDECKER, P., JANSSEN, K. P. F., LI,
C., MULLEN, K., HARKE, B., BUCKERS, J., HELL, S. W.
& HOFKENS, J. (2010) Spectroscopic rationale for
efficient stimulated-emission depletion microscopy
fluorophores. Journal of the American Chemical Society 132,
5021–5023.
JI, N., MILKIE, D. E. & BETZIG, E. (2010). Adaptive optics
via pupil segmentation for high-resolution imaging in
biological tissues. Nature Methods 7, 141–147.
JIANG, J., BOSNICK, K., MAILLARD, M. & BRUS, L. (2003).
Single molecule Raman spectroscopy at the junctions of
large Ag nanocrystals. Journal of Physical Chemistry B 107,
9964–9972.
Advances in SOFI 11

JONES, S. A., SHIM, S. -H., HE, J. & ZHUANG, X. (2011).
Fast, three-dimensional super-resolution imaging of live
cells. Nature Methods.
KANCHANAWONG, P., SHTENGEL, G., PASAPERA, A. M.,
RAMKO, E. B., DAVIDSON, M. W., HESS, H. F. &
WATERMAN, C. M. (2010). Nanoscale architecture of
integrin-based cell adhesions. Nature 468, 580–584.
KLAR, T. A. (2000). Fluorescence microscopy with
diffraction resolution barrier broken by stimulated
emission. Proceedings of the National Academy of Sciences of
the United States of America 97, 8206–8210.
KLAR, T. A. & HELL, S. (1999). Subdiffraction resolution
in far-field fluorescence microscopy. Optics Letters 24,
954–956.
KLEIN, T., LOSCHBERGER, A., PROPPERT, S., WOLTER, S., VAN
DE LINDE, S. & SAUER, M. (2011). Live-cell dSTORM
with SNAP-tag fusion proteins. Nature Methods 8, 7–9.
LAURENCE, T. A., BRAUN, G. B., REICH, N. O. &
MOSKOVITS, M. (2012). Robust SERS enhancement
factor statistics using rotational correlation spec-
troscopy. Nano Letters 12(6), 2912–2917.
LAURENCE, T. A., BRAUN, G., TALLEY, C., SCHWARTZBERG,
A., MOSKOVITS, M., REICH, N. & HUSER, T. (2009).
Rapid, solution-based characterization of optimized
SERS nanoparticle substrates. Journal of the American
Chemical Society 131, 162–169.
LEE, H. L., LORD, S. J., IWANAGA, S., ZHAN, K., XIE, H.,
WILLIAMS, J. C., WANG, H., BOWMAN, G. R.,
GOLEY, E. D., SHAPIRO, L., TWIEG, R. J., RAO, J. &
MOERNER, W. E. et al. (2010). Superresolution imaging
of targeted proteins in fixed and living cells using pho-
toactivatable organic fluorophores. Journal of the American
Chemical Society 132, 15099–15101.
LEE, P. C. & MEISEL, D. (1982). Adsorption and surface-
enhanced Raman of dyes on silver and gold sols. Journal
of Physical Chemistry 86, 3391–3395.
MENDEL, J. M. (1991). Tutorial on higher-order statistics
(spectra) in signal-processing and system-theory –
theoretical results and some applications. Proceedings of
the IEEE 79, 278–305.
NIE, S. (1997). Probing single molecules and single
nanoparticles by surface-enhanced Raman scattering.
Science 275, 1102–1106.
PALLAORO, A., BRAUN, G. B. & MOSKOVITS, M.
(2011). Quantitative ratiometric discrimination between
noncancerous and cancerous prostate cells based on
neuropilin-1 overexpression. Proceedings of the National
Academy of Sciences of the United States of America 108,
16559–16564.
PALLAORO, A., BRAUN, G. B., REICH, N. O. & MOSKOVITS,
M. (2010). Mapping local pH in live cells using
encapsulated fluorescent SERS nanotags. Small 6,
618–622.
PLANCHON, T. A., GAO, L., MILKIE, D. E.,
DAVIDSON, M. W., GALBRAITH, J. A., GALBRAITH, C. G.
& BETZIG, E. (2011). Rapid three-dimensional isotropic
imaging of living cells using Bessel beam plane illumi-
nation. Nature Methods 8, 417–423.
RITTWEGER, E., HAN, K. Y., IRVINE, S. E., EGGELING, C. &
HELL, S. W. (2009). STED microscopy reveals crystal
colour centres with nanometric resolution. Nature
Photonics 3, 144–147.
RUST, M. J., BATES, M. & ZHUANG, X. (2006). Sub-diffrac-
tion-limit imaging by stochastic optical reconstruction
microscopy (STORM). Nature Methods 3, 793–795.
SCHWARTZ, O. & ORON, D. (2012). Fluorescence anti-
bunching microscopy. Proc. of SPIE 8228, 822802–4.
VAN DE LINDE, S., WOLTER, S., HEILEMANN, M. & SAUER, M.
(2010). The effect of photoswitching kinetics and label-
ing densities on super-resolution fluorescence imaging.
Journal of Biotechnology 149, 6.
WEISS, S. (2000). Shattering the diffraction limit of light : a
revolution in fluorescence microscopy? Proceedings of
the National Academy of Sciences of the United States of America
97, 8747–8749.
WESTPHAL, V., RIZZOLI, S. O., LAUTERBACH, M. A., KAMIN,
D., JAHN, R.& HELL, S. W. (2008). Video-rate far-field
optical nanoscopy dissects synaptic vesicle movement.
Science 320, 246–249.
WOLTER, S., ENDESFELDER, U., VAN DE LINDE, S.,
HEILEMANN, M. & SAUER, M. (2011). Measuring locali-
zation performance of super-resolution algorithms on
very active samples. Optics Express 19, 7020–7033.
WOMBACHER, R., HEIDBREDER, M., VAN DE LINDE, S.,
SHEETZ, M. P., HEILEMANN, M., CORNISH, V. W. &
SAUER, M. (2010). Live-cell super-resolution imaging
with trimethoprim conjugates. Nature Methods 7,
717–719.
12 T. Dertinger et al.
Copyright © 2022 FDOKUMEN