Inducible laryngeal obstruction: an official joint European ...
Upload
independentCategory
view
0download
0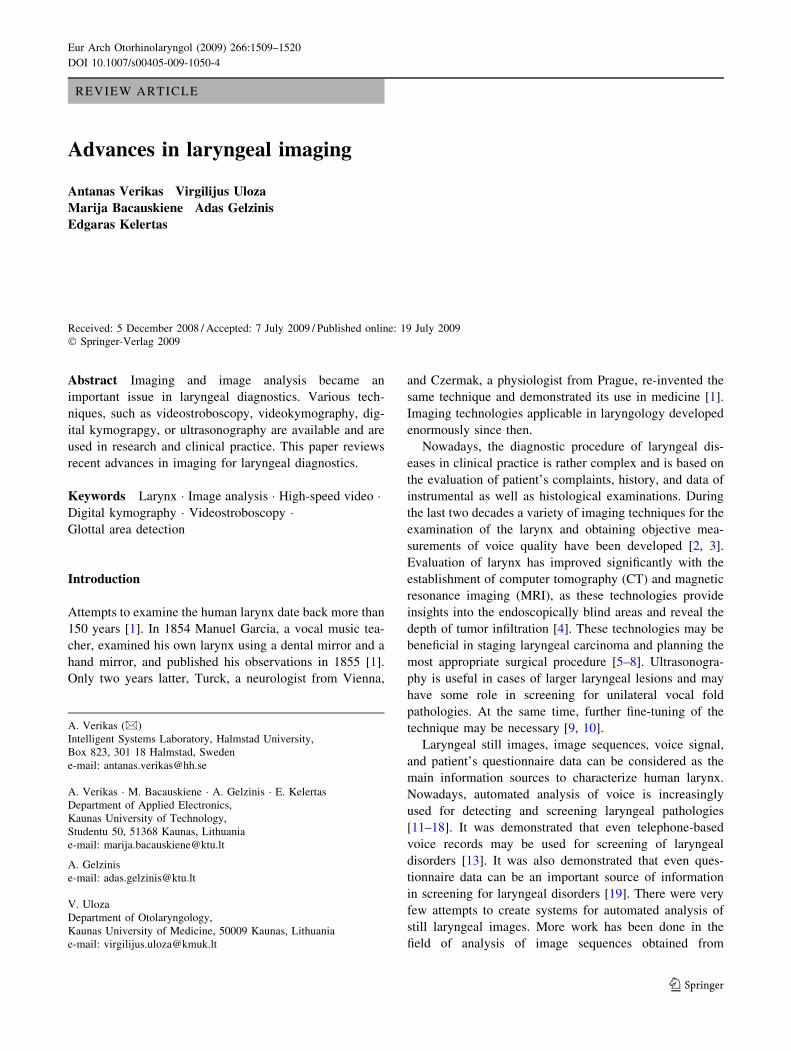
REVIEW ARTICLE
Advances in laryngeal imaging
Antanas Verikas Æ Virgilijus Uloza ÆMarija Bacauskiene Æ Adas Gelzinis ÆEdgaras Kelertas
Received: 5 December 2008 / Accepted: 7 July 2009 / Published online: 19 July 2009
� Springer-Verlag 2009
Abstract Imaging and image analysis became an
important issue in laryngeal diagnostics. Various tech-
niques, such as videostroboscopy, videokymography, dig-
ital kymograpgy, or ultrasonography are available and are
used in research and clinical practice. This paper reviews
recent advances in imaging for laryngeal diagnostics.
Keywords Larynx � Image analysis � High-speed video �Digital kymography � Videostroboscopy �Glottal area detection
Introduction
Attempts to examine the human larynx date back more than
150 years [1]. In 1854 Manuel Garcia, a vocal music tea-
cher, examined his own larynx using a dental mirror and a
hand mirror, and published his observations in 1855 [1].
Only two years latter, Turck, a neurologist from Vienna,
and Czermak, a physiologist from Prague, re-invented the
same technique and demonstrated its use in medicine [1].
Imaging technologies applicable in laryngology developed
enormously since then.
Nowadays, the diagnostic procedure of laryngeal dis-
eases in clinical practice is rather complex and is based on
the evaluation of patient’s complaints, history, and data of
instrumental as well as histological examinations. During
the last two decades a variety of imaging techniques for the
examination of the larynx and obtaining objective mea-
surements of voice quality have been developed [2, 3].
Evaluation of larynx has improved significantly with the
establishment of computer tomography (CT) and magnetic
resonance imaging (MRI), as these technologies provide
insights into the endoscopically blind areas and reveal the
depth of tumor infiltration [4]. These technologies may be
beneficial in staging laryngeal carcinoma and planning the
most appropriate surgical procedure [5–8]. Ultrasonogra-
phy is useful in cases of larger laryngeal lesions and may
have some role in screening for unilateral vocal fold
pathologies. At the same time, further fine-tuning of the
technique may be necessary [9, 10].
Laryngeal still images, image sequences, voice signal,
and patient’s questionnaire data can be considered as the
main information sources to characterize human larynx.
Nowadays, automated analysis of voice is increasingly
used for detecting and screening laryngeal pathologies
[11–18]. It was demonstrated that even telephone-based
voice records may be used for screening of laryngeal
disorders [13]. It was also demonstrated that even ques-
tionnaire data can be an important source of information
in screening for laryngeal disorders [19]. There were very
few attempts to create systems for automated analysis of
still laryngeal images. More work has been done in the
field of analysis of image sequences obtained from
A. Verikas (&)
Intelligent Systems Laboratory, Halmstad University,
Box 823, 301 18 Halmstad, Sweden
e-mail: [email protected]
A. Verikas � M. Bacauskiene � A. Gelzinis � E. Kelertas
Department of Applied Electronics,
Kaunas University of Technology,
Studentu 50, 51368 Kaunas, Lithuania
e-mail: [email protected]
A. Gelzinis
e-mail: [email protected]
V. Uloza
Department of Otolaryngology,
Kaunas University of Medicine, 50009 Kaunas, Lithuania
e-mail: [email protected]
123
Eur Arch Otorhinolaryngol (2009) 266:1509–1520
DOI 10.1007/s00405-009-1050-4

high-speed cameras, laryngeal videostroboscopy or
videokymography.
Different tasks can be pursued with laryngeal imaging.
Obtaining images of high quality and resolution, revealing
the detailed morphology of the glottal structures, is one of
the main tasks. Such images are essential in making correct
diagnosis and choosing the treatment. Quantitative char-
acterization of the vibratory behavior of the vocal folds is
another important task. Characterization in the form of a
rather small set of physically interpretable parameters is
desired. Several indices, describing the glottal wave form,
are usually used for the characterization. Figure 1 presents
three laryngeal images recorded from the same patient with
cyst in the left vocal fold. The two video-laryngo-strobo-
scopic images on the left-hand side of Fig. 1 provide
mainly the ‘‘functional information’’ about the vibratory
function of the vocal folds and the glottal closure. The
image shown on the right-hand side of Fig. 1 was obtained
via direct microlaryngoscopy, and provides more detailed
information about structural changes in the vocal fold and
morphological peculiarities of the cyst which is funda-
mental in making the correct diagnosis. This image was
used to quantitatively characterize the distribution of color,
the geometry of the edges of the vocal folds, and the
texture.
Specific tasks are often pursued by applying ultrasonic
imaging. Autofluorescence laryngoscopy often focuses on
revealing early malignant changes, while CT and MRI help
to reveal the depth of tumor infiltration. It is noteworthy
that other methods, such as inverse filtering and electro-
glottography (EEG), are also often used to examine the
vocal fold vibrations and to calculate glottal wave form
parameters [20, 21]. The aim of this work was to review the
state-of-the-art imaging and image analysis techniques
used in laryngoscopy. 3D imaging technologies, such as
CT or MRI, were not considered in this review.
Analysis of still images
An image analysis-based technique for automated catego-
rization of manually marked suspect lesions into the
healthy and diseased classes has been proposed [22]. The
categorization is based on textural features extracted from
co-occurrence matrices [23, 24] computed from manually
marked areas of vocal fold images, taken by a CCD cam-
era. The classification accuracy of 81.4% was reported
when testing the technique on a very small set of 35 ima-
ges. A set of 785 color laryngeal images obtained via direct
microlaryngoscopy has been used in studies presented in
literature [25, 26]. The classification accuracy of over 94%
was achieved when categorizing the images into one
healthy and two pathological (nodular and diffuse) classes.
Figure 2 presents characteristic examples from the three
decision classes considered. As can be seen from Fig. 2,
examples representing the three classes are rather dissim-
ilar. However, it is worth noting that due to a large variety
of appearance of vocal fold mass lesions, classification can
sometimes be difficult even for a trained physician [27].
Figure 3 exemplifies some results of the automated anal-
ysis. Images were automatically segmented into regions of
homogenous color. The region boundaries found are shown
with thin black curves. Two lines in the image on the right-
hand side of Fig. 3 delineate the polyp. Lines in the other
two images approximate the edges of vocal folds. As can
be seen, one of the lines was misplaced. When categorizing
the same set of images into seven classes (one healthy and
six pathological), the classification accuracy of over 80%
was reported [28]. Image texture, distribution of color, and
geometry of edges of vocal folds were the types of features
used for the categorization. The investigation showed that
color was among the most discriminative types of features.
Hanson et al. [29] used color, an average value of the
normalized red component r given by Eq. 1, to quantify the
degree of erythema
r ¼ R
Rþ Gþ Bð1Þ
where R, G, and B are three components of the color
images recorded by the color CCD camera. Five different
areas were manually selected from each laryngeal image to
estimate the r component. The value of the r component
computed for normal subjects was compared to the r
component values computed for patients with chronic lar-
yngitis. The examination showed that the r values for
patients with chronic posterior laryngitis were significantly
higher than the r values computed for normal larynges. It is
worth noting that the camera was color-balanced before
Fig. 1 Images obtained from
the same patient by
videostroboscopy (left and
middle) and direct
microlaryngoscopy (right)
1510 Eur Arch Otorhinolaryngol (2009) 266:1509–1520
123

each recording. However, variations in illumination,
geometry, and appearance of vocal folds have not been
taken into consideration.
Imaging is successfully used in indirect autofluores-
cence and fluorescence (5-ALA-induced PPIX, for exam-
ple) laryngoscopy [30–34]. Autofluorescence laryngoscopy
is based on the fact that normal cells emit green fluores-
cence when exposed to blue light, while precancerous or
cancerous lesions display a significant loss of green fluo-
rescence and appear reddish. Autofluorescence is usually
induced by filtered blue light of a xenon lamp or light of a
blue laser. A color CCD camera is usually used for
recording. Autofluorescence and fluorescence imaging
helps to detect borderlines between tumors and healthy
tissue. It is argued that autofluorescence endoscopy shows
greater sensitivity in the detection of precancerous or
cancerous lesions, compared to standard laryngomicros-
copy [32]. However, the image analysis procedures used
are limited to image visualization. Quantification of color,
texture, and shape of lesions and normal tissue could help
in more accurate categorization of lesions as well as in the
follow-up procedures.
Hsiao et al. [35, 36] and Shau et al. [37] used color
Doppler ultrasound imaging to assess laryngeal phonation
function non-invasively. Vocal fold mucosal wave velocity
and elasticity of vocal folds were quantified on the basis of
color Doppler imaging. The mean vocal fold displacement
velocity was assessed from the pseudocolor codes of the
ultrasound image. A commercially available high resolu-
tion ultrasound scanner was used for imaging. The authors
pointed out that the technique was applicable for the
evaluation of the phonation function affected by vocal
disorders that alter the vibration of the mucosa. Ultrasonic
imaging was also used by Niimi et al. [38] to obtain
quantitative measurements of the vertical movement of the
larynx. A linear type ultrasonic tomograph with 128
ultrasound emitting elements aligned on a straight line
served as an imaging device, ensuring a spatial resolution
of 1 mm.
In [39], image analysis-based procedures were used to
make relative measurements of some laryngeal parameters.
Analysis of image sequences
Videostroboscopy
Videostroboscopy is one of the standard methods used to
examine moving objects. Laryngo-videostroboscopy is
used extensively for the analysis of vocal folds and in the
clinical practice for diagnosing voice disorders [40–44].
For example, videostroboscopy is a well-established tech-
nique for measuring the glottal gap or examining the glottic
closure [41, 45, 46]. Laryngo-videostroboscopy is able to
reveal a number of abnormalities, including abnormalities
of laryngeal structure, absence of vibration, and vibratory
asymmetry. Flashing light is used to illuminate an object in
stroboscopy. When the flashes are synchronized with the
vocal fold vibrations, a stationary view of the vocal folds is
obtained.
However, the single-flash-timing laryngeal videostro-
boscopy has a limitation that it is effective only when vocal
fold vibrations exhibit only one single fundamental fre-
quency. Multiple tones (fundamental frequencies) may be
recorded in the presence of some diseases, such as polyps,
nodules, or cysts [47]. In such cases, a clear view of the
vibrating vocal folds cannot be obtained with the single-
flash-timing laryngeal videostroboscopy. A multiple-flash-
timing laryngeal videostroboscopy technique was proposed
by Deguchi et al. [47], in order to deal with such cases.
Multiple light emitting diodes (LED) are used as illumi-
nation sources.
Fig. 2 Images from the nodular(left), diffuse (middle), and
healthy (right) classes
Fig. 3 Images illustrating the
results of automated analysis
Eur Arch Otorhinolaryngol (2009) 266:1509–1520 1511
123

Schade et al. [48] proposed using the short-interval
color-filtered double strobe flash-stroboscopy to obtain
quantitative measurements of vocal fold movements. With
this technique a double exposure is accomplished in each
video frame. Thus, information about the vocal fold
velocity is available from a single image obtained with this
technique.
Among other issues, the usefulness of laryngeal trans-
illumination in combination with stroboscopy for auto-
mated endoscopic images-based quantitative measurement
of glottal area function was studied in [49]. The results
showed that the utilization of color information (available
due to transillumination) facilitates automated quantitative
measurements of the glottal area function and the detection
of the glottal contour area. In [50] image sequences
recorded with the stroboscopy system were used to mea-
sure the glottic angle and the angular velocities of vocal
fold abduction and adduction. The authors indicated that
semi-automated edge tracking would be an important
improvement of the technique.
In clinical practice, decision-making is quite often based
on subjective evaluation of video data. Quantitative mea-
sures of motion and geometry of vocal folds can provide
objective information and may be useful in planning
medical treatment and tracing progress over time. Video-
strobokymography introduced in [45] creates multiple
kymograms (multi-line kymography) based on multiple
lines of interest from recorded successive frames of stro-
boscopic video images, and enables calculation of some
quantitative parameters. Two quantitative parameters,
namely open quotient and asymmetry index, are calculated
from video-strobokymograms. To facilitate the analysis,
images are rotated to make the glottal axis vertical before
creating a kymogram. To create a kymogram from a
sequence of images, one—and always the same—line is
taken from each image. The lines are then combined into a
new image showing the time course of the fold vibrations.
Figure 4 shows an example of a video-strobokymogram
obtained with the ‘‘EndoSTROB’’ device (XION medical).
A wave of mucous membrane and a clear closure phase are
well recognizable.
Videokymography
A special CCD camera-based video system for videoky-
mography was developed [51, 52]. The system can function
in two modes. In the first mode, the system functions as an
ordinary video camera. In the second—line-imaging—
mode, videokymographic images are recorded. Thus, vocal
fold vibration frequency and amplitude, left–right asym-
metry, and open and closed phases of the glottal cycle can
be quantified. One drawback of the system is that only a
single kymogram can be obtained during one examination.
A new-generation videokymographic system has been
recently introduced [53, 54]. Two CCD sensors are used to
provide simultaneously a laryngoscopic and kymographic
image for clinical vocal fold examination. A color CCD
camera is used for obtaining a laryngoscopic image, while
a high-speed line-scan CCD is used to capture a kymo-
graphic image at a selected position, which is shown on the
laryngoscopic image. Since the color CCD camera is not
fast enough, the laryngoscopic image appears blurred,
while the kymographic image is of high quality, high
signal-to-noise-ration and high spatial and temporal
resolution.
In [55], an approach to quantitative characterization of
videokymographic images was presented. An active con-
tour model-based algorithm tracks the vibration wave in a
videokymographic image, and quantifies its properties in
terms of parameters. The parameters considered are: the
amplitude and period ratios between the right and left vocal
fold, and the ratio between the opening and the closing
phases. Verdonck-de Leeuw et al. [56] studied the effect of
irregular vocal fold vibration on voice quality by simulta-
neously recording and analyzing videokymographic images
and speech signals.
Digital kymography
Vocal fold vibrations occurring during voice production
can be observed with a relatively high spatial and temporal
resolution by applying high-speed imaging techniques [57].
Digital high-speed imaging systems were introduced in
1980s [58–61]. A solid endoscope is usually attached to a
high-speed camera and used to illuminate the target and to
collect the reflected light. In another imaging setup, sug-
gested by researchers from the University of Tokyo, a
flexible fiberscope inserted through the nasal cavity is used
[60, 62, 63]. Such system allows for examining the vocal
Fig. 4 An example of a video-strobokymogram obtained with the
‘‘EndoSTROB’’ device (courtesy: XION medical)
1512 Eur Arch Otorhinolaryngol (2009) 266:1509–1520
123

fold vibrations during running speech including conso-
nants. However, images recorded using a solid endoscope-
based imaging system are of higher quality [62].
At present, videokymography and high-speed imaging
(also referred to as high-speed video or high-speed glot-
tography) are the only available techniques for directly
studying aperiodic vibrations of vocal folds [64]. Such
studies are usually performed by creating and analyzing
kymograms. Kymograms obtained (using the technique
explained in ‘‘Videostroboscopy’’) from a high-speed video
are usually called digital kymograms. Kymography meth-
ods allow for the condensation and quantification of
information generated by a high-speed imaging system. It
is evident that the analysis of the huge amount of infor-
mation available from high-speed imaging may help cli-
nicians in gaining a better insight on the effects various
treatments have on vocal folds [65].
By using appropriate image analysis techniques a
parametric description of the vocal fold dynamics can be
obtained from digital kymograms. Digital images lend
themselves for calculating various quantitative measures
characterizing the vocal fold dynamics. Parametric
description of vocal fold dynamics is important in clinical
investigation of laryngeal pathologies, and is usually done
by finding the glottal area via image segmentation and
plotting the glottal area as a function of time—computing
the glottal area waveform (GAW). This approach is often
criticized on the basis that asymmetries between the
oscillation dynamics of the left and the right vocal fold are
not taken into consideration [66]. Single-line or multi-line
kymography [67], evaluating the time-dependent distance
of a specific point/points on the vocal fold edge to the
longitudinal glottal axis (experimental 1D trajectory/tra-
jectories), overcomes this drawback. Different symmetry/
asymmetry measures can be used to assess the oscillations
of vocal folds [68]. For example, vocal fold vibration
irregularities were studied in [69] based on high-speed
video and digital kymography. Two types of irregularities
were studied: a vibration frequency difference between
the right and left vocal folds (horizontal asymmetry) and
the vertical asymmetry, measured on one side between the
ventral and dorsal fold third. The aim was to obtain inde-
pendent quantitative measurements for voice therapy
planing and control. However, the symmetry measures did
not incorporate details about the time-varying shape of the
vocal fold edges [66].
Lohscheller et al. [70] identified the following main
requirements for an image analysis system designed to
investigate vocal fold vibrations based on high-speed video:
1. robust segmentation of glottis;
2. edge identification for the left and the right vocal fold,
aiming to exploit this information for distinguishing
between the influences of the left and right vocal fold
on the laryngeal dynamics (asymmetry of the oscilla-
tion directions, velocities, and amplitudes);
3. high edge detection accuracy;
4. high computation speed;
5. minimal manual intervention.
One advantage of high-speed video endoscopy over
videokymography is the possibility to remove errors caused
by involuntary motion of the endoscope. For example,
Deliyski [71, 72] presents an image analysis-based tech-
nique to compensate for endoscopic motion in high-speed
video. The technique is based on the assumption that the
difference between the endoscopic and vocal fold dynam-
ics is sufficient to accurately estimate the endoscopic
motion in relation to the vocal folds.
Though expensive, high-speed video endoscopy systems
are commercially available. However, extraction, quanti-
fication, and presentation of essential diagnostic informa-
tion to the clinician in an effective interpretable form are
still rather problematic [71]. Accurate extraction of glottal
area, compact quantitative representation of information
available from kymograms, accuracy of measurements, and
calibration are issues important for all the techniques dis-
cussed above. Therefore, we review works related to these
issues in the following sections.
Detecting glottal area
Simple thresholding techniques are often used in the image
segmentation process to extract the glottal area [66, 73–
75]. Such image thresholding often results in error, espe-
cially when the image quality is not high. False and mul-
tiple vocal fold contours may appear in different frames.
Figure 5 presents several examples of images taken from
the same image sequence recorded with a laryngo-video-
stroboscope. It is evident that due to illumination variation
and a large variability of the vocal fold appearance, simple
thresholding techniques will often fail, especially in cases
when the opening is narrow. Determining the presence of
glottal area in an image automatically is not a trivial issue.
One has also bear in mind the fact that vocal folds can be
occluded by other structures. In [76], a semi-automatic
technique based on gray level derivative is applied to
detect the glottal edge. When parameters of the technique
are determined, the edge detection and calculation of the
glottal area is performed automatically.
More advanced techniques, like region growing [77, 78],
active contour models or ‘‘snakes’’, are sometimes applied
for extracting the glottal area [79, 80]. The approach
proposed in [77] is based on image thresholding and
morphological operations followed by region-growing.
A histogram-based image thresholding is applied,
Eur Arch Otorhinolaryngol (2009) 266:1509–1520 1513
123

assuming that the image histogram follows the Rayleigh
distribution. The thresholding technique is similar to that of
Otsu [81], except that the threshold is determined by
minimizing the pixel classification error instead of maxi-
mizing the between-cluster variance (when partitioning the
histogram into two clusters) in the Otsu’s technique. The
image processing technique developed in [70] for extract-
ing vocal fold edges from high-speed video sequences is
based on the seeded region-growing algorithm. Having the
edges, the so-called vibration trajectories characterizing
deflections of the vocal folds perpendicular to the glottal
main axis are defined and used in the analysis. The success
of the image segmentation process highly depends on the
choice of an appropriate region homogeneity criterion. The
technique requires the manual definition of one or several
seed points. The manual intervention enables to achieve a
high processing speed amounting to 98 images/s. In total
186,000 images were analyzed. The authors claim that the
segmentation accuracy exceeds the one obtained by human
experts.
Active contour models are based on the minimization of
some energy function, usually exploiting information on
gray-level gradient. Additional information expressing our
prior knowledge can also be incorporated into such func-
tions [80]. In [82], the active contour-based algorithm has
been used to detect the pseudo-glottis and track its defor-
mations within a high-speed image sequence of the vibra-
tion pattern of the substitute voice generating element. The
algorithm is initialized with a region of interest extracted
by a region-growing algorithm. Active contour models,
however, are rather time-consuming. A rather generic
glottal area detection algorithm has been recently proposed
in [83]. The algorithm is based on several image processing
techniques, and does not require any initialization.
Characterizing vibrations of vocal folds quantitatively
Recently, high-speed imaging combined with advanced
image analysis is considered as the most promising
approach to explore the relation between voice disorders
and vibrations of vocal folds [61, 70, 84–86]. However,
there are no standard procedures to characterize vocal fold
vibrations and in clinical practice high-speed videos are
largely interpreted subjectively. To characterize the
vibrations of vocal folds, several positions on the vocal fold
edges are selected, usually dorsal, medial, and ventral [87]
(see Fig. 6), and trajectories (experimental trajectories) for
these points are extracted and used for further character-
ization. Often, only the medial trajectory is utilized [88–
90]. GAW is used instead of the trajectories sometimes.
The regularity and symmetry of vocal fold vibrations are
usually characterized quantitatively by computing various
measures such as amplitude and phase asymmetry, and
instability of the fundamental frequency [69, 87, 91].
Yan et al. [74, 92] have recently suggested using the
Hilbert transform-based characterization. To describe the
experimental trajectory u(t), the complex signal /(t) is
defined as
/ðtÞ ¼ uðtÞ þ jHfuðtÞg ð2Þ
where j is the imaginary unit and H{u(t)} stands for the
Hilbert transform of u(t):
HfuðtÞg ¼ 1
p
Zþ1
�1
uðsÞs� t
ds ð3Þ
Thus, the Hilbert transform is obtained by convolving
u(t) with a time function {-(1/pt)}, i.e. by filtering with a
Fig. 5 Examples of images taken from the same image sequence recorded with a laryngo-videostroboscope
Fig. 6 A frame of vocal folds obtained by videostroboscopy
1514 Eur Arch Otorhinolaryngol (2009) 266:1509–1520
123

90�-phase-shift filter or quadrature filter. Having the
Hilbert transform, the envelope r(t) [88] or the Nyquist
plot [92] are computed to characterize the dynamics of
vocal folds
rðtÞ ¼ffiffiffiffiffiffiffiffiffiffiffiffiffiffiffiffiffiffiffiffiffiffiffiffiffiffiffiffiffiffiffiffiffiffiffiffiffiffiffiffiffiffiffiffiffiffifR½/ðtÞ�g2 þ fI½/ðtÞ�g2
qð4Þ
where R[] and I[] stand for the real and the imaginary part
of the complex signal.
In [92], the Nyquist plot-based analysis is used to
characterize the dynamics of vocal folds. The approach is
applied to both the normalized glottis area waveform
extracted from high-speed digital images and the acoustic
signal. The Nyquist plot or the analytic phase trace maps an
instantaneous trace of the vibratory signal. The phase trace
repeats itself from period to period for a periodic signal.
Scattering in the Nyquist plot is used as a measure of
irregularity of the vocal fold vibrations.
An interesting approach to the characterization of vocal
fold vibrations has been recently proposed by Lohscheller
et al. [84, 93]. The authors suggest representing vocal fold
vibrations by a phonovibrogram (PVG)—a 2D image of
distances of vocal fold edges from the glottal main axis.
The distances are measured at M points equidistantly
spread over the main axis between the posterior and the
anterior glottal ending points. One image frame generates
one column in the 2D image. The image consists of
2M ? 1 rows—one middle point concatenating M distance
values to the edges of the left and the right vocal fold,
respectively. PVG images are considered as vocal fold
vibration fingerprints, as a specific vibration pattern creates
a specific geometrical form within a PVG. The authors
suggest characterizing the PVG geometry by ten regression
lines represented by a set of ten angles.
Granqvist and Lindestad [94] proposed a Fourier analy-
sis-based technique for estimating and visualizing vibration
frequencies in the entire laryngeal area. Vibration frequen-
cies can be evaluated in a specific position defined by an
image pixel or a line in an image, as well as in all pixel
positions. To visualize oscillations, the estimated frequen-
cies are superimposed on an image frame by coloring pixels
corresponding to the oscillating parts of the larynx.
Quantitative characterization in multi-line kymography
Multi-line digital kymography is performed by using many
cross-section lines of the glottis simultaneously [65, 67, 69,
95, 96]. Multi-line kymography is used to reveal glottic
movements differing between the anterior and posterior
commissure. Multi-line kymography is the usual way to
represent the temporal and spatial information on the
vibration amplitude of vocal fold edges. However, such
technique of the representation of the vibration amplitude
is rather redundant and apt to be compromised by mea-
surement errors easily [97]. Liu et al. [97] presented rather
an efficient way to represent information obtained during
multi-line kymography. The authors suggested collecting
the fold vibration amplitude measurements akl made at
different time moments l = 1, 2,..., L and in different
locations k = 1, 2,..., K into a K 9 L matrix A. The matrix
A can be represented as
A ¼XK
i¼1
riuivTi ð5Þ
with ui, vi being the left and the right singular vectors of A
and ri is the corresponding singular value. The vectors ui
and vi reflect spatial and temporal behavior of the fold
vibrations and are called by the authors the spatial and the
temporal eigenfolds. The authors demonstrated that the first
spatial eigenfold reflects the average shape of the vocal
folds, the second eigenfold captures the closing pattern of
the folds, while the third spatial eigenfold reflects the
motion of the vocal folds in the longitudinal direction. The
first temporal eigenfold captures the vibration amplitude
differences between the left and right fold. It is worth
noting that when approximating A with M \ K B L sin-
gular vectors, an optimal approximation is obtained in the
sum of the squared error sense.
Combining imaging and other analysis techniques
A solid endoscope-based high-speed imaging system is
limited to studies of vocal fold vibrations in sustained
phonation. To study the vocal fold vibrations in the sus-
tained phonation and in the production of consonants in
running speech, Kiritani et al. [61, 62] used both the solid
endoscope and the fiberscope-based digital high-speed
imaging systems. High-speed image sequences, speech
waveforms, and EGG signals were utilized. Sakakibara
et al. [63] used a fiberscope-based high-speed imaging
system to study throat singing. High-speed image sequen-
ces, sound and EGG waveforms, and inverse filtering were
utilized in the study. In [58, 98], high-speed image
sequences were compared with synchronized speech
waveforms and EGG signals. Koster et al. [99] synchro-
nously recorded a high-speed image sequence, sound and
EGG and used these three modalities to study voice onset.
The same three modalities have also been used by Bailly
et al. [100] to study the ventricular band vibration and its
interaction with the vocal fold vibration. Henrich et al. [21]
synchronized a high-speed image sequence with an EGG
signal and investigated the suitability of the differentiated
EGG signal for determining the glottal opening and clo-
sure. Granqvist et al. [101], aiming to study the relation-
ship between the vocal fold vibrations and the associated
trans-glottal airflow, recorded high-speed video, EGG, oral
Eur Arch Otorhinolaryngol (2009) 266:1509–1520 1515
123

airflow, oral air pressure, and sound pressure (audio). The
glottal area extracted from the high-speed image sequence
was compared with inverse filtered airflow.
In [102], when studying ‘‘Mongolian throat singing’’,
the kymographic images were manually compared frame
by frame to the sound signal and the high-speed images.
According to Wittenberg et al. [95], an important appli-
cation of simultaneous analysis of high-speed video and
audio signals is searching for glottalizations in the speech
signal. Hertegard and Gauffin [20], by using EGG, inverse
filtered flow waveform, and videostroboscopy, demon-
strated the correspondence between the phases of the
glottal vibration cycle observed in the image sequence and
the inverse filtered flow waveform.
Accuracy of measurements and calibration
Accuracy of measurements of vocal folds on videostrobo-
scopic images was studied in [103]. This included the
investigation of the magnitude of the error of measurement
of the surface areas. The glottal area and the area of the
lesion were studied. The study emphasized the necessity of
correction for differences in magnification and view angle
between images of two recordings, to make a correct
comparison between the images. It was also pointed out
that the measurement error is mainly due to the uncertainty
of the outline of areas with a fuzzy boundary.
To obtain absolute metric spatial dimensions of laryngeal
structures, a high-speed camera system was combined with a
laser projection system [104, 105]. The dimensions of lar-
yngeal structures were determined on digital images. Image
segmentation was applied to extract the glottal area. The
precision of the measurements was limited by non-orthog-
onality of the glottal plane to the optical axis, not exactly
parallel the two laser beams used, and the relatively low
spacial resolution of the camera [104].
A Radon/Hough transform-based technique to calibrate
high-speed image sequences aiming to obtain vocal fold
measurements in a metric scale was recently proposed
[106]. As in [104, 105], an endoscope is equipped with a
laser projection device projecting two parallel lines with a
known distance between them onto the vocal folds. The
distance is the information used for the calibration. The
Radon/Hough transform maps 2D images in such a way
that lines manifest themselves as peaks. The peaks are
detected using image processing procedures.
Discussion
Advanced image analysis procedures are used in laryngeal
diagnostics with increasing frequency. Nonetheless, the
image analysis procedures used are quite often limited to
image visualization, for example, in indirect autofluores-
cence laryngoscopy. Quantification of color, texture, and
shape of lesions and normal tissue could help in a more
accurate categorization of lesions as well as in follow-up
procedures.
High temporal and spacial-horizontal resolution is
achieved in the new generation videokymography system.
One limitation of videokymography is that vibration of the
anterior and posterior parts of vocal folds cannot be
observed simultaneously. One more drawback of video-
kymograpy is the fact that errors caused by the movements
of the endoscope cannot be corrected after recording. In
digital kymograpgy, by contrast, image analysis-based
procedures are available for removing the errors.
High-speed imaging systems are still too expensive to be
widely used in clinical practice. However, regarding the
investigation of vocal fold vibrations, it seems that high-
speed imaging is the most promising approach. Currently,
the low spatial resolution often amounting to 256 9 256 or
less pixels is identified as the main technical limitation of
high-speed imaging systems [70, 107]. A spatial resolution
of at least 1,024 9 1,024 pixels is desired. Higher temporal
resolution would also be very helpful.
The most common temporal resolution of 2,000–4,000
frames/s, currently used in research (in combination with
the spatial resolution of 256 9 256 pixels), is still not high
enough for accurate examination of vocal fold vibrations,
especially for phonations with a high fundamental fre-
quency. For fundamental frequency of 200 Hz and higher,
only a few images are obtained for the open phase of a
glottal area pulse. Thus, the precision of the parameters
calculated from the image sequences is rather limited. Due
to the limited precision and the uncertainty arising in
the glottal area detection, it can be difficult to identify the
source of small variations in values of the parameters. The
variations may occur due to the measurement uncertainty
as well as the treatment applied.
High-speed imaging and digital kymography allow for
extracting numerous image data-based parameters (fea-
tures) that can provide detailed characterization of the
temporal behavior of different parts of the glottis. The
characterization and discrimination power of the parame-
ters can be explored by applying powerful data analysis
techniques. The parameters may enable automated dis-
crimination between various laryngeal disorders and sev-
eral stages of disorders. However, large data sets are
required to assess the validity and reliability of the
parameters. Since high-speed laryngeal imaging systems
are not widely used in clinical practice, gathering large data
sets is rather problematic. Moreover, there are no generally
accepted clinical protocols regarding the use of high-speed
imaging data in laryngology.
1516 Eur Arch Otorhinolaryngol (2009) 266:1509–1520
123
Currently, high-speed imaging is black and white.
Future color high-speed imaging will provide even more
information for studying laryngeal disorders. However,
color imaging requires an increased frame rate and an
increased amount of light. An increased amount of light
may lead to burns in the patient’s oral cavities.
The accuracy and robustness of glottal area detection is
an important issue in quantitative characterization of vocal
fold vibrations, since the robustness of the characterization
is dependent on the robustness of the glottal area detection.
Due to variation in illumination and a large variability of
the appearance of vocal folds, simple thresholding tech-
niques often fail, especially in cases when the glottal
opening is narrow. Therefore, it is difficult to correctly
determine the time moment of gap opening and closure. To
achieve the desired accuracy, semi-automatic glottal area
detection procedures are often utilized, meaning that glottal
area detection techniques sometimes require manual setting
of some parameter values. Therefore, the results of area
detection can be highly sensitive to the operator’s choices.
The results of glottal area detection are also dependent on
the distance between the vocal folds and the endoscope. If
procedures for the compensation of endoscope motion are
not applied, the absolute values of the glottal area cannot
be compared.
Due to a large number of image frames usually recorded
in one sequence during high-speed imaging, fully auto-
mated procedures are highly desirable. Fully automated
procedures, however, require very robust glottal area
detection. This is a complicated task. Due to partial
occlusion of vocal folds by other laryngeal structures, it is
sometimes even impossible to estimate the glottal area
from the images. Advanced data analysis techniques can be
used to provide a value of some certainty measure
regarding glottal area measurement results for a given
image frame. Frames with low certainty values could be
checked manually or skipped, if possible. Thus, high spa-
tial resolution and advanced image analysis techniques can
increase the glottal area detection accuracy and robustness,
and reduce the necessity of manual human involvement.
Acknowledgments We acknowledge the support from The Agency
for International Science and Technology Development Programmes,
Lithuania (COST Action 2103). We acknowledge very helpful
comments from the anonymous reviewer.
Conflict of interest statement There is no conflict of interest.
References
1. Alberti PW (1996) The history of laryngology: a centennial
celebration. Otolaryngol Head Neck Surg 114:345–354
2. Mafee MF, Valvassori GE, Becker M (2005) Imaging of the
neck and head, 2nd edn. Thieme, Stuttgart
3. Uloza V, Saferis V, Uloziene I (2005) Perceptual and acoustic
assessment of voice pathology and the efficacy of endolaryngeal
phonomicrosurgery. J Voice 19:138–145
4. Gallivan KH, Gallivan GJ (2002) Bilateral mixed laryngoceles:
simultaneous strobovideolaryngoscopy and external video
examination. J Voice 16:258–266
5. Rumboldt Z, Gordon L, Ackermann RBS (2006) Imaging in
head and neck cancer. Curr Treat Options Oncol 7:23–34
6. Ruffing S, Struffert T, Reith AGW (2005) Imaging diagnostics
of the pharynx and larynx. Radiologe 45:828–836
7. Hasso AN, Tang T (1994) Magnetic resonance imaging of the
pharynx and larynx. Top Magn Reson Imaging 6:224–240
8. Hoorweg JJ, Kruijt RH, Heijboer RJ, Eijkemans MJ, Kerrebijn
JD (2006) Reliability of interpretation of CT examination of the
larynx in patients with glottic laryngeal carcinoma. Arch Oto-
laryngol Head Neck Surg 135:129–134
9. Rubin JS, Lee S, McGuinness J, Hore I, Hill D, Berger L
(2004) The potential role of ultrasound in differentiating
solid and cystic swellings of the true vocal fold. J Voice
18:231–235
10. Schade G, Kothe C, Leuwer R (2003) Sonography of the lar-
ynx—an alternative to laryngoscopy? HNO 51:585–590
11. Boyanov B, Hadjitodorov S (1997) Acoustic analysis of path-
ological voices. A voice analysis system for the screening of
laryngeal diseases. IEEE Eng Med Biol Mag 16:74–82
12. Hadjitodorov S, Mitev P (2002) A computer system for acoustic
analysis of pathological voices and laryngeal diseases screening.
Med Eng Phys 24:419–429
13. Moran RJ, Reilly RB, de Chazal P, Lacy PD (2006) Telephony-
based voice pathology assessment using automated speech
analysis. IEEE Trans Biomed Eng 53:468–477
14. Umapathy K, Krishnan S, Parsa V, Jamieson DG (2005) Dis-
crimination of pathological voices using a time-frequency
approach. IEEE Trans Biomed Eng 52:421–430
15. Hadjitodorov S, Boyanov B, Teston B (2000) Laryngeal
pathology detection by means of class-specific neural maps.
IEEE Trans Inf Technol Biomed 4:68–73
16. Godino-Llorente JI, Gomez-Vilda P (2004) Automatic detection
of voice impairments by means of short-term cepstral parame-
ters and neural network based detectors. IEEE Trans Biomed
Eng 51:380–384
17. de Oliveira Rosa M, Pereira JC, Grellet M (2000) Adaptive
estimation of residue signal for voice pathology diagnosis. IEEE
Trans Biomed Eng 47:96–104
18. Gelzinis A, Verikas A, Bacauskiene M (2008) Automated
speech analysis applied to laryngeal disease categorization.
Comput Methods Programs Biomed 91:36–47
19. Verikas A, Gelzinis A, Bacauskiene M, Uloza V, Kaseta M
(2009) Using the patient’s questionnaire data to screen laryngeal
disorders. Comput Biol Med 39:148–155
20. Hertegard S, Gauffin J (1995) Glottal area and vibratory patterns
studied with simultaneous stroboscopy, flow glottography, and
electroglottography. J Speech Hear Res 38:85–100
21. Henrich N, d’Alessandro C, Doval B, Castellengo M (2004) On
the use of the derivative of electroglottographic signals for
characterization of nonpathological phonation. J Acoust Soc Am
115:1321–1332
22. Ilgner JFR, Palm C, Schutz AG, Spitzer K, Westhofen M,
Lehmann TM (2003) Colour texture analysis for quantitative
laryngoscopy. Acta Otolaryngol 123:730–734
23. Haralick RM, Shanmugam K, Dinstein I (1973) Textural fea-
tures for image classification. IEEE Trans Syst Man Cybern
3:610–621
Eur Arch Otorhinolaryngol (2009) 266:1509–1520 1517
123

24. Gelzinis A, Verikas A, Bacauskiene M (2007) Increasing the
discrimination power of the co-occurrence matrix-based fea-
tures. Pattern Recognit 40:2367–2372
25. Verikas A, Gelzinis A, Bacauskiene M, Uloza V (2006)
Towards a computer-aided diagnosis system for vocal cord
diseases. Artif Intell Med 36:71–84
26. Verikas A, Gelzinis A, Valincius D, Bacauskiene M, Uloza V
(2007) Multiple feature sets based categorization of laryngeal
images. Comput Methods Programs Biomed 85:257–266
27. Poels PJP, de Jong FICS, Schutte HK (2003) Consistency of the
preoperative and intraoperative diagnosis of benign vocal fold
lesions. J Voice 17:425–433
28. Verikas A, Gelzinis A, Bacauskiene M, Uloza V (2006) Inte-
grating global and local analysis of colour, texture and geo-
metrical information for categorizing laryngeal images. Intern J
Pattern Recognit Artif Intell 20:1187–1205
29. Hanson DG, Jiang J, Chi W (1998) Quantitative color analysis
of laryngeal erythema in chronic posterior laryngitis. J Voice
12:78–83
30. Arens C, Reussner D, Woenkhaus J, Leunig A, Betz CS, Glanz
H (2007) Indirect fluorescence laryngoscopy in the diagnosis of
precancerous and cancerous laryngeal lesions. Eur Arch
Otorhinolaryngol 264:621–626
31. Arens C, Dreyer T, Glanz H, Malzahn K (2004) Indirect auto-
fluorescence laryngoscopy in the diagnosis of laryngeal cancer
and its precursor lesions. Eur Arch Otorhinolaryngol 261:71–76
32. Baletic N, Petrovic Z, Pendjer I, Malicevic H (2004) Autoflu-
orescent diagnostics in laryngeal pathology. Eur Arch Otorhi-
nolaryngol 261:233–237
33. Csanady M, Kiss JG, Ivan L, Jori J, Czigner J (2004) ALA
(5-aminolevulinic acid)-induced protoporphyrin IX fluorescence
in the endoscopic diagnostic and control of pharyngo-laryngeal
cancer. Eur Arch Otorhinolaryngol 261:262–266
34. Zargi M, Fajdiga I, Smid L (2000) Autofluorescence imaging in
the diagnosis of laryngeal cancer. Eur Arch Otorhinolaryngol
257:17–23
35. Hsiao TY, Wang CL, Chen CN, Hsieh FJ, Shau YW (2001)
Noninvasive assessment of laryngeal phonation function using
color doppler ultrasound imaging. Ultrasound Med Biol
27:1035–1040
36. Hsiao TY, Wang CL, Chen CN, Hsieh FJ, Shau YW (2002)
Elasticity of human vocal folds measured in vivo using color
doppler imaging. Ultrasound Med Biol 28:1145–1152
37. Shau YW, Wang CL, Hsieh FJ, Hsiao TY (2001) Noninvasive
assessment of vocal fold mucosal wave velocity using color
doppler imaging. Ultrasound Med Biol 27:1451–1460
38. Niimi S, Matsunaga A, Hirose H (1992) Ultrasonic observation
of the vertical movement of the larynx during phonation. In:
Proceedings of international congress on acoustics, vol 1–4,
Beijing, pp 1317–1318
39. Goncalves MI, Leonard R (1998) A hardware-software system
for analysis of video images. J Voice 12:143–150
40. Popolo PS, Titze IR (2008) Qualification of a quantitative lar-
yngeal imaging system using videostroboscopy and videoky-
mography. Ann Otol Rhinol Laryngol 117:404–412
41. Rihkanen H, Reijonen P, Lehikoinen-Soderlund S, Lauri ER
(2004) Videostroboscopic assessment of unilateral vocal fold
paralysis after augmentation with autologous fascia. Eur Arch
Otorhinolaryngol 261:177–183
42. Lee JS, Kim IE, Sung MW, Kim KH, Sung MY, Park KS (2001)
A method for assessing the regional vibratory pattern of vocal
folds by analysing the video recording of stroboscopy. Med Biol
Eng Comput 39:273–278
43. Woo P, Colton RH, Casper JK, Brewer DW (1991) Diagnostic
value of stroboscopic examination in hoarse patients. J Voice
5:231–238
44. Colton RH, Woo P, Brewer DW, Griffin B, Casper J (1995)
Stroboscopic signs associated with benign lesions of the vocal
folds. J Voice 9:312–325
45. Sung MW, Kim KH, Koh TY, Kwon TY, Mo JH, Choi SH, Lee
JS, Park KS, Kim EJ, Sung MY (1999) Videostrobokymogra-
phy: a new method for the quantitative analysis of vocal fold
vibration. Laryngoscope 109:1859–1863
46. Sulter AM, Schutte HK, Miller DG (1996) Standardized lar-
yngeal videostroboscopic rating: differences between untrained
and trained male and female subjects, and effects of varying
sound intensity fundamental frequency, and age. J Voice
10:175–189
47. Deguchi S, Ishimaru Y, Washio S (2007) Preliminary evaluation
of stroboscopy system using multiple light sources for obser-
vation of pathological vocal fold oscillatory pattern. Ann Otol
Rhinol Laryngol 116:687–694
48. Schade G, Hess M, Muller F, Kirchhoff T, Ludwigs M, Hillman
R, Kobler J (2002) Physical and technical elements of short-
interval, color-filtered double strobe flash-stroboscopy. HNO
50:1079–1083
49. Hess MM, Ludwigs M (2000) Strobophotoglottographic trans-
illumination as a method for the analysis of vocal fold vibration
patterns. J Voice 14:255–271
50. Dailey SH, Kobler J, Hillman RE, Tangrom K, Thananart E,
Mauri M, Zeitels SM (2005) Endoscopic measurement of vocal
fold movement during adduction and abduction. Laryngoscope
115:178–183
51. Svec JG, Schutte HK (1996) Videokymography: high-speed line
scanning of vocal fold vibration. J Voice 10:201–205
52. Schutte HK, Svec JG, Sram F (1998) First results of clinical
application of videokymography. Laryngoscope 108:1206–1210
53. Qiu QJ, Schutte HK (2006) A new generation videokymography
for routine clinical vocal fold examination. Laryngoscope
116:1824–1828
54. Qiu QJ, Schutte HK (2007) Real-time kymographic imaging for
visualizing human vocal-fold vibratory function. Rev Sci
Instrum 78:1–6
55. Manfredi C, Bocchi L, Bianchi S, Migali N, Cantarella G (2006)
Objective vocal fold vibration assessment from videokymo-
graphic images. Biomed Signal Process Control 1:129–136
56. de Leeuw IMV, Festen JM, Mahieu HF (2001) Deviant vocal
fold vibration as observed during videokymography: the effect
on voice quality. J Voice 15:313–322
57. Eysholdt U, Tigges M, Wittenberg T, Proschel U (1996) Direct
evaluation of high-speed recordings of vocal fold vibrations.
Folia Phoniatr Logop 48:163–170
58. Kiritani S, Honda K, Imagawa H, Hirose H (1986) Simultaneous
high-speed digital recording of vocal fold vibration and speech
signal. In: Proceedings of the IEEE international conference on
acoustics, speech, and signal processing, vol 11, Tokyo,
pp 1633–1636
59. Kiritani S, Imagawa H, Hirose H (1988) High-speed digital
image recording for the observation of vocal cord vibration. In:
Vocal physiology: voice production, mechanism, and functions.
Raven Press, New York, pp 261–269
60. Kiritani S, Imagawa H, Hirose H (1990) Vocal cord vibration
and voice source characteristics—observations by a high-speed
digital recording. In: Proceedings of the international confer-
ence on spoken language processing (ICSLP ’90), Kobe,
pp 61–64
61. Kiritani S, Hirose H, Imagawa H (1993) High-speed digital
image-analysis of vocal cord vibration in diplophonia. Speech
Commun 13:23–32
62. Kiritani S, Hirose H, Imagawa H (1993) High-speed digital
image recording system for observing vocal cord vibration. Ann
Bull RILP 27:79–87
1518 Eur Arch Otorhinolaryngol (2009) 266:1509–1520
123

63. Sakakibara KT, Imagawa H, Konishi T, Kondo K, Murano EZ,
Kumada M, Niimi S (2001) Vocal fold and false vocal fold
vibrations in throat singing and synthesis of khoomei. In:
Proceedings of the international computer music conference
2001, Havana, Cuba, International Computer Music Associa-
tion, pp 135–138
64. Hertegard S (2005) What have we learned about laryngeal
physiology from high-speed digital videoendoscopy? Curr Opin
Otolaryngol Head Neck Surg 13:152–156
65. Kendall KA, Browning MM, Skovlund SM (2005) Introduction
to high-speed imaging of the larynx. Curr Opin Otolaryngol
Head Neck Surg 13:135–137
66. Schwarz R, Dollinger M, Wurzbacher T, Eysholdt U,
Lohscheller J (2008) Spatio-temporal quantification of vocal
fold vibrations using high-speed videoendoscopy and a biome-
chanical model. J Acoust Soc Am 123:2717–2732
67. Tigges M, Wittenberg T, Mergell P, Eysholdt U (1999) Imaging
of vocal fold vibration by digital multi-plane kymography.
Comput Med Imaging Graph 23:323–330
68. Kim DY, Kim LS, Kim KH, Sung MW, Roh JL, Kwon TK, Lee
SJ, Choi SH, Wang SG, Sung MY (2003) Videostrobokymo-
graphic analysis of benign vocal fold lesions. Acta Otolaryngol
123:1102–1109
69. Eysholdt U, Rosanowski F, Hoppe U (2003) Vocal fold vibra-
tion irregularities caused by different types of laryngeal asym-
metry. Eur Arch Otorhinolaryngol 260:412–417
70. Lohscheller J, Toy H, Rosanowski F, Eysholdt U, Dollinger M
(2007) Clinically evaluated procedure for the reconstruction of
vocal fold vibrations from endoscopic digital high-speed videos.
Med Image Anal 11:400–413
71. Deliyski DD (2005) Endoscope motion compensation for lar-
yngeal high-speed videoendoscopy. J Voice 19:485–496
72. Deliyski D, Petrushev P (2003) Methods for objective assessment
of high-speed videoendoscopy. In: Proceedings of the 6th inter-
national conference: advances in quantitative laryngology, voice
and speech research, AQL-2003, Hamburg, Germany, pp 1–16
73. Tao C, Zhang Y, Jiang JJ (2007) Extracting physiologically
relevant parameters of vocal folds from high-speed video image
series. IEEE Trans Biomed Eng 54:794–801
74. Yan Y, Ahmad K, Kunduk M, Bless D (2005) Analysis of vocal-
fold vibrations from high-speed laryngeal images using a Hilbert
transform-based methodology. J Voice 19:161–175
75. Yan Y, Bless D, Chen X (2005) Biomedical image analysis in
high-speed laryngeal imaging of voice production. In: Pro-
ceedings of the 2005 IEEE engineering in medicine and biology
27th annual conference, Shanghai, pp 7684–7687
76. Larsson H, Hertegard S, Lindestad PA, Hammarberg B (2000)
Vocal fold vibrations: high-speed imaging, kymography, and
acoustic analysis: a preliminary report. Laryngoscope
110:2117–2122
77. Yan Y, Chen X, Bless D (2006) Automatic tracing of vocal-fold
motion from high-speed digital images. IEEE Trans Biomed
Eng 53:1394–1400
78. Wittenberg T, Moser M, Tigges M, Eysholdt U (1995)
Recording, processing, and analysis of digital high-speed
sequences in glottography. Mach Vis Appl 8:399–404
79. Allin S, Galeotti J, Stetten G, Dailey SH (2004) Enhanced snake
based segmentation of vocal folds. In: Proceedings of the IEEE
international symposium on biomedical imaging, Washington,
DC, IEEE, pp 812–815
80. Marendic B, Galatsanos N, Bless D (2001) A new active contour
algorithm for tracking vocal folds. In: Proceedings of the IEEE
international conference on image processing, Thessaloniki, pp
397–400
81. Otsu N (1979) A threshold selection method from gray-level
histograms. IEEE Trans Syst Man Cybern 9:62–66
82. Lohscheller J, Dollinger M, Schuster M, Schwarz R, Eysholdt U,
Hoppe U (2004) Quantitative investigation of the vibration
pattern of the substitute voice generator. IEEE Trans Biomed
Eng 51:1394–1400
83. Osma-Ruiz V, Godino-Llorente JI, Saenz-Lechon N, Fraile R
(2008) Segmentation of the glottal space from laryngeal images
using the watershed transform. Comput Med Imaging Graph
32:193–201
84. Lohscheller J, Eysholdt U, Toy H, Dollinger M (2008) Phono-
vibrography: mapping high-speed movies of vocal fold vibra-
tions into 2-d diagrams for visualizing and analyzing the
underlying laryngeal dynamics. IEEE Trans Med Imaging
27:300–309
85. Braunschweig T, Schelhorn-Neise P, Dollinger M (2008)
Diagnosis of functional voice disorders by using the high speed
recording technics. Laryngorhinootologie 87:323–330
86. Mortensen M, Woo P (2008) High-speed imaging used to detect
vocal fold paresis: a case report. Ann Otol Rhinol Laryngol
117:684–687
87. Dollinger M, Braunschweig T, Lohscheller J, Eysholdt U,
Hoppe U (2003) Normal voice production: computation of
driving parameters from endoscopic digital high speed images.
Methods Inf Med 42:271–276
88. Braunschweig T, Flaschka J, Schelhorn-Neise P, Dollinger M
(2008) High-speed video analysis of the phonation onset, with
an application to the diagnosis of functional dysphonias. Med
Eng Phys 30:59–66
89. Dollinger M, Hoppe U, Hettlich F, Lohscheller J, Schuberth S,
Eysholdt U (2002) Vibration parameter extraction from endo-
scopic image series of the vocal folds. IEEE Trans Biomed Eng
49:773–781
90. Schwarz R, Hoppe U, Schuster M, Wurzbacher T, Eysholdt U,
Lohscheller J (2006) High-precision measurement of the vocal
fold length and vibratory amplitudes. IEEE Trans Biomed Eng
53:1099–1108
91. Mergell P, Herzel HP, Titze IR (2000) Irregular vocal-fold
vibration—high speed observation and modeling. J Acoust Soc
Am 108:2996–3002
92. Yan Y, Damrose E, Bless D (2007) Automatic tracing of vocal-
fold motion from high-speed digital images. J Voice 21:604–616
93. Lohscheller J, Doellinger M, McWhorter AJ, Kunduk M (2008)
Preliminary study on the quantitative analysis of vocal loading
effects on vocal fold dynamics using phonovibrograms. Ann
Otol Rhinol Laryngol 117:484–493
94. Granqvist S, Lindestad PA (2001) A method of applying fourier
analysis to high-speed laryngoscopy. J Acoust Soc Am
110:3193–3197
95. Wittenberg T, Tigges M, Mergell P, Eysholdt U (2000) Func-
tional imaging of vocal fold vibration: digital multislice high-
speed kymography. J Voice 14:422–442
96. Eysholdt U, Rosanowski F, Hoppe U (2003) Measurement and
interpretation of irregular vocal fold vibrations. HNO 51:710–
716
97. Liu L, Galatsanos N, Bless D (2002) A new approach for
analysis of vibrating vocal folds. In: Proceedings of the IEEE
international symposium on biomedical imaging, Washington,
DC, pp 589–592
98. Kiritani S, Niimi S, Imagawa H, Hirose H (1995) Vocal fold
vibrations associated with involuntary voice changes in certain
pathological cases. In: Vocal fold physiology: voice quality
control. Vocal Fold Physiology Series, Kurume, Japan, pp 269–
281
99. Koster O, Marx B, Gemmar P, Hess MM, Ktinzel HJ (1999)
Qualitative and quantitative analysis of voice onset by means of
a multidimensional voice analysis system (mvas) using high-
speed imaging. J Voice 13:355–374
Eur Arch Otorhinolaryngol (2009) 266:1509–1520 1519
123

100. Bailly L, Henrich N, Webb M, Muller F, Licht AK, Hess M
(2007) Exploration of vocal-folds and ventricular-bands inter-
action in singing using high-speed cinematography and elec-
troglottography. In: 19th international congress on acoustics,
Madrid, Spain, pp 1–6
101. Granqvist S, Hertegard S, Larsson H, Sundberg J (2003) Simul-
taneous analysis of vocal fold vibration and transglottal airflow:
exploring a new experimental setup. J Voice 17:319–330
102. Lindestad PA, Sodersten M, Merker B, Granqvist S (2001)
Voice source characteristics in mongolian ‘‘throat singing’’
studied with high-speed imaging technique, acoustic spectra,
and inverse filtering. J Voice 15:78–85
103. Svec JG, Schutte HK (2005) Accuracy of measurements on
digital videostroboscopic images of the vocal folds. Ann Otol
Rhinol Laryngol 114:443–450
104. Schuberth S, Hoppe U, Dollinger M, Lohscheller J, Eysholdt U
(2002) High-precision measurement of the vocal fold length and
vibratory amplitudes. Laryngoscope 112:1043–1049
105. Schuster M, Lohscheller J, Kummer P, Eysholdt U, Hoppe U
(2005) Laser projection in high-speed glottography for high-
precision measurements of laryngeal dimensions and dynamics.
Eur Arch Otorhinolaryngol 262:477–481
106. Wurzbacher T, Voigt I, Schwarz R, Dollinger M, Hoppe U,
Penne J, Eysholdt U, Lohscheller J (2008) Calibration of lar-
yngeal endoscopic high-speed image sequences by an automated
detection of parallel laser line projections. Med Image Anal
12:300–317
107. Schade G, Muller F (2005) Physical and technical elements of
short-interval, color-filtered double strobe flash-stroboscopy.
HNO 53:1085–1091
1520 Eur Arch Otorhinolaryngol (2009) 266:1509–1520
123
Copyright © 2022 FDOKUMEN