
Recent advances and key challenges in investigations of the flow inside human...
20
This article was downloaded by: [University of Ottawa] On: 30 October 2012, At: 07:30 Publisher: Taylor & Francis Informa Ltd Registered in England and Wales Registered Number: 1072954 Registered office: Mortimer House, 37-41 Mortimer Street, London W1T 3JH, UK International Journal of Computational Fluid Dynamics Publication details, including instructions for authors and subscription information: http://www.tandfonline.com/loi/gcfd20 Recent advances and key challenges in investigations of the flow inside human oro-pharyngeal-laryngeal airway A. Pollard a , M. Uddin b , A.-M. Shinneeb a & C.G. Ball c a Department of Mechanical and Materials Engineering, Queen's University, Kingston, ON K7L 3N6, Canada b Department of Mechanical Engineering and Engineering Science, University of North Carolina, Charlotte, NC, 28223, USA c Graduate School of Medicine, University of Wollongong, Wollongong, NSW, 2522, Australia Version of record first published: 17 May 2012. To cite this article: A. Pollard, M. Uddin, A.-M. Shinneeb & C.G. Ball (2012): Recent advances and key challenges in investigations of the flow inside human oro-pharyngeal-laryngeal airway, International Journal of Computational Fluid Dynamics, 26:6-8, 363-381 To link to this article: http://dx.doi.org/10.1080/10618562.2012.668616 PLEASE SCROLL DOWN FOR ARTICLE Full terms and conditions of use: http://www.tandfonline.com/page/terms-and-conditions This article may be used for research, teaching, and private study purposes. Any substantial or systematic reproduction, redistribution, reselling, loan, sub-licensing, systematic supply, or distribution in any form to anyone is expressly forbidden. The publisher does not give any warranty express or implied or make any representation that the contents will be complete or accurate or up to date. The accuracy of any instructions, formulae, and drug doses should be independently verified with primary sources. The publisher shall not be liable for any loss, actions, claims, proceedings, demand, or costs or damages whatsoever or howsoever caused arising directly or indirectly in connection with or arising out of the use of this material.
-
Upload
independent -
Category
Documents
-
view
3 -
download
0
Transcript of Recent advances and key challenges in investigations of the flow inside human...

This article was downloaded by: [University of Ottawa]On: 30 October 2012, At: 07:30Publisher: Taylor & FrancisInforma Ltd Registered in England and Wales Registered Number: 1072954 Registered office: Mortimer House,37-41 Mortimer Street, London W1T 3JH, UK
International Journal of Computational Fluid DynamicsPublication details, including instructions for authors and subscription information:http://www.tandfonline.com/loi/gcfd20
Recent advances and key challenges in investigationsof the flow inside human oro-pharyngeal-laryngealairwayA. Pollard a , M. Uddin b , A.-M. Shinneeb a & C.G. Ball ca Department of Mechanical and Materials Engineering, Queen's University, Kingston, ON K7L3N6, Canadab Department of Mechanical Engineering and Engineering Science, University of NorthCarolina, Charlotte, NC, 28223, USAc Graduate School of Medicine, University of Wollongong, Wollongong, NSW, 2522, AustraliaVersion of record first published: 17 May 2012.
To cite this article: A. Pollard, M. Uddin, A.-M. Shinneeb & C.G. Ball (2012): Recent advances and key challenges ininvestigations of the flow inside human oro-pharyngeal-laryngeal airway, International Journal of Computational FluidDynamics, 26:6-8, 363-381
To link to this article: http://dx.doi.org/10.1080/10618562.2012.668616
PLEASE SCROLL DOWN FOR ARTICLE
Full terms and conditions of use: http://www.tandfonline.com/page/terms-and-conditions
This article may be used for research, teaching, and private study purposes. Any substantial or systematicreproduction, redistribution, reselling, loan, sub-licensing, systematic supply, or distribution in any form toanyone is expressly forbidden.
The publisher does not give any warranty express or implied or make any representation that the contentswill be complete or accurate or up to date. The accuracy of any instructions, formulae, and drug doses shouldbe independently verified with primary sources. The publisher shall not be liable for any loss, actions, claims,proceedings, demand, or costs or damages whatsoever or howsoever caused arising directly or indirectly inconnection with or arising out of the use of this material.
Recent advances and key challenges in investigations of the flow inside
human oro-pharyngeal-laryngeal airway
A. Pollarda*, M. Uddinb, A.-M. Shinneeba and C.G. Ballc
aDepartment of Mechanical and Materials Engineering, Queen’s University, Kingston, ON K7L 3N6, Canada; bDepartment ofMechanical Engineering and Engineering Science, University of North Carolina, Charlotte, NC 28223, USA; cGraduate School of
Medicine, University of Wollongong, Wollongong, NSW 2522, Australia
(Received 24 August 2011; final version received 9 February 2012)
The oro-pharyngeal-laryngeal human airway is a complex geometry; the flow physics within are subjected to andinfluenced by a variety of different factors that produce jet-like flow, re-circulating flows that are enhanced bycurvature, detached and secondary flows. Simulation and experiment are the tools available to the fluid dynamicsresearcher. Simulation results obtained from direct and large-eddy simulation, and Reynolds-averaged Navier–Stokes and associated models of turbulence are reviewed. Experimental data obtained through the use of flowvisualisation, hot-wire anemometry and particle image velocimetry are also reviewed. A comparison of dataobtained from the application of these tools reveals many inconsistencies that are explored in this article. Whilemuch progress has been made to understand some of the physics of the flow in the human airway, we continue touncover new and significant fluid dynamic behaviour. Finally, future research directions are suggested.
Keywords: turbulence; experimental techniques; direct simulation; turbulence modelling; human airway
1. Introduction
Computational fluid dynamics (CFD) is a methodologythat has continued to mature over the last 50 years or so.These 50 years span the career of a couple of generationsof CFD practitioners, and during this time the dream ofmany originators of CFD methods and models embo-died therein was to see this tool used to ‘predict’ (inquotes, because it is recognised that, even now, we mustknow a flow before predicting it computationally withconfidence) any and all phenomena encountered withinthe realm of physicochemical hydrodynamics. And yetthe community, in the opinion of the authors, hasadvanced well beyond what is justifiably predictable dueto non-congruence between experimental and computa-tional data. The authors believe that a great deal ofmodelling reported in the literature is based uponmethods with unknown deficiencies and with little effortto compensate for or estimate the scale of the resultanterrors; in all likelihood, few other fields have seen suchan explosion of unjustifiable predictions than those forthe purported effects of surgical intervention or aero-solised drug delivery.
In this article, a very complex flow is considered,and a variety of computational tools and experimentaldata obtained using different techniques are introducedand critiqued as a reminder, to the CFD community inparticular, of the stringent need that predictions be
considered questionable unless measured against ex-perimental (or properly resolved direct numericalsimulation, DNS, or perhaps large eddy simulation,LES) data that are subjected to equally stringentassessment. Interdisciplinary CFD is at the heart ofthis article.
Clinically (and perhaps most comprehensively), theupper respiratory tract comprises the mouth, oralcavity and associated structures; the nostrils; the nasalcavity, its associated structures (i.e. turbinates andnasal hairs), and connected passages (the sinuses andeustachian tubes); the pharynx; the larynx; and finallythe trachea and mainstem bronchi. Physiologically, theupper respiratory tract is important because it serves asthe sole route for nutrient delivery (oxygen is carried tothe lungs, food is diverted from the pharynx to thestomach via the oesophagus). The lower airways helpto maintain homeostasis (through oxygen/carbon-dioxide exchange, acid–base balance, etc.), whileguarding against infection (moist mucous membranesand nasal hairs trap large particles, the mucociliaryescalator removes small particles, and the pharyngeallymphoid ring guards against pathogens). Finally, it isan important site for delivery of medications (oral,sub-lingual, intra-nasal and inhaled).
In the past, the majority of efforts have beendirected to understand the basic fluid mechanics in the
*Corresponding author. Email: [email protected]
International Journal of Computational Fluid Dynamics
Vol. 26, Nos. 6–8, July–September 2012, 363–381
ISSN 1061-8562 print/ISSN 1029-0257 online
� 2012 Taylor & Francis
http://dx.doi.org/10.1080/10618562.2012.668616
http://www.tandfonline.com
Dow
nloa
ded
by [
Uni
vers
ity o
f O
ttaw
a] a
t 07:
30 3
0 O
ctob
er 2
012
airway to eventually improve drug delivery to the lungsvia the oro-pharyngeal-laryngeal human airway (OPLhenceforth). A new, emerging driver is even morechallenging: virtualisation of corrective surgery toeffect improved breathing patterns in clinically abnor-mal airways. That said, this article provides anoverview of the methods and limitations of dataobtained in a human airway and the cautious interplaybetween simulations and experiments as well as theinterdependency of outlet/inlet conditions as the flowproceeds from one region to another with a viewtowards drug delivery. In so doing, reasons areexamined and questions proposed regarding the causesfor either agreement or disagreement between experi-ments and simulations.
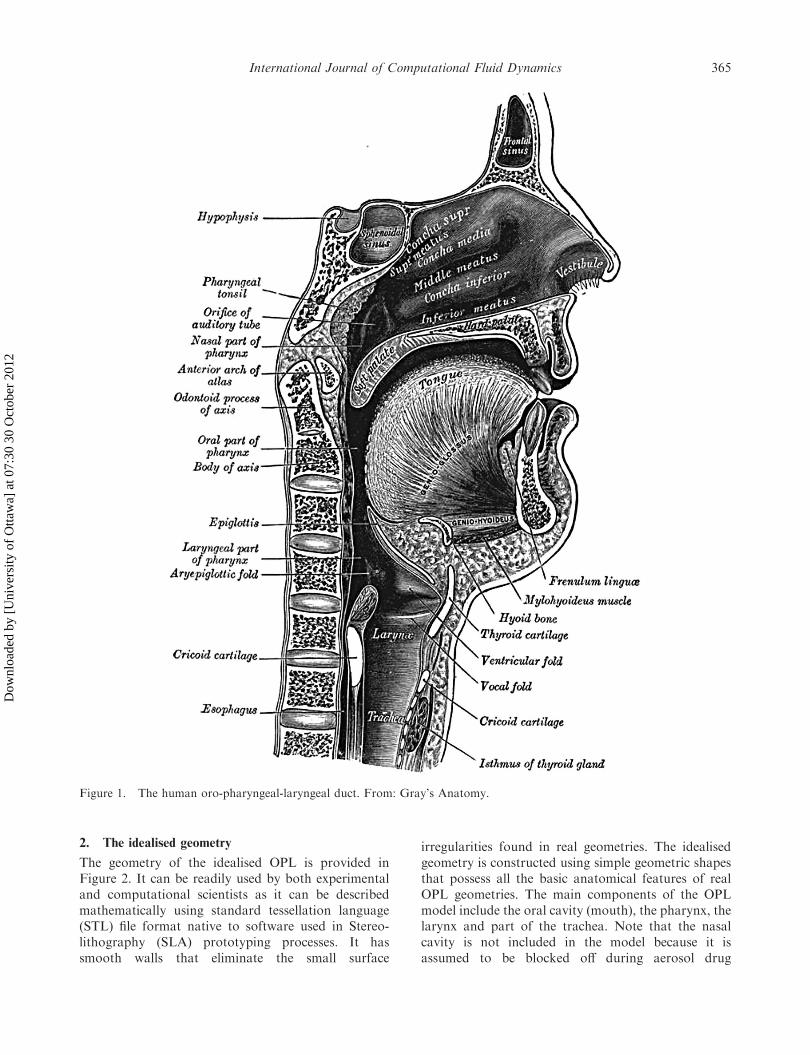
The upper airway considered here extends from themouth, through the oral cavity, pharynx and larynx, tothe trachea. Inhaled pharmaceuticals are rarely, if ever,administered via the nose which acts as a highlyeffective filter; so the nasal passages are not includedin this already complex airway (for the interestedreader, see Schroeter et al. 2006, Shi et al. 2006,Zamankhan et al. 2006, Doorly et al. 2008a,c, Xi andLongest 2008). The various regions of the OPL aregeometrically very different. The oral cavity is precededby the lips and teeth, each with different radii ofcurvature; the oral cavity may be described as havingthe shape of a prolate spheroid that features differentradii of curvature along the sagittal and coronal planes.In the posterior of the oral cavity, the cross sectionalshape converges almost to circular, and is then sub-tended by the uvula. In the oropharynx, the shaperemains somewhat circular before the glottal region. Inthis region, the epiglottis protrudes into the oropharynxvolume; air must travel around it before entering thetrachea and then on to the first bronchi and the lungs.These features are highlighted in Figure 1.
Typically, during drug delivery using, say, ametered dose inhaler, the human subject will pursetheir lips and inhale; this inspiration opens the airwaybecause of the pressure change between the atmo-sphere and the lungs that result from the suddenincrease in volume in the lungs caused by thecontraction of the diaphragm. Breathing is cyclical,but the majority of attention by the fluid dynamics anddrug delivery communities has been directed to theinspiration portion of the cycle, leaving the fluiddynamics of the expiration portion of the cyclesomewhat unexplored. Despite optimal inhaler techni-que, supplemented by the use of spacer devices, drugdelivery rates to the alveolar regions of the lungs areminimal; typically 80% to 95% of an inhaled dose isdeposited in the extra-thoracic airway and ultimatelychannelled to the gastro-intestinal tract or washed out(Gonda 1992). Arguably, the flow in the upper-airways
has a profound effect on drug deposition and delivery –in mouth breathing, air flow rates can vary signifi-cantly with ventilatory effort and physiological de-mand. There is the additional complication of thehighly variable geometry of the upper-airway which,even with steady inspiration, generates Reynoldsnumbers (Re ¼ UB
ffiffiffiffi
Ap
=n, based upon local bulkvelocity UB and cross-sectional area A) in the range650 � Re � 13; 000, see Johnstone et al. (2004). Withthis Reynolds number range, the flow varies fromlaminar-like, to transitional, to fully turbulent – evenat a single inspiratory flow rate, owing to the variablegeometry of the airway. This does not diminish theneed for realistic transient flow data in a real OPL;rather, the steady flow problems must be mastered. Inthis review, steady, inspired flow is considered.
It is obvious that human subjects have some OPLgeometric variability; indeed, some might argue, aconsiderable variability exists from child to healthy ordiseased adult to geriatric patient with reduced breath-ing volumes. And so, it is useful to consider anidealised geometry that contains all the basic physio-logical elements found in an actual airway.
Over the last decade or so, the flow and particledeposition patterns inside an idealised geometry of theOPL have been investigated using both experimentaland computational methods. Taken in isolation, dataobtained from one approach is often difficult toreconcile against data obtained from another. Thus,in this article, the interplay between simulation andexperiment is considered, and attention is drawn to thestrengths and weaknesses associated with their appli-cation and the care required in interpreting those datathat result.
This article is based upon about a decade’s worthof work that emanated from the lead author’slaboratory. While it relies heavily on previouslypublished or presented material, which is duly notedand acknowledged, it offers a fresh look at what hasbeen recently learned and provides suggestions wherethe authors think further research is warranted.
This article is laid out as follows. The idealisedgeometry is described and the fluid dynamic regionsthat are considered interesting are highlighted. Theexperimental methods that have been employed toinvestigate the flow in the airway are described, as arethe various computational approaches. This is thenfollowed by presentation and discussion of results,with emphasis on weaknesses in those data obtainedfrom both experiment and simulation. Some new dataobtained from full field particle image velocimetry(PIV) are also presented to highlight some of theseweaknesses to be addressed. Finally, the article endswith sections that deal with key challenges and somesuggestions for future work.
364 A. Pollard et al.
Dow
nloa
ded
by [
Uni
vers
ity o
f O
ttaw
a] a
t 07:
30 3
0 O
ctob
er 2
012
2. The idealised geometry
The geometry of the idealised OPL is provided inFigure 2. It can be readily used by both experimentaland computational scientists as it can be describedmathematically using standard tessellation language(STL) file format native to software used in Stereo-lithography (SLA) prototyping processes. It hassmooth walls that eliminate the small surface
irregularities found in real geometries. The idealisedgeometry is constructed using simple geometric shapesthat possess all the basic anatomical features of realOPL geometries. The main components of the OPLmodel include the oral cavity (mouth), the pharynx, thelarynx and part of the trachea. Note that the nasalcavity is not included in the model because it isassumed to be blocked off during aerosol drug
Figure 1. The human oro-pharyngeal-laryngeal duct. From: Gray’s Anatomy.
International Journal of Computational Fluid Dynamics 365
Dow
nloa
ded
by [
Uni
vers
ity o
f O
ttaw
a] a
t 07:
30 3
0 O
ctob
er 2
012

delivery. This design was developed based on informa-tion from magnetic resonance imaging (MRI) andcomputed tomography (CT) scans, direct observationof living subjects, and data in the archival literature.The introduction of the idealised geometry by WarrenFinlay’s group at the University of Alberta and therationale behind the geometry and choice of dimen-sions are fully described in Stapleton et al. (2000).
3. Overview of basic fluid dynamic features and scaling
options for flow inside the OPL
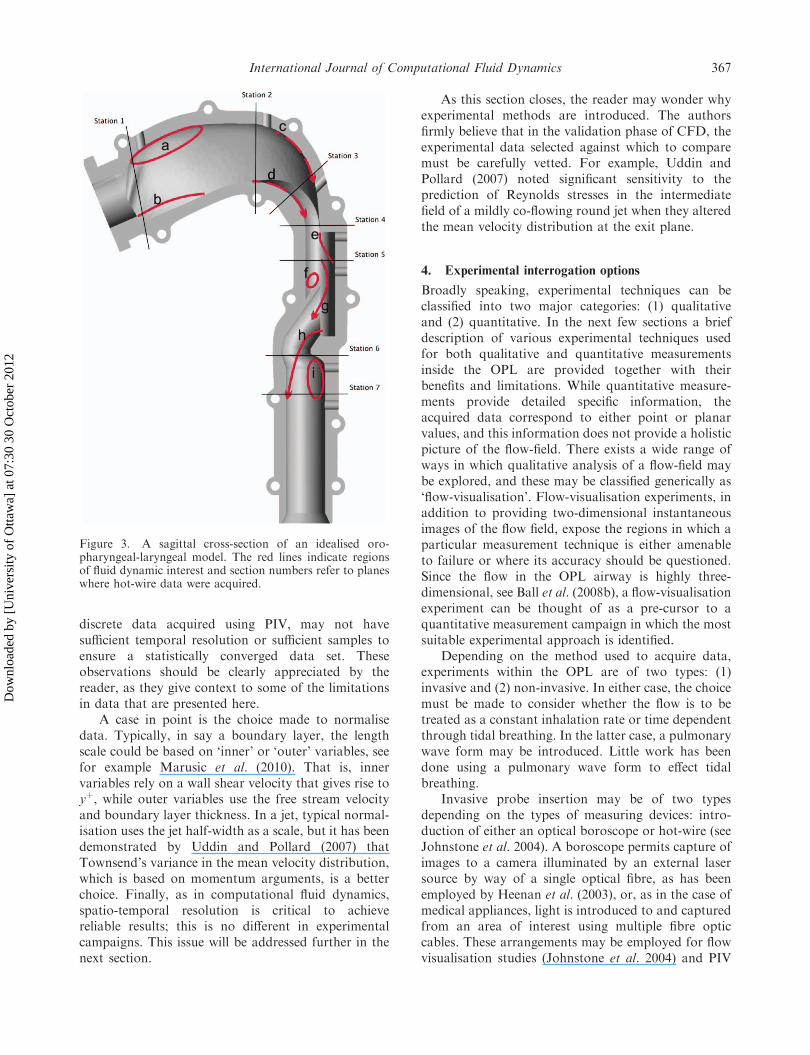
The cross-sectional shape of the idealised geometryshown in Figure 2 shows that the OPL is a combina-tion of some basic building block geometries. Thecross-sectional geometry begins with a round pipe,which represents an idealised inhalation device andthen expands into a ‘slice-of-bread’-like cross-sectionbefore it evolves into a half-ellipsoid shape, then to afull ellipsoid shape just before the epiglottis and finallyreverting again to a round pipe that represents thetrachea. A sagittal cross-section of the idealised OPL,see for example Johnstone et al. (2004), is displayed inFigure 3. The basic, almost canonical flow regions ofinterest are: (a, b) recirculation behind the teeth, whichshould give rise to oscillating inlet conditions into theremaining portion of the oral cavity due to theunsteady ‘flapping’ of the shear layer; (c) destabilisingflow curvature, which could generate Taylor–Gortler-
type secondary flows as the flow enters the nasophar-ynx; (d) stabilising flow curvature, which would tend tostretch any vortex aligned in the sagittal plane; (e) flowseparation distal to the nasal pharynx, the inletcondition which will be influenced by the complexitiesintroduced into the flow in preceding sections; (f)recirculation around the epiglottis, as this acts as aforward facing step-like obstruction; (g) flow accelera-tion around and into the orifice provided by theepiglottis, which is similar to a Borda-type pipeentrance; (h) the laryngeal jet as the flow is acceleratedaround the larynx; and (i) recirculation distal to thelarynx. The flow in the airway is essentially a collectionof basic flows with which engineers are somewhatfamiliar – such as flows over backward and forwardfacing steps, flow in curved ducts and jet flows.
It could be argued that interrogation of the flowinside a complex domain has many interdependenciesbetween flow ‘regions’; that is, the outlet from oneregion acts as the inlet to the next. Computationally,this suggests that any model of turbulence, which mayinadequately capture the physics of flow in one sectionbecause it is less sensitive to a given phenomenon (say,pressure gradients for example) but is ideally suited tothe flow physics in the next, may be wholly compro-mised as a viable model. Equally, the use of pointmeasurements (with a hot-wire, for example) mayintroduce spatial averaging that suppresses energyproduction magnitudes or, as in the case of planar
Figure 2. The idealised extra-throacic airway (ETA), feature names, cross-sectional shapes and model dimensions (in mm).
366 A. Pollard et al.
Dow
nloa
ded
by [
Uni
vers
ity o
f O
ttaw
a] a
t 07:
30 3
0 O
ctob
er 2
012
discrete data acquired using PIV, may not havesufficient temporal resolution or sufficient samples toensure a statistically converged data set. Theseobservations should be clearly appreciated by thereader, as they give context to some of the limitationsin data that are presented here.
A case in point is the choice made to normalisedata. Typically, in say a boundary layer, the lengthscale could be based on ‘inner’ or ‘outer’ variables, seefor example Marusic et al. (2010). That is, innervariables rely on a wall shear velocity that gives rise toyþ, while outer variables use the free stream velocityand boundary layer thickness. In a jet, typical normal-isation uses the jet half-width as a scale, but it has beendemonstrated by Uddin and Pollard (2007) thatTownsend’s variance in the mean velocity distribution,which is based on momentum arguments, is a betterchoice. Finally, as in computational fluid dynamics,spatio-temporal resolution is critical to achievereliable results; this is no different in experimentalcampaigns. This issue will be addressed further in thenext section.
As this section closes, the reader may wonder whyexperimental methods are introduced. The authorsfirmly believe that in the validation phase of CFD, theexperimental data selected against which to comparemust be carefully vetted. For example, Uddin andPollard (2007) noted significant sensitivity to theprediction of Reynolds stresses in the intermediatefield of a mildly co-flowing round jet when they alteredthe mean velocity distribution at the exit plane.
4. Experimental interrogation options
Broadly speaking, experimental techniques can beclassified into two major categories: (1) qualitativeand (2) quantitative. In the next few sections a briefdescription of various experimental techniques usedfor both qualitative and quantitative measurementsinside the OPL are provided together with theirbenefits and limitations. While quantitative measure-ments provide detailed specific information, theacquired data correspond to either point or planarvalues, and this information does not provide a holisticpicture of the flow-field. There exists a wide range ofways in which qualitative analysis of a flow-field maybe explored, and these may be classified generically as‘flow-visualisation’. Flow-visualisation experiments, inaddition to providing two-dimensional instantaneousimages of the flow field, expose the regions in which aparticular measurement technique is either amenableto failure or where its accuracy should be questioned.Since the flow in the OPL airway is highly three-dimensional, see Ball et al. (2008b), a flow-visualisationexperiment can be thought of as a pre-cursor to aquantitative measurement campaign in which the mostsuitable experimental approach is identified.
Depending on the method used to acquire data,experiments within the OPL are of two types: (1)invasive and (2) non-invasive. In either case, the choicemust be made to consider whether the flow is to betreated as a constant inhalation rate or time dependentthrough tidal breathing. In the latter case, a pulmonarywave form may be introduced. Little work has beendone using a pulmonary wave form to effect tidalbreathing.
Invasive probe insertion may be of two typesdepending on the types of measuring devices: intro-duction of either an optical boroscope or hot-wire (seeJohnstone et al. 2004). A boroscope permits capture ofimages to a camera illuminated by an external lasersource by way of a single optical fibre, as has beenemployed by Heenan et al. (2003), or, as in the case ofmedical appliances, light is introduced to and capturedfrom an area of interest using multiple fibre opticcables. These arrangements may be employed for flowvisualisation studies (Johnstone et al. 2004) and PIV
Figure 3. A sagittal cross-section of an idealised oro-pharyngeal-laryngeal model. The red lines indicate regionsof fluid dynamic interest and section numbers refer to planeswhere hot-wire data were acquired.
International Journal of Computational Fluid Dynamics 367
Dow
nloa
ded
by [
Uni
vers
ity o
f O
ttaw
a] a
t 07:
30 3
0 O
ctob
er 2
012
measurements (Heenan et al. 2003). In either case, theintroduction of physical probes into a confined spacemay alter the flow field in the immediate vicinity of theprobe (Tropea et al. 2008). To circumvent this, non-invasive methods can be employed, but this requiresfirst the use of an optically clear geometry that affordsdirect visual access to the interior cavity. Typically, thisis accomplished using a silicone material that is castaround a rapid prototyped core, which is flushed fromthe cavity upon curing of the silicone. Examples ofthese measurement options may be found in Heenanet al. (2003, 2004), Johnstone (2003), Johnstone et al.(2004), Shinneeb and Pollard (2010, 2011).
4.1. Flow visualisation
Flow visualisation is a very effective way to obtain aholistic view of the main features that are expected in aflow; this is especially useful when the flow in questionhas not been previously explored. The flow in thehuman airway is highly three-dimensional and con-tains many regions of flow reversal both in the meanflow direction and the transverse-sagittal or coronalplane, see for example Figures 7, 12 and 18 in Ball et al.(2008b). Those images indicate the highly distortedflow field that displays regions of significant lateralstrain and cross-stream recirculation. Other images canbe found in references Johnstone (2003) and Johnstoneet al. (2004).
4.2. Hot-wire anemometry (HWA)
Hot-wire anemometry is the workhorse tool inturbulence research. A hot-wire, typically 5 mm indiameter and 1 mm in length (l/d � 200), acts as theactive arm in a high frequency Wheatstone bridge. Itprovides a continuous analogue signal that can bereadily converted into instantaneous velocities. It maybe constructed to measure a single velocity componentor (in various arrangements) to collect two or morecomponents, see for example Lavoie and Pollard(2003). It is not without problems however. The mostserious issues, especially in the case of the OPL arespatial resolution and the introduction of wire(s) intoregions of flow reversal.
In the OPL, if it is based on typical humangeometric sizes, the wire length can be up to 20% ofthe airway dimension (in the pharynx region). Toalleviate the spatial averaging that would ensue, a 2:1size idealised model was therefore constructed for thestudies considered herein. Even so, as has beenconvincingly demonstrated by significant evidencethat the spatial attenuation owing to an idealisedspanwise sensor (which measures streamwise velocity u)is, in principle, a simple function of the evaluated
integral of velocity fluctuation across that transverseelement. For turbulent flows, this process is compli-cated by the fact that the velocity fluctuations are timedependent and are composed instantaneously of multi-ple overlapping and interacting scales. In wall-boundedturbulence these velocity fluctuations are also highlyanisotropic and subject to complex, and often disputed,scaling conditions, both of which raise questions overthe applicability of isotropic assumptions in providingtheoretical corrections (Hutchins et al. 2009).
In the case of cross-wires, spatial resolution,especially between the wires as well as ‘cross-talk’(Zhu and Antonia 1995, Lavoie and Pollard 2003),further add to uncertainties in data. It is hoped thatrecent advances in nano-technology eventually willenable the spatial resolution issues to be addressed(Bailey et al. 2010).
A single hot-wire cannot differentiate flow direc-tion, while a two-wire system can at least determinetwo components of velocity but its cone of acceptance(Lavoie and Pollard 2003) is predicated by a velocityvector that is aligned with the probe axis. The only wayto eliminate directional effects is to ‘fly’ the hot-wire,see for example Fellouah and Pollard (2009); however,this is impractical in the case of the OPL. Therefore, inregions where the flow is reversed relative to the probeaxis, the data can be expected to be biased or rectified,see Johnstone (2003).
Additionally, the hot-wire anemometer requirescareful calibration for regions of low velocity and mustalso account for thermal conductivity of the wallmaterial, which can distort the thermal boundary layeraround the wire. These are not trivial issues (Johnstoneet al. 2005), especially inside the complex airway modelconsidered here. An advantage of hot-wire anemome-try is the temporal resolution of the signals, which arein the kHz range.
4.3. Particle image velocimetry
Particle image velocimetry is an optical method thatcan provide instantaneous velocity information over atwo-dimensional plane. The method’s principles applyequally to gaseous or liquid working fluids. When air isused, droplets are introduced to the flow; when liquidsare used, solid particles are introduced. In either case,the droplets/particles are micron-sized. For a givenlight plane, two successive images of the illuminatedparticles are captured within microseconds, and thencross-correlated to obtain a single realisation ofvelocities in terms of camera pixels. Typical dataaccumulation rates are on the order of 15Hz; althoughmuch faster rates are available to those with fastercameras. These data are then ensemble averaged toprovide mean and higher order statistics of the flow.
368 A. Pollard et al.
Dow
nloa
ded
by [
Uni
vers
ity o
f O
ttaw
a] a
t 07:
30 3
0 O
ctob
er 2
012
In earlier studies, a boroscope was inserted into anopaque model of the OPL, see Heenan et al. (2003).The field of view, which was rather narrow, waslimited to the focal length of the fibre optic lens; evenso, those data provided good insight into flowfeatures of the sagittal plane. More recently, theopaque model has been replaced with a model that isoptically clear. Thus, data may be captured overlarger planes of view with improved accuracy and aglobal quantitative visualisation. Moreover, the clearmodel readily permits interrogation of coronal planes,see Shinneeb and Pollard (2011). However, dataaccumulation rates are still limited as in the afore-mentioned case.
However, PIV is not without issues. One of themajor challenges includes wall light reflections thatmask particle motion; with a liquid as the workingfluid, temperature control to less than 0.58C is requiredto ensure index matched refraction does not hamperinformation collection of the supposed measurementplane that was educed from careful calibration of atarget. Perhaps more important is model fidelity. Evenwith a stereolithographic image file that is sent to athree-dimensional printer or rapid prototype facility,the resulting flow phantom (the optically clear modelof the OPL) may deviate from the STL model; suchchecks have not been done in our current work. Theliterature suggests geometric variations in, for exam-ple, nasal flows to be of the order of 5% (Doorly et al.2008b).
The increased use of PIV for the validation (recallthe difference between verification and validation,V&V) process of simulations has spawned a numberof scientific meetings and reports. It was noted that itis fair to say that computationalists and experimen-talists in the field of fluid dynamics have been pioneersin the development of methodology and procedures invalidation. However, it is also fair to say that the fieldof CFD has, in general, proceeded along a path that islargely independent of validation. There are diversereasons why the CFD community has not perceived astrong need for code V&V, especially validation. Inretrospect, the relationship between computationalistsand experimentalists is probably understandable be-cause it represents the classic case of a new technology(computational simulation) that is rapidly growingand attracting a great deal of visibility and fundingsupport that had been the domain of the oldertechnology (experimentation) (Oberkampf and Truca-no 2002).
Clearly, the introduction of PIV is a new technol-ogy that has the capability to provide data with bothspatial and temporal fidelity to more fully complementdata obtained from simulations, particularly at la-boratory scale Reynolds numbers.
5. Computational simulation/modelling options
The Reynolds Averaged Navier–Stokes (RANS)method is the most coarse-grained approach to solvefluid flow problems where the time averaged Navier–Stokes equations are used to model all of theturbulence transport terms; in other words, in thisapproach all scales of motions are modelled. This is thecrudest CFD approach, and may not be exactlyapplicable in many areas, but, as of today, seems tobe the most popular and affordable approach to dealwith complex geometries or flows of industrialapplication and importance. As the modelled transportequations in RANS are formulated and constants aredetermined using information derived from simplecanonical flows, the success of a RANS type CFDprediction depends largely on the relevance of the flowin question to the flow on which the chosen turbulencemodel is based. The issue of the ‘best’ turbulencemodel is an on-going debate. In the OPL, thischallenge is further complicated by the fact that, asmentioned earlier, the flow is characterised by a rangeof Reynolds numbers from laminar to transitional toturbulent.
It is known that RANS turbulence modelling ofrelatively simple geometries (such as a smooth stenosedtube) fails with transitional flows (Ryval et al. 2004).However, Ryval et al. (2004) also noted that ‘while thetransitional model often under-predicts the magnitudeof the turbulence, the trends are well-described andthe velocity field is superior to that predicted using thestandard model. On the basis of this study, thereappears to be some promise for simulating physiolo-gical pulsatile flows using a relatively simple two-equation turbulence model’. Thus, it is highly unlikelythat in cases of flow like the one inside the humanairway, which is a superposition of a number ofbuilding-block flows, one turbulence model would becapable of capturing all flow features and thusenabling a reliable prediction of flow characteristics.Since the flow characteristics in a particular region aregoverned by both upstream and downstream condi-tions, even the use of a model appropriate for oneregion might produce unrealistic results in another dueits failure in an upstream or downstream region (orboth). Thus, this consideration warrants a volumedependent zonal modelling approach where a turbu-lence model is introduced appropriate for thatparticular volume zone.
For simplicity of referencing, the authors introducethe term ‘vonal’ approach. This is not a novel idea; thisapproach was first documented by Savill (1981)(although the original idea may have stemmed fromKline at Stanford in 1981) to divide the flow intoregions dominated by different types of distorted shearlayers, then apply a distorted stress model to calculate
International Journal of Computational Fluid Dynamics 369
Dow
nloa
ded
by [
Uni
vers
ity o
f O
ttaw
a] a
t 07:
30 3
0 O
ctob
er 2
012
what was termed ‘representative structure parameters’for each of these regions, and finally use these in placeof the stress ratios determined by the eddy-viscositymodels. Iacovides and Theofanopoulos (1991) used asomewhat similar approach in their work on turbu-lence modelling of flow inside a rotating cavity wherethey applied both k7E and the algebraic stress models(ASM) in the fully turbulent region in conjunction withtwo different versions of mixing length model in thethin viscosity dominated wall region. Arguably, theproposed vonal approach can be thought of as anextension to the approach suggested by Iacovides andTheofanopoulos (1991) and the popular shear-stresstransport, SST, k7o model of Menter (1993).Computationally, RANS is appealing, but requiresthe use of models of turbulence that are not tuned tothe low Reynolds number range found in the OPLwhich essentially demands a-priori and a-posterioritesting of RANS using both LES and DNS – anapproach similar to that of Raiesi et al. (2011).Interestingly, LES does not appear to provide anysignificant advantages to well-resolved RANS simula-tions, at least for the mean flow (Kleinstreuer andZhang 2010). Arguably because LES resolves the largescales, but models the ‘universal’ scales; this is a firstlevel coarsening from DNS.
The relatively low Reynolds numbers of the flowinside the airway suggest that it is a good candidate forthe application of direct numerical simulations (DNS).While algorithms exist to solve Navier–Stokes (N–S)equations, a significant requirement from DNS isimposed: the results must be extraordinarily accurate.Flows associated with simple geometries, for example,channels, pipes, jets, wakes and mixing layers, arereadily handled by DNS. However, complex geome-tries introduce both grid structure issues as well aserrors associated with discretisation of the N–Sequations on these grids. Furthermore, there aredifficulties with surface facetisation as well – an issuethat seems to be scantly addressed in most of thepublished CFD simulations in and around complexgeometries. If the grid in the fluid region is refinedenough to resolve Kolmogorov scales, then the under-lying solid boundary needs to be represented with thatsame level of fidelity in order to maintain the accuracyof the predictions. In private communications, theauthors have learned that, in case of numericalprediction of aeroacoustic noise due to side mirrorsof a road vehicle, an accurate representation of mirrorsurface is a key issue. While this may have relativelyless impact on the prediction of macroscopic quantitieslike time averaged drag or wake structure, the qualityof the surface facetisation reduces the accuracy of theacoustic predictions which is scale dependent. Thisillustrates the importance of a good quality surface
preparation. However, the requirement to refine thesurface to the level that it is comparable to the finestscales in the flow will make the size of the surface meshextremely large. The impact of this effect will bediscussed later.
Setting aside the surface quality issue, there havebeen many approaches to handle complex geometriesusing DNS. Examples include Seidl et al. (1998) whoconsidered a finite volume method applied to turbulentflow over a sphere; Karniadakis (1999) who consideredboth internal and external turbulent flows using aspectral element method; Hicken et al. (2005) whodeveloped a conservative collocated method forunstructured meshes and applied the method to simplechannel flow; Hicken et al. (2005) who also demon-strated conservation of momentum and energy up tosecond order; and Subbareddy and Candler (2009)who considered conservation of momentum andenergy on unstructured grids and for compressibleflow that gave spectral-like resolution for compressibleisotropic turbulence. Mittal and Iaccarino (2005)reviewed the immersed boundary method that hasbeen applied to both internal and external turbulentflows with good success. The idea of immersedboundaries is not new (see Roache 1972, Ozem1997); it currently has considerable attention in coarsegrained simulations like detached eddy simulation(DES) or RANS of external flows. The application ofthis approach in DNS is in early stages of developmentand appears to be a promising one, see for examplePinelli et al. (2010).
Wei and Pollard (2010) applied the discontinuousGalerkin method (DGM) to compressible flow inchannels under the effects of pressure gradients, andconsidered the effects of Mach number, see Wei andPollard (2010, 2011). The DGM is admirably suited tohandle near wall, pressure gradient and compressibilityeffects within a DNS framework and is also ideallysuited to parallel computer implementation. It has notyet been applied directly to the OPL flow, but it hasbeen applied (Wei and Pollard 2010) to the flow over alarynx-type planar depression that encompasses acombined turbulent boundary layer along a flat walland a laminar boundary layer at the entrance to thechannel at the beginning of a curved upper wall.
Large eddy simulation is a first level of coarseningfrom DNS where the large scales are resolved, but thefiner so-called ‘universal’ scales are modelled. Largeeddy simulation has been recently employed byKleinstreuer and Zhang (2010) with the idealisedgeometry model that emerged from the University ofAlberta and Queen’s University. In relation to DNS,the RANS method is the most coarse-grained ap-proach to solve fluid flow problems because timeaveraged Navier–Stokes equations are used to model
370 A. Pollard et al.
Dow
nloa
ded
by [
Uni
vers
ity o
f O
ttaw
a] a
t 07:
30 3
0 O
ctob
er 2
012
all of the turbulence transport terms; in other words,all scales of motion are modelled in this approach.While this crude (in the authors’ opinions) approachmay not be exact in many areas, it seems to be the mostpopular and affordable approach to deal with complexgeometries or with flows of industrial importance.
More recently, the lattice-Boltzmann method(LBM) (see e.g. Chen and Doolen 1998) has beendeveloped as an alternative approach to Navier–Stokesequations. In the lead author’s group, Bespalko (2006)and Bespalko et al. (2012) applied LBM to turbulentchannel flow as a precursor test case for application tocomplex geometries. Ball et al. (2008b) considered theflow in the human airway using LBM. To performDNS of any flow, the Kolmogorov length scaledetermines the resolution requirements. For flow inthe human airway at the 10 l/min inhalation rate, theKolmogorov length scale Z ¼ (u3/E)1/4 ranges from 0.35mm to 5.8 mm (where we have assumed E * k), whichrequires a grid resolution of 0.17 mm or *144 millioncontrol volumes. The LBM formulation of Ball et al.(2008b) used a uniform cubic grid; note that thesmallest length scale determines the simulation resolu-tion requirements. The simulation required *1.5million time steps and produced over 1 terabyte of data.
6. Review of experimental and simulation results
One of our objectives here is to address the dilemmaoften faced by CFD researchers: experimental dataacquired with great precision and care even for thesimplest flow cases, like a zero pressure gradient flatplate boundary layer, are often questioned becausetechnological evolution enables increased fidelity inboth space and time. CFD results are always requiredto establish credibility against these experimental data.We refer the reader to section 4.3, while also noting thatthe two approaches are in a push–pull situation.Advances in one approach tend to force the develop-ment in another. To be certain, the authors do not wantto imply that experimental data are flawed; rather, theauthors wish to emphasise the fact already pointed outby experimentalists (Hutchins et al. 2009) that the dataneed to be analysed with an understanding of thestrengths and limitations of the sensors employed toacquire data. As discussed in the preceding sections, theconstraints imposed by the flow geometry limit the levelof fidelity of the experimental data for internal flowsinside narrow geometries with protrusions and sharpedges, like the OPL, so that the validation exercisebecomes even more challenging. Indeed, this was achallenge that inspired much of our work.
In what follows, the authors will rely heavily onsome of the earlier published work by Johnstone et al.(2004) and Ball et al. (2008a,b), where the
corresponding figure numbers from these papers willbe referenced. The conventions used in these plots andthe subsequent discussions need to be explained first:K �
ffiffiffiffiffiffiffiffiffiffiffiffiffiffiffiffiffiffiffiffiffiffiffiffiffiffiffiffiffiffi
U2 þ V2 þW2p
, where U, V and W represent themean velocity components, the local bulk velocity isdefined as UB : Q/A, where Q is the volume flow rateand A is the local cross-sectional area.
In general, the flow field is influenced by bothupstream and downstream conditions that are in closeproximity to the region in which data are acquired.With reference to Figure 3, this implies that the flowfield at station 4 will be influenced by both stations 3and 5. As will be discussed later, CFD predictions(LBM and RANS) and experimental data showconsiderable differences at station 3 and some dis-agreement at station 5, but they are in satisfactoryagreement at station 4. This has also been noted byBall et al. (2008a) who concluded that ‘ . . . it isdisconcerting that poor flow predictions at mid-streamlocations had little effect on the outcome of down-stream simulation results’. From a flow physics pointof view, this agreement raises some interesting issues,and a possible hypothesis which again requires somefurther testing to verify.
Ball et al. (2008a) also concluded that the k7omodel seems to be the most appropriate eddy-viscosityapproach for CFD predictions of OPL flows, and thatReynolds stress model (RSM) did not demonstratebetter agreement with experimental data (contrary togenerally expected better performance from advancedmodels like RSM). However, from the figures 5, 10, 15and 17 in Ball et al. (2008a), it appears that amongst allof the two-equation type models, k7o seems to be in acloser agreement with RSMpredictions. It must be notedthat Ball et al. (2008a) used the standard and the SSTk7o models (designed for fully turbulent flow) becauseof the transitional-like nature of the flow, as determinedby Johnstone (2003) and Johnstone et al. (2004), asopposed to the low Reynolds number version of theWilcox k7o model (Wilcox 2006). The standard k7omodel has been demonstrated to overpredict the turbu-lence fluctuations for realistic laminar or transitionalflows (Zhang and Kleinstreuer 2003). In Ball et al.(2008a), the RANSmodels did not clearly overpredict orunderpredict the turbulence. The close agreement of thek7o and RSM results could, of course, be fortuitousjuxtaposition of the data, as will be discussed furtherbelow.
The results from a mixture of computationalapproaches that have been applied to the modelledOPL are presented in Figure 4. A comparison betweenexperimental (single and cross hot-wire anemometers)and computational (RANS and LBM) results areshown in Figure 4(a,b) at 10 and 15 l/min, respectively.In these plots, the vertical axis represents the value of
International Journal of Computational Fluid Dynamics 371
Dow
nloa
ded
by [
Uni
vers
ity o
f O
ttaw
a] a
t 07:
30 3
0 O
ctob
er 2
012
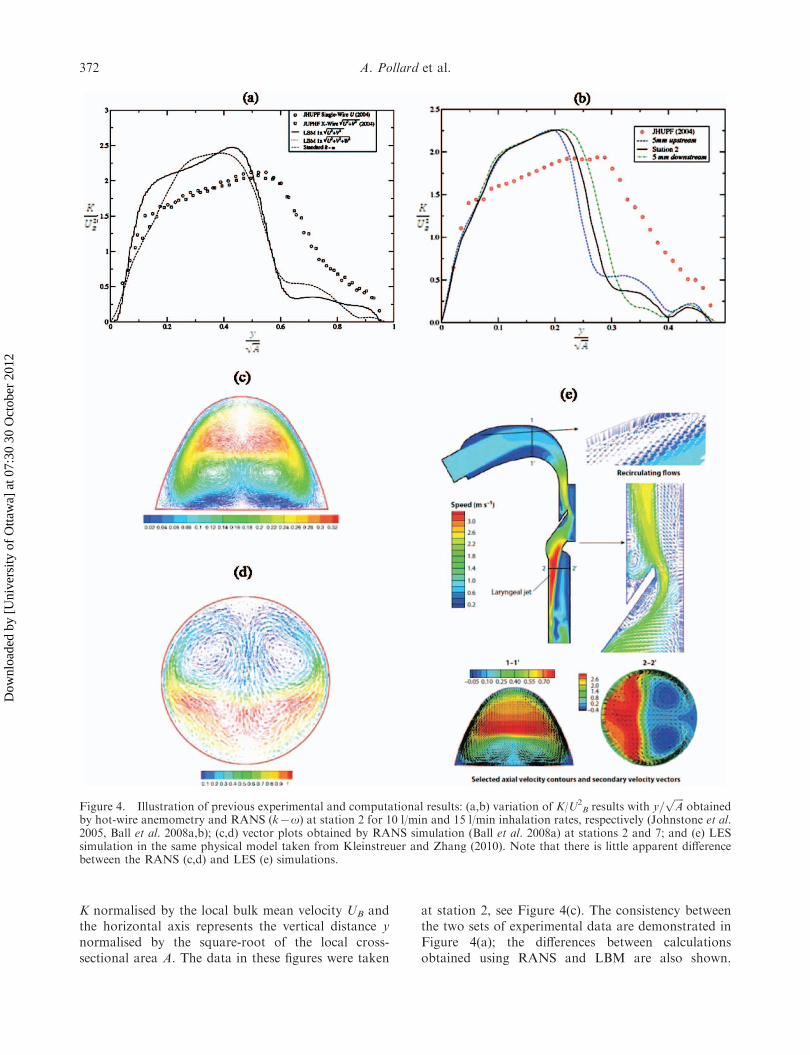
K normalised by the local bulk mean velocity UB andthe horizontal axis represents the vertical distance ynormalised by the square-root of the local cross-sectional area A. The data in these figures were taken
at station 2, see Figure 4(c). The consistency betweenthe two sets of experimental data are demonstrated inFigure 4(a); the differences between calculationsobtained using RANS and LBM are also shown.
Figure 4. Illustration of previous experimental and computational results: (a,b) variation of K/U2B results with y=
ffiffiffiffi
Ap
obtainedby hot-wire anemometry and RANS (k7o) at station 2 for 10 l/min and 15 l/min inhalation rates, respectively (Johnstone et al.2005, Ball et al. 2008a,b); (c,d) vector plots obtained by RANS simulation (Ball et al. 2008a) at stations 2 and 7; and (e) LESsimulation in the same physical model taken from Kleinstreuer and Zhang (2010). Note that there is little apparent differencebetween the RANS (c,d) and LES (e) simulations.
372 A. Pollard et al.
Dow
nloa
ded
by [
Uni
vers
ity o
f O
ttaw
a] a
t 07:
30 3
0 O
ctob
er 2
012
The differences between simulation and experimenthave been explored; as an example, the results frompossible positioning errors of the hot-wires relativestation 2 are presented in Figure 4(b). It is clear thatthis is probably not the cause for the differencesobserved. The flow field obtained from the simulationsat station 2 shown in Figure 4(c) indicates significantcross-flow in the sagittal plane, which casts some doubtas to the ability of the hot-wire anemometry tomeasure the actual flow field. The flow visualisationindicates that at station 2 there is significant helicalmotion and transverse movement in the y=
ffiffiffiffi
Ap
> 0:3region, which likely influences the experimental data inways that are still under investigation (especially usingPIV, see below). The general agreement betweensimulation results from the DNS–LBM and someRANS turbulence models is encouraging and suggeststhat RANS (k7o in particular) may be a useful toolfor exploratory investigations of airway flow in, forexample, specific real geometries prior to medically-proposed surgical intervention. The RANS result ofBall et al. (2008a) depicting the flow in the trachea(station 7 in Figure 3) is shown in Figure 4(d). Itreveals a non-uniform and vortical velocity distribu-tion in the trachea. Thus, those who wish to modelflow in the lungs should be cautioned not to assume apipe-flow type velocity distribution as inlet conditionsto their simulations. The LES results of Kleinstreuer
and Zhang (2010) shown in Figure 4(e) confirm thefinding of Ball et al. (2008a,b).
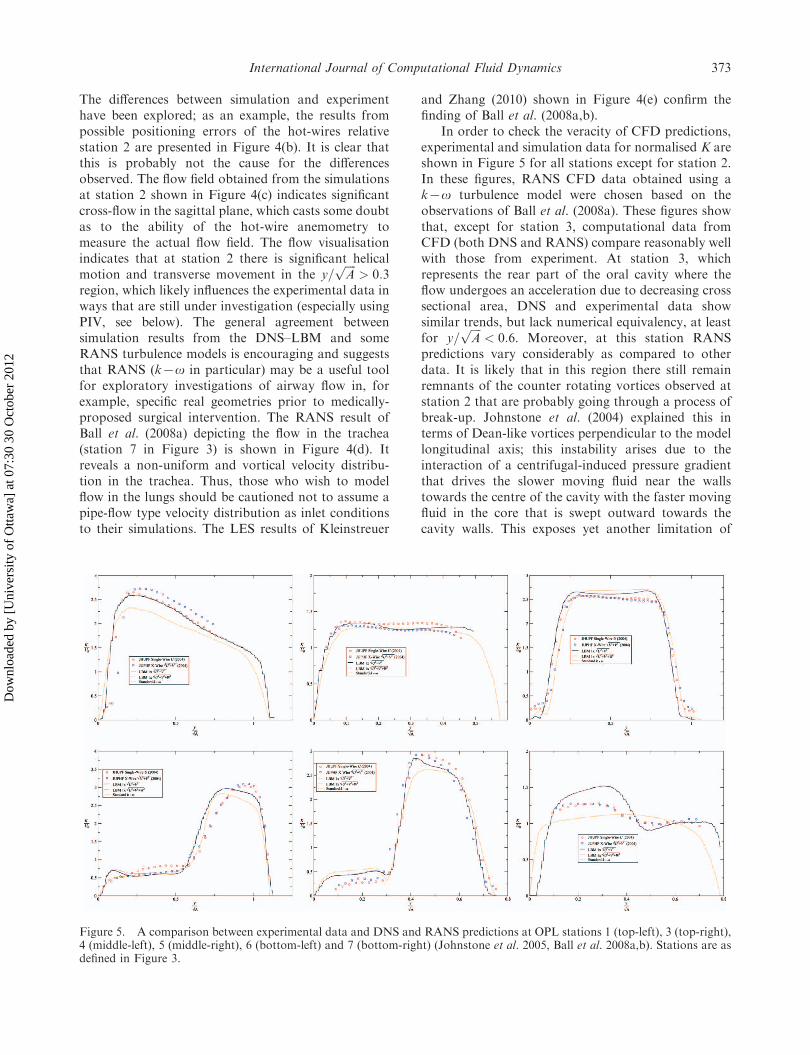
In order to check the veracity of CFD predictions,experimental and simulation data for normalised K areshown in Figure 5 for all stations except for station 2.In these figures, RANS CFD data obtained using ak7o turbulence model were chosen based on theobservations of Ball et al. (2008a). These figures showthat, except for station 3, computational data fromCFD (both DNS and RANS) compare reasonably wellwith those from experiment. At station 3, whichrepresents the rear part of the oral cavity where theflow undergoes an acceleration due to decreasing crosssectional area, DNS and experimental data showsimilar trends, but lack numerical equivalency, at leastfor y=
ffiffiffiffi
Ap
< 0:6. Moreover, at this station RANSpredictions vary considerably as compared to otherdata. It is likely that in this region there still remainremnants of the counter rotating vortices observed atstation 2 that are probably going through a process ofbreak-up. Johnstone et al. (2004) explained this interms of Dean-like vortices perpendicular to the modellongitudinal axis; this instability arises due to theinteraction of a centrifugal-induced pressure gradientthat drives the slower moving fluid near the wallstowards the centre of the cavity with the faster movingfluid in the core that is swept outward towards thecavity walls. This exposes yet another limitation of
Figure 5. A comparison between experimental data and DNS and RANS predictions at OPL stations 1 (top-left), 3 (top-right),4 (middle-left), 5 (middle-right), 6 (bottom-left) and 7 (bottom-right) (Johnstone et al. 2005, Ball et al. 2008a,b). Stations are asdefined in Figure 3.
International Journal of Computational Fluid Dynamics 373
Dow
nloa
ded
by [
Uni
vers
ity o
f O
ttaw
a] a
t 07:
30 3
0 O
ctob
er 2
012
RANS type turbulence modelling – the inability ofRANS to resolve motions that may be due to Dean-like vortices or anisotropies in the cross-streamReynolds stresses. This also indicates that hot-wireexperimental data will be rectified in this region.Alternatively, this could be a Reynolds number effect;Figure 12 of Johnstone et al. (2004) suggests that theflow in this region at 10 l/min flow rate sufferssignificantly from transitional effects. This reinforcesthe fact that RANS predictions in transitional regionsare unreliable. The recent work by Zhang andKleinstreuer (2011) explains this in further detail.The good match between the CFD predictions andexperimental data at all other downstream stationsindicate a possibility that RANS calculations are lesssensitive to upstream conditions like swirl; thisconjecture needs to be verified. In general, it appearsthat RANS calculations produce results with anacceptable level of accuracy, a view also shared byZhang and Kleinstreuer (2011).
A similar conclusion can be drawn from the LESwork of Kleinstreuer and Zhang (2010); the PIVmeasurements, DES and LES work of Jayaraju et al.(2008); and the RANS and LES work of Dehbi (2011).Take for example Dehbi (2011) who noted that thejitter between their PIV experimental data and LES orDES data does not show much evidence of improvedaccuracy from these much more expensive numericalmethods. The wall nodes in Jayaraju et al. (2008) seemto be well resolved; however, with a total cell count ofunder 2 million, a well resolved treatment in the coreregion at a flow rate of 30 l/min, especially in theabsence of a grid-independence test, remains an openquestion particularly in light of DNS like LBMsimulations of Ball et al. (2008b). Clearly, theseindicate the necessity of high fidelity DNS simulationat a flow rate of 30 l/min. As a final note on the meanflow, the authors would like to add that althoughcomparisons are made with respect to K, a similarconclusion can be made with respect to the quantitiesU and V (see Ball et al. 2008a,b).
There is now sufficient evidence of success of CFDprediction for the mean flow using steady and unsteadymethods. However, turbulence statistics and a com-parison of these to experimental data are rather rare.To the best of the authors’ knowledge there arevirtually no data that support the credibility of CFDin predicting turbulent stresses for the case at hand.This could be due to lack of reliable experimental data.It is believed that turbulence has a significant effect onthe transport of some particles or droplets in humanairway.
Particle deposition studies abound; they presentsignificant challenge to both experimentalists andcomputationalists. In experimental studies, deposition
is typically measured by particle capture and measure-ment methods, such as gamma scintigraphy (Corcoranand Chigier 2000, Heenan et al. 2004). Numericalstudies suffer from the difficulties of the great challengeof computing particle dynamics within a flow field thatis already complicated and very difficult to simulate ormodel. Research groups have met with varying success,reporting ‘varying degrees of discrepancy’ between invitro experiments, in vivo studies and numericalsimulations (Cheng et al. 1996, Yu et al. 1998). Thesedifficulties are acknowledged in more recent studieswhere models of fluid-particle flows are successfullyvalidated (Kleinstreuer and Zhang 2003, Zhang andKleinstreuer 2004). The complexity of the flowsystems, however, makes accurate verification ofnumerical results with experimental data impracticable(the same challenge faced in the authors’ works). WhenLES or DES flow data are used to predict timeaveraged deposition in airways, it is necessary to firstensure that these numerical methods predict turbulentstress distributions with reasonable accuracy.
In order to demonstrate this issue, turbulent stresspredictions using LBM based DNS and RSM-RANSdata are compared against experimental data atstations 2, 5 and 6 in Figure 6. Since the mean flowprediction at station 2 does not compare very well withthe experimental data, it is not unexpected that stressdistributions will also be poorly predicted. However,the magnitude of mismatch between the CFD andexperimental stress data is almost an order ofmagnitude larger. In addition, surprisingly, contraryto mean flow, RANS and LBM data largely disagreeboth with the experimental stress data and what ispredicted by both computational approaches. Thesame is true at the other two stations, 5 and 6, wherethe CFD mean flow predictions are in a very goodagreement with experimental data. There are reasonsto believe that hot-wire experimental data may berectified in this region, but outstanding unexplainedquestions are (1) why is mean flow data using hot-wiresalmost unaffected? and (2) why do RSM types ofmodelling show a slightly better match with rectifiedexperimental data? This again emphasises the need forhigh fidelity experimental PIV and properly resolvedDNS data. This is currently an ongoing process in thelead author’s laboratory – some of the current progresswill be discussed next.
7. Recent work
A major limitation to earlier experimental work hasbeen the intrusive and/or point-wise nature of themeasurement techniques. Recent advances in opticallytransparent materials have facilitated the constructionof complex flow passages such as phantoms of the
374 A. Pollard et al.
Dow
nloa
ded
by [
Uni
vers
ity o
f O
ttaw
a] a
t 07:
30 3
0 O
ctob
er 2
012

human airway (see Figure 7(b)). This developmentenabled the use of PIV in complex geometries by usinga working fluid with a refractive index that matchedthat of the model material. The major weakness of PIVmay be the relatively crude temporal resolution of thedata (temporal-resolved PIV is currently available inthe market). However, this could be advantageouswhen uncorrelated data are needed for statistical studyof the flow structures (see e.g. Shinneeb and Pollard2011).
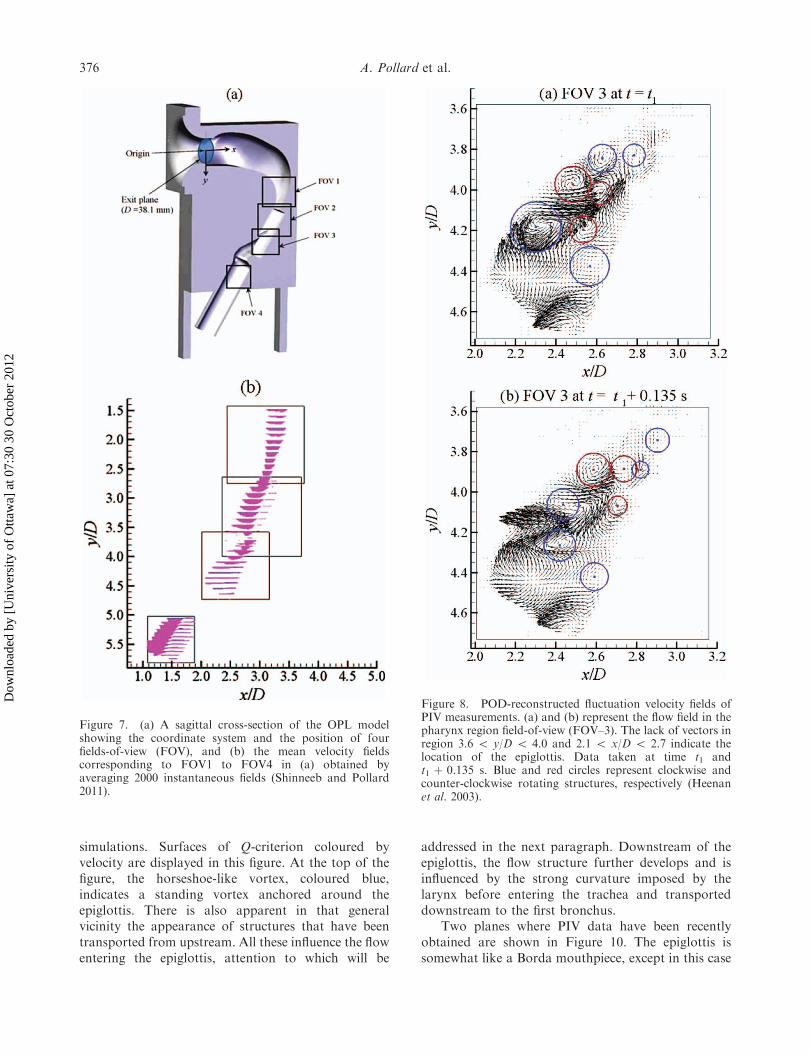
A series of experiments were carried out in the OPLmodel using PIV at a flow rate of 10 l/min. Thepurpose of this study is to gain more insight into thedynamics of the vortical structures in the OPL flow.Four fields-of-view (FOV1 to FOV4) were positionedon the sagittal plane as illustrated in Figure 7(a) wherethe measurements focused on the pharynx to thetrachea region. This region was determined in earlierstudies to be in poor agreement with experimentalresults (see for example Ball et al. 2008a,b). The meanvelocity fields calculated from 2000 image pairs thatwere acquired at each location at a framing rate of2 Hz are shown in Figure 7(b). Both the horizontal xand vertical y axes are normalised by the inlet nozzlediameter D. Note that only some rows of vectors areshown to avoid cluttering. In this study, PIV data werefirst analysed using the proper orthogonal decomposi-tion (POD) technique to identify the main energy-
containing structures (Shinneeb and Pollard 2010).Using only a few POD modes, the velocity fields whichwere reconstructed recovered about 60% of theturbulent kinetic energy. These reconstructed velocityfields were used as a basis to search for vorticalstructures using the vortex identification algorithm ofAgrawal and Prasad (2002). This algorithm is based onthe concept to use closed streamlines to identifyvortices. This technique involves searching the POD-reconstructed field for circular streamlines by monitor-ing the change in direction of the measured velocityvectors along expanding circular paths surroundingcandidate vortex centres. The largest such path forwhich the change in direction is monotonic for 75% ofthe vectors is taken to define the size of the vortex. Thecirculation of a structure is then calculated byintegrating along its outermost path. In discrete data,it is calculated by integrating along a polygon path.Figure 8(a,b) present selected examples of POD-reconstructed velocity fluctuation fields in the pharynxregion. These fields were acquired at a sampling rate of7.4 Hz (0.135 s). Red and blue circles represent positive(counter-clockwise) and negative (clockwise) rotatingstructures, respectively.
A region of flow that has been found particularlyinteresting is that around the epiglottis. To indicate therichness of the flow in this region, Figure 9 shows flowstructures that have been educed from DNS–LBM
Figure 6. U (left) and V (right) normal stress profiles normalised by bulk velocity squared at 10 l/min. Station 2 (Top), Station 5(Middle) and Station 6 (Bottom). Experimental data of Johnstone et al. (2005) are compared with computational data of Ball(2005).
International Journal of Computational Fluid Dynamics 375
Dow
nloa
ded
by [
Uni
vers
ity o
f O
ttaw
a] a
t 07:
30 3
0 O
ctob
er 2
012
simulations. Surfaces of Q-criterion coloured byvelocity are displayed in this figure. At the top of thefigure, the horseshoe-like vortex, coloured blue,indicates a standing vortex anchored around theepiglottis. There is also apparent in that generalvicinity the appearance of structures that have beentransported from upstream. All these influence the flowentering the epiglottis, attention to which will be
addressed in the next paragraph. Downstream of theepiglottis, the flow structure further develops and isinfluenced by the strong curvature imposed by thelarynx before entering the trachea and transporteddownstream to the first bronchus.
Two planes where PIV data have been recentlyobtained are shown in Figure 10. The epiglottis issomewhat like a Borda mouthpiece, except in this case
Figure 7. (a) A sagittal cross-section of the OPL modelshowing the coordinate system and the position of fourfields-of-view (FOV), and (b) the mean velocity fieldscorresponding to FOV1 to FOV4 in (a) obtained byaveraging 2000 instantaneous fields (Shinneeb and Pollard2011).
Figure 8. POD-reconstructed fluctuation velocity fields ofPIV measurements. (a) and (b) represent the flow field in thepharynx region field-of-view (FOV–3). The lack of vectors inregion 3.6 5 y/D 5 4.0 and 2.1 5 x/D 5 2.7 indicate thelocation of the epiglottis. Data taken at time t1 andt1 þ 0.135 s. Blue and red circles represent clockwise andcounter-clockwise rotating structures, respectively (Heenanet al. 2003).
376 A. Pollard et al.
Dow
nloa
ded
by [
Uni
vers
ity o
f O
ttaw
a] a
t 07:
30 3
0 O
ctob
er 2
012

the entrance flow is complicated by upstream influ-ences derived from the oro-pharynx as the fluidenters the mouthpiece obliquely. The data providedin Figure 11 illustrate the mean velocity vectors in ay–z plane. These data indicate the complex, asym-metric and anisotropic flow features in this region.This complexity eventually gives rise to flow symme-try around the sagittal plane in the trachea andasymmetry in the anterior–posterior plane of thetrachea noted above (see Figure 6). In addition,cross-stream velocity vectors coloured by the magni-tude of v02 in the y-direction (recall this is notperpendicular to the epiglottis centreline) are dis-played in Figure 12. The magnitude of v02 is observedto increase towards the central plane of the epiglottisat this location. Further analysis of these flow aspectsis ongoing.
8. Key challenges
As noted above, the OPL may be decomposed into anumber of basic building block geometries; this iswhere a multi-disciplinary approach is warranted toexplore key features of the flows encountered therein.
In the first instance, for example, the OPL generalshape may be likened to a simple curved round tube.This flow is well known to create Dean vortices (Bergeret al. 1983). Recent work has further interrogated thisflow to reveal that the longitudinal instantaneousvorticity emerges as a strong transport mechanism thatoverpowers the normal two cell structure typicallynoted in this flow, Smits (private communication) seealso Rutten et al. (2005).
The spatial scales of the flow in the OPL areinhalation rate (or Reynolds number) and vonaldependent; yet to-date measurements use probes thatare probably too large. The spatial averaging in the caseof hot-wires and the temporal snapshots in the case ofPIV both contribute to suppress the true flow structurethat is found from high resolution DNS of the OPL.Thus a key challenge is to perform newDNS simulationsof, say, curved round pipe (or curved channel) flow andto explore the effects of sensor length using those data,see Suzuki and Kasagi (1992), Vukoslavevi et al. (2009).Concomitantly, the advent of nano-based hot-wires(Bailey et al. 2010) could be directly introduced into anew OPL measurement campaign.
Planar backward and forward facing step flows havebeen thoroughly investigated both experimentally andcomputationally, see for example Pollard et al. (1996).A key challenge would be to examine these flows using
Figure 9. Lattice Boltzmann data, 10 1/min inhalation rate,Q-value, coloured by velocity. Note the horseshoe-typevortex around the epiglottis and the complex vortexstructure distal to the epiglottis, data from Ball et al. (2008a).
Figure 10. Geometry of the idealised model. The red linesrepresent the position of y–z planes. These are located justupstream of and distal to the entrance to the epiglottis (Plane2 and Plane 3, respectively).
International Journal of Computational Fluid Dynamics 377
Dow
nloa
ded
by [
Uni
vers
ity o
f O
ttaw
a] a
t 07:
30 3
0 O
ctob
er 2
012

curved steps inside either a plane or circular channel andto explore the effects of inlet conditions on the formationof longitudinal vortices. Extending this to include aBorda-type extension would also help to reveal details ofepiglottal influences on the flow as a frontispiece to thelarynx. While some work has been done for the case ofjets emanating from inclined nozzles (Webster andLongmire 1998, New et al. 2005), there appears to benone for the case of inspiration, and particularly for thecase when the incoming flow approaches the mouthpieceentrance at non-perpendicular angles.
In all work to date on the OPL, the walls have beenrigid. There has been no consideration for themorphological changes in the OPL that occur in bothphysiologic and pathologic states. Even in normal tidalbreathing, as at 10 l/min studied here, physiologicairways are compliant with small variations describedas follows. There are small variations in the length anddiameter of the upper airways (Hughes et al. 1972).The real-life air-liquid interface (between inspired airand a 10 m m mucous layer coating epithelial cilia)causes an accountable pressure drop (King et al. 1982).The surface corrugations of the human airway, lessthan 10–15% of the pipe radius, tend to have littleeffect on bulk flow profiles (Schroter and Sudlow1969). At higher physiological flow rates, it is uncertainwhether these assumptions will still hold. Airwaydiameters increase with greater pressure drops required(through chest and lung expansion) to generate greaterinspiratory flow rates. The ‘tracheal tug’ (which iseasily palpated just above the sternal notch) is clearevidence of airway displacement and deformation(lengthening). These few normal physiological changesare relatively simple. In unhealthy patients, modifica-tions to the airway begin with the simple lengtheningthat manifests as a tracheal tug. Glottal constriction ofcroup, the inspiratory collapse that causes the char-acteristic ‘whoop’ of pertussis, the epiglottitis (andfrequent resultant fatal airway obstruction) that resultsfrom Haemophilus influenzae, and asthma are just afew of the pathological changes that are seen inpaediatric medicine – in order to compensate on aminute-by-minute basis, the airways are necessarilycompliant. Likewise, the airways must be compliant inorder to adapt in adult disease states – chronicobstructive pulmonary disease, heart disease andcancer are probably the most common and importantcauses of compensatory mechanisms in the airways. Tofully understand these flows, adaptive modelling (i.e.vonal modelling) in all likelihood will be necessary.
9. Summary and future prospects
The progress made to understand the flow inside thehuman airway using evidence gathered from
Figure 11. Mean velocity fields in the epiglottal region,from 3-D PIV measurements. Top figure from Plane 2; lowerfigure from Plane 3 (Shinneeb and Pollard 2011).
Figure 12. Contour plot of v02 across Plane 2, from PODreconstructed fluctuation velocity fields of 3-D PIVmeasurments. Velocities normalised by the inlet velocity, U0,and locations by the nozzle diameter D. Vectors represent themean flow in the y–z plane. Note the complex secondary meanflow and the peak in r.m.s velocity (Shinneeb and Pollard 2011).
378 A. Pollard et al.
Dow
nloa
ded
by [
Uni
vers
ity o
f O
ttaw
a] a
t 07:
30 3
0 O
ctob
er 2
012
experimental and computational methods has beenreviewed. Recent advances in PIV and novel computa-tional approaches to DNS and LES are expected togreatly assist future explorations of this fascinating flow.
The flow physics inside the human airway is a richlandscape for research. The modelled human airwayconsidered here was, for the most part, that of ahealthy adult; however, the oral pathway geometrymay be severely altered by myriad pathological andanatomical variations that could severely influence theflow physics. An example is airway constriction due toadenotonsillar hypertrophy (enlarged adenoid/tonsil),which could introduce higher local Reynolds numbersor because of craniofacial anomalies that will imposeasymmetric geometry and therefore possible severethree-dimensional unsteady flow behaviour. Addition-ally, while each human subject has the basic upperairway components considered here, their geometricscales can vary considerably. For example, there is the‘small-mouth/large nose’ or conversely the ‘largemouth/small nose’ variation so that if nasal flow isintroduced including the changes in the oral pathwayentrance condition (lips are slightly pursed forexample) the nasal pharyngeal flow will act as a wall-jet with co-flow imposed in the outer region (from theoral portion of the inhalation stream). Sleep apnoea isa common problem with a complex ætiology. Asufferer typically uses a positive airway pressure device(mask or nasal buds) which forces air into the oro-nasal passages to keep the airway open; recent CFDand imaging and future research options may be foundin De Backer et al. (2008).
Future challenges include analysis of real geome-tries, and design constraints for drug delivery appli-ances. Beyond single-breath flow fluctuations, there isalso the challenge associated with inter-subject varia-bility. It is currently nearly feasible to accuratelypredict the mean flow in an idealised upper-airway (asis done here). Heenan et al. (2003) considered tworealistic geometries (the aforementioned ‘large mouth/small nose’ and ‘small mouth/large nose’), derivedfrom MRI, to explore deposition of aerosol in theairway. The human airway is patient-specific, age-dependent, and even disease-dependent (e.g. croup,angio-oedema, anaphylaxis, epiglottitis, pharyngitis,etc.). As such the (perhaps lofty) goal in airwaysresearch is to develop the capacity for patient-specificflow predictions. Treatment prescriptions are stillremote – even once we have the technology, therewill be obstacles to knowledge-transfer. In the mean-time, it is recognised that while specific features ofairway geometry have a major influence on the flowstructure, the global flow behaviour can be inferredquite adequately using idealised models (Kleinstreuerand Zhang 2010).
Acknowledgements
The work described in this article is based heavily upon thework of former students and post-doctoral fellows in theComputational and Experimental Fluid Dynamics Labora-tory at Queen’s University. We wish to acknowledge theirtremendous contributions. We thank the High PerformanceComputing Virtual Laboratory, Queen’s University site, forcomputational support. Our work was funded from variousgrants under the auspices of the Natural Science andEngineering Research Council (NSERC) of Canada.
References
Agrawal, A. and Prasad, A.K., 2002. Properties of vortices inthe self-similar turbulent jet. Experiments in Fluids, 33,565–577.
Bailey, S.C., et al., 2010. Turbulence measurements using ananoscale thermal anemometry probe. Journal of FluidMechanics, 663, 160–179.
Ball, C.G., 2005. Lattice Boltzmann method simulation andReynolds averaged Navier–Stokes modelling of the flowinside an idealised human extra-thoracic airway. M.Sc.thesis. Queen’s University.
Ball, C.G., Uddin, M., and Pollard, A., 2008a. High resolutionturbulence modelling of airflow in an idealised humanextra-thoracic airway. Computers & Fluids, 37, 943–964.
Ball, C.G., Uddin, M., and Pollard, A., 2008b. Mean flowstructures inside the human upper airway. Flow, Turbu-lence and Combustion, 81, 155–188.
Berger, S.A., Talbot, L., and Yao, L.S., 1983. Flow in curvedpipes. Annual Review of Fluid Mechanics, 15, 461–512.
Bespalko, D.J., 2006. Direct numerical simulation of turbulentchannel flow using the lattice-Boltzmann method. M.A.Sc.thesis. Queen’s University.
Bespalko, D., Pollard, A., and Uddin, M., 2012. Analysis ofthe pressure fluctuations from an LBM simulation ofturbulent channel flow. Computers & Fluids, 54, 143–146.
Chen, S. and Doolen, G.D., 1998. Lattice Boltzmann methodfor fluid flows. Annual Review of Fluid Mechanics, 30,329–364.
Cheng, Y.S., et al., 1996. Nasal deposition of ultrafine particlesin human volunteers and its relationship to airwaygeomoetry. Aerosol Science and Technology, 25, 274–291.
Corcoran, T.E. and Chigier, N., 2000. Characterization ofthe laryngeal jet using phase doppler interferometry.Journal of Aerosol Medicine, 2 (13), 125–137.
De Backer, J.W., et al., 2008. Novel imaging techniquesusing computer methods for the evaluation of the upperairway in patients with sleep-disordered breathing: acomprehensive review. Sleep Medicine Reviews, 12, 437–447.
Dehbi, A., 2011. Prediction of extrathoracic aerosol deposi-tion using RANS-random walk and LES approaches.Aerosol Science and Technology, 45 (5), 555–569.
Doorly, D.J., Taylor, D.J., and Schroter, R.C., 2008a.Mechanics of airflow in the human nasal airways. Respi-ratory Physiology & Neurobiology, 163 (1–3), 100–110.
Doorly, D.J., et al., 2008b. Experimental investigation ofnasal airflow. Proceedings of the institution of mechan-ical engineers. Journal of Engineering in Medicine: PartH, 222 (4), 439–453.
Doorly, D.J., et al., 2008c. Nasal architecture: form and flow.Transactions of the Royal Society. Series A, Mathema-tical, Physical, and Engineering Sciences, 366, 3225–3246.
International Journal of Computational Fluid Dynamics 379
Dow
nloa
ded
by [
Uni
vers
ity o
f O
ttaw
a] a
t 07:
30 3
0 O
ctob
er 2
012

Fellouah, H. and Pollard, A., 2009. The velocity spectra andturbulence length scale distributions in the near tointermediate regions of a round free turbulent jet. Physicsof Fluids, 21, 115101.
Gonda, I., 1992. Targeting by deposition. In: A.J. Hickey, ed.Pharmaceutical inhalation aerosol technology, Vol. 54.New York: Marcel Dekker Inc., 61–82.
Heenan, A.F., et al., 2003. Experimental measurementsand computational modelling of the flow field in anidealised extra-thoracic airway. Experiments in Fluids,35, 70–84.
Heenan, A.F., et al., 2004. An investigation of the relation-ship between the flow field and regional deposition inrealistic extra-thoracic airways. Aerosol Science, 35,1013–1023.
Hicken, J.E., et al., 2005. A shift transformation for fullyconservative methods: turbulence simulation on complex,unstructured grids. Journal of Computational Physics,208, 704–734.
Hutchins, N., et al., 2009. Hot-wire spatial resolution issuesin wall-bounded turbulence. Journal of Fluid Mechanics,635, 103–136.
Iacovides, H. and Theofanopoulos, I.P., 1991. Turbulencemodelling of axisymmetric flow inside rotating cavities.International Journal of Heat and Fluid Flow, 12 (1), 2–11.
Jayaraju, S.T., et al., 2008, Large eddy and detached eddysimulations of fluid flow and particle deposition in ahuman mouththroat. Aerosol Science, 39, 862–875.
Hughes, J.M.B., Hoppin, F.G., and Mead, J., 1972. Effect oflung inflation on bronchial length and diameter in excisedlungs. Journal of Applied Physiology, 32, 25–35.
Johnstone, A.M., 2003. Experimental investigation of turbu-lent flow in an idealised human extrathoracic airway.M.Sc. thesis. Queen’s University.
Johnstone, A., Uddin, M., and Pollard, A., 2005. Calibrationof hot-wire probes using non-uniform mean velocityprofiles. Experiments in Fluids, 39, 525–532.
Johnstone, A., et al., 2004. The flow inside an idealised formof the human extra-thoracic airway. Experiments inFluids, 37, 673–689.
Karniadakis, G.E., 1999. Simulating turbulence in complexgeometries. Fluid Dynamics Research, 24, 343–362.
King, M., Chang, H.K., and Weber, M.E., 1982. Resistanceof mucus-lined tubes to steady and oscillatory airflow.Journal of Applied Physiology, 52 (5), 1172–1176.
Kleinstreuer, C. and Zhang, Z., 2003. Laminar-to-turbulentfluid-particle flows in a human airway model. Interna-tional Journal of Multiphase Flow, 29, 271–289.
Kleinstreuer, C. and Zhang, Z., 2010. Airflow and particletransport in the human respiratory system. AnnualReview of Fluid Mechanics, 42, 301–334.
Lavoie, P. and Pollard, A., 2003. Uncertainty analysis offour-sensor hot-wires and their data-reduction schemesused in the near field of a turbulent jet. Experiments inFluids, 34, 358–370.
Marusic, I., et al., 2010. Wall-bounded turbulent flows athigh Reynolds numbers: recent advances and key issues.Physics of Fluids, 22, 065103.
Menter, F.R., 1993. Zonal two-equation k–o turbulencemodels for aerodynamic flows, AIAA Paper July 1993.93–2906,
Mittal, R. and Iaccarino, G., 2005. Immersed boundarymethods. Annual Review of Fluid Mechanics, 37, 239–261.
New, T.H., Lim, K.M.K., and Tsai, H.M., 2005. Vorticalstructures in a laminar V-notched indeterminate-originjet. Physics Fluids, 17, 054108.
Oberkampf, W.L. and Trucano, T.G., 2002. Verification andvalidation in computational fluid dynamics, SandiaReport, SAND2002–0529. See also Progress in AerospaceSciences, 38, 209–272.
Ozem, H.L.M., 1997. Numerical and experimental investiga-tion of isothermal swirling flow in a flat flame burner.Thesis (PhD). Queen’s University, 1997.
Pinelli, A., et al., 2010. Immersed-boundary methods forgeneral finite-difference and finite-volume Navier–Stokessolvers. Journal of Computational Physics, 229, 9073–9091.
Pollard, A., Wakarani, N., and Shaw, J., 1996. Genesis andmorphology of erosional shapes associated with turbu-lent flow over a forward facing step. In: P.J. Ashworth,S.L. Bennett, J.L. Best and S.J. McLelland, eds. Coherentflow structures in open channels, Chapter 13. Chichester,UK: Wiley and Sons Ltd., 249–265.
Raiesi, H., Piomelli, U., and Pollard, A., 2011. Evaluation ofturbulence models using large-eddy simulation data.ASME Journal of Fluids Engineering, 133, 021203.
Roache, P.J., 1972. Computational fluid dynamics. Alber-querque, New Mexico: Hermosa Publishers.
Rutten, F., Schroder, W., and Meinke, M., 2005. Large-eddysimulation of low frequency oscillations of the Deanvortices in turbulent pipe bend flows. Physics of Fluids,17, 035107.
Ryval, J., Straatman, A.G., and Steinman, D.A., 2004. Two-equation turbulence modeling of pulsatile flow in astenosed tube. Journal of Biomechanical Engineering, 126(5), 625–635.
Savill, A.M., 1981. Zonal modelling? In: S.J. Kline, B.J.Cantwell and G.M. Lilley, eds. Proceedings of the 1980–81 AFOSR-HTTM-Stanford conference on complexturbulent flows, Stanford, CA: Stanford University,994–1004.
Schroter, R.C. and Sudlow, M.F., 1969. Flow patterns inmodels of the human bronchial airways. RespirationPhysiology, 7 (3), 341–355.
Schroeter, D., Kimbell, J.S., and Asgharian, B., 2006.Analysis of particle deposition in the turbinate andolfactory regions using a human nasal computationalfluid dynamics model. Journal of Aerosol Medicine, 19(3), 301–313.
Seidl, V., Muzaferija, S., and Peric, M., 1998. Parallel DNSwith local grid refinement. Applied Science Research, 59,379–394.
Shi, H., Kleinstreuer, C., and Zhang, Z., 2006. Laminarairflow and nanoparticle or vapor deposition in a humannasal cavity model. Journal of Biomechanical Engineer-ing-Transaction of the ASME, 128, 697–706.
Shinneeb, A.-M. and Pollard, A., 2010. Quantitative analysisof the flow in the human upper airway using POD. In:Proceedings of the 15th Int Symp on applications of lasertechniques to fluid mechanics Lisbon, Portugal, 5–8 July2010. CD-ROM.
Shinneeb, A.-M. and Pollard, A., 2011. Investigation ofvortical structures in the human airway using properorthogonal decomposition. Experiments in Fluids, in press.
Stapleton, K.W., et al., 2000. On the suitability of k-Eturbulence modeling for aerosol deposition in the mouthand throat: a comparison with experiment Journal ofAerosol Science, 31, 739–749.
Subbareddy, P.K. and Candler, G.V., 2009. A fully discretekinetic energy consistent finite-volume scheme forcompressible flows. Journal of Computational Physics,228 (5), 1347–1364.
380 A. Pollard et al.
Dow
nloa
ded
by [
Uni
vers
ity o
f O
ttaw
a] a
t 07:
30 3
0 O
ctob
er 2
012
Suzuki, Y. and Kasagi, N., 1992. Evaluation of hot-wiremeasurements in wall shear turbulence using a directnumerical simulation database. Experimental Thermaland Fluid Science, 5, 69–77.
Tropea, C., Yarin, A.L., and Foss, J.F., 2008. Handbook ofexperimental fluid mechanics. Berlin: Springer.
Uddin, M. and Pollard, A., 2007. Self-similarity of coflowingjets: the virtual origin. Physics of Fluids, 19, 068103.
Vukoslavevi, P.V., et al., 2009. On the spatial resolution ofvelocity and velocity gradient-based turbulence statisticsmeasured with multi-sensor hot-wire probes. Experi-ments in Fluids, 46 (1), 109–119.
Webster, D. and Longmire, E., 1998. Vortex rings fromcylinders with inclined exits. Physics Fluids, 10 (2), 400–416.
Wei, L. and Pollard, A., 2010. Direct numerical simulation ofa turbulent flow with pressure gradients. In: J. Peinke, M.Oberlack and A. Talamelli, eds. Progress in turbulenceIII, Proceedings of the 2008 iTi conference in turbulence.Vol. 131. Berlin: Springer Proceedings in Physics, 131–134.
Wei, L. and Pollard, A., 2011. Effects of Mach number andviscosity on pressure-gradient-vorticity flux correlations.Journal of Fluid Mechanics, 673, 1–18.
Wilcox, D.C., 2006. Turbulence modeling for CFD. 3rd ed. LaCanada, CA: DCW Industries Inc.
Xi, J.X. and Longest, P.W., 2008. Numerical predictions ofsubmicrometer aerosol deposition in the nasal cavityusing a novel drift flux approach. International Journal ofHeat and Mass Transfer, 51, 5562–5577.
Yu, G., Zhang, Z., Lessman, R., 1998. Fluid flow andparticle diffusion in the human upper respiratory system.Aerosol Science and Technology, 28, 146–158.
Zamankhan, P., et al., 2006. Airflow and deposition of nano-particles in a human nasal cavity. Aerosol Science andTechnology, 40, 463–476.
Zhang, Z. and Kleinstreuer, C., 2003. Low-Reynolds-numberturbulent flows in locally constricted conduits: a compar-ison study. AIAA Journal, 41, 831–840.
Zhang, Z. and Kleinstreuer, C., 2004. Airflow structures andnon-particle deposition in a human upper airway model.Journal of Computational Physics, 198, 178–210.
Zhang, Z. and Kleinstreuer, C., 2011. Laminar-to-turbulentfluidnanoparticle dynamics simulations: model compar-isons and nanoparticle-deposition applications. Interna-tional Journal for Numerical Methods in BiomedicalEngineering, 27 (12), 1930–1950.
Zhu, Y. and Antonia, R.A., 1995. Effect of wire separationon X-probe meansurements in a turbulent flow. Journalof Fluid Mechanics, 287, 199–223.
International Journal of Computational Fluid Dynamics 381
Dow
nloa
ded
by [
Uni
vers
ity o
f O
ttaw
a] a
t 07:
30 3
0 O
ctob
er 2
012


![4* • Pharingeal grooves/cleft : 4 • [Pharyngeal membrane]](https://static.fdokumen.com/doc/165x107/6334ea00b9085e0bf5093ec7/4-pharingeal-groovescleft-4-pharyngeal-membrane.jpg)