Greater Launceston Metropolitan Passenger Transport Plan ...
79
Page | 1 Greater Launceston Metropolitan Passenger Transport Plan Background Department of Infrastructure, Energy and Resources
-
Upload
khangminh22 -
Category
Documents
-
view
0 -
download
0
Transcript of Greater Launceston Metropolitan Passenger Transport Plan ...

Page | 1
Greater Launceston Metropolitan Passenger Transport Plan
Background
Department o f In f rast ructure, Energy and Resources


i
Contents Maps, Tables and Figures .................................................................................................................................................. ii Maps .............................................................................................................................................................................. ii Tables ........................................................................................................................................................................... iii Figures .......................................................................................................................................................................... iv
1. Introduction .............................................................................................................................................................. 1 What is a Metropolitan Transport Plan? .................................................................................................................. 1 Why have a transport plan for Launceston? ............................................................................................................. 1 Approaching the background information ............................................................................................................... 1 Aims of the Report 1 ................................................................................................................................................. 2
2. Overview of Launceston Metropolitan Area ............................................................................................................. 2 Greater Launceston .................................................................................................................................................. 2 Regional Context ....................................................................................................................................................... 3
3. Launceston Metropolitan Passenger Transport Plan Study Area – .......................................................................... 3 4. Travel patterns – review and analysis of key demographic, land use and travel data ............................................. 6 Demographic influences and population forecasts ...................................................................................................... 6
Population ................................................................................................................................................................. 6 Needs Analysis ............................................................................................................................................................ 12
Analysis ................................................................................................................................................................... 13 2011 indicators ....................................................................................................................................................... 17
Settlement and land use patterns ............................................................................................................................... 18 Land use and Planning in Tasmania ........................................................................................................................ 18 Development patterns in Greater Launceston ....................................................................................................... 19 Residential land use ................................................................................................................................................ 20 Retail and industry ‐ key activity and employment centres ................................................................................... 27
Travel Data – Journey to Work ................................................................................................................................... 39 5. Passenger transport system – review and analysis of system infrastructure and services .................................... 44 Road Network ............................................................................................................................................................. 44
Summary of Launceston Traffic Study (2012) ......................................................................................................... 45 Public transport ........................................................................................................................................................... 49
Network Overview .................................................................................................................................................. 49 Metropolitan bus services ...................................................................................................................................... 50 Non Metropolitan services ..................................................................................................................................... 61
Active transport – network description, use and identification of key linkages ........................................................ 63 The role of active transport .................................................................................................................................... 63 The Gehl Report – Launceston Public Spaces and Public Life Jan 2011 .................................................................. 63 Cycling ..................................................................................................................................................................... 64 Walking ................................................................................................................................................................... 66
Taxi service – role, structure and patronage .............................................................................................................. 67 Parking – supply and demand ..................................................................................................................................... 69
Parking in the Launceston Central Area .................................................................................................................. 69

ii
Maps, Tables and Figures
Maps
Map 1‐ Study Area ............................................................................................................................................................ 5 Map 2 ‐ Population and per annum growth rate by suburb ............................................................................................. 8 Map 3 – Total Need ......................................................................................................................................................... 15 Map 4 – Total Relative Needs ......................................................................................................................................... 16 Map 6 – Median Weekly Household Income .................................................................................................................. 17 Map 7 – Population over 65yrs ....................................................................................................................................... 17 Map 5 – Dwellings without Motor Vehicles .................................................................................................................... 17 Map 8 – Population Density ............................................................................................................................................ 22 Map 9 – Dwelling Density ............................................................................................................................................... 23 Map 10 – Dwellings mapped by address point ............................................................................................................... 24 Map 11 – Building approval by CCD, 1997‐2007 ............................................................................................................ 25 Map 12 – Residential Land Use ....................................................................................................................................... 26 Map 13 – Commercial Land Use ..................................................................................................................................... 28 Map 14 – Retail Hierarchy (as identified by the Launceston Retail Audit and Activity Centre Hierarchy strategy) ....... 33 Map 15 – Industrial Land Use ......................................................................................................................................... 35 Map 16 – School Locations and high school/college student numbers ......................................................................... 38 Map 17 – Average Annual Daily Traffic ........................................................................................................................... 47 Map 18 – Travel Time Survey Routes .............................................................................................................................. 48 Map 19‐ Metro Bus Network (Source: MetroTas) .......................................................................................................... 51 Map 20‐ Tiger Bus City Explorer ...................................................................................................................................... 54 Map 21 ‐ Tiger Bus River Explorer ................................................................................................................................... 54 Map 22 – Principal Urban Cycling Network Launceston ................................................................................................. 65 Map 23‐ Gradient greater than 15% and distance to act5ivity centres.......................................................................... 66 Map 24 ‐ Parking and Bus Interchange ........................................................................................................................... 72

iii
Tables
Table 1 – Relevant Studies and Reports............................................................................................................................ 2 Table 2 ‐ Study Suburbs .................................................................................................................................................... 3 Table 3 – Percentage Change 2001‐2006 ......................................................................................................................... 6 Table 4 – Population projections by LGA .......................................................................................................................... 9 Table 5‐ Transport Need Indicators and Weightings ...................................................................................................... 12 Table 6 Highest Transport Needs CCDs – Launceston ................................................................................................... 13 Table 7 Highest Increases in CCD Needs Score – Launceston ........................................................................................ 13 Table 8 Highest Decreases in CCD Needs Score – Launceston ...................................................................................... 13 Table 9 ‐ Average of SA1 populations and dwellings per hectare by suburb ................................................................. 20 Table 10 ‐ Dwelling type as a percentage by suburb ...................................................................................................... 21 Table 11 – Journey to Work from Home Zone by Suburb as percentage ....................................................................... 42 Table 12 – Major State and local roads .......................................................................................................................... 45 Table 13 ‐ Travel Time Survey Results ............................................................................................................................ 48 Table 14 ‐ 2 Key Average service frequencies (minutes) Frequency ‐ Return or Loop services ..................................... 52 Table 15‐ Launceston‐ total passenger boardings .......................................................................................................... 55 Table 16 ‐ Number of return daily services to urban fringe areas .................................................................................. 61 Table 17 ‐ Central Area Car Parks ................................................................................................................................... 69

iv
Figures
Figure 1 ‐ Plan of Launceston – 1885. Source: National Library of Australia <http://nla.gov.au/nla.aus‐f9598> ............ 3 Figure 2 ‐ Population change by age for Greater Launceston, Northern Region and Tasmania for 2001‐2011 .............. 7 Figure 3 – Greater Launceston Age Profile 2011 .............................................................................................................. 7 Figure 4 – Suburb Age Profiles ........................................................................................................................................ 10 Figure 5 ‐ Origin trips as a percentage of Greater Launceston trips and Population by suburb .................................... 40 Figure 6 ‐ Origin trips as a percentage of suburb population ......................................................................................... 40 Figure 7 ‐ Work zones as a percentage of total trips ...................................................................................................... 41 Figure 8 ‐ JTW for Greater Launceston by mode for 1996, 2001, 2006 and 2011 .......................................................... 43 Figure 9 ‐ JTW for Greater Launceston by suburb and mode 2011 ................................................................................ 43 Figure 10 ‐ Launceston Weekday Patronage Metro & Non Metro by Type of Passenger .............................................. 56 Figure 11 ‐ Launceston Metro and Non Metro Patronage by type by temporal periods ............................................... 57 Figure 12 – Launceston Metro and Non Metro Patronage Weekdays by Time of Day .................................................. 57 Figure 13 – Weekday Launceston Metro Network Boardings by Passenger Type ......................................................... 58 Figure 14 – Saturday Patronage by Passenger Type ....................................................................................................... 59 Figure 15 – Sunday Patronage by Passenger Type ......................................................................................................... 59 Figure 16 ‐ Launceston Timetable Patronage by area by temporal periods ................................................................... 60 Figure 17 ‐ ALL Launceston Metro Patronage (incl Metro student only services) by area ............................................ 60

Page | 1
1. Introduction
Report 1 – Review, Analysis and Problem Identification (Report 1) provides the background detail that informs the development of the Greater Launceston Metropolitan Passenger Transport Plan (Passenger Transport Plan). Report 1 will consider current and historic demographic and land use patterns, current travel patterns and mode choice and infrastructure and service provision.
What is a Metropolitan Transport Plan?
The rationale behind the development of metropolitan transport plans is to better integrate transport planning and land use planning through a more holistic planning approach. Investment in the transport system needs to be matched by supportive land use planning decisions.
Decisions that encourage land use patterns typified by low density suburban sprawl, segregation of land uses into separate areas and location of commercial development on the urban fringe make it costly and operationally difficult to provide public transport. These patterns also limit the viability of other modes, particularly walking and cycling. Historically, the solutions to transport problems were to provide more capacity for cars. The financial, social and environmental cost of this approach is not sustainable and, to the extent that other modes are valued as alternatives, it is necessary to consider how their use can be better supported.
Metropolitan transport plans should address land use measures required to support improved passenger transport outcomes, including:
• Identification of activity centre hierarchy, including satellite centres which are serviced by public transport; • Location of major development (e.g. commercial development within major activity centres) and identified
future development; • Capacity of alternative transport modes to better meet transport needs in proposed areas of new
development, and within the existing urban footprint; • Promotion of appropriate land use, by identifying designated corridors that will be targeted for delivery of
higher frequency public transport services; and • The potential influence of smart growth principles, such as an urban growth boundary, on existing and
future infrastructure provision.
Why have a transport plan for Launceston?
The Tasmanian Urban Passenger Transport Framework (Framework) provides the overarching policy response to deliver better modal choice to people in urban areas. The Framework identifies Metropolitan Transport Plans as key initiatives to ensure that investment in the transport system is matched by supportive land use planning decisions.
In developing the Framework, the Greater Hobart region was used as a case study to consider appropriate options and actions for the Tasmanian urban context. A transport plan for Greater Launceston, as the next major urban centre, is the appropriate next step in furthering the initiatives of the Framework.
Approaching the background information
Report 1 will incorporate analysis of new data and information, where this is current and salient. This will include 2011 Census data (as available) to support demographic and socio‐economic analysis and travel patterns.
Where analysis of data has recently been undertaken by, or for, DIER or other stakeholders, relevant reports, strategies and plans will be used to provide input to the background reports and the Plan. Summarising the findings from these reports will provide a more complete picture of the current situation and future trends and avoids re‐visiting recent analysis. Known relevant reports include:
Page | 2
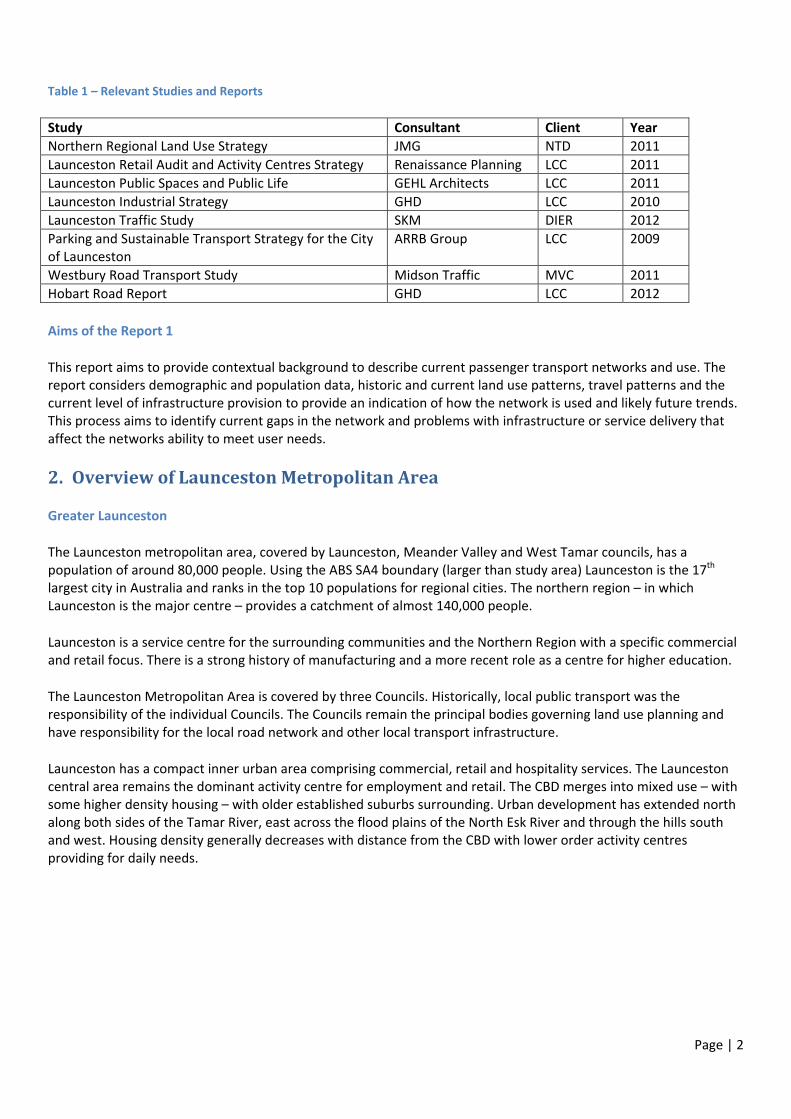
Table 1 – Relevant Studies and Reports
Study Consultant Client Year Northern Regional Land Use Strategy JMG NTD 2011 Launceston Retail Audit and Activity Centres Strategy Renaissance Planning LCC 2011 Launceston Public Spaces and Public Life GEHL Architects LCC 2011 Launceston Industrial Strategy GHD LCC 2010 Launceston Traffic Study SKM DIER 2012 Parking and Sustainable Transport Strategy for the City of Launceston
ARRB Group LCC 2009
Westbury Road Transport Study Midson Traffic MVC 2011 Hobart Road Report GHD LCC 2012
Aims of the Report 1
This report aims to provide contextual background to describe current passenger transport networks and use. The report considers demographic and population data, historic and current land use patterns, travel patterns and the current level of infrastructure provision to provide an indication of how the network is used and likely future trends. This process aims to identify current gaps in the network and problems with infrastructure or service delivery that affect the networks ability to meet user needs.
2. Overview of Launceston Metropolitan Area
Greater Launceston
The Launceston metropolitan area, covered by Launceston, Meander Valley and West Tamar councils, has a population of around 80,000 people. Using the ABS SA4 boundary (larger than study area) Launceston is the 17th largest city in Australia and ranks in the top 10 populations for regional cities. The northern region – in which Launceston is the major centre – provides a catchment of almost 140,000 people.
Launceston is a service centre for the surrounding communities and the Northern Region with a specific commercial and retail focus. There is a strong history of manufacturing and a more recent role as a centre for higher education.
The Launceston Metropolitan Area is covered by three Councils. Historically, local public transport was the responsibility of the individual Councils. The Councils remain the principal bodies governing land use planning and have responsibility for the local road network and other local transport infrastructure.
Launceston has a compact inner urban area comprising commercial, retail and hospitality services. The Launceston central area remains the dominant activity centre for employment and retail. The CBD merges into mixed use – with some higher density housing – with older established suburbs surrounding. Urban development has extended north along both sides of the Tamar River, east across the flood plains of the North Esk River and through the hills south and west. Housing density generally decreases with distance from the CBD with lower order activity centres providing for daily needs.

Page | 3
Figure 1 ‐ Plan of Launceston – 1885. (Source: National Library of Australia http://nla.gov.au/nla.aus‐f9598)
Regional Context
Greater Launceston is the second largest urbanised centre in Tasmania and is the major commercial and retail activity centre for the Northern Region. Surrounding satellite towns offer “lifestyle” living options and maintain strong commuter ties to the study area. Further afield, industry, agriculture and tourism provide employment opportunities and regional centres provide for most daily needs while the Launceston area caters for the more significant retail and commercial requirements and to access higher levels of education.
3. Launceston Metropolitan Passenger Transport Plan Study Area –
For this study the Greater Launceston metropolitan area has a boundary defined by the extent of the regular urban passenger transport services. This includes the following suburbs:
Table 2 ‐ Study Suburbs
Suburb LGA
Blackstone Heights Meander Valley Council
East Launceston Launceston City Council
Grindelwald West Tamar Council
Hadspen Meander Valley Council

Page | 4
Invermay Launceston City Council
Kings Meadows Launceston City Council
Launceston Launceston City Council
Legana West Tamar Council
Mayfield Launceston City Council
Mowbray Launceston City Council
Newnham Launceston City Council
Newstead Launceston City Council
Norwood Launceston City Council
Prospect Launceston City Council
Prospect Vale Meander Valley Council
Punchbowl Launceston City Council
Ravenswood Launceston City Council
Riverside West Tamar Council
Rocherlea Launceston City Council
South Launceston Launceston City Council
St Leonards Launceston City Council
Summerhill Launceston City Council
Travellers Rest Meander Valley Council
Trevallyn Launceston City Council/West Tamar Council
Waverley Launceston City Council
West Launceston Launceston City Council
Youngtown Launceston City Council
The study will consider the relationship between satellite towns (and growth areas) and the contiguous urban area. These will be considered in terms of the transport corridors into metropolitan areas. This will include Northern Midlands and George Town Councils with linkages to the following towns considered:
Town LGA
George Town George Town Council
Evandale Northern Midlands Council
Carrick Northern Midlands Council
Perth Northern Midlands Council
Longford Northern Midlands Council
Map 1 shows the study area – defined by the urban extent – and the neighbouring satellite towns.

Page | 5
Map 1‐ Study Area

Page | 6
Table 3 – Percentage Change 2001‐2006
0‐44 years
45 years and over
Greater Launceston 1.13% 20.20%
Northern Region ‐5.11% 24.40%
Tasmania ‐3.29% 24.27%
4. Travel patterns – review and analysis of key demographic, land use and travel data
Demographic influences and population forecasts
Population
Population for the study area at the 2011 Census was 80,706. This represents a growth rate 9% over the ten year period from 2001. This is slightly faster than the State growth of 8.4% and northern region (SA4) growth at 7.8% for the same period. Growth in Tasmania was half the National growth of 15%, equal to South Australia but lower than all other states. In this period growth in Tasmania outside of the capital city was larger than within, counter to all other states and territories.
Over this period Legana (3.5%), Youngtown (3.21%), Blackstone Heights (2.36% and Prospect Vale (2.00%) exhibited the fastest average growth rates. Hadspen and Blackstone Heights experienced significant growth in the previous census period 1996‐2001 (8.98% and 7.78% respectively), with growth slowing in the following decade. Suburbs that recorded negative growth rates included Travellers Rest – shrinking by 6% per annum – and Launceston, Rocherlea, Prospect, Ravenswood and Waverly reducing by up to 1.70% per annum (Map 2).
While there are variations in growth rates between Census periods for individual suburbs, the general trend over the 10 year period examined suggest fairly stable or shrinking populations in the established suburbs and those closer to the CBD. Growth is occurring in the outer suburbs. Growth patterns generally reflect historic and current land use zoning decisions and the available greenfield development opportunities (see Settlement and Land Use Patterns below).
Where growth is occurring within the age structure of a population has an effect on household composition and localised differences in how and why people travel. Influences that are shaping the structure of State and local populations include improved health benefits (that increase lifespan and help to maintain active lifestyles into later life stages and a trend to lower birth rates). These trends are reflected across developed countries, with older cohorts becoming over represented in the population over time.
An ageing population is evident in Tasmania from the 3.29% decline in the population of 0‐44 year olds and a 24.27% increase in the population aged 45 and over for the period 2001‐2011. This is more pronounced in the Northern region, with a decline of more than 5% in the population of 0‐44 year olds. While the population in Greater Launceston is also ageing (20.2% increase in the 45 and over population for the period 2001‐2011) it avoided the state‐wide decline in the 0‐44 year old population, with a 1.13% increase.
The other major influence on population change in Tasmania is migration. This can be seen at a State and regional level. General migratory movements within developed countries tend towards movements to cities and urban lifestyles and away from regional areas. Tasmania is often seen as a “lifestyle” choice rather than for its employment/career opportunities. This is a likely explanation for migration trends over the last decade that have seen a decrease in the mid‐20 to mid‐30 cohorts and an increase in the 45+ age groups and school age children (see Fig 2).

Page | 7
Figure 2 ‐ Population change by age for Greater Launceston, Northern Region and Tasmania for 2001‐2011
Figure 3 – Greater Launceston Age Profile 2011
While the age profile for the Launceston Urban area has similarities to the wider Tasmanian structure it is not as pronounced in some aspects. The profile taken from the 2011 Census (see Fig 3) and comparisons with previous Census periods demonstrates an ageing population. However the decrease in children in the 0‐4 years cohort is less pronounced and there is less distinction between the 20s cohorts and the cohorts either side. A possible influence on the latter is the regional attraction of Launceston for higher education and employment.
For the 2011 Census Greater Launceston (SA3) population had an average age of 38. Around 18% of the population was in the 0‐14 age group and approximately 16% were aged 65 and over.
0‐14 yr 15‐29 yr 30‐44 yr 45‐59 yr 60‐74 yr 75+ yr
Greater Launceston ‐1% 6% ‐2% 15% 32% 16%
Northern Region ‐6% 1% ‐10% 16% 41% 20%
Tasmania ‐4% 3% ‐8% 17% 38% 21%
‐20%
‐10%
0%
10%
20%
30%
40%
50%
Percen
tage
cha
nge
2001
‐201
1
4000 3000 2000 1000 0 1000 2000 3000 4000
0‐4 years5‐9 years
10‐14 years 15‐19 years 20‐24 years25‐29 years30‐34 years35‐39 years40‐44 years45‐49 years50‐54 years55‐59 years60‐64 years65‐69 years70‐74 years75‐79 years80‐84 years85‐89 years90‐94 years95‐99 years
100 years and over
Urban Launceston
Male
Female
Source: ABS 2011, Place of usual residence

Page | 8
Map 2 ‐ Population and per annum growth rate by suburb
Page | 9
Expected growth
Growth projections for LGAs in Tasmania were calculated in 2008 for the Demographic Change Advisory Council (DCAC). Projections were calculated out to 2032 using high, mid and low growth scenarios. For the Launceston Transport Plan the mid‐range projection is being considered. It should be noted that projections are only illustrations of how a population would change over time if certain assumptions were to hold true for the period of projection. They should not be considered as predictions or forecasts.
For a state‐wide projection DCAC assumed the following to develop the medium growth scenario:
• A fertility rate of 2.16 children per woman in 2007 decreasing to 1.95 in 2017 and remaining constant.
• Mortality rate of 86 years for men and 89.5 years for women by 2057 • Zero net interstate migration; and • A net gain of 1000 persons per year for overseas migration.
At the LGA level these assumptions were adjusted through consultation to reflect local variance. Projections are based on 2007 estimated resident population (ERP). For the LGAs within the study area the following projections were generated:
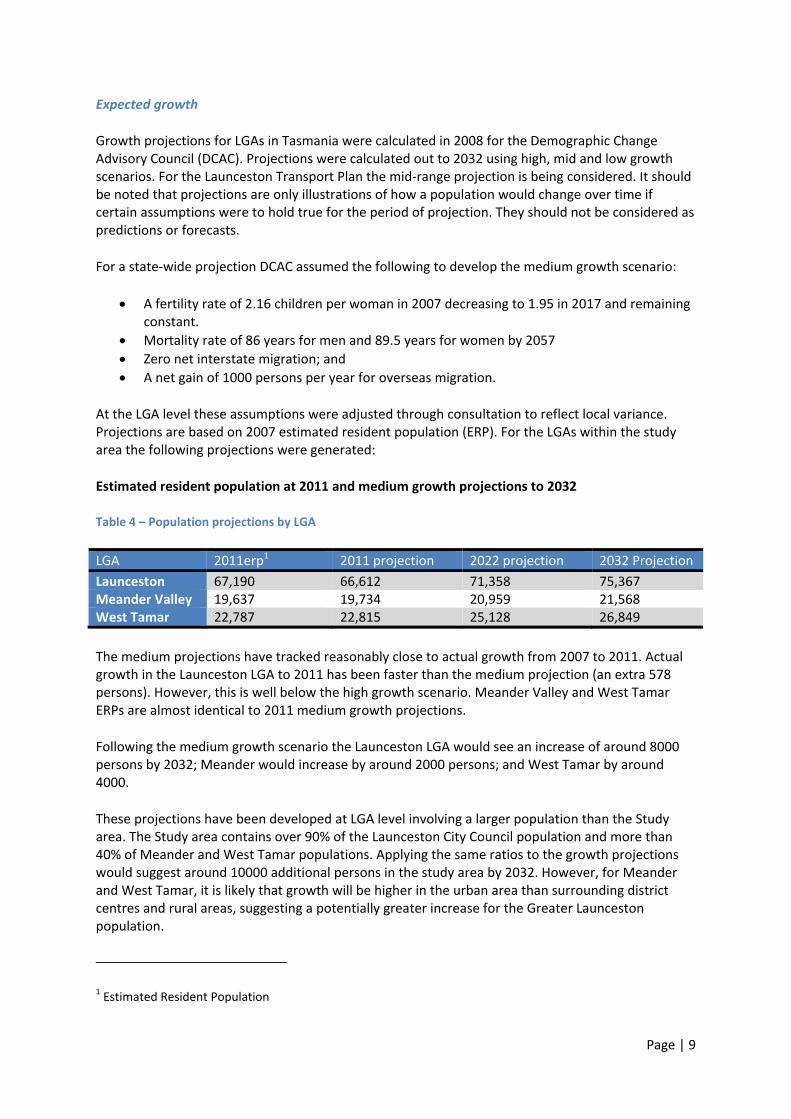
Estimated resident population at 2011 and medium growth projections to 2032
Table 4 – Population projections by LGA
LGA 2011erp1 2011 projection 2022 projection 2032 Projection Launceston 67,190 66,612 71,358 75,367 Meander Valley 19,637 19,734 20,959 21,568 West Tamar 22,787 22,815 25,128 26,849
The medium projections have tracked reasonably close to actual growth from 2007 to 2011. Actual growth in the Launceston LGA to 2011 has been faster than the medium projection (an extra 578 persons). However, this is well below the high growth scenario. Meander Valley and West Tamar ERPs are almost identical to 2011 medium growth projections.
Following the medium growth scenario the Launceston LGA would see an increase of around 8000 persons by 2032; Meander would increase by around 2000 persons; and West Tamar by around 4000.
These projections have been developed at LGA level involving a larger population than the Study area. The Study area contains over 90% of the Launceston City Council population and more than 40% of Meander and West Tamar populations. Applying the same ratios to the growth projections would suggest around 10000 additional persons in the study area by 2032. However, for Meander and West Tamar, it is likely that growth will be higher in the urban area than surrounding district centres and rural areas, suggesting a potentially greater increase for the Greater Launceston population.
1 Estimated Resident Population
Page | 10
Local variations
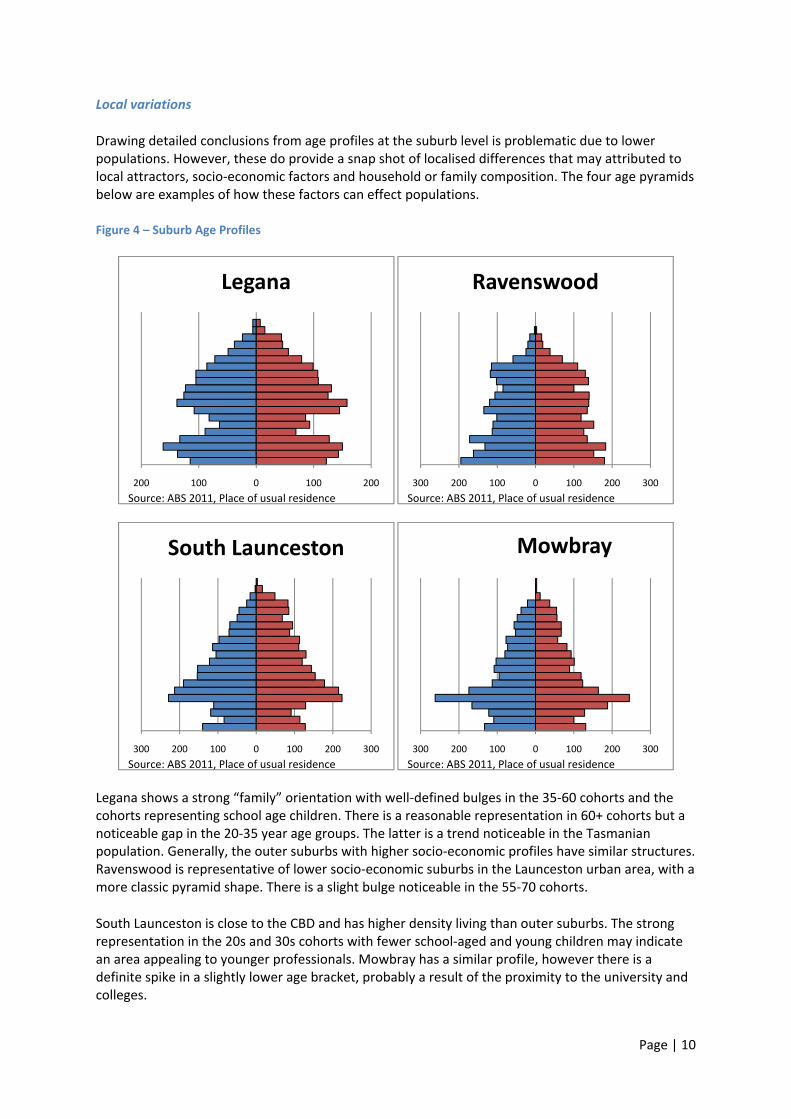
Drawing detailed conclusions from age profiles at the suburb level is problematic due to lower populations. However, these do provide a snap shot of localised differences that may attributed to local attractors, socio‐economic factors and household or family composition. The four age pyramids below are examples of how these factors can effect populations.
Figure 4 – Suburb Age Profiles
Legana shows a strong “family” orientation with well‐defined bulges in the 35‐60 cohorts and the cohorts representing school age children. There is a reasonable representation in 60+ cohorts but a noticeable gap in the 20‐35 year age groups. The latter is a trend noticeable in the Tasmanian population. Generally, the outer suburbs with higher socio‐economic profiles have similar structures. Ravenswood is representative of lower socio‐economic suburbs in the Launceston urban area, with a more classic pyramid shape. There is a slight bulge noticeable in the 55‐70 cohorts.
South Launceston is close to the CBD and has higher density living than outer suburbs. The strong representation in the 20s and 30s cohorts with fewer school‐aged and young children may indicate an area appealing to younger professionals. Mowbray has a similar profile, however there is a definite spike in a slightly lower age bracket, probably a result of the proximity to the university and colleges.
200 100 0 100 200
Legana
Source: ABS 2011, Place of usual residence300 200 100 0 100 200 300
Ravenswood
Source: ABS 2011, Place of usual residence
300 200 100 0 100 200 300
South Launceston
Source: ABS 2011, Place of usual residence300 200 100 0 100 200 300
Mowbray
Source: ABS 2011, Place of usual residence

Page | 11
In each of these examples, the transport needs will vary according to demographic profiles as well as specific socio‐economic factors. These are discussed further in the following section.
Needs Analysis
Page | 12
Needs Analysis
The recent management of public transport has focussed on ensuring that minimum service levels are provided to maintain accessibility for people who have limited alternative transport options. It is this focus that has strongly influenced the ‘high penetration/low frequency’ model under which urban bus services are generally provided. The priority has been to reduce walking distances from residences to bus stops. The consequence of this strategy is that routes have a tendency to be circuitous and indirect, benefitting time‐rich passengers with poor personal mobility but removing any incentive for time‐sensitive travellers to use public transport instead of the private car.
In 2003, Booz Allan Hamilton Inc. (now Booz & Co) was engaged by DIER to undertake transport needs analysis using 2001 Census data. The analysis was later repeated using 2006 Census data, allowing information to be updated and compared. The purpose of this work was to assess the extent to which public transport services aligned with social need.
The same approach was used in the each study, based on methodologies identified in previous work by Currie and Wallis2. In brief, the methodology involved:
• Assembling transport need indicators for a series of areas; • Defining a Need Score for each area based on the relative indicator values; and • Examining the differences in these scores between the various areas.
Two types of need indicators were assembled:
• Total Transport Need Indicator (Total Need) – based on the total number of persons in the area that belong to each indicator group; and
• Relative Transport Need Indicator (Relative Need) – based on the proportion of population in an area belonging to each indicator group.
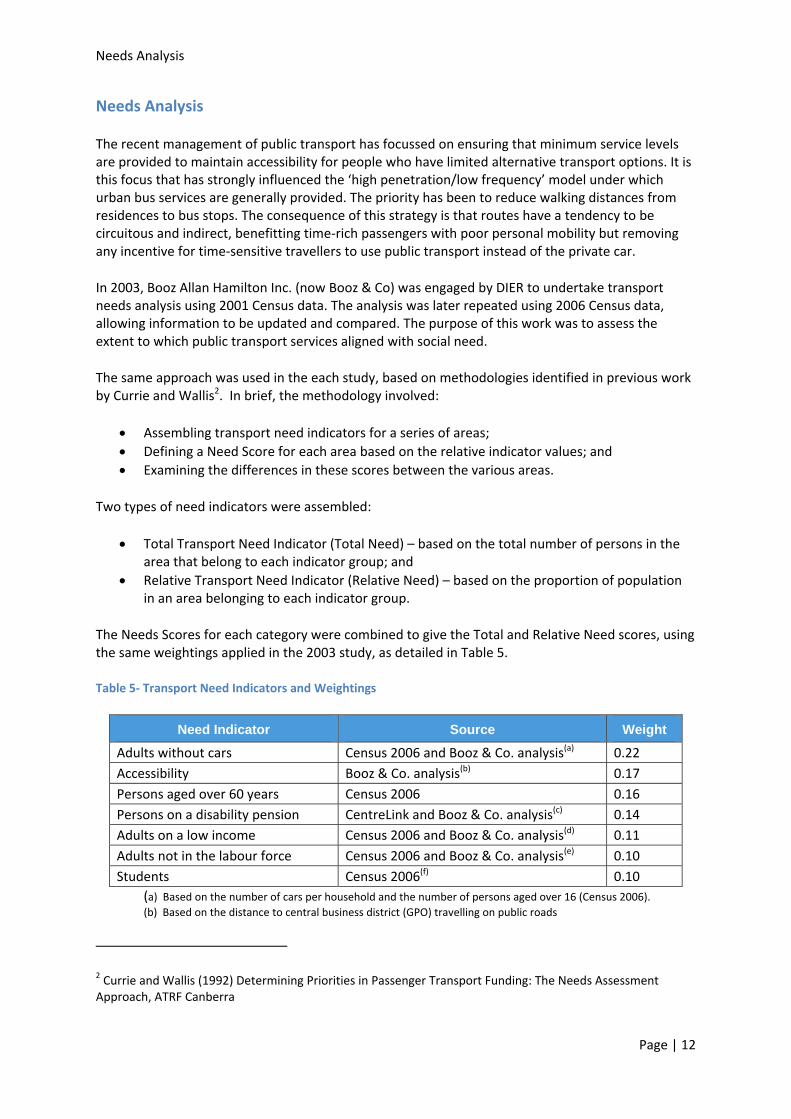
The Needs Scores for each category were combined to give the Total and Relative Need scores, using the same weightings applied in the 2003 study, as detailed in Table 5.
Table 5‐ Transport Need Indicators and Weightings
Need Indicator Source Weight
Adults without cars Census 2006 and Booz & Co. analysis(a) 0.22 Accessibility Booz & Co. analysis(b) 0.17 Persons aged over 60 years Census 2006 0.16 Persons on a disability pension CentreLink and Booz & Co. analysis(c) 0.14 Adults on a low income Census 2006 and Booz & Co. analysis(d) 0.11 Adults not in the labour force Census 2006 and Booz & Co. analysis(e) 0.10 Students Census 2006(f) 0.10
(a) Based on the number of cars per household and the number of persons aged over 16 (Census 2006). (b) Based on the distance to central business district (GPO) travelling on public roads
2 Currie and Wallis (1992) Determining Priorities in Passenger Transport Funding: The Needs Assessment Approach, ATRF Canberra

Needs Analysis
Page | 13
(c) Based on the number of persons on a disability pension in postcode grouping (CentreLink 2007). This was then spread across CCDs based on number of persons aged over 60 for all CCDs (d) Based on household income <$250 per week (Census 2006) and average 2 persons aged over 16 in each household (Census 2006). (e) Based on persons not in labour force (Census 2006). (f) Based on persons attending an educational institution (Census 2006).
Analysis
Analysis was undertaken at Collector District level and included 149 CCDs in the study area. The top five ranking CCDs for 2006 are shown in Table 6, along with their 2001 scores and rankings.
Table 6 Highest Transport Needs CCDs – Launceston
CD Name 2006 Score
2006 Rank 2001 Score
2001 Rank
Kings Meadow C 100 1 94 3 Youngtown E 89 2 69 51 Newstead I 87 3 91 5 Norwood A 86 4 89 7 South Launceston I 86 5 89 8
The top rating CCDs for Launceston in 2006 were, in general, high rating CCDs in the 2003 study. The difference in scores between the top (Kings Meadow C) and second top ranking CCDs shows that this CCD has a significantly higher need.
Table 7 Highest Increases in CCD Needs Score – Launceston
CD Name 2006 Score
2006 Rank
2001 Score
2001 Rank
Score Change
Rank Change
Youngtown E 89 2 69 51 +20 +49 Newstead D 65 27 51 138 +14 +111 Inveresk D 63 30 57 120 +6 +90 Prospect Vale C 66 26 60 101 +6 +75 Kings Meadow C 100 1 94 3 +6 +2
For Youngtown E, the largest component score increases were for Aged 60+, people with disabilities and Not‐In‐Workforce Populations.
Table 8 Highest Decreases in CCD Needs Score – Launceston
CD Name 2006 Score
2006 Rank
2001 Score
2001 Rank
Score Change
Rank Change
Legana G 47 87 76 28 ‐29 ‐59 Hadspen B 47 88 76 29 ‐29 ‐59 Riverside F 37 132 66 68 ‐29 ‐64 Legana B 48 78 75 33 ‐26 ‐45 Blackstone Heights C 30 146 56 125 ‐26 ‐21
For Riverside F, the largest component score decreases were for Adults Without Cars and Student Populations, with minimal change and even increases in other components.

Needs Analysis
Page | 14
The maps (pages 15&16) show the relative and total needs scores for Launceston. The maps indicate that the greatest numbers of people with higher transport needs correspond with outer urban communities. However, relative to their population, some inner suburban areas – such as Invermay, and parts of East Launceston – have a moderate proportion of people who experience transport disadvantage.

Needs Analysis
Page | 15
Map 3 – Total Need

Needs Analysis
Page | 16
Map 4 – Total Relative Needs

Needs Analysis
Page | 17
2011 indicators
The 2001/2006 Booz & Co analysis provides a detailed and consistent view of transport disadvantage in the Greater Launceston area.
Some 2011 data is now available and several indicators have been considered individually at suburb level. This includes:
• Dwellings without vehicles; • Median weekly household incomes; and • Percentage of population over 65 years of
age.
A repeat of the study with 2011 Census data is not being considered at this stage. In terms of transport need, the individual indicators analysed using 2011 Census data correspond with the previous Booz & Co work. The individual indicators highlight the northern suburbs as relatively low‐income areas, with lower levels of vehicle ownership. The southern suburbs have relatively high proportion of people aged over 65.
Map 6 – Median Weekly Household Income
Map 7 – Population over 65yrs
Map 5 – Dwellings without Motor Vehicles

Needs Analysis
Page | 18
Settlement and land use patterns
Land use and Planning in Tasmania
State planning
The resource management and Planning System (RMPS) was established in 1994 to ensure sustainable outcomes for land use and development in Tasmania. A set of objectives were outlined including:
• The promotion of sustainable development;
• Fair and orderly use and development; and
• The facilitation of economic development in accordance with other objectives.
The overarching piece of legislation informing the RMPS is the Land Use Planning and Approvals Act 1993 (LUPAA). This is the mechanism under which council planning schemes are prepared, approved and amended and planning directives are assessed as well as providing for development control and agreements between councils and landowners.
Under the Act, the Tasmanian Planning Commission has statutory responsibility covering statutory planning and the assessment of major projects. This includes the assessment of regional and local planning instruments and advice to the Minister on related matters.
Planning reform
The Tasmanian Planning Commission has instituted a suite of planning reform measures with the aim of improving and standardising planning processes across the State. These measures include the development of Regional Land Use Strategies and the creation of new, or interim, planning schemes that will adhere to a standardise template. Councils within the Northern Region have elected to create interim planning schemes.
Regional Land Use Strategies
Regional land use strategies were developed for each of the three regions in Tasmania and the Regional Land Use Strategy of Northern Tasmania (Strategy) was declared, under LUPAA, in 2011. Under the LUPAA, interim planning schemes are required to be consistent with the Regional Plan.
The Strategy aims to provide a policy framework to future development and planning to 2032. Formation of the Strategy included consideration of current and future settlement patterns and a hierarchy of settlements was developed. The Passenger Transport Plan uses the Strategy’s urban boundary and settlement hierarchy as the basis for considering current and future passenger transport needs.
Local Planning Schemes
For local governments, planning schemes are the statutory instruments, developed under LUPPA and consistent with regional strategies, that detail the requirements that apply to new use or development. They provide a ‘plan’ showing land use zones and overlays and an ‘ordinance’ describing conditions of use and development within zones.
Needs Analysis
Page | 19
Councils in Northern Tasmania are currently preparing or have prepared draft interim Planning Schemes. Launceston City Council’s scheme was declared in October 2012.
Development patterns in Greater Launceston
Settled in 1806, Launceston is one of Australia’s oldest towns. The development of the town and the transport network over the previous two centuries has been shaped by residential settlement patterns and expansion, commercial activity and the range of transport modes that have been used.
Relationship to the landscape has defined aspects of Launceston’s settlement patterns and transport network. At the confluence of the North and South Esk Rivers and the Tamar Estuary, settlement and expansion has been influenced by proximity to the port, the hills and gorges of the South Esk River and the flood plains of the North Esk River.
The early layout of the town sat on low lying land at the head of the Tamar Estuary and on the southern bank of the North Esk River, bordered by hills to the east and west. The hills became the suburbs of East and West Launceston and settlement expanded across the North Esk, in Inveresk and St Leonards.
Residential, industrial and commercial districts have developed and expanded – driven by demand and by access – with major arterials defined initially be connections to intra‐ and inter‐regional centres. As the town grew and residential areas expanded the arterial and local networks adapted to accommodate metropolitan needs and changing transport modes – from horse to tram to motor vehicle.
The current urban extent still centres on the original town precinct with residential expansion north to Rocherlea, east to include Ravenswood, Waverley and St Leonards, south and west to encompass Kings Meadows, Youngtown and Prospect through to Hadspen and on the western side of the Tamar though to Legana. The CBD is the primary activity centre with expanding roles for Mowbray and Kings Meadows.
When considering the relationship between land use and transport, the study area has attributes typical of Australian cities, where land use has developed in tandem with the increasing dominance of the private vehicle as mode of choice and a lack of incentive to provide boundaries to expansion. The flexibility of travel provided by private vehicles reinforced mid twentieth century planning policies towards separation of land uses in outer suburbs that are now characterised by low density single detached dwellings and a lack of activity centres.
This style of development has placed increased reliance on private cars for every day trips. Low population, urban sprawl and high car ownership inhibits an efficient and cost‐effective public transport service, making it difficult to provide a service which meets all of the community’s needs.

Needs Analysis
Page | 20
Residential land use
Population and dwelling densities
Population and dwelling statistics were collected for the 2011 Census. The Statistical Area Level 1 (SA1) geography has been used to represent the data to provide a crude indication of population and housing densities across the Study area. Due to the size of the boundaries and the inclusion of non‐residential facilities, utilities and non‐residential zoned land the following analyses provide an indication only and is liable to understate densities compared to other methodologies.
Map 8 and 9 show population and dwelling density per hectare for each SA1 and Table 8 provides a summary average by suburb. Launceston has relatively low densities with an average population density across the Study Area of under 15 people per hectare and a housing density of fewer than 7 dwellings per hectare. A more refined analysis (by ABS meshblock or specific location sample) would return higher density figures for some areas, however in any areas average density levels are still likely to be below the agreed national standard for effective delivery of public transport services, which is a minimum of 15 dwellings per hectare. Map 10 represents dwellings by address point to indicate where, within ABS SA1 boundaries, higher densities occur.
Inner city areas have higher density populations and dwelling densities, with South Launceston achieving highest in both. Densities grade down though suburban and outer suburban areas, with older established areas generally having higher densities than newer growth areas. Map 10 shows individual address points to provide a more accurate spatial representation of density.
While data provided in Table 9 suggests Hadspen and Legana have very low densities, the averaged SA1 areas that make up the suburban geographies include greenfield sites or rural land that is not currently developed. As described above, recent population growth has been faster in outer areas.
Map 11 provides a representation of building approval data (ABS) from 1997/98‐2006/07 (by Census Collector District). This gives an indication of residential growth in outer areas comparative to inner‐urban areas. While building approvals were lower in more established areas, the ratio of units and flats to detached dwellings was greater, suggesting a move towards higher density dwellings with possible infill development. It is noted that where higher frequency bus services are contemplated, a minimum of 25 dwellings per hectare may be necessary to establish the necessary levels of demand
Table 9 ‐ Average of SA1 populations and dwellings per hectare by suburb
Suburbs Average Pop/Ha
Average Dwellings/Ha
Hadspen 9.5 4.0Invermay 16.7 8.6Kings Meadows/Punchbowl 14.1 6.6Launceston 16.2 8.7Legana 5.2 2.0Mowbray 15.7 7.0Newnham ‐ Mayfield 17.8 7.6Newstead 18.2 8.4Norwood (Tas.) 16.3 6.9Prospect Vale ‐ Blackstone 12.9 5.8

Needs Analysis
Page | 21
Ravenswood 16.5 7.0Riverside 10.2 4.6South Launceston 18.1 9.2Summerhill/Prospect 16.4 7.2Trevallyn 15.4 6.7Waverley/St Leonards 10.8 4.5West Launceston 13.5 6.5Youngtown 13.9 6.0Greater Launceston 14.6 6.7
Dwelling type
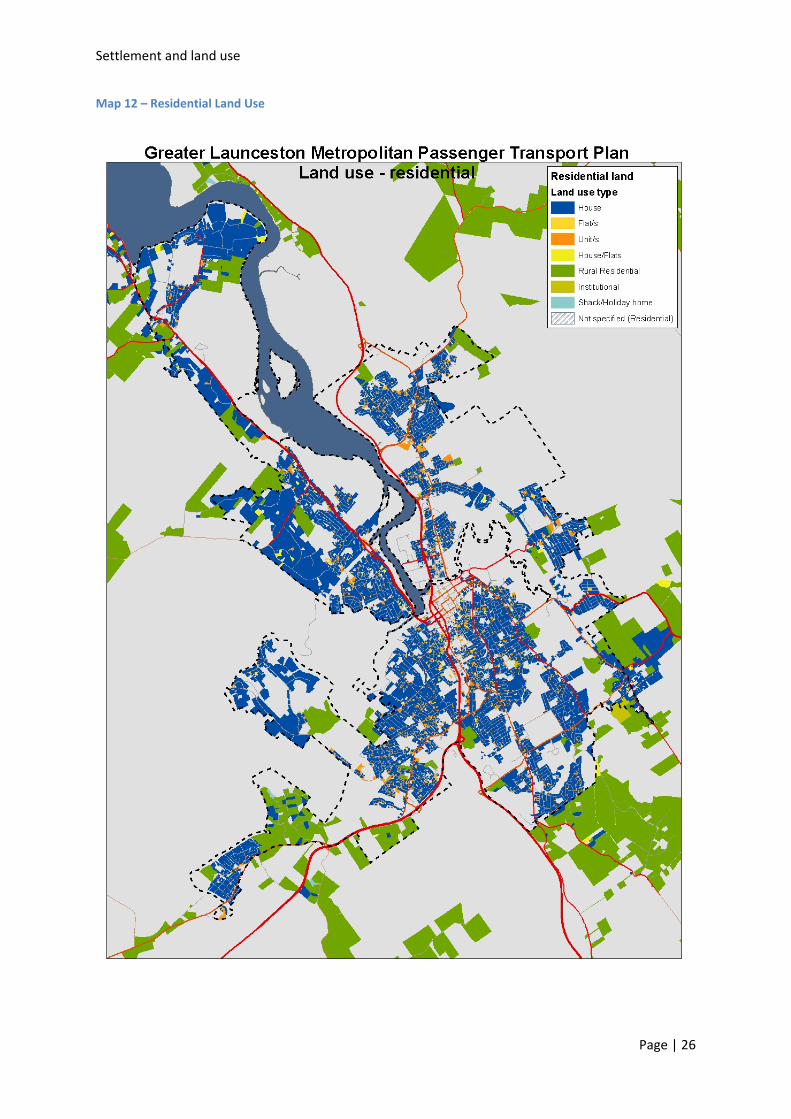
Map 12 shows current residential land use in the Greater Launceston area which is predominantly detached dwellings – 81% (Table 9). Areas of higher density living are scattered throughout the Study Area with Launceston, South Launceston and Youngtown having the highest percentage of flats/units.
Table 10 ‐ Dwelling type as a percentage by suburb
Suburb House Semi‐detached Flat/Unit Other
Hadspen 87% 8% 3% 2% Invermay 75% 14% 10% 1% Kings Meadows ‐ Punchbowl 88% 5% 7% 0% Launceston 56% 15% 21% 7% Legana 93% 0% 6% 1% Mowbray 83% 7% 8% 2% Newnham ‐ Mayfield 84% 9% 7% 0% Newstead 75% 10% 14% 1% Norwood 88% 3% 9% 0% Prospect Vale ‐ Blackstone 83% 10% 7% 0% Ravenswood 82% 8% 10% 0% Riverside 86% 11% 3% 0% South Launceston 70% 9% 19% 2% Summerhill ‐ Prospect 89% 7% 5% 0% Trevallyn 88% 6% 6% 0% Waverley ‐ St Leonards 88% 4% 6% 2% West Launceston 82% 4% 13% 1% Youngtown 81% 3% 15% 0% Greater Launceston 81% 8% 10% 1%

Settlement and land use
Page | 22
Map 8 – Population Density

Settlement and land use
Page | 23
Map 9 – Dwelling Density

Settlement and land use
Page | 24
Map 10 – Dwellings mapped by address point

Settlement and land use
Page | 25
Map 11 – Building approval by CCD, 1997‐2007
Settlement and land use
Page | 26
Map 12 – Residential Land Use
Settlement and land use
Page | 27
Future Growth Areas
Council areas have completed or are in the process of completing interim planning schemes. Through zoning provisions the interim schemes provide an indication of where residential growth is likely to occur.
Launceston City Council has predominantly well‐established suburbs, with limited potential for urban expansion other than through infill development. Several locations in the outer urban areas of Rocherlea and St Leonards have been re‐zoned residential and will allow for expansion.
West Tamar Council has concentrated urban development in the Legana region. The area has some development underway and zoning to allow further development if demand is sufficient. Discussion with council officers suggested potential scope to double the population in the next 20 years.
In Meander Valley Council (MVC), Prospect Vale has reasonable levels of housing density. Being bounded by the Bass Highway and other suburban areas limits Prospect Vale’s potential expansion. However, MVCs Land Use Strategy suggests a further 100ha of vacant residential land. Blackstone Heights has further potential for expansion, with the potential for up to 1000 additional lots, depending on density(the cost of infrastructure provision has slowed development in this area).
The Meander Valley Council sees Hadspen as a key growth area (Meander Valley Land Use Strategy, p91), with further development potential between the South Esk and the Bass Highway and plans for expansion south of the Bass Highway to cater for future growth.
Retail and industry ‐ key activity and employment centres
In 2011 the Launceston City Council commissioned a retail audit and activity centre hierarchy strategy. A key outcome was to provide a strategy that takes “full account of access and sustainability considerations”. Council sought additional funding from the State Government and as the proposed outcomes were able to provide relevant input into the Metropolitan Transport Plan funding was allocated from this project.
Transport is a derived demand in that it is used to enable a person to meet other needs, such as employment, shopping or socialising. Retail and commercial areas are strong attractors. This means their identification, and understanding the level of demand they create, is an important element of transport planning.
The outputs of the retail audit and activity centre hierarchy strategy provide the most recent and detailed information on these subjects. The Transport Plan will use the analysis provided by the retail audit and hierarchy strategy to consider future transport needs for the Greater Launceston urban area. Local council planning documents provide further information regarding current zoning and future plans.
Greater Launceston retail‐commercial structure and recommended hierarchy
Central Launceston is the commercial, administrative and retail hub for the northern region. Services provide for the large, contiguous urban population and a number of smaller settlements beyond the fringe with strong employment links and the wider industrial and agricultural needs of the region. Retail and commercial space is concentrated in the CBD area with smaller retail centres located in suburban areas (See Map 13). The map also indicates the extant commercial use along certain corridors, particularly Invermay Road and Hobart Road.

Settlement and land use
Page | 28
Map 13 – Commercial Land Use

Settlement and land use
Page | 29
In March 2011 the combined retail and commercial floor space of the greater Launceston urban areas was approximately 510,610 square metres gross leasable area (GLA) (JMG, 2011, p66).The Launceston Retail Audit and Activity Centres Strategy describes the Launceston retail‐commercial system as a hierarchy comprising the following areas (see Map 14):
• The Launceston Central Area (LCA), including the central business district and surrounding commercial and retail precincts;
• District centres of Kings Meadows and Mowbray; • K‐Mart Plaza; • Bulky goods clusters/precincts; • A number of neighbourhood and convenience centres and several bulky goods precincts.
The following sections detail each area, with brief description of its role within the hierarchy (as detailed in the Retail Audit and Activity Centre Strategy).
Launceston Central Area (LCA)
“The regional shopping centre for Launceston and its regional catchment area. The CBD provides for the full range of daily, weekly and discretionary shopping requirements together with a comprehensive range of entertainment, leisure, professional and commercial services.”
The LCA includes the CBD and surrounding retail commercial area. The Retail Audit breaks the LCA into three zones:
• The Core CBD, four blocks stretching from the Kingsway through to George Street and Patterson Street to York Street;
• The Supporting CBD, bounded by Wellington, Elizabeth, Tamar and William Streets; and • The LCA Balance, including the newly revitalised Seaport area, Esplanade and Boland Street
to the north, out beyond City Park (Lawrence Street) and inclusive of the Windmill Hill aquatic complex to the east, Balfour Street to the south and Margret Street and West Tamar Highway to the west.
The core CBD is the principal shopping precinct in Northern Tasmania has a broad intra‐regional catchment area with a smaller inter‐regional component. The audit describes “…regional level stores…supported by a range of regional, district and local services to meet the needs of resident and other visitors and the significant working population of the CBD” (LCC, 2011, p90).
The mix of uses includes a range of key retail attractors, a number of cafes, restaurants and other eateries and range of business and personal services including banking, medical and other insurances, hair and beauty etc.
The CBD area is considered to have reasonable pedestrian access (particularly the core area that includes Brisbane St Mall, the Quadrant Mall and a number of interlinking arcades. There is reasonable space dedicated to parking within the LCA although a perceived issue exists. An In‐Home telephone survey conducted by Renaissance Planning identified availability and cost of parking as the most significant negative attribute of the CBD (refer Launceston Retail Audit, 2011, p95). Metropolitan public transport services run through St John and York Streets, with some fringe and regional services linking to the Transit Centre in Cimitiere Street.
Settlement and land use
Page | 30
A diverse range of activities and services take place beyond the retail core, in the supporting CBD and LCA remainder. This includes the major government and administration centres, offices and further retail, dining and entertainment. The LCA also includes a major education facility (Launceston College) and several bulky goods precincts.
District Centres
“District Centres are…comprehensive higher order activity centre complementing the CBD. Comprehensive food and grocery shopping role with a wider range of discretionary stores and services. Intended to serve district and regional catchments.”
The Kings Meadows district centre follows Hobart Road generally between Russell/Innocent Streets and Falkner Road. It includes a free standing shopping mall anchored by a Coles supermarket (with considerable at‐grade parking between the mall and Hobart Rd) and a free standing Woolworths supermarket further stores and services. Hobart Road has a range of retail and commercial frontages although the Retail Audit found less than 25% of the street frontage was active.
The catchment for the Kings Meadows district extends beyond the local area. The immediate area lacks high‐density residential development. Access would generally be by private vehicle. PT services are provided as looped services operating between Launceston CBD, Kings Meadows and Newstead/Norwood. Beyond the individual shopping complexes, the area is not conducive to pedestrian access.
The Mowbray district centre is north of the Launceston CBD and runs along Invermay Road north from Vermont Road to Haig and Beatty Streets. The area includes Coles and Woolworths supermarkets and a range of street‐based activities including dining and retail. A Target department store is currently under construction.
Around 50% of the activity centre area is devoted to parking. A bus route runs through the activity centre along Invermay Rd. It currently attracts the highest patronage of any route in Launceston. The Mowbray Activity Centre is considered to have a reasonably high level of pedestrian access.
Mowbray is considered to have a regional catchment area extending beyond the Greater Launceston area.
K‐Mart Plaza
“Intended to provide for daily and weekly shopping needs together with a limited range of discretionary shopping requirements.”
The K‐Mart Plaza has been identified by the Retail Audit as distinct from District or Neighbourhood Centres. The Plaza includes K‐Mart department store, a K‐Mart Tyre and Auto Service and a Coles supermarket. The Plaza has a regional function and also provides neighbourhood centre requirements for the eastern suburbs.
Neighbourhood Activity Centres
“Neighbourhood activity centres provide for daily and most weekly purchases. [They] are also intended to provide supporting medical and community services.”

Settlement and land use
Page | 31
Prospect Vale Market Place is in the Meander Valley Council and provides neighbourhood centre function for the Prospect/Prospect Vale, Hadspen, Summerhill and Blackstone Heights area. The complex is anchored by a Woolworths supermarket and includes Chickenfeed, Postal services along with chemist and food outlets. At‐grade parking separates the complex from Westbury Road. The facility can also be accessed from the bus route operating along Westbury Road.
The Prospect retail options are augmented by an older shopping centre within the LCC boundary. The area has an IGA on the western side of Trotters Lane and a range of shops catering to personal needs on the eastern side. Parking fronts on to Westbury Road.
While the Retail Strategy identifies the Prospect/ Prospect Vale area at Neighbourhood Activity Centre level, growth in the area and planned retail expansions provides a solid argument for elevations to District Centre level.
Riverside has a small shopping centre anchored by a Woolworths supermarket. The centre includes a pharmacist and several eateries. It is neighboured by several street front shops across Cleghorn Street to the North. The centre is also close to the Riverside offices of the West Tamar Council (other offices and council chambers are located in Beaconsfield) and the Riverside Swimming Pool (open air summer only). At grade parking is provided off the West Tamar Highway.
This section of Riverside is, to a degree, ribbon development. It is only one or two streets deep either side of the West Tamar Highway – with much of the eastern side occupied by schools, sporting facilities and a golf course. The potential catchment for the shopping centre is therefore limited.
The Newstead activity centre is located on the off‐set junctions of Elphin Road Hobblers Bridge Road and David Street. The centre comprises a traditional street frontage with medical and pharmacy services, food outlets and several small retail/service establishments. This is augmented by the more recent establishment of a Coles supermarket with at‐grade parking facilities. Elphin Road is included on the regular bus service that runs through Newstead, Norwood and links through Kings Meadows to back to the Launceston CBD.
Legana has experienced recent residential development and population expansion, which has included on‐going expansion of the activity centre. The centre is anchored by a Woolworths supermarket with supporting retail and food outlets. It neighbours a Chickenfeed outlet and Salvation Army store. An at‐grade car parking facility provides access to the area. Bus services also operate through the site.
The Retail Audit has included Ravenswood and Trevallyn as Neighbourhood Activity Centres. Ravenswood has an IGA with several supporting retail and service stores, and a library. This is a relatively small but important activity centres as Ravenswood is an isolated suburb, with a high percentage of dwellings without access to private vehicles. Trevallyn has a small delicatessen/grocer store sited on the corner of Trevallyn Road and Bain Tree Terrace, supported by a pharmacy, post office, bakery, café, health‐clinic and hair dresser.
Neighbourhood Stores/Clusters
“Provide daily and weekly food requirements together with limited other weekly requirements.”

Settlement and land use
Page | 32
Smaller stand‐alone stores are located in Launceston (Wellington St), Newnham, Norwood, West Launceston, Youngtown, North Riverside, Prospect Vale and Hadspen. A shopping area is also developing in Abbot Street, East Launceston.
Bulky Goods Clusters/Precincts
“Provision of accessible clusters of bulky goods stores and services in amenable shopping environments.”
Bulky goods clusters/precincts are located in the CBD northern precincts (north of Cimitiere Street), the southern precincts (Kingsway, Bathurst and Wellington /Streets), K‐mart Plaza, Invermay and Bunnings (Connector Park, Kings Meadows).
Retail Strategy – spatial development
Essential to the discussions on passenger transport is access to goods and services and the relationship between residential and retail areas, including expectations of growth and change. The Launceston Retail Audit and Activity Centres Strategy provided analysis of these parameters to detail recommendations for growth and consolidation in the retail sector.
The retail audit suggests:
• Consolidation of existing suburbs within Launceston (south and west of the North Esk River); • Limited consolidation in northern and eastern suburbs; • Further growth and consolidation in Riverside and Legana • Further growth and consolidation in Prospect Vale and Blackstone Heights; • Consolidation of the urban community of Hadspen; and • Ongoing consolidation of exiting urban communities in the Northern Midlands.
The analysis suggested that the identified growth patterns would support small neighbourhood centres of clusters but would not require new major centres. The Report states “…the higher order activity centres that have historically developed in Launceston are well located to serve the existing and future urban population” (LCC, p193). The report states “…consolidation of the CBD and wider LCA and district centres…reinforces the region’s higher order activity centres, that is a centrally placed linear network that is highly accessible to the wider urban area”.
The Retail Audit also concludes that there are:
• Reasonably high levels of pedestrian access for the LCA and District Centres; • Reasonable PT services for district centres, • Opportunities for retail and commercial consolidation in the northern part of CBD/LCA; and • Opportunities for improvement and consolidation of the CBD and wider LCA.
This analysis of the commercial‐retail hierarchy is an important element in planning for future public transport and active transport networks. It highlights:
• Continued dominance of the Central Business District as the main attractor for employment and retail activities; and
• The corridors along which future demand is most likely to emerge, connecting local areas to District Activity Centres and Neighbourhood Activity Centres, and all areas to the CBD.

Settlement and land use
Page | 33
Map 14 – Retail Hierarchy (as identified by the Launceston Retail Audit and Activity Centre Hierarchy strategy)
Settlement and land use
Page | 34
Industrial land use
Current industrial land use is scattered throughout the Greater Launceston area with some specifically zoned locations where it is the major land use.
Current precincts:
• Invermay/Inveresk • Remount Road • Rocherlea – George Town Rd/Lilydale Rd • Killafaddy area • Legana Industrial Park • Areas of Launceston and East Launceston • Areas of Kings Meadows/Youngtown – including Techno Park • Areas of Prospect and Prospect Vale
Growth potential identified in the Launceston Industrial Strategy (2010):
• Rocherlea – George Town Rd/Lilydale Rd • Killafaddy area • Prospect (Trotters Lane vicinity) • Youngtown (south) • Connector Park • Techno Park • Remount Road
Other sites in the study area:
• There may be some room for expansion of Legana Industrial Park. • Potential for industrial expansion of Prospect Vale (Adjacent to Bass Highway) • Northern Midlands Council is developing TransLink on Evandale Road. • Meander Valley Council is
While some industrial zoned land is still available within the study area, significant areas of development are expected to be in located beyond the urban extent. Sites outside the study area are:
• TransLink site in Northern Midlands council – adjacent to Launceston Airport • Valley Central Industrial Park at Westbury in Meander Valley.
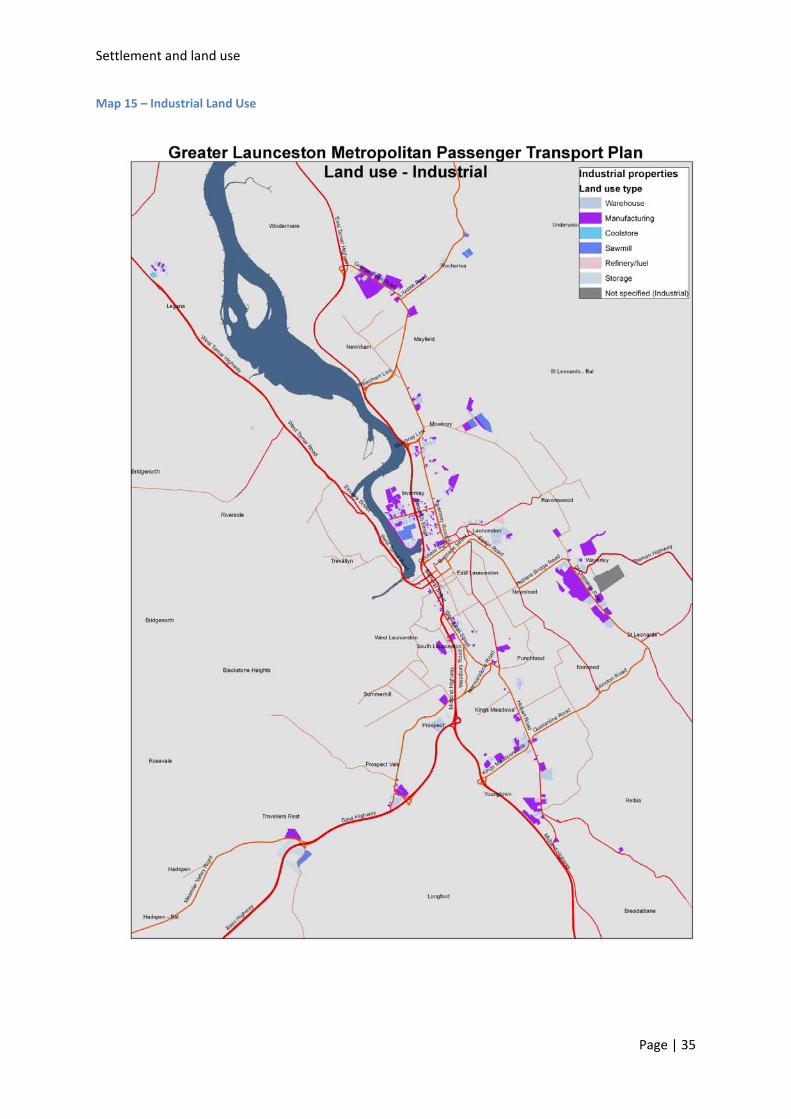
Map 15 shows land zoned for industrial use (excluding any zone changes identified in interim planning schemes). This map highlights the larger industrial areas north and east of the CBD, industrial parcels south of the retail strip in Kings Meadows through to Youngtown and the scattered sites scattered along from the CBD through to Westbury Road.
Journey to Work data (see below) suggests that the sub‐urban areas are not significant attractors comparative to the Launceston Central Area. However Invermay and Kings Meadows are the next highest attractors after Launceston and this would include an industrial component as well as retail and commercial.
Settlement and land use
Page | 35
Map 15 – Industrial Land Use

Settlement and land use
Page | 36
Educational Centres
Educational facilities generate a significant number of weekday trips – for staff and students – with a majority made by non‐drivers (by virtue of age or income) reliant on family or public transport. This places specific loads on transport infrastructure and the public transport system at peak times.
In relation to its population, Launceston has a relatively wide range of choice in schools, with significant movement of students between suburbs to attend schools of choice. For Launceston, this results in noticeable (and at times significant) transport patterns driven by the schools, which impact on the public transport services and on the road network.
Attractors and routes
Area Schools (excl Primary only) Routes from CBD
Riverside Riverside High School – yr7‐yr10
Launceston Christian School – Early Learning‐yr12)
West Tamar Highway
Mowbray‐Rocherlea Launceston Church Grammar School – Early Learning‐yr12
Brooks High School – yr7‐yr10
UTAS
Invermay Road/Georgetown Road
Goderich Street/East Tamar Highway
Prospect/Prospect Vale
Prospect High School – yr7‐yr10
St Patricks College – yr7‐yr12
Westbury Rd
CBD Launceston College – yr11‐yr12
East Launceston Newstead College – yr11‐yr12
Scotch Oakburn College – Early learning‐yr12
Elphin Road/Penquite Rd
Kings Meadows Kings Meadows High School – yr7‐yr10 Hobart Rd
Transport impacts
• Launceston College Bus Interchange – morning peak student movements, with drop off and transfers at Launceston College on Brisbane Street, coincide with peak inbound commuter movements. Bus parking bays utilise one traffic lane impacting on inbound traffic movements on Brisbane Street, with flow‐on effects on West Tamar Highway.
• Student only services – the high level of student only services to/from the major destinations, both routed through the CBD and cross‐urban (refer to Public Transport section), limits Metro’s ability to offer improved frequency on general access services.
Schools Viability Reference Group
The Tasmanian Government commissioned an independent reference group to examine the current state school system. Recommendations included a review of policies and guidelines relating to school boundaries, catchment areas, enrolment and attendance. Any decisions of Government arising from these recommendations may influence the number of schools, enrolments at individual schools and criteria for attendance based on locality. Any impacts on transport considerations are not currently known.
Settlement and land use
Page | 37
Tertiary education
Launceston hosts two University of Tasmania (UTas) campuses (Newnham and Inveresk) and the Australian Maritime College (also based at Newnham). The combined campuses attract enrolments in excess of 5000 students. For intra‐ and inter‐state and international students, on‐site accommodation is available and Utas also manages access to off‐site rental properties. Census data (2011) indicates high proportions of university aged residents in suburbs adjacent to the Newnham campus.

Settlement and land use
Page | 38
Map 16 – School Locations and high school/college student numbers

Journey to Work
Page | 39
Travel Data – Journey to Work
Detailed travel data can provide specific information on where, how and why people travel. Several jurisdictions around Australia undertake household travel surveys for specific areas. These can probe a number of specific journey types such as work, education, access to services or recreation. In Tasmania, Greater Hobart is the only area to have been subject to a comprehensive household travel survey.
Where household travel survey data is not available, Australian Census data provides the next level of useful travel information. Undertaken every five years, the Census includes collection of Journey to Work trips data (JTW) that allows analysis by origin‐destination and by mode type.
JTW is useful for understanding one key trip generator that has specific peak periods and network implications. However, it does have limitations in providing a population‐wide indication of travel patterns. The active workforce in Launceston accounts for less than 50% of the population and JTW does not capture trips generated for education, or accessing goods and services. The non‐working population is likely to have a higher proportion of transport disadvantaged – younger and older cohorts, single parents or students – and other analysis (e.g. Needs Analysis, PT Patronage) will be needed to obtain a detailed picture.
Origin‐destination analysis has been undertaken using 1996, 2001 and 2006 data. Mode share has been analysed for 2006 and 2011.
JTW – Origin and Destination
Analysis of JTW data provides an indication of residential areas that contribute to a greater proportion of trips on specific sections of the network (origin) and the location major employment areas (destination).
The number of trip origins from suburbs in Greater Launceston is reasonably well correlated to population, with Riverside being both the highest population and origin of any suburbs (see Table 10). Newnham, Prospect Vale, West Launceston, Newstead, South Launceston, Youngtown and Norwood are clustered between 5% and 6.5% of total JTW trips.

Journey to Work
Page | 40
Figure 5 ‐ Origin trips as a percentage of Greater Launceston trips and Population by suburb
Figure 5 – representing trip by suburb of origin as percentage and population by suburb – highlights where other analyses are required to gain a broader picture of daily travel needs. The suburbs with lower percentages of JTW trips to population (i.e. fewer people in the labour force) correspond to areas of higher transport need (see Needs Analysis section) with higher levels of unemployed and single parents, and lower car ownership. Ravenswood, Rocherlea and Mayfield are in this category.
Figure 6 ‐ Origin trips as a percentage of suburb population
0
1000
2000
3000
4000
5000
6000
0.00%
1.00%
2.00%
3.00%
4.00%
5.00%
6.00%
7.00%
8.00%
9.00%
JTW (%)
Pop (No)
0.00%
5.00%
10.00%
15.00%
20.00%
25.00%
30.00%
35.00%
40.00%
Journey to Work
Page | 41
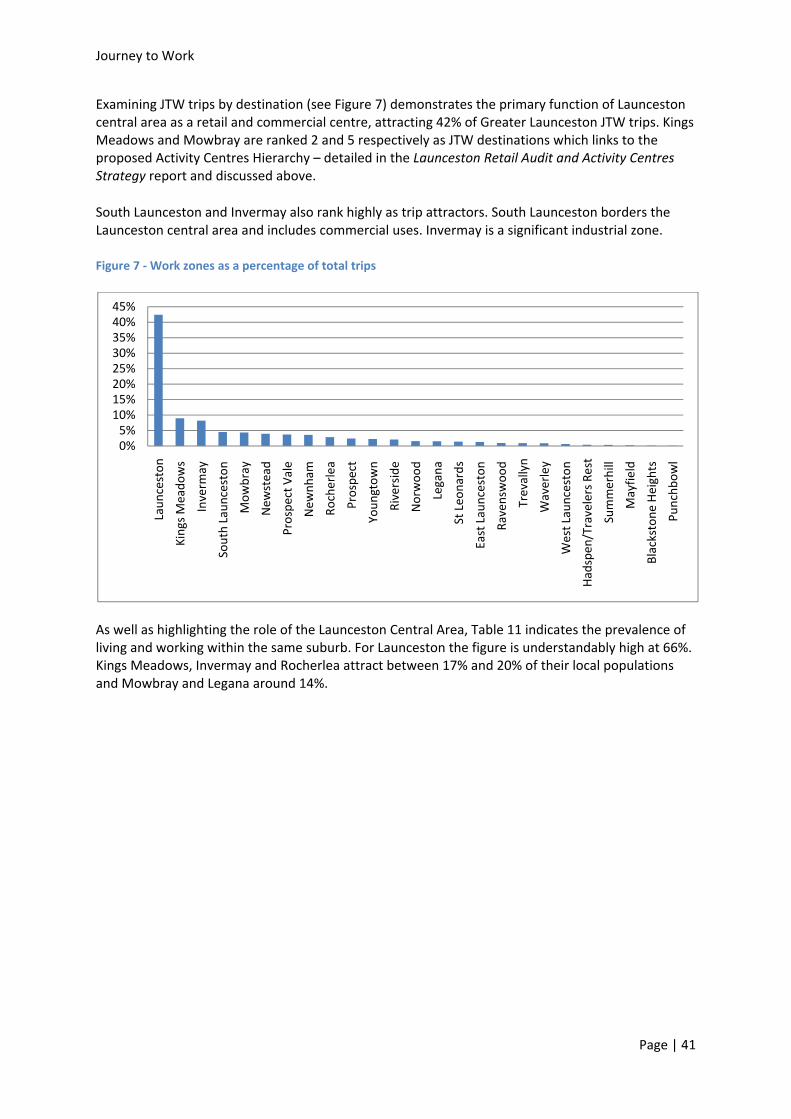
Examining JTW trips by destination (see Figure 7) demonstrates the primary function of Launceston central area as a retail and commercial centre, attracting 42% of Greater Launceston JTW trips. Kings Meadows and Mowbray are ranked 2 and 5 respectively as JTW destinations which links to the proposed Activity Centres Hierarchy – detailed in the Launceston Retail Audit and Activity Centres Strategy report and discussed above.
South Launceston and Invermay also rank highly as trip attractors. South Launceston borders the Launceston central area and includes commercial uses. Invermay is a significant industrial zone.
Figure 7 ‐ Work zones as a percentage of total trips
As well as highlighting the role of the Launceston Central Area, Table 11 indicates the prevalence of living and working within the same suburb. For Launceston the figure is understandably high at 66%. Kings Meadows, Invermay and Rocherlea attract between 17% and 20% of their local populations and Mowbray and Legana around 14%.
0%5%
10%15%20%25%30%35%40%45%
Laun
ceston
Kings Meado
ws
Inverm
ay
South Laun
ceston
Mow
bray
New
stead
Prospe
ct Vale
New
nham
Rocherlea
Prospe
ct
Youn
gtow
n
Riverside
Norwoo
d
Legana
St Leo
nards
East Launceston
Ravenswoo
d
Trevallyn
Waverley
West Launceston
Hadspen
/Travelers Rest
Summerhill
Mayfie
ld
Blackstone
Heights
Punchb
owl

Journey to Work
Page | 42
Table 11 – Journey to Work from Home Zone by Suburb as percentage
Work Zones
Home Zones Blackstone
Heights
East Lau
nceston
Inverm
ay
Kings Meado
ws
Laun
ceston
Legana
Mayfie
ld
Had
spen
/Travellers Rest
Mow
bray
New
nham
New
stead
Norwoo
d
Prospe
ct
Prospe
ct Vale
Punchb
owl
Ravenswoo
d
Riverside
Rocherlea
South Laun
ceston
St Leo
nards
Summerhill
Trevallyn
Waverley
West Laun
ceston
Youn
gtow
n
Blackstone Heights 5.6% 0.6% 9.6% 9.6% 41.2% 0.0% 0.0% 0.8% 3.6% 1.5% 4.0% 0.6% 4.0% 5.6% 0.0% 0.6% 1.3% 2.1% 3.8% 0.0% 0.0% 0.6% 0.0% 0.6% 4.2%
East Launceston 0.0% 8.6% 5.9% 5.1% 51.6% 0.8% 0.0% 0.0% 2.9% 3.9% 6.0% 0.5% 2.6% 2.1% 0.0% 1.0% 0.7% 0.9% 4.0% 0.5% 0.4% 0.8% 0.4% 0.0% 1.3%
Invermay 0.0% 0.6% 17.6% 6.6% 42.6% 1.4% 0.0% 0.0% 6.5% 2.9% 2.1% 0.9% 1.8% 2.5% 0.0% 0.9% 1.4% 2.7% 4.4% 1.7% 0.0% 0.0% 1.5% 0.3% 1.7%
Kings Meadows 0.0% 0.8% 7.5% 19.5% 37.5% 0.6% 0.0% 0.0% 2.8% 2.2% 3.1% 1.1% 2.6% 3.7% 0.3% 0.8% 0.9% 2.5% 6.5% 1.9% 0.0% 0.3% 0.9% 0.4% 4.1%
Launceston 0.0% 1.6% 5.8% 5.4% 66.0% 1.0% 0.0% 0.3% 1.9% 2.9% 2.5% 0.3% 0.8% 2.2% 0.0% 0.3% 0.6% 1.5% 3.9% 0.6% 0.0% 0.8% 0.8% 0.3% 0.7%
Legana 0.0% 0.8% 9.1% 6.9% 41.9% 14.4% 0.0% 0.0% 2.3% 2.3% 2.7% 0.8% 2.2% 2.5% 0.0% 0.5% 3.3% 2.5% 3.0% 1.6% 0.0% 0.9% 0.0% 0.3% 1.9%
Mayfield 0.0% 0.0% 12.5% 8.0% 27.8% 1.1% 6.1% 1.1% 10.3% 6.8% 1.1% 0.0% 1.5% 4.6% 0.0% 1.9% 0.0% 8.0% 3.8% 1.1% 0.0% 0.0% 0.0% 0.0% 4.2%
Hadspen/Travellers Rest 0.0% 1.3% 7.9% 9.7% 38.7% 0.4% 0.4% 7.4% 4.2% 2.1% 3.6% 0.5% 4.7% 7.0% 0.0% 0.3% 0.6% 1.0% 5.5% 2.6% 0.9% 0.3% 0.0% 0.3% 0.6%
Mowbray 0.0% 0.4% 12.1% 6.9% 33.7% 0.5% 0.7% 0.5% 14.1% 6.8% 3.6% 0.9% 1.8% 2.6% 0.0% 1.3% 0.7% 6.0% 3.8% 0.9% 0.0% 0.4% 1.2% 0.4% 0.8%
Newnham 0.0% 1.0% 10.2% 6.8% 34.5% 0.8% 0.6% 0.4% 9.1% 11.7% 4.3% 1.3% 1.4% 1.9% 0.3% 0.9% 0.7% 6.0% 3.4% 0.8% 0.3% 0.6% 0.8% 0.5% 1.7%
Newstead 0.0% 2.8% 5.5% 7.1% 49.6% 0.2% 0.0% 0.0% 2.8% 3.1% 10.6% 1.7% 2.6% 2.0% 0.0% 1.0% 1.0% 1.3% 4.3% 0.9% 0.4% 0.5% 1.0% 0.2% 1.3%
Norwood 0.0% 2.0% 6.1% 11.9% 40.9% 1.0% 0.0% 0.0% 3.5% 2.2% 4.2% 8.7% 1.9% 2.9% 0.3% 1.0% 1.0% 2.0% 4.1% 1.7% 0.0% 0.4% 1.3% 0.7% 2.1%
Prospect 0.0% 1.0% 8.5% 12.2% 35.1% 1.0% 0.0% 0.6% 3.9% 4.4% 2.7% 1.0% 7.7% 8.1% 0.0% 0.0% 1.7% 1.9% 5.2% 1.0% 0.6% 0.0% 0.0% 1.2% 2.1%
Prospect Vale 0.2% 0.4% 7.9% 10.8% 39.4% 1.0% 0.0% 0.2% 3.4% 1.6% 3.0% 0.7% 4.1% 12.3% 0.2% 0.7% 0.9% 2.2% 4.3% 1.3% 0.2% 0.5% 1.1% 0.4% 3.1%
Punchbowl 0.0% 0.0% 3.5% 21.1% 47.4% 0.0% 0.0% 0.0% 5.3% 0.0% 6.1% 0.0% 0.0% 0.0% 0.0% 0.0% 0.0% 0.0% 13.2% 0.0% 0.0% 0.0% 0.0% 0.0% 3.5%
Ravenswood 0.0% 0.6% 10.0% 9.4% 32.0% 0.9% 0.0% 0.0% 6.8% 3.2% 5.4% 2.0% 1.5% 2.8% 0.0% 8.1% 0.4% 2.9% 3.8% 3.0% 0.0% 1.1% 2.5% 0.4% 3.0%
Riverside 0.0% 1.1% 6.2% 7.1% 44.0% 3.3% 0.2% 0.0% 3.3% 3.2% 3.8% 0.9% 1.6% 1.9% 0.0% 0.4% 11.9% 3.2% 3.6% 0.6% 0.2% 1.1% 0.7% 0.4% 1.4%
Rocherlea 0.0% 0.0% 11.8% 6.8% 24.8% 0.0% 0.0% 0.0% 14.3% 9.3% 3.1% 0.0% 3.1% 0.0% 0.0% 0.0% 0.0% 17.4% 1.9% 3.7% 0.0% 0.0% 0.0% 0.0% 3.7%
South Launceston 0.0% 1.5% 7.3% 9.4% 49.0% 0.7% 0.2% 0.0% 3.2% 3.3% 2.3% 1.5% 2.4% 3.5% 0.0% 0.3% 0.8% 2.1% 9.6% 0.9% 0.0% 0.0% 0.3% 0.2% 1.4%
St Leonards 0.0% 1.2% 9.6% 9.4% 31.8% 0.6% 0.0% 0.6% 5.1% 2.5% 5.1% 2.7% 2.0% 1.6% 0.0% 1.4% 1.6% 3.9% 5.1% 9.8% 0.0% 0.6% 2.4% 0.6% 2.5%
Summerhill 0.0% 0.4% 9.3% 9.9% 39.1% 0.6% 0.0% 0.3% 2.8% 1.9% 3.4% 1.4% 3.6% 7.3% 0.0% 0.3% 1.5% 2.4% 5.5% 1.2% 4.6% 0.7% 0.6% 0.9% 2.1%
Trevallyn 0.0% 0.8% 7.3% 6.4% 46.3% 1.5% 0.3% 0.0% 3.3% 3.7% 3.9% 1.3% 1.8% 2.5% 0.2% 0.8% 3.3% 3.0% 4.1% 0.9% 0.2% 5.9% 0.7% 0.7% 1.2%
Waverley 0.0% 0.8% 10.3% 12.0% 27.7% 0.8% 0.0% 0.0% 7.3% 3.1% 5.6% 2.0% 1.1% 1.4% 0.8% 2.5% 0.8% 4.2% 3.6% 2.8% 0.8% 0.0% 8.1% 0.8% 3.4%
West Launceston 0.0% 0.8% 7.0% 7.3% 48.7% 1.0% 0.5% 0.0% 2.3% 3.7% 3.1% 1.5% 2.3% 4.4% 0.0% 1.0% 1.7% 2.5% 4.1% 0.7% 0.2% 0.8% 0.5% 4.2% 1.7%
Youngtown 0.0% 0.6% 7.8% 14.2% 38.7% 0.8% 0.0% 0.5% 3.5% 2.1% 2.6% 2.1% 3.8% 2.5% 0.4% 0.3% 1.2% 2.7% 4.1% 1.7% 0.5% 0.5% 0.5% 0.2% 8.8%
Greater Launceston 0.1% 1.3% 8.2% 9.0% 42.4% 1.5% 0.2% 0.4% 4.3% 3.6% 4.0% 1.6% 2.5% 3.7% 0.1% 1.0% 2.1% 2.9% 4.5% 1.4% 0.4% 1.0% 0.9% 0.7% 2.3%

JTW – M
Examinarea 78%suburbssignifica
The suband the all trips westernPublic T
Figure 8
Figure 9
0%
10%
20%
30%
40%
50%
60%
70%
80%
90%
Mode
ing JTW by m% of recorde had betweently for the f
urb of Launchighest numfor Greater Ln. This result ransport sec
‐ JTW for Gre
‐ JTW for Gre
Car, as driver
mode demoned trips wereen 70% and 8four Census
ceston recordmber of walkiLaunceston, is also reflecction.
ater Launcest
ater Launcest
Car, as passeng
nstrates the pe made by ca85% of trips bperiods exam
ded the loweing trips, at jwith northected by the a
ton by mode
ton by suburb
ger Bus
prevalence or as driver aby car as drivmined (see F
est number ojust under 40rn and easteanalysis of fu
for 1996, 200
b and mode 2
Walked
of the car as nd 8% by carver. These stFigure 8).
of trips by ca0% (see Figuern suburbs hull fare passe
01, 2006 and 2
2011
only Othework
home/di
mode of chor as passengetatistics have
ar (less than re 9). Bus trihigher than snger boardin
2011
r (excl ked at d not go)
No
P
oice. For the er. The majoe not varied
50% by car aps were undsouthern andngs discussed
ot stated
Page | 43
study ority of
as driver) der 2% of d d in the
1996
2001
2006
2011

Page | 44
5. Passenger transport system – review and analysis of system infrastructure and services
Road Network
The road network reflects early settlement ties to the port and the reliance on non‐motorised transport options. Changes and improvements to the network occurred with the advent of rail links, an electric tram system, trolley busses and the gradual but now dominant presence of the private motor vehicle. The streets used for the tram system provide the arterial skeleton for current access between the CBD and major activity centres and residential areas.
The significant intra‐ and inter‐regional road links are part of the State and National highway network. This includes:
• The Midland Highway/Southern Outlet linking to the south of Launceston and to Hobart. • Bass Highway which provides links to the north‐west of Tasmania • The Tasman Highway linking Launceston to the North East • The East Tamar providing northern links to George Town and Bell Bay • West Tamar Highways providing access to Riverside and Legana and links through to Exeter,
Beaconsfield and Beauty Point.
The Wellington/Bathurst couplet is not part of the State Road network but performs an essential linking role to the CBD and for north‐south passenger and freight traffic. Table 12 provides a list of significant State and local roads and the linkages or connections they provide. Map 17 provides known AADTs.
Network information provided below is sourced from DIER data sets and from the Launceston Traffic Study (2012) produced by Sinclair Knight Merz on behalf of DIER and Launceston City Council.

Road Network
Page | 45
Table 12 – Major State and local roads
Road/Route Ownership Category Links to/between:
Midland Highway/Southern Outlet
State Category 1 – Trunk Road To south (Hobart)
Bass Highway State Category 1 – Trunk Road To north west
East Tamar Highway State Category 1 – Trunk Road To north (George Town)
Goderich Street State Category 1 – Trunk Road Couplet‐East Tamar (also Mowbray)
West Tamar Highway State Category 3 – Regional Access Road
To north (Beaconsfield)
Taman Highway State Category 4 – Feeder Road
To north east/east
Launceston Couplet Wellington/Bathurst
LCC Class 1 – Primary Arterial North‐South through LCA (Southern Outlet‐Goderich St)
Cimitiere Street LCC Class 2 – Sub Arterial East‐West through LCA
Elphin Road LCC Class 1 – Primary Arterial CBD‐Newstead
Hoblers Bridge Road State/LCC Category 4 – Feeder Road /Class 1 – Primary Arterial
Newstead‐eastern suburbs
George Town Road LCC Class 1 – Primary Arterial Mowbray‐northern suburbs
Invermay Road LCC Class 2 – Sub arterial CBD‐northern suburbs
Vermont Road/ Wildor Crescent
LCC Class 3 – Collector Mowbray‐Ravenswood
Ravenswood Road LCC Class 3 – Collector Ravenswood‐Hoblers Bridge
Boland Street LCC Class 2 – Sub Arterial LCA‐KMart Plaza‐Eastern Suburbs
Henry Street LCC Class 3 – Collector To Ravenswood
Hobart Road LCC To Kings Meadows/Youngtown
Westbury Road LCC/MVC To Prospect/Prospect Vale
Penquite Road LCC Newstead‐Norwood
Tamar Street LCC Invermay Rd‐CBD
High St CBD‐East Launceston‐Kings Meadows
Frederick St‐Hillside Cres‐Brougham
LCC CBD‐West Launceston
Granville‐Vaux St LCC West Launceston‐Summerhill
Kings Bridge‐Trevallyn Road LCC CBD‐Trevallyn
Summary of Launceston Traffic Study (2012)
Traffic Volumes
State Government and local councils collect traffic volumes data for most roads at varying intervals. Map 17 provides an overview of recent traffic volumes on major roads in Launceston. State Road data was accessed through the DIER RIMS database and local council data was sourced from the Launceston Traffic Study (2012).

Road Network
Page | 46
Highest volumes were recorded on the Wellington/Bathurst couplet with an Average Annual Daily Traffic (AADT) count of more than 45,000 vehicles per day (vpd). Roads connecting the couplet (Southern Outlet and Goderich St) and the West Tamar Highway were recorded AADTs at around 25,000 vpd. The Charles Street Bridge was slightly higher at around 29,000 vpd (see Map 17).
Safety
• 4874 crashes reported between 2007 and 2011 (755 resulted in injury) • Majority on arterial network. • Intersections with crash frequency greater than 20 (between 28 and 20):
o Brisbane St/Wellington St o Goderich St/Lindsay St/Charles St o Bathurst St/Brisbane St o Forster Street/Goderich St o Howick St/Wellington ST o Howick St/Southern Outlet o Wellington St/York St.
• Dominant crash types were cross‐intersection and rear‐end related crashes. • Typical of busy urban junctions.
Congested minutes
DIER uses the Sydney Coordinated Adaptive Traffic System (SCATS) to manage signalised intersections. SCATS is able to monitor and record “unusually congested minutes” where specific saturation, volume and cycle parameters are exceeded. For the Traffic Study, analysis was undertaken on the accumulated congested minutes recorded in three time periods – AM Peak (6am‐10am), inter‐peak (10am‐3pm) and PM Peak (3pm‐7pm) – for 20 weekdays. The analysis included all signalised intersection in the Launceston area.
For each time period, analysis was conducted in increments of 10 accumulated congested minutes starting from intersection approaches with less than 10 congested minutes to 80+ congested minutes. The percentage of intersection approaches recording less than 10 congested minutes for the AM, Inter‐Peak and PM periods was 78%, 73% and 67% respectively. Congested minutes exceeding 80 was 6%, 12% and 10% for the AM, Inter‐Peak and PM periods respectively.
The majority of intersection approaches cumulative congested minutes greater 80 were right hand turn lanes with the arterial north‐south by east‐west intersections (where York and Brisbane Streets intersect the Bathurst/Wellington couplet) and the Goderich‐Esplanade intersection experiencing high congested minutes across all time periods. Results suggested that East/West approaches on Frederick and Patterson Streets also experienced higher levels of congestion.
Travel Time Analysis
Travel times were compared between 2005 and 2012 for three key routes (see Map 18 and Table 13) through Launceston CBD.
• Travel times have increased significantly for route 2 – east/west – particularly westbound. • Increases in Southbound direction for both route 1 and route 3 for the PM peak were noted. • There was an 8% increase for route 3 during the inter‐peak.

Road Network
Page | 47
Map 17 – Average Annual Daily Traffic
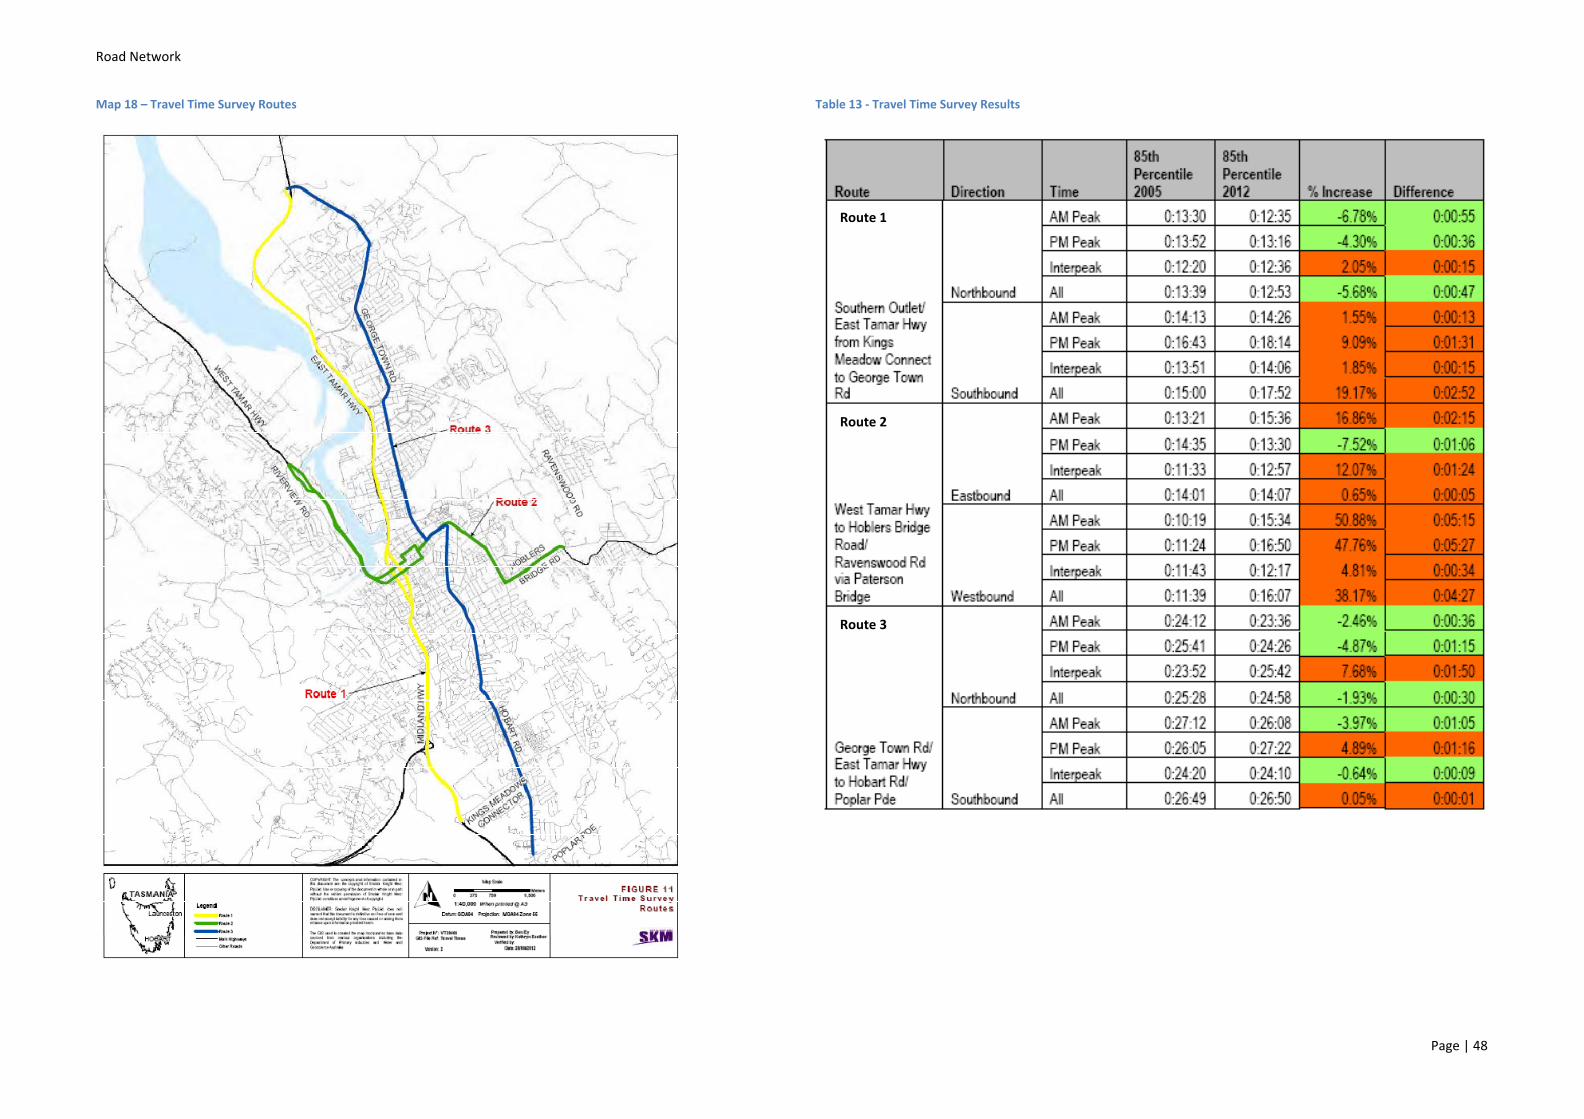
Road Network
Page | 48
Map 18 – Travel Time Survey Routes
Table 13 ‐ Travel Time Survey Results
Route 1
Route 2
Route 3

Public Transport
Page | 49
Public transport
Network Overview
History
Launceston’s initial passenger transport options were pedestrian or horse drawn. In the late 1800s with a population over 10,000, horse‐drawn busses and cabs were providing a range of services between the CBD and suburbs. In the early 20th Century competition came in the form of petrol and steam buses – although reliability remained an issue for these modes.
Passenger transport moved forward in 1911 with the installation of a council operated tram system – Launceston Municipal Tramways (LMT) – powered by the Duck Reach hydro electric scheme. Initially running to Kings Bridge, Mowbray and Newstead, the network expanded to 29 trams at its peak and included Trevallyn, West Launceston, Kings Meadows and East Launceston. The LMT also operated petrol buses and brought in diesel buses in 1941.
While initially profitable, patronage on the tramways dropped over time and through the 1930s and 40s there was considerable discussion regarding the best model for delivery of a PT service. Considered to have a high operating cost per passenger, the tram system was replaced by a trolley bus operation in 1952. Financial stress also precipitated the shift from municipal ownership to State ownership in 1955 for both Launceston and Hobart PT services. The new State enterprise was the Metropolitan Transport Trust (MTT).
The drought in Tasmania in the late 1960s was the catalyst for the removal of the trolley bus systems. Lower water storage in the hydro catchments resulted in severe power rationing and an increase in electricity costs. With ongoing discussion around the lack of flexibility in the trolley bus routes, the network was removed in 1968 and replaced with motor buses (Cooper, 2006).
The State Government continued operation of the MTT service in Launceston. With the increasing dominance of the private car, full‐fare commuting and non‐directed trips continued to decline with the operation focusing instead on school services and areas of transport need.
Now operating as Metro Tasmania, the State Owned Company provides services throughout the contiguous urban area and through to Hadspen. Manions Coaches provides the metropolitan link through to Legana. A range of student and intra‐ and inter‐regional services are provided by private operators through contractual arrangements with the State Government.
Current Service
Service types
Launceston has three broad types of public general access bus services, differentiated by route population density levels and distances from major activity centres and urban catchments. The broad types are:
• Metropolitan bus services – operating wholly within the urban area (refer Map 1) and include the suburbs listed in Table 2.
• Urban fringe – connecting to Launceston from more distant communities with strong linkages to Launceston for employment, education and services; and

Public Transport
Page | 50
• Intrastate – operating to Launceston from other cities or areas with minimal linkages for employment and services.
The metropolitan service is the focus for this study.
Metropolitan bus services
Launceston’s bus system provides regular bus services within the metropolitan area. Services generally operate seven days a week and include evening services Monday‐Saturday as late as 10pm. All services are operated by Metro Tasmania (including outer metropolitan areas of Hadspen, Blackstone Heights and St Leonards) with the exception of Legana, which is serviced by Manions Coaches.
Comparison to Like Cities
Launceston services are to some extent similar to those in Hobart, operating on a daily basis with evening services. The main difference is a lack of a noticeable commuter peak, especially between 4pm and 6pm and lower levels of service frequency throughout.
The level of overall service in Launceston is comparable, or slightly in advance of, other cities with like populations in Australia and New Zealand. Timetable services in Ballarat, Albury‐Wodonga, Toowoomba and Dunedin were examined. Services in Launceston are similar to those in Dunedin, while Launceston has superior night services compared to other like Australian cities. Night services only occur on Fridays in Ballarat and not at all in Albury‐Wodonga or Toowoomba. The latter two cities do not have any Sunday services.
Summary of services
Launceston metropolitan services can be broken down into 5 main areas:
• Northern Launceston – incorporating Inveresk, Invermay, Mowbray, Mayfield, Alanvale and Rocherlea;
• Southern Launceston – including Newstead, Norwood, Youngtown, Kings Meadows, East Launceston and Punchbowl;
• Eastern Launceston – Ravenswood, Waverley and St Leonards; • Western Launceston – Prospect, Prospect Vale, Summerhill, West Launceston, Blackstone
Heights and Hadspen; and • Riverside area – Trevallyn, West Riverside, Riverside, North Riverside and Legana.
A high frequency corridor service operates Monday to Fridays from Launceston CBD to Mowbray Shopping Area, operating on average every 10 minutes during weekdays until 6pm. At other times services operate at least on an hourly basis. Specialist and outer metropolitan services are shown with a shaded background. Some areas are not serviced during weekends and evenings, but are relatively close to core routes which can be accessed by a walk of approximately 500 metres.
Map 19 shows the Launceston Metro bus network and Table 14 summarises frequency of services to each suburban area, as well as key Launceston shopping precincts. Some services do not operate on Sundays or during evenings.

Public Transport
Page | 51
Map 19‐ Metro Bus Network (Source: MetroTas)

Public Transport
Page | 52
Table 14 ‐ 2 Key Average service frequencies (minutes) Frequency ‐ Return or Loop services
Suburbs or areas Route Nos Weekday core day time hours before 6pm
Weekday & Saturday Evenings to approx 10pm
Saturday core day time hours before 6pm
Sunday core day time hours
Northern Launceston Launceston to Mowbray Shopping Centre Corridor
via Inveresk
2 thru 10 10 60 30@ 60
Rocherlea 10 30 60 30 60University 2 30 Access to
Route 10 Access to Route 10
Access to Route 10
Mayfield/Alanvale 6 & 7 30 Access to Route 10
Access to Route 10@
Access to Route 10
Southern Launceston King Meadows Shopping
area 40,48,50,58 15#L 60L 30L 60L
Newstead, Norwood, Youngtown, Kings
Meadows
40 & 50 15 60 30 60
East Launceston and Punchbowl
45 & 55 60# Access to routes 40 & 50
120 Access to routes 40 &
50 High penetration services to Youngtown and Kings
Meadows
48 & 58 6 services Access to routes 40 & 50
Access to routes 40 & 50
Access to routes 40 &
50 Eastern Launceston
Ravenswood & Waverly 20 thru 38 60# 120 60 120St Leonards 28,32,38 60 No service 120 No service
Western Launceston Prospect – Westbury Road via Hospital
60 thru 78 15#L 60L 60@L 60L
Prospect Vale, Summerhill, West
Launceston
60 thru 74 30 60 60 60
Blackstone Heights 66 & 76 6 services No service 3 services No serviceHadspen 78 60 No service 120 No service
Riverside area Trevallyn, West
Riverside, Riverside, North Riverside
80 through 95
30# 120## 60 120
Legana Legana Loop & 183
60 No service 4 services No service
NB The number of services referred to above are either full loop services or return services. @ An additional 5 service operate to this area on Saturdays # Additional services operate during peak period. ## Last evening service departs at 8:40pm. L The level frequency indicated is only possible if passengers use loop services in both directions. If only
the shortest possible route between the location and Launceston is taken then the stated frequency should be doubled. i.e. a 15 minute loop frequency translates into a 30 minutes service if a passenger wished to only travel via the shortest possible route to their destination.
Public Transport
Page | 53
Most contiguous core areas are provided with services after 6pm usually on an hourly basis. All areas (including outer metropolitan areas) receive Saturday services. Sunday services are limited to key contiguous suburbs.
The network design features a series of loop services providing access to a number of suburbs traversed by each loop. There is a high frequency corridor service – Launceston to Mowbray Shopping area – with services continuing further to the more distant Northern suburbs. Outer suburban areas have lower frequency services. There is a specialist, higher penetration service in the Southern suburbs.
Loop services can provide suburban areas with higher frequency at lower cost than linear routes. However, loop services are, by nature, difficult to comprehend and use, reinforcing negative perceptions of public transport and potentially reducing patronage.
Bus malls, Transit Centre and key central stops
Metro Tasmania operates its urban services from the bus mall in St John Street, in the Launceston CBD. All of its services commence and terminate at this point.
The Transit Centre was established in 2002. It is located on Cimitiere Street. A 10 year initial lease on bays commenced in 2003. Leases were negotiated with Red Line Tasmania, TassieLink and Metro. Metro ceased operating services through the Transit Centre in 2007 in favour of on‐street stops. Two fringe/regional operators negotiated shared use of one TassieLink bay.
The initial lease period ceased in March 2013. Red Line Tasmania will continue to use the site. The TassieLink lease has not been renewed and is currently operating on a month‐by‐month basis while alternative arrangements are sought.
Map 24 (page 72) shows the areas of Launceston CBD within 400 metres walk of each of the Transit Centre and Bus Mall. This map also shows the current major car parks operated by Launceston City Council.
Private operators also use a number of bus stops located around the Launceston CBD.
Tiger Bus
The Launceston City Council has contracted Metro Tasmania to provide a free service around the Launceston CBD, linking [ ]. The 'City Explorer' and 'River Explorer' provide a free transport service around the City Centre and to attractions around Launceston. The services are provided alternately, with each trip taking approximately 30 minutes.

Public Transport
Page | 54
Map 20‐ Tiger Bus City Explorer
Map 21 ‐ Tiger Bus River Explorer
The service is provided as an adjunct to the commuter service linking Inveresk and the CBD. It therefore operates as an inter‐peak service between 10am and 4pm, Monday to Friday.
Bus stop infrastructure
Outside of CBD Bus Mall, Metro Tasmania has no other major interchange points on the Launceston Network. The remainder of its off‐bus infrastructure is therefore a mixture of relatively standard bus stop sites, consisting of shelters and seating at higher use sites, and simple ‘blade (i.e. sign) and poles’ at other sites.
In common with the rest of Metro Tasmania’s network, distances between bus stops are relatively short. This is a reflection of historical practices where originally trams, and later buses, simply pulled up where people were waiting to board. As stops were formalised, existing stopping locations were simply marked and have remained. Subsequent additions have arisen from ad hoc decisions, particularly in response to specific community requests for additions. Removals of bus stops have been far rarer. As a result, the number of bus stops has tended to grow and the spacing between them reduces over time.
For example, Invermay Road has nine stops on the northward service over a distance of 2.3 kilometres – an average spacing of around 250 metres between bus stops. An average spacing of 400 metres between bus stops is considered a reasonable industry average.
Accessible services
Under the Commonwealth Disability Discrimination Act 1992 (DDA), all public transport operators, and providers, have a legal obligation to provide accessible services for people with disabilities. For existing transport infrastructure, a timetable for compliance has been developed, which allows operators to bring their services up to full compliance over a 20 year period. One hundred per cent compliance must be achieved by 2022.

Public Transport
Page | 55
On the whole in Tasmania, bus operators have successfully met the requirements for accessible vehicles. By 31 December 2012, 55 per cent of services must be operated with accessible vehicles. ‘Accessible’ in this context means vehicles that are accessible to people using wheelchairs, as well as having a range of enhancements to facilitate travel by people with vision and hearing impairments, or other disabilities.
Meeting the targets for accessible off‐bus infrastructure remains a challenge. Metro has undertaken a program of upgrading bus stops on a route by route basis. This has primarily focussed on the provision of shelters with allocated spaces for people using wheelchairs and the provision of Tactile Ground Surface Indicators (TGSIs). In order to meet the one hundred per cent targets for compliance in 2022, it is clear that much remains to be done in respect to bus stops.
Full compliance will be a particular challenge in Launceston, due to the steep topography across much of the city. Map 23 (on page 66) indicates the area of land with gradients greater than 15 per cent. In order to be deemed fully accessible, bus stops require gradients of around 2‐3 per cent.
Launceston public transport market and patronage
The Launceston passenger transport system aims to provide services to the following market segments:
• Directed trips – students/commuters (student, adult full fare and Adult concession) • Non‐directed trips – shopping/recreation/social (students, adult concession and adult full
fare)
Table 15‐ Launceston‐ total passenger boardings
1000000
1200000
1400000
1600000
1800000
2000000
2200000
Patronage

Public Transport
Page | 56
The Urban Service Standards focus on transport disadvantage which prioritises non‐directed trips and student travel (see Box 2). In Launceston, student travel dominates the market share – accounting for 69% of patronage (see Fig 10). Adult concession accounts for 23% of the market share and full adult fare constitutes around 8% of patronage. There is only minimal evidence of an adult commuter peak, suggesting directed trips are a minor component of the market at this stage.
Services are provided on typically ‘flat’ daytime timetables, where the frequency remains the same throughout the day. Some services are augmented by additional peak services driven by student demand. This demonstrates that commuters are accommodated without the need to use additional peak vehicles.
Despite a lack of directed trips (commuter peak demand), patronage indicates that there is consistent demand for regular seven day a week services related to non‐directed travel, such as shopping/personal business trips and well as recreational trips. Launceston has many areas with persons who are transport disadvantaged who have critical needs for bus services throughout the week.
Figure 10 ‐ Launceston Weekday Patronage Metro & Non Metro by Type of Passenger
Temporal, spatial and passenger type considerations
Patronage type composition varies over temporal periods and across the week. Students dominate peak use, while in all other periods Adult Concession passengers. Adult concession passengers are
Adult Full fare, 8.0%
Adult Concession, 23.1%
Student, 68.9%
Box 2 Urban Service Standards
The Urban Service Standards combine measurements of transport need, trip attractors and defined routes to determine the appropriate level of service for routes and route corridors.
Service level thresholds specify the service provision attributes for the range of identified service levels; i.e. the temporal span and the frequency for defined travel periods.
The Standards provide route design principles that aim to promote easily comprehensible services with maximum catchment.
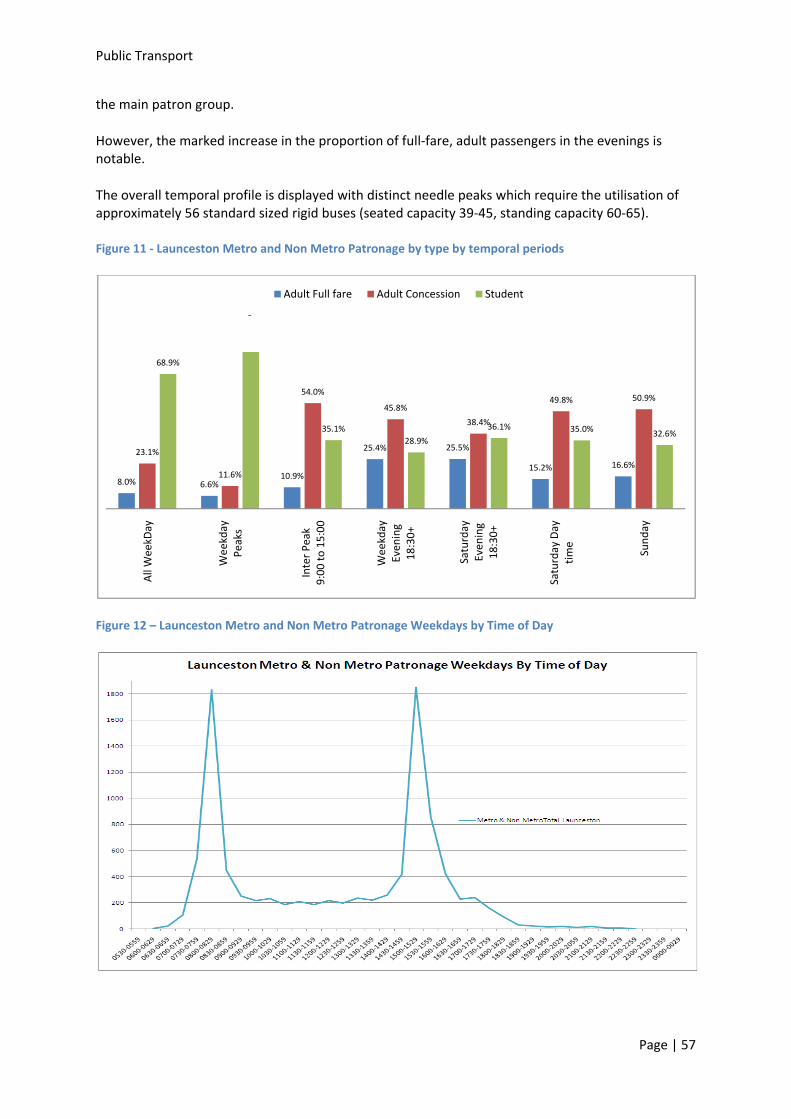
Public Transport
Page | 57
the main patron group.
However, the marked increase in the proportion of full‐fare, adult passengers in the evenings is notable.
The overall temporal profile is displayed with distinct needle peaks which require the utilisation of approximately 56 standard sized rigid buses (seated capacity 39‐45, standing capacity 60‐65).
Figure 11 ‐ Launceston Metro and Non Metro Patronage by type by temporal periods
Figure 12 – Launceston Metro and Non Metro Patronage Weekdays by Time of Day
8.0% 6.6%10.9%
25.4% 25.5%
15.2% 16.6%23.1%
11.6%
54.0%
45.8%
38.4%
49.8% 50.9%
68.9%
35.1%28.9%
36.1% 35.0% 32.6%
All WeekD
ay
Weekday
Peaks
Inter P
eak
9:00
to 15:00
Weekday
Even
ing
18:30+
Saturday
Even
ing
18:30+
Saturday Day
time
Sund
ay
Adult Full fare Adult Concession Student
8

Public T
Metro Tstudent Tasmaniof the st
Figure 13
ransport
Tasmania typpatronage, tia’s boardingtudent task,
3 – Weekday
pically carriesthe remaindg’s by passenthe consiste
Launceston M
s 86% of Lauer being carrnger type andnt adult con
Metro Networ
nceston’s daried by privad time of daycession patr
rk Boardings b
aily patronagate operatorsy and demonronage and m
by Passenger
ge and appros. Figure 13 rnstrates the minimal com
Type
P
oximately 76%represents Mstriking dommuter peaks
Page | 58
% of the Metro minance s.

Public Transport
Page | 59
Weekend Patronage
Weekend travel shows the relative importance of segments of the community most likely to have higher representations of transport disadvantaged – concession and student travel.
Figure 14 – Saturday Patronage by Passenger Type
Figure 15 – Sunday Patronage by Passenger Type

Public Transport
Page | 60
Overall patronage is highest on northern services (peak and inter‐peak), followed by southern services. The northern area increases its share further during off‐peak times. The northern area is categorised by a larger number of target customers and by a route design that provides a high frequency corridor service and consistent services at night times and weekends. These are factors likely to explain the higher use of passenger transport in the area.
Figure 16 ‐ Launceston Timetable Patronage by area by temporal periods
The inclusion of student‐only Metro services narrows the gap between northern services and other areas during peak periods. The probable reason is the relatively greater number of student‐only services in other areas.
Figure 17 ‐ ALL Launceston Metro Patronage (incl Metro student only services) by area
38%36%
39%
53%
44%
55%51%
46%
10% 10% 10%8%
10% 10% 9% 10%
25% 25% 25%
18%
24%
16%19%
22%
15% 17%13% 14% 16% 14% 16% 16%
8% 9%7% 7% 6% 4% 6% 6%5% 4%
6%
0% 0% 0% 0% 0%
All WeekDay Weekday Peaks
Inter Peak 9:00 to 15:00
Weekday Evening 18:30+
Saturday Evening 18:30+
Saturday Day time
Sunday Weekend
Northern Timetabled Services Eastern Timetabled Services Southern Timetabled ServicesWestern Timetabled Services Riverside Timetabled Services Total Tiger Bus
34%30%
41%
53%
44%
55%51%
46%
9% 8% 10%8%
10% 10% 9% 10%
25% 26% 25%
18%
24%
16%19%
22%
17%20%
12% 14% 16% 14% 16% 16%12%
15%
6% 7% 6% 4% 6% 6%3% 2%
6%
0% 0% 0% 0% 0%
All WeekDay Weekday Peaks
Inter Peak 9:00 to 15:00
Weekday Evening 18:30+
Saturday Evening 18:30+
Saturday Day time
Sunday Weekend
Metro All Northern Metro All Eastern Metro All Southern
Metro All Western Metro All River Metro All Tiger

Public Transport
Page | 61
Launceston Bus Services Review 2007
A review of Launceston bus services was implemented in 2007. Before 2007 Launceston bus services generally operated on a low frequency high penetration basis. Recommendations from the Review that were implemented included simplifying the bus network and increasing the frequency of services on simplified routes.
This increased walking distance to stops on routes where these measures were implemented. However, waiting time at stops was decreased and transit times reduced. Post‐implementation analysis of boardings data showed an immediate increase in patronage of 9% compared to pre‐review levels. The review also included improvements to weekend services as well as evening services – night services reintroduced Monday to Thursday – improving services for the socially excluded.
Non Metropolitan services
There are two types of other types of regular bus services travelling to the Launceston metropolitan area.
Urban Fringe Services to areas of Launceston beyond the outer suburban areas of Hadspen, St Leonards and Legana. Such services operate on most days of the week and provide a number of services, which allow passengers a choice of times to undertake daily return trips
Intrastate Services to other Tasmanian towns and cities. Such services (with the exception of service to Hobart) do not allow a choice of daily return trips, with a service generally operated on a once a day basis.
Urban Fringe Services
Such urban fringe services are in three broad groupings with bus services to:
• Cressy/Longford/Evandale/Perth operated by Tassielink. • Beauty Point/Beaconsfield/Grindelwald operated by Manions Coaches. • George Town area operated by Lees Coaches.
The key feature of urban fringe services are timetables which allow multiple trips – including a choice of times to make return trips. Currently timetables allows for both students and commuter needs on weekdays, as well as allowing weekday and weekend shopping trips to Launceston. There are no evening services bar those which depart almost immediately after 6pm. Current timetables do not allow people in these areas to make a variety of recreational trips outside ‘business hours’.
Table 16 ‐ Number of return daily services to urban fringe areas
Suburbs or areas Route Nos
Weekday core day time hours before 6pm
Weekday Evenings after 6pm
Saturday core day time hours before 6pm
Sunday core day time hours before 6pm
Cressy 740,742
743 7# 1 2 2
Longford & Perth 740 thru 743
8# 1 3 3

Public Transport
Page | 62
Evandale 743,744 3 No service 3 3
Beauty Point 183 6 No service 3 No serviceBeaconsfield 183 6.5 0.5 3 No servicesGrindelwald 183 4 No service 2.5 No service
George Town 3# No service 2 No service
# An additional return service operates for primarily for students on School days only.
Intrastate Services
Longer distance bus services are supplied to:
• Hobart, operated by Redline and Tassielink • Devonport, operated by Redline and Tassielink • Smithton/Burnie, operated by Redline • Deloraine/Mole Creek, operated by Redline • St Helens, (some services connecting from Bicheno) operated by Calow’s Coaches • Queenstown/Strahan/Cradle Mountain, operated by Tassielink • Scottsdale/Derby/Winnaleah, operated by Sainty’s
Levels of service vary depending on the destination – from three to four return trips per day between Hobart and Launceston, to at least daily weekday services to regional destinations. The service from Queenstown is only provided twice a week. Current timetabling makes it difficult to undertake return day trips, with significant stop over time, between Launceston and Hobart, and between Launceston and Devonport.
Student only services travel to surrounding towns. The services extend as far as Bridport, Scottsdale, Blessington, Deddington, St Helens, Ross, Cressy, Deloraine and Beauty Point.
Active Transport
Page | 63
Active transport – network description, use and identification of key linkages
The role of active transport
Like cities and towns across Australia, cars dominate the choice of transport options in Launceston. Because of the convenience of the private car, it is likely to remain the dominant mode for some time. However, a greater shift to other transport modes is needed to better manage the negative impacts of car use.
The majority of car trips made in Greater Launceston are short. Walking and cycling are important transport modes and are viable alternatives to private car use, especially for short tips to work, school, the local shops or to visit friends and family.
The environmental, social and health benefits of walking and cycling, together with opportunities to improve the liveability of our communities, are widely recognised. However, there is also a growing awareness that further action must be taken in order to encourage and support an increased modal shift to walking and cycling.
The Gehl Report – Launceston Public Spaces and Public Life Jan 2011
Gehl Architects were commissioned to undertake a report of Launceston by the city’s council. The report uses the consultant’s Public Spaces & Public Life (PSPL) methodology and focuses on the Launceston Central Area. The report includes reference to the effects of car‐dominated space and benefits for increasing walking, cycling and public transport options. As the primary activity centre and most significant attractor for work trips, considerations of transport options will affect the Greater Launceston area.
The Gehl Report highlights Launceston’s amenity values – a low built skyline, compact and flat centre and natural setting with rivers and reserve area in close proximity. Currently a traffic dominated centre, the Report recommends reducing traffic volumes and speeds in the centre, improving the attractiveness of cycling and walking links, increasing diversity in the heart and promoting the use of public space. Specific recommendations include:
• Traffic calming • Changing one way streets to two way • Lowering speed limits • Reducing parking • Improving the integration of public transport • Ensuring a bicycle friendly environment with door‐to‐door network • Promoting cycling as an alternative to the car • Extending and connecting the walking network • Improving comfort and reducing barriers to walking • Developing attractive walking routes.

Active Transport
Page | 64
Walking
The Launceston central area and CBD is reasonably flat with a network of footpaths and paved areas providing reasonable connectivity for walking. While ABS Journey to Work statistics show walking to be less than 6% of all work trips in 2011 in Greater Launceston, the central suburb of Launceston recorded walking at 25% of trips. The adjacent areas of Invermay and South Launceston also recorded higher percentages of walking trips with around 11% and 13% respectively. Beyond these locations, distance and/or topography are likely to be limiting factors for walking as a regular transport mode option.
Increased distances in the more dispersed low‐density suburban and fringe areas limit walking opportunities to access work and services. However, district centres and activity centres have reasonable residential populations within walking distances (see Map 22). Some suburban fringe areas that are more car‐dependant do not have footpaths. These areas include parts of Legana, Riverside and Blackstone Heights.
Launceston City Council has recently adopted the Launceston Pedestrian Strategy aiming to improve pedestrian infrastructure and increase participation for recreation and transport.
Cycling
Planning for cycling infrastructure in the Greater Launceston region in recent years has been undertaken at local and regional levels. Council bicycle plans have been used as the basis for the development of:
• The Greater Launceston Regional Bike Strategy – covering recreational and commuting cycling the strategy was joint approach by five councils (LCC, MVC, WTC, NMC, GTC) and Sport and Recreation; and
• The Principal Urban Cycling Network Launceston – focussing on priority urban connections (see below).
Launceston City Council is currently developing a Bicycle Strategy.
Principal Urban Cycling Network –Launceston
DIER, together with local government representatives, cycling advocacy groups and other community based organisations have undertaken a process to identify the highest priority transport oriented cycling routes in Launceston, Hobart and Devonport/Burnie. A map of the Launceston Principal Urban Cycling Network is below (Map xx).
The principal urban cycling networks provide the arterial cycling structure that urban streets and local council cycling infrastructure can feed into, with the aim of facilitating cycling journeys between suburban areas and activity centres. While cycle infrastructure exists on some routes, it is yet to be developed on others. In some cases, the precise route to be followed has not been finalised, and it will not be possible to do this until some initial feasibility, concept, planning and design work has been completed.
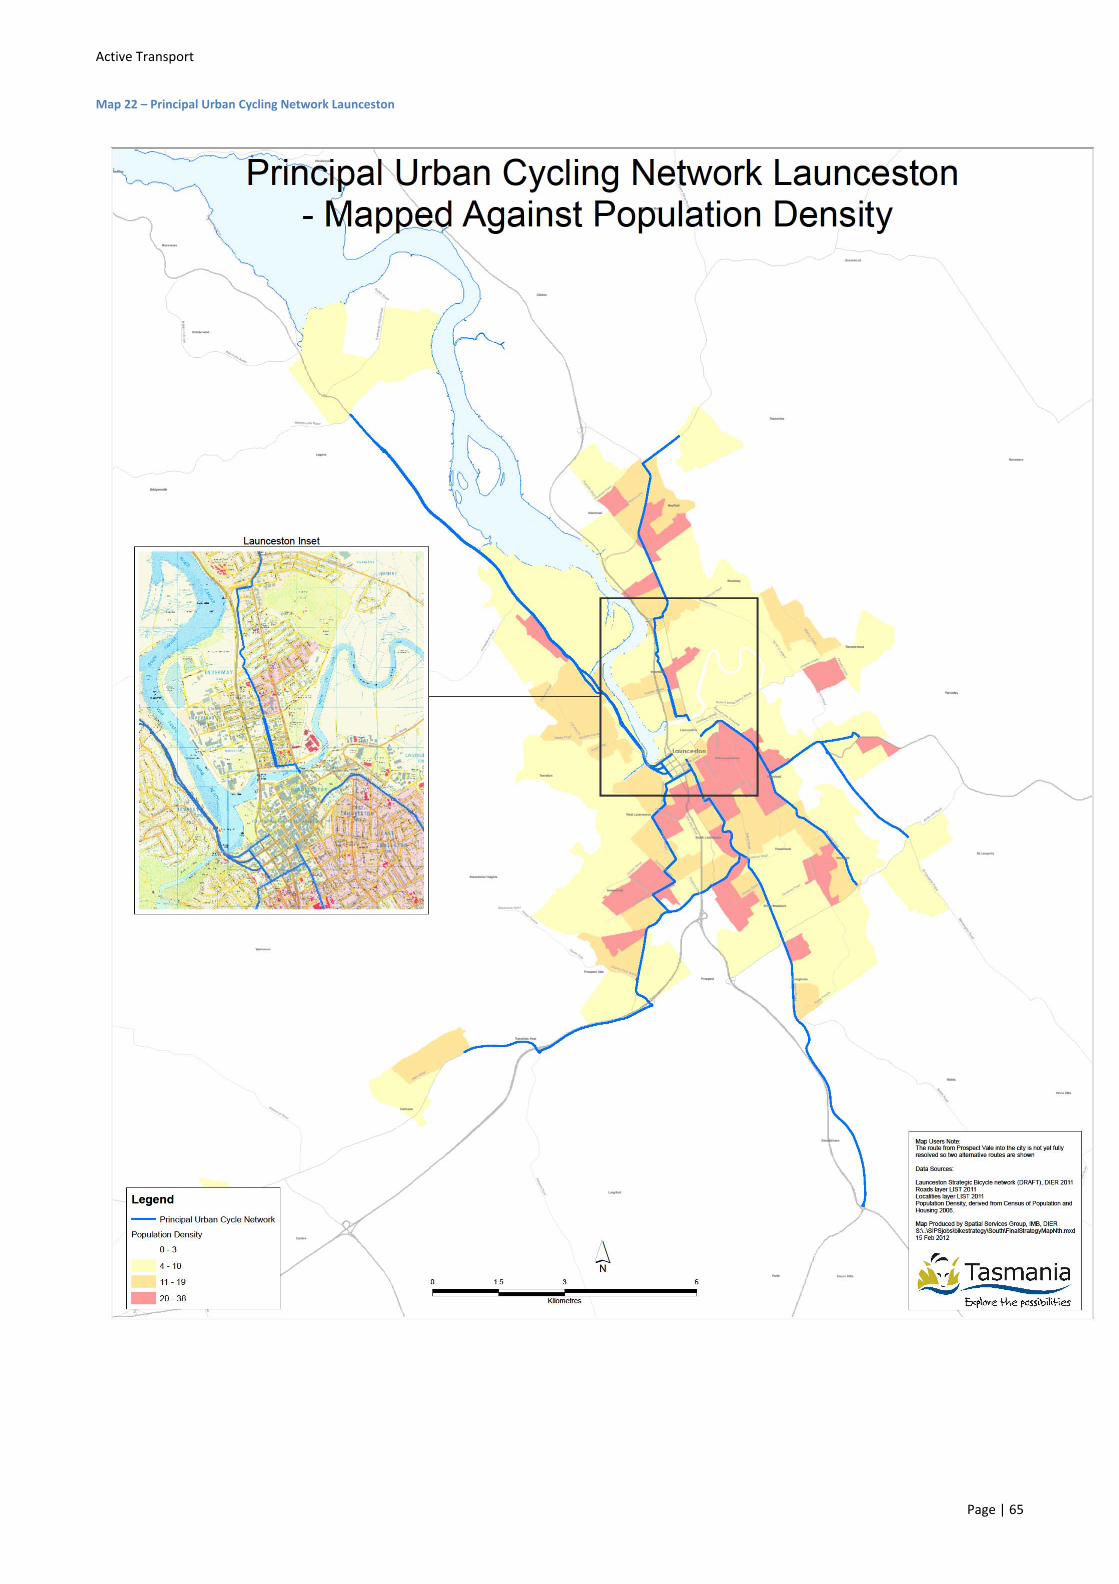
Active Transport
Page | 65
Map 22 – Principal Urban Cycling Network Launceston

Active Transport
Page | 66
Walking
Map 23‐ Gradient greater than 15% and distance to act5ivity centres

Active Transport
Page | 67
Taxi services
Taxi services are provided in Launceston under the authority of taxi licences issued by the Transport Commission. There are currently 102 standard taxi licences on issue for the Launceston taxi area, with a further 11 licences on issue for the Perth taxi area, which incorporates the Launceston Airport. This includes perpetual taxi licences (which are perpetual assets and may be leased and freely traded) and owner‐operator taxi licences (which may only be operated by the holder of the licence).
The location of the Airport is significant because a taxi licence provides the right to carry passengers into, within and from the relevant taxi area. This means operators of both Perth and Launceston taxi Licences can carry passengers to and from the Launceston Airport.
The number of licences available for release is restricted by the Taxi and Luxury Hire Cars Act 2008. Under that Act, a minimum number of owner‐operator taxi licences are offered for sale each year. (No further perpetual taxi licences will be issued). The number to be offered for sale is equal to 5 per cent of the total standard licences on issue, or 1 licence, whichever is the greater figure.
Since the legislation came into effect in 2008, only one Launceston licence and three Perth licences have been sold. Prior to this, in 2007‐08, ten perpetual licences were sold; however, this was the first issue of new licences for a substantial period. It has been suggested that the limited demand for new taxi licences indicates that the taxi market is at capacity in Launceston (or even over‐supplied), with limited opportunities for new operators. The extent to which this is the explanation cannot be determined. The apparent demand situation in Launceston is in strong contrast to Hobart, where an additional 50 licences have been sold, and come into operation, since 2008.
The number of taxis in Launceston has increased since 2004 with the release of licences to operate Wheelchair Accessible Taxi Services (WAT). Following a staged release of licences over the period 2004 to 2006, WAT licences are now available on application from the Transport Commission to appropriately accredited taxi operators who have a compliant vehicle. There are now 18 WATs operating in Launceston. These taxis perform an important role providing transport services to clients with disabilities, as well as operating as part of the overall taxi fleet (but with larger seating and storage capacity than standard taxis).
For members of the Transport Access Scheme (TAS), travel in taxis is subsidised. A TAS member pays only 50% of the metered fare (40% of the metered fare for wheelchair‐reliant members of the scheme). The remainder of the fare is paid through the State Government, up to a maximum amount of $25 per trip for non‐wheelchair reliant members and $30 for wheelchair‐reliant members. WAT fares are higher than standard taxi fares when wheelchair‐reliant passengers are carried and the higher subsidy is intended to offset this difference.
Taxis provide a niche transport service in Launceston and its surrounding areas. The generally high accessibility to private vehicles, and the relative low cost of public transport, means that taxis fill the gaps between these types of transport services. In particular, Launceston taxi operators have identified the following specific markets for the services:
• Business travel;
• Aged clients, who no longer drive themselves;
• People who are unable to drive, such as people with disabilities;
• Evenings, particularly Friday and Saturday nights.

Active Transport
Page | 68
Most taxi work is pre‐booked, although there are a number of permanent ranks in Launceston and taxis may accept hailings from the street. A new licence operator has the option of negotiating access to a taxi dispatch network to aid in securing bookings. Unlike Hobart, Launceston only has one taxi network, which may limit options for new operators.
The taxi industry generally views the potential market for taxi services in Launceston as fixed and unable to be influenced by the industry’s own actions. The implication is that the potential for any increase in demand lies only in absolute growth in those sectors of the community where taxi services are in demand – namely, those listed above.
One area of growth that has been identified (both within Launceston and in Hobart) is the potential role of taxis to provide services in lieu of buses, on public transport corridors during periods of low demand.
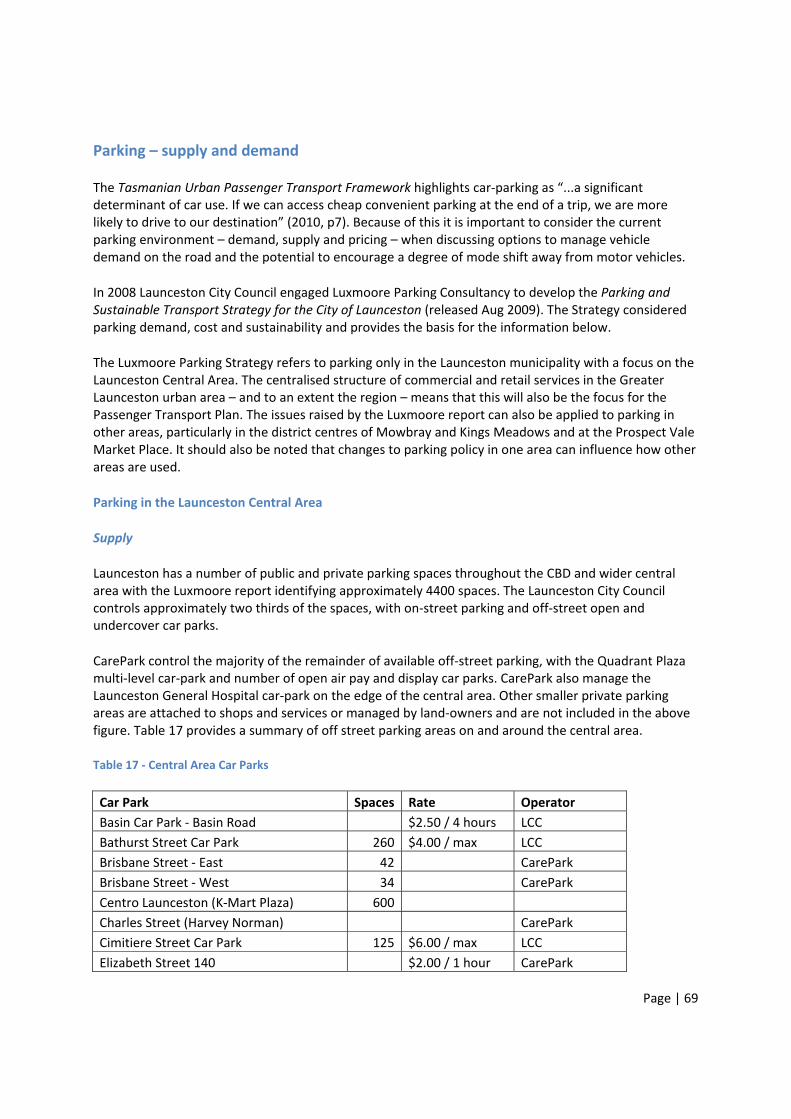
Page | 69
Parking – supply and demand
The Tasmanian Urban Passenger Transport Framework highlights car‐parking as “...a significant determinant of car use. If we can access cheap convenient parking at the end of a trip, we are more likely to drive to our destination” (2010, p7). Because of this it is important to consider the current parking environment – demand, supply and pricing – when discussing options to manage vehicle demand on the road and the potential to encourage a degree of mode shift away from motor vehicles.
In 2008 Launceston City Council engaged Luxmoore Parking Consultancy to develop the Parking and Sustainable Transport Strategy for the City of Launceston (released Aug 2009). The Strategy considered parking demand, cost and sustainability and provides the basis for the information below.
The Luxmoore Parking Strategy refers to parking only in the Launceston municipality with a focus on the Launceston Central Area. The centralised structure of commercial and retail services in the Greater Launceston urban area – and to an extent the region – means that this will also be the focus for the Passenger Transport Plan. The issues raised by the Luxmoore report can also be applied to parking in other areas, particularly in the district centres of Mowbray and Kings Meadows and at the Prospect Vale Market Place. It should also be noted that changes to parking policy in one area can influence how other areas are used.
Parking in the Launceston Central Area
Supply
Launceston has a number of public and private parking spaces throughout the CBD and wider central area with the Luxmoore report identifying approximately 4400 spaces. The Launceston City Council controls approximately two thirds of the spaces, with on‐street parking and off‐street open and undercover car parks.
CarePark control the majority of the remainder of available off‐street parking, with the Quadrant Plaza multi‐level car‐park and number of open air pay and display car parks. CarePark also manage the Launceston General Hospital car‐park on the edge of the central area. Other smaller private parking areas are attached to shops and services or managed by land‐owners and are not included in the above figure. Table 17 provides a summary of off street parking areas on and around the central area.
Table 17 ‐ Central Area Car Parks
Car Park Spaces Rate Operator Basin Car Park ‐ Basin Road $2.50 / 4 hours LCC Bathurst Street Car Park 260 $4.00 / max LCC Brisbane Street ‐ East 42 CarePark Brisbane Street ‐ West 34 CarePark Centro Launceston (K‐Mart Plaza) 600 Charles Street (Harvey Norman) CarePark Cimitiere Street Car Park 125 $6.00 / max LCC Elizabeth Street 140 $2.00 / 1 hour CarePark
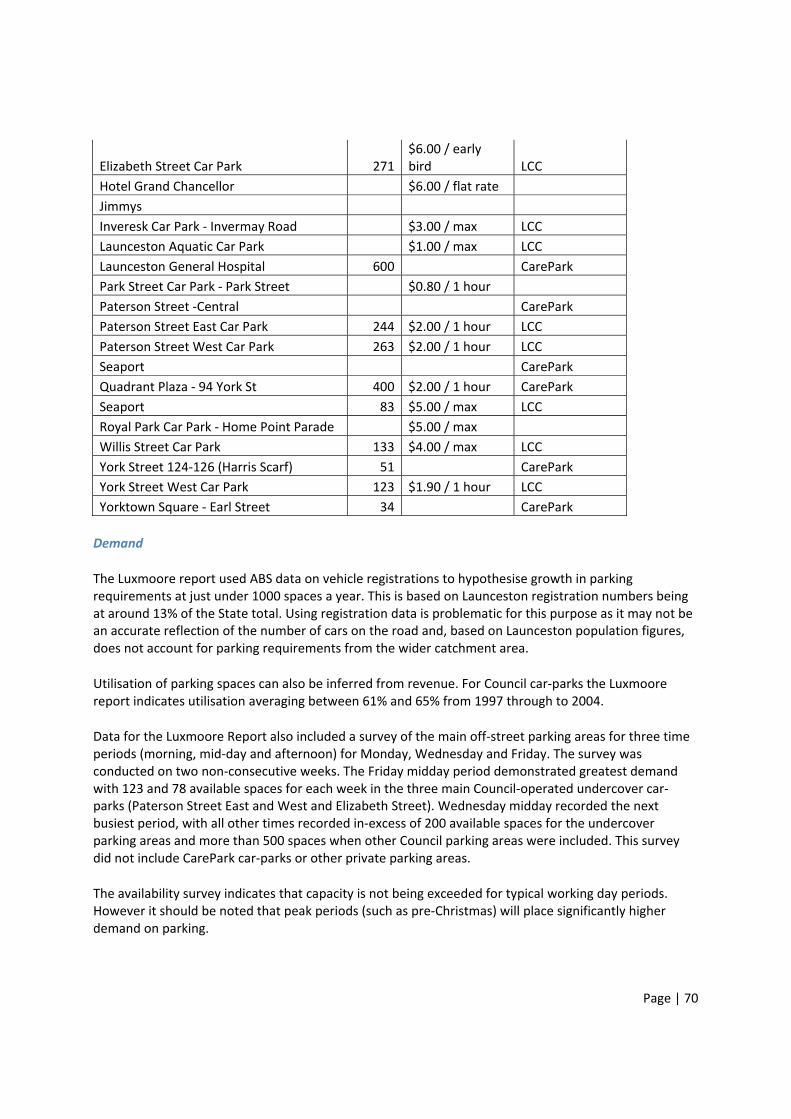
Page | 70
Elizabeth Street Car Park 271$6.00 / early bird LCC
Hotel Grand Chancellor $6.00 / flat rate Jimmys Inveresk Car Park ‐ Invermay Road $3.00 / max LCC Launceston Aquatic Car Park $1.00 / max LCC Launceston General Hospital 600 CarePark Park Street Car Park ‐ Park Street $0.80 / 1 hour Paterson Street ‐Central CarePark Paterson Street East Car Park 244 $2.00 / 1 hour LCC Paterson Street West Car Park 263 $2.00 / 1 hour LCC Seaport CarePark Quadrant Plaza ‐ 94 York St 400 $2.00 / 1 hour CarePark Seaport 83 $5.00 / max LCC Royal Park Car Park ‐ Home Point Parade $5.00 / max Willis Street Car Park 133 $4.00 / max LCC York Street 124‐126 (Harris Scarf) 51 CarePark York Street West Car Park 123 $1.90 / 1 hour LCC Yorktown Square ‐ Earl Street 34 CarePark
Demand
The Luxmoore report used ABS data on vehicle registrations to hypothesise growth in parking requirements at just under 1000 spaces a year. This is based on Launceston registration numbers being at around 13% of the State total. Using registration data is problematic for this purpose as it may not be an accurate reflection of the number of cars on the road and, based on Launceston population figures, does not account for parking requirements from the wider catchment area.
Utilisation of parking spaces can also be inferred from revenue. For Council car‐parks the Luxmoore report indicates utilisation averaging between 61% and 65% from 1997 through to 2004.
Data for the Luxmoore Report also included a survey of the main off‐street parking areas for three time periods (morning, mid‐day and afternoon) for Monday, Wednesday and Friday. The survey was conducted on two non‐consecutive weeks. The Friday midday period demonstrated greatest demand with 123 and 78 available spaces for each week in the three main Council‐operated undercover car‐parks (Paterson Street East and West and Elizabeth Street). Wednesday midday recorded the next busiest period, with all other times recorded in‐excess of 200 available spaces for the undercover parking areas and more than 500 spaces when other Council parking areas were included. This survey did not include CarePark car‐parks or other private parking areas.
The availability survey indicates that capacity is not being exceeded for typical working day periods. However it should be noted that peak periods (such as pre‐Christmas) will place significantly higher demand on parking.

Page | 71
Pricing
For council operated off‐street parking in the CBD prices are around $2.00 per hour with periphery parking at a reduced hourly rate. Metered parking peaks at $2.10 per hour for short‐term CBD parking and reduces with distance from the central area (with time limits increasing).
All day parking rates are available from $4.00 per day on the CBD periphery (e.g. Wilis Street car‐park), but can still be found at a modest $6.00 per day within several blocks of the Mall (e.g. Elizabeth St car‐park).
The CarePark facility at the Quadrant Plaza, with 400 spaces, charges $2.00 per hour with an all‐day fee of $12. Early bird parking is available on some levels from $5.00 per day. The Central Patterson Street car‐park is charges $3.00 per hour.

Page | 72
Map 24 ‐ Parking and Bus Interchange
Page | 73
Greater Launceston Metropolitan Passenger Transport Plan
Passenger Transport Policy Division Department of Infrastructure, Energy and Resources
GPO Box 936, Hobart 7001
Ph: 1300 135 513