
New Metropolitan Perspectives - Oapen
301
123 Smart Innovation, Systems and Technologies 177 Carmelina Bevilacqua Francesco Calabrò Lucia Della Spina Editors New Metropolitan Perspectives Knowledge Dynamics, Innovation-driven Policies Towards the Territories’ Attractiveness Volume 1
-
Upload
khangminh22 -
Category
Documents
-
view
1 -
download
0
Transcript of New Metropolitan Perspectives - Oapen
123
Smart Innovation, Systems and Technologies 177
Carmelina BevilacquaFrancesco CalabròLucia Della Spina Editors
New Metropolitan PerspectivesKnowledge Dynamics, Innovation-driven Policies Towards the Territories’ Attractiveness Volume 1

Smart Innovation, Systems and Technologies
Volume 177
Series Editors
Robert J. Howlett, Bournemouth University and KES International,Shoreham-by-sea, UK
Lakhmi C. Jain, Faculty of Engineering and Information Technology,Centre for Artificial Intelligence, University of Technology Sydney,Sydney, NSW, Australia

The Smart Innovation, Systems and Technologies book series encompasses thetopics of knowledge, intelligence, innovation and sustainability. The aim of theseries is to make available a platform for the publication of books on all aspects ofsingle and multi-disciplinary research on these themes in order to make the latestresults available in a readily-accessible form. Volumes on interdisciplinary researchcombining two or more of these areas is particularly sought.
The series covers systems and paradigms that employ knowledge and intelligencein a broad sense. Its scope is systems having embedded knowledge and intelligence,which may be applied to the solution of world problems in industry, the environmentand the community. It also focusses on the knowledge-transfer methodologies andinnovation strategies employed to make this happen effectively. The combination ofintelligent systems tools and a broad range of applications introduces a need for asynergy of disciplines from science, technology, business and the humanities. Theseries will include conference proceedings, edited collections, monographs, hand-books, reference books, and other relevant types of book in areas of science andtechnology where smart systems and technologies can offer innovative solutions.
High quality content is an essential feature for all book proposals accepted for theseries. It is expected that editors of all accepted volumes will ensure thatcontributions are subjected to an appropriate level of reviewing process and adhereto KES quality principles.
** Indexing: The books of this series are submitted to ISI Proceedings,EI-Compendex, SCOPUS, Google Scholar and Springerlink **
More information about this series at http://www.springer.com/series/8767
Carmelina Bevilacqua • Francesco Calabrò •
Lucia Della SpinaEditors
New MetropolitanPerspectivesKnowledge Dynamics, Innovation-drivenPolicies Towards the Territories’Attractiveness Volume 1
123

EditorsCarmelina BevilacquaUniversity of Reggio CalabriaReggio Calabria, Reggio Calabria, Italy
Lucia Della SpinaMediterranea University of Reggio CalabriaReggio Calabria, Reggio Calabria, Italy
Francesco CalabròMediterranea University of Reggio CalabriaReggio Calabria, Reggio Calabria, Italy
ISSN 2190-3018 ISSN 2190-3026 (electronic)Smart Innovation, Systems and TechnologiesISBN 978-3-030-52868-3 ISBN 978-3-030-52869-0 (eBook)https://doi.org/10.1007/978-3-030-52869-0
© The Editor(s) (if applicable) and The Author(s) 2020. This book is an open access publication.Open Access This book is licensed under the terms of the Creative Commons Attribution 4.0International License (http://creativecommons.org/licenses/by/4.0/), which permits use, sharing,adaptation, distribution and reproduction in any medium or format, as long as you give appropriate creditto the original author(s) and the source, provide a link to the Creative Commons license and indicate ifchanges were made.The images or other third party material in this book are included in the book’s Creative Commonslicense, unless indicated otherwise in a credit line to the material. If material is not included in the book’sCreative Commons license and your intended use is not permitted by statutory regulation or exceeds thepermitted use, you will need to obtain permission directly from the copyright holder.The use of general descriptive names, registered names, trademarks, service marks, etc. in this publi-cation does not imply, even in the absence of a specific statement, that such names are exempt from therelevant protective laws and regulations and therefore free for general use.The publisher, the authors and the editors are safe to assume that the advice and information in thisbook are believed to be true and accurate at the date of publication. Neither the publisher nor theauthors or the editors give a warranty, expressed or implied, with respect to the material containedherein or for any errors or omissions that may have been made. The publisher remains neutral with regardto jurisdictional claims in published maps and institutional affiliations.
This Springer imprint is published by the registered company Springer Nature Switzerland AGThe registered company address is: Gewerbestrasse 11, 6330 Cham, Switzerland
This volume is part of the TREnD project (Transition with Resilience for EvolutionaryDevelopment), which has received funding from the European Union’s Horizon 2020research and innovation program under the Marie Skłodowska-Curie grant agreementNo. 823952

Preface
This volume contains the proceedings for the fourth International “NEWMETROPOLITAN PERSPECTIVES. Knowledge Dynamics and Innovation-drivenPolicies Towards Urban and Regional Transition”, scheduled from 26 to 28 May2020, in Reggio Calabria, Italy.
The Symposium was jointly promoted by LaborEst (Evaluation and EconomicAppraisal Lab) and CLUDs (Commercial Local Urban Districts Lab), Laboratoriesof the PAU Department, Mediterranea University of Reggio Calabria, Italy, inpartnership with a qualified international network of the academic institution andscientific societies.
The fourth edition of “NEW METROPOLITAN PERSPECTIVES”, like theprevious ones, aimed to deepen those factors which contribute to increase cities andterritories attractiveness, both with theoretical studies and tangible applications.
When the call for papers of New Metropolitan Perspectives was launched inSeptember 2019, no one could imagine that in a few months we would find our-selves suddenly catapulted into a totally unknown future. And the papers sent inJanuary 2020, of course, could not in any way reflect the dynamics caused by thespread of COVID-19, the outlines of which will all be discovered and deepened inthe coming years: it is still too early to fully understand the extent of these changes.
Today, we are still dealing with what appears to be a cataclysm of planetaryproportions; it will take time to “historicize” events and interpret their profoundmeaning and long-term impact, through the multilevel observation—through theinterpretation of macro-data and the in-depth investigation of the different realitiesinvolved—that the scientific community will be able to develop when the healthemergency is over. At that point, the scenarios can begin to be configured withscientific rigour, which are beginning to be intuitively delineated in constant events.It will be possible to appreciate the permanent (real and perceived) effects on thedaily life of communities, on the organisation of work and logistics chains and inthe system of social relations.
At present, we can only hypothesise scenarios, more or less well founded.
v
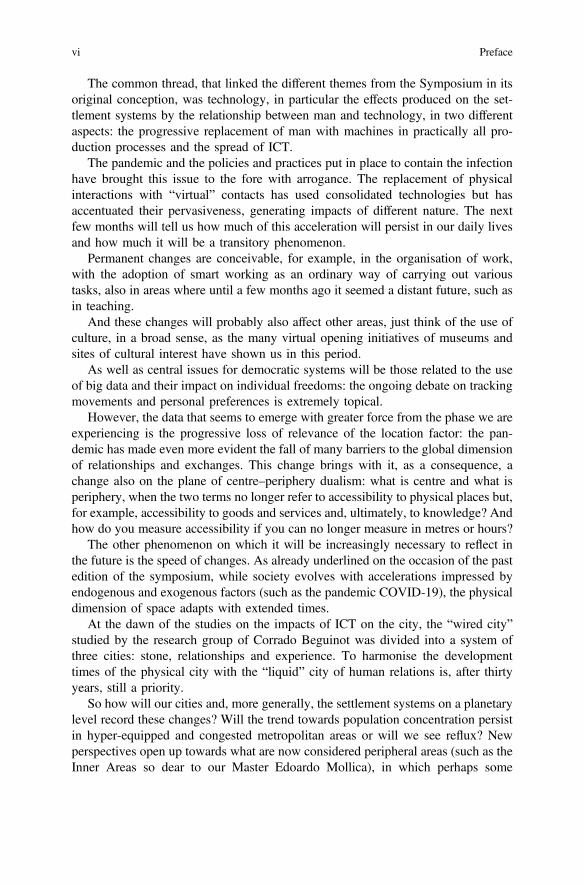
The common thread, that linked the different themes from the Symposium in itsoriginal conception, was technology, in particular the effects produced on the set-tlement systems by the relationship between man and technology, in two differentaspects: the progressive replacement of man with machines in practically all pro-duction processes and the spread of ICT.
The pandemic and the policies and practices put in place to contain the infectionhave brought this issue to the fore with arrogance. The replacement of physicalinteractions with “virtual” contacts has used consolidated technologies but hasaccentuated their pervasiveness, generating impacts of different nature. The nextfew months will tell us how much of this acceleration will persist in our daily livesand how much it will be a transitory phenomenon.
Permanent changes are conceivable, for example, in the organisation of work,with the adoption of smart working as an ordinary way of carrying out varioustasks, also in areas where until a few months ago it seemed a distant future, such asin teaching.
And these changes will probably also affect other areas, just think of the use ofculture, in a broad sense, as the many virtual opening initiatives of museums andsites of cultural interest have shown us in this period.
As well as central issues for democratic systems will be those related to the useof big data and their impact on individual freedoms: the ongoing debate on trackingmovements and personal preferences is extremely topical.
However, the data that seems to emerge with greater force from the phase we areexperiencing is the progressive loss of relevance of the location factor: the pan-demic has made even more evident the fall of many barriers to the global dimensionof relationships and exchanges. This change brings with it, as a consequence, achange also on the plane of centre–periphery dualism: what is centre and what isperiphery, when the two terms no longer refer to accessibility to physical places but,for example, accessibility to goods and services and, ultimately, to knowledge? Andhow do you measure accessibility if you can no longer measure in metres or hours?
The other phenomenon on which it will be increasingly necessary to reflect inthe future is the speed of changes. As already underlined on the occasion of the pastedition of the symposium, while society evolves with accelerations impressed byendogenous and exogenous factors (such as the pandemic COVID-19), the physicaldimension of space adapts with extended times.
At the dawn of the studies on the impacts of ICT on the city, the “wired city”studied by the research group of Corrado Beguinot was divided into a system ofthree cities: stone, relationships and experience. To harmonise the developmenttimes of the physical city with the “liquid” city of human relations is, after thirtyyears, still a priority.
So how will our cities and, more generally, the settlement systems on a planetarylevel record these changes? Will the trend towards population concentration persistin hyper-equipped and congested metropolitan areas or will we see reflux? Newperspectives open up towards what are now considered peripheral areas (such as theInner Areas so dear to our Master Edoardo Mollica), in which perhaps some
vi Preface
organisational processes are more easily managed and there are still values thatcould be appreciated by future generations.
The ethics of research, in the disciplinary sectors that the Symposium crosses,invites us to feed, with scientific rigour, policies and practices that make the ter-ritory more resilient and able to react effectively to events such as the pandemic thatwe are suffering in recent months: we hope to know the outcomes of these coursesin the next editions of the New Metropolitan Perspectives Symposium.
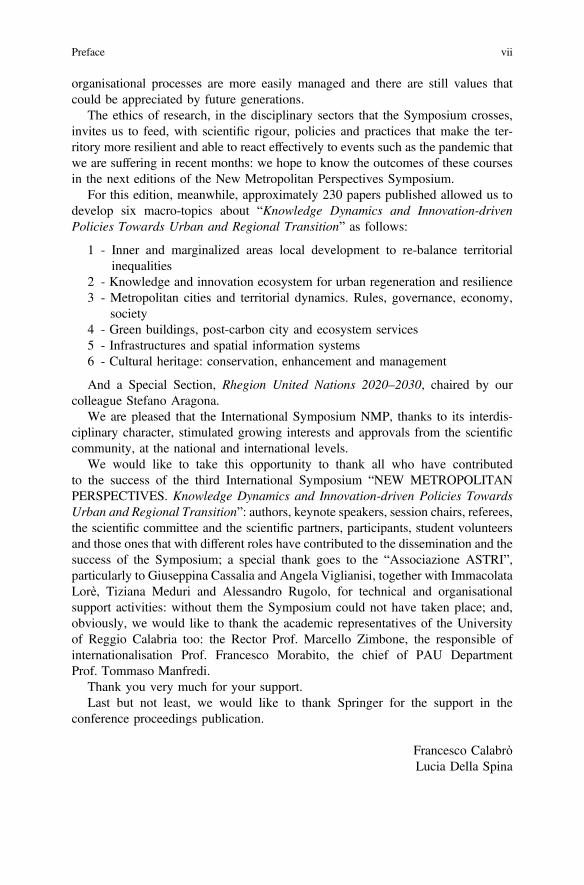
For this edition, meanwhile, approximately 230 papers published allowed us todevelop six macro-topics about “Knowledge Dynamics and Innovation-drivenPolicies Towards Urban and Regional Transition” as follows:
1 - Inner and marginalized areas local development to re-balance territorialinequalities
2 - Knowledge and innovation ecosystem for urban regeneration and resilience3 - Metropolitan cities and territorial dynamics. Rules, governance, economy,
society4 - Green buildings, post-carbon city and ecosystem services5 - Infrastructures and spatial information systems6 - Cultural heritage: conservation, enhancement and management
And a Special Section, Rhegion United Nations 2020–2030, chaired by ourcolleague Stefano Aragona.
We are pleased that the International Symposium NMP, thanks to its interdis-ciplinary character, stimulated growing interests and approvals from the scientificcommunity, at the national and international levels.
We would like to take this opportunity to thank all who have contributedto the success of the third International Symposium “NEW METROPOLITANPERSPECTIVES. Knowledge Dynamics and Innovation-driven Policies TowardsUrban and Regional Transition”: authors, keynote speakers, session chairs, referees,the scientific committee and the scientific partners, participants, student volunteersand those ones that with different roles have contributed to the dissemination and thesuccess of the Symposium; a special thank goes to the “Associazione ASTRI”,particularly to Giuseppina Cassalia and Angela Viglianisi, together with ImmacolataLorè, Tiziana Meduri and Alessandro Rugolo, for technical and organisationalsupport activities: without them the Symposium could not have taken place; and,obviously, we would like to thank the academic representatives of the Universityof Reggio Calabria too: the Rector Prof. Marcello Zimbone, the responsible ofinternationalisation Prof. Francesco Morabito, the chief of PAU DepartmentProf. Tommaso Manfredi.
Thank you very much for your support.Last but not least, we would like to thank Springer for the support in the
conference proceedings publication.
Francesco CalabròLucia Della Spina
Preface vii
Cities and Regions Towards Transition
The fourth edition of the New Metropolitan Perspective Symposium took place in aperiod of global uncertainty that is calling into question the essence of the economicprosperity pursued in the last decades. It is recognised that what is urgently requiredis a policy shift from a primary push towards ever-increasing productivityand competitiveness goals to one that pursues a “renewed” concept ofcompetitiveness—socially just and environmentally responsible—employing areformed pan-economic approach. The continuing and progressive changes dueto the systemic impact of shocks and stresses at the global level need a con-vergence of efforts by all countries. This is critical to balance the need to maintaineconomic prosperity generated by globalisation and to mitigate global crisis likeclimate change and the ongoing COVID-19 pandemic. The scenario that isemerging these days is similar to a post-war reconstruction economy, alongsideclimate change and the risks associated with it, the emergency of the pandemic hasseriously questioned social stability at the urban level and the confluence ofinstitutions in multilevel governance processes. Concurrently, the main question tobe addressed can no longer be confined to how cities and regions can compete in aglobal context, but rather how they can survive in a world that must face the effectsof continuous shocks by ensuring socially acceptable living conditions foreveryone.
At European level, this need has been stimulating the debate for the revision ofpolicies designed to build a better Europe for its citizens and a “restructuringprocess” of EU institutions in the light of anti-European, populist and sovereignpolitical movements. These movements together with far-reaching global crises andshocks are threatening the future of EU and the Cohesion Policy grounded on thevirtuous principle to reduce disparities by promoting social, economic and territorialcohesion. In response, the European Commission has recently introduced theEuropean Green Deal, a set of policy initiatives to strive for a green transition basedon solidarity and fairness. This marks a novel growth strategy that is comprehen-sive, ambitious and bold, integrating climate, environmental and social protectiongoals with economic ones. Such a transformative pathway helps set the stage forpolicy actions in the upcoming post-2020 programming period of the Cohesion
ix

Policy. Arguably, these days the perspective of the EU mission will be redesigned,through new priorities and new tools launched for shaping the Conference on theFuture of Europe.
In this context, the debate on how to prepare EU territories and cities to addressthe challenges of regional and global implications cannot be more relevant. Thecurrent development approaches need to be adjusted to formulate a new develop-ment pattern. Such a pattern is characterised by a more flexible approach in allo-cating investment, a more integrated approach to reach the goal of transitiondevelopment and a more tailored, place-sensitive approach to regional develop-ment. It should facilitate a sustainable transition process towards transformingregional and urban socio-economic and technological systems. This process will bedriven with an evolutionary approach in which knowledge and innovationdynamics can break path dependency and promote an effective regional diversifi-cation. This pattern should be underpinned by an integrated, multiscalar and mul-tidimensional approach aimed to enhance the resilience capacity of territories torespond to the various crises and shocks they are exposed to.
To substantiate these arguments, the Symposium was also part of the TREnD(Transition with Resilience for Evolutionary Economic Development) researchproject funded by the European Union’s Horizon 2020 Research and InnovationProgramme under the Marie Skłodowska-Curie Actions—RISE 2018. Consideringthe above-mentioned unparalleled yet controversial complexity while responding tothe European call for the green transition, TREnD proposes a new approach in thedesign process of place-sensitive, innovation-oriented development policies thatcan facilitate the regional and urban transition to sustainability while reinforcingresilience to shocks induced by transition economies (e.g. post-carbon economy).TREnD’s approach is focused on how to strengthen the regional capabilities totrigger, implement and manage transition strategies towards driving“resilience-building” processes. The scope is to combine Transition with Resiliencefor Evolutionary Development in different territorial contexts towards a reformingprocess of Cohesion Policy for the next programming period 2021–2027. TheTREnD, therefore, seeks to: 1) identify and examine the factors enabling or hin-dering the transition strategies at a governance standpoint; 2) assess the territorialcharacteristics critical to enable a resilient-building process; 3) unveil the unex-ploited potentials for “re-shaping trajectories” disclosed through the windows oflocal opportunities due to the external shocks cities and regions are continuouslyexposed to.
TREnD highlights regional diversification seen more as a process of co-creationof solutions and concepts to solve development problems through the enhancementof the resilience capacity of regions, which can be achieved by implementingtailored placed-based innovation policies with a transitional approach. Stemmingfrom the current debates on regional diversification together with the emerging roleof the city in pursuing local innovation ecosystem, the aim is to explore newdevelopment policy configuration within the evolutionary framework to help dif-ferent territories effectively respond to continuous shocks. It is expected to gain asound understanding of the triggering mechanisms conducive to frame a more
x Cities and Regions Towards Transition

inclusive S3 process for the post-2020 Cohesion Policy. This new framework,thanks to resilience-based process and transition management, will help definetailored S3 processes more sensitive to different regional contexts and needs. In sodoing, it will reinforce innovation diffusion, facilitate diversification and tighten thelinkages between advanced and peripheral areas (at regional and sub-regionallevels) through more inclusive approaches.
Considering this vision, the Symposium tried to offer possible solutions tosustainable development as defined by the UN Agenda 2030, focusing on thecomplex and dynamic relationships between human society and technologicaldevelopment, and the latter’s socio-economic, political, institutional and environ-mental impacts on territorial and urban systems. Indeed, investigating the nexusbetween the ever-changing societal needs and rapid technological developmentrepresents a valuable opportunity to achieve this ambitious goal. The desired shifttowards a more sustainable knowledge-based economy and society since thebeginning of the 2000s, especially in developed countries, is impeded by severalchallenges. In Europe, the Smart Specialisation Strategy (S3) represents the strongpush to boost economic development through knowledge, research and innovation.The current academic and policymakers’ debate are questioning its capacity tobreak down path dependencies and facilitate economic diversification. The diffi-culties in implementing and doubts about the effectiveness of this ambitiousinnovation-oriented policy—especially at regional level—suggest the need to revisethe post-2020 Cohesion Policy and the approach beyond Regional SmartSpecialisation Strategy (RIS3). Among the rising concerns, the controversial effectof innovation concentration on peripheral areas due to the new geography ofknowledge is coming to the fore. The surging discontent shows how policymakersare struggling with continuous mutating scenarios characterised by more complexterritorial dynamics. The pillar on which the current policy action seems to rest isrepresented by the potentials underlying knowledge complexity and innovation inreversing negative trends. However, recent studies have pointed out how suchcomplexity is giving rise to inequalities in both core and lagging regions, makingperipheral areas a common issue to tackle. More efforts are needed to addressdifferent aspects of inequalities connected with the new geography of knowledge.Therefore, a more inclusive and integrated approach is desirable to advance tech-nological innovation while addressing social issues of health, environment, edu-cation and social exclusion.
Accordingly, the Symposium stimulated multidisciplinary discussions on thekey elements of the debate on a shift in policy design and implementation,including transition management, resilience, diversification and quality of gover-nance to leverage the potentials of peripheral areas and reshape the trajectory ofeconomic growth for more equitable development. It aims to identify a new andbalanced developed pattern, casting light on the multiscalar and multidimensionalanalysis of different perspectives, strategies, tools, objectives and impacts of localeconomic development and innovation processes. Such a pattern needs to be framedwithin the United Nations 2030 Agenda (TS25) and to reach the SustainableDevelopment Goals (SDGs).
Cities and Regions Towards Transition xi
The sessions have been organised around key elements affecting vertically(multilevel) and horizontally (cross-sectoral and multidisciplinary) the social,economic, institutional, organisational and physical/environmental dimensions oflocal economic development. The themes of sessions followed the key elementsof the debate on a shift in policy design and implementation to drivetransition-oriented structural change of regions. This echoes the EU’s desirablesmart transition that requires an economically prosperous and socially inclusivetransition process to promote regional convergence. Sessions TS04T1, TS04T2,TS04T3 and TS04T4 altogether build up the overall theoretical framework ofsustainable transitional development, offering insight into knowledge complexity,transition management, resilience, diversification and quality of governance toleverage the potentials of peripheral areas and reshape the trajectory of economicgrowth for more equitable development.
To achieve a smart transition, it is critical to reinforce the resilience of regions atdifferent territorial scales, especially those expected to be more affected, to respondto the shocks that green and digital transitions are likely to trigger. In this regard,the Symposium undertook a multifaceted and multidimensional conceptualisationof resilience, for which sessions TS01, TS25 and TS26 investigated territorialsystems resilience, urban resilience and sustainability. Session TS07 looked intosmart and resilient infrastructures, and sessions TS09 and TS23 investigated urbanand built environment with sustainability and resilience. Sessions TS02, TS06,TS10 and TS21 pay close attention to territorial and urban regeneration. Urban andterritorial regeneration are considered as a useful tool to facilitate territorial andurban resilience-building processes by promoting positive physical transformationsand thereby increasing cities’ preparedness and response capacity to crises andshocks. Sustainable urban and territorial regeneration need to define new economicand territorial strategies within a period of financial constraints. Therefore, sessionTS21 casts light on the issue of circular regeneration, while session TS03 conductsa critical review of territorial dynamics and urban growth models.
The value-adding of local assets from the urban–rural perspective offers a chanceto define alternative development patterns. In this respect, cultural heritage, aspotential local assets, needs to be properly leveraged to drive sustainable localdevelopment. The Symposium, therefore, highlighted innovative approaches toheritage management. Session TS19 casted light on the enhancement of culturalheritage in fragile areas; session TS20 presents new management strategies for thevalue-adding of heritage in inner areas; and session TS22 relates heritage man-agement to climate change, exploring integrated conservation strategies based ontraditional and innovative technologies able to help mitigate the negative effects ofclimate change. The Symposium equally gives insight into the urban transitiontowards a post-carbon society, a key element useful for the discussions on the newobjectives of the post-2020 Cohesion Policy and new strategies and tools.Accordingly, session TS23 investigated an ecosystem services approach to theevaluation of settlement transformations; session TS12 was focused on greenbuilding related to post-carbon transition, and session TS30 furthers session TS12and proposed eco-design-based strategies and approaches.
xii Cities and Regions Towards Transition

As in the past editions, this year’s Symposium has received generous supportfrom and will see the participation of a high-quality international network of higheracademic institutions and scientific societies. Therefore, it will undoubtedly serve asan important occasion for exchanging and disseminating research findings andstimulating a fruitful debate on global challenges among academics and policy-makers. All in all, the Symposium and the contributions to its different sessionscontributed to deepening the discussions on a transition-oriented approach—onwhich the TREnD project is grounded—while offering insights into how to fill theexisting gaps.
Carmelina Bevilacqua
Cities and Regions Towards Transition xiii

Organization
Programme Chairs
Carmelina Bevilacqua Mediterranea University of Reggio Calabria, ItalyFrancesco Calabrò Mediterranea University of Reggio Calabria, ItalyLucia Della Spina Mediterranea University of Reggio Calabria, Italy
Scientific CommitteeIbtisam Al Khafaji Al-Esraa University College of Baghdad, IraqShaymaa Fadhìl Jasim
Al KubasiDepartment of Architecture, University of Koya,
IraqChro Ali Hama Radha Sulaimani Polytechnic University, IraqPierre-Alexandre Balland Universiteit Utrecht, NetherlandsAngela Barbanente Politecnico di BariMassimiliano Bencardino Università di SalernoJozsef Benedek RSA: Babes-Bolyai University, RomaniaChrister Bengs SLU/Uppsala Sweden and Aalto/ Helsinki,
FinlandAdriano Bisello EURAC ResearchMario Bolognari Università degli Studi di MessinaKamila Borsekova Matej Bel University, SlovakiaNico Calavita San Diego State University, USARoberto Camagni Politecnico di Milano, Presidente GremiSebastiano Carbonara Università degli Studi “Gabriele d’Annunzio”
Chieti-PescaraFarida Cherbi Institut d’Architecture de TiziOuzou, AlgeriaAntonio Del Pozzo Università degli Studi di Messina—UnimeMaurizio Di Stefano Icomos ItaliaAlan W. Dyer Northeastern University of Boston, USAYakup Egercioglu Izmir Katip Celebi University, Turkey
xv
Khalid El Harrouni Ecole Nationale d’Architecture, Rabat, MoroccoGabriella Esposito De Vita CNR/IRISS Istituto di Ricerca su Innovazione
e Servizi per lo SviluppoFabiana Forte Università degli Studi della Campania “Luigi
Vanvitelli”Rosa Anna Genovese Università degli Studi di Napoli “Federico II”Christina Kakderi Aristotelio Panepistimio Thessalonikis, GreeceOlivia Kyriakidou Athens University of Economics and Business,
GreeceIbrahim Maarouf Alexandria University, Faculty of Engineering,
EgyptLívia M. C. Madureira Centro de Estudos Transdisciplinares para o
Desenvolvimento: CETRAD, PortugalTomasz Malec Istanbul Kemerburgaz University, TurkeyBenedetto Manganelli Università degli Studi della BasilicataGiuliano Marella Università di PadovaNabil Mohäreb Beirut Arab University, Tripoli, LebanonMariangela Monaca Università di MessinaBruno Monardo Università degli Studi di Roma “La Sapienza”Giulio Mondini Politecnico di TorinoPierluigi Morano Politecnico di BariFabio Naselli Epoka UniversityAntonio Nesticò Università degli Studi di SalernoPeter Nijkamp Vrije Universiteit AmsterdamDavy Norris Louisiana Tech University, USAAlessandra Oppio Politecnico di MilanoLeila Oubouzar Institut d’Architecture de TiziOuzou, AlgeriaSokol Pacukaj Aleksander Moisiu University, AlbaniaAurelio Pérez Jiménez University of Malaga, SpainKeith Pezzoli University of California, San Diego, USAMaría José Piñera Mantiñán University of Santiago de Compostela, SpainFabio Pollice Università del SalentoVincenzo Provenzano Università di PalermoAhmed Y. Rashed Founding Director “Farouk ElBaz Centre
for Sustainability and Future StudiesPaolo Rosato Presidente SIEVMichelangelo Russo SIU – Società Italiana degli UrbanistiHelen Salavou Athens University of Economics and Business,
GreeceStefano Stanghellini INU – Istituto Nazionale di UrbanisticaLuisa Sturiale Università di CataniaFerdinando Trapani Università degli Studi di PalermoRobert Triest Northeastern University of Boston, USAClaudia Trillo University of Salford, UKGregory Wassall Northeastern University of Boston, USA
xvi Organization

Internal Scientific BoardGiuseppe Barbaro Mediterranea University of Reggio CalabriaConcetta Fallanca Mediterranea University of Reggio CalabriaGiuseppe Fera Mediterranea University of Reggio CalabriaMassimiliano Ferrara Mediterranea University of Reggio CalabriaGiovanni Leonardi Mediterranea University of Reggio CalabriaTommaso Manfredi Mediterranea University of Reggio CalabriaDomenico E. Massimo Mediterranea University of Reggio CalabriaCarlo Morabito Mediterranea University of Reggio CalabriaDomenico Nicolò Mediterranea University of Reggio CalabriaAdolfo Santini Mediterranea University of Reggio CalabriaSimonetta Valtieri Mediterranea University of Reggio CalabriaSanto Marcello Zimbone Mediterranea University of Reggio Calabria
Scientific Partnership
Regional Studies Association, Seaford, East Sussex, UKAl-Esraa University Baghdad, IraqEurac Research, Bozen, ItalyIcomos Italia, Rome, ItalyINU—Istituto Nazionale di Urbanistica, Rome, ItalySocietà Italiana degli Urbanisti, Milan, ItalySocietà Geografica Italiana, Rome, ItalySIEV—Società Italiana di Estimo e Valutazione, Rome, Italy
Organising Committee
ASTRI Associazione Scientifica Territorio e Ricerca InterdisciplinareURBAN LAB S.r.l.
This Symposium is part of a project that has received funding from the EuropeanUnion’s Horizon 2020 research and innovation programme under grant agreementNº823952.
Organization xvii

Contents
Smart Specialisation Strategy (S3) and Social Network Analysis(SNA): Mapping Capabilities in Calabria . . . . . . . . . . . . . . . . . . . . . . . . 1Arnault Morisson, Carmelina Bevilacqua, and Mathieu Doussineau
Identifying Localized Entrepreneurial Projects Through SemanticSocial Network Analysis . . . . . . . . . . . . . . . . . . . . . . . . . . . . . . . . . . . . . 12Maria Patrizia Vittoria and Pasquale Napolitano
Smart Specialisation Priorities of Less Developed Regions.A Critical Evaluation . . . . . . . . . . . . . . . . . . . . . . . . . . . . . . . . . . . . . . . 22Petra Szávics and József Benedek
Sustainable Development and Transition Management:A New Approach for European Peripheral Areas . . . . . . . . . . . . . . . . . 37Vincenzo Provenzano, Maria Rosaria Seminara, and Massimo Arnone
Contextualizing Transition: A Multiscale Approach to MakingResilience-Oriented and Place-Sensitive Strategies . . . . . . . . . . . . . . . . . 47Carmelina Bevilacqua, Yapeng Ou, Pasquale Pizzimenti,and Giada Anversa
Smart Specialisation 2.0: Driving Public Funds Towards Platformsand Ecosystems . . . . . . . . . . . . . . . . . . . . . . . . . . . . . . . . . . . . . . . . . . . 68Christina Kakderi, Nicos Komninos, Anastasia Panori,and Artemis Psaltoglou
Industrial Policies and Evolutionary Paths: A Case Studyof the Impact of the Greek Investment Law to Effect InvestmentDecisions of Greek Firms . . . . . . . . . . . . . . . . . . . . . . . . . . . . . . . . . . . . 80Athanasios Kalogeresis
Exploring Territorial Imbalances: A Systematic Literature Reviewof Meanings and Terms . . . . . . . . . . . . . . . . . . . . . . . . . . . . . . . . . . . . . 90Stefania Oppido, Stefania Ragozino, and Gabriella Esposito De Vita
xix
Toward Nature-Based Solutions (NBS) Approach in IntegratedSegment Reporting of Placed-Based Organizations . . . . . . . . . . . . . . . . 101Maria-Gabriella Baldarelli and Domenico Nicolò
Making a Step Forward Towards Urban Resilience.The Contribution of Digital Innovation . . . . . . . . . . . . . . . . . . . . . . . . . 113Carlo Vermiglio, Hiroko Kudo, and Vincenzo Zarone
Evaluating the Priorities of the Calabria’s Coast FLAGs for theImprovement of the Quality of Life of the Fisheries Communities . . . . . 124Alba Distaso, Giuseppa Romeo, and Claudio Marcianò
Socio-Economic Impacts of the Common Fisheries Policy on Southand Central Tyrrhenian Sea (GSA 10) Demersal Trawl Fisheries . . . . . 143Rosaria Felicita Sabatella, Paolo Accadia, Maria Cozzolino,Monica Gambino, Loretta Malvarosa, and Evelina Carmen Sabatella
Financial Targets for the Sponsee and the Sponsor in the Restoration/Recovery of the Historical and Architectural Heritage . . . . . . . . . . . . . . 155Luigi Dolores, Maria Macchiaroli, and Gianluigi De Mare
Reaching Sustainability in Healthcare: Strategies for a Healthy IndoorAir Quality in Healing Environments . . . . . . . . . . . . . . . . . . . . . . . . . . . 166Marco Gola, Gaetano Settimo, and Stefano Capolongo
Built Environment and Alzheimer. Quality Evaluation of TerritorialStructures for Patients with Dementia . . . . . . . . . . . . . . . . . . . . . . . . . . 178Andrea Brambilla, Roberto Maino, Silvia Mangili,and Stefano Capolongo
Transforming the Built Environment ThroughHealthy-Design Strategies . . . . . . . . . . . . . . . . . . . . . . . . . . . . . . . . . . . . 187Maddalena Buffoli, Andrea Rebecchi, Marta Dell’Ovo, Alessandra Oppio,and Stefano Capolongo
Assessing the Effectiveness of Public Investments in Cultural BuiltHeritage: The Case of the Umbertine Forts System in Italy . . . . . . . . . . 197Giuseppina Cassalia, Veronica Calvieri, Immacolata Lorè,and Francesco Calabrò
Enhancing Heritage and Traditional Architecture ConservationThrough Digital Technologies. Developing a Digital ConservationHandbook for As-Salt, Jordan . . . . . . . . . . . . . . . . . . . . . . . . . . . . . . . . 211Claudia Trillo, Rania Aburamadan, Chika Udeaja, Athena Moustaka,Kwasi Gyau Baffour, and Busisiwe Chikomborero Ncube Makore
Facility Management Services in Smart Cities:Trends and Perspectives . . . . . . . . . . . . . . . . . . . . . . . . . . . . . . . . . . . . . 220Nazly Atta and Cinzia Talamo
xx Contents
Evolution and Transformation of Real Estate Dynamicsin the City of Milan . . . . . . . . . . . . . . . . . . . . . . . . . . . . . . . . . . . . . . . . 231Liala Baiardi and Andrea Ciaramella
Proactive Maintenance Strategy Based on Resilience Empowermentfor Complex Buildings . . . . . . . . . . . . . . . . . . . . . . . . . . . . . . . . . . . . . . 239Francesco Rota, Maria Cinzia Luisa Talamo, and Giancarlo Paganin
An Integrated Decision Support System to Define the Best Scenariofor the Adaptive Sustainable Re-Use of Cultural Heritagein Southern Italy . . . . . . . . . . . . . . . . . . . . . . . . . . . . . . . . . . . . . . . . . . 251Lucia Della Spina, Claudia Giorno, and Ruggiero Galati Casmiro
Middle Lands in Friuli Venezia Giulia. Research by Designand Towards Action . . . . . . . . . . . . . . . . . . . . . . . . . . . . . . . . . . . . . . . . 268Elena Marchigiani
Author Index . . . . . . . . . . . . . . . . . . . . . . . . . . . . . . . . . . . . . . . . . . . . . . . . 281
Contents xxi
Smart Specialisation Strategy (S3) and SocialNetwork Analysis (SNA): Mapping
Capabilities in Calabria
Arnault Morisson1,2(&) , Carmelina Bevilacqua1 ,and Mathieu Doussineau3
1 Mediterranean University of Reggio Calabria, Reggio Calabria, [email protected]
2 Utrecht University, Utrecht, The Netherlands3 European Commission, Joint Research Centre Seville, Seville, Spain
Abstract. The concept of smart specialization strategy (S3) requires regions tohave an extended knowledge of their institutional contexts in order for policy-makers to design the most adapted place-based innovation policies. In thecontext of the next programming period of EU Cohesion Policy 2021–2027, thispaper explores the use of social network analysis (SNA) in mapping regionalcapabilities in Calabria. Using the CORDIS database, the paper finds that SNAcan inform policymakers on key aspects of the enabling conditions for smartspecialization such as governance, the entrepreneurial discovery process (EDP),priority setting, and interregional collaboration.
Keywords: Entrepreneurial discovery process � Interregional collaboration �Peripheral region � Horizon 2020 � Governance
1 Introduction
In the European Union (EU), the future programming period of EU Cohesion Policy2021–2027 dedicates a substantial share of its budget to promoting a Smarter Europethrough, notably, the confirmation of the Smart Specialisation Strategy concept (S3)after a first experiment during the 2014–2020 programming period [1]. S3 is a policyconcept to support regional prioritization in innovative sectors, fields or technologiesthrough the entrepreneurial discovery process (EDP), a bottom-up approach to revealwhat a region does best in terms of its scientific and technological endowments [2].
In the S3 implementation, the European Commission (EC) and the EuropeanParliament have pushed for synergies across EU funding, namely between the Euro-pean Structural and Investment Funds (ESIF) and Horizon 2020 [3]. In the next pro-gramming period 2021–2027, synergies across EU funding are even more crucial tomaximize investments in research and innovation at the regional scale.
Many regions have faced difficulties in designing and implementing their S3 in theprogramming period 2014–2020, most notably related to S3 governance, monitoring,
© The Author(s) 2020C. Bevilacqua et al. (Eds.): NMP 2020, SIST 177, pp. 1–11, 2020.https://doi.org/10.1007/978-3-030-52869-0_1
and the entrepreneurial discovery process [4]. For the new programming period 2021–2027, the EC has requested national and regional authorities to update their S3 andrespond to seven ‘enabling conditions’ under the new Cohesion Policy [5]. TheEuropean Commission encourages regions to use evidence-based approaches combinedwith a wide involvement of stakeholders coming from the quadruple helix—privatesector, public institutions, universities, and civil society—to update their S3. Triplehelix models of innovation involving the private sector, public institutions, and uni-versities and increasingly quintuple models of innovation that incorporate the triplehelix, civil society, and the environment are frequently used in S3 [6]. Depending onwhat helix is most appropriate at the regional institutional level to address regionalchallenges and priorities, regions must adopt an entrepreneurial discovery process(EDP), which is a bottom-up process involving a wide range of stakeholders to defineregional actions and to identify regional technological opportunities.
S3 requires regions to have a comprehensive knowledge of their institutionalcontexts to design the most adapted place-based innovation policies [7]. This mappingexercise of scientific and technological capabilities is, however, often lacking. Insouthern Italy for instance, most southern Italian regions selected high-tech speciali-sation areas despite having little capacities in scientific and technological capacities [8].The evolutionary economic geography (EEG) and regional innovation system(RIS) literatures have introduced tools to help policymakers to design innovationpolicies that are tailored to their regional institutional contexts. The RIS literatureprovides conceptual frameworks depending on the type of regions to support newindustrial path development [9, 10]. In EEG, the concept of economic relatedness offersa robust tool for regions to prioritise and select the most relevant regional sectors [11].
The JRC S3 platform and H2020 project ‘S3 Online’ have listed tools to supportregional policymakers in drafting and updating their S3. Some examples of quantitativetools are related variety analysis, extroversion analysis, and so on. Some examples ofqualitative tools are SWOT analysis, benchmarking, foresight exercises, regional assetsmapping, and so on. Social network analysis (SNA) is, however, not highlighted as arelevant policy tool for S3.
This paper explores the use of SNA in mapping regional capabilities in Calabriaand its potential application for regional policymakers in the context of updating theirS3 for the next programming period 2021–2027. The research question that this paperaims to answer is: how SNA could be used to map regional scientific capabilities andinterregional collaboration opportunities to support the S3? The authors selected Cal-abria as it is a peripheral region in South Italy. In the regional innovation scoreboard,the region is defined as moderate- and is ranked 203 out of 238 regions in Europe [12].Calabria has a gross domestic product (GDP) PPS per capita of €17,400 in 2017,compared with €28,900 in Italy and €30,000 in the European Union [13]. For theprogramming period 2014–2020, Calabria selected to prioritize for its S3 the followingsectors: sustainable construction, healthy living care services and products (life sci-ences), reducing environmental impacts and harm from natural hazards, ICTs and new
2 A. Morisson et al.

technologies for tourism and cultural industries, developing the ICTs and innovativeservices sectors, providing healthy and safe food (agri-food), technologies for logistics,and advanced technologies and solutions for manufacturing [14].
The data come from the CORDIS database, which compiled data on all EU researchprojects under Horizon 2020 (2014–2020) [15]. H2020 research projects are used as aproxy to map regional scientific capabilities to be mobilized in the S3. However, thisapproach has limitations since it only maps regional scientific capabilities in H2020research projects. The Calabria Region participated in 51 H2020 research projects thathave involved a total of 578 unique organizations. The paper finds that SNA can informpolicymakers on key aspects of the enabling conditions for smart specialization such asgovernance, the entrepreneurial discovery process (EDP), priority setting, and inter-regional collaboration.
2 Methodology
This paper explores the use of social network analysis in mapping regional capabilitiesin Calabria and its potential application for regional policymakers in the context ofupdating their S3 for the next programming period 2021–2027. Social network analysis(SNA) is a research tool that has frequently been used to study European FrameworkPrograms [16]. SNA is the study of the collection, management, analysis, interpreta-tion, and presentation of relational data to analyze entire social structures (completenetworks) or local networks (ego-centered networks) [17]. Our social network includesnodes (organizations or projects) and ties (interactions between the nodes) that connectthem.
To build our networks, we use data coming from the CORDIS database, whichcompiled data on all EU research projects under Horizon 2020 (2014–2020) [15].The CORDIS database of Horizon 2020 research projects offers many advantages forresearch purposes as it is well-structured and standardized. Moreover, Horizon 2020 isthe biggest EU Research and Innovation program ever with nearly €80 billion offunding available over 7 years from 2014 to 2020 [18]. Other collaborative programsdatabase could be used to map regional capabilities, such as EUREKA, Knowledge andInnovative Communities (KICs), or INTERREG. We only use the H2020 projects inwhich at least one organization from the Calabria region is present as a participant orcoordinator. We consider the co-participation in the same H2020 projects as a tiewithin our network. We postulate that within the same H2020 project the organizationsparticipating in the project are connected with one another. In total, 26 unique orga-nizations from the Calabria region have participated in 51 different H2020 researchprojects, which involved a total of 578 unique organizations with 7438 ties.
Horizon 2020 research projects are used as a proxy to map regional scientificcapabilities to be mobilized in the S3. To get funded, Horizon 2020 research projectsare selected on a competitive basis. We thus assume that H2020 research projects
S3 and SNA: Mapping Capabilities in Calabria 3
represent the most competitive scientific knowledge in a region. However, thisapproach has limitations since it only maps regional scientific capabilities in H2020research projects. To reduce these limitations, regional and national collaborativeresearch projects and projects funded under thematic objective 1 “Research andInnovation” of the Calabria Operational Program 2014–2020 could be included in theSNA.
The authors use R and different packages such as igraph, sna, EconGeo, ggplot2…to graph the network and to calculate different network centrality measures such asdegree centrality (number of edges per node), betweenness centrality (nodes bridgingposition between other nodes), closeness centrality (distance between nodes), andeigenvector centrality (nodes connected to highly connected nodes) [19]. In our net-works, betweenness centrality is particularly useful to identify the actors or projectsacting as brokers or gatekeeper between actors or projects. Networks are built for theH2020 research projects and for the organizations participating in the H2020 researchprojects. The networks are undirected and not weighted.
3 Findings
3.1 H2020 Research Projects Network in Calabria
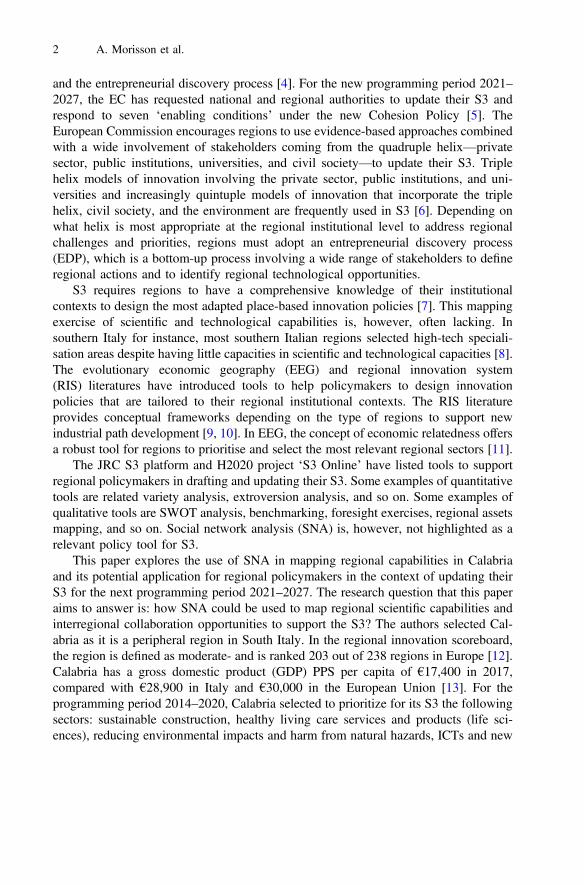
In looking at H2020 research projects, SNA can inform on the links between projects,their centralities in the network, and the type of competitive research programs in theregion. Networks in Fig. 1 represent the network of H2020 research projects thatinvolve at least a Calabrian organization. The types of programs are coded according toCORDA Data Dictionary [20]. The sizes of the nodes in the network on the leftrepresent the research project total cost while the sizes of the nodes in the network onthe right represent the projects’ betweenness centrality score showing the projectsacting as bridges among actors in the network. The network shows a large presence ofprograms related to research, namely Future and Emerging Technologies (FET) andMarie-Curie Sklodowska Actions. Compared to the priorities selected for its S3,Calabria has H2020 research projects related to climate actions, food and agriculture,and ICT that have high betweenness centrality scores and high budget confirming theirrelevance of the S3 priorities, namely TARANTO, E-SHAPE, or ERA-PLANET. TheH2020 research project SuperScienceMe, a project to promote research and science, iscoordinated by the University of Calabria and has the highest betweenness centralityscore.
The implications for S3 of this network are to confirm the strategic regionalimportance of the S3 priorities, to highlight scientific capabilities in specific domains,and to underline central research projects.
4 A. Morisson et al.

3.2 Organizations in H2020 Research Projects Network in Calabria
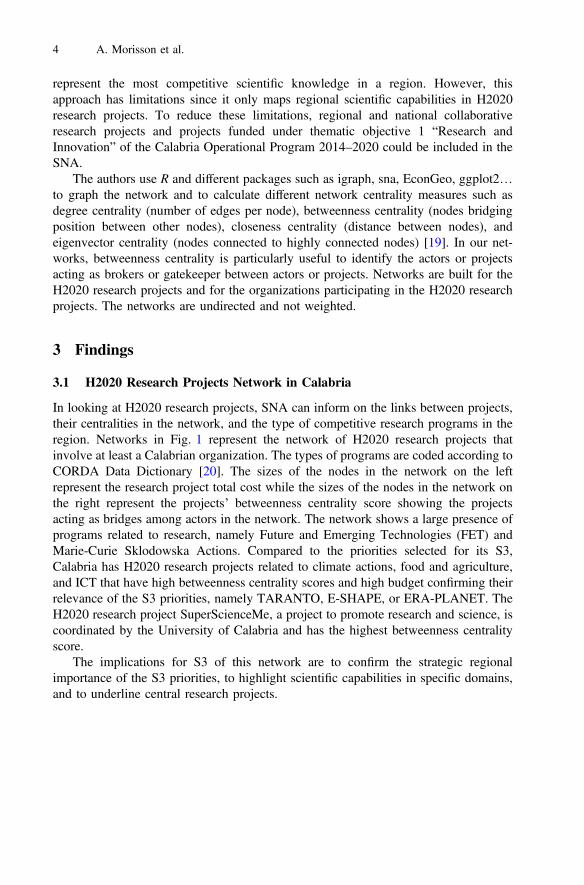
In looking at organizations participating in H2020 research projects, SNA can informon the links between organizations depending on different parameters such as locationsor activities, their centralities in the network, and their positions in the network.Figure 2 represents the unique organizations that have participated in a H2020 researchproject in which a Calabrian organization is also present. The size of the node repre-sents the betweenness centrality score, which allows to identify the organizations thatmight act as brokers or gatekeepers among different organizations in different researchprojects. As a result, the network underlines the key organizations in the network. Itshows that Calabrian organizations are not well connected in the network with theexception of the University of Calabria, the Calabria Regional Council, the Mediter-ranean University of Reggio Calabria, and Bioage SRL. Many Italian organizations arewell-connected with one another but not with the rest of the network. There is a largenumber of higher or secondary education establishments (HES) in the network.
Energy
Food
H ealth
IC T
Inclusiv eness
R esearch
Science f
Secur ity
Space
T Y P E O F P R O G R A M
A dvanced M ate r ia ls
C lim a te
E nergy
Food
H ea lth
IC T
Inc lus iv eness
R esearch
S c ience fo r S oc ie ty
S ecur ity
S pace
S uppor ts to S M E s
C O O R D IN ATO R
C oord ina to r
Par tic ipan tProject’s Betweenness Centrality
(Node Size)Project’s Total Cost
(Node Size)
TARANTOERA-PLANET
PPILOW
SuperScienceMe
M-ERA.NET 2
E-SHAPE
Fig. 1. Networks of H2020 projects in Calabria with their total costs (left) and betweennesscentrality (right). Source: own design.
S3 and SNA: Mapping Capabilities in Calabria 5
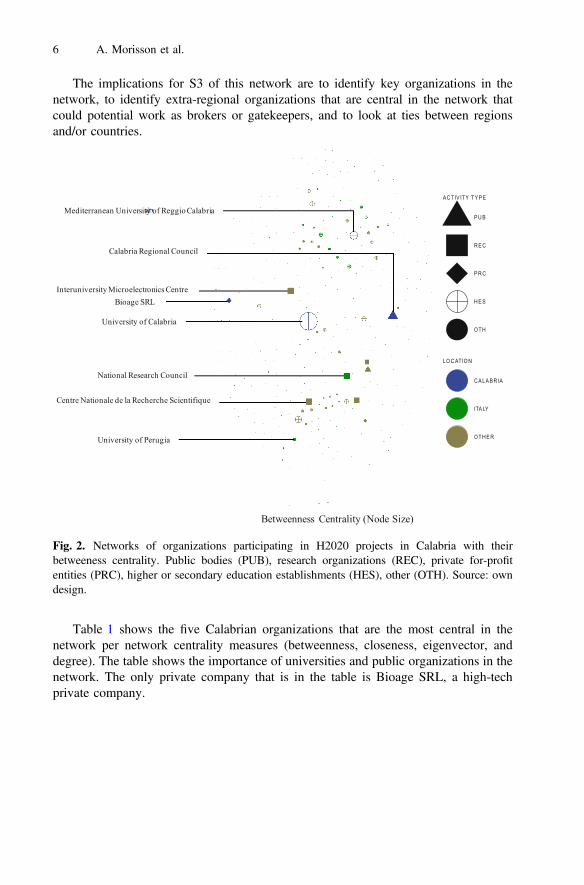
The implications for S3 of this network are to identify key organizations in thenetwork, to identify extra-regional organizations that are central in the network thatcould potential work as brokers or gatekeepers, and to look at ties between regionsand/or countries.
Table 1 shows the five Calabrian organizations that are the most central in thenetwork per network centrality measures (betweenness, closeness, eigenvector, anddegree). The table shows the importance of universities and public organizations in thenetwork. The only private company that is in the table is Bioage SRL, a high-techprivate company.
AC TIV ITY TYPE
PU B
R EC
PR C
H ES
OTH
LO C ATIO N
C ALABR IA
ITALY
OTH ER
AC T IV IT Y T Y P E
P U B
R E C
P R C
H E S
OT H
LO C AT IO N
C A LA B R IA
ITA LY
OT H E R
Betweenness Centrality (Node Size)
Calabria Regional Council
Mediterranean University of Reggio Calabria
University of Calabria
National Research Council
University of Perugia
Centre Nationale de la Recherche Scientifique
Bioage SRLInteruniversity Microelectronics Centre
Fig. 2. Networks of organizations participating in H2020 projects in Calabria with theirbetweeness centrality. Public bodies (PUB), research organizations (REC), private for-profitentities (PRC), higher or secondary education establishments (HES), other (OTH). Source: owndesign.
6 A. Morisson et al.
The implications for S3 of these network centrality measures are to identify themost central organizations in the network. In Calabria, the University of Calabria, theCalabria Regional Council, and the Mediterranean University of Reggio Calabria arethe most central organizations. The network centrality measures facilitate the selectionof key organizations that must be involved in the entrepreneurial discovery process(EDP).
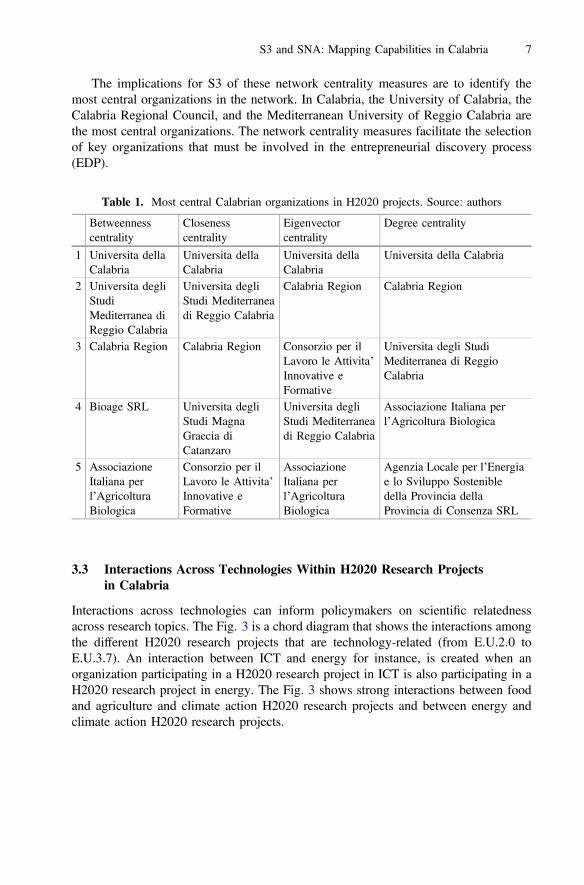
3.3 Interactions Across Technologies Within H2020 Research Projectsin Calabria
Interactions across technologies can inform policymakers on scientific relatednessacross research topics. The Fig. 3 is a chord diagram that shows the interactions amongthe different H2020 research projects that are technology-related (from E.U.2.0 toE.U.3.7). An interaction between ICT and energy for instance, is created when anorganization participating in a H2020 research project in ICT is also participating in aH2020 research project in energy. The Fig. 3 shows strong interactions between foodand agriculture and climate action H2020 research projects and between energy andclimate action H2020 research projects.
Table 1. Most central Calabrian organizations in H2020 projects. Source: authors
Betweennesscentrality
Closenesscentrality
Eigenvectorcentrality
Degree centrality
1 Universita dellaCalabria
Universita dellaCalabria
Universita dellaCalabria
Universita della Calabria
2 Universita degliStudiMediterranea diReggio Calabria
Universita degliStudi Mediterraneadi Reggio Calabria
Calabria Region Calabria Region
3 Calabria Region Calabria Region Consorzio per ilLavoro le Attivita’Innovative eFormative
Universita degli StudiMediterranea di ReggioCalabria
4 Bioage SRL Universita degliStudi MagnaGraecia diCatanzaro
Universita degliStudi Mediterraneadi Reggio Calabria
Associazione Italiana perl’Agricoltura Biologica
5 AssociazioneItaliana perl’AgricolturaBiologica
Consorzio per ilLavoro le Attivita’Innovative eFormative
AssociazioneItaliana perl’AgricolturaBiologica
Agenzia Locale per l’Energiae lo Sviluppo Sostenibledella Provincia dellaProvincia di Consenza SRL
S3 and SNA: Mapping Capabilities in Calabria 7
The implications for S3 of this chord diagram are to identify the connectionsbetween the technologies and also to support the prioritization process.
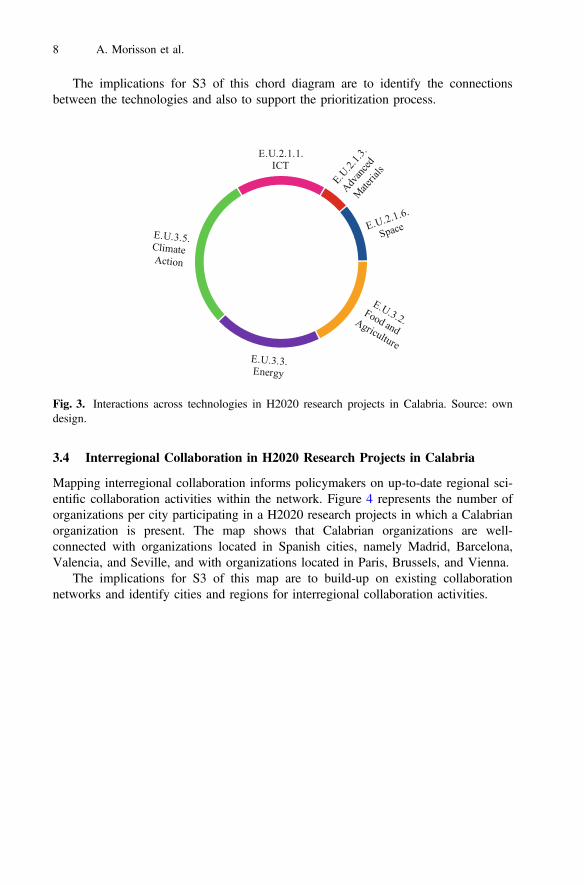
3.4 Interregional Collaboration in H2020 Research Projects in Calabria
Mapping interregional collaboration informs policymakers on up-to-date regional sci-entific collaboration activities within the network. Figure 4 represents the number oforganizations per city participating in a H2020 research projects in which a Calabrianorganization is present. The map shows that Calabrian organizations are well-connected with organizations located in Spanish cities, namely Madrid, Barcelona,Valencia, and Seville, and with organizations located in Paris, Brussels, and Vienna.
The implications for S3 of this map are to build-up on existing collaborationnetworks and identify cities and regions for interregional collaboration activities.
Food and Agr iculture
Energy
C lim ate Action
ICT
Advanc
ed Mater
ials
Space
E.U.2.1.1.ICT
Fig. 3. Interactions across technologies in H2020 research projects in Calabria. Source: owndesign.
8 A. Morisson et al.

4 Discussion and Conclusions
Using CORDIS open database of H2020 research projects, social network analysis(SNA) offers some insights for updating smart specialisation strategy (S3) for the nextprogramming period 2021–2027. For priority setting, it helps mapping existing sci-entific capabilities in H2020 research projects. Indeed, it can show strengths in sci-entific capacities such as in climate actions, food and agriculture, and ICT in the case ofCalabria. For governance and the entrepreneurial discovery process (EDP), SNAsupports the identification of key and well-connected organizations in the network aswell as those working as bridges in the network. The identified organizations must playa role in the governance and in the EDP such as piloting working groups on prioritisedsectors. The identification of actors is an important action to build an effective EDP,qualitative concepts embedded in places must rally actors together towards a commonvision for the future [21]. For the interregional dimension, centrality network measurescan support the identification of key and well-connected extra-regional organizations.Finally, a map can be produced to highlight existing collaboration and create interre-gional collaboration activities according to existing collaboration networks.
In Calabria, the network is characterized by the central role of public organizationsand universities in the network and a weaker role of private companies. The SNAconfirms the weak role of private actors in the RIS of peripheral regions [9]. Onepotential path to strengthen the network is to always involve a private company with a
Fig. 4. Number of organizations outside of Italy collaborating with Calabrian organization inH2020 projects. Source: own design.
S3 and SNA: Mapping Capabilities in Calabria 9
university in H2020 research projects thus allowing private companies to have accessthrough a better connected actor, such as the University of Calabria or MediterraneanUniversity of Reggio Calabria, to a larger number of ties in the network. Futureresearch could use SNA for H2020 research projects and other collaborative researchprojects in different institutional contexts.
Acknowledgments. This research is part of the TREnD project (Transition with Resilience forEvolutionary Development), which has received funding from the European Union’s Horizon2020 research and innovation program under the Marie Skłodowska-Curie grant agreementNo. 823952.
References
1. European Commission, New Cohesion Policy, http://ec.europa.eu/regional_policy/en/2021_2027/. Accessed 19 Dec 2019
2. Foray, D., David, P., Hall, B.H.: Smart Specialisation – The Concept. KnowledgeEconomists. Policy Brief Number 9, June. European Commission, DG research, Brussels(2009)
3. Doussineau, M., Arregui-Pabollet, E., Harrap, N., Merida, F.: Stairway to Excellence:Drawing Funding and Financing Scenarios for Effective Implementation of SmartSpecialisation Strategies. Joint Research Centre, Seville (2018)
4. Guzzo, F., Gianelle, C., Marinelli, E.: Smart Specialisation at Work: The Policy Makers’View on Strategy Design and Implementation. Joint Research Centre, Seville (2018)
5. European Commission: Regulation of the European Parliament and of the Council. EuropeanCommission, Brussels (2019)
6. Carayannis, E.G., Rakhmatullin, R.: The quadruple/quintuple innovation helixes and smartspecialisation strategies for sustainable and inclusive growth in Europe and beyond.J. Knowl. Econ. 5(2), 212–239 (2014)
7. Morisson, A., Doussineau, M.: Regional innovation governance and place-based policies:design, implementation and implications. Reg. Stud. Reg. Sci. 6(1), 101–116 (2019)
8. Caramis, A., Lucianetti, L.F.: Scoperta imprenditoriale e strategie di specializzazioneintelligente: dalla teoria alla pratica. Sci. Reg. – Ital. J. Reg. Sci. 15(3), 67–84 (2016)
9. Trippl, M., Zukauskaite, E., Healy, A.: Shaping smart specialization: the role of place-specific factors in advanced, intermediate and less-developed European regions. Reg. Stud.,1–13 (2019)
10. Asheim, B.T.: Smart specialisation, innovation policy and regional innovation systems: whatabout new path development in less innovative regions? Innov. Eur. J. Soc. Sci. Res. 32(1),8–25 (2019)
11. Balland, P.A., Boschma, R., Crespo, J., Rigby, D.L.: Smart specialization policy in theEuropean Union: relatedness, knowledge complexity and regional diversification. Reg. Stud.53(9), 1252–1268 (2019)
12. European Commission: Regional Innovation Scoreboard 2019. Publications Office of theEuropean Union, Luxembourg (2019)
13. Eurostat, Regional GDP https://ec.europa.eu/eurostat/news/themes-in-the-spotlight/regional-gdp. Accessed 04 Jan 2020
14. S3 Platform, Calabria. https://s3platform.jrc.ec.europa.eu/regions/ITF6/tags/ITF6. Accessed03 Jan 2020
10 A. Morisson et al.
15. European Commission, What is Horizon 2020? https://ec.europa.eu/programmes/horizon2020/en/what-horizon-2020. Accessed 15 Jan 2020
16. EU open Data portal, CORDIS-EU research projects under Horizon 2020 (2014-2020).https://data.europa.eu/euodp/en/data/dataset/cordisH2020projects. Accessed 04 Jan 2020
17. European Commission. Study on Network Analysis of the 7th Framework ProgrammeParticipation. Publications Office of the European Union, Luxembourg (2019)
18. Brandes, U., Robins, G., McCranie, A., Wasserman, S.: What is network science? Netw. Sci.1(1), 1–15 (2013)
19. Freeman, L.C., Roeder, D., Mulholland, R.R.: Centrality in social networks: II. Experimentalresults. Soc. Netw. 2(2), 119–141 (1979)
20. CORDA data dictionary, H2020 standard definition. https://data.europa.eu/euodp/en/data/dataset/cordisH2020projects. Accessed 04 Jan 2020
21. Advancing Place-Based Regional Innovation Policies. In: González-López, M., Asheim, B.T. (eds.) Regions and Innovation Policies in Europe; Learning from the Margins.Cheltenham: Edward Elgar (forthcoming)
Open Access This chapter is licensed under the terms of the Creative Commons Attribution 4.0International License (http://creativecommons.org/licenses/by/4.0/), which permits use, sharing,adaptation, distribution and reproduction in any medium or format, as long as you give appro-priate credit to the original author(s) and the source, provide a link to the Creative Commonslicense and indicate if changes were made.The images or other third party material in this chapter are included in the chapter’s Creative
Commons license, unless indicated otherwise in a credit line to the material. If material is notincluded in the chapter’s Creative Commons license and your intended use is not permitted bystatutory regulation or exceeds the permitted use, you will need to obtain permission directlyfrom the copyright holder.
S3 and SNA: Mapping Capabilities in Calabria 11
Identifying Localized Entrepreneurial ProjectsThrough Semantic Social Network Analysis
Maria Patrizia Vittoria(&) and Pasquale Napolitano
IRISS/CNR, Naples, [email protected]
Abstract. We propose a novel set of social network analysis, firm level andcommunication-based algorithms for mining the web to identify emergingentrepreneurial projects. These algorithms are implemented in a hybrid theo-retical framework and tested in an on-line environment. The algorithms takeaccount of entrepreneurship as the relational capability for innovation andlearning, the central role of computer-mediated communication, the constructionof ‘dynamic’ semantic networks, and the temporal computation of networkcentrality measures. The temporal calculation of betweenness of concepts allowsus to extract and predict long-term trends for entrepreneurial projects. Weillustrate our approach by considering the nodes in a network (based on ourprevious empirical analysis) as localized potential entrepreneurs in the culturaland creative context, and the inherent Instagram community, and analyzing thesemantic networks emerging from sharing hashtags.
Keywords: Entrepreneurial project � Social media � Semantic social networkanalysis
JEL Codes: R11 � R15 � R58
1 Introduction
Claiming for renewed interpretation of local resource, the present paper suggests anovel set of social network analysis, firm level and communication-based algorithmsfor mining the web to identify emerging entrepreneurial projects. Based on a con-structivist approach in social science, which seems knowledge as socially constructed,Berger and Luckmann (1969) suggest that the cognitive processes linked to entrepre-neurial activities feature prominently in theories of opportunity recognition (Kirzner1979; Beattie 1999). From this perspective, entrepreneurship can be considered asocially constructed phenomenon, which is reflected by the emergence of opportunities.These opportunities arise as individuals make sense of information and their actionsand retrospectively ‘discover’ and ‘recognize’ business ideas (Gartner et al. 2003).Thus, entrepreneurship takes place in an ‘enacted’ environment (Weick 1995).
Compared to several other qualitative research methodologies, discourse analysis ismore strongly based on social constructivist paradigm (Phillips and Hardy 2002). Asknown, it requires some contextualization (Cicourel 1981; Fairclough 1995); texts arethe material manifestation of discourse but discourse exists beyond the individual texts
© The Author(s) 2020C. Bevilacqua et al. (Eds.): NMP 2020, SIST 177, pp. 12–21, 2020.https://doi.org/10.1007/978-3-030-52869-0_2
that comprise them (Chalaby 1996; Phillips and Hardy 2002). Also, a discourse cannotbe identified on the basis of a single text; rather discourse emerges from the interactionsamong different social groups, their ‘texts’, and the context in which these interactionsare embedded. In the case of entrepreneurship research, the context is both proximateand distal, indicating the systemic (economic) and substantive (political and cultural)embeddedness of entrepreneurship (Johannisson et al. 2002) which is reflected in theoverall institutional setting, norms, and values, and the entrepreneur’s political andsocial environment. Linking this to notions of context as discussed in discourseanalysis, the proximate context and the distal context will reflect the entrepreneur’srespective micro- and macro-environments (Achtenhagen and Welter 2007).
Based on selected social theories and semantic social network analysis (as a specifictype of discourse analysis), we draw on the highly interconnected world of socialnetworking platforms (Instagram1) to conduct an empirical exploration of a localizedentrepreneurial project. We select a localized group of nodes (entrepreneurs) andvisualize their Instagram community. Network centrality measures contribute toexplaining the role of specific nodes-concepts-business ideas within the discourse.
The paper is structured as follows: Sect. 2 discusses the notion of entrepreneurship,Sect. 3 defines semantic social network analysis (SNA), Sect. 4 provides a synthesis ofthe empirical survey, Sect. 5 gives the main evidences, and Sect. 6 concludes thepaper.
2 The Localized Entrepreneur and Social Media
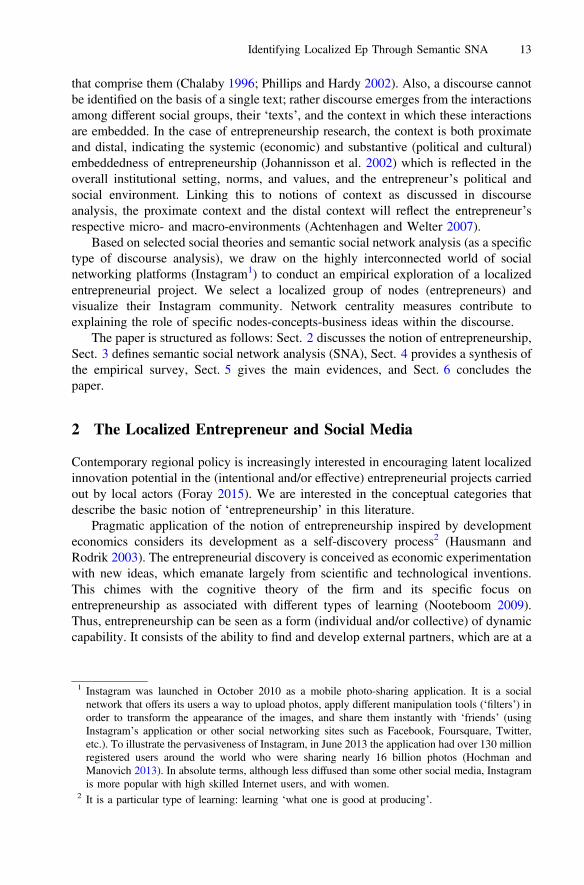
Contemporary regional policy is increasingly interested in encouraging latent localizedinnovation potential in the (intentional and/or effective) entrepreneurial projects carriedout by local actors (Foray 2015). We are interested in the conceptual categories thatdescribe the basic notion of ‘entrepreneurship’ in this literature.
Pragmatic application of the notion of entrepreneurship inspired by developmenteconomics considers its development as a self-discovery process2 (Hausmann andRodrik 2003). The entrepreneurial discovery is conceived as economic experimentationwith new ideas, which emanate largely from scientific and technological inventions.This chimes with the cognitive theory of the firm and its specific focus onentrepreneurship as associated with different types of learning (Nooteboom 2009).Thus, entrepreneurship can be seen as a form (individual and/or collective) of dynamiccapability. It consists of the ability to find and develop external partners, which are at a
1 Instagram was launched in October 2010 as a mobile photo-sharing application. It is a socialnetwork that offers its users a way to upload photos, apply different manipulation tools (‘filters’) inorder to transform the appearance of the images, and share them instantly with ‘friends’ (usingInstagram’s application or other social networking sites such as Facebook, Foursquare, Twitter,etc.). To illustrate the pervasiveness of Instagram, in June 2013 the application had over 130 millionregistered users around the world who were sharing nearly 16 billion photos (Hochman andManovich 2013). In absolute terms, although less diffused than some other social media, Instagramis more popular with high skilled Internet users, and with women.
2 It is a particular type of learning: learning ‘what one is good at producing’.
Identifying Localized Ep Through Semantic SNA 13
distance3, and the intellectual and behavioral capability to collaborate across this dis-tance. It takes account of both competence and governance issues (Nooteboom 2009).
It is a fact that the new opportunities from participation in open-source com-munities and social networking platforms are contributing to a more complex notion ofthe entrepreneur. We are interested in the effects of textual meta-data matrices withinthe communication on social networks, in particular Instagram, and how these lin-guistic signs - verbal language fragments in a social platform strictly visual based - canexpress meaning for research especially from the perspective of the relational dimen-sion of the focal network.
The approach to language introduced by Austin (1962) with his definition ofperformative utterance, suggests that language should no longer be considered adescriptive tool related to a state of affairs but should be understood as an act ofcreation - “performative” - of the real. Evoking the categories of thought throughlanguage is to create meaning, in the case of hashtags, commentary and descriptiontextual meta-data of the visual products issued by the users of the social. For each userit means building an individual identity, an individual biography. These individualbiographies mediated by social-media when if shared, evolve into a value that is a morecomplex system which transcends the individual dimension of the individual user andis shared by multiple users4.
The novelty here is that, in the utterance, the individual is performing an action ofwhich the very act of uttering the sentence is an essential component. We propose tointroduce performative utterance in an assessment of a corporate network empirically.This allows us to analyze what is imprinted in the statements of identity discoursegenerated through the hashtag, on the Instagram profiles of community actors, andwhat it means when placed in a relational intentionality typical of network dynamics.Our interest is in identifying the self-representation produced by the meta-data, and toinvestigate which metadata are most commonly shared by the actors in the network.The analysis is conducted in two phases to examine the universes of identity, values,and interests that characterize the network and its actors. This research extends thenotion of entrepreneurship as the ability to find and develop outside partners at suffi-cient cognitive distance. Additional relational competencies are needed, and particu-larly the ability to compete in global knowledge networks.
3 The way this literature considers the concept of ‘distance’ is interesting. It is not seen as fixeddistance between two situated nodes (geo-graphical distance) but as a ‘cognitive’ gap, or a variablespace resulting from the trade-off between the novelty value of cognitive variety and the need forsome cognitive coherence to utilize the potential for novelty.
4 These are precisely the forms of transmission, including the writing of social media, whichdetermine the ability to generate ideas, because in this context, every statement is emancipated fromits subjective and contingent character, to become a form of collective writing (Husserl 2015). Thestorytelling that daily produces a user through social is configured as a performative narrative,based on operational narratives of more performances.
14 M. P. Vittoria and P. Napolitano
3 Semantic Social Network Analysis
Grounded in the field of communication science, semantic network analysis (Popping2000) can be considered an alternative to content analysis (CA) (Krippendorff 2004).Since CA is used to analyze the content of media messages, it tends to determine thevalue of one or more variables based on the message content. In other words, it infersrelevant aspects of what a message (newspaper article, forum posting, personal e-mail,etc.) means in its context, and the communication research question determines boththe relevance and the correct context.
Rather than directly coding the messages to address the research question, semanticnetwork analysis first represents the content of the messages as a network of objects.This network representation is queried to address the research question.
Despite wide use of the technique, extracting the network of relations from the textcan be more difficult than categorizing text fragments although there are no standardsfor defining patterns on these networks (van Atteveldt 2008).
New social media such as Facebook, Twitter, Instagram, and so on, are considereddirect and indirect big relational data sets. Within these virtual places, huge amounts ofcontent (photo and/or video posts and blogs) are shared socially at diverse levels withdifferent motivations such as socializing, co-designing, etc. This kind of social sharingis considered semantic due to the nature of the shared objects. The strength of this kindof on-line semantic sharing lies in the network structure and in its power of viraltransmission of the messages/content5.
Even more trans-disciplinary technique, actually, there are three implication levels,as scientific fields directly involved in.
Firstly, ‘computational linguistics’ has seen drastic increases in computer storageand processing power in recent decades, leading to the development of multiple lin-guistic tools and techniques. Second, there is a need to alleviate the problems ofcombining, sharing, and querying these semantic networks, which requires a focus on‘knowledge representation’. This refers to the formal representation of the backgroundknowledge used to aggregate the textual objects with the abstract concepts in a researchquestion. Third, there can be the distinguishing manual and automatic extractions ofcomplex and abstract concepts by these data sets6. A frequent application of automaticextractions is marketing trend analysis and political science. At this level, the basicresearch question is about measuring the concept’s relative importance in the relevantinformation sphere (web, blog, on-line forum). If the concept (e.g. a hashtag) is a nodein a network of links (e.g. sharing hashtag), then analysis of the network structure canreveal the relative importance of that concept. Thus, semantic SNA is an extension ofthe SNA method (Wasserman and Faust 1994). The concepts of high betweenness
5 In these respects, Barabasi (2003) was pioneering research.6 Condor is a sophisticated semantic SNA tool (Gloor et al. 2009). It includes automated textualanalysis functionality using standard information retrieval algorithms such as ‘term frequency-inverse document frequency’. Also, it factors in the betweenness centrality of nodes to weigh thecontent by the social network position of the nodes.
Identifying Localized Ep Through Semantic SNA 15

centrality (BC) (the semantic, more diffused SNA indicator) become gatekeepersbetween different domains7.
4 Exploring an Entrepreneurial Project (Ep) ThroughSemantic SNA: A Synthesis of the Empirical Survey
The empirical analysis is in two steps. The first is an interpretative firm-level case studyto identify a localized Ep project8.
The evidence includes the multi-relational external networks, corresponding to aspecific learning investment.
Starting from these networks (A � 6 nodes and 8 links; B � 5 nodes and 8 links),we can parse the corresponding Instagram communities (research step 2).
The research dataset consists of the hashtags9 emitted in the previous two years byall members (6 + 5) of the networks related to the case study.
The research on the Instagram database involved several stages: search of thecontent was enabled using the tool Iconosquare (http://iconosquare.com/) which, onlygiving information on the user’s Instagram account, provides more objective researchcontent since it is free of local and temporal constraints, which constrain search per-formed by users directly approaching a company.
In a subsequent step, data collection consists of gathering company information oncompanies and compiling it in a database record using the “trans-coding” language(Manovich 2001) ‘python’ which is a script that can extract data from Instagramthrough the API protocol10.
7 SNA provides a lot of measures for quantifying a member’s interconnectedness within socialnetworks. As is well known, each indicator can be critically analyzed according to its explanatorycapabilities and the context of analysis (cfr. Landherr et al. 2010). If we consider centrality as thecontrol of the information flow that a member of a network may exert based on his position in thenetwork, the concept of BC is on the track. It is given by the quotient of the number of all shortestpaths between actors in the network that include the regarded actor and the number of all shortestpaths in the network (Freeman 1977).
8 The case observed is the Fondazione Plart located in Naples, Italy. It is dedicated to recovery,restoration, and conservation of artifacts and design objects constructed from synthetic materials(plastics). It is a research and restoration lab, an event location, a training center, and a permanentexhibition site for its founder’s historical plastics collection. The Plart’s founder is largelyrecognized as a potential entrepreneur in the local cultural and creative context.
9 It was decided to analyze the hashtags emitted in a 2-year period in order to even out the differencesrelated to the longevity of the different Instagram profiles as well as the various geographicallocations. We chose a period when all profiles and geographical locations were on the company inorder to allow comparative analysis which would be chronologically balanced.
10 Instagram provides API, i.e. the protocols for querying to extract information about the data, to beused in external applications such as external analytics tool platforms. The link below identifies allthe endpoints, i.e. all types of calls carried including a direct link to the images, its statistics (likesand comments), and the set of accompanying text which then provides all the hashtag used - https://www.instagram.com/developer/endpoints/.
16 M. P. Vittoria and P. Napolitano
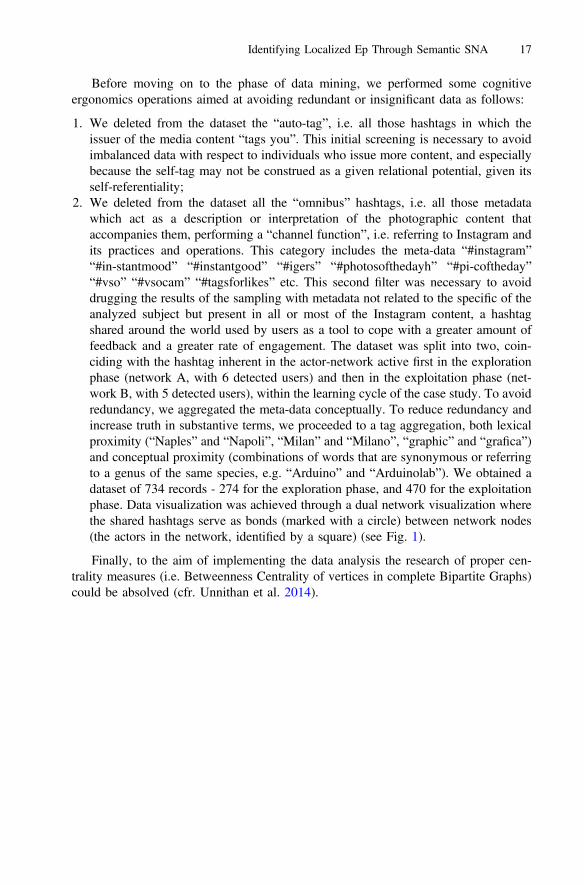
Before moving on to the phase of data mining, we performed some cognitiveergonomics operations aimed at avoiding redundant or insignificant data as follows:
1. We deleted from the dataset the “auto-tag”, i.e. all those hashtags in which theissuer of the media content “tags you”. This initial screening is necessary to avoidimbalanced data with respect to individuals who issue more content, and especiallybecause the self-tag may not be construed as a given relational potential, given itsself-referentiality;
2. We deleted from the dataset all the “omnibus” hashtags, i.e. all those metadatawhich act as a description or interpretation of the photographic content thataccompanies them, performing a “channel function”, i.e. referring to Instagram andits practices and operations. This category includes the meta-data “#instagram”“#in-stantmood” “#instantgood” “#igers” “#photosofthedayh” “#pi-coftheday”“#vso” “#vsocam” “#tagsforlikes” etc. This second filter was necessary to avoiddrugging the results of the sampling with metadata not related to the specific of theanalyzed subject but present in all or most of the Instagram content, a hashtagshared around the world used by users as a tool to cope with a greater amount offeedback and a greater rate of engagement. The dataset was split into two, coin-ciding with the hashtag inherent in the actor-network active first in the explorationphase (network A, with 6 detected users) and then in the exploitation phase (net-work B, with 5 detected users), within the learning cycle of the case study. To avoidredundancy, we aggregated the meta-data conceptually. To reduce redundancy andincrease truth in substantive terms, we proceeded to a tag aggregation, both lexicalproximity (“Naples” and “Napoli”, “Milan” and “Milano”, “graphic” and “grafica”)and conceptual proximity (combinations of words that are synonymous or referringto a genus of the same species, e.g. “Arduino” and “Arduinolab”). We obtained adataset of 734 records - 274 for the exploration phase, and 470 for the exploitationphase. Data visualization was achieved through a dual network visualization wherethe shared hashtags serve as bonds (marked with a circle) between network nodes(the actors in the network, identified by a square) (see Fig. 1).
Finally, to the aim of implementing the data analysis the research of proper cen-trality measures (i.e. Betweenness Centrality of vertices in complete Bipartite Graphs)could be absolved (cfr. Unnithan et al. 2014).
Identifying Localized Ep Through Semantic SNA 17
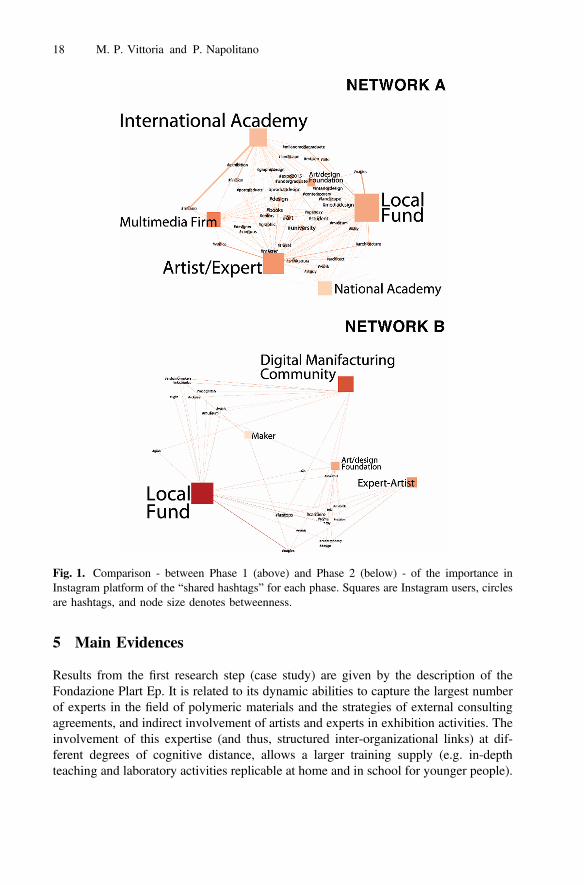
5 Main Evidences
Results from the first research step (case study) are given by the description of theFondazione Plart Ep. It is related to its dynamic abilities to capture the largest numberof experts in the field of polymeric materials and the strategies of external consultingagreements, and indirect involvement of artists and experts in exhibition activities. Theinvolvement of this expertise (and thus, structured inter-organizational links) at dif-ferent degrees of cognitive distance, allows a larger training supply (e.g. in-depthteaching and laboratory activities replicable at home and in school for younger people).
Fig. 1. Comparison - between Phase 1 (above) and Phase 2 (below) - of the importance inInstagram platform of the “shared hashtags” for each phase. Squares are Instagram users, circlesare hashtags, and node size denotes betweenness.
18 M. P. Vittoria and P. Napolitano
Results from the second research step emerge by the semantic network analysis of aselected group of Instagram users formed by Fondazione Plart’s external networknodes. A main evidences’ synthetic view is in Fig. 1, where the network visualizationsare scaled according to the betweenness centrality values11. This provides an under-standing of which occurrences are the most shared by the users of the network in eachphase.
When interpreting the data, it was clear that the evolution of the cycle of learning,the network concerned, at least as regards its narration on social media, evolves into anequally sharp. In the first phase, the network aggregates of semantic fields are related toarchitecture and design disciplines - all members of the network share the #architectureand #design hashtag. In the second phase, the network also aggregates on a geo-graphical basis, and extends its domain epistemic to the world and the art market,tourism, new creative forms, such as the universe of ‘making’.
6 Conclusion
This research has demonstrated that selecting a group of nodes that are connected by alearning logic based on cognitive distance allows social media (Instagram) to be usedas a source of information for research in entrepreneurship.
This study contributes to our understanding of complex social networks bystudying the modular structures of networks. Detecting the network modules, orcommunities, is becoming a critical issue and there is much discussion on the quality ofthe partition process. Our research testifies to the importance of aligning the researchquestion and its theoretical background (finding a localized entrepreneurship project asa self-discovery process), with the research method (explorative), and thus, fixing thealgorithm for mining the web (selecting Instagram users through a firm-level casestudy). To model the formation of a community (in our conceptual background) weused a learning-based entrepreneurial process, which treats each node as a player in aheuristic of invention (a dynamic cycle alternating the phases of exploration andexploitation).
Acknowledgment. This research is part of the TREnD project (Transition with Resilience forEvolutionary Development), which has received funding from the European Union’s Horizon2020 research and innovation program under the Marie Skłodowska-Curie grant agreementNo. 823952.
11 In particular, it is possible to scale the values - for each phase - according to two statisticalcategories. I.e. we can take account of the phenomena of node degree (which correspond to the‘what’ kind of information) and betweenness centrality (which approximates the influence of aconcept, the ‘who’ kind of information, within a discussion) for each node and each link.
Identifying Localized Ep Through Semantic SNA 19
References
Achtenhagen, L., Welter, F.: Media discourse in entrepreneurship research. In: Neergaard, H.,Ulhøi, J.P. (eds.) Handbook of Qualitative Research Methods in Entrepreneurship, pp. 193–215. Edward Elgar, Cheltenham, Northampton (2007)
Austin, J.L.: How to Do Things with Words. Oxford University Press, Oxford (1962)Barabási, A.-L.: Linked: Linked: how everything is connected to everything else and what it
means for business. Science and Everyday Life. Plume 2 (2003)Beattie, R.: The creative entrepreneur: a study of the entrepreneur’s creative processes (1999).
www.babson.edu/entrep/fer/papers99/III/III_BBerger, P.L., Luckmann, T.: Die gesellshaftliche Konstruktion der Wirklichkeit: Eine Theorie der
Wissenssoziologie. Fischer, Frankfurt (1969)Chalaby, J.K.: Beyond the prison-house of language: discourse as a sociological concept. Br.
J. Sociol. 47, 684–698 (1996)Cicourel, A.V.: Three models of discourse analysis: the role of social structure. Discourse
Process. 3, 101–131 (1981)Fairclough, N.: Media Discourse. Edward Arnold, London (1995)Foray, D.: Smart Specialization. Opportunities and Challenges for Regional Innovation Policy.
Routledge, Taylor & Francis Group, London, New York (2015)Freeman, L.C.: A set of measures of centrality based on betweenness. Sociometry 40(1), 35–41
(1977)Gartner, W., Carter, N., Hill, G.: The language of opportunity. In: Steyaert, C., Hjorth, D. (eds.)
New Movements in Entrepreneurship, pp. 103–124. Edward Elgar, Cheltenham, Northamp-ton (2003)
Gloor, P.A., Krauss, J., Nann, S., Fischbach, K., Schoder, D.: Web Science 2.0: identifyingtrends through semantic social network analysis. IEEE Computer Society (2009)
Hausmann, R., Rodrik, D.: Economic development as self-discovery. J. Dev. Econ. 72, 603–633(2003)
Hochman, N., Manovich, L.: Zooming into an Instagram City: reading the local through socialmedia. First Monday 18(7) (2013). https://doi.org/10.5210/fm.v18i7.4711
Husserl, E.: La crisi delle scienze europee e la fenomenologia trascendentale. Saggiatore, Milano(2015). traduzione di E. Filippini, prefazione di E. Paci, il [1961]
Johannisson, B., Ramirez-Pasillas, M., Karlsson, G.: The embeddedness of inter-firm networks.Entrepreneurship Reg. Dev. 4(14), 297–315 (2002)
Kirzner, I.: Perception, Opportunity and Profit: Studies in the Theory of Entrepreneur-ship. University of Chicago Press, Chicago (1979)
Krippendorff, K.: Reliability in content analysis: some common misconceptions and recom-mendations. Hum. Commun. Res. 30(3), 411–433 (2004)
Landherr, A., Friedl, B., Heidemann, J.: A critical review of centrality measures in socialnetworks. Bus. Inf. Syst. Eng. 2(6), 371–385 (2010)
Manovich, L.: The Language of New Media. The MIT Press, Cambridge, London (2001)Nooteboom, B.: A Cognitive Theory of the Firm. Learning, Governance and Dynamic
Capabilities. Edward Elgar, Cheltenham, Northampton (2009)Phillips, N., Hardy, C.: Discourse Analysis: Investigating Processes of Social Construction. Sage,
London, Thousand Oaks (2002)Popping, R.: Computer-Assisted Text Analysis. Sage, London (2000)Unnithan, S., Kannan, B., Jathavedan, M.: Betweenness centrality in some classes of Graphs. Int.
J. Comb. 2014, 1–12 (2014). ID 241723
20 M. P. Vittoria and P. Napolitano
Van Atteveldt, W.: Semantic network analysis. Techniques for extracting, representing, andquerying media content. Vrije Universiteit (2008). http://vanatteveldt.com/dissertation
Wasserman, S., Faust, K.: Social Network Analysis: Methods and Applications. CambridgeUniversity Press, Cambridge (1994)
Weick, K.E.: Sensemaking in Organizations. Sage, London, Thousand Oaks (1995)
Open Access This chapter is licensed under the terms of the Creative Commons Attribution 4.0International License (http://creativecommons.org/licenses/by/4.0/), which permits use, sharing,adaptation, distribution and reproduction in any medium or format, as long as you give appro-priate credit to the original author(s) and the source, provide a link to the Creative Commonslicense and indicate if changes were made.The images or other third party material in this chapter are included in the chapter's Creative
Commons license, unless indicated otherwise in a credit line to the material. If material is notincluded in the chapter's Creative Commons license and your intended use is not permitted bystatutory regulation or exceeds the permitted use, you will need to obtain permission directlyfrom the copyright holder.
Identifying Localized Ep Through Semantic SNA 21
Smart Specialisation Priorities of LessDeveloped Regions. A Critical Evaluation
Petra Szávics(&) and József Benedek
Babeș-Bolyai University, Cluj-Napoca, [email protected]
Abstract. This paper critically analysis the definition of smart specialisationpriority areas of Romanian less developed regions, aiming to identify weak-nesses in policy design that according to existing theories characterise suchregions. Besides an empirical contribution to the literature, findings also have apractical relevance. They can be used by regions to redesign strategies in theirpreparation for the absorption of Cohesion Policy funds between 2021 and2027. While in the definition of priority areas we could depict resemblance withthe general practice presented in the literature, there are also shortcomingsreported to the evaluation framework proposed in this paper based on officialmethodological and original theoretical aspects. These mainly refer to a lesstargeted approach within priorities, overlapping between priorities and hori-zontal character of vertically defined priorities. However, under these aspects,regional strategies present a high level of heterogeneity; thus, responsibleinstitutions will need to invest different time and effort to revise policydocuments.
Keywords: Smart specialisation � Less developed regions � Cohesion policy
1 Introduction
Smart specialisation strategies are policy interventions aiming to transform the econ-omy by linking economic activities and market opportunities with research excellenceand the potential of new technologies, taking into consideration local assets andchallenges, as well as external sources of knowledge and local value chains [1–3].Starting with the 2014–2020 programming period, such strategies have become ex-anteconditionality for declaring European Regional Development Fund (ERDF) expendi-tures in research and innovation under Thematic Objective (TO) 1. For the nextfinancial exercise, strategies need to be revised in line with criteria under the enablingcondition for Policy Objective (PO) 1 – A smarter Europe by promoting innovative andsmart economic transformation.
A proper policy design contributes to the fulfilment of these criteria. Additionally, itis a pre-condition for the effective use of funds, maximising their efficiency [2], andultimately their impact. Smart specialisation strategies, especially in terms of prioritiesand actions defined under the policy mix, are fed into Operational Programmes, settingthe framework for financing operations. Priority selection in a vertical manner,reflecting a certain granularity level is one of the most important elements of a good
© The Author(s) 2020C. Bevilacqua et al. (Eds.): NMP 2020, SIST 177, pp. 22–36, 2020.https://doi.org/10.1007/978-3-030-52869-0_3
policy design [2]. The impact of smart specialisation strategies is especially importantin less developed regions, the main beneficiaries of Cohesion Policy funds. Imple-mentation of these policies should contribute to the improvement of regional innova-tion performance and the reduction of development gaps. However, based onimplementation experiences so far, the highest benefits of this approach are visible indeveloped regions [4]. Due to weaknesses observed in non-core regions, smart spe-cialisation “may actually exacerbate regional imbalances and run counter to current EUcohesion policy” [5]. While there is a lot of reference throughout the literatureregarding the problems such regions face [6–9], authors also note that each regionpresents particularities pending context, path dependencies and factors of structural,institutional and geographic character [10].
Against this background, the aim of our paper is to critically evaluate the definitionof smart specialisation priority areas selected by Romanian less developed regions1, asone of the main indicators of proper policy design. Additionally, where appropriate, wepropose to identify weaknesses in priority area definition. For this purpose the con-sistency of selected priorities will be evaluated against a set of criteria derived from theapplicable methodological guidance and early theoretical aspects related to smartspecialisation, which represented the most important information sources available atthe time regional strategies have been elaborated. Additionally, some aspects observedat the level of general European Union practice in relation to priority area definitionwill also be used. Our paper will bring empirical evidence in order to enrich theexisting literature on smart specialisation in less developed regions. Research onregional priority areas in Romania has not been performed yet and altogether the smartspecialisation processes in Romanian development regions has not gained a lot ofattention. There are two notable exemptions, i.e. a study on the smart specialisationprocess in the North East Development Region [11] and another one on the positiveeffects of the smart specialisation process on the development of regional innovationsystems [12]. Findings can also have a practical relevance since Romanian regions withdifferent levels of experience in the smart specialisation process [12] need to revisetheir strategies for the next programming period.
To proceed, we will start with a literature review on the most important aspectsconcerning smart specialisation, its link with Cohesion Policy and aspects related topriority area definition, including problems less developed regions face in this process.We will continue with the description of methodological aspects. The next chapter willbe dedicated to the analysis of regional smart specialisation priorities based on thecontent of strategies, starting with a short overview of the smart specialisation expe-rience in Romania, focusing on the regional level. We will resume with discussions andconclusions, presenting the limitations of our study and defining further areas ofresearch.
1 Romania has eight NUTSII development regions, out of which one developed (Bucharest-Ilfov) andseven less developed (West, Center, North West, North East, South West, South Muntenia and SouthWest Oltenia). Five of the latter are also considered low income, thus lagging regions (North West,North East, South East, South Muntenia and South West Oltenia).
Smart Specialisation Priorities of Less Developed Regions 23

2 Smart Specialisation, Priorities and Cohesion Policy
2.1 Smart Specialisation and Cohesion Policy
As a concept, smart specialisation refers to economic transformation, triggered by theagglomeration and spillover effects generated by new economic specialties [1, 2].Emphasis is on new economic activities that rely on existing productive assets, exploitnew technologies and research capacities and result from a process of entrepreneurialdiscovery [2, 13]. Smart specialisation strategies are designed policy interventions,with the aim to facilitate such a transformative specialisation through vertical priori-tisation in a limited number of economic areas [2].
Resonating with the reforms generated by the Barca report [14, 15], starting from2014–2020, these “innovation driven development strategies” [16] have been set as ex-ante conditionality for the use of ERDF under TO1 (Promoting research, developmentand innovation) and have gained a territorial dimension [2]. In the context of CohesionPolicy, such strategies are defined as integrated, place- and evidence-based economictransformation agendas, developed at the national/regional level, through a bottom-upprocess, in order to support research and technology driven economic development inselected priority areas, relying on local assets and capabilities, but also on externalsources of knowledge and integration in global value chains [3]. To support strategyelaboration, the European Commission issued official methodological guidance anddeveloped a dedicated platform [2].
Although major concerns have been raised regarding the efficacy of the concept,McCann [17] demonstrates that “smart specialisation emerges as being especiallyuseful for many non-core regions as a way of prioritising policy initiatives and ensuringresource concentration”. However, such regions face serious challenges linked to smartspecialisation. Low capacity of institutions governing and participating in the process,weak innovation systems lacking cooperation culture and trust have negative effects onpolicy formulation [7–9, 18–21]. Success in the smart specialisation process is addi-tionally hindered by the lack of technological diversification [21]. Dependence ondeclining industries, limited entrepreneurial and innovation capability especially affectthe selection of priorities and the identification of new, transformative activities basedon market opportunities [22]. While non-core regions face such challenges and theyhave less experience in such processes, they need to design and implement smartspecialisation strategies based on an approach that presents weaknesses, since “it doesnot prescribe (…) specific tools for specific actions” [23] and it does not take intoconsideration the differences between different types of regions [22]. This may lead to alack of understanding or misinterpretation of policy prioritisation and, in certain cases,to the selection of too many specialisation priorities and their too broad definition [24].Inadequacies resulting from these bottlenecks represent “a significant challenge forCohesion Policy” [25].
2.2 Smart Specialisation Priorities
According to the methodological guidance, a smart specialisation strategy shouldcontain specialisation priorities, a policy mix with actions based on the analysis of
24 P. Szávics and J. Benedek
socio-economic and research-development-innovation context, as well as input ofstakeholders and monitoring and evaluation mechanisms [3]. An appropriate priorityselection, which includes the results of entrepreneurial discovery processes, as amethod of stakeholder involvement, is a criterion of good policy design [2]. Smartspecialisation priorities can be defined as technologies or economic activities andshould be limited in number [3]. Besides the vertical ones, horizontal priorities arerecommended to be included, referring to the diffusion of novel technologies, organ-isational or social innovation. However, according to the same guidance, these can alsobe part of the policy mix [3].
Vertical priorities should reflect a middle level of granularity that is between thelevel of economic sectors and individual projects, pointing towards new, transformativeactivities matching or combining scientific or research, technological and economicstrengths, market potential and opportunities [2]. This level of granularity reflects smartchoices or niches, representing a precise expression of areas that would impact theeconomy most, such as: “ICT based innovation for active ageing”, “wood-basedsolutions for eco-construction” [26], “nanotechnology applications for the pulp andpaper industry” [27]. Furthermore, priorities should be about particularisation and theyshould be anchored in existing economic strengths or assets – identified at the level ofclustered or correlated activities - taking into consideration emerging opportunities asidentified by key actors possessing entrepreneurial and market knowledge [2].
Reflecting the experimental character of the policy, neither the theory, nor themethodological guidance offer detailed advice or a set of criteria to be used for priorityselection. This is especially relevant in relation to the problems regions with lesscapacity and experience face when designing a strategy. Lack of selection criteria led tovarious approaches taken by regions in their priority area definition. A recent analysisof 39 regional and national strategies identified four dimensions used in differentcombination in order to define smart specialisation priorities, i.e. (1) sectors or valuechains that reflect economic activities, (2) key enabling or general purpose technologiesthat activate transformation, (3) societal challenges that need to be overcome atEuropean or the specific territorial level, (4) specific resources that can be exploited,like natural and cultural ones [28, 29]. However, the same authors acknowledge thatmatching all these dimensions within one smart specialisation area might be limitativeand consider that combining at least two out of the four dimensions would be a properapproach [29]. Generally, priorities, defined through such a combination of differentdimensions, are presented from one up to three levels [29].
The most important information on national and regional smart specialisationpriorities is presented in a database hosted by the dedicated smart specialisation plat-form developed by the Joint Research Centre of the European Commission. The RIS3database2 contains two levels for each priority - the name of the priority and itsdescription, including granularity level expressed through several niches – as well aspolicy objectives. As dimensions or areas linked to one specialisation priority there are
2 The EYE@RIS3 database can be accessed on the following link: https://s3platform.jrc.ec.europa.eu/map.
Smart Specialisation Priorities of Less Developed Regions 25

economic and scientific domains, using NACE3 rev.2 and NABS4 2007 codes. Exceptfor the name of priority area and its description, all other types of information can beselected from pre-set lists.
3 Methodological Aspects
To critically evaluate how priorities are defined in the smart specialisation strategies ofRomanian less developed regions, we have developed a set of criteria based onmethodological aspects from the official guidance [3] and interpreted them togetherwith early theoretical aspects linked to smart specialisation [1, 2, 13]. Additionally, wealso took into consideration the general practice at the EU level, deriving from existingstudies [28, 29] and the architecture of the RIS3 database. Thus, from a methodologicalpoint of view, by priority area definition we understand the following aspects: (1) thevertical or horizontal character of priority areas, perceiving under (a) horizontal ones,priorities that refer to technology diffusion or aspects related to social, organisationalinnovation, and by (b) vertical ones, priorities that present a combination or intersectionof at least the economic dimension with research or scientific strengths and potentialuse of key enabling or general purpose technologies; (2) the name of the priority area,which should reflect economic activities or technologies and (3) the granularity level ofvertical priority areas in terms of niches that point towards new activities that are belowthe level of a sector and above the level of an individual project. Additionally, we haveanalysed if - in terms of economic area or activity5 – the economic dimension takeninto consideration covers correlated or interlinked activities or areas. Moreover, wesearched for other aspects taken into consideration during priority area definition, suchas challenges, cultural or natural resources.
Our research based on the above-mentioned elements was carried out on the finalSmart Specialisation Strategies of the Romanian less developed regions, approved bythe Regional Development Councils, the governing body of Regional DevelopmentAgencies. These secondary documents were collected through desk-research from theofficial web-pages of the Agencies at the beginning of September 2019. The samestrategies are in force at the moment and will undergo revision for the next pro-gramming period. We did not include in our research data from the RIS3 database,since, for the information presented, various sources, including unofficial ones (finalstrategy, draft strategy and/or other sources and studies) are referred by regions6. Onlythe chapters describing the selected smart specialisation priority areas and those
3 Statistical Classification of Economic Activities in the European Community.4 Nomenclature for the Analysis and Comparison of Scientific Programmes and Budgets.5 While generally the literature refers to the economic dimension in terms of economic sector, wedifferentiate between economic areas in terms of 2 or 3 digit NACE divisions and economic activitiesin terms of 4 digit NACE divisions.
6 Out of the seven less developed Romanian regions registered in the RIS3 database, two (Centre andSouth East) provide information based on the final strategy, two (North East and South West Oltenia)refer to other sources and studies besides the final strategy, one (North West) gives as a source thedraft strategy and one (West) other study and source.
26 P. Szávics and J. Benedek
describing the method of priority area selection were analysed. If there were separatedocuments containing additional information, they were also included in our research.This is the case of the Centre region, which has an annex to the strategy that contains amore detailed analysis of the specialisation priorities.
Based on the existing literature, our assumption is that priority selection might beless targeted in terms of number of priorities selected and their granularity level.Additionally, we expect to find differences between regions, pending their experiencein smart specialisation processes. Two regions (North East and North West) have ahigher degree of experience compared to all others [12].
4 Smart Specialisation in Romanian Regions
Romania, a Member State since 2007, is preparing for its third financial exercise. Forthe first two programming periods all Operational Programmes (OPs) have beendeveloped centrally, relying on national strategies and policies. Currently, theRegional OP that has a separate budget for each of the eight NUTS II developmentregions represents a partial exception. Regional Development Strategies were alsoprepared by Regional Development Agencies (RDAs) for this programme. RDAs areorganised as non-governmental organisations at the level of the NUTS II regions, out ofwhich seven are less developed (West, North West, Centre, North East, South East,South Muntenia and South West Oltenia) and one – Bucharest-Ilfov – developed.These Agencies are the only regional level organisations that have tasks connected tostrategic planning, but they are not officially responsible for research-development-innovation policies [12, 30]. They also act as Intermediate Body for Regional OP,managed centrally by the responsible line ministry.
In order to substantiate interventions for TO1, selected for the Regional andCompetitiveness OPs 2014–2020, Romania has elaborated and submitted as ex-anteconditionality the National Research-Development-Innovation Strategy 2014-2020.The document represented a partial fulfilment of the conditionality7. In parallel, even ifnot linked to the programming process, by 2014, some RDAs voluntarily developedSmart Specialisation Strategies [11, 12]. This was the case of the North East, West andCentre regions. By 2016, the strategies of South Muntenia and South West Olteniawere also finalised and North West started the process. In early 2016, two regions,namely North West and North East, were selected to receive support from the JointResearch Centre of the European Commission [12]. The pilot project “RIS3 support forlagging regions” was finalized in mid-2018, resulting in the revision of the strategy inthe North East region and the elaboration of the strategy in the North West region. Atthe moment, these two regions are the most experienced in smart specialisation [12].
In March, 2016, the ROP 2014–2020 was amended, introducing the necessity toelaborate Framework Documents (Concept Notes) for Regional Smart Specialisation,to fundament the implementation of Priority Axes 1, financing technology transfer in
7 Further information is to be found in the Partnership Agreement of Romania approved by theEuropean Commission on August 14, 2014. Section 2.3. https://www.fonduri-ue.ro/acord-parteneriat#varianta-%C3%AEn-englez%C4%83.
Smart Specialisation Priorities of Less Developed Regions 27

less developed regions. This amendment was also linked to the fulfilment of the ex-anteconditionality [11, 12]. The Concept Notes were elaborated based on a methodologyissued by the Regional OP Managing Authority, following the official EC guidelinesand proposing general criteria for priority selection [31]. Thus, by 2018, all regionselaborated the Framework Document, including South East and updated or finalisedtheir strategies. The West, South Muntenia and South West Oltenia DevelopmentRegions were exceptions, not performing an update of their existing policy document.For the next programming period, decentralized Regional OPs are proposed and RDAsneed to revise strategies to meet the fulfilment criteria under PO1.
5 Smart Specialisation Priorities of Romanian LessDeveloped Regions
All seven strategies analysed have a chapter referring to the methodological aspectstaken into consideration for the definition of priority areas. Generally, regions startedwith the analysis of economic potential in terms of critical mass, competitive andcomparative advantages based on indicators, such as number of companies, number ofemployees, turnover, productivity, exports, and clusters. Such indicators were looked aton the level of economic areas or the level of interlinked, complementary economicactivities. Only the North West region gives a clear definition of such activities, in termsof clusters of correlated industries, according to the definition of Cluster Observatory. Asa second step, RDAs took into consideration the research-development dimension interms of infrastructure, patents and licences, R&D projects and in some cases publica-tions. Results of economic and scientific or research specialisation resulting from the firsttwo steps were completed by an analysis of technological specialisation only in the caseof the South Muntenia region and with the potential of using new technologies in theNorth West region. Additionally, all regions mention correlation with other assets (suchas labour force, education) and/or dimensions (natural resources, societal challenges).The North West region also included global and European development tendencies.Potential priority areas resulting from the analysis were tested and validated in entre-preneurial discovery processes and modified according to their outcomes. In the case ofthe South East and South West Oltenia regions, these were preceded by gathering inputfrom key stakeholders through interviews and questionnaires.
Most regions identified 6 smart specialisation priority areas, except for South Eastand Centre, which selected 7, respectively 9 priorities. In most cases regions definedonly vertical priorities, except for the North West region defining “ICT” and the SouthMuntenia region selecting “High Tech Industry” as both a vertical and horizontalpriority area, and South West Oltenia defining “ICT” and “Eco-technologies” as hor-izontal areas8. These horizontal priorities refer to the diffusion of general purpose
8 The South East region mentions five additional horizontal priorities, including the diffusion of keyenabling and information and communication technologies, besides those that refer to support RDI orcluster development. Since based on the strategy these can also be interpreted as being part of thepolicy mix, they were left out from the analysis. In the case of the North East region the prioritiesdefined as horizontal ones are clearly part of the policy mix.
28 P. Szávics and J. Benedek
technologies or other groups of technologies that also include key enabling ones, in allor most vertical areas. Regarding vertical priorities, two regions – West and Centre –
named them strictly in terms of economic activities, while other two – North West andSouth East – have priorities with names referring to both economic activities andtechnologies or groups of technologies. Besides reference to economic activities andtechnologies, South West Oltenia, South Muntenia and North East also use other namecategories like “Bio-economy”, “Smart localities”, or “Energy-environment”.
Priorities have an economic dimension in all seven strategies. In terms of four digitNACE codes, clear reference is only made in the strategies of the West, North West andCentre regions. In all other cases the economic area targeted can be deducted from thename and/or the description of the priority or the niches proposed. Generally, prioritiesare linked to areas of economic activities in terms of two or three digit NACE division,or groups of correlated economic areas or activities, but there are some exceptions. Forexample, under “Industrial engineering and transport”, the South West Oltenia regionincluded automotive, electrical, railway, rolling stock industries, constructions, as wellas chemical and metallurgical industries. North West, under “New materials” refers tofurniture, paper, plastic and packaging industries, as well as to metal working tech-nologies. Full reference to corresponding research or scientific domains and tech-nologies is to be found only in the case of the North West region, while SouthMuntenia emphasises corresponding technologies. The North East region highlightedcorresponding research fields for all smart specialisation priority areas. As for the SouthWest Oltenia region, only one priority has a declared research dimension. Two out ofsix priority areas have a rather weak research or technological dimension in the strategyof the West region, while one priority has both. However, in most cases, when no clearreference is made, a link between the targeted economic areas or activities and cor-responding research areas and/or technological domains can be deducted from thename of the area and/or the proposed niches. The strategy of the Centre region presentsa particular case, since several cross-cutting themes were defined in relation to thevertical priority areas. In some cases these indicate technologies and in all cases theyrefer to economic systems (circular economy) and/or principles (sustainable economy,energy efficiency). Such principles are referred to in general, at least at the level ofobjectives, in many of the strategies analysed. Other dimensions taken into consider-ation by all regions in relation to at least some of the priority areas refer to natural andcultural resources, societal or economic challenges.
The mid-grained granularity level or niches are missing from the strategy of theCentre region, from two priorities of the South East region, and are very limitedlyreferred to by the West region. In other cases there are generally several, i.e. two tofourteen niches that are listed under each specialisation priority. Except for North West,there is a certain overlap between the niches under the priorities that are definedvertically and those that are defined horizontally, or between those defined in economicand technological terms, or using other types of names. For example, in the case of theSouth West Oltenia region, new technologies in agriculture appear both under “Eco-technologies” and under “Agriculture and food industry”. In the strategy of the SouthMuntenia region, fertilizers as a niche appear under “Agriculture and food industry”, aswell as under “Bio-economy”. Additionally, while advanced production technologiesappear under the “High-tech industry” priority, intelligent production equipment is
Smart Specialisation Priorities of Less Developed Regions 29

listed under “Construction of vehicles, component and equipment”. Sustainabledevelopment of crops and new plants resistant to climate change, as well as newtechnologies in agro-food and precision agriculture are overlapping niches between“Agro-food” and “Energy-environment” priorities in the strategy of the North Eastregion. Based on the proposed niches, in the case of the West region “ICT” ratherrepresents a horizontal priority while “ICT, High-tech and advanced materials” rep-resents both a vertical and a horizontal priority in the case of the South East region. Theniches under these smart specialisation priorities refer to the diffusion of technologiesin other vertical priority areas.
6 Discussion
In the seven regional smart specialisation strategies analysed, there were 6 to 9 pri-orities named in economic, technological, or other, more general terms. Priorities aremostly vertically designed. Only two regions assign both a vertical and horizontalcharacter to some of their technologically named priorities and one region defines twosolely horizontal priorities. Nevertheless, based on niches or granularity level, at leastone of the vertical priorities chosen by three other regions has a horizontal character.
In terms of economic activities at the level of 4 digits NACE codes, the economicdimension of priorities can be clearly identified in three strategies. In all other casesreference to this dimension is weak, however information can be deducted. In mostcases this dimension covers interlinked activities, except for one priority of North Westand South East that encompasses several types of economic activities without a clearlink between them. Reference to the scientific, research, or technological dimension ofpriorities is only made in the strategy of the North West region. North East focuses onthe research dimension and South Muntenia on the technology dimension. In all othercases, such dimensions can only be deducted from the name of the priority area orniches, if defined. Granularity level or niches are almost or completely missing fromthe strategies of the West and Centre regions, while in all other cases several suchniches are defined. Except for the North West region, there are overlaps between nichesdefined under different priority areas.
The main bottlenecks identified can be grouped under two aspects. One is thevertical definition of smart specialisation priorities, taking into consideration relevantdimensions and the other one is the targeted approach. Regarding the first aspect, wecan mention the horizontal character of vertically defined areas, in some cases inter-linked with a less proper naming of priorities, as well as overlaps between nichesproposed under different priorities within one strategy. As for the second aspect, we canmention the rather big number of priorities, the lack of granularity level in some cases,or the multitude of niches identified under a priority area, as well as reference toseveral, not clearly interlinked economic areas or activities within one priority.
Although most of the smart specialisation priorities lack correspondence with thethree dimensions taken into consideration in our methodology - economic, research orscientific and technological - a resemblance with the practice of other European regionscan be observed, as presented by Gianelle, Guzzo & Miezkowski [29]. Romanian lessdeveloped regions clearly link their priorities to at least an economic and a research or
30 P. Szávics and J. Benedek

technological dimension, in many cases adding aspects linked to natural, culturalresources, societal or economic challenges, economic trends and principles.
Despite the apparently similar methodological approach taken by regions, outcomesin terms of priority definition and their granularity level differs from one strategy toanother. While we have expected to find such differences based on the degree ofexperience regions have linked to smart specialisation as related by Ranga [12],strategies show a greater heterogeneity within the groups with more (North West andNorth East) and less experience (West, Centre, South East, South Muntenia and SouthWest Oltenia). If we were to set up a hierarchy from the point of view of the quality ofpriority area definition, the North West region would have the fewest problems, fol-lowed by the North East and South Muntenia regions, than by South East and SouthWest Oltenia, and finally by the Centre and West regions (Table 1). From a practicalpoint of view, this means that redesigning strategies and priority areas will implydifferent effort and time invested by each region. When there are several niches underone priority, revision will be easier and will need to focus on selecting niches that couldlead to new activities, triggering economic transformation as proposed by Foray [2].When there are also overlaps between niches and thus between priority areas or nicheslack completely, revision will imply a re-definition of all priorities.
Table 1. Synthetic presentation of main findings
Specialisation priorities Main findings
Smart Specialisation Strategy of West Region (2016)automotive components, textiles, ICT, agro-food, constructions, tourism
strong economic dimension of priorities;niches are generally missing; ICT, a verticalarea, has a horizontal character
Smart Specialisation Strategy of North West Region (2018)agro-food, cosmetics & food supplements,health, new materials, advanced productiontechnologies, ICT
priorities reflect all three dimensions; 2 to 12niches under priorities; ICT is both a verticaland a horizontal priority
Smart Specialisation Strategy of Centre Region (2017)automotive & mechatronics, aerospaceindustry, agro-food, textiles & leather,sustainable built environment, forestry &woodworking & furniture, IT & creativeindustries, health & pharmaceuticals,wellness tourism
strong economic dimension of priorities; noniches have been identified (accent on cross-cutting themes)
Smart Specialisation Strategy of South West Oltenia Region (2016)industrial engineering & transport,sustainable energy & environment, basic &experimental innovative medicine,agriculture & agro-food, tourism & culturalidentity, ICT, eco-technologies
mainly economic dimension of priorities; 2to 12 niches under priorities, in some casespresenting overlaps; ICT and eco-technologies are defined as horizontalpriorities
(continued)
Smart Specialisation Priorities of Less Developed Regions 31
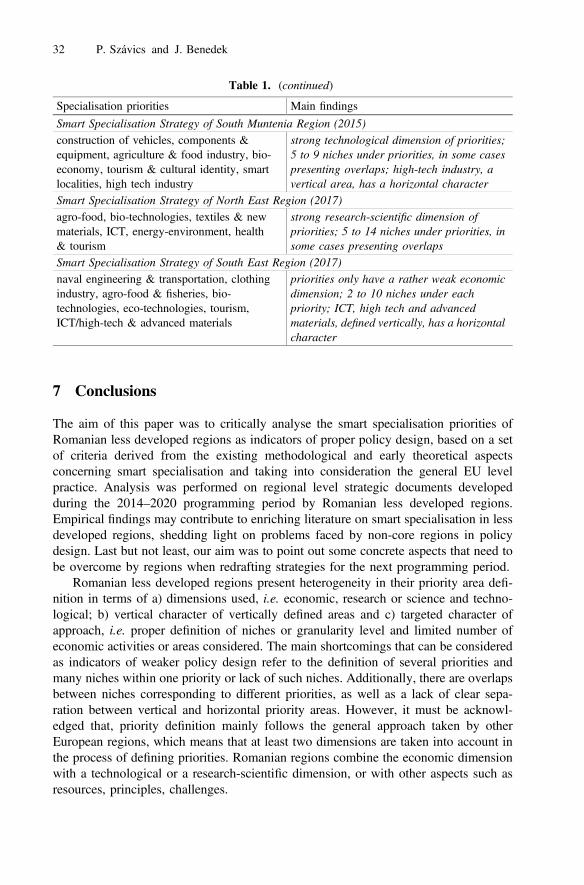
7 Conclusions
The aim of this paper was to critically analyse the smart specialisation priorities ofRomanian less developed regions as indicators of proper policy design, based on a setof criteria derived from the existing methodological and early theoretical aspectsconcerning smart specialisation and taking into consideration the general EU levelpractice. Analysis was performed on regional level strategic documents developedduring the 2014–2020 programming period by Romanian less developed regions.Empirical findings may contribute to enriching literature on smart specialisation in lessdeveloped regions, shedding light on problems faced by non-core regions in policydesign. Last but not least, our aim was to point out some concrete aspects that need tobe overcome by regions when redrafting strategies for the next programming period.
Romanian less developed regions present heterogeneity in their priority area defi-nition in terms of a) dimensions used, i.e. economic, research or science and techno-logical; b) vertical character of vertically defined areas and c) targeted character ofapproach, i.e. proper definition of niches or granularity level and limited number ofeconomic activities or areas considered. The main shortcomings that can be consideredas indicators of weaker policy design refer to the definition of several priorities andmany niches within one priority or lack of such niches. Additionally, there are overlapsbetween niches corresponding to different priorities, as well as a lack of clear sepa-ration between vertical and horizontal priority areas. However, it must be acknowl-edged that, priority definition mainly follows the general approach taken by otherEuropean regions, which means that at least two dimensions are taken into account inthe process of defining priorities. Romanian regions combine the economic dimensionwith a technological or a research-scientific dimension, or with other aspects such asresources, principles, challenges.
Table 1. (continued)
Specialisation priorities Main findings
Smart Specialisation Strategy of South Muntenia Region (2015)construction of vehicles, components &equipment, agriculture & food industry, bio-economy, tourism & cultural identity, smartlocalities, high tech industry
strong technological dimension of priorities;5 to 9 niches under priorities, in some casespresenting overlaps; high-tech industry, avertical area, has a horizontal character
Smart Specialisation Strategy of North East Region (2017)agro-food, bio-technologies, textiles & newmaterials, ICT, energy-environment, health& tourism
strong research-scientific dimension ofpriorities; 5 to 14 niches under priorities, insome cases presenting overlaps
Smart Specialisation Strategy of South East Region (2017)naval engineering & transportation, clothingindustry, agro-food & fisheries, bio-technologies, eco-technologies, tourism,ICT/high-tech & advanced materials
priorities only have a rather weak economicdimension; 2 to 10 niches under eachpriority; ICT, high tech and advancedmaterials, defined vertically, has a horizontalcharacter
32 P. Szávics and J. Benedek
A revision of the strategies for the next programming period in order to reach a moretargeted approach in priority area definition and thus a greater impact of funds spent willrequire different levels of effort from each region, pending on the number of weaknessesidentified. As a first step, regions might consider matching the three dimensions pro-posed in this paper with each priority area. Results should than be further tested withstakeholders to reach the appropriate granularity level. For this purpose, some regions,especially those that make reference to other sources and studies in the RIS3 database ofthe smart specialisation platform, might already possess additional data.
Besides these practical aspects, our analysis and results may contribute to theexisting literature, by pointing out some specific problems linked to strategy design inRomanian less developed regions. For a more accurate picture, research should beexpanded to cover the exact reasons of the weaknesses identified, with emphasis on thecapacity of institutions managing the process and that of stakeholders involved in it.Results of systematically conducted analysis in other areas concerning the use ofCohesion Policy funds may also be considered, such as the impact of bad policy designon the success of the National Growth Pole Strategy [32, 33]. Additionally, the resultsof entrepreneurial discovery processes should be fed in. Not covering these aspectsrepresents one of the main limitations of this study, but at the same time it sets furtherresearch objectives.
Acknowledgement. Elaboration and publication of this paper have been mainly supported bythe Romanian Ministry of Research and Innovation, under project number PN-III-P4-ID-PCCF-2016-00084, financed from the National Plan for RDI 2015–2020 (PNCDI III), implemented bythe Executive Unit for Financing Higher Education, Research, Development and Innovation -National University Research Council.
References
1. Foray, D., David, P.A., Hall, B.H.: Smart specialization. From academic idea to politicalinstrument, the surprising career of a concept and the difficulties involved in itsimplementation. MTEI-Working Paper 001 (2009). https://pdfs.semanticscholar.org/29ad/6773ef30f362d7d3937c483003d974bc91c5.pdf. Accessed 15 Jan 2020
2. Foray, D.: Smart Specialisation. Opportunities and Challenges for Regional InnovationPolicy. Routledge, London (2015)
3. European Union: Guide to Research and Innovation Strategies for Smart Specialisations(RIS 3). European Commission, Brussels (2012)
4. European Commission: Impact Assessment Accompanying the document - Proposals for aRegulation of the European Parliament and of the Council on the European RegionalDevelopment Fund and on the Cohesion Fund on a mechanism to resolve legal andadministrative obstacles in a cross-border context on specific provisions for the Europeanterritorial cooperation goal (Interreg) supported by the European Regional Development Fundand external financing instruments. SWD 282. https://ec.europa.eu/transparency/regdoc/rep/10102/2018/EN/SWD-2018-282-F1-EN-MAIN-PART-1.PDF. Accessed 20 Jan 2020
5. Barzotto, M., Corradini, C., Fai, F.M., Labory, S., Tomlinson, R.: Executive summary. In:Barzotto M., Corradini C., Fai, F.M., Labory S., Tomlinson P.R. (eds.) Revitalising LaggingRegions: Smart Specialisation and Industry 4.0, p. 9. Taylor & Francis, Oxon (2019)
Smart Specialisation Priorities of Less Developed Regions 33
6. Blažek, J., et al.: Smart specialisation for regional innovation. Regions with less developedresearch and innovation systems. Reflection Paper. FP7 project with grant no.320131 (2014). https://orca.cf.ac.uk/78219/1/Regions%20with%20Less%20Developed%20Research%20and%20Innovation%20Systems.pdf. Accessed 26 Aug 2019
7. McCann, P., Ortega-Argilés, R.: Smart specialisation: insights from the EU experience andimplications for other economies. J. Reg. Res. 36, 279–293 (2016)
8. Tsipouri, L.J.: Fostering innovation in less-developed and low institutional capacity regions:Challenges and opportunities. Background paper for an OECD/EC Workshop on 22 June2018 within the workshop series “Broadening innovation policy: New insights for regionsand cities”, Paris. https://www.oecd.org/cfe/regional-policy/Tsipouri(2018)FosteringInnovationInLessDevelopedRegions.pdf. Accessed 26 Jan 2020
9. Trippl, M., Zukauskaite, E., Healy, A.: Shaping smart specialization: the role of place-specific factors in advanced, intermediate and less-developed European regions. Reg. Stud.(2019). https://doi.org/10.1080/00343404.2019.1582763
10. Blažek, J., et al.: Smart specialisation for regional innovation. Regions with less developedresearch and innovation systems. Research Working Paper. FP7 project with grant no.320131 (2014). https://orca.cf.ac.uk/78216/1/Regions%20less%20developed.pdf. Accessed26 Aug 2019
11. Healy, A.: Smart specialization in a centralized state: strengthening the regional contributionin North East Romania. Eur. Plann. Stud. 24(8), 1527–1543 (2016). https://doi.org/10.1080/09654313.2016.1184233
12. Ranga, M.: Smart specialization as a strategy to develop early stage regional innovationsystems. Eur. Plann. Stud. 26(11), 2125–2146 (2018). https://doi.org/10.1080/09654313.2018.1530149
13. Foray, D.: From smart specialisation to smart specialisation policy. Eur. J. Innov. Manage.17(4), 492–507 (2014). https://doi.org/10.1108/EJIM-09-2014-0096
14. McCann, P., Ortega-Argilés, R.: Smart specialisation, regional growth and applications toEU cohesion policy. Reg. Stud. 49(8), 1291–1302 (2015). https://doi.org/10.1080/00343404.2013.799769
15. McCann, P.: The Regional and Urban Policy of the European Union. Edward ElgarPublishing, Cheltenham, UK, Northamton, MA, USA (2015)
16. European Union: Regional policy for smart growth in Europe 2020, p. 7. EU PublicationsOffice, Brussels (2011)
17. McCann, P.: The Regional and Urban Policy of the European Union, p. 160. Edward ElgarPublishing, Cheltenham, UK, Northamton, MA, USA (2015)
18. Badescu, G., Uslaner, E.: Social Capital and the Transition to Democracy. Routledge,London (2004)
19. Koczinszky, G., Benedek, J.: Contributions to the impact assessment of network cooperationamong social enterprises. Theor. Methodol. Pract. Club Econ. Miskolc 15(2), 23–28 (2019)
20. Rodrígez-Pose, A., Ketterer, T.: Institutional change and the development of lagging regionsin Europe. Reg. Stud. 54(7), 974–986 (2020). https://doi.org/10.1080/00343404.2019.1608356
21. McCann, P., Ortega-Argilés, R.: Perspectives on smart specialisation policies in laggingregions. In: Barzotto, M., Corradini, C., Fai, F.M., Labory, S., Tomlinson, P.R. (eds.)Revitalising Lagging Regions: Smart Specialisation and Industry 4.0, pp. 17–27. Taylor &Francis, Oxon (2019)
22. Barzotto, M., Corradini, C., Fai, F.M., Labory, S., Tomlinson, R.: An extra-regionalcollaborative approach to smart specialisation. In: Barzotto, M., Corradini, C., Fai, F.M.,Labory, S., Tomlinson, P.R. (eds.) Revitalising Lagging Regions: Smart Specialisation andIndustry 4.0, pp. 29–41. Taylor & Francis, Oxon (2019)
34 P. Szávics and J. Benedek
https://www.oecd.org/cfe/regional-policy/Tsipouri(2018)FosteringInnovationInLessDevelopedRegions.pdf

23. McCann, P., Ortega-Argilés, R.: Perspectives on smart specialisation policies in laggingregions. In: Barzotto, M., Corradini, C., Fai, F.M., Labory, S., Tomlinson, P.R. (eds.)Revitalising Lagging Regions: Smart Specialisation and Industry 4.0, pp. 17–27, p. 19.Taylor & Francis, Oxon (2019)
24. Potter, J., Lawton Smith, H.: Smart specialisation in Eastern Europe: insights from twolagging Polish regions. In: Barzotto, M., Corradini, C., Fai, F.M., Labory, S., Tomlinson, P.R. (eds.) Revitalising Lagging Regions: Smart Specialisation and Industry 4.0, pp. 43–53.Taylor & Francis, Oxon (2019)
25. McCann, P., Ortega-Argilés, R.: Perspectives on smart specialisation policies in laggingregions. In: Barzotto, M., Corradini, C., Fai, F.M., Labory, S., Tomlinson, P.R. (eds.)Revitalising Lagging Regions: Smart Specialisation and Industry 4.0, pp. 17–27, p. 18.Taylor & Francis, Oxon (2019)
26. European Union: Guide to Research and Innovation Strategies for Smart Specialisations(RIS 3), p. 52. European Commission, Brussels (2012)
27. Foray, D.: Smart Specialisation. Opportunities and Challenges for Regional InnovationPolicy, p. 42. Routledge, London (2015)
28. Gianelle, C., Guzzo, F., Miesykowski, K.: Smart Specialisation atWork: Assessing InvestmentPriorities. JRC Technical Reports, JRC113433. European Commission, Seville (2018)
29. Gianelle, C., Guzzo, F., Miesykowski, K.: Smart specialisation: what gets lost in translationfrom concept to practice? Reg. Stud. (2019). https://doi.org/10.1080/00343404.2019.1607970
30. Benedek, J., Török, I., Máthé, C.: Evidence-based designation of development regions inRomania. Reg. Stat. 8(1), 1–20 (2018). https://doi.org/10.15196/RS080105
31. MRDPA (Ministry of Regional Development and Public Administration).Methodology for theelaboration of the Framework Document for Smart Specialisation (2016). http://www.adrse.ro/Documente/Planificare/DCR/Metodologie_realizarea_DCR.pdf. Accessed 04 Sep 2019
32. Benedek, J.: The role of urban growth poles in regional policy: the Romanian case. In:Calabró, F., Della Spina, L. (eds.) 2nd International Symposium on New MetropolitanPerspectives – Strategic Planning, Spatial Planning, Economic Programs and DecisionSupport Tools, Through the Implementation of Horizon/Europe 2020. ISTH2020. ReggioCalabria (Italy), 18–20May 2016. Procedia-Social and Behavioural Sciences, vol. 223, pp. 1–986, 285–290. Elsevier, Amsterdam (2016). https://doi.org/10.1016/j.sbspro.2016.05.368
33. Benedek, J., Varvari, Ș., Litan, C.: Chapter 8: urban growth pole policy and regionaldevelopment: old wine in new bottles? In: Lang, T., Görmar, F. (eds.) Regional and LocalDevelopment in Times of Polarization. Re-Thinking Special Policies in Europe, pp. 173–196. Palgrave/MacMillan, Basingstoke (2019). https://doi.org/10.1007/978-3-319-67277-9
Smart Specialisation Priorities of Less Developed Regions 35

Open Access This chapter is licensed under the terms of the Creative Commons Attribution 4.0International License (http://creativecommons.org/licenses/by/4.0/), which permits use, sharing,adaptation, distribution and reproduction in any medium or format, as long as you give appro-priate credit to the original author(s) and the source, provide a link to the Creative Commonslicense and indicate if changes were made.The images or other third party material in this chapter are included in the chapter's Creative
Commons license, unless indicated otherwise in a credit line to the material. If material is notincluded in the chapter's Creative Commons license and your intended use is not permitted bystatutory regulation or exceeds the permitted use, you will need to obtain permission directlyfrom the copyright holder.
36 P. Szávics and J. Benedek
Sustainable Development and TransitionManagement: A New Approach for European
Peripheral Areas
Vincenzo Provenzano(&), Maria Rosaria Seminara,and Massimo Arnone
SEAS, University of Palermo, Viale delle Scienze Ed.13, 90128 Palermo, [email protected]
Abstract. This paper on Europe as a sustainable economy and its policy forperipheral areas contributes to the analysis on the relationship between Tran-sition Management and new approaches to regional development. It follows thatregions are different ecosystems which require not only conventional macroe-conomic visions for development processes, but also a precise spatial approachbased on different levels of geographical aggregation. The physical environ-ment, therefore, becomes a useful element not only to analyse the transitionmechanisms, but also as a constitutive part of economic, social and environ-mental changes in the short, medium and long term. A number of interestingaspects are examined and the concept of Living Labs as a modus operandi ofTransition Management is indicated according to the Quintuple Helix model,which requires large-scale public participation, both in the structuring ofproblems as well as the dynamic change in political agendas. The authorsunderline how, in an era of constant transformation, ecosystem managementcontributes to ecological and economic resilience as well as social flexibilityneeded to deal with and challenge the economic crisis as well as the mistrust thatcitizens have towards the European institutions. This paper, founded on anecosystem approach, aims to contribute to the debate on the review of theEuropean Cohesion Policy.
Keywords: Transition management � Living labs � Cohesion policy
1 Introduction
This study, by taking into consideration the growing inequalities across Europe, offers afirst analysis on how to intervene on the Cohesion Policies of the European Union forthe period 2021–2027. Horizontal policies, such as infrastructure, human capital and aproperty rights system, have shown to have positive effects only in developed regions,whilst this has not been the case for the less developed ones. The same quest for “goodpolicies” of the Smart Specialization Strategies (S3) was an important element of theEU 2020 innovation plan whose popularity led to a wide dissemination of concepts andapplications in regional contexts. Foray [1] (p. 6) observed that “the high flexibility ofthe concept of Smart Specialization also entails a great risk”: terms such as S3 andentrepreneurial discovery are now routine in EU cohesion policy, however its
© The Author(s) 2020C. Bevilacqua et al. (Eds.): NMP 2020, SIST 177, pp. 37–46, 2020.https://doi.org/10.1007/978-3-030-52869-0_4

implementation and true impact has shown no significant results on the less developedregions. A variable however that is somewhat overlooked is that of the physicalenvironment, being an essential element of the Quintuple Helix Model.
In this study we address the documented lack of a clear European Cohesion Policythat highlights the need to analyse the link between the transition period after the GreatRecession and envisage new guidelines for development in lagging regions. As aprerequisite for said analysis, the first step is to trace Europe as a sustainable economy.In doing so, we aim to establish a new Transition Management concept that could assistas a mixing framework for quality analysis, addressing the role of new notions forsustainability transition and thus allowing for more accurate policy recommendations.
Recent empirical results on the Great Recession Annoni [2] indicate how Europeanregions diverge in their ability to recover from economic shocks. In particular, the coredeveloped regions experience significant growth and spill-over effects to neighbouringregions due to higher investment shares, the presence of an economic structure basedon advanced value-added sectors, as well as high quality institutions. In marginalregions, the increase of higher education and training level as well as advancedexpertise in information and communication technologies (ICT) all have an influenceon the regional GDP per capita.
European policymakers, most likely reassured by these results, confirm the EU’sprevious Cohesion Policy yet the large economic gap and social discontent in Europeillustrates a different approach. In the second paragraph, we therefore illustrate howEurope is an ecosystem based on its territorial elements. The Transition Managementapproach is then presented in the third paragraph illustrating it as a sustainable inno-vation system capable of reacting to a dynamic timeframe. In this setting the imple-mentation of a Quintuple Helix Model together with the Territorial Living Lab aredesigned to implement an improved and multi-dimensional approach to regionaldevelopment. In conclusion, the authors explore how certain aspects of a more activerole of the environment as a cross-setting variable for growth.
2 Europe and Peripheral Areas: Sustainability and LocalStrategies for Growth
In September 2015, the United Nations (UN) General Assembly adopted a globaldevelopment agenda for all countries and stakeholders to use as a blueprint for progresson economic, social, and environmental sustainability. The 2030 Agenda for Sus-tainable Development and its seventeen Sustainable Development Goals (SDGs) bound193 Member States to ensure sustained and inclusive economic growth, social inclu-sion, and environmental protection, fostering peaceful, just, and inclusive societiesthrough a new global partnership.
Europe intends to adopt the objectives outlined in the 2030 Agenda. The imple-mentation of these objectives involves the evolution from a linear to a circular econ-omy, the sustainability from farm to consumer, creating a global food and agriculturesystem, a clean and resilient energy sector, as well as a regulated social investmentsystem, which includes education, healthcare, gender equality and rural development.We are therefore obliged to balance out the different aspects such as economic, social,
38 V. Provenzano et al.
environmental, as well as institutional sustainable development. In this perspective,Cohesion Policy at European level should play a key role by further promoting inte-gration and economic and social equality.
The main objective of the European Cohesion Policy is the reduction of structuralgaps, at both international as well as intranational level. Growth differentials are at theheart of the continuing European debate which questions the mechanisms underlyingthe growing gaps as opposed to the supporters of automatic economic convergenceprocesses.
EU regional and urban development policies defined as Cohesion Policies accountfor approximately a third of the EU’s multiannual budget. A fundamental characteristicis that Cohesion Policy is managed according to a multilevel governmental scheme thatincludes national governments, regional administration and local communities [3].
In recent years the economic and social results have been widely discussed withopposing views: one study indicates that the differentials have increased [4], whereasother authors believe that they have diminished [5]. Cohesion policies in particular,tend to favour the most competitive European areas by increasing regional gaps. Thenew Cohesion Policy 2021–2027 appears, however, to place resources where they aremost needed. The new criteria include the areas that have higher levels of youthunemployment, low levels of education, measures related to climate change and thelevel of migrant integration. The 2021–2027 Cohesion Policy framework goes evenfurther at a local level: it supports the development of local growth strategies by urban,local or other territorial authorities, which are now expected to be put in charge of, or atleast involved in, the selection of EU-funded projects. It also supports the continuationof “Community-Led Local Development”, namely the creation of local growthstrategies by action groups involving local authorities, civil society and businesspartners.
The socio-economic inequalities between different geographical regions are achallenge faced by many countries. The core-periphery model links the interrelatedgaps in demographic and economic conditions to the spatial fields. Since the “core” is ahighly urbanized region in which both population and economic activity are concen-trated, the “periphery” is distinguished from the core by its sparse population andlagging economic development [6]. The concentration of long-term unemployment,education deficit, growing poverty and outward migration of residents, are oftenassociated with peripheral and low-growth regions. Such regions can be found in bothdeveloped as well as less developed countries.
It is therefore necessary to look at the growing disparity between central andbordering or rural areas. In the European Union (EU), rural regions cover 57% of theterritory and include 24% of the population [7].
Rural regions face significant challenges in comparison to other regions [8]. Ruralterritories are characterized from distance to markets and services [9] as well as from adecline in employment in dominant agricultural sector [10]. The major difficultiesencountered in these areas are the absence of employment opportunities, [11] andlimited access to public services such as education and health [12]. The question ofrural development is on the agenda of various governments and institutions like theEuropean Commission, OECD and the United Nations [13]. The progressively risingdepopulation of rural areas has led European governments to devise strategies to
Sustainable Development and Transition Management 39

encourage the development of these areas and their connected sectors. Unbalanceddevelopment is a typical feature of the European economic landscape. It is for thisreason that it remains essential, in line with the principle of solidarity, to promotediscussions on territorial production and wealth in Europe. The initial structuralcharacteristics and diverging dynamics in terms of industry decline, and growth of highproductivity services, explain the presence of distinctive regions which require specificeconomic policy action needed for recovery and structural change.
Recent empirical studies based on a neoclassical growth modelling approach [2]demonstrate how the core European regions have better institutions, and an economyspecialised in higher-value-added sectors significantly boost domestic growth, and howincreased investment also induces positive spill-over effects to neighbouring regions.
In other words, macroeconomic approaches to growth presuppose the existence ofunique models, abstractly conceived and applicable to any territorial context. In doingso, economic laws overlook the territory that exclusively represents the place whichcauses the effects of general development process, that is a “container space” of eco-nomic and social processes.
It is therefore possible to say that regional policies play a leading role particularly inthose regions that are in disadvantaged areas. The involvement of local actors becomesfundamental in the development of their territory. Sociological and economic theoriesconfirm the existence of possible synergy effects in the implementation of developmentpolicies, deriving from the dialogue between institutions and civil society, expandingthe number of subjects participating in the definition of a local growth strategy [14]. Anongoing debate is that of the quality and hierarchy of government related to the degreeof administrative decentralization. The accountability for regional prosperity may bemanaged at central or local level, suggesting, in the second case, a transition towards aneoliberal vision of the governance process as a guarantor of the citizens’ well-beingand autonomy.
In this context, the place-based related to new regional development ideas [15]open new aspects of analysis. A place-based strategy may be used to identify positiveelements for territorial development to decipher the main configurations of the socialand relational structures existing in the territory [16].
At local level, the founding elements of development, the availability of naturalresources, input factors and infrastructure, namely the presence of a combination ofadvantages, open new distinctive means of growth with significant a level of entre-preneurial creativity and discovery. An innovative combination of local factorsdetermines synergies and agglomerate new ways of cooperation processes [17]. Fur-thermore, the presence of public-private networks, attractive cultural and naturalenvironments, as well as the presence of processes which increase innovation, are allcrucial elements in the low-income areas. In this way an eco-system innovationapproach becomes a key factor in the development of marginal areas, both in terms ofdiversification and increased competitiveness, as well as in relation to new forms ofgovernance [18].
40 V. Provenzano et al.

3 Transition Management: A New Vision for SustainableDevelopment
The European Union has spoken of ecological transition by treating it at as a challengefor the future of the Union as well as the whole world, and treating it as a fertile groundfor new economic possibilities [19]. The transition can be defined as an emergingapproach to facilitate the processes of change and innovation towards a more sus-tainable future. Sustainable Transition is becoming increasingly popular to study anddevelop multi-dimensional and long-term systemic innovation processes towards newmethods of production and sustainable consumption. Sustainable Transition mustembrace a systemic approach that, in addition to considering individual problems andsectors, must be positioned at a wider level to solve complex problems and facilitate theidentification of connections and feedback between the various components; [20, 21].
Sustainable development goals can be achieved through a shared vision and astructured process, meaning a Transition Management approach could potentiallychange society in the middle and the long term. The current policy of innovationprocesses has not brought the expected results as demonstrated by the widening ofterritorial gaps between EU Member States. The unidirectional approach of develop-ment policies has not achieved the expected results. Transition Management disruptsthe old planning technique and it implements a model with a more process-orientedapproach. The Transition Management method can be considered as a model thatcombines growth, innovation, and the environment. These topics are currently thecentre of political debate in an era of economic, social and cultural transition such asthe one we are experiencing.
The operational structure of Transition Management is divided into four phases:strategic, tactical, operational and reflective [22]. It is a cycle that includes collectivestructuring of problems, controlled experimentation and an evaluation of the policies inplace. The structure is cyclical, there is no starting point, yet these phases can followone another without a consequential order.
The Transition Management Cycle, [23, 24] is based on the interaction of theo-retical reflections and practical experiments.
Transition Management provides transversal tools for solving specific problems. Itis characterized by a dynamic vision of social phenomena and a multilevel approach toproblem-solving. Its theoretical structure based on dynamic and complex systems isreinforced by an operating system divided into four phases which directly involves thesocial players (Fig. 1).
Sustainable Development and Transition Management 41
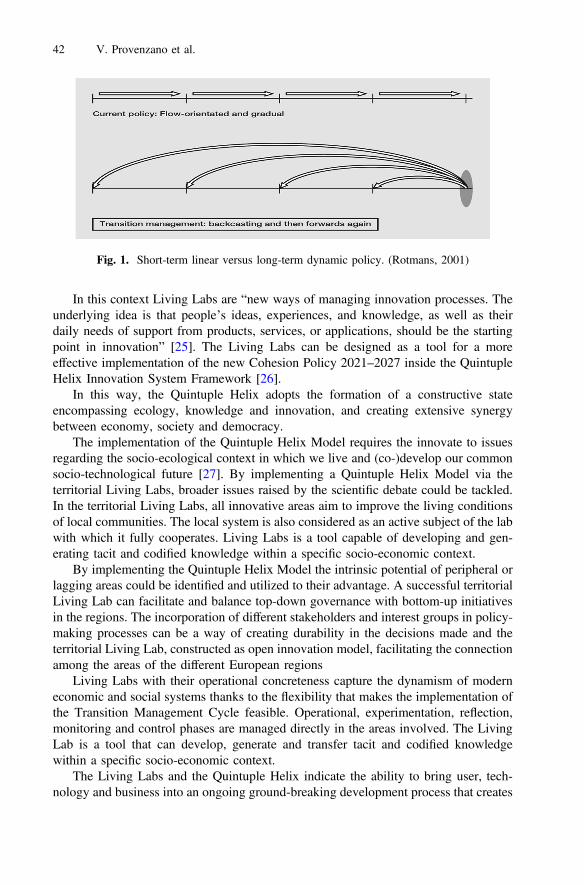
In this context Living Labs are “new ways of managing innovation processes. Theunderlying idea is that people’s ideas, experiences, and knowledge, as well as theirdaily needs of support from products, services, or applications, should be the startingpoint in innovation” [25]. The Living Labs can be designed as a tool for a moreeffective implementation of the new Cohesion Policy 2021–2027 inside the QuintupleHelix Innovation System Framework [26].
In this way, the Quintuple Helix adopts the formation of a constructive stateencompassing ecology, knowledge and innovation, and creating extensive synergybetween economy, society and democracy.
The implementation of the Quintuple Helix Model requires the innovate to issuesregarding the socio-ecological context in which we live and (co-)develop our commonsocio-technological future [27]. By implementing a Quintuple Helix Model via theterritorial Living Labs, broader issues raised by the scientific debate could be tackled.In the territorial Living Labs, all innovative areas aim to improve the living conditionsof local communities. The local system is also considered as an active subject of the labwith which it fully cooperates. Living Labs is a tool capable of developing and gen-erating tacit and codified knowledge within a specific socio-economic context.
By implementing the Quintuple Helix Model the intrinsic potential of peripheral orlagging areas could be identified and utilized to their advantage. A successful territorialLiving Lab can facilitate and balance top-down governance with bottom-up initiativesin the regions. The incorporation of different stakeholders and interest groups in policy-making processes can be a way of creating durability in the decisions made and theterritorial Living Lab, constructed as open innovation model, facilitating the connectionamong the areas of the different European regions
Living Labs with their operational concreteness capture the dynamism of moderneconomic and social systems thanks to the flexibility that makes the implementation ofthe Transition Management Cycle feasible. Operational, experimentation, reflection,monitoring and control phases are managed directly in the areas involved. The LivingLab is a tool that can develop, generate and transfer tacit and codified knowledgewithin a specific socio-economic context.
The Living Labs and the Quintuple Helix indicate the ability to bring user, tech-nology and business into an ongoing ground-breaking development process that creates
Fig. 1. Short-term linear versus long-term dynamic policy. (Rotmans, 2001)
42 V. Provenzano et al.
real-life environments. These concepts support long-term cooperation, co-creativeresearch, and development by involving the user in the innovation process for ‘sensing,prototyping, validating and refining complex solutions in multiple and evolving real-life contexts. The long-term cooperation between researchers, companies, and end-users revert traditional methods and the Quintuple Helix is able to boost assets which ina classical non-spatial economic model tend not to be valorised.
4 Conclusions
This paper on Europe as a sustainable economy and its policy for marginal areascontributes to the analysis on the relationship between Transition Management and newconducts of regional development in three ways.
First, the Quintuple Helix Innovation Framework identifies the importance of theenvironment within the processes of innovation and regional development. It followsthat regions and local areas are different ecosystems and therefore require not onlyconventional macroeconomic visions for development processes but also an ecosystemapproach. Second, the paper aims to define Transition Management as a specificecosystem change process. The environment, therefore, becomes a useful element notonly to analyse the transition mechanisms, but as a constitutive element of economic,social and environmental changes in the short, medium and long term. Third, weacknowledge that intervention policies cannot be linear but follow a complex trend,with continuous backward induction processes, requiring a high degree of flexibility.
In this regard the paper aims to underline certain aspects of the role of policy insustainable transition, and some motives for which the European Union decided toreview its approach for the 2021–2027 programming period. The main reason, in short,is a common discontent amongst citizens regarding increased inequality across areas.The environment, therefore, become a cross-setting variable for change.
The results suggest some interesting trends. First, the approach of continuousadjustment is more suitable in economically and socially vulnerable areas, much moresensitive and less resilient in the presence of external shocks. Second, the peripheralareas may exploit new opportunities deriving from the economic and social innovationin their respective specific territories, avoiding any exogenous model of innovation.Third, Transition Management is a modus operandi that fits easily as an open model: itadapts to local economic systems and captures the dynamism and complexity ofeconomic and social phenomena. It also proposes a multi-layered structure with theinvolvement of different social actors. Finally, it is a model that makes democracy anecessary condition for its application, requiring broad public participation both in thestructuring of problems and in the control of the political agenda.
On the other hand, there appears to be an imminent limitation at this stage ofanalysis. As a policy tool, the building capacity of lagging regions to adopt a flexibleapproach related to the logical framework of Transition Management requires a specificgovernance method able to quickly re-evaluate all different paths of development.A corollary of this potential drawback is the implementation of reliable and well-defined indicators needed to support the decision-making process.
Sustainable Development and Transition Management 43
The authors underline how we are now in an era of a deep transformation in whichecosystem management must build and maintain ecological and economic resilience, aswell as the need for social flexibility in order to cope with economic and territorialissues, innovate, and adapt.
At this stage precise results cannot be portrayed. However, it is clear that a suc-cessful environmental Living Lab can facilitate and offset top-down governance withbottom-up initiatives in a local area. This study most likely outlines an operatingmethod as opposed to indicating a model of analysis. Nevertheless, certain observationsmay prove useful in the wider debate about the difficulty of applying policy in terms ofits ability to reduce economic and territorial disparity between and within Europeanregions, which remains a significant challenge for Europe and its Cohesion Policy.
Acknowledgment. The authors would like to thank the anonymous reviewers for the con-structive feedback.
This research is part of the TREnD project (Transition with Resilience for EvolutionaryDevelopment), which has received funding from the European Union’s Horizon 2020 researchand innovation program under the Marie Skłodowska-Curie grant agreement No. 823952.
References
1. Foray, D.: The concept of the “Entrepreneurial Discovery Process”. In: Kyriakou, D.,Martinez, M.I., Perianez-Forte, I., Rainoldi, A. (eds.) Governing Smart Specialisation.Routledge (2017)
2. Annoni, P., De Dominicis, L., Prognos, N.K.: The Great Recession: Main Determinants ofRegional Economic Resilience in the EU. EU Working Paper, December 2019
3. Fratesi, U., Wishlade, F.G.: The impact of European Cohesion Policy in different contexts.Reg. Stud. 51(6), 817–821 (2017)
4. Leonardi, R.: Cohesion in the European Union. Reg. Stud. 40(2), 155–166 (2006)5. Boldrin, M., Canova, F.: Inequality and convergence in Europe’s regions: Reconsidering
European regional policies. Econ. Pol. 32, 205–253 (2001)6. Friedmann, J.: Urbanization, Planning, and National Development. SAGE Publications,
London (1973)7. European Commission: Staff Working Document a View of Employment, Growth and
Innovation in Rural Areas. European Commission, Brusssels (2012)8. Brown, D.L., Schafft, K.A.: Rural People & Communities in the 21st Century: Resilience &
Transformation. Polity Press, Cambridge (2011)9. OECD: The New Rural Paradigm Policies and Governance. OECD, Paris (2006)10. Terluin, I.J.: Differences in economic development in rural regions of advanced countries: an
overview and critical analysis of theories. J. Rural Stud. 19(3), 327–344 (2003)11. Bosworth, G.: Characterising rural businesses–tales from the paperman. J. Rural Stud. 28(4),
499–506 (2012)12. Lehmann, U., Dieleman, M., Martineau, T.: Staffing remote rural areas in middle- and low-
income countries: a literature review of attraction and retention. BMC Health Serv. Res.8, 19 (2008). https://doi.org/10.1186/1472-6963-8-19
13. Pato, M.L., Teixeira, A.: Twenty years of rural entrepreneurship: a bibliometric survey. Soc.Ruralis 56, 1–26 (2014). https://doi.org/10.1111/soru.12058
44 V. Provenzano et al.

14. Ruzza, C.: Europe and Civil Society: Movement Coalitions and European Governance.Manchester University Press, Manchester-New York (2004)
15. Barca, F.: An Agenda for a Reformed Cohesion Policy: A Place-Based Approach to MeetingEuropean Union Challenges and Expectations. Independent Report Prepared at the Requestof the European Commissioner for Regional Policy. Danuta Hübner. European Commission,Brussels (2009)
16. Provenzano, V., Arnone, M., Seminara, M.R.: The links between smart specialisationstrategy, the quintuple helix model and living labs. In: Bisello, A., Vettorato, D., Laconte, P.,Costa, S. (eds.) SSPCR 2017. GET, pp. 563–571. Springer, Cham (2018). https://doi.org/10.1007/978-3-319-75774-2_38
17. Camagni, R.: Le ragioni della coesione territoriale: contenuti e possibili strategie di policy.Sci. Reg. III(2), 97–111 (2004)
18. Provenzano, V., Seminara, M.R.: Europe 2020 strategy and new policies for marginal areas.Adv. Eng. 11, 53–58 (2014)
19. European Commission. Reflection paper towards a sustainable Europe by 2030, Bruxelles(2019)
20. Geels, F.W.: Technological transitions as evolutionary reconfiguration processes: a multi-level perspective and a case-study. Res. Pol. 31(8–9), 1257–1274 (2002)
21. Rotmans, J., Kemp, R., Van Asselt, M.: More evolution than revolution: transitionmanagement in public policy. Foresight 3(1), 15–31 (2001)
22. Loorbach, D.: Transition management: governance for sustainability. In: ConferenceGovernance and Sustainability ‘New Challenges for the State, Business and Civil Society’,Berlin (2002)
23. Loorbach, D.: Transition Management: New Mode of Governance for SustainableDevelopment. International Books, Utrecht (2007)
24. Loorbach, D., Rotmans, J.: Managing transitions for sustainable development. In: Xander,O., Wieczorek, A. (eds.) Understanding Industrial Transformation - Views from DifferentDisciplines, pp. 187–206. Springer, Dordrecht (2006). https://doi.org/10.1007/1-4020-4418-6_10
25. Bergvall-Kareborn, B., Stahlbros, A.: Living lab: an open and citizen-centric approach forinnovation. Int. J. Innov. Reg. Dev. 1(4), 356–370, 200 (2009)
26. Carayannis, E.G., Grigoroudis, E., Campbell, D.F.J., Meissner, D., Stamati, D.: Theecosystem as Helix: an exploratory theory building study of regional co-opetitiveentrepreneurial ecosystems as quadruple/quintuple helix innovation models. R&D Manage.48(1), 148–162 (2017)
27. Baccarne, B., Logghe, S., Schuurman, D., De Marez, L.: Governing quintuple helixinnovation: urban living labs and socio-ecological entrepreneurship. Technol. Innov.Manage. Rev. 6(3), 22–30 (2016)
Sustainable Development and Transition Management 45

Open Access This chapter is licensed under the terms of the Creative Commons Attribution 4.0International License (http://creativecommons.org/licenses/by/4.0/), which permits use, sharing,adaptation, distribution and reproduction in any medium or format, as long as you give appro-priate credit to the original author(s) and the source, provide a link to the Creative Commonslicense and indicate if changes were made.The images or other third party material in this chapter are included in the chapter's Creative
Commons license, unless indicated otherwise in a credit line to the material. If material is notincluded in the chapter's Creative Commons license and your intended use is not permitted bystatutory regulation or exceeds the permitted use, you will need to obtain permission directlyfrom the copyright holder.
46 V. Provenzano et al.

Contextualizing Transition: A MultiscaleApproach to Making Resilience-Oriented
and Place-Sensitive Strategies
Carmelina Bevilacqua(&) , Yapeng Ou , Pasquale Pizzimenti ,and Giada Anversa
CLUDSLab, PAU Department, Mediterranea University of Reggio Calabria,89124 Reggio Calabria, [email protected]
Abstract. The widening of regional disparities remains a critical concern in thepolitical and academic debate at global scale. Given the scope of the phe-nomenon, recent evidence indicates how growing regional divergences areincreasingly jeopardizing social cohesion, fueling inequalities even withinregions. The dichotomy between less developed and core regions seems to losethe centrality in the political agenda. An example is provided by the newgeography of knowledge that is giving rise to a complex divergence that restsalso on the different internal regional contexts’ conditions. Regions are exposedto multidimensional shocks and stresses questioning territories’ resilience andtheir ability to manage the transition process. The paper argues that regions needto enhance their resilience to transition-induced shock (dynamics) understandingthis internal complex divergence. The paper introduces the multiscale approachas a dynamic factor in the policy-making process to capture the sensitiveness ofplaces to adaptation, resilience-oriented performance, and the disruption of pathdependency - which may be considered as the main obstacle for an equitabledistribution of competitive advantage derived from innovation - and lead thepost-carbon transition required by the European Green Deal. The analysisconducted rests on the conceptual framework of the Open Access Toolkitconceived for the TREnD Research Project funded by the Horizon 2020 Pro-gram. The conceptual framework adopted, underpinned by sets of indicators thatcouple context conditions with innovation performance, can be used to exploreand identify in further studies EU settings that are more exposed to systemicrisks associated with the transition process.
Keywords: Transition � Resilience � Peripheral areas � Context conditions �Multiscale approach
1 Introduction
The widening of territorial disparities remains a major concern in the political andacademic debate in the European Union (EU). Recent evidence indicates how growingterritorial divergences are increasingly jeopardizing social cohesion, fueling politicalinstability and raising populist waves [1]. Technological progress and the associated
© The Author(s) 2020C. Bevilacqua et al. (Eds.): NMP 2020, SIST 177, pp. 47–67, 2020.https://doi.org/10.1007/978-3-030-52869-0_5

new geography of knowledge reveal how disparities between and within (core vsperiphery) regions are increasing. A growing literature advocates a reform of thecurrent place-based approach to regional development, which is no longer effectiveespecially for peripheral areas [2, 3]. The widening of these disparities across EU isopening the discussion on how to couple distributive development policies with thebenefits arising from agglomerations - to source new competitive advantages - forperipheral areas [1]. At the same time, the need to tackle the pressing climate changeside-effects issue pushed the EU Institutions to frame and launch the European GreenDeal. A new growth-strategy that “aims to transform the EU into a fair and prosperoussociety, with a modern, resource-efficient and competitive economy where there are nonet emissions of greenhouse gases in 2050 and where economic growth is decoupledfrom resource use” [4] (p. 2). The Green Deal is part of the European Commission’sStrategy to achieve the UN 2030 Agenda for Sustainable Development and target fourmajor domains of transition: i) climate, ii) energy, iii) circular economy and iv) con-struction [4]. This requires a bold and comprehensive policy response to maximizebenefits for health, quality of life, resilience and competitiveness [4]. The ability torespond to such pressing challenges is calling the attention of the EU policy debate onthe concepts of “change” and the “transition” that it implies. EU has already recognizedthe need to ensure socially fair and just transitions of climate neutrality, digitalizationand demographic change [5]. However, building a resilient society characterized bysocial fairness and prosperity through the post-2020 Cohesion Policy requires a con-ceptual and policy paradigmatic shift able to target effectively regions’ disparitiesbetween core and peripheral areas. Despite territorial cohesion is one of the mainobjectives of the Cohesion Policy, it seems that investments (structural funds) inperipheral areas have not generated territorial convergences. Truly, peripheral areas -showing demographic, labor market and economic disadvantages [6] - remain at thesame development stage despite long-term structural funds in research and innovation.Such a paradox leads to find an answer to the following question: Why peripheral areasare not able to transform technological innovation into economic developmentopportunities as the core areas do?
Three factors appear accountable to answer this question. First, peripheral areastend to be locked in an innovation paradox. Their need to increase R&D intensity andinnovation activities has long been recognized so as to catch up with their advancedcounterparts [7]. Peripheral areas commonly underinvest in R&D and innovationactivities due to lower capacity to absorb public funds earmarked for the promotion ofinnovation and to invest in innovation related activities [7]. This apparent contradictionmakes them unable to leverage their assets and potentials to boost R&D and therebybuild up competitive advantages. Second, peripheral areas show a mismatch betweenR&D activity (knowledge creation) and economic development during the innovationprocess (knowledge transfer) in peripheral areas. This mismatch and the differences inregional capabilities to cope with technological resilience are widening the gap betweencore and peripheral areas [3]. The focus of EU Research and Innovation policies todrive structural change towards knowledge and innovation has worked well in fillingthe gap on the “R&D” side but not on the “development” side - as R&D developmentsare not transformed into productivity gains [8]. This effect raises policy questionsregarding knowledge transfer processes [9]. Third, a new geography of development
48 C. Bevilacqua et al.
characterized by spatially concentrated technological innovation is ever growing. Theeconomic integration process, both regionally and globally, has favored agglomerationeconomies, fueling the concentration of higher-level economic activities and services inmajor cities [10]. This effect is seemingly intensified with the rise of high tech-ledinnovation, leading to a new geography of knowledge more concentrated inmetropolitan areas [3, 11, 12]. Whereas knowledge is an increasingly critical dimensionof competitive advantage [11], its concentration in core areas - where productivityincreases thanks to the concentration of skilled labor forces, companies and capitals -hinders the innovation diffusion process. This results in a “new landscape” of regionaldisparities characterized by not only inter-regional but intra-regional divergences [13,14]. Conversely, innovation diffusion can act as driver of industrial renewal and pro-ductivity growth, helping regions in industrial transition “catch up” with the moreproductive core/advanced areas [15].
This paper argues that on the one hand, during the transition to knowledge econ-omy, regions’ innovation and development performance and their resilience totransition-induced shocks are subject to their context conditions at different scales. Onthe other hand, addressing the more complicated issue of regional disparities requires amore nuanced recognition and understanding of places and relative context conditionsat multiple territorial scales and typologies. Therefore, the multiscale approach to theanalysis of territorial contexts allows sustaining regional economic agents to adapt andreconfigure their industrial, technological, network and institutional structures in anever-changing economic system [16], thereby improving their resilience. In the light ofthe aforementioned factors, the multiscale approach is introduced as a dynamic factorin the policy-making process to capture the sensitiveness of place to adaptation,resilience-oriented performance, and the disruption of path dependency - which may beconsidered as the main obstacle for an equitable distribution of competitive advantagedue to concentrated innovation. The paper is grounded on a complex European project,Transition with Resilience for Evolutionary Development (TREnD) – funded by theHorizon 2020 European Research Framework - aiming to: build an analytical frame-work of the context conditions of EU regions at different scales and the related tra-jectory of transition; and define how innovation can support transition-orientedregional/urban transformations and which factors can facilitate or hinder it. The mul-tiscale approach proposed in this paper results from the logic behind the Open AccessToolkit (the analytical framework envisioned by the TREnD project) based on sub-regional units of data analysis likely to introduce sensitiveness measures of adaptationtowards transition. In so doing, the paper first provides the research background andreview of the literature on regional resilience, transition, territorial scales and territorialcharacteristics from the perspective of evolutionary economic geography. Then, itexplains the multiscale approach by proposing an example consistent with the logic ofthe Open Access Toolkit in combining two indicators as explanatory variablesrespectively of context conditions and innovation performance. The results of theanalysis of covariance on a metropolitan and urban-rural territorial basis are the startingpoint for a conceptual model to contextualize transition with resilience with a multi-scale approach and characterize and an territorial contexts and related transitionpropensity of regions.
Contextualizing Transition 49
2 Literature Review
2.1 Resilience and Transition
Resilience has become a very common and fashionable concept in the academic andpolitical agenda. The responsiveness of economies in absorbing major global shocks(e.g. the economic crisis of 2008, environmental risks due to climate change) has beenthe focus of several studies [16, 17]. It is recognized that socio-economic systems needto be resilient to economic shocks to ensure both present and future economic stability,competitiveness, and high quality of life [18]. Resilience is a useful concept for ana-lyzing how regions and localities respond to and recover from shocks, and how thespatial dynamics of economic growth and development are shaped over time undersuch shocks [19]. Increasingly, resilience is conceptualized not only as regions’ abilityto accommodate shocks but also for their long-term ability to develop new growthpaths [17, 19]. This means that resilience represents a trade-off between adaptation(changes within pre-existing paths) and adaptability (ability to develop new pathways)in a situation of structural change [17, 20]. To operationalize the concept of resilienceand thereby to better support policymaking and implementation, resilience needs to beproperly measured. However, this is not a simple task. Currently, there is no main-stream approach to the measurement of resilience and, therefore, no uniform strategiesfor strengthening the resilience of economies [21]. One big challenge is the difficulty inadopting the conceptual framework of resilience for its application in the analysis ofterritories and their processes of change [22]. Indeed, developing indicator frameworksto measure resilience is a complex activity considering the diversity of context con-ditions at different territorial scales, the different geographical typologies and thecontinuous socio-economic changes due to rapid technological processes. Conse-quently, it is difficult to make a straightforward measurement of territorial resiliencecapacity [23]. Nevertheless, different groups of factors were proposed by scholars thatmay indicate and affect regional resilience (Table 1).
Table 1. Academic definitions of factors that may indicate and affect regional resilience [20].
Author(s) Resilience factors
Martin (2012) – regional dynamic growth– structure of the economy– regional export orientation & specialization– human capital– innovation rate– business and corporate culture– localization of the region– institutional arrangement in the region
Foster (2006) – regional economic capacity– regional socio-demographic capacity & community’scapacity
(continued)
50 C. Bevilacqua et al.
Also, international organizations developed and proposed different approaches andindicators frameworks with different metrics to measure resilience capacity (Table 2). Itis worth noting that the factors and indicators listed in Table 2 generally show noterritorial perspective with the exception of the development resilience analyticalapproach that considers different categories of indicators according to various spatialcontexts.
Table 1. (continued)
Author(s) Resilience factors
Briguglio et al. (2009) – macroeconomic stability– micro-economic market efficiency– good governance– social development
Koutský et al. (2012) – main macroeconomic indicators– labor market indicators, etc.
Stanickova and Melecký(2018)
– community links– human capital and socio-demographic structure– labor market– economic performance– innovation, science and research
Table 2. Resilience metrics [22]
Resilienceaspect
Definition Exampleapproach
Organization(year)
Metrics
Socio-ecological
The ability of a systemto absorb disturbance,learn and adapt, andself-organize
ResilienceAssessmentWorkbook forPractitioners
ResilienceAlliance(2010)
No use of specificindicators, attributesof factors thatenhance or eroderesilience
Development The way households,communities, nationsetc. can cope withvarious stressors toavoid poverty
A CommonAnalyticalModel forResilienceMeasurement
FSIN (2014) Provides differentcategories ofindicators thatdepend on context
Socio-economic
Shock-absorption orshock-counteractioneffects of policies on aneconomy
EconomicResilience:Definition andMeasurement
World Bank(2014)
Provides a list ofindicators that canbe used to build aresilience indicator
Community The process of acommunity to adapt to apositive trajectory offunctioning after adisturbance
Community-basedresilienceanalysis (Co-BRA)
UNDP (2013) Participatoryprocess, quantitativeindicators linked tohuman, natural,social, financial andphysical capital
Contextualizing Transition 51
Regional “resilience resonates with the growing importance of an evolutionaryperspective within economic geography” [24] (p. 2). It helps conceptualize regions in adynamic, holistic and systematic way [25] and understand the dynamics behindregional change [26]. It is recognized that the response to major shocks may exert aformative influence over how the economic landscape evolves, and - as an indicator oflong-run regional growth patterns - regional resilience “can help understand the exis-tence, persistence and evolution of long-run regional disparities” [24] (p. 4). Thisevolutionary perspective allows perceiving current regional disparities as the outcomeof the long cycle of: 1) development in the economic structure, consisting of a majorwave of technological innovation that began in the 1970s; and 2) regional evolutionaryfeatures, consisting of place-specific endowments of people and skills, firms andindustries, formal and informal institutions, innovation capacities, and their reaction tochange [1]. In this perspective, it is possible to formulate policies aimed at fostering atransition to a sustainable development, offering insights into the mechanisms thatunderlie innovations, structural change and transitions [27]. Sustainable transition callsfor fundamental shifts in socio-technological systems that result from “system dis-rupting innovations” [28]. Tödtling and Trippl [28] propose systemic and multiscalepolicy concepts for new regional industrial path development, paying more attention tothe direction of innovation and change. The EU has long pursued a structural changetowards the knowledge-based society through the focus of public policies on Researchand Innovation. However, such a policy approach is criticized for the lack of a systemicperspective and the disregard of untraded interdependencies and synergetic effectsamong firms, other organizations and policy makers [28]. Less developed territorieshave channeled fewer resources in this direction - as a proportion of GDP - despite theirneed to increase their R&D intensity and innovation activities [7]. In addition, thelimited interregional diffusion of technology and efficient production practices accountfor the large and persistent divergences in economic development across EU subna-tional regions [29].
2.2 Territorial Scales and Territorial Characteristics
As a response to the persistent socio-economic gaps among regions, the EU CohesionPolicy emphasizes the need to foster territorial development by capitalizing on terri-torial intrinsic attributes and strengths [30]. The different territorial scales (regional,sub-regional, metropolitan, city) reveal a stark difference between rural and urbanregions and between rural regions close to cities and remote ones, which suggests adifferentiated policy approach to address different challenges [31]. Moreover, economicsystems are always prone to perturbations and shocks, such as recessions, major policychanges, currency crises and technological breakthroughs that can all disrupt anddestabilize the path and pattern of economic growth [19]. It is within regional, urbanand local economies and communities that such shocks and disturbances work out theireffects and consequences [19]. Therefore, approaching territorial scales is relevant toregional development as it implies: 1) a shift from reaching convergence throughredistributive regional policies towards endogenous approaches designed to fosterterritorial features in pursuing growth and competitiveness; 2) the deployment ofinterventions designed for different spatial scales, and an emphasis on the networking
52 C. Bevilacqua et al.
and connection of places; and 3) the strengthening of sub-national governments,through the devolution of political powers, or the adoption of multi-level governance[32]. During the 2014–2020 programming period, EU instruments introduced territorialand scalar varieties into the use of Structural Funds to address in an integrated way theterritorial development needs of different regions and sub-regions, allowing interven-tions to be tailored to specificities of place and scale [30]. Many scholars argue that theneed to territorialize policies and funds allows that innovation process is not blindlyreplicated across European regions, as replication without considering local conditionsand broader regional network characteristics would produce a duplication of innovativeefforts and fragmentation [33]. “With fragmentation, regional critical mass is barelyattainable, the potential gains from scale and agglomeration vanishes, and the potentialfor complementarities within Europe diminishes” [33] (p. 6). Ultimately, this is likelyto damage the sustainability of new regional pathways and reduce the effectiveness ofthe innovation policy deployed. It is no longer viable to assume that the same drivers ofchange are effective everywhere, and the appropriate drivers will respond and deliverrequired outcomes once the right levers are activated [26]. In this direction, an inte-grated multiscale approach is useful to provide meaningful information for policy-making, as it highlights local contexts features and potentials, integrates spatial scales,and addresses the local capacity of adaptation and transformation [34]. Together withterritorial scales, regional characteristics have been increasingly considered as a factorpertinent to persisting regional disparities in the EU. First of all, the specific socio-economic characteristics of each region affect the allocation of EU funds [35]. It is alsorecognized that local endowments and unique characteristics of regions are importantterritorial capital for regional development, and that the underdevelopment of laggingregions occurs due primarily to a failure to deliver effective investments and institutions[30]. Also, regional characteristics that affect resilience-related outcomes generallydemonstrate an evolutionary feature, as it takes a long time to change them [21].Regional characteristics, such as geographical, social, and institutional conditions, areconsidered closely related with the geographical heterogeneity of R&D investments’productivity in the EU by an extensive literature [36]. These elements suggest howregional characteristics prove to be a relevant issue to be considered in designing moretailored strategies sensitive to local contexts. EU regional policies are generating dis-parate effects on different regions due to the joint force of multiple factors, such as thecharacteristics of the intervention, the structural characteristics and the specific natureof the territories involved, and finally the kind of context, meaning institutional skills,the social culture and policy-related objectives [37]. Indeed, countries showing anevident regional heterogeneity, including the ability to use structural funds and identifywinning regional development strategies, are more likely to evidence the differentiationof the effects of the EU Cohesion Policy on different regions [37]. This is especiallytrue at a time when the EU regional policies are centered on structural change. Thechanging structure of the economy interacts with the characteristics of regions togenerate a pattern of development over time, which has increasingly resulted indivergence among regions especially since the new millennium [1]. Technologicalprogress has increasingly stimulated output in advanced technologies, finance andadvanced services sectors dependent on agglomeration economies concentrated in largemetropolitan areas [1]. Consequently, regions vary not only in terms of technological
Contextualizing Transition 53

and industrial competences, but also in terms of potential evolutionary trajectories [38].This suggests that the potential evolutionary pathways of an innovation system dependon its inherited structures and existing dynamics including the adaptation or evenradical transformation (ibid.) [37].
3 Methodology
To capture both the characteristics of different contexts from a multiscale perspectiveand their conditions for innovation, we use official statistics of different territorialtypologies based on the Eurostat database. The multiscale approach proposed in thispaper results from the logic behind the Open Access Toolkit (the analytical frameworkenvisioned by the TREnD project) based on sub-regional units of data analysis likely tointroduce sensitiveness measures of adaptation towards transition. It has been recog-nized that regional statistics alone cannot reveal the full and sometimes complex pictureof what is happening at a finer level within the EU. Moreover, statistical information ata sub-regional level is an important tool for highlighting specific regional and territorialcharacteristics [39]. Therefore, a broad range of territorial typologies were integratedinto the NUTS Regulation underlining the importance of subnational statistics as aninstrument for targeted policymaking and a tool for understanding and quantifying theimpact of policy decisions in specific territories [39]. The different typologies thatconstitute the building block for official statistics within the EU [39] follow a rigorousmethodology in coupling the source of data from a plethora of administrative bound-aries, according to each member State, and the need to ground the statistical obser-vations beyond and inside the regional level, namely the NUTS 3 level. Three territorialtypologies and their territorial characteristics are investigated: cluster types, localtypology, and regional typology including other regional typologies (see Table 3).
Table 3. Definition of territorial typologies according to Eurostat [39]
Classification Territorial typology Definition
NUTS3 Urban-Rural typology Urban-rural typology is applied to NUTS3 regionsby identifying three types of region based on theshare of the rural population: predominantly rural,intermediate and predominantly urban regions
Metropolitan regions These regions are defined as urban agglomerations(NUTS3 regions or groups of NUTS3 regions)where at least 50% of the population lives inside afunctional urban area (FUA) composed of at least250,000 inhabitants
LocalAdministrativeUnits (LAU)
Degree of urbanization The local administrative units (LAUs) is codified ascities, towns and suburbs or rural areas based on acombination of geographical contiguity andpopulation density
(continued)
54 C. Bevilacqua et al.
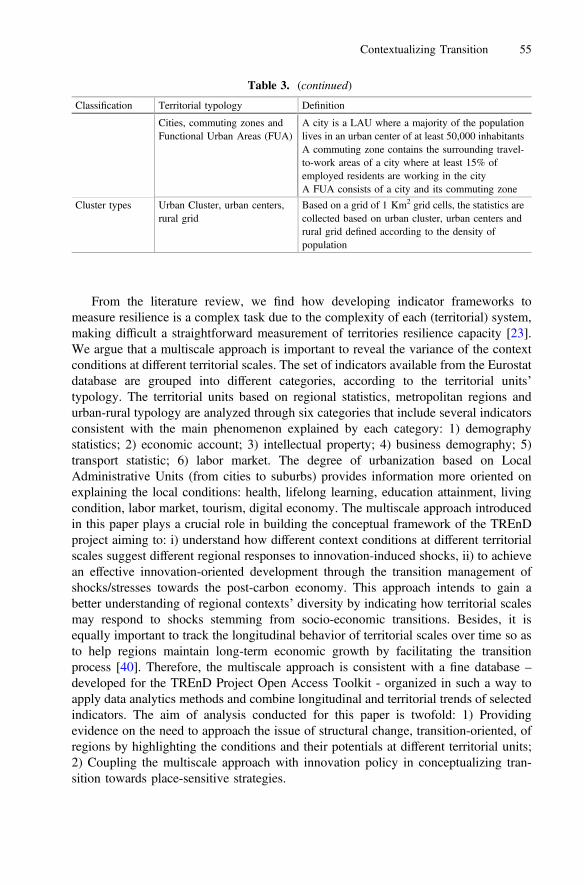
From the literature review, we find how developing indicator frameworks tomeasure resilience is a complex task due to the complexity of each (territorial) system,making difficult a straightforward measurement of territories resilience capacity [23].We argue that a multiscale approach is important to reveal the variance of the contextconditions at different territorial scales. The set of indicators available from the Eurostatdatabase are grouped into different categories, according to the territorial units’typology. The territorial units based on regional statistics, metropolitan regions andurban-rural typology are analyzed through six categories that include several indicatorsconsistent with the main phenomenon explained by each category: 1) demographystatistics; 2) economic account; 3) intellectual property; 4) business demography; 5)transport statistic; 6) labor market. The degree of urbanization based on LocalAdministrative Units (from cities to suburbs) provides information more oriented onexplaining the local conditions: health, lifelong learning, education attainment, livingcondition, labor market, tourism, digital economy. The multiscale approach introducedin this paper plays a crucial role in building the conceptual framework of the TREnDproject aiming to: i) understand how different context conditions at different territorialscales suggest different regional responses to innovation-induced shocks, ii) to achievean effective innovation-oriented development through the transition management ofshocks/stresses towards the post-carbon economy. This approach intends to gain abetter understanding of regional contexts’ diversity by indicating how territorial scalesmay respond to shocks stemming from socio-economic transitions. Besides, it isequally important to track the longitudinal behavior of territorial scales over time so asto help regions maintain long-term economic growth by facilitating the transitionprocess [40]. Therefore, the multiscale approach is consistent with a fine database –
developed for the TREnD Project Open Access Toolkit - organized in such a way toapply data analytics methods and combine longitudinal and territorial trends of selectedindicators. The aim of analysis conducted for this paper is twofold: 1) Providingevidence on the need to approach the issue of structural change, transition-oriented, ofregions by highlighting the conditions and their potentials at different territorial units;2) Coupling the multiscale approach with innovation policy in conceptualizing tran-sition towards place-sensitive strategies.
Table 3. (continued)
Classification Territorial typology Definition
Cities, commuting zones andFunctional Urban Areas (FUA)
A city is a LAU where a majority of the populationlives in an urban center of at least 50,000 inhabitantsA commuting zone contains the surrounding travel-to-work areas of a city where at least 15% ofemployed residents are working in the cityA FUA consists of a city and its commuting zone
Cluster types Urban Cluster, urban centers,rural grid
Based on a grid of 1 Km2 grid cells, the statistics arecollected based on urban cluster, urban centers andrural grid defined according to the density ofpopulation
Contextualizing Transition 55
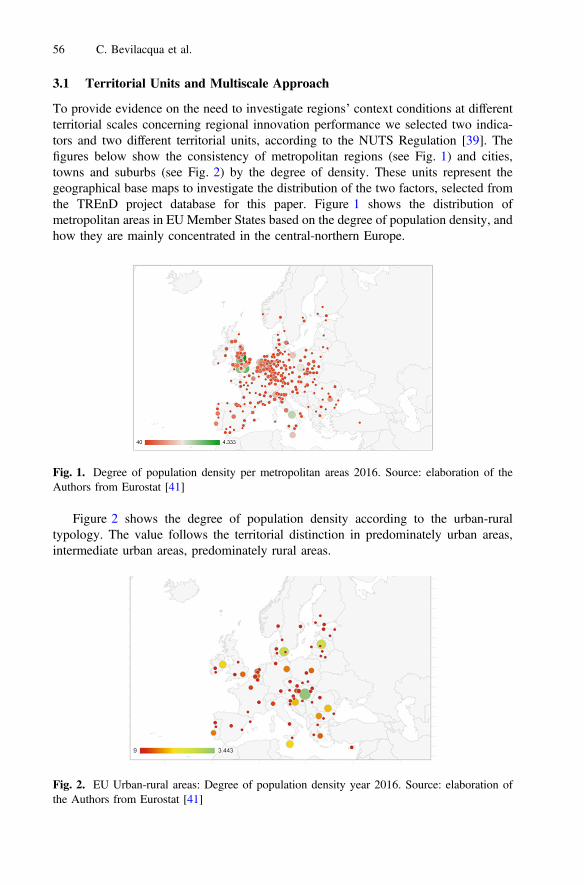
3.1 Territorial Units and Multiscale Approach
To provide evidence on the need to investigate regions’ context conditions at differentterritorial scales concerning regional innovation performance we selected two indica-tors and two different territorial units, according to the NUTS Regulation [39]. Thefigures below show the consistency of metropolitan regions (see Fig. 1) and cities,towns and suburbs (see Fig. 2) by the degree of density. These units represent thegeographical base maps to investigate the distribution of the two factors, selected fromthe TREnD project database for this paper. Figure 1 shows the distribution ofmetropolitan areas in EU Member States based on the degree of population density, andhow they are mainly concentrated in the central-northern Europe.
Figure 2 shows the degree of population density according to the urban-ruraltypology. The value follows the territorial distinction in predominately urban areas,intermediate urban areas, predominately rural areas.
Fig. 1. Degree of population density per metropolitan areas 2016. Source: elaboration of theAuthors from Eurostat [41]
Fig. 2. EU Urban-rural areas: Degree of population density year 2016. Source: elaboration ofthe Authors from Eurostat [41]
56 C. Bevilacqua et al.
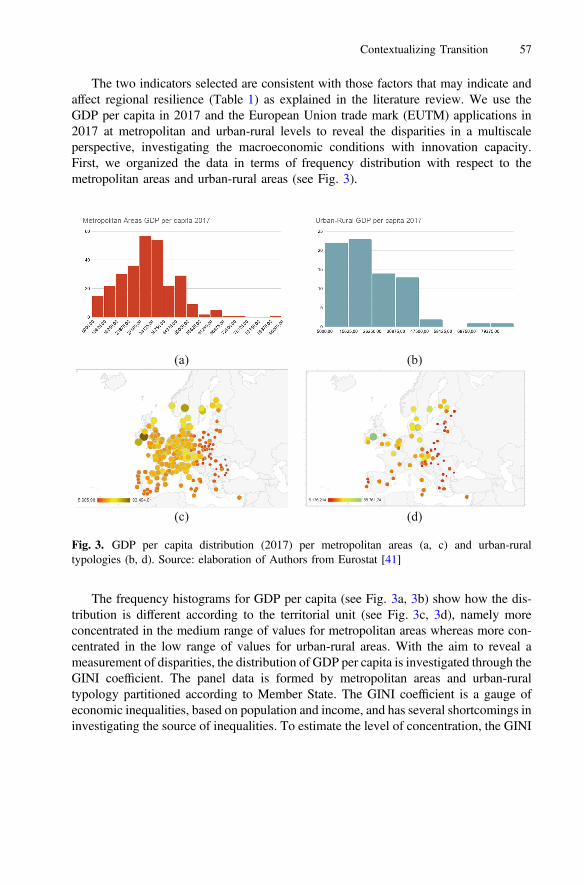
The two indicators selected are consistent with those factors that may indicate andaffect regional resilience (Table 1) as explained in the literature review. We use theGDP per capita in 2017 and the European Union trade mark (EUTM) applications in2017 at metropolitan and urban-rural levels to reveal the disparities in a multiscaleperspective, investigating the macroeconomic conditions with innovation capacity.First, we organized the data in terms of frequency distribution with respect to themetropolitan areas and urban-rural areas (see Fig. 3).
The frequency histograms for GDP per capita (see Fig. 3a, 3b) show how the dis-tribution is different according to the territorial unit (see Fig. 3c, 3d), namely moreconcentrated in the medium range of values for metropolitan areas whereas more con-centrated in the low range of values for urban-rural areas. With the aim to reveal ameasurement of disparities, the distribution of GDP per capita is investigated through theGINI coefficient. The panel data is formed by metropolitan areas and urban-ruraltypology partitioned according to Member State. The GINI coefficient is a gauge ofeconomic inequalities, based on population and income, and has several shortcomings ininvestigating the source of inequalities. To estimate the level of concentration, the GINI
(a) (b)
(c) (d)
Fig. 3. GDP per capita distribution (2017) per metropolitan areas (a, c) and urban-ruraltypologies (b, d). Source: elaboration of Authors from Eurostat [41]
Contextualizing Transition 57
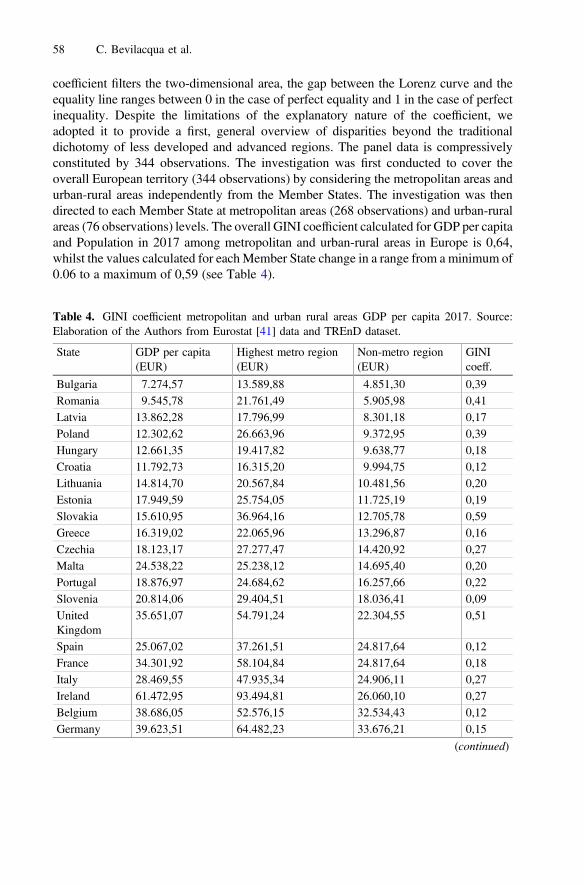
coefficient filters the two-dimensional area, the gap between the Lorenz curve and theequality line ranges between 0 in the case of perfect equality and 1 in the case of perfectinequality. Despite the limitations of the explanatory nature of the coefficient, weadopted it to provide a first, general overview of disparities beyond the traditionaldichotomy of less developed and advanced regions. The panel data is compressivelyconstituted by 344 observations. The investigation was first conducted to cover theoverall European territory (344 observations) by considering the metropolitan areas andurban-rural areas independently from the Member States. The investigation was thendirected to each Member State at metropolitan areas (268 observations) and urban-ruralareas (76 observations) levels. The overall GINI coefficient calculated for GDP per capitaand Population in 2017 among metropolitan and urban-rural areas in Europe is 0,64,whilst the values calculated for eachMember State change in a range from a minimum of0.06 to a maximum of 0,59 (see Table 4).
Table 4. GINI coefficient metropolitan and urban rural areas GDP per capita 2017. Source:Elaboration of the Authors from Eurostat [41] data and TREnD dataset.
State GDP per capita(EUR)
Highest metro region(EUR)
Non-metro region(EUR)
GINIcoeff.
Bulgaria 7.274,57 13.589,88 4.851,30 0,39Romania 9.545,78 21.761,49 5.905,98 0,41Latvia 13.862,28 17.796,99 8.301,18 0,17Poland 12.302,62 26.663,96 9.372,95 0,39Hungary 12.661,35 19.417,82 9.638,77 0,18Croatia 11.792,73 16.315,20 9.994,75 0,12Lithuania 14.814,70 20.567,84 10.481,56 0,20Estonia 17.949,59 25.754,05 11.725,19 0,19Slovakia 15.610,95 36.964,16 12.705,78 0,59Greece 16.319,02 22.065,96 13.296,87 0,16Czechia 18.123,17 27.277,47 14.420,92 0,27Malta 24.538,22 25.238,12 14.695,40 0,20Portugal 18.876,97 24.684,62 16.257,66 0,22Slovenia 20.814,06 29.404,51 18.036,41 0,09UnitedKingdom
35.651,07 54.791,24 22.304,55 0,51
Spain 25.067,02 37.261,51 24.817,64 0,12France 34.301,92 58.104,84 24.817,64 0,18Italy 28.469,55 47.935,34 24.906,11 0,27Ireland 61.472,95 93.494,81 26.060,10 0,27Belgium 38.686,05 52.576,15 32.534,43 0,12Germany 39.623,51 64.482,23 33.676,21 0,15
(continued)
58 C. Bevilacqua et al.
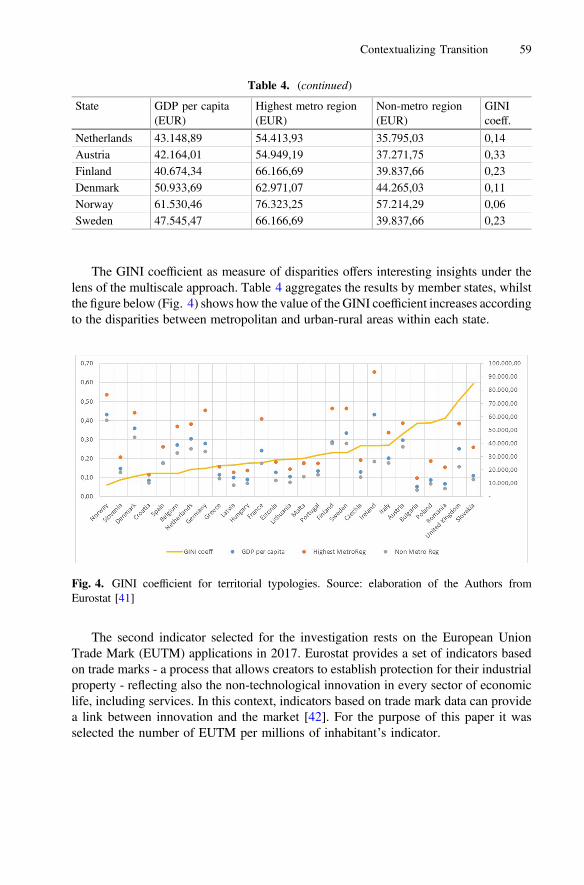
The GINI coefficient as measure of disparities offers interesting insights under thelens of the multiscale approach. Table 4 aggregates the results by member states, whilstthe figure below (Fig. 4) shows how the value of the GINI coefficient increases accordingto the disparities between metropolitan and urban-rural areas within each state.
The second indicator selected for the investigation rests on the European UnionTrade Mark (EUTM) applications in 2017. Eurostat provides a set of indicators basedon trade marks - a process that allows creators to establish protection for their industrialproperty - reflecting also the non-technological innovation in every sector of economiclife, including services. In this context, indicators based on trade mark data can providea link between innovation and the market [42]. For the purpose of this paper it wasselected the number of EUTM per millions of inhabitant’s indicator.
Fig. 4. GINI coefficient for territorial typologies. Source: elaboration of the Authors fromEurostat [41]
Table 4. (continued)
State GDP per capita(EUR)
Highest metro region(EUR)
Non-metro region(EUR)
GINIcoeff.
Netherlands 43.148,89 54.413,93 35.795,03 0,14Austria 42.164,01 54.949,19 37.271,75 0,33Finland 40.674,34 66.166,69 39.837,66 0,23Denmark 50.933,69 62.971,07 44.265,03 0,11Norway 61.530,46 76.323,25 57.214,29 0,06Sweden 47.545,47 66.166,69 39.837,66 0,23
Contextualizing Transition 59

Figure 5 shows the distribution of the EUTM indicators by metropolitan areas andurban-rural areas. Based on the frequency distribution of the indicator across the twoterritorial scales, we applied a cluster analysis to classify the values according to: i)low, ii) medium, iii) medium-high, and iv) high performances in terms of number ofEUTM per million of inhabitants with respect to the territorial units, in a range ofvalues between 0 and 1. The two figures below (see Fig. 6, 7) display the results ofcluster analysis aggregated by Members States against the EUTM indicators analyzedby Metropolitan areas (268 observations) and urban-rural areas (76 observations).
(a) (b)
(c) (d)
Fig. 5. European Trade Marks (2016) at metropolitan (a, c) and urban-rural scales (b, d)(number per millions of inhabitants). Source: elaboration of the Authors from Eurostat [41]
Fig. 6. Cluster analysis aggregated by Member State against the EUTM indicators analyzed byMetropolitan areas (268 observations). Source: elaboration of the Authors from Eurostat [41]
60 C. Bevilacqua et al.
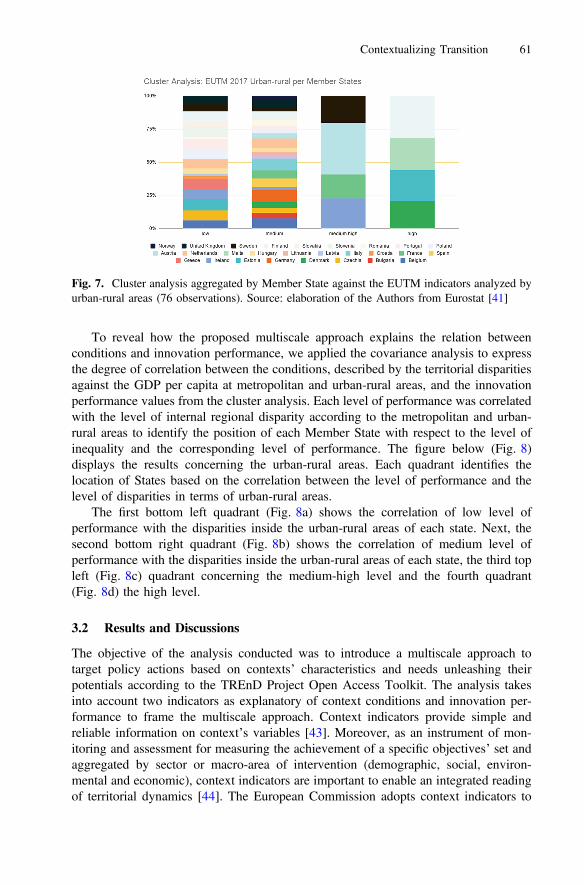
To reveal how the proposed multiscale approach explains the relation betweenconditions and innovation performance, we applied the covariance analysis to expressthe degree of correlation between the conditions, described by the territorial disparitiesagainst the GDP per capita at metropolitan and urban-rural areas, and the innovationperformance values from the cluster analysis. Each level of performance was correlatedwith the level of internal regional disparity according to the metropolitan and urban-rural areas to identify the position of each Member State with respect to the level ofinequality and the corresponding level of performance. The figure below (Fig. 8)displays the results concerning the urban-rural areas. Each quadrant identifies thelocation of States based on the correlation between the level of performance and thelevel of disparities in terms of urban-rural areas.
The first bottom left quadrant (Fig. 8a) shows the correlation of low level ofperformance with the disparities inside the urban-rural areas of each state. Next, thesecond bottom right quadrant (Fig. 8b) shows the correlation of medium level ofperformance with the disparities inside the urban-rural areas of each state, the third topleft (Fig. 8c) quadrant concerning the medium-high level and the fourth quadrant(Fig. 8d) the high level.
3.2 Results and Discussions
The objective of the analysis conducted was to introduce a multiscale approach totarget policy actions based on contexts’ characteristics and needs unleashing theirpotentials according to the TREnD Project Open Access Toolkit. The analysis takesinto account two indicators as explanatory of context conditions and innovation per-formance to frame the multiscale approach. Context indicators provide simple andreliable information on context’s variables [43]. Moreover, as an instrument of mon-itoring and assessment for measuring the achievement of a specific objectives’ set andaggregated by sector or macro-area of intervention (demographic, social, environ-mental and economic), context indicators are important to enable an integrated readingof territorial dynamics [44]. The European Commission adopts context indicators to
Fig. 7. Cluster analysis aggregated by Member State against the EUTM indicators analyzed byurban-rural areas (76 observations). Source: elaboration of the Authors from Eurostat [41]
Contextualizing Transition 61
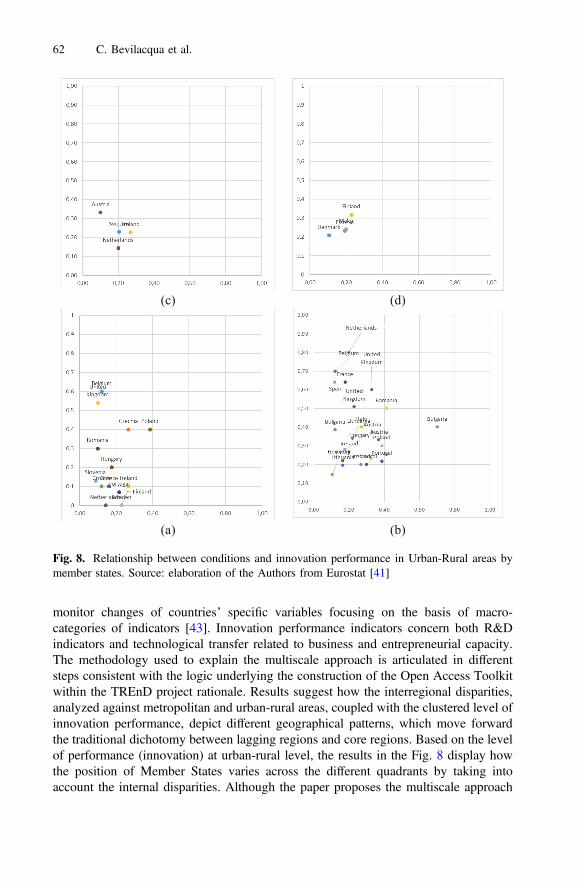
monitor changes of countries’ specific variables focusing on the basis of macro-categories of indicators [43]. Innovation performance indicators concern both R&Dindicators and technological transfer related to business and entrepreneurial capacity.The methodology used to explain the multiscale approach is articulated in differentsteps consistent with the logic underlying the construction of the Open Access Toolkitwithin the TREnD project rationale. Results suggest how the interregional disparities,analyzed against metropolitan and urban-rural areas, coupled with the clustered level ofinnovation performance, depict different geographical patterns, which move forwardthe traditional dichotomy between lagging regions and core regions. Based on the levelof performance (innovation) at urban-rural level, the results in the Fig. 8 display howthe position of Member States varies across the different quadrants by taking intoaccount the internal disparities. Although the paper proposes the multiscale approach
(c) (d)
(a) (b)
Fig. 8. Relationship between conditions and innovation performance in Urban-Rural areas bymember states. Source: elaboration of the Authors from Eurostat [41]
62 C. Bevilacqua et al.
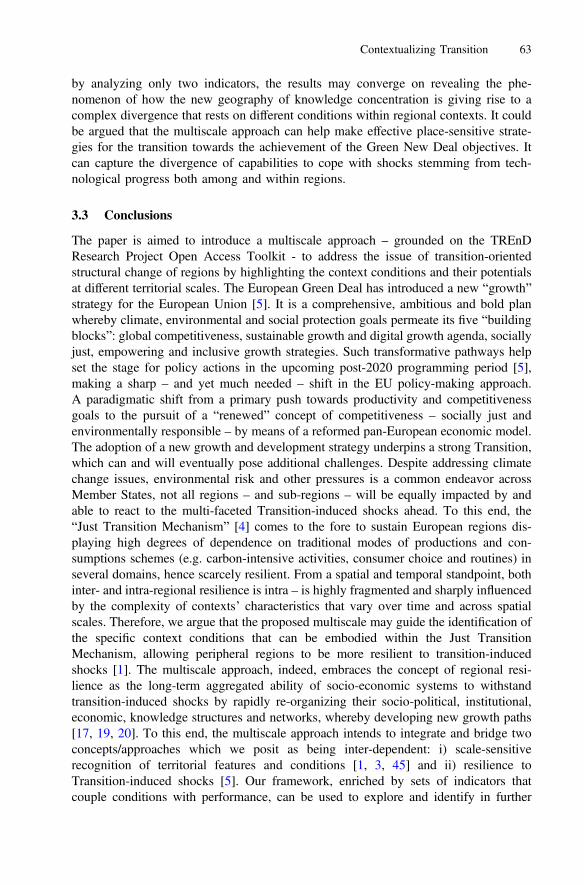
by analyzing only two indicators, the results may converge on revealing the phe-nomenon of how the new geography of knowledge concentration is giving rise to acomplex divergence that rests on different conditions within regional contexts. It couldbe argued that the multiscale approach can help make effective place-sensitive strate-gies for the transition towards the achievement of the Green New Deal objectives. Itcan capture the divergence of capabilities to cope with shocks stemming from tech-nological progress both among and within regions.
3.3 Conclusions
The paper is aimed to introduce a multiscale approach – grounded on the TREnDResearch Project Open Access Toolkit - to address the issue of transition-orientedstructural change of regions by highlighting the context conditions and their potentialsat different territorial scales. The European Green Deal has introduced a new “growth”strategy for the European Union [5]. It is a comprehensive, ambitious and bold planwhereby climate, environmental and social protection goals permeate its five “buildingblocks”: global competitiveness, sustainable growth and digital growth agenda, sociallyjust, empowering and inclusive growth strategies. Such transformative pathways helpset the stage for policy actions in the upcoming post-2020 programming period [5],making a sharp – and yet much needed – shift in the EU policy-making approach.A paradigmatic shift from a primary push towards productivity and competitivenessgoals to the pursuit of a “renewed” concept of competitiveness – socially just andenvironmentally responsible – by means of a reformed pan-European economic model.The adoption of a new growth and development strategy underpins a strong Transition,which can and will eventually pose additional challenges. Despite addressing climatechange issues, environmental risk and other pressures is a common endeavor acrossMember States, not all regions – and sub-regions – will be equally impacted by andable to react to the multi-faceted Transition-induced shocks ahead. To this end, the“Just Transition Mechanism” [4] comes to the fore to sustain European regions dis-playing high degrees of dependence on traditional modes of productions and con-sumptions schemes (e.g. carbon-intensive activities, consumer choice and routines) inseveral domains, hence scarcely resilient. From a spatial and temporal standpoint, bothinter- and intra-regional resilience is intra – is highly fragmented and sharply influencedby the complexity of contexts’ characteristics that vary over time and across spatialscales. Therefore, we argue that the proposed multiscale may guide the identification ofthe specific context conditions that can be embodied within the Just TransitionMechanism, allowing peripheral regions to be more resilient to transition-inducedshocks [1]. The multiscale approach, indeed, embraces the concept of regional resi-lience as the long-term aggregated ability of socio-economic systems to withstandtransition-induced shocks by rapidly re-organizing their socio-political, institutional,economic, knowledge structures and networks, whereby developing new growth paths[17, 19, 20]. To this end, the multiscale approach intends to integrate and bridge twoconcepts/approaches which we posit as being inter-dependent: i) scale-sensitiverecognition of territorial features and conditions [1, 3, 45] and ii) resilience toTransition-induced shocks [5]. Our framework, enriched by sets of indicators thatcouple conditions with performance, can be used to explore and identify in further
Contextualizing Transition 63
studies EU settings – profiled and classified using a place and scale-sensitive andevolutionary approach (longitudinal) – that are more exposed to systemic risks asso-ciated with the transition process.
Acknowledgements. This research is part of the TREnD project (Transition with Resilience forEvolutionary Development) which has received funding from the European Union’s Horizon2020 research and innovation program under the Marie Skłodowska-Curie grant agreementNo. 823952.
References
1. Iammarino, S., Rodríguez-Pose, A., Storper, M.: Why Regional Development matters forEurope’s Economic Future (2017). https://ec.europa.eu/regional_policy/sources/docgener/work/201707_regional_development_matters.pdf. Accessed 21 Jan 2020
2. Hassink, R.: Advancing place-based regional innovation policies. In: González-López, M.,Asheim, B.T. (eds.) Regions and Innovation Policies in Europe: Learning from the Margins(2020). Edward Elgar, Cheltenham (2020)
3. Hassink, R., Gong, H.: Six critical questions about smart specialization. Eur. Plan. Stud. 27(10), 2049–2065 (2019)
4. European Commission: The European Green Deal. Communication from The Commission ToThe European Parliament, The European Council, The Council, The European Economic AndSocial Committee And The Committee Of The Regions. Brussels, 11.12.2019. COM(2019)640 final. https://ec.europa.eu/info/sites/info/files/european-green-deal-communication_en.pdf. Accessed 19 Jan 2020
5. European Commission: A Strong Social Europe for Just Transitions. Communication fromthe Commission to the European Parliament, the Council, the European Economic andSocial Committee and the Committee of the Regions (2020). https://eur-lex.europa.eu/legal-content/EN/TXT/?uri=COM:2020:14:FIN. Accessed 31 Jan 2020
6. ESPON: Inner Peripheries in Europe: Possible Development Strategies to Overcome TheirMarginalising Effects (2018). https://www.espon.eu/inner-peripheries-brief. Accessed 19 Jan2020
7. Oughton, C., Landabaso, M., Morgan, K.: The regional innovation paradox: innovationpolicy and industrial policy. J. Technol. Transfer 27(1), 97–110 (2002)
8. Lopes, J., Ferreira, J.J., Farinha, L.: Innovation strategies for smart specialisation (RIS3):Past, present and future research. Growth Change 50(1), 38–68 (2019)
9. Andries, P., Callaert, J., Debackere, K., Du Plessis, M., Glänzel, W., Thijs, B.: Specialisationprofiles and diagnostic tools, pp. 150–168 (2013). In: OECD Innovation-driven Growth inRegions: The Role of Smart Specialisation. https://www.oecd.org/sti/inno/smart-specialisation.pdf. Accessed 19 Jan 2020
10. Lagendijk, A., Lorentzen, A.: Proximity, knowledge and innovation in peripheral regions.On the intersection between geographical and organizational proximity. Eur. Plann. Stud. 15(4), 457–466 (2007)
11. Balland, P.A., Rigby, D.: The geography of complex knowledge. Econ. Geogr. 93(1), 1–23(2017)
12. Compagnucci, F., Cusinato, A.: The knowledge economy: a new source of regionaldivergence? Revue d’Économie Régionale & Urbaine 2, 365–393 (2014)
64 C. Bevilacqua et al.
13. Butkus, M., Cibulskiene, D., Maciulyte-Sniukiene, A., Matuzeviciute, K.: What is theevolution of convergence in the EU? decomposing EU disparities up to NUTS 3 level.Sustainability 10, 1–37 (2018). https://doi.org/10.3390/su10051552
14. Iammarino, S., Rodríguez-Pose, A., Storper, M.: Regional inequality in Europe: evidence,theory and policy implications. J. Econ. Geogr. 19(2), 273–298 (2019)
15. OECD: Regions in Industrial Transition: Policies for People and Places. Paris: OECDPublishing (2019). https://doi.org/10.1787/c76ec2a1-en. Accessed 19 Jan 2020
16. Balland, P.A., Rigby, D., Boschma, R.: The technological resilience of US cities.Cambridge J. Reg. Econ. Soc. 8(2), 167–184 (2015)
17. Boschma, R.: Towards an evolutionary perspective on regional resilience. Reg. Stud. 49(5),733–751 (2015). https://doi.org/10.1080/00343404.2014.959481
18. Bruneckiene, J., Pekarskiene, I., Palekiene, O., Simanaviciene, Z.: An assessment of socio-economic systems’ resilience to economic shocks: the case of lithuanian regions.Sustainability 11(566), 1–24 (2019). https://doi.org/10.3390/su11030566
19. Martin, R., Sunley, P.: On the notion of regional economic resilience: conceptualization andexplanation. J. Econ. Geogr. 15, 1–42 (2015). https://doi.org/10.1093/jeg/lbu015
20. Stognief, N., Walk, P., Schöttker, O., Oei, P.-Y.: Economic resilience of German ligniteregions in transition. Sustainability 11(21), 1–17 (2019)
21. Stanickova, M., Melecký, L.: Understanding of resilience in the context of regionaldevelopment using composite index approach: the case of European Union NUTS-2 regions.Reg. Stud. 5(1), 231–254 (2018). https://doi.org/10.1080/21681376.2018.1470939
22. Sánchez-Zamora, P., Gallardo-Cobos, R.: Diversity, disparity and territorial resilience in thecontext of the economic crisis: an analysis of rural areas in Southern Spain. Sustainability 11,1–21 (2019). https://doi.org/10.3390/su11061743
23. European Commission: Building and measuring Europe’s resilience (2017). https://ec.europa.eu/newsroom/ENV/item-detail.cfm?item_id=604587&newsletter_id=300&utm_source=env_newsletter&utm_medium=email&utm_campaign=Beyond%20GDP&utm_content=Building%20and%20measuring%20Europes%20resilience&lang=en. Accessed 29Jan 2020
24. Martin, R.: Regional economic resilience, hysteresis and recessionary shocks. J. Econ.Geogr. 12(1), 1–32 (2012)
25. Hassink, R.: Regional resilience: a promising concept to explain differences in regionaleconomic adaptability? Cambridge J. Reg. Econ. Soc. 3, 45–58 (2010). https://doi.org/10.1093/cjres/rsp033
26. Christopherson, S., Michie, J., Tyler, P.: Regional resilience: theoretical and empiricalperspectives. Cambridge J. Reg. Econ. Soc. 3, 3–10 (2010). https://doi.org/10.1093/cjres/rsq004
27. Van den Bergh, J.C.J.M., Oosterhuis, F.: An evolutionary-economic analysis of energytransitions. In: Van den Bergh, J.C.J.M., Bruinsma, F.R. (eds.) Managing the Transition toRenewable Energy: Theory and Practice from Local. Regional and Macro Perspectives.Edward Elgar, Cheltenham, UK (2008)
28. Tödtling, F., Trippl, M.: Regional innovation policies for new path development – beyondneo-liberal and traditional systemic views. Eur. Plan. Stud. 26(9), 1779–1795 (2018). https://doi.org/10.1080/09654313.2018.1457140
29. Beugelsdijk, S., Klasing, M.J., Milionis, P.: Regional economic development in Europe: therole of total factor productivity. Reg. Stud. 52(4), 461–476 (2018). https://doi.org/10.1080/00343404.2017.133411
30. O’Brien, P., Sykes, O., Shaw, D.: The evolving context for territorial development policyand governance in Europe-From shifting paradigms to new policy approaches. L’Informationgéographique 79(1), 72–97 (2015)
Contextualizing Transition 65
31. Garcilazo, E.: Growth Trends and Characteristics of OECD Rural Regions. Garcilazo,Enrique. OECD Regional Development Working Papers, No. 2013/10 (2013). OECDPublishing, Paris. https://doi.org/10.1787/5k4522x3qk9q-en
32. Bachtler, J.: Place-based policy and regional development in Europe. Horizons 10(44), 54–58 (2010)
33. Crespo, J., Balland, P.A., Boschma, R., Rigby, D.: Regional Diversification Opportunitiesand Smart Specialization Strategies. European Commission, Directorate-General forResearch and Innovation (2017). https://ec.europa.eu/research/openvision/pdf/rise/crespo-balland-boschma-rigby_regional_diversification.pdf. Accessed 13 Jan 2020
34. Singh-Peterson, L., Underhill, S.J.R.: A multi-scalar, mixed methods framework forassessing rural communities’ capacity for resilience, adaptation, and transformation.Commun. Dev. 48(1), 124–140 (2017). https://doi.org/10.1080/15575330.2016.1250103
35. Coppola, G., Destefanis, S., Marinuzzi, G., Tortorella, W.: The impact of EU funds andnational policies on regional growth, 65–79 (2018). The Impact of Cohesion Policies inEurope and Italy. Senato della Repubblica. http://www.senato.it/service/PDF/PDFServer/BGT/01083823.pdf. Accessed 28 Jan 2020
36. Crescenzi, R., Rodríguez-Pose, A.: R&D, Socio-Economic Conditions, and RegionalInnovation in the U.S. Growth Change 44(2), 287–320 (2018)
37. Pellegrini, G., Tortorella, W. The Main Evidence, 7–11(2018). The Impact of CohesionPolicies in Europe and Italy. Senato della Repubblica. http://www.senato.it/service/PDF/PDFServer/BGT/01083823.pdf. Accessed 28 Jan 2020
38. McCann, P., Ortega-Argilés, R.: Smart specialisation, regional growth and applications toEU cohesion policy. Economic Geography Working Paper 2011: Faculty of SpatialSciences, University of Groningen (2011)
39. European Union: Eurostat Methodological manual on territorial typologies (2018 Edition).Luxembourg: Publications Office of the European Union EU (2019)
40. Eurostat website: Eurostat Database (2020). available at https://ec.europa.eu/eurostat/data/database. Accessed 21 Jan 2020
41. Hallegatte, S.: Economic Resilience Definition and Measurement. Policy Research WorkingPaper 6852, The World Bank Climate Change Group Office of the Chief Economist (2014).http://documents.worldbank.org/curated/en/350411468149663792/pdf/WPS6852.pdf.Accessed 21 Jan 2020
42. Eurostat website: European Union trade mark (EUTM), Reference Metadata in Euro SDMXMetadata Structure (ESMS). Compiling agency: Eurostat, the statistical office of theEuropean Union (Eurostat Metadata – EUTM. https://ec.europa.eu/eurostat/cache/metadata/en/ipr_t_esms.htm. Accessed 20 Mar 2020
43. European Union: Connecting the Development Community. CAPACITY4DEV. https://europa.eu/capacity4dev/evaluation_guidelines/minisite/en-methodological-bases-and-approach/evaluation-tools/context-indicators/detailed-presentat#anchor1. Accessed 18 Jan 2020
44. Prezioso, M.: Cohesion policy: methodology and indicators towards common approach.Romanian J. Reg. Sci. 2(2) 1–32 (2008). https://art.torvergata.it/retrieve/handle/2108/20466/27812/P1-PREZIOSO.pdf. Accessed 21 Jan 2020
45. Rodríguez-Pose, A.: The revenge of the places that don’t matter (and what to do about it).Cambridge J. Reg. Econ. Soc. 11(1), 189–209 (2018)
66 C. Bevilacqua et al.

Open Access This chapter is licensed under the terms of the Creative Commons Attribution 4.0International License (http://creativecommons.org/licenses/by/4.0/), which permits use, sharing,adaptation, distribution and reproduction in any medium or format, as long as you give appro-priate credit to the original author(s) and the source, provide a link to the Creative Commonslicense and indicate if changes were made.The images or other third party material in this chapter are included in the chapter's Creative
Commons license, unless indicated otherwise in a credit line to the material. If material is notincluded in the chapter's Creative Commons license and your intended use is not permitted bystatutory regulation or exceeds the permitted use, you will need to obtain permission directlyfrom the copyright holder.
Contextualizing Transition 67
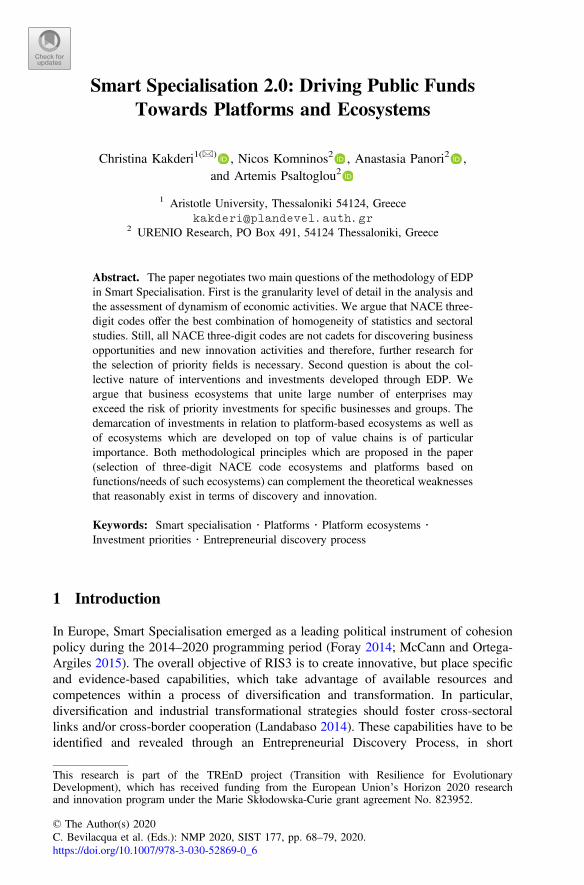
Smart Specialisation 2.0: Driving Public FundsTowards Platforms and Ecosystems
Christina Kakderi1(&) , Nicos Komninos2 , Anastasia Panori2 ,and Artemis Psaltoglou2
1 Aristotle University, Thessaloniki 54124, [email protected]
2 URENIO Research, PO Box 491, 54124 Thessaloniki, Greece
Abstract. The paper negotiates two main questions of the methodology of EDPin Smart Specialisation. First is the granularity level of detail in the analysis andthe assessment of dynamism of economic activities. We argue that NACE three-digit codes offer the best combination of homogeneity of statistics and sectoralstudies. Still, all NACE three-digit codes are not cadets for discovering businessopportunities and new innovation activities and therefore, further research forthe selection of priority fields is necessary. Second question is about the col-lective nature of interventions and investments developed through EDP. Weargue that business ecosystems that unite large number of enterprises mayexceed the risk of priority investments for specific businesses and groups. Thedemarcation of investments in relation to platform-based ecosystems as well asof ecosystems which are developed on top of value chains is of particularimportance. Both methodological principles which are proposed in the paper(selection of three-digit NACE code ecosystems and platforms based onfunctions/needs of such ecosystems) can complement the theoretical weaknessesthat reasonably exist in terms of discovery and innovation.
Keywords: Smart specialisation � Platforms � Platform ecosystems �Investment priorities � Entrepreneurial discovery process
1 Introduction
In Europe, Smart Specialisation emerged as a leading political instrument of cohesionpolicy during the 2014–2020 programming period (Foray 2014; McCann and Ortega-Argiles 2015). The overall objective of RIS3 is to create innovative, but place specificand evidence-based capabilities, which take advantage of available resources andcompetences within a process of diversification and transformation. In particular,diversification and industrial transformational strategies should foster cross-sectorallinks and/or cross-border cooperation (Landabaso 2014). These capabilities have to beidentified and revealed through an Entrepreneurial Discovery Process, in short
This research is part of the TREnD project (Transition with Resilience for EvolutionaryDevelopment), which has received funding from the European Union’s Horizon 2020 researchand innovation program under the Marie Skłodowska-Curie grant agreement No. 823952.
© The Author(s) 2020C. Bevilacqua et al. (Eds.): NMP 2020, SIST 177, pp. 68–79, 2020.https://doi.org/10.1007/978-3-030-52869-0_6
EDP. This new policy instrument was embraced and massively implemented byEuropean regions (Foray 2019) despite the conceptual misunderstandings and diffi-culties in operationalisation. Today, both the policy and the core principles remainvalid and regions will have to repeat this exercise for 2021–2027 since smart spe-cialisation remains a core element of the next period of cohesion policy.
A core element of Smart Specialisation Strategies (S3) which drive the EuropeanStructural Investment Funds (ESIF) in European cities and regions is the Entrepre-neurial Discovery Process (EDP). The EDP, which is considered the cornerstone ofsmart specialization (Kyriakou et al. 2017), aims to highlight areas of the regionaleconomy that offer the highest potential for future development and to deal with thedifficult problems of selecting and hierarching investment priorities and of allocatingthe ESIF to specific priorities. During the EDP business stakeholders enter agovernment-led participatory process and a collaborative dialogue that integrates theirfragmented and dispersed knowledge, setting common priorities for intervention andinvestments for growth. The existence of such an open participatory process togetherwith the use of reliable data, guarantee that the selection of priorities will not be definedbased on the interests of specific stakeholders and the region will not lock-in to tra-ditional activities.
Guidance on Entrepreneurial Discovery Process (EDP) was provided by the RIS3Guide and other official documents on aims, contribution to prioritisation, and methodsof implementation.
• EDP “aims to build a systematic understanding of the areas in the economy andsociety that have the greatest potential for future development” (p. 20) & “mobilisetalent by matching RTD + I capacities and business needs through an entrepre-neurial discovery process” (p. 17).
• “Smart Specialisation should address the difficult problem of prioritisation andresource allocation based on the involvement of all stakeholders in a process ofentrepreneurial discovery, which should secure a regionally and business-driven,inclusive and open prioritisation process” (p. 52).
• “There are different methodologies for organising such processes, e.g. surveys,seminars with participatory leadership methods, crowdsourcing, etc. Such an open,participatory process, together with reliance on robust evidence based on regionalassets, are the best guarantees to avoid both the risk of capture by interest groupsand the risk of lock-in into traditional activities” (p. 52). “An effective appreciationof dynamic EDP can only be performed if entrepreneurial actors and managementand governance bodies responsible of RIS3 engage in direct discussion” (p. 20).
Despite the guidance provided, serious gaps and open questions still remain in thetheory and methodology guiding EDP (Komninos et al. 2018). Related variety offers areference framework, but not the methodological background for the choice of relatedor unrelated specialisation and, afterwards, for the selection of investments withinpriorities’ activities. These questions come again to the front, as regions have to initiatea stage (or wave) 2.0 of smart specialisation, this time focusing more on interregionalcooperation and good governance (CoR 2018). The S3 in the next programming periodwill focus on a number of enabling conditions, for good governance, such as(1) Analysis of challenges including bottlenecks for innovation diffusion, (2) Existence
Smart Specialisation 2.0: Driving Public Funds Towards Platforms 69
of competent regional/national institution or body, responsible for the management ofthe smart specialization strategy, (3) monitoring and evaluation tools to measure per-formance towards the objectives of the strategy, (4) Functioning of stakeholderscooperation (entrepreneurial discovery process), (5) Actions necessary to improvenational or regional research and innovation systems, (6) Support industrial transition,and (7) Actions for internationalization.
The next section provides a short review of the current literature presenting thebackground of RIS3 implementation and existing challenges. The third section is ananalysis of the methodology used for a survey on ecosystems in Greek NUTS-2 regionswhile the last section provides a discussion of the survey’s results and also gives somepolicy recommendations for the future programming period.
2 Smart Specialisation in Practice: Past Challengesand Future Questions
The Research and Innovation Strategy for Smart Specialisation (RIS3) requires EUregions to leverage private research and innovation expenditure towards a limited set ofpriorities. Such priorities are “areas of investment which regional or nationalauthorities identify as ‘key’, in order to build competitive advantage by developing andmatching research and innovation own strengths to business needs and to addressemerging opportunities and market developments in a coherent manner” (OfficialJournal of the EU 2013). Selection of priority areas is viewed as a process of entre-preneurial discovery through a permanent process of navigation, continuous monitor-ing and adjustments (Foray 2019).
Achieving an effective prioritisation through EDP has proven to be a challengingtask, undermined by a number of issues, among which is the weak understanding of theS3 concept (confusion between prioritisation of industry sectors and clusters or ontechnological specialisation, KETs and value chains) (Reid et al. 2012; Komninos et al.2014; Iacobucci 2014); the translation of theoretical guidelines and methodologies intopractice (e.g. the identification of technological priorities in peripheral areas with lowlevel of patents (Griniece et al. 2017; Panori et al. 2017; Gianelle et al., 2019); theactual process of prioritisation (the dilemma of diversification, i.e. the identification andselection of tradjectories for future related diversification) (Boschma 2017; Ballandet al. 2019); the existence of bottlenecks in the selection of priorities due to differentinstitutional settings and governance capacities (with EDPs leading to lock-in) (Kroll2015; Hassink and Gong 2019) and the fulfilment of the EC’s ex-ante conditionalities(lack of consistency, no clear demarcation between the national, macro-regional, andregional scope of action and responsibility) (Piatkowski et al. 2014). The effectivenessof prioritisation has also been linked to ‘the governance of RIS3’, i.e. the elements inthe institutional setting, the organisation and processes of RIS3 which contribute to theimprovement of RIS3 management, monitoring and evaluation, the effective func-tioning of EDP, but also to the effective industrial transition and internationalcollaboration.
Existing literature and policy reports on prioritisation focus on the categorisation ofRIS3 priorities (degree of homogeneity, clustering or taxonomy of priorities) and less
70 C. Kakderi et al.
on their selection method (McCann and Ortega-Argilés 2016; Iacobucci and Guzzini2016; Gianelle et al. 2019; Pavone et al. 2019). Evidence shows that there is a largevariety of priority setting approaches among EU countries and among EU-regions(McCann and Ortega-Argilés 2016) although these can be grouped into coherentclusters of key activities (e.g. agro-food, life sciences etc.) (Pavone et al. 2019).According to the European Commission (EC 2012), priorities could be determined interms of knowledge fields, subsystems within or across sectors, clusters, or technolo-gies. Gianelle et al. (2019) based on their analysis of 39 policy documents from Italyand Poland argue that S3 priorities can be defined as a distinctive combination of fourdimensions: (1) the sectors or value chains of primary interest for the intervention,(2) the transformative processes to be activated (technology applications), (3) thesocietal challenges to be addressed, and (4) the natural and/or cultural resources to beused. Classification methods may vary, ranging from sectoral classification to textmining or multi-dimensional analysis. This wide range of definitions/interpretationswas due to a gap in the S3 theory of what an investment priority should be but also inthe methodology guiding EDP.
Regardless of the actions taken for simplification and the widespread experimen-tation, a significant gap remains between theory and practice. The specifications of S3make clear that the objective is diversification and industrial transformation towardshigher added value activities. Diversification may be intra-industry, when research andinnovation change and improve products and processes of an industry or inter-industry,when innovation leads to branching of an industry towards other sectors. Inter-industrydiversification may be “related” to existing skills and know-how or “unrelated” towardsnew skills and know-how. Empirical evidence suggests that knowledge spilloverswithin a region, or smaller country, occur primarily among related sectors, and only toa limited extent among unrelated sectors. It is the related variety in a region that feedsbranching out new activities from technologically related activities, not regionaldiversity nor regional specialisation per se (Boschma and Frenken 2011, p. 67).Therefore related variety can guide the selection of priority activities for inter-industryrelated diversification, but to our knowledge there isn’t so far any theoretical guidanceabout the diversification of industries in the case of intra-industry change or inter-industry un-related change.
This discussion brings EU countries and regions with three main challenges. Thefirst refers to the actual identification of priority areas which reflects a clear policydirection. This selection should be based (a) on the detection of existing (knowledge,technological, market-related) capabilities and specialisations and (b) the selection ofthe most promising ones for potential diversification which are expected to unleash ahighest potential for the future. The identification of such capabilities, especiallythrough a collective process of EDP entails a high level of risk and should therefore beevidence based. This requires the employment of custom-made policy intelligence thatdraws upon the correct type of data depending on the country/region. The focus forexample on patents underestimates other types of capabilities and is not relevant forless developed regions. Also, there is a delicate balance in the sense that priority areasshould not be too general or too specific (Foray 2019).
The second challenge refers to the actual design of the strategy. Even after theselection of priorities how can a country/region best utilize funds in order to maximize
Smart Specialisation 2.0: Driving Public Funds Towards Platforms 71
the potential? What are the best actions that should be taken to unleash the potential ofthese sectors and how can theory orientate policy mix? The indication of bringing acritical level of investments on a few set of priorities might orientate funds towardsventures with limited beneficiaries which contradicts the actual notion of public policy.
These questions are accompanied by a methodology gap regarding the EDPgranularity. Granularity allows defining the level of detail in modelling industries ordecision-making processes. The greater the granulation, the deeper the level of detailand the better understanding of trends. Statistical data on industrial activities are givenat four levels of granularity, classifying industries in 21 Sections, 88 Divisions, 272Groups, and 615 Classes. We don’t dispose any methodological guidance about thebest granularity level to perform EDP. For instance, is it better to perform EDP at thelevel of industry sections, industry divisions, industry groups, or industry classes?The JRC application Eye@RIS3: Innovation Priorities in Europe which depicts S3priorities across Europe shows that most member-states and regions have selectedpriorities (thus performed EDP) at the level of industry section or division. This israther a low granularity EDP, which obstructs a clear outline of industrial diversifi-cation, because sections and divisions include a mixture of industrial activities withvery different future trajectories. Dealing with the above three challenges is crucial forany country/region implementing their smart specialisation agenda, yet it becomesmore daring for peripheral or less developed regions and for regions with low insti-tutional capacity and advanced governance mechanisms, such as Greece.
3 Ecosystem Discovery: A Survey for Greece
We focus our analysis in the thirteen NUTS-2 level Greek regions. Greece is aperipheral country in the EU with below average GDP per capita and only a moderateinnovator. The country, which is mainly based on tourism and the overall servicessector, has one of the lowest levels of patent applications in Europe. Given the lowlevels of growth and the significant effects of the recent economic crisis in the country’seconomy, Smart Specialisation has a higher significance as a chance for achievingcohesion and catching up more developed countries.
Stage 1 of our survey deals with the prioritisation challenge by adopting a methodbased on data than theory. We start from the statement that all industries of a country orregion have potential for diversification and growth. Our intention is to test the fea-sibility of this approach for Greece. Instead of selecting a few industries and performEDP in them, we examine the most important industries per region, in terms of size andspecialisation. Two reasons justify this orientation of work: (a) the widely accepted S3principle for place-specific innovation strategy or “one-size-does-not-fit-all”, whichsuggests that the most robust theoretical prediction should be assessed with place-specific data, and (b) the probability of finding innovative solutions in less expectedactivities, a trend outlined by many aspects of innovation theory, such as the proba-bilistic and non-deterministic character of innovation, serendipity in innovation, andinnovation outcomes by chaotic systemic combinations.
72 C. Kakderi et al.
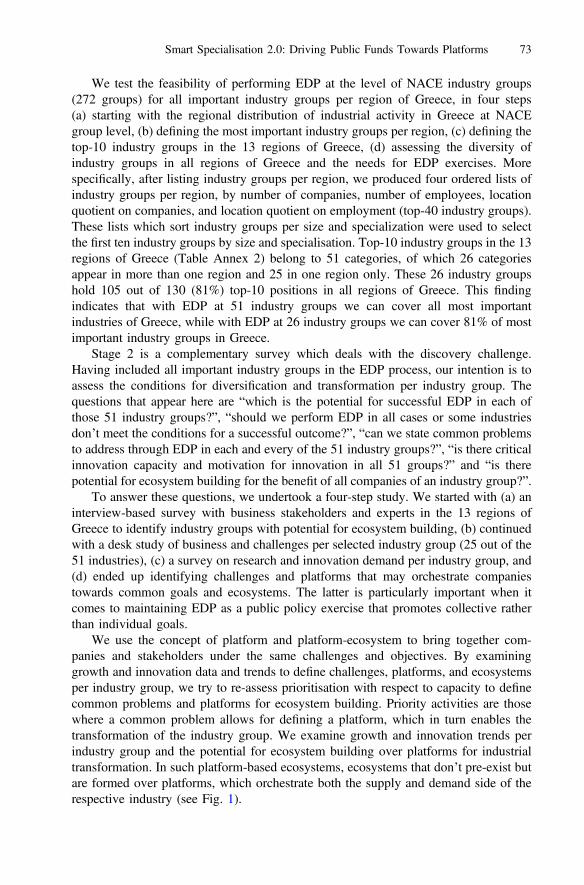
We test the feasibility of performing EDP at the level of NACE industry groups(272 groups) for all important industry groups per region of Greece, in four steps(a) starting with the regional distribution of industrial activity in Greece at NACEgroup level, (b) defining the most important industry groups per region, (c) defining thetop-10 industry groups in the 13 regions of Greece, (d) assessing the diversity ofindustry groups in all regions of Greece and the needs for EDP exercises. Morespecifically, after listing industry groups per region, we produced four ordered lists ofindustry groups per region, by number of companies, number of employees, locationquotient on companies, and location quotient on employment (top-40 industry groups).These lists which sort industry groups per size and specialization were used to selectthe first ten industry groups by size and specialisation. Top-10 industry groups in the 13regions of Greece (Table Annex 2) belong to 51 categories, of which 26 categoriesappear in more than one region and 25 in one region only. These 26 industry groupshold 105 out of 130 (81%) top-10 positions in all regions of Greece. This findingindicates that with EDP at 51 industry groups we can cover all most importantindustries of Greece, while with EDP at 26 industry groups we can cover 81% of mostimportant industry groups in Greece.
Stage 2 is a complementary survey which deals with the discovery challenge.Having included all important industry groups in the EDP process, our intention is toassess the conditions for diversification and transformation per industry group. Thequestions that appear here are “which is the potential for successful EDP in each ofthose 51 industry groups?”, “should we perform EDP in all cases or some industriesdon’t meet the conditions for a successful outcome?”, “can we state common problemsto address through EDP in each and every of the 51 industry groups?”, “is there criticalinnovation capacity and motivation for innovation in all 51 groups?” and “is therepotential for ecosystem building for the benefit of all companies of an industry group?”.
To answer these questions, we undertook a four-step study. We started with (a) aninterview-based survey with business stakeholders and experts in the 13 regions ofGreece to identify industry groups with potential for ecosystem building, (b) continuedwith a desk study of business and challenges per selected industry group (25 out of the51 industries), (c) a survey on research and innovation demand per industry group, and(d) ended up identifying challenges and platforms that may orchestrate companiestowards common goals and ecosystems. The latter is particularly important when itcomes to maintaining EDP as a public policy exercise that promotes collective ratherthan individual goals.
We use the concept of platform and platform-ecosystem to bring together com-panies and stakeholders under the same challenges and objectives. By examininggrowth and innovation data and trends to define challenges, platforms, and ecosystemsper industry group, we try to re-assess prioritisation with respect to capacity to definecommon problems and platforms for ecosystem building. Priority activities are thosewhere a common problem allows for defining a platform, which in turn enables thetransformation of the industry group. We examine growth and innovation trends perindustry group and the potential for ecosystem building over platforms for industrialtransformation. In such platform-based ecosystems, ecosystems that don’t pre-exist butare formed over platforms, which orchestrate both the supply and demand side of therespective industry (see Fig. 1).
Smart Specialisation 2.0: Driving Public Funds Towards Platforms 73
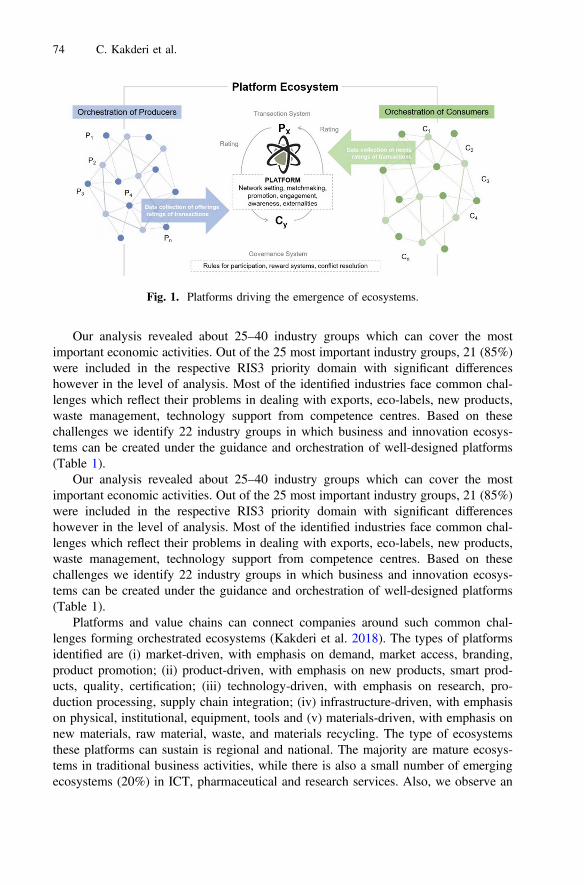
Our analysis revealed about 25–40 industry groups which can cover the mostimportant economic activities. Out of the 25 most important industry groups, 21 (85%)were included in the respective RIS3 priority domain with significant differenceshowever in the level of analysis. Most of the identified industries face common chal-lenges which reflect their problems in dealing with exports, eco-labels, new products,waste management, technology support from competence centres. Based on thesechallenges we identify 22 industry groups in which business and innovation ecosys-tems can be created under the guidance and orchestration of well-designed platforms(Table 1).
Our analysis revealed about 25–40 industry groups which can cover the mostimportant economic activities. Out of the 25 most important industry groups, 21 (85%)were included in the respective RIS3 priority domain with significant differenceshowever in the level of analysis. Most of the identified industries face common chal-lenges which reflect their problems in dealing with exports, eco-labels, new products,waste management, technology support from competence centres. Based on thesechallenges we identify 22 industry groups in which business and innovation ecosys-tems can be created under the guidance and orchestration of well-designed platforms(Table 1).
Platforms and value chains can connect companies around such common chal-lenges forming orchestrated ecosystems (Kakderi et al. 2018). The types of platformsidentified are (i) market-driven, with emphasis on demand, market access, branding,product promotion; (ii) product-driven, with emphasis on new products, smart prod-ucts, quality, certification; (iii) technology-driven, with emphasis on research, pro-duction processing, supply chain integration; (iv) infrastructure-driven, with emphasison physical, institutional, equipment, tools and (v) materials-driven, with emphasis onnew materials, raw material, waste, and materials recycling. The type of ecosystemsthese platforms can sustain is regional and national. The majority are mature ecosys-tems in traditional business activities, while there is also a small number of emergingecosystems (20%) in ICT, pharmaceutical and research services. Also, we observe an
Fig. 1. Platforms driving the emergence of ecosystems.
74 C. Kakderi et al.
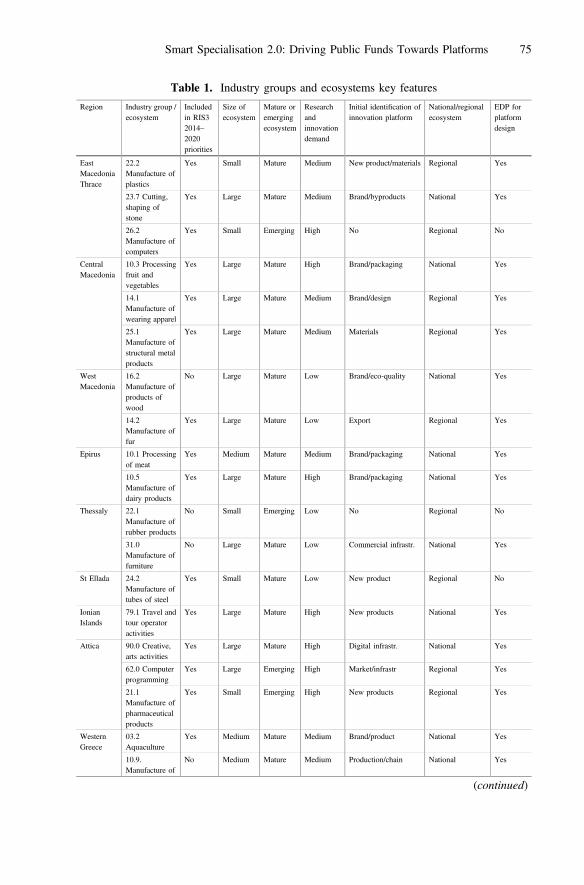
Table 1. Industry groups and ecosystems key features
Region Industry group /ecosystem
Includedin RIS32014–2020priorities
Size ofecosystem
Mature oremergingecosystem
Researchandinnovationdemand
Initial identification ofinnovation platform
National/regionalecosystem
EDP forplatformdesign
EastMacedoniaThrace
22.2Manufacture ofplastics
Yes Small Mature Medium New product/materials Regional Yes
23.7 Cutting,shaping ofstone
Yes Large Mature Medium Brand/byproducts National Yes
26.2Manufacture ofcomputers
Yes Small Emerging High No Regional No
CentralMacedonia
10.3 Processingfruit andvegetables
Yes Large Mature High Brand/packaging National Yes
14.1Manufacture ofwearing apparel
Yes Large Mature Medium Brand/design Regional Yes
25.1Manufacture ofstructural metalproducts
Yes Large Mature Medium Materials Regional Yes
WestMacedonia
16.2Manufacture ofproducts ofwood
No Large Mature Low Brand/eco-quality National Yes
14.2Manufacture offur
Yes Large Mature Low Export Regional Yes
Epirus 10.1 Processingof meat
Yes Medium Mature Medium Brand/packaging National Yes
10.5Manufacture ofdairy products
Yes Large Mature High Brand/packaging National Yes
Thessaly 22.1Manufacture ofrubber products
No Small Emerging Low No Regional No
31.0Manufacture offurniture
No Large Mature Low Commercial infrastr. National Yes
St Ellada 24.2Manufacture oftubes of steel
Yes Small Mature Low New product Regional No
IonianIslands
79.1 Travel andtour operatoractivities
Yes Large Mature High New products National Yes
Attica 90.0 Creative,arts activities
Yes Large Mature High Digital infrastr. National Yes
62.0 Computerprogramming
Yes Large Emerging High Market/infrastr Regional Yes
21.1Manufacture ofpharmaceuticalproducts
Yes Small Emerging High New products Regional Yes
WesternGreece
03.2Aquaculture
Yes Medium Mature Medium Brand/product National Yes
10.9.Manufacture of
No Medium Mature Medium Production/chain National Yes
(continued)
Smart Specialisation 2.0: Driving Public Funds Towards Platforms 75
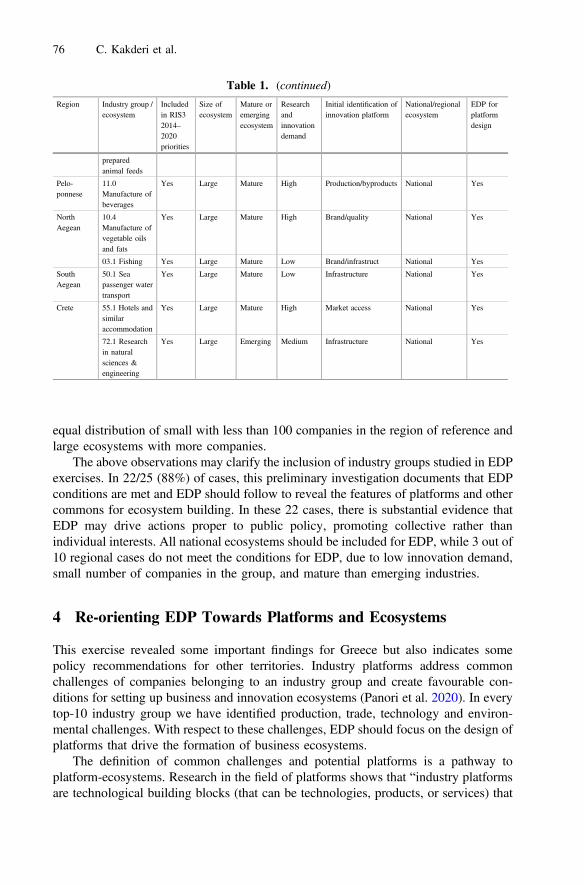
equal distribution of small with less than 100 companies in the region of reference andlarge ecosystems with more companies.
The above observations may clarify the inclusion of industry groups studied in EDPexercises. In 22/25 (88%) of cases, this preliminary investigation documents that EDPconditions are met and EDP should follow to reveal the features of platforms and othercommons for ecosystem building. In these 22 cases, there is substantial evidence thatEDP may drive actions proper to public policy, promoting collective rather thanindividual interests. All national ecosystems should be included for EDP, while 3 out of10 regional cases do not meet the conditions for EDP, due to low innovation demand,small number of companies in the group, and mature than emerging industries.
4 Re-orienting EDP Towards Platforms and Ecosystems
This exercise revealed some important findings for Greece but also indicates somepolicy recommendations for other territories. Industry platforms address commonchallenges of companies belonging to an industry group and create favourable con-ditions for setting up business and innovation ecosystems (Panori et al. 2020). In everytop-10 industry group we have identified production, trade, technology and environ-mental challenges. With respect to these challenges, EDP should focus on the design ofplatforms that drive the formation of business ecosystems.
The definition of common challenges and potential platforms is a pathway toplatform-ecosystems. Research in the field of platforms shows that “industry platformsare technological building blocks (that can be technologies, products, or services) that
Table 1. (continued)
Region Industry group /ecosystem
Includedin RIS32014–2020priorities
Size ofecosystem
Mature oremergingecosystem
Researchandinnovationdemand
Initial identification ofinnovation platform
National/regionalecosystem
EDP forplatformdesign
preparedanimal feeds
Pelo-ponnese
11.0Manufacture ofbeverages
Yes Large Mature High Production/byproducts National Yes
NorthAegean
10.4Manufacture ofvegetable oilsand fats
Yes Large Mature High Brand/quality National Yes
03.1 Fishing Yes Large Mature Low Brand/infrastruct National Yes
SouthAegean
50.1 Seapassenger watertransport
Yes Large Mature Low Infrastructure National Yes
Crete 55.1 Hotels andsimilaraccommodation
Yes Large Mature High Market access National Yes
72.1 Researchin naturalsciences &engineering
Yes Large Emerging Medium Infrastructure National Yes
76 C. Kakderi et al.

act as a foundation on top of which an array of firms, organized in a set of interde-pendent firms (sometimes called an industry “ecosystem”), develop a set of inter-related products, technologies and services” Gawer (2010; 287). Equally, platforms canbe understood as collaborative business models based on technology that engenderecosystems. A platform is “a plug-and-play business model that allows multiple par-ticipants (producers and consumers) to connect to it, interact with each other and createand exchange value” (Castellani, n.a.).
Platform-based ecosystems are created when an organisation launches a platformthat becomes the foundation for products and services of other companies. Gawer andCusumano (2002) call this relationship “platform leadership”, a strategy that enablescompanies to exert influence over the direction of innovation in an industry, byengaging other firms in a joint effort for complementary products. Industry-wideplatforms offer resources that third party organisations can use to develop their owncomplementary products, technologies, or services. They enable the creation of busi-ness ecosystems and has a disruptive network effect in many industries. They arefoundations for setting up ecosystems of organisations that share resources, knowledgeor access to markets (Gawer and Cusumano 2014). Working with an industry-wideplatform typically results in a two-part structure: on the one side, there is the specificsolution that is hosted on the platform, and on the other side, there is the platform withits infrastructure, hardware, software and data which communicate with the hostedsolutions and organise collaboration according to established procedures.
Platforms must be designed as service providers. Their detailed design must definethe model of service provision, the providers, services, and users, as well as thebusiness model, the service operation model, and the quality model of provided ser-vices assessment. Failure of defining a sustainable service model is equal to EDPfailure and no further policy support to the respective industry group should be pro-vided. Platforms may be physical, institutional, infrastructure and digital. They can bemarket-driven, product-driven, technology-driven, infrastructure-driven or materials-driven. Platforms providing services for market making (access, branding, promotion),product development (innovation, quality, certification, standardisation) and technol-ogy development (materials, processing, value chain optimisation) are mostly neededto address growth and innovation challenges of business ecosystems. They give birth tobusiness ecosystems created around common challenges. Platforms and ecosystemsguarantee the public character of policy mix and actions deriving from EDP as theyserve common needs of an industry group than individual trajectories and interests ofcompanies. Such ecosystems do not need to exist prior to the platform, since it acts asan anchor orchestrating complementors. Ecosystems can be created in each and everyindustry group around a challenge and common assets that may deal with the chal-lenge. The starting point is to recognize some form of externalities (conditions outsidethe market and inter-firm competition) and how a platform can engage the companiesof the industry group and offer advantages in dealing with the challenges they face. Itmay be an e-commerce platform, a common quality control laboratory, a commontreatment of production waste. It may be also a service developed by a group ofcompanies, which is needed, without being a field of competition.
Smart Specialisation 2.0: Driving Public Funds Towards Platforms 77

References
Balland, P.-A., Boschma, R., Crespo, J., Rigby, D.L.: Smart specialization policy in theEuropean Union: relatedness, knowledge complexity and regional diversification. Reg. Stud.53(9), 1252–1268 (2019). https://doi.org/10.1080/00343404.2018.1437900
Boschma, R., Frenken, K.: 14 technological relatedness, related variety and economic geography.In: Handbook of Regional Innovation and Growth, p. 187 (2011)
Boschma, R.: Relatedness as driver behind regional diversification: a research agenda. Reg. Stud.51(3), 351–364 (2017)
Committee of the Regions (CoR). Regions and Cities call for a new Smart Specialisation built oninterregional collaboration, 16.05.2018, Press Release (2018). https://cor.europa.eu/en/news/Pages/Regions-and-cities-call-for-a-new-Smart-Specialisation-2-0-built-on-interregional-cooperation.aspx. Accessed 18 Feb 2020
European Commission. Frequently asked questions on RIS3 (2012). Accessed from http://s3platform.jrc.ec.europa.eu/faqs-on-ris3
Foray, D.: From smart specialisation to smart specialisation policy. Eur. J. Innov. Manage. 17(4),492–507 (2014). https://doi.org/10.1108/EJIM-09-2014-0096
Foray, D.: In response to ‘Six critical questions about smart spezialisation’. Eur. Plan. Stud. 27(10), 2066–2078 (2019)
Gawer, A.: The organization of technological platforms. In: Technology and Organization:Essays in Honour of Joan Woodward. Emerald Group Publishing Limited (2010)
Gawer, A., Cusumano, M.A.: Industry platforms and ecosystem innovation. J. Prod. Innov.Manag. 31(3), 417–433 (2014)
Gianelle, C., Kyriakou, D., Cohen, C., Przeor, M.: Implementing Smart Specialisation: AHandbook (EUR 28053 EN). European Commission, Brussels (2016). https://doi.org/10.2791/53569
Gianelle, C., Guzzo, F., Mieszkowski, K.: Smart specialisation: what gets lost in translation fromconcept to practice? Reg. Stud., 1–12 (2019). https://doi.org/10.1080/00343404.2019.1607970
Griniece, E., Panori, A., Kakderi, C., Komninos, N. Reid, A.: Methodologies for smartspecialisation strategies: a view across the EU regions. In: International Conference forEntrepreneurship, Innovation, and Regional Development (ICEIRD 2017), Thessaloniki(2017)
Hassink, R., Gong, H.: Six critical questions about smart specialization. Eur. Plan. Stud. 27(10),2049–2065 (2019)
Iacobucci, D.: Designing and implementing a smart specialisation strategy at regional level:Some open questions. Sci. Reg. 13(1), 107–126 (2014)
Iacobucci, D., Guzzini, E.: Relatedness and connectivity in technological domains: missing linksin S3 design and implementation. Eur. Plan. Stud. 24(8), 1511–1526 (2016)
Kakderi, C., Psaltoglou, A., Fellnhofer, K.: Digital platforms and online applications for userengagement and collaborative innovation. In: The 20th Conference of the Greek Society ofRegional Scientists (2018)
Komninos, N., Musyck, B., Iain Reid, A.: Smart specialisation strategies in south Europe duringcrisis. Eur. J. Innov. Manage. 17(4), 448–471 (2014)
Komninos, N., Kakderi, C., Panori, A., Garcia, E., Fellnhofer, K., Reid, A., Cvijanović, V.,Roman, M., Deakin, M., Mora, L. Reid, A.: Intelligence and co-creation in SmartSpecialisation Strategies: Towards the next stage of RIS3. Online S3 White Paper (2018).https://www.onlines3.eu/wp-content/onlines3-files/22%20Intelligence%20and%20co-creation%20in%20Smart%20Spec.pdf
78 C. Kakderi et al.
Kroll, H.: Efforts to implement smart specialization in practice—leading unlike horses to thewater. Eur. Plan. Stud. 23(10), 2079–2098 (2015). https://doi.org/10.1080/09654313.2014.1003036
Kyriakou, D., Palazuelos Martinez, M., Periáñez-Forte, I., Rainoldi, A.: Governing SmartSpecialisation. Routledge, London (2017)
Landabaso, M., Valdaliso, J.M., Magro, E., Navarro, M., Aranguren, M.J., Wilson, J.R.: Pathdependence in policies supporting smart specialisation strategies. Eur. J. Innov. Manage. 17,390–408 (2014). https://doi.org/10.1108/EJIM-12-2013-0136
McCann, P., Ortega-Argiles, R.: Smart specialization, regional growth and applications toEuropean Union cohesion policy. Reg. Stud. 49(8), 1291–1302 (2015). https://doi.org/10.1080/00343404.2013.799769
McCann, P., Ortega-Argilés, R.: The early experience of smart specialization implementation inEU cohesion policy. Eur. Plan. Stud. 24(8), 1407–1427 (2016). https://doi.org/10.1080/09654313.2016.1166177
Official Journal of the European Union (OJ). Regulation (EU) No 1303/2013 of the EuropeanParliament and of the Council of 17 December 2013 (2013)
Panori, A., Kakderi, C., Komninos, N., Fellnhofer, K., Reid, A., Mora, L.: Smart systems ofinnovation for smart places: Challenges in deploying digital platforms for co-creation anddata-intelligence. Land Use Policy, 104631 (2020)
Panori, A., Komninos, N., Kakderi, C., Fellnhofer, K.: Smart specialisation strategies: an onlineplatform for strategy design and assessment. In: Kabashkin, I., Yatskiv, I., Prentkovskis, O.(eds.) RelStat 2017. LNNS, vol. 36, pp. 3–16. Springer, Cham (2018). https://doi.org/10.1007/978-3-319-74454-4_1
Pavone, P., Pagliacci, F., Russo, M., Giorgi, A.: R&I smart specialisation strategies: classificationof EU regions’ priorities. Results from automatic text analysis. DEMB Working Paper SeriesNo. 148 (2019)
Piatkowski, M., Szuba, T., Wolszczak, G.: Review of National and Regional Research andInnovation Strategies for Smart Specialization (RIS3) in Poland. World Bank Group,Washington (2014)
Reid, A., Komninos, N., Sanchez, J., Tsanakas, P.: RIS3 National Assessment: Greece. SmartSpecialisation as a Means to Foster Economic Renewal. Report to the European Commission,DG Regional Policy. European Commission, Brussels (2012)
Open Access This chapter is licensed under the terms of the Creative Commons Attribution 4.0International License (http://creativecommons.org/licenses/by/4.0/), which permits use, sharing,adaptation, distribution and reproduction in any medium or format, as long as you give appro-priate credit to the original author(s) and the source, provide a link to the Creative Commonslicense and indicate if changes were made.The images or other third party material in this chapter are included in the chapter's Creative
Commons license, unless indicated otherwise in a credit line to the material. If material is notincluded in the chapter's Creative Commons license and your intended use is not permitted bystatutory regulation or exceeds the permitted use, you will need to obtain permission directlyfrom the copyright holder.
Smart Specialisation 2.0: Driving Public Funds Towards Platforms 79
Industrial Policies and Evolutionary Paths:A Case Study of the Impact of the GreekInvestment Law to Effect Investment
Decisions of Greek Firms
Athanasios Kalogeresis(&)
School of Spatial Planning and Development,Aristotle University of Thessaloniki, Thessaloniki, Greece
Abstract. The main objective of the article is to test the difficulty of changingevolutionary paths, by studying the evolution of the sectoral outcomes of one ofthe basic regional and industrial policy tools in Greece, the Greek InvestmentLaw (GIL), through a brief analysis the past and present experience of GILs.Based on a unique database of the past four GILS, I will try to comment on theeffectiveness of the policies in altering the investment decisions of Greek firms,in the light of the national Smart Specialisation Strategy (3S), particularlyfocusing on the current law (for which there is some preliminary unpublisheddata), which incorporates - but is not limited to - the sectoral priorities of theGreek National 3S Strategy, and the degree to which this is visible in thepreliminary data. More specifically, I will focus on the extent of visible changesin the sectoral distribution of the recent GILs and whether these seem to con-verge to the targets of the Greek National Smart Specialization Strategy andwhether the lack of convergence can be ascribed to the workings of evolutionarymechanisms and in particular a political and cognitive lock-in.
Keywords: Investment laws � Greek 3S � Diversification
1 Introduction
Given the rather limited literature evaluating Smart Specialisation and – perhaps evenmore so – the entrepreneurial discovery process [1], which should, at least in theoryidentify the activities (sectors, clusters, ecosystems) to be assisted, through the par-ticipation of a wide array of local actors), this paper aims to critically evaluate at leasttwo aspects of Smart Specialisation. The former is the conditionality attached to SmartSpecialization requiring policies to comply to the priorities of national or regional 3S.What I will try to show is that adapting ‘traditional’ top-down industrial/regional policyinstruments to fit 3S often yields very limited results. The latter (which is inextricablylinked to the former) is related to the perceived effectiveness of the entrepreneurialdiscovery process. In particular, I would like to test the hypothesis that the sectoralpriorities of Smart Specialisation strategies identify potential sources of growth,increased profitability and attractiveness to investors. If this is the case, then, these
© The Author(s) 2020C. Bevilacqua et al. (Eds.): NMP 2020, SIST 177, pp. 80–89, 2020.https://doi.org/10.1007/978-3-030-52869-0_7
activities should emerge as preferred choices for both incumbent and nascent enter-prises and investors even in the absence of specific or mission oriented policies. What Iwill argue is that in fact evolutionary paths often prove very difficult to change.
Further, I will try to probe into whether we can ascribe the stability of investmentdecision of Greek firms (and consequently the stable industrial structure of Greece) tothe workings of evolutionary mechanisms and in particular a political and cognitivelock-in, or whether this, as Glasmeier [2] warns, would constitute an uncritical use ofthe concepts.
The paper will be based on the past and current experience of one of the basicregional policy tools in Greece, the Greek Investment Laws (GILs). By studying theevolution of the sectoral outcomes of past and present GILs I will try to comment onthe effectiveness of the 3S, particularly focusing on the current law (for which there issome preliminary unpublished data), which incorporates - but is not limited to - thesectoral priorities of the Greek National 3S, and the degree to which this is visible inthe preliminary data. More specifically, I will focus on the extent of visible changes inthe sectoral distribution of the recent GILs and whether these seem to converge to thetargets of the Greek National 3S.
2 Path Dependence and Lock-Ins
The notion of path dependence concerns the influence of past conditions, choices andpolicies on current outcomes, or as Walker [3] noted, the fact that “… industrial historyis literally embodied in the present”. In anticipating the evolutionary turn in EconomicGeography Storper and Walker [4] wrote that: “Localized technological change in anindustry can be understood, like all industrial development, as an evolutionary path inwhich each step moves one way from a past that cannot be recovered and that limitsfuture directions’.
The notion of path-dependence was introduced by the economists David [5], whowrote on the economic history of technology and Arthur [6], who was interested onself-reinforcing cumulative economic processes. During the recent years, path-dependence and various other concepts of evolutionary thinking have been elevatedinto one the dominant concepts of economic geography [7] employed on numerousoccasions as the hermeneutic instruments to a wide array of issues related to unevendevelopment, such as the persistence of regional disparities, the lock-in of regions toparticular functional specializations [8] and cluster development [9].
Similar notions had been used in economics and economic geography in the past.First and foremost is Myrdal’s [10] attempt to account for uneven development throughthe cumulative causation concept, which aimed at explaining regional divergence asproduct of circular processes, or a stream of events directly flowing from a randomstarting point in the recent or distant path. As Kaldor [11] noted, it is “the cumulativeadvantages accruing from the growth of industry itself–the development of skill andknow-how; the opportunities for easy communication of ideas and experience; theopportunity of ever-increasing differentiation of processes and of specialization inhuman activities”. The idea that current outcomes are inescapably shaped by pastchoices is also dominant in the various stages of growth/lifecycle theories [12–15]
Industrial Policies and Evolutionary Paths 81
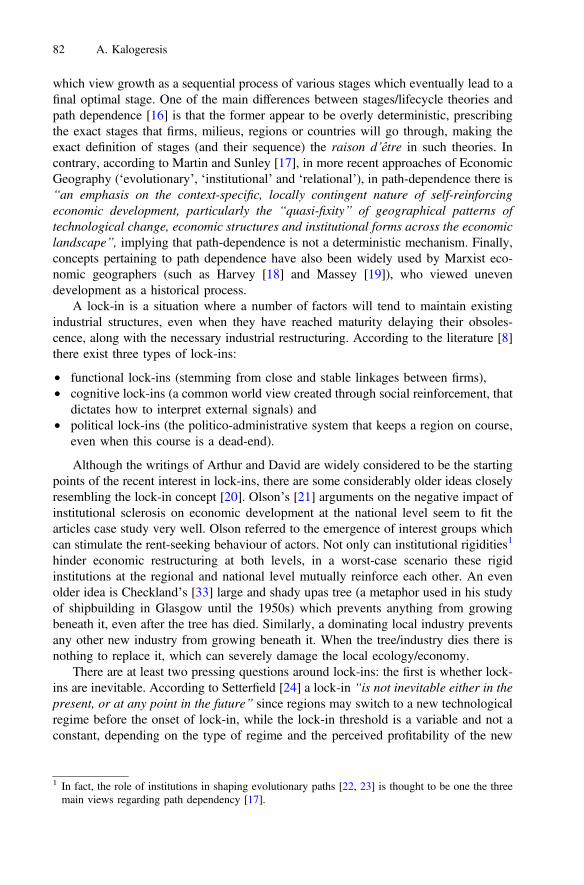
which view growth as a sequential process of various stages which eventually lead to afinal optimal stage. One of the main differences between stages/lifecycle theories andpath dependence [16] is that the former appear to be overly deterministic, prescribingthe exact stages that firms, milieus, regions or countries will go through, making theexact definition of stages (and their sequence) the raison d’être in such theories. Incontrary, according to Martin and Sunley [17], in more recent approaches of EconomicGeography (‘evolutionary’, ‘institutional’ and ‘relational’), in path-dependence there is“an emphasis on the context-specific, locally contingent nature of self-reinforcingeconomic development, particularly the “quasi-fixity” of geographical patterns oftechnological change, economic structures and institutional forms across the economiclandscape”, implying that path-dependence is not a deterministic mechanism. Finally,concepts pertaining to path dependence have also been widely used by Marxist eco-nomic geographers (such as Harvey [18] and Massey [19]), who viewed unevendevelopment as a historical process.
A lock-in is a situation where a number of factors will tend to maintain existingindustrial structures, even when they have reached maturity delaying their obsoles-cence, along with the necessary industrial restructuring. According to the literature [8]there exist three types of lock-ins:
• functional lock-ins (stemming from close and stable linkages between firms),• cognitive lock-ins (a common world view created through social reinforcement, that
dictates how to interpret external signals) and• political lock-ins (the politico-administrative system that keeps a region on course,
even when this course is a dead-end).
Although the writings of Arthur and David are widely considered to be the startingpoints of the recent interest in lock-ins, there are some considerably older ideas closelyresembling the lock-in concept [20]. Olson’s [21] arguments on the negative impact ofinstitutional sclerosis on economic development at the national level seem to fit thearticles case study very well. Olson referred to the emergence of interest groups whichcan stimulate the rent-seeking behaviour of actors. Not only can institutional rigidities1
hinder economic restructuring at both levels, in a worst-case scenario these rigidinstitutions at the regional and national level mutually reinforce each other. An evenolder idea is Checkland’s [33] large and shady upas tree (a metaphor used in his studyof shipbuilding in Glasgow until the 1950s) which prevents anything from growingbeneath it, even after the tree has died. Similarly, a dominating local industry preventsany other new industry from growing beneath it. When the tree/industry dies there isnothing to replace it, which can severely damage the local ecology/economy.
There are at least two pressing questions around lock-ins: the first is whether lock-ins are inevitable. According to Setterfield [24] a lock-in “is not inevitable either in thepresent, or at any point in the future” since regions may switch to a new technologicalregime before the onset of lock-in, while the lock-in threshold is a variable and not aconstant, depending on the type of regime and the perceived profitability of the new
1 In fact, the role of institutions in shaping evolutionary paths [22, 23] is thought to be one the threemain views regarding path dependency [17].
82 A. Kalogeresis
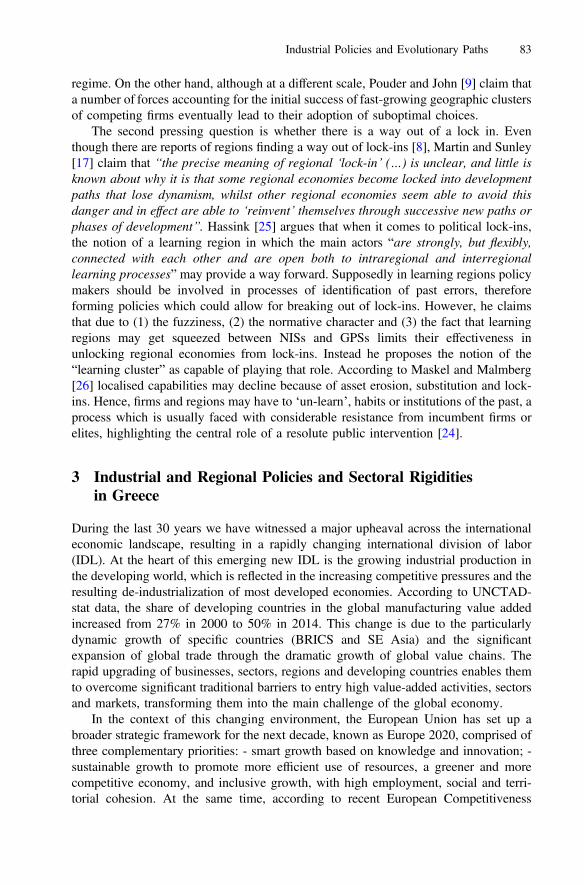
regime. On the other hand, although at a different scale, Pouder and John [9] claim thata number of forces accounting for the initial success of fast-growing geographic clustersof competing firms eventually lead to their adoption of suboptimal choices.
The second pressing question is whether there is a way out of a lock in. Eventhough there are reports of regions finding a way out of lock-ins [8], Martin and Sunley[17] claim that “the precise meaning of regional ‘lock-in’ (…) is unclear, and little isknown about why it is that some regional economies become locked into developmentpaths that lose dynamism, whilst other regional economies seem able to avoid thisdanger and in effect are able to ‘reinvent’ themselves through successive new paths orphases of development”. Hassink [25] argues that when it comes to political lock-ins,the notion of a learning region in which the main actors “are strongly, but flexibly,connected with each other and are open both to intraregional and interregionallearning processes” may provide a way forward. Supposedly in learning regions policymakers should be involved in processes of identification of past errors, thereforeforming policies which could allow for breaking out of lock-ins. However, he claimsthat due to (1) the fuzziness, (2) the normative character and (3) the fact that learningregions may get squeezed between NISs and GPSs limits their effectiveness inunlocking regional economies from lock-ins. Instead he proposes the notion of the“learning cluster” as capable of playing that role. According to Maskel and Malmberg[26] localised capabilities may decline because of asset erosion, substitution and lock-ins. Hence, firms and regions may have to ‘un-learn’, habits or institutions of the past, aprocess which is usually faced with considerable resistance from incumbent firms orelites, highlighting the central role of a resolute public intervention [24].
3 Industrial and Regional Policies and Sectoral Rigiditiesin Greece
During the last 30 years we have witnessed a major upheaval across the internationaleconomic landscape, resulting in a rapidly changing international division of labor(IDL). At the heart of this emerging new IDL is the growing industrial production inthe developing world, which is reflected in the increasing competitive pressures and theresulting de-industrialization of most developed economies. According to UNCTAD-stat data, the share of developing countries in the global manufacturing value addedincreased from 27% in 2000 to 50% in 2014. This change is due to the particularlydynamic growth of specific countries (BRICS and SE Asia) and the significantexpansion of global trade through the dramatic growth of global value chains. Therapid upgrading of businesses, sectors, regions and developing countries enables themto overcome significant traditional barriers to entry high value-added activities, sectorsand markets, transforming them into the main challenge of the global economy.
In the context of this changing environment, the European Union has set up abroader strategic framework for the next decade, known as Europe 2020, comprised ofthree complementary priorities: - smart growth based on knowledge and innovation; -sustainable growth to promote more efficient use of resources, a greener and morecompetitive economy, and inclusive growth, with high employment, social and terri-torial cohesion. At the same time, according to recent European Competitiveness
Industrial Policies and Evolutionary Paths 83

Reports (European Commission, 2013, 2014), Europe is in dire need of restructuring,as it appears to be losing ground relative to its main competitors, namely the US andSE. Asia. In addition, the recent crisis has had a major impact on the Europeaneconomy, which seem to be recovering more slowly than its main competitors.
The Greek economy was the biggest victim submitted to more than six years ofcontinuous recession and a consequent restructuring of the Greek production system,which led to a decline in GDP reaching more than 25% and unemployment rates atsimilar levels. At the same time, during the 2006–2016 period, gross capital investmentfell by −64.6%. The extent of the devaluation of invested capital in the productiveeconomy was (and still is) unprecedented and raises questions about the practicalpossibilities of recovery. Indeed, since 2011 the evolution of the annual net privatecapital formation has been clearly negative and much lower than other EU countriesthat experienced a disinvestment problem during the global financial crisis (Italy,Portugal). By the most conservative estimates to meet capital requirements of at least €70 billion (AMECO/ECFIN, 2016), in order to raise the level of private capital for-mation to 2010 levels.
In part, this picture was attributed to the weaknesses of the Greek growth model,which relied too heavily on consumption and the abundance of cheap credit, especiallyfrom foreign banks after Greece’s entry into the euro. This has led to the country’sover-indebtedness, but also to the decline in the importance of productive investment.
Apart of the challenging external environment, the Greek economy is characterisedby a number of endogenous weaknesses which can be summarized as follows [27–29]:
• The problematic structure of the productive sector (e.g. prevalence of micro andsmall businesses, low export propensity, limited performance in innovation andR&D activities, the strong dualism of Greek businesses and the relative absence ofmanufacturing and tradeable services).
• The problematic role of the state. This includes a range of issues such as the lowcapacity to produce public goods, the inefficient organization of the educationsystem, the complex institutional framework and the frequently changing taxregime. The way in which the state contributes to shaping the country’s vision andstrategy for development is also considered ineffective.
• The problematic form of public-private cooperation (cooperation to generateoligopolistic revenue rather than new production/wealth).
• The relatively low propensity for entrepreneurship, and• low social capital stocks.
3.1 The Greek Smart Specialisation Strategy
It is clear that the Greek economy is in dire need of a competitiveness boost and theapproval of the national 3S strategy in August 2015 provided a much-needed frame-work which is based in three main strategic options intersected by four priority axes(see Table 1).
84 A. Kalogeresis
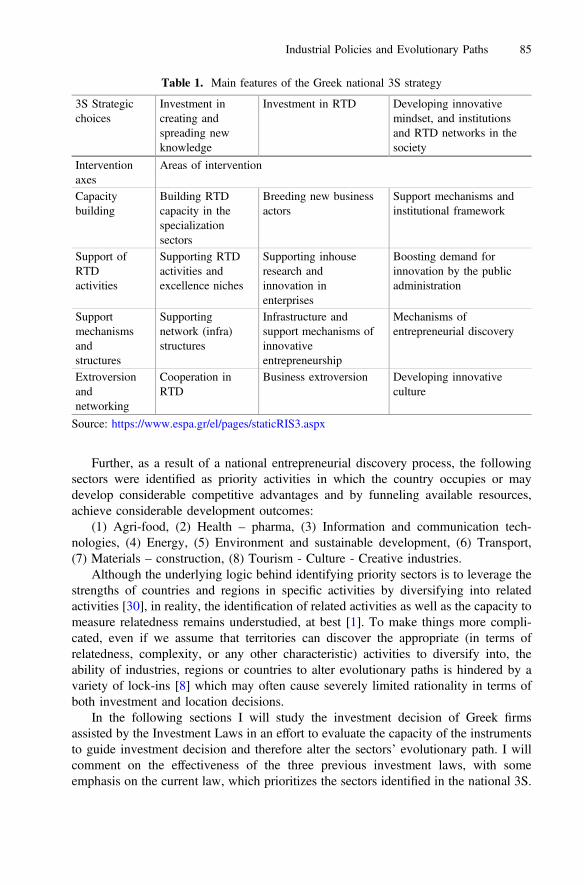
Further, as a result of a national entrepreneurial discovery process, the followingsectors were identified as priority activities in which the country occupies or maydevelop considerable competitive advantages and by funneling available resources,achieve considerable development outcomes:
(1) Agri-food, (2) Health – pharma, (3) Information and communication tech-nologies, (4) Energy, (5) Environment and sustainable development, (6) Transport,(7) Materials – construction, (8) Tourism - Culture - Creative industries.
Although the underlying logic behind identifying priority sectors is to leverage thestrengths of countries and regions in specific activities by diversifying into relatedactivities [30], in reality, the identification of related activities as well as the capacity tomeasure relatedness remains understudied, at best [1]. To make things more compli-cated, even if we assume that territories can discover the appropriate (in terms ofrelatedness, complexity, or any other characteristic) activities to diversify into, theability of industries, regions or countries to alter evolutionary paths is hindered by avariety of lock-ins [8] which may often cause severely limited rationality in terms ofboth investment and location decisions.
In the following sections I will study the investment decision of Greek firmsassisted by the Investment Laws in an effort to evaluate the capacity of the instrumentsto guide investment decision and therefore alter the sectors’ evolutionary path. I willcomment on the effectiveness of the three previous investment laws, with someemphasis on the current law, which prioritizes the sectors identified in the national 3S.
Table 1. Main features of the Greek national 3S strategy
3S Strategicchoices
Investment increating andspreading newknowledge
Investment in RTD Developing innovativemindset, and institutionsand RTD networks in thesociety
Interventionaxes
Areas of intervention
Capacitybuilding
Building RTDcapacity in thespecializationsectors
Breeding new businessactors
Support mechanisms andinstitutional framework
Support ofRTDactivities
Supporting RTDactivities andexcellence niches
Supporting inhouseresearch andinnovation inenterprises
Boosting demand forinnovation by the publicadministration
Supportmechanismsandstructures
Supportingnetwork (infra)structures
Infrastructure andsupport mechanisms ofinnovativeentrepreneurship
Mechanisms ofentrepreneurial discovery
Extroversionandnetworking
Cooperation inRTD
Business extroversion Developing innovativeculture
Source: https://www.espa.gr/el/pages/staticRIS3.aspx
Industrial Policies and Evolutionary Paths 85
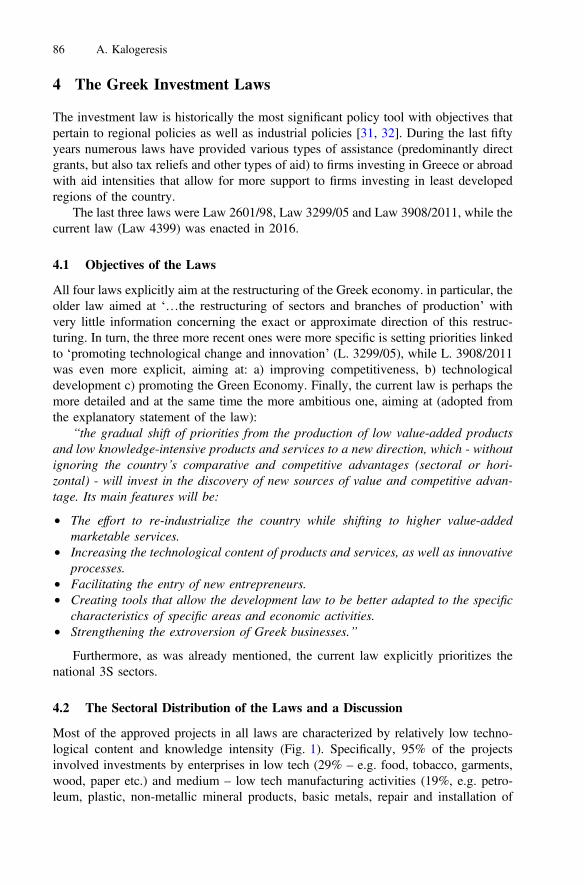
4 The Greek Investment Laws
The investment law is historically the most significant policy tool with objectives thatpertain to regional policies as well as industrial policies [31, 32]. During the last fiftyyears numerous laws have provided various types of assistance (predominantly directgrants, but also tax reliefs and other types of aid) to firms investing in Greece or abroadwith aid intensities that allow for more support to firms investing in least developedregions of the country.
The last three laws were Law 2601/98, Law 3299/05 and Law 3908/2011, while thecurrent law (Law 4399) was enacted in 2016.
4.1 Objectives of the Laws
All four laws explicitly aim at the restructuring of the Greek economy. in particular, theolder law aimed at ‘…the restructuring of sectors and branches of production’ withvery little information concerning the exact or approximate direction of this restruc-turing. In turn, the three more recent ones were more specific is setting priorities linkedto ‘promoting technological change and innovation’ (L. 3299/05), while L. 3908/2011was even more explicit, aiming at: a) improving competitiveness, b) technologicaldevelopment c) promoting the Green Economy. Finally, the current law is perhaps themore detailed and at the same time the more ambitious one, aiming at (adopted fromthe explanatory statement of the law):
“the gradual shift of priorities from the production of low value-added productsand low knowledge-intensive products and services to a new direction, which - withoutignoring the country’s comparative and competitive advantages (sectoral or hori-zontal) - will invest in the discovery of new sources of value and competitive advan-tage. Its main features will be:
• The effort to re-industrialize the country while shifting to higher value-addedmarketable services.
• Increasing the technological content of products and services, as well as innovativeprocesses.
• Facilitating the entry of new entrepreneurs.• Creating tools that allow the development law to be better adapted to the specific
characteristics of specific areas and economic activities.• Strengthening the extroversion of Greek businesses.”
Furthermore, as was already mentioned, the current law explicitly prioritizes thenational 3S sectors.
4.2 The Sectoral Distribution of the Laws and a Discussion
Most of the approved projects in all laws are characterized by relatively low techno-logical content and knowledge intensity (Fig. 1). Specifically, 95% of the projectsinvolved investments by enterprises in low tech (29% – e.g. food, tobacco, garments,wood, paper etc.) and medium – low tech manufacturing activities (19%, e.g. petro-leum, plastic, non-metallic mineral products, basic metals, repair and installation of
86 A. Kalogeresis

machinery, etc.), provision of less knowledge-intensive services (35%, e.g. hotels,transportation, travel agencies, etc.), as well as primary sectors (10%) and energy (1%).
On the contrary, high or medium – high-tech sectors accounted for 4% of totalprojects. As an indication, of how Greece compares to the rest of Europe, in 2010, EUindustry was almost equally divided in terms of technological intensity in two maingroups (53% for low-tech/medium-low tech and 47% for high-tech/medium-high tech).
In terms of sectors, the priorities of all four laws were to varying extents clearly notfulfilled, while the current law, which pertains to the national 3S strategy the most doesnot seem to diverge from the norm, which is an overwhelming majority of projects inthe hotel sectors (ranging between 40%–50%). An interesting point here is the fact thatthe hotel sector is a very mature one, while most projects were concentrated into thecore activity of hotels with very little (if any) diversification to related sectors.
An even more convincing characteristic of the current law regarding the difficultyof path switching or upgrading is the relative collapse of the most innovative schemesof the Law and those that could signal an upgrade or a diversification of the Greekeconomy. For example, the scheme of innovative new enterprises managed to attractvery little interest, while the networking scheme turned out to be a total failure, failingto attract a single application!
The situation could be attributed to all kinds of lock-ins. Functional, since (mainlyin the insular regions but also progressively in the large urban centers) tourism and therelated activities account for the vast majority of economic activity, embedding localand regional productive systems; cognitive, since the sector is widely considered as thecountry’s “heavy industry” and the optimal activity to capitalize on the country’scomparative advantage. Nevertheless, it is foremost a political lock-in and has con-sistently been so since the early 1980’s. In fact, the functional and cognitive lock-insseem to fuel the political one, which is evident, not so much in the existence of a “thickinstitutional tissue” [25], but mainly in the state’s reluctance to view tourism for what itis, i.e. a relatively low productivity sector absorbing scarce resources which could be
0% 5% 10% 15% 20% 25% 30% 35% 40%
High-techHigh-tech KIS
Knowledge-intensive servicesLess Knowledge-intensive services (LKIS)
Low-techMedium-high-techMedium-low-tech
Constructionsmining
Energy production and distributionPrimary (inc. Aquaculture)
projects employment
Fig. 1. Technological and knowledge content of projects (l.3299)
Industrial Policies and Evolutionary Paths 87
better employed in higher value added activities. The exact mechanisms, as well as therelations between the various types of lock-in constitute very interesting issues forfuture research.
Acknowledgment. This research is part of the TREnD project (Transition with Resilience forEvolutionary Development), which has received funding from the European Union’s Horizon2020 research and innovation program under the Marie Skłodowska-Curie grant agreementNo. 823952.
References
1. Balland, P.A., Boschma, R.A., Crespo, J., Rigby, D.L.: Smart specialization policy in theEU: relatedness, knowledge complexity and regional diversification. SSRN Electron.J. (2017). https://doi.org/10.2139/ssrn.2995986
2. Glasmeier, A.: Manufacturing Time: Global Competition in the Watch Industry, 1795–2000.Guilford Press, New York (2000)
3. Walker, R.A.: The geography of production. In: Sheppard, E., Barnes, T.J. (eds.) ACompanion to Economic Geography, pp. 113–132. Blackwell, Oxford (2000)
4. Walker, R., Storper, M.: The Capitalist Imperative: Territory, Technology and IndustrialGrowth. Blackwell, Oxford (1989)
5. David, P.A.: Clio and the economics of QWERTY. Am. Econ. Rev. 75, 332–337 (1985)6. Arthur, W.B.: Competing technologies, increasing returns, and lock-in by historical events.
Econ. J. 99, 116–131 (1989). https://doi.org/10.2307/22342087. Pike, A., Rodriguez-Pose, A., Tomaney, J. (eds.): Handbook of Local and Regional
Development. Routledge, London (2010)8. Grabher, G.: The weakness of strong ties - the lock-in of regional development in the Ruhr
area. In: Grabher, G. (ed.) The Embedded Firm: on the Socioeconomics of IndustrialNetworks, pp. 255–277. Routledge, London (1993)
9. Pouder, R., John, C.H.St.: Hot spots and blind spots: geographical clusters of firms andinnovation. Acad. Manag. Rev. 21, 1192 (1996). https://doi.org/10.2307/259168
10. Myrdal, G.: Economic Theory and Under-Developed Regions. G. Duckworth, London(1957)
11. Kaldor, N.: The case for regional policies. Scott. J. Polit. Econ. 17, 337–348 (1970). https://doi.org/10.1111/j.1467-9485.1970.tb00712.x
12. Gerschenkron, A.: Economic Backwardness in Historical Perspective: A Book of Essays.Belknap Press of Harvard University Press, Cambridge (1962)
13. Rostow, W.W.: The Stages of Economic Growth. A Non-Communist Manifesto. CambridgeUniversity Press, Cambridge (1960)
14. Taaffe, E.J., Morrill, R.L., Gould, P.R.: Transport expansion in underdeveloped countries: acomparative analysis. Geogr. Rev. 53, 503–529 (1963). https://doi.org/10.2307/212383
15. Vernon, R.: International investment and international trade in the product cycle. Q. J. Econ.80, 190–207 (1966). https://doi.org/10.2307/1880689
16. Belussi, F., Sedita, S.R.: Life cycle vs. multiple path dependency in industrial districts. Eur.Plan. Stud. 17, 505–528 (2009). https://doi.org/10.1080/09654310802682065
17. Martin, R., Sunley, P.: Path dependence and regional economic evolution. J. Econ. Geogr. 6,395–437 (2006). https://doi.org/10.1093/jeg/lbl012
18. Harvey, D.: The Limits to Capital. Verso, London, New York (2006)19. Massey, D.: Spatial Divisions of Labour. Macmillan Education UK, London (1984)
88 A. Kalogeresis

20. Hassink, R., Shin, D.-H.: Guest editorial. Environ. Plan. Econ. Space. 37, 571–580 (2005).https://doi.org/10.1068/a36273
21. Olson, M.: The Rise and Decline of Nations: Economic Growth, Stagflation, and SocialRigidities. Yale University Press, New Haven (1984)
22. North, D.C.: Institutions, Institutional Change and Economic Performance. CambridgeUniversity Press, Cambridge (1990)
23. Setterfield, M.: A model of institutional hysteresis. J. Econ. Issues 27, 755–774 (1993)24. Setterfield, M.: Notes and comments. Cumulative causation, interrelatedness and the theory
of economic growth: a reply to Argyrous and Toner. Camb. J. Econ. 25, 107–112 (2001).https://doi.org/10.1093/cje/25.1.107
25. Hassink, R.: How to unlock regional economies from path dependency? From learningregion to learning cluster. Eur. Plan. Stud. 13, 521–535 (2005). https://doi.org/10.1080/09654310500107134
26. Maskell, P., Malmberg, A.: Localised learning and industrial competitiveness. Camb.J. Econ. 23, 167–185 (1999)
27. Iordanoglou, C.H.: State and interest groups: a critique of the conventional wisdom (Kratoskai homades sympherontōn: mia kritikē tēs paradedegmenēs sophias). Polis (in Greek),Athens (2013)
28. Petrakos, G.: Economic Crisis in Greece. European and Domestic Market and PolicyFailures. Région Dév. 39, 9–33 (2014)
29. Kalogeresis, A., Labrianidis, L.: From spectator to walk-on to actor: an exploratory study ofthe internationalisation of Greek firms since 1989. Eur. J. Comput. Econ. 7, 121–143 (2010)
30. Foray, D., Goddard, J., Beldarrain, X.G., Landabaso, M., McCann, P., Morgan, K.,Nauwelaers, C., Ortega-Argilés, R.: Guide to research and innovation strategies for smartspecialisation (RIS 3). Publications Office of the European Union, Luxembourg (2012)
31. Papadoulis, A., Petrakos, G., Psycharis, Y.: Policies of investment incentives and regionaldevelopment: review and initial evaluation. Rev. Econ. Sci. Greek 5, 5–40 (2004)
32. Petrakos,G., Psycharis,Y.:RegionalDevelopment inGreece.Kritiki (inGreek),Athens (2016)33. Checkland, S.G.: The Upas Tree: Glasgow 1875–1975?: A Study in Growth and
Contraction. University of Glasgow Press (1976)
Open Access This chapter is licensed under the terms of the Creative Commons Attribution 4.0International License (http://creativecommons.org/licenses/by/4.0/), which permits use, sharing,adaptation, distribution and reproduction in any medium or format, as long as you give appro-priate credit to the original author(s) and the source, provide a link to the Creative Commonslicense and indicate if changes were made.The images or other third party material in this chapter are included in the chapter’s Creative
Commons license, unless indicated otherwise in a credit line to the material. If material is notincluded in the chapter’s Creative Commons license and your intended use is not permitted bystatutory regulation or exceeds the permitted use, you will need to obtain permission directlyfrom the copyright holder.
Industrial Policies and Evolutionary Paths 89
Exploring Territorial Imbalances:A Systematic Literature Review of Meanings
and Terms
Stefania Oppido(&) , Stefania Ragozino ,and Gabriella Esposito De Vita
Research Institute for Innovation and Services for Development,National Research Council of Italy, 80134 Naples, Italy
Abstract. Within the framework of the EU Strategies of Territorial Cohesion, arelevant role is played by policy design focused on a more balanced and equaldevelopment of regions pursued by regenerating and improving endogenousresources. A place-sensitive instead of place-neutral approach can be useful toovercome weaknesses, innovation gaps and social-economic issues related toasymmetric and unequal development between and within regions. This paperdeals with the complexity of territorial imbalances and spatial inequalities byfocusing on lacking, declining and marginal areas. By developing a SystematicLiterature Review, a first mapping of terms, practices and issues related to thoseareas has been developed in order to investigate scenarios in different geo-political contexts and at various spatial scales. The Systematic Literature Reviewapproach has permitted the systematization of a multitude of terms referring togaps between core areas and areas suffering from territorial imbalances, as wellas the exploration of disciplinary sectors, geographical contexts, documenttypologies, frequency of terms, and to develop a preliminary geo-localization ofpractices. The findings of this first step are relevant to providing a systematicknowledge base within a complex field in which a clarification of meanings,scales and processes is needed.
Keywords: Cohesion policy � Place-based approach � Inner peripheries
1 Introduction
The European Cohesion Policy 2014–2020 has been strongly dedicated at improvingKnowledge and Innovation as drivers to overcome the development issues affectingregions and cities and to build an operative framework for smart, sustainable andinclusive growth [1]. Regions have been invited at playing an incisive role in designingtailored policies toward the current challenges of our society, by valorising endogenousresources. At regional level, following a place-based approach, a policy design focusedon a more balanced and equal development has been strongly encouraged via the SmartSpecialisation Strategies (S3) aimed at improving competitiveness in the globalisedmarket starting from local resources and competencies [2]. Nevertheless, at the end ofthe last programming period, there are still regions with unsolved structural
© The Author(s) 2020C. Bevilacqua et al. (Eds.): NMP 2020, SIST 177, pp. 90–100, 2020.https://doi.org/10.1007/978-3-030-52869-0_8
weaknesses, highlighting an innovation gap, and the spread of shrinking andmarginalisation processes in urban peripheries, small cities, and inner areas. Therefore,across many countries, in last decades, models of economic growth have generated anincreasing polarisation between attractive core areas and areas suffering decline anddeprivation processes, making them lagging and peripheral [3–6]. Starting from thisevidence, the new steps of EU cohesion policies (2021–2027) are geared to a moretailored approach to regional development under the flagship of solidarity and spatialequality, targeting the complexity of territorial imbalances through regeneration pro-cesses. During the Italian Presidency of the EU Council (July–December 2014), thedebate about this issue has been encouraged [7], according to the Italian NationalStrategy for Inner Areas SNAI (2014) which is part of the European Cohesion Policyand promotes a place-based approach [8].
Within this scientific debate and political agenda, the ongoing research project“Territorial Imbalances and Marginalisation Processes. The Landscape as a Driver forthe Regeneration of Small Villages and Inner Areas” at CNR IRISS deals with place-based regeneration strategies in areas that suffer inequality development processes, witha specific in-depth focus on Italian context, starting from the framework of the SNAI.By contributing to the working group “Aree interne e dintorni” (Inner areas and sur-roundings) within the Italian Planning Society, the researchers focus on the Italianscenario by observing inequalities not only in the areas defined as “inner” by the SNAI,as well as launching a critical debate on policies and practices. By analysing the Italianscenario, researchers registered a relevance of the Italian role within the Europeandebate, but also a very specific perspective, which does not permit generalization in aninternational framework. For these reasons, research activities are focusing on:
– Deepening the Italian scenario implementing a first empirical case study (Irpiniaarea in Campania Region) with an Action Research protocol finalised to build anaction arena – coherent with the place-based approach [9, 10].
– Understanding the phenomenon of areas suffering territorial imbalances in aninternational framework. Geographic and economic remoteness, negative economicand demographic trend as well as exclusion from economic, institutional and cul-tural networks and from decision-making [3, 6, 11–14] are recurring conditions thataffect local development, triggering the risk of progressive territorial de-generationprocesses [15].
This paper regards the process to decode this complex issue, considered relevantwithin the political and scientific debate. A preliminary screening of literature high-lighted the multidisciplinary character of the debate including regional and urbanstudies, economics, social science and environmental studies. The main evidence ofthis activity has been the identification of a multitude of terms referring to areasaffected by conditions of decline or inequalities, and has stimulated the followingresearch questions: How do you intend these areas in different geo-political and dis-ciplinary contexts? Are the different terms synonymous or do they refer to differentsituations?
Starting from these questions, research activities have been aimed at decodingdifferent meanings and collecting practices and issues in an international scenario bydeveloping a Systematic Literature Review (SLR). Having built a database and tested
Exploring Territorial Imbalances 91
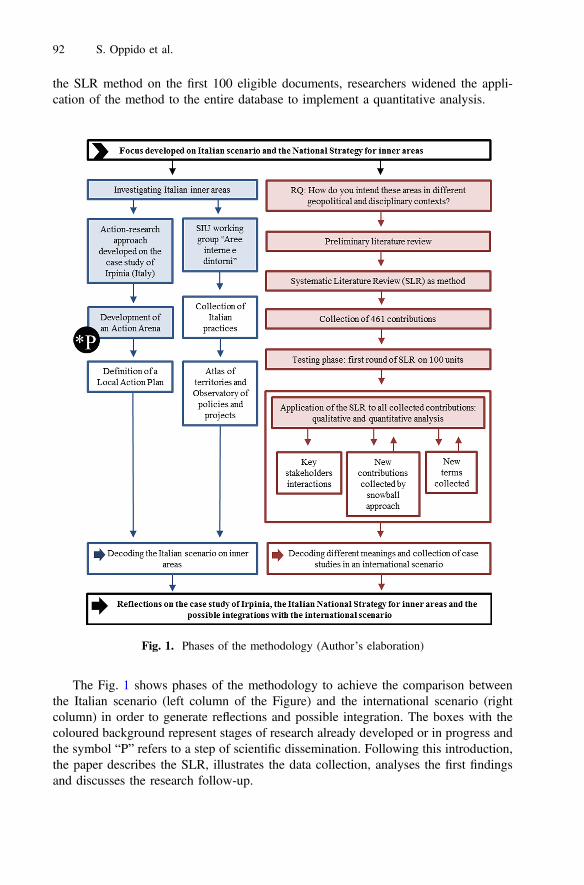
the SLR method on the first 100 eligible documents, researchers widened the appli-cation of the method to the entire database to implement a quantitative analysis.
The Fig. 1 shows phases of the methodology to achieve the comparison betweenthe Italian scenario (left column of the Figure) and the international scenario (rightcolumn) in order to generate reflections and possible integration. The boxes with thecoloured background represent stages of research already developed or in progress andthe symbol “P” refers to a step of scientific dissemination. Following this introduction,the paper describes the SLR, illustrates the data collection, analyses the first findingsand discusses the research follow-up.
Fig. 1. Phases of the methodology (Author’s elaboration)
92 S. Oppido et al.
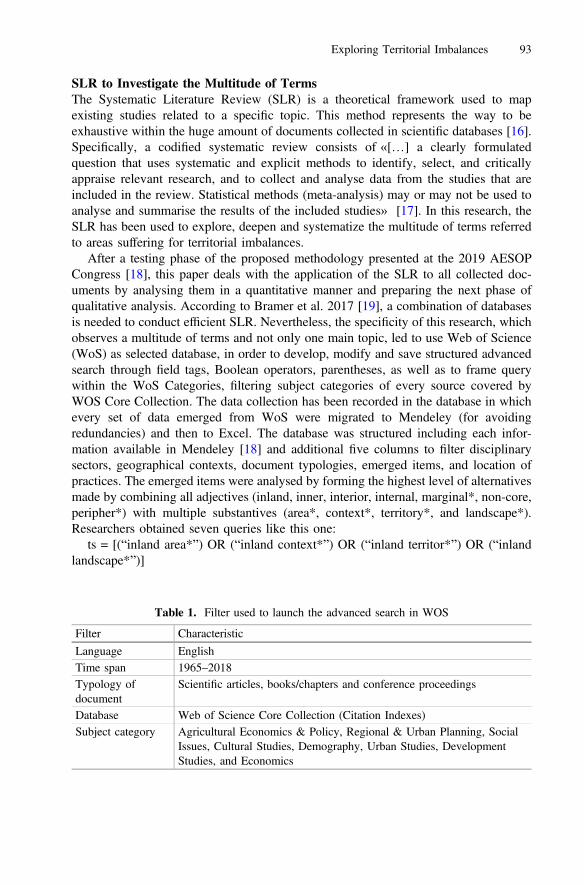
SLR to Investigate the Multitude of TermsThe Systematic Literature Review (SLR) is a theoretical framework used to mapexisting studies related to a specific topic. This method represents the way to beexhaustive within the huge amount of documents collected in scientific databases [16].Specifically, a codified systematic review consists of «[…] a clearly formulatedquestion that uses systematic and explicit methods to identify, select, and criticallyappraise relevant research, and to collect and analyse data from the studies that areincluded in the review. Statistical methods (meta-analysis) may or may not be used toanalyse and summarise the results of the included studies» [17]. In this research, theSLR has been used to explore, deepen and systematize the multitude of terms referredto areas suffering for territorial imbalances.
After a testing phase of the proposed methodology presented at the 2019 AESOPCongress [18], this paper deals with the application of the SLR to all collected doc-uments by analysing them in a quantitative manner and preparing the next phase ofqualitative analysis. According to Bramer et al. 2017 [19], a combination of databasesis needed to conduct efficient SLR. Nevertheless, the specificity of this research, whichobserves a multitude of terms and not only one main topic, led to use Web of Science(WoS) as selected database, in order to develop, modify and save structured advancedsearch through field tags, Boolean operators, parentheses, as well as to frame querywithin the WoS Categories, filtering subject categories of every source covered byWOS Core Collection. The data collection has been recorded in the database in whichevery set of data emerged from WoS were migrated to Mendeley (for avoidingredundancies) and then to Excel. The database was structured including each infor-mation available in Mendeley [18] and additional five columns to filter disciplinarysectors, geographical contexts, document typologies, emerged items, and location ofpractices. The emerged items were analysed by forming the highest level of alternativesmade by combining all adjectives (inland, inner, interior, internal, marginal*, non-core,peripher*) with multiple substantives (area*, context*, territory*, and landscape*).Researchers obtained seven queries like this one:
ts = [(“inland area*”) OR (“inland context*”) OR (“inland territor*”) OR (“inlandlandscape*”)]
Table 1. Filter used to launch the advanced search in WOS
Filter Characteristic
Language EnglishTime span 1965–2018Typology ofdocument
Scientific articles, books/chapters and conference proceedings
Database Web of Science Core Collection (Citation Indexes)Subject category Agricultural Economics & Policy, Regional & Urban Planning, Social
Issues, Cultural Studies, Demography, Urban Studies, DevelopmentStudies, and Economics
Exploring Territorial Imbalances 93
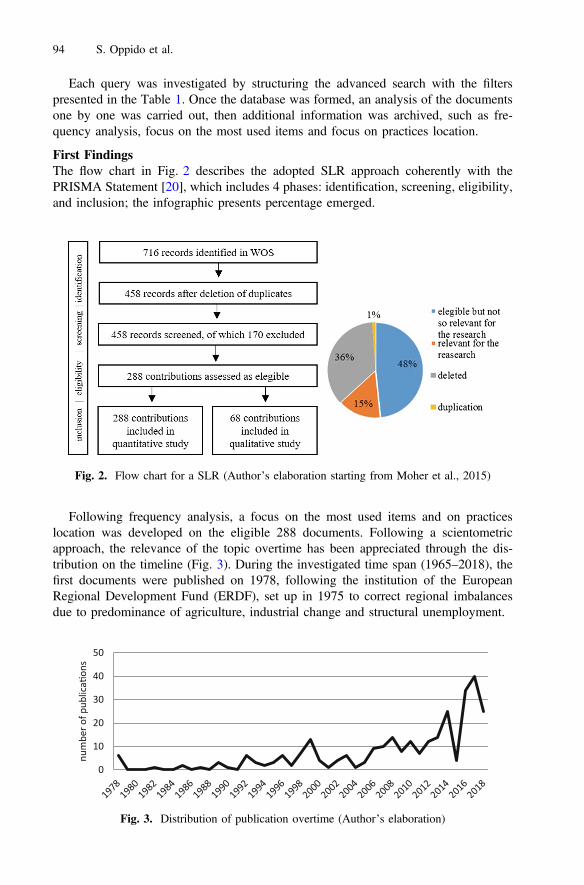
Each query was investigated by structuring the advanced search with the filterspresented in the Table 1. Once the database was formed, an analysis of the documentsone by one was carried out, then additional information was archived, such as fre-quency analysis, focus on the most used items and focus on practices location.
First FindingsThe flow chart in Fig. 2 describes the adopted SLR approach coherently with thePRISMA Statement [20], which includes 4 phases: identification, screening, eligibility,and inclusion; the infographic presents percentage emerged.
Following frequency analysis, a focus on the most used items and on practiceslocation was developed on the eligible 288 documents. Following a scientometricapproach, the relevance of the topic overtime has been appreciated through the dis-tribution on the timeline (Fig. 3). During the investigated time span (1965–2018), thefirst documents were published on 1978, following the institution of the EuropeanRegional Development Fund (ERDF), set up in 1975 to correct regional imbalancesdue to predominance of agriculture, industrial change and structural unemployment.
Fig. 2. Flow chart for a SLR (Author’s elaboration starting from Moher et al., 2015)
0
10
20
30
40
50
num
ber o
f pub
lica
ons
Fig. 3. Distribution of publication overtime (Author’s elaboration)
94 S. Oppido et al.
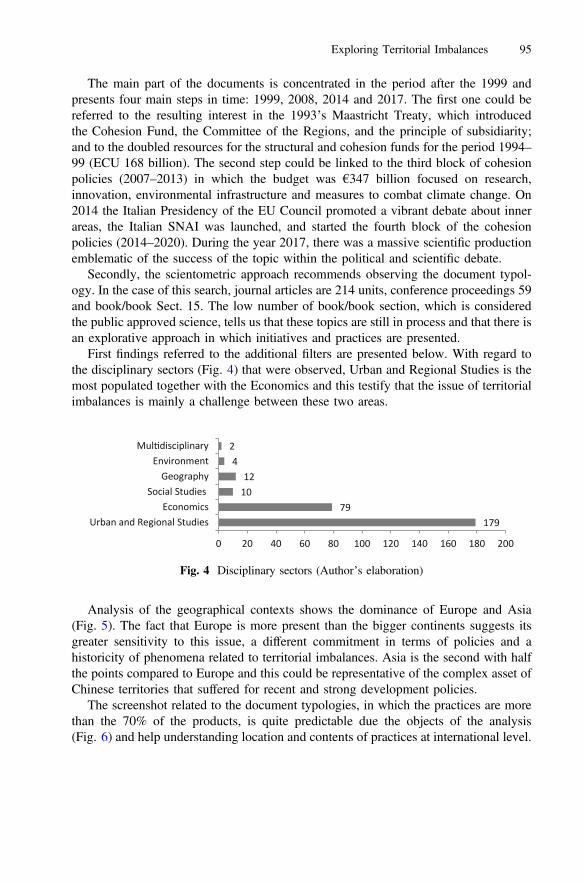
The main part of the documents is concentrated in the period after the 1999 andpresents four main steps in time: 1999, 2008, 2014 and 2017. The first one could bereferred to the resulting interest in the 1993’s Maastricht Treaty, which introducedthe Cohesion Fund, the Committee of the Regions, and the principle of subsidiarity;and to the doubled resources for the structural and cohesion funds for the period 1994–99 (ECU 168 billion). The second step could be linked to the third block of cohesionpolicies (2007–2013) in which the budget was €347 billion focused on research,innovation, environmental infrastructure and measures to combat climate change. On2014 the Italian Presidency of the EU Council promoted a vibrant debate about innerareas, the Italian SNAI was launched, and started the fourth block of the cohesionpolicies (2014–2020). During the year 2017, there was a massive scientific productionemblematic of the success of the topic within the political and scientific debate.
Secondly, the scientometric approach recommends observing the document typol-ogy. In the case of this search, journal articles are 214 units, conference proceedings 59and book/book Sect. 15. The low number of book/book section, which is consideredthe public approved science, tells us that these topics are still in process and that there isan explorative approach in which initiatives and practices are presented.
First findings referred to the additional filters are presented below. With regard tothe disciplinary sectors (Fig. 4) that were observed, Urban and Regional Studies is themost populated together with the Economics and this testify that the issue of territorialimbalances is mainly a challenge between these two areas.
Analysis of the geographical contexts shows the dominance of Europe and Asia(Fig. 5). The fact that Europe is more present than the bigger continents suggests itsgreater sensitivity to this issue, a different commitment in terms of policies and ahistoricity of phenomena related to territorial imbalances. Asia is the second with halfthe points compared to Europe and this could be representative of the complex asset ofChinese territories that suffered for recent and strong development policies.
The screenshot related to the document typologies, in which the practices are morethan the 70% of the products, is quite predictable due the objects of the analysis(Fig. 6) and help understanding location and contents of practices at international level.
17979
1012
4 2
Urban and Regional StudiesEconomics
Social StudiesGeography
EnvironmentMul disciplinary
0 20 40 60 80 100 120 140 160 180 200
Fig. 4 Disciplinary sectors (Author’s elaboration)
Exploring Territorial Imbalances 95

Four items on eighteen emerged as dominant and are all terms consisting of thesubstantive “area”: peripher* area* (121), marginal* area* (59), inland area* (46) andinner area* (22). The term peripher* area* is the most present in the database repre-senting twice as much as the second term for presence. Authors developed two analyseson this set of data. The first one is referred to the use of these terms overtime (Fig. 7)and shows the constant increasing of the term peripher* area* with one decreasingperiod (2001–2005). It is noticeable the increasing in the use of inland area* since2011, the massive presence of marginal* area* during the two periods 2006–2010 and2011–2015, the consolidated use of the term inner area* in the period 2016–2018.
15073
2119
9 8
6 2
EuropeAsiaany
AfricaSouth AmericaNorth America
AustraliaCentral America
0 20 40 60 80 100 120 140 160
Fig. 5. Geographical contexts (Author’s elaboration)
30213
1629
Theore cal approachCase study
Methodological approachProject/program/policy
0 50 100 150 200 250
Fig. 6. Document typologies (Author’s elaboration)
0 10 20 30 40 50
1991-1995
1996-2000
2001-2005
2006-2010
2011-2015
2016-2018
Peripher* area*
Marginal* area*
Inner area*
Inland area*
Fig. 7. Presence of emerged items overtime (Author’s elaboration)
96 S. Oppido et al.
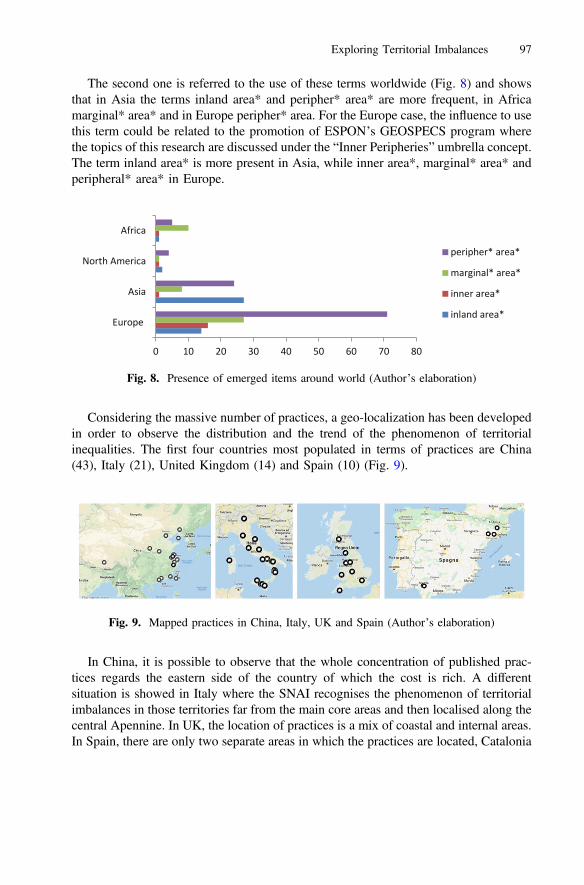
The second one is referred to the use of these terms worldwide (Fig. 8) and showsthat in Asia the terms inland area* and peripher* area* are more frequent, in Africamarginal* area* and in Europe peripher* area. For the Europe case, the influence to usethis term could be related to the promotion of ESPON’s GEOSPECS program wherethe topics of this research are discussed under the “Inner Peripheries” umbrella concept.The term inland area* is more present in Asia, while inner area*, marginal* area* andperipheral* area* in Europe.
Considering the massive number of practices, a geo-localization has been developedin order to observe the distribution and the trend of the phenomenon of territorialinequalities. The first four countries most populated in terms of practices are China(43), Italy (21), United Kingdom (14) and Spain (10) (Fig. 9).
In China, it is possible to observe that the whole concentration of published prac-tices regards the eastern side of the country of which the cost is rich. A differentsituation is showed in Italy where the SNAI recognises the phenomenon of territorialimbalances in those territories far from the main core areas and then localised along thecentral Apennine. In UK, the location of practices is a mix of coastal and internal areas.In Spain, there are only two separate areas in which the practices are located, Catalonia
0 10 20 30 40 50 60 70 80
Europe
Asia
North America
Africa
peripher* area*
marginal* area*
inner area*
inland area*
Fig. 8. Presence of emerged items around world (Author’s elaboration)
Fig. 9. Mapped practices in China, Italy, UK and Spain (Author’s elaboration)
Exploring Territorial Imbalances 97
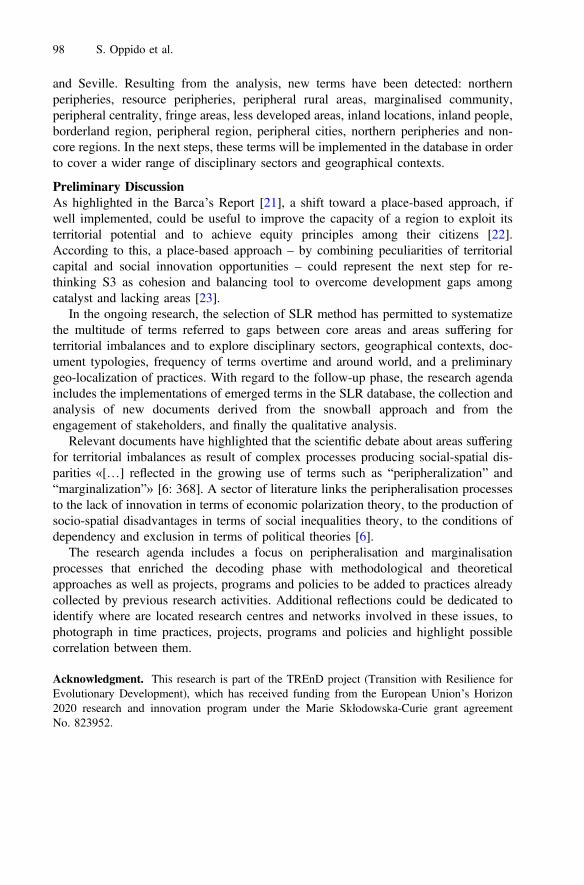
and Seville. Resulting from the analysis, new terms have been detected: northernperipheries, resource peripheries, peripheral rural areas, marginalised community,peripheral centrality, fringe areas, less developed areas, inland locations, inland people,borderland region, peripheral region, peripheral cities, northern peripheries and non-core regions. In the next steps, these terms will be implemented in the database in orderto cover a wider range of disciplinary sectors and geographical contexts.
Preliminary DiscussionAs highlighted in the Barca’s Report [21], a shift toward a place-based approach, ifwell implemented, could be useful to improve the capacity of a region to exploit itsterritorial potential and to achieve equity principles among their citizens [22].According to this, a place-based approach – by combining peculiarities of territorialcapital and social innovation opportunities – could represent the next step for re-thinking S3 as cohesion and balancing tool to overcome development gaps amongcatalyst and lacking areas [23].
In the ongoing research, the selection of SLR method has permitted to systematizethe multitude of terms referred to gaps between core areas and areas suffering forterritorial imbalances and to explore disciplinary sectors, geographical contexts, doc-ument typologies, frequency of terms overtime and around world, and a preliminarygeo-localization of practices. With regard to the follow-up phase, the research agendaincludes the implementations of emerged terms in the SLR database, the collection andanalysis of new documents derived from the snowball approach and from theengagement of stakeholders, and finally the qualitative analysis.
Relevant documents have highlighted that the scientific debate about areas sufferingfor territorial imbalances as result of complex processes producing social-spatial dis-parities «[…] reflected in the growing use of terms such as “peripheralization” and“marginalization”» [6: 368]. A sector of literature links the peripheralisation processesto the lack of innovation in terms of economic polarization theory, to the production ofsocio-spatial disadvantages in terms of social inequalities theory, to the conditions ofdependency and exclusion in terms of political theories [6].
The research agenda includes a focus on peripheralisation and marginalisationprocesses that enriched the decoding phase with methodological and theoreticalapproaches as well as projects, programs and policies to be added to practices alreadycollected by previous research activities. Additional reflections could be dedicated toidentify where are located research centres and networks involved in these issues, tophotograph in time practices, projects, programs and policies and highlight possiblecorrelation between them.
Acknowledgment. This research is part of the TREnD project (Transition with Resilience forEvolutionary Development), which has received funding from the European Union’s Horizon2020 research and innovation program under the Marie Skłodowska-Curie grant agreementNo. 823952.
98 S. Oppido et al.
References
1. European Commission: Europe 2020: Europe’s Growth Strategy. European CommissionDirectorate-General for Communication Publications, Brussels (2012)
2. Foray, D.: Smart Specialisation: Opportunities and Challenges for Regional InnovationPolicy. Routledge, London & New York (2014)
3. Bertolini, P., Pagliacci, F.: Quality of life and territorial imbalances. a focus on italian innerand rural areas. Bio-Based Appl. Econ. 6(2), 183–208 (2017)
4. Copus, A., Mantino, F., Noguera, J.: Inner Peripheries: an oxymoron or a real challenge forterritorial cohesion? Ital. J. Plann. Pract. 7(1), 24–49 (2017)
5. Copus, A., Melo, P.C., Kaup, S., Tagai, G., Artelaris, P.: Regional poverty mapping inEurope–Challenges, advances, benefits and limitations. Local Econ. 30(7), 742–764 (2015)
6. Kühn, M.: Peripheralization: theoretical concepts explaining socio-spatial inequalities. Eur.Plann. Stud. 23(2), 367–378 (2015)
7. Servillo, L., Russo, A.P., Barbera, F., Carrosio, G.: Inner peripheries: towards an EU place-based agenda on territorial peripherality. Ital. J. Plann. Pract. 6(1), 42–75 (2016)
8. Barca, F., Casavola, P., Lucatelli, S.: A strategy for inner areas in Italy: definition,objectives, tools and governance. Mater. UVAL 31 (2014)
9. Oppido, S., Ragozino, S., Micheletti, S., Esposito De Vita, G.: Sharing responsibilities toregenerate publicness and cultural values of marginalised landscapes: case of Alta Irpinia,Italy. Urbani Izziv 29(Special Issue Public Space for Local Life), 125–142 (2018)
10. Oppido, S., Ragozino, S., Icolari, D., Corvigno, V., Esposito De Vita, G.: Patrimonializ-zazione del paesaggio irpino: verso comunità di paesaggio sperimentando la ricerca-azione.In: XXII Conferenza Nazionale SIU Società Italiana degli Urbanisti - L’Urbanistica Italianadi fronte all’agenda 2030 per lo Sviluppo Sostenibile (2020)
11. ESPON: Processes, Features and Cycles of Inner Peripheries in Europe (PROFECY). Theneed for integrating inner peripheries (2017)
12. Pezzi, M.G., Urso, G.: Peripheral areas: conceptualizations and policies. Introduction andeditorial note. Ital. J. Plann. Pract. 6(1), 1–19 (2016)
13. Herrschel, T.: Regional development, peripheralisation and marginalization and the role ofgovernance. In: Herrschel, T., Tallberg, P. (eds.) The Role of Regions? Networks, Scale,Territory, pp. 85–102. Kristianstad Boktryckeri, Kristianstad (2011)
14. Kühn, M., Bernt, M.: Peripheralization and power – theoretical debates. In: Fischer-Tahir,A., Naumann, M. (eds.) Peripheralization, pp. 302–317. Springer VS, Wiesbaden (2013)
15. Sassen, S.: Expulsions. Harvard University Press, Massachusetts (2014)16. Perroni, M.G., Gouvea da Costa, S.E., Pinhero de Lima, E., Vieira da Silva, W., Sant Anna
Ramos Vosgerau, D.: Proposal of a method for review and content analysis of literature: thecase of industrial energy efficiency. In: 26th Annual Conference on POMS, pp. 1–10 (2015)
17. Glossary of Cochrane Community: Systematic review (2019)18. Oppido, S., Ragozino, S.: Unbalanced development and peripheralisation processes: a
testing phase to map studies. In: AESOP Annual Congress Venice 2019 Planning forTransition, Book of Paper, pp. 3381–3393 (2019)
19. Bramer, W.M., Rethlefsen, M.L., Kleijnen, J., Franco, O.H.: Optimal database combinationsfor literature searches in systematic reviews: a prospective exploratory study. Syst. Rev. 6(245), 1–12 (2017)
20. Moher, D., Liberati, A., Tetzlaff, J., Altman, D.G., Group, T.P.: Linee guida per il reportingdi revisioni sistematiche e meta-analisi: il PRISMA Statement. Evidence 7(6), 1–8 (2015)
21. Barca, F.: An Agenda for a Reformed Cohesion Policy. A Place-Based Approach to MeetingEuropean Union Challenges and Expectations (2009)
Exploring Territorial Imbalances 99
22. Barca, F., McCann, P., Rodríguez-Pose, A.: The case for regional development intervention:place-based versus place-neutral approaches. J. Reg. Sci. 52(1), 134–152 (2012)
23. Bevilacqua, C., Trillo, C., Esposito, G., Calabrò, J., Schultz, A.L., Pizzimenti, P., Maione,C.: Smart Specialization Strategies: The Role of Public Private Partnership in PlanningSmarter Cities. Networked Regions and Cities in Times of Fragmentation: DevelopingSmart, Sustainable and Inclusive Places. Regional Studies Association (2012)
Open Access This chapter is licensed under the terms of the Creative Commons Attribution 4.0International License (http://creativecommons.org/licenses/by/4.0/), which permits use, sharing,adaptation, distribution and reproduction in any medium or format, as long as you give appro-priate credit to the original author(s) and the source, provide a link to the Creative Commonslicense and indicate if changes were made.The images or other third party material in this chapter are included in the chapter's Creative
Commons license, unless indicated otherwise in a credit line to the material. If material is notincluded in the chapter's Creative Commons license and your intended use is not permitted bystatutory regulation or exceeds the permitted use, you will need to obtain permission directlyfrom the copyright holder.
100 S. Oppido et al.

Toward Nature-Based Solutions(NBS) Approach in Integrated SegmentReporting of Placed-Based Organizations
Maria-Gabriella Baldarelli1 and Domenico Nicolò2(&)
1 University of Bologna, 40126 Bologna, Italy2 University Mediterranea of Reggio Calabria, 89124 Reggio Calabria, Italy
Abstract. This paper aims to focus on the contribution of the approach bysegments of place-based organizations to planning and reporting social andenvironmental performance along with economic and financial dimensions. Theliterature review is about Nature-Based Solutions (NBS) and segment reporting.In the context of scientific contributions regarding the NBS approach, animportant issue is to evaluate the impact of NBS about different social andenvironmental challenges. Raymond et al. (2017) propose a framework toidentify how NBS can produce both synergies through ecosystem services andco-benefits in a NBS view. Moreover, the paper analyses the logic underlyingthe technique of segmentation in the “space”, the social performance of theoperating segments over “time” and the synergies between segments. In the caseexamined (a Farm), we will demonstrate how the case manages to achievesignificant economy with the production of electric energy deriving from thebiogas obtained by fermentation of manure, therefore it does not incur the costof purchasing electricity and it doesn’t incur in the disposal costs of the manure,but to translate them into raw material to produce electricity and also to sell theenergy in excess to its needs. Besides, the Farm generates benefits for theenvironment inside and outside of it.
Keywords: Nature based solutions � Segment reporting � Environmentalimpact � Farm analysis � Value added
1 Introduction
In the past, the debate had developed with fierce criticisms over the behavior oftransnational companies, which have given rise to and continue to perpetrate green-washing behaviors without highlighting an effective change in production systems.Systems that are not yet able to guarantee respect for the environment and itsimprovement. In practice, instead, a marketing process oriented towards greenwashingis developed, which is also accompanied by a “discreet” intervention strategy at the
This paper is the result of joint research; however, M.G. Baldarelli wrote the Introduction, Sects. 2, 4and the Discussion and Conclusion; D. Nicolò wrote Sects. 3 and 5.
© The Author(s) 2020C. Bevilacqua et al. (Eds.): NMP 2020, SIST 177, pp. 101–112, 2020.https://doi.org/10.1007/978-3-030-52869-0_9
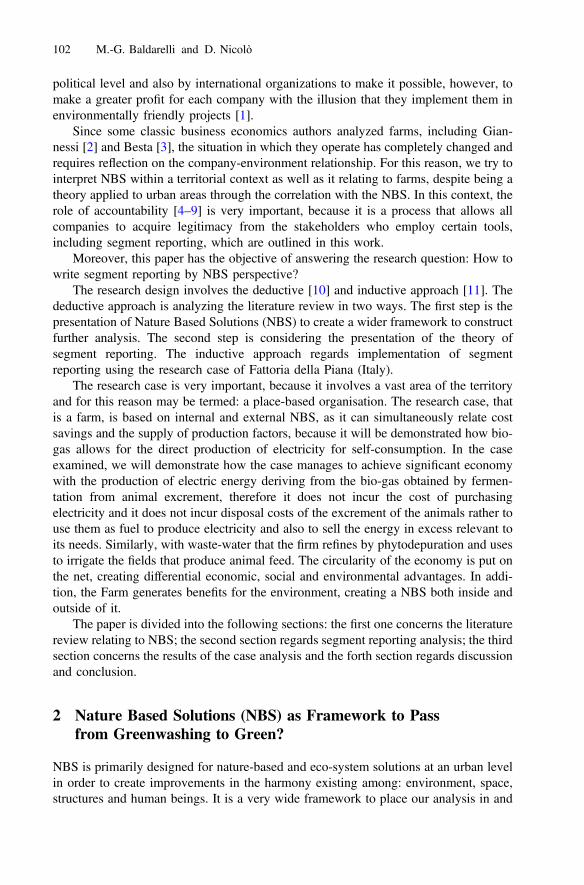
political level and also by international organizations to make it possible, however, tomake a greater profit for each company with the illusion that they implement them inenvironmentally friendly projects [1].
Since some classic business economics authors analyzed farms, including Gian-nessi [2] and Besta [3], the situation in which they operate has completely changed andrequires reflection on the company-environment relationship. For this reason, we try tointerpret NBS within a territorial context as well as it relating to farms, despite being atheory applied to urban areas through the correlation with the NBS. In this context, therole of accountability [4–9] is very important, because it is a process that allows allcompanies to acquire legitimacy from the stakeholders who employ certain tools,including segment reporting, which are outlined in this work.
Moreover, this paper has the objective of answering the research question: How towrite segment reporting by NBS perspective?
The research design involves the deductive [10] and inductive approach [11]. Thedeductive approach is analyzing the literature review in two ways. The first step is thepresentation of Nature Based Solutions (NBS) to create a wider framework to constructfurther analysis. The second step is considering the presentation of the theory ofsegment reporting. The inductive approach regards implementation of segmentreporting using the research case of Fattoria della Piana (Italy).
The research case is very important, because it involves a vast area of the territoryand for this reason may be termed: a place-based organisation. The research case, thatis a farm, is based on internal and external NBS, as it can simultaneously relate costsavings and the supply of production factors, because it will be demonstrated how bio-gas allows for the direct production of electricity for self-consumption. In the caseexamined, we will demonstrate how the case manages to achieve significant economywith the production of electric energy deriving from the bio-gas obtained by fermen-tation from animal excrement, therefore it does not incur the cost of purchasingelectricity and it does not incur disposal costs of the excrement of the animals rather touse them as fuel to produce electricity and also to sell the energy in excess relevant toits needs. Similarly, with waste-water that the firm refines by phytodepuration and usesto irrigate the fields that produce animal feed. The circularity of the economy is put onthe net, creating differential economic, social and environmental advantages. In addi-tion, the Farm generates benefits for the environment, creating a NBS both inside andoutside of it.
The paper is divided into the following sections: the first one concerns the literaturereview relating to NBS; the second section regards segment reporting analysis; the thirdsection concerns the results of the case analysis and the forth section regards discussionand conclusion.
2 Nature Based Solutions (NBS) as Framework to Passfrom Greenwashing to Green?
NBS is primarily designed for nature-based and eco-system solutions at an urban levelin order to create improvements in the harmony existing among: environment, space,structures and human beings. It is a very wide framework to place our analysis in and
102 M.-G. Baldarelli and D. Nicolò
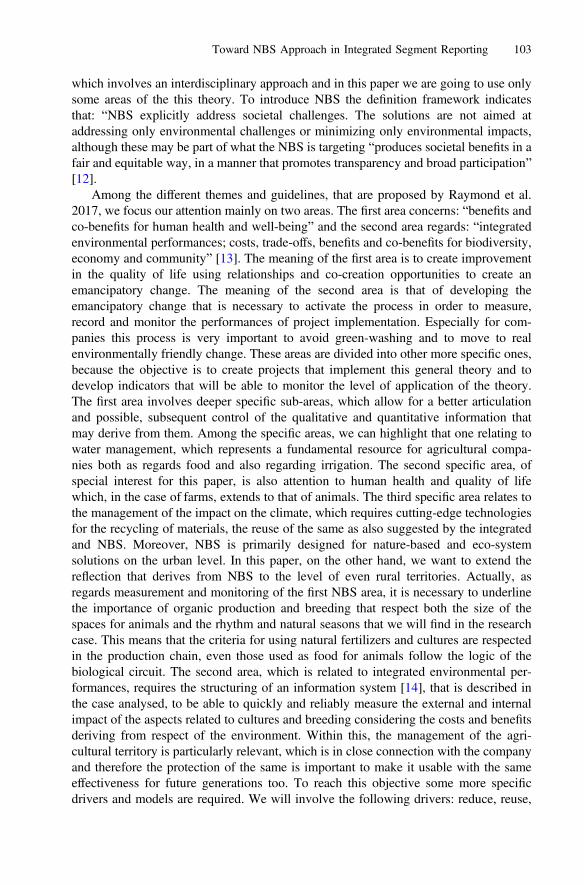
which involves an interdisciplinary approach and in this paper we are going to use onlysome areas of the this theory. To introduce NBS the definition framework indicatesthat: “NBS explicitly address societal challenges. The solutions are not aimed ataddressing only environmental challenges or minimizing only environmental impacts,although these may be part of what the NBS is targeting “produces societal benefits in afair and equitable way, in a manner that promotes transparency and broad participation”[12].
Among the different themes and guidelines, that are proposed by Raymond et al.2017, we focus our attention mainly on two areas. The first area concerns: “benefits andco-benefits for human health and well-being” and the second area regards: “integratedenvironmental performances; costs, trade-offs, benefits and co-benefits for biodiversity,economy and community” [13]. The meaning of the first area is to create improvementin the quality of life using relationships and co-creation opportunities to create anemancipatory change. The meaning of the second area is that of developing theemancipatory change that is necessary to activate the process in order to measure,record and monitor the performances of project implementation. Especially for com-panies this process is very important to avoid green-washing and to move to realenvironmentally friendly change. These areas are divided into other more specific ones,because the objective is to create projects that implement this general theory and todevelop indicators that will be able to monitor the level of application of the theory.The first area involves deeper specific sub-areas, which allow for a better articulationand possible, subsequent control of the qualitative and quantitative information thatmay derive from them. Among the specific areas, we can highlight that one relating towater management, which represents a fundamental resource for agricultural compa-nies both as regards food and also regarding irrigation. The second specific area, ofspecial interest for this paper, is also attention to human health and quality of lifewhich, in the case of farms, extends to that of animals. The third specific area relates tothe management of the impact on the climate, which requires cutting-edge technologiesfor the recycling of materials, the reuse of the same as also suggested by the integratedand NBS. Moreover, NBS is primarily designed for nature-based and eco-systemsolutions on the urban level. In this paper, on the other hand, we want to extend thereflection that derives from NBS to the level of even rural territories. Actually, asregards measurement and monitoring of the first NBS area, it is necessary to underlinethe importance of organic production and breeding that respect both the size of thespaces for animals and the rhythm and natural seasons that we will find in the researchcase. This means that the criteria for using natural fertilizers and cultures are respectedin the production chain, even those used as food for animals follow the logic of thebiological circuit. The second area, which is related to integrated environmental per-formances, requires the structuring of an information system [14], that is described inthe case analysed, to be able to quickly and reliably measure the external and internalimpact of the aspects related to cultures and breeding considering the costs and benefitsderiving from respect of the environment. Within this, the management of the agri-cultural territory is particularly relevant, which is in close connection with the companyand therefore the protection of the same is important to make it usable with the sameeffectiveness for future generations too. To reach this objective some more specificdrivers and models are required. We will involve the following drivers: reduce, reuse,
Toward NBS Approach in Integrated Segment Reporting 103
recycle and recover [15, 16] and the segment reporting model that we are going toanalyze in the following paragraph.
3 Segment Reporting: An Integrated Perspective of Analysisin “Space” and in “Time” of Financial and SocialPerformance of the Companies
The operating segments are companies’ subsystems resulting from a process of seg-mentation in “space” in correspondence with the different products, markets, groups ofcustomers, geographical areas, with similar characteristics. Segmentation in “space”leads to the definition of the “map of the segments” and can be carried out according toone of the abovementioned criteria or even a combination of them. The choice of thesegmentation criterion (or criteria) depends on the information needs of the manage-ment which uses information on the performance of the segments to take decisions andto evaluate the results of the segments and the company as a whole.
Segmentation in “space”, by geographical areas and/or by lines of business (LOB),highlights if are there not good performing segments, or even that produce losses. Goodperformance of the company may hide a bad competitive and/or economic performanceof one or more segments. Segmentation in “time”, moreover, allows the managementof companies to promptly perceive if some segments have an unfavorable financialand/or economic trend, highlighting the need to improve the current trend throughtargeted choices [17].
Reporting by segment is a source of analytical financial information very usefulboth for strategic management and external financial disclosure of the companies.Originally to satisfy the information needs of top management, interested in measuringwith high frequency (quarterly, monthly) the performance of the segments [18–23],segment reporting has also become a very important part of external financial disclo-sure [17, 24–27].
Since the international accounting standards (SFAS: 14 and 131; IAS 14 and 14-R;IFRS 8) introduced segment reporting as a mandatory external financial disclosure toolfor listed companies, a rich research area has developed on this subject.
The IFRS 8 (Operating segment) has introduced the management approachaccording to which external reporting by segment for the stakeholders must be basedon the same segmentation criteria used for the internal segment reporting addressed tothe top management. The underlying idea of this principle is: if a segmentation criteriondelivers significant information for management control, it will also be significant tomeet the information needs of stakeholders [17, 24, 28–34].
This paper highlights a very important function that can be performed by segmentreporting, not yet examined by the literature: measuring the social performance of eachsegment of the company is very useful in understanding the drivers of the socialperformance of the company as a whole. In this way, it is easy to find out if there aresegments with sub-optimal performance, not only from an economic perspective butalso from a social one. The same can be said for the environmental and socialdimension of their performance. Furthermore, disclosing the social performance of the
104 M.-G. Baldarelli and D. Nicolò

segments allows stakeholders to know how much value the company produces anddistributes, with specific reference to each of their segments as well. Adopting a similarapproach, it is also possible to report and manage the company’s impact on theenvironment, with high frequency (monthly, quarterly). In this paper, both from atheoretical point of view and through a case study, these important functions of seg-ment reporting are analysed. The research line suggested by this paper is to combinethe social and economic information by segment into an integrated segment reporting[35]. To this end, a segment reporting scheme is proposed. This model is innovativebecause it integrates two performance dimensions of the segments: both the economicone, highlighted by the operating result of the distinct segments and the social one,expressed by the added value produced by each of them and intended to satisfy theinterests of the stakeholders. The value added is assumed as a synthetic indicator of thesocial performance of the companies and their segments because it shows the wealthdistributed to stakeholders (workers, financiers, public administration, shareholders).
The contribution of this paper is to highlight the relevance to measure the contri-bution of each segment to overall company worth. By measuring the value addedcreated by each segment with high frequency (monthly, quarterly), the managementcan be informed promptly if some segment does not contribute adequately to the totalvalue added of the company as a whole and set tailored choices to correct any unfa-vourable trends. For this reason, we propose a reporting by segment scheme whichhighlights not only the operating result but also the value added created by eachsegment. This scheme is general and must be tailored by the companies to their specificneeds. This model is then applied to a case study in the agri-food sector. In other paperswe have presented general reporting schemes for segments that can be adopted bycompanies operating in other sectors: transport and healthcare [36, 37].
Another contribution of this paper is to propose segment reporting to investigate thesynergies between segments and thus highlight the elements of internal synergy (i.e.between segments) and of the ecosystem (between each segment and the environment)that derive from the NBS model adopted in the case-study examined in this paper.
In the case study examined the synergies between the segments are evident: thewaste produced by some segments becomes raw material for other segments thuscreating a double economic advantage for the company: on the one hand, the costs ofwaste disposal are eliminated (in both the dairy and the farmhouse) on the other, thecosts of purchasing raw materials and consumables of some segments are reduced sincethey are obtained by recycling, converting and reusing waste materials from othersegments. There is also an NBS advantage that is achieved with other companies(farms operating within the same ecosystem) from which the company under exami-nation purchases manure to transform it into electricity through the biogas plant. Inaddition to minimising their environmental impact, these transactions generate sig-nificant reciprocal economic benefits. In particular, those that use manure andwastewater from stables not only generate revenues by selling electric energy but alsodo not pay waste disposal expenses. The company examined in this paper achieves theadvantage of obtaining raw materials at a very low cost, i.e. manure and wastewaterfrom the stables, which is needed to produce electricity using the biogas plant thatenters the national electricity grid, achieving substantial revenue flows (on average €2.1million per year).
Toward NBS Approach in Integrated Segment Reporting 105
Integrated segment reporting allows measurement of the added value of thesesegments, that is, the wealth they produce, and which may be distributed to meet theinterests of stakeholders. Furthermore, when integrated segment reporting is preparedby a company that implements an NBS model, it highlights the benefits that derivefrom it in terms of costs and revenues for each distinct segment. Following the liter-ature review, in the next section, we will examine the case study.
4 The Research Case of Fattoria della Piana: Methodology,Mission and Governance
MethodologyThis section presents a research case [38–40], the analysis of which is performed
through a qualitative approach [41]. The case was chosen because it is a “critical case”[39]. In fact, it is of significant importance for the positive results that the company hasachieved to date in the concrete implementation of an NBS model. These results derivefrom the transformation of agri-food and zootechnical production waste into resourcesin an efficient and economical way. This process demonstrates the concrete possibilityof combining the reduction of the environmental impact of production activities, goodeconomic, social and environmental results. To this must also be added the satisfactionof the stakeholders through the distribution of a substantial added value and theadoption of NBS.
The research was conducted by adopting the participant observation method, avariant of the case method, which leads the researcher to observe the reality byinteracting with the key players of the company. The results are also based on docu-mentary analysis, used to collect, classify, measure and interpret information [42]. Theexamined documents made it possible to give definition to the map of the segments andto allocate costs and revenues to these centres and in this way to measure their grossand net added value and operating result. Accounting and non-accounting informationwas used, acquired directly from the managers. The latter also assessed the consistencyof the results of the segments reached through the allocation of costs and revenues tothese result centres. We are fully aware that general theories, valid for all companies,cannot be inferred from cases [42, 43]. In fact, this study does not aim to build a“theoretical case” [38] from which to derive a theory by means of a statistical gener-alisation or mathematical modelling [39, 44, 45], but it has more limited objectives:establishing a theoretical framework of reference for companies operating in this sectorwho intend to carry out reporting by segment for management control and also externalcommunication needs and demonstrating the economic convenience of adopting anNBS model in the agri-food and zootechnical fields. In fact, the segment report pre-sented in this paper can also be adopted, with the necessary adjustments, by othercompanies operating in the same fields of activity. By carrying out a similar activitythey face similar management problems, the adaptation of the report schemes bysegment presented in this paper to the needs of each company is minimal. For thedescription of the case we use the mission, governance and accountability schemeproposed by Matacena.
106 M.-G. Baldarelli and D. Nicolò
Mission and GovernanceFor the description of the case we use the mission, governance and accountabilityscheme [46]. Fattoria della Piana is a cooperative of agricultural products, establishedin 1986, with registered offices in Candidoni (RC-Italy). The company’s mission is toproduce mainly dairy products with the aim of respecting the traditions of the Calabrianterritory with the combination of modern technologies to respect the environment,giving life to the NBS aspects related to: Reduce; Reuse; Recycle1 [16].
It operates in the dairy sectors, collecting the milk produced by the members of thecooperative and transforming it into dairy products that it distributes daily using freshproducts, its agritourism activity and energy and heat production chain through abiogas plant and a photovoltaic plant. The cooperative created an efficient NBS modelby transforming the problems of the disposal of livestock rubbish and dairy processingresidues into resources to produce electricity and heat, through a biogas plant with apower of 998 kW, in water that can be used to irrigate the fields in which food for farmanimals is grown, through a phytodepuration plant, in fertilizer to fertilize the fields inwhich forage for animals grows.
The company has obtained ISO 14001 certification, which is issued to companiesthat are able to control the effects of their production activities, minimizing the envi-ronmental impact and won a lot of awards (fattoriadellapiana.it). The cooperative’sgovernance considers the typical aspects of these companies, namely: mutuality,democracy and solidarity, which are reflected in the active participation of employeesat various levels. After the brief analysis of mission and governance, we can considerthe different dimensions of NBS and add the segments that will be explained in thefollowing section.
5 The Case Study “Fattoria della Piana”: NBSand Integrated Segment Reporting
In the case study examined, Fattoria della Piana, the segment with the highest turnoverin 2017 and 2018, is a “Dairy”, together with the segments of: “Electricity productionfrom biogas plant”, “Electricity production from a photovoltaic plant” and“Farmhouse”.
The biogas plant collects the manure of the livestock farms in the area, especiallyone located in an area adjacent to the farm examined in this case study, and thedischarges of the dairy processing (mostly whey) into two large fermentation tanks that
1 “Today ours is the largest farm in the province of Reggio Calabria and one of the largest in SouthernItaly. A reality that continues to grow, always respecting the environment and transforming what isnormally waste into a resource. Our organic fertilizer returns to the soil all the nutrients necessary toobtain quality productions. We replicate natural cycles by generating more energy than is necessaryfor the operation of the company, helping to reduce the environmental impact. We have aphotovoltaic system that powers the entire farm and allows you to cut costs. We have a biogasproduction plant powered by different processing residues, which allows you to create biomethane.Finally, there is our phytodepuration plant, the largest in Southern Italy. The electricity produced bybiomethane, equal to 998 kW/h, is fed into the national grid, covering the energy needs of 2,680families.” (www.fattoriadellapiana.it).
Toward NBS Approach in Integrated Segment Reporting 107
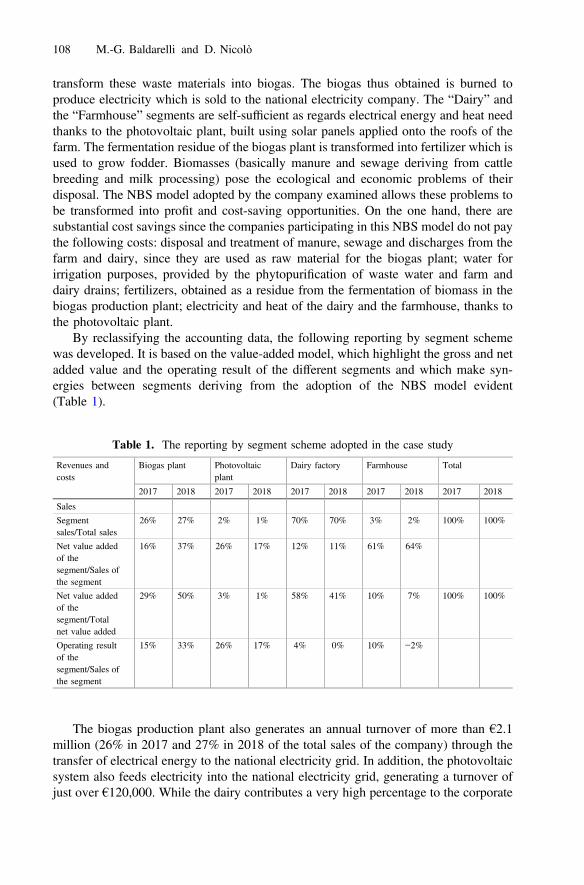
transform these waste materials into biogas. The biogas thus obtained is burned toproduce electricity which is sold to the national electricity company. The “Dairy” andthe “Farmhouse” segments are self-sufficient as regards electrical energy and heat needthanks to the photovoltaic plant, built using solar panels applied onto the roofs of thefarm. The fermentation residue of the biogas plant is transformed into fertilizer which isused to grow fodder. Biomasses (basically manure and sewage deriving from cattlebreeding and milk processing) pose the ecological and economic problems of theirdisposal. The NBS model adopted by the company examined allows these problems tobe transformed into profit and cost-saving opportunities. On the one hand, there aresubstantial cost savings since the companies participating in this NBS model do not paythe following costs: disposal and treatment of manure, sewage and discharges from thefarm and dairy, since they are used as raw material for the biogas plant; water forirrigation purposes, provided by the phytopurification of waste water and farm anddairy drains; fertilizers, obtained as a residue from the fermentation of biomass in thebiogas production plant; electricity and heat of the dairy and the farmhouse, thanks tothe photovoltaic plant.
By reclassifying the accounting data, the following reporting by segment schemewas developed. It is based on the value-added model, which highlight the gross and netadded value and the operating result of the different segments and which make syn-ergies between segments deriving from the adoption of the NBS model evident(Table 1).
The biogas production plant also generates an annual turnover of more than €2.1million (26% in 2017 and 27% in 2018 of the total sales of the company) through thetransfer of electrical energy to the national electricity grid. In addition, the photovoltaicsystem also feeds electricity into the national electricity grid, generating a turnover ofjust over €120,000. While the dairy contributes a very high percentage to the corporate
Table 1. The reporting by segment scheme adopted in the case study
Revenues andcosts
Biogas plant Photovoltaicplant
Dairy factory Farmhouse Total
2017 2018 2017 2018 2017 2018 2017 2018 2017 2018
Sales
Segmentsales/Total sales
26% 27% 2% 1% 70% 70% 3% 2% 100% 100%
Net value addedof thesegment/Sales ofthe segment
16% 37% 26% 17% 12% 11% 61% 64%
Net value addedof thesegment/Totalnet value added
29% 50% 3% 1% 58% 41% 10% 7% 100% 100%
Operating resultof thesegment/Sales ofthe segment
15% 33% 26% 17% 4% 0% 10% −2%
108 M.-G. Baldarelli and D. Nicolò
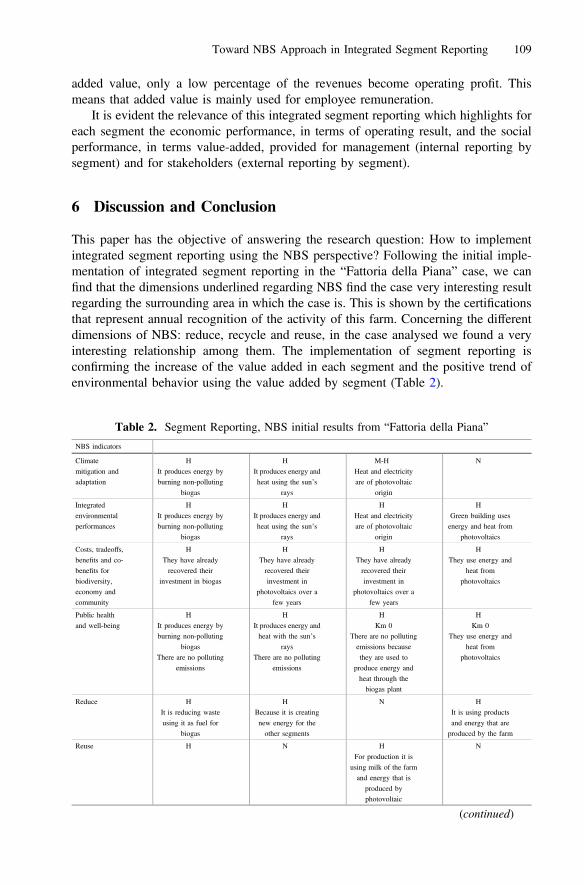
added value, only a low percentage of the revenues become operating profit. Thismeans that added value is mainly used for employee remuneration.
It is evident the relevance of this integrated segment reporting which highlights foreach segment the economic performance, in terms of operating result, and the socialperformance, in terms value-added, provided for management (internal reporting bysegment) and for stakeholders (external reporting by segment).
6 Discussion and Conclusion
This paper has the objective of answering the research question: How to implementintegrated segment reporting using the NBS perspective? Following the initial imple-mentation of integrated segment reporting in the “Fattoria della Piana” case, we canfind that the dimensions underlined regarding NBS find the case very interesting resultregarding the surrounding area in which the case is. This is shown by the certificationsthat represent annual recognition of the activity of this farm. Concerning the differentdimensions of NBS: reduce, recycle and reuse, in the case analysed we found a veryinteresting relationship among them. The implementation of segment reporting isconfirming the increase of the value added in each segment and the positive trend ofenvironmental behavior using the value added by segment (Table 2).
Table 2. Segment Reporting, NBS initial results from “Fattoria della Piana”
NBS indicators
Climate
mitigation andadaptation
H
It produces energy byburning non-polluting
biogas
H
It produces energy andheat using the sun’s
rays
M-H
Heat and electricityare of photovoltaic
origin
N
Integrated
environmentalperformances
H
It produces energy byburning non-polluting
biogas
H
It produces energy andheat using the sun’s
rays
H
Heat and electricityare of photovoltaic
origin
H
Green building usesenergy and heat from
photovoltaics
Costs, tradeoffs,
benefits and co-benefits for
biodiversity,economy and
community
H
They have alreadyrecovered their
investment in biogas
H
They have alreadyrecovered their
investment inphotovoltaics over a
few years
H
They have alreadyrecovered their
investment inphotovoltaics over a
few years
H
They use energy andheat from
photovoltaics
Public health
and well-being
H
It produces energy byburning non-polluting
biogasThere are no polluting
emissions
H
It produces energy andheat with the sun’s
raysThere are no polluting
emissions
H
Km 0There are no polluting
emissions becausethey are used to
produce energy and
heat through thebiogas plant
H
Km 0They use energy and
heat fromphotovoltaics
Reduce H
It is reducing waste
using it as fuel forbiogas
H
Because it is creating
new energy for theother segments
N H
It is using products
and energy that areproduced by the farm
Reuse H N H
For production it is
using milk of the farmand energy that is
produced byphotovoltaic
N
(continued)
Toward NBS Approach in Integrated Segment Reporting 109
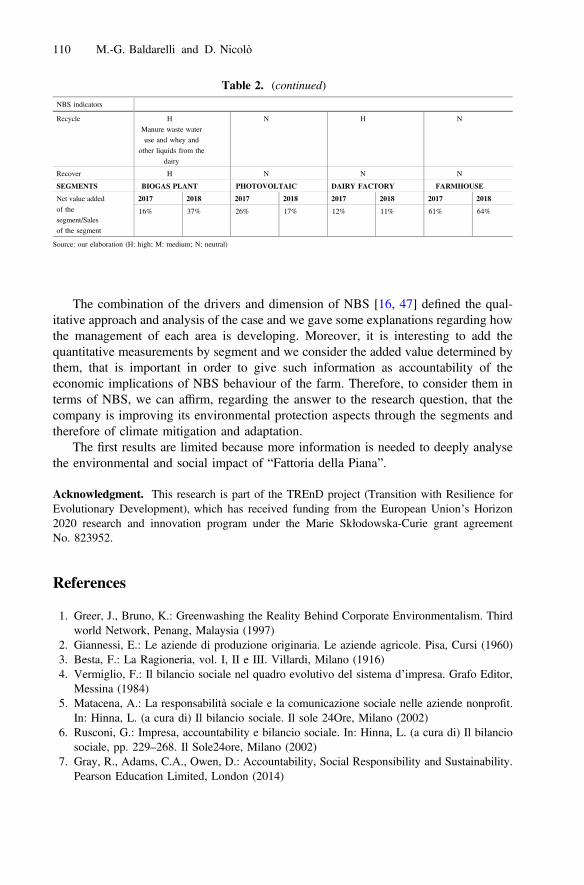
The combination of the drivers and dimension of NBS [16, 47] defined the qual-itative approach and analysis of the case and we gave some explanations regarding howthe management of each area is developing. Moreover, it is interesting to add thequantitative measurements by segment and we consider the added value determined bythem, that is important in order to give such information as accountability of theeconomic implications of NBS behaviour of the farm. Therefore, to consider them interms of NBS, we can affirm, regarding the answer to the research question, that thecompany is improving its environmental protection aspects through the segments andtherefore of climate mitigation and adaptation.
The first results are limited because more information is needed to deeply analysethe environmental and social impact of “Fattoria della Piana”.
Acknowledgment. This research is part of the TREnD project (Transition with Resilience forEvolutionary Development), which has received funding from the European Union’s Horizon2020 research and innovation program under the Marie Skłodowska-Curie grant agreementNo. 823952.
References
1. Greer, J., Bruno, K.: Greenwashing the Reality Behind Corporate Environmentalism. Thirdworld Network, Penang, Malaysia (1997)
2. Giannessi, E.: Le aziende di produzione originaria. Le aziende agricole. Pisa, Cursi (1960)3. Besta, F.: La Ragioneria, vol. I, II e III. Villardi, Milano (1916)4. Vermiglio, F.: Il bilancio sociale nel quadro evolutivo del sistema d’impresa. Grafo Editor,
Messina (1984)5. Matacena, A.: La responsabilità sociale e la comunicazione sociale nelle aziende nonprofit.
In: Hinna, L. (a cura di) Il bilancio sociale. Il sole 24Ore, Milano (2002)6. Rusconi, G.: Impresa, accountability e bilancio sociale. In: Hinna, L. (a cura di) Il bilancio
sociale, pp. 229–268. Il Sole24ore, Milano (2002)7. Gray, R., Adams, C.A., Owen, D.: Accountability, Social Responsibility and Sustainability.
Pearson Education Limited, London (2014)
Table 2. (continued)
NBS indicators
Recycle H
Manure waste wateruse and whey and
other liquids from the
dairy
N H N
Recover H N N N
SEGMENTS BIOGAS PLANT PHOTOVOLTAIC DAIRY FACTORY FARMHOUSE
Net value added
of the
segment/Salesof the segment
2017 2018 2017 2018 2017 2018 2017 2018
16% 37% 26% 17% 12% 11% 61% 64%
Source: our elaboration (H: high; M: medium; N: neutral)
110 M.-G. Baldarelli and D. Nicolò

8. Bebbington, J., Unerman, J.: Achieving the United Nations Sustainable Development Goals:an enabling role for accounting research. Accounting, Auditing & Accountability Journal 31(1), 2–24 (2018)
9. Dillard, J.: Speech presented at the CSEAR Conference Urbino (2018)10. Ferraris Franceschi, R.: L’indagine metodologica in economia aziendale. Giuffrè, Milano
(1978)11. Naumes, W., Naumes, M.J.: The Art and Craft of Case Writing. Routledge, New York
(2014)12. Cohen-Shacham, E., Walters, G., Janzen, C., Maginnis, S.: Nature-based solutions to address
global societal challenges, p. 97. IUCN, Gland, Switzerland (2016)13. Raymond, C.M., Frantzeskaki, N., Kabisch, N., Berry, P., Breil, M., Nita, M.R., Calfapietra,
C.: A framework for assessing and implementing the co-benefits of nature-based solutions inurban areas. Environ. Sci. Policy 77, 15–24 (2017)
14. Marchi, L.: I sistemi informativi aziendali, II edn. Giappichelli, Torino (1993)15. Korhonen, J., Nuur, C., Feldmann, A., Birkie, S.E.: Circular economy as an essentially
contested concept. J. Clean. Prod. 175, 544–552 (2018)16. Kirchherr, J., Reike, D., Hekkert, M.: Conceptualizing the circular economy: an analysis of
114 definitions. Resour. Conserv. Recycl. 127, 221–232 (2017)17. Nicolò, D.: Il reporting per segmenti e l’informativa settoriale secondo l’IFRS 8. Giuffrè,
Milano (2009)18. Barbato Bergamin, M.: Programmazione e controllo in un’ottica strategica. UTET, Torino
(1997)19. Riccaboni, A.: Gerarchia degli obiettivi d’impresa e sistema di gestione delle performance.
Egea, Milano (1993)20. Amigoni, F.: Le forme di reporting e l’analisi degli scostamenti. In: Amigoni, F. (a cura di)
Misurazioni d’azienda. Programmazione e controllo. Giuffrè, Milano (1995)21. Saita, M.: Programmazione e controllo. Giuffrè, Milano (1996)22. Ferraris Franceschi, R.: Pianificazione e controllo. Sistemi di management e logiche di
funzionamento, vol. I. Giappichelli, Torino (2007)23. Marasca, S., Marchi, L., Riccaboni, A.: Controllo di gestione. Metodologie e strumenti.
Knowità, Milano (2013)24. Paris, A.: Comunicazione d’impresa e report di segmenti operativi. Cedam, Padova (1999)25. Angiola, N.: IAS 14: Segment reporting. Interpretazione e applicazione. FrancoAngeli,
Milano (2004)26. Angiola, N.: IFRS 8: Operating segment. Riflessioni sui nuovi orientamenti. FrancoAngeli,
Milano (2007)27. Fortuna, F.: Il segmental reporting nel processo informativo d’impresa: comunicazione
interna, esterna e creazione di valore. FrancoAngeli, Milano (2004)28. Bugeja, M., Czernkowski, R., Moran, D.: Did IFRS 8 increase segment disclosure? Working
Paper, University of Technology, Sydney, Australia, pp. 4–8 (2012)29. Crawford, L., Extance, H., Helliar, C., Power, D.: Operating Segments: The Usefulness of
IFRS 8. ICAS - Institute of Chartered Accountants in Scotland, Edinburgh (2012)30. Mardini, G., Crawford, L., Power, D.: The impact of IFRS 8 on disclosure practices of
Jordanian listed companies. J. Account. Emerg. Econ. 2(1), 67–90 (2012)31. Pisano, S., Landriani, L.: The Determinants of segment disclosures: an empirical analysis on
Italian listed companies. Financ. Report. 1(1), 113–132 (2012)32. Nichols, N., Street, D., Cerola, S.: An analysis of the impact of adopting IFRS 8 on the
segment disclosures of European blue-chip companies. J. Int. Account. Audit. Taxat. 21(2),79–105 (2012)
Toward NBS Approach in Integrated Segment Reporting 111
33. Nichols, N., Street, D., Tarca, A.: The impact of segment reporting under the IFRS 8 andSFAS 131 management approach: a research review. J. Int. Financ. Manage. Account. 24(3),261–312 (2013)
34. Pardal, P., Morais, A.I., Curto, J.D.: Competitive harm and business segment reporting underIFRS 8: evidence from European union listed firms. In: EAA 38th Annual Congress,Glasgow, April 28–30, 2015, pp. 1–52 (2015)
35. Baldarelli, M.G., Nicolò, D.: Toward an integrated segment reporting: between tradition andinnovation. Int. J. Adv. Manage. Econ. 08(06), 16–22 (2019)
36. Nicolò, D.: Il reporting per segmenti nel controllo di gestione. Un’esperienza nel settoredelle autolinee di trasporto pubblico. In Corbella, S., Marchi, L., Rossignoli, F. (a cura di)Nuove frontiere del reporting aziendale. La comunicazione agli stakeholders tra vincolinormativi e attese informative, pp. 175–195. FrancoAngeli, Milano (2018)
37. Nicolò, D., Valenza, G.: Il reporting per segmenti nei settori del trasporto pubblico locale edella cura della salute. Esperienze a confronto, Management Control (in press)
38. Naumes, W., Naumes, M.J.: Art and Craft of Case Writing. ME Sharpe, Inc., Armonk (2006)39. Yin, R.K.: Case Study Research and Applications: Design and Methods. Sage, Thousand
Oaks (2013)40. Chiucchi, M.S.: Il metodo dello studio di caso nel management accounting. Giappichelli,
Torino (2012)41. Ritchie, J., Lewis, J.: Qualitative Research Practice. A Guide for Social Science Students and
Researchers. Sage, Thousand Oaks (2003)42. Costa, M.: Il caso in economia aziendale: tra logica della scoperta scientifica e logica della
conferma scientifica. In: Dagnino, G.B., Di Betta, P., Quattrone, P. (a cura di) Lemetodologie della ricerca nelle discipline economico-aziendali fra tradizione e nuovetendenze, pp. 421–447. Edizioni Scientifiche Italiane, Napoli (1998)
43. Corbetta, P.: Metodologie e tecniche della ricerca sociale, II edn. Il Mulino, Bologna (2014)44. Klandermans, B., Staggenborg, S. (eds.) Methods of Social Movement Research, vol. 16.
University of Minnesota Press, Minneapolis (2002)45. Turrini, A.: Il caso come metodologia di ricerca in economia aziendale. In: Azienda
Pubblica, vol. 15(1/2), pp. 67–85 (2002)46. Matacena, A.: Corporate social responsibility and accountability: some glosses. In: Civil
Economy, Democracy, Transparency and Social and Environmental Accounting ResearchRole, pp. 7–59 (2010)
47. Cohen-Shacham, E., Walters, G., Janzen, C., Maginnis, S.: Nature-Based Solutions toAddress Global Societal Challenges, p. 97. IUCN, Gland, Switzerland, (2016)
Open Access This chapter is licensed under the terms of the Creative Commons Attribution 4.0International License (http://creativecommons.org/licenses/by/4.0/), which permits use, sharing,adaptation, distribution and reproduction in any medium or format, as long as you give appro-priate credit to the original author(s) and the source, provide a link to the Creative Commonslicense and indicate if changes were made.The images or other third party material in this chapter are included in the chapter's Creative
Commons license, unless indicated otherwise in a credit line to the material. If material is notincluded in the chapter's Creative Commons license and your intended use is not permitted bystatutory regulation or exceeds the permitted use, you will need to obtain permission directlyfrom the copyright holder.
112 M.-G. Baldarelli and D. Nicolò
Making a Step Forward Towards UrbanResilience. The Contribution of Digital
Innovation
Carlo Vermiglio1(&), Hiroko Kudo2, and Vincenzo Zarone3
1 Department of Business Administration, University of Messina, Messina, [email protected]
2 Department of Law, Chuo University, Tokyo, [email protected]
3 Department of Economics and Management, University of Pisa, Pisa, [email protected]
Abstract. Starting from ‘wicked problem’ theory as the landmark for framingdisaster events in terms of policy issue for city governments, this paper high-lights the contribution provided by Big Data analytics and digital innovation indealing with disaster risks. The research aims at answering the followingquestion: what is the role that ‘smart technologies’ play in strengthening urbanresilience to disaster risks?To answer the question, the study devotes attention to some applications of
data analytics for enhancing cities resilience towards disaster risk reduction.Exploiting the transformative power of digital innovation for the enhancement
of city ‘smartness’ could be a valuable path for boosting urban resilience facing‘wicked problems. However, it is debatable whether cities can effectivelyovercome these problems without a clear understanding of the need to mergesmartness and resilience in a broad policy framework and to apply these prin-ciples into consistent operational disaster risk reduction plans.
Keywords: Smart cities � Resilience � Disaster risk reduction � Big dataanalytics � Smart technologies
1 Introduction
Enhancing the ‘smartness’ of cities and boosting the ‘resilience’ of their communitiesin the face of ‘wicked problems’ are key contemporary challenges for local govern-ments that ask for, adaptive, collaborative, and long-term oriented policy approaches.
These challenges drawn the attention of both academic and politicians, arriving atthe fore of the agenda of UN Institutions, national, local Governments, and NGOs, inlight of the pivotal relevance they assume for the achievement of Sustainable Devel-opment Goals. A major concern of the Agenda, in fact, is to “ensure responsive,inclusive, participatory and representative decision-making at all levels”. Likewise, theHyogo Framework for Action and the Sendai Framework for Disaster Risk Reduction2015–2030 (SFDRR) have strongly emphasized the need for “strengthening disaster
© The Author(s) 2020C. Bevilacqua et al. (Eds.): NMP 2020, SIST 177, pp. 113–123, 2020.https://doi.org/10.1007/978-3-030-52869-0_10
risk governance and coordination across relevant institutions and sectors and the fulland meaningful participation of relevant stakeholders at appropriate levels”.
For 2018, the UN ‘High-Level Political Forum on Sustainable Development’(HLPF) will focus on transformation towards sustainable and resilient societies, with amajor attention, among others, to SDG 11 named “Make cities and human settlementsinclusive, safe, resilient and sustainable”, confirming the pivotal role played by Cities,Local and Regional Governments in pursuing sustainability and disaster risk reductionchallenges.
Adopting a ‘smart approach’ that “makes use of opportunities from digitalization,clean energy and technologies, as well as innovative transport technologies, thusproviding options for inhabitants to make more environmentally friendly choices andboost sustainable economic growth and enabling cities to improve their servicedelivery” is a basic principle of the UN New Urban Agenda.
City transformation processes must therefore be rethought to mitigate the effects ofextreme events on the vital functions of cities and communities.
In light of these challenges the paper debates on how the dissemination of ‘smarttechnologies’ strengthens urban resilience to disaster risks.
The remainder of the research is structured as follows: Sect. 2 presents the literaturereview which embraces two major strands of research: public policy and ICT man-agement; Sect. 3 briefly describes method and discusses preliminary findings; Sect. 4highlights conclusion and limitations of the study.
2 Framing Cities in the Era of Complexity and Vulnerabilityto Disaster Risk. A Literature Review
The public governance literature has illustrated how organizations and communitiescould deal with the dynamic complexity that characterizes today’s societies [1–6].
From the perspective of public policy issues, ‘wicked problems’ [7] are thoseunpredictable, complex, undefined, open-ended and non-linear problem [8, 9], that ‘haveno technical solution, involve multiple stakeholders, and create ripple effects’ [10].
In their pivotal work, Rittel and Webber [7] listed ten properties of wicked prob-lems1, whose essence has been effectively summarized by Head [11]: complexity,uncertainty and divergence.
Looking at these features, which are cumulative and mutually reinforcing, disasterscan be easily labeled as ‘wicked problems’ due to their wide nature (storms,
1 For every WP: 1. There is no definitive formulation of a wicked problem. 2. They have no stoppingrule. 3. Solutions to wicked problems are not true/false, but good/bad. 4. There is no immediate andno ultimate test of a solution to a wicked problem. 5. Every solution to a wicked problem is a “one-shot operation”; because there is no opportunity to learn by trial and error, every attempt countssignificantly. 6. They do not have an enumerable (or exhaustively describable) set of potentialsolutions, nor is there a well-described set of permissible operations that may be incorporated into theplan. 7. Every wicked problem is essentially unique. 8. Every wicked problem can be considered asymptom of another wicked problem. 9. The existence of a discrepancy representing a wickedproblem can be explained in numerous ways. The choice of explanation determines the nature of theproblem’s solution. 10. The designer has no right to be wrong.
114 C. Vermiglio et al.
earthquakes, volcanoes, heat waves, droughts, epidemic, floods, landslides, wildfire,collision, terrorist attack, nuclear accident, etc.), causes (natural vs. man-made, mixed),scale (local, national, super-national), and to the variety of interpretative criteriaapplicable to these catastrophic events (technical, social, economic etc.), [12–15].
The frequency and intensity of disasters and extreme weather events occurred in thelast decade posed critical issues that forced policy makers to prioritize disaster riskmanagement and community resilience in the policy agenda [16–18], defining effectivestrategies that might spread a common sense of preparedness, adaptation and awarenessthrough the communities.
From an urban governance perspective, disasters determine devastating effects tocritical infrastructure and basic service disruptions, generating mistrust and insecuritythrough the community.
Moreover, the whole disaster risk management cycle poses problems in terms ofscales of governance, decentralization of tasks and resources, legitimacy, collaborationpaths between public and private organizations [19–21].
As for Harding et al. [22], these problems ‘involve complex interconnected systemslinked by social processes, with little certainty as to where they begin and end, leadingto difficulty in knowing where and how constructive interventions should be made andwhere problem boundaries lie’.
Disasters that occur at city level determine also transboundary effects that requestcollaborative approaches [23] to mitigate disaster risks, to create capacity and resilientculture [24–28] to coordinate emergency responses and provide recovery actions [29, 30].
Among public institutions, cities are those organizations that appear increasinglyvulnerable: catastrophic events have seriously harmed them, their communities and thenetwork of connections that has constituted the vital fabric on whom they are foundedand developed.
As stated by Khan & Zaman [31], planning for future cities demands greaterattention in coping with disaster risks and in facing the changing socio-economic andsafety landscape of the urban reality.
A plethora of labels, brands and definitions of city are competing for attention in theacademic debate of last decades [32].
Most of them are conceived within the ICT domain [33–36]. Digital technologies,especially with data analytics, have transformed the services and the relationshipbetween governments and their stakeholder [37].
As noted by Kitchin [38], the development of ‘smart cities’ around the globe hasbeen driven by ‘technically inspired innovation, creativity and entrepreneur-ship. However, a technocratic focus will not necessary create more liveable and safecities.
Some authors have properly underlined the risk connected to a short-sightedapproach in considering smart cities as a merely ICT phenomenon [39–41].
None of the label here referred fully meet the idea of a city that might cope withurbanization threats, disaster risk reduction and sustainability targets.
Moreover, there are a multitude of cases where cities – supposed to be smart – havefailed to plan for future threats, showing significant lack of planning and preparednesswhich have determined extraordinary damages and losses as results of catastrophicevents [42].
Making a Step Forward Towards Urban Resilience 115
3 Method and Discussion of Preliminary Results
Through a desk research, we focus on some best practices of public institutions thathave applied smart technologies for the enhancement of service quality to citizens aswell as to increase the level of safety and security of the communities.
Data are gathered from international reports and studies that clearly demonstrateshow smart technologies for emergency significantly contributes to timely response andhas reduced the number of people affected or deaths during disaster situations
In this sense, valuable examples come from Africa Region where the use of earlywarning systems (EWS) in flood-prone villages of Zambia allows to send alert mes-sages to local residents, urging them to evacuate to higher ground in the event offlooding. EWS system’ has helped in saving lives during annual seasonal floods andhas provided governments and humanitarian agencies with information on where reliefefforts are needed, thus demonstrating how ICT tools play a key role in pursuingresilience and sustainability targets.
The positive impact of ICT networks on safety and security of communities hasbeen stressed in the literature and its effectiveness repeatedly proofed, among others, indisaster situations occurred in Mexico, Japan and among ASEAN countries wherethreats posed by natural disasters and extreme weather events are constantly presents.
Monitoring and communication systems, hazard mapping platforms, live crisis mapare key tools of the whole disaster risk management process [43, 44].
More recently, direct participation of citizens in disaster situations via social media,videos, photos, text messages and chats (Twitter, Facebook, Instagram, Snapchat,YouTube, WhatsApp etc.), is of pivotal importance for activating emergency responsesand recovery actions. These innovations have, to some extent, redesigned the processand structure of service provision. Each citizen/user is like a sensor that provides datafor filling the gaps in the availability of real-time information about disasters [45, 46].
One of the main routes of innovation in enhancing cities resilience towards disasterrisk reduction refers to the use of Open data innovation, Mergel [47] and Big Data asboth strategic and operational tools that may bring fundamental changes to disaster riskmanagement chain’ [48, 49]. As noted by Papadopoulos et al., [50] current trends are toinvestigate theory using structured data to develop mathematical models [51, 52], or touse social media to study how people respond to disasters and how appropriate mea-sures are taken to enable recovery [53–56]. There are several examples of theemployment of open data infrastructure for coping with resilience and sustainabilitytargets at local level. Maps originally produced to provide developers and planners withinfrastructure and housing related information, have been updated with data on floodrisk areas and critical infrastructure that are of key importance for disaster risk man-agement and emergency plans (i.e. the Greater Manchester Open Data InfrastructureMap (https://mapinggm.org.uk/gmodin/), the Coastal Resilience projects developed inthe US and the Carribean; the Cape Town Disaster Risk Management Centre etc.).
On the other hand, BigDataAnalytics (BDA) enables smart cities to acquire incredibleinsights from immense volume of data generated via heterogeneous sources such asInternet-of-Things (IoT) integrated sensors, Radio-Frequency Identification (RFID) tags,Global Positioning Systems (GPS), smartphones, Bluetooth devices, etc. [57, 58].
116 C. Vermiglio et al.
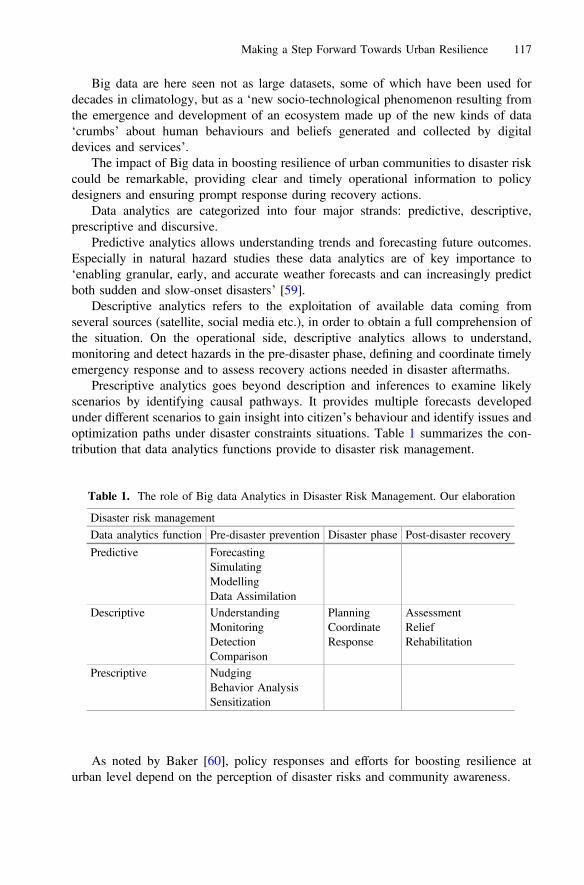
Big data are here seen not as large datasets, some of which have been used fordecades in climatology, but as a ‘new socio-technological phenomenon resulting fromthe emergence and development of an ecosystem made up of the new kinds of data‘crumbs’ about human behaviours and beliefs generated and collected by digitaldevices and services’.
The impact of Big data in boosting resilience of urban communities to disaster riskcould be remarkable, providing clear and timely operational information to policydesigners and ensuring prompt response during recovery actions.
Data analytics are categorized into four major strands: predictive, descriptive,prescriptive and discursive.
Predictive analytics allows understanding trends and forecasting future outcomes.Especially in natural hazard studies these data analytics are of key importance to‘enabling granular, early, and accurate weather forecasts and can increasingly predictboth sudden and slow-onset disasters’ [59].
Descriptive analytics refers to the exploitation of available data coming fromseveral sources (satellite, social media etc.), in order to obtain a full comprehension ofthe situation. On the operational side, descriptive analytics allows to understand,monitoring and detect hazards in the pre-disaster phase, defining and coordinate timelyemergency response and to assess recovery actions needed in disaster aftermaths.
Prescriptive analytics goes beyond description and inferences to examine likelyscenarios by identifying causal pathways. It provides multiple forecasts developedunder different scenarios to gain insight into citizen’s behaviour and identify issues andoptimization paths under disaster constraints situations. Table 1 summarizes the con-tribution that data analytics functions provide to disaster risk management.
As noted by Baker [60], policy responses and efforts for boosting resilience aturban level depend on the perception of disaster risks and community awareness.
Table 1. The role of Big data Analytics in Disaster Risk Management. Our elaboration
Disaster risk managementData analytics function Pre-disaster prevention Disaster phase Post-disaster recovery
Predictive ForecastingSimulatingModellingData Assimilation
Descriptive UnderstandingMonitoringDetectionComparison
PlanningCoordinateResponse
AssessmentReliefRehabilitation
Prescriptive NudgingBehavior AnalysisSensitization
Making a Step Forward Towards Urban Resilience 117

The availability of real-time data and information which can be verified from avariety of sources supports real-time decision-making process, enhances communityawareness and perception of incoming threats and guarantees a timelier response indisaster situations, creating the premise for ‘transforming urban governance into Smartcity governance’ [61, 62].
The above reflections offer interesting hints for some preliminary conclusions andfor the analysis of limitations and future perspectives of the research.
4 Conclusion and limitations
Cities can be depicted as complex, dynamic and manifold organisms, which evolve,flourish and regenerate as part of a broader ecosystem. Cities worldwide are exposed toa wide range of risks; many of them are attributable to natural hazards. In facing theseunprecedented threats, urban governance has to develop a deep understanding of thesystems that are critical to the life of the city [63], focusing on mutual interdepen-dencies that exist among various components of each subsystem (natural, socio-technical, economic etc.). At this stage of the analysis it can be stated that successfulinnovations, such as the use of digital sensors that improve controls and safety net-works in smart cities, early warning systems for disaster alert, highlight the credibilityand feasibility of the pursuit of certain notions of “smart” cities. Smart cities have toseek to process and manage the real-time data flowing from new digital infrastructure[64], not only for the provision of high-quality services to the community, but also asvaluable tools to make working the concept of resilience into the vital fabric of thecommunities.
Enhancing city ‘smartness’ as a path for boosting the ‘resilience’ of their com-munities in the face of ‘wicked problems’ seems to be the right answer that urbangovernments have to adopt for coping with current threats posed by natural hazards,climate change and urbanization trends.
Smart city governance asks for transformative, adaptive, sustainable, collaborative,responsive and long-term oriented policy approaches where all the actors involvedinteract through the facilitating medium of innovative ICTs, to help to meet thechallenges of urban problems.
The ‘smartness’ and ‘resilience’ are irreplaceable pillars of future cities. However, itis debatable whether cities which are now facing an endless sequence of hazardousevents, can effectively overcome them without a clear understanding of the need tomerge the two concepts in a broader policy framework and to apply these principlesinto consistent operational disaster risk reduction plan.
In the current scenario, cities have to exploit the transformative power of ICTs thatmight stimulate learning processes and strengthen urban resilience to disaster risks.
Big Data Analytics are of pivotal importance in boosting resilience and providingin depth and earlier understanding of natural and man-made hazards, and for knowl-edge enhancements about citizens’ actions, behaviors and attitudes in both safe andhazardous situations.
Despite the above-mentioned ‘pros’ for the exploitation of digital innovation toenhance resilience to disaster risks, some limitations have to be highlighted:
118 C. Vermiglio et al.
• The concept of resilience has a great appeal in the academic debate and in socialmedia. It gives us useful insights about the broader categories of activities thatshould be improved (learning, adaptability, awareness, collaboration,), but ‘withoutproviding any clear operative indications to policy designers’ [65];
• Academics have to suggest clear and consistent directions on how to make this shifttowards smart and resilient cities, highlighting how resilience can be reallyimpactful for future cities well-being.
• While it is important that smart technologies foster innovation and resiliencethrough the community, on the other side it is strictly needed that citizens perceivethe disruptive value of this concept in an era of vulnerability, overcoming somemental biases (myopia, optimism, inertia, and amnesia, as in the s.c. ‘Ostrichparadox’ proposed by Kunreuther and Meyer [66], that people show when con-sidering disaster risks.
• The desired ‘cultural shift’ towards urban resilience cannot be evermore “eventdriven”; it rather must originate from nudge initiatives and awareness from allstakeholder involved, perceiving the scope of the threats that urbanization, envi-ronmental and natural hazards pose on our heads and on those of future generations.
• The massive use of rough and unstructured data coming from a wide number ofsources (social media, twitter, YouTube, snapchat, etc.) in addition to those alreadygathered from ‘official tools’ (satellite, risk platforms etc.) can lead to noises andmisinformation [67];
• Strong privacy concern, security issues, and data protection, along with open data,big data, and network/ubiquitous, remind us of the importance of finding the rightequilibrium/balance among these;
• Training and education in engaging with smart technologies and their limitationsand potential will help bridge the gap between availability and effective adoption forurban smart governance purposes.
As the topic has great potential for further discussion, the research will benefit froma broader review of the literature, mainly focused on policy and managerial implica-tions of digital innovation facing disasters at local level and from a well-structuredcomparative case study analysis.
Acknowledgement. This research is part of the TREnD project (Transition with Resilience forEvolutionary Development), which has received funding from the European Union’s Horizon2020 research and innovation program under the Marie Skłodowska-Curie grant agreementNo. 823952.
References
1. Rhodes, M.L., Murphy, J., Muir, J., Murray, J.: Public Management and ComplexityTheory. Richer decision-making in public services, Routledge Critical Studies in PublicManagement, London (2011)
2. Noto, G., Bianchi, C.: Dealing with multi-level governance and wicked problems in urbantransportation systems: the case of palermo municipality. Systems 3(3), 62–80 (2015)
Making a Step Forward Towards Urban Resilience 119
3. Boulton, J.G., Allen, P.M., Bowman, C.: Embracing Complexity: Strategic Perspectives foran Age of Turbulence. Oxford University Press, Oxford (2015)
4. Eppel, E.A., Rhodes, M.L.: Complexity theory and public management: a ‘becoming’ field.Public Manag. Rev. 20, 949–959 (2018)
5. Rhodes, R.A.W.: Understanding Governance: Policy Networks, Governance, Reflexiv-ity and Accountability. Open University Press (1997)
6. Wagenaar, H.: Governance, complexity and democratic participation: how citizens andpublic officials harness the complexities of neighborhood decline. Am. Rev. Public Adm.37(1), 17–50 (2007)
7. Rittel, J., Webber, M.: Dilemmas in a general theory of planning’. Policy Sci. 4(2), 155–169(1973)
8. Alford, J., Head, B.: Wicked and less wicked problems: a typology and a contingencyframework. Policy Soc. 3, 397–413 (2017)
9. Bianchi, C., Bovaird, T., Loeffler, E.: Applying a dynamic performance managementframework to wicked issues: how coproduction helps to transform young people’s servicesin surrey county council, UK. Int. J. Public Adm. 40(10), 833–846 (2017)
10. Head, B.: Wicked problems in public policy. Public Policy 3(2), 101–118 (2008)11. Head, B., Alford, J.: Wicked problems: implications for public policy and management.
Adm. Soc. 47(6), 711–739 (2013)12. Van Bueren, E., Klijn, E.H., Koppenjan, J.: Dealing with wicked problems in networks:
analysing an environmental debate from a network perspective. J. Public Adm. Res. Theor.13, 193–212 (2003)
13. Stallings, R.A.: Methodological Issues. Handbook of Disaster Research. Handbooks ofSociology and Social Research. Springer, New York (2007)
14. Brown, C., Milke, M., Seville, E., Giovinazzi, S.: Disaster Waste Management on the Roadto Recovery: L’Aquila Earthquake case study. Ohrid, Macedonia. In: 14th EuropeanConference on Earthquake Engineering (14ECEE) (2010)
15. McEntire, D.A.: Triggering agents, vulnerabilities and disaster reduction: towards a holisticparadigm Disaster Prev. Manag. Int. J. 10(3), 189–196 (2001)
16. McEntire, D.A., Fuller, C., Johnston, C.W., Weber, R.: A comparison of disaster paradigms:the search for a holistic policy guide. Public Adm. Rev. 62(3), 267–281 (2002)
17. Kapucu, N., Arslan, T., Collins, M.: Examining intergovernmental and inter-organizationalresponse to catastrophic disasters: toward a network-centric approach. Adm. Soc. 42, 222–247 (2010)
18. Berg, M., De Maio, V.: Understanding the global strategy for disaster risk reduction. Risk,Hazards Crisis Public Policy 8(2), 147–167 (2017)
19. Howes, D., Gorman-Murray, A., McKinnon, S.: Queering disasters: on the need to accountfor LGBTI experiences in natural disaster contexts. Gender Place Cul. J. Feminist Geogr.21(7), 905–918 (2014)
20. United Nation System for Disaster Risk Reduction: Making cities resilient (2016). https://www.unisdr.org/we/campaign/cities
21. Harding, R., Hendriks, C., Faruqi, M.: Environmental Decision-Making: ExploringComplexity and Context. Federation Press, Frenchs Forest (2009)
22. Boin, A.: The New World of Crises and Crisis Management: Implications for Policymakingand Research, Review of Policy Research, 26 (4). Cambridge University Press, Patterns andProspects (2009)
23. Manyena, S.B.: The concept of resilience revisited. Disasters 30(4), 433–450 (2006)24. Alexander, D.E.: Resilience and disaster risk reduction: an etymological journey. Natural
Hazards Earth Syst. Sci. 13(11), 2707–2716 (2013)
120 C. Vermiglio et al.
25. Capano, G., Woo, J.J.: Resilience and robustness in policy design: a critical appraisal. PolicySci. 50, 399–426 (2017)
26. Duijnhoven, H., Neef, M.: Disentangling wicked problems: a reflexive approach towardsresilience. In: Masys, A. (ed.) Applications of Systems Thinking and Soft OperationsResearch in Managing Complexity. Advanced Sciences and Technologies for SecurityApplications. Springer (2016)
27. Holling, C.S.: Resilience and stability of ecological systems. Annu. Rev. Ecol. Syst. 4, 1–23(1973)
28. Ansell, C., Gash, A.: Collaborative governance in theory and practice. J. Public Adm. Res.Theor. 18, 543–571 (2008)
29. Quarantelli, E.: The disaster recovery process: what we know and do not know fromresearch, International Forum on Civil Protection. University of Delaware, Paper(286) (1999)
30. Boin, A., Ekengren, M., Rhinard, M.: The European Union as Crisis Manager. Patterns andProspects. Cambridge University Press, Cambridge (2013)
31. Khan, S., Zaman, A.U.: Future cities: conceptualizing the future based on a criticalexamination of existing notions of cities. Cities 72, 217–225 (2018)
32. Castelnovo, V., Misuraca, G., Savoldelli, A.: Smart cities governance: the need for a holisticapproach to assessing urban participatory policy making. Soc. Sci. Comput. Rev. 34(6),724–739 (2016)
33. Hall, R.E.: The vision of a smart city. In: Proceedings of the 2nd International Life ExtensionTechnology Workshop, Paris, France, 28 September (2000)
34. Caragliu, A., Del Bo, C., Nijkamp, P.: Smart cities in Europe. J. Urban Technol. 18(2), 65–82 (2011)
35. Kanter, R.M., Litow, S.: Informed and interconnected: A manifesto for smarter cities.Harvard Business School General Mgt. Unit Working Paper, 09–141 (2009)
36. Roseland, M.: Dimensions of the eco-city. Cities 14(4), 197–202 (1997)37. Kudo, H.: Digital governance as alternative public service delivery: From e-government to
government digital services. In: Nemec, J., Potier, V., de Vries M, (eds.) Alternative servicedelivery, IASIA/IIAS Conference (2018)
38. Kitchin, R.: The real-time city? Big data and smart urbanism. GeoJournal 79(1), 1–14 (2014)39. Gil-Garcia, R.: Enacting Electronic Government Success: An Integrative Study of
Government-wide Websites, Organizational Capabilities, and Institutions. Springer,New York (2012)
40. Nam, T., Pardo, T.A.: Conceptualizing smart city with dimensions of technology, people,and institutions. In: Proceedings of the 12th Annual International Digital GovernmentResearch Conference: Digital Government Innovation in Challenging Times, pp. 282–291(2011)
41. Anthopoulos, L.G.: Understanding the smart city domain: a literature review. In: Trans-forming City Governments for Successful Smart Cities, pp. 9–21. Springer, Cham (2015)
42. Desouza, K.C., Flanery, T.H.: Designing, planning, and managing resilient cities: aconceptual framework. Citie 35, 89–99 (2013)
43. Yates, D., Paquette, S.: Emergency Knowledge Management and Social Media Technolo-gies. A case study of the Haitian Eartquake (2010)
44. Turoff, M., Hiltz, S.R., Bañuls, V., Van Den Eede, G.: Multiple perspectives on planning foremergencies: an introduction to the special issue on planning and foresight for emergencypreparedness and management. In: Technological Forecasting & Social Change, 80,pp. 1647–1656. Elsevier (2013)
45. Goodchild, M.F., Glennon, J.A.: Crowdsourcing geographic information for disasterresponse: a research frontier. Int. J. Digital Earth 3, 231–241 (2010)
Making a Step Forward Towards Urban Resilience 121

46. Cervone, G., Sava, E., Huang, Q., Schnebele, E., Harrison, J., Waters, N.: Using Twitter fortasking remote-sensing data collection and damage assessment: 2013 Boulder flood casestudy. Int. J. Remote Sens. 37, 100–124 (2016)
47. Mergel, I.: Open innovation in the public sector: drivers and barriers for the adoption ofChallenge.gov. Public Manag. Rev. 20(5), 726–745 (2018)
48. Brown, V., Harris, J., Russell, J. (eds.): Tackling Wicked Problems Through Transdisci-plinary Imagination. Earthscan, London (2010)
49. Kooiman, J. (ed.): Modern governance: New Government-Society Interactions. Sage,London (1993)
50. Papadopoulos, T., Gunasekaran, A., Dubey, R., Altay, N., Childe, S.J., Fosso-Wamba, S.:The role of Big Data in explaining disaster resilience in supply chains for sustainability.J. Clean. Prod. 142, 1108–1118 (2016)
51. Hashim, I.A.T., Chang, V., Anuar, N.B., Adewole, K., Yaqoob, I., Gani, A., Ahmed, E.,Chiroma, H.: The role of big data in smart city. Int. J. Inf. Manage. 36(5), 748–758 (2018)
52. Ragini, J., Rubesh Anand, P.M., Vidhyacharan, B.: Big data analytics for disaster responseand recovery through sentiment analysis. Int. J. Inf. Manage. 42, 13–24 (2018)
53. Chae, J., Thom, D., Jang, Y., Kim, S., Ertl, T., Ebert, D.S.: Public behavior response analysisin disaster events utilizing visual analytics of microblog data. Comput. Graph. 38, 51–60(2014)
54. Data-Pop Alliance: “Big Data for Resilience: Realising the Benefits for DevelopingCountries”. Synthesis Report (2015)
55. Brohi, S., Bamiah, M., Brohi, M.: Big data in Smart Cities: a systematic mapping review.J. Eng. Sci. Technol. 13(7), 224–2270 (2018)
56. Morabito, V.: Big Data and Analytics for Government Innovation Big Data and Analytics,pp. 23–45. Springer, Switzerland (2015)
57. Emmanouil, D., Nikolaos, D.: Big data analytics in prevention, preparedness, response andrecovery in crisis and disaster management. In: Recent Advances in Computer Sciences(2015)
58. Baker, S.M.: Vulnerability and resilience in natural disasters: a marketing and public policyperspective. J. Public Policy Mark. 28(1), 114–123 (2009)
59. Meijer, A., Bolívar, M.P.R.: Governing the smart city: a review of the literature on smarturban governance. Int. Rev. Admin. Sci. 82(2), 392–408 (2016)
60. Wu, Y., Zhang, W., Shen, J., Mo, Z., Peng, Y.: Smart city with Chinese characteristicsagainst the background of big data: Idea, action and risk. J. Clean. Prod. 173, 60–66 (2018)
61. Harrison, C., Williams, P.: A systems approach to natural disaster resilience. Simul. Model.Pract. Theory 65, 11–31 (2016)
62. Webster, C.W.R., Leleux, C.: Smart Governance: opportunities for technologically mediatedcitizen co-production. Inf. Polity 23(1), 95–110 (2018)
63. Han, H., Hawken, S.: Introduction: innovation and identity in next-generation smart cities.City, Cult. Soc. 12, 1–4 (2018)
64. Gil, O., Cortés-Cediel, M.E., Cantador, I.: Citizen participation and the rise of digital mediaplatforms in smart governance and smart cities. Int. J. E-Planning Res. 8(1), 19–34 (2019)
65. Chmutina, K.: Unpacking resilience policy discourse. Cities 58, 70–79 (2016)66. Kunreuther, H., Meyer, R.: The Ostrich Paradox. Wharton Digital Press, Washington DC
(2017)67. Yu, M., Yang, C., Li, Y.: Big Data in natural disaster management: a review. Geosci. 8, 165
(2018)
122 C. Vermiglio et al.

Open Access This chapter is licensed under the terms of the Creative Commons Attribution 4.0International License (http://creativecommons.org/licenses/by/4.0/), which permits use, sharing,adaptation, distribution and reproduction in any medium or format, as long as you give appro-priate credit to the original author(s) and the source, provide a link to the Creative Commonslicense and indicate if changes were made.The images or other third party material in this chapter are included in the chapter’s Creative
Commons license, unless indicated otherwise in a credit line to the material. If material is notincluded in the chapter’s Creative Commons license and your intended use is not permitted bystatutory regulation or exceeds the permitted use, you will need to obtain permission directlyfrom the copyright holder.
Making a Step Forward Towards Urban Resilience 123
Evaluating the Priorities of the Calabria’sCoast FLAGs for the Improvementof the Quality of Life of the Fisheries
Communities
Alba Distaso, Giuseppa Romeo, and Claudio Marcianò(&)
Mediterranea University of Reggio Calabria, Reggio Calabria, [email protected]
Abstract. In this study we attempt to evaluate, using a multi-criteria decisionmaking methodology, the priorities of the directors of the six Fishery LocalAction Groups (FLAGs) in Calabria Region coastal areas on some dimensionsof quality of life. More specifically, the focus is on the role of the FLAGs as apolicy instrument, in the context of the Community Led Local Development(CLLD), aimed at improving the quality of life of the small fisheries commu-nities. The results have highlighted the strengths and meaningful weaknesses ofthe level of the perception of the quality of life of the areas where the FLAGsoperated in the previous EU programming period.
Keywords: Fishery Local Action Group � Analytic Hierarchy Process �Community-led local development � Quality of life
1 Introducing
Starting from the 80ies, the European Union through the Fishery Common Policy(FCP) has adopted some specific measures aimed at favoring not only the imple-mentation of the sustainability criterion by boosting the reduction of the fishing boatsbut also at helping the economy of the seafaring communities (Simon 2008). Thisbecause one wants to reach “an efficient equilibrium among the firmness of the ichthyicresources, number of the fishery staff, the profitability of the sector and the interest ofthe consumers” (Simon 2008, p. 55). To such an aim the 1198/06 Reg (E.U.) hasintroduced new institutional organizational mechanisms able to promote the localdevelopment making use of a bottom-up participative approach. The Fishery LocalAction Groups (FLAGs) born on the course of the Local Action Groups (LAG),represent the instrument of territorial governance of the ichthyic development involvinga plurality of local actors coming from the public, private and no profit spheres. Theyare appointed to manage the network of the involved parts and play a central role forthe sustainable development of the fisheries areas under economic, environmental andsocial perspectives. Through the local Development Plans (LDP) they adopt policies ofdevelopment which have to take into account the effective needs and characteristics ofthe territory (Marcianò and Romeo 2016).
© The Author(s) 2020C. Bevilacqua et al. (Eds.): NMP 2020, SIST 177, pp. 124–142, 2020.https://doi.org/10.1007/978-3-030-52869-0_11
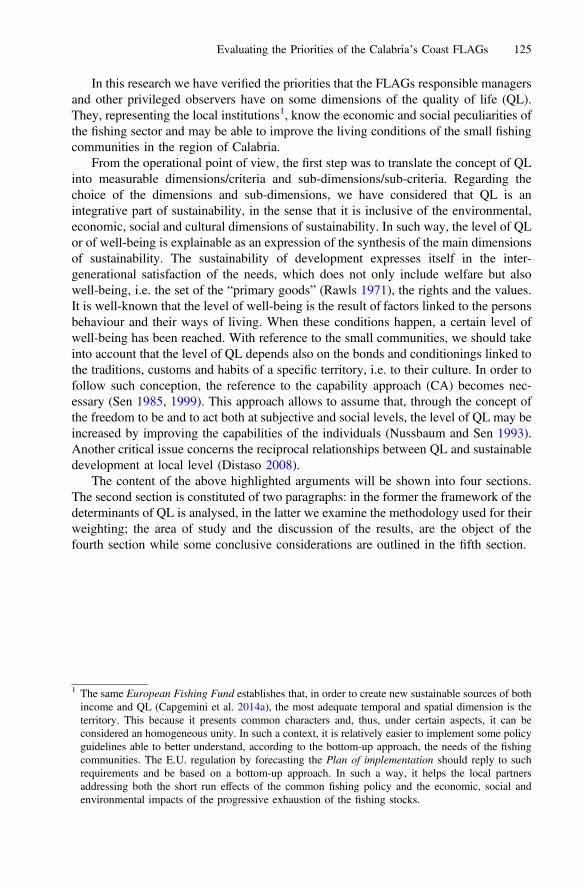
In this research we have verified the priorities that the FLAGs responsible managersand other privileged observers have on some dimensions of the quality of life (QL).They, representing the local institutions1, know the economic and social peculiarities ofthe fishing sector and may be able to improve the living conditions of the small fishingcommunities in the region of Calabria.
From the operational point of view, the first step was to translate the concept of QLinto measurable dimensions/criteria and sub-dimensions/sub-criteria. Regarding thechoice of the dimensions and sub-dimensions, we have considered that QL is anintegrative part of sustainability, in the sense that it is inclusive of the environmental,economic, social and cultural dimensions of sustainability. In such way, the level of QLor of well-being is explainable as an expression of the synthesis of the main dimensionsof sustainability. The sustainability of development expresses itself in the inter-generational satisfaction of the needs, which does not only include welfare but alsowell-being, i.e. the set of the “primary goods” (Rawls 1971), the rights and the values.It is well-known that the level of well-being is the result of factors linked to the personsbehaviour and their ways of living. When these conditions happen, a certain level ofwell-being has been reached. With reference to the small communities, we should takeinto account that the level of QL depends also on the bonds and conditionings linked tothe traditions, customs and habits of a specific territory, i.e. to their culture. In order tofollow such conception, the reference to the capability approach (CA) becomes nec-essary (Sen 1985, 1999). This approach allows to assume that, through the concept ofthe freedom to be and to act both at subjective and social levels, the level of QL may beincreased by improving the capabilities of the individuals (Nussbaum and Sen 1993).Another critical issue concerns the reciprocal relationships between QL and sustainabledevelopment at local level (Distaso 2008).
The content of the above highlighted arguments will be shown into four sections.The second section is constituted of two paragraphs: in the former the framework of thedeterminants of QL is analysed, in the latter we examine the methodology used for theirweighting; the area of study and the discussion of the results, are the object of thefourth section while some conclusive considerations are outlined in the fifth section.
1 The same European Fishing Fund establishes that, in order to create new sustainable sources of bothincome and QL (Capgemini et al. 2014a), the most adequate temporal and spatial dimension is theterritory. This because it presents common characters and, thus, under certain aspects, it can beconsidered an homogeneous unity. In such a context, it is relatively easier to implement some policyguidelines able to better understand, according to the bottom-up approach, the needs of the fishingcommunities. The E.U. regulation by forecasting the Plan of implementation should reply to suchrequirements and be based on a bottom-up approach. In such a way, it helps the local partnersaddressing both the short run effects of the common fishing policy and the economic, social andenvironmental impacts of the progressive exhaustion of the fishing stocks.
Evaluating the Priorities of the Calabria’s Coast FLAGs 125
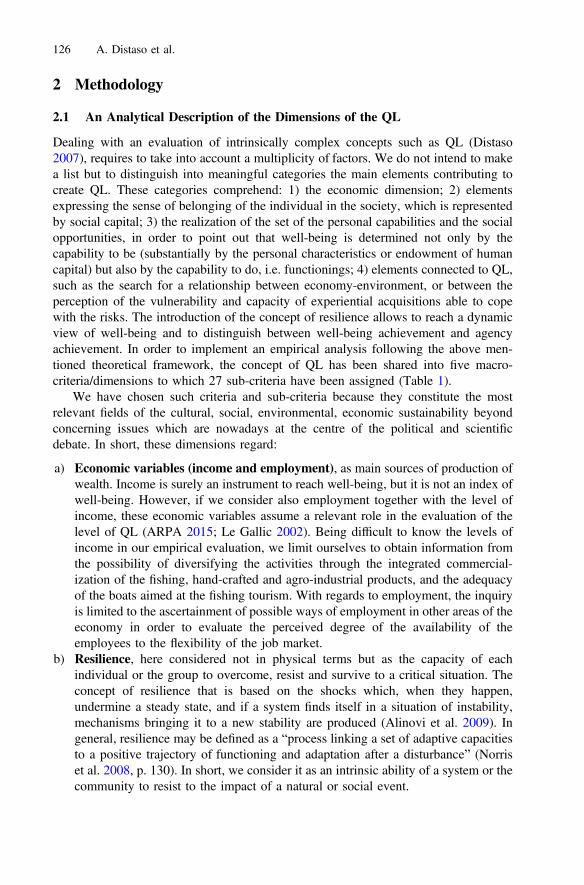
2 Methodology
2.1 An Analytical Description of the Dimensions of the QL
Dealing with an evaluation of intrinsically complex concepts such as QL (Distaso2007), requires to take into account a multiplicity of factors. We do not intend to makea list but to distinguish into meaningful categories the main elements contributing tocreate QL. These categories comprehend: 1) the economic dimension; 2) elementsexpressing the sense of belonging of the individual in the society, which is representedby social capital; 3) the realization of the set of the personal capabilities and the socialopportunities, in order to point out that well-being is determined not only by thecapability to be (substantially by the personal characteristics or endowment of humancapital) but also by the capability to do, i.e. functionings; 4) elements connected to QL,such as the search for a relationship between economy-environment, or between theperception of the vulnerability and capacity of experiential acquisitions able to copewith the risks. The introduction of the concept of resilience allows to reach a dynamicview of well-being and to distinguish between well-being achievement and agencyachievement. In order to implement an empirical analysis following the above men-tioned theoretical framework, the concept of QL has been shared into five macro-criteria/dimensions to which 27 sub-criteria have been assigned (Table 1).
We have chosen such criteria and sub-criteria because they constitute the mostrelevant fields of the cultural, social, environmental, economic sustainability beyondconcerning issues which are nowadays at the centre of the political and scientificdebate. In short, these dimensions regard:
a) Economic variables (income and employment), as main sources of production ofwealth. Income is surely an instrument to reach well-being, but it is not an index ofwell-being. However, if we consider also employment together with the level ofincome, these economic variables assume a relevant role in the evaluation of thelevel of QL (ARPA 2015; Le Gallic 2002). Being difficult to know the levels ofincome in our empirical evaluation, we limit ourselves to obtain information fromthe possibility of diversifying the activities through the integrated commercial-ization of the fishing, hand-crafted and agro-industrial products, and the adequacyof the boats aimed at the fishing tourism. With regards to employment, the inquiryis limited to the ascertainment of possible ways of employment in other areas of theeconomy in order to evaluate the perceived degree of the availability of theemployees to the flexibility of the job market.
b) Resilience, here considered not in physical terms but as the capacity of eachindividual or the group to overcome, resist and survive to a critical situation. Theconcept of resilience that is based on the shocks which, when they happen,undermine a steady state, and if a system finds itself in a situation of instability,mechanisms bringing it to a new stability are produced (Alinovi et al. 2009). Ingeneral, resilience may be defined as a “process linking a set of adaptive capacitiesto a positive trajectory of functioning and adaptation after a disturbance” (Norriset al. 2008, p. 130). In short, we consider it as an intrinsic ability of a system or thecommunity to resist to the impact of a natural or social event.
126 A. Distaso et al.
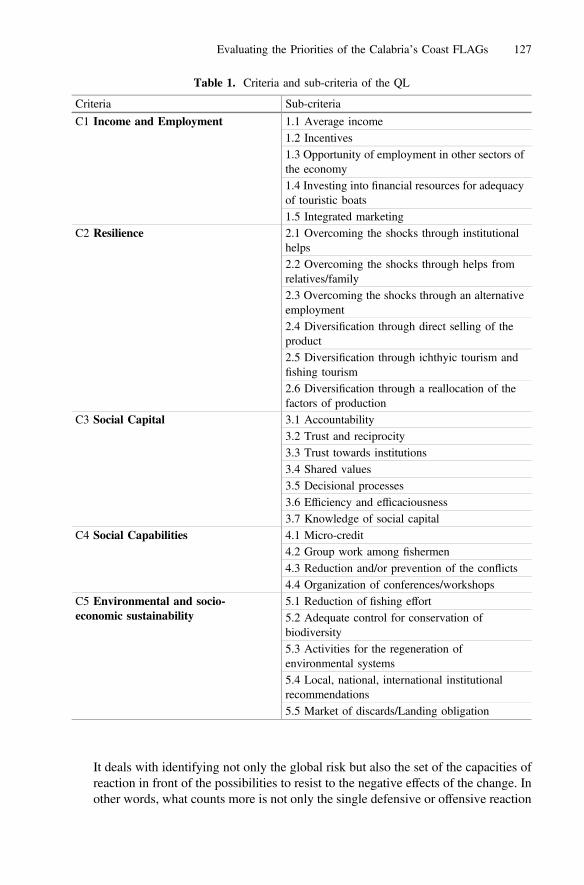
It deals with identifying not only the global risk but also the set of the capacities ofreaction in front of the possibilities to resist to the negative effects of the change. Inother words, what counts more is not only the single defensive or offensive reaction
Table 1. Criteria and sub-criteria of the QL
Criteria Sub-criteria
C1 Income and Employment 1.1 Average income1.2 Incentives1.3 Opportunity of employment in other sectors ofthe economy1.4 Investing into financial resources for adequacyof touristic boats1.5 Integrated marketing
C2 Resilience 2.1 Overcoming the shocks through institutionalhelps2.2 Overcoming the shocks through helps fromrelatives/family2.3 Overcoming the shocks through an alternativeemployment2.4 Diversification through direct selling of theproduct2.5 Diversification through ichthyic tourism andfishing tourism2.6 Diversification through a reallocation of thefactors of production
C3 Social Capital 3.1 Accountability3.2 Trust and reciprocity3.3 Trust towards institutions3.4 Shared values3.5 Decisional processes3.6 Efficiency and efficaciousness3.7 Knowledge of social capital
C4 Social Capabilities 4.1 Micro-credit4.2 Group work among fishermen4.3 Reduction and/or prevention of the conflicts4.4 Organization of conferences/workshops
C5 Environmental and socio-economic sustainability
5.1 Reduction of fishing effort5.2 Adequate control for conservation ofbiodiversity5.3 Activities for the regeneration ofenvironmental systems5.4 Local, national, international institutionalrecommendations5.5 Market of discards/Landing obligation
Evaluating the Priorities of the Calabria’s Coast FLAGs 127

in front of a risk, but the evaluation of how the individuals manage the risks overthe long run. Once evaluating a risk, it is necessary to consider the resilience eitheras a single act of reaction to a negative event or as a capacity to choose the mostadequate strategies to face it. In such a way, since this capacity is founded both onthe active and reactive behaviour of the agents, we may deduce that it is theconsequence of the capacity of choice of the persons in front of the perceived risks.Then, the derived conceptual framework is based on the relation risks-resilience-capability. An increase of the capabilities make individuals less vulnerable in caseof risks. This means that the concept of vulnerability refers back to the endowmentof the capacities of the persons or a social groups, and, thus, to the capabilities. Infact, on the one hand, a low level of resilience indicates that the agents demonstratea limited disposal to strategic choices and express a will to act in the short run. Onthe other hand, a higher level of resilience is an index of the possibility of mod-ifying the contingent situation pointing out perspectives of long run. We have tospecify that when evaluating the conditions of life, resilience is the contrary ofvulnerability since it reduces the probability that the level of well-being decreasesowing to a shock. Socio-economic resilience does not only mean a certain degreeof resistance to a shock but also a durable preservation of the level of well-being.
c) Social capital or relational capital as an expression of the existing link betweenthe quality of social relationships and individual and collective well-being. It isstraightforward that this link, briefly named social quality, contributes to a higherlevel of QL. Its level is as much as higher as networks of interpersonal relationshipsand shared values able both to produce social norms, moral obligations and tocreate associations facilitating the coordination among the members of a com-munity and the collective action, are developed. Several researches have provedthat a social environment rich in terms of interpersonal relationships and partici-patory opportunities creates those specific conditions favourable both for the dif-fusion of information and a higher level of trust and shared values among themembers of the community. Since economic development is strongly stimulated(or prevented) by the structure of social relationships, the economic activity is moredynamic in those situations where social interactions are intense and wherereciprocal trust and the observance of rules are customs. These processes find theirimplementation in social capital as a shape of capital aimed at evaluating thepossible individual and collective benefits coming from the social relations amongpersons. The benefits obtaining from the social relationships are of different nature.It deals with familiar relationships, belonging to associations, good neighbourhood,but also sharing norms or common values translating themselves in trust. Shortly, ifthe capacity of collaboration in a community increases in order to reach sharedrules, we cannot neglect social capital in the evaluation of the QL since it repre-sents the dimension which characterizes social sustainability. For this reason, socialcapital is also recognized as a relevant analytical category in the dynamics of localdevelopment (as for a deepening of this issue, see, Distaso and Distaso 2015).
d) Social capabilities, as a set of capacities through which it is possible to ascertain ifindividuals are able to act together and cooperate. This in order to face riskysituations. The concept of social capability aims at pointing out that belonging to asocial group completes individual freedom because this is not limited to the private
128 A. Distaso et al.
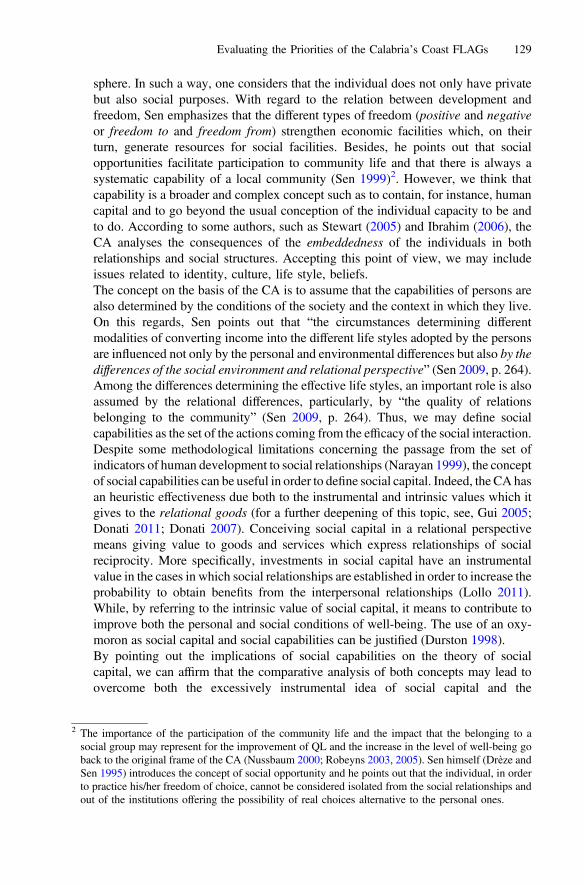
sphere. In such a way, one considers that the individual does not only have privatebut also social purposes. With regard to the relation between development andfreedom, Sen emphasizes that the different types of freedom (positive and negativeor freedom to and freedom from) strengthen economic facilities which, on theirturn, generate resources for social facilities. Besides, he points out that socialopportunities facilitate participation to community life and that there is always asystematic capability of a local community (Sen 1999)2. However, we think thatcapability is a broader and complex concept such as to contain, for instance, humancapital and to go beyond the usual conception of the individual capacity to be andto do. According to some authors, such as Stewart (2005) and Ibrahim (2006), theCA analyses the consequences of the embeddedness of the individuals in bothrelationships and social structures. Accepting this point of view, we may includeissues related to identity, culture, life style, beliefs.The concept on the basis of the CA is to assume that the capabilities of persons arealso determined by the conditions of the society and the context in which they live.On this regards, Sen points out that “the circumstances determining differentmodalities of converting income into the different life styles adopted by the personsare influenced not only by the personal and environmental differences but also by thedifferences of the social environment and relational perspective” (Sen 2009, p. 264).Among the differences determining the effective life styles, an important role is alsoassumed by the relational differences, particularly, by “the quality of relationsbelonging to the community” (Sen 2009, p. 264). Thus, we may define socialcapabilities as the set of the actions coming from the efficacy of the social interaction.Despite some methodological limitations concerning the passage from the set ofindicators of human development to social relationships (Narayan 1999), the conceptof social capabilities can be useful in order to define social capital. Indeed, the CA hasan heuristic effectiveness due both to the instrumental and intrinsic values which itgives to the relational goods (for a further deepening of this topic, see, Gui 2005;Donati 2011; Donati 2007). Conceiving social capital in a relational perspectivemeans giving value to goods and services which express relationships of socialreciprocity. More specifically, investments in social capital have an instrumentalvalue in the cases in which social relationships are established in order to increase theprobability to obtain benefits from the interpersonal relationships (Lollo 2011).While, by referring to the intrinsic value of social capital, it means to contribute toimprove both the personal and social conditions of well-being. The use of an oxy-moron as social capital and social capabilities can be justified (Durston 1998).By pointing out the implications of social capabilities on the theory of socialcapital, we can affirm that the comparative analysis of both concepts may lead toovercome both the excessively instrumental idea of social capital and the
2 The importance of the participation of the community life and the impact that the belonging to asocial group may represent for the improvement of QL and the increase in the level of well-being goback to the original frame of the CA (Nussbaum 2000; Robeyns 2003, 2005). Sen himself (Drèze andSen 1995) introduces the concept of social opportunity and he points out that the individual, in orderto practice his/her freedom of choice, cannot be considered isolated from the social relationships andout of the institutions offering the possibility of real choices alternative to the personal ones.
Evaluating the Priorities of the Calabria’s Coast FLAGs 129
individualistic view of the capabilities. In this framework, social relationships canbe now considered a structure constituted of social resources (Lin 2001), and socialcapital is considered as a set of rights allowing each person, beyond his/herinterpersonal relationships, to have access to common resources. If such rights areaccumulated and transformed in other resources, social capital is an endowmentwhich each individual can mobilize in case of need. Thus, social capital offers anintegrated structure “capable of thinking” in terms of access to the resources(Bebbington 1999). Furthermore, the expansion of the foundations of the economicanalysis that the approach of capabilities allows, brings new elements to the theoryof social capital, such as, for instance, the evaluation of the impact of the socialpolicy not only in terms of the economic advantages but also in terms of func-tionings3. And, if the informative ground of the CA can be extended to includeevaluations of value of social structures, social capital may provide a valid struc-ture for the identification of social capabilities.From what above, we have noticed that social capital and social capabilities, beingcomplementary, are synergic concepts in the sense that they are both a combinationof material and immaterial resources available for the individual, since their pos-session or not determines the effective ability to engage himself/herself in somevaluable activities. It should be pointed out that social capital may be considered asan economic reification of capabilities (Lollo 2011). At the empiric evaluation aim,social capabilities may be defined as those individual capabilities through whichagents have the possibility to put at their disposal human capital in terms ofeducation, culture, competences, savoir faire, directed at obtaining, through sometraining a higher level of collective well-being.
e) Environmental and socio-economic sustainability. We refer to that paradigm ofsustainable development according to which sustainable development can beexplained through the optimal growth expressing the search of an equilibriumbetween economic growth and environmental degradation” (Siebert 1998, p. 266). Inthis view, development can be evaluated as the process where the well-being of eachindividual and the improvement of his/her capabilities are the main aim of the severalchanges produced. Therefore, sustainable development becomes synonymous ofhuman development (Anand and Sen 2000). Furthermore, accepting the idea of asocially sustainable development, we can state that development is sustainable insocial terms if it considers social interactions and their economic, ecological and socialimplications at the level both of the persons and society (Lehtonen 2004). Thisbecause it deals with both improving individual capabilities and social capabilities.The concept of capability integrated with the concept of social sustainable develop-ment may lead to the issue of the inter-generational transmission of the capabilities.According to the CA perspective, socially sustainable development guarantees thepossibilities of improvement both for the present and future population. Social sus-tainability means that development should allow, on the one hand, an intergenera-tional progress of QL and a reinforcement of both individual and social capabilities of
3 Functionings can be defined as those possibilities of implementation which become effective throughthe capabilities of “doing” and the achievement of the “states of being and doing” (Sen 1985).
130 A. Distaso et al.
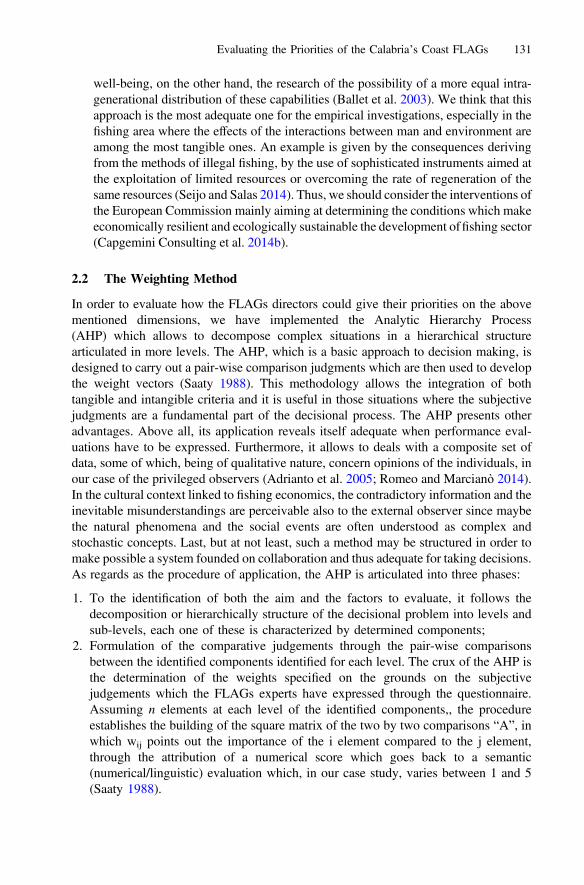
well-being, on the other hand, the research of the possibility of a more equal intra-generational distribution of these capabilities (Ballet et al. 2003). We think that thisapproach is the most adequate one for the empirical investigations, especially in thefishing area where the effects of the interactions between man and environment areamong the most tangible ones. An example is given by the consequences derivingfrom the methods of illegal fishing, by the use of sophisticated instruments aimed atthe exploitation of limited resources or overcoming the rate of regeneration of thesame resources (Seijo and Salas 2014). Thus, we should consider the interventions ofthe European Commission mainly aiming at determining the conditions which makeeconomically resilient and ecologically sustainable the development offishing sector(Capgemini Consulting et al. 2014b).
2.2 The Weighting Method
In order to evaluate how the FLAGs directors could give their priorities on the abovementioned dimensions, we have implemented the Analytic Hierarchy Process(AHP) which allows to decompose complex situations in a hierarchical structurearticulated in more levels. The AHP, which is a basic approach to decision making, isdesigned to carry out a pair-wise comparison judgments which are then used to developthe weight vectors (Saaty 1988). This methodology allows the integration of bothtangible and intangible criteria and it is useful in those situations where the subjectivejudgments are a fundamental part of the decisional process. The AHP presents otheradvantages. Above all, its application reveals itself adequate when performance eval-uations have to be expressed. Furthermore, it allows to deals with a composite set ofdata, some of which, being of qualitative nature, concern opinions of the individuals, inour case of the privileged observers (Adrianto et al. 2005; Romeo and Marcianò 2014).In the cultural context linked to fishing economics, the contradictory information and theinevitable misunderstandings are perceivable also to the external observer since maybethe natural phenomena and the social events are often understood as complex andstochastic concepts. Last, but at not least, such a method may be structured in order tomake possible a system founded on collaboration and thus adequate for taking decisions.As regards as the procedure of application, the AHP is articulated into three phases:
1. To the identification of both the aim and the factors to evaluate, it follows thedecomposition or hierarchically structure of the decisional problem into levels andsub-levels, each one of these is characterized by determined components;
2. Formulation of the comparative judgements through the pair-wise comparisonsbetween the identified components identified for each level. The crux of the AHP isthe determination of the weights specified on the grounds on the subjectivejudgements which the FLAGs experts have expressed through the questionnaire.Assuming n elements at each level of the identified components,, the procedureestablishes the building of the square matrix of the two by two comparisons “A”, inwhich wij points out the importance of the i element compared to the j element,through the attribution of a numerical score which goes back to a semantic(numerical/linguistic) evaluation which, in our case study, varies between 1 and 5(Saaty 1988).
Evaluating the Priorities of the Calabria’s Coast FLAGs 131
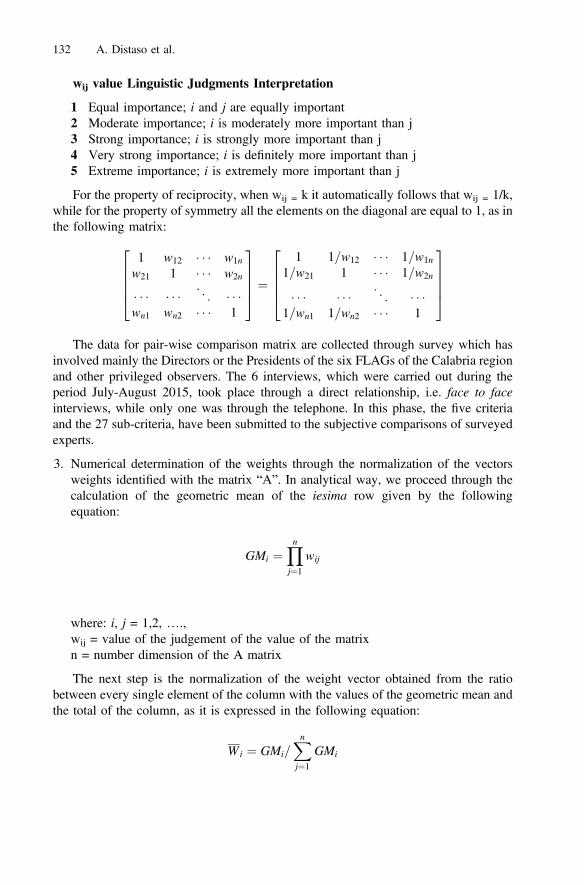
wij value Linguistic Judgments Interpretation
1 Equal importance; i and j are equally important2 Moderate importance; i is moderately more important than j3 Strong importance; i is strongly more important than j4 Very strong importance; i is definitely more important than j5 Extreme importance; i is extremely more important than j
For the property of reciprocity, when wij = k it automatically follows that wij = 1/k,while for the property of symmetry all the elements on the diagonal are equal to 1, as inthe following matrix:
1 w12 � � � w1n
w21 1 � � � w2n
� � � � � � . .. � � �
wn1 wn2 � � � 1
26664
37775 ¼
1 1=w12 � � � 1=w1n
1=w21 1 � � � 1=w2n
� � � � � � . .. � � �
1=wn1 1=wn2 � � � 1
26664
37775
The data for pair-wise comparison matrix are collected through survey which hasinvolved mainly the Directors or the Presidents of the six FLAGs of the Calabria regionand other privileged observers. The 6 interviews, which were carried out during theperiod July-August 2015, took place through a direct relationship, i.e. face to faceinterviews, while only one was through the telephone. In this phase, the five criteriaand the 27 sub-criteria, have been submitted to the subjective comparisons of surveyedexperts.
3. Numerical determination of the weights through the normalization of the vectorsweights identified with the matrix “A”. In analytical way, we proceed through thecalculation of the geometric mean of the iesima row given by the followingequation:
GMi ¼Ynj¼1
wij
where: i, j = 1,2, ….,wij = value of the judgement of the value of the matrixn = number dimension of the A matrix
The next step is the normalization of the weight vector obtained from the ratiobetween every single element of the column with the values of the geometric mean andthe total of the column, as it is expressed in the following equation:
Wi ¼ GMi=Xnj¼1
GMi
132 A. Distaso et al.

In order to verify the consistency of the obtained results, the auto-value associatedto the auto-vector of the maximum coefficient of the matrix of the two by two com-parisons “A” which is denominated kmax:
kmax ¼ Wi �Xnj¼1
wij
which allows to determine the index of consistency given by the following equa-tion, in which n represents the number of the considered criteria:
CI ¼ kmax � n=n� 1
By dividing the consistency index per the Random Index (RI), whose value isderived by a pre-constituted table and associated to the number of the n consideredcriteria, we obtain the consistency ratio (RC):
RC ¼ CI=RI
Higher is the value assumed by such an index, minor is the consistency of thesubjective judgements which the policy maker expresses. In general, the threshold oftolerance of the CR is of 10%, but values of the 20% may be tolerated (Saaty 1988).
3 Results
3.1 The Area of Study
The FLAGs are private-public partnership activated in the Fishery Common Policy,and are constituted of the partnership among representatives of local public institutions,associations of fishing producers, private persons or associates farms of aquaculture andtransformation, economic agents dealing with activities regarding the coastal area ofrelevance. The FLAGs, according to the inter-industrial view of local development, isan instrument born to create a team. This case study has specifically examined theFLAGs operating in Calabria Region (Fig. 1).
Concerning the territorial aspect, the break-downof theCalabrian FLAGs results to behomogeneous and respects the requirements of the Italian Operative planning. The sixFLAGs in Calabria Region, representing more the 70% of the Calabria’s seamanship,constitute an important share of the 43 FLAGs nowadays approved at national level. Infact, the FLAGs are strategic instruments of development and their action responds to theneeds and crucial priorities in order to overcome the fish chain in Calabria Region. In fact,the IV Fishing European Fund (FEF) forecasts the implementation of some measures forthe sustainable development of the fishing areas aimed at:
– strengthening the economic and social well-being of the coastal areas and increasethe level of both the fishing products and aquaculture;
– maintaining and increasing the level of employment promoting the diversificationconnected to the changes in place in the fish sector;
– promoting the quality of the coastal environment.
Evaluating the Priorities of the Calabria’s Coast FLAGs 133
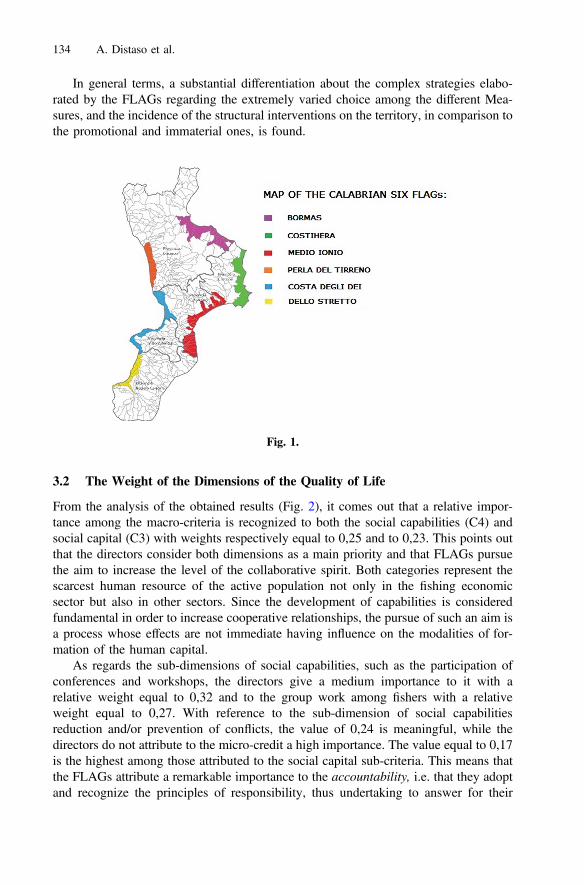
In general terms, a substantial differentiation about the complex strategies elabo-rated by the FLAGs regarding the extremely varied choice among the different Mea-sures, and the incidence of the structural interventions on the territory, in comparison tothe promotional and immaterial ones, is found.
3.2 The Weight of the Dimensions of the Quality of Life
From the analysis of the obtained results (Fig. 2), it comes out that a relative impor-tance among the macro-criteria is recognized to both the social capabilities (C4) andsocial capital (C3) with weights respectively equal to 0,25 and to 0,23. This points outthat the directors consider both dimensions as a main priority and that FLAGs pursuethe aim to increase the level of the collaborative spirit. Both categories represent thescarcest human resource of the active population not only in the fishing economicsector but also in other sectors. Since the development of capabilities is consideredfundamental in order to increase cooperative relationships, the pursue of such an aim isa process whose effects are not immediate having influence on the modalities of for-mation of the human capital.
As regards the sub-dimensions of social capabilities, such as the participation ofconferences and workshops, the directors give a medium importance to it with arelative weight equal to 0,32 and to the group work among fishers with a relativeweight equal to 0,27. With reference to the sub-dimension of social capabilitiesreduction and/or prevention of conflicts, the value of 0,24 is meaningful, while thedirectors do not attribute to the micro-credit a high importance. The value equal to 0,17is the highest among those attributed to the social capital sub-criteria. This means thatthe FLAGs attribute a remarkable importance to the accountability, i.e. that they adoptand recognize the principles of responsibility, thus undertaking to answer for their
Fig. 1.
134 A. Distaso et al.

actions and behaviours. It is well known that trust has a relevant importance in theevaluation of the dimension of social capital. The perception that the privilegedobservers have with reference to the shared values, i.e. keeping of the civic virtues,such as the capacity to follow the agreements, to be sincere in the social and/oreconomic relationships, the capacity to place confidence in the others and to respon-sibly act in the respect of the law- is averagely low in the fishing sector with a valueequal to 0,14. The perception of trust and reciprocity among the actors is as much aslow, with a value equal to 0,14. Thus, in general, the reciprocal trust among the agentsis considered to be rather low, even if they give a certain importance to the decisionalprocesses, with a value equal to 0,14. On this purpose, the same directors of theCosthiera and Perla del Tirreno FLAGs think that the situation could improve if theinstitution of the Calabria Region would allow a sufficient period of time for theimplementation of the Local development Plans (Marcianò and Romeo 2016). It fol-lows the scarce trust also towards the government institutions (the value results equal to0,12). Despite the knowledge about social capital is scarce (the average value is only0,14), although some of the interviewed privileged observers do not know the conceptof social capital, they declare to indirectly promote it through specific activities aimedto its increase in value. The values of the sub-criterion of social capital effectivenessand efficacy is averagely higher and is equal to 0,15. This data indicates that the FLAGrole is not always well understood among the population, even if, according to someinterviewed stakeholders, they are enough integrated in the territory.
The economic criteria represented by income and employment, whose averageweight is equal to 0,21, result meaningful. A relative importance is attributed to thesub-dimension related to integrated commercialization among fishing, handcrafted,agro-industrial products and touristic services with an average weight equal to 0,28. Inorder to boost the integrated marketing, the FLAGs action, which is aimed at thepromotion of exhibitions and festivals, may be incisive since they would give a sig-nificant contribution to the increase of the added value of the fishing products.
With reference to the fishermen’s income (which has an average value equal to0,21), the interpretation is more uncertain as, on the one hand, the FLAGs leaders thinkthat it is sufficient for a dignified life; on the other hand, the interested persons thinkthat it is insufficient. Beyond the fact that the fishermen have a innate reluctance todeclare the level of their income, there is the issue about the incentives which are notalways promptly supplied. Although the averaged value is equal to 0,18, we have topoint out that, even the small loans to handcrafted fishing are not effectively suppliedbecause, despite the public notices of the Calabria Region to favour fishermen, areconsidered as bank loans with all the conditions which the banks establish. We canstate the same issue regarding the investment of the financial resources for the ade-quacy of the boats aimed at touristic aims or for employment opportunities in othersectors of the economy.
The weights of the obtained average values are indicative of some evaluations, suchas that of the Director of the Costhiera FLAG, according to whom the increase inincome due to the fishing-tourism is uncertain since it previously needs an adequacy tothe boats and, thus, an adequate investment. In fact, what counts more is a culturalchange which a passage from a merely productive activity to a service activity requires.In his turn, the Director of the Bormas FLAG asserts that the fishing-tourism is an
Evaluating the Priorities of the Calabria’s Coast FLAGs 135
activity which only the professional fishing can practice and not those who practice thetrawling fishing. However, behind these evaluations, a generational issue is emerging,since the new generation does not have any longer the same motivations as the previousgenerations to exercise an always handed down activity. Furthermore, not even the factthat the norms are becoming more restrictive for the small boats, with the consequenceof excessive costs, can explain this change. It is useful to highlight that, in the area ofthe Stretto, owing to the different conditions due to the beauty of the landscape, thefishing tourism could constitute a source of integration of income (Nicolosi et al. 2016;Romeo and Marcianò 2019; Musolino 2018). With reference to the sub-criterionopportunity to carry out another kind of job, the relative low value explains not only thepreference from the fishermen to be employed in the fishing activity since they feelprofessional but also for the enjoyment of the beauties of the marine milieu.
The average value of sustainability has got a little significance. Most probably therelative low weight attributed to sustainability is explained by the fact that the FLAGsfocus more on the dimensions of sustainability of the fisheries communities through thediversification of the activities rather than on the fisheries stocks. With reference to theaverage value (0,19) of the sub-criterion market of the discards, the FLAGs areinvolved into the interventions aimed at the rational use of the catch normally discardedin order to improve both the marine habitat and the average incomes of the fishermen.However, regarding the Bormas and Costhiera FLAGs, that minimum quantitative ofdiscards adequate for making the relative market convenient, is not produced. The sub-criterion about the capacity of the operators of the fishing sector to consider the advicecoming from the local, national, and/or international institutions assumes a minorrelevance. This in order to ensure a sustainable management of the fishing areas and itsrelative ecosystems as well as the reduction of the fishing effort which the FLAGsleaders believe it is a minimal measure to pursue the sustainability in the fishing sector.
With reference to the resilience, the low value indicates that not all the directorsgive a relevant importance to it. From the interviews it emerges that the perceived levelof resilience of the fishermen is very low. The FLAGs could intervene in order toincrease the resilience of the fishermen through the diversification of the activities, suchas the ichthyic-tourism or the fish tourism. In particular, the mission of the FLAGs is toincrease the added value of the downstream productive section (i.e. fishery itself)through the catering service, tourism etc. Also, they do not attribute a relevantimportance to the same sub-criterion wide activities of reallocation of the factors ofproduction, such as community, social, recreational services, probably because theythink that this activity is not well practised owing also to the inadequate equipmentsuch as the boats, while diversification through the sub-criterion direct selling of theproducts may be a more efficient way to increase the level of resilience (the weight isequal to 0,27). On this purpose, the questions of the schedule regarding the diversifi-cation have been formulated on the ground of the Local Development Plan of eachFLAG and taking into account the most recent literature (Brugère et al. 2008; Carràet al. 2014; FARNET 2016). For an analysis of the real conditions in which the agentsoperate, the issue should go beyond the correct conception of resilience exposed in thedimension (b) of the previous section. We have noticed that the condition of thefisherman is heavily influenced by a controversial character and external to his activity,such as that of the second-hand dealer. The action of this figure should be included in
136 A. Distaso et al.
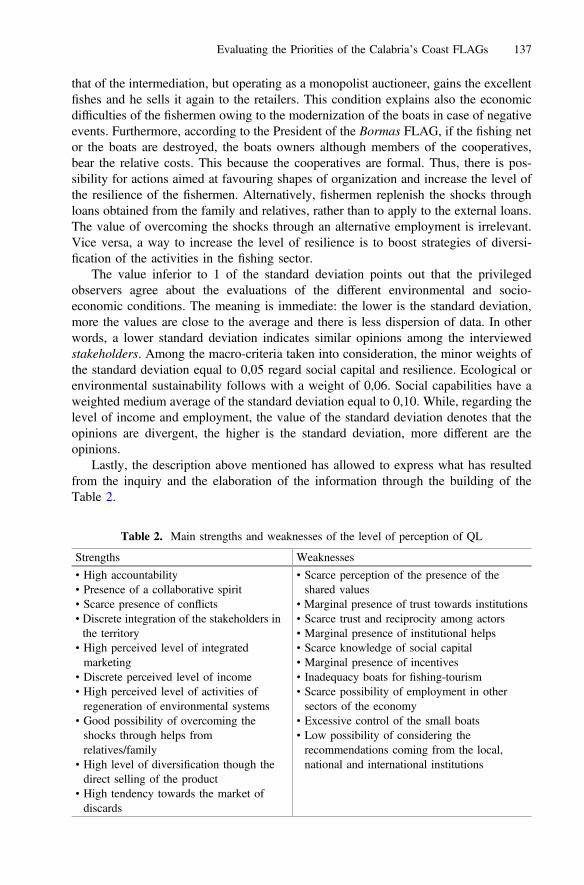
that of the intermediation, but operating as a monopolist auctioneer, gains the excellentfishes and he sells it again to the retailers. This condition explains also the economicdifficulties of the fishermen owing to the modernization of the boats in case of negativeevents. Furthermore, according to the President of the Bormas FLAG, if the fishing netor the boats are destroyed, the boats owners although members of the cooperatives,bear the relative costs. This because the cooperatives are formal. Thus, there is pos-sibility for actions aimed at favouring shapes of organization and increase the level ofthe resilience of the fishermen. Alternatively, fishermen replenish the shocks throughloans obtained from the family and relatives, rather than to apply to the external loans.The value of overcoming the shocks through an alternative employment is irrelevant.Vice versa, a way to increase the level of resilience is to boost strategies of diversi-fication of the activities in the fishing sector.
The value inferior to 1 of the standard deviation points out that the privilegedobservers agree about the evaluations of the different environmental and socio-economic conditions. The meaning is immediate: the lower is the standard deviation,more the values are close to the average and there is less dispersion of data. In otherwords, a lower standard deviation indicates similar opinions among the interviewedstakeholders. Among the macro-criteria taken into consideration, the minor weights ofthe standard deviation equal to 0,05 regard social capital and resilience. Ecological orenvironmental sustainability follows with a weight of 0,06. Social capabilities have aweighted medium average of the standard deviation equal to 0,10. While, regarding thelevel of income and employment, the value of the standard deviation denotes that theopinions are divergent, the higher is the standard deviation, more different are theopinions.
Lastly, the description above mentioned has allowed to express what has resultedfrom the inquiry and the elaboration of the information through the building of theTable 2.
Table 2. Main strengths and weaknesses of the level of perception of QL
Strengths Weaknesses
• High accountability• Presence of a collaborative spirit• Scarce presence of conflicts• Discrete integration of the stakeholders inthe territory
• High perceived level of integratedmarketing
• Discrete perceived level of income• High perceived level of activities ofregeneration of environmental systems
• Good possibility of overcoming theshocks through helps fromrelatives/family
• High level of diversification though thedirect selling of the product
• High tendency towards the market ofdiscards
• Scarce perception of the presence of theshared values
• Marginal presence of trust towards institutions• Scarce trust and reciprocity among actors• Marginal presence of institutional helps• Scarce knowledge of social capital• Marginal presence of incentives• Inadequacy boats for fishing-tourism• Scarce possibility of employment in othersectors of the economy
• Excessive control of the small boats• Low possibility of considering therecommendations coming from the local,national and international institutions
Evaluating the Priorities of the Calabria’s Coast FLAGs 137

4 Concluding Remarks
In this research we have evaluated the main role of the FLAG as a policy instrumentaimed at the improvement of the QL of the small fisheries communities in CalabriaRegion coastal areas. In this way, by intervening in the field of political, social andenvironmental economy, the forecasted actions 2014–2020 of the actual planning maybe implemented.
From the methodological point of view, since the data of the issues which we havedealt with are of qualitative nature, the multi-criteria analysis has revealed itself anefficacious instrument. To such an aim, we have taken into account five macro-criteriadetermining QL: income and employment (as more merely economic parameters),
Fig. 2. Average values of the weights of the criteria and sub-criteria of the QL
138 A. Distaso et al.
resilience, social capital, social capabilities, environmental and socio-economic sus-tainability. These chosen dimensions have been specified into 27 sub-criteria, which areintegrated parts of the macro-criteria. Through the employed methodology, theweaknesses and strengths which the coastal areas where the FLAGs operate present, arespecified.
The results have highlighted the minor or major importance that the Directors of theFLAGs in Calabria give to the different selected dimensions. For instance, a relativemajor importance is attributed to the intangible aspects of the QL. This indicates that theFLAGs directors are aware that both social capital and social capabilities are importantin those communities especially in a period of crisis of the welfare state. It is necessarythat innovative ideas have to be pursued so that well-being may grow in those belongingto the community. Furthermore, the importance attributed to social capital, as the resultsshow, lessens on the ground of the scarce frequency of the interpersonal relationships oftrust, and, consequently of shared values. This is a privileged field where the FLAGscould intervene through a major organization of seminars/conferences, team workamong fishermen, etc. in order to improve a not very positive situation.
It should be necessary that the FLAGs could give more importance to the resilience,by inducing fishermen toward the diversification of the activities through the directselling and the marketing of the ichthyic products. Such a kind of diversification gavepositive results so far, while lacks are noticed about the activity linked to the fishing-tourism owing to the inadequacy of the boats. This activity is efficiently practised onlyin some areas. The level of efficiency may increase if incentives are given to the hand-crafted fishing, if the micro-credit is instituted and if the public institutions are closer tothe effective needs of the fishermen.
From our research it emerges that the FLAGs should follow some policy lines ofintervention aimed at increasing for instance the level of both social capital and socialcapabilities if their target is the improvement of the level of quality of life of thefisheries communities. The FLAGs should promote to a greater extent both socialcapital and social capabilities through cultural meetings, workshops, and activitiessupporting associationism such as the practice of the micro- credit and by orienting theiter of the started public notices. In such a way, the interpersonal relationships withinthe small fisheries communities and between them and the FLAGs could be permeatedof a higher level of trust. Furthermore, it is necessary to make more efforts in order tolet the small fisheries communities comprehend the positive effects deriving from anincrease of such capital. This could be easier if all the subjects representatives of theterritory and the stakeholders who play a central role in the local context are involved.In fact, we think that the regional institutions should have a relevant position whichallows continuity and innovation in the policy guidelines.
Acknowledgments. This study has been published with the contribution of TREnD project(Transition with Resilience for Evolutionary Development), which has received funding from theEuropean Union’s Horizon 2020 research and innovation program under the Marie Skłodowska-Curie grant agreement No. 823952. It provides further elaboration of the results obtained within aproject supported by the “Stretto” Coast FLAG, Calabria Region - European Fisheries Fund(2007–2013), Priority Axis4: Sustainable Development of Fisheries Areas - Measure 4.1.Strengthening the Competitiveness of Fisheries Areas.
Evaluating the Priorities of the Calabria’s Coast FLAGs 139

References
Adrianto, L., Matsuda, Y., Sakuma, Y.: Assessing local sustainability of fishery system: a multi-criteria participatory approach with the case of Yoron Island, Kagoshima prefecture Japan.Mar. Policy 29, 9–23 (2005)
Alinovi, L., Mane, E., Romano, D.: Measuring household resilience to food insecurity:application to Palestinian Households. EC-FAO, Working Paper, pp. 1–39 (2009)
Anand, S., Sen, A.K.: Human development and economic sustainability. World Dev. 12, 2029–2049 (2000)
ARPA: La concezione del “progresso” e del “benessere” secondo l’ OCSE nel progetto “BetterLife” (2015). https://www.arpa.piemonte.it/approfondimenti/temi-ambientali/ambiente-e-salute/prevenzione-e-previsione-dei-rischi-sanitari/vis/documentazione/progetto-better-life-ocse/le-dimensioni-e-gli-indicatori-del-benessere-dell2019ocse-nel-progetto-201cbetter-life201d
Ballet, J., Dubois, J.L., Mahieu, F.R.: Relating capability and sustainability: the sociallysustainable development. Paper Presented for the 3rd Conference on the Capability Approach,University of Pavia, 6th–9th September (2003)
Bebbington, A.: Capitals and capability: a framework for analysing peasant viability. Rurallivelihoods and poverty. World Dev. 27, 2021–2044 (1999)
Brugère, C., Holvoet, K., Allison, E.H.: Livelihood diversification in coastal and inland fishingcommunities: misconceptions, evidence and implications for fisheries management. WorkingPaper, Sustainable Fisheries Livelihoods Programme (SFLP), Rome, FAO/DFID (2008).http://www.fao.org/fishery/docs/DOCUMENT/sflp/wp/diversification_june2008.pdf
Capgemini Consulting, Wageningen University & Research, Ramboll: Executive Summary,Study on the Implementation of Axis 4 of the European Fishery Fund, MARE/2011/01(2014a). https://ec.europa.eu/fisheries/sites/fisheries/files/axis-4-executive-summary_en.pdf
Capgemini Consulting, Wageningen University & Research, Ramboll: Final Report, Study onthe implementation of Axìs 4 of the European Fshery Fund, MARE/2011/01 (2014b). https://ec.europa.eu/fisheries/sites/fisheries/files/axis-4-final-report_en.pdf
Carrà, G., Peri, I., Vindigni, G.A.: Diversification strategies for sustaining small scale fisheriesactivities. A multidimensional integrated approach. Rivista di Studi sulla Sostenibilità 1, 79–99 (2014)
Distaso, A.: Well-being and/or quality of life in E.U. countries through a multidimensional indexof sustainability. Ecol. Econ. 64(1), 163–180 (2007)
Distaso, A.: Local sustainable development and well-being/quality of life. An application of thecapability approach at regional level. Rassegna Economica LXX, 287–322 (2008)
Distaso, A., Distaso, M.: Economics of Social Capital: theoretical and empirical approaches. Thecase study of the Basilicata Region. In: Proceedings LI Convegno SIDEA, 18–20 Settembre,pp. 1–11 (2015)
Donati, P. (ed.): Il capitale sociale. L’approccio relazionale. Sociologia e Politiche Sociali, no. 1,pp. 9–39 (2007)
Donati, P.: Beni relazionali e capitale sociale. In: Donati, P., Solci, R. (eds.) I beni relazionali.Che cosa sono e quali effetti producono. Bollati Boringhieri, Torino, pp. 140–189 (2011)
Drèze, J., Sen, A.: India: Economic Development and Social Opportunity. Oxford UniversityPress, Oxford (1995)
140 A. Distaso et al.
Durston, J.: Building social capital in rural communities (where it doesn’t exist) theoretical andpolicy implications of peasant Empowerment in Chiquimula, Guatemala. Paper Prepared forDelivery at the 1998 Meeting of the Latin American Studies Association (LASA), Chicago,IL, The Palmer House Hilton, 24–26 September (1998)
FARNET: Results-oriented CLLD in fisheries areas. E. European Commission, Directorate-General for Maritime Affairs and Fisheries, Director-General, May 2016. https://webgate.ec.europa.eu/fpfis/cms/farnet/results-oriented-clld-fisheries-areas-helsinki-finland-24–26
Gui, B.: From transactions to encounters: the joint generation of relational good and conventionalgoods. In: Gui, B., Sugden, R. (eds.) Economics and Social Interactions, pp. 23–51.Cambridge University Press, Cambridge (2005)
Ibrahim, S.S.: From individual to collective capabilities: the capability approach as a conceptualframework for self-help. J. Hum. Dev. 7, 397–416 (2006)
Le Gallic, B.: Fisheries sustainability indicators. The OECD experience. In: Joint WorkshopEEA-EC DG Fisheries-DG Environment on “Tools for Measuring (Integrated) FisheriesPolicy Aiming at Sustainable Ecosystem”, 28–29 October, Brussels, Belgium. FisheriesDivision Directorate for Food, Agriculture and Fisheries, OECD, pp. 1–11 (2002)
Lehtonen, M.: The environmental-social interface of sustainable development: capabilities, socialcapital, institutions. Ecol. Econ. 49, 199–214 (2004)
Lin, N.: Building a network theory of social capital. In: Lin, N., Cook, K., Burt, R.S. (eds.) SocialCapital. Theory and Research. DeGruyter, New York (2001)
Lollo, E.: Social capital and the capability approach: new answers to old problems, 1–14 (2011).http://www.happinesseconomics.net
Marcianò, C., Romeo, G.: Integrated local development in coastal areas: the case of the “Stretto”Coast FLAG in Southern Italy. Procedia Soc. Behav. Sci. 223, 379–385 (2016)
Musolino, D.: Characteristics and effects of twin cities integration: the case of Reggio Calabriaand Messina, ‘walled cities’ in Southern Italy. Reg. Sci. Policy Pract., 1–20 (2018)
Narayan, D.: Bonds and Bridges: Social Capital and Poverty. Poverty Group, PREM, WorldBank (1999)
Nicolosi, A., Sapone, N., Cortese, L., Marcianò, C.: Fisheries-related tourism in southernTyrrhenian coastline. Procedia Soc. Behav. Sci. 223, 416–421 (2016)
Norris, F.H., Stevens, S.P., Pfefferbaum, B., Wyhe, K.F., Pfefferbaum, R.L.: Communityresilience as a metaphor, theory, set of capacities and strategies for disaster readiness. Am.J. Community Psychol. 41, 127–150 (2008)
Nussbaum, M.C., Sen, A. (eds.): The Quality of Life. Clarendon Press, Oxford (1993)Nussbaum, M.C.: Women and Human Development: The Capabilities Approach. Cambridge
University Press, Cambridge (2000)Rawls, J.: A Theory of Justice. Harvard University Press, Cambridge (1971)Robeyns, I.: Sen’s capability approach and gender inequality: selecting relevant capabilities.
Fem. Econ. 9, 61–92 (2003)Robeyns, I.: The capability approach: a theoretical survey. J. Hum. Dev. 6, 93–114 (2005)Romeo, G., Marcianò, C.: Performance evaluation of rural governance using an integrated AHP-
VIKOR methodology. In: Zopounidis, C., Kalogeras, N., Mattas, K., van Dijk, G., Baourakis,G. (eds.) Agricultural Cooperative Management and Policy. Book Series CooperativeManagement, pp. 109–134. Springer, Cham (2014)
Romeo, G., Marcianò, C.: Evaluating the economic performance of fishing systems using fuzzymulticriteria analysis in a Fishery Local Action Group in South Italy. Fish. Res. 218, 259–268(2019)
Saaty, T.L.: Mathematical Methods of Operations Research. Dover Publications, New York(1988)
Evaluating the Priorities of the Calabria’s Coast FLAGs 141
Seijo, J.C., Salas, S.: The role of capacity building for improving governance of fisheries andconservation of marine ecosystems. In: Garcia, S.M., Rice, J., Charles, A. (eds.) Governanceof Marine Fisheries and Biodiversity Conservation. Interaction and Coevolution, pp. 374–384. Wiley, Chichester (2014)
Sen, A.K.: Commodities and Capabilities. Elsevier and Reprinted, Amsterdam (1999). OxfordUniversity Press, New Delhi (1985)
Sen, A.K.: Development as Freedom. Knopf, New York (1999)Sen, A.K.: The Idea of Justice. Penguins Books Ltd., London (2009)Siebert, H.: Economics of the Environment. Theory and Policy. Springer, Heidelberg (1998)Simon, F.: Politica economica dell’ ambiente e delle risorse naturali nel XIX e XX secolo. Il caso
particolare dell’ ecosistema marino. In: Cognata, A., Pipitone, V. (eds.) La valutazione dellerisorse ambientali. Approcci multidisciplinari al Golfo di Castellamare, Franco Angeli,Milano, pp. 41–60 (2008)
Stewart, F.: Groups and capabilities. J. Hum. Dev. 6, 185–204 (2005)
Open Access This chapter is licensed under the terms of the Creative Commons Attribution 4.0International License (http://creativecommons.org/licenses/by/4.0/), which permits use, sharing,adaptation, distribution and reproduction in any medium or format, as long as you give appro-priate credit to the original author(s) and the source, provide a link to the Creative Commonslicense and indicate if changes were made.The images or other third party material in this chapter are included in the chapter's Creative
Commons license, unless indicated otherwise in a credit line to the material. If material is notincluded in the chapter's Creative Commons license and your intended use is not permitted bystatutory regulation or exceeds the permitted use, you will need to obtain permission directlyfrom the copyright holder.
142 A. Distaso et al.
Socio-Economic Impacts of the CommonFisheries Policy on South and Central
Tyrrhenian Sea (GSA 10) Demersal TrawlFisheries
Rosaria Felicita Sabatella(&), Paolo Accadia, Maria Cozzolino,Monica Gambino, Loretta Malvarosa, and Evelina Carmen Sabatella
NISEA Fisheries and Aquaculture Economic Research, Salerno, [email protected]
Abstract. European and national fisheries policies aim at reverting toa sus-tainable exploitation of fish resources and to ensure the economic and socialsustainability of fishing activities in the medium to long term (Art. 2 of Regu-lation [EU] No. 1380/2013).The aim of this study was to assess the socio-economic impact of national and
European management measures, implemented in the past ten years, on dem-ersal trawl fisheries in South and Central Tyrrhenian Sea (GSA 10).An effectiveness and efficiency evaluation was performed to establish whether
the objectives of the management policies were achieved (effectiveness) and atwhat cost (efficiency).The economic and social effectiveness of the measures of the Italian man-
agement plans showed a limited performance, particularly in economic terms,due substantially to reduced landings, increased operating costs and reducedlabour productivity. The efficiency assessment, which involved analysis of theresults of the EU cohesion policy financed by the structural funds, demonstratedthat despite the considerable financial out lay the measures failed to mitigate theeconomic and social impact of the Common Fisheries Policy.
Keywords: Common Fisheries Policy � Socio-economic impact � Demersaltrawl fisheries
1 Evolution of the Main Demersal Trawl FisheriesManagement Measures
In 1982, Act of17 February 1982, No. 41, approving the “Plan for the rationalizationand development of marine fisheries”, introduced a first comprehensive framework forthe management of fishing activities. Forty years on, the objective of Art.1– to promotethe rational utilization and enhancement of marine biological resource through an equaldevelopment of sea fishing – is still topical. The Act laid the foundation of a systembased on effort regulation, an approach that has been considered as the most appro-priate for its features of Italian as well as Mediterranean fisheries and which hascharacterized their management for several decades [1]. However, the current state of
© The Author(s) 2020C. Bevilacqua et al. (Eds.): NMP 2020, SIST 177, pp. 143–154, 2020.https://doi.org/10.1007/978-3-030-52869-0_12

demersal resources demonstrates that effort management through input measures hasfailed to achieve the expected results [2, 3]. The adoption of input control measures,which include control of the fishing capacity, can lead to various disadvantages incomparison to regulation through output control; the main disadvantage is that it onlyaddresses one of the components that determine fishing mortality, i.e. capacity. In thiscase, operators would be inclined to replace the regulated factor with those not subjectto control for example by increasing the level of technology used in order to improvecatches and reduce the time they require (overcapitalisation and increasing of vessel“catchability”) [4]. That approach is now being criticized by the scientific communityand the introduction of measures based on output, like the quota system, are suggestedalso in the Mediterranean Sea [5].
The entry into force of Council Regulation (EC) No. 1967/2006 “Concerningmanagement measures for the sustainable exploitation of fishery resources in theMediterranean Sea” and of Regulation (EC) No. 1198/2006 was followed in 2008 bythe adoption of a new approach based on Management Plans, which the MediterraneanMember States were required to adopt for a number of fishing activities in their waters.The aim of the European Commission was to introduce a national and EU-levelmultiannual management plan system combining effort management and specifictechnical measures based on a decentralized decision-making process [6].
The Malta MedFish4Ever Ministerial declaration on the protection of Mediter-ranean fish resources (30 March 2017) accelerated the adoption of managementmeasures for Italy’s demersal stocks. The declaration laid down a detailed work pro-gramme for the next 10 years, including the objective of ensuring proper data collectionand enhancing the knowledge on stocks to achieve sustainable management of stocks.In June 2019, Regulation (EE) No. 2019/1022 established a multiannual plan for thefisheries exploiting demersal stocks in the western Mediterranean Sea. The first fiveyears of the plan envisage a substantial reduction of fishing activities in terms of days atsea.
2 Economic and Social Sustainability
The evaluation of the socio-economic impacts of the Common Fisheries Policy(CFP) on demersal trawl fishing in GSA10 was conducted by selecting appropriateindicators to analyse the economic, social and labour productivity dimensions. Theselected indicators are those used in the Italian Management Plans and in ImpactAssessment concerning the Commission’s proposal for the 2012 reform of the Com-mon Fisheries Policy [7] to evaluate if the objectives have been reached or not.
In particular, the economic sustainability is oriented to increase the long-termresilience of the sector and to encourage fishing on species that produce high pricecommodities [7]. The economic indicators included: a) medium and long-term prof-itability in terms of gross profit margin; b) short-term profitability in terms of the ratioof current revenues to break-even point (CR/BEP) and in terms of the value of pro-duction and average landing prices, which provide valuable information on market andproduction trends.
144 R. F. Sabatella et al.
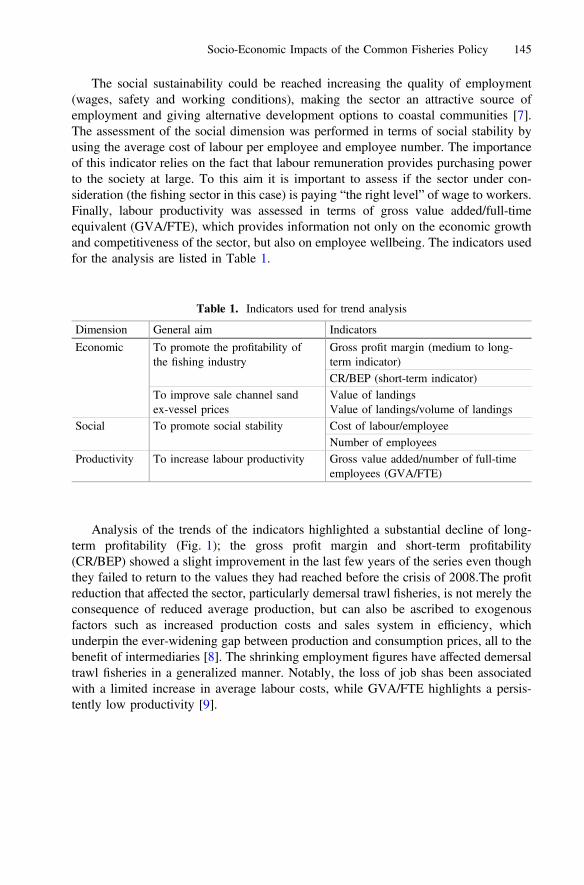
The social sustainability could be reached increasing the quality of employment(wages, safety and working conditions), making the sector an attractive source ofemployment and giving alternative development options to coastal communities [7].The assessment of the social dimension was performed in terms of social stability byusing the average cost of labour per employee and employee number. The importanceof this indicator relies on the fact that labour remuneration provides purchasing powerto the society at large. To this aim it is important to assess if the sector under con-sideration (the fishing sector in this case) is paying “the right level” of wage to workers.Finally, labour productivity was assessed in terms of gross value added/full-timeequivalent (GVA/FTE), which provides information not only on the economic growthand competitiveness of the sector, but also on employee wellbeing. The indicators usedfor the analysis are listed in Table 1.
Analysis of the trends of the indicators highlighted a substantial decline of long-term profitability (Fig. 1); the gross profit margin and short-term profitability(CR/BEP) showed a slight improvement in the last few years of the series even thoughthey failed to return to the values they had reached before the crisis of 2008.The profitreduction that affected the sector, particularly demersal trawl fisheries, is not merely theconsequence of reduced average production, but can also be ascribed to exogenousfactors such as increased production costs and sales system in efficiency, whichunderpin the ever-widening gap between production and consumption prices, all to thebenefit of intermediaries [8]. The shrinking employment figures have affected demersaltrawl fisheries in a generalized manner. Notably, the loss of job shas been associatedwith a limited increase in average labour costs, while GVA/FTE highlights a persis-tently low productivity [9].
Table 1. Indicators used for trend analysis
Dimension General aim Indicators
Economic To promote the profitability ofthe fishing industry
Gross profit margin (medium to long-term indicator)CR/BEP (short-term indicator)
To improve sale channel sandex-vessel prices
Value of landingsValue of landings/volume of landings
Social To promote social stability Cost of labour/employeeNumber of employees
Productivity To increase labour productivity Gross value added/number of full-timeemployees (GVA/FTE)
Socio-Economic Impacts of the Common Fisheries Policy 145
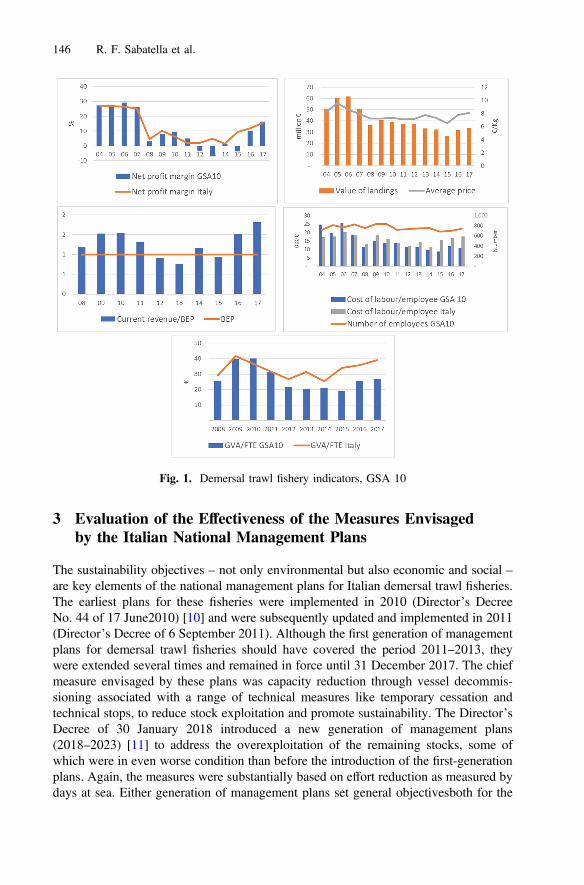
3 Evaluation of the Effectiveness of the Measures Envisagedby the Italian National Management Plans
The sustainability objectives – not only environmental but also economic and social –are key elements of the national management plans for Italian demersal trawl fisheries.The earliest plans for these fisheries were implemented in 2010 (Director’s DecreeNo. 44 of 17 June2010) [10] and were subsequently updated and implemented in 2011(Director’s Decree of 6 September 2011). Although the first generation of managementplans for demersal trawl fisheries should have covered the period 2011–2013, theywere extended several times and remained in force until 31 December 2017. The chiefmeasure envisaged by these plans was capacity reduction through vessel decommis-sioning associated with a range of technical measures like temporary cessation andtechnical stops, to reduce stock exploitation and promote sustainability. The Director’sDecree of 30 January 2018 introduced a new generation of management plans(2018–2023) [11] to address the overexploitation of the remaining stocks, some ofwhich were in even worse condition than before the introduction of the first-generationplans. Again, the measures were substantially based on effort reduction as measured bydays at sea. Either generation of management plans set general objectivesboth for the
Fig. 1. Demersal trawl fishery indicators, GSA 10
146 R. F. Sabatella et al.
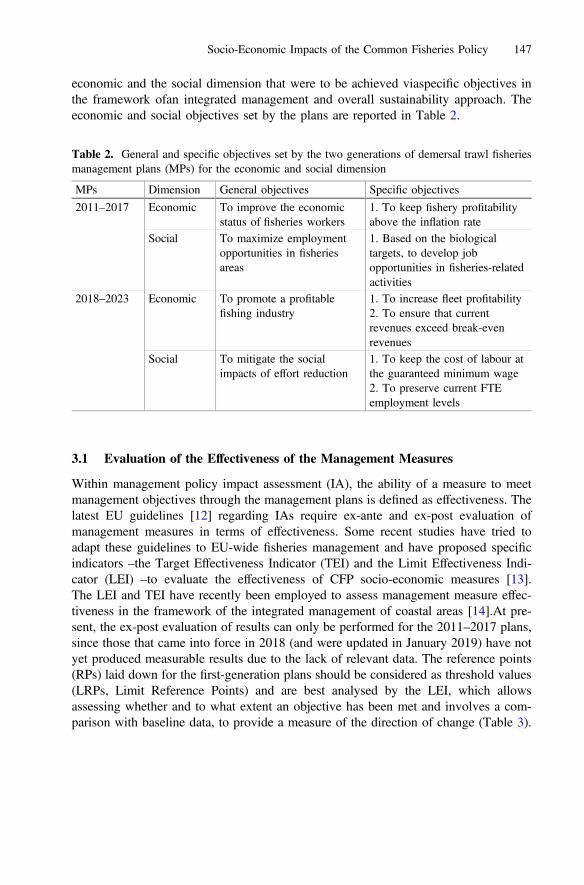
economic and the social dimension that were to be achieved viaspecific objectives inthe framework ofan integrated management and overall sustainability approach. Theeconomic and social objectives set by the plans are reported in Table 2.
3.1 Evaluation of the Effectiveness of the Management Measures
Within management policy impact assessment (IA), the ability of a measure to meetmanagement objectives through the management plans is defined as effectiveness. Thelatest EU guidelines [12] regarding IAs require ex-ante and ex-post evaluation ofmanagement measures in terms of effectiveness. Some recent studies have tried toadapt these guidelines to EU-wide fisheries management and have proposed specificindicators –the Target Effectiveness Indicator (TEI) and the Limit Effectiveness Indi-cator (LEI) –to evaluate the effectiveness of CFP socio-economic measures [13].The LEI and TEI have recently been employed to assess management measure effec-tiveness in the framework of the integrated management of coastal areas [14].At pre-sent, the ex-post evaluation of results can only be performed for the 2011–2017 plans,since those that came into force in 2018 (and were updated in January 2019) have notyet produced measurable results due to the lack of relevant data. The reference points(RPs) laid down for the first-generation plans should be considered as threshold values(LRPs, Limit Reference Points) and are best analysed by the LEI, which allowsassessing whether and to what extent an objective has been met and involves a com-parison with baseline data, to provide a measure of the direction of change (Table 3).
Table 2. General and specific objectives set by the two generations of demersal trawl fisheriesmanagement plans (MPs) for the economic and social dimension
MPs Dimension General objectives Specific objectives
2011–2017 Economic To improve the economicstatus of fisheries workers
1. To keep fishery profitabilityabove the inflation rate
Social To maximize employmentopportunities in fisheriesareas
1. Based on the biologicaltargets, to develop jobopportunities in fisheries-relatedactivities
2018–2023 Economic To promote a profitablefishing industry
1. To increase fleet profitability2. To ensure that currentrevenues exceed break-evenrevenues
Social To mitigate the socialimpacts of effort reduction
1. To keep the cost of labour atthe guaranteed minimum wage2. To preserve current FTEemployment levels
Socio-Economic Impacts of the Common Fisheries Policy 147
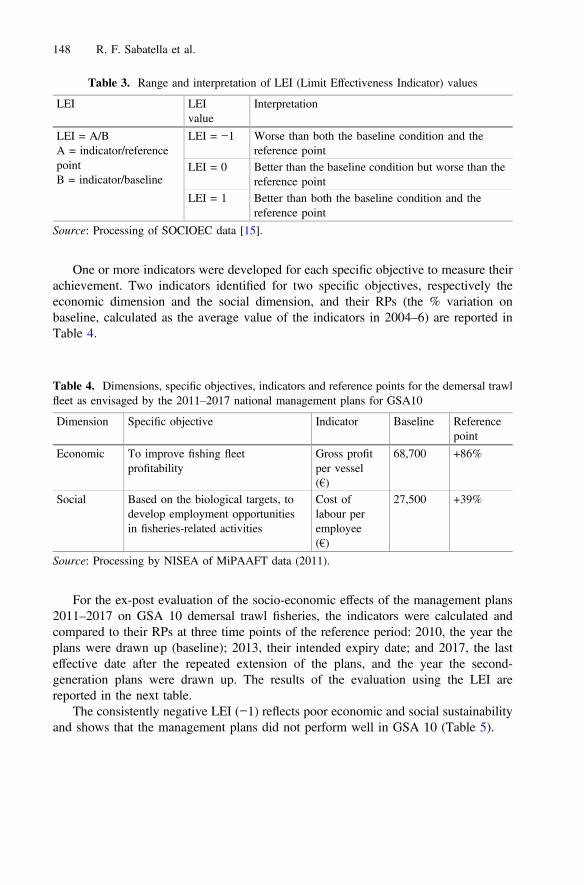
One or more indicators were developed for each specific objective to measure theirachievement. Two indicators identified for two specific objectives, respectively theeconomic dimension and the social dimension, and their RPs (the % variation onbaseline, calculated as the average value of the indicators in 2004–6) are reported inTable 4.
For the ex-post evaluation of the socio-economic effects of the management plans2011–2017 on GSA 10 demersal trawl fisheries, the indicators were calculated andcompared to their RPs at three time points of the reference period: 2010, the year theplans were drawn up (baseline); 2013, their intended expiry date; and 2017, the lasteffective date after the repeated extension of the plans, and the year the second-generation plans were drawn up. The results of the evaluation using the LEI arereported in the next table.
The consistently negative LEI (−1) reflects poor economic and social sustainabilityand shows that the management plans did not perform well in GSA 10 (Table 5).
Table 3. Range and interpretation of LEI (Limit Effectiveness Indicator) values
LEI LEIvalue
Interpretation
LEI = A/BA = indicator/referencepointB = indicator/baseline
LEI = −1 Worse than both the baseline condition and thereference point
LEI = 0 Better than the baseline condition but worse than thereference point
LEI = 1 Better than both the baseline condition and thereference point
Source: Processing of SOCIOEC data [15].
Table 4. Dimensions, specific objectives, indicators and reference points for the demersal trawlfleet as envisaged by the 2011–2017 national management plans for GSA10
Dimension Specific objective Indicator Baseline Referencepoint
Economic To improve fishing fleetprofitability
Gross profitper vessel(€)
68,700 +86%
Social Based on the biological targets, todevelop employment opportunitiesin fisheries-related activities
Cost oflabour peremployee(€)
27,500 +39%
Source: Processing by NISEA of MiPAAFT data (2011).
148 R. F. Sabatella et al.

The management plans 2018–2023, as updated in January 2019 [11], aim atreducing mortality from fishing (F) in direct proportion to the percent reduction offishing capacity (2018) and effort (2019–2020). At variance with the first-generationplans, the new plans provide for ex-ante evaluation of the effectiveness of the measuresthrough a simulation of their biological, economic and social effects both in 2020 (theend of the first period of plan implementation and the year when measure effectivenessis to be evaluated) and in 2023 (final year of plan validity).
According to the ex-ante evaluation (Table 6), the management plans 2018–2023should achieve a fairly satisfactory economic performance, since all the economicindicators included in the simulation show an improvement compared to 2015. Asregards social sustainability, the number of FTE jobs is expected to decline as a resultof fishing effort reduction.
4 Evaluation of the Efficiency of the Management MeasuresEnvisaged by the Italian National Management Plans
The IA of structural fund efficiency is directed at establishing the adequacy of thepublic resources allocated to support the sector, i.e. whether the desired effects havebeen achieved at a reasonable cost [16].
The final results of the two most recent (expired) programmes, FIFG 2000–2006and EFF 2007–2013, are summarized in the next two paragraphs.
Table 5. Ex-post evaluation of the economic and social effectiveness of the measures of thenational management plans 2011–2017 on the demersal trawl fleet operating in GSA 10 using theLimit Effectiveness Indicator (LEI)
Year Economic dimensionGross profit/vessel (€)
Social dimensionCost of labour/employee (€)
Baseline LRP Outcome LEI Baseline LRP Outcome LEI
2010 68,700 127,782 47,399 −1 27,500 38,225 13,980 −12013 68,700 127,782 16,349 −1 27,500 38,225 11,309 −12017 68,700 127,782 49,796 −1 27,500 38,225 10,669 −1
Source: Processing by NISEA of MiPAAFT data (2011) and National FisheriesData Collection Programme 2010–2017.
Table 6. Expected values of the economic and social indicators in 2020 and 2023 andcomparison with current situation (demersal trawl fisheries, GSA 10) Source: MiPAAFT (2018).
Gross profit margin
CR/BEP Cost of labour/FTE
FTE Gross profit margin
CR/BEP Cost of labour/FTE
FTE Gross profit margin
CR/BEP Cost of labour/FTE
FTE
Scenario 0_Status quo -3.08 0.95 11,107 660 7.61 1.30 11,919 648 7.67 1.30 11,913 648
Scenario 1_F-5% 11.64 1.45 16,270 456 22.83 1.85 16,188 315
Trawlers 06-24m GSA10
Average value 2013-15 2020 2023
Socio-Economic Impacts of the Common Fisheries Policy 149
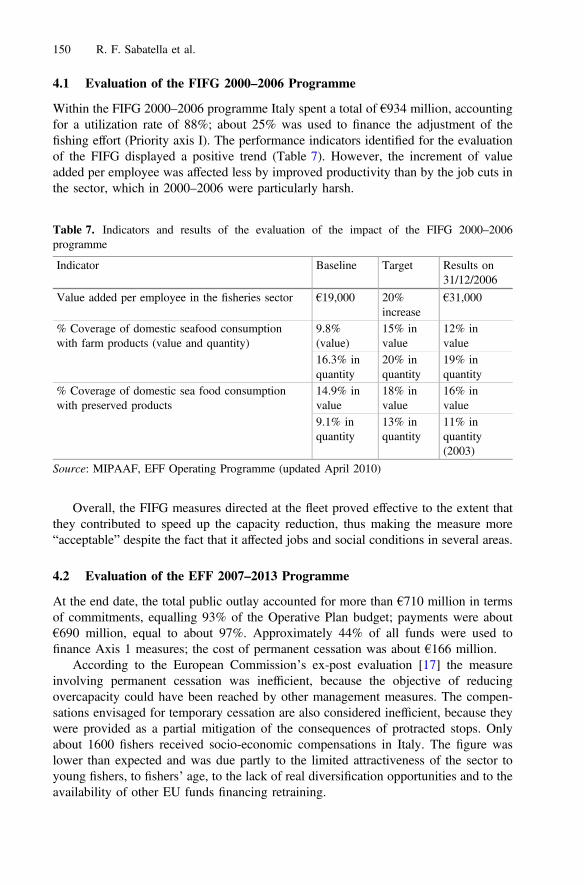
4.1 Evaluation of the FIFG 2000–2006 Programme
Within the FIFG 2000–2006 programme Italy spent a total of €934 million, accountingfor a utilization rate of 88%; about 25% was used to finance the adjustment of thefishing effort (Priority axis I). The performance indicators identified for the evaluationof the FIFG displayed a positive trend (Table 7). However, the increment of valueadded per employee was affected less by improved productivity than by the job cuts inthe sector, which in 2000–2006 were particularly harsh.
Overall, the FIFG measures directed at the fleet proved effective to the extent thatthey contributed to speed up the capacity reduction, thus making the measure more“acceptable” despite the fact that it affected jobs and social conditions in several areas.
4.2 Evaluation of the EFF 2007–2013 Programme
At the end date, the total public outlay accounted for more than €710 million in termsof commitments, equalling 93% of the Operative Plan budget; payments were about€690 million, equal to about 97%. Approximately 44% of all funds were used tofinance Axis 1 measures; the cost of permanent cessation was about €166 million.
According to the European Commission’s ex-post evaluation [17] the measureinvolving permanent cessation was inefficient, because the objective of reducingovercapacity could have been reached by other management measures. The compen-sations envisaged for temporary cessation are also considered inefficient, because theywere provided as a partial mitigation of the consequences of protracted stops. Onlyabout 1600 fishers received socio-economic compensations in Italy. The figure waslower than expected and was due partly to the limited attractiveness of the sector toyoung fishers, to fishers’ age, to the lack of real diversification opportunities and to theavailability of other EU funds financing retraining.
Table 7. Indicators and results of the evaluation of the impact of the FIFG 2000–2006programme
Indicator Baseline Target Results on31/12/2006
Value added per employee in the fisheries sector €19,000 20%increase
€31,000
% Coverage of domestic seafood consumptionwith farm products (value and quantity)
9.8%(value)
15% invalue
12% invalue
16.3% inquantity
20% inquantity
19% inquantity
% Coverage of domestic sea food consumptionwith preserved products
14.9% invalue
18% invalue
16% invalue
9.1% inquantity
13% inquantity
11% inquantity(2003)
Source: MIPAAF, EFF Operating Programme (updated April 2010)
150 R. F. Sabatella et al.

According to OpenCohesion data on the EFF impact on employment, the EU-leveltargets were not achieved (Table 8).
In general, jobs declined sharply during the EFF programming period (EuropeanCommission, 2017). The fact that the funds were channelled towards Priority axis 1,especially permanent cessation, clearly contributed to the job loss. The ex-post eval-uation of the EFF highlights Priority axis 4, concerning the sustainable development offisheries areas and the creation of fisheries local action groups (FLAGs). According tothe “Study on the implementation of Axis 4 of the European Fisheries Fund”MARE/2011/01, Axis 4 seems to have contributed to preserve about 9,000 jobs and tocreate 6,000–8,000 more, although these data disagree with those of the EUOpenCohesion database. In Italy FLAGs began operating late; therefore, at variancewith other Member States like Spain, they did not exert favourable effects onemployment figures on fisheries value added.
It may thus be concluded that, as demonstrated by the indicators, the socio-economic impacts of the CFP have not been mitigated by the measures funded by theEU despite the substantial outlay of the structural funds.
5 Conclusion
Eight years into the CFP and almost 10 since the adoption of the first national man-agement plans for demersal trawl fisheries, the Mediterranean fish stocks are stillexploited above the maximum sustainable yield [18]. The consistent overfishing is dueto excessive effort. As a result, in the past 20 years the Italian fishing sector hasundergone a reduction of fleet capacity and fishing effort, which has resulted incon-siderable job cuts. The 2018 update of the management plans for demersal trawlfisheries has also introduced effort regulation as the main technical measure.
The outcome of these policies has been a marked reduction in the volume and valueof production in all areas from 2004 to 2017 [8]. The reduced production is due to theeffort reduction as well as to economic factors (incidence of the energy cost), socialproblems (difficulty in finding specialized workers) and ecological issues (probableincrease in the actual effort due to greater vessel efficiency and to increased fishingeffort by the other Mediterranean fleets).
Table 8. Fisheries employment levels outcome indicators (OpenCohesion)
Outcome indicators* EU target value Italy target value Final value
FLAG jobs created 4,619 1,920 139Fisheries jobs created 6,930 3,200 111FLAG jobs maintained 26,530 23,099 355Fisheries jobs maintained 52,437 32,400 2,860
Source: https://cohesiondata.ec.europa.eu/2014-2020/ESIF-2014-2020-Achievement-Details/aesb-873i
Socio-Economic Impacts of the Common Fisheries Policy 151

Effort rationalization has not enhanced profitability for the remaining demersaltrawlers.
The ex-post evaluation of the economic and social effectiveness of the measures ofthe national management plans 2011–2017 demonstrated their poor effectiveness,particularly in the economic sector. The negative value of the LEI is to be ascribed tothe use of high RPs and to a general deterioration of the profit indicators, due essen-tially to reduced catches and labour productivity and to increased operating costs.
The ex-ante efficiency evaluation of the second-generation management measures(2018–2023) leads to expect a marked reduction in FTE jobs, particularly in2023, dueto the progressive reduction of days at sea.
As regards the support provided by the structural funds, the sums allocated forpermanent and temporary cessation and socio-economic compensations have provedinefficient and have not improved fishers’ conditions despite the substantial outlays.
One of the factors hampering the achievement of the biological, but also economicand social, sustainability targets is the poor sharing of objectives among managementbodies (European Commission and national and regional administrations). The modesof management plan implementation should lead to the creation of a body with specificroles and responsibilities in plan management, surveillance and monitoring. Thegovernance should be inspired to recent approaches in this field, especially as regardsco-management and responsive management, with a broader stakeholder involvementin management, surveillance and monitoring.
A further obstacle hampering the recovery of the sector is the poor fisher and ownerawareness of the changes that have affected fisheries in the past few years; this resultsin their limited ability to address and adjust to such changes by adopting a moreentrepreneurial stance based on continuous training and a greater use of investment.The levels of activity are progressively declining, also due to the adoption of the recentmanagement measures (national and multiannual management plans); average pro-ductivity is slightly improving, but it will be able to achieve levels that ensure eco-nomic sustainability only if it is accompanied by a consistent effort reduction. Thedirect effects of these changes will be lower employment levels in terms of FTE; sincethe cost of labour is proportional to revenues, due to the widespread application ofprofit-sharing contracts, incomes may increase only in presence of increased dailyvalue added. In Italy, several local operators have adopted quality labels, have createdor strengthened the role of Producer Organizations or have undertaken direct sale, thuspromoting commercial strategies that improve the traceability and quality of fresh localproducts. However, the distribution network and sales system is still inadequate andinefficient, also due to fishers’ typical business risk aversion and to the near absence oftraining opportunities directed at up grading their skills, which would enable theadoption of new sales technologies, like the exploitation of digital markets.
Acknowledgements. The study was funded by Uila Pesca under the three-year national fishingplan, launched by the Fishery Directorate – Mipaaf.
152 R. F. Sabatella et al.
References
1. Caddy, J.F.: Practical issues in choosing a framework for resource assessment andmanagement of Mediterranean and Black Sea fisheries. Medit. Mar. Sci. 10, 83–120 (2009).https://doi.org/10.12681/mms.124
2. Vielmini, I., Perry, A.L., Cornax, M.J.: Untying the Mediterranean Gordian knot: a twentyfirst century challenge for fisheries management. Front. Mar. Sci. 4, 195 (2017). https://doi.org/10.3389/fmars.2017.00195
3. Colloca, F., Scarcella, G., Libralato, S.: Recent trends and impacts of fisheries exploitationon Mediterranean stocks and ecosystems. Front. Mar. Sci. 4, 244 (2017). https://doi.org/10.3389/fmars.2017.00244
4. Sabatella R.F., Spagnolo M.: National planning and management measures, Chap. 10. In:Cataudella, S., Spagnolo, M. (eds.), The State of Italian Marine Fisheries and Aquaculture.Ministero delle Politiche Agricole, Alimentari e Forestali (MiPAAF), Rome (Italy), 620p. (2011)
5. Cardinale, M., Osio, G.C., Scarcella, G.: Mediterranean sea: a failure of the europeanfisheries management system. Front. Mar. Sci. 4, 72 (2017). https://doi.org/10.3389/fmars.2017.00072
6. Sabatella, E.C., et al.: Key economic characteristics of Italian trawl fisheries andmanagement challenges. Front. Mar. Sci. 4, 371 (2017). https://doi.org/10.3389/fmars.2017.0037
7. EU COM: Commission Staff Working Paper, Impact Assessment, Accompanying thedocument, Commission proposal for a Regulation of the European Parliament and of theCouncil on the Common Fisheries Policy [repealing Regulation (EC) N° 2371/2002].425 final; SEC(2011) 892 final (2011)
8. Maiorano, P., Sabatella, R.F., Marzocchi, B.M. (eds.): Annuario sullo stato delle risorse esulle strutture produttive dei mari italiani, 432 p. (2019)
9. Coppola, G., Gambino, M., Paolucci, C., Restaino, M.L.: The dynamics of the Italianmaritime districts (2004–2013). In: XXIV Conference of the European Association ofFisheries Economists. Faculty of Geography, Santiago de Compostela, 2–4 April 2019(2019)
10. MiPAAFT: Decreto Direttoriale n. 6 del 20 settembre 2011. Adozione dei piani nazionali digestione della flotta (2011). https://www.politicheagricole.it/flex/cm/pages/ServeBLOB.php/L/IT/IDPagina/6896
11. MiPAAFT: Decreto del Direttore Generale n. 26510 del 28 dicembre 2018. Modifica deiPiani di Gestione Nazionale relativi alle flotte di pesca per la cattura delle risorse demersalinell’ambito delle GSA 9, 10, 11, 16, 17, 18 e 19 (2018) https://www.politicheagricole.it/flex/cm/pages/ServeBLOB.php/L/IT/IDPagina/13693
12. EC (European Commission): Impact Assessment Guidelines. SEC(2005) 791, updated inMarch 2006, Brussels (2006)
13. Malvarosa, L., et al.: Sustainability Impact Assessment (SIA) in fisheries: implementation inEU fishing regions. Mar. Policy 101, 63–79 (2019)
14. Gambino, M., et al.: Towards an integrated coastal zone management in campania region(Italy) a multidisciplinary approach to the analysis of coastal fishery activities and theirsocio-economic management. Procedia – Soc. Behav. Sci. 223, 342–348 (2016). https://doi.org/10.1016/j.sbspro.2016.05.239
15. SOCIOEC: Deliverable 5.6 - Rating (ex ranking) management measures at CS level (2015)
Socio-Economic Impacts of the Common Fisheries Policy 153
16. European Commission: Evaluating EU Activities — A practical guide for the Commissionservices. Office for Official Publications of the European Communities, Luxembourg 110p. (2004). ISBN 92-894-7928-0
17. European Commission: Ex post evaluation of the european fisheries fund. PublicationsOffice of the European Union, Luxembourg (2017). ISBN 978-92-79-65193-9. https://doi.org/10.2771/798734
18. STECF: Scientific, Technical and Economic Committee for Fisheries (STECF) ñ Mediter-ranean assessments 2016 part 2 (STECF1706). Publications Office of the European Union,Luxembourg. EUR 28359 EN (2017). https://doi.org/10.2760/015005
Open Access This chapter is licensed under the terms of the Creative Commons Attribution 4.0International License (http://creativecommons.org/licenses/by/4.0/), which permits use, sharing,adaptation, distribution and reproduction in any medium or format, as long as you give appro-priate credit to the original author(s) and the source, provide a link to the Creative Commonslicense and indicate if changes were made.The images or other third party material in this chapter are included in the chapter's Creative
Commons license, unless indicated otherwise in a credit line to the material. If material is notincluded in the chapter's Creative Commons license and your intended use is not permitted bystatutory regulation or exceeds the permitted use, you will need to obtain permission directlyfrom the copyright holder.
154 R. F. Sabatella et al.

Financial Targets for the Sponseeand the Sponsor in the Restoration/Recoveryof the Historical and Architectural Heritage
Luigi Dolores(&) , Maria Macchiaroli , and Gianluigi De Mare
University of Salerno, Via Giovanni Paolo II, 132, Fisciano (SA), Italy{ldolores,mmacchiaroli,gdemare}@unisa.it
Abstract. The paper explores the theme of sponsorship for therestoration/recovery of the historical-architectural heritage. The goal is to pro-pose a model that allows both the sponsee (often public institution) and thesponsor company (mainly private) to maximize the monetary return generatedby the investment. The model is tested through the following case study: thesponsorship of the restoration works of the Don Tullio’s Fountain located in theVilla Comunale of Salerno (Italy). In the logic of the model, the fundingrequested by the sponsee is necessarily inclusive of the amount equal to the costof the restoration work but should also consider the financial advantage derivingfrom the advertising return to the sponsor company. These targets are estimatedthrough the direct audience critical variable connected with the number ofvisitors of the location of interest. For the sponsor, on the other hand, assuming aCobb-Douglas production function, it’s possible to quantify under static con-ditions the optimal percentage of turnover to invest in sponsorship to maximizeprofits. Assuming, therefore, that several companies are interested in sponsoringthe restoration of the monument, the application of the model makes it possibleto determine which company would be most suitable to sign the sponsorshipcontract.
Keywords: Sponsorship � Advertising fees � Cultural heritage � Profitability ofinvestment � Public-private partnership
1 Introduction
Local development understood as a process of valorisation of existing territorialresources is based on the dialectic interaction between endogenous and exogenousprocesses. Therefore, it’s synonymous with mutual influence between the local andexternal dimensions. In this perspective, the challenge is to increase the value of theidentity capital (natural, physical, human, social and symbolic) of a territory [1]. Amongthe identity resources that characterize local realities, cultural heritage plays a primaryrole. Policies to promote local development often include among their main goals that ofimproving the enjoyment of the historical-artistic heritage. This often happens through
L. Dolores, M. Macchiaroli and G. De Mare—Contributed equally to this work.
© The Author(s) 2020C. Bevilacqua et al. (Eds.): NMP 2020, SIST 177, pp. 155–165, 2020.https://doi.org/10.1007/978-3-030-52869-0_13
the elaboration of management models based on multi-level planning focused on formsof partnership between institutions and companies of the territory [2–7].
Among the main forms of public-private partnership, sponsorship represents a validinstrument for the enhancement of cultural heritage that offers several advantages toboth public administrations and companies. The latter, taking on the role of sponsors,use cultural sponsorship to strengthen or rebuild their corporate image and corporatereputation as well as to achieve a variety of objectives: improving relations withcustomers, fostering relations with bodies and institutions, improving relations withsuppliers, and generating consensus in society. Another important advantage is themonetary return generated by the investment in sponsorship. On the other hand, publicbodies, taking on the role of sponsees, not only obtain from companies the financial orin-kind means necessary to organise and carry out a given activity but by interactingwith the business world they contribute to the social and economic development of theterritory [8].
The objective of the work consists in proposing and testing through a case study,set in the city of Salerno (Italy), a model that allows the sponsor to maximize the profitsgenerated by the investment in sponsorship and, at the same time, the sponsee tooptimize the amount of funding obtained by the company. The financing companiescan thus establish the optimum percentage of turnover to be invested in sponsorshipscapable of generating the highest achievable profit. For Public Administrations, on theother hand, the model makes it possible to determine the financial resources deemedoptimal to proceed with the signing of the sponsorship contract. These resources areconsidered to include not only the amount needed to carry out the restoration work butalso an aliquot linked to the profit of the private lender and representative of the valuethat the candidate company intends to acquire with its offer.
2 Methods
The logical path of the proposed model can be divided into two phases. The problem ofmaximizing the economic return due to public administrations is addressed in the phaseof estimating sponsorship fees [9], which is inspired by the Technical Regulations oncultural sponsorship [10]. These rules assume that the total cost of the sponsorship isestablished on the basis of the value of the work, services or supplies necessary for therestoration, plus an additional aliquot proportional to the value of the advertising return,expressed in both monetary and image terms, which the administration is able to offerthe sponsor [11]. The mark-up, representative of the countervalue offered, is to beproperly estimated based on the considered desirability of the sponsorship on themarket. This allows the Administrations both to avoid, in case of overestimation, a totallack of interest on the part of the companies, and to avoid, in case of underestimation,the attribution to the private individual of services of too high a value compared to theconsideration obtained. However, the monetary and image returns due to the companyare in practice rarely estimated because of their difficult measurement [12]. It followsthat Administrations are unlikely to maximise public return from the application of the
156 L. Dolores et al.

instrument. To overcome the problem, when estimating the sponsorship fees, it’sassumed that the advertising return offered to the sponsor is a function of variousparameters, some referring to the property to be enhanced (name of the designer, timeof construction, architectural quality, relevance of the property to the community) andothers characterizing the sponsorship activity (media coverage, direct audience) [13]. Inaddition, the analysis of numerous cases of cultural sponsorship shows that the criticalvariable that most influences advertising fees is the direct audience, i.e. the number ofvisitors to the monumental locations affected by the restoration/recovery projects. Thecontribution of the other parameters is therefore in most cases negligible. A comparisonof the examples analysed shows an almost linear relationship between unit fees andnumber of visitors. So, having estimated the direct audience for the location of interestand made a comparison with similar sponsorship cases, it’s possible to establish a feerepresentative of the advertising cost with linear proportion.
The problem of maximising the business profits generated by sponsorship isaddressed in the static analysis phase of the investment [14]. The latter consists in there-elaboration of a model proposed by Bucci, Castellani and Figini [15], in whichsponsorship is considered as that immaterial production factor that enters in eachmoment in time (static hypothesis) in the production function of the company. Themodel assumes a Cobb-Douglas production function [16]. Below is adopted the ver-sion proposed by Romer [17] used to explain the endogenous growth of productionsystems generated by human capital. In the present case, this input is replaced by thestock of sponsorships (S) accumulated by the company. Knowing the revenues (R) ofthe enterprise and the capital (K), labour (L) and sponsorship (S), the function isdefined as follows:
R ¼ KaL1�aS1�a: ð1Þ
Equation (1) shows constant returns to scale compared to K and L. However, whenall three factors of production are considered, it shows increasing returns to scale. Wealso assume for the three factors considered individually decreasing marginal returns,being a < 1 [18, 19]. The price of the good offered by the company is normalised to 1.This makes it possible to relate revenues directly to the factors of production. The totalprofit is represented by the following formula:
p ¼ KaL1�aS1�a � rK�wL�sS; ð2Þ
where rK is the cost of capital, wL represents the cost of labour and sS identifies thecost of sponsorship. In addition, r, w and s represent the unit cost of K, L and S re-spectively. The unit cost of the sponsorship s is the link between the two phases. Thisparameter represents the cost of a single sponsorship and includes both the cost ofrestoration work and the cost of advertising. Therefore, estimated s in the phase ofestimating sponsorship fees, this value is then reintroduced in the static analysis phase
Financial Targets for the Sponsee and the Sponsor 157
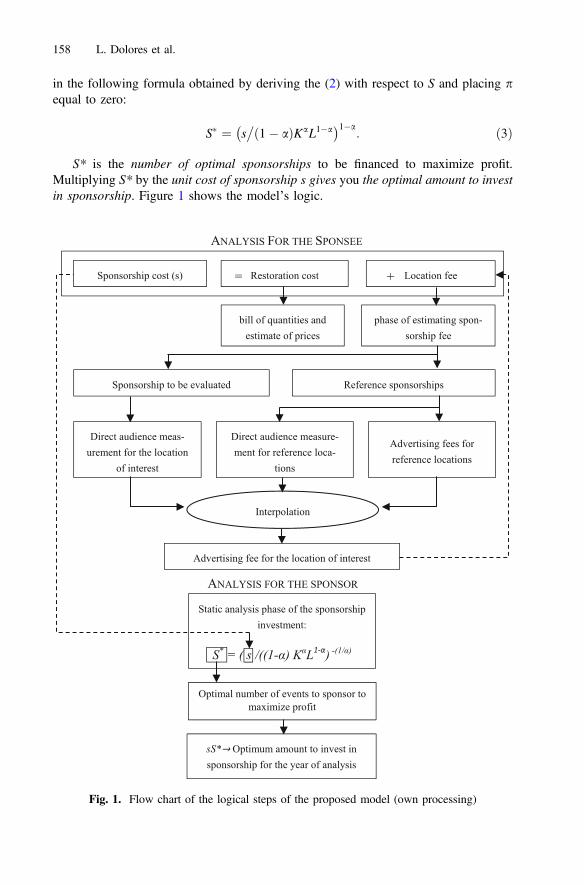
in the following formula obtained by deriving the (2) with respect to S and placing pequal to zero:
S� ¼ s�1� að ÞKaL1�a
� �1�a: ð3Þ
S* is the number of optimal sponsorships to be financed to maximize profit.Multiplying S* by the unit cost of sponsorship s gives you the optimal amount to investin sponsorship. Figure 1 shows the model’s logic.
Fig. 1. Flow chart of the logical steps of the proposed model (own processing)
158 L. Dolores et al.
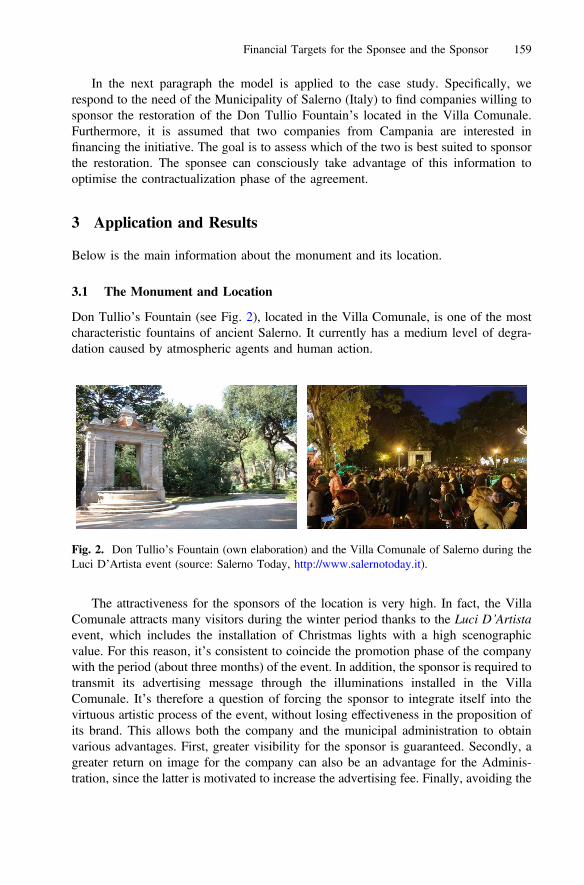
In the next paragraph the model is applied to the case study. Specifically, werespond to the need of the Municipality of Salerno (Italy) to find companies willing tosponsor the restoration of the Don Tullio Fountain’s located in the Villa Comunale.Furthermore, it is assumed that two companies from Campania are interested infinancing the initiative. The goal is to assess which of the two is best suited to sponsorthe restoration. The sponsee can consciously take advantage of this information tooptimise the contractualization phase of the agreement.
3 Application and Results
Below is the main information about the monument and its location.
3.1 The Monument and Location
Don Tullio’s Fountain (see Fig. 2), located in the Villa Comunale, is one of the mostcharacteristic fountains of ancient Salerno. It currently has a medium level of degra-dation caused by atmospheric agents and human action.
The attractiveness for the sponsors of the location is very high. In fact, the VillaComunale attracts many visitors during the winter period thanks to the Luci D’Artistaevent, which includes the installation of Christmas lights with a high scenographicvalue. For this reason, it’s consistent to coincide the promotion phase of the companywith the period (about three months) of the event. In addition, the sponsor is required totransmit its advertising message through the illuminations installed in the VillaComunale. It’s therefore a question of forcing the sponsor to integrate itself into thevirtuous artistic process of the event, without losing effectiveness in the proposition ofits brand. This allows both the company and the municipal administration to obtainvarious advantages. First, greater visibility for the sponsor is guaranteed. Secondly, agreater return on image for the company can also be an advantage for the Adminis-tration, since the latter is motivated to increase the advertising fee. Finally, avoiding the
Fig. 2. Don Tullio’s Fountain (own elaboration) and the Villa Comunale of Salerno during theLuci D’Artista event (source: Salerno Today, http://www.salernotoday.it).
Financial Targets for the Sponsee and the Sponsor 159
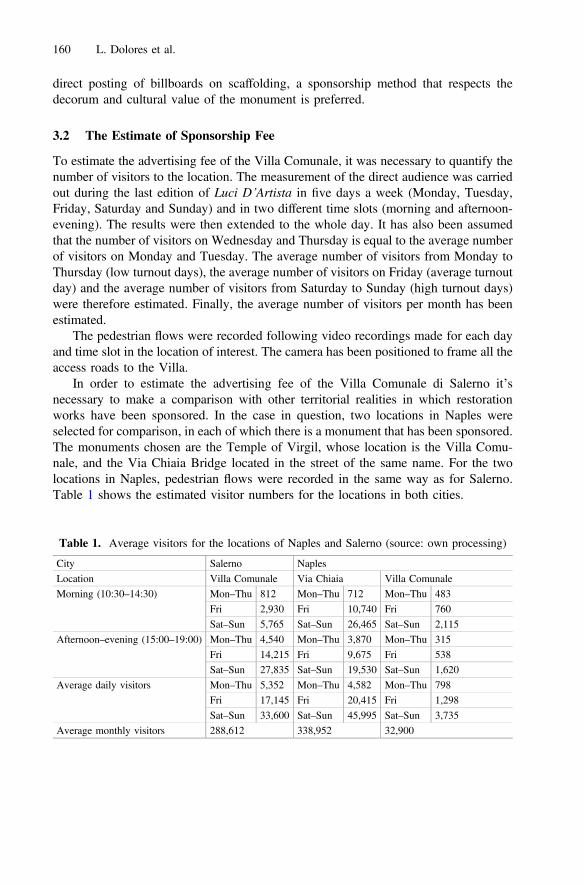
direct posting of billboards on scaffolding, a sponsorship method that respects thedecorum and cultural value of the monument is preferred.
3.2 The Estimate of Sponsorship Fee
To estimate the advertising fee of the Villa Comunale, it was necessary to quantify thenumber of visitors to the location. The measurement of the direct audience was carriedout during the last edition of Luci D’Artista in five days a week (Monday, Tuesday,Friday, Saturday and Sunday) and in two different time slots (morning and afternoon-evening). The results were then extended to the whole day. It has also been assumedthat the number of visitors on Wednesday and Thursday is equal to the average numberof visitors on Monday and Tuesday. The average number of visitors from Monday toThursday (low turnout days), the average number of visitors on Friday (average turnoutday) and the average number of visitors from Saturday to Sunday (high turnout days)were therefore estimated. Finally, the average number of visitors per month has beenestimated.
The pedestrian flows were recorded following video recordings made for each dayand time slot in the location of interest. The camera has been positioned to frame all theaccess roads to the Villa.
In order to estimate the advertising fee of the Villa Comunale di Salerno it’snecessary to make a comparison with other territorial realities in which restorationworks have been sponsored. In the case in question, two locations in Naples wereselected for comparison, in each of which there is a monument that has been sponsored.The monuments chosen are the Temple of Virgil, whose location is the Villa Comu-nale, and the Via Chiaia Bridge located in the street of the same name. For the twolocations in Naples, pedestrian flows were recorded in the same way as for Salerno.Table 1 shows the estimated visitor numbers for the locations in both cities.
Table 1. Average visitors for the locations of Naples and Salerno (source: own processing)
City Salerno NaplesLocation Villa Comunale Via Chiaia Villa ComunaleMorning (10:30–14:30) Mon–Thu 812 Mon–Thu 712 Mon–Thu 483
Fri 2,930 Fri 10,740 Fri 760Sat–Sun 5,765 Sat–Sun 26,465 Sat–Sun 2,115
Afternoon–evening (15:00–19:00) Mon–Thu 4,540 Mon–Thu 3,870 Mon–Thu 315Fri 14,215 Fri 9,675 Fri 538Sat–Sun 27,835 Sat–Sun 19,530 Sat–Sun 1,620
Average daily visitors Mon–Thu 5,352 Mon–Thu 4,582 Mon–Thu 798Fri 17,145 Fri 20,415 Fri 1,298
Sat–Sun 33,600 Sat–Sun 45,995 Sat–Sun 3,735Average monthly visitors 288,612 338,952 32,900
160 L. Dolores et al.
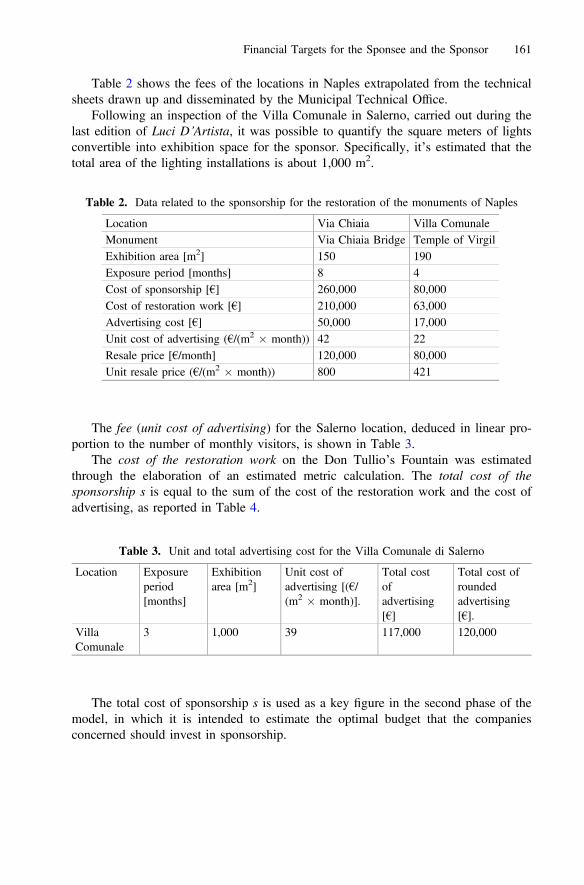
Table 2 shows the fees of the locations in Naples extrapolated from the technicalsheets drawn up and disseminated by the Municipal Technical Office.
Following an inspection of the Villa Comunale in Salerno, carried out during thelast edition of Luci D’Artista, it was possible to quantify the square meters of lightsconvertible into exhibition space for the sponsor. Specifically, it’s estimated that thetotal area of the lighting installations is about 1,000 m2.
The fee (unit cost of advertising) for the Salerno location, deduced in linear pro-portion to the number of monthly visitors, is shown in Table 3.
The cost of the restoration work on the Don Tullio’s Fountain was estimatedthrough the elaboration of an estimated metric calculation. The total cost of thesponsorship s is equal to the sum of the cost of the restoration work and the cost ofadvertising, as reported in Table 4.
The total cost of sponsorship s is used as a key figure in the second phase of themodel, in which it is intended to estimate the optimal budget that the companiesconcerned should invest in sponsorship.
Table 2. Data related to the sponsorship for the restoration of the monuments of Naples
Location Via Chiaia Villa ComunaleMonument Via Chiaia Bridge Temple of VirgilExhibition area [m2] 150 190Exposure period [months] 8 4Cost of sponsorship [€] 260,000 80,000Cost of restoration work [€] 210,000 63,000Advertising cost [€] 50,000 17,000Unit cost of advertising (€/(m2 � month)) 42 22Resale price [€/month] 120,000 80,000Unit resale price (€/(m2 � month)) 800 421
Table 3. Unit and total advertising cost for the Villa Comunale di Salerno
Location Exposureperiod[months]
Exhibitionarea [m2]
Unit cost ofadvertising [(€/(m2 � month)].
Total costofadvertising[€]
Total cost ofroundedadvertising[€].
VillaComunale
3 1,000 39 117,000 120,000
Financial Targets for the Sponsee and the Sponsor 161
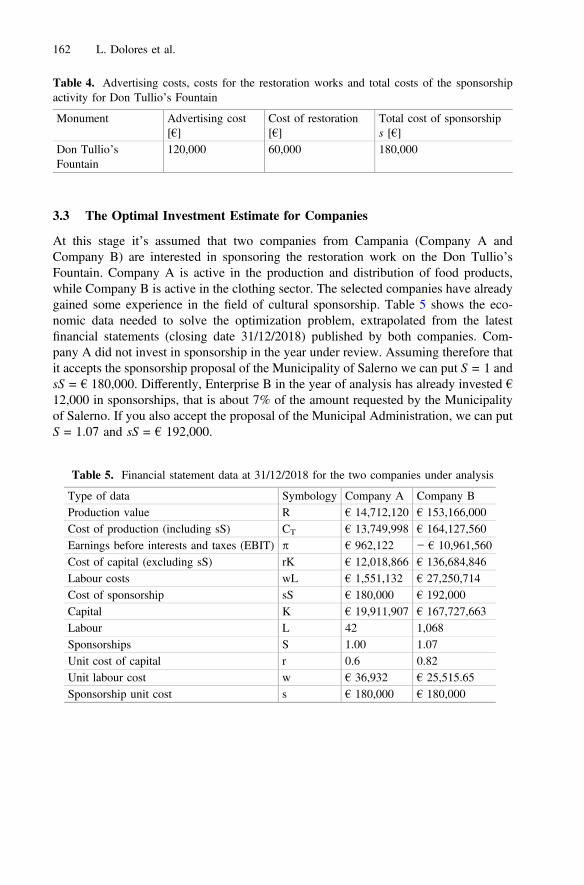
3.3 The Optimal Investment Estimate for Companies
At this stage it’s assumed that two companies from Campania (Company A andCompany B) are interested in sponsoring the restoration work on the Don Tullio’sFountain. Company A is active in the production and distribution of food products,while Company B is active in the clothing sector. The selected companies have alreadygained some experience in the field of cultural sponsorship. Table 5 shows the eco-nomic data needed to solve the optimization problem, extrapolated from the latestfinancial statements (closing date 31/12/2018) published by both companies. Com-pany A did not invest in sponsorship in the year under review. Assuming therefore thatit accepts the sponsorship proposal of the Municipality of Salerno we can put S = 1 andsS = € 180,000. Differently, Enterprise B in the year of analysis has already invested €12,000 in sponsorships, that is about 7% of the amount requested by the Municipalityof Salerno. If you also accept the proposal of the Municipal Administration, we can putS = 1.07 and sS = € 192,000.
Table 4. Advertising costs, costs for the restoration works and total costs of the sponsorshipactivity for Don Tullio’s Fountain
Monument Advertising cost[€]
Cost of restoration[€]
Total cost of sponsorships [€]
Don Tullio’sFountain
120,000 60,000 180,000
Table 5. Financial statement data at 31/12/2018 for the two companies under analysis
Type of data Symbology Company A Company BProduction value R € 14,712,120 € 153,166,000Cost of production (including sS) CT € 13,749,998 € 164,127,560Earnings before interests and taxes (EBIT) p € 962,122 − € 10,961,560Cost of capital (excluding sS) rK € 12,018,866 € 136,684,846Labour costs wL € 1,551,132 € 27,250,714Cost of sponsorship sS € 180,000 € 192,000Capital K € 19,911,907 € 167,727,663Labour L 42 1,068Sponsorships S 1.00 1.07Unit cost of capital r 0.6 0.82Unit labour cost w € 36,932 € 25,515.65Sponsorship unit cost s € 180,000 € 180,000
162 L. Dolores et al.
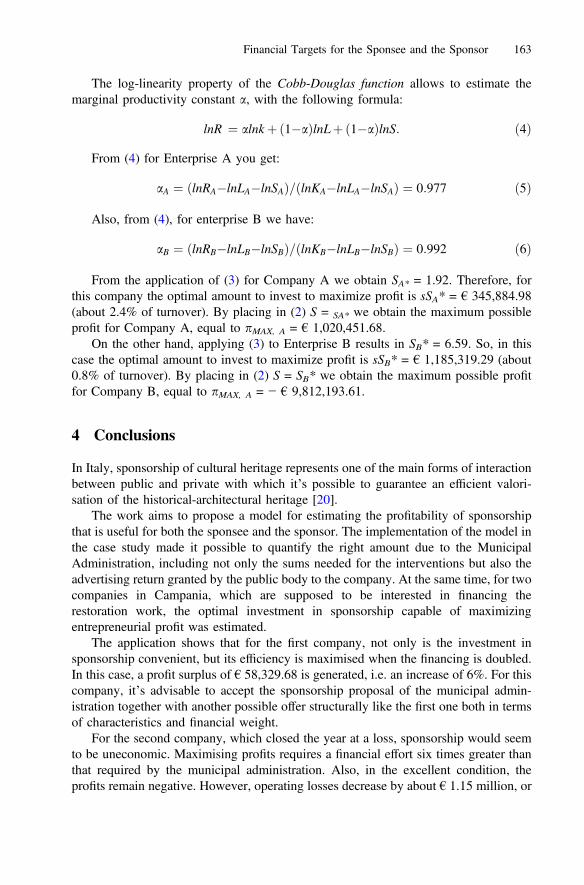
The log-linearity property of the Cobb-Douglas function allows to estimate themarginal productivity constant a, with the following formula:
lnR ¼ alnkþ 1�að ÞlnLþ 1�að ÞlnS: ð4Þ
From (4) for Enterprise A you get:
aA ¼ lnRA�lnLA�lnSAð Þ= lnKA�lnLA�lnSAð Þ ¼ 0:977 ð5Þ
Also, from (4), for enterprise B we have:
aB ¼ lnRB�lnLB�lnSBð Þ= lnKB�lnLB�lnSBð Þ ¼ 0:992 ð6Þ
From the application of (3) for Company A we obtain SA* = 1.92. Therefore, forthis company the optimal amount to invest to maximize profit is sSA* = € 345,884.98(about 2.4% of turnover). By placing in (2) S = SA* we obtain the maximum possibleprofit for Company A, equal to pMAX, A = € 1,020,451.68.
On the other hand, applying (3) to Enterprise B results in SB* = 6.59. So, in thiscase the optimal amount to invest to maximize profit is sSB* = € 1,185,319.29 (about0.8% of turnover). By placing in (2) S = SB* we obtain the maximum possible profitfor Company B, equal to pMAX, A = − € 9,812,193.61.
4 Conclusions
In Italy, sponsorship of cultural heritage represents one of the main forms of interactionbetween public and private with which it’s possible to guarantee an efficient valori-sation of the historical-architectural heritage [20].
The work aims to propose a model for estimating the profitability of sponsorshipthat is useful for both the sponsee and the sponsor. The implementation of the model inthe case study made it possible to quantify the right amount due to the MunicipalAdministration, including not only the sums needed for the interventions but also theadvertising return granted by the public body to the company. At the same time, for twocompanies in Campania, which are supposed to be interested in financing therestoration work, the optimal investment in sponsorship capable of maximizingentrepreneurial profit was estimated.
The application shows that for the first company, not only is the investment insponsorship convenient, but its efficiency is maximised when the financing is doubled.In this case, a profit surplus of € 58,329.68 is generated, i.e. an increase of 6%. For thiscompany, it’s advisable to accept the sponsorship proposal of the municipal admin-istration together with another possible offer structurally like the first one both in termsof characteristics and financial weight.
For the second company, which closed the year at a loss, sponsorship would seemto be uneconomic. Maximising profits requires a financial effort six times greater thanthat required by the municipal administration. Also, in the excellent condition, theprofits remain negative. However, operating losses decrease by about € 1.15 million, or
Financial Targets for the Sponsee and the Sponsor 163
almost 10%. It would, therefore, be interesting for this company to analyse the effectsof sponsorship in the long term (dynamic analysis), to see whether the investment madetoday contributes to a positive return in subsequent years.
The model analyses the profitability of sponsorship from both the sponsor and thesponsee’s point of view, allowing for the alignment of their objectives. However, it hasseveral limitations, due to the simplifying hypotheses adopted. To overcome them, infuture research, greater importance will be given to the other parameters that influencesponsorship fees and a more complex production function will be adopted.
References
1. Nesticò, A., Maselli, G.: Sustainability indicators for the economic evaluation of tourisminvestments on islands. J. Clean. Prod. 248, 119217 (2020). https://doi.org/10.1016/j.jclepro.2019.119217
2. Seravalli, G.: Innovazione e sviluppo locale - Concetti, esperienze, politiche. Economia EPolitica Industriale 1, 75–106 (2008)
3. Nesticò, A., De Mare, G., Fiore, P., Pipolo, O.: A model for the economic evaluation ofenergetic requalification projects in buildings. a real case application. In: Murgante, B., et al.(eds.) ICCSA 2014. LNCS, vol. 8580, pp. 563–578. Springer, Cham (2014). https://doi.org/10.1007/978-3-319-09129-7_41
4. Nesticò, A., Macchiaroli, M., Pipolo, O.: Historic buildings and energetic requalification amodel for the selection of technologically advanced interventions. In: Gervasi, O., et al.(eds.) ICCSA 2015. LNCS, vol. 9157, pp. 61–76. Springer, Cham (2015). https://doi.org/10.1007/978-3-319-21470-2_5
5. Nesticò, A., He, S., De Mare, G., Benintendi, R., Maselli, G.: The ALARP principle in thecost-benefit analysis for the acceptability of investment risk. Sustainability 10(12), 4668(2018). https://doi.org/10.3390/su10124668
6. De Mare, G., Nesticò, A., Macchiaroli, M.: Significant appraisal issues in value estimate ofquarries for the public expropriation [Questioni estimative di rilievo nella stima del valore dicave per l’espropriazione]. Valori e Valutazioni 18, 17–23 (2017). ISSN: 2036-2404
7. Macchiaroli, M., Pellecchia, V., D’Alpaos, C.: Urban water management in Italy: aninnovative model for the selection of water service infrastructures. WSEAS Trans. Environ.Develop. 15, 463–477 (2019). Print ISSN: 1790-5079. E-ISSN: 2224-3496. doi: a985115-071
8. Tocci, M.: Lineamenti sul contratto di sponsorizzazione dei beni culturali. FilodirittoEditore, Bologna (2015)
9. Dolores, L., Macchiaroli, M., De Mare, G.: A model for defining sponsorship fees in public-private bargaining for the rehabilitation of historical-architectural heritage. In: Calabrò, F.,Della Spina, L., Bevilacqua, C. (eds.) ISHT 2018. SIST, vol. 101, pp. 484–492. Springer,Cham (2019). https://doi.org/10.1007/978-3-319-92102-0_51
10. Di Mauro, F.: Le norme tecniche e linee guida applicative delle disposizioni in materia disponsorizzazioni di beni culturali: i tratti essenziali. Aedon, Rivista di arti e diritto online. IlMulino – Rivisteweb 3 (2012)
11. Rossi, F.: Sponsorizzazione sportiva e relazioni pubbliche: analisi di uno strumento dicomunicazione integrata. Nuove proposte per il mondo professionistico. Master’s degreeThesis, University of Padua, Department of linguistic, Padua, Italy (2016)
12. Pham, M.T.: The evaluation of sponsorship effectiveness: a model and some methodologicalconsiderations. Gestion 2000, 47–65 (1991)
164 L. Dolores et al.
13. Cornwell, T.B., Maignan, I.: An international review of sponsorship research. J. Advert. 27(1), 1–21 (1998)
14. Dolores, L., Macchiaroli, M., De Mare, G.: Sponsorship for the sustainability of historical-architectural heritage: application of a model’s original test finalized to maximize theprofitability of private investors. Sustainability 9(10), 1750 (2017). https://doi.org/10.3390/su9101750
15. Bucci, A., Castellani, M., Figini, P.: L’investimento in Sponsorizzazione delle Imprese:Un’analisi Economica in Termini Statici e Dinamici. Rivista di Politica Economica 93, 183–224 (2003)
16. Cobb, C.W., Douglas, P.H.: A theory of production. Am. Econ. Rev. 18, 139–165 (1928).https://www.jstor.org/stable/1811556
17. Romer, P.M.: Increasing returns and long run growth. J. Polit. Econ. 94(5), 1002–1037(1986)
18. Solow, R.M.: Lezioni sulla Teoria della Crescita Endogena. Carocci, Rome (1994)19. Ardeni, P.G.: Teorie della Crescita Endogena. Giappichelli, Torino (1995)20. Dolores, L., Macchiaroli, M., De Mare, G.: A dynamic model for the financial sustainability
of the restoration sponsorship. Sustainability 12(4), 1694 (2020). https://doi.org/10.3390/su12041694
Open Access This chapter is licensed under the terms of the Creative Commons Attribution 4.0International License (http://creativecommons.org/licenses/by/4.0/), which permits use, sharing,adaptation, distribution and reproduction in any medium or format, as long as you give appro-priate credit to the original author(s) and the source, provide a link to the Creative Commonslicense and indicate if changes were made.The images or other third party material in this chapter are included in the chapter's Creative
Commons license, unless indicated otherwise in a credit line to the material. If material is notincluded in the chapter's Creative Commons license and your intended use is not permitted bystatutory regulation or exceeds the permitted use, you will need to obtain permission directlyfrom the copyright holder.
Financial Targets for the Sponsee and the Sponsor 165
Reaching Sustainability in Healthcare:Strategies for a Healthy Indoor Air Quality
in Healing Environments
Marco Gola1(&), Gaetano Settimo2, and Stefano Capolongo1
1 Politecnico di Milano, 20133 Milan, [email protected]
2 Istituto Superiore di Sanità, 00161 Rome, Italy
Abstract. Indoor Air Quality (IAQ) is one of the main topics in which gov-ernments are focusing. In architectures for health, several researches arereporting a growing number of data analysis and research works in order toimprove users’ health. Although many studies have been conducted related tothe biological and physical risks, the chemical risks have been less investigatedand only in some specific functional areas of the hospitals.Starting from some systematic reviews and research works, the paper aims to
identify and list the best healthy practices for an adequate IAQ in inpatientwards. In particular, the handbook lists the solutions and strategies related tochemical pollution, starting from design and management, with a focus on(1) localization of hospitals and inpatient rooms, (2) hospital room, (3) micro-climatic parameters, (4) ventilation systems, (5) materials and finishing,(6) furniture and equipment, (7) cleaning products and activities, (8) mainte-nance and (9) management activities, and (10) users and specific training of theworkers.The multidisciplinary approach emphasizes the need for interdisciplinary
knowledge and skills aimed to find solutions able to protect users’ health status.The design and management decision-making, ranging from the adequatechoices of construction site and hospital exposure, finishing materials, cleaningand maintenance activities, etc., which can affect the IAQ must be carried outbased on scientific research and data analysis.
Keywords: Indoor Air Quality � Hospital settings � Design and managementstrategies
1 The Indoor Air Quality
1.1 Health Promotion in Confined Spaces
Although the Indoor Air Quality (IAQ) has been already argued at the end of Eightiesby Fanger [1], only recently it becomes a primary strategy to be considered. The topicneeds to be focused because of the increasing of exposed population due to lifestylesand the permanence in confined environments (about 90% of the day).
Even European Community underlines the priority of energy efficiency strategies,in the same time it recommends to reach healthier indoor environments and the
© The Author(s) 2020C. Bevilacqua et al. (Eds.): NMP 2020, SIST 177, pp. 166–177, 2020.https://doi.org/10.1007/978-3-030-52869-0_14
development of a specific European strategy on IAQ. Currently several EU countrieshave introduced in their legislations some actions relating to IAQ [2].
Since several years, critical factors due to the exposure to indoor air pollutants havebeen a matter of concern for EU legislators, and an increasing number of countries hasbeen addressing policies regarding health promotion strategies. EU has often high-lighted the importance to investigate IAQ, the relative impacts on health status andrecommendations regarding actions and monitoring activities.
Although the current criticisms, in several countries air quality monitoring arecarried out in specific professional workplaces in which chemicals are used, but also insome generic indoor spaces [3, 4].
1.2 The Environmental Quality of Healthcare Settings
The great importance of the issues connected with IAQ in the hospital settings, and allthe other similar facilities, accredited or not by the National Health System (NHS), hasurged several research and institutional bodies to investigate the topic and find solutionsand strategies for healthy environments (especially in relation to the evaluation of theconcentration levels in indoor air of the main chemical and biological pollutants) [5].
In such facilities with high managerial, technological and functional complexity,where the several functional units are designed with specific standards and needs(inpatient and outpatient areas, public ones, rehabilitation, etc.), where are carried outassistance and medical activities, diagnostics, training and research activities, etc., theyare characterized by the presence of indoor air of chemical and biological componentsthat can affect the health status of users [4–6].
In these healing spaces in which hospital staff interacts for various operationalneeds, but also users, specific preventive interventions are required, considering that theexposure of key-actors (from the daily users to the hospital staff), whose roles,knowledge and backgrounds, motivations and individual relationships have changed,becoming increasingly an active component to collaborate for improving the quality ofthe environments, medical services, takes on particular significance and importance,both for the vulnerabilities of the subjects and for the time spent in indoors [7–11].
In the specific case of the activities carried out, it is essential to consider therelationships between the behaviors and activities of the healthcare staff, and all theother users who live and work the healing spaces (outpatients, visitors, externalworkers for cleaning and maintenance activities, etc.) with their activities and behaviors[8, 12]. They are also affected by the quality of the building and daily relationships withthe correct application of the organizational and management procedures of medicalprocesses.
The use of technological and ventilation systems designed to perform and satisfythe various tasks in the best technical and economic conditions, the furnishings, thelevel of use, the ordinary and extraordinary cleaning and sanitization activities,maintenance, procedures and organic management of the regular prevention activitiesimplemented and shared within the structures, etc. are all factors that affect significantlyon IAQ and on the state of health and satisfaction of users [12, 13].
For this reason, these aspects are increasingly steps of the quality of services,therapies, healthcare services, activities and training program continuously provided,
Reaching Sustainability in Healthcare 167
contributing to obtaining an effective and adequate quality of the indoor air thatresponds to the main references elaborated by the World Health Organization(WHO) [14], and which constitute a concrete contribution on a global scale. The WHOactivities on air quality have boosted the legislative activities already in place in variousEuropean countries that set the maximum concentrations allowed in the indoor air ofindividual pollutants [2, 14].
2 Risks Correlated to Healing Spaces
2.1 Health Promotion in Confined Spaces
Indoor pollution is defined as “[…] the presence of physical, chemical and biologicalcontaminants in confined spaces’ air does not present in outdoor air of high qualityecological systems” [15].
Indoor air pollution is a public health issue. It is related to many of the majorchronic diseases, related to respiratory, mucous membranes, skin, nervous and immunesystems, such as asthma, fever by humidifiers, allergic alveolitis, legionellosis, etc. Inaddition to these well-known diseases, several symptoms, very frequently, character-ized by neurosensory effects that determine discomfort, decreased wellness of occu-pants and negative perception of IAQ, may manifest. All the pathologies and diseasesare caused by IAQ that affect mainly vulnerable population, in particular elderly,children and those who already suffer for chronic diseases [16].
As WHO highlights, the well-known concepts related to air quality are [17, 18]:
• people spend 90% of their time in confined spaces (working and living places,transports, etc.);
• indoor air is much more polluted than the outdoor, because additional factors relatedto the indoor space affect air;
• it is estimated that 50% of diseases are caused by an inadequate IAQ.
In average, an adult inhales and exhales about 8 L of air per minute, at rest.Therefore, in a day, totally, he breathes about 11 thousand liters of air [19]. Unhealthyair quality can cause several health effects [20].
In general, healing environments must be aimed to users’ well-being but, para-doxically, sometimes they become unhealthy. The main factors of air pollution inhealthcare facilities are substances used for therapeutic and diagnostic aims, mainte-nance and cleaning products, disinfectants, ventilation and air conditioning manage-ment, heating systems, building materials, furniture and finishing, equipment, etc. [5].In addition, also the outdoor greatly affects the indoor air, because it is the sum of theoutdoor one with the influence of internal factors [4, 12].
Starting from the merging of all these factors, the outcomes cannot be consideredacceptable and consequently poor ventilation and inadequate air exchange can causeinadequate conditions. Indoor air in buildings is affected by outdoor and, therefore, byfactories in the neighbourhood, road traffic, parking lots, warehouses of irritatingsubstances or waste, construction sites or any other source of air pollution itself [12].
168 M. Gola et al.

Therefore, to guarantee safety and air quality, it should be considered carefully thelocation of the outer air intakes for ventilation systems and their filters [19, 21].
The presence of contaminants within healthcare environments influences the IAQcompromising wellbeing and safety conditions that must be fundamentals in an ade-quate hospital complex [22].
Indoor pollutants concentration is inconstant during the time; it is related to the yearof construction of the building, its dimensional aspects, the typology of the sources,such as the activities carried out by users, ventilation systems, procedures, cleaning andmaintenance activities, etc. [6]. Indoor air, often characterized by a mixture of com-pounds very variable from outdoor one, can present concentration values of pollutantshigher than those external environments and, sometimes, some indoor pollutants arenot related to outdoor [4].
Italy lacks of legislations and norms about physical, biological, and chemicalpollution of air in functional units. Currently the Legislative Decree No. 81 (2008) isused as a reference document, even if it states guidelines about workplaces [2, 5].
The healthcare facility, as a public infrastructure that hosts many and several userswith different health conditions, cultures and origins, is the architecture with the highestnumber of risk factors and air pollutions [10]. Moreover, to traditional outdoor sourcesof pollution, occupants and building factors, it is important to add those relating totherapeutic and medical activities and products.
Since sources of chemical, biological and physical pollutants are several and manycontaminants and pollutants can influence air quality in healing environments, it isfundamental to guarantee an adequate air-change through proper design of ventilationsystems, that must also ensure to filter and enter the best outdoor air, minimizingpollution related to products and activities, materials and diluting the pollutant con-centration and drain them [8].
2.2 Factors that Affect the IAQ in the Environmental Units
From the chemical pollution’s point of view, hospital planners, managers and hospitalstaff therefore have the strategic role on defining strategies for maximum infectioncontrol. In case of design mistakes, it becomes strategic to ensure proper managementof the facilities, in particular with the HVAC system with constant air change, choosingfurniture and building material with low volatile organic compounds (VOCs) emissions[18], regular and conscious maintenance, medical activities and cleaning procedures(avoiding the use of sprays and other cleaning materials that generate VOCs, etc.) thattake place inside the healing spaces [12].
Starting from these considerations, a research group gave rise to a monitoringactivity of air quality in inpatient rooms, focusing on chemical pollution for under-standing the current values and room features, maintenance activities and medicalprocedures [23]. For supporting the research project, the authors have done a sys-tematic review on the current State of the Art and knowledge related to chemicalpollution in healing spaces and the emerging strategies, supported by scientific data, forhealthy inpatient rooms and their indoor air. The focus of the investigation is strictlyrelated to inpatient wards.
Reaching Sustainability in Healthcare 169
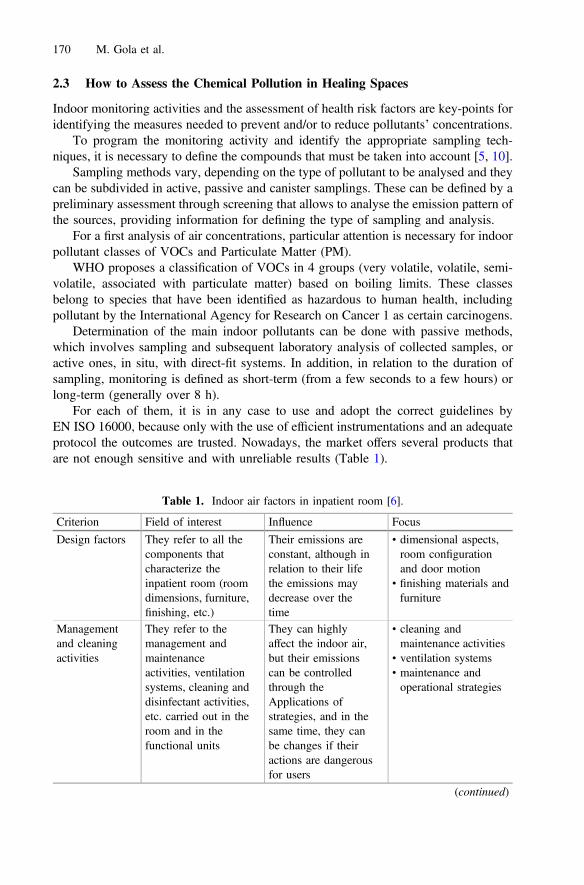
2.3 How to Assess the Chemical Pollution in Healing Spaces
Indoor monitoring activities and the assessment of health risk factors are key-points foridentifying the measures needed to prevent and/or to reduce pollutants’ concentrations.
To program the monitoring activity and identify the appropriate sampling tech-niques, it is necessary to define the compounds that must be taken into account [5, 10].
Sampling methods vary, depending on the type of pollutant to be analysed and theycan be subdivided in active, passive and canister samplings. These can be defined by apreliminary assessment through screening that allows to analyse the emission pattern ofthe sources, providing information for defining the type of sampling and analysis.
For a first analysis of air concentrations, particular attention is necessary for indoorpollutant classes of VOCs and Particulate Matter (PM).
WHO proposes a classification of VOCs in 4 groups (very volatile, volatile, semi-volatile, associated with particulate matter) based on boiling limits. These classesbelong to species that have been identified as hazardous to human health, includingpollutant by the International Agency for Research on Cancer 1 as certain carcinogens.
Determination of the main indoor pollutants can be done with passive methods,which involves sampling and subsequent laboratory analysis of collected samples, oractive ones, in situ, with direct-fit systems. In addition, in relation to the duration ofsampling, monitoring is defined as short-term (from a few seconds to a few hours) orlong-term (generally over 8 h).
For each of them, it is in any case to use and adopt the correct guidelines byEN ISO 16000, because only with the use of efficient instrumentations and an adequateprotocol the outcomes are trusted. Nowadays, the market offers several products thatare not enough sensitive and with unreliable results (Table 1).
Table 1. Indoor air factors in inpatient room [6].
Criterion Field of interest Influence Focus
Design factors They refer to all thecomponents thatcharacterize theinpatient room (roomdimensions, furniture,finishing, etc.)
Their emissions areconstant, although inrelation to their lifethe emissions maydecrease over thetime
• dimensional aspects,room configurationand door motion
• finishing materials andfurniture
Managementand cleaningactivities
They refer to themanagement andmaintenanceactivities, ventilationsystems, cleaning anddisinfectant activities,etc. carried out in theroom and in thefunctional units
They can highlyaffect the indoor air,but their emissionscan be controlledthrough theApplications ofstrategies, and in thesame time, they canbe changes if theiractions are dangerousfor users
• cleaning andmaintenance activities
• ventilation systems• maintenance andoperational strategies
(continued)
170 M. Gola et al.
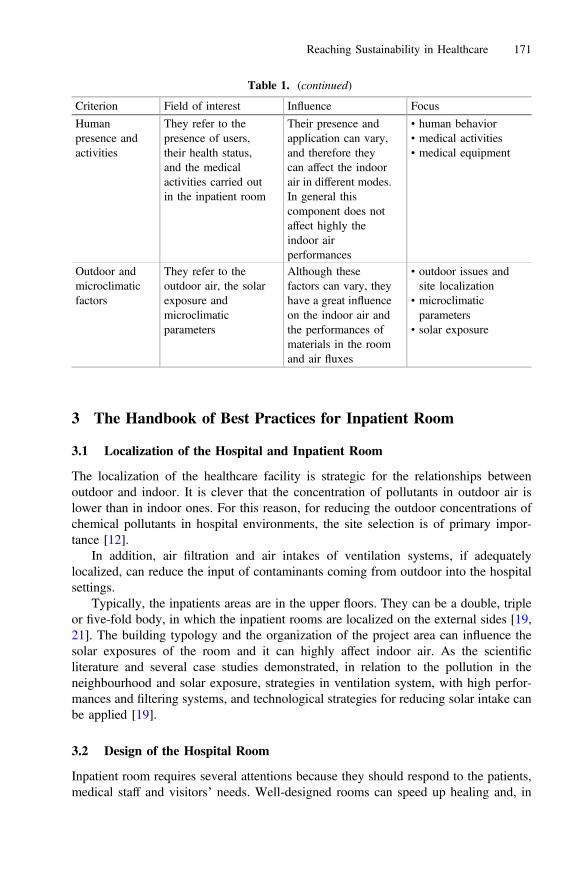
3 The Handbook of Best Practices for Inpatient Room
3.1 Localization of the Hospital and Inpatient Room
The localization of the healthcare facility is strategic for the relationships betweenoutdoor and indoor. It is clever that the concentration of pollutants in outdoor air islower than in indoor ones. For this reason, for reducing the outdoor concentrations ofchemical pollutants in hospital environments, the site selection is of primary impor-tance [12].
In addition, air filtration and air intakes of ventilation systems, if adequatelylocalized, can reduce the input of contaminants coming from outdoor into the hospitalsettings.
Typically, the inpatients areas are in the upper floors. They can be a double, tripleor five-fold body, in which the inpatient rooms are localized on the external sides [19,21]. The building typology and the organization of the project area can influence thesolar exposures of the room and it can highly affect indoor air. As the scientificliterature and several case studies demonstrated, in relation to the pollution in theneighbourhood and solar exposure, strategies in ventilation system, with high perfor-mances and filtering systems, and technological strategies for reducing solar intake canbe applied [19].
3.2 Design of the Hospital Room
Inpatient room requires several attentions because they should respond to the patients,medical staff and visitors’ needs. Well-designed rooms can speed up healing and, in
Table 1. (continued)
Criterion Field of interest Influence Focus
Humanpresence andactivities
They refer to thepresence of users,their health status,and the medicalactivities carried outin the inpatient room
Their presence andapplication can vary,and therefore theycan affect the indoorair in different modes.In general thiscomponent does notaffect highly theindoor airperformances
• human behavior• medical activities• medical equipment
Outdoor andmicroclimaticfactors
They refer to theoutdoor air, the solarexposure andmicroclimaticparameters
Although thesefactors can vary, theyhave a great influenceon the indoor air andthe performances ofmaterials in the roomand air fluxes
• outdoor issues andsite localization
• microclimaticparameters
• solar exposure
Reaching Sustainability in Healthcare 171
addition, decrease the rate of errors in the process [22, 24]. As the scientific literature andseveral simulations evidenced, there is not any specific dimension of the double andsingle rooms. It is strongly affected by several variable defined by ventilation systems,human density, window openings, etc. and the layouts’ design of the project [6].
For a good IAQ in rooms, it is necessary to pre-assess the possible factors thatinfluence the performances and impacts related to selected furniture, finishing mate-rials, microclimatic parameters, ventilation system, room’s volume, and medicalactivities. The door and window openings can highly affect the performances of thehealing unit [12].
3.3 Microclimatic Parameters
Microclimatic parameters (CO2, temperature, relative humidity and air velocity) have agreat influence in indoor air. As the scientific literature evidenced, the increase ofmicroclimatic parameters can affect the performances of workers and patients, finishingmaterials and furniture, as well as the chemical emissions of cleaning products.
An adequate microclimatic parameters, supported by the window opening andefficient ventilation system, can guarantee good performances in IAQ and users’comfort [1].
3.4 Ventilation Systems
In inpatient areas, the influence of medical activities, high temperature for patient well-being, users’ health status and behavior, etc. can affect IAQ performances. It is nec-essary an adequate ventilation system to control indoor pollutants through theirremoval by dilution, air purification and filtration [21]. As the scientific literatureevidenced, insufficient ventilation and filtration contribute to poor IAQ for outdoorcontaminants in the building, recirculation of indoor pollutants and dirt build-up in airhandling systems [19, 21]. In general, ventilation systems should be designed specif-ically for the activities to be carried out, managed and well-filtered for guaranteeing thebetter performances during its functioning [19].
3.5 Construction and Finishing Materials
In order to minimize the sources of pollution, it is necessary to identify and defineadequate materials that respond to the medical and hygiene requirements. Hospitalplanners should also consider that environmental conditions of the space can affect therelease of pollutants, such as high-temperature or humidity that can increase materialemissions, solar exposure, etc. [6, 25].
For achieving healthier environments, as some researchers have highlighted, it isnecessary an adequate materials’ selection with low VOC emissions, as less porousas possible for supporting the performances of cleaning activities and easy main-tenance [25].
In general, finishing and furniture must comply with international certifications, andduring and after their installation, they need of an adequate ventilation for diluting theiremissions, for several days (at least 72 h) [12].
172 M. Gola et al.
3.6 Furniture and Equipment
In order to reduce the sources of pollution, it is important to select furniture andequipment that respond to hygiene requirements and medical activities to be carriedout. As the scientific literature evidenced, it is necessary an adequate selection offurniture with low or zero VOC emissions, as less porous as possible to facilitate easymaintenance and cleaning procedures. Furniture should be placed in indoor environ-ments after the site construction have been completed [12]. Furniture must comply withinternational certifications, and during and after their installation, they need of anadequate ventilation for diluting their emissions, for several days (at least 72 h) [25]. Inorder to avoid the emission of contaminants due to deterioration, finishing materialsand furnishings must be periodically checked and maintained for ensuring thatequipment and furnishings are placed in positions where they do not interfere withairflows [12].
3.7 Cleaning Products and Procedures
A clean space is an essential requirement for an adequate IAQ. However, inadequatedetergents and/or cleaning procedures may cause adverse effects on air performances.Proper ventilation must be ensured during and immediately after cleaning procedures.Several studies suggest window opening for 10–15 min, in the absence of users [5].
Cleaning activity should be defined through specific protocols, and medical andnon-medical staff should be trained on risks. It is recommended the selection ofminimum emission cleaning products, adequate for the surfaces to be treated [6, 12].
3.8 Maintenance Activities
It is fundamental that hospitals, as well as well-designed and built to ensure adequateIAQ, must be regularly maintained in all its components, for high performances [6, 26].
As several researchers highlight, a regular and constant maintenance and man-agement program can facilitate the coordination of the necessary activities to be carriedout.
Therefore periodic and regular inspections and investigations in hospital settings andchecks of the quality and efficiency, identification of potential air pollution by main-tenance activities, analysis of datasheet of cleaning products, construction materials,furnishings, and medical equipment with low VOC emissions should be verified [12].
3.9 Management Activities
It is fundamental that hospitals, as well as well-designed and built to ensure adequateIAQ, must be well managed, for ensuring all the accurate work of hospital plannerswould not be productive, and to be health promoter [8]. An adequate IAQ managementprogram can facilitate the coordination of the necessary activities to identify, correct,and prevent IAQ issues and to overcome critical factors with design and managementstrategies [8, 12]. Regular monitoring activities permits to the healthcare organizationto know the performances of the healthcare facility. In addition, air samplings and the
Reaching Sustainability in Healthcare 173
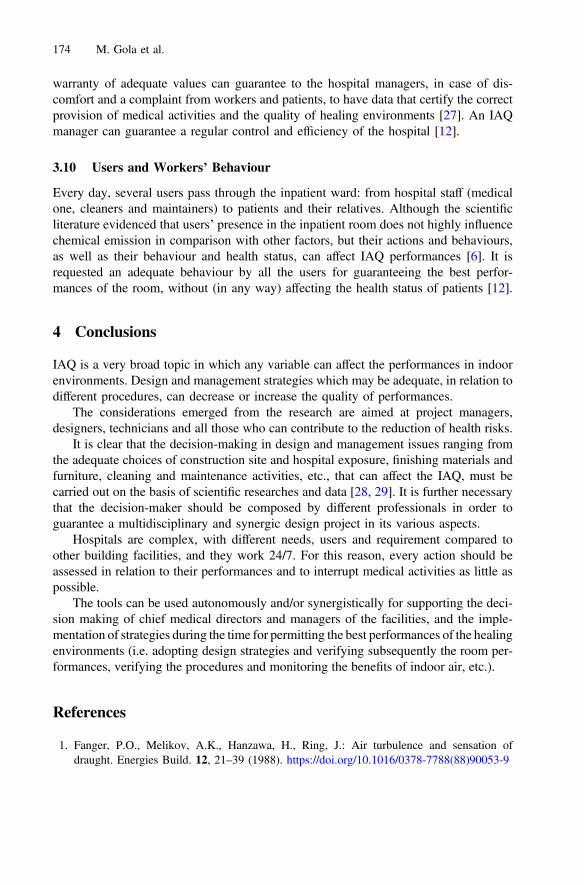
warranty of adequate values can guarantee to the hospital managers, in case of dis-comfort and a complaint from workers and patients, to have data that certify the correctprovision of medical activities and the quality of healing environments [27]. An IAQmanager can guarantee a regular control and efficiency of the hospital [12].
3.10 Users and Workers’ Behaviour
Every day, several users pass through the inpatient ward: from hospital staff (medicalone, cleaners and maintainers) to patients and their relatives. Although the scientificliterature evidenced that users’ presence in the inpatient room does not highly influencechemical emission in comparison with other factors, but their actions and behaviours,as well as their behaviour and health status, can affect IAQ performances [6]. It isrequested an adequate behaviour by all the users for guaranteeing the best perfor-mances of the room, without (in any way) affecting the health status of patients [12].
4 Conclusions
IAQ is a very broad topic in which any variable can affect the performances in indoorenvironments. Design and management strategies which may be adequate, in relation todifferent procedures, can decrease or increase the quality of performances.
The considerations emerged from the research are aimed at project managers,designers, technicians and all those who can contribute to the reduction of health risks.
It is clear that the decision-making in design and management issues ranging fromthe adequate choices of construction site and hospital exposure, finishing materials andfurniture, cleaning and maintenance activities, etc., that can affect the IAQ, must becarried out on the basis of scientific researches and data [28, 29]. It is further necessarythat the decision-maker should be composed by different professionals in order toguarantee a multidisciplinary and synergic design project in its various aspects.
Hospitals are complex, with different needs, users and requirement compared toother building facilities, and they work 24/7. For this reason, every action should beassessed in relation to their performances and to interrupt medical activities as little aspossible.
The tools can be used autonomously and/or synergistically for supporting the deci-sion making of chief medical directors and managers of the facilities, and the imple-mentation of strategies during the time for permitting the best performances of the healingenvironments (i.e. adopting design strategies and verifying subsequently the room per-formances, verifying the procedures and monitoring the benefits of indoor air, etc.).
References
1. Fanger, P.O., Melikov, A.K., Hanzawa, H., Ring, J.: Air turbulence and sensation ofdraught. Energies Build. 12, 21–39 (1988). https://doi.org/10.1016/0378-7788(88)90053-9
174 M. Gola et al.

2. Settimo, G.: Existing guidelines for indoor air quality: the case study of hospitalenvironments. In: Capolongo, S., Settimo, G., Gola, M. (eds.) Indoor Air Quality inHealthcare Facilities. SPH, pp. 13–26. Springer, Cham (2017). https://doi.org/10.1007/978-3-319-49160-8_2
3. D’Amico, A., Fara, G.M.: The need to develop a multidisciplinary expertise for themicrobiological safety of operating theatres. Ann. Ig. 28(6), 379–380 (2016). https://doi.org/10.7416/ai.2016.2119
4. Gola, M., Settimo, G., Capolongo, S.: Indoor air in healing environments: Monitoringchemical pollution in inpatient rooms. Facilities 37(9/10), 600–623 (2019). https://doi.org/10.1108/F-01-2018-0008
5. Settimo, G., Bonadonna, L., Gherardi, M., di Gregorio, F., Cecinato, A., et al. (eds.): Qualitàdell’aria negli ambienti sanitari: strategie di monitoraggio degli inquinanti chimici ebiologici. Rapporti ISTISAN 19/17. Istituto Superiore di Sanità, Rome (2019). IstitutoSuperiore di Sanità. http://old.iss.it/binary/publ/cont/19_17_web.pdf. Accessed 29 Jan 2020
6. Gola, M., Settimo, G., Capolongo, S.: Indoor air quality in inpatient environments: asystematic review on factors that influence chemical pollution in inpatient wards. J. Healthc.Eng. 2019, 8358306 (2019). https://doi.org/10.1155/2019/8358306
7. Smith, D., Alverdy, J., An, G., Coleman, M., Garcia-Houchins, S., Green, J., et al.: Thehospital microbiome project: meeting report for the 1st hospital microbiome projectworkshop on sampling design and building science measurements. Stan. Genomic Sci. 8,112–117 (2013). https://doi.org/10.4056/sigs.3717348
8. Leung, M., Chan, A.H.S.: Control and management of hospital indoor air quality. Med. Sci.Monit. 12, SR17–SR23 (2006)
9. Harvey Jr., T.E., Pati, D.: Keeping watch. Design features to aid patient and staff visibility.Health Facil. Manag. 25(6), 27–31 (2012)
10. Śmiełowska, M., Marć, M., Zabiegała, B.: Indoor air quality in public utility environments—a review. Environ. Sci. Pollut. Res. 24(12), 11166–11176 (2017). https://doi.org/10.1007/s11356-017-8567-7
11. ISIAQ (International Society of Indoor Air Quality and Climate): Review on indoor airquality in hospitals and other health care facilities, vol. 43. International Society of IndoorAir Quality and Climate, Philadelphia (2003)
12. Gola, M., Settimo, G., Capolongo, S.: Chemical pollution in healing spaces: the decalogue ofthe best practices for adequate indoor air quality in inpatient rooms. Int. J. Environ. Res.Public Health 16(22), 4388 (2017). https://doi.org/10.3390/ijerph16224388
13. de Oliveira, A.C., Damasceno, Q.S.: Surfaces of the hospital environment as possibledeposits of resistant bacteria: a review. Rev. Esc. Enferm. USP 44(4), 1112–1117 (2010).https://doi.org/10.1590/S0080-62342010000400038
14. Bonadonna, L., de Grazia, M.C., Capolongo, S., Casini, B., Cristina, M.L., et al.: Watersafety in healthcare facilities. The Vieste Charter. Ann. Ig. 29(2), 92–100 (2017). https://doi.org/10.7416/ai.2017.2136
15. Ministero dell’Ambiente: Relazione della Commissione nazionale per l’inquinamento degliambienti confinati. Ministero dell’Ambiente, Rome (1991)
16. Gianfredi, V., Grisci, C., Nucci, D., Parisi, V., Moretti, M.: Communication in health.Recenti Prog. Med. 109(7–8), 374–383 (2018). https://doi.org/10.1701/2955.29706
17. D’Alessandro, D., Tedesco, P., Rebecchi, A., Capolongo, S.: Water use and water saving inItalian hospitals. A preliminary investigation. Ann Ist Super Sanità 52(1), 56–62 (2016).https://doi.org/10.4415/ANN_16_01_11
18. WHO: Guidelines for Indoor Air Quality: Selected Pollutants. WHO, Copenhagen (2010)
Reaching Sustainability in Healthcare 175

19. Moscato, U., Borghini, A., Teleman, A.A.: HVAC management in health facilities. In:Capolongo, S., Settimo, G., Gola, M. (eds.) Indoor Air Quality in Healthcare Facilities. SPH,pp. 95–106. Springer, Cham (2017). https://doi.org/10.1007/978-3-319-49160-8_9
20. Campanella, P., Azzolini, E., Izzi, A., Pelone, F., De Meo, C., La Milia, D., Specchia, M.,Ricciardi, W.: Hospital efficiency: How to spend less maintaining quality? Annalidell’Istituto Superiore di Sanita 53(1), 46–53 (2017). https://doi.org/10.4415/ANN_17_01_10
21. Joppolo, C.M., Romano, F.: HVAC system design in healthcare facilities and control ofaerosol contaminants: issues, tools, and experiments. In: Capolongo, S., Settimo, G., Gola,M. (eds.) Indoor Air Quality in Healthcare Facilities. SPH, pp. 83–94. Springer, Cham(2017). https://doi.org/10.1007/978-3-319-49160-8_8
22. Brambilla, A., Capolongo, S.: Healthy and sustainable hospital evaluation-A review of POEtools for hospital assessment in an evidence-based design framework. Buildings 9(4), 76(2019). https://doi.org/10.3390/buildings9040076
23. Settimo, G., Gola, M., Mannoni, V., De Felice, M., Padula, G., Mele, A., Tolino, B.,Capolongo, S.: Assessment of indoor air quality in inpatient wards. In: Capolongo, S.,Settimo, G., Gola, M. (eds.) Indoor Air Quality in Healthcare Facilities. SPH, pp. 107–118.Springer, Cham (2017). https://doi.org/10.1007/978-3-319-49160-8_10
24. Brambilla, A., Buffoli, M., Capolongo, S.: Measuring hospital qualities. A preliminaryinvestigation on Health Impact Assessment possibilities for evaluating complex buildings.Acta bio-medica: Atenei Parmensis 90(9S), 54–63 (2019). https://doi.org/10.23750/abm.v90i9-S.8713
25. Gray, W.A., Vittori, G., Guenther, R., Vernon, W., Dilwali, K.: Leading the way: innovativesustainable design guidelines for operating healthy healthcare buildings. In: Proceedings ofthe ISIAQ–10th International Conference on Healthy Buildings, Curran Associates, RedHook, pp. 1212–1217 (2012)
26. Pati, D., Park, C.-S., Augenbroe, G.: Facility maintenance performance perspective to targetstrategic organizational objectives. J. Perform. Constr. Facil. 24(2), 180–187 (2010). https://doi.org/10.1061/(ASCE)CF.1943-5509.0000070
27. Gola, M., Mele, A., Tolino, B., Capolongo, S.: Applications of IAQ monitoring ininternational healthcare systems. In: Capolongo, S., Settimo, G., Gola, M. (eds.) Indoor AirQuality in Healthcare Facilities. SPH, pp. 27–39. Springer, Cham (2017). https://doi.org/10.1007/978-3-319-49160-8_3
28. Gola, M., Signorelli, C., Buffoli, M., Rebecchi, A., Capolongo, S.: Local health rules andbuilding regulations: a survey on local hygiene and building regulations in italianmuniciples. Ann. Istituto Superiore di Sanità 53(3), 223–230 (2017). https://doi.org/10.4415/ANN_17_03_08
29. Sotgiu, G., Aliberti, S., Piana, A.: Nosocomial transmission of carbapenem-resistantKlebsiella pneumoniae in an Italian university hospital: a molecular epidemiological study.J. Hosp. Infect. 99(4), 413–418 (2018). https://doi.org/10.1016/j.jhin.2018.03.033
176 M. Gola et al.

Open Access This chapter is licensed under the terms of the Creative Commons Attribution 4.0International License (http://creativecommons.org/licenses/by/4.0/), which permits use, sharing,adaptation, distribution and reproduction in any medium or format, as long as you give appro-priate credit to the original author(s) and the source, provide a link to the Creative Commonslicense and indicate if changes were made.The images or other third party material in this chapter are included in the chapter’s Creative
Commons license, unless indicated otherwise in a credit line to the material. If material is notincluded in the chapter’s Creative Commons license and your intended use is not permitted bystatutory regulation or exceeds the permitted use, you will need to obtain permission directlyfrom the copyright holder.
Reaching Sustainability in Healthcare 177

Built Environment and Alzheimer. QualityEvaluation of Territorial Structures
for Patients with Dementia
Andrea Brambilla1(&) , Roberto Maino2, Silvia Mangili2,and Stefano Capolongo1
1 Department ABC Architecture Built Environment Construction Engineering,Cluster Design of Health Facilities, Design & Health Lab, Politecnico di Milano,
via Ponzio 31, 20133 Milan, [email protected]
2 School of Architecture Urban Planning Construction Engineering,Politecnico di Milano, Milan, Italy
Abstract. Sustainable, inclusive and resilient cities and urban settlements arefundamental in enabling people to live long and healthy lives. Elderly popula-tion is growing all over the world and in Italy is among the largest. Within thisscenario, epidemiological data show that Alzheimer disease, a dementia whichmanifest with ageing, is also forecast to rapidly increase, up to 150 million casesin 2050. Within urban settlements, the health and socio-sanitary structures forelderly patients represent a fundamental social infrastructure that collectsimportant investments but must be suitable to host people with dementia. Thepaper describes the methodology adopted for the definition of an assessment toolable to evaluate the indoor and outdoor qualities and characteristics of socio-sanitary facilities for Alzheimer and elderly people. In the first phase the analysisof scientific literature, international case studies and sustainability assessmentframework led to identification of 4 criteria, 19 indicators and 71 variablesvalidated by experts in geriatry, psychiatry and architecture. In the second phasethe tool has been operationalized and tested on a sample of three territorialstructures in Lombardy Region, Italy. The outcomes of the evaluation can leadto the definition of sustainable project strategies.
Keywords: Ageing society � Dementia � Evaluation tool
1 Introduction and Research Purpose
Sustainable, inclusive and resilient cities and urban settlements are fundamental inenabling people to live longer and in a good state of health. Today, a significant shareof the world’s population is composed by elderly people. Therefore, fostering Sus-tainable Development Goals in terms of Sustainable Cities and Communities (SDGsNo. 11) require specific actions toward ageing population needs [1]. Within this sce-nario, healthcare and socio-sanitary facilities represent a social infrastructure of greatimportance in a country like Italy in which the elderly population is among the largestin the world, with an increasing life expectancy, from 78.1 years old for men and 83.7
© The Author(s) 2020C. Bevilacqua et al. (Eds.): NMP 2020, SIST 177, pp. 178–186, 2020.https://doi.org/10.1007/978-3-030-52869-0_15
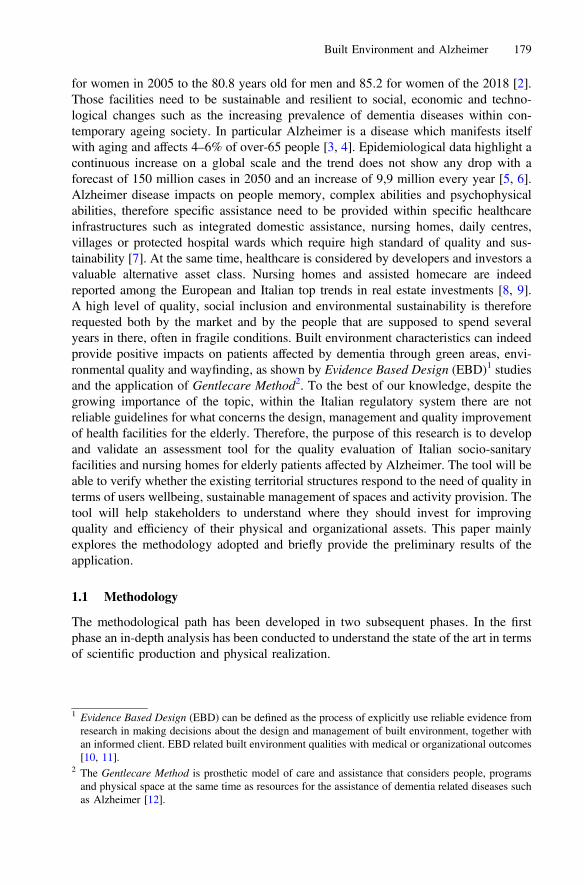
for women in 2005 to the 80.8 years old for men and 85.2 for women of the 2018 [2].Those facilities need to be sustainable and resilient to social, economic and techno-logical changes such as the increasing prevalence of dementia diseases within con-temporary ageing society. In particular Alzheimer is a disease which manifests itselfwith aging and affects 4–6% of over-65 people [3, 4]. Epidemiological data highlight acontinuous increase on a global scale and the trend does not show any drop with aforecast of 150 million cases in 2050 and an increase of 9,9 million every year [5, 6].Alzheimer disease impacts on people memory, complex abilities and psychophysicalabilities, therefore specific assistance need to be provided within specific healthcareinfrastructures such as integrated domestic assistance, nursing homes, daily centres,villages or protected hospital wards which require high standard of quality and sus-tainability [7]. At the same time, healthcare is considered by developers and investors avaluable alternative asset class. Nursing homes and assisted homecare are indeedreported among the European and Italian top trends in real estate investments [8, 9].A high level of quality, social inclusion and environmental sustainability is thereforerequested both by the market and by the people that are supposed to spend severalyears in there, often in fragile conditions. Built environment characteristics can indeedprovide positive impacts on patients affected by dementia through green areas, envi-ronmental quality and wayfinding, as shown by Evidence Based Design (EBD)1 studiesand the application of Gentlecare Method2. To the best of our knowledge, despite thegrowing importance of the topic, within the Italian regulatory system there are notreliable guidelines for what concerns the design, management and quality improvementof health facilities for the elderly. Therefore, the purpose of this research is to developand validate an assessment tool for the quality evaluation of Italian socio-sanitaryfacilities and nursing homes for elderly patients affected by Alzheimer. The tool will beable to verify whether the existing territorial structures respond to the need of quality interms of users wellbeing, sustainable management of spaces and activity provision. Thetool will help stakeholders to understand where they should invest for improvingquality and efficiency of their physical and organizational assets. This paper mainlyexplores the methodology adopted and briefly provide the preliminary results of theapplication.
1.1 Methodology
The methodological path has been developed in two subsequent phases. In the firstphase an in-depth analysis has been conducted to understand the state of the art in termsof scientific production and physical realization.
1 Evidence Based Design (EBD) can be defined as the process of explicitly use reliable evidence fromresearch in making decisions about the design and management of built environment, together withan informed client. EBD related built environment qualities with medical or organizational outcomes[10, 11].
2 The Gentlecare Method is prosthetic model of care and assistance that considers people, programsand physical space at the same time as resources for the assistance of dementia related diseases suchas Alzheimer [12].
Built Environment and Alzheimer 179
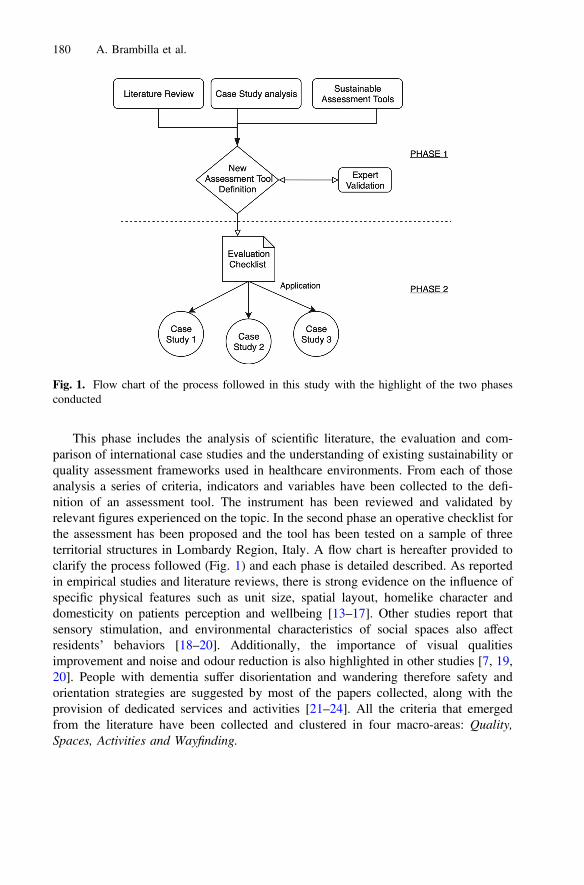
This phase includes the analysis of scientific literature, the evaluation and com-parison of international case studies and the understanding of existing sustainability orquality assessment frameworks used in healthcare environments. From each of thoseanalysis a series of criteria, indicators and variables have been collected to the defi-nition of an assessment tool. The instrument has been reviewed and validated byrelevant figures experienced on the topic. In the second phase an operative checklist forthe assessment has been proposed and the tool has been tested on a sample of threeterritorial structures in Lombardy Region, Italy. A flow chart is hereafter provided toclarify the process followed (Fig. 1) and each phase is detailed described. As reportedin empirical studies and literature reviews, there is strong evidence on the influence ofspecific physical features such as unit size, spatial layout, homelike character anddomesticity on patients perception and wellbeing [13–17]. Other studies report thatsensory stimulation, and environmental characteristics of social spaces also affectresidents’ behaviors [18–20]. Additionally, the importance of visual qualitiesimprovement and noise and odour reduction is also highlighted in other studies [7, 19,20]. People with dementia suffer disorientation and wandering therefore safety andorientation strategies are suggested by most of the papers collected, along with theprovision of dedicated services and activities [21–24]. All the criteria that emergedfrom the literature have been collected and clustered in four macro-areas: Quality,Spaces, Activities and Wayfinding.
Fig. 1. Flow chart of the process followed in this study with the highlight of the two phasesconducted
180 A. Brambilla et al.

1.2 Case Study Analysis
At the same time, the search of case studies, best practices and benchmark of excel-lence in the treatment of Alzheimer’s patients has been conducted. An investigation onfive case studies considered excellent in the European panorama for the care andsupport of Alzheimer’s disease has been carried out. The analysis includes threeAlzheimer Village (Hogway Dementia Village in The Netherlands, Landais AlzheimerVillage, in France and Il Paese Ritrovato in Italy), a Day Care Centre (Day Care Centrein Spain) and an Alzheimer department in Nursery Home (Foyer La Grange in France).The best practice comparison confirms the four macro areas previously identified.Additionally, relevant design strategies applied in the five case studies have beenconsidered as assessment criteria and led back to the four macro areas.
1.3 Evaluation Tools Analysis
Furthermore, existing evaluation tools have been analysed in order to understand how farthe four macro-areas highlighted in the literature review and case study analysis arepresent in the available assessment methodologies. Originally grounded on sustainabilityassessment, those instruments are very important for the evaluation and improvement ofthe existing assets in terms of sustainability values, organization performances or health-related outcomes [25, 26]. Eight evaluation tools have been selected due to their relevanceto the topic: BREEAM Building Research Establishment Environmental AssessmentMethod Healthcare version (UK, 2008); CHD-CHC Center for Health Design Commu-nity Health Center Evaluation tool (USA, 2017); DQI Design Quality Indicators forHealthcare (UK, 2012); EAT Environmental Audit Tool (Australia, 2003); LEEDLeadership in Energy and Environmental Design Healthcare version (USA 2011); Sus-tHealth Evaluation Tool (Italy, 2015); WELL International Building Standard (USA,2011); TESS-NH Therapeutic Environment Screening Survey - Nursing Homes (USA,1991). Only two of them specifically assess environments for patients suffering fromdementia (EAT and TESS-NH). The analysis confirms the accuracy of the four macroareas identifiedwith the addition of environmental sustainability topic. It also provides aninsight of the evaluation method from both qualitative and quantitative approaches.Figure 2 offers a summary of the analysis conducted.
Fig. 2. Comparison of the international assessment tools selected. The percentage represent thenumber of indicators related to that specific topic retrospect to the total number of indicators.A fifth macro-area (environmental sustainability) emerges from this analysis.
Built Environment and Alzheimer 181
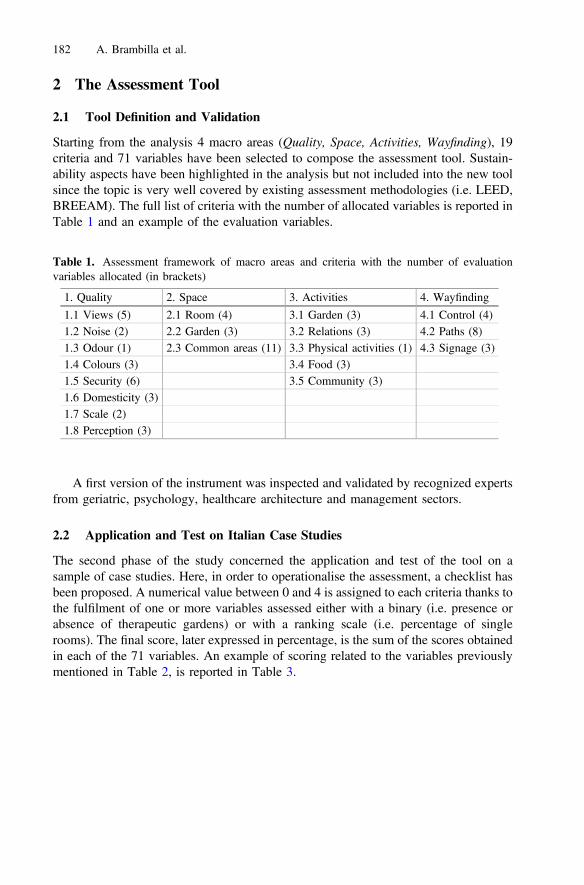
2 The Assessment Tool
2.1 Tool Definition and Validation
Starting from the analysis 4 macro areas (Quality, Space, Activities, Wayfinding), 19criteria and 71 variables have been selected to compose the assessment tool. Sustain-ability aspects have been highlighted in the analysis but not included into the new toolsince the topic is very well covered by existing assessment methodologies (i.e. LEED,BREEAM). The full list of criteria with the number of allocated variables is reported inTable 1 and an example of the evaluation variables.
A first version of the instrument was inspected and validated by recognized expertsfrom geriatric, psychology, healthcare architecture and management sectors.
2.2 Application and Test on Italian Case Studies
The second phase of the study concerned the application and test of the tool on asample of case studies. Here, in order to operationalise the assessment, a checklist hasbeen proposed. A numerical value between 0 and 4 is assigned to each criteria thanks tothe fulfilment of one or more variables assessed either with a binary (i.e. presence orabsence of therapeutic gardens) or with a ranking scale (i.e. percentage of singlerooms). The final score, later expressed in percentage, is the sum of the scores obtainedin each of the 71 variables. An example of scoring related to the variables previouslymentioned in Table 2, is reported in Table 3.
Table 1. Assessment framework of macro areas and criteria with the number of evaluationvariables allocated (in brackets)
1. Quality 2. Space 3. Activities 4. Wayfinding
1.1 Views (5) 2.1 Room (4) 3.1 Garden (3) 4.1 Control (4)1.2 Noise (2) 2.2 Garden (3) 3.2 Relations (3) 4.2 Paths (8)1.3 Odour (1) 2.3 Common areas (11) 3.3 Physical activities (1) 4.3 Signage (3)1.4 Colours (3) 3.4 Food (3)1.5 Security (6) 3.5 Community (3)1.6 Domesticity (3)1.7 Scale (2)1.8 Perception (3)
182 A. Brambilla et al.
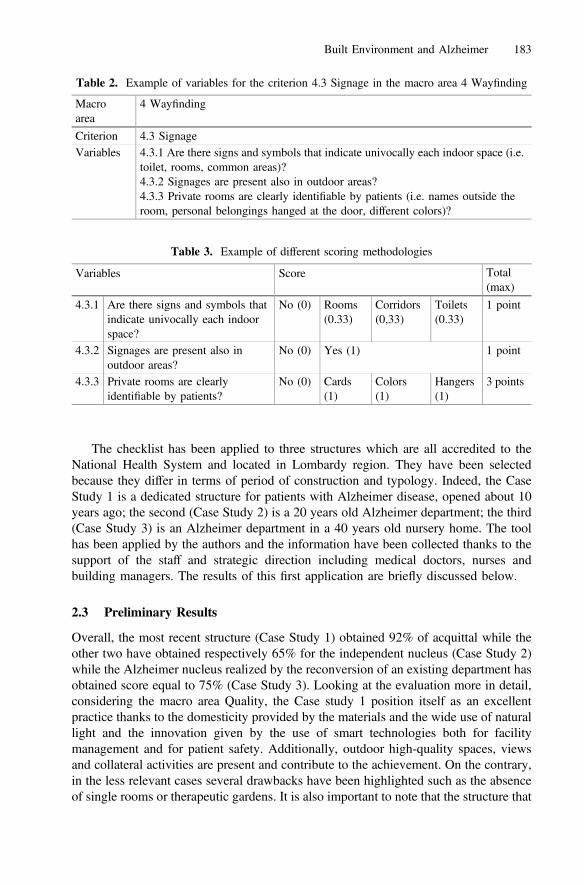
The checklist has been applied to three structures which are all accredited to theNational Health System and located in Lombardy region. They have been selectedbecause they differ in terms of period of construction and typology. Indeed, the CaseStudy 1 is a dedicated structure for patients with Alzheimer disease, opened about 10years ago; the second (Case Study 2) is a 20 years old Alzheimer department; the third(Case Study 3) is an Alzheimer department in a 40 years old nursery home. The toolhas been applied by the authors and the information have been collected thanks to thesupport of the staff and strategic direction including medical doctors, nurses andbuilding managers. The results of this first application are briefly discussed below.
2.3 Preliminary Results
Overall, the most recent structure (Case Study 1) obtained 92% of acquittal while theother two have obtained respectively 65% for the independent nucleus (Case Study 2)while the Alzheimer nucleus realized by the reconversion of an existing department hasobtained score equal to 75% (Case Study 3). Looking at the evaluation more in detail,considering the macro area Quality, the Case study 1 position itself as an excellentpractice thanks to the domesticity provided by the materials and the wide use of naturallight and the innovation given by the use of smart technologies both for facilitymanagement and for patient safety. Additionally, outdoor high-quality spaces, viewsand collateral activities are present and contribute to the achievement. On the contrary,in the less relevant cases several drawbacks have been highlighted such as the absenceof single rooms or therapeutic gardens. It is also important to note that the structure that
Table 2. Example of variables for the criterion 4.3 Signage in the macro area 4 Wayfinding
Macroarea
4 Wayfinding
Criterion 4.3 SignageVariables 4.3.1 Are there signs and symbols that indicate univocally each indoor space (i.e.
toilet, rooms, common areas)?4.3.2 Signages are present also in outdoor areas?4.3.3 Private rooms are clearly identifiable by patients (i.e. names outside theroom, personal belongings hanged at the door, different colors)?
Table 3. Example of different scoring methodologies
Variables Score Total(max)
4.3.1 Are there signs and symbols thatindicate univocally each indoorspace?
No (0) Rooms(0.33)
Corridors(0,33)
Toilets(0.33)
1 point
4.3.2 Signages are present also inoutdoor areas?
No (0) Yes (1) 1 point
4.3.3 Private rooms are clearlyidentifiable by patients?
No (0) Cards(1)
Colors(1)
Hangers(1)
3 points
Built Environment and Alzheimer 183
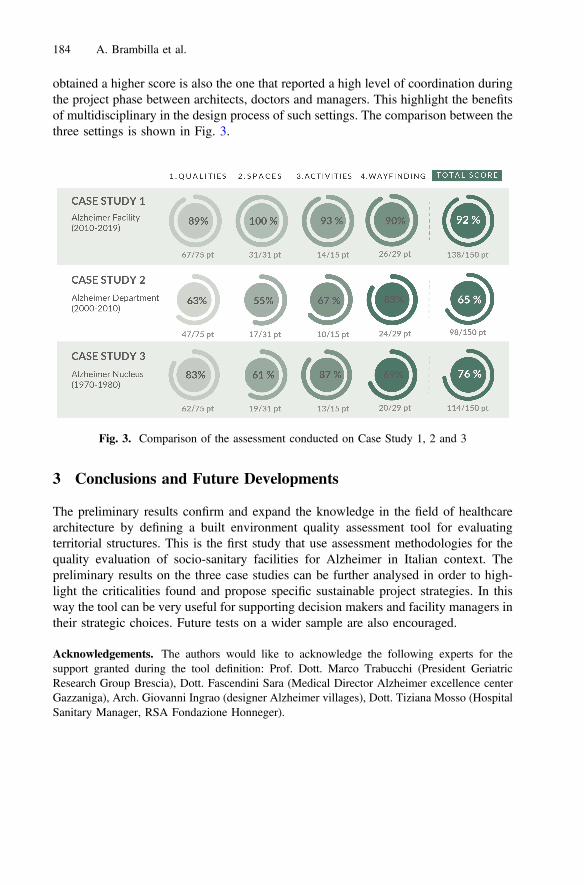
obtained a higher score is also the one that reported a high level of coordination duringthe project phase between architects, doctors and managers. This highlight the benefitsof multidisciplinary in the design process of such settings. The comparison between thethree settings is shown in Fig. 3.
3 Conclusions and Future Developments
The preliminary results confirm and expand the knowledge in the field of healthcarearchitecture by defining a built environment quality assessment tool for evaluatingterritorial structures. This is the first study that use assessment methodologies for thequality evaluation of socio-sanitary facilities for Alzheimer in Italian context. Thepreliminary results on the three case studies can be further analysed in order to high-light the criticalities found and propose specific sustainable project strategies. In thisway the tool can be very useful for supporting decision makers and facility managers intheir strategic choices. Future tests on a wider sample are also encouraged.
Acknowledgements. The authors would like to acknowledge the following experts for thesupport granted during the tool definition: Prof. Dott. Marco Trabucchi (President GeriatricResearch Group Brescia), Dott. Fascendini Sara (Medical Director Alzheimer excellence centerGazzaniga), Arch. Giovanni Ingrao (designer Alzheimer villages), Dott. Tiziana Mosso (HospitalSanitary Manager, RSA Fondazione Honneger).
Fig. 3. Comparison of the assessment conducted on Case Study 1, 2 and 3
184 A. Brambilla et al.
References
1. World Health Organization: WHO Healthy Ageing and the Sustainable Development Goals.https://www.who.int/ageing/sdgs/en/. Accessed 28 Jan 2020
2. Quotidiano Sanità. Noi Italia 2019: Cresce speranza di vita per uomini e donne dove siamoal top in Ue, ultimi invece per fecondità. Al 12° posto in Europa per la spesa sanitaria. Giùl’out of pocket. Istat. http://www.quotidianosanita.it/studi-e-analisi/articolo.php?articolo_id=72993. Accessed 28 Jan 2020
3. Galluzzo, L., Gandin, C., Ghirini, S., Scafato, E.: Population ageing: opportunity orchallenge? Centro Nazionale di Epidemiologia, Sorveglianza e Promozione della Salute,Istituto Superiore di Sanità, Roma Bollettino epidemiologico nazionale (2012). https://www.epicentro.iss.it/ben/2012/aprile/2. Accessed 28 Jan 2020
4. Izzicupo, F., Chattat, R., Gainotti, S., Carbone, G., Di Fiandra, T., Galeotti, F., Menniti-Ippolito, F., Raschetti, R., Vanacore, N.: Alzheimer: conoscere la malattia per saperlaaffrontare. Il Pensiero Scientifico Editore, Roma (2009)
5. Alzheimer’s Disease International 2019. World Alzheimer Report 2019: Attitudes todementia. Alzheimer’s Disease International, London. https://www.alz.co.uk/research/WorldAlzheimerReport2019.pdf. Accessed 28 Jan 2020
6. Falasca, C. (eds.): 2° Rapporto sulle condizioni abitative degli anziani in Italia che vivono incase di proprietà – 2015. AUSER. http://www1.auser.it/wp-content/uploads/2015/11/SECONDO%20RAPPORTO%20SULLE%20CONDIZIONI%20ABITATIVE%20DEGLI%20ANZIANI.pdf. Accessed 28 Jan 2020
7. Cannara, A., Brizioli, C., Brizioli, E.: Progettare l’ambiente per l’Alzheimer. Franco Angeli,Milano (2015)
8. Dezza, P.: Nelle residenze sanitarie il 5% degli investimenti immobiliari. Il Sole 24 Ore.https://www.ilsole24ore.com. Accessed 28 Jan 2020
9. PwC and the Urban Land Institute. Emerging Trends in Real Estate® Europe 2019. PwC andthe Urban Land Institute, London (2018). https://www.pwc.at/de/publikationen/branchen-und-wirtschaftsstudien/pwc-emerging-trends-in-real-estate-europe-2019.pdf. Accessed 28Jan 2020
10. Hamilton, D.K., Watkins, D.H.: Evidence-Based Design for Multiple Building Types.Wiley, Hoboken (2008)
11. Ulrich, R.S., Berry, L.L., Quan, X., Parish, J.T.: A Conceptual Framework for the Domain ofEvidence-Based Design. HERD 4(1), 95–114 (2010)
12. Jones, M.: Il motodo Gentlecare. Carocci Faber, Roma (2008)13. Chaudhury, H., Cooke, H.A., Cowie, H., Razaghi, L.: The Influence of the physical
envirnment on residents with dementia in long-term care settings: a review of the empiricalliterature. Gerontologist 58(5), e325–e337 (2017). https://doi.org/10.1093/geront/gnw259
14. Chrysikou, E.: From Normalisation theory to a “fit for purpose” architecture for mental ill.World Health Des. 5(3), 72–80 (2012)
15. Davis, S., Byers, S., Nay, R., Koch, S.: Guiding design of dementia friendly environments inresidential care settings. Dementia 8(2), 185–203 (2009)
16. Milte, R., Shulver, W., Killington, M., Bradleya, C., Ratcliffe, J., Crottyab, M.: Quality inresidential care from the perspective of people living with dementia: the importance ofpersonhood. Arch. Gerontol. Geriatr. 63, 9–17 (2016)
17. Orfield, S.J.: Dementia environment design in seniors housing: optimizing residentperception and cognition. Seniors Hous. Care J. 23(1), 58–69 (2015)
18. Marquardt, G., Bueter, K., Motzek, T.: Impact of the design of the built environment onpeople with dementia: an evidence-based review. HERD 8(1), 127–157 (2014)
Built Environment and Alzheimer 185
19. Marquardt, G., Schmieg, P.: Dementia-friendly architecture: environments that facilitatewayfinding in nursing homes. Am. J. Alz. Dis. Other Dementias 24(4), 333–340 (2009)
20. Leung, M., Wang, C., Chan, I.Y.S.: A qualitative and quantitative investigation of effects ofindoor built environment for people with dementia in care and attention homes. Build.Environ. 157, 89–100 (2019)
21. Anderiesen, H., Scherder, E.J.A., Goossens, R.H.M., Sonnoveld, M.H.: A systematic review– physical activity in dementia: the influence of the nursing home environment. Appl.Ergonomics 45, 1678–1686 (2014)
22. Van Hoof, J., Helianthe, S.M.K., Duijnstee, M.S.H., et al.: The indoor environment and theintegrated design of homes for older people with dementia. Build. Environ. 45(5), 1244–1261 (2010)
23. de Boer, B., Hamers, J.P.H., Zwakhalen, S.M.G., Tan, F.E.S., Verbeek, H.: Quality of careand quality of life of people with dementia living at green care farms: a cross-sectional study.BMC Geriatr. 17, 155 (2017)
24. Jarrott, S., Gigliotti, C.M.: Comparing responses to horticultural-based and traditionalactivities in dementia care programs. Am. J. Alz. Dis. Other Dementias 25(8), 657–665(2010)
25. Brambilla, A., Buffoli, M., Capolongo, S.: Measuring hospital qualities. Acta bio-medica90(9S), 54–63 (2019)
26. Brambilla, A., Capolongo, S.: Healthy and sustainable hospital evaluation - a review of POEtools for hospital assessment in an evidence-based design framework. Buildings 9(4), 76(2019)
Open Access This chapter is licensed under the terms of the Creative Commons Attribution 4.0International License (http://creativecommons.org/licenses/by/4.0/), which permits use, sharing,adaptation, distribution and reproduction in any medium or format, as long as you give appro-priate credit to the original author(s) and the source, provide a link to the Creative Commonslicense and indicate if changes were made.The images or other third party material in this chapter are included in the chapter’s Creative
Commons license, unless indicated otherwise in a credit line to the material. If material is notincluded in the chapter’s Creative Commons license and your intended use is not permitted bystatutory regulation or exceeds the permitted use, you will need to obtain permission directlyfrom the copyright holder.
186 A. Brambilla et al.
Transforming the Built Environment ThroughHealthy-Design Strategies
A Multidimensional Framework for Urban Plans’Evaluation
Maddalena Buffoli1 , Andrea Rebecchi1 , Marta Dell’Ovo1 ,Alessandra Oppio2(&) , and Stefano Capolongo1
1 Department of Architecture, Built Environment and Construction Engineering(ABC), Politecnico di Milano, via G. Ponzio 31, 20133 Milan, Italy
{maddalena.buffoli,andrea.rebecchi,marta.dellovo,
stefano.capolongo}@polimi.it2 Department of Architecture and Urban Studies (DAStU), Politecnico di
Milano, via E. Bonardi 3, 20133 Milan, [email protected]
Abstract. According to the research grant titled “Urban Health: good prac-tices for health impact assessment of urban and environmental redevelopmentand regeneration interventions” and awarded by the Italian National Center forDisease prevention and Control (CCM) in 2017, this paper is aimed to describethe overall goal of the project: develop and disseminate experience-basedpractices among Policy Makers, based on Health Impact Assessment models,literature and case studies, mainly referred to healthy aging and equity in urbanregeneration programs. The authors were involved in the development andapplication phases of a quali-quantitative assessment tool, capable of providingan effective and flexible support to the Local Health Agencies (LHAs) forevaluating the Urban Health strategies’ integrations into urban plans.The final framework is composed by 20 criteria, aimed to assess the
propensity of urban plans to promote Urban Health strategies. The criteria aredivided into 7 macro-areas: the first one including prerequisites (0. Generalcriteria) while the other 6 constituting the assessment tool (1. Environment; 2.Soil and subsoil; 3. Sustainability and hygiene of the built environment; 4.Urban and social development; 5. Mobility and transport; 6. Outdoor spaces).This research project could be considered a starting point to disseminate
methods, tools and indicators to design and assess not merely the public spaces’environmental quality, but also foresee the urban plans’ Public Health outcomes.
Keywords: Urban Health � Urban assessment tool � Healthy and sustainableenvironment
© The Author(s) 2020C. Bevilacqua et al. (Eds.): NMP 2020, SIST 177, pp. 187–196, 2020.https://doi.org/10.1007/978-3-030-52869-0_16

1 Theoretical Scenario
1.1 State of the Art
The relations between the morpho-typological and functional features of the builtenvironment and Public Health outcomes, open to a challenging scenario about theUrban Health research topic, considering the huge urbanization phenomena thatcharacterizes contemporary cities and societies, both at european level than in devel-oping countries. The United Nations (UN) Population Division Department states thattoday 54% of the world’s population live in urban areas. This is expected to rise up to70% by 2050, when the World’s urban population will exceed 6 billion [1]. Theincrease of buildings density will be one of the main global trends, with significantimpacts connected to the increase of environmental risk factors (Urban Heat IslandEffect; soil, air, acoustic and light pollution, in terms of inappropriate artificial lightingdevices and low natural lighting of places; vehicular traffic conditions; urban safety &security; poor attractiveness of places) affecting the contemporary cities [2], creating agap between an healthy environment and alarming living conditions.
Referring to the Agenda 2030, the Sustainable Development Goals (SDG’s)highlighted how cities today represent the most challenging context for quality of life,environmental sustainability, health and social inclusion and their strategic role inadapting to climate change. In particular, the 11th SDGs argue about “SustainableCities and Communities” [3] and state how urban development and renewal initiativesshould be designed and organized to make cities healthier, smarter, resilient, safe andcircular.
To summarize these concepts, the meaningful synthesis of the challenging rela-tionship between urban planning and Public Health was recently stated by WorldHealth Organization [4] into the following sentence: “Health is the precondition ofurban sustainable development and the first priority for urban planners”.
In this scenario, in the last years, researchers and practitioners, both of technical andmedical education, identified the need of inter-disciplinary approaches, in order toaddress the cities’ key features to Public Health outcomes [5]. There’s a need of jointactions in order to involve the communities [6], starting from the professionalsthemselves. Urban Health strategies should be considered since the early stages ofurban planning [7], as vehicles of primary health prevention and promotion [8].
In order to promote health in urban areas through urban planning strategies, a firstresearch was conducted in 2010 by Politecnico di Milano in collaboration with theLocal Health Agency (LHA) of the Municipality of Milano (better known as ASLMilano, but nowadays called ATS Città Metropolitana di Milano). However, the new,emerging and disruptive environmental risk factors (i.e. Climate Change) together withthe contemporary Public Health needs, such as social inclusion, equity, safety andDesign for All, have highlighted the critical issues and the irrelevance of the strategiesdeveloped previously.
188 M. Buffoli et al.
1.2 Research Opportunities
According to this scientific debate, the authors are part of a research group atDepartment of Architecture, Built environment and Construction engineering (ABC) ofPolitecnico di Milano still working on a research grant titled “Urban Health: goodpractices for health impact assessment of urban and environmental redevelopment andregeneration interventions” and awarded in 2017 by the Italian National Center forDisease prevention and Control (CCM). The overall goal of the research projectCCM2017 was to develop and disseminate experience-based practices among PolicyMakers, based on Health Impact Assessment models, literature and case studies, mainlyreferred to healthy aging and equity in urban regeneration programs.
The specific objectives of the CCM2017 project were six; the key one - the first -was to draft and apply a quali-quantitative assessment tool, capable of providing aneffective and flexible support to the LHAs for evaluating the Urban Health strategies’integrations into urban plans. Even before the research proposal, it was highlighted thelack - in the national scenario - of evaluation tools capable to support, both designersand Policy Makers, in the achievement of Public Health purposes [9].
2 Methodological Framework
Given these premises and according to the experience developed in 2010 by Politec-nico di Milano together with the LHA of the Municipality of Milano (better known asASL Milano, but nowadays called ATS Città Metropolitana di Milano), the currentresearch provided a deep revision of the overall structure of the tool previously framedby solving and implementing criticalities detected by its application and given thenecessity to update the methodology and the contents.
The research developed in 2010 was divided into criteria too, but with a differentpurpose: in 2010 the objective was to evaluate the environmental hygiene aspects ofurban plans; actually, the tool presented in this paper, aims to assess the level ofadherence and development of the Urban Health criteria. Furthermore, in the currenttool, the criteria are weighted according to importance and therefore contribute, in adifferent way, to the final score.
The final goal of the research is to define a quali-quantitative assessment tool,capable of providing effective and flexible support to the LHAs for evaluating theUrban Health strategies’ integrations into urban plans. For this reason, the method-ological framework has been divided mainly in 3 phases organized by following thescheme of [10] namely intelligence, design and choice (Fig. 1), that can be described asfollow:
– the intelligence phase refers to the description of the main objectives, the analysis ofthe previous experience and a deep investigation of the state of the art.
– the design phase consists in the development of the framework, its validation andthe criteria weight elicitation;
– the choice phase deals with the final validation of the tool and its dissemination.
Transforming the Built Environment Through Healthy-Design Strategies 189

2.1 Intelligence Phase
Given the final objective to support LHAs in formulating suggestions to protect andpromote Public Health into urban plans, considering an Urban Health approach, theresearch started with a deep analysis of the State of the Art. This step consisted of aliterature review with special reference on Experience Based Healthy Design andUrban Planning Strategies, the analysis of existing urban-scale assessment tools andthe revision of case studies of urban regeneration with health impacts on the context.
The literature confirmed the suitability of the MCA in supporting decisions aboutcomplex problems since allows to structure them in hierarchical phases and levels in orderto be solved by having an overall view of the big picture. In particular, problems con-cerning the transformation of the environment are defined as complex [6], since they arecharacterized by a multidimensional nature where multiple trade-offs have to be foundamong several aspects. It is therefore essential to evaluate their impacts and effects on theenvironmental quality and the social well-being in order to guarantee transparency andlegitimacy of those processes whose final decision is able to affect the entire community.In this context the transparency is ensured by the adoption of clear methodologies able toguide the decision-makers in the different phases of the evaluation process [11, 12].
Moreover the comparison with literature allowed to identify the most frequentlyused and validated assessment tools aimed to evaluate urban quality and sustainablefeatures of urban projects and plans [Green Star Communities, Australia; GlobalSustainability Assessment System (GSAS), Qatar; Comprehensive Assessment Systemfor Built Environment Efficiency for Urban Development (CASBEE-UD), Japan; LEEDNeighbourhood Development, United States; British Research Establishment Envi-ronmental Assessment Method for (BREEAM) Communities, United Kingdom; DGNBSystem, German Sustainable Building Council; HQE for Urban Planning Development(UPD), France]. From the analysis and comparison of the related indicators, it has beenpointed out, in most of them, the absence of specific criteria directly connected toPublic Health outcomes [13].
INTELLIGENCE PHASE
DESIGN PHASE
CHOICE PHASE
Objectives definition
Framework definition
Test validation
Final validation
Dissemination
Weights elicitation
Review of theprevious experience
Analysis of theState of the Art
Fig. 1. Methodological flowchart
190 M. Buffoli et al.
2.2 Design Phase
The previous phase led to the definition of criteria and indicators able to measure towhich extent a town-planning plan is able to promote Urban Health strategies and toenhance a built environment aimed at satisfying social needs, improve people’s qualityof life and promote the adoption of healthy lifestyles, like Physical Activity.
Most of the criteria are a review of those defined during the previous experience [6]while others are the result of emerging needs reported by studies on Urban Health andExperience Based Healthy Design [14]. Moreover, within this context, the MulticriteriaAnalysis (MCA) has been considered as the most suitable methodology able to face thecomplexity of the decision context given by the presence of several and sometimesconflictual objectives and the co-existence of different dimensions to balance.
The framework underwent two different steps to achieve the final validation. Thefirst moment involved the application of the multicriteria tool on existing urban plansand it has been carried on by the LHA of Bergamo, divided in two teams of profes-sionals. Within this first step, a special attention has been given to the evaluation of theeffectiveness of the tool and its objectiveness in formulating judgements. The secondmoment consisted in two meeting organized with the Welfare General Directorate ofLombardy Region and professionals coming from all the LHAs based in LombardyRegion, in order to have feedbacks about the tool.
Once all the feedbacks have been collected and processed, the final framework hasbeen defined composed by 20 criteria (indicators), aimed to assess the propensity ofurban plans to promote Urban Health strategies. The criteria are divided into 7 macro-areas: the first one including prerequisites (0. General criteria) while the other 6 con-stituting the assessment tool (1. Environment; 2. Soil and subsoil; 3. Sustainability andhygiene of the built environment; 4. Urban and social development; 5. Mobility andtransport; 6. Outdoor spaces).
– Based on an idea of urban quality that diverges - significantly - from the traditionalquantitative type, linked to the concept of urban planning standards, the proposedcriteria are qualitative and performance. Each criteria is then assessed through aperformance matrix. The attribution of the judgment to the criteria consists inverifying the level of adhesion of each urban plan/project to a set of performancerequirements (presence/absence of specific Urban Health strategies) described in thematrix, according to the following scheme: Strong: it represents the performancemost consistent with the objectives of Urban Health, with reference to the singlecriterion analyzed;
– Moderate: it is the intermediate level and refers to a consistent performance that canbe improved;
– Low: it does not consider any Urban Health strategy, limiting itself to merecompliance with sector regulations.
The individual judgments correspond to numerical values in order to elaboratesummary evaluations (evaluation by areas and the final overall evaluation of the pro-ject) and explanatory graphs of analysis.
When the final set of indicators has been structured (Fig. 2), it has been possible toweight their influence in achieving the main objective.
Transforming the Built Environment Through Healthy-Design Strategies 191
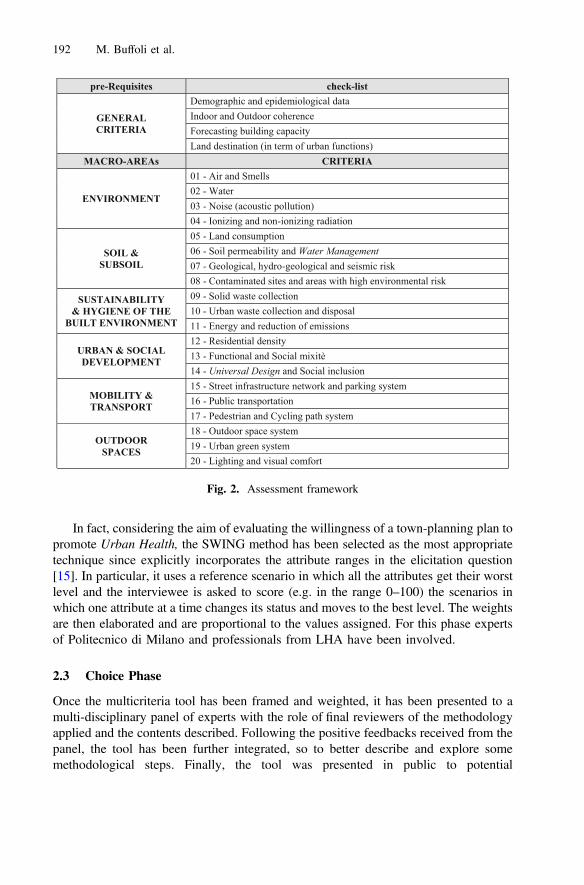
In fact, considering the aim of evaluating the willingness of a town-planning plan topromote Urban Health, the SWING method has been selected as the most appropriatetechnique since explicitly incorporates the attribute ranges in the elicitation question[15]. In particular, it uses a reference scenario in which all the attributes get their worstlevel and the interviewee is asked to score (e.g. in the range 0–100) the scenarios inwhich one attribute at a time changes its status and moves to the best level. The weightsare then elaborated and are proportional to the values assigned. For this phase expertsof Politecnico di Milano and professionals from LHA have been involved.
2.3 Choice Phase
Once the multicriteria tool has been framed and weighted, it has been presented to amulti-disciplinary panel of experts with the role of final reviewers of the methodologyapplied and the contents described. Following the positive feedbacks received from thepanel, the tool has been further integrated, so to better describe and explore somemethodological steps. Finally, the tool was presented in public to potential
pre-Requisites check-list
GENERALCRITERIA
Demographic and epidemiological dataIndoor and Outdoor coherenceForecasting building capacityLand destination (in term of urban functions)
MACRO-AREAs CRITERIA
ENVIRONMENT
01 - Air and Smells02 - Water 03 - Noise (acoustic pollution)04 - Ionizing and non-ionizing radiation
SOIL &SUBSOIL
05 - Land consumption06 - Soil permeability and Water Management07 - Geological, hydro-geological and seismic risk08 - Contaminated sites and areas with high environmental risk
SUSTAINABILITY& HYGIENE OF THE
BUILT ENVIRONMENT
09 - Solid waste collection10 - Urban waste collection and disposal11 - Energy and reduction of emissions
URBAN & SOCIALDEVELOPMENT
12 - Residential density13 - Functional and Social mixitè14 - Universal Design and Social inclusion
MOBILITY &TRANSPORT
15 - Street infrastructure network and parking system16 - Public transportation17 - Pedestrian and Cycling path system
OUTDOORSPACES
18 - Outdoor space system19 - Urban green system20 - Lighting and visual comfort
Fig. 2. Assessment framework
192 M. Buffoli et al.
Stakeholders (urban planners, designers, Public Health experts, Policy Makers,Administrators, etc.) in order to identify any further aspects to be improved and to havean additional validation.
The LHA of Bergamo, local research unit of the CCM2017 Project, tested theassessment framework in its daily activities of urban plans and projects’ evaluation. Thisapproach, common to all the Public Health operators, will be helpful to be more effectiveand incisive in the opinions to be expressed about urban plans and projects, with a care-fulness to the design sphere that considermore strategic the performances and that exceedscompliance with regulatory requirements. At the same time, designers can receive aneffective support about the application ofUrbanHealth strategies, inherent the wording ofthe framework indicators. The assessment framework has therefore been validated and thedissemination phase of which manuals, papers and workshops are part, has begun.
3 Evaluating the Built Environment
Within this context, as it has been already described, the multicriteria framework allowsto give an overall evaluation of urban plans according to the Urban Health approach byconsidering external and design factors. What deserve to be explored is the role of thebuilt environment in promoting or negatively affecting the wellbeing of inhabitants. Infact, among the selected macro-areas, one is focused in analyzing the role of buildingsand the design process in achieving sustainable goals.
3.1 Sustainability and Hygiene of the Built Environment
The third macro-area, titled “Sustainability and hygiene of the built environment”, is thewhich one that involves all the indicators aimed at assessing the possible interactions(positive or negative) of urban plans on the environment in terms of sustainable devel-opment and resilience to climate change. Here both the management dimension and thedesign one are considered. In fact, the first criterion 09 - Solid waste collection considerall policies aimed at managing the entire waste process, from its production to its finaloutcome. Innovative systems of waste collection, like pneumatic networks, have directimpacts on hygiene, cleaning and sanitation actions of the city and its public spaces,whether they are close to residential dwellings [16], or closer to squares and publicspaces in general. The criterion is also focused on the process of collection, transport,treatment (recovery or disposal) and also the reuse of waste materials, usually producedby human activity, in an attempt to reduce their effects on human health and the envi-ronment. The second one, 10 - Urban waste collection and disposal considers theinfrastructure or sewerage network as a complex and articulated system of undergroundcanalizations that allows the collection and conveyance of domestic, industrial and urbanwastewater. This wastewater is then purified and discharged into river mouths or directlyinto the sea. When disposing of wastewater, a distinction must be made between blackwater and rainwater (or white water). In order to design sustainable living environmentsthat respect the natural water cycle, it is important to anticipate and encourage thefollowing strategies: a) separate sewerage (rainwater and sewage); b) rainwater reusesystem after separation of first rainwater. The last criterion,
Transforming the Built Environment Through Healthy-Design Strategies 193
11 - Energy and reduction of emissions encourages greater awareness of con-sumption and sustainability regarding technological and plant engineering choices inorder to improve the energy efficiency of buildings. In fact, the reduction of energyconsumption leads to less local air pollution, with direct positive effects on the PublicHealth of the inhabitants. In addition, lower air pollution leads to lower impacts on theclimate-environment, which in turn leads to further lower impacts on health. It istherefore important to reach performance certificate with high performance class orpresence of further recognized environmental certification (LEED, BREAM, etc.); oradopt a balance between the following strategies:
– passive principles for sustainability (orientation and shape; thermal insulation andinertia; natural ventilation; shielding systems);
– active principles for sustainability in % above the legal minimums: (electricity andthermal energy from renewable sources, efficient plant systems).
It is important to underline how the role of humans is fundamental in achievingsustainable objectives even related to their own health, according to the Healthy Citiesdefinition stating that urban settlements are “those urban centers that continuouslycreating and improving those physical and social environments, encouraging theexpansion of resources and making people in conditions to support each other inperforming and developing all the daily activities.” [17]. All the instances discussed inthis macro-area aim at improving the overall quality of life by providing strategies thatcould be adopted during the design phase.
4 Conclusions
This research project could be considered a starting point to disseminate methods, toolsand indicators to design (if applied preliminarily to the project by architects and urbanplanners) and assess (if used from the LHAs) the public spaces’ environmental quality,according to the international scenario [20], where several frameworks - mainly con-scious about the urban quality assessment - are frequently used, like those one cited inthe introduction. The research and application outlooks will take consistency inspreading the tool to all the LHAs, but also to the architectural and urban planningfirms, in order to be applied - bilaterally - since from the early design stages.
It is necessary and crucial to evaluate the public space with qualitative frameworksand approaches, highlighting the urban context and public spaces features, experience-based oriented to promote healthy lifestyles.
Making cities healthier means to improve those physical factors - as network ofpublic spaces, land use mix, street design, etc. - capable to create a more healthy, safe,comfortable and attractive places. Making the urban settlements more sustainablemeans also take care about the built environment, both in the design process and in thebuilding features (construction materials, active and passive solar systems, environ-mental orientation of buildings; etc.).
The paradigm of Public Health needs to be changed, moving from a medical model,focused on the individuals, to a social model, where the health status is the result ofvarious socio-economic, cultural and environmental factors.
194 M. Buffoli et al.
A multidisciplinary approach is crucial [18–20], as it enable to put together dif-ferent stakeholders, like epidemiologist and Public Health experts; urban planners,designers and construction technologists; Policy Makers, to enhance a direct interactionwith decision-maker; and, finally, economists or valuation experts, dealing with theproject feasibility studies.
Acknowledgments. The project development was possible thanks to the funds of the NationalCenter for Disease Prevention and Control CCM2017 regarding the project titled “Urban Health:good practices for health impact assessment of urban and environmental redevelopment andregeneration interventions.” (CUP: C42F17000330001) and all the related partners involved, likeLHA of Bergamo (Complex Operating Unit in Hygiene and Public Health, Health-Environment),Welfare General Directorate of Lombardy Region and Italian Ministry of Health (Office 8 -Health promotion, prevention and control of chronic degenerative diseases).
References
1. Talukder, S., Capon, A., Nath, D., Kolb, A., Jahan, S., Boufford, J.: Urban health in the post-2015 agenda. Lancet 385, 769 (2015). https://doi.org/10.1016/S0140-6736(15)60428-7
2. Capolongo, S.; Buffoli, M.; Brambilla, A.; Rebecchi, A.: Healthy urban planning & designstrategies to improve urban quality and attractiveness of places. In: TECHNE 19 TOPIC 2:The Public Space as Environmental Infrastructure, Functional to the Pursuit of UrbanSustainability Goals (in press)
3. Sustainable Development Commission: Health, Place and Nature. How Outdoor Environ-ments Influence Health and Well-Being: A Knowledge Base (2008). https://research-repository.st-andrews.ac.uk/handle/10023/2180
4. World Health Organization: Health as the Pulse of the New Urban Agenda (2016). http://apps.who.int/iris/bitstream/handle/10665/250367/9789241511445-eng.pdf;jsessionid=07F882D99F1E1AF399B57D5546EEB2BB?sequence=1
5. Gianfredi, V., Balzarini, F., Gola, M., Mangano, S., Carpagnano, L.F., Colucci, M.E., Gentile,L., Piscitelli, A., Quattrone, F., Scuri, S., Mantovani, L.G., Auxilia, F., Castaldi, S., Capolongo,S., Pelissero, G., Odone, A., Signorelli, C.: Leadership in public health: opportunities for younggenerations within scientific associations and the experience of the “Academy of YoungLeaders”. Front. Public Health 7, 378 (2019).https://doi.org/10.3389/fpubh.2019.00378
6. Capolongo, S., Buffoli, M., Mosca, E.I., Galeone, D., D’Elia, R., Rebecchi, A.: Public healthaspects’ assessment tool for urban projects, according to the urban health approach. In: DellaTorre, S., Cattaneo, S., Lenzi, C., Zanelli, A. (eds.) Regeneration of the Built Environmentfrom a Circular Economy Perspective. RD, pp. 325–335. Springer, Cham (2020). https://doi.org/10.1007/978-3-030-33256-3_30
7. Capolongo, S., Sdino, L., Dell’Ovo, M., Moioli, R., Della Torre, S.: How to assess urbanregeneration proposals by considering conflicting values. Sustainability 11(14), 3877 (2019).https://doi.org/10.3390/su11143877
8. Capasso, L., Faggioli, A., Rebecchi, A., Capolongo, S., Gaeta, M., Appolloni, L., De Martino,A., D’Alessandro, D.: Aspetti igienico-sanitari in ambito urbanistico: Conflittualità nelle normeurbanistiche nazionali e locali in tema di Sanità Pubblica. Epidemiol. Prev. 42, 60–64 (2018)
9. Capolongo, S., Rebecchi, A., Dettori, M., Appolloni, L., Azara, A., Buffoli, M., Capasso, L.,Casuccio, A., Oliveri Conti, G., D’Amico, A., et al.: Healthy design and urban planningstrategies, actions, and policy to achieve salutogenic cities. Int. J. Environ. Res. PublicHealth 15, 2698 (2018)
Transforming the Built Environment Through Healthy-Design Strategies 195

10. Simon, H.A.: The New Science of Management Decision. Harper and Row, New York(1960)
11. Rebecchi, A., Buffoli, M., Dettori, M., Appolloni, L., Azara, A., Castiglia, P., D’Alessandro,D., Capolongo, S.: Walkable environments and healthy urban moves: Urban context featuresassessment framework experienced in Milan. Sustainability 11(10), 2778 (2019). https://doi.org/10.3390/su1110277
12. Bouyssou, D., Marchant, T., Pirlot, M., Perny, P., Tsoukias, A., Vincke, P.: Evaluation andDecision Models. A Critical Perspective. Springer Science & Business Media, New York(2000). https://doi.org/10.1007/978-1-4615-1593-7
13. D’Alessandro, D., Appolloni, L., Capasso, L.: Public Health and urban planning: a powerfulalliance to be enhanced in Italy. Ann. Ig. 29, 452–463 (2017). https://doi.org/10.7416/ ai.2017.2177
14. Ferretti, V., Bottero, M., Mondini, G.: Decision making and cultural heritage: an applicationof the Multi-Attribute Value Theory for the reuse of historical buildings. J. Cult. Herit. 15(6),644–655 (2014)
15. Gola, M., Signorelli, C., Buffoli, M., Rebecchi, A., Capolongo, S.: Local health rules andbuilding regulations: a survey on local hygiene and building regulations in Italianmuniciples. Ann. Istituto Superiore di Sanità 53(3), 223–230 (2017). https://doi.org/10.4415/ANN_17_03_08
16. Rydin, Y., Bleahu, A., Davis, M., Dávila, J.D., Friel, S., de Grandis, G., Groce, N., Hallal, P.C., Hamilton, I., Howden-Chapman, P., et al.: Shaping cities for health: Complexity and theplanning of urban environments in the 21st century. Lancet 379, 2079–2108 (2012)
17. World Health Organization: International Workshop on Housing, Health and Climate Change:Developing Guidance for Health Protection in the Built Environment Mitigation and AdaptationResponses (2010). http://www.who.int/hia/house_report.pdf. Accessed 20 Sep 2019
18. Oppio, A., Bottero, M., Giordano, G., Arcidiacono, A.: A multi-methodological evaluationapproach for assessing the impact of neighbourhood quality on public health. Epidemiol.Prev. 40, 249–256 (2016)
19. Capolongo, S., Lemaire, N., Oppio, A., Buffoli, M., Roue Le Gall, A.: Action planning forhealthy cities: the role of multi-criteria analysis, developed in Italy and France, for assessinghealth performances in land-use plans and urban development projects. Epidemiol. Prev. 40,257–264 (2016)
20. D’Alessandro, D., et al.: Strategies for disease prevention and health promotion in urbanareas: the Erice 50 Charter. Ann. Ig. 29, 481–493 (2017)
Open Access This chapter is licensed under the terms of the Creative Commons Attribution 4.0International License (http://creativecommons.org/licenses/by/4.0/), which permits use, sharing,adaptation, distribution and reproduction in any medium or format, as long as you give appro-priate credit to the original author(s) and the source, provide a link to the Creative Commonslicense and indicate if changes were made.The images or other third party material in this chapter are included in the chapter’s Creative
Commons license, unless indicated otherwise in a credit line to the material. If material is notincluded in the chapter’s Creative Commons license and your intended use is not permitted bystatutory regulation or exceeds the permitted use, you will need to obtain permission directlyfrom the copyright holder.
196 M. Buffoli et al.

Assessing the Effectiveness of PublicInvestments in Cultural Built Heritage:
The Case of the Umbertine FortsSystem in Italy
Giuseppina Cassalia1(&) , Veronica Calvieri2, Immacolata Lorè1,and Francesco Calabrò1
1 Mediterranea University of Reggio Calabria, 89100 Reggio Calabria, [email protected] Club UNESCO, Campo Calabro, Italy
Abstract. The paper deals with the topic of the allocation of resources andinvestment strategies in cultural built heritage. The valorization of cultural assetsis often guaranteed by the intervention of public funding. The need to allocatethese funds efficiently and effectively, together with the transparency duties towhich public administrations are subject, necessitates a careful measurement ofthe economic, cultural, environmental and social effects. Accordingly, the paperoutlines the starting framework of a study on the ex-post evaluation of theeffectiveness of public intervention towards the restoration and valorization ofthree forts in the Umbertine Forts System, located in the Metropolitan City ofReggio Calabria, southern Italy.The open remarks raised by the preliminary step of the study evoke questions
both about the topic of evaluation tools and the methods used in the ex-postevaluation of the effectiveness of public intervention towards cultural builtheritage restoration and valorization, and also on the topic of local governance,strategic planning and management of cultural heritage.
Keywords: Public investments � Cultural built heritage � Ex-post evaluationtools � Umbertine Forts System � Cost benefits analysis
1 Introduction
The enhancement of cultural heritage oriented towards segments of new demand andwith increasingly sustainable use methods represents a fundamental pillar of theEuropean strategy in favor of intelligent growth. In particular, culture has alwaysplayed a primary role within the Italian economic system as an engine for the country’sgrowth. In terms of policies, the interest in cultural activities is due both to theemployment potential closely connected to the sector, and to the multiple
The paper is the result of the joint work of the authors. Although scientific responsibility is equallyattributable, the abstract and Sects. 2, 2.1, 3, 3.2 and 4 were written by G. Cassalia while Sects. 1was written by F. Calabrò, 2.2 by V. Calveri and 3.2 by I. Lorè.
© The Author(s) 2020C. Bevilacqua et al. (Eds.): NMP 2020, SIST 177, pp. 197–210, 2020.https://doi.org/10.1007/978-3-030-52869-0_17

interrelationships that bind it to other economic spheres, the agri-food, tourism, crafts,research activities and development.
This leads to the concept of shared value “which focuses on the connectionsbetween societal and economic progress” [1].
Furthermore, numerous European documents stress the potential of cultural her-itage as an engine of growth in terms of: new and higher quality job opportunities, ableto exploit and spread the use of new information technologies; b) redevelopmentfactors of urban environments and the driving force of development of rural areas andminor centers of architectural and landscape value; and c) drivers for social cohesionbecause the enhancement of local goods and traditions increases the awareness of thecollective heritage and enables the strengthening of the sense of belonging in thecommunities [2, 3].
The valorization of cultural assets, notoriously characterized by poor profitability, isoften guaranteed by the intervention of a public body or a third party interested inknowing how and with what effects the resources provided have been used. The need toallocate these funds efficiently and optimally, together with the transparency duties towhich public administrations are subject, necessitates careful measurement of theeffects of an economic investment [4, 5]. In this regard, the measurement of impact isbecoming more and more relevant in investments with social spill overs, but, at thesame time, it is really complex because of the lack of track record and historical data. Inthe literature and practice, as demonstrated in the following chapter, many instrumentshave been developed for the measurement of the impact of cultural projects. Almost allthe tools are based on two-dimensional analysis: economic-financial performance andsocial and/or environmental impact. Because of the peculiarities and constraints of thecultural heritage sector, further steps should be taken in the development of method-ologies suitable for the addressed field. A holistic approach should be chosen also forthese methodologies and instruments to measure the spillover effects from cross-cuttingissues regarding trans-categories, as well as trans-sectors, benefits [6].
The paper outlines the starting framework of a study on the ex-post evaluation ofthe effectiveness of public intervention toward the restoration and valorization of threeforts of the Umbertine Forts System, in the Metropolitan City of Reggio Calabria,southern Italy. Regions like Calabria have been the target during the last three Euro-pean programming cycles of substantial public investments, but interventions have notyet produced significant socioeconomic effects. Funding pressures reinforce the needfor a better understanding of how local governments can invest in the mitigation ofterritorial disparities and what the communities get in return. The open questions raisedby the preliminary step of the study presented here emphasize how the culture ofevaluation is an essential step towards achieving the overriding key objectives ofefficiency, transparency, and accountability, with the aim of determining both the costsand the benefits of publicly financed projects, and to improve the efficiency andeffectiveness of that investment.
198 G. Cassalia et al.

2 Cultural Built Heritage Public Investments in Timesof Scarce Resources: Burdensome Encumbranceor Development Engine?
The allocation of resources and investment strategies are crucial issues for the culturalsector. In recent decades, the idea of cultural built heritage as a weight bearing on thepublic sector has evolved into the concept of a strategic asset capable of increasing theattractiveness and competitiveness of some territories [2].
This important evolution in theoretical terms encounters, however, a strong limitfrom the increasingly strict constraints placed on public spending, which have con-stituted a real, generalized collapse of investments. Although the need to attract privateresources and skills to the sector and to enhance the synergies between cultural heritageand tourist accommodation has long been highlighted, it is clear that the role of publicinvestment remains crucial [7].
Moreover, given the low absorption rate of EU Structural Funds, the debate in Italycontinues about the extent to which, after decades of subsidies, the European RegionalPolicy is effective. This explains the attention to the programming strategies of theseresources and to the selection of the territories and themes to invest in, so as to arrive atthe methodologies for measuring the impacts actually obtained [8].
Far from finding an answer to the question, the study aims at contributing to thedebate on the effectiveness of public investments in cultural projects and to identifyingthe roles and responsibilities of the multi-level authorities, by choosing the UmbertineForts System of the City of Reggio Calabria (Italy) as an applicative case. As apreliminary step of the study, this contribution adopts an analytical and interpretiveapproach that could be easily exported to other public planning processes, to supportlocal policy makers in defining systemic territorial strategies.
2.1 Cultural Sector Potentiality and Investment Strategies in Calabria
Considering the strategic role of culture and the scarcity of financial resources availableto the Calabria Region (Italy), it is essential to develop and disseminate a culture ofmeasurement in the cultural field that allows evaluating ex ante and in itinere, duringthe planning phase so as to allocate resources more effectively and to appraise ex postthe cultural heritage investment effects on the territory. It is the authors’ opinion thatthe developmental potential related to cultural heritage depends on the endowment ofresources, but also on the effectiveness of the enhancement strategies [9, 10].
Regarding the first aspect, in 2014 Calabria was assessed to be among the regionswith the most advantageous capital and cultural heritage assets in Italy1. Likewise, froma tourism point of view, there was notable improvement based on the seasonal
1 “Big Data e Social Network per Istruzione e Cultura in Calabria”, presented the 16th of October 2014in Rome, Palazzo dell'Informazione, Sala Mastai.
Assessing the Effectiveness of Public Investments in Cultural Built Heritage 199
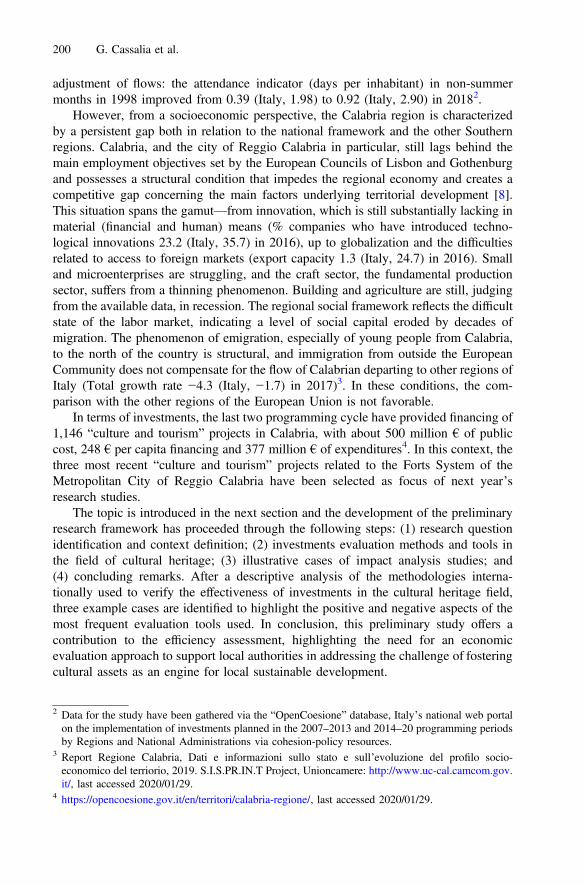
adjustment of flows: the attendance indicator (days per inhabitant) in non-summermonths in 1998 improved from 0.39 (Italy, 1.98) to 0.92 (Italy, 2.90) in 20182.
However, from a socioeconomic perspective, the Calabria region is characterizedby a persistent gap both in relation to the national framework and the other Southernregions. Calabria, and the city of Reggio Calabria in particular, still lags behind themain employment objectives set by the European Councils of Lisbon and Gothenburgand possesses a structural condition that impedes the regional economy and creates acompetitive gap concerning the main factors underlying territorial development [8].This situation spans the gamut—from innovation, which is still substantially lacking inmaterial (financial and human) means (% companies who have introduced techno-logical innovations 23.2 (Italy, 35.7) in 2016), up to globalization and the difficultiesrelated to access to foreign markets (export capacity 1.3 (Italy, 24.7) in 2016). Smalland microenterprises are struggling, and the craft sector, the fundamental productionsector, suffers from a thinning phenomenon. Building and agriculture are still, judgingfrom the available data, in recession. The regional social framework reflects the difficultstate of the labor market, indicating a level of social capital eroded by decades ofmigration. The phenomenon of emigration, especially of young people from Calabria,to the north of the country is structural, and immigration from outside the EuropeanCommunity does not compensate for the flow of Calabrian departing to other regions ofItaly (Total growth rate −4.3 (Italy, −1.7) in 2017)3. In these conditions, the com-parison with the other regions of the European Union is not favorable.
In terms of investments, the last two programming cycle have provided financing of1,146 “culture and tourism” projects in Calabria, with about 500 million € of publiccost, 248 € per capita financing and 377 million € of expenditures4. In this context, thethree most recent “culture and tourism” projects related to the Forts System of theMetropolitan City of Reggio Calabria have been selected as focus of next year’sresearch studies.
The topic is introduced in the next section and the development of the preliminaryresearch framework has proceeded through the following steps: (1) research questionidentification and context definition; (2) investments evaluation methods and tools inthe field of cultural heritage; (3) illustrative cases of impact analysis studies; and(4) concluding remarks. After a descriptive analysis of the methodologies interna-tionally used to verify the effectiveness of investments in the cultural heritage field,three example cases are identified to highlight the positive and negative aspects of themost frequent evaluation tools used. In conclusion, this preliminary study offers acontribution to the efficiency assessment, highlighting the need for an economicevaluation approach to support local authorities in addressing the challenge of fosteringcultural assets as an engine for local sustainable development.
2 Data for the study have been gathered via the “OpenCoesione” database, Italy’s national web portalon the implementation of investments planned in the 2007–2013 and 2014–20 programming periodsby Regions and National Administrations via cohesion-policy resources.
3 Report Regione Calabria, Dati e informazioni sullo stato e sull’evoluzione del profilo socio-economico del terriorio, 2019. S.I.S.PR.IN.T Project, Unioncamere: http://www.uc-cal.camcom.gov.it/, last accessed 2020/01/29.
4 https://opencoesione.gov.it/en/territori/calabria-regione/, last accessed 2020/01/29.
200 G. Cassalia et al.
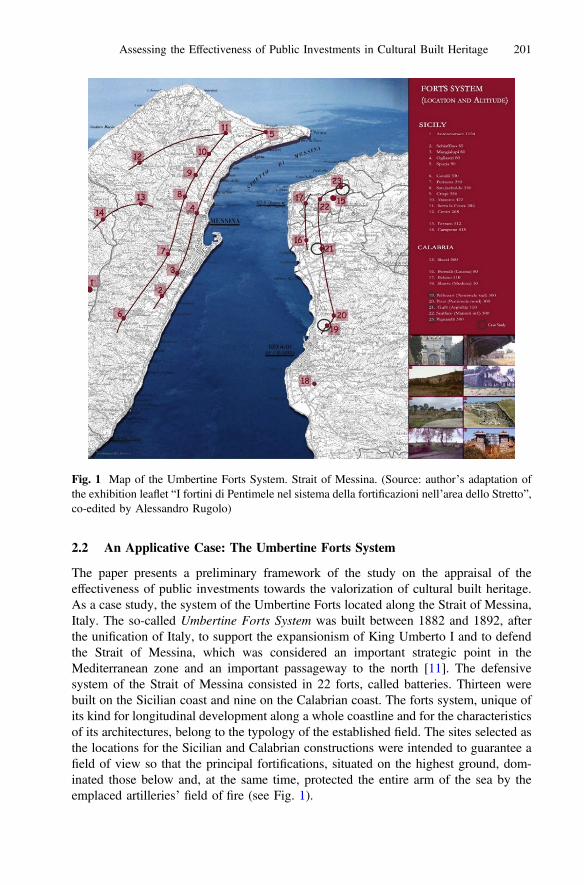
2.2 An Applicative Case: The Umbertine Forts System
The paper presents a preliminary framework of the study on the appraisal of theeffectiveness of public investments towards the valorization of cultural built heritage.As a case study, the system of the Umbertine Forts located along the Strait of Messina,Italy. The so-called Umbertine Forts System was built between 1882 and 1892, afterthe unification of Italy, to support the expansionism of King Umberto I and to defendthe Strait of Messina, which was considered an important strategic point in theMediterranean zone and an important passageway to the north [11]. The defensivesystem of the Strait of Messina consisted in 22 forts, called batteries. Thirteen werebuilt on the Sicilian coast and nine on the Calabrian coast. The forts system, unique ofits kind for longitudinal development along a whole coastline and for the characteristicsof its architectures, belong to the typology of the established field. The sites selected asthe locations for the Sicilian and Calabrian constructions were intended to guarantee afield of view so that the principal fortifications, situated on the highest ground, dom-inated those below and, at the same time, protected the entire arm of the sea by theemplaced artilleries’ field of fire (see Fig. 1).
Fig. 1 Map of the Umbertine Forts System. Strait of Messina. (Source: author’s adaptation ofthe exhibition leaflet “I fortini di Pentimele nel sistema della fortificazioni nell’area dello Stretto”,co-edited by Alessandro Rugolo)
Assessing the Effectiveness of Public Investments in Cultural Built Heritage 201
The peculiarity of this cultural built heritage lies in its essence of being a serial assetthat is configured as a unitary whole, even if articulated and complex in nature, bothfrom a geographical/landscape point of view and from an architectural/built one. Thestudy, at this stage, focuses on the Calabrian side of the fortress system and, in par-ticular, on those subject to restoration interventions. In Fig. 1, these are identified as n.23 the Poggio Pignatelli Fort, n. 21 the Fort in Arghillà and n. 19 the Fort in Pentimele.
The very first question arising from the study deals with the governance approachto the conservation and management of this cultural built heritage. Aware of thespecific and unique cultural landscape evidenced by the Sicilian and Calabrian fortresssystem, why was it conceived as a sum of single buildings? In this first step of thestudy, no plans nor documents have been found regarding a strategic vision for theconservation and management of the forts as a system. As will be showed, more than10 million euros of public funding have been spent for the conservation and val-orization of three of these forts on the Calabrian side of the system. And, according tothe first results, two out of the three are not in operation.
A brief description of the three forts and the infrastructure investments in questionfollows to outline the framework for further considerations concerning the allocation ofresources and investment strategies.
The Fort in Arghillà. The Gullì battery, today known as Ecolandia, is located inArghillà, a north suburb of Reggio Calabria. It was restored in the late 1990s, throughthe European URBAN I program, during the 1994–99 programming period (Table 1).In particular, the work involved the restoration of the fort, the construction of anamphitheater of about 800 seats and the renewal and valorization of equipped greenspaces from 1998 to 2001. The fort has long remained unused and, since 2011, hasbeen managed by a group of companies that have turned it into an EnvironmentalTechnology Playground Park. Due to the fact that the 1994–99 programming periodwas not well monitored, there are no public data on the timing and detailed publicspending of the intervention. Accordingly, this part of the study needs to be furtherdeveloped. Nevertheless, it’s known that seven million euros have been invested andabout six million and five hundred thousand euros officially disbursed (Table 2).
The Forts in Pentimele. These forts rise on the hill of Pentimele and are sit in apanoramic position over the city of Reggio Calabria. Due to the state of neglect, thearea, despite being very close to the city, is not densely populated and does not host anytype of accommodation (except from a bed & breakfast). The structural and archi-tectural restoration of the Umbertino Fort was part of the 46 new restoration inter-ventions in the regions of the Convergence Objective, 2007–2013 programming period.The planned interventions in the Calabrian territory were 14, and among them were theenhancement of the Pentimele Fort. It obtained an investment of three million euros,divided as follows: 10% EU fund, 3% Revolving Fund (national co-financing) and 87%Revolving Fund (Cohesion Action Plan). The work began in April 2016 and wascompleted in February 2017. An analysis of the data provided by OpenCoesione showsthat the total expenditure at the end of the work was 71% of the programmed financing.While the inauguration of the fort took place in June 2017, nevertheless, the structure isnot in operation to date.
202 G. Cassalia et al.

The Forts in Campo Calabro. Three of the forts of the Umbertine System are situatedin the territory of the Campo Calabro municipality, in the settlement of Matiniti, on thehills above the town. Manned by Italian Army troops until 1984, the forts weredecommissioned as military structures and have suffered a gradual decline due to theinterruption of maintenance work and vandalism. The Poggio Pignatelli fort is locatedone km from the town, and its restoration and enhancement work began in June 2014and ended in November 2015. Approximately € 618,000.00 was spent in the firstinstance, of which 75% came from European Union and 25% from national co-financing. The management of the internal areas and buildings of the fort was assignedto various associations that, after an initial phase of activity, stopped operating.A second round of funding has been committed within the 2014–2020 programmingperiod. Eight hundred thousand euros is expected to be spent by the end of 2020 withthe aim of enhancing the structure of the Umbertine fort with a specific environmentalapproach aimed at creating a museum.
Table 1. Framework of the public intervention on the forts (1)
Fort name Municipality Intervention Programmingperiod
EU fund Program
Fort inArghilla’
ReggioCalabria
RestorationandValorization
P.P. 1994–1999
STRUCT.FUND*
Urban I CommunityInitiative
Fort inPentimele
ReggioCalabria
RestorationandValorization
P.P. 2007–2013
ERDF** IROP Cult. and Tourism—CAP CulturalHeritage****
PoggioPignatelliFort
CampoCalabro
RestorationandValorization
P.P. 2007–2013
ERDF ROP Calabria*****
SystemValorization
P.P. 2014–2020
DCF*** Reggio Calabria Pact
*Structural Fund; ** European Regional Development Fund; ***Development Cohesion Fund;**** Integrated Regional Operational Program Cult. and Tourism - Cohesion Action PlanCultural Heritage; *****Regional Operational Program
Table 2. Framework of the Public Intervention on the Forts (2)
Fort’s name Progr.period
Financialstatus
Projectstatus
Proceduralstatus
Tot. pub.investment
Tot. payment
Fort inArghilla’
P.P. 1994–1999
Cleared Completed Executed 7,000,000.00 €* 6,500,000.00 €*
Fort inPentimele
P.P. 2007–2013
In progress In progress Execution ofworks
3,000,000.00 € 2,134,264.00 €
PoggioPignatelli Fort
P.P. 2007–2013
Cleared Completed Test 750,000.00 € 617,952.00 €
P.P. 2014–2020
Not started In progress Preliminaryproject
800,000.00 € 0
* approximate amount
Assessing the Effectiveness of Public Investments in Cultural Built Heritage 203
In order to get valid results, it is essential to emphasize some aspects that willinfluence the methodology on the topic in the ensuing research steps. First of all, aspreviously stated, the restoration interventions were allocated to individualelements/buildings. This underlines a lack of planning and an absent overview of theFortress System as a serial cultural built heritage—if not of the Strait of Messina Area,between the Sicilian and Calabrian coasts—located in the Metropolitan City of ReggioCalabria. Second, this study phase focuses only on public investments for restorationand enhancement interventions, falling under the “infrastructure” type of investment.For the record, over the years, Ecolandia, the fort in Arghillà, has received further andsubstantial (European, National and Regional) public funding for the implementation ofcultural activities, social services and scientific activities. These funds are not countedin the study.
In summary and in a very rough way, it can be stated that around € 11,550,000 havebeen committed for the restoration and conservation of three military fortresses, and onaverage 80% of the programmed funds have actually been spent.
The question that arises from this first analysis, in need of further study, deals withthe impact that this public investment had and will have on the territory. How do weevaluate the effectiveness of these interventions? What are the generated outcomes onthe various stakeholders such as the community, local businesses, associations,administrations and potential tourists?
To deal with this topic, the following section will illustrate a series of evaluationtools used in various cases to measure the economic values provided by cultural builtheritage.
3 Toward the Assessment of the Public InvestmentsEffectiveness: Methodological Considerations
The most sensitive issue in the investments analysis is that relating to the measurementof the impacts obtained: for instance, the question refers to whether and how much thefinanced projects have actually contributed to increasing the tourist attractiveness of theconcerned areas and if the expected effects in terms of promotion of jobs and incomeopportunities have actually been achieved. In economic terms, there is now a largeliterature on the available methodologies and the limits of each, and the analyticalchoices are adapted to the characteristics of the individual case [12]. More in depth, theassessment and measurement of economic values provided by cultural built heritagehas increasingly been recognized as an essential part of cultural policy as underlined byLichfield (1988), Pearce and Mourato (1998) and Ost and Van Droogenbroeck (1998)[13–15]. The former framed very clearly the evaluation tools that aim to predict,estimate and value the costs and benefits and their distribution among the partiesinvolved in and affected by cultural built heritage: financial and social financial analysis(FA, SFA); cost benefits and social cost benefits analysis (CBA and SCBA); andcommunity impact analysis (CIA).
In accordance with the latter, the interpretation of the processes of value creationand impact generation on the territory for all the stakeholders of an investment arecentral elements of a comprehensive and dynamic network system based on the
204 G. Cassalia et al.
measurement of shared value [1]. It is the authors’ belief that it is necessary to representthe value of a project with the awareness that its impact does not only concern thefinancial sphere, but should be valued in a multi-attribute microeconomic perspective,considering the economic, social, environmental and cultural domains. Moreover, it isalso significant to pay attention both to the concept of assessing the impact of theinfrastructure investments and to the concept of measuring the outcomes. The latter hasthe aim of qualifying and quantifying the added value of the project with respect to theset objectives, taking into account the way in which the implementation process tookplace and the changes that may have occurred in the reference context. The formerconsiders the persistence over time and the scope of immediate results. However, bothevaluations deal with external effectiveness or with the degree of satisfaction of theneeds from which the project was generated.
3.1 Tools and Methods for Evaluating Investments in Cultural Projects
Recent studies have highlighted pros and cons of various methods, bringing to lightexemplary cases and possible connections. The CHCFE report commissioned by theEuropean Union (2015) and David Throsby’s study on Investment in Urban Heritagecommissioned by the World Bank (2012) are two examples [16, 17].
These studies argue that many empirical studies have used stated preferencemethods such as contingent (CVM) to evaluate the welfare effects of cultural heritageinvestments by assessing the willingness of visitors, local residents or other stake-holders to contribute toward the costs of preserving the site of interest [18]. Theimprovement of experimental choice methods has resulted in an expansion of interestin the use of DCM as a technique for determining demand for various different attri-butes of a heritage site, such as its beauty, its amenity, its entry price, etc. [19].
Other researches relate the appraisal of the impacts of a cultural heritage investmentbased on a quantitative analysis of a statistical data approach. This is the case of theGuggenheim Museum Bilbao studied by Plaza (2006), who estimated the impacts ofthe Museum on overnight stays, employment, and fiscal revenues for the city of Bilbao[20]. Moreover, hedonic price studies of heritage values focus on real estate prices forlisted property to ascertain the extent to which the heritage characteristics influence themarket valuation [21]. A diverse form of empirical research is that aimed at assessingthe benefits of investment in cultural heritage. Some studies look at the valuation ofcultural landscapes and at environmental assets defined as cultural heritage [22].Empirical assessment of the use benefits of heritage is usually straightforward, beingbased on measurement of observable financial flows generated by market transactions.Revealed preference data can also be used to determine a range of use and non-usebenefits through the application of travel-cost methods [23].
Finally, there is cost-benefit analysis (CBA) in which the aggregated present valueof the net benefits produced by the investment project is compared to the present valueof the project’s capital costs [24, 25]. Moreover, there is social cost-benefit analysis thatcaptures the benefits of an investment with large spill-over effects [26, 27].
Given the purposes of the research, three case studies of impact assessment ofcultural heritage projects are reported below. The cases involve cultural immovable
Assessing the Effectiveness of Public Investments in Cultural Built Heritage 205
heritage in three different European areas5: Belgium, Macedonia, and Poland. The case-study selection was based on the following criteria: (1) cross-geographical contexts;(2) focus on built heritage; (3) assessment approaches; and (4) results obtained.
3.2 Example Cases of Cultural Projects’ Effects Evaluation
The first case study concerns the city of Mechelen (Belgium) [16]. The main researchquestion of this study was how to assess direct and indirect impacts of immovableheritage on the economy, society, culture and environment in the case of the chosenobject of study, the historic city center of Mechelen. The aim was to estimate theheritage spillovers in the fields of economy, society, culture and environment, and thechosen approach was qualitative, rather than quantitative, and the selected method wasan indicator-based examination. The study is based on secondary data sources supple-mented with evidence from stakeholder consultations and on the findings of the con-ducted survey. The results indicate that there is a correlation between the heritage and itsimpact on the society, but other factors also play a significant role in this process. Theresearch highlights the lack of available data with regard to some of the indicators.
The second case study examined the impact of cultural heritage in Macedoniaconducted by Throsby [17]. He applied an ex-post CBA assessing the economicimpacts of heritage investment, in the historic town center of Skopje. This reportproposed a procedure for conducting an ex-post economic impact analysis and quan-tified a series of indicators and other measures to enable an assessment of the results ofthe project. The most important lesson for project design arising from the researchrelates to the need for sound monitoring and evaluation provisions to be built intoproject implementation. Economic variables of importance in this respect include theoutput of goods and services generated by enterprises located in the project site,household incomes and expenditures, trends in employment, tourist numbers and levelsof spending and induced investments attributable to the project. It may also be possibleto include the means to track some social and cultural impacts.
Another example is the analysis of the modernization projects of the Gallery of19th-Century Polish Art in Krakow [16]. The main challenge of analyzing this case liesin the lack of critical data that was collected neither by the museums nor by otherbodies, or experts. Therefore, analysis has to be based only on existing research, resultsof surveys and the data already collected by several institutions. Even institutions thatbenefited from the EU financial support for cohesion or development do not seem to besufficiently aware of the importance of the potential impact their projects might have.Consequently, data to verify potential impact are usually not collected. Apart from thelack of awareness, the question of costs and shortage of financial resources hinderscultural institutions from running a monitoring of impact. Therefore, the analysis had tobe done based on the scarce data and comparison of the successful projects found in theliterature on the subject. The other problem faced here is the one of isolating the impactof the projects from their very complex settings. In case of the Gallery of 19th-CenturyPolish Art, located in the heart of Krakow’s Old Town, it is rather difficult to say
5 Europe is considered from a geographical and not an administrative perspective.
206 G. Cassalia et al.
whether the museum alone produces much impact—it is more likely the whole buildingof Sukiennice with its three parts, or even the whole complex of the Old Town, that inmany cases could be analyzed as a whole.
As it is also assumed in Sect. 4, the brief comparative analysis of these three casesleads to an important lesson for conducting ex-post impact assessments: no matterwhere (the north, south, or east of Europe) or the specific approach (qualitative orquantitative), the primary constraint is likely to be the availability of data. The threeresearch results deal with the need for comprehensive monitoring and evaluation toolsto be integrated into the project implementation.
4 Concluding Remarks
There are many expectations placed on the ability of cultural heritage investments tohave beneficial effects in terms of the generation of employment and income, especiallyfor territories such as Calabria that combine an endowment of international appeal withstill-low levels of enhancement.
The results highlighted by this first phase of the study raise questions both (1) onthe topic of evaluation tools and methods to be used, and (2) on the topic of strategicplanning and management of cultural heritage.
1.1 Availability of Data. On the former, it emerged that the choice of evaluation toolsto be used for the assessment of the effectiveness of the public investment in the field ofcultural built heritage is by no means simple. The methodology that can be applied inany economic analysis of a cultural heritage investment will be determined by theavailability of data. In many cases, it has been proven that it is not feasible to carry outa fully articulated ex-post cost-benefit analysis along the lines described in the Thorsbycase study. Nonetheless, a compilation of the types of indicators discussed by theauthor should be able to provide a useful picture of the project’s effects, assuming thatdata relating to at least the most important effects can be captured.
1.2 Systemic Approach. In the literature and practice, many tools have been developedfor the measurement of the impact of cultural projects. Given the likely significance ofnon-market benefits in the overall pattern of heritage project impacts, further stepsshould be taken in the development of methodologies adapted to the addressed field.A holistic approach should be chosen also for these methodologies and instruments tomeasure the spillover effects from cross-cutting issues regarding trans-categories, aswell as trans-sectors benefits.
1.3 Heterogeneity and Comparability. A further issue concerns the heterogeneity andcomparability of investments. The variability, in the case of the forts system, is linked atfirst instance to the financing/implementation timing. In the case of the Fort in Arghillà,there is a lack of availability of economic and financial data because the interventionswere carried out in a European programming period (1994–1999) in which publicexpenditure monitoring was not yet foreseen. On the other hand, the other two inter-ventions are too recent to have already produced visible effects. In fact, investments incultural built heritage usually have a fairly long-time horizon. Furthermore, we can
Assessing the Effectiveness of Public Investments in Cultural Built Heritage 207
expect a distorting effect linked to the various characteristics of the territories affected bythe investments, some concentrated in the suburban area of the capital city with morethan 180,000 inhabitants (census 2017), the other in a municipality with less than 5,000inhabitants (census 2017)6. The variability described makes the causal links to be soughtunclear. The heterogeneity described make it particularly difficult to apply the coun-terfactual method, based on the comparison between actors/areas that have received ornot received comparable treatments, both in terms of intervention type and intensity.
2.1 Regional Programs and the Evaluation Culture. Investments in culture and tour-ism infrastructure are therefore an excellent opportunity to test this relationship. Thereis a total of about 55 infrastructure projects, financed in the 2014–2020 programmingperiod, for interventions ranging from urban regeneration to architectural restoration,from the enhancement of archaeological areas to the improvement of nature trails. Infinancial terms, it deals with more than 53 million euros of public investments, ofwhich 35 million were made in the Metropolitan City of Reggio Calabria. It highlightsthe need for: an economic evaluation approach to support local policy makers indefining systemic territorial strategies that enable evaluating ex ante and in itinere,during the planning phase; where to allocate resources more effectively; and to appraiseex post the cultural heritage investment effects on the territory.
2.2 Local Strategic Planning and Management. As highlighted by this preliminarystudy on the Umbertine Forts System, the process of adding value to the assets haslacked strategic planning for the enhancement of this cultural built heritage. The criticalissues that emerged are diverse: first of all, the idea of working on single elementswithout considering the value of the system as a whole. The peculiarity of this culturalbuilt heritage stands in its essence of being a serial asset but configured as a unitarywhole, even if articulated and complex, both from a geographical/landscape point ofview and from an architectural/built one. Despite this being the year 2020, the re-functionalization of cultural built heritage still enshrines the restoration of culturalheritage as the main core of intervention, with little or no attention to management andfunctional objectives. The logic followed in these interventions is based on the idea thatit is sufficient to restore and recover the physical structures of an asset so that all theconditions for an effective and positive impact on the local development of the territoryare realized almost automatically: tourist and economic effects; enhancement of localproductions; growth of the sense of belonging by young people; reversal of the exodusof the active population, creation of jobs, etc. The ineluctable result deals with a publicfunding of more than 10 million euros for the restoration of three forts of the Calabrian-side of the system, and two out of three forts are not yet in operation.
2.3 Research Implementation. As repeatedly pointed out, more research is needed toacquire a more comprehensive and detailed understanding of the heritage spillovers inthe economic, social, cultural and environmental domains, especially in light of thelack of available data. Therefore, the research implementation will address the designof a social cost–benefit analysis towards the identification of the economic, social,cultural and environmental impacts (positive and negative) generated by the
6 http://dati.istat.it/ last accessed 2020/01/21.
208 G. Cassalia et al.
investments in the forts system valorization. The study’s aim is to create useful tech-nical support for operators who are preparing to plan and evaluate interventions for theredevelopment of cultural heritage.
The open questions raised by the preliminary step of the study presented hereemphasize how the culture of evaluation is an essential step for achieving the over-riding key objectives of efficiency, transparency, and accountability, with the aim ofdetermining both the costs and the benefits of publicly financed projects, and toimprove the efficiency and effectiveness of that investment. If well-resourced moni-toring mechanisms could be routinely included when heritage projects are beingimplemented, the tracking of post-project performance in economic, social, and culturalterms would be greatly facilitated, and the quantity and quality of data available for ex-post impact analysis would accordingly be increased.
References
1. Porter, M.E., Kramer, M.R.: Creating shared value. Harv. Bus. Rev. 1(2), 2–17 (2011)2. EC: European agenda for culture in a globalising world (2009). http://eur-lex.europa.eu3. KEA: The Economy of Culture in Europe, Document prepared for the European
Commission, Bruxelles (2006)4. Della Spina, L.: A multi-level integrated approach to designing complex urban scenarios in
support of strategic planning and urban regeneration. In: Calabrò, F., Della Spina, L.,Bevilacqua, C. (eds.) ISHT 2018. SIST, vol. 100, pp. 226–237. Springer, Cham (2019).https://doi.org/10.1007/978-3-319-92099-3_27
5. Nesticò, A., Maselli, G.: Sustainability indicators for the economic evaluation of tourisminvestments on islands. J. Clean. Prod. 248, 119217 (2020). https://doi.org/10.1016/j.jclepro.2019.119217
6. Cassalia, G., Tramontana, C., Calabrò, F.: Evaluation approach to the integrated valorizationof territorial resources: the case study of the Tyrrhenian area of the metropolitan city ofReggio Calabria. In: Calabrò, F., Della Spina, L., Bevilacqua, C. (eds.) ISHT 2018. SIST,vol. 101, pp. 3–12. Springer, Cham (2019). https://doi.org/10.1007/978-3-319-92102-0_1
7. UVAL: L’Italia secondo i Conti Pubblici Territoriali. I flussi finanziari pubblici nel settorecultura e servizi ricreativi. Atti del convegno di presentazione, Collana Materiali UVAL n.3,(2014)
8. Barca, F.: Towards a place-based social agenda for the EU. Report Working Paper (2009)9. Mollica, E.: Le Aree Interne della Calabria. Rubbettino, Soveria Mannelli (1997)10. Calabrò, F., Della Spina, L.: The public-private partnership for the enhancement of unused
public buildings: an experimental model of economic feasibility project. Sustainability 11,5662 (2019). https://doi.org/10.3390/su11205662
11. Banchini, R., Meduri, T., Tramontana, C.: La valorizzazione delle risorse architettoniche perla costruzione della Città Metropolitana dello Stretto: il recupero dei Forti di Pentimele.LaborEst 5, 29–31 (2010)
12. UVAL: Approcci alla valutazione degli effetti delle politiche di sviluppo regionale, CollanaMateriali UVAL n. 22 (2011)
13. Lichfield, N.: Economics in Urban Conservation. Cambridge University Press, Cambridge(1988)
14. Pearce, D.W., Mourato, S.: The Economics of Cultural Heritage. World Bank Report,CSERGE, University College London (1998)
Assessing the Effectiveness of Public Investments in Cultural Built Heritage 209
15. Ost, C., Van Droogenbroeck, N.: A Report on Economics of Conservation. ICOMOS,Brussels (1998)
16. CHCFE Consortium: Cultural Heritage counts for Europe (2015). http://www.europanostra.org/our-work/policy/cultural-heritage-counts-europe/. Accessed 21 Jan 2020
17. Throsby, D.: Investment in urban heritage: economic impacts of cultural heritage projects inFYR Macedonia and Georgia. Urban development series (16). World Bank, Washington DC(2012)
18. Carson, R.T., Mitchell, R.C., Conaway, M.B.: Economic benefits to foreigners visitingMorocco accruing from the rehabilitation of the Fes Medina. In: Navrud, S., Ready, R.C.(eds.) Valuing Cultural Heritage: Applying Environmental Valuation Techniques to HistoricBuildings, Monuments and Artifacts, pp. 118–141. Edward Elgar, Cheltenham (2002)
19. Kinghorn, N., Willis, K.: Valuing the components of an archaeological site: an application ofchoice experiment to Vindolanda, Hadrian’s Wall. J. Cult. Herit. 9(2), 117–124 (2008)
20. Plaza, B.: The return on investment of the Guggenheim Museum Bilbao. Int. J. Urban Reg.Res. 30(2), 452–467 (2006)
21. Noonan, D.S.: Finding an impact of preservation policies: price effects of historic landmarkson attached homes in Chicago, 1990–1999. Econ. Develop. Q. 21(1), 17–33 (2007)
22. Nicolosi, A., Laganà, V.R., Cortese, L., Privitera, D.: Using the network and MCA on touristattractions. The case of Aeolian Islands, Italy. Sustainability 10, 4169 (2018)
23. Poor, P.J., Smith, J.M.: Travel cost analysis of a cultural heritage site: the case of historic St.Mary’s City of Maryland. J. Cult. Econ. 28(3), 217–229 (2004)
24. Navrud, S., Strand, J.: Social costs and benefits of preserving and restoring the NidarosCathedral. In: Navrud, S., Ready, R.C. (eds.) Valuing Cultural Heritage: ApplyingEnvironmental Valuation Techniques to Historic Buildings, Monuments and Artifacts,pp. 118–141. Edward Elgar, Cheltenham (2002)
25. Locurcio, M., Tajani, F., Morano, P., Torre, C.M.: A fuzzy multi-criteria decision model forthe regeneration of the urban peripheries. New Metrop. Perspect. 100, 681–690 (2019).https://doi.org/10.1007/978-3-319-92099-3_76
26. Sturiale, L., Scuderi, A., Timpanaro, G., Foti, V.T., Stella, G.: Social and inclusive “value”generation in metropolitan area with the “urban gardens” planning. In: Mondini, G., Oppio,A., Stanghellini, S., Bottero, M., Abastante, F. (eds.) Values and Functions for Future Cities.GET, pp. 285–302. Springer, Cham (2020). https://doi.org/10.1007/978-3-030-23786-8_16
27. Saganeiti, L., Favale, A., Pilogallo, A., Scorza, F., Murgante, B.: Assessing urbanfragmentation at regional scale using sprinkling indexes. Sustainability 10, 3274 (2018).https://doi.org/10.3390/su10093274
Open Access This chapter is licensed under the terms of the Creative Commons Attribution 4.0International License (http://creativecommons.org/licenses/by/4.0/), which permits use, sharing,adaptation, distribution and reproduction in any medium or format, as long as you give appro-priate credit to the original author(s) and the source, provide a link to the Creative Commonslicense and indicate if changes were made.The images or other third party material in this chapter are included in the chapter’s Creative
Commons license, unless indicated otherwise in a credit line to the material. If material is notincluded in the chapter’s Creative Commons license and your intended use is not permitted bystatutory regulation or exceeds the permitted use, you will need to obtain permission directlyfrom the copyright holder.
210 G. Cassalia et al.
Enhancing Heritage and TraditionalArchitecture Conservation Through Digital
Technologies. Developing a DigitalConservation Handbook for As-Salt, Jordan
Claudia Trillo1(&) , Rania Aburamadan2, Chika Udeaja3,Athena Moustaka1, Kwasi Gyau Baffour1 ,
and Busisiwe Chikomborero Ncube Makore1
1 University of Salford, Salford, [email protected]
2 Amman Arab University, Amman, Jordan3 London South Bank University, London, UK
Abstract. Heritage cities are facing unprecedented pressure, due to the com-bination of climate change impacts, rapid urbanization and uncontrolled growth.Historic urban centres in Middle East and North Africa (MENA) countries areparticularly exposed. This paper discusses the benefit of applying digital tech-nologies, and in particular Building Information Modeling (BIM), in supportingheritage conservation, by developing a proof of concept based on a purposelychosen case study, i.e. the traditional Jordanian city of As-Salt near Amman.Building on and moving forward the tradition of paper-based ConservationHandbooks for historic cities, this study aims at exploiting the potential ofdigital technologies for enhancing the development and implementation ofDigital Conservation Handbooks. Documentation and promoting of As-Salt willbe conducted through developing a set of virtual models (3D models and BIMobjects) suitable to support the construction sector and traditional architectureand heritage, framed and delivered in form of Digital Conservation Handbook.This will be achieved by: developing a new set of BIM (Building InformationModeling) objects related to the traditional architecture heritage in Jordan,suitable to be used by engineers and architects in the development of inter-ventions on the built environment; creating a library of 3D models of exemplarbuildings (Jordan heritage and traditional architecture), suitable to be used topromote the tourist image of Jordan. This will set a precedent for further doc-umentation and heritage conservation of traditional cities in Jordan, MENAcountries and internationally. Finally, the paper will discuss issues and chal-lenges of documenting traditional heritage and architecture in As-Salt and theimpact that such process may achieve in raising awareness across the localcommunities, thus offering insights to the larger community of architects,conservationists, and planners.
Keywords: Heritage conservation � Conservation handbooks � Heritage andBIM
© The Author(s) 2020C. Bevilacqua et al. (Eds.): NMP 2020, SIST 177, pp. 211–219, 2020.https://doi.org/10.1007/978-3-030-52869-0_18
1 Conservation of Historic Centres and ConservationHandbooks: Opportunities for Digital Technologies
Heritage cities are facing unprecedented threats. While almost unanimous consensusexists internationally on the need of safeguarding monuments and key-tangible heritageassets for the benefit of future generations, less relevant heritage assets, such as tra-ditional housing, vernacular architecture, historic urban patterns and features, historicartefacts related to socio- economic systems, struggle to be adequately acknowledgedand protected. UNESCO’s recommendation on the Historic Urban Landscape(UNESCO 2011) describes the need for a shift from an emphasis on architecturalmonuments primarily towards a broader recognition of the importance of the social,cultural and economic processes in the conservation of urban values. Pressures onhistoric urban areas encompass rapid urbanization, uncontrolled growth, environmentalissues related to the climate change impact on cities. Tools for managing successfullyhistoric urban landscape conservation include participatory tools for engaging stake-holders and citizens, knowledge and planning tools, regulatory systems and financialtools (Bandarin and Oers 2012; UNESCO 2016).
This study aims at producing a novel tool positioned within the interplay betweencommunity engagement and knowledge and planning tools, by building on and movingforward the existing tradition of the Italian Conservation Handbooks (Giovanetti 1992).Digital technologies, and in particular BIM (Building Information Modelling), areinstrumental to update the traditional approach pursued by the Conservation Hand-books and exploit the potential of digital technologies in heritage conservation. There istherefore a need of focus on the implementation of conservation policies, integratingmanagement, conservation, development, and planning disciplines to practice. Indeed,implementing conservation policies is obviously challenging, since effective conser-vation requires alignment of policies and instruments at different level, adequateresources and availability of skills and competences (Ginzarly et al. 2019). The above-mentioned tradition of “Conservation Handbook” stems from the pioneering experi-ence developed in 1977 in the city of Pesaro (Panella 1992). In this city, local gov-ernment was seeking to implement the local plan for the historic centre, and wasstruggling to implement effective conservation of the urban fabric. Resulting in adedicated city laboratory, supported by experts and conservationists. The experience letto the creation of a handbook, offering technical support to architects and conserva-tions, which at the same time acting as vehicle for raising awareness across residentsabout the value of heritage assets.
Based on this pioneering experience, the City of Rome replicated the methodology,between 1982 and 1984 thanks to the support given from the University La Sapienzaand experts of the caliber of Paolo Marconi. At that time, the famous architect CarloAymonino was councilor for the historic centre and enabled synergies with the uni-versity course on reuse of historic buildings directed by Giovannetti (Panella 1992).A final case of reference which fully developed this methodology is the handbookprepared for the city of Citta’ di Castello, which spans between 1980s and early 1990s(Giovanetti 1992). These cases supported the development and testing of a now con-solidated methodology for the conservation of historic urban fabric, based on the three
212 C. Trillo et al.

specific goals: (1) encourage and steer the conservation of historic urban fabric, throughappreciation of the materiality of historic buildings; (2) offer technical insights toconservations and architects; (3) engage with the communities on the conservation oftraditional heritage. In fact, once exemplar cases become “models” to look at, followingthe publication of the handbooks, residents acknowledged the value of those buildingsand a virtuous process of value recognition and historic buildings appreciationemerged. Eventually, conservation handbooks became indirectly instrumental to raisingawareness and proud with locals.
Over the years, this methodology has been replicated and led to the production of arobust body of knowledge on the traditional characters of historic architectures indifferent regions of Italy. The rationale beyond the conservation handbooks lies at theinterplay between micro, meso and macro scale. Conservation of the character of theurban fabric is enabled by the effective conservation of the buildings, which are madeof different elements, such as roofs, windows, floors, walls. The articulation of someselected exemplar buildings through their own components, allows depiction of thekey-elements for the thorough understanding and appreciation of the materiality of thehistoric fabric. Each handbook offers therefore a selection of case studies, extractedfrom some selected exemplar buildings and showing the material details of the city bymeans of its components. While creating technical knowledge, the handbook alsoworks in the interplay between society (community recognizing values) and economicfabric (workers capable to perpetuate the technique), perpetuating the concept thathistoric urban fabric and landscape are outcomes of the socio- economic place- basedfabric (Turri 2001).
Nowadays digital technologies offer a unique opportunity for uplifting the power ofthe rationale beyond conservation handbooks. In facts, they offer the possibility tointegrate multiple layers of information and to link across industry, community andhigher education with a flexibility and timeliness that traditional techniques such aspaper-based drawings did not allow at such an extent (Udeaja et al. 2019). In particular,Building Information Modelling (BIM) offers the opportunity to link a variety ofinformation concerning heritage assets and convey them across multi-disciplinaryprofessionals (Pocobelli et al. 2018). This is a process also known as Heritage BuildingInformation Modelling (HBIM). Therefore, the researchers developed a projecthypothesis rethinking conservation handbook in the context of digital technologies. It isbased on the idea that contemporary conservation handbook should take the form ofBIM models, embedding key features of historic buildings whilst enabling designers togather and reassemble information easily (Volk et al. 2014). This facilitates the con-servation of historic centres, both through an enhanced body of knowledge madeavailable to the local professionals’ community, and through community engagement.
2 Research Methodology
This study aims at showing the potential of an application of digital technologies to theconservation of historic centre, by channelling BIM into the tradition of the conser-vation handbook. Digital handbooks based on BIM objects will facilitate the prepa-ration and delivery of conservation projects in historic centres, and at the same time
Enhancing Heritage and Traditional Architecture Conservation 213
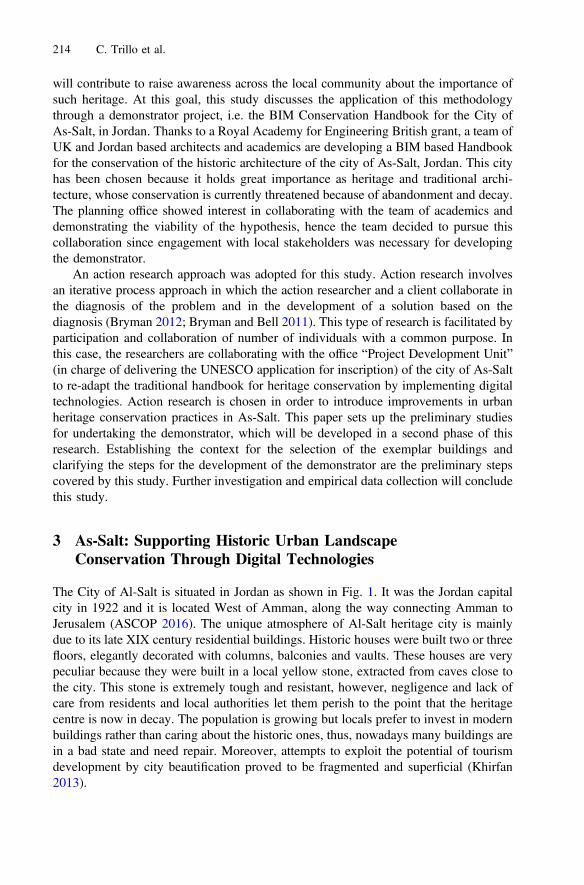
will contribute to raise awareness across the local community about the importance ofsuch heritage. At this goal, this study discusses the application of this methodologythrough a demonstrator project, i.e. the BIM Conservation Handbook for the City ofAs-Salt, in Jordan. Thanks to a Royal Academy for Engineering British grant, a team ofUK and Jordan based architects and academics are developing a BIM based Handbookfor the conservation of the historic architecture of the city of As-Salt, Jordan. This cityhas been chosen because it holds great importance as heritage and traditional archi-tecture, whose conservation is currently threatened because of abandonment and decay.The planning office showed interest in collaborating with the team of academics anddemonstrating the viability of the hypothesis, hence the team decided to pursue thiscollaboration since engagement with local stakeholders was necessary for developingthe demonstrator.
An action research approach was adopted for this study. Action research involvesan iterative process approach in which the action researcher and a client collaborate inthe diagnosis of the problem and in the development of a solution based on thediagnosis (Bryman 2012; Bryman and Bell 2011). This type of research is facilitated byparticipation and collaboration of number of individuals with a common purpose. Inthis case, the researchers are collaborating with the office “Project Development Unit”(in charge of delivering the UNESCO application for inscription) of the city of As-Saltto re-adapt the traditional handbook for heritage conservation by implementing digitaltechnologies. Action research is chosen in order to introduce improvements in urbanheritage conservation practices in As-Salt. This paper sets up the preliminary studiesfor undertaking the demonstrator, which will be developed in a second phase of thisresearch. Establishing the context for the selection of the exemplar buildings andclarifying the steps for the development of the demonstrator are the preliminary stepscovered by this study. Further investigation and empirical data collection will concludethis study.
3 As-Salt: Supporting Historic Urban LandscapeConservation Through Digital Technologies
The City of Al-Salt is situated in Jordan as shown in Fig. 1. It was the Jordan capitalcity in 1922 and it is located West of Amman, along the way connecting Amman toJerusalem (ASCOP 2016). The unique atmosphere of Al-Salt heritage city is mainlydue to its late XIX century residential buildings. Historic houses were built two or threefloors, elegantly decorated with columns, balconies and vaults. These houses are verypeculiar because they were built in a local yellow stone, extracted from caves close tothe city. This stone is extremely tough and resistant, however, negligence and lack ofcare from residents and local authorities let them perish to the point that the heritagecentre is now in decay. The population is growing but locals prefer to invest in modernbuildings rather than caring about the historic ones, thus, nowadays many buildings arein a bad state and need repair. Moreover, attempts to exploit the potential of tourismdevelopment by city beautification proved to be fragmented and superficial (Khirfan2013).
214 C. Trillo et al.
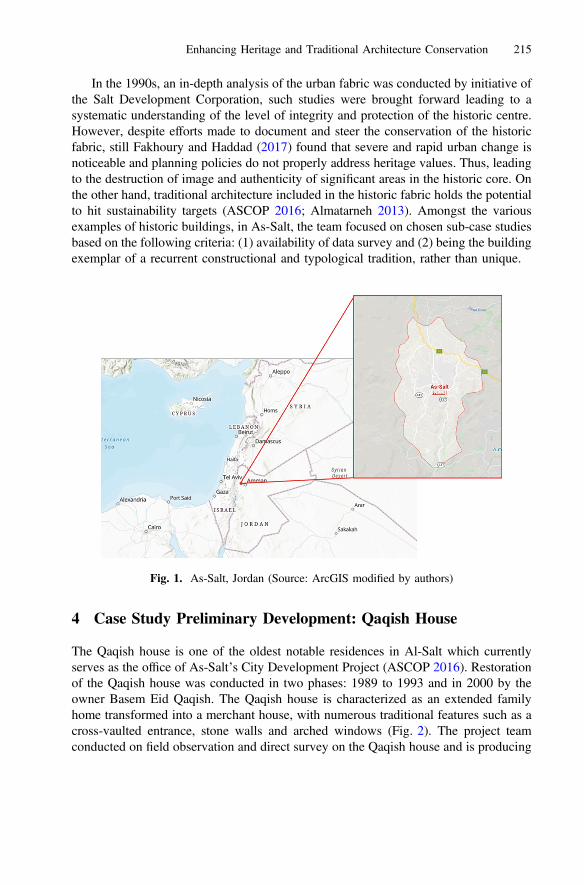
In the 1990s, an in-depth analysis of the urban fabric was conducted by initiative ofthe Salt Development Corporation, such studies were brought forward leading to asystematic understanding of the level of integrity and protection of the historic centre.However, despite efforts made to document and steer the conservation of the historicfabric, still Fakhoury and Haddad (2017) found that severe and rapid urban change isnoticeable and planning policies do not properly address heritage values. Thus, leadingto the destruction of image and authenticity of significant areas in the historic core. Onthe other hand, traditional architecture included in the historic fabric holds the potentialto hit sustainability targets (ASCOP 2016; Almatarneh 2013). Amongst the variousexamples of historic buildings, in As-Salt, the team focused on chosen sub-case studiesbased on the following criteria: (1) availability of data survey and (2) being the buildingexemplar of a recurrent constructional and typological tradition, rather than unique.
4 Case Study Preliminary Development: Qaqish House
The Qaqish house is one of the oldest notable residences in Al-Salt which currentlyserves as the office of As-Salt’s City Development Project (ASCOP 2016). Restorationof the Qaqish house was conducted in two phases: 1989 to 1993 and in 2000 by theowner Basem Eid Qaqish. The Qaqish house is characterized as an extended familyhome transformed into a merchant house, with numerous traditional features such as across-vaulted entrance, stone walls and arched windows (Fig. 2). The project teamconducted on field observation and direct survey on the Qaqish house and is producing
Fig. 1. As-Salt, Jordan (Source: ArcGIS modified by authors)
Enhancing Heritage and Traditional Architecture Conservation 215
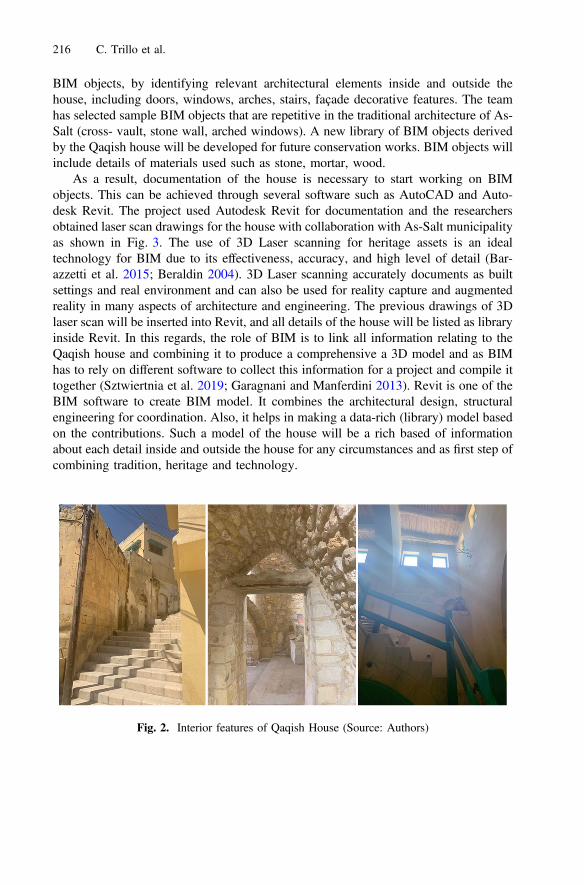
BIM objects, by identifying relevant architectural elements inside and outside thehouse, including doors, windows, arches, stairs, façade decorative features. The teamhas selected sample BIM objects that are repetitive in the traditional architecture of As-Salt (cross- vault, stone wall, arched windows). A new library of BIM objects derivedby the Qaqish house will be developed for future conservation works. BIM objects willinclude details of materials used such as stone, mortar, wood.
As a result, documentation of the house is necessary to start working on BIMobjects. This can be achieved through several software such as AutoCAD and Auto-desk Revit. The project used Autodesk Revit for documentation and the researchersobtained laser scan drawings for the house with collaboration with As-Salt municipalityas shown in Fig. 3. The use of 3D Laser scanning for heritage assets is an idealtechnology for BIM due to its effectiveness, accuracy, and high level of detail (Bar-azzetti et al. 2015; Beraldin 2004). 3D Laser scanning accurately documents as builtsettings and real environment and can also be used for reality capture and augmentedreality in many aspects of architecture and engineering. The previous drawings of 3Dlaser scan will be inserted into Revit, and all details of the house will be listed as libraryinside Revit. In this regards, the role of BIM is to link all information relating to theQaqish house and combining it to produce a comprehensive a 3D model and as BIMhas to rely on different software to collect this information for a project and compile ittogether (Sztwiertnia et al. 2019; Garagnani and Manferdini 2013). Revit is one of theBIM software to create BIM model. It combines the architectural design, structuralengineering for coordination. Also, it helps in making a data-rich (library) model basedon the contributions. Such a model of the house will be a rich based of informationabout each detail inside and outside the house for any circumstances and as first step ofcombining tradition, heritage and technology.
Fig. 2. Interior features of Qaqish House (Source: Authors)
216 C. Trillo et al.
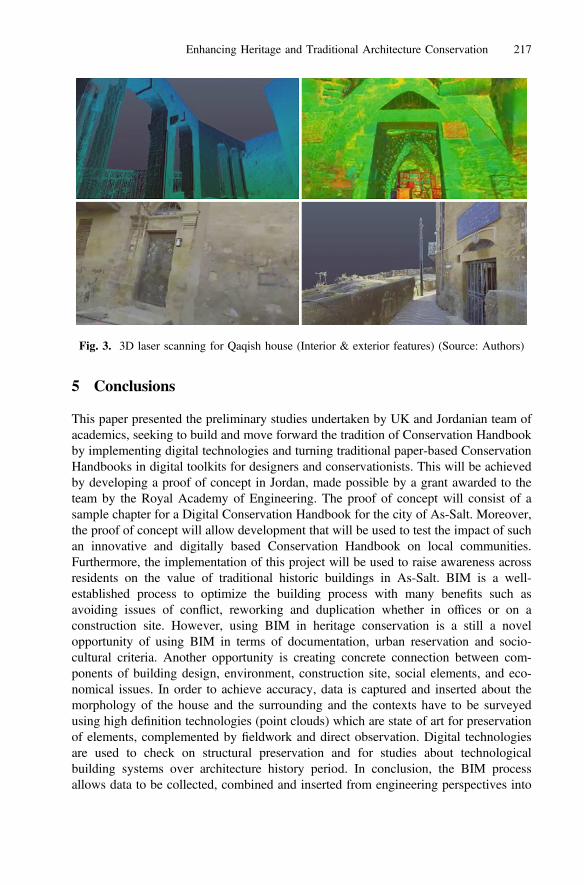
5 Conclusions
This paper presented the preliminary studies undertaken by UK and Jordanian team ofacademics, seeking to build and move forward the tradition of Conservation Handbookby implementing digital technologies and turning traditional paper-based ConservationHandbooks in digital toolkits for designers and conservationists. This will be achievedby developing a proof of concept in Jordan, made possible by a grant awarded to theteam by the Royal Academy of Engineering. The proof of concept will consist of asample chapter for a Digital Conservation Handbook for the city of As-Salt. Moreover,the proof of concept will allow development that will be used to test the impact of suchan innovative and digitally based Conservation Handbook on local communities.Furthermore, the implementation of this project will be used to raise awareness acrossresidents on the value of traditional historic buildings in As-Salt. BIM is a well-established process to optimize the building process with many benefits such asavoiding issues of conflict, reworking and duplication whether in offices or on aconstruction site. However, using BIM in heritage conservation is a still a novelopportunity of using BIM in terms of documentation, urban reservation and socio-cultural criteria. Another opportunity is creating concrete connection between com-ponents of building design, environment, construction site, social elements, and eco-nomical issues. In order to achieve accuracy, data is captured and inserted about themorphology of the house and the surrounding and the contexts have to be surveyedusing high definition technologies (point clouds) which are state of art for preservationof elements, complemented by fieldwork and direct observation. Digital technologiesare used to check on structural preservation and for studies about technologicalbuilding systems over architecture history period. In conclusion, the BIM processallows data to be collected, combined and inserted from engineering perspectives into
Fig. 3. 3D laser scanning for Qaqish house (Interior & exterior features) (Source: Authors)
Enhancing Heritage and Traditional Architecture Conservation 217
other tools to make it available for researchers, experts and generic actors involved inheritage means. The use of BIM that will be tested in this case study is innovative,because it will be related to the aim of creating a digital conservation handbook ontraditional historic buildings in As-Salt. It is expected that as a result of such a study,engagement with local planners and residents will raise awareness on the importance ofvaluing the conservation of the historic centre of As-Salt. Furthermore, the testing willallow for the development of a proof of concept for a BIM based conservationhandbook. Thus, perpetuating this tradition through the instruments of digitaltechnologies.
References
Almatarneh, R.T.: Sustainability lessons learnt from traditional architecture: a case study of theold city of As-Salt, Jordan. IOSR-JESTFT 5(3), 100–109 (2013)
ASCOP. Architectural Heritage in As-Salt City, Jordan. Retrieved from As-Salt, Jordan (2016)Bandarin, F., Oers, R.: The Historic Urban Landscape: Managing Heritage in an Urban Century.
Wiley-Blackwell, Chichester (2012)Barazzetti, L., Banfi, F., Brumana, R., Gusmeroli, G., Previtali, M., Schiantarelli, G.: Cloud-to-
BIM-to-FEM: structural simulation with accurate historic BIM from laser scans. Simul.Model Pract. Theor. 57, 71–78 (2015). https://doi.org/10.1016/j.simpat.2015.06.004
Beraldin, J.-A.: Integration of laser scanning and close-range photogrammetry—the last decadeand beyond. Int. Arch. Photogramm. Remote Sens. 35, 972–983 (2004)
Bryman, A.: Social Research Methods. Oxford University Press, Oxford (2012)Bryman, A., Bell, E.: Business Research Methods. OUP, Oxford (2011)Fakhoury, L.A., Haddad, N.A.: Aspects of the architectural and urban heritage: from registers to
conservation for adaptive and modern use at the historic cores of salt and Irbid, Jordan.Archnet-IJAR 11(2), 190–218 (2017). Accessed from https://archnet.org/publications/12018
Garagnani, S., Manferdini, A.M.: Parametric accuracy: building information modelling processapplied to the cultural heritage preservation. Int. Arch. Photogram. Rem. Sens. Spat. Info. XL(5), 87–92 (2013). https://doi.org/10.5194/isprsarchives-xl-5-w1-87-2013
Ginzarly, M., Houbart, C., Teller, J.: The Historic Urban Landscape approach to urbanmanagement: a systematic review. Int. J. Heritage Stud. 25(10), 999–1019 (2019). https://doi.org/10.1080/13527258.2018.1552615
Giovanetti, F.: The Conservation Handbook for the city of Citta’ di Castello. In: Giovanetti, F.(ed.) Manuale del Recupero di Citta’ di Castello, pp. 17–48. Edizioni DEI Tipografia delGenio Civile, Rome (1992)
Khirfan, L.: Ornamented facades and panoramic views: the impact of tourism development on al-salt’s historic Urban landscape. In: Gharipour, M. (ed.) International Journal of IslamicArchitecture, vol. 2, pp. 307–324. Intellect, Bristol (2013)
Panella, R.: In support of a conservation- driven approach in the reuse of historic architecture. In:Giovanetti, F. (ed.) Manual for the Recovery of the Town of Citta di Castello. DEI Editions,Civil Engineering Typography, Rome (1992)
Pocobelli, D.P., Boehm, J., Bryan, P., Still, J., Grau-Bové, J.: BIM for heritage science: a review.Heritage Sci. 6(1), 30 (2018). https://doi.org/10.1186/s40494-018-0191-4
Sztwiertnia, D., Ochałek, A., Tama, A., Lewińska, P.: Conservation, analysis, and restorationHBIM (heritage Building Information Modell) of the Wang Stave Church in Karpacz -CaseStudy. Int. J. Arch. Heritage 1–15 (2019). https://doi.org/10.1080/15583058.2019.1645238
218 C. Trillo et al.
Turri, E.: Il Paesaggio Come Teatro. Marsilio, Venezia (2001). Accessed from http://www.marsilioeditori.it/catalogo/libro/3176865-il-paesaggio-come-teatro
Udeaja, C., et al.: Scientometric analysis and mapping of digital technologies used in culturalheritage field. Paper presented at the ARCOM 2019, UK (2019)
UNESCO. The UNESCO Recommendation on the Historic Urban Landscape (2011). Accessedfrom Paris, France: https://whc.unesco.org/uploads/activities/documents/activity-638-98.pdf
UNESCO. The HUL guidebook. Paper presented at the 15th World Conference of the League ofHistorical Cities, Bad Ischl, Austria (2016)
Volk, R., Stengel, J., Schultmann, F.: Building Information Modelling (BIM) for existingbuildings—literature review and future needs. Autom. Constr. 38, 109–127 (2014). https://doi.org/10.1016/j.autcon.2013.10.023
Open Access This chapter is licensed under the terms of the Creative Commons Attribution 4.0International License (http://creativecommons.org/licenses/by/4.0/), which permits use, sharing,adaptation, distribution and reproduction in any medium or format, as long as you give appro-priate credit to the original author(s) and the source, provide a link to the Creative Commonslicense and indicate if changes were made.The images or other third party material in this chapter are included in the chapter’s Creative
Commons license, unless indicated otherwise in a credit line to the material. If material is notincluded in the chapter’s Creative Commons license and your intended use is not permitted bystatutory regulation or exceeds the permitted use, you will need to obtain permission directlyfrom the copyright holder.
Enhancing Heritage and Traditional Architecture Conservation 219
Facility Management Services in Smart Cities:Trends and Perspectives
Nazly Atta and Cinzia Talamo(&)
Architecture Built Environment and Construction Engineering—ABCDepartment, Politecnico di Milano, Milan, Italy
Abstract. A Smart City can be defined as a complex socio-technical system inwhich services are optimized by the use of digital telecommunication technologiesfor the benefit of its inhabitants and business activities. The Smart City topic istoday at the centre of many debates at European and international levels, also forthe potential impact of the innovation of urban services within the overall per-formance of cities. Literature and virtuous cases of Smart Cities at the Europeanlevel envisage optimization and innovation scenarios for traditional Urban FacilityManagement (UFM) services, based on the application of Information andCommunication Technologies (ICTs), in particular Internet of Things (IoT) andBig Data management. Although the interest in the transition of the cities towardsSmart Cities by administrations is growing, this transformation process appears tobe still experimental and not much supported by shared knowledge references andtools. In light of this premise, the contribution - that is part of the PRIN research“Metropolitan cities: economic-territorial strategies, financial constraints and cir-cular regeneration” - introduces the main results of the study conducted on asample of 21 cities at the European scale with the aim of deepening and analyzing:(i) current innovation scenarios of UFM services enabled by ICTs that allowinformation sharing (Big Data flows) and a continuous monitoring of infrastruc-tures and physical assets at the urban scale; (ii) characteristics and main trends inthe implementation by public administrations of information platforms for theprovision of smart UFM services and, more in general, for the smart managementof cities; (iii) the potentialities of Milan, investigating the evolution of the offeredsmart urban services and of the adopted cognitive tools to manage city informa-tion, highlighting main trends, strengths and possible scenarios of improvement.
Keywords: Urban Facility Management (UFM) � Smart City � Urban services �Internet of Things � Big Data Management � Information platforms
1 Smart Cities and Scenarios of Innovation of TraditionalUrban Services
The adoption of Information and Communication Technologies (ICTs) is redefining thescenario of traditional Urban Facility Management (UFM), understood as the integratedmanagement of support services for the operation, use and enhancement of urban goods[1]. These services are today affected by important changes, especially in metropolitanareas, due to the evolution of ICT solutions and the application of Internet of Things
© The Author(s) 2020C. Bevilacqua et al. (Eds.): NMP 2020, SIST 177, pp. 220–230, 2020.https://doi.org/10.1007/978-3-030-52869-0_19
(IoT) and Big Data paradigms, which concern aspects such as: methods of data detection,analysis and management; methods of communication/interaction with users; monitoringof performance; methods of response of systems, network interactions, etc. The digital-ization of urban management processes is not simply bringing services towards ICT-based solutions, but it is redefining in a disruptive way the meanings of the concept of thecity itself (digital, eco, green, intelligent, sustainable, etc.) [2, 3], multiplying the inter-pretive keys of its cognitive methods [4], dynamically expanding its boundaries (from thesmart city to the smart region) in relation to the growth of networks based on smartspecialization strategies [5, 6]. It is a scenario characterized by a heterogeneity of inter-pretations and experiments [7–10] in which the evolution of the new ICT technologicaloffer plays an important role in placing the importance of services as enablers of trans-formations of the behaviors of the different categories of stakeholders [11] as well as in themanagement of tangible and intangible assets and related parameters for urban perfor-mance assessment [8]. Thus, it arises the need to acquire interpretation tools, capable ofrelating the consolidated methods of analysis and forecasting of the dynamics of devel-opment of urban systems with phenomena linked to the evolution of services, consideredin a smart perspective [12]. Therefore, the paper aims to highlight trends and propose newclassification schemes useful for describing new/renewed UFM services affected bydigital evolution, new service management models, enabling technologies and informa-tion sources. To this end, it has been developed a European-scale analysis of smart urbanservices, here offered in a sample of significant Smart City experiences. The sample wasdefined by selecting cities that: (i) have been involved in projects concerning ICTapplications in urban service management under the EU’s 7th Framework Program orHorizon2020; (ii) are developing/have developed initiatives, policies, guidelines and/orstrategies relating to the integration of ICTs in the management of urban FM services. Thesample consists of 21 cities1. The analysis of smart urban services assumes and relates thefollowing three levels:
• Domains of the Smart City. They are widely shared in literature [13, 14] and theyrepresent the different sectors of urban development, classified as follows: People,Economy, Governance, Mobility, Environment, Living [15, 16];
• Domains of UFM. By comparing the traditional UFM services with the Smart Citydomains, it arises the need to propose a new set of urban FM domains [1, 17, 18].The urban FM domains thus identified are: Building, Energy, Education, Gover-nance, Environment, Business, Mobility, Health, Waste, Safety & Security, Water;
• Smart services in relation to different application fields. According to Rapaccini andGaiardelli (2015) it is possible to “define the service as intelligent or smart whenthis is provided in order to anticipate problems/needs of the customer, thanks toICTs that favor the acquisition and processing of contextual information. Theobjective is to provide proposals for intervention in less time and with less effort
1 Antwerp (Belgium), Barcelona (Spain), Berlin (Germany), Bristol (UK), Copenhagen (Denmark),Eindhoven (The Netherlands), Espoo (Finland), Geneva (Switzerland), Genoa (Italy), Lisbon(Portugal), London (UK), Lyon (France), Milan (Italy), Munich (Germany), Nice (France), Padova(Italy), Santander (Spain), Stavanger (Norway), Stockholm (Sweden), Vienna (Austria), Warsaw(Poland).
Facility Management Services in Smart Cities 221

and costs” [19]. Examples of smart UFM services are: Smart Street Lighting Mgmt;Energy Grid Mgmt; Smart Bins Monitoring & Dynamic Scheduling; Smart WaterMgmt & Real-time Leakage Detection; etc. Parallel to these innovative services,there are also sharing and delivery services - such as bike/car sharing, co-working,food delivery, etc. - which represent another important emerging ICT-based servicecategory [20].
In relation to this classification structure, a qualitative comparative analysis wasconducted to identify the smart city and UFM domains most affected by the adoption ofadvanced ICT solutions and to identify the main characteristics of smart services.Table 1 shows a summary of the sample review.
Table 1. Summary of the survey on 21 European Smart Cities: smart UFM services, trends bydomain and innovative strategies for the planning and delivery of services. Adapted from [2]
SC domain Service Strategy Innovation Smart Cities
Energy ∙ Continuous monitoring of energy consumption anddata analyses provide insights on energy demand aturban/district scale for the identification and location(GIS) of peak hours and for the identification of areaswith energy surplus able to support any neighbouringareas in energy deficit∙ Smart lighting systems (motion and presence sensorsand actuators for switching street lighting on/off) toimprove citizens’ perception of safety
Eindhoven, Milan,Padova, Stockholm,Espoo, Nice
Waste ∙ Wireless ultrasonic sensors that detect the filling levelof waste containers∙ Planning and optimization of waste collection routes:geo-location data of the containers together with datafrom the sensors about their filling level allow toidentify real-time the most efficient routes for wastecollection∙ Municipal waste management platform: drivers ofcollection vehicles can use mobile apps to scan, confirmand generate report on any event (e.g. automatic billingfor the collection of waste on request)
Berlin, Vienna,Barcelona, Lisbon,Stockholm
Building ∙ Real-time monitoring of energy consumption (e.g.identification of peaks)∙ Real-time adjustment of the energy distribution∙ Scheduling maintenance and cleaning interventionsbased on actual use (no longer periodic interventionswith frequencies defined on a statistical basis but real-time monitoring of the operating conditions of theelements and interventions according to real conditions)∙ Real-time monitoring of user behaviour (use of as-sets,fixed furnishings, preferences, etc.) to improve themanagement of spaces and internal layout
Stavanger, Warsaw,Antwerp, Lyon,Geneva, Lisbon,Genoa
(continued)
222 N. Atta and C. Talamo
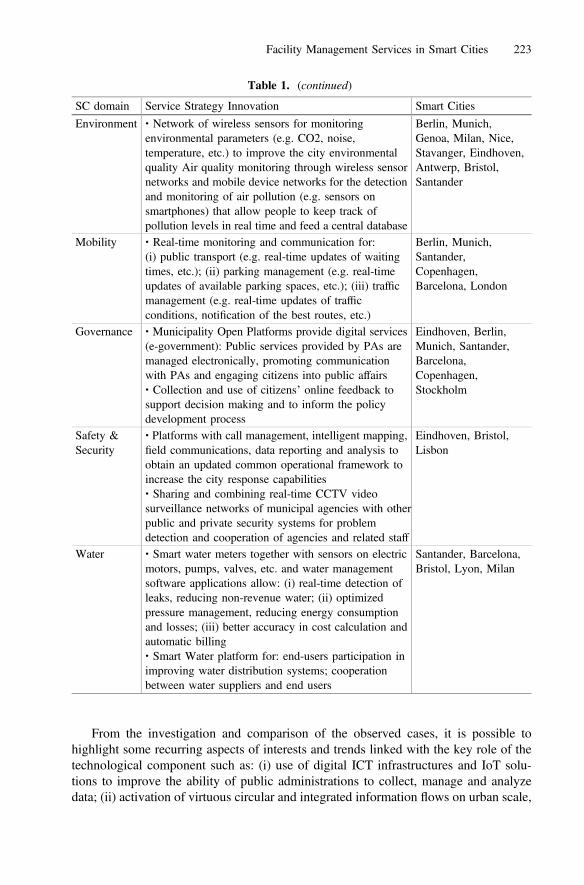
From the investigation and comparison of the observed cases, it is possible tohighlight some recurring aspects of interests and trends linked with the key role of thetechnological component such as: (i) use of digital ICT infrastructures and IoT solu-tions to improve the ability of public administrations to collect, manage and analyzedata; (ii) activation of virtuous circular and integrated information flows on urban scale,
Table 1. (continued)
SC domain Service Strategy Innovation Smart Cities
Environment ∙ Network of wireless sensors for monitoringenvironmental parameters (e.g. CO2, noise,temperature, etc.) to improve the city environmentalquality Air quality monitoring through wireless sensornetworks and mobile device networks for the detectionand monitoring of air pollution (e.g. sensors onsmartphones) that allow people to keep track ofpollution levels in real time and feed a central database
Berlin, Munich,Genoa, Milan, Nice,Stavanger, Eindhoven,Antwerp, Bristol,Santander
Mobility ∙ Real-time monitoring and communication for:(i) public transport (e.g. real-time updates of waitingtimes, etc.); (ii) parking management (e.g. real-timeupdates of available parking spaces, etc.); (iii) trafficmanagement (e.g. real-time updates of trafficconditions, notification of the best routes, etc.)
Berlin, Munich,Santander,Copenhagen,Barcelona, London
Governance ∙ Municipality Open Platforms provide digital services(e-government): Public services provided by PAs aremanaged electronically, promoting communicationwith PAs and engaging citizens into public affairs∙ Collection and use of citizens’ online feedback tosupport decision making and to inform the policydevelopment process
Eindhoven, Berlin,Munich, Santander,Barcelona,Copenhagen,Stockholm
Safety &Security
∙ Platforms with call management, intelligent mapping,field communications, data reporting and analysis toobtain an updated common operational framework toincrease the city response capabilities∙ Sharing and combining real-time CCTV videosurveillance networks of municipal agencies with otherpublic and private security systems for problemdetection and cooperation of agencies and related staff
Eindhoven, Bristol,Lisbon
Water ∙ Smart water meters together with sensors on electricmotors, pumps, valves, etc. and water managementsoftware applications allow: (i) real-time detection ofleaks, reducing non-revenue water; (ii) optimizedpressure management, reducing energy consumptionand losses; (iii) better accuracy in cost calculation andautomatic billing∙ Smart Water platform for: end-users participation inimproving water distribution systems; cooperationbetween water suppliers and end users
Santander, Barcelona,Bristol, Lyon, Milan
Facility Management Services in Smart Cities 223

together with standardized communication processes for the exchange of informationin real time between the city administration and citizens; (iii) overcoming of the“physical place” as an unavoidable dimension of the activities, guaranteeing, forexample, multimodal accessibility to useful data and digital services. Focusing onsmart UFM services, several common trends emerge from the analysis of case studies:
1. Bottom-up approach to the planning and delivery of urban services and the riseof a new social entrepreneurship. Unlike traditional UFM services, that essentiallyfollow a top-down approach in design [21, 22], in the case of smart services it ispossible to observe a bottom-up approach. These services are created mainly through“bottom-up” processes, enabled by ICTs, with the involvement of various actors (de-velopers, users, etc.), who have an active role in the recognition of problems and needsand, in some cases, in the definition of application proposals, such as: reporting ofaccidents and roadblocks (London), the case of voluntary citizens’ organizations tocarry out cleaning and maintenance of local common goods (Barcelona), or the morestructured cases of car pooling applications or short-term hosting proposed directly bycitizens. This new concept of services derives from the integration of public admin-istrations (in an open government logic, thanks to databases, web applications and openinformation platforms for data sharing made available to all by PAs) and the “privates”,no longer intended only as traditional private players (e.g. private service providercompanies), but as an aggregation of small players, such as developers, interestedcitizens, researchers, technology suppliers, etc., which generates novel forms of socialentrepreneurship;
2. Services based on real-time data and data-driven decision-making processes.Smart services involve increasingly dynamic data flows available in real time. Thismakes possible a continuous monitoring (as in the cases of the Real Time Networks inVienna and the London Datastore in London) and the application of different forms of“sensing and responding” [23];
3. Existence of two main approaches in acquiring both static (from statisticalsources) and dynamic data from smart devices (sensors, tags, GPS, GIS, smart-phones,etc.), confirming the two approaches described by the British Standard Institute in theCity data survey report [24]. A first approach which consists in the targeted collectionof data, following the identification of one or more urban issues (as in the case ofLondon which focuses on optimizing the provision of public transport in less centralareas of the city). The limit of this approach is an excessive siloed vision focused onsingle services within the same domain, which if - on one hand - has the benefit ofoptimizing a certain service - on the other - presents the risk of precluding the possi-bility of integrating large amounts of data coming from other domains or other services.The second approach consists in the massive collection of large amounts of real-timedata concerning several aspects of the city useful for several services (cross-domain),with a view to Big Data Analytics systems (as in the case of SmartSantander projectwhich envisaged the implementation of 20,000 sensors in Belgrade, Guildford, Lübeckand Santander - which alone has 12,000 sensors - to test and exploit the potential ofdata analysis technologies and techniques). The risk of this approach is an overabun-dance of data, from which it may be difficult to derive effective value in absence ofclear aims;
224 N. Atta and C. Talamo

4. Integrated approach to the management of urban services. The pursuit of inte-grated approaches to city management supported by ICT-oriented services can beextensively observed (e.g. Vienna, London, Eindhoven, Santander, Berlin, etc.). Thismarks a trend towards the shift from a siloed approach to integrated approaches in theorganizational models of municipalities. It means the transition from organizationsbased on independent decision-making and operational centres referring to individualvertical domains, with problems of communication and information sharing [25], tofunctions of “integrated holistic governance” [26, 27], relying on shared knowledgebases thanks to the use of information platforms and organizational models based onintegrated and collaborative decision-making centres [7, 28].
The case studies highlight how the achievement of this systemic and holistic visionof urban management depends on the implementation of a Smart City Platform which,in this context, represents a key enabling factor.
2 Enabling Technologies and Tools for InformationManagement Within Smart Cities
The analysis of the sample reveals a particular attention paid by municipalities toimplement information platforms. Although this implementation process appears to bestill at an experimental stage and little supported by shared references and supporttools, the investigated cities contribute to recognize the key role of the platforms inenabling the delivery of new digital services. The Smart City Platform has the potentialto gather experiences, skills and knowledge and to set up a common development planfor all the sets of smart services offered within the various city domains. The cases ofBarcelona, Berlin, London and Vienna highlight a further meaning of platform, onwhich it is worth paying attention, defined as Open Smart City Platform. This meaningrefers to the fundamental concepts of:
– accessibility. Public administrations are increasingly aware that their data representa heritage for the community. The accessibility and diffusion of city data play animportant role for various stakeholders (investors, facility managers, urban plan-ners, developers, service providers, citizens, etc.) to support decision-making pro-cesses at different levels (strategic, operational) [29];
– interoperability, i.e. the ability of the platform to work in a coordinated way withother systems (e.g. other databases, devices and sensors, Continuous MonitoringSystem, Energy Management System, Data Analysis System, etc.) by exchangingdata in interoperable formats in order to exploit the benefits of data systemizationand the potential of calculation and analysis of specialized software [30]. In thisway it is possible to overcome the problem of integration of heterogeneous data(different languages, formats, etc.) coming from different systems;
– open and expandable platform structure. An open platform is based on the use ofIoT technologies and exploits the capabilities of Big Data Management. Theanalysis of the platforms available on the market has highlighted a recurrence in thecharacteristics of their structure: modular, multi-layer, multi-tenant, scalable andexpandable over time [31]. In particular, the performed analysis highlighted the
Facility Management Services in Smart Cities 225
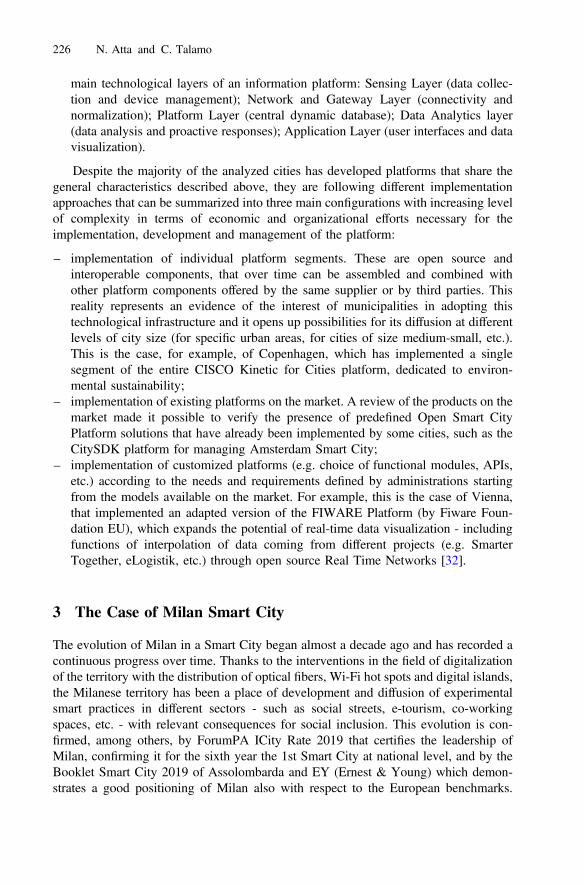
main technological layers of an information platform: Sensing Layer (data collec-tion and device management); Network and Gateway Layer (connectivity andnormalization); Platform Layer (central dynamic database); Data Analytics layer(data analysis and proactive responses); Application Layer (user interfaces and datavisualization).
Despite the majority of the analyzed cities has developed platforms that share thegeneral characteristics described above, they are following different implementationapproaches that can be summarized into three main configurations with increasing levelof complexity in terms of economic and organizational efforts necessary for theimplementation, development and management of the platform:
– implementation of individual platform segments. These are open source andinteroperable components, that over time can be assembled and combined withother platform components offered by the same supplier or by third parties. Thisreality represents an evidence of the interest of municipalities in adopting thistechnological infrastructure and it opens up possibilities for its diffusion at differentlevels of city size (for specific urban areas, for cities of size medium-small, etc.).This is the case, for example, of Copenhagen, which has implemented a singlesegment of the entire CISCO Kinetic for Cities platform, dedicated to environ-mental sustainability;
– implementation of existing platforms on the market. A review of the products on themarket made it possible to verify the presence of predefined Open Smart CityPlatform solutions that have already been implemented by some cities, such as theCitySDK platform for managing Amsterdam Smart City;
– implementation of customized platforms (e.g. choice of functional modules, APIs,etc.) according to the needs and requirements defined by administrations startingfrom the models available on the market. For example, this is the case of Vienna,that implemented an adapted version of the FIWARE Platform (by Fiware Foun-dation EU), which expands the potential of real-time data visualization - includingfunctions of interpolation of data coming from different projects (e.g. SmarterTogether, eLogistik, etc.) through open source Real Time Networks [32].
3 The Case of Milan Smart City
The evolution of Milan in a Smart City began almost a decade ago and has recorded acontinuous progress over time. Thanks to the interventions in the field of digitalizationof the territory with the distribution of optical fibers, Wi-Fi hot spots and digital islands,the Milanese territory has been a place of development and diffusion of experimentalsmart practices in different sectors - such as social streets, e-tourism, co-workingspaces, etc. - with relevant consequences for social inclusion. This evolution is con-firmed, among others, by ForumPA ICity Rate 2019 that certifies the leadership ofMilan, confirming it for the sixth year the 1st Smart City at national level, and by theBooklet Smart City 2019 of Assolombarda and EY (Ernest & Young) which demon-strates a good positioning of Milan also with respect to the European benchmarks.
226 N. Atta and C. Talamo

Analyzing the city according to three macro-categories of observation of smartness -namely: services and applications; sensing technology; database and data analysis - it ispossible to observe how Milan has already widely undertaken smart projects. Theseprojects are now consolidated in some domains (e.g. mobility and energy) in terms ofsensor installation and provision of smart services through various digital applicationsand interfaces available to citizens. In particular, among the services offered in Milan,sharing mobility services (e.g. car and bike sharing, etc.) and sustainable energy ser-vices (e.g. district heating networks, etc.) appear to be competitive with respect to theEuropean benchmarks [11]. As regards the digitalization of infrastructures throughsensors and smart devices, Milan presents a remarkable development of the applicationof sensors in the public transport and road networks (e.g. sensors for detecting avail-ability of bike and car sharing vehicles, GPS sensors for local public transport vehicles,traffic detection sensors, occupancy sensors for public car parks), public lighting andenergy network monitoring (e.g. smart metering for water and gas networks). The bigdata generated by these sensor systems should be processed through the informationplatform in order to improve the offered services. However, the city seems to be not yetfully able to exploit dynamic data for understanding frequencies and intensity of use ofthe different offered services, users behaviors, etc., useful for outlining possible futurecity service strategies. In particular, Milan owns an Open Database [33], accessiblethrough the municipal website, but it has not yet developed solutions for integratingdynamic data from sensors and from smart services. Milan published on the Munici-pality portal about 420 open datasets, a substantially lower number of datasets com-pared to cities such as London, Berlin and Lyon (more than 1000 datasets).Furthermore, the majority of published Open Data are still of a “static” nature (e.g. kmof road infrastructure, no. bus stops, no. subway lines and stops, etc.) or statistics (e.g.from censuses, reports, etc.) and not coming in real time from sensors/services. In thisregard, it is important to underline that the number of datasets present within the opendatabase is partially influenced by the willingness - expressed by the managers of smartservices - to share dynamic data with the city administration. To sensitize public andprivate actors to the topic of Open Data, Milan has joined from 2015 the DigitalEcosystem E015, an initiative promoted by Lombardy Region, with Confindustria,CCIAA di Milano, Confcommercio, Assolombarda, Unione del Commercio andtechnical-scientific coordination by Cefriel. This initiative aims to encourage “thecreation of digital relationships between public and private subjects interested inenhancing their digital heritage by sharing it or in enriching the software solutions fortheir users with the features and information shared by the other participants” [34].Digital Ecosystem E015 aims to develop a platform for the collection and integration ofheterogeneous and multi-thematic data useful for the development of new services indifferent sectors (e.g. tourism, transport, culture, etc.). The initiative involved thedevelopment and publication of various APIs (Application Programming Interfaces),written according to common guidelines, which allow the sharing of information andfunctionalities. Currently the E015 catalogue has more than a hundred APIs of whichabout one fifth related to Milan (e.g. Around Me, etc.). The apps developed for Milanfrom the data made available on the platform mainly relate to mobility, tourism andculture (e.g. ATM GiroMilano; Milan Airports; etc.). Following the example of Lon-don, Lyon and Amsterdam, Milan could update the geo-localized data coming in real
Facility Management Services in Smart Cities 227
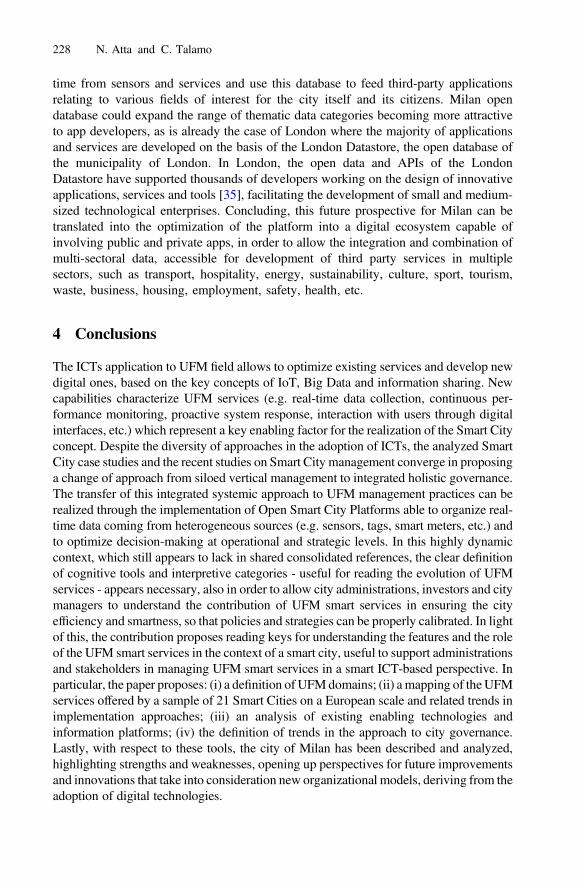
time from sensors and services and use this database to feed third-party applicationsrelating to various fields of interest for the city itself and its citizens. Milan opendatabase could expand the range of thematic data categories becoming more attractiveto app developers, as is already the case of London where the majority of applicationsand services are developed on the basis of the London Datastore, the open database ofthe municipality of London. In London, the open data and APIs of the LondonDatastore have supported thousands of developers working on the design of innovativeapplications, services and tools [35], facilitating the development of small and medium-sized technological enterprises. Concluding, this future prospective for Milan can betranslated into the optimization of the platform into a digital ecosystem capable ofinvolving public and private apps, in order to allow the integration and combination ofmulti-sectoral data, accessible for development of third party services in multiplesectors, such as transport, hospitality, energy, sustainability, culture, sport, tourism,waste, business, housing, employment, safety, health, etc.
4 Conclusions
The ICTs application to UFM field allows to optimize existing services and develop newdigital ones, based on the key concepts of IoT, Big Data and information sharing. Newcapabilities characterize UFM services (e.g. real-time data collection, continuous per-formance monitoring, proactive system response, interaction with users through digitalinterfaces, etc.) which represent a key enabling factor for the realization of the Smart Cityconcept. Despite the diversity of approaches in the adoption of ICTs, the analyzed SmartCity case studies and the recent studies on Smart City management converge in proposinga change of approach from siloed vertical management to integrated holistic governance.The transfer of this integrated systemic approach to UFM management practices can berealized through the implementation of Open Smart City Platforms able to organize real-time data coming from heterogeneous sources (e.g. sensors, tags, smart meters, etc.) andto optimize decision-making at operational and strategic levels. In this highly dynamiccontext, which still appears to lack in shared consolidated references, the clear definitionof cognitive tools and interpretive categories - useful for reading the evolution of UFMservices - appears necessary, also in order to allow city administrations, investors and citymanagers to understand the contribution of UFM smart services in ensuring the cityefficiency and smartness, so that policies and strategies can be properly calibrated. In lightof this, the contribution proposes reading keys for understanding the features and the roleof the UFM smart services in the context of a smart city, useful to support administrationsand stakeholders in managing UFM smart services in a smart ICT-based perspective. Inparticular, the paper proposes: (i) a definition of UFMdomains; (ii) a mapping of theUFMservices offered by a sample of 21 Smart Cities on a European scale and related trends inimplementation approaches; (iii) an analysis of existing enabling technologies andinformation platforms; (iv) the definition of trends in the approach to city governance.Lastly, with respect to these tools, the city of Milan has been described and analyzed,highlighting strengths and weaknesses, opening up perspectives for future improvementsand innovations that take into consideration new organizational models, deriving from theadoption of digital technologies.
228 N. Atta and C. Talamo
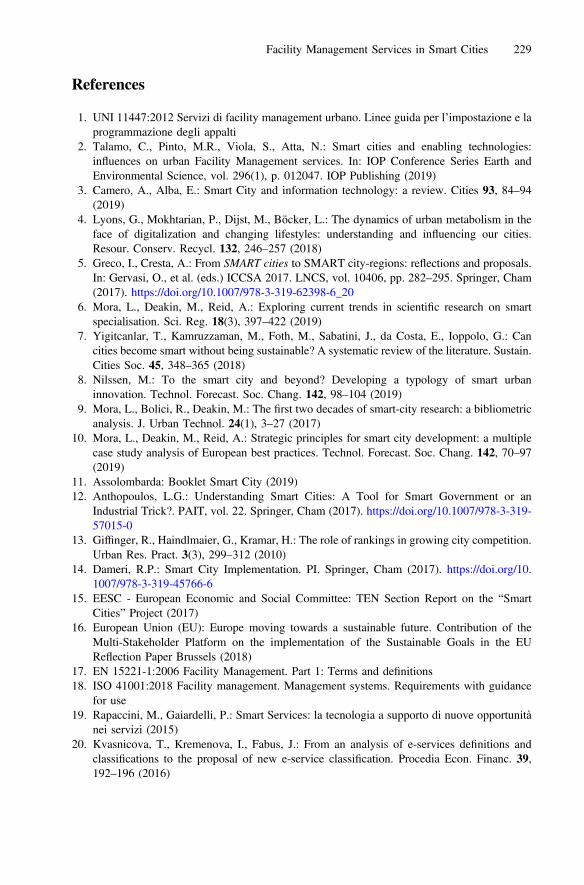
References
1. UNI 11447:2012 Servizi di facility management urbano. Linee guida per l’impostazione e laprogrammazione degli appalti
2. Talamo, C., Pinto, M.R., Viola, S., Atta, N.: Smart cities and enabling technologies:influences on urban Facility Management services. In: IOP Conference Series Earth andEnvironmental Science, vol. 296(1), p. 012047. IOP Publishing (2019)
3. Camero, A., Alba, E.: Smart City and information technology: a review. Cities 93, 84–94(2019)
4. Lyons, G., Mokhtarian, P., Dijst, M., Böcker, L.: The dynamics of urban metabolism in theface of digitalization and changing lifestyles: understanding and influencing our cities.Resour. Conserv. Recycl. 132, 246–257 (2018)
5. Greco, I., Cresta, A.: From SMART cities to SMART city-regions: reflections and proposals.In: Gervasi, O., et al. (eds.) ICCSA 2017. LNCS, vol. 10406, pp. 282–295. Springer, Cham(2017). https://doi.org/10.1007/978-3-319-62398-6_20
6. Mora, L., Deakin, M., Reid, A.: Exploring current trends in scientific research on smartspecialisation. Sci. Reg. 18(3), 397–422 (2019)
7. Yigitcanlar, T., Kamruzzaman, M., Foth, M., Sabatini, J., da Costa, E., Ioppolo, G.: Cancities become smart without being sustainable? A systematic review of the literature. Sustain.Cities Soc. 45, 348–365 (2018)
8. Nilssen, M.: To the smart city and beyond? Developing a typology of smart urbaninnovation. Technol. Forecast. Soc. Chang. 142, 98–104 (2019)
9. Mora, L., Bolici, R., Deakin, M.: The first two decades of smart-city research: a bibliometricanalysis. J. Urban Technol. 24(1), 3–27 (2017)
10. Mora, L., Deakin, M., Reid, A.: Strategic principles for smart city development: a multiplecase study analysis of European best practices. Technol. Forecast. Soc. Chang. 142, 70–97(2019)
11. Assolombarda: Booklet Smart City (2019)12. Anthopoulos, L.G.: Understanding Smart Cities: A Tool for Smart Government or an
Industrial Trick?. PAIT, vol. 22. Springer, Cham (2017). https://doi.org/10.1007/978-3-319-57015-0
13. Giffinger, R., Haindlmaier, G., Kramar, H.: The role of rankings in growing city competition.Urban Res. Pract. 3(3), 299–312 (2010)
14. Dameri, R.P.: Smart City Implementation. PI. Springer, Cham (2017). https://doi.org/10.1007/978-3-319-45766-6
15. EESC - European Economic and Social Committee: TEN Section Report on the “SmartCities” Project (2017)
16. European Union (EU): Europe moving towards a sustainable future. Contribution of theMulti-Stakeholder Platform on the implementation of the Sustainable Goals in the EUReflection Paper Brussels (2018)
17. EN 15221-1:2006 Facility Management. Part 1: Terms and definitions18. ISO 41001:2018 Facility management. Management systems. Requirements with guidance
for use19. Rapaccini, M., Gaiardelli, P.: Smart Services: la tecnologia a supporto di nuove opportunità
nei servizi (2015)20. Kvasnicova, T., Kremenova, I., Fabus, J.: From an analysis of e-services definitions and
classifications to the proposal of new e-service classification. Procedia Econ. Financ. 39,192–196 (2016)
Facility Management Services in Smart Cities 229
21. Andersen, M.K., Queck, P.F.: Service Innovation in the Facility Management Industry. ISSWhite Paper, Aspector (2011)
22. Breuer, J., Walravens, N., Ballon, P.: Beyond defining the smart city. Meeting top-down andbottom-up approaches in the middle. TeMA: J. Land Use Mobil. Environ. 7, 153–164 (2014)
23. Talamo, C., Atta, N., Martani, C., Paganin, G.: The integration of physical and digital urbaninfrastructures: the role of “Big data”. TECHNE-J. Technol. Archit. Environ. 11, 217–225(2016)
24. BSI: City data survey report for BSI in support of understanding data requirements andstandards for smart city initiatives (2015)
25. OICE: Smart City: uno strumento per le Comunità Intelligenti (2017)26. Lee, H.J., Kim, M.: Smart Connected City for Holistic Services. Broadband Commun. Netw.
Recent Adv. Lessons Pract. 297 (2018)27. Mutiara, D., Yuniarti, S., Pratama, B.: Smart governance for smart city. In: IOP Conference
Series: Earth and Environmental Science, vol. 126(1), p. 012073. IOP Publishing (2018)28. Lytras, M., Visvizi, A.: Who uses smart city services and what to make of it: toward
interdisciplinary smart cities research. Sustainability 10(6), 1998 (2018)29. Li, Y.: An integrated platform for the internet of things based on an open source ecosystem.
Future Internet 10(11), 105 (2018)30. Bröring, A., et al.: Enabling IoT ecosystems through platform interoperability. IEEE Softw.
34(1), 54–61 (2017)31. Santana, E.F.Z., Chaves, A.P., Gerosa, M.A., Kon, F., Milojicic, D.S.: Software platforms
for smart cities: concepts, requirements, challenges, and a unified reference architecture.ACM Comput. Surv. (CSUR) 50(6), 78 (2018)
32. Smart City Wien website. https://smartdata.wien/iot. Accessed 07 Jan 202033. Comune di Milano - Open Data. http://dati.comune.milano.it. Accessed 07 Jan 202034. E015 - Regione Lombardia website. https://www.e015.regione.lombardia.it. Accessed 07
Jan 202035. Greater London Authority - London Database website. https://data.london.gov.uk. Accessed
07 Jan 2020
Open Access This chapter is licensed under the terms of the Creative Commons Attribution 4.0International License (http://creativecommons.org/licenses/by/4.0/), which permits use, sharing,adaptation, distribution and reproduction in any medium or format, as long as you give appro-priate credit to the original author(s) and the source, provide a link to the Creative Commonslicense and indicate if changes were made.The images or other third party material in this chapter are included in the chapter's Creative
Commons license, unless indicated otherwise in a credit line to the material. If material is notincluded in the chapter's Creative Commons license and your intended use is not permitted bystatutory regulation or exceeds the permitted use, you will need to obtain permission directlyfrom the copyright holder.
230 N. Atta and C. Talamo
Evolution and Transformation of Real EstateDynamics in the City of Milan
Liala Baiardi(&) and Andrea Ciaramella
Politecnico di Milano, Milan 20133, [email protected]
Abstract. With the foundation of metropolitan cities, we have witnessed atransition that has implemented the drivers of change and innovation in largecities, towards the production of knowledge and all the resources necessary toface international competition and overcome possible structural crises on aterritorial basis.This article shows some results of a study on Italian metropolitan cities, to
investigate the extent to which the values of the real estate market and landrevenues are linked to the performance of the cities and the territory.Through a series of parameters and the grouping of investments by the main
real estate players, this study seeks to answer the following research question:following the development activities in the Italian metropolitan cities, did realestate properties increase their value and their revenues?The phenomenon of urbanization of metropolitan cities is analyzed by
proposing a framework for the analysis of the real estate profile on ametropolitan-tan scale, in order to understand the role of this entity in relation toaspects of social cohesion and economic-environmental sustainability.
Keywords: Real estate development � Investment � Metropolitan cities
1 Introduction
With the establishment of “metropolitan cities”, approved by the Italian government in2014 (L. 7 April 2014, n. 56 on “Provisions on metropolitan cities, provinces, unionsand mergers of municipalities”), we have witnessed a significant transition. Theestablishment of metropolitan cities requires overcoming the critical issues and linksthat these contexts face on different scales and dimensions - mainly economic, envi-ronmental and social - including aspects relating to the variation of settlement/functional trends and the complexities of urban transformation/regeneration processesand building restoration.
In this scenario, which reveals an increasing competitiveness between territory,cities, geographical areas and territorial systems, public institutions are involved in therelaunching and requalification activities. They are aware of the fact that in the com-petition between urban areas the most dynamic “systems” able to combine the pro-tection of their territory with the development hypotheses will be awarded [1].
Metropolitan cities have been entitled to become drivers of change and innovation,privileged centers of knowledge production, powerful competitors in international
© The Author(s) 2020C. Bevilacqua et al. (Eds.): NMP 2020, SIST 177, pp. 231–238, 2020.https://doi.org/10.1007/978-3-030-52869-0_20

markets, and enablers to overcome crises [2]. Metropolitan cities are expected todemonstrate “the capacity to recover quickly from difficulties” [3], hence to tow ter-ritories toward resilience, as for the Oxford dictionary’s definition.
The paper analyzes the metropolitan dynamics an focus on Milanese experience asan example of urban resilience, by exploring the real estate strategies that supported therecovery from the crisis.
2 Methodology of Investigation
In the last ten years, extensive researches have sought to assess the dynamics involvedin the metropolitan cities by comparing them with one another. Most of these studieshave defined synthetic indicators to measure urban smartness [4] and also its dimen-sions and productivity [5].
Some observers note that although indicators are a powerful means of describingcomplex phenomena and supporting decision-making processes to define effectivestrategies and urban actions, they may sometimes be ineffective for measuring elementssuch as social, demographic, and cultural differences between cities [6, 7].
The Research Project of Relevant National Interest - PRIN “Metropolitan cities:territorial economic strategies, financial constraints and circular regeneration” hisaimed to improve the knowledge system regarding the functions, structure and per-formance of Metropolitan Cities, as well as the role to be assigned to second and thirdorder cities, “territorial order centers”, in a context of reduced functionality and ten-dential disappearance of the Provinces.
The analysis of the real estate profile implies data processing, after gatheringinformation from the principal official sources reporting the national real estate marketbehavior.
We analyzed official data provided by the main real estate operators and also focuson data from the Real Estate Market Observatory (Italian OMI – Osservatorio delMercato Immobiliare), and large database, provided to Politecnico by “Il QuotidianoImmobiliare” – QI (https://www.ilqi.it/post/quotidiano-immobiliare), the first Italianonline magazine and search engine about real estate issues.
The results of these multiple-method examination will be presented in the followingsections of this paper.
3 Metropolitan Cities and Real Estate Investments in Italy
In Italy, the law of April 7, 2014 no. 56 the establishment, redefining the provincialsystem. The measure identified ten metropolitan cities. According to the geographicalareas defined by the Italian National Institute of Statistics (ISTAT), the 10 citiesapproved by the law 2014 no. 56, were structured into three classes [8]:
– Northern metropolitan cities: Turin, Milan, Genoa and Bologna;– Central metropolitan cities: Florence and Rome;– Southern metropolitan cities: Bari, Naples, Reggio Calabria.
232 L. Baiardi and A. Ciaramella
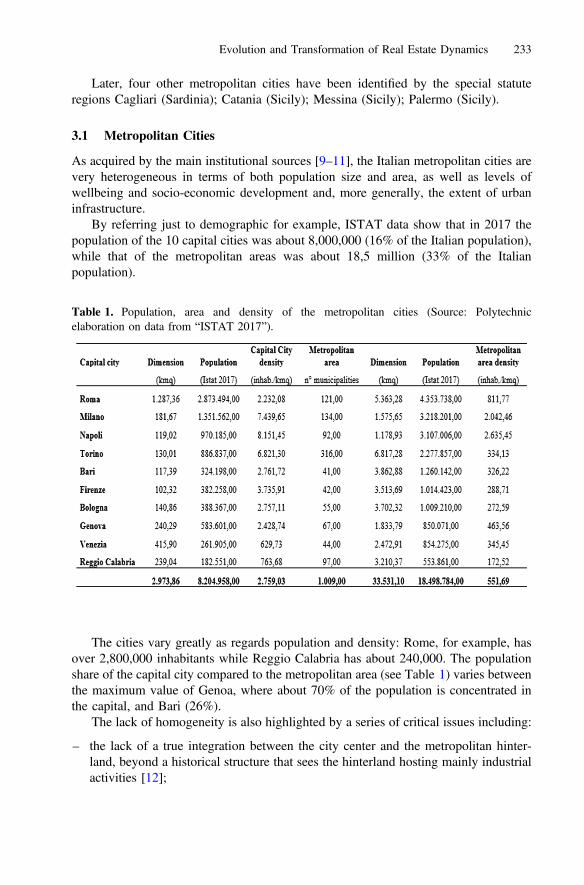
Later, four other metropolitan cities have been identified by the special statuteregions Cagliari (Sardinia); Catania (Sicily); Messina (Sicily); Palermo (Sicily).
3.1 Metropolitan Cities
As acquired by the main institutional sources [9–11], the Italian metropolitan cities arevery heterogeneous in terms of both population size and area, as well as levels ofwellbeing and socio-economic development and, more generally, the extent of urbaninfrastructure.
By referring just to demographic for example, ISTAT data show that in 2017 thepopulation of the 10 capital cities was about 8,000,000 (16% of the Italian population),while that of the metropolitan areas was about 18,5 million (33% of the Italianpopulation).
The cities vary greatly as regards population and density: Rome, for example, hasover 2,800,000 inhabitants while Reggio Calabria has about 240,000. The populationshare of the capital city compared to the metropolitan area (see Table 1) varies betweenthe maximum value of Genoa, where about 70% of the population is concentrated inthe capital, and Bari (26%).
The lack of homogeneity is also highlighted by a series of critical issues including:
– the lack of a true integration between the city center and the metropolitan hinter-land, beyond a historical structure that sees the hinterland hosting mainly industrialactivities [12];
Table 1. Population, area and density of the metropolitan cities (Source: Polytechnicelaboration on data from “ISTAT 2017”).
Evolution and Transformation of Real Estate Dynamics 233
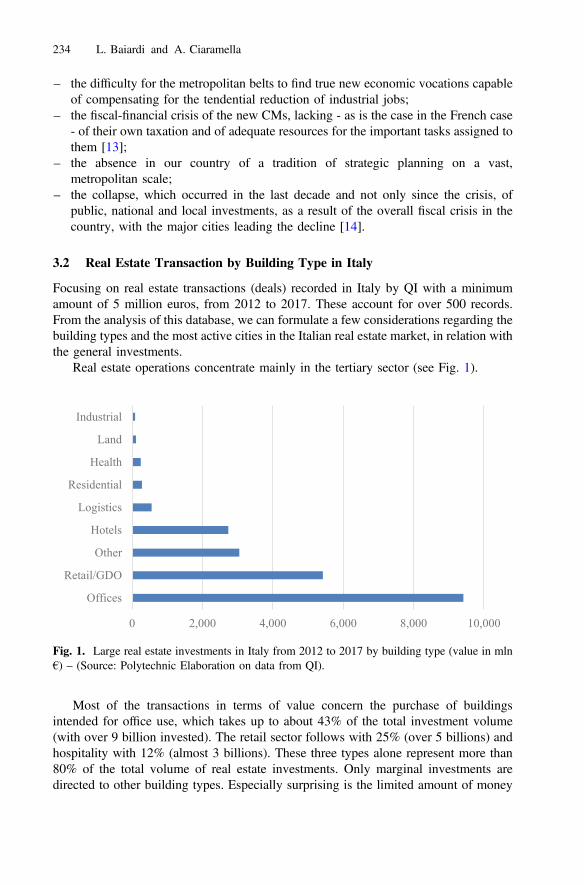
– the difficulty for the metropolitan belts to find true new economic vocations capableof compensating for the tendential reduction of industrial jobs;
– the fiscal-financial crisis of the new CMs, lacking - as is the case in the French case- of their own taxation and of adequate resources for the important tasks assigned tothem [13];
– the absence in our country of a tradition of strategic planning on a vast,metropolitan scale;
– the collapse, which occurred in the last decade and not only since the crisis, ofpublic, national and local investments, as a result of the overall fiscal crisis in thecountry, with the major cities leading the decline [14].
3.2 Real Estate Transaction by Building Type in Italy
Focusing on real estate transactions (deals) recorded in Italy by QI with a minimumamount of 5 million euros, from 2012 to 2017. These account for over 500 records.From the analysis of this database, we can formulate a few considerations regarding thebuilding types and the most active cities in the Italian real estate market, in relation withthe general investments.
Real estate operations concentrate mainly in the tertiary sector (see Fig. 1).
Most of the transactions in terms of value concern the purchase of buildingsintended for office use, which takes up to about 43% of the total investment volume(with over 9 billion invested). The retail sector follows with 25% (over 5 billions) andhospitality with 12% (almost 3 billions). These three types alone represent more than80% of the total volume of real estate investments. Only marginal investments aredirected to other building types. Especially surprising is the limited amount of money
0 2,000 4,000 6,000 8,000 10,000
Offices
Retail/GDO
Other
Hotels
Logistics
Residential
Health
Land
Industrial
Fig. 1. Large real estate investments in Italy from 2012 to 2017 by building type (value in mln€) – (Source: Polytechnic Elaboration on data from QI).
234 L. Baiardi and A. Ciaramella
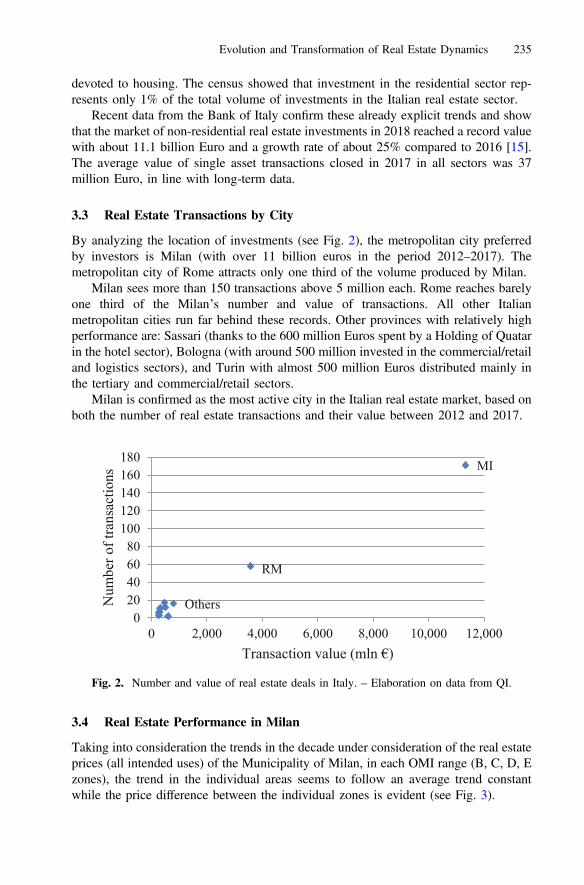
devoted to housing. The census showed that investment in the residential sector rep-resents only 1% of the total volume of investments in the Italian real estate sector.
Recent data from the Bank of Italy confirm these already explicit trends and showthat the market of non-residential real estate investments in 2018 reached a record valuewith about 11.1 billion Euro and a growth rate of about 25% compared to 2016 [15].The average value of single asset transactions closed in 2017 in all sectors was 37million Euro, in line with long-term data.
3.3 Real Estate Transactions by City
By analyzing the location of investments (see Fig. 2), the metropolitan city preferredby investors is Milan (with over 11 billion euros in the period 2012–2017). Themetropolitan city of Rome attracts only one third of the volume produced by Milan.
Milan sees more than 150 transactions above 5 million each. Rome reaches barelyone third of the Milan’s number and value of transactions. All other Italianmetropolitan cities run far behind these records. Other provinces with relatively highperformance are: Sassari (thanks to the 600 million Euros spent by a Holding of Quatarin the hotel sector), Bologna (with around 500 million invested in the commercial/retailand logistics sectors), and Turin with almost 500 million Euros distributed mainly inthe tertiary and commercial/retail sectors.
Milan is confirmed as the most active city in the Italian real estate market, based onboth the number of real estate transactions and their value between 2012 and 2017.
3.4 Real Estate Performance in Milan
Taking into consideration the trends in the decade under consideration of the real estateprices (all intended uses) of the Municipality of Milan, in each OMI range (B, C, D, Ezones), the trend in the individual areas seems to follow an average trend constantwhile the price difference between the individual zones is evident (see Fig. 3).
MI
RM
Others0
20406080
100120140160180
0 2,000 4,000 6,000 8,000 10,000 12,000
Num
ber o
f tra
nsac
tions
Transaction value (mln €)
Fig. 2. Number and value of real estate deals in Italy. – Elaboration on data from QI.
Evolution and Transformation of Real Estate Dynamics 235
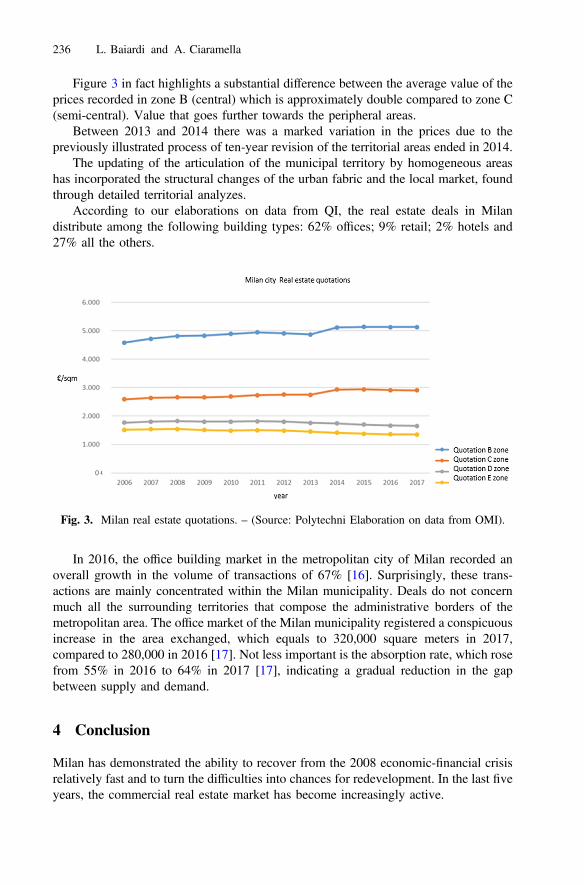
Figure 3 in fact highlights a substantial difference between the average value of theprices recorded in zone B (central) which is approximately double compared to zone C(semi-central). Value that goes further towards the peripheral areas.
Between 2013 and 2014 there was a marked variation in the prices due to thepreviously illustrated process of ten-year revision of the territorial areas ended in 2014.
The updating of the articulation of the municipal territory by homogeneous areashas incorporated the structural changes of the urban fabric and the local market, foundthrough detailed territorial analyzes.
According to our elaborations on data from QI, the real estate deals in Milandistribute among the following building types: 62% offices; 9% retail; 2% hotels and27% all the others.
In 2016, the office building market in the metropolitan city of Milan recorded anoverall growth in the volume of transactions of 67% [16]. Surprisingly, these trans-actions are mainly concentrated within the Milan municipality. Deals do not concernmuch all the surrounding territories that compose the administrative borders of themetropolitan area. The office market of the Milan municipality registered a conspicuousincrease in the area exchanged, which equals to 320,000 square meters in 2017,compared to 280,000 in 2016 [17]. Not less important is the absorption rate, which rosefrom 55% in 2016 to 64% in 2017 [17], indicating a gradual reduction in the gapbetween supply and demand.
4 Conclusion
Milan has demonstrated the ability to recover from the 2008 economic-financial crisisrelatively fast and to turn the difficulties into chances for redevelopment. In the last fiveyears, the commercial real estate market has become increasingly active.
Fig. 3. Milan real estate quotations. – (Source: Polytechni Elaboration on data from OMI).
236 L. Baiardi and A. Ciaramella
We found out that these operations tend to concentrate in a few poles, as they havebeen encouraged by public initiatives that were directed to regenerate entire areas of thecity, such as the Porta Nuova District. Many companies have invested in a number ofinitiatives, directed both to building development and enhancement, which have con-curred to reactivate the local market and economy. Our paper examined the most recentcommercial real estate initiatives, in order to explain how they helped the Milanmetropolitan area to develop a resilient attitude.
The investments seem mostly interested in moving to these new areas, in first-handpremises, suitable to boost the company’s image by being aesthetically impactful andenvironmentally sustainable.
Real estate initiatives can regenerate urban areas while boosting economic, envi-ronmental and social activities. Our research endorses that urban resilience goes hand-in-hand with this kind of initiatives. Companies produce knowledge, compete ininternational markets, and contribute to overcoming the crises. Public authoritiesshould prioritize the attraction of investors and organizations that are interested in realestate initiatives, as they can increase urban resilience.
The case of Milan confirms the attractiveness of metropolitan cities that become theprivileged contexts for multiple businesses to settle.
Acknowledgments. This research has been funded by the Research Project of RelevantNational Interest (PRIN) entitled “Metropolitan Cities: Economic-territorial strategies, financialconstraints, and circular regeneration”. This PRIN project is carried out by Politecnico di Milanoin partnership with the University of Bari “Aldo Moro”, Naples “Federico II”, and Venice“IUAV” (are members of the research group of the Milan Polytechnic: Prof. Roberta Capelloresponsible for the project, L. Baiardi, S. Bellintani, R. Camagni, A. Caragliu, A. Ciaramella, G.Cia, A. Celani, M. Morena, V. Puglisi, C. Tagliaro, O. Tronconi).
“Il Quotidiano Immobiliare” – QI (https://www.ilqi.it/post/quotidiano-immobiliare), the firstItalian online magazine and search engine about real estate issues,
Real Estate Market Observatory (Italian OMI – Osservatorio del Mercato Immobiliare) is theprincipal official sources reporting the national real estate market behaviour and, on the basis of apartnership deal between Italian IRS “Agenzia delle Entrate” and Politecnico di Milano ABCDepartment, collaborated to this project by providing us with a database occurring in Italy from2012 to 2017. The analysis proposed in this paper are largely based on this information.
References
1. Baiardi, L.: La globalizzazione e i cambiamenti delle aree urbane. In: Baiardi, L., Morena,M. (eds.) Marketing Territoriale. Ed Il sole 24 Ore, Milano (2009)
2. Zilli, S.: Città metropolitane e resilienza territoriale. In: Viganoni, L. (ed.) Commercio,Consumo e Città: Quaderno di Lavoro. Pratiche, Pianificazione e Governance perl’inclusione, la Resilienza e la Sostenibilità” Urbane. Franco Angeli, Milano (2017)
3. Oxford Dictionaries. Resilience. Oxford Dictionaries (2019). https://en.oxforddictionaries.com/definition/resilience. Accessed 28 Feb 2019
4. Giffinger, R., Fertner, C., Kramar, H., Kalasek, R., Pichler-Milanovic, N., Meijers, E.: SmartCities: Ranking of European Medium-Sized Cities. Centre of Regional Science (SRF),Vienna University of Technology, Vienna, AU (2007)
Evolution and Transformation of Real Estate Dynamics 237
5. Caragliu, A., Del Bo, C., Nijkamp, P.: Smart cities in Europe. J. Urban Technol. 18, 65–82(2011). https://doi.org/10.1080/10630732.2011.601117
6. Kitchin, R., Lauriault, T.P., McArdle, G.: Knowing and governing cities through urbanindicators, city benchmarking and real-time dashboards. Reg. Stud. Reg. Sci. 2(1), 6–28(2015). https://doi.org/10.1080/21681376.2014.983149
7. Vanolo, A.: Smartmentality: the smart city as disciplinary strategy. Urban Stud. 51, 883–898(2014). https://doi.org/10.1177/0042098013494427
8. ISTAT (Istituto Nazionale di Statistica), Rapporto annuale (2017). https://www.istat.it/it/files//2017/05/RapportoAnnuale2017.pdf. Accessed 12 Nov 2018
9. ARUP. Smart actions in Italian metropolitan cities (2013). https://www.arup.com/publications/research/section/smart-actions-in-italianmetropolitan-cities. Accessed 12 Nov2018
10. DARA (Dipartimento per gli Affari Regionali e le Autonomie). I dossier delle CittàMetropolitane (2017). http://www.affariregionali.it/comunicazione/dossier-e-normativa/i-dossier-delle-citt%C3%A0-metropolitane/. Accessed 04 Oct 2019
11. Censis. Rileggere i territori per dare identità e governo all’area vasta. Il governo delle areemetropolitane in Europa. Report di ricerca (2014). http://province.usb.it/documenti.html?eID=dam_frontend_push&docID=464. Accessed 12 Nov 2018
12. Calafati, A. (a cura di): Città tra sviluppo e declino. Un’agenda urbana per l’Italia. DonzelliEditore, Roma (2015)
13. Ires-Irpet-Eupolis: La finanza territoriale – Rapporto 2014. Franco Angeli, Milano (2014)14. Camagni, R., Capello, R., Caragliu, A.: Static vs. dynamic agglomeration economies: spatial
context and structural evolution behind urban growth. Reg. Sci. 95, 133–158 (2015). https://doi.org/10.1111/pirs.12182
15. BNP Paribas Real Estate: At a glance-Q1 2018. Investimenti in Italia, Milano (2018)16. Scenari Immobiliari: Milano Challenger ‘sul Podio d’Europa’. Rapporto 2017 Mercato
Immobiliare di Milano e Area Metropolitana (2017)17. Pwc: Real Estate Market Overview Italy 2017 (2018)18. Colliers International Italia: Italia INVESTIMENTI. Market report 2017 (2018)
Open Access This chapter is licensed under the terms of the Creative Commons Attribution 4.0International License (http://creativecommons.org/licenses/by/4.0/), which permits use, sharing,adaptation, distribution and reproduction in any medium or format, as long as you give appro-priate credit to the original author(s) and the source, provide a link to the Creative Commonslicense and indicate if changes were made.The images or other third party material in this chapter are included in the chapter's Creative
Commons license, unless indicated otherwise in a credit line to the material. If material is notincluded in the chapter's Creative Commons license and your intended use is not permitted bystatutory regulation or exceeds the permitted use, you will need to obtain permission directlyfrom the copyright holder.
238 L. Baiardi and A. Ciaramella
Proactive Maintenance Strategy Basedon Resilience Empowerment for Complex
Buildings
Francesco Rota1, Maria Cinzia Luisa Talamo1,and Giancarlo Paganin2(&)
1 ABC Department, Politecnico di Milano, Milan, Italy2 DASTU Department, Politecnico di Milano, Milan, Italy
Abstract. Resilience of the built environment, particularly in complex build-ings, is strictly related to the effectiveness of systems and sub-systems thatprovide the expected features to manage risk scenarios in routine and non-routine conditions. In this perspective, maintenance is therefore a key factor toassure building resilience by keeping systems and equipment in the requiredoperational state. Risk management can be empowered if system resilience anddisruptive events are monitored in real-time, and, to this aim, proactive main-tenance can nowadays monitor systems resilience with innovative digital tools.More specifically, proactive maintenance, through Industry 4.0 (I4.0) tools,
can enact control strategies for mitigating both endogenous risks – such asequipment failure, aging and obsolesce not always deeply investigated inbuilding sector – and exogenous risks.Anticipation of disruptive events of systems and control of endogenous risks
is possible thanks the introduction of IoT and machine learning tools which mayallow to modify the traditional corrective maintenance in the direction of aproactive maintenance approach.Aim of this paper is to highlight how proactive maintenance approach, if fully
implemented, and supported by I4.0 tools, can empower resilience of systems inthe building sector.
Keywords: Complex building resilience � Condition-based maintenance �Proactive maintenance � Information management � I4.0 � Risk management
1 Introduction
1.1 Proactive Maintenance Approaches in Support of InfrastructureResilience
Maintenance, in its general exception, ensures system performances over time. Intro-ducing the exception of proactivity, through real-time data management, maintenancecan dynamically support in advance the actions taken in order to:
– prevent the occurrence of a disruptive event;– monitor the system status, alerting if performances are reaching a critical threshold.
© The Author(s) 2020C. Bevilacqua et al. (Eds.): NMP 2020, SIST 177, pp. 239–250, 2020.https://doi.org/10.1007/978-3-030-52869-0_21
Actual proactive maintenance application needs:
– a real-time data flow management;– systems able to process real-time data and learn in order to obtain dynamically
system predictions and select responding actions.
These conditions can be supported by enabling technologies proposed by Industry4.0 (I4.0). Through them, by processing a huge amount of data over a limited timeframe, proactive maintenance can:
– describe the assets status/performance in a relative short period;– contribute to highlight the risks of the disruptive events deriving from internal &
external hazards.
In this way, proactive maintenance, seen as strategy which describes in advanceassets current and possible future status, can empower systems resilience in complexbuildings, by dealing with actions - such as anticipate, resist, adapt, react and adjust(ARARA) [1], which withstand the possible changes due to the progressive degrada-tion and the abrupt failures of systems.
Innovation, in the traditional maintenance strategies of complex buildings, consistsin the application of IoT, machine learnings and big data - already used in industrialsector – in the management of systems to empower complex buildings resilience.
This paper shows an application of a methodology, tested for the proactivemaintenance of equipment, which support the operations of hospital buildings.
2 Complex Systems Resilience Management in the BuildingSector
2.1 Current Complex Systems Resilience Approaches in Building Sector
In management of complex buildings, especially where criticalities of systems must becarefully considered, a risk management framework (based on: context analysis, riskassessment, taking control measures, monitoring and review, communication andtraining) is highly recommended in order to increase their resilience.
Currently, the major attention of risk management seems to focus on natural haz-ards related to earthquakes, fire, climate change, rather than to the effects of technicalevents, apparently less dangerous, such as service equipment faults, aging of thesystems, cyber-attacks of ICT system or infrastructure incorrect use and so on.
However, these effects are very often those that constitute the principal and mostfrequent highly-impacting causes in the loss of performance for the systems, so, evenon these factors should be necessary to develop a resilience strategy.
By analysing the current literature (Table 1), resilience in complex building man-agement starts to be a hot-topic, investigated from different points of view, in particularthose related to some strategic actions (such as anticipate, resist, adapt, react, adjust)and managed with the support of some dynamic tools.
240 F. Rota et al.
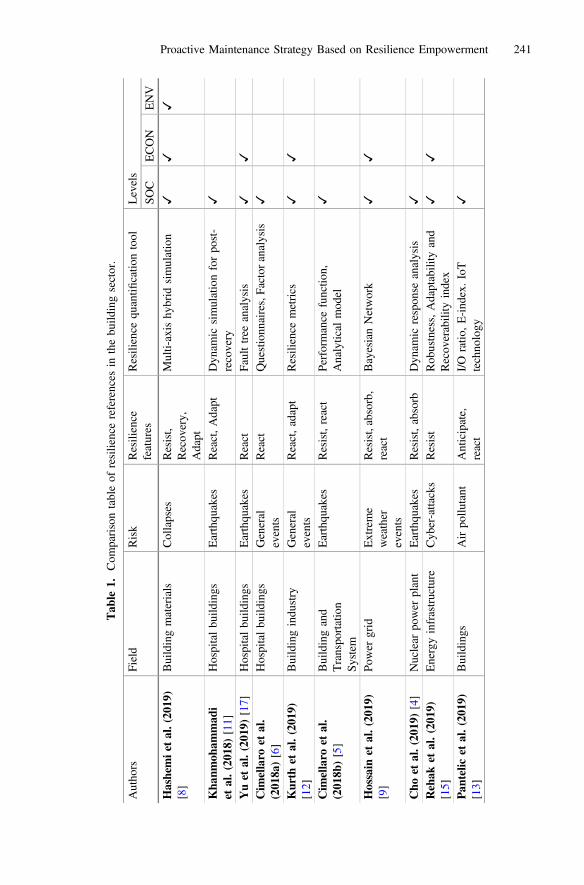
Tab
le1.
Com
parisontableof
resiliencereferences
inthebu
ildingsector.
Autho
rsField
Risk
Resilience
features
Resilience
quantifi
catio
ntool
Levels
SOC
ECON
ENV
Hashemie
tal.(20
19)
[8]
Buildingmaterials
Collapses
Resist,
Recov
ery,
Adapt
Multi-axishy
brid
simulation
✓✓
✓
Kha
nmoh
ammad
iet
al.(201
8)[11]
Hospitalbu
ildings
Earthqu
akes
React,Adapt
Dyn
amic
simulationforpo
st-
recovery
✓
Yuet
al.(201
9)[17]
Hospitalbu
ildings
Earthqu
akes
React
Faulttree
analysis
✓✓
Cim
ellaro
etal.
(201
8a)[6]
Hospitalbu
ildings
General
events
React
Questionn
aires,Factor
analysis
✓
Kurth
etal.(201
9)[12]
Buildingindu
stry
General
events
React,adapt
Resilience
metrics
✓✓
Cim
ellaro
etal.
(201
8b)[5]
Buildingand
Transpo
rtation
System
Earthqu
akes
Resist,react
Performance
functio
n,Analytical
mod
el✓
Hossain
etal.(201
9)[9]
Power
grid
Extreme
weather
events
Resist,absorb,
react
BayesianNetwork
✓✓
Cho
etal.(201
9)[4]
Nuclear
power
plant
Earthqu
akes
Resist,absorb
Dyn
amic
respon
seanalysis
✓
Rehak
etal.(201
9)[15]
Energyinfrastructure
Cyb
er-attacks
Resist
Rob
ustness,Adaptability
and
Recov
erability
index
✓✓
Pan
telic
etal.(201
9)[13]
Buildings
Airpo
llutant
Anticipate,
react
I/O
ratio
,E-ind
ex.IoT
techno
logy
✓
Proactive Maintenance Strategy Based on Resilience Empowerment 241
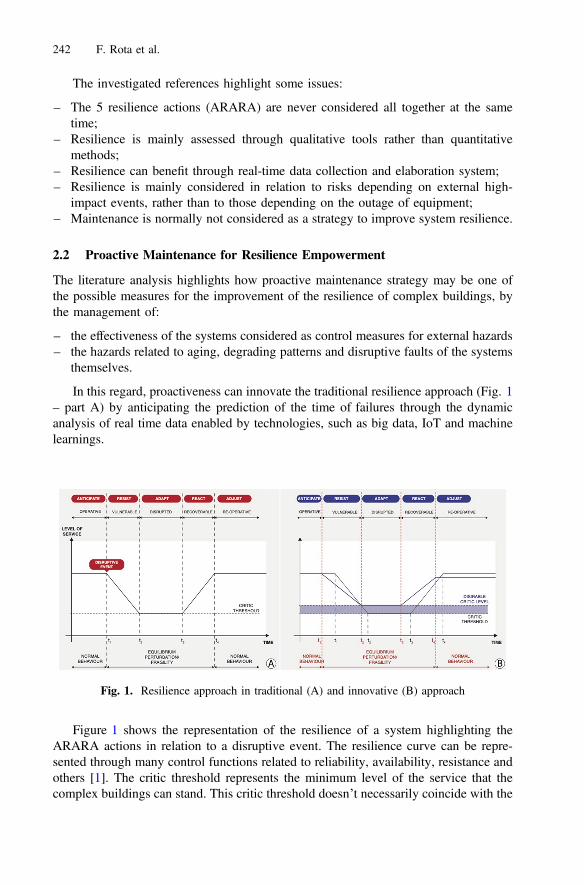
The investigated references highlight some issues:
– The 5 resilience actions (ARARA) are never considered all together at the sametime;
– Resilience is mainly assessed through qualitative tools rather than quantitativemethods;
– Resilience can benefit through real-time data collection and elaboration system;– Resilience is mainly considered in relation to risks depending on external high-
impact events, rather than to those depending on the outage of equipment;– Maintenance is normally not considered as a strategy to improve system resilience.
2.2 Proactive Maintenance for Resilience Empowerment
The literature analysis highlights how proactive maintenance strategy may be one ofthe possible measures for the improvement of the resilience of complex buildings, bythe management of:
– the effectiveness of the systems considered as control measures for external hazards– the hazards related to aging, degrading patterns and disruptive faults of the systems
themselves.
In this regard, proactiveness can innovate the traditional resilience approach (Fig. 1– part A) by anticipating the prediction of the time of failures through the dynamicanalysis of real time data enabled by technologies, such as big data, IoT and machinelearnings.
Figure 1 shows the representation of the resilience of a system highlighting theARARA actions in relation to a disruptive event. The resilience curve can be repre-sented through many control functions related to reliability, availability, resistance andothers [1]. The critic threshold represents the minimum level of the service that thecomplex buildings can stand. This critic threshold doesn’t necessarily coincide with the
Fig. 1. Resilience approach in traditional (A) and innovative (B) approach
242 F. Rota et al.
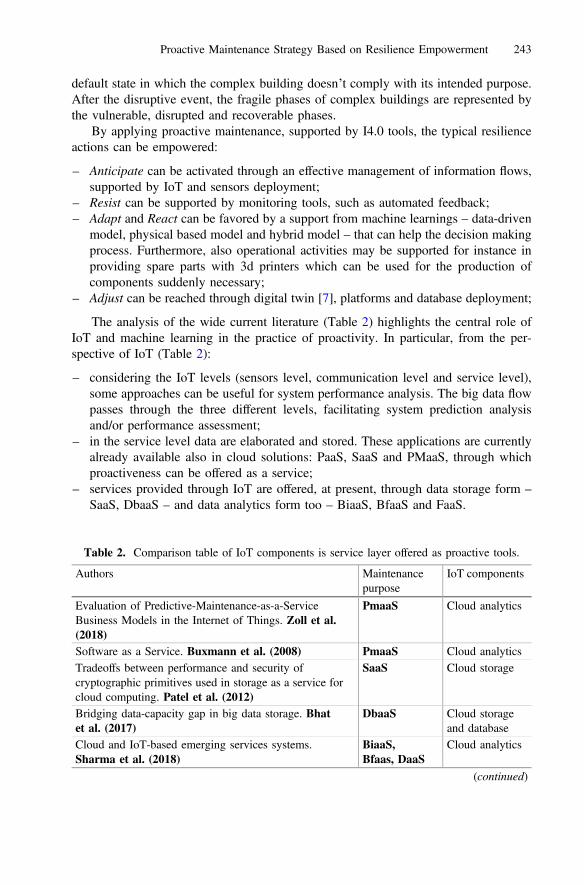
default state in which the complex building doesn’t comply with its intended purpose.After the disruptive event, the fragile phases of complex buildings are represented bythe vulnerable, disrupted and recoverable phases.
By applying proactive maintenance, supported by I4.0 tools, the typical resilienceactions can be empowered:
– Anticipate can be activated through an effective management of information flows,supported by IoT and sensors deployment;
– Resist can be supported by monitoring tools, such as automated feedback;– Adapt and React can be favored by a support from machine learnings – data-driven
model, physical based model and hybrid model – that can help the decision makingprocess. Furthermore, also operational activities may be supported for instance inproviding spare parts with 3d printers which can be used for the production ofcomponents suddenly necessary;
– Adjust can be reached through digital twin [7], platforms and database deployment;
The analysis of the wide current literature (Table 2) highlights the central role ofIoT and machine learning in the practice of proactivity. In particular, from the per-spective of IoT (Table 2):
– considering the IoT levels (sensors level, communication level and service level),some approaches can be useful for system performance analysis. The big data flowpasses through the three different levels, facilitating system prediction analysisand/or performance assessment;
– in the service level data are elaborated and stored. These applications are currentlyalready available also in cloud solutions: PaaS, SaaS and PMaaS, through whichproactiveness can be offered as a service;
– services provided through IoT are offered, at present, through data storage form –
SaaS, DbaaS – and data analytics form too – BiaaS, BfaaS and FaaS.
Table 2. Comparison table of IoT components is service layer offered as proactive tools.
Authors Maintenancepurpose
IoT components
Evaluation of Predictive-Maintenance-as-a-ServiceBusiness Models in the Internet of Things. Zoll et al.(2018)
PmaaS Cloud analytics
Software as a Service. Buxmann et al. (2008) PmaaS Cloud analyticsTradeoffs between performance and security ofcryptographic primitives used in storage as a service forcloud computing. Patel et al. (2012)
SaaS Cloud storage
Bridging data-capacity gap in big data storage. Bhatet al. (2017)
DbaaS Cloud storageand database
Cloud and IoT-based emerging services systems.Sharma et al. (2018)
BiaaS,Bfaas, DaaS
Cloud analytics
(continued)
Proactive Maintenance Strategy Based on Resilience Empowerment 243

From the point of view of machine learnings (Table 3):
– transferred data in an IoT architecture are elaborated in a machine learning tool,which can be deployed in a service layer, which provides a system performanceprediction.
– different kinds of machine learning (ML) tools can be used, but those which arereferred as data-driven model [10] are the most promising, as they use big dataoriginated from the specific components of complex building operations, resultingin more accurate predictions.
The success of an efficient resilience assessment for complex buildings is depen-dent on an architecture for information management flow, which focuses its strategy oninnovative anticipating actions (Fig. 1 – part B). In the traditional approach, collected
Table 2. (continued)
Authors Maintenancepurpose
IoT components
Cloud-enabled prognosis for manufacturing. Gao et al.(2015)
MaaS Cloud analytics
Failure as a service (faas): A cloud service for large-scale, online failure drills. Gunawi et al. (2011)
FaaS Cloud analyticsand storage
Machine learning for predictive maintenance: Amultiple classifier approach. Susto et al. (2015)
FaaS Cloud analytics
Smart technologies with wireless sensor networks.Dener and Bostancıo˘glu (2015)
PmaaS Cloud analytics
Timed verification of machine-to-machinecommunications. Gharbi et al. (2014)
PmaaS Cloud analytics
Emerging trends, issues and challenges in Internet ofThings, Big Data and cloud computing. Kobusińskaet al. (2018)
PmaaS Multi-Cloud
Deadline‐constrained coevolutionary genetic algorithmfor scientific workflow scheduling in cloud computing.Liu et al. (2017)
PmaaS Multi-Cloud
Networking protocols and standards for internet ofthings. Salman and Baset (2012)
PmaaS Multi-Cloud
Development of an earth observation cloud platform insupport to water resources monitoring. Bucur et al.(2018)
PmaaS Cloud analyticsand storage
Business Integration/Intelligent-as-a-Service: BiiaS, Business framework-as-a-Service: BfaaS,Database-as-a-service: DbaaS, Failure-as-a-Service: FaaS, Predictive-Maintenance-as-a-Service: PmaaS, Software-as-a-Service: SaaS.
244 F. Rota et al.

Table 3. Comparison table of machine learning tools for a data-driven model.
Authors Informationsources
Goal ML
Multiple fault separation and detection byjoint subspace learning for the healthassessment of wind turbine gearboxes. Duet al. (2017)
Expertknowledge,Sensor data
Identify faultpatterns
JSL
A novel approach for data-driven process andcondition monitoring systems on the exampleof mill-turn centers. Kißkalt et al. (2017)
Sensor data Degradationpattern recognition
HMM
Prognostics and health management: Areview of vibration based bearing and gearhealth indicators. Wang et al. (2018)
Sensor data Life prediction ofsystem
HMM
A data-driven method for estimating theremaining useful life of a composite drillpipe. Lahmadi et al. (2018)
Sensor data RULs predictionof system
RNN
Intelligent health monitoring of machinebearings based on feature extraction.Chalouli et al. (2017)
Sensor data Fault diagnosis KM, KM
Equipment Sub-system Extraction and itsApplication in Predictive Maintenance. Zhaoet al. (2018)
Sensor data Fault detection HC
An Industrial Case Study Using VibrationData and Machine Learning to Predict AssetHealth. Amihai et al. (2018)
Sensor data Prediction of assethealth
RF
(WIP) Correlation-Driven Service EventRouting for Predictive IndustrialMaintenance. Zhu et al. (2018)
Sensor data Prediction ofsystem fault
ECA
Tool wear condition monitoring based oncontinuous wavelet transform and blindsource separation. Benkedjouh et al. (2018)
Sensor data Prediction of wearin millingoperations
CWT
Data-driven prognostic method based onBayesian approaches for direct remaininguseful life prediction. Mosallam et al. (2014)
Nasaprognosticcenter dataset
RULs predictionof criticalcomponents
KM
Prognostics of multiple failure modes inrotating machinery using a pattern-basedclassifier and cumulative incidence functions.Ragab et al. (2019)
Sensor data RULs predictionof criticalcomponents
ANN,SVM
Remaining useful life prediction usingprognostic methodology based on logicalanalysis of data and Kaplan–Meierestimation. Ragab et al. (2016)
Sensor data Survival analysis KME
(continued)
Proactive Maintenance Strategy Based on Resilience Empowerment 245

Table 3. (continued)
Authors Informationsources
Goal ML
Vehicle remote health monitoring andprognostic maintenance system. Shafi et al.(2018)
Sensor data Fault prediction forsubsystems
DT,SVM,KNN,RF
A Simple State-Based Prognostic Model forFilter Clogging. Skaf et al. (2015)
Sensor data Detect filterclogging
HMM
Machine learning for predictive maintenanceof industrial machines using IoT sensor data.Kanawaday et Sane (2017)
Sensor data Prediction offailures and qualitydefects
ARIMA
Machine Learning approach for PredictiveMaintenance in Industry 4.0. Paolanti et al.(2018)
Sensor data,Maintenancelogs
Fault prediction RF
Predicting tool wear with multi-sensor datausing deep belief networks. Chen et al.(2018)
Sensor data Prediction of wearsystem
DBN,ANN,SVM
Early fault detection of machine tools basedon deep learning and dynamic identification.Luo et al. (2019)
Sensor data Fault detection DL
A research study on unsupervised machinelearning algorithms for early fault detectionin predictive maintenance. Amruthnath etGupta (2018)
Historicaldata, Sensordata
Fault detection PCA,HC, KF,FA
On the use of machine learning methods topredict component reliability from data-driven industrial case studies. Alsina et al.(2018)
Sensor data,Equations
Reliabilityestimation
RF, LR,SVM,ANN
Thermal power generation fault diagnosisand prediction model based on deep learningand multimedia systems. Chen et al. (2018)
Historicaldataset
Fault diagnosis DL, FA
Towards online data-driven prognosticssystem. Elattar et al. (2018)
Sensor data Online prognosticssystem
DL, KF
Machine prognostics based on sparserepresentation model. Ren et al. (2018)
Sensor data Estimation ofmachines life
SR, HC
Artificial neural network: ANN, Auto Regressive Integrated Moving Average: ARIMA, Blindsource separation: BSS, Continuous wavelet transform: CWT, Deep Belief Network: DBN,Decision trees: DT, Deep Learning: DL, Event correlation algorithm: ECA,, Fuzzy Algorithm:FA, Health Indicator: HI, Hidden Markov Model: HMM, Hierarchy clustering: HC, Kalmanfilter: KF, K-Means: KM, Kaplan-Meier estimation: KME, Nearest neighbour: KNN, Jointsubspace learning: JSL, Linear regression: LR, Principal Component Analysis: PCA,Recurrent Neural Network: RNN, Random forest: RF, Sparse representation: SR, Supportvector Machine: SVM.
246 F. Rota et al.
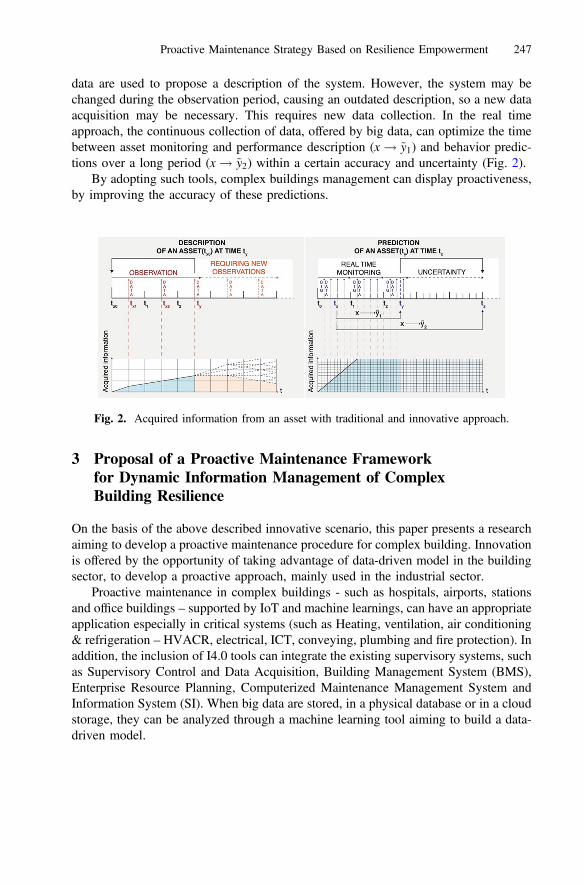
data are used to propose a description of the system. However, the system may bechanged during the observation period, causing an outdated description, so a new dataacquisition may be necessary. This requires new data collection. In the real timeapproach, the continuous collection of data, offered by big data, can optimize the timebetween asset monitoring and performance description (x ! ~y1) and behavior predic-tions over a long period (x ! ~y2) within a certain accuracy and uncertainty (Fig. 2).
By adopting such tools, complex buildings management can display proactiveness,by improving the accuracy of these predictions.
3 Proposal of a Proactive Maintenance Frameworkfor Dynamic Information Management of ComplexBuilding Resilience
On the basis of the above described innovative scenario, this paper presents a researchaiming to develop a proactive maintenance procedure for complex building. Innovationis offered by the opportunity of taking advantage of data-driven model in the buildingsector, to develop a proactive approach, mainly used in the industrial sector.
Proactive maintenance in complex buildings - such as hospitals, airports, stationsand office buildings – supported by IoT and machine learnings, can have an appropriateapplication especially in critical systems (such as Heating, ventilation, air conditioning& refrigeration – HVACR, electrical, ICT, conveying, plumbing and fire protection). Inaddition, the inclusion of I4.0 tools can integrate the existing supervisory systems, suchas Supervisory Control and Data Acquisition, Building Management System (BMS),Enterprise Resource Planning, Computerized Maintenance Management System andInformation System (SI). When big data are stored, in a physical database or in a cloudstorage, they can be analyzed through a machine learning tool aiming to build a data-driven model.
Fig. 2. Acquired information from an asset with traditional and innovative approach.
Proactive Maintenance Strategy Based on Resilience Empowerment 247
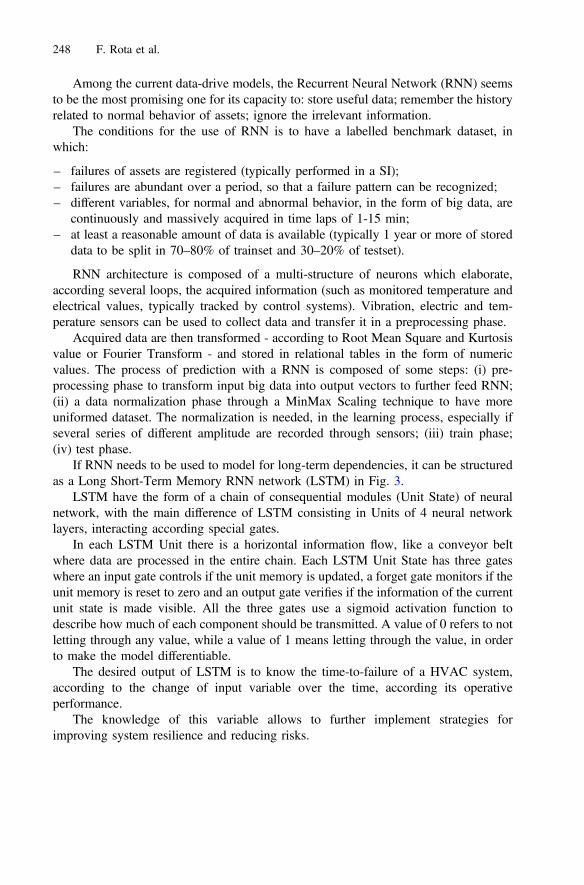
Among the current data-drive models, the Recurrent Neural Network (RNN) seemsto be the most promising one for its capacity to: store useful data; remember the historyrelated to normal behavior of assets; ignore the irrelevant information.
The conditions for the use of RNN is to have a labelled benchmark dataset, inwhich:
– failures of assets are registered (typically performed in a SI);– failures are abundant over a period, so that a failure pattern can be recognized;– different variables, for normal and abnormal behavior, in the form of big data, are
continuously and massively acquired in time laps of 1-15 min;– at least a reasonable amount of data is available (typically 1 year or more of stored
data to be split in 70–80% of trainset and 30–20% of testset).
RNN architecture is composed of a multi-structure of neurons which elaborate,according several loops, the acquired information (such as monitored temperature andelectrical values, typically tracked by control systems). Vibration, electric and tem-perature sensors can be used to collect data and transfer it in a preprocessing phase.
Acquired data are then transformed - according to Root Mean Square and Kurtosisvalue or Fourier Transform - and stored in relational tables in the form of numericvalues. The process of prediction with a RNN is composed of some steps: (i) pre-processing phase to transform input big data into output vectors to further feed RNN;(ii) a data normalization phase through a MinMax Scaling technique to have moreuniformed dataset. The normalization is needed, in the learning process, especially ifseveral series of different amplitude are recorded through sensors; (iii) train phase;(iv) test phase.
If RNN needs to be used to model for long-term dependencies, it can be structuredas a Long Short-Term Memory RNN network (LSTM) in Fig. 3.
LSTM have the form of a chain of consequential modules (Unit State) of neuralnetwork, with the main difference of LSTM consisting in Units of 4 neural networklayers, interacting according special gates.
In each LSTM Unit there is a horizontal information flow, like a conveyor beltwhere data are processed in the entire chain. Each LSTM Unit State has three gateswhere an input gate controls if the unit memory is updated, a forget gate monitors if theunit memory is reset to zero and an output gate verifies if the information of the currentunit state is made visible. All the three gates use a sigmoid activation function todescribe how much of each component should be transmitted. A value of 0 refers to notletting through any value, while a value of 1 means letting through the value, in orderto make the model differentiable.
The desired output of LSTM is to know the time-to-failure of a HVAC system,according to the change of input variable over the time, according its operativeperformance.
The knowledge of this variable allows to further implement strategies forimproving system resilience and reducing risks.
248 F. Rota et al.
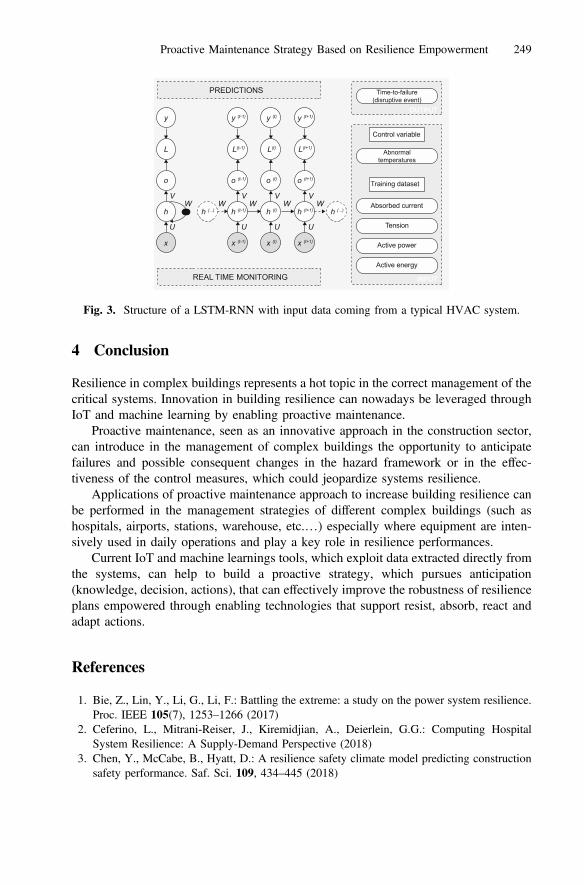
4 Conclusion
Resilience in complex buildings represents a hot topic in the correct management of thecritical systems. Innovation in building resilience can nowadays be leveraged throughIoT and machine learning by enabling proactive maintenance.
Proactive maintenance, seen as an innovative approach in the construction sector,can introduce in the management of complex buildings the opportunity to anticipatefailures and possible consequent changes in the hazard framework or in the effec-tiveness of the control measures, which could jeopardize systems resilience.
Applications of proactive maintenance approach to increase building resilience canbe performed in the management strategies of different complex buildings (such ashospitals, airports, stations, warehouse, etc.…) especially where equipment are inten-sively used in daily operations and play a key role in resilience performances.
Current IoT and machine learnings tools, which exploit data extracted directly fromthe systems, can help to build a proactive strategy, which pursues anticipation(knowledge, decision, actions), that can effectively improve the robustness of resilienceplans empowered through enabling technologies that support resist, absorb, react andadapt actions.
References
1. Bie, Z., Lin, Y., Li, G., Li, F.: Battling the extreme: a study on the power system resilience.Proc. IEEE 105(7), 1253–1266 (2017)
2. Ceferino, L., Mitrani-Reiser, J., Kiremidjian, A., Deierlein, G.G.: Computing HospitalSystem Resilience: A Supply-Demand Perspective (2018)
3. Chen, Y., McCabe, B., Hyatt, D.: A resilience safety climate model predicting constructionsafety performance. Saf. Sci. 109, 434–445 (2018)
y
L
o
h
x
U U U U
WW W W WV V V V
y (t-1)
L(t-1)
o (t-1)
h (t-1)h (...) h (...)
x (t-1)
y (t+1)
L(t+1)
o (t+1)
h (t+1)
x (t+1)
y (t)
L(t)
o (t)
h (t)
x (t)
Abnormal temperatures
Time-to-failure(disruptive event)
PREDICTIONS
REAL TIME MONITORING
Control variable
Training dataset
Absorbed current
Tension
Active power
Active energy
INPUT
OUTPUT
Fig. 3. Structure of a LSTM-RNN with input data coming from a typical HVAC system.
Proactive Maintenance Strategy Based on Resilience Empowerment 249
4. Cho, S.G., Furuya, O., Kurabayashi, H.: Enhancement of seismic resilience of pipingsystems in nuclear power plants using steel coil damper. Nucl. Eng. Des. 350, 147–157(2019)
5. Cimellaro, G.P., Arcidiacono, V., Reinhorn, A.M.: Disaster resilience assessment of buildingand transportation system. J. Earthq. Eng., 1–27 (2018b)
6. Cimellaro, G.P., Malavisi, M., Mahin, S.: Factor analysis to evaluate hospital resilience.ASCE-ASME J. Risk Uncertainty Eng. Syst. Part A Civ. Eng. 4(1), 04018002 (2018a)
7. Farsi, M.A., Zio, E.: Industry 4.0: some challenges and opportunities for reliabilityengineering. Int. J. Reliab. Risk Saf. Theor. Appl. (2019)
8. Hashemi, M.J., Al-Attraqchi, A.Y., Kalfat, R., Al-Mahaidi, R.: Linking seismic resilienceinto sustainability assessment of limited-ductility RC buildings. Eng. Struct. 188, 121–136(2019)
9. Hossain, N.U.I., Jaradat, R., Hosseini, S., Marufuzzaman, M., Buchanan, R.K.: Aframework for modeling and assessing system resilience using a Bayesian network: a casestudy of an interdependent electrical infrastructure system. Int. J. Crit. Infrastruct. Prot. 25,62–83 (2019)
10. ISO 13381:2015 - Condition monitoring and diagnostics of machines11. Khanmohammadi, S., Farahmand, H., Kashani, H.: A system dynamics approach to the
seismic resilience enhancement of hospitals. Int. J. Disaster Risk Reduct. 31, 220–233(2018)
12. Kurth, M.H., Keenan, J.M., Sasani, M., Linkov, I.: Defining resilience for the US buildingindustry. Build. Res. Inf. 47(4), 480–492 (2019)
13. Pantelic, J., Dawe, M., Licina, D.: Use of IoT sensing and occupant surveys for determiningthe resilience of buildings to forest fire generated PM2. 5. PLoS One 14(10) (2019)
14. Patriarca, R., Di Gravio, G., Costantino, F., Falegnami, A., Bilotta, F.: An analyticframework to assess organizational resilience. Saf. Health Work 9(3), 265–276 (2018)
15. Rehak, D., Senovsky, P., Hromada, M., Lovecek, T.: Complex approach to assessingresilience of critical infrastructure elements. Int. J. Crit. Infrastruct. Prot. 25, 125–138 (2019)
16. Yan, S., Lin, K.J., Zheng, X., Zhang, W.: Using latent knowledge to improve real-timeactivity recognition for smart IoT. IEEE Trans. Knowl. Data Eng. (2019)
17. Yu, P., Wen, W., Ji, D., Zhai, C., Xie, L.: A framework to assess the seismic resilience ofurban hospitals. Adv. Civ. Eng. (2019)
Open Access This chapter is licensed under the terms of the Creative Commons Attribution 4.0International License (http://creativecommons.org/licenses/by/4.0/), which permits use, sharing,adaptation, distribution and reproduction in any medium or format, as long as you give appro-priate credit to the original author(s) and the source, provide a link to the Creative Commonslicense and indicate if changes were made.The images or other third party material in this chapter are included in the chapter's Creative
Commons license, unless indicated otherwise in a credit line to the material. If material is notincluded in the chapter's Creative Commons license and your intended use is not permitted bystatutory regulation or exceeds the permitted use, you will need to obtain permission directlyfrom the copyright holder.
250 F. Rota et al.

An Integrated Decision Support Systemto Define the Best Scenario for the AdaptiveSustainable Re-Use of Cultural Heritage
in Southern Italy
Lucia Della Spina(&) , Claudia Giorno,and Ruggiero Galati Casmiro
Mediterranea University, Reggio Calabria, [email protected]
Abstract. The objective of this document is to propose an integrated evaluationmodel to support the choice of an alternative of an historic industrial archeologybuilding located in Southern Italy, in order to define a strategy shared based on a“bottom-up approach”. The methodological path, in consideration of the needsof the local community and of the historic and cultural values of the historicbuilding, is able to verify the feasibility and economic sustainability of thehypothesis in relation to different management models that involve differentforms of public-private partnership. The positive results obtained show that theproposed model can be a useful decision support tool in contexts characterizedby high complexity, where the goal is to build shared development strategies.
Keywords: Strategic evaluation � Circular economy � Sustainable re-use ofcultural heritage � Multi-Criteria decision aid � Economic evaluation � Financialsustainability
1 Introduction
In the last few decades, researches and debates at an international level have seen theattribution of an increasingly significant role to cultural heritage within the frameworkof development models based on local peculiarities and on the enhancement of theendogenous resources of the territories. In particular, cultural identities have taken onnew values and specificities also thanks to the implications of an intangible nature -such as those related to traditions, knowledge and creativity - that have enriched thenotion of heritage. It has been recognized that the process of preservation andenhancement of cultural heritage - addressed to all the other resources which charac-terized and represented the distinctive signs that history has sedimented in a territory -if supported by “system” strategies can play an important function both in preservingthe resources that promote and support the economic development of local commu-nities. The involvement of local communities, also implemented through the net-working of the main stakeholders in the area, raises awareness of cultural heritage,understood as the ability of citizens to recognize their identity in that heritage, torecognize it as their own and, consequently, to cooperate for its conservation.
© The Author(s) 2020C. Bevilacqua et al. (Eds.): NMP 2020, SIST 177, pp. 251–267, 2020.https://doi.org/10.1007/978-3-030-52869-0_22
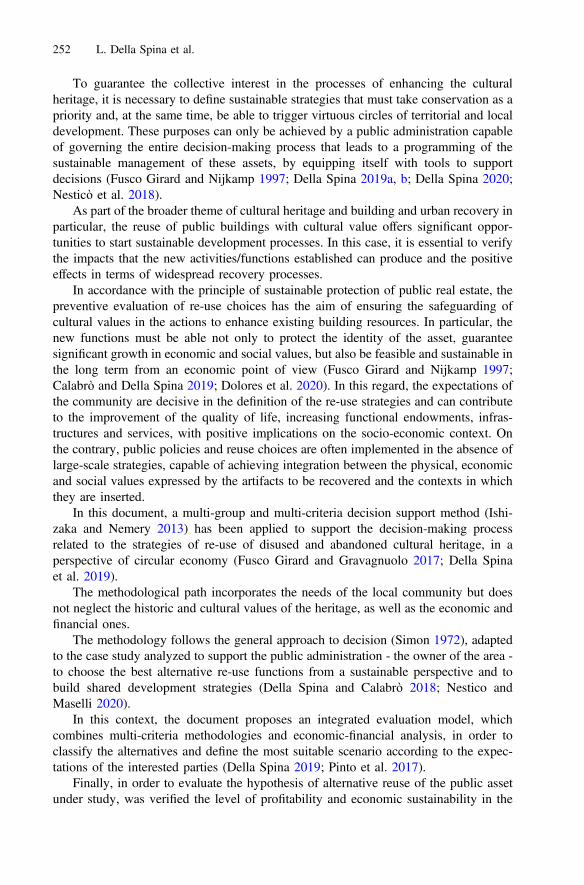
To guarantee the collective interest in the processes of enhancing the culturalheritage, it is necessary to define sustainable strategies that must take conservation as apriority and, at the same time, be able to trigger virtuous circles of territorial and localdevelopment. These purposes can only be achieved by a public administration capableof governing the entire decision-making process that leads to a programming of thesustainable management of these assets, by equipping itself with tools to supportdecisions (Fusco Girard and Nijkamp 1997; Della Spina 2019a, b; Della Spina 2020;Nesticò et al. 2018).
As part of the broader theme of cultural heritage and building and urban recovery inparticular, the reuse of public buildings with cultural value offers significant oppor-tunities to start sustainable development processes. In this case, it is essential to verifythe impacts that the new activities/functions established can produce and the positiveeffects in terms of widespread recovery processes.
In accordance with the principle of sustainable protection of public real estate, thepreventive evaluation of re-use choices has the aim of ensuring the safeguarding ofcultural values in the actions to enhance existing building resources. In particular, thenew functions must be able not only to protect the identity of the asset, guaranteesignificant growth in economic and social values, but also be feasible and sustainable inthe long term from an economic point of view (Fusco Girard and Nijkamp 1997;Calabrò and Della Spina 2019; Dolores et al. 2020). In this regard, the expectations ofthe community are decisive in the definition of the re-use strategies and can contributeto the improvement of the quality of life, increasing functional endowments, infras-tructures and services, with positive implications on the socio-economic context. Onthe contrary, public policies and reuse choices are often implemented in the absence oflarge-scale strategies, capable of achieving integration between the physical, economicand social values expressed by the artifacts to be recovered and the contexts in whichthey are inserted.
In this document, a multi-group and multi-criteria decision support method (Ishi-zaka and Nemery 2013) has been applied to support the decision-making processrelated to the strategies of re-use of disused and abandoned cultural heritage, in aperspective of circular economy (Fusco Girard and Gravagnuolo 2017; Della Spinaet al. 2019).
The methodological path incorporates the needs of the local community but doesnot neglect the historic and cultural values of the heritage, as well as the economic andfinancial ones.
The methodology follows the general approach to decision (Simon 1972), adaptedto the case study analyzed to support the public administration - the owner of the area -to choose the best alternative re-use functions from a sustainable perspective and tobuild shared development strategies (Della Spina and Calabrò 2018; Nestico andMaselli 2020).
In this context, the document proposes an integrated evaluation model, whichcombines multi-criteria methodologies and economic-financial analysis, in order toclassify the alternatives and define the most suitable scenario according to the expec-tations of the interested parties (Della Spina 2019; Pinto et al. 2017).
Finally, in order to evaluate the hypothesis of alternative reuse of the public assetunder study, was verified the level of profitability and economic sustainability in the
252 L. Della Spina et al.
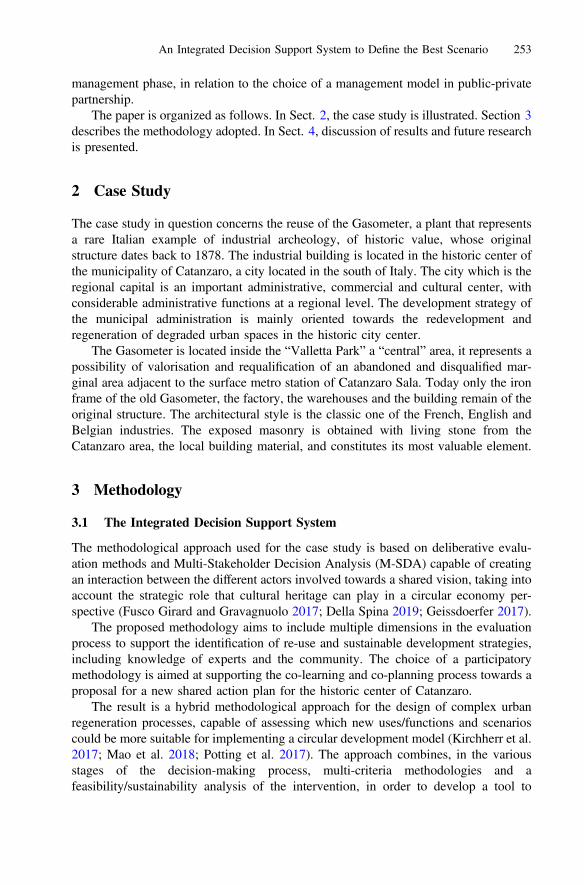
management phase, in relation to the choice of a management model in public-privatepartnership.
The paper is organized as follows. In Sect. 2, the case study is illustrated. Section 3describes the methodology adopted. In Sect. 4, discussion of results and future researchis presented.
2 Case Study
The case study in question concerns the reuse of the Gasometer, a plant that representsa rare Italian example of industrial archeology, of historic value, whose originalstructure dates back to 1878. The industrial building is located in the historic center ofthe municipality of Catanzaro, a city located in the south of Italy. The city which is theregional capital is an important administrative, commercial and cultural center, withconsiderable administrative functions at a regional level. The development strategy ofthe municipal administration is mainly oriented towards the redevelopment andregeneration of degraded urban spaces in the historic city center.
The Gasometer is located inside the “Valletta Park” a “central” area, it represents apossibility of valorisation and requalification of an abandoned and disqualified mar-ginal area adjacent to the surface metro station of Catanzaro Sala. Today only the ironframe of the old Gasometer, the factory, the warehouses and the building remain of theoriginal structure. The architectural style is the classic one of the French, English andBelgian industries. The exposed masonry is obtained with living stone from theCatanzaro area, the local building material, and constitutes its most valuable element.
3 Methodology
3.1 The Integrated Decision Support System
The methodological approach used for the case study is based on deliberative evalu-ation methods and Multi-Stakeholder Decision Analysis (M-SDA) capable of creatingan interaction between the different actors involved towards a shared vision, taking intoaccount the strategic role that cultural heritage can play in a circular economy per-spective (Fusco Girard and Gravagnuolo 2017; Della Spina 2019; Geissdoerfer 2017).
The proposed methodology aims to include multiple dimensions in the evaluationprocess to support the identification of re-use and sustainable development strategies,including knowledge of experts and the community. The choice of a participatorymethodology is aimed at supporting the co-learning and co-planning process towards aproposal for a new shared action plan for the historic center of Catanzaro.
The result is a hybrid methodological approach for the design of complex urbanregeneration processes, capable of assessing which new uses/functions and scenarioscould be more suitable for implementing a circular development model (Kirchherr et al.2017; Mao et al. 2018; Potting et al. 2017). The approach combines, in the variousstages of the decision-making process, multi-criteria methodologies and afeasibility/sustainability analysis of the intervention, in order to develop a tool to
An Integrated Decision Support System to Define the Best Scenario 253
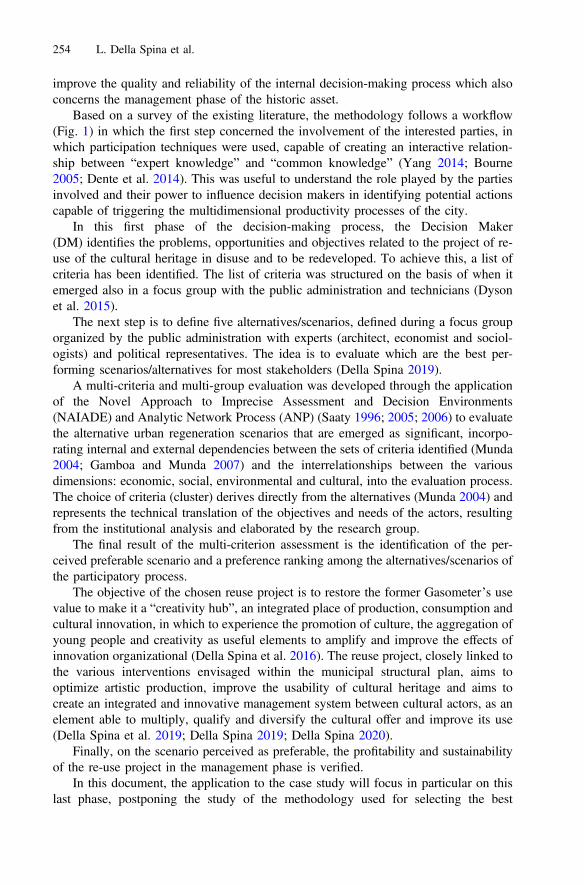
improve the quality and reliability of the internal decision-making process which alsoconcerns the management phase of the historic asset.
Based on a survey of the existing literature, the methodology follows a workflow(Fig. 1) in which the first step concerned the involvement of the interested parties, inwhich participation techniques were used, capable of creating an interactive relation-ship between “expert knowledge” and “common knowledge” (Yang 2014; Bourne2005; Dente et al. 2014). This was useful to understand the role played by the partiesinvolved and their power to influence decision makers in identifying potential actionscapable of triggering the multidimensional productivity processes of the city.
In this first phase of the decision-making process, the Decision Maker(DM) identifies the problems, opportunities and objectives related to the project of re-use of the cultural heritage in disuse and to be redeveloped. To achieve this, a list ofcriteria has been identified. The list of criteria was structured on the basis of when itemerged also in a focus group with the public administration and technicians (Dysonet al. 2015).
The next step is to define five alternatives/scenarios, defined during a focus grouporganized by the public administration with experts (architect, economist and sociol-ogists) and political representatives. The idea is to evaluate which are the best per-forming scenarios/alternatives for most stakeholders (Della Spina 2019).
A multi-criteria and multi-group evaluation was developed through the applicationof the Novel Approach to Imprecise Assessment and Decision Environments(NAIADE) and Analytic Network Process (ANP) (Saaty 1996; 2005; 2006) to evaluatethe alternative urban regeneration scenarios that are emerged as significant, incorpo-rating internal and external dependencies between the sets of criteria identified (Munda2004; Gamboa and Munda 2007) and the interrelationships between the variousdimensions: economic, social, environmental and cultural, into the evaluation process.The choice of criteria (cluster) derives directly from the alternatives (Munda 2004) andrepresents the technical translation of the objectives and needs of the actors, resultingfrom the institutional analysis and elaborated by the research group.
The final result of the multi-criterion assessment is the identification of the per-ceived preferable scenario and a preference ranking among the alternatives/scenarios ofthe participatory process.
The objective of the chosen reuse project is to restore the former Gasometer’s usevalue to make it a “creativity hub”, an integrated place of production, consumption andcultural innovation, in which to experience the promotion of culture, the aggregation ofyoung people and creativity as useful elements to amplify and improve the effects ofinnovation organizational (Della Spina et al. 2016). The reuse project, closely linked tothe various interventions envisaged within the municipal structural plan, aims tooptimize artistic production, improve the usability of cultural heritage and aims tocreate an integrated and innovative management system between cultural actors, as anelement able to multiply, qualify and diversify the cultural offer and improve its use(Della Spina et al. 2019; Della Spina 2019; Della Spina 2020).
Finally, on the scenario perceived as preferable, the profitability and sustainabilityof the re-use project in the management phase is verified.
In this document, the application to the case study will focus in particular on thislast phase, postponing the study of the methodology used for selecting the best
254 L. Della Spina et al.
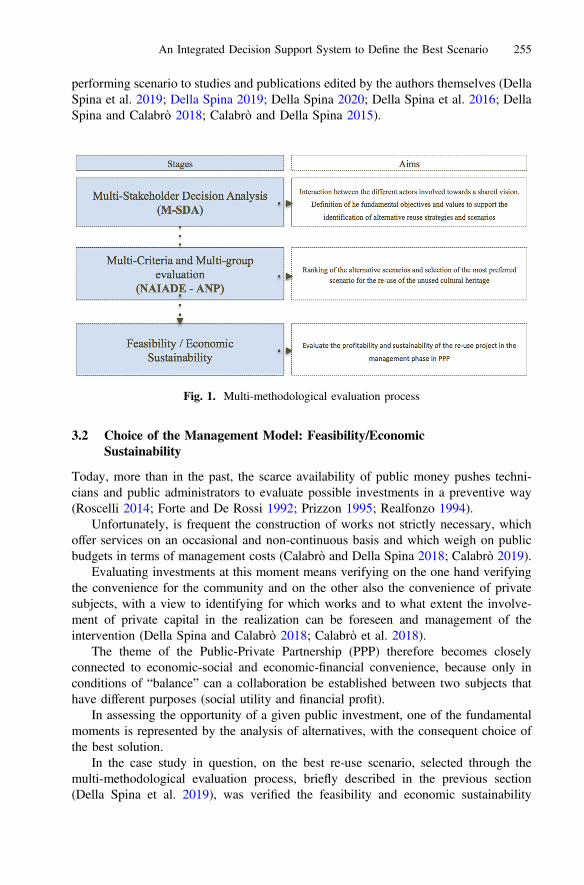
performing scenario to studies and publications edited by the authors themselves (DellaSpina et al. 2019; Della Spina 2019; Della Spina 2020; Della Spina et al. 2016; DellaSpina and Calabrò 2018; Calabrò and Della Spina 2015).
3.2 Choice of the Management Model: Feasibility/EconomicSustainability
Today, more than in the past, the scarce availability of public money pushes techni-cians and public administrators to evaluate possible investments in a preventive way(Roscelli 2014; Forte and De Rossi 1992; Prizzon 1995; Realfonzo 1994).
Unfortunately, is frequent the construction of works not strictly necessary, whichoffer services on an occasional and non-continuous basis and which weigh on publicbudgets in terms of management costs (Calabrò and Della Spina 2018; Calabrò 2019).
Evaluating investments at this moment means verifying on the one hand verifyingthe convenience for the community and on the other also the convenience of privatesubjects, with a view to identifying for which works and to what extent the involve-ment of private capital in the realization can be foreseen and management of theintervention (Della Spina and Calabrò 2018; Calabrò et al. 2018).
The theme of the Public-Private Partnership (PPP) therefore becomes closelyconnected to economic-social and economic-financial convenience, because only inconditions of “balance” can a collaboration be established between two subjects thathave different purposes (social utility and financial profit).
In assessing the opportunity of a given public investment, one of the fundamentalmoments is represented by the analysis of alternatives, with the consequent choice ofthe best solution.
In the case study in question, on the best re-use scenario, selected through themulti-methodological evaluation process, briefly described in the previous section(Della Spina et al. 2019), was verified the feasibility and economic sustainability
Fig. 1. Multi-methodological evaluation process
An Integrated Decision Support System to Define the Best Scenario 255
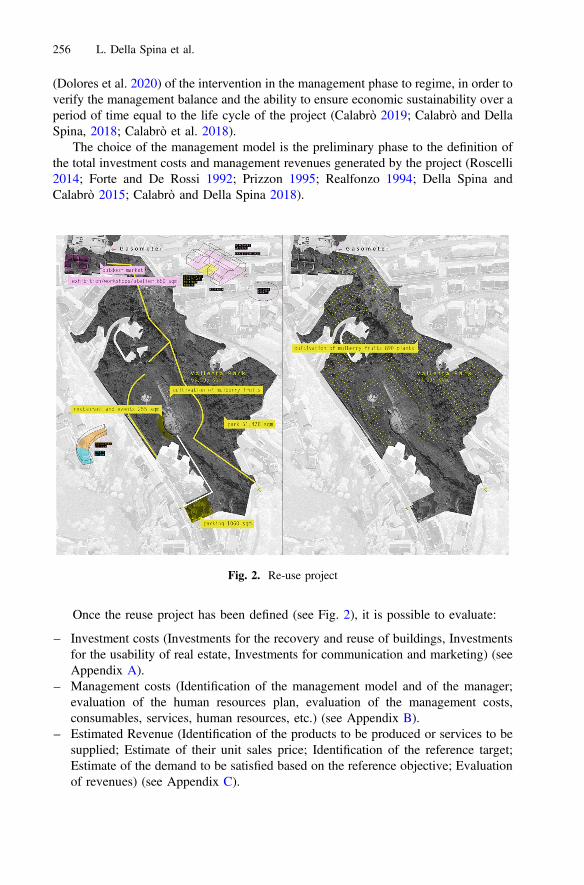
(Dolores et al. 2020) of the intervention in the management phase to regime, in order toverify the management balance and the ability to ensure economic sustainability over aperiod of time equal to the life cycle of the project (Calabrò 2019; Calabrò and DellaSpina, 2018; Calabrò et al. 2018).
The choice of the management model is the preliminary phase to the definition ofthe total investment costs and management revenues generated by the project (Roscelli2014; Forte and De Rossi 1992; Prizzon 1995; Realfonzo 1994; Della Spina andCalabrò 2015; Calabrò and Della Spina 2018).
Once the reuse project has been defined (see Fig. 2), it is possible to evaluate:
– Investment costs (Investments for the recovery and reuse of buildings, Investmentsfor the usability of real estate, Investments for communication and marketing) (seeAppendix A).
– Management costs (Identification of the management model and of the manager;evaluation of the human resources plan, evaluation of the management costs,consumables, services, human resources, etc.) (see Appendix B).
– Estimated Revenue (Identification of the products to be produced or services to besupplied; Estimate of their unit sales price; Identification of the reference target;Estimate of the demand to be satisfied based on the reference objective; Evaluationof revenues) (see Appendix C).
Fig. 2. Re-use project
256 L. Della Spina et al.
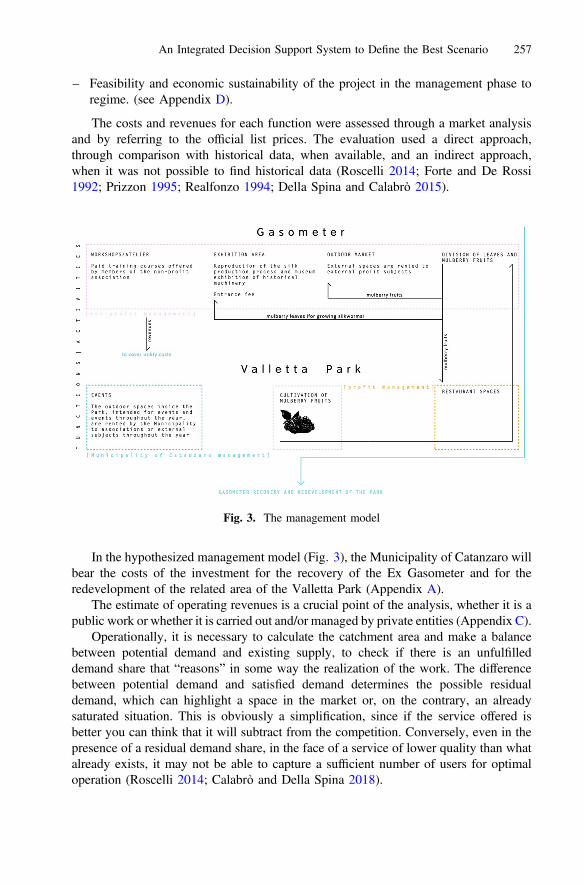
– Feasibility and economic sustainability of the project in the management phase toregime. (see Appendix D).
The costs and revenues for each function were assessed through a market analysisand by referring to the official list prices. The evaluation used a direct approach,through comparison with historical data, when available, and an indirect approach,when it was not possible to find historical data (Roscelli 2014; Forte and De Rossi1992; Prizzon 1995; Realfonzo 1994; Della Spina and Calabrò 2015).
In the hypothesized management model (Fig. 3), the Municipality of Catanzaro willbear the costs of the investment for the recovery of the Ex Gasometer and for theredevelopment of the related area of the Valletta Park (Appendix A).
The estimate of operating revenues is a crucial point of the analysis, whether it is apublic work or whether it is carried out and/or managed by private entities (Appendix C).
Operationally, it is necessary to calculate the catchment area and make a balancebetween potential demand and existing supply, to check if there is an unfulfilleddemand share that “reasons” in some way the realization of the work. The differencebetween potential demand and satisfied demand determines the possible residualdemand, which can highlight a space in the market or, on the contrary, an alreadysaturated situation. This is obviously a simplification, since if the service offered isbetter you can think that it will subtract from the competition. Conversely, even in thepresence of a residual demand share, in the face of a service of lower quality than whatalready exists, it may not be able to capture a sufficient number of users for optimaloperation (Roscelli 2014; Calabrò and Della Spina 2018).
Fig. 3. The management model
An Integrated Decision Support System to Define the Best Scenario 257

The new uses/functions envisaged for the Gasometer area have as reference thetarget the population of the municipality of Catanzaro. It was considered a territorialwater catchment area within a radius of 10 km and the potential flows of travelers ofthe Catanzaro Sala railway station, which will be reactivated in the short term (Fig. 4).
In the hypothesized management model, the Municipality will entrust the man-agement of the activities envisaged within the Gasometer and of the care of the park’sgreenery to non-profit associations.
In addition, the outdoor spaces will be rented for events and shows throughout theyear. The revenues from the activities to be placed within the Gasometer (laboratories/ateliers/market) will cover the costs for utilities and human resources for the staff involvedin the care of the mulberry trees and park greenery (Appendix B and C).
The semi-circular building located in the lower part of the park will instead beleased by the Municipality of Catanzaro to a private external profit subject (Figs. 2, 3and 5).
Fig. 4. Analysis of the user base
258 L. Della Spina et al.
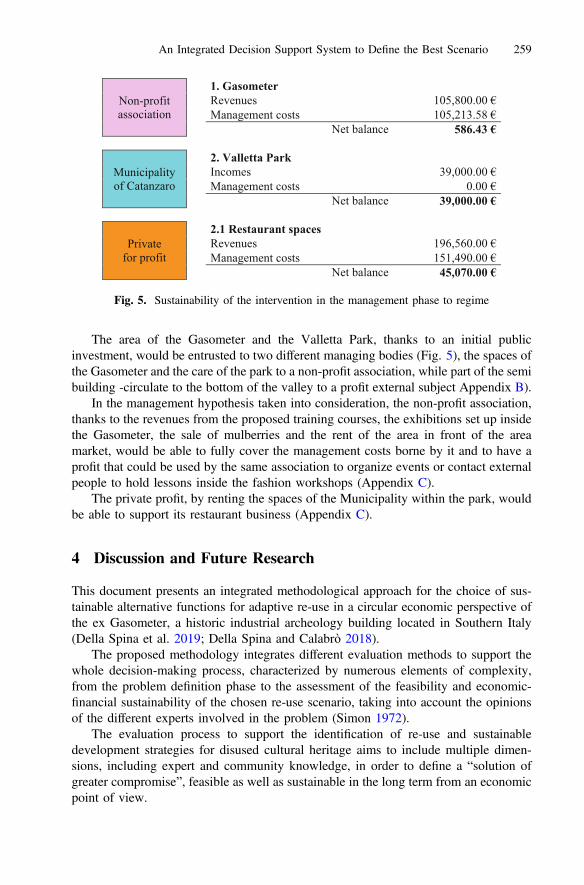
The area of the Gasometer and the Valletta Park, thanks to an initial publicinvestment, would be entrusted to two different managing bodies (Fig. 5), the spaces ofthe Gasometer and the care of the park to a non-profit association, while part of the semibuilding -circulate to the bottom of the valley to a profit external subject Appendix B).
In the management hypothesis taken into consideration, the non-profit association,thanks to the revenues from the proposed training courses, the exhibitions set up insidethe Gasometer, the sale of mulberries and the rent of the area in front of the areamarket, would be able to fully cover the management costs borne by it and to have aprofit that could be used by the same association to organize events or contact externalpeople to hold lessons inside the fashion workshops (Appendix C).
The private profit, by renting the spaces of the Municipality within the park, wouldbe able to support its restaurant business (Appendix C).
4 Discussion and Future Research
This document presents an integrated methodological approach for the choice of sus-tainable alternative functions for adaptive re-use in a circular economic perspective ofthe ex Gasometer, a historic industrial archeology building located in Southern Italy(Della Spina et al. 2019; Della Spina and Calabrò 2018).
The proposed methodology integrates different evaluation methods to support thewhole decision-making process, characterized by numerous elements of complexity,from the problem definition phase to the assessment of the feasibility and economic-financial sustainability of the chosen re-use scenario, taking into account the opinionsof the different experts involved in the problem (Simon 1972).
The evaluation process to support the identification of re-use and sustainabledevelopment strategies for disused cultural heritage aims to include multiple dimen-sions, including expert and community knowledge, in order to define a “solution ofgreater compromise”, feasible as well as sustainable in the long term from an economicpoint of view.
Non-profit association
1. Gasometer Revenues 105,800.00 €Management costs 105,213.58 €
Net balance 586.43 €
Municipality of Catanzaro
2. Valletta ParkIncomes 39,000.00 €Management costs 0.00 €
Net balance 39,000.00 €
Private for profit
2.1 Restaurant spacesRevenues 196,560.00 €Management costs 151,490.00 €
Net balance 45,070.00 €
Fig. 5. Sustainability of the intervention in the management phase to regime
An Integrated Decision Support System to Define the Best Scenario 259

The results obtained show that the re-use scenario, chosen through a multi-groupand multi-criteria decision-making process, and the chosen PPP management model isfeasible and economically sustainable.
Many experiments show that the public administration, which is characterized bythe availability of an invaluable cultural heritage, does not have the sufficient economicand managerial capacity necessary to keep this heritage efficient over time and,therefore, sees the private interlocutor (profit or non profit) the key actor with whom tocollaborate and cooperate for enhancement projects, aimed at promoting and sup-porting entrepreneurship and employment, in particular youth, by supporting innova-tive forms of business capable to raise the quality of the cultural offer, both local andnational. (Calabrò and Della Spina 2018; Calabrò et al. 2018; Della Spina and Calabrò2018; Calabrò and Della Spina 2019).
The results obtained from the decision support process show that the re-use sce-nario, identified through a multi-group and multi-criteria decision process, and inparticular the chosen PPP management model, is feasible as well as sustainable in thelong term by a from an economic point of view, as operating revenues allow fullcoverage of operating costs, including ordinary and extraordinary maintenance, withoutadditional charges and costs for the public sector (Della Spina and Calabrò 2015; DellaSpina and Calabrò 2018; Calabrò and Della Spina 2019).
The overall consistency of the results obtained also highlights that the involvementof non-profit associations in the management model of the public good is relevant notonly for the economic sustainability of the project, but also for the emancipation of thelocal communities and the re-appropriation of their identity, indispensable for trig-gering virtuous processes of local development (Della Spina 2020).
Today, the new challenge for local authorities is to regenerate abandoned anddisused heritage buildings, in a process that must necessarily involve the variousstakeholders and the local community in order to create new governance models thatare capable of to guarantee economic sustainability and the conservation of historicheritage and cultural values, as in the case of the former Gasometer, which has alwaysbeen a symbol for the local community (Della Spina et al. 2019).
From this perspective, the study could have interesting political implications in thechallenge faced by decision-makers in rethinking the planning and design of a generalplan aimed at relaunching and enhancing the immense historic heritage with a view tocircular economy, economic development of the territory, which identifies the keys to aculture-led regeneration process in adaptive reuse and cultural and creative (DellaSpina et al. 2019; Della Spina 2020; Vickery 2007).
Author Contributions. The contribution is the result of the joint effort of the authors. Despitethe global responsibility for the work being equally shared between the three authors, Lucia DellaSpina is responsible for Sects. 3 and 4, while Claudia Giorno e Ruggiero Galati Casmiro areresponsible for Sects. 2 and Appendix. The abstract and introduction are the result of the jointwork of the three authors.
260 L. Della Spina et al.

Appendix A - ESTIMATED INVESTMENT COSTS
PART I - INVESTMENT FOR THE RECOVERY AND RE-USE OF REAL ESTATE
Unit(sqm)
ConstructionCost (euro/sqm)
Total (euro)
A - Estimated construction costA.1. GasometerProperty recovery 965 680.00 656.200,00A.2. Valletta ParkExternal arrangement and planting ofmulberries
51,470 6.00 308,820.00
Parking 1,060 38.00 40,280.00Driveway 610 53.00 32,330.00Amount of completion and redevelopment of“Valletta Park” project (2002–2010)
2,424,240.00
Photovoltaic system 255 2,000.00 5,000.00A - Total costs for auction based works 3,466,870.00of which: costs for the implementation of safety plans (not subject to auctionreduction)
69,337.40
B - Estimate of the sums available to the promoterB.1 Economic jobs planned and excluded from the contract 0.00B.2. Topographical survey, findings and geological surveys 0.00B.3 Allacciamenti ai pubblici servizi (VAT included)) 0.00B.4 Unexpected costs 104,006.10B.5 Acquisition of areas or assets 0.00B.6 Provision for the adjustment of the prices (referred to art. 133, c. 3 del D.Lgs. 163/2006)
0.00
B.7 Incentive expenses (referred to art. 92, c. 5 del D.Lgs. 163/2006) 34,668.70B.8 Technical expenses (planning, works management, daily assistance andworks accounting)
208,012.20
B.9 Technical expenses (planning, works management, daily assistance andworks accounting)
34,668.70
B.10 Expenses for consultancy and support activities 0.00B.11 Possible expenses for selection boards 0.00B.12 Expenses for advertising and, where applicable, for artistic works 0.00B.13 Expenses for laboratory tests, technical checks and work tests 34,668.70B.a - Total sums available to the Promoter excluding VAT 416,024.40B 14. VAT (if not recoverable) and any other taxes 41,602.44B.b - Total sums available to the Promoter including VAT 457.626,84
SUMMARY I - INVESTMENT FOR THE RECOVERY AND RE-USEOF BUILDINGS (PRODUCTION COST)A) Total costs auction based works 3,466,870.00B) Sums available to the Promoter 457,626.84I – Total investment for the recovery and re-use of real estate 3,924,496.84
An Integrated Decision Support System to Define the Best Scenario 261
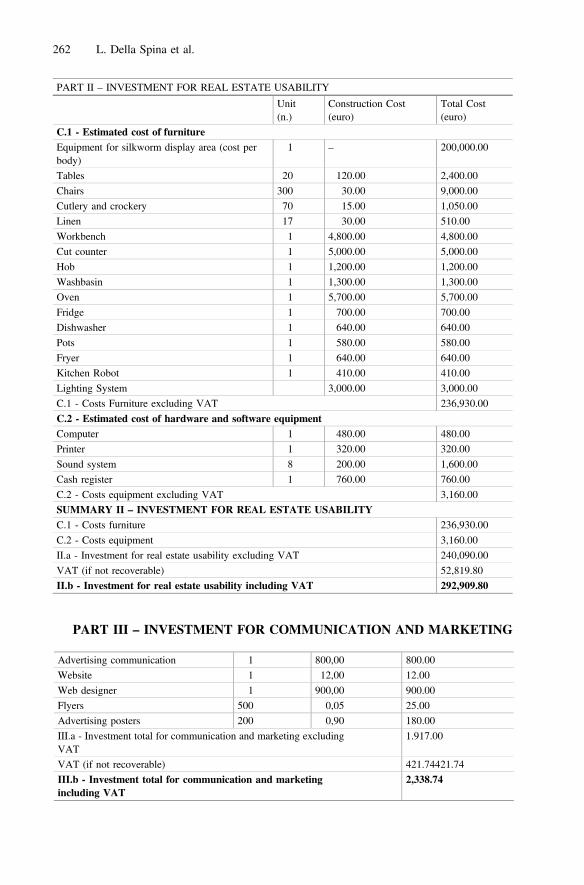
PART III – INVESTMENT FOR COMMUNICATION AND MARKETING
PART II – INVESTMENT FOR REAL ESTATE USABILITY
Unit(n.)
Construction Cost(euro)
Total Cost(euro)
C.1 - Estimated cost of furnitureEquipment for silkworm display area (cost perbody)
1 – 200,000.00
Tables 20 120.00 2,400.00
Chairs 300 30.00 9,000.00Cutlery and crockery 70 15.00 1,050.00Linen 17 30.00 510.00
Workbench 1 4,800.00 4,800.00Cut counter 1 5,000.00 5,000.00
Hob 1 1,200.00 1,200.00Washbasin 1 1,300.00 1,300.00Oven 1 5,700.00 5,700.00
Fridge 1 700.00 700.00Dishwasher 1 640.00 640.00
Pots 1 580.00 580.00Fryer 1 640.00 640.00Kitchen Robot 1 410.00 410.00
Lighting System 3,000.00 3,000.00C.1 - Costs Furniture excluding VAT 236,930.00
C.2 - Estimated cost of hardware and software equipmentComputer 1 480.00 480.00Printer 1 320.00 320.00
Sound system 8 200.00 1,600.00Cash register 1 760.00 760.00
C.2 - Costs equipment excluding VAT 3,160.00SUMMARY II – INVESTMENT FOR REAL ESTATE USABILITYC.1 - Costs furniture 236,930.00
C.2 - Costs equipment 3,160.00II.a - Investment for real estate usability excluding VAT 240,090.00
VAT (if not recoverable) 52,819.80II.b - Investment for real estate usability including VAT 292,909.80
Advertising communication 1 800,00 800.00Website 1 12,00 12.00
Web designer 1 900,00 900.00Flyers 500 0,05 25.00Advertising posters 200 0,90 180.00
III.a - Investment total for communication and marketing excludingVAT
1.917.00
VAT (if not recoverable) 421.74421.74III.b - Investment total for communication and marketingincluding VAT
2,338.74
262 L. Della Spina et al.
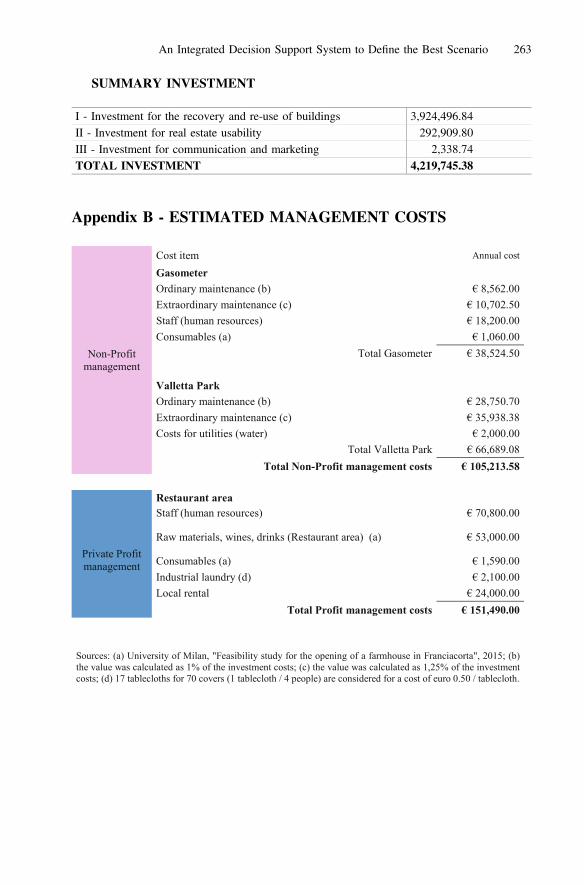
SUMMARY INVESTMENT
Appendix B - ESTIMATED MANAGEMENT COSTS
I - Investment for the recovery and re-use of buildings 3,924,496.84II - Investment for real estate usability 292,909.80III - Investment for communication and marketing 2,338.74TOTAL INVESTMENT 4,219,745.38
Non-Profit management
Cost item Annual cost
GasometerOrdinary maintenance (b) € 8,562.00Extraordinary maintenance (c) € 10,702.50Staff (human resources) € 18,200.00Consumables (a) € 1,060.00
Total Gasometer € 38,524.50
Valletta Park Ordinary maintenance (b) € 28,750.70Extraordinary maintenance (c) € 35,938.38Costs for utilities (water) € 2,000.00
Total Valletta Park € 66,689.08Total Non-Profit management costs € 105,213.58
Private Profitmanagement
Restaurant areaStaff (human resources) € 70,800.00
Raw materials, wines, drinks (Restaurant area) (a) € 53,000.00
Consumables (a) € 1,590.00Industrial laundry (d) € 2,100.00Local rental € 24,000.00
Total Profit management costs € 151,490.00
Sources: (a) University of Milan, "Feasibility study for the opening of a farmhouse in Franciacorta", 2015; (b) the value was calculated as 1% of the investment costs; (c) the value was calculated as 1,25% of the investment costs; (d) 17 tablecloths for 70 covers (1 tablecloth / 4 people) are considered for a cost of euro 0.50 / tablecloth.
An Integrated Decision Support System to Define the Best Scenario 263
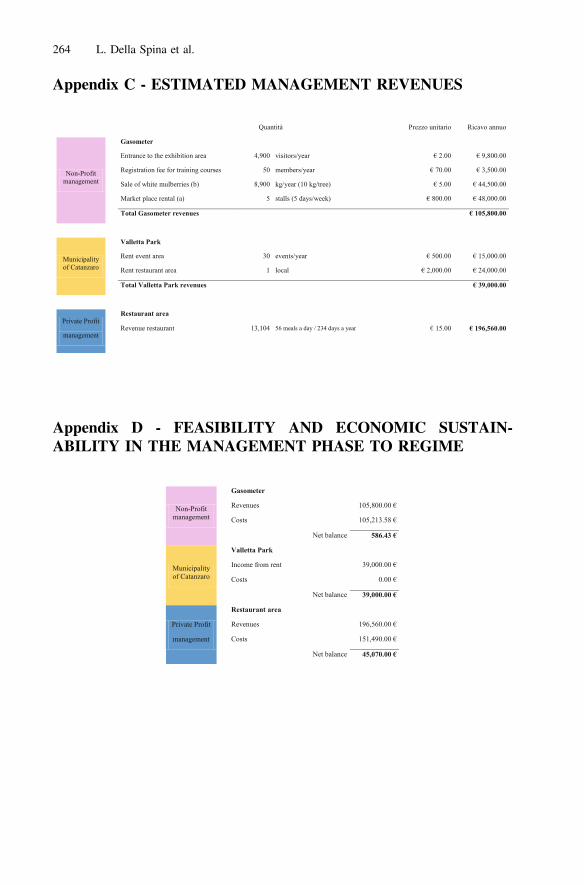
Appendix C - ESTIMATED MANAGEMENT REVENUES
Appendix D - FEASIBILITY AND ECONOMIC SUSTAIN-ABILITY IN THE MANAGEMENT PHASE TO REGIME
264 L. Della Spina et al.
References
Bourne, L.: Project relationships and the stakeholder circle. In: PMI Research Conference, CentreMont-Royal, Montreal, Canada (2005)
Calabrò, F., Mallamace, S., Meduri, T., Tramontana, C.: Unused real estate and enhancement ofhistoric centers: legislative instruments and procedural ideas. In: Calabrò, F., Della Spina, L.,Bevilacqua, C. (eds.) New Metropolitan Perspectives, ISHT 2018. Smart Innovation, Systemsand Technologies – SIST, vol. 101, pp. 464–474. Springer, Cham (2019). https://doi.org/10.1007/978-3-319-92102-0_49. ISBN: 978-3-319-92098-6, ISSN: 2190-3018
Calabrò, F., Della Spina, L.: The public-private partnership for the enhancement of unused publicbuildings: an experimental model of economic feasibility project. Sustainability 11, 5662(2019). https://doi.org/10.3390/su11205662
Calabrò, F., Della Spina, L.: Il Partenariato Pubblico Privato per la valorizzazione degli immobilipubblici inutilizzati. Un modello sperimentale di Progetto di Fattibilità Economica. LaborEst2018, 16 IS, 1–40 (2018). https://doi.org/10.19254/laborest.16.IS
Della Spina, L.: Adaptive sustainable reuse for cultural heritage: a multiple criteria decisionaiding approach supporting urban development processes. Sustainability 12, 1363 (2020).https://doi.org/10.3390/su12041363
Della Spina, L.: Multidimensional assessment for “Culture-Led” and “Community-Driven” urbanregeneration as driver for trigger economic vitality in urban historic centers. Sustainability 11,7237 (2019a). https://doi.org/10.3390/su11247237
Della Spina, L., Calabrò, F.: Decision support model for conservation, reuse and valorization ofthe historic cultural heritage. In: Gervasi, O., et al. (eds.) Computational Science and ItsApplications – ICCSA 2018. ICCSA 2018. Lecture Notes in Computer Science, vol. 10962.LNCS, pp. 3–17. Springer, Cham (2018). https://doi.org/10.1007/978-3-319-95168-3_1
Della Spina, L., Giorno, C., Galati Casmiro, R.: Bottom-up processes for culture-led urbanregeneration scenarios. In: Misra, S., et al. (eds.) Computational Science and Its Applications– ICCSA 2019. Lecture Notes in Computer Science, vol. 11622, pp. 93–107. Springer, Cham(2019). https://doi.org/10.1007/978-3-030-24305-0_8
Della Spina, L.: Evaluation decision support models: highest and best use choice. Procedia Soc.Behav. Sci. (2016). https://doi.org/10.1016/j.sbspro.2016.05.323. ISSN: 1877-0428
Della Spina, L., Calabrò, F.: Processo edilizio e stima dei costi. Laborest 11, 1–22 (2015). ISSN:2421-3187
Della Spina, L.: Historical cultural heritage: decision making process and reuse scenarios for theenhancement of historic buildings. In: Calabrò, F., Della Spina, L., Bevilacqua, C. (eds.) NewMetropolitan Perspectives. ISHT 2018. Smart Innovation, Systems and Technologies, vol.101. Springer, Cham (2018). https://doi.org/10.1007/978-3-319-92102-0_47
Della Spina, L.: A multi-level integrated approach to designing complex urban scenarios insupport of strategic planning and urban regeneration. In: Calabrò, F., Della Spina, L.,Bevilacqua, C. (eds.) New Metropolitan Perspectives. ISHT 2018. Smart Innovation, Systemsand Technologies, vol. 100. Springer, Cham (2019b). https://doi.org/10.1007/978-3-319-92099-3_27
Dente, B.: Policy Decisions, 134 p. Springer, Heildelberg (2014). https://doi.org/10.1007/978-3-319-02520-9
Dyson, K., Matthews, J., Love, P.E.: Critical success factors of adapting heritage buildings: anexploratory study. Built Environ. Proj. Asset Manag. 6, 44–57 (2015)
Dolores, L., Macchiaroli, M., De Mare, G.: A dynamic model for the financial sustainability ofthe restoration sponsorship. Sustainability 12(4), 1694 (2020)
Forte, F., De Rossi, B.: Principi di economia ed estimo; Etas: Milano, Italy (1992)
An Integrated Decision Support System to Define the Best Scenario 265
Fusco Girard, L., Nijkamp, P.: Le valutazioni per lo sviluppo sostenibile della città e delterritorio, FrancoAngeli, Milano (1997)
Fusco Girard, L., Gravagnuolo, A.: Circular economy and cultural heritage/landscaperegeneration. Circular business, financing and governance models for a competitive Europe.BDC Bollettino Del Centro Calza Bini 17, 35–52 (2017)
Gamboa, G., Munda, G.: The problem of windfarm location: a social multi-criteria evaluationframework. Energy Policy 35, 1564–1583 (2007)
Geissdoerfer, M., Savaget, P., Bocken, N.M.P., Hultink, E.J.: The circular economy—a newsustainability paradigm? J. Clean. Prod. 143, 757–768 (2017)
Ishizaka, A., Nemery, P.: Multi-Criteria Decision Analysis: Methods and Software. Wiley,Chichester (2013)
Kirchherr, J., Reike, D., Hekkert, M.: Conceptualizing the circular economy: an analysis of 114definitions. Resour. Conserv. Recycl. 127, 221–232 (2017)
Mao, J., Li, C., Pei, Y., Xu, L.: Implementation of a circular economy. In: Circular Economy andSustainable Development Enterprises, pp. 151–170. Springer, Singapore (2018)
Munda, G.: Social multi-criteria evaluation (SMCE): methodological foundations and operationalconsequences. Eur. J. Oper. Res. 158, 662–677 (2004)
Nesticò, A., Morano, P., Sica, F.: A model to support the public administration decisions for theinvestments selection on historic buildings. J. Cult. Heritage 33, 201–207 (2018)
Nesticò, A., Maselli, G.: Sustainability indicators for the economic evaluation of tourisminvestments on islands. J. Cleaner Prod. 248 (2020). Art. no. 119217. https://doi.org/10.1016/j.jclepro.2019.119217
Pinto, M.R., De Medici, S., Senia, C., Fabbricatti, K., De Toro, P.: Building reuse: multi-criteriaassessment for compatible design. Int. J. Des. Sci. Technol. IJDST 22, 165–193 (2017)
Potting, J., Hekkert, M., Worrell, E., Hanemaaijer, A.: Circular Economy: Measuring Innovationin the Product Chain; Policy Report; PBL Netherlands Environmental Assessment Agency:The Hague, The Netherlands (2017)
Prizzon, F.: Gli Investimenti Immobiliari. Analisi Di Mercato E Valutazione Economico-Finanziaria degli Interventi. Celid, Torino (1995)
Realfonzo, A.: Teoria e metodo dell’Estimo urbano. Roma, Italy, Nis (1994)Roscelli, R. (eds.): Manuale di estimo: valutazioni economiche ed esercizio della professione.
UTET università (2014)Saaty, T.L.: Decision Making with Dependence and Feedback: The Analytic Network Process.
RWS Publications, Pittsburgh (1996)Saaty, T.L.: Theory and Applications of the Analytic Network Process. RWS Publications,
Pittsburgh (2005)Saaty, T.L.: The analytic network process. In: Decision Making with the Analytic Network
Process; International Series in Operations Research and Management Science, vol. 95, pp. 1–26. Springer, Boston (2006)
Simon, H.: Theories of bounded rationality. In: McGuire, C.B., Radner, R. (eds.) Decision andOrganization, pp. 161–176. North-Holland, Amsterdam (1972)
Vickery, J.: The Emergence of Culture-Led Regeneration: A Policy Concept and Its Discontents;Centre for Cultural Policy Studies: Warwick, UK (2007). http://wrap.warwick.ac.uk/36991/1/WRAP_Vickery_ccps.paper9.pdf. Accessed 29 Oct 2019
Yang, R.J.: An investigation of stakeholder analysis in urban development projects: empirical orrationalistic perspectives. Int. J. Proj. Manag. 32(5), 838–849 (2014)
266 L. Della Spina et al.

Open Access This chapter is licensed under the terms of the Creative Commons Attribution 4.0International License (http://creativecommons.org/licenses/by/4.0/), which permits use, sharing,adaptation, distribution and reproduction in any medium or format, as long as you give appro-priate credit to the original author(s) and the source, provide a link to the Creative Commonslicense and indicate if changes were made.The images or other third party material in this chapter are included in the chapter's Creative
Commons license, unless indicated otherwise in a credit line to the material. If material is notincluded in the chapter's Creative Commons license and your intended use is not permitted bystatutory regulation or exceeds the permitted use, you will need to obtain permission directlyfrom the copyright holder.
An Integrated Decision Support System to Define the Best Scenario 267
Middle Lands in Friuli Venezia Giulia.Research by Design and Towards Action
Elena Marchigiani(&)
Department of Engineering and Architecture, University of Trieste, Trieste, [email protected]
Abstract. In the Italian Region Friuli Venezia Giulia, 71% of the Municipal-ities count less than 5,000 inhabitants, with a stop in population growth and anincrease of aging trends. In the frame of the cohesion policies (National Strategyfor Inner Areas – SNAI), three Project Areas were identified in the mountainsector. However, the presence of middle lands is even more pervasive. This termstands for marginalised contexts, outside those identified by the SNAI; they aredotted by natural and rural landscapes, small urban centres, and the peripheriesof medium cities. Here the number of inhabitants and the functioning of servicesstill hold on, economic crisis and abandonment have not reached their climax.Nonetheless, the risk to slip into more serious conditions of fragility is strong.Since some years, at the University of Trieste, these areas have been the
object of Urban Planning Courses. The methodology is that of research bydesign to support local planning and regional policies. Starting from the char-acters of marginalised contexts in Friuli Venezia Giulia, this paper presents theoutputs of the activities developed in the middle lands along the river Cormor.Through the interaction with the Municipalities involved in the construction of aRiver Contract, the request to draw the extension of a horse/cycle path offeredthe opportunity to reflect on how to reconceive economies and services relatedto slow tourism within a larger planning perspective. Project investigationsinterpreted Cormor as the spine of a network of ecological services, and newfunctions were defined for existing collective facilities. The research is in pro-gress, and more contexts will be studied within Friuli Venezia Giulia SNAI’sareas. In view of the next season of EU cohesion policies, the closing paragraphquestions the definition of place-based development strategies for marginalisedterritories, and the need to go beyond spatial perimeters centred on abstractstatistical indicators and accessibility parameters.
Keywords: Friuli Venezia Giulia � Middle lands � Local development
1 Introduction
1.1 A Growing National Debate
In Italy, over the last years, there has been a rekindling of debate on territorial rep-resentations as a support to economic programs and cohesion policies [1, 2]. The startin 2014 of the National Strategy for Inner Areas (SNAI) was a turning point [3]. Theclassification of the Italian territory on the basis of the different degrees of accessibility
© The Author(s) 2020C. Bevilacqua et al. (Eds.): NMP 2020, SIST 177, pp. 268–280, 2020.https://doi.org/10.1007/978-3-030-52869-0_23

to urban poles and services directed funding on some target areas in the most seriousconditions of depopulation, economic crisis, hydrogeological and seismic risks1. Thishas opened up the possibility to start a new phase of development policies, and todaySNAI’s results offer inputs to further thought and action.
In the view of the next 2021–2027 EU programs, planning reflection is focusing on thevariety of peripheral situations that characterise large parts of Italian urbanised contexts:in addition to the fragile and abandoned territories that are already included in the SNAI, thereflection also concentrates on the outskirts of large and medium urban centres, as well ason the variety of in-between landscapes made of disconnected aggregates of rural areasand small towns2. What emerges is a geography of different marginalised areas, punc-tuating the north and south of the Country, the mountains and the plains; they shareproblems of economic and/or demographic shrinkage, and the need to deeply reorganisethe offer of basic equipment for social and health care, education and mobility.
However critical this representation of Italy may be, it also suggests a radical shiftin development perspectives for both marginalised contexts and the whole Country.Extending and refining SNAI’s approach, while putting aside policies based on a meredefence and homologation of ‘slower’ contexts to the (few) competitive urban areas,can be a way to give a voice and a future to many peripheral situations. The reference isto place-based projects, built together with local populations, and aimed at reactivatingexisting (and often hidden) resources and social-economic initiatives. However, lo-calism is not enough. A new course of public-directed policies, addressing public andprivate investment, and referring to an urban strategy built on national and regionalscales, is strongly needed [5–7].
1.2 Marginalised Areas in Friuli Venezia Giulia
Within a reflection on marginalised areas, the case of the Italian region Friuli VeneziaGiulia is significant. Here 71% of the Municipalities count less than 5,000 inhabitants,with an overall standstill of population and a growth of aging trends; there is only onemedium-sized city (Trieste, 204,338 inhabitants), and three small capital cities (Gor-izia, 34,411; Pordenone 51,139; Udine, 99,518 inhabitants) [8]. Three SNAI’s ProjectAreas have been recognised in the mountain sector: Dolomiti Friulane, Alta Carnia, ValCanale – Canal del Ferro (43 Municipalities and about 58,000 inhabitants in total,nearly 4.8% of the overall regional population) [9]3.
1 On the basis of the travel time by car to the nearest urban/intermunicipal pole of services, SNAI
classifies as “inner areas”: “intermediate” (20–40 min), “peripheral” (40–75 min), “ultra-peripheral”(over 75 min) territories. They cover 51.7% of Italian Municipalities, 22.4% of national populationand nearly 60% of the Country surface. By 2018, 72 target areas were selected; they cover 1,071Municipalities (26% of territories classified as inner areas) [4].
2 The building of atlases and debate on marginalised areas are currently at the core of research,seminars and conferences developed by the Italian Society of Planners (SIU; a technical group wasestablished in 2019), the Italian Institute of Planning (INU), the National Research Council of Italy(CNR-IRISS), and many Italian Universities (among the others, Politecnico of Milano, Politecnico ofTorino, IUAV of Venezia, Università Federico II of Napoli, Università di Camerino).
3 By 2020, only one of the Strategies for the SNAI’s areas (Alta Carnia) was approved by the NationalCommittee for Inner Areas, shile the other two are still under signature by the Ministries.
Middle Lands in Friuli Venezia Giulia 269
If the coverage of SNAI’s areas is quite relevant, the presence ofmiddle lands is no lessextensive. This term refers to contexts that, while pervasive, do not fall within theparameters and perimeters established for the SNAI’s most marginal territories. In themiddle lands, the number of inhabitants and the distribution of services still hold on(albeit with difficulty), the situations of economic crisis and abandonment are still lim-ited, ecological, landscape and historical assets are often consistent, and entrepreneurialculture has not yet disappeared. Nonetheless, the increase of environmental and socialand economic challenges, and the difficulties of small Municipalities to coordinate actionand resources, put these contexts at the risk of slipping into more serious conditions ofmarginality. Today, the middle lands and the inner areas of Friuli Venezia Giulia jointlysuffer from the lack of a regional vision, helping reactivate their development potentials.It is therefore no coincidence that in the SNAI’s areas the expenditure of the availableEuropean, national and regional funds shows significant delays, nor that the access tospecific funding remains highly uncertain for the middle lands of this region.
Since some years, at the University of Trieste, the strategic role that marginalisedareas can play in spatial plans – both at the regional and the intermunicipal levels – hasbeen the object of project investigations. The methodology is that of research by designto support policy and action. In the frame of the teaching activities of the MasterCourse in Architecture, regional contexts are chosen on the basis of the opportunity towork with local actors, in order to help them build development scenarios which arestrongly embedded in local resources. This paper presents the outputs of the firstinvestigations carried out in the middle lands along the river Cormor. The secondparagraph describes the main features of the study area and the invitation to reflect onnew interpretative approaches offered by the interaction with the Municipalitiesinvolved in the construction of a River Contract. The third section explains how thelocal stakeholders’ request to draw the extension of a horse/cycle path was specificallytranslated into an opportunity to reframe economies and services related to slowtourism within a larger planning perspective. In this perspective, the Cormor was readas the spine of a network of ecological services, and new functions were defined forexisting collective equipment. The research is in progress, and more contexts will bestudied within Friuli Venezia Giulia SNAI’s areas. In view of the next season of EU
cohesion policies, the closing paragraph questions the definition of place-baseddevelopment strategies for marginalised territories, and the need to go beyond spatialperimeters centred on abstract statistical indicators and accessibility parameters.
2 The Middle Lands Along the River Cormor
Working on the middle lands along the river Cormor provided insights into territorialconditions that recur in Friuli Venezia Giulia [10]4. In this region, many urban centresstand nearby the system of rivers stretching from the mountains to the sea. The focus of
4 The reference is to the Urban Planning and Design Studio (academic year 2018–2019), at the fourthyear of Architecture, coordinated by Elena Marchigiani, with Paola Cigalotto and Andrea Peraz.
270 E. Marchigiani

the University activities was on the sequence of urbanised spaces, including the smallcentres along the river Cormor, and the western peripheries of the middle-sized city ofUdine5. These areas were selected in order to cover a significant sample of intertwinedriver and urban landscapes: from the northern foothill sector, where the Cormor runs inthe middle of the reliefs topped by ancient villages; to the ‘dry plain’, where Udineconurbation lay, and the minor water network is mainly underground; to the southern‘wet plain’, where the water comes again to the surface, and the urbanization becomesmore scattered (Fig. 1).
2.1 Edge Territories Back at the Centre
Despite the presence of areas of environmental interest, over time, the weakening ofrelationship between the river landscapes and the neighbouring urban centres hascontributed to relegate Cormor to a marginal position within the overall functioningand use of these middle lands. At a first glance, no exceptional landscapes, nor out-standing tourist and cultural attractors can be recognised. The minimal and ordinaryelements of spatial identity and rural production suffer from the crisis of the social andeconomic conditions that, in the past, ensured their construction and management.Standing on the edge of the city and the countryside, of the water and the land, thesecounter-spaces of the contemporary urbanisation risk being reductively interpreted asplaces that don’t matter, where abandonment and degradation are unavoidable [11].
However, these interpretative drifts can be eluded by taking a different approach. Thefirst move is to re-centralise the margin [6]. By making our glance more attentive, wehave to search for the local conditions where to graft trajectories of internal
Fig. 1. Friuli Venezia Giulia. On the left, the SNAI’s Project Areas and the Cormor middle lands;on the right, the settlements framework, the main watercourses, and the orography. In red, theriver Cormor (SOURCE: L. Di Giusto)
5 The investigation covered 11 Municipalities in the former province of Udine (from Tricesimo at thenorth, to Castions di Strada at the south), counting about 171,000 inhabitants.
Middle Lands in Friuli Venezia Giulia 271

metamorphosis. In this perspective, the relationship with the river can once again becomean opportunity to answer the contemporary demands for a better quality of life, and for a‘slower’, more sustainable and endogenous social and economic growth [12, 13].
2.2 The River Contract as an Opportunity
The opportunity to test this approach on the Cormor middle lands was given by thecollaboration with local stakeholders6. Since the early 2000s, a number of Munici-palities along the river have started to jointly reflect on the sustainable management ofwater resources and the settlement of new economic activities. Thanks to Europeancooperation funds, they succeeded in equipping the northern part of a horse and cycletrack (Ippovia del Cormor). With the Valle del Cormor citizens’ Association, theMunicipalities are now engaged in the definition of a River Contract: a largescale andlong-term strategic and planning tool, where environmental issues combine with thoseof local development.
The process towards the River Cormor Contract was fostered by the adhesion of theFriuli Venezia Giulia Region to these initiatives (in 2016), and by the perspective offuture funds (that, however, have not yet been programmed)7. In 2017, the Valle delCormor Association organised participatory activities with local communities. Thedefinition of the Document of Intents for the River Contract started in May 2018. Theactions developed with the University of Trieste strongly interacted with this process.In April 2019 the signature of the Document of Intents started, under the coordinationof the Municipality of Tricesimo, with the involvement of the Friuli Venezia GiuliaRegion, the Reclamation of the Friuli Plain Consortium, and the Valle del CormorAssociation. The objectives set by the Document cover different fields of action. Theydo not only consist in environmental protection, the prevention of hydrogeological risk,the reduction of water pollution due to urban and agricultural activities. They also dealwith the tourist development of these territories, whose location in the proximity ofimportant European cycle routes offers unprecedented opportunities (the reference is tothe Alpe Adria cross-border itinerary)8.
The stakeholders’ request to design the extension to the Adriatic Sea of the horseand cycle track along the river gave the University a chance to reframe the issue oftourism in an integrated planning perspective, and to imagine the accessibility to thewatercourse as a driver for new economies and services spreading their effects on largerterritories.
6 The teaching and research activities developed by the University of Trieste were organised in theframe of an agreement between the Department of Engineering and Architecture, the Municipality ofTricesimo, and the Valle del Cormor Association.
7 The Regional Law no. 11/2015 defined and structured the process of negotiated planning for theRiver Contracts; with the resolution of the Regional Council no. 1448, 28.07.2016, Friuli VeneziaGiulia formally adhered to the National Charter of River Contracts, launching activities aimed atpromoting and supporting them on the regional territory [14].
8 In the Regional Landscape Plan approved in 2018, the completion of the Ippovia del Cormor is partof the project for a regional slow mobility network [15].
272 E. Marchigiani
3 Project-Oriented and Shared Representations
Teaching and research by design activities were addressed to draw representations andproject inputs that could help local actors build deeper reflection on future policies andspatial interventions. The prompt was to read the river not as a trivial back of cities andrural sites, but as the spine of a new system of ecological services, able to put into playa rich estate of often underused public facilities and housing settlements, and toredefine cycle tourism in relation to the particular sensitivity and lifestyles of theCormor middle lands.
During this process, professors and students were accompanied by representativesof the Valle del Cormor Association and of the Municipalities adhering to the RiverContract. We started by combining the analysis of the current planning tools with visitsto the study areas, where we talked to technicians and politicians, listened to inhabi-tants, observed and reflected in places. The discussion with our partners of intermediateresults further prompted to synthesise ideas into new representations of existingresources and of their enhancement opportunities.
We were convinced that co-building explorations of locally rooted potentials foreconomic and social redevelopment had to be an essential ingredient of our contri-bution to the implementation of the River Contract. In this view, we started fromrecognising the functions and values of the waterway ecosystem, with the aim to takethe places where they materialise as the main components of a new spatial system, inwhich the development of green and blue networks, of new tourist activities, and thereuse of existing equipment can find a synthesis and mutual interactions.
3.1 A Complex Ecosystem
All through the Urban Planning and Design Studio, students and local actors wereinvited to interpret the river contexts as a complex ecosystem.
In order to safeguard, restore, enhance and manage river landscapes, it is necessaryto identify correlations among a multiplicity of material and immaterial processes andelements of the territory [16]. This viewpoint allows to recognise the primary value ofthe interconnections between the river and the urban settlements, the natural elements,and the evidence of local culture and production.
Building visions for the Cormor landscapes therefore meant focusing on the dif-ferent functions (and values) that, today, waterways can recover in the fields of:ecology (rivers as excretory systems; natural corridors; areas where to govern hydro-geological fragility); society (rivers as spaces perceived and enjoyed by local com-munities; common goods; components of equipment addressed to stable andtemporary, static and moving populations); economy (rivers as places for sustainableactivities, different from intensive production and agricultural exploitation); culture(rivers as gates through which to rediscover and enhance the history and the identity ofthe territory, and as attractors of new tourist flows). In this way, the focus on theCormor stream and trail was framed into a more complex spatial system.
Middle Lands in Friuli Venezia Giulia 273

3.2 Tourism and Well-Being
The issues of tourism and cycling added further inputs for drawing new representationsof the Cormor ecosystem. Specifically, they invited to interpret the river as the com-ponent of a network of greenways [17]. Emphasis was put on the many potentials ofslow mobility: from favouring the access and enjoyment of ‘minor’ landscapes; tooffering the opportunity to activate circular economies. However, cycling is not only atourists’ practice. In our Country, the growth of seasonal and daily soft mobility istracing new geographies, that tell how local administrations, stakeholders and enter-prises have been able to conceive products and services of particular innovation andexcellence, addressed both to tourists and residents [18].
According to these considerations, we invited the students to conceive the green-ways as part of the system of collective equipment that already punctuates the Cormormiddle lands. Our surveys had in fact shown how the fragility of the territories alongthe river and of the communities that inhabit them was also connected to a growinglack in the maintenance of public spaces and services; to their inadequacy to the needsof moving and changing populations; to their closure to the contexts and difficultaccessibility. Integrated work on the banks of the river and on the edges of urbancentres, on the rural spaces and on the leftovers of peri-urban agriculture, was thereforea stimulus to take the project of the cycle route as a prompt to rethink the uses of publicfacilities and their spatial connections; to regenerate the legacy of urban policies andplanning standards that, over time, have built the material quality of welfare and ofeveryday life (green areas, spaces for mobility, social-assistance and educational-cultural services) [19].
3.3 Light Infrastructural Projects for Local Development
The search for places and materials where light infrastructural and re-equipmentprojects could be grounded forced us to continuously move across different scales. Westarted from a larger perspective, to draw a master plan holding together the manyfunctions that the Cormor middle lands can play as a whole. In general terms, the horseand cycle itinerary was conceived not as a single path, but as a widespread infras-tructure for the slow use of the territory. Design explorations showed the capacity ofthe cycle route to promote environmental protection and risk management, as well as toattract inhabitants and enterprises through the settlement of new facilities (accommo-dation and catering equipment, connected to the production, sale and consumption oftypical goods; sports events and trails, offering the experience of regional landscapes).The parallel focus on a site-specific scale allowed to articulate the master planaccording to different territorial situations. Specifically, three types of spatial ‘transects’were recognised, on the basis of the features of the watercourse (channelled or not,above-ground or at a lower level, with natural or artificial banks), the proximity of thecycle way to the river, the combination of urban, rural or natural land uses. This, again,proved the internal variety of the middle lands, and the need to adjust visions andprojects to their resources.
274 E. Marchigiani
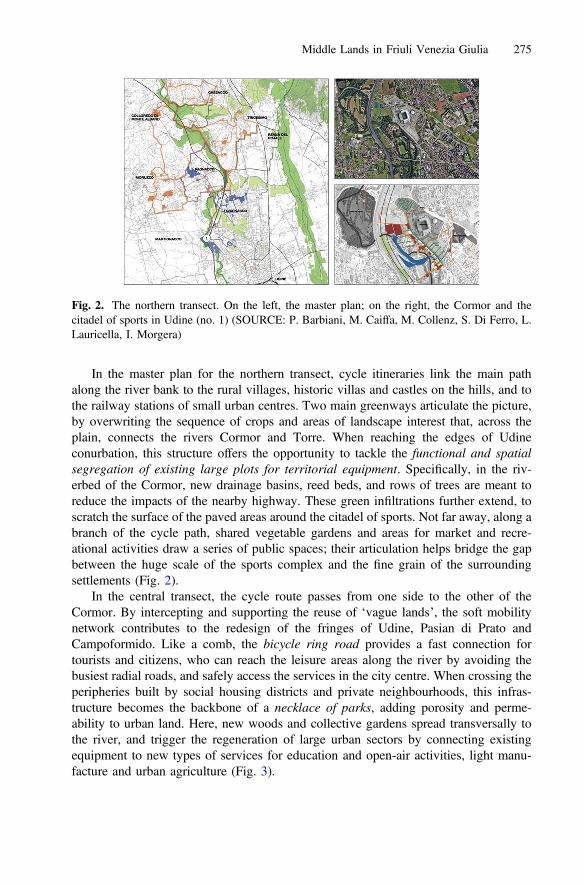
In the master plan for the northern transect, cycle itineraries link the main pathalong the river bank to the rural villages, historic villas and castles on the hills, and tothe railway stations of small urban centres. Two main greenways articulate the picture,by overwriting the sequence of crops and areas of landscape interest that, across theplain, connects the rivers Cormor and Torre. When reaching the edges of Udineconurbation, this structure offers the opportunity to tackle the functional and spatialsegregation of existing large plots for territorial equipment. Specifically, in the riv-erbed of the Cormor, new drainage basins, reed beds, and rows of trees are meant toreduce the impacts of the nearby highway. These green infiltrations further extend, toscratch the surface of the paved areas around the citadel of sports. Not far away, along abranch of the cycle path, shared vegetable gardens and areas for market and recre-ational activities draw a series of public spaces; their articulation helps bridge the gapbetween the huge scale of the sports complex and the fine grain of the surroundingsettlements (Fig. 2).
In the central transect, the cycle route passes from one side to the other of theCormor. By intercepting and supporting the reuse of ‘vague lands’, the soft mobilitynetwork contributes to the redesign of the fringes of Udine, Pasian di Prato andCampoformido. Like a comb, the bicycle ring road provides a fast connection fortourists and citizens, who can reach the leisure areas along the river by avoiding thebusiest radial roads, and safely access the services in the city centre. When crossing theperipheries built by social housing districts and private neighbourhoods, this infras-tructure becomes the backbone of a necklace of parks, adding porosity and perme-ability to urban land. Here, new woods and collective gardens spread transversally tothe river, and trigger the regeneration of large urban sectors by connecting existingequipment to new types of services for education and open-air activities, light manu-facture and urban agriculture (Fig. 3).
Fig. 2. The northern transect. On the left, the master plan; on the right, the Cormor and thecitadel of sports in Udine (no. 1) (SOURCE: P. Barbiani, M. Caiffa, M. Collenz, S. Di Ferro, L.Lauricella, I. Morgera)
Middle Lands in Friuli Venezia Giulia 275
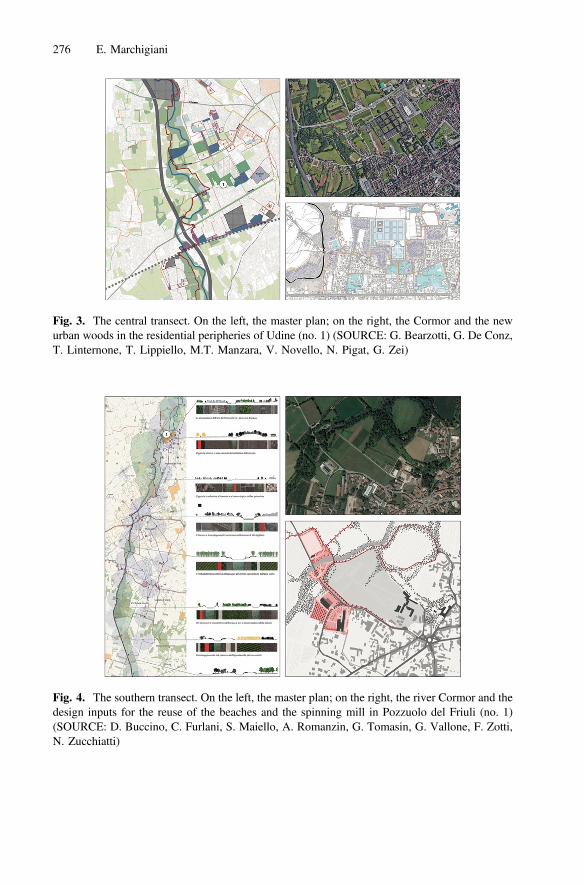
Fig. 3. The central transect. On the left, the master plan; on the right, the Cormor and the newurban woods in the residential peripheries of Udine (no. 1) (SOURCE: G. Bearzotti, G. De Conz,T. Linternone, T. Lippiello, M.T. Manzara, V. Novello, N. Pigat, G. Zei)
Fig. 4. The southern transect. On the left, the master plan; on the right, the river Cormor and thedesign inputs for the reuse of the beaches and the spinning mill in Pozzuolo del Friuli (no. 1)(SOURCE: D. Buccino, C. Furlani, S. Maiello, A. Romanzin, G. Tomasin, G. Vallone, F. Zotti,N. Zucchiatti)
276 E. Marchigiani
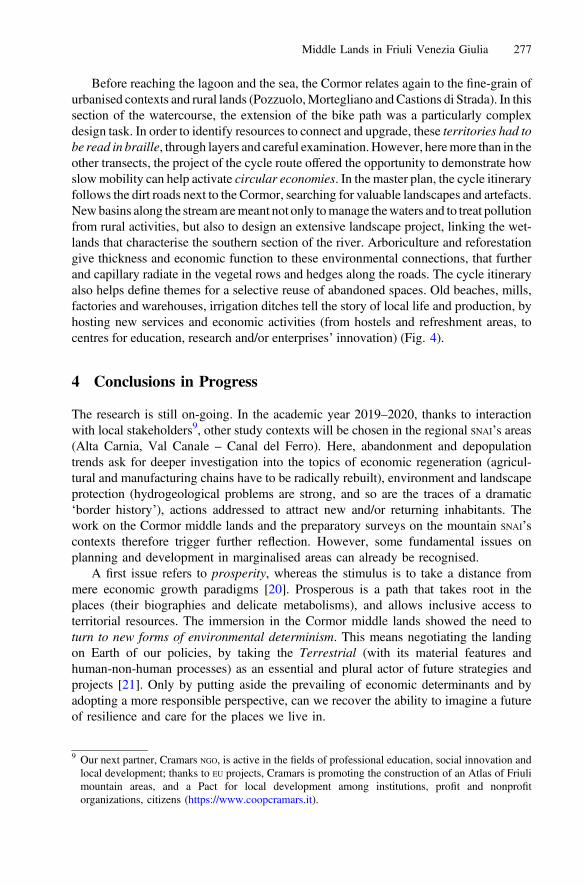
Before reaching the lagoon and the sea, the Cormor relates again to the fine-grain ofurbanised contexts and rural lands (Pozzuolo,Mortegliano andCastions di Strada). In thissection of the watercourse, the extension of the bike path was a particularly complexdesign task. In order to identify resources to connect and upgrade, these territories had tobe read in braille, through layers and careful examination.However, heremore than in theother transects, the project of the cycle route offered the opportunity to demonstrate howslowmobility can help activate circular economies. In the master plan, the cycle itineraryfollows the dirt roads next to the Cormor, searching for valuable landscapes and artefacts.Newbasins along the stream aremeant not only tomanage thewaters and to treat pollutionfrom rural activities, but also to design an extensive landscape project, linking the wet-lands that characterise the southern section of the river. Arboriculture and reforestationgive thickness and economic function to these environmental connections, that furtherand capillary radiate in the vegetal rows and hedges along the roads. The cycle itineraryalso helps define themes for a selective reuse of abandoned spaces. Old beaches, mills,factories and warehouses, irrigation ditches tell the story of local life and production, byhosting new services and economic activities (from hostels and refreshment areas, tocentres for education, research and/or enterprises’ innovation) (Fig. 4).
4 Conclusions in Progress
The research is still on-going. In the academic year 2019–2020, thanks to interactionwith local stakeholders9, other study contexts will be chosen in the regional SNAI’s areas(Alta Carnia, Val Canale – Canal del Ferro). Here, abandonment and depopulationtrends ask for deeper investigation into the topics of economic regeneration (agricul-tural and manufacturing chains have to be radically rebuilt), environment and landscapeprotection (hydrogeological problems are strong, and so are the traces of a dramatic‘border history’), actions addressed to attract new and/or returning inhabitants. Thework on the Cormor middle lands and the preparatory surveys on the mountain SNAI’scontexts therefore trigger further reflection. However, some fundamental issues onplanning and development in marginalised areas can already be recognised.
A first issue refers to prosperity, whereas the stimulus is to take a distance frommere economic growth paradigms [20]. Prosperous is a path that takes root in theplaces (their biographies and delicate metabolisms), and allows inclusive access toterritorial resources. The immersion in the Cormor middle lands showed the need toturn to new forms of environmental determinism. This means negotiating the landingon Earth of our policies, by taking the Terrestrial (with its material features andhuman-non-human processes) as an essential and plural actor of future strategies andprojects [21]. Only by putting aside the prevailing of economic determinants and byadopting a more responsible perspective, can we recover the ability to imagine a futureof resilience and care for the places we live in.
9 Our next partner, Cramars NGO, is active in the fields of professional education, social innovation andlocal development; thanks to EU projects, Cramars is promoting the construction of an Atlas of Friulimountain areas, and a Pact for local development among institutions, profit and nonprofitorganizations, citizens (https://www.coopcramars.it).
Middle Lands in Friuli Venezia Giulia 277
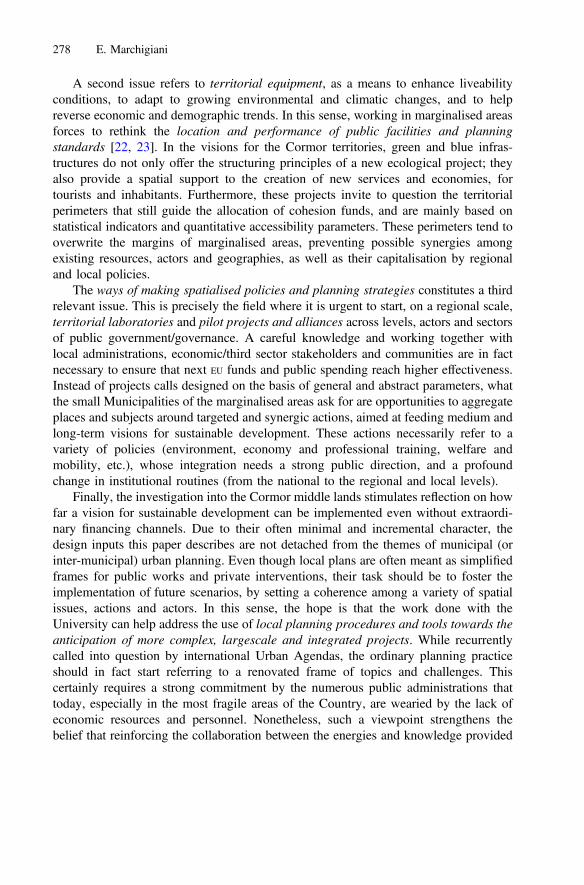
A second issue refers to territorial equipment, as a means to enhance liveabilityconditions, to adapt to growing environmental and climatic changes, and to helpreverse economic and demographic trends. In this sense, working in marginalised areasforces to rethink the location and performance of public facilities and planningstandards [22, 23]. In the visions for the Cormor territories, green and blue infras-tructures do not only offer the structuring principles of a new ecological project; theyalso provide a spatial support to the creation of new services and economies, fortourists and inhabitants. Furthermore, these projects invite to question the territorialperimeters that still guide the allocation of cohesion funds, and are mainly based onstatistical indicators and quantitative accessibility parameters. These perimeters tend tooverwrite the margins of marginalised areas, preventing possible synergies amongexisting resources, actors and geographies, as well as their capitalisation by regionaland local policies.
The ways of making spatialised policies and planning strategies constitutes a thirdrelevant issue. This is precisely the field where it is urgent to start, on a regional scale,territorial laboratories and pilot projects and alliances across levels, actors and sectorsof public government/governance. A careful knowledge and working together withlocal administrations, economic/third sector stakeholders and communities are in factnecessary to ensure that next EU funds and public spending reach higher effectiveness.Instead of projects calls designed on the basis of general and abstract parameters, whatthe small Municipalities of the marginalised areas ask for are opportunities to aggregateplaces and subjects around targeted and synergic actions, aimed at feeding medium andlong-term visions for sustainable development. These actions necessarily refer to avariety of policies (environment, economy and professional training, welfare andmobility, etc.), whose integration needs a strong public direction, and a profoundchange in institutional routines (from the national to the regional and local levels).
Finally, the investigation into the Cormor middle lands stimulates reflection on howfar a vision for sustainable development can be implemented even without extraordi-nary financing channels. Due to their often minimal and incremental character, thedesign inputs this paper describes are not detached from the themes of municipal (orinter-municipal) urban planning. Even though local plans are often meant as simplifiedframes for public works and private interventions, their task should be to foster theimplementation of future scenarios, by setting a coherence among a variety of spatialissues, actions and actors. In this sense, the hope is that the work done with theUniversity can help address the use of local planning procedures and tools towards theanticipation of more complex, largescale and integrated projects. While recurrentlycalled into question by international Urban Agendas, the ordinary planning practiceshould in fact start referring to a renovated frame of topics and challenges. Thiscertainly requires a strong commitment by the numerous public administrations thattoday, especially in the most fragile areas of the Country, are wearied by the lack ofeconomic resources and personnel. Nonetheless, such a viewpoint strengthens thebelief that reinforcing the collaboration between the energies and knowledge provided
278 E. Marchigiani
by the University on the one side, the questions and practices emerging from theterritories on the other, can do more than a lot in stimulating collective social andtechnical innovation.
References
1. Calafati, A.G. (ed.): Città tra sviluppo e declino. Donzelli, Roma (2014)2. Munarin, S., Velo, L. (eds.): Italia 1945-2045. Donzelli, Roma (2016)3. Ministero per la Coesione Territoriale: Strategia nazionale per le Aree interne (2014). http://
old2018.agenziacoesione.gov.it/it/arint. Accessed 02 Jan 20204. Lucatelli, S.: Strategia Nazionale Aree Interne: metodo e stato di attuazione (2019). https://
www.forumdisuguaglianzediversita.org/wp-content/uploads/2019/05/Lucatelli_28-maggio-2019.pdf. Accessed 02 Jan 2020
5. Forum Diseguaglianze e Diversità: Fifteen Proposals for Social Justice (2019). https://www.forumdisuguaglianzediversita.org/proposte-per-la-giustizia-sociale/fifteen-proposals-for-social-justice. Accessed 02 Jan 2020
6. De Rossi, A. (ed.): Riabitare l’Italia. Donzelli, Roma (2018)7. Carrosio, G.: I margini al centro. Donzelli, Roma (2019)8. Regione Autonoma Friuli Venezia Giulia: Regione in cifre (2018). http://www.regione.fvg.
it/rafvg/cms/RAFVG/GEN/statistica/FOGLIA49. Accessed 02 Jan 20209. Regione Autonoma Friuli Venezia Giulia: Strategia per le Aree Interne. https://www.regione.
fvg.it/rafvg/cms/RAFVG/economia-imprese/montagna/FOGLIA14. Accessed 02 Jan 202010. Marchigiani, E., Cigalotto, P.: Terre di mezzo. Percorsi di progetto lungo il torrente Cormor.
EUT Edizioni Università di Trieste, Trieste (2019). https://www.openstarts.units.it/handle/10077/27778. Accessed 02 Jan 2020
11. Rodríguez-Pose, A.: The revenge of the places that don’t matter (and what to do about it).Camb. J. Reg. Econ. Soc. 11(1), 189–209 (2018)
12. Lancerini, E. (ed.): Territori Lenti: contributi per una nuova geografia dei paesaggi abitatiitaliani. Territorio 34, 9–69 (2005)
13. Nocifora, E., de Salvo, P., Calzati, V. (eds.): Territori lenti e turismo di qualità. FrancoAngeli, Milano (2011)
14. Regione Autonoma Friuli Venezia Giulia: Contratti di fiume. https://www.regione.fvg.it/rafvg/cms/RAFVG/ambiente-territorio/pianificazione-gestione-territorio/FOGLIA213.Accessed 02 Jan 2020
15. Regione Autonoma Friuli Venezia Giulia: Piano Paesaggistico Regionale. http://www.regione.fvg.it/rafvg/cms/RAFVG/ambiente-territorio/pianificazione-gestione-territorio/FOGLIA21. Accessed 02 Jan 2020
16. Council of Europe: European Landscape Convention (2000)17. European Greenways Association: Lille Declaration (2000). http://www.aevv-egwa.org/
greenways. Accessed 02 Jan 202018. Velo, L.: La bicicletta un nuovo mezzo per la salvaguardia, il riciclo e la valorizzazione della
città diffusa veneta. In: AA.VV., Atti della XVIII Conferenza nazionale SIU, Italia ’45–’45,pp. 1663–1669. Planum Publisher, Milano (2015)
19. Pasqui, G.: Urbanistica oggi. Piccolo lessico critico. Donzelli, Roma (2017)20. Jackson, T.: Prosperity Without Growth, 2nd edn. Routledge, London and New York (2017)
Middle Lands in Friuli Venezia Giulia 279
https://www.forumdisuguaglianzediversita.org/wp-content/uploads/2019/05/Lucatelli_28-maggio-2019.pdf
https://www.forumdisuguaglianzediversita.org/wp-content/uploads/2019/05/Lucatelli_28-maggio-2019.pdf
21. Latour, B.: Où atterrir?. Comment s’orienter en politique. Éditions La Découverte, Paris(2017)
22. Gabellini, P.: Le mutazioni dell’urbanistica. Principi, tecniche, competenze. Carocci editore,Roma (2018)
23. Standard, Laboratorio (ed.): Diritti in città. Donzelli, Roma (in press)
Open Access This chapter is licensed under the terms of the Creative Commons Attribution 4.0International License (http://creativecommons.org/licenses/by/4.0/), which permits use, sharing,adaptation, distribution and reproduction in any medium or format, as long as you give appro-priate credit to the original author(s) and the source, provide a link to the Creative Commonslicense and indicate if changes were made.The images or other third party material in this chapter are included in the chapter's Creative
Commons license, unless indicated otherwise in a credit line to the material. If material is notincluded in the chapter's Creative Commons license and your intended use is not permitted bystatutory regulation or exceeds the permitted use, you will need to obtain permission directlyfrom the copyright holder.
280 E. Marchigiani

Author Index
AAburamadan, Rania, 211Accadia, Paolo, 143Anversa, Giada, 47Arnone, Massimo, 37Atta, Nazly, 220
BBaffour, Kwasi Gyau, 211Baiardi, Liala, 231Baldarelli, Maria-Gabriella, 101Benedek, József, 22Bevilacqua, Carmelina, 1, 47Brambilla, Andrea, 178Buffoli, Maddalena, 187
CCalabrò, Francesco, 197Calvieri, Veronica, 197Capolongo, Stefano, 166, 178, 187Cassalia, Giuseppina, 197Ciaramella, Andrea, 231Cozzolino, Maria, 143
DDe Mare, Gianluigi, 155De Vita, Gabriella Esposito, 90Dell’Ovo, Marta, 187Della Spina, Lucia, 251
Distaso, Alba, 124Dolores, Luigi, 155Doussineau, Mathieu, 1
GGalati Casmiro, Ruggiero, 251Gambino, Monica, 143Giorno, Claudia, 251Gola, Marco, 166
KKakderi, Christina, 68Kalogeresis, Athanasios, 80Komninos, Nicos, 68Kudo, Hiroko, 113
LLorè, Immacolata, 197
MMacchiaroli, Maria, 155Maino, Roberto, 178Makore, Busisiwe Chikomborero Ncube, 211Malvarosa, Loretta, 143Mangili, Silvia, 178Marchigiani, Elena, 268Marcianò, Claudio, 124Morisson, Arnault, 1Moustaka, Athena, 211
© The Author(s) 2020C. Bevilacqua et al. (Eds.): NMP 2020, SIST 177, pp. 281–282, 2020.https://doi.org/10.1007/978-3-030-52869-0
NNapolitano, Pasquale, 12Nicolò, Domenico, 101
OOppido, Stefania, 90Oppio, Alessandra, 187Ou, Yapeng, 47
PPaganin, Giancarlo, 239Panori, Anastasia, 68Pizzimenti, Pasquale, 47Provenzano, Vincenzo, 37Psaltoglou, Artemis, 68
RRagozino, Stefania, 90Rebecchi, Andrea, 187Romeo, Giuseppa, 124Rota, Francesco, 239
SSabatella, Evelina Carmen, 143Sabatella, Rosaria Felicita, 143Seminara, Maria Rosaria, 37Settimo, Gaetano, 166Szávics, Petra, 22
TTalamo, Cinzia, 220Talamo, Maria Cinzia Luisa, 239Trillo, Claudia, 211
UUdeaja, Chika, 211
VVermiglio, Carlo, 113Vittoria, Maria Patrizia, 12
ZZarone, Vincenzo, 113
282 Author Index