NMR as Evaluation Strategy for Cellular Uptake of Nanoparticles
Upload
khangminh22Category
view
2download
0
-
Uptake and distribution of ultrafinenanoparticles and microemulsions from thenasal mucosaBejgum, Bhanu Chanderhttps://iro.uiowa.edu/discovery/delivery/01IOWA_INST:ResearchRepository/12730576490002771?l#13730717490002771
Bejgum. (2019). Uptake and distribution of ultrafine nanoparticles and microemulsions from the nasalmucosa [University of Iowa]. https://doi.org/10.17077/etd.h0z4bv8z
Downloaded on 2022/07/07 18:32:26 -0500Copyright © 2017 Bhanu Chander BejgumFree to read and downloadhttps://iro.uiowa.edu
-

Uptake and Distribution of Ultrafine Nanoparticles and Microemulsions from the Nasal
Mucosa
by
Bhanu Chander Bejgum
A thesis submitted in partial fulfillment of the requirements for the Doctor of
Philosophy degree in Pharmacy (Pharmaceutics) in the Graduate College of
The University of Iowa
August 2017
Thesis Supervisor: Professor Maureen D. Donovan

Copyright by
Bhanu Chander Bejgum
2017
All Rights Reserved

Graduate College The University of Iowa
Iowa City, Iowa
CERTIFICATE OF APPROVAL
_______________________
PH.D. THESIS
_______________
This is to certify that the Ph.D. thesis of
Bhanu Chander Bejgum
has been approved by the Examining Committee for the thesis requirement for the Doctor of Philosophy degree in Pharmacy (Pharmaceutics) at the August 2017 graduation.
Thesis Committee: ___________________________________ Maureen D. Donovan, Thesis Supervisor
___________________________________ Douglas R. Flanagan
___________________________________ Aliasger K. Salem
___________________________________ Lewis L. Stevens
___________________________________ Laura B. Ponto

ii
To my family
iii
ACKNOWLEDGMENTS
I would like to express my heartfelt thanks to all the people who have been
involved either directly or indirectly, at various stages of my journey at The University of
Iowa (UIowa). I may not be able to list all the names here, but I sincerely appreciate all
the unforgettable help, support, advice, and encouragement I have received at UIowa.
First and foremost, I would like to express my deepest gratitude and appreciation
to my advisor, Professor Maureen Donovan for her continuous support, guidance, and
mentoring throughout my graduate career. Her expertise, enthusiasm and feedback
constantly assisted me in the right direction and led me towards the completion of my
dissertation research. Along with the academic and research skills, she has constantly
encouraged and supported me to take up the leadership roles and all other necessary skills
that are useful for my career. It has been an honor to work with her.
Secondly, I would like to acknowledge and appreciate my dissertation committee
members, Dr. Douglas Flanagan, Dr. Aliasger Salem, Dr. Lewis Stevens and Dr. Laura
Ponto for their valuable suggestions and guidance in my research, and for their time on
my dissertation. I would also like to thank Dr. Jennifer Fiegel for her help and input on
my comprehensive exam.
I would like to thank Central Microscopy Research Facility (CMRF) for assisting
me with the confocal and electron microscopy. I would also like to acknowledge the help
from staff of Small Animal Imaging Facility, especially Susan Walsh for her assistance in
fluorescence imaging and micro-CT studies. I am extremely grateful to Dr. Sarah Larsen
for allowing me to use inductively coupled plasma optical emission spectroscopy and Dr.
Aliasger Salem for allowing me to use Malvern Zetasizer. Furthermore, I am extremely

iv
thankful to all the faculty and staff members of the Division of Pharmaceutics and
Translational Therapeutics, College of Pharmacy, for their valuable support during my
graduate studies.
I thank Dr. Keith Guillory and pharmaceutics faculty for offering my financial
support during my graduate career in the form of Keith Guillory Fellowship, research and
teaching assistantships. I would like to thank graduate school of UIowa for awarding the
Summer Dissertation Fellowship.
I would like to express my gratitude to all former and current lab members in Dr.
Donovan’s lab including Nan Chen, Ana Ferreira, Wisam Al-bakri, Varsha Dhamankar,
Rakesh Awasthi, Maya George, Krupal Maity, Namita Sawant, and Shanti Chade. Also, I
thank all my friends at UIowa who made my graduate study a memorable one. They all
have been a valuable source of friendship and advice over the past years.
Last but not least, this work would not have been completed without the love and
support from my family and friends. I would like to thank my dad (Ramesh), mom
(Vanaja), brother (Bharath), and sister (Priyanka) for their unconditional love and
encouragement. Finally, I would like to thank my wife (Manasa) for her love and support.

v
ABSTRACT
Various colloidal delivery systems, including polymeric nanoparticles, metal
colloids, liposomes, and microemulsions have been reported to enhance the delivery of
therapeutic agents following intranasal administration. However, the mechanisms
involved in the uptake of these nanomaterials, especially those in the ultrafine size ranges
(diameter < 20 nm) through nasal mucosa and their subsequent biodistribution in the
body are not well characterized. The objectives of this study address the knowledge gap
regarding ultrafine nanoparticle transfer in the nasal mucosa by quantifying nanoparticle
uptake and biodistibution patterns in the presence and absence of known inhibitors of
endocytic processes.
The uptake of ~ 10 nm fluorescent quantum dots (QDs) was investigated by
measuring the concentration of QDs following exposure to bovine respiratory and
olfactory mucosal explants. An inductively coupled optical emission spectroscopy
method was developed to measure the amount of QDs within the tissues. The results
demonstrated that carboxylate-modified QDs (COOH-QDs) show ~2.5 fold greater
accumulation in the epithelial and submucosal regions of the olfactory tissues compared
to the respiratory tissues. Endocytic inhibitory studies showed that in respiratory tissues
clathrin-dependent, macropinocytosis and caveolae-dependent endocytosis process were
all involved in the uptake of COOH-QDs. Whereas in olfactory tissues, clathrin-
dependent endocytosis was the major endocytic pathway involved in uptake of COOH-
QDs. Additional energy-independent pathways appeared to also be active in the transfer

vi
of COOH-QDs into the olfactory mucosa. Interestingly, PEGylated quantum dots (PEG-
QDs) of similar size ~15 nm were not internalized into the bovine nasal tissues.
In vivo fluorescence imaging was used to study the biodistribution of quantum
dots following nasal instillation in mice. These studies showed that majority of COOH-
QDs remain in the nasal tissues for relatively long periods of time (up to 24 h) whereas
PEG-QDs showed no such accumulation. Biodistribution studies of gold nanoparticles
(~15 nm) in mice using micro-CT showed that gold nanoparticles were transferred to the
posterior turbinate region and a fraction of the administered dose distributed to regions in
close proximity to the olfactory bulb. Both NIR imaging and micro-CT imaging were
useful tools for visualization of in vivo nanoparticle distribution.
A diazepam-containing microemulsion (dispersed phase ~40 nm) was formulated
to investigate the uptake mechanisms utilized for fluid-phase colloidal dispersions in the
nasal mucosa. The resulting diazepam-containing microemulsion showed enhanced
transfer of the drug into the bovine nasal respiratory and olfactory tissues. It is unclear if
endocytosis of the fluid-phase nanodispersions played a role in drug absorption from the
microemulsions in a manner similar to the uptake of solid-phase nanoparticles, however,
since there was significant loss of the epithelial cell layer following exposure to the
microemulsion formulation which likely altered the barrier properties of the epithelium.
These studies have increased the fundamental understanding of ultrafine
nanoparticle uptake in the nasal tissues and the resulting nanoparticle biodistribution
patterns. While ultrafine nanoparticles may have limited application in the development
of efficient drug delivery systems, an understanding of the size-dependent and tissue-

vii
dependent processes responsible for the uptake of particulates into mucosal tissues will
contribute to the rational development of nanoparticulate drug delivery strategies
investigating the nasal and other routes of administration.

viii
PUBLIC ABSTRACT
A variety of ultrafine nanomaterials including metals, engineered nanoparticles,
and viruses have been reported to be transported from the nasal tissues into either the
brain or the blood. The mechanisms involved in the uptake of these nanomaterials,
especially those in the ultrafine size range (diameter < 20 nm), through nasal mucosa and
their subsequent biodistribution in the body are not well characterized. The objective of
this study is to investigate the mechanisms involved in the uptake of quantum dots (a
model for ultrafine nanoparticles) into the nasal tissues and to characterize their
biodistribution patterns using mice as an animal model
The uptake of these ultrafine nanoparticles was observed to depend on their
surface characteristics; negatively charged, carboxylate quantum dots were shown to be
taken up by the nasal tissues to a greater extent (2-5 % in 120 min) than with a near-
neutral surface charge PEGylated QDs which showed negligible uptake into the tissues.
The ultrafine nanoparticles were internalized into the nasal tissues using multiple
pathways including micropinocytosis, clathrin-mediated and caveolae-mediated
endocytosis. Additional energy-independent pathways were involved in the uptake into
olfactory tissues. Following intranasal administration in mice, ultrafine gold
nanoparticles and carboxylate quantum dots were observed to migrate from the anterior
region of the nasal cavity to posterior regions, including near the olfactory regions, due to
mucociliary clearance and some particles were appeared to be retained in the posterior
regions for periods of time at least up to 24 h.

ix
While ultrafine nanoparticles may have limited application in the development of
efficient drug delivery systems, due to limitations of low drug loading efficiency and
potential toxic effects, these results contribute to the rational development of
nanoparticulate drug delivery strategies investigating the nasal and other routes of
administration.

x
TABLE OF CONTENTS
LIST OF TABLES ........................................................................................................... xiii
LIST OF FIGURES ...........................................................................................................xv
CHAPTER I .........................................................................................................................1
INTRODUCTION ...............................................................................................................1 Nasal Anatomy and Physiology........................................................................3 The Respiratory Region ....................................................................................4 The Olfactory Region .......................................................................................7 Intranasal Delivery of Drugs and Vaccines ......................................................8 Fate of Inhaled Nanomaterials Deposited on the Nasal Mucosa ......................9 Nanomaterial Internalization Pathways Into and Across the Nasal Tissues ............................................................................................................10
Mechanisms of Intercellular Transfer of Nanomaterial ..........................11 Mechanisms of Intracellular Transfer of Nanomaterial ..........................12
In Vitro and In Vivo Intranasal Uptake Models .............................................16 Solid-phase Nanodispersions in Intranasal Uptake ........................................16
Polymeric Nanoparticles .........................................................................17 Nonbiodegradable Polymeric Nanoparticles ...........................................17 Biodegradable Polymeric Nanoparticles .................................................20 Metallic Nanoparticles .............................................................................23 Solid Lipid Nanoparticles ........................................................................28
Liquid-phase Nanopdispersions in Intranasal Drug Delivery ........................29 Liposomes ................................................................................................31 Microemulsions .......................................................................................33
Summary .........................................................................................................37
CHAPTER II ......................................................................................................................39
OBJECTIVES ....................................................................................................................39
CHAPTER III ....................................................................................................................41
UPTAKE AND TRANSPORT PATHWAYS FOR ULTRAFINE NANOPARTICLES (QUANTUM DOTS) IN THE NASAL MUCOSA .....41 Introduction .....................................................................................................41 Materials and Instrumentation ........................................................................44 Experimental Procedures ................................................................................45
Preparation of Quantum Dot Dispersions ................................................45 Determination of Particle Size and Zeta Potential ..................................45 Preparation of Bovine Respiratory and Olfactory Mucosal Tissues .......45 Quantum Dot Uptake Studies ..................................................................46 Quantification of Quantum Dots .............................................................47 Extraction of Cadmium from QDs ..........................................................50 Extraction of Cadmium from QDs in Bovine Respiratory and Olfactory Tissues .....................................................................................51 Visualization of QDs in Tissues Using Confocal Microscopy ................52

xi
Visualization of QDs in Tissues Using Transmission Electron Microscopy (TEM) ..................................................................................53 Investigation of the Endocytic Pathways Involved in the Uptake of Quantum Dots ..........................................................................................54 Statistical Analysis ..................................................................................55
Results.............................................................................................................55 Particle Size Analysis ..............................................................................55 Quantification of Quantum Dots .............................................................56 QD Translocation into Nasal Respiratory and Olfactory Mucosa ...........60 Visualization of QDs in Tissues Using Confocal and Electron Microscopy ..............................................................................................65 Transmission Electron Microscopy (TEM) .............................................68 Identification of Endocytic Pathways ......................................................71
Discussion .......................................................................................................74 Conclusion ......................................................................................................79
CHAPTER IV ....................................................................................................................80
DISTRIBUTION OF QUANTUM DOTS AFTER INTRANASAL ADMINISTRATION IN MICE IN VIVO LIVE ANIMAL IMAGING .......80 Introduction .....................................................................................................80
In Vivo Fluorescence Imaging ................................................................82 Quantum Dots in Small Animal Fluorescence Imaging ..........................83 Micro-Computed Tomography (Micro-CT) Small Animal Imaging ......84
Materials and Instrumentation ........................................................................85 Animals ....................................................................................................85 Administration of Quantum Dots ............................................................86 In Vivo Fluorescence Imaging ................................................................87 Image Analysis ........................................................................................89 Distribution of Gold Nanoparticles: Micro-CT Imaging .........................89
Results and Discussion ...................................................................................91 IRDye® Distribution Following Intranasal Administration .....................91 Distribution of COOH-QDs Following Intranasal Administration .........94 Effect of Particle Surface Modifications on Intranasal Uptake .............104 Mechanistic Evaluation of COOH-QD Uptake from Nasal Tissues Using Whole Animal Imaging ...............................................................110 Translocation of Gold Nanoparticles Measured Using Micro-CT ........115
Conclusions...................................................................................................121
CHAPTER V ...................................................................................................................123
UPTAKE OF MICROEMULSIONS FROM NASAL TISSUES ...................................123 Introduction ...................................................................................................123 Materials and Methods .................................................................................126
Solubility Studies ...................................................................................126 Microemulsion Formulation ..................................................................127 Characterization of Microemulsions .....................................................130 Preparation of Bovine Nasal Tissues .....................................................130 Uptake Studies of Diazepam-containing Microemulsions ....................130 Histological Evaluation of Bovine Nasal Tissues Exposed to Microemulsions .....................................................................................133

xii
Transport Inhibitor Studies ....................................................................134 HPLC Analysis ......................................................................................134 Statistical Analysis ................................................................................135
Results and Discussion .................................................................................136 Solubility Studies ...................................................................................136 Characterization of Microemulsions .....................................................136 Microemulsion Uptake Studies .............................................................139 Histological Evaluation .........................................................................143 Mechanism of DZME Uptake into Nasal Tissues .................................144
Conclusions...................................................................................................147
CHAPTER VI ..................................................................................................................148
CONCLUSIONS..............................................................................................................148
REFERENCES ................................................................................................................151
APPENDIX-A..................................................................................................................169 Technical Specifications and Optical Spectrum of COOH-QDs ..................169
APPENDIX-B ..................................................................................................................170 Particle Size Distribution of 0.05 mg/mL COOH-QD and PEG-QD Dispersion in KRB ........................................................................................170
APPENDIX-C ..................................................................................................................172 Data Showing Efficiency of ICP-OES Measurements in Presence of Blank Tissues ................................................................................................172
APPENDIX-D..................................................................................................................174 Sample Calculation of Mass of QD from Measured Cd Concentration .......174
APPENDIX-E ..................................................................................................................175 TEER Measurements Representing Respiratory and Olfactory Tissue Integrity .........................................................................................................175
APPENDIX-F ..................................................................................................................176 Sequential Fluorescence Images from Individual Mice after Intranasal Administration of COOH-QDs .....................................................................176 Sequential Fluorescence Images from Individual Mice after Intravenous Administration of COOH-QDs .....................................................................178 Sequential Fluorescence Images of Individual Mice after Intranasal Administration of PEG-QDs .........................................................................180 Sequential Fluorescence Images of Individual Mice after Intranasal Administration of COOH-QDs in the Presence of an Endocytic Inhibitor Cocktail ..........................................................................................182
xiii
LIST OF TABLES
Table 1-1 Summary of studies showing intranasal uptake of polystyrene nanoparticles. ............................................................................................................18
Table 1-2 Summary of selected studies showing potential use of biodegradable PLGA and PLA particles in delivering a variety of drugs and vaccines via the intranasal route. .........................................................................................................22
Table 1-3 Summary of studies showing translocation of metallic nanoparticles following intranasal administration. .........................................................................25
Table 1-4 Summary of selected studies showing toxicity effects of metallic nanoparticles following intranasal instillation. .........................................................27
Table 1-5 Summary of studies investigating intranasal uptake of drugs/antigens using solid lipid nanoparticle systems. .....................................................................30
Table 1-6 Summary of studies showing intranasal uptake of drugs/vaccines using liposomal vesicular systems......................................................................................32
Table 1-7 Summary of studies showing intranasal uptake of drugs/vaccines using microemulsion systems. ............................................................................................36
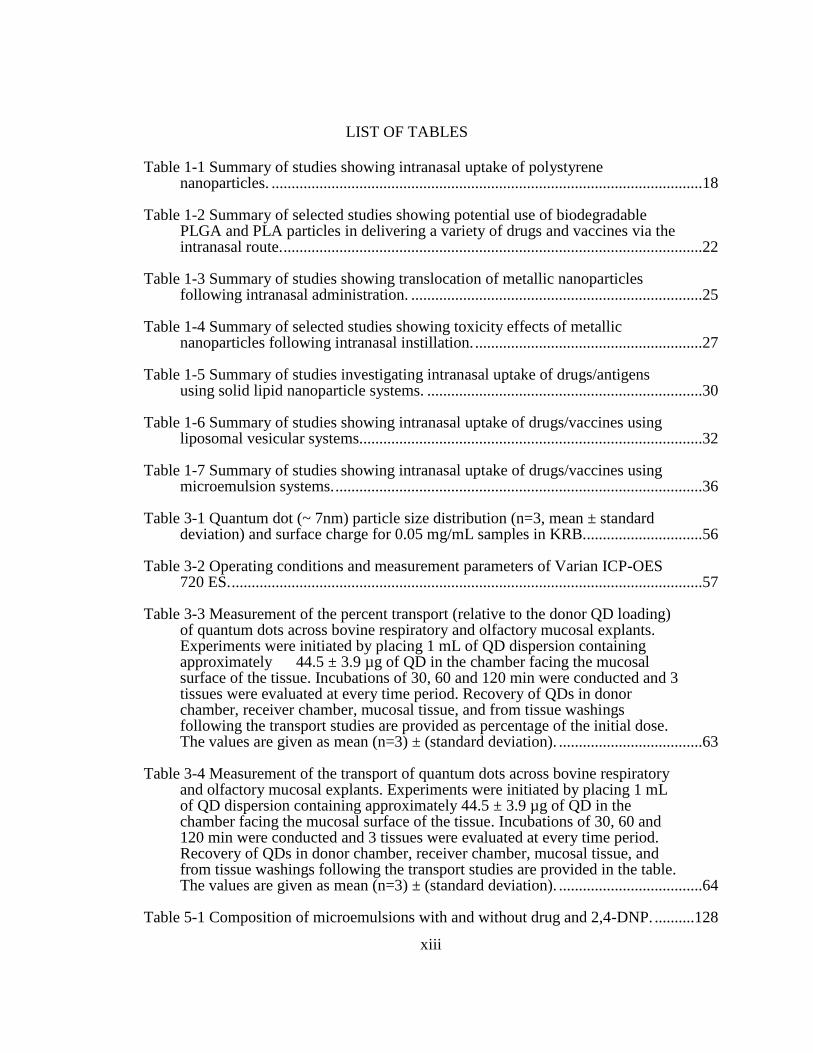
Table 3-1 Quantum dot (~ 7nm) particle size distribution (n=3, mean ± standard deviation) and surface charge for 0.05 mg/mL samples in KRB..............................56
Table 3-2 Operating conditions and measurement parameters of Varian ICP-OES 720 ES. ......................................................................................................................57
Table 3-3 Measurement of the percent transport (relative to the donor QD loading) of quantum dots across bovine respiratory and olfactory mucosal explants. Experiments were initiated by placing 1 mL of QD dispersion containing approximately 44.5 ± 3.9 µg of QD in the chamber facing the mucosal surface of the tissue. Incubations of 30, 60 and 120 min were conducted and 3 tissues were evaluated at every time period. Recovery of QDs in donor chamber, receiver chamber, mucosal tissue, and from tissue washings following the transport studies are provided as percentage of the initial dose. The values are given as mean (n=3) ± (standard deviation). ....................................63
Table 3-4 Measurement of the transport of quantum dots across bovine respiratory and olfactory mucosal explants. Experiments were initiated by placing 1 mL of QD dispersion containing approximately 44.5 ± 3.9 µg of QD in the chamber facing the mucosal surface of the tissue. Incubations of 30, 60 and 120 min were conducted and 3 tissues were evaluated at every time period. Recovery of QDs in donor chamber, receiver chamber, mucosal tissue, and from tissue washings following the transport studies are provided in the table. The values are given as mean (n=3) ± (standard deviation). ....................................64
Table 5-1 Composition of microemulsions with and without drug and 2,4-DNP. ..........128

xiv
Table 5-2 Size and zeta potential of microemulsions with and without drug and 2,4-DNP (mean ± std dev). ...........................................................................................138
Table A-1 Specifications of COOH-QDs provided by NN-Labs, LLC (Fayetteville, AR). Catalog # CZW-R. .........................................................................................169
Table C-1 Correlation between theoretical mass of Cd as added QDs to blank olfactory tissues and the Cd concentration measured from the digested samples of those tissues. QD dispersion (0.2 mL) spiked into known olfactory tissue weight and digested in 1 mL of nitric acid followed by dilution to 10 mL with DI water. ............................................................................172
Table C-2 Correlation between theoretical mass of Cd as added QDs to blank respiratory tissues and the Cd concentration measured from the digested samples of those tissues. QD dispersion (0.2 mL) spiked into known respiratory tissue weight and digested in 1 mL of nitric acid followed by dilution to 10 mL with DI water. ............................................................................173
Table E-1 TEER values across respiratory and olfactory tissues exposed to COOH-QD dispersion measured at the beginning and end of the transport study for each time point. Values represent maintenance of tissue integrity before and after the transport. ...................................................................................................175

xv
LIST OF FIGURES
Figure 1.1 Schematic representation of nasal anatomy showing the location of turbinate regions, olfactory mucosa and olfactory bulb. Reproduced with permission23. ...............................................................................................................4
Figure 1.2 Schematic representation of the composition of the respiratory epithelium and submucosal region27. The epithelial barrier of respiratory mucosa typically consists of ciliated pseudostratified columnar epithelial cells, goblet cells and basal cells. The underlying lamina propria consists of connective tissue (CT), fibroblasts, blood vessels (BV), and serous glands. .............6
Figure 1.3 Schematic representations of the location of the olfactory region, the olfactory epithelium and olfactory neuronal pathways from nose to olfactory bulb28. Reproduced with permission. ..........................................................................7
Figure 1.4 Possible pathways of nanomaterial transfer from nose to brain and systemic circulation. Inhaled nanoparticles have a chance to be taken up by either respiratory or olfactory mucosa and subsequently enter the brain and/or the systemic circulation. Reproduced with permission38. .........................................10
Figure 1.5 Schematic representations of internalization pathways of nanomaterial (left). Schematic representations macropinocytosis, clathrin-mediated endocytosis and caveolae-mediated endocytosis pathways (right). Reproduced with permission39. .....................................................................................................11
Figure 3.1 Schematic showing the working principle of ICP-OES135. Metal-containing samples are nebulized using a peristaltic pump and an auxiliary argon flow directly into the plasma. The metal-containing droplets are atomized, ionized and finally exited to higher energy levels. The characteristic emissions from metal ions are separated using a high precision prism and a photomultiplier tube detector captures the intensity of each emission. ...................................................................................................................49
Figure 3.2 Sample calibration curve for elemental Cd using ICP-OES (n=3). Calibration equation was Intensity (a.u) = 3.4984 * Cd Conc. (ng/mL), r2 = 0.9999. ......................................................................................................................57
Figure 3.3 Correlation between theoretical QD concentrations versus ICP-OES measured QD concentration. A correlation equation of Intensity (a.u) = 0.9697 * Cd. Conc (ng/mL) was observed (r2 =0.9992). ..........................................58
Figure 3.4 Correlation of the theoretical mass of Cd as added QD dispersion to blank respiratory tissues and the Cd concentration measured from digested samples of these tissues. A good correlation between added mass of QDs and measured mass of QDs was observed (y=0.997x, r2=0.999). ...................................59
Figure 3.5 Correlation of the theoretical mass of Cd as added QDs to blank olfactory tissues and the Cd concentration measured from digested samples of

xvi
these tissues. A good correlation between added mass of QDs and measured mass of QDs was observed (y=996x, r2=0.999). ......................................................60
Figure 3.6 Comparison of QD uptake into full thickness olfactory and respiratory tissues after a 120 min incubation period. A) Column graph showing the mean and standard deviation of the groups Uncorrected Fischer’s LSD test showed significant difference (p<0.05) in uptake of QD between respiratory and olfactory tissues after 120 min incubation B) Box Whisker plots of the same data showing the median and range of the data. (n=3). ...................................61
Figure 3.7 Confocal laser scanning microscopic images of respiratory tissues showing the transport of QDs. Column I shows the nuclear stain (DAPI) channel. The epithelial region is indicated by a solid line and the submucosal region by a double arrowed line. Column II shows the QD channel, and column III shows merged images from both channels. Each row of images is labeled with the exposure time of the respiratory tissues to QDs or to a control samples with no QD exposure. White arrows highlight the QD localization in the merged image of the respiratory tissue. (Scale bar = 20 µm). ...........................................................................................................................66
Figure 3.8 Confocal laser scanning microscopic images of olfactory tissues showing the transport of QDs. Column I shows the nuclear stain (DAPI) channel. The epithelial region is indicated by a solid line and the submucosal region by a double arrowed line. Column II shows the QD channel, and column III shows merged images from both channels. Each row of images is labeled with the exposure time of the olfactory tissues to QDs or to a control samples with no QD exposure. White arrows highlight the QD localization in the merged image of the olfactory tissue. (Scale bar = 20 µm). ...............................67
Figure 3.9 Transmission electron micrographs of bovine respiratory epithelial cells exposed to COOH-QDs for 120 min. Distinct nucleus (N), mitochondria (M), cellular junction (CJ), golgi apparatus (G) can be observed. a: magnification x7000. b: Enlarged mucosal region (orange circle) showing dispersed, electron-dense particles in cytoplasm (green circles) and in vesicle structures (red circles) of the epithelial region (magnification x21000). ..................................69
Figure 3.10 Transmission electron micrographs of bovine olfactory epithelial cells exposed toCOOH-QDs for 120 min. Distinct nucleus (N), mitochondria (M), cellular junction (CJ) can be observed. a: Image with magnification of x7000. b: Enlarged mucosal region (orange box) showing dispersed, electron-dense particles in cytoplasm (green circles) and vesicular structures (red circles) in the epithelial region(magnification: x24000)...........................................70
Figure 3.11 Uptake of QDs in the nasal respiratory tissue in the presence of inhibitors: 2,4-dinitrophenol (DNP), amiloride, methyl-β-cyclodextrin (MBC) and chlorpromazine (CPZ). A) Bar graph showing mean and standard deviation, * indicates significant difference between the control and inhibited uptake compared used Student’s t-test, n=3 or 6, p<0.05. B) Box Whisker plot showing the median and range of the same data. ................................72

xvii
Figure 3.12 Uptake of QDs in the nasal olfactory tissue in the presence of inhibitors: 2,4-dinitrophenol (DNP), amiloride, methyl-β-cyclodextrin (MBC) and chlorpromazine (CPZ).A) Bar graph showing mean and standard deviation, * indicates significant difference between the control and inhibited uptake compared used Student’s t-test, n=3 or 6, p<0.05. B) Box Whisker plot showing the median and range of the same data. ................................73
Figure 4.1 Anatomical planes of mouse placed in prone position, showing transverse, sagittal and frontal planes169. Reproduced with permission. ..................91
Figure 4.2 Structure of IRDye 800CW, chemical formulation: C46H50N2Na4O15S4, molecular weight of 1091.1 g/mol173. .......................................................................92
Figure 4.3 Co-registered fluorescence and x-ray whole animal images of a representative mouse showing biodistribution of IRDye after intranasal administration. Green color represents the pseudo-colored NIR emission signal from the IRDye. Presence of IRDye in the nasal region can be observed in both dorsal and side views up to 4 h and only in the dorsal view at 24 h. In the 2 h side view image, a strong presence of dye in the throat region can be observed. The majority of the dye seemed to reside in the abdominal region and was likely associated with the digestive and urinary systems. .....................................................................................................................93
Figure 4.4 Composite fluorescence images co-registered with x-ray images of mice showing the distribution of COOH-QDs after intranasal (top row) and intravenous (middle row) administration. The control group received normal saline is shown in the bottom row. The red color represents the fluorescence signal from COOH-QDs. A gradual decrease of fluorescence intensity in the nasal region (yellow circle in top row image) from 5 min to 24 h can be observed after intranasal dosing, whereas intravenous dosing resulted in high fluorescence intensities in the abdominal region within 2 h. Gradual decreasing intensities can be seen up to 24 h. Sequential images for an individual mouse are provided in Appendix-F. ........................................................95
Figure 4.5 Mean fluorescence intensity from nasal regions (55 mm2 ROI; circled region shown in insert) of animals administered COOH-QDs via intranasal (i.n.), or intravenous (i.v.) routes. * represents statistical significance between i.n. and i.v. fluorescence intensities when tested with Student’s t-test at p<0.05 (n=3). ............................................................................................................96
Figure 4.6 Fluorescence images co-registered with x-ray images of mice 24 h after COOH-QD administration. Upper panel shows images of anesthetized, live mice with intact nasal cavity and lower panel shows images of euthanized mice with exposed nasal cavity. Opening of the nasal cavity enabled visualization of the strong fluorescence signal from COOH-QD accumulation in the deeper nasal tissues following intranasal administration that was not visible in the mice with intact nasal cavities. Intravenous administration did not show nasal tissue accumulation, even in the exposed nasal cavity images. Images of all mice after opening nasal cavity are provided in Appendix-F. ............98

xviii
Figure 4.7 Mean fluorescence intensities of COOH-QDs from the nasal regions of mice with intact nasal cavities and exposed nasal cavities after 5 min and 24 h following intranasal (30 ug/animal) and intravenous (60 ug/animal) administration. * represents statistical significance between i.n. and i.v. fluorescence intensities when tested using Student’s t-test at p < 0.05 (n=3). .........99
Figure 4.8 Fluorescence images co-registered with X-ray images from various harvested organs of mice 24 h following intranasal administration (A) and intravenous administration (B). ..............................................................................100
Figure 4.9 Mean fluorescence intensities from various organs of mice 24 h after intranasal (30 ug/animal) and intravenous administration (60 ug/animal) of QDs.* represents statistical significance between i.n. and i.v. fluorescence intensities when tested using Student’s t-test at p < 0.05 (n=3). ............................101
Figure 4.10 Composite fluorescence images of mice co-registered with corresponding x-ray images. These images compare the distribution of (upper panel) PEG-QDs (30 μg/animal in 5 μL volume) and (lower panel) COOH-QDs(30 μg/animal in 5 μL volume) at various time points after intranasal administration. Sequential images for all individual mice are provided in Appendix-F. ............................................................................................................105
Figure 4.11 Comparison of mean fluorescence intensities from the intact nasal region of mice (from a 55 mm2 area ROI as shown in Figure 4.4) following intranasal administration of COOH-QDs and PEG-QDs at same dose of 30 μg/animal in 5 μL volume. (n=3). ...........................................................................106
Figure 4.12 Fluorescence images of mice co-registered with corresponding x-ray images 24 h after intranasal administration of PEG-QDS and COOH-QDs. The upper panels are images of mice with intact nasal cavities. Lower panels are images of mice following the opening of the nasal cavity along the septum prior to imaging. Images of all mice after opening nasal cavity are provided in Appendix-F. ............................................................................................................107
Figure 4.13 Mean fluorescence intensities from the deeper nasal tissues of mice with intact and exposed nasal cavities 24 h after intranasal administration of PEG-QDs and COOH-QDs, at same dose of 30 μg/animal * represents statistical significance between COOH-QDs and PEG-QDs fluorescence intensities tested using Student’s t-test at p<0.05 (n=3). ........................................108
Figure 4.14 Whole animal fluorescence images of mice co-registered with corresponding x-ray images comparing the distribution of COOH-QDs (top row) in the presence of a cocktail of endocytic inhibitors (bottom row) at various time points after intranasal administration. The red fluorescence in the nose region represents signal from QDs. Inclusion of inhibitors resulted in no difference in QD fluorescence signal when compared to QDs without inhibitors. Sequential images for all individual mice are provided in Appendix-F. ............................................................................................................111
Figure 4.15 Mean fluorescence intensities from nasal regions (from a 55 mm2 area ROI as shown in Figure 4.4) of live animals in presence and absence of

xix
inhibitor cocktail. No difference in fluorescence signal from QDs in presence of inhibitor cocktail is observed. (n=3). ..................................................................112
Figure 4.16 Images of mice showing the fluorescence from the deeper nasal regions 24 h after intranasal administration of COOH-QDs in the presence and absence of an endocytic inhibitor cocktail. The upper panels are images of mice with intact nasal cavities. Lower panels are images of mice following the opening of the nasal cavity along the septum prior to imaging. Images of all mice after opening nasal cavity are provided in Appendix-F. ...........................113
Figure 4.17 Mean fluorescence intensities from the nasal tissues of mice with intact and exposed nasal cavities 24 h after intranasal administration of COOH-QDs in presence and absence of an endocytic inhibitor cocktail (n=3). .........................114
Figure 4.18 In vivo micro-CT imaging of a mouse head region 24 h after intranasal (A) and intravenous (B) administration of 15 nm gold nanoparticles. Axial (left column), dorsal (middle column) and lateral views (right column) are depicted. Yellow colored arrows show the accumulation of gold particles in the nasal conche following intranasal administration, whereas no such accumulation was observed in the same regions after intravenous administration. ........................................................................................................116
Figure 4.19 In vivo micro-CT 3D lateral view of the head regions of a mouse showing the accumulation of AuNPs in anterior and posterior regions of the nasal cavity (yellow arrows) 24 h after intranasal administration. .........................117
Figure 4.20 In vivo micro-CT images of mouse in axial (left), dorsal (middle) and lateral (right) views 24 h after intravenous administration of AuNPs. High contrast CT signal in heart (yellow arrow), liver (purple arrow) and spleen (blue arrow) can be observed. .................................................................................118
Figure 4.21 In vivo micro-CT images of the head region of a mouse 6 h (A) and 24 (B) after multiple dosing of AuNPs via the intranasal route. Accumulation of AuNPs (colored in red) in the nasal mucosa can be observed. ...............................120
Figure 5.1 Chemical structure of diazepam203. ................................................................124
Figure 5.2 Schematic showing the preparation of diazepam-containing microemulsion. Microemulsions were prepared by adding the required amount of a sorbitol solution of known concentration to a mixture containing IPM, Tween 80, and diazepam in a stirred beaker at 55 °C followed by cooling to room temperature. ..................................................................................129
Figure 5.3 Sample calibration curve for analyzing diazepam using HPLC method (n=3). Good linearity of the method was observed from 1 μg/mL to 1000 μg/mL with AUC=35.913* Concentration (μg/mL) and r2=0.9999. Insert is presented for better visualization of the linearity in low concentrations (0 to 100 μg/mL). ............................................................................................................135

xx
Figure 5.4 Solubility of diazepam in various components used in microemulsions. Column bars are labeled with the mean solubility value (mg/mL). Results are expressed as mean ± standard deviation of three replicates. ..................................136
Figure 5.5 Appearance of diazepam-containing microemulsion. ....................................138
Figure 5.6 Comparison of the cumulative percent of diazepam (relative to the donor chamber initial concentration) appearing in the receiver chamber as a function of time across bovine respiratory and olfactory tissue explants following exposure to DZS (diazepam IPM solution, 4 mg/mL) and DZME (diazepam-containing microemulsion, 4 mg/mL). A) Data shown are mean ± standard deviation (n=6 per tissue type). B) Mean percent diazepam transferred to receiver results shown without error bars. ..............................................................140
Figure 5.7 Comparison of diazepam percent remaining in the donor chamber after 120 min exposure of diazepam IPM solution (DZS) and diazepam-containing microemulsion (DZME) to the respiratory, olfactory and artificial membrane. Dashed line represents 100%. Data shown are mean ± standard deviation (n=6 per tissue/membrane type). ...........................................................................141
Figure 5.8 Comparison of diazepam percent (relative to the initial diazepam concentration in the donor chamber) accumulated in the respiratory and olfactory tissues after 120 min exposure to diazepam-IPM solution (DZS) and diazepam-containing microemulsion (DZME). Data shown are mean ± standard deviation (n=6 for each tissue type). * Indicates a statistically significant difference when compared using an unpaired, two-tailed Student’s t-test with p<0.05. ...................................................................................................141
Figure 5.9 Comparison of diazepam accumulation in the thickness normalized olfactory and respiratory tissue explants after 120 min exposure to a diazepam IPM solution (DZS) and a diazepam-containing microemulsion (DZME). Data shown are mean ± standard deviation (n=6 for each tissue type). .................143
Figure 5.10 Brightfield microscopic images of control (left) and DZME exposed (right) respiratory tissue explant. Solid line arrow shows intact epithelium in control tissue and the dashed-line arrow shows the damaged epithelium in DZME-exposed respiratory tissue. .........................................................................144
Figure 5.11 Brightfield microscopic images of control (left) and DZME exposed (right) olfactory tissue explant. Solid line arrow shows intact epithelium in control tissue and the dashed-line arrow shows the damaged epithelium in DZME-exposed olfactory tissue. ............................................................................144
Figure 5.12 Comparison of diazepam accumulation in the respiratory and olfactory tissues after 120 min exposure to DZME in the presence and absence of the metabolic inhibitor 2,4 –dinitrophenol (2,4-DNP). Data shown are mean ± standard deviation (n=6 for each tissue type). * Indicates a statistically significant difference when compared using an unpaired two-tailed Student’s t-test with p<0.1. .....................................................................................................146

xxi
Figure A.1 Typical UV-Vis absorption (a) and emission (b) spectrum of COOH-QDs purchased from NN-Labs, Inc (Fayetteville, AR), Lot # LW074414A21104. ................................................................................................169
Figure B.1 Representative particle size distribution of 0.05 mg/mL COOH-QDs (Lot# LW074414A21104) in KRB using a volume-weighted distribution analysis (Nicomp Particle Sizer, Model 380 ZLS, Santa Barbara, CA). ................170
Figure B.2 Representative particle size distribution of 0.05 mg/mL PEG-QDs (Lot# LW134414A23108) in KRB using a volume-weighted distribution analysis (Nicomp Particle Sizer, Model 380 ZLS, Santa Barbara, CA). ..............................171
Figure F.1 Fluorescence images co-registered with x-ray images from individual mice showing the distribution of COOH-QDs after intranasal administration. The red color represents the fluorescence signal from COOH-QDs. .....................176
Figure F.2 Fluorescence images co-registered with x-ray images of euthanized individual mice with exposed nasal cavities observed 24 h after intranasal administration of COOH-QDs. The red color represents the fluorescence signal from COOH-QDs. ........................................................................................177
Figure F.3 Fluorescence images co-registered with x-ray images from individual mice showing the distribution of COOH-QDs after intravenous (retro-orbital injection) administration. The red color represents the fluorescence signal from COOH-QDs. Mouse 2 died after the 2 h time point. .....................................178
Figure F.4 Fluorescence images co-registered with x-ray images of euthanized individual mice with exposed nasal cavities observed 24 h after intravenous administration of COOH-QDs. ...............................................................................179
Figure F.5 Fluorescence images co-registered with x-ray images from individual mice showing the distribution of PEG-QDs after intranasal administration. The red color represents the fluorescence signal from PEG-QDs. .........................180
Figure F.6 Fluorescence images co-registered with x-ray images of euthanized individual mice with exposed nasal cavities observed 24 h after intranasal administration of PEG-QDs. ...................................................................................181
Figure F.7 Fluorescence images co-registered with x-ray images of individual mice showing the distribution of COOH-QDs in the presence of an endocytic inhibitor cocktail following intranasal administration. The red color represents the fluorescence signal from COOH-QDs. ............................................182
Figure F.8 Fluorescence images co-registered with x-ray images of euthanized individual mice with exposed nasal cavities observed 24 h after intranasal administration of COOH-QDs in the presence of an endocytic cocktail inhibitor. The red color represents the fluorescence signal from COOH-QDs. .....183

1
CHAPTER I
INTRODUCTION
Nanotechnology is the science and engineering of extremely small colloidal
materials less than 100 nm in size. Materials at such small sizes possess a wide variety of
physical and chemical properties that are different than those same materials at larger
sizes. Due to these unique properties, the applications of nanotechnology have expanded
rapidly into several fields including biomedical and pharmaceutical applications.
Nanotechnology in medicine shows immense potential for improving the lives of humans
by improving disease diagnosis, delivery of therapeutic agents and tissue engineering.
The term ‘colloidal dispersion’ is used to describe a homogenous system in which
particles of size between 1 nm to 1000 nm of any nature (e.g. solid, liquid or gas) are
dispersed in a continuous phase of a different composition (or state)1. Systems that
contain solid colloidal material dispersed in liquid media are termed “solid-phase
nanodispersions” and semi-solid/liquid colloidal materials dispersed in liquid media are
“liquid-phase nanodispersions”. Advancements in nanotechnology have enabled
researchers to explore several varieties of colloidal dispersions to deliver therapeutic
agents to target selected regions in the body. For example, liquid-phase nanodispersions
like liposomes2, niosomes3, micelles4, microemulsions5 and solid-phase nanodisperions
like polymeric nanoparticles6, metallic nanoparticles7, drug nanocrystals8, and polymer
drug conjugates9 have been reported to enhance delivery of therapeutic agents via
common routes of administration including oral, parenteral, transdermal, pulmonary,
ocular and intranasal routes.

2
Some of these colloidal systems have already been approved by the FDA and are
being used clinically in humans. For example, Doxil® injection is a liposomal formulation
of doxorubicin approved by the FDA in 1995 for treatment of ovarian cancer10. Even
though nanotechnology has advanced significantly, there are still only a few approved
drug products using these technologies due to the limited knowledge regarding the
cellular interactions of colloidal systems. A great amount of work is in progress aimed to
understand the interactions of nanomaterials with biological tissues and the mechanisms
of nanoparticle cellular internalization.
Delivery of nanoparticles via the intranasal route has gained the attention of
numerous investigators. Several nanoparticle drug delivery systems have been reported to
increase the transport of drugs/vaccines across the nasal mucosa compared to
drugs/vaccines delivered as solutions11-12. Studies have shown that both engineered
nanoparticles (carbon nanotubes, quantum dots) and natural nanoparticles (smoke, dust,
and viruses) can transfer to both the brain and systemic circulation following intranasal
exposure13-15. Understanding the role of the nasal mucosa in the internalization of the
nanoparticle systems is essential to develop advanced drug delivery systems and improve
delivery of drugs/vaccines via this route.
In addition to a useful route for the delivery of drugs, the nasal route is also a
potential route for exposure of unwanted airborne nanoparticles. As utilization of
nanomaterials has increased, humans are being continuously exposed to airborne
nanoparticles in workplaces, from consumer products and in public places16. Research
has repeatedly shown several harmful effects of some nanomaterials, including
cytotoxicity and oxidative stress17-18. Nanoparticles of various chemistries are highly

3
reactive and can interact with cellular systems to produce reactive oxygen species (ROS),
which, in turn, cause oxidative stress and alter signal transduction mechanisms,
eventually damaging the cells and tissues19.
Prior to understanding the specifics of nanomaterial transit through nasal tissue, it
is essential to understand the anatomy and physiology of human nose along with its
cellular composition and some key endogenous processes. A detailed description of the
anatomy, physiology and function of nasal cavity was published by Mygind and Dahl20,
and a brief brief overview of nasal anatomy and physiology is summarized below.
Nasal Anatomy and Physiology
Main functions of the nose include the sense of olfaction, regulation of
temperature and humidity of inhaled air, and filtering of particulate matter from the
inhaled air. The structure of the human nose is complex. Anatomically, the human nose is
divided into three distinct regions: the anterior region (nasal vestibule), the
middle/turbinate region (respiratory and olfactory region) and the posterior region
(nasopharynx) (Figure 1.1). The nasal septum differentiates the nasal cavity into two
halves. The surface of the nasal vestibule is composed of stratified, squamous and
keratinized epithelial cells along with sebaceous glands21. These cells are very resistant to
dehydration and can withstand noxious environmental substances while preventing their
permeation. The nasal valve is a narrowing of the airway passage; it lies between the
vestibule and the turbinate regions. The nasal valve is anatomically responsible for most
of the resistance to airflow in the respiratory tract. Beyond the nasal valve, the airway
opens into the large main nasal passage or the turbinate region. Turbinates are
cartilaginous protrusions from the lateral surfaces covered by mucosal tissue and are

4
responsible for the airway dynamics due to their baffle like behavior and for the air
conditioning functions of the nasal cavity due to their relatively large surface areas which
allow for rapid heat and water exchange22. Anteriorly the lower two turbinates and the
associated mucosal tissues in the area are referred to as the respiratory region and the
superior turbinate region called the olfactory region.
Figure 1.1 Schematic representation of nasal anatomy showing the location of turbinate regions, olfactory mucosa and olfactory bulb. Reproduced with permission23.
The Respiratory Region
The respiratory region contains the largest surface area of the nasal cavity; the
total surface area of the nasal mucosa is estimated to be 180 cm2 of which respiratory
mucosa occupies ~170 cm2. Morphologically, the respiratory mucosa is composed of two
distinct layers: the respiratory epithelium and the lamina propria (submucosal region).
The respiratory epithelium is composed of ciliated pseudostratified columnar epithelial
cells, goblet cells and the basal cells (Figure 1.2). The epithelial cells are approximately

5
25 μm in height, 7 μm wide at the tip and 3 μm wide at the base. These cells are
connected via tight junctions and possess a barrier function, inhibiting the permeation of
many substances. Each epithelial cell in the respiratory region contains 300 to 400
microvilli that are 0.1 μm in diameter and 2 μm in height on their apical surfaces24.
Goblet cells are also present within the respiratory epithelium and, along with the mucus
glands present in the submucosal region secrete and maintain the mucus layer. Mucin, a
glycoprotein is the main constituent of mucus, and the mucus layer forms a continuous,
10 -20 μm thick blanket covering the epithelial cells. Cilia present on the epithelial cells
continuously beat at a rate of 10 to 20 times per second and are responsible for the
clearance of mucus and trapped particulate matter into the nasopharynx24. Basal cells are
present on the basement membrane separating the epithelium from the submucosal
region; these stem cells can mature into ciliated epithelial cells or goblet cells. The
submucosal region is composed of connective collagen fibrils and is highly vascularized
with an abundant capillary network and contains serous and mucous glands. Materials
reaching the submucosal region have access to the systemic circulation through the
vascular network.
The submucosal region also contains the “ Nasal Associated Lymphoid Tissue
(NALT)” which is responsible for the local mucosal defense system and involves both
the production of antibodies and serves as the source of circulating immune cells25.
NALT is an aggregation of organized lymphoid tissue consisting of aggregates of paired
lymphocyte-like follicles situated in the region closer to the nasopharyngeal duct. These
follicles are reported to contain T- and B-cells, and a layer of specialized membranous
cells called M-cells covers the surfaces of the follicles. Reports have shown that these M-

6
cells function similarly to the M-cells in the Peyer’s Patches present in the
gastrointestinal tract and it is reported that these cells are responsible for nanoparticle
uptake in the nasal mucosa26. Several vaccine delivery systems actively target antigens to
the lymphoid NALT via intranasal route to trigger mucosal immunity12.
Figure 1.2 Schematic representation of the composition of the respiratory epithelium and submucosal region27. The epithelial barrier of respiratory mucosa typically consists of ciliated pseudostratified columnar epithelial cells, goblet cells and basal cells. The underlying lamina propria consists of connective tissue (CT), fibroblasts, blood vessels (BV), and serous glands.

7
Figure 1.3 Schematic representations of the location of the olfactory region, the olfactory epithelium and olfactory neuronal pathways from nose to olfactory bulb28. Reproduced with permission.
The Olfactory Region
Figures 1.3 illustrates the location and cellular composition of the olfactory region
in humans. The olfactory region constitutes only about 5% of the total area of the nasal
cavity, and it is in close proximity to the olfactory bulb in the brain29. Similar to the
respiratory region, the olfactory mucosa can be divided into a mucosal (olfactory
epithelium) and submucosal region. The olfactory epithelium is composed of three types
of cells: olfactory neural receptor cells (olfactory axons), supporting cells (sustentacular
cells) and basal cells. Neural receptor cells are un-myelinated axons that originate at the
olfactory bulb and pass through the cribriform plate and terminate at the apical surface of

8
the olfactory epithelium. Supporting cells are columnar cells that provide mechanical
support to the neuronal cells. The basal cells are capable of differentiating into olfactory
neuronal cells or into sustancular cells. The neuronal cells and sustentacular cells are
connected by tight junctions, which form a physical barrier to material transfer. The
submucosal region is located beneath the epithelium and contains the vascular supply,
Bowman’s glands which secrete mucus, and nasal lymphatic vessels. The lamina propria
of the olfactory region is innervated by a neuronal supply that consists of olfactory axon
bundles, autonomic nerve fibers and the maxillary branch of the trigeminal nerve system.
The olfactory region makes a direct connection to the olfactory bulb of the brain.
Intranasal Delivery of Drugs and Vaccines
Nasal delivery of therapeutics has been conventionally limited to the treatment of
local/topical nasal problems like allergies and rhinitis. However, recently nasal delivery
is being used as a substitute for parenteral and oral delivery or in attempts to target
therapeutic agents to the brain30. The highly vascularized and immunologically
competent nasal mucosa offers several advantages including improved bioavailability,
quicker onset of action and excellent mucosal immune response for the delivery of drugs
and vaccines. Nose-to-brain pathways, potentially bypassing the blood-brain barrier,
present an added advantage for the delivery of therapeutics to the brain via the nasal
route. Despite of these advantages, intranasal delivery is restricted to the delivery of
highly-permeable, potent compounds because the nasal cavity can hold only a limited
volume in dose and mucociliary clearance rapidly removes material from the absorption
site31. Advanced delivery systems may be able to overcome some of these limitations
with innovative formulations such as nanoparticles and microemulsions.
9
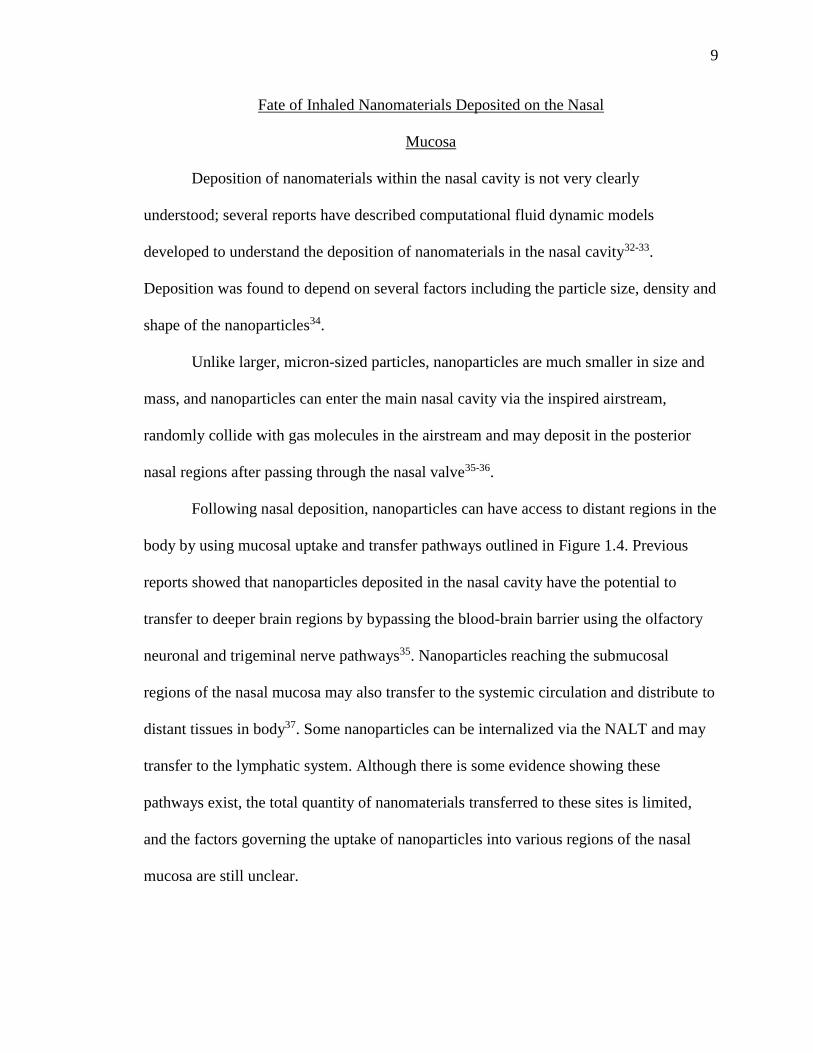
Fate of Inhaled Nanomaterials Deposited on the Nasal
Mucosa
Deposition of nanomaterials within the nasal cavity is not very clearly
understood; several reports have described computational fluid dynamic models
developed to understand the deposition of nanomaterials in the nasal cavity32-33.
Deposition was found to depend on several factors including the particle size, density and
shape of the nanoparticles34.
Unlike larger, micron-sized particles, nanoparticles are much smaller in size and
mass, and nanoparticles can enter the main nasal cavity via the inspired airstream,
randomly collide with gas molecules in the airstream and may deposit in the posterior
nasal regions after passing through the nasal valve35-36.
Following nasal deposition, nanoparticles can have access to distant regions in the
body by using mucosal uptake and transfer pathways outlined in Figure 1.4. Previous
reports showed that nanoparticles deposited in the nasal cavity have the potential to
transfer to deeper brain regions by bypassing the blood-brain barrier using the olfactory
neuronal and trigeminal nerve pathways35. Nanoparticles reaching the submucosal
regions of the nasal mucosa may also transfer to the systemic circulation and distribute to
distant tissues in body37. Some nanoparticles can be internalized via the NALT and may
transfer to the lymphatic system. Although there is some evidence showing these
pathways exist, the total quantity of nanomaterials transferred to these sites is limited,
and the factors governing the uptake of nanoparticles into various regions of the nasal
mucosa are still unclear.

10
Figure 1.4 Possible pathways of nanomaterial transfer from nose to brain and systemic circulation. Inhaled nanoparticles have a chance to be taken up by either respiratory or olfactory mucosa and subsequently enter the brain and/or the systemic circulation. Reproduced with permission38.
Nanomaterial Internalization Pathways Into and Across the
Nasal Tissues
Nanomaterials need to traverse the mucus layer and the epithelial barrier to have
access to the blood and/or lymph vessels present in the submucosal layer of the nasal
tissues. The possible transport pathways for nanomaterial internalization across and into
the nasal epithelia are shown in Figure 1.5. Material deposited on the nasal mucosal
surface can be internalized into deeper tissue regions by intracellular/transcellular and
paracellular/intercellular routes.

11
Figure 1.5 Schematic representations of internalization pathways of nanomaterial (left). Schematic representations macropinocytosis, clathrin-mediated endocytosis and caveolae-mediated endocytosis pathways (right). Reproduced with permission39.
Mechanisms of Intercellular Transfer of Nanomaterial
Transfer via the paracellular pathway is a convective process, which occurs
between adjacent epithelial cells through the intercellular spaces and tight junctions.
Hydrophilic materials are preferentially transferred through this route. The diameter of
the tight junctions between the nasal epithelial cells is reported to be 3.9 to 8.4 Å40. It is
unlikely that any nanomaterial greater than this diameter will be able to pass through
these junctions in their closed state. However, there is evidence showing the presence of
nanoparticles of diameter 10 – 200 nm in the paracellular spaces. Huang and Donovan
were able to visually show 10 nm carboxylate polystyrene nanoparticles in the
paracellular spaces of rabbit nasal mucosa41. More recently, Chen reported that 20 nm
carboxylate polystyrene nanoparticles were internalized into bovine nasal tissues through
the paracellular route38. These authors have postulated the possible opening of the tight
Endocytic pathways for transcellular
uptake

12
junctions to enable nanoparticle passage. Involvement of paracellular transport pathways
for nanomaterials is still controversial and needs further investigation. The integrity of
tight junctions can be compromised under some pathological conditions or due to usage
of absorption enhancers, which might potentially open up the intercellular spaces and
lead to passage of extremely small nanoparticles through paracellular routes42.
Mechanisms of Intracellular Transfer of Nanomaterial
Since the efficient transfer of nanomaterials through paracellular routes is
unlikely, the particles must use the transcellular routes to reach the deeper tissue regions.
Nanoparticles can interact with the cell membrane and be internalized into the cell
through endocytic processes. Endocytosis of particulate matter can occur by multiple
mechanisms, broadly divided into two categories: phagocytosis (cell eating) and
pinocytosis (cell drinking). Both of these endogenous processes are essential for the
transfer of biomaterials into and out of cells. Drugs and nanocarriers can also access these
endogenous processes or it may be possible for the nanoparticles to trigger these
endocytic pathways based on their physiochemical and surface properties.
Phagocytosis is the process by which large diameter (>1 μm) particulate matter,
including several types of bacteria, is internalized into cells. Phagocytosis primarily
occurs in specialized cells like macrophages, monocytes, neutrophils and dendritic cells.
The primary result of this process is to present unwanted foreign material to the immune
system. Particulate matter deposited on the nasal mucosa has shown to be internalized by
dendritic cells and subsequently to be presented to the NALT43. As these large materials
enter the body, the receptors present on phagocytic cells recognize foreign particles and
engulf them by wrapping the cell membrane around the particle. The wrapped membrane

13
detaches from the cell membrane and forms vesicles that eventually convert to
phagosomes. The phagosomes are rich in enzymes and have a low pH, which assists in
the degradation of the particulate matter into soluble cellular debris. These digested
materials are released into the cytoplasm and are eventually eliminated from the cell by
either diffusion or exocytosis44. Several particulate vaccine delivery systems target these
phagocytosis mechanisms by using specific ligands/antigens to efficiently deliver vaccine
into the immune cells12.
Pinocytosis is the process of internalization of solutes and colloidal substances
(1 nm to 1000 nm) into the cells39. Pinocytosis is active in many types of epithelial cells,
including nasal epithelial cells45. There are different mechanisms that result in
pinocytosis. Broadly pinocytosis can be subdivided into three main morphologically
distinct processes based on the proteins involved: 1) clathrin-dependent endocytosis, 2)
caveolae-dependent endocytosis and 3) macropinocytosis. More detailed descriptions of
these pathways can be accessed elsewhere in a series of publications45-47. Figure 1.5
shows a schematic of events that take place in these three endocytic processes and a brief
description of these processes is presented below.
Macropinocytosis is a non-specific endocytic process which involves the
formation of actin-driven plasma membrane protrusions that collapse onto and fuse with
the plasma membrane and generates large endocytic vesicles (1-5 μm diameter) called
macropinosomes39. Owing to the large size of macropinosomes, this process provides
cells with a way to non-selectively internalize large quantities of external cell milieu.
Unlike other endocytic vesicles, macropinosomes that are larger in size, do not contain
any specific coating, and are believed to be relatively more fluid. Escape of the

14
internalized cargo from macropinosomes is also reported due to its more fluid nature
compared to other endocytic vesicles. Once formed, macropinosomes undergo maturation
and fuse with a lysosome which possess an enzyme-rich acidic environment or recycle
their contents to the surface of the cell. Pharmacologically active drugs, including
amiloride and its derivatives have been shown to inhibit the Na+/H+ exchange pump in
the plasma membrane, which leads to low pH in the cytosol48. Formation of membrane
ruffling was reported to be inhibited at low pH and thus at appropriate concentrations of
amiloride or its analogs inhibit macropinocytosis.
Clathrin-mediated endocytosis is an endogenous process involved in all
mammalian cells for the uptake of essential nutrients, including cholesterol-laden low-
density lipoprotein particles that bind to the LDL receptor and iron-laden transferrin that
binds to transferrin receptors39. This process typically occurs in a membrane region
enriched in clathrin, a main cytosolic coat protein. Clathrin polymerization is responsible
for the formation of the ‘coated pits’ on the cell membrane upon activation of specific
receptors. After formation, coated pits pinch off from the cell membrane with the help of
dynamin and form clathrin-coated vesicles. The resulting endocytic vesicles are relatively
small in diameter at 100-150 nm39. As these vesicles mature to form early endosomes,
they lose their clathrin coat and any associated ligands into the cytosol that may recycle
back these substances to the cell membrane. The early endosomes travel further into the
cytosol and form late endosomes which finally fuse to lysosomes, an acidic and enzyme-
rich environment able to degrade entrapped material. In some cases, the inert entrapped
material, resistant to degradation, may release into the cytosol and return to the
membrane from which it was internalized, or it could traverse the cell and be delivered to

15
an opposite/adjacent cell in a process called transcytosis39. Several compounds have been
reported to dissociate the clathrin lattice and thereby inhibit clathrin-mediated
endocytosis. Chlorpromazine is a commonly used inhibitor for clathrin-mediated
endocytosis; it is believed to inhibit clathrin-coated pit formation49.
Caveolae-mediated endocytosis is also a pinocytosis process involved in
internalization of biomolecules including cholesterol into cells. Caveolae are flask-shaped
invaginations of the plasma membrane rich in cholesterol and sphingolipids, abundantly
present on endothelial cells46. The sizes of caveolae are reported to be 50-60 nm and the
shape and structural organization of caveolae are conferred by caveolin, a dimeric protein
that binds cholesterol50. Similar to clathrin-mediated endocytosis, caveolae-mediated
processes is also highly regulated process involving complex signaling, which may be
driven by the entrapped material itself. Materials on the cell surface move along the
plasma membrane to reach caveolae invaginations, where they may be tethered through
receptor-ligand interactions. Caveosomes are then sorted to cell organelles including the
endoplasmic reticulum. This process bypasses lysosomal formation and is believed to be
a useful pathway for internalization of material that are sensitive to degradation in acidic,
enzyme-rich lysosomes39. Compounds that inhibit the formation of caveolae either by
inhibiting cholesterol binding or interrupting the actin cytoskeleton have been shown to
inhibit caveolae-mediated endocytosis. Methyl-β-cyclodextrin binds to cholesterol in the
caveolae and thus depletes the availability of cholesterol for formation of caveolae, which
results in the inhibition of this endocytic process50.
Materials present on the cell surface, including nanoparticles are believed to be
internalized into the cells through the above described pinocytosis pathways. One

16
common feature among these endocytic processes is formation of vesicles that are finally
presented to the cytosol. Nanoparticles internalized into the cells through these pathways
are either degraded in lysosomes or presented to cell organelles like the Golgi apparatus,
endoplasmic reticulum, or mitochondria39.
In Vitro and In Vivo Intranasal Uptake Models
Studying the intranasal uptake of nanoparticles requires a reliable nasal model. In
vivo models including mouse51, rat37, rabbit41, and sheep52 are being used to study the
biodistribution and bioavailability of therapeutic agents administered in nanoparticle
systems. While these in vivo models are helpful in mimicking the human nasal
conditions, mechanistic studies of nanoparticle transfer into the nasal tissues is difficult
using in vivo models. In vitro studies using excised nasal mucosa from either bovine53,
ovine and porcine40 species have been demonstrated to be efficient and easier models for
understanding the underlying mechanisms of intranasal transit of nanoparticles. In
addition, investigators have used cell culture systems of nasal epithelial airways
developed from a variety of species including bovine, hamster, humans as in vitro models
for studying nanoparticle uptake54.
Solid-phase Nanodispersions in Intranasal Uptake
The term “solid-phase nanodispersions” is used to describe colloidal dispersions
of solid-state nanoparticulate materials of diameter between 1-1000 nm dispersed in a
continuous liquid medium. Nanoparticles are made from a wide range of materials and
can be used as drug carriers or as vaccines, in which therapeutic agents are entrapped,
dissolved, encapsulated, adsorbed or chemically attached. The extent of uptake and
cellular internalization pathways of nanoparticles from the nasal mucosa is dependent on

17
several factors, including size, shape, surface chemistry, and composition of the
nanoparticles. A brief review of different solid nanoparticle systems used in intranasal
delivery is provided below.
Polymeric Nanoparticles
Nonbiodegradable Polymeric Nanoparticles
Initial use of polymeric nanoparticles for drug delivery was limited to
nonbiodegradable and/or non-biocompatible systems like polystyrene, poly (methyl
methacrylate) (PMMA), polyacrylamide and polyacrylates12, 55. While most of these
polymer systems serve as excellent adjuvants for vaccines or carriers for small and large
drug molecules, the accumulation of these particulate systems in tissues raises
biocompatibility concerns and lead to a major concern requiring clearance of these
particulate systems from the body and potential safety concerns. Nonbiodegradable
polyermic systems act as good models for the investigation of the processes used for
nanoparticle uptake into the nasal epithelium. Among the nonbiodegradable
nanoparticles, polystyrene nanoparticles are widely used model nanoparticles for
intranasal studies because they are readily available in different sizes with different
surface chemistries and contain fluorescent dyes enabling easy detection. Table 1-1
summarizes some of polystyrene nanoparticulate systems previously used in the
investigation of intranasal nanoparticle transfer.
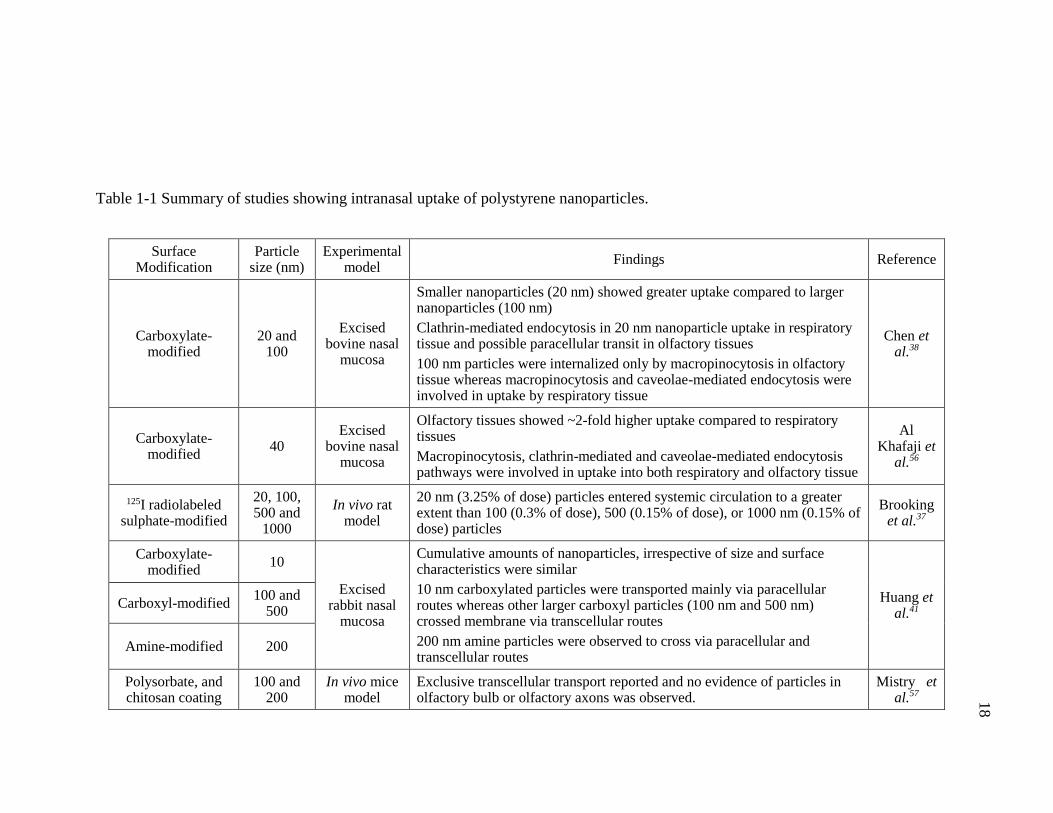
18
Table 1-1 Summary of studies showing intranasal uptake of polystyrene nanoparticles.
Surface Modification
Particle size (nm)
Experimental model
Findings Reference
Carboxylate-modified
20 and 100
Excised bovine nasal
mucosa
Smaller nanoparticles (20 nm) showed greater uptake compared to larger nanoparticles (100 nm)
Clathrin-mediated endocytosis in 20 nm nanoparticle uptake in respiratory tissue and possible paracellular transit in olfactory tissues
100 nm particles were internalized only by macropinocytosis in olfactory tissue whereas macropinocytosis and caveolae-mediated endocytosis were involved in uptake by respiratory tissue
Chen et al.38
Carboxylate-modified
40 Excised
bovine nasal mucosa
Olfactory tissues showed ~2-fold higher uptake compared to respiratory tissues
Macropinocytosis, clathrin-mediated and caveolae-mediated endocytosis pathways were involved in uptake into both respiratory and olfactory tissue
Al Khafaji et
al.56
125I radiolabeled sulphate-modified
20, 100, 500 and
1000
In vivo rat model
20 nm (3.25% of dose) particles entered systemic circulation to a greater extent than 100 (0.3% of dose), 500 (0.15% of dose), or 1000 nm (0.15% of dose) particles
Brooking et al.37
Carboxylate-modified
10
Excised rabbit nasal
mucosa
Cumulative amounts of nanoparticles, irrespective of size and surface characteristics were similar
10 nm carboxylated particles were transported mainly via paracellular routes whereas other larger carboxyl particles (100 nm and 500 nm) crossed membrane via transcellular routes
200 nm amine particles were observed to cross via paracellular and transcellular routes
Huang et al.41
Carboxyl-modified 100 and
500
Amine-modified 200
Polysorbate, and chitosan coating
100 and 200
In vivo mice model
Exclusive transcellular transport reported and no evidence of particles in olfactory bulb or olfactory axons was observed.
Mistry et al.57

19
Mistry et al. investigated the possibility of nose-to-brain transfer of chitosan-
coated polystyrene and polysorbate-coated polystyrene nanoparticles (100 – 200 nm in
diameter) using fluorescence microscopy and stereology techniques following repeated
intranasal administration every 24 h for two days in mice57. The authors found no
evidence of either of the nanoparticle types in the olfactory axons or the olfactory bulbs
of mice after the 4th day of first administered dose; instead, the majority of particles
remained in the olfactory epithelial cells. The use of nonbiodegradable polystyrene
polymeric particles allowed the authors to visualize the nanoparticles using fluorescent
microscopy to observe nasal epithelial cross-sectional images and authors were able to
conclude that nanoparticles should have a diameter of < 100 nm for transcellular
transport of nanoparticles through the olfactory axons beyond the basement membrane.
Huang et al. reported the transcellular and paracellular transfer of 10 nm carboxylate
surface modified polystyrene nanoparticles following exposure to excised rabbit nasal
mucosa using fluorescence microscopy41. In another study, Chen et al. demonstrated
greater uptake of 20 nm sized carboxylate polystyrene nanoparticles than 100 nm sized
nanoparticles into excised bovine nasal respiratory and olfactory tissue using
spectrophotometric and fluorescence detection of the incorporated dye38. Chen also
showed that intact nanoparticles could be taken up into nasal tissues using multiple
endocytic mechanisms, and additional paracellular pathways for smaller, 20 nm
nanoparticles were also reported38. Although these nonbiodegradable nanoparticles are
unlikely to be effective drug delivery systems, they serve as excellent models for
systematically studying the size and surface properties of nanoparticles that influence
cellular interactions and biodistribution patterns.

20
Biodegradable Polymeric Nanoparticles
Natural polymers like chitosan, gelatin, alginate and synthetic polymers like
polylactic acid (PLA), poly (lactic-co-glycolic acid) (PLGA), and poly-caprolactones, are
some of the biocompatible and biodegradable polymers used in nanoparticle
preparations58. Nanoparticles made of biodegradable materials may provide controlled
drug delivery, lower toxicity, and improved biocompatibility, with minimal immunogenic
and inflammatory responses59. Table 1-2 summarizes some of the selected biodegradable
nanoparticulate systems evaluated as nasal drug delivery systems. PLGA and PLA are
most frequently used in nanoparticulate delivery systems because these polymers undergo
hydrolysis and produce the biodegradable monomers, lactic acid and glycolic acid.
PLGA particles are being studied widely for their ability to deliver large molecules like
vaccines and DNA or RNA for gene delivery strategies. Surface-modified PLGA
particles have been repeatedly shown to improve the induction of systemic and mucosal
immune responses. For example, Pawar et al. reported augmented systemic and mucosal
immune responses after intranasal administration of Heptitis B Surface Antigen (HBsAg)
in PLGA particles of diameter 160-180 nm in mice60. They also showed that modifying
the surface of PLGA particles using chitosan and trimethyl chitosan ligands increased the
zeta potential of the HBsAG PLGA particles, which further potentiated the mucosal
immune response. Along with nasal vaccinations, PLGA particles have also been
reported to deliver small drug molecules to the brain via the intranasal route. Seju et al.
developed olanzapine-containing PLGA nanoparticles of ~90 nm diameter for intranasal
delivery to the brain and reported a ~10 times increase in olanzapine concentrations in
brain when compared to olanzapine solution when administered through the intranasal
21
route in rats61. Most formulations in the nasal cavity are cleared rapidly through
mucociliary clearance, and such rapid clearance from the nasal cavity limits the
internalization of particulate therapeutic agents. To overcome these limitations, several
varieties of surface modifications using ligands like chitosan, trimethyl-chitosan, lecithin
and polyethylene glycol (PEG) have been examined62-63. Surface modification with
anionic or neutral polymers increases the otherwise negative zeta potential of PLGA
particles and may improve mucoadhesion, which may enhance the residence time in the
nasal mucosa. For example, surface modification of PLGA particles with chitosan or its
derivative, glycol chitosan has shown to improve the retention time of Hepatitis B surface
Antigen in the nasal mucosa compared to the uncoated PLGA particles64. Also, the glycol
chitosan coating of PLGA particles was shown to induce significantly higher systemic
and mucosal immune response compared to uncoated PLGA particles64. Although
biodegradable nanoparticles offer several advantages, researchers need to be careful to
understand the particle aggregation properties of these systems and their mechanisms of
particle transit in the nasal mucosa when investigating them as nanoparticulate delivery
systems. Nanoparticles deposited on the nasal mucosa can potentially release drug into
the mucosal secretions and the free drug has the potential to transfer into the nasal
mucosa or the drug can also be released within the nasal mucosa from internalized
nanoparticles without the particles being further translocated. Hence, it is important to
study the drug release behavior from these nanoparticles to better understand how
nanoparticles can potentially improve the drug delivery across the nasal mucosa.

22
Table 1-2 Summary of selected studies showing potential use of biodegradable PLGA and PLA particles in delivering a variety of drugs and vaccines via the intranasal route.
Type of particulate system
Particle size (nm)
Antigen/Drug Experimental
model Findings Reference
Unmodified PLGA, chitosan
coated and trimethyl chitosan
(TMC) coated
420 – 490
Heptitis B surface antigen
BALB/c mice
TMC coated PLGA particles induced substantially higher antibody titers (anti HBsAg) in local and distal mucosal secretions
as compared to chitosan coated, uncoated PLGA and soluble or alum adsorbed HBsAg.
Pawar et al.60
PLGA ~180 Diazepam Sprague
Dawley Rats
Approximately 2 -3-fold increase in brain/blood diazepam concentration was observed with PLGA particles compared to
drug in solution
Sharma et al.65
Wheat germ agglutinin
conjugated PEG-PLA
~110 6-coumarin Sprague
Dawley Rats
Nanoparticles were transferred into the olfactory submucosa through transcellular pathways followed by subsequent transfer to
olfactory bulb through nerve bundles or their surrounding connective tissue
Liu et al.66
PLA, PEG-PLA 200 Tetanus toxoid BALB/c mice PEG-PLA particles showed ~2-fold increase in anti-tetanus IgG antibodies after 24 weeks compared to PLA particles or antigen
solution Vila et al.67
PLGA 91 Olanzapine Albino Rat Approximately 6 - 8 times higher concentration of drug in brain
with PLGA particles compared to drug in solution Seju et al.61
PLGA ~70 Nile red Excised Bovine nasal Mucosa
Around 4% of exposed nanoparticles internalized into nasal mucosa within 1 h
Greater uptake into olfactory tissue compared to respiratory tissue
Majority of particles were observed in submucosal regions of nasal tissues
Albarki et al.68

23
Metallic Nanoparticles
Nanoparticles made of metals, metal alloys, metal oxides and other metallic salts
can be generally described as “metallic nanoparticles”. These include nanoparticles of
gold, silver, copper, iron oxide, manganese oxide, and indium oxide. Also included in
this category semi-conductor-based quantum dots and non-metal, carbon-based
nanoparticles like fullerenes, graphenes and carbon nanotubes. Several metallic
nanoparticles have been shown to transfer from nose to brain, lungs and other distant
regions14, 69-72. In 1960, De Lorenzo reported nanomaterials, less than the diameter of the
olfactory axons, can be transferred through these axons, and the author showed evidence
of colloidal gold in the olfactory axons beyond the basement membrane of the olfactory
mucosa of squirrel monkeys following intranasal instillation73-74. Olfactory axons in
humans 100 – 700 nm in diameter and the colloidal gold used by DeLorenzo was
~50 nm75. Following nasal exposure, the extremely small size of these metallic
nanoparticles may result in entrapment in olfactory neuronal cells in the nasal mucosa
with subsequent transfer to the olfactory bulb and other regions of the brain. In another
study, Edler and coworkers reported a 3-4-fold increased concentration of manganese in
the olfactory bulb compared to control after a 12-day inhalation exposure of 30 nm
manganese oxide nanoparticles in rats72. In a more recent study, Hopkins et al. used
fluorescent microscopy and showed that short-term inhalation exposure of 15 – 20 nm
diameter solid, cadmium-selenide quantum dot nanoparticles in mice resulted in axonal
transport to the olfactory bulb76. A study by Garzotto and Marchis investigated the
localization of cadmium selenide quantum dots in the olfactory epithelium following
intranasal administration in CD1 mice71. These investigations imaged cross-sections of

24
the nasal tissues using confocal microscopy and reported that quantum dots were able to
cross the olfactory epithelium and reach the underlying lamina propria. An absence of
quantum dots in the olfactory neurons caused the authors to conclude that quantum dots
cross the olfactory epithelium through extracellular spaces around the olfactory neuronal
cells and supporting cells. The investigations did not report any quantum dots being
transferred to the brain, however, but they did show small amounts of quantum dots
present around the olfactory nerve bundles in the submucosal 24 h after intranasal
administration. Quantum dots in the lamina propria have the potential to reach the brain
by transfer along the perineuronal spaces, and small quantities of particles in nerve
bundles could transfer through the neuronal axons and reach the brain. A summary of the
few studies showing the transfer of metallic nanoparticles from the nose to the brain
following either intranasal instillation or inhalation exposure is shown in Table 1-3.
These investigations have led researchers to engineer advanced metallic
nanoparticles for disease diagnosis and also for studying the efficiency of targeted drug
delivery to the brain77-80. For example, Joshi and coworkers administered insulin attached
to colloidal gold (~4 nm diameter) via per-oral and intranasal routes in diabetic Wister
rats and compared the resulting reduction in blood glucose levels81. They reported that
within 2 hours of dosing an approximately 50% reduction in blood glucose levels
following intranasal administration but only a 19% reduction following per-oral
administration. Although gold nanoparticles served as excellent carriers for insulin, the
clearance, accumulation and toxicity of gold following intranasal administration was not
discussed in the report; gold accumulation is likely a safety concern regarding the
sustained and chronic use of these nanoparticles to treat type I diabetes.

25
Table 1-3 Summary of studies showing translocation of metallic nanoparticles following intranasal administration.
Nanoparticle type Size (nm) Experimental
model Findings Reference
CdSe/ZnS QDs encapsulated in
polyethylene glycol, phosphatidyl,
ethanolamine micelle
15-20 Mice
Three hours after inhalation exposure, quantum dots were visualized in olfactory axons and olfactory bulb
Authors concluded transfer for QDs from nose to brain via olfactory axonal transport
Hopkins et al.76
Carboxylate-modified CdSe/ZnS QDs
15-20 Mice
Transfer of QDs was visualized from olfactory epithelium to lamina propria within 4 h post instillation
No evidence of QDs in olfactory neuronal components, instead QDs were present as clusters in extracellular spaces in lamina
propria
Garzotto et al.71
Manganese oxide particles
~ 30 Rats 12 days of exposure resulted in 3.5-fold increase of Mn in olfactory bulb and ~1 fold increase in Mn content in lungs
Elder et al.72
Radiolabeled carbon particles (13C )
36 Rats Gradual increase in 13C carbon in the olfactory bulb from day 1 to
day 7 following 6 h inhalation exposure Oberdorster
et al.70
Iron oxide particles 280 Mice
Higher iron levels in olfactory bulb and brain stem 2 week after instillation
Possibility of both olfactory neuronal and trigeminal pathways for brain uptake
Wang et al.82
Silver coated gold particles
~50 Squirrel
Monkeys
Within 30 - 60 min of instillation, gold particles were detected in olfactory neuronal axons and olfactory bulb which showed the
involvement of olfactory neuronal pathways
De Lorenzo et al.74

26
Recent advances in nanoparticle engineering have led to the synthesis of a variety
of surface functionalized metallic nanoparticles with high stability in biological
environments. The inherent metallic properties of nanoparticles, including the magnetic
properties of iron oxide particles, optical properties of quantum dots and high density of
gold particles, make these particles excellent choices for magnetic resonance imaging
(MRI), multimodal optical imaging and computerized tomography (CT), respectively83-85.
Intranasal delivery of metallic nanoparticles for diagnostic purposes is still limited to cell
based and small animal studies due to the potential for accumulation of a heavy metal
load in the body, as the clearance properties of these of nanoparticles is uncharacterized.
Nevertheless, improved diagnostics used in cells and small animals can still have a huge
impact on life science research which could assist considerably in translational research.
A rapid increase in the utilization of metallic nanoparticles has been seen, not
only in the biomedical fields, but also in the automobile and consumer product
industries86-87. This increased utilization is accompanied by the potential risk of increased
levels of nanomaterials in the environment, which also cause increased human exposure
to nanoparticles.
One of the major routes of human exposure to these extremely small, elemental
nanoparticles is through inhalation. Bioaccumulation of unwanted harmful airborne metal
nanoparticles along the olfactory neurons and in the brain could potentially result in
several CNS-related diseases like Alzheimers88 and Parkinsons diseases89. As multiple
investigations have shown the potential transfer of nanomaterial from the nose to the
brain, the potential neurotoxicity associated with accumulation of metal particles has also
been widely studied (Table 1-4).

27
Table 1-4 Summary of selected studies showing toxicity effects of metallic nanoparticles following intranasal instillation.
Nanoparticle type Size (nm) Animal Model
Toxicity Findings References
Ferric oxide 21 and 280 Mice
Induction of oxidative stress and elevation of glutathione levels in olfactory bulb and hippocampus
Alterations in nerve cells, neurodendron degeneration, membrane disruption, swollen mitochondria and dilation in
rough endoplasmic reticulum in olfactory bulb
Wang et al.90
Silica 15 Rats
Induction of oxidative stress and increased inflammatory response in striatum.
Depletion of dopamine and down regulation of tyrosine hydroxylase
Wu et al.91
Titanium dioxide 80 and 155 Mice Increased tumor necrosis factor alpha and interleukin
Increased oxidative damage due to lipid peroxidation Wang et al.14
Silver 25 Mice
Elevated tissue glutathione levels in nasal epithelia
Increase oxidative stress in nose and in blood
Mild enhancement of erythrocyte destruction
Genter et al.92

28
Solid Lipid Nanoparticles
Solid lipid nanoparticles (SLNs) constitute attractive colloidal drug delivery
systems consisting of lipid particles dispersed in aqueous surfactant solutions. Generally,
SLNs contain a solid hydrophobic core made of lipids stabilized using surfactants. Lipids
that are well tolerated by the body like phospholipids (e.g. phosphatidyl choline,
phosphatidylehanolamine), triglycerides (e.g. tristearin), fatty acids (e.g. stearic acid) and
waxes (e.g. cetyl palmitate) can also be used for the production of the solid lipid cores93.
Unlike most polymeric nanoparticles, lipids used in SLNs are known to be biocompatible
and biodegradable, hence they may have minimal cytotoxicity. Furthermore, production
of polymeric nanoparticles involves the use of organic solvents and there is always a
concern for the residual solvents in the finished product, whereas production of SLNs
does not need to employ potentially toxic organic solvents94. SLNs can be prepared using
simple techniques like high pressure homogenization, and can be easily scaled to large-
scale production compared to more sophisticated production methods required for
polymeric nanoparticles95. SLNs are similar to microemulsions and liposomes, differing
primarily in the lipid physical state. The solid lipid in SLNs replaces liquid/semi-solid
phase lipids used in vesicular systems. Because of the solid-state lipid in the core, SLNs
show better stability than lipid vesicular systems. Concern regarding the safety of
surfactants used as stabilizers in SLNs has not been established, however, and this is a
significant limitation in developing safer SLN systems.
Lipophilic drugs can be dissolved or dispersed in the lipid portion of the
phospholipids and hydrophilic drugs can be dissolved or dispersed in the hydrophilic
portion of the phospholipid matrix, thus SLNs have the potential to act as carriers for a

29
variety of hydrophilic and lipophilic drugs/vaccines 94. The hydrophobic lipid cores of
SLNs can be tuned to a variety of sizes and surface characteristics and enable controlled
and targeted delivery of drugs by various routes of administration. One of the widely
studied applications of SLNs is targeting drugs to the brain following intravenous and
intranasal administration. Intravenous administration of surface engineered SLNs with
appropriate surfactants like polysorbate 80 and/or appropriate ligands like polyethylene
glycols have been shown to escape clearance by the reticuloendothelial system and allow
enhanced uptake of SLNs via receptor-mediated endocytosis across the blood-brain
barrier96-97. Several reports in the literature also describe the superiority of the intranasal
route over the intravenous route for delivery of drugs in SLNs. Table 1-5 summarizes
some of those investigations. For example, Patel et al. developed risperidone SLNs (150
nm diameter) using glyceryl behenate as the lipid and Pluronic F-127 as the surfactant.
The authors reported rat brain/blood ratio ~ 5 fold higher 1 h after administration when
delivered via intranasal route compared to the intravenous route98.
Liquid-phase Nanopdispersions in Intranasal Drug Delivery
The term “liquid-phase nanodispersions” is used to describe colloidal dispersions
of liquid/semisolid-state nanomaterials of diameters 1-1000 nm dispersed in continuous
liquid medium. Liquid-phase nanodispersions have been employed as carriers for drugs
and vaccines for several decades. Alternative terminologies for liquid-phase dispersions
are used in literature including vesicular systems, which include microemulsions,
liposomes, niosomes, and micelles. Liposomes and microemulsions are widely studied as
liquid-phase, nasally-administrated nanodispersions, and a brief review of these systems
is summarized in the following sections.
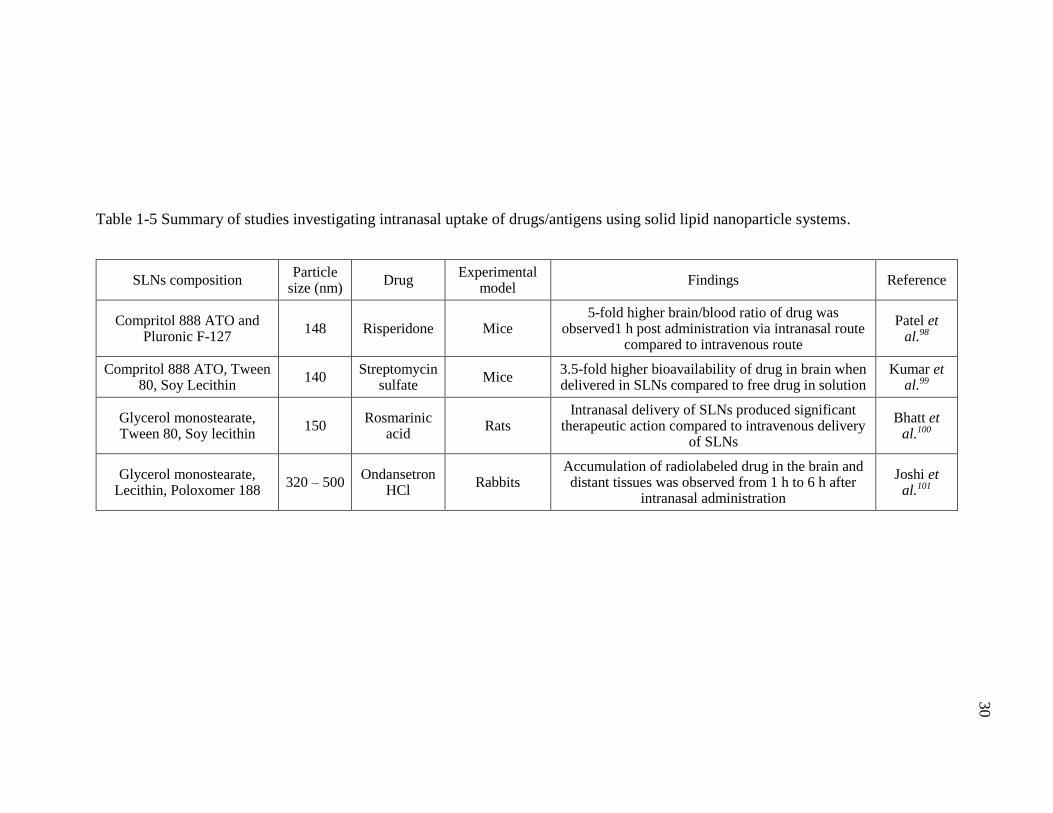
30
Table 1-5 Summary of studies investigating intranasal uptake of drugs/antigens using solid lipid nanoparticle systems.
SLNs composition Particle
size (nm) Drug
Experimental model
Findings Reference
Compritol 888 ATO and Pluronic F-127
148 Risperidone Mice 5-fold higher brain/blood ratio of drug was
observed1 h post administration via intranasal route compared to intravenous route
Patel et al.98
Compritol 888 ATO, Tween 80, Soy Lecithin
140 Streptomycin
sulfate Mice
3.5-fold higher bioavailability of drug in brain when delivered in SLNs compared to free drug in solution
Kumar et al.99
Glycerol monostearate, Tween 80, Soy lecithin
150 Rosmarinic
acid Rats
Intranasal delivery of SLNs produced significant therapeutic action compared to intravenous delivery
of SLNs
Bhatt et al.100
Glycerol monostearate, Lecithin, Poloxomer 188
320 – 500 Ondansetron
HCl Rabbits
Accumulation of radiolabeled drug in the brain and distant tissues was observed from 1 h to 6 h after
intranasal administration
Joshi et al.101
31
Liposomes
Liposomes are spherical vesicles composed of lipid bilayers made of natural,
biodegradable, nontoxic constituents like phospholipids surrounding a central aqueous
core. They may contain cholesterol as a membrane stabilizer that helps maintain their
fluid-like physical state. Unique bilayer structures mimic natural cell membranes and
incorporating charged agents can provide the opportunity to alter the liposomal surface
chemistry. Liposomes can encapsulate a wide variety of lipophilic drugs in the lipid
bilayers and hydrophilic drugs can be retained in the aqueous cores. Wide size ranges of
liposomes have been reported (from 150 nm to > 5000 nm) with positive (cationic),
negative (anionic) and neutral surface charges. In general, encapsulation of vaccines or
drugs in the inner core of liposomes is preferred because it protects the cargo from
enzymatic and chemical degradation inside the body102.
In nasal delivery, liposomes are most widely investigated as carriers for vaccines.
A variety of viral (e.g., influenza103, hepatitis B virus104) and bacterial (e.g.,
mycobacterium tuberculosis105, pseudomonas aeruginosa106) pathogens have been the
target for nasal vaccines. Some of these studies are summarized in Table 1-6.
Production of immunoglobulin A (IgA) at mucosal surfaces is a critical first line
of defense against pathogens that infect the host. Studies in animal models investigating
the efficacy of liposomal vaccine systems delivered through the intranasal route have
demonstrated local production of specific IgA in nasal, bronchoalveolar, vaginal and
rectal secretions and there are also reports showing increased production of IgA in saliva
and bile102.

32
Table 1-6 Summary of studies showing intranasal uptake of drugs/vaccines using liposomal vesicular systems.
Liposomes composition Vesicle
size (nm) Drug/antigen
Experimental model
Findings Reference
Distearoylphosphatidyl choline, cholesterol, N-
glutarylphophatidyl ethanolamine, hemaglutinin
712 Heptitis B
surface antigen (HBsAg)
Mice
Liposome formulation showed high levels of anti-HBsAg antibody titers in plasma, nasal, salivary,
vaginal and intestinal secretions compared to antigen alum formulation.
Both mucosal and systemic immune responses were observed with liposomes
Tiwari et al.104
Phosphatidylcholine, cholesterol
2300 Tetanus toxoid Rabbits After 10th week post-vaccination, liposomal formulation showed highest IgA titers in nasal lavage compared to
solution or alum formulation
Tafaghodi et al.107
Egg phosphatidylcholine, dioleylphosphatidylethanala
mine, cholesterol, glycol chitosan coating
1000 Plasmid
pRc/CMV-HBs (DNA)
Mice High humoral mucosal immune response (high sIgA
antibody levels) with liposomal formulations compared to naked DNA solution
Khatri et al.108
Egg phosphatidylcholine, cholesterol
166 Rivastigmine Rats Higher levels of drug in olfactory bulb and other brain regions were observed within 15 min after intranasal
administration Yang et al.109

33
Nasal immunization has been shown to trigger both humoral and celluar immune
responses102. There are also reports showing liposomal formulations of small molecules
increasing the distribution of small drugs across the nasal mucosa to reach the systemic
circulation and CNS. Yang and coworkers studied the pharmacokinetics and
pharmacodynamics of 179 nm rivastgmine-containing liposomes following intranasal
delivery in rats. Intranasal administration of a rivastgimne liposomal formulation showed
greater distribution of rivastigmine to the CNS, plasma, liver and kidney compared to the
intravenous injection of rivastigmine solution109. In spite of these advantages, intranasal
liposomal formulations are still not commercially available. Chemical instability of
liposomal formulations due to degradation of the liposome components and physical
instability including size changes and loss of entrapped drug upon storage are major
problems in liposomal formulations110. Overcoming these limitations could make
liposomal formulations promising nanoparticulate drug delivery systems for intranasal
administration.
Microemulsions
Microemulsions are thermodynamically stable, isotropic translucent systems
consisting of oil and water with surfactants and stabilizers. The dispersed phase of a
microemulsion is typically 10-100 nm in diameter. Microemulsions differ from
macroemulsions in two significant ways. Microemulsions are thermodynamically stable
systems whereas macroemulsions pose problems like creaming, coalescence and phase
separation. The dispersed phase in microemulsions is typically in the low nanometer size
range and thus microemulsions are transparent systems whereas the dispersed phase in
macroemulsions is frequently several microns in diameter and the systems are turbid or

34
milky white111. Microemulsions are pseudo-ternary systems which spontaneously form
upon mixing specific proportions of oil, water and surfactants. Stabilizers and/or
cosurfactants are typically used in these systems to impart thermodynamic stability to the
systems. These surfactants and stabilizers help to reduce the interfacial tension between
oil and water by adsorbing to the interface and thus surfactants assist in the formation and
stabilization of microemulsions. Depending on the type of surfactant used, two types of
microemulsions can be formed. Typically, a hydrophilic surfactant (high HLB value) aids
in emulsifying oil throughout the continuous water phase to form an oil-in-water (o/w)
microemulsion. Similarly, a lipophilic surfactant (low HLB value) aids in emulsifying
water throughout the continuous oil phase and forms a water-in-oil (w/o)
microemulsion112.
By virtue of their lipophilic nature, small size and good physical stability,
microemulsions have been explored as delivery systems to enhance uptake across the
nasal mucosa. Several studies showed improved transfer of drugs to the brain and
systemic circulation when delivered in microemulsions compared to aqueous solutions.
Some of these studies are summarized in Table 1-7. For example, risperidone
microemulsion consisting of Capmul MCM, Tween 80, and propylene glycol showed
~14% higher blood-brain ratio of drug 30 min after delivery via intranasal administration
in rats compared to intravenous administration of same formulation. Incorporation of
chitosan, a mucoadhesive polymer in the microemulsion system, resulted in a further
increase in the brain-blood ratio for resperidone when delivered via the intranasal
route113. Microemulsions enable the formulation of high concentration dosage forms
suitable for nasal administration. For example, the solubilization capacity of nimodipine,

35
a poorly water-soluble drug (2.3 μg/mL) was increased over 2700 fold to 6.4 mg/mL
when formulated in a microemulsion system consisting of Labrafil M 1944CS,
Cremophor RH 40, ethanol and water. Following intranasal administration of this
nimodipine microemulsion, a three-fold increase in nimodipine uptake in the olfactory
bulb compared with intravenous injection of drug in a solution containing ethanol, PEG
400 and water was reported 114.
In spite of their advantages, there are no commercial microemulsion drug delivery
systems available in the market designed for the intranasal route. Their drug loading
capacity and use of high concentrations of excipients limits the use of microemulsions.
Surfactants and cosolvents can be toxic at high doses; formulators are limited in the range
of compositions in development of microemulsion systems with high drug loading
capacities while minimizing use of the surfactants and cosolvents.
Formulation of lipophilic drugs as non-aqueous concentrates in soft gelatin
capsules is another alternative delivery system that gained interest of pharmaceutical
industry. These non-aqueous drug concentrates are designed to form microemulsions
upon dilution with water immediately before administration or following administration
and dilution with gastric fluids115. In cases where these drug concentrates form clear
transparent microemulsions upon dilution, the concentrates are called self-
microemulsifying drug delivery systems (SMEDDS). While most of the systems being
developed are intended for oral delivery116-118, SMEDDS have the potential to be used in
intranasal delivery, where the drug concentrates can be diluted immediately before
administration and then sprayed into the nasal cavity.
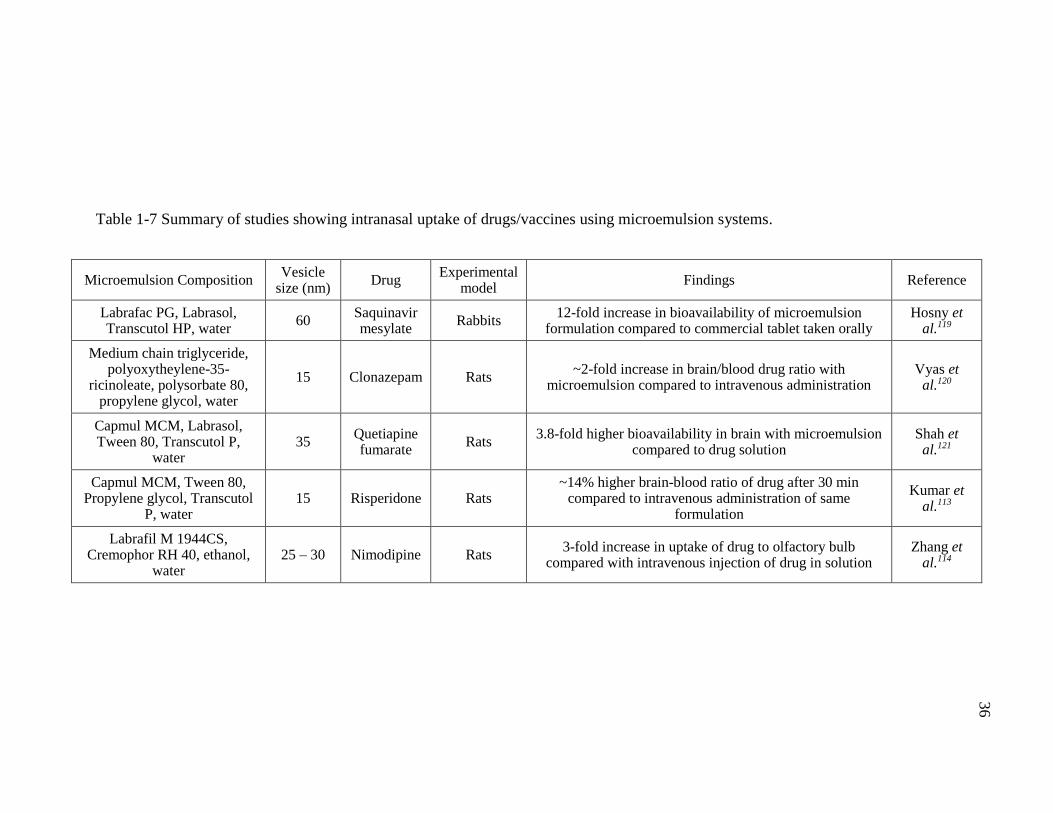
36
Table 1-7 Summary of studies showing intranasal uptake of drugs/vaccines using microemulsion systems.
Microemulsion Composition Vesicle
size (nm) Drug
Experimental model
Findings Reference
Labrafac PG, Labrasol, Transcutol HP, water
60 Saquinavir mesylate
Rabbits 12-fold increase in bioavailability of microemulsion
formulation compared to commercial tablet taken orally Hosny et
al.119
Medium chain triglyceride, polyoxytheylene-35-
ricinoleate, polysorbate 80, propylene glycol, water
15 Clonazepam Rats ~2-fold increase in brain/blood drug ratio with
microemulsion compared to intravenous administration Vyas et
al.120
Capmul MCM, Labrasol, Tween 80, Transcutol P,
water 35
Quetiapine fumarate
Rats 3.8-fold higher bioavailability in brain with microemulsion
compared to drug solution Shah et
al.121
Capmul MCM, Tween 80, Propylene glycol, Transcutol
P, water 15 Risperidone Rats
~14% higher brain-blood ratio of drug after 30 min compared to intravenous administration of same
formulation
Kumar et al.113
Labrafil M 1944CS, Cremophor RH 40, ethanol,
water 25 – 30 Nimodipine Rats
3-fold increase in uptake of drug to olfactory bulb compared with intravenous injection of drug in solution
Zhang et al.114

37
Summary
The nasal route has been widely studied for the delivery of drugs and vaccines
using a variety of colloidal delivery systems. Even though significant progress has been
made, the commercial availability of colloidal nasal dosage forms for systemic delivery
and delivery to the brain are very limited. Many questions about the safety and efficacy
of the colloidal delivery systems remain elusive. In addition, poor drug loading capacity
and high production costs limit usage of colloidal delivery systems. Although significant
progress has been made, the effect of particle/vesicle size and surface characteristics on
particle uptake is still unclear. Several reports suggest that uptake of smaller diameter
nanoparticles into nasal tissues is greater compared to larger particles of similar
composition. Also, there are reports which show smaller size nanoparticles with positive
surface charge show significantly reduced uptakes into nasal tissues, compared to larger
particles with negative surface charge. Additionally, it is unclear how these colloidal
systems are internalized or absorbed into the nasal mucosa. Most of the studies that report
improved delivery of drugs from nasal mucosa fail to investigate or report on the
underlying mechanisms of particle uptake into the nasal respiratory and olfactory mucosa
or provide sufficient information about the release of the drug contents from the
nanoparticle to determine how the particle-associated drug will be presented once
absorbed or transferred into the mucosa.
The studies designed in this research aim to address the existing knowledge gap
regarding ultrafine nanoparticle (< 20 nm) transfer into the nasal mucosa by investigating
the following important questions: 1) How much of the applied nanoparticle load is
transferred into the nasal tissues? 2) Where do the absorbed nanoparticles distribute

38
within the nasal cavity and throughout the body? 3) What uptake pathways can
nanoparticles access? and 4 ) Does the physical state of the nanoparticles (solid vs semi-
solid) affect the efficiency of nasal uptake?
These questions will be addressed in the following chapters: Chapter 3 addresses
Questions 2 & 3 and describe the investigation of the uptake mechanisms of ultrafine
nanoparticles following measurement of the concentration of nanoparticles in various
tissue regions. These are some of the first studies to use chemical analytical methods to
investigate nanoparticle uptake and distribution in tissues. The localization of such
extremely small nanoparticles within those tissue regions will also be shown using
confocal and electron microscopy techniques. Chapter 4 addresses Questions 2 & 3 by
describing the results following the use of non-invasive in vivo imaging methods to
demonstrate the fate of intranasally instilled ultrafine nanoparticles. The potential use of
whole animal imaging and micro-CT techniques for qualitative and semi-quantitative
analysis of nanoparticle biodistribution provides additional methods to investigators to
understand the fate of nanoparticles following intranasal administration. Finally, in
Chapter 5, an attempt was made to study the effect of the physical state of the
nanomaterials on their uptake mechanisms in nasal mucosa by using a drug-containing
microemulsion system. This research overall was aimed at addressing Question 4 and
investigates a new type of colloidal nasal delivery system.

39
CHAPTER II
OBJECTIVES
Colloidal dispersions, irrespective of physical state (solid vs semi-solid) have
been shown to enhance the delivery of therapeutic agents via the nasal mucosa to the
brain and/or the systemic circulation. Although there is evidence that intact nanomaterials
transverse the respiratory and olfactory epithelial barrier, the nasal mucosa represents an
effective barrier against the uptake of many other particulates. Careful characterization of
the uptake and distribution of particles into the olfactory and respiratory tissues, the
brain, and the systemic vasculature is needed to identify particle characteristics that can
be leveraged for advanced drug delivery strategies.
The central hypothesis of this work focuses on nanoparticulate uptake in the nasal
mucosa is that: extremely small nanoparticles (1-20 nm) have access to multiple uptake
pathways through the nasal mucosa, including convective transport within the
paracellular spaces, endocytic uptake by the epithelial cells, and additional neuronal-
associated pathways. A secondary hypothesis is that: the physical state of the
nanomaterials (solid vs semi-solid) and surface characteristics of the nanomaterials
influence their uptake mechanism.
The rationale for the pursuit of this research is that the determining the particle
characteristics which contribute to nasal uptake can result in improved targeted therapies
for a multitude of diseases. Knowledge of nanoparticle uptake can also be applied to
avoid potential neurotoxicities through the appropriate selection of nanomaterials. These
hypotheses will be tested the following specific aims:

40
Specific Aim 1: Investigate the extent of quantum dots (< 20 nm) uptake into
bovine respiratory and olfactory mucosal explants using inductively coupled plasma-
optical emission spectroscopy to analyze uptake and evaluate their localization in nasal
tissues using confocal and electron microscopy.
Specific aim 2: Evaluate the extent of PEGylated quantum dots uptake into bovine
nasal mucosa and compare the uptake with carboxylate-modified quantum dots to
determine the effect of surface modification on nanoparticle transit into nasal tissues.
Specific aim 3: Identify the pathways involved in the uptake of quantum dots into
the bovine nasal respiratory and olfactory mucosal explants by probing energy-dependent
and energy-independent uptake pathways into the bovine nasal mucosa.
Specific aim 4: Investigate the effect of physical state (solid vs semi-solid) on the
uptake of nanomaterials into nasal mucosa by comparing the uptake properties of solid
quantum dots (QDs) nanoparticles and semi-solid (microemulsion) nanodroplets. Prepare
diazepam-containing microemulsions and investigate diazepam permeation into/across
bovine respiratory and olfactory mucosal explants. Identify the pathways involved in the
uptake of microemulsion into nasal mucosa by probing the energy-independent pathways.
Specific aim 5: Investigate and characterize the biodistribution of QDs with
different surface modifications (carboxylated and PEGylated) after intranasal
administration in mice using non-invasive in vivo fluorescence imaging and determine
involvement of endocytic pathways in the uptake of quantum dots in mice. Identify the
transverse pathways of gold nanoparticles from nasal cavity of mice using micro-CT
whole animal imaging.

41
CHAPTER III
UPTAKE AND TRANSPORT PATHWAYS FOR ULTRAFINE
NANOPARTICLES (QUANTUM DOTS) IN THE NASAL MUCOSA
Introduction
The applications of nanotechnology in the biomedical and pharmaceutical
industries have expanded rapidly during the past decade, particularly for the delivery of
drugs and vaccines and also in medical imaging for diagnosing and detecting disease11.
Studies have shown that both engineered nanoparticles (e.g. carbon nanotubes, quantum
dots) and naturally occurring nanoparticles (e.g. smoke, dust, viruses) appear in the
central nervous system (CNS) following intranasal exposure13-15. Additional reports are
also available showing that a variety of nanoparticles enter the systemic circulation
through the vascular bed in the nasal mucosa following intranasal administration37. As a
result, nanoparticulate systems are being used to exploit the nasal route to deliver drugs
locally, systemically and directly to the brain.
Particle size and surface chemistry are the important characteristics of particulate
systems that affect their extent of uptake through nasal tissues. An interesting study by
Brookings et al.37, demonstrated that the rate and extent of translocation of 125I-
radiolabelled latex nanoparticles (20, 100, 500 and 1000 nm) into the systemic circulation
following nasal administration in rats was dependent on the size and surface charge of the
nanoparticles. They observed that 20 nm sulfated polystyrene particles showed greater
uptake into the blood (3.25 % of administered dose) compared to larger particles.
Additional studies have shown the extent of uptake of small nanomaterials (< 50 nm) like
metals, metal oxides, and viruses was higher through the nasal mucosa when compared to

42
nanoparticles with diameters > 50 nm69, 72, 92. There are also several reports available in
the literature showing that nanoparticles with diameters less than 20 nm showed
increased deposition in the nasal cavity, compared to particles >100 nm, more typical of
the particle sizes most frequently studied as drug delivery systems70, 122. In general,
although ultrafine nanoparticles (< 20 nm) show higher translocation efficiencies,
limitations including low drug encapsulation efficiencies and high cost of production
continued to motivate investigators to select larger particles (>100 nm) for drug delivery
purposes. While there are a limited number of reports available in the literature
investigating the extent of uptake of ultrafine nanoparticles (< 20 nm) in the nasal
mucosa, better understanding of the uptake and transfer of these ultrafine particles is
necessary in order to identify solutions where these extremely small particle sizes may be
preferred for drug delivery and in contrast, when these ultrafine particles represent a
toxicological concern.
The major routes and the extent of uptake involved in the internalization of the
nanoparticles into tissues depend on the properties of the particles, including their size,
surface charge and shape123. Phagocytosis, macropinocytosis, clathrin-mediated
endocytosis and caveolae-mediated endocytosis are currently the major pathways which
have been identified in the regulation of entry of physiologically relevant
materials/macromolecules into cells46. Nanoparticles can also be entrapped within these
endocytic vesicles and enter into cells. Previously, Huang et al. reported that 10 nm
carboxylate-modified polystyrene nanoparticles and 200 nm amine-modified polystyrene
particles were found in both the paracellular spaces and in trancellular locations
(endocytosis into interior of cells) of excised rabbit nasal mucosa41. More recently,

43
multiple size-dependent pathways within the bovine nasal mucosa have been investigated
using fluorescently-labeled polystyrene particles (20 nm and 100 nm). It was observed
that 100 nm particles were primarily taken up by macropinocytosis in both the respiratory
and olfactory mucosa whereas a clathrin-mediated pathway appeared to be primarily
involved in the uptake of 20 nm nanoparticles across the respiratory mucosa38. Uptake
was dependent not only on the size and surface chemistry of the particles but also on the
epithelial region within the nasal cavity. Further understanding of the underlying
mechanisms of the membrane transport and distribution of nanoparticles (< 20 nm) is
essential to assist in the design and development of advanced nanoparticulate drug
delivery systems with improved efficiency for nasally-administered therapeutics.
The aim of the present study was to investigate the uptake of ultrafine
nanoparticles in the bovine nasal mucosa and to study the pathways involved in that
uptake. Quantum dots (QDs) were chosen as the model for ultrafine nanoparticles for the
purpose of this study. QDs are readily-available, inorganic nanocrystals (1 – 10 nm)
composed of a heavy metal core (e.g. CdSe) with an inorganic shell (e.g. ZnS). The
unique, size-specific optical properties of QDs have encouraged their application in a
number of in vivo and in vitro systems in biomedical and pharmaceutical sciences124-125.
Compared to conventional organic dyes and fluorescent proteins, QDs offer
unique advantages, such as size dependent optical properties, large absorption
coefficients across a wide spectral range and high levels of brightness and
photostability124. These unique properties make QDs very attractive probes for diagnostic
purposes using molecular imaging and in vivo imaging. QDs were observed to be rapidly
cleared from the blood circulation following intravenous injection and have been detected

44
in the reticuloendothelial tissues, including liver, spleen, lymph nodes and bone marrow
of animals for up to 2 years after administration126-129. There are also reports showing QD
transfer through the blood-brain barrier to reach the brain following intraperitoneal
injection in mice130. Yet, Choi et al. reported that QDs of < 6 nm with cysteine coating
were rapidly cleared through the kidneys131. Additional investigations of the
biodistribution of quantum dots in the body are needed to fully understand the importance
of their properties, including size and surface chemistry, on their fate within the body.
Materials and Instrumentation
Fluorescent quantum dots (QDs) with cadmium selenide (CdSe) core and zinc
sulfide (ZnS) shell were purchased from NN-Labs, LLC (Fayetteville, AR). These
particles are available with a variety of surface modifications; QDs with a carboxyl
surface group (COOH-QDs) or polyethylene glycol surface-modified QDs (PEG-QDs)
were used in these studies. Nanoparticles ~ 7 nm diameter in size with emission
wavelength of 620-640 nm were selected. A sample optical spectrum of COOH-QDs is
shown in Appendix-A. PEG-QDs were used to study the effect of hydrophilic surface
modification only and COOH-QDs were used for all other studies.
2, 4-Dinitrophenol, chlorpromazine, methyl-β-cylcodextrin, amiloride,
glutaraldehyde solution (50% in water), osmium tetroxide solution (4% in water), and
sodium glycocholate hydrate were purchased from Sigma Aldrich Co. (St. Louis, MO).
Sucrose, potassium ferrocyanide and uranyl acetate were obtained from Spectrum
Chemicals (New Brunswick, NJ). Vertical Navicyte® diffusion chambers were obtained
from Harvard Apparatus (Hollison, MA) and were used to perform transport studies. The
exposed tissue area was 0.64 cm2, and each chamber reservoir capacity was 2 mL.

45
Krebs Ringer Bicarbonate buffer (KRB) consisting of 123.8 mM sodium
chloride, 1.5 mM monobasic sodium phosphate, 4.56 mM potassium chloride, 10 mM
dextrose, 15 mM sodium bicarbonate were purchased from Research Products
International Corp (Mt. Prospect, IL). KRB also contained 1.67 mM magnesium chloride
(Sigma Aldrich, St. Louis, MO), 0.7 mM dibasic sodium phosphate (Sigma Aldrich, St.
Louis, MO), and 1.2 mM calcium chloride (EM Science, Fibbstown, New Jersey). The
buffer pH was adjusted to between 7.2 and 7.5 with 1 N hydrochloric acid or 1 N sodium
hydroxide solution (VWR, Radnor, PA).
Experimental Procedures
Preparation of Quantum Dot Dispersions
Commercially available QDs were purchased as 1 mg/mL dispersions in water.
These particles were shaken by hand for 1 min and an aliquot was pipetted and diluted to
0.05 mg/mL using KRB buffer and mixed well for an additional 1 min.
Determination of Particle Size and Zeta Potential
The mean diameter of the QDs (0.05 mg/mL) in KRB was determined using
dynamic light scattering (Nicomp Particle Sizer, Model 380 ZLS, Santa Barbara, CA)
using a volume-weighted distribution analysis, their surface zeta potentials were
measured using a Malvern Nano ZS Zetasizer (Worcestershire, UK).
Preparation of Bovine Respiratory and Olfactory Mucosal
Tissues
Bovine nasal mucosal tissues (olfactory and respiratory tissues) were obtained
from a local abattoir (Bud’s Custom Meats Co, Riverside, IA). The animals were

46
decapitated and longitudinal incisions along the lateral walls of the nasal cavity were
made along with a vertical incision along the ocular plane to expose the nasal respiratory
and olfactory regions. Both the nasal respiratory and olfactory tissues were harvested,
rinsed thoroughly with KRB and transported to the lab after placing them in fresh, ice-
cold KRB. Tissue sections were carefully peeled away from the underlying cartilage and
mounted between the donor and receiver chambers of a Navicyte® diffusion chamber
system. Tissues were mounted such that the mucosal side of the tissue faced the donor
solution and transport took place in the direction from the mucosal to the submucosal
surface. The explants were equilibrated for 20-30 min with 1 mL of prewarmed (37 ˚C)
KRB in both donor and receiver chambers. The tissues were kept aerated with carbogen
(95% O2 + 5% CO2), and the temperature was maintained at 37 ˚C throughout the
experiment.
Quantum Dot Uptake Studies
Methods to measure QD uptake using bovine nasal mucosal explants were
adapted and modified from previous studies reported by Kandimalla et al.132. After
equilibration of tissues with KRB, the buffer was replaced with 1 mL of QD suspension
(0.05 mg/mL) in the donor chamber and 1 mL of prewarmed KRB buffer in the receiver
chamber. At various time points (30, 60 and 120 min) tissues were removed from the
system and the donor and receiver solution were collected and stored at 4 ˚C for future
analysis. The mucosal surface of the tissues was washed with deionized water and the
washing fluids were also collected for analysis. The tissue sections exposed to the QD
suspension were carefully cut to isolate the tissue region exposed to the quantum dots and
the weight of the tissues was recorded using an analytical balance (Model: XS105DU,

47
Mettler Toledo, Columbus, OH). All the samples (tissues, donor, receiver, and tissue
washings) were stored at 4 ˚C until further analysis for QD content. The integrity of the
tissues was monitored by measuring transepithelial electrical resistance (TEER) of the
tissues before and after the completion of the transport study using an EVOM2 epithelial
voltohmmeter (World Precision Instruments, Sarasota, FL). Previous studies have shown
that bovine nasal tissue explants were viable for up to 4 h after harvesting132, and all
experiments were performed within this 4 h window. A typical range of TEER values
reported in literature is 120 -180 Ω cm2 for bovine nasal mucosa132. Initial studies
showed average TEER values for bovine respiratory mucosa and olfactory mucosa were
~ 180 Ω cm2 and ~140 Ω cm2 respectively. Any values less than 100 Ω cm2 were
indicative of tissue damage and tissue explants with resistances less than 100 Ω cm2 were
discarded.
The effect of hydrophilic surface modification of QDs was tested using PEG-
QDs. For these experiments, the particles and tissues were prepared in an identical
manner as for the COOH-QDs, but tissues were exposed to PEG-QDs (0.05 mg/mL) in
KRB for 2 hr. The extent of PEG-QD uptake was compared to that for COOH-QDs by
comparing the amounts of QDs in the donor and receiver chamber and within the tissue
segment exposed to the donor chamber containing the QD dispersion.
Quantification of Quantum Dots
The uptake of QDs into the nasal tissues was studied by quantifying the particle
mass transferred into the tissues as a function of time. QDs have fluorescent properties
and several studies have shown the use of fluorescent spectroscopy to quantify quantum
dots. However, initial attempts to quantify QDs with this technique were unsuccessful
48
because of the high variation within repeated samples. Also, many of the concentrations
used in these tissue uptake studies were below the quantification limit of fluorescent
spectroscopy. QD emission spectra are sensitive to the size of the particles and slight
changes in the particle size changes their emission spectra133. For accurate quantification
using fluorescent spectroscopy methods extraction of intact QDs from the tissue samples
was required. During the course of a transport study and during the extraction procedure,
however, the size of the QDs could change, which would result in either over or under
prediction of the true QD content134. In order to avoid these discrepancies, several
researchers used alternate methods for quantification of QDs that are independent of
particle size, including atomic spectroscopy, mass spectrometry, and inductively coupled
optical emission spectroscopy (ICP-OES). Unlike fluorescence spectroscopy, ICP-OES
quantifies the elemental content (Cd, Zn, and Se) of QDs from which the total amount of
QDs in the sample can be quantified. Due to the high sensitivity of this technique, ICP-
OES analysis of Cd was used to determine the amount of nanoparticles in the tissue
samples.
ICP-OES is a powerful and popular analytical tool for the quantification of
metals. A schematic of the working principle of ICP-OES is shown in Figure 3.1. An
inert gas, argon, continuously flows through a source of concentric quartz tubes called a
torch where the argon gas is ionized by a radio-frequency (RF) generator (0.5 to 2 kW).

49
Figure 3.1 Schematic showing the working principle of ICP-OES135. Metal-containing samples are nebulized using a peristaltic pump and an auxiliary argon flow directly into the plasma. The metal-containing droplets are atomized, ionized and finally exited to higher energy levels. The characteristic emissions from metal ions are separated using a high precision prism and a photomultiplier tube detector captures the intensity of each emission.
The resulting ions and electrons interact with a magnetic field produced by an
induction coil (placed around the torch) to accelerate the ions and electrons in specific
annular paths. The ions and electrons collide with additional argon to generate a high-
temperature (5000 – 10000 K), inductively-coupled plasma (ICP). Metal-containing
samples are nebulized using a peristaltic pump and an auxiliary argon flow directly into
the plasma. The metal-containing droplets are atomized, ionized and finally exited to
higher energy levels. When returning to their ground state, metallic ions emit photons
characteristic of each specific element. These emissions are separated using a high

50
precision prism and a photomultiplier tube detector captures the intensity of each
emission. The measured intensity of the emission is proportional to the concentration of
the element, and elemental concentrations can be calculated using a standard curve
generated using known concentration standards.
The accuracy and efficiency of ICP-OES depends on various parameters
including the RF power, the argon gas flow rate into the plasma, the peristaltic pump rate,
and the auxiliary argon flow rate. These parameters were optimized for the detection of
cadmium, which emits characteristic photons at a wavelength of 226.5 nm136. The
intensities of the corresponding photon wavelengths were measured to quantify the
cadmium content. After the method was developed, it was tested for linearity using a
series of elemental cadmium standards (Sigma Aldrich, St. Louis, MO) The experimental
plan was to measure the concentration of the Cd present in the quantum dots contained in
the digested samples and thereby determine the QD concentration using stoichiometric
calculations. A Varian ICP-OES 720 ES system (Agilent Technologies, Santa Clara, CA)
was used for these studies.
Extraction of Cadmium from QDs
Extraction of cadmium from the core of the quantum dots is necessary in order to
accurately quantify QDs using ICP-OES. Because of their inert nature, QDs exhibit
greater thermal and chemical stability both in solution state and in vivo conditions
compared to other polymeric nanoparticles137-139. The procedure to extract cadmium from
the quantum dots was adapted from a previous report using an acid digestion method134.
QD-containing dispersions were digested with 70 %w/w nitric acid in borosilicate culture
test tubes for about 24 h at 80 °C maintained using a heat block, followed by dilution

51
with deionized water. The efficiency of the digestion method in extracting Cd was
investigated by correlating the theoretical Cd concentration based on the initial QD
dispersion concentration from aliquots of the QD dispersion to the Cd concentration
measured following acid digestion of the dispersion aliquot.
Extraction of Cadmium from QDs in Bovine Respiratory
and Olfactory Tissues
It was previously reported that a variety of mouse tissues could be completely
digested using nitric acid134. Adaptation of the nitric acid digestion method to extract Cd
from QDs in bovine nasal tissues was carried out using the same method as described in
above section. Bovine respiratory and olfactory tissues exposed to QDs were treated with
70 %w/w nitric acid for about 24 h at 80 °C and diluted with water before analysis using
ICP-OES. Since cadmium is present in very low concentrations in tissues, there is the
possibility of interference from endogenous Cd. In order to test for the interference of the
endogenous Cd, control bovine nasal tissues (without QD exposure) were treated under
similar conditions and analyzed using ICP-OES.
To extract cadmium from the QDs dispersed in the donor, receiver and washing
fluids obtained during transport studies, 0.2 mL of a QD donor sample, or 0.5 mL of a
receiver sample, 0.5 mL of a washing fluid were placed in borosilicate glass test tubes
and 1 mL, 0.5 mL and 0.5 mL of 70% w/w nitric acid were added, respectively, to the
test tubes. Tissue explants exposed to the QD dispersion were weighed and placed in a
borosilicate test tube and 1 mL of 70%w/w nitric acid was added to the tube. All the test
tubes with nitric acid were placed in a 80 °C heating block for 24 h. Following Cd
extraction, the samples were diluted to 5 mL with deionized water and analyzed for

52
cadmium content using the Varian ICP-OES 720 ES system. Each set of samples
included a blank (no QDs), a set of elemental Cd standards of known concentrations, a
positive control (0.05 mg/mL QD dispersion in KRB) and a control tissue (tissue not
exposed to QDs) as control samples.
Visualization of QDs in Tissues Using Confocal
Microscopy
The unique, size-dependent fluorescent spectral properties of QDs make them
good alternatives to fluorescent dyes for visualization. Compared to conventional dyes,
QDs have improved photo-stability and have broad excitation spectra and narrow
emission spectra124. Following the QD transport studies, the tissue sections were
visualized for the localization of QDs within the tissues using confocal laser scanning
microscopy.
Following a QD transport study, donor and receiver solutions were collected, and
the mucosal side of the tissue was washed with deionized water. The tissue sections
exposed to QDs were carefully cut and placed into a fixative (4% paraformaldehyde) for
24-36 h followed by treatment with a series of increasing concentrations of sucrose (10%,
20% and 30% w/v). The tissues were snapfrozen using liquid nitrogen and stored at
-20 ˚C. Vertical cross-sections (10 µm) were cut using a cryostat microtome (Lecia
Microm HM 505 E Cryostat, Buffalo Grove, IL) at -25 ˚C and stained with DAPI, a blue-
fluorescent nuclear stain. A Zeiss 710 confocal laser-scanning microscope (Oberkochen,
Germany) was used with a UV laser (405 nm) and an argon ion laser (458 nm) to excite
the DAPI and QDs, respectively. Emission bands of 460 ± 40 nm and 620 ± 20 nm were

53
used to capture DAPI and QD fluorescence, respectively. The captured images were
processed using ImageJ software (Freeware from National Institute of Health, USA).
Visualization of QDs in Tissues Using Transmission
Electron Microscopy (TEM)
In addition to examining the tissues for fluorescence indicating QD uptake,
additional visualization of the QDs in the tissues was attempted using transmission
electron microscopy. Since confocal microscopy is limited by the wavelength of the
excitation laser (~460 nm in these studies), visualization of individual, extremely small
QDs within the cells is difficult. On the other hand, resolution can be increased
substantially using TEM, which is not limited by the wavelength range of light, and
instead, is dependent on the energy of the electron beam. TEM was utilized to obtain
high-resolution images of electron-dense QDs within the cells140.
Similar to the confocal studies, following the completion of the transport studies,
the tissues mounted between the diffusion cells were washed with deionized water and
trimmed to the exposure area between the diffusion cells and further sectioned into
~1-2 mm3 sections which were chemically fixed with 2.5% glutarldehyde for ~ 24 h. The
tissues were rinsed with 0.2 M sodium glycocholate and treated with fresh 1 % OsO4
(prepared by adding 2 parts of 0.2 M sodium glycocholate to 1 part of 4% osmium and 1
part of 6% potassium ferocyanide) followed by treatment with 2.5% uranyl acetate. After
30 min, the tissues were dehydrated with a series of increasing acetone concentrations
(50%, 75%, 95% and 100%). Following complete dehydration, the tissues were placed in
epoxy resin (Epon-812TM, Sigma Aldrich, St Louis, MO) and molded at 70 ˚C for at least
2-3 days. Ultrathin sections (~ 80 nm) were prepared using an ultramicrotome (Leica EM

54
UC6 Ultramicrotome Mz6, Buffalo Grove, IL) and placed on a grid for TEM analysis. A
JEOL JEM-1230 TEM (Tokyo, Japan) was used to obtain images of the QDs in the tissue
sections.
Investigation of the Endocytic Pathways Involved in the
Uptake of Quantum Dots
Particulate matter is most commonly taken up into cells using energy-dependent
endocytic pathways141-142. However, due to the small sizes of the quantum dots, these
particles may be able to enter the tissues through energy-independent processes,
including transport through the paracellular spaces41, 71. The extent of passive QD uptake
was investigated by blocking all energy-dependent endocytic pathways using 0.18 µg/mL
2, 4-dinitrophenol (2,4-DNP) (Sigma Aldrich, St Louis, MO). The involvement of
specific endocytic pathways was identified by using chemicals reported to be specific
inhibitors for each pathway. The pharmacological inhibitors chlorpromazine143 (CPZ, 10
mg/mL), amiloride144 (10 µg/mL) and methyl-β-cyclodextrin145 (MBC, 5 mg/mL) have
been shown to inhibit the clathrin-mediated endocytosis, macropinocytosis and caveolae-
mediated endocytosis, respectively.
The inhibitor of interest was dissolved in KRB and after tissues were equilibrated
for 30 min with KRB, 1 mL of inhibitor in KRB was replaced in the donor and receiver
chambers for 60 min. This step allows the inhibitors to permeate into the tissues prior to
QD exposure. The donor solution was then replaced with 1 mL of a QD suspension (0.05
mg/mL) containing the inhibitor in KRB and the receiver chamber was replaced with a
fresh 1 mL of the KRB with inhibitor. Transport studies were carried out for an additional

55
60 min, and tissue samples along with donor, receiver and washing fluids were collected
and analyzed for QD content using the method described in previous section.
Statistical Analysis
Each experiment was repeated at least 3 to 6 times with tissues obtained from
different animals and the data are presented as mean ± standard deviation. Statistical
significance was tested using either one-way or two-way analysis of variance (ANOVA),
where appropriate. Multiple comparisons were conducted using the uncorrected Fischer’s
LSD test. A Student’s t-test was used when comparing two sample sets. Differences were
considered significant at p < 0.05. GraphPad Prism, Inc. (La Jolla, CA) software was
used to perform the statistical testing.
Results
Particle Size Analysis
Three lots of COOH-QDs and one lot of PEG-QDs of ~ 7nm size were purchased
as 1 mg/mL dispersions in water. Both COOH- QDs and PEG-QDs were observed to
show a bimodal size distribution with the majority (> 99.5 %) of particles of < 20 nm and
a small fraction (~0.1 - 0.4%) of larger size (~800 nm) (See Figure B.1 in Appendix-B).
These larger particles may be minor contaminants, most likely dust particles. Purchased
dispersions were diluted in KRB to a concentration of 0.05 mg/mL and the particle size
was measured (Table 3-1). The viscosity and refractive index values of the QD
dispersions used for particle size analysis were 0.933 cPs and 1.333, respectively. These
values were selected based on the assumption that the viscosity and refractive index of
the QD dispersions was similar to water at 25 °C. The larger particle sizes measured,

56
compared to the manufacturer’s specifications, may be the result of either not correcting
for the increased viscosity or altered refractive index of the QD dispersions. Aggregation
of the particles is also a possibility, but patterns typical of aggregate formation (multi-
modal size distribution) are not noted with the observed particle size distributions. Zeta
potential measurements revealed that the surfaces of the carboxyl-QDs and PEG-QDs
were negatively charged. Since PEG is a hydrophilic, neutral polymer, an increase in the
surface charge towards neutrality was observed when compared to the anionic COOH-
QDs.
Table 3-1 Quantum dot (~ 7nm) particle size distribution (n=3, mean ± standard deviation) and surface charge for 0.05 mg/mL samples in KRB.
Surface Group Lot Mean Particle
Diameter (nm) Zeta potential (mV)
COOH 1 ( LW074414A21104) 11.4 ± 0.4 -18.05 ± 2.05
COOH 2 (Not available) 12.8 ± 1.7 Did not test
COOH 3 (Not available) 14.5 ± 2.1 Did not test
PEG 1 (LW134414A23108) 14.6 ± 0.3 -9.23 ± 1.18
Quantification of Quantum Dots
The developed ICP-OES instrument operational conditions and measurement
parameters for quantification of Cd are provided in Table 3-2. The ICP-OES method was
calibrated using certified Cd elemental standard solutions (Sigma Aldrich, St. Louis, MO)
and the method showed good linearity over a range of 10 ng/mL to 1000 ng/mL of Cd (r2
> 0.999) (Figure 3.2). The lowest calibration concentration was 10 ng/mL and this was
taken as the quantification limit; any values below 10 ng/mL showed high variation and
were considered as zero values in the data analysis.

57
Table 3-2 Operating conditions and measurement parameters of Varian ICP-OES 720 ES.
Figure 3.2 Sample calibration curve for elemental Cd using ICP-OES (n=3). Calibration equation was Intensity (a.u) = 3.4984 * Cd Conc. (ng/mL), r2 = 0.9999.
0
1000
2000
3000
4000
5000
0 200 400 600 800 1000 1200
Inte
nsi
ty U
nit
s (a
.u.)
Concentration of Cd (ng/mL)
Sample Introduction
Auxiliary Argon Flow (L/min) 1.5
Sample Uptake (s) 30
Rinse Time (s) 10
Pump Rate (rpm) 15
Nebulizer Gas Flow (L/min) 0.75
Replicates 3
Plasma Properties
RF power (kW) 1.00
Plasma Gas Flow (L/min) 15.0
Cadmium (Cd) emission line (nm) 226.5136

58
The extraction of Cd from the core of the QDs was shown to be achievable with
digestion in nitric acid. Digestion of QDs (0.143 μg to 143 μg) with 1 mL of 70 %w/w
nitric acid for 24 h at 80 °C was shown to be sufficient to extract all the Cd from the core
of the QDs. Calculation of the QD concentrations from the Cd content in the digested
samples showed a good correlation to the theoretical concentrations of QDs with a good
correlation (r2>0.999) (Figure 3.3).
Figure 3.3 Correlation between theoretical QD concentrations versus ICP-OES measured QD concentration. A correlation equation of Intensity (a.u) = 0.9697 * Cd. Conc (ng/mL) was observed (r2 =0.9992).
The same acid digestion conditions used to extract Cd from QDs in KRB were
used to extract Cd from QDs present in nasal tissues. The average weight of the bovine
respiratory and olfactory tissues exposed to the QDs was 110 ± 24 μg and 80 ± 24 μg,
respectively. When representative bovine respiratory and olfactory tissues were exposed
0.00
0.02
0.04
0.06
0.08
0.10
0.12
0 0.02 0.04 0.06 0.08 0.1 0.12
Ca
lcu
late
d c
on
c o
f Q
D (
mg
/m
L)
Theoretical conc of QD (mg/mL)

59
to blank KRB for 2 h in the Navicyte® diffusion apparatus, followed by digestion in 1 mL
of 70 %w/w nitric acid at 80 °C, within 24 h a clear, faint yellowish color solution was
observed without any visible particulate content. This suggested that both respiratory and
olfactory tissues were completely digested. To investigate the endogenous Cd content in
the blank tissues, digested tissue samples were analyzed for Cd content with ICP-OES
and a negligible amount of endogenous Cd was observed.
To test if QDs present in the tissues can be digested completely using the acid
digestion conditions, known concentrations of QDs (data provided in Appendix-C) were
spiked with blank tissue samples and digested in nitric acid for 24 h at 80 °C followed by
analysis of samples using ICP-OES. A good correlation between the measured Cd
concentration and the theoretical concentration of added QDs was obtained. From Figure
3.4 and 3.5 it can be observed that the measured mass of QDs per gram of bovine nasal
respiratory and olfactory tissues correlated well (r2>0.99) with the theoretical loaded
mass of QDs. A sample calculation is shown in Appendix-D.
Figure 3.4 Correlation of the theoretical mass of Cd as added QD dispersion to blank respiratory tissues and the Cd concentration measured from digested samples of these tissues. A good correlation between added mass of QDs and measured mass of QDs was observed (y=0.997x, r2=0.999).
0
35
70
105
140
175
210
0 50 100 150 200
Me
asu
red
Ma
ss o
f Q
Dp
er
g o
f R
esp
ira
tory
Tis
sue
(μg/g
)
Calculated Mass of QD per g of Respiratory Tissue …

60
Figure 3.5 Correlation of the theoretical mass of Cd as added QDs to blank olfactory tissues and the Cd concentration measured from digested samples of these tissues. A good correlation between added mass of QDs and measured mass of QDs was observed (y=996x, r2=0.999).
From these studies it was observed that the developed acid digestion conditions
were sufficient to digest the bovine nasal tissues and to extract the Cd completely from
the core of the QDs. The lowest detectable concentration of QDs using the developed
ICP-OES method was found to be 0.143 μg/mL, which corresponds to 10 ng/mL of Cd.
QD Translocation into Nasal Respiratory and Olfactory
Mucosa
Following 120 min incubations of QD dispersions with respiratory and olfactory
tissues in Navicyte® diffusion cells, the uptake of COOH-QDs by the olfactory mucosa
was found to be ~2.5-fold higher compared to the respiratory mucosa (Figure 3.6).
0
75
150
225
300
375
450
0 75 150 225 300 375
Me
asu
red
Ma
ss o
f Q
Dp
er
g o
f O
lfa
cto
ryT
issu
e(μg/g
)
Calculated Mass of QD per g of Olfactory Tissue
(μg/g)

61
T im e (m in )
Am
ou
nt o
f Q
Ds
pe
r
gra
m o
f t
iss
ue
(u
g/g
)
30
60
120
0
5 0
1 0 0
1 5 0
R e s p ira to ry
O lfa c to ry
Figure 3.6 Comparison of QD uptake into full thickness olfactory and respiratory tissues after a 120 min incubation period. A) Column graph showing the mean and standard deviation of the groups Uncorrected Fischer’s LSD test showed significant difference (p<0.05) in uptake of QD between respiratory and olfactory tissues after 120 min incubation B) Box Whisker plots of the same data showing the median and range of the data. (n=3).
30 60 120
0
10
20
30
40
Time (min)
Am
ou
nt
of
QD
s p
er
gra
m o
f ti
ssu
e (
mg
/g)
Respiratory Tissue
Olfactory Tissue
*
A
B

62
The transfer of QDs (expressed as the percent of the original donor concentration
in Table 3-3) into the olfactory mucosa was increased from 1.1 % in 30 min to 4.4 % in
120 min. These findings suggest entrapment of particles within nasal tissues as soon as
30 min of exposure. Transfer into the respiratory mucosa remained low (~ 0.7 – 1.8 %)
throughout the incubation period. The uptake of QDs into respiratory and olfactory
tissues after 60 min exposure was found to be similar (~ 1.2 %), however exposure for
longer times (120 min) resulted in greater uptake into olfactory tissue (~ 4.4 %)
compared to respiratory tissue (~1.8 %). Approximately 1.2 – 5 % of the QDs were
recovered from the tissue washings which implies some QDs were adsorbed to the tissue
surface. Maximum adsorption of QDs was observed with respiratory tissues (~ 5%)
exposed for 120 min. The recovery of QDs (in µg) from the donor chambers, receiver
chambers, tissue washing fluids and tissues at all time intervals is summarized in Table 3-
4. Most of the QDs remained in the donor chamber, and a negligible mass of the QDs (<
0.11 µg) was recovered from the receiver chamber and tissue washings. The localization
within tissues was further studied using microscopy techniques described in following
sections. The overall recovery of QDs following transport studies was found to be greater
than 79 %.
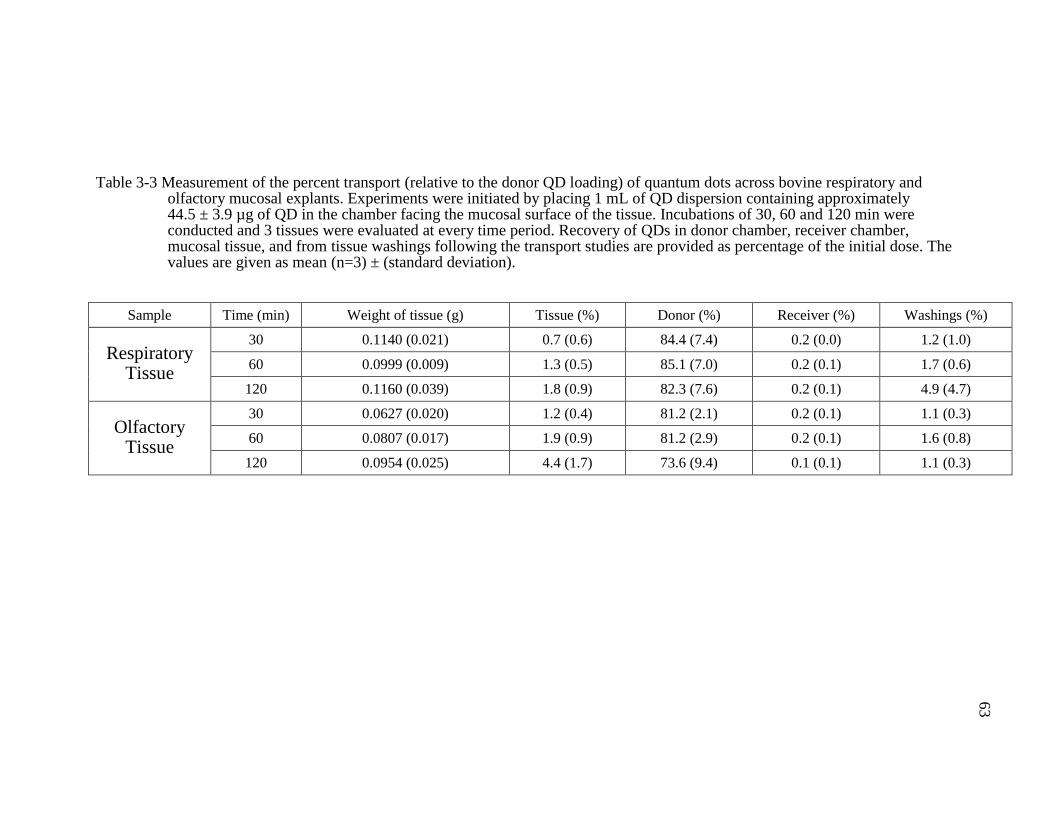
63
Table 3-3 Measurement of the percent transport (relative to the donor QD loading) of quantum dots across bovine respiratory and olfactory mucosal explants. Experiments were initiated by placing 1 mL of QD dispersion containing approximately 44.5 ± 3.9 µg of QD in the chamber facing the mucosal surface of the tissue. Incubations of 30, 60 and 120 min were conducted and 3 tissues were evaluated at every time period. Recovery of QDs in donor chamber, receiver chamber, mucosal tissue, and from tissue washings following the transport studies are provided as percentage of the initial dose. The values are given as mean (n=3) ± (standard deviation).
Sample Time (min) Weight of tissue (g) Tissue (%) Donor (%) Receiver (%) Washings (%)
Respiratory Tissue
30 0.1140 (0.021) 0.7 (0.6) 84.4 (7.4) 0.2 (0.0) 1.2 (1.0)
60 0.0999 (0.009) 1.3 (0.5) 85.1 (7.0) 0.2 (0.1) 1.7 (0.6)
120 0.1160 (0.039) 1.8 (0.9) 82.3 (7.6) 0.2 (0.1) 4.9 (4.7)
Olfactory Tissue
30 0.0627 (0.020) 1.2 (0.4) 81.2 (2.1) 0.2 (0.1) 1.1 (0.3)
60 0.0807 (0.017) 1.9 (0.9) 81.2 (2.9) 0.2 (0.1) 1.6 (0.8)
120 0.0954 (0.025) 4.4 (1.7) 73.6 (9.4) 0.1 (0.1) 1.1 (0.3)

64
Table 3-4 Measurement of the transport of quantum dots across bovine respiratory and olfactory mucosal explants. Experiments were initiated by placing 1 mL of QD dispersion containing approximately 44.5 ± 3.9 µg of QD in the chamber facing the mucosal surface of the tissue. Incubations of 30, 60 and 120 min were conducted and 3 tissues were evaluated at every time period. Recovery of QDs in donor chamber, receiver chamber, mucosal tissue, and from tissue washings following the transport studies are provided in the table. The values are given as mean (n=3) ± (standard deviation).
Sample Time (min)
Weight of tissue (g)
Amount in tissue (µg)
Amount in Donor (µg)
Amount in Receiver (µg)
Amount in Washings
(µg)
Total Mass of QDs recovered
(µg)
Total Recovery
(%)
Respiratory
Mucosa
30 0.1140 (0.021) 0.29 (0.2) 37.39 (1.3) 0.10 (0.0) 0.54 (0.4) 38.05 (1.3) 86.6 (8.2)
60 0.0999 (0.009) 0.54 (0.2) 37.70 (1.5) 0.10 (0.0) 0.78 (03) 38.74 (1.8) 88.2 (6.5)
120 0.1160 (0.039) 0.75 (0.4) 36.41 (1.0) 0.07 (0.1) 2.16 (1.9) 38.30 (2.4) 89.0 (11.7)
Olfactory
Mucosa
30 0.0627 (0.020) 0.49 (0.2) 36.09 (2.7) 0.11 (0.0) 0.48 (0.1) 36.93 (2.4) 83.7 (2.6)
60 0.0807 (0.017) 0.80 (0.4) 36.19 (4.2) 0.08 (0.1) 0.73 (0.4) 37.42 (4.1) 84.8 (2.6)
120 0.0954 (0.025) 1.87 (0.7) 32.52 (1.7) 0.07 (0.0) 0.48 (0.2) 34.69 (2.3) 79.1 (10.9)
65
The effect of surface properties of QDs on the extent of uptake into nasal mucosa
was studied by comparing the uptake of PEG-QDs and COOH-QDs. A 2 h exposure of
bovine nasal mucosa to PEG-QDs at the same concentration used for the COOH-QDs
(0.05 mg/mL) and at twice the concentration (0.1 mg/mL), did not show any uptake of
the PEG-QDs into either respiratory or olfactory tissues. This is significantly different
than the COOH-QDs which showed ~1 % to 5 % uptake into bovine nasal tissues (Table
3-3). More than 90% of the PEG-QDs remained in the donor chamber and ~5% were
recovered from the tissue washings. Since PEG-QDs did not show any uptake into the
nasal tissues, only COOH-QD uptake using imaging techniques was further pursued.
Visualization of QDs in Tissues Using Confocal and
Electron Microscopy
The fluorescent images of the respiratory and the olfactory tissues following
exposure to QDs are shown in Figures 3.7 and 3.8, respectively. The blue color in the
images shows the position of the nucleus in each cell stained with DAPI, and a clear
distinction between the intact epithelium (showed with green color lines in the figures)
and the submucosal region of the nasal tissues following exposure to QDs shows that the
integrity of the tissue remained unaffected for the entire incubation period. As additional
tissue viability evidence, the TEER values, which are a measure of the tissue integrity,
remained within an acceptable range for the entire period of the incubation (See
Appendix-E). These observations show that the transfer of the QDs into the tissue is not
simply a result of epithelial barrier disruption.

66
Figure 3.7 Confocal laser scanning microscopic images of respiratory tissues showing the
transport of QDs. Column I shows the nuclear stain (DAPI) channel. The
epithelial region is indicated by a solid line and the submucosal region by a
double arrowed line. Column II shows the QD channel, and column III shows
merged images from both channels. Each row of images is labeled with the
exposure time of the respiratory tissues to QDs or to a control samples with no
QD exposure. White arrows highlight the QD localization in the merged
image of the respiratory tissue. (Scale bar = 20 µm).
I II III
Control
no QD
exposure
30 min
60min
120 min
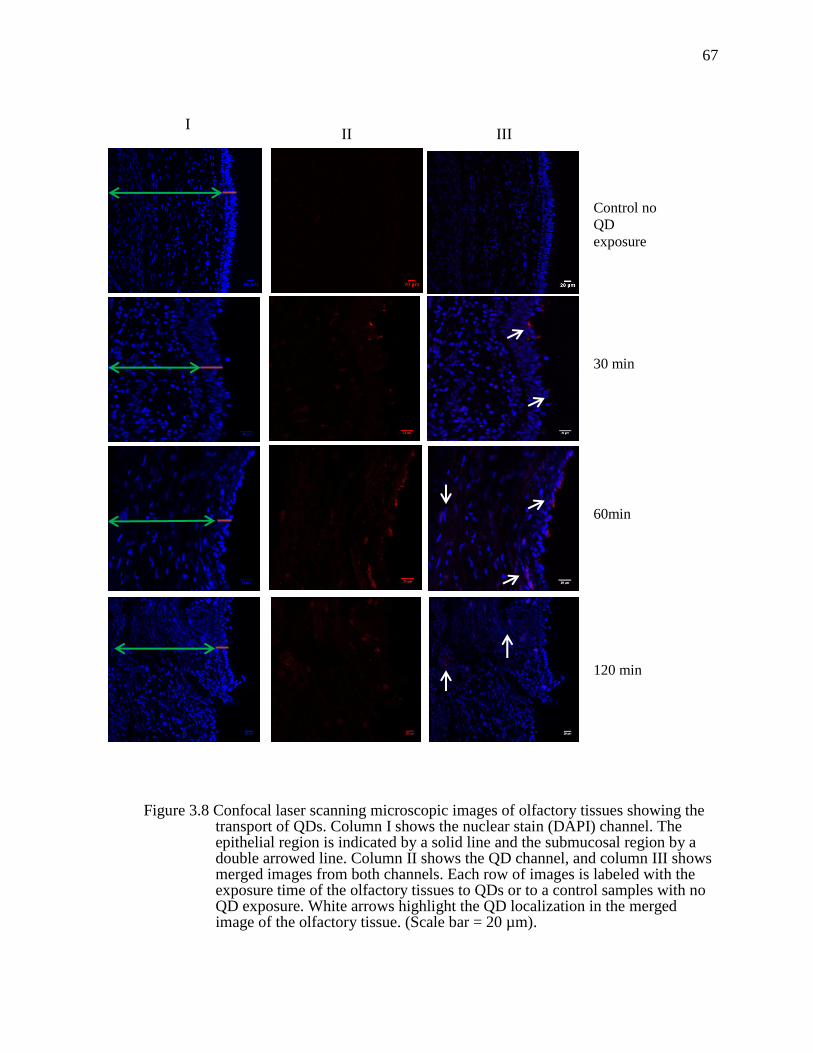
67
Figure 3.8 Confocal laser scanning microscopic images of olfactory tissues showing the transport of QDs. Column I shows the nuclear stain (DAPI) channel. The epithelial region is indicated by a solid line and the submucosal region by a double arrowed line. Column II shows the QD channel, and column III shows merged images from both channels. Each row of images is labeled with the exposure time of the olfactory tissues to QDs or to a control samples with no QD exposure. White arrows highlight the QD localization in the merged image of the olfactory tissue. (Scale bar = 20 µm).
I II III
Control no
QD
exposure
30 min
60min
120 min

68
The fluorescent signal intensity corresponding to the QDs (red color, Figures 3.7
and 3.8) in the epithelium and submucosal region of both the tissues gradually increased
over the 30 min to 120 min measurement intervals, demonstrating that the QDs were
continuously translocated into the respiratory and the olfactory tissues. As early as
30 min after incubation, QDs were visually observed in the submucosal regions of both
the respiratory and olfactory mucosa. The increased fluorescence intensity in the
submucosal region between 60 min and 120 min compared to the early 30 min incubation
shows that the QDs accumulate in these regions.
Transmission Electron Microscopy (TEM)
The TEM images displayed in Figures 3.9a & 3.10a show epithelial cell images
from respiratory and the olfactory samples exposed to quantum dots for 120 min. QDs
were observed in the intercellular spaces between the epithelial cells. At higher
magnification (Figures 3.9b & 3.10b) showing portions of two epithelial cells and their
associated intercellular junctions revealed the presence of QDs in various endocytic
vesicular structures with variety of morphologies. QDs were also present as small
aggregates in the cytoplasm. These results suggest that the uptake of QDs is primarily by
endocytic pathways, with some contribution from paracellular transfer.

69
Figure 3.9 Transmission electron micrographs of bovine respiratory epithelial cells exposed to COOH-QDs for 120 min. Distinct nucleus (N), mitochondria (M), cellular junction (CJ), golgi apparatus (G) can be observed. a: magnification x7000. b: Enlarged mucosal region (orange circle) showing dispersed, electron-dense particles in cytoplasm (green circles) and in vesicle structures (red circles) of the epithelial region (magnification x21000).

70
Figure 3.10 Transmission electron micrographs of bovine olfactory epithelial cells exposed toCOOH-QDs for 120 min. Distinct nucleus (N), mitochondria (M), cellular junction (CJ) can be observed. a: Image with magnification of x7000. b: Enlarged mucosal region (orange box) showing dispersed, electron-dense particles in cytoplasm (green circles) and vesicular structures (red circles) in the epithelial region(magnification: x24000).

71
Identification of Endocytic Pathways
Assessment of QD tissue uptake in the presence of inhibitors of endocytosis indicated
that the uptake of QDs into the nasal mucosa involves multiple pathways. Incubation with
2, 4-DNP a general inhibitor of ATP-dependent activities, resulted in a significant
reduction in the uptake of COOH-QDs into respiratory tissues (Figure 3.11). Similarly, in
the presence of specific endocytic inhibitors, either amiloride, CPZ or MBC, a reduction
in COOH-QD uptake was also observed. These findings suggest that the primary uptake
pathways of QDs in the respiratory tissue involve macropinocytosis, along with clathrin-
mediated and caveolae-mediated endocytic pathways. Energy-independent pathways in
the respiratory tissue do not appear to play major role in the uptake of ultrafine
nanoparticles. However, extremely small size QDs may have access to energy-
independent pathways through the intercellular spaces that are evident in the TEM
images (Figures 3.9a & 3.9b).
In the case of olfactory tissues (Figure 3.12), only chlorpromazine was able to
significantly reduce the uptake of the COOH-QDs, suggesting that the major endocytic
uptake pathway for these ultrafine particles in the olfactory mucosa might be via clathrin-
mediated endocytosis. The inclusion of any other inhibitor, including 2, 4-DNP, did not
reduce the uptake to a statistically significant level, which implies that energy-
independent pathways also exist for the uptake of quantum dots into the olfactory tissues.
TEM images (Figures 3.10a & 3.10b) show the presence of QDs in the intercellular
spaces between the olfactory epithelial cells, providing additional evidence for the
importance of these pathways in the olfactory mucosa.

72
A
B
Co
ntr
ol
Wit
h 2
,4 D
NP
Wit
h A
milo
r id
e
Wit
h M
BC
Wit
h C
PZ
0
2
4
6
8
Am
ou
nt
of
QD
s p
er g
ra
m
of
tis
su
e (
g/g
)
Figure 3.11 Uptake of QDs in the nasal respiratory tissue in the presence of inhibitors: 2,4-dinitrophenol (DNP), amiloride, methyl-β-cyclodextrin (MBC) and chlorpromazine (CPZ). A) Bar graph showing mean and standard deviation, * indicates significant difference between the control and inhibited uptake compared used Student’s t-test, n=3 or 6, p<0.05. B) Box Whisker plot showing the median and range of the same data.
Con
trol
With
2,4
DN
P
With
Am
ilori
de
With
MBC
With
CPZ
0
2
4
6
8A
mou
nt
of
QD
s p
er g
ram
of
tiss
ue
(µg/g
)
*
*
* *

73
A
B
Co
ntr
ol
Wit
h 2
,4 D
NP
Wit
h A
milo
r id
e
Wit
h M
BC
Wit
h C
PZ
0
5
1 0
1 5
2 0
Am
ou
nt
of
QD
s p
er g
ra
m
of
tis
su
e (
g/g
)
Figure 3.12 Uptake of QDs in the nasal olfactory tissue in the presence of inhibitors: 2,4-dinitrophenol (DNP), amiloride, methyl-β-cyclodextrin (MBC) and chlorpromazine (CPZ).A) Bar graph showing mean and standard deviation, * indicates significant difference between the control and inhibited uptake compared used Student’s t-test, n=3 or 6, p<0.05. B) Box Whisker plot showing the median and range of the same data.
Con
trol
With
2,4
DN
P
With
Am
ilori
de
With
MBC
With
CPZ
0
5
10
15
20
Am
ou
nt
of
QD
s p
er g
ram
of
tiss
ue
(µg/g
)
*

74
Discussion
Although the science of nanotechnology has advanced immensely in recent years,
the transport properties of nanoparticles into and across tissues, and specifically the nasal
mucosa are still not well understood. In these studies the uptake of quantum dots, a
model for ultrafine nanoparticles, into or across the bovine nasal mucosa was evaluated.
While it is unlikely that QDs will be effective drug delivery systems due to their heavy
metal contents, their unique, size-specific optical properties have encouraged their
investigation in a number of different applications in the biomedical and pharmaceutical
sciences124.
After 2 h of QD exposure to nasal tissues, the majority of the COOH-QDs were
recovered from the donor chamber with more limited accumulation in nasal tissues and
only negligible amounts of the QDs were transported through the whole thickness of the
tissues and entered the receiver chamber. Visualization of the COOH-QDs using confocal
microscopy also showed an accumulation of aggregates of QDs in the tissues. Unlike
small drug molecules, quantum dots are particles that are likely to be entrapped inside
vesicles in subcellular regions. They also appear to be trapped in the collagen fibers in the
submucosal regions of the nasal tissues, and this entrapment likely hinders the transfer of
QDs into the receiver side of the diffusion apparatus.
The red fluorescence signal intensity corresponding to the QDs observed in
epithelial and submucosal regions (Figures 3.7 and 3.8) suggest that a greater number of
particles accumulated in the submucosal region. These results are somewhat consistent
with previous report by Garzotto et al., who showed similar accumulations of carboxyl
surface modified QDs in the submucosal region, surrounding the blood vessels and nerve

75
bundles of the olfactory epithelium after 4 h of intranasal administration in CD1 mice71.
In a different study, Chen et al., showed accumulation of 20 nm and 100 nm carboxylate-
modified polystyrene particles in the submucosal regions of bovine olfactory and
respiratory mucosa after only 60 min of exposure38. Contrary to these findings, however,
in a recent study, Mistry et al. reported that, even after 90 min exposure of either 20 nm,
100 nm or 200 nm carboxylate - modified polystyrene particles to excised porcine nasal
mucosa. The majority of the particles either remained in the donor chamber or associated
with the apical edge of olfactory epithelium and none of the particles, irrespective of size,
showed accumulation in the submucosal region when visualized using fluorescence
microscopy40. These conflicting results could be due to use of different ex vivo tissue
models that may show different rate of particle uptake.
Similarly, there are reports showing transfer of 20 – 1000 nm nanoparticles into
systemic circulation following nasal exposure37, 146. Most of the current and previous
reports lead to the same conclusions that ultrafine nanoparticles accumulate in the
submucosal region of nasal tissues. Accumulation of nanoparticles in the nasal tissues
can be advantageous for drug and vaccine delivery. The submucosal region of the nasal
tissues is highly vascularized, innervated with olfactory neuronal cells (olfactory tissue)
and also contains lymphoid tissues. Drug and/or antigen encapsulated nanoparticles
accumulated in this region may release the encapsulated drug/vaccine into both lymph or
blood circulation and provide the desired therapeutic effect.
Since the olfactory mucosa is highly innervated with olfactory neuronal cells, any
accumulation of particles near these cells may enhance the potential to transfer the
nanoparticles to brain via olfactory neuronal pathways or through perineuronal spaces

76
along the neuronal axons. Some earlier studies showed that colloidal particles of
elemental metals including iron oxide82, manganese72, and gold73 reach the brain in small,
but potentially toxic quantities following nasal exposure.
Unlike COOH-QDs, when PEG-QDs of similar size were exposed to the bovine
nasal tissues, uptake into these tissues was considerably reduced compared to the COOH-
QDs. It is not surprising that PEG-QDs were not internalized into the cells, since the
more neutral, non-interactive PEG surface hinders interactions with proteins, other
macromolecules, and cell-based receptors in the mucosa. Particle interactions with
components in the nasal secretions or at the cellular surfaces lead to in-situ surface
modifications that may promote uptake by a variety of endocytic pathways. However,
PEG, being a large, flexible neutral polymer is believed to camouflage the surface of the
nanoparticle which decreases the particle interactions with the components of the
secretions and cell surfaces, and thus limits uptake via the endocytic pathways147.
Similar observations have been reported by other investigators148-149 , and it has been
repeatedly shown that surface chemistry plays an important role in cellular
internalization.
Researchers have previously shown that ultrafine nanoparticulate matter is
typically taken up by three major endocytosis processes45, 150: clathrin-mediated
endocytosis, caveolae-mediated endocytosis and macropinocytosis. Several studies report
additional uptake mechanisms for QDs, including those with carboxylated surface
characteristics, in other tissues. Zhang et al. showed that quantum dots (655 nm emission
QDs) surface modified with carboxyl groups were taken up into human epidermal
keratinocytes by caveolae/lipid raft- mediated endocytosis involving LDL receptors and
77
scavenger receptors145. Xiao et al. used similar, 655 nm emission QDs with carboxyl-
derived surfaces, and showed that the mechanism of uptake into human mammary cells
(MCF-7 and MCF-10A cells) was through clathrin-mediated endocytosis151. The results
from nasal mucosal uptake studies show that the COOH-QDs were internalized in the
respiratory tissues via multiple endocytosis pathways including clathrin-mediated,
caveolae-mediated endocytosis and macropinocytosis. QDs exposed to bovine olfactory
mucosa, in comparsion, were internalized primarily by clathrin-mediated endocytosis. It
is not uncommon for particles to be taken up via multiple pathways, for example in a
recent study reported by Jiang et al.152 the involvement of both clathrin-mediated
endocytosis and macropinocytosis was observed in the uptake of D- penicillamine coated
quantum dots (8 nm diameter) into HeLa Cells.
Currently, proposed mechanisms for nanoparticle uptake include the adsorption of
proteins/ligands from the extracellular environment on the nanoparticle surface that serve
as triggers for specific endocytic processes. Macropinocytosis has not been previously
reported as an uptake mechanism for carboxyl-surface quantum dots. However,
macropinocytosis is a non-specific endocytosis process in which cell membrane ruffling
causes formation of large troughs, which can subsequently form large size vesicles
(1-5 μm diameter) taken into the cells and it is very likely that QDs could be included in
the materials entrapped within these vesicles153.QD uptake by bovine respiratory tissues
was observed to involve macropinocytosis, but this pathway did not seem to play a
significant role in QD uptake into olfactory tissues. Similar results were observed in
previous studies with polystyrene nanoparticles38, 56. Macropinocytosis also seemed to
play less significant role in uptake of 40 nm and 100 nm carboxylate polystyrene particles

78
from bovine olfactory mucosa, whereas this pathway played a major role in uptake of
these nanoparticles in bovine respiratory mucosa38, 56. Though macropinocytosis is a non-
specific endocytic pathway, it is associated with actin-dependent ruffling of the plasma
membrane. Factors that increase actin polymerization have been shown to elevate
macropinocytosis154. While it is not clear that the absence of these factors in bovine
olfactory mucosa is responsible for the minor involvement of macropinocytosis in uptake
of QDs in olfactory mucosa compared to the respiratory mucosa, it may be one direction
of future investigations. Also, it was shown that antigen-presenting cells like dendritic
cells and macrophages of the immune system internalize solutes and antigens using
macropinocytosis144. The absence of NALT in the olfactory tissue compared to
respiratory tissue could be another reason for lower involvement of macropinocytosis in
the olfactory mucosa.
An interesting observation from the present study is that although multiple
endocytic processes were involved in QD uptake into the respiratory tissue, only ~ 2 % of
the exposed QD load was taken up into the tissue. In comparison, ~ 5% of the QD load
was internalized into the olfactory tissues, primarily via clathrin-mediated endocytosis. A
potential explanation for the increased uptake into the olfactory tissues may be due to the
involvement of additional non-energy dependent mechanisms, including greater
utilization of paracellular routes in olfactory tissues compared to respiratory tissues. The
structural differences between respiratory and olfactory mucosa, including the presence
of Bowman’s glands in the olfactory epithelium may make olfactory mucosa more
permeable compared to respiratory mucosa. This is also evident from the lower TEER
values measured in the olfactory mucosa (~140 Ω cm2) compared to respiratory mucosa

79
(180 Ω cm2). Surprisingly, PEG-QDs did not show any uptake into the olfactory tissues,
which calls into question the role of the passive intercellular pathways in the uptake of
nanoparticles by the olfactory tissue.
Conclusion
The uptake behavior of ultrafine nanoparticles (<20 nm) was demonstrated to be
dependent on the region of the nasal epithelium involved (respiratory vs. olfactory) where
the extent of uptake was observed to be greater in the olfactory epithelium compared to
the respiratory epithelium. While both respiratory and olfactory tissues seem to be
morphologically similar, the uptake pathways utilized by these tissues were found to be
different. In respiratory tissues, clathrin-dependent, macropinocytosis and caveolae-
dependent endocytosis process were all involved in the uptake of QDs. Whereas in
olfactory tissues clathrin-dependent endocytosis was the major endocytic pathway
involved in uptake of QDs. Additional energy-independent pathways appeared to be
active in the internalization of QDs into the olfactory mucosa, however the effect of
surface chemistry on these pathways requires further investigation. The significantly
higher uptake of ultrafine nanoparticles by the olfactory mucosa might be advantageous
for the delivery of therapeutic materials into the CNS, but this also suggests that there is
an increased risk to the CNS from the transfer of airborne nanoparticulate substances
deposited on olfactory region.

80
CHAPTER IV
DISTRIBUTION OF QUANTUM DOTS AFTER INTRANASAL
ADMINISTRATION IN MICE IN VIVO LIVE ANIMAL IMAGING
Introduction
A number of reports of research conducted in animals have demonstrated
improved delivery of therapeutic agents to brain from the nasal cavity when delivered via
particulate systems155-157. For example, Al-Ghananeem et al. reported higher brain
concentrations of diadanosine in rats after intranasal administration of diadanosine-
carrying chitosan microparticles (269 – 382 nm) compared to concentrations achieved
after intravenous or intranasal administration of diadanosine solution158. There are also
reports showing potential transfer of extremely small, non-therapeutic nanomaterials to
the brain following nasal exposure in animal models70, 72-73, 82, 159. For example, Elder et
al. reported a 3.5 fold increase in manganese levels in the olfactory bulb after a 12 day
inhalation exposure to 30 nm manganese oxide nanoparticles72. The direct nose-to-brain
delivery via olfactory and trigeminal neuronal pathways and convective transport through
perineuronal spaces along olfactory axon bundles are believed to assist in the transfer of
substances into the brain while bypassing the blood- brain barrier30, 71. It is likely that
ultrafine small nanoparticles, those with diameter less than 100 nm, can both be
internalized into epithelial cells and transported via neuronal pathways to reach the brain.
There are also reports showing the transfer of inert particles/microparticles from
the nasal cavity into the systemic circulation. Almeida et al. reported low levels (0.96 %
of administered dose) of 510 nm carboxylated polystyrene particles into the circulatory
system of rats within 10 min following intranasal administration160. In another study,

81
Alpar et al. also reported evidence of 830 nm carboxylated polystyrene microparticles in
blood of rats even after 24 h of intranasal dosing146. The highly perfused respiratory
mucosa and the presence of nasal associated lymphoid tissue may provide pathways for
the subsequent transfer of internalized particles to systemic circulation29. However, it is
difficult to conceive of such large microparticles passing through the small fenestrated
capillary openings (diameter ~13-17 nm161) in the nasal mucosa, thus uptake into the
lymphatic system by scavenger cells seems to be the more likely method for larger
nanoparticle/microparticle transfer into the systemic circulation.
In Chapter 3, it was shown that carboxylate surface modified quantum dots (7 –
10 nm) are taken up into the nasal mucosa and lodge within these tissues. Understanding
the fate and biodistribution of the nanoparticles accumulated within these tissues is
essential for the development of efficient targeted delivery systems. The purpose of these
experiments was to study the distribution of nanoparticulate matter from the nasal
mucosa in live animals using fluorescent imaging and computed tomography techniques.
Quantum dots with carboxyl surface modifications (COOH-QDs) were used as model
nanoparticulate systems. While it is unlikely that quantum dots will be effective delivery
systems due to their heavy metal contents, they are an excellent model for initial
investigations to characterize nanoparticle biodistribution patterns without the need for
further bioconjugation with fluorescent dyes. Since QDs are also available with a variety
of surface modifications, the effect of surface properties on the biodistribution from the
nasal cavity can also be studied. In the current study, the biodistribution of PEG-coated
QDs (PEG-QDs) was compared to the distribution of carboxylated QDs to probe some of
the initial, potentially surface-dependent, uptake mechanisms of these particles. An

82
attempt to visualize the uptake of fluorescent quantum dots from the nasal cavity in
presence of inhibitors of endocytosis mechanisms was the focus of these initial
investigations.
The ability to quantitatively or semi-quantitatively study the biodistribution of
intranasally administered nanoparticles is a difficult process potentially involving
invasive techniques enabling the measurement of the resulting particulate content in the
harvested organs. Simple, non-invasive in vivo imaging of biodistribution in preclinical
animal models is a rapidly emerging field utilizing techniques including optical
fluorescence imaging, computed tomography, magnetic resonance imaging and positron
emission tomography.
In Vivo Fluorescence Imaging
New whole-body animal fluorescence imaging techniques, especially those
utilizing the near infrared emission region (NIR), now enable the detection of agents with
intrinsic fluorescence properties or those tagged with biocompatible fluorescence dyes in
live animals. A number of optical imaging approaches that rely on fluorescence,
absorption, reflectance, or bioluminescence as the source of contrast have recently been
described162. In general, selected wavelength photons irradiate a whole animal, passing
through the tissues to excite the fluorescent contrast agent possibly deposited in the
tissue. The fluorescent agents absorb the photons and then emits a characteristic
fluorescence light, which travels back to the surface of the animal. The application of an
emission filter allows for the selected detection of the desired wavelength of emission. A
detector (typically a Charge-Coupled-Device (CCD) camera) captures the signal.
Detectors process the photon signals into a digital image. The resolution and sensitivity

83
of fluorescence bioimaging is limited due to the interference from the endogenous
tissues. The thick, opaque animal tissues absorb and scatter emitted photons and generate
strong autofluorescence, as a result, the intensity of the emitted signal is attenuated and
becomes diffuse or blurred163. Several components within the tissues including small
molecules (sugars, fatty acids, amino acids, nucleotides, ions, water), macromolecules
(proteins, phospholipids, RNA, DNA, polysaccharides), organelles, and cell membranes
collectively absorb and emit light in the ultraviolet through the visible wavelength region
of electromagnetic spectrum162. Absorption by tissue components in this wavelength
range limits effective light penetration. However, these interferences can be minimized
using light in the far-red or near-infrared wavelength ranges as the absorption of light in
this region is limited to deoxyhemoglobin, oxyhemoglobin, water and lipids162. As a
result, use of NIR agents in bioimaging has been used by several investigators and
commercial imaging technology companies, and NIR imaging agents including organic
NIR dyes and nanocrystals with intrinsic NIR emission properties have been developed
for animal imaging164.
Quantum Dots in Small Animal Fluorescence Imaging
In recent years, semiconductor quantum dots (QDs) have proven to be the best
NIR imaging agents for in vivo animal studies. Quantum dots with inherent fluorescent
emissions in the NIR region are readily available enabling their direct imaging without
the need for additional conjugation. NIR-QDs offer advantages over fluorescence
techniques for deep-tissue imaging because both scattering and autofluoresence from
endogenous tissues are reduced in the NIR region124. QDs have size-tunable optical and
electronic properties. The particle size determines the wavelength of fluorescence

84
emission. By altering the QD size and its chemical composition, fluorescence emission
may be tuned from the near ultraviolet throughout the visible and into the near-infrared
spectrum, spanning a broad wavelength range from 400-2000 nm137.
Micro-Computed Tomography (Micro-CT) Small Animal
Imaging
Unlike fluorescence/NIR imaging, CT offers imaging using three-dimensional
modalities that help to visualize the distribution pattern of high contrast, electron dense
material in the deeper tissue regions. A typical laboratory micro-CT scanner will consist
of a tungsten-anode X-ray tube coupled to a high resolution X-ray detector system. To
produce a truly 3D dataset using CT, X-ray projection views are acquired at hundreds of
equally spaced angular positions around the object of interest. These views are then used
to reconstruct a CT image, typically using proprietary image processing software
programs165. Several studies have reported the benefits of gold nanoparticles as contrast
agents in computed tomography studies in preclinical animal models166-168. The
commercial availability of gold in extremely small particulate sizes allowed for their use
in the investigation of nanoparticle biodistribution patterns from the nasal cavity using
micro-CT techniques.
Although fluorescence and CT imaging offer several advantages, interference
from endogenous fluorescence or attenuation of CT signals from soft tissues and bone
provides limitations to their overall use in live animal imaging. The weak signal
provided from single nanoparticles or small aggregates of nanoparticles remains difficult
to distinguish from these background signals, and, as a result, the observations made

85
using these techniques are primarily limited to stronger signals emitted from
accumulated, aggregates of nanoparticulate materials.
Materials and Instrumentation
Near-infrared dye, IRDye (IRDye® 800CW carboxylate, Ex/Em-774 nm/789 nm)
was purchased from LI-COR, Lincoln NE). Near-infrared quantum dots (NIR-QDs),
COOH-QDs (8 μM Qdot® 800 ITK carboxyl quantum dots in 50 mM borate buffer) and
PEG-QDs (2 μM Qtracker® 800 vascular labels in 50 mM borate buffer with PEG surface
coating) were purchased from Molecular Probes (Life Technologies Inc., Eugene, OR).
The hydrodynamic diameter of these NIR-QDs was ~ 20 nm and they have a broad
excitation range (405-760 nm) and narrow emission range with emission maxima of ~
800 nm. Gold nanoparticles (AuNPs) (Mvivo AU, colloidal suspension of gold
nanoparticles (200 mg/mL) in 10 mM phosphate buffered saline, core size 14±2 nm)
were purchased from MediLumine Inc. (Montreal, Canada). 2, 4-Dinitrophenol,
chlorpromazine, methyl-β-cyclodextrin and amiloride were purchased from Sigma
Chemical Co. (St.Louis, MO).
Animals
Male BALB/C mice were purchased from Harlan Sprague (Indianapolis, IN).
Animals were maintained on a twelve-hour light/dark cycle and allowed access to food
and water ad libitum. Mice were 5-7 weeks of age and weighed 20 to 25 g at the time of
the experiments. Animals were acclimated to the animal facility for at least 48 h prior to
use. All the experimental protocols were approved by The Institutional Animal Care and
Use Committee at the University of Iowa (protocol number: 1403044). Prior to dosing,

86
animals were anesthetized by intraperitoneal injection of pentobarbital (50 mg/mL, 20 μL
per animal).
Administration of Quantum Dots
For intranasal administration, anesthetized mice were placed on a lab bench in the
supine position with head elevated slightly and a 5 μL volume of QD dispersion
(30 μg/animal of COOH-QDs and PEG-QDs) was slowly dropped into one nostril of
each mouse using a micropipette. For intravenous administration, 50 μL of QD dispersion
(60 μg/animal of COOH-QDs) were administered as a bolus dose via a retro-orbital
injection in each mouse. For studies including inhibitors, a cocktail of methyl-β-
cyclodextrin (10 mg/mL), amiloride (0.1 mg/mL) and chlorpromazine (0.1 mg/mL) was
prepared in normal saline. The stock solution (12 μg/ μL) of COOH-QDs was diluted to 6
μg/μL with this cocktail of inhibitors solution and a 5 μL was administered into the
nostril of each mouse (30 μg/animal dose of COOH-QDs).
Initial animal imaging studies were performed using intranasal instillation of
IRDye® solutions. A 5 μg dose of IRDye® (5 μL volume of 1 μg/μL IRDye® solution in
normal saline) was instilled into one nostril of an anesthetized mouse in supine position.
For studying QD distribution, animals were divided into five groups (n=3 each group);
the first group of animals were administered COOH-QDs intranasally, the second group
were administered PEG-QDs intranasally and the third group of animals were
administered COOH-QDs intravenously, the fourth group received COOH-QDs in
endocytic cocktail inhibitor solution and the fifth group served as a control group, those
animals received an intranasal instillation of normal saline (5 μL ).

87
In Vivo Fluorescence Imaging
A Carestream In Vivo Multispectral Imaging system (In Vivo MS Fx Pro,
Carestream Health, Rochester NY) was used for obtaining the whole-animal fluorescence
images along with X-ray images. The multimodal imaging capability of the MS Fx Pro
imaging system enabled the acquisition of X-ray and fluorescence images from the
animals simultaneously. Super imposition of X-ray images with fluorescence images
enable the visualization of the anatomical locations of the fluorescence signals in the
mice. The Carestream In Vivo MS Fx Pro system operates on an inverted illumination
and detection platform. The animal resides in a temperature controlled translucent sample
tray/scanning box with an optional anesthesia supply feature. For fluorescence imaging, a
xenon excitation source is used to irradiate the animal from the bottom of the sample tray
and the emitted light is collected at a right inverted angle (90°) and detected by the CCD
detector. For X-ray imaging, the X-rays are irradiated overhead of the scanning box and
the mouse; the radiographic phosphor screen placed beneath the scanning box capture the
transmitted X-ray energy and sends a digitalized signal to the CCD camera placed at the
bottom of scanning box.
After instilling the test QD dispersion, anesthetized animals were placed in either
a prone (animal lies flat with head in upright position) or side position (animal lies on
side position with one side of the body resting on the tray) within the scanning box inside
the in vivo imaging system. The system was configured and a protocol was developed to
acquire an X-ray image as the first step with subsequent acquisition of a fluorescence
image. For X-ray imaging animals were irradiated with high energy X-rays (f-stop=2.86,
filter=0.4 mm, field of view=190 mm, acquisition time = 180 sec) and the resulting signal

88
was captured by the CCD camera and processed to an image file using Multimodal®
imaging software. For fluorescence imaging, the animals were irradiated with filtered
light (770 nm filter for IRDye®; 450 nm filter for NIR-QDs) and the fluorescence
emission was captured using an emission filter (830 nm for IRDye®; 790 nm filter for
NIR-QDs) with an acquisition period of 60 sec (f-stop=2.51, field of view=190 mm,
binning=4, acquisition time = 60 sec). Mice were imaged before (baseline images) and
immediately after (time 0) administration of the test sample and at 2, 4, and 24 h for
IRDye® and 1, 2, 5,7 and 24 h for NIR-QDs. The fluorescence signal intensity from the
deeper tissue regions is attenuated and the intensity of emission will be low and cannot be
captured by this system, so at each time point, images were acquired with mice in supine,
prone and side positions in order to improve signal sampling from various positions. For
later sampling times (>15 min), the mice were briefly anesthetized during imaging by
supplying isoflurane vapors (1-2 % in oxygen) through the nose cones inside the
scanning box.
After the 24 h measurment, animals were euthanized by injecting a lethal dose of
pentobarbital (50 mg/mL, 50 μL per animal) intraperitoneally. Various organs from the
euthanized mice, including the brain, olfactory bulb, liver, kidneys, heart, lungs and
spleen were collected, washed with 1X phosphate buffer saline (Sigma Aldrich, St.Louis,
MO), and imaged for QD fluorescence within these organs. To capture any QD
fluorescence from the remaining body tissues, each body was imaged in the supine
position. Also, to measure any remaining QD signal in the nasal cavity, an incision along
the nasal septum of each mouse was made such that the nasal cavity was exposed and the
animals were imaged in the prone position.
89
Image Analysis
Images were analyzed using ImageJ software (Openware from NIH). The raw
files (.bip image files) from the MS Fx Pro system were converted to 16-bit .tif files using
the Carestream Molecular Imaging software (Carestream Health, Rochester NY)
provided with the imaging system. These 16-bit .tif image files were opened using
ImageJ software and the fluorescence signal was pseudocolored with “red”. These
pseudocolored fluorescence images were co-registered with the corresponding X-ray
images to better visualize the anatomical location of the fluorescence signal from various
anatomical regions. For whole animal images and images following organ removal, a
region of interest (ROI) analysis was performed by manually drawing a fixed area ROI
(area= 55 mm2) to outline the fluorescence signal in the nasal region. The mean
fluorescence intensity in each ROI was quantified. The background mean fluorescence
intensity was measured by drawing three ROIs with the same area in a background area
where no fluorescence was visually observed, and that mean intensity was subtracted
from the mean fluorescence intensity from the QD signals. Similarly, ROI analyses were
performed by drawing ROI to outline each tissue and the mean fluorescence was
measured after subtracting the background intensity. The resulting ROI values were
plotted using Graphpad Prism software to semi-quantitatively describe the biodistribution
of the nanoparticles.
Distribution of Gold Nanoparticles: Micro-CT Imaging
The biodistribution of gold nanoparticles (AuNPs) following intranasal
administration was studied using Micro-Computed Tomography (Micro-CT). In one set
of experiments, two mice were administered 1 mg gold nanoparticles as a single dose via

90
the intranasal route (5 μL of 200 mg/mL) and one mouse received a 20 mg dose of gold
nanoparticles (100 μL of 200 mg/mL) as an intravenous injection via the retro-orbital
route. In another set of experiments, multiple doses of 1 mg AuNPs were administered to
mice (n=2) by administering a 1 mg (5 μL of 200 mg/mL) dose every hour for 4 h via the
intranasal route. Before instilling the dose, animals were anesthetized using an
intraperitoneal injection of pentobarbital (50 mg/mL, 20 μL per animal) for the first dose
and isoflurane inhalation (1-2 % in oxygen) for the 2nd, 3rd and 4th dose. The mice were
scanned with a Micro-CT scanner (Siemens Inveon High-Resolution CT scanner,
Munich, Germany). Two dimensional x-ray images of the mice were acquired by
rotating the source around the animal (50 kV, 500 mA, 99 microns, 360 rotation in 120
steps). The 2D images obtained were used to generate a 3D virtual model for the head
region and abdominal regions. Images were displayed in three orthogonal planes of the
mouse body placed in a prone position as shown in Figure 4.1 below. The transverse
plane (axial view) divides the mouse body into anterior and posterior regions; the sagittal
plane (lateral view) bisects the mouse body as a right and left side; the frontal plane
(dorsal view) divides the body into ventral and dorsal sections. These 3D models were
analyzed using ImageJ software. For animals receiving a single intranasal dose, CT scans
were acquired 24 h after dosing. For animals receiving multiple doses, CT scans were
acquired at 6 h and 24 h after administration of the first dose. For the control mouse
(intravenous dosing), a single CT scan was taken 24 h after administration. Animals
remained anesthetized during the CT scanning period (~30-60 min) using isoflurane (2.5
% for induction and 1-2% for maintenance).

91
Figure 4.1 Anatomical planes of mouse placed in prone position, showing transverse, sagittal and frontal planes169. Reproduced with permission.
Results and Discussion
IRDye® Distribution Following Intranasal Administration
The purpose of this pilot study was to investigate the feasibility of using an
optical imaging system for studying the distribution of the NIR-QDs. This study assisted
in the design of the experiments utilizing quantum dots with respect to the selection of
sampling time points, positions of imaging and ease of detection of the signal. IRDye®
800CW fluorescent dyes are widely used for optical imaging of tumors in animal
models170-171. These dyes are available with several functionalities, and the carboxylate
form of this dye has been described to be non-reactive within the body, hence it is widely
used in animal imaging studies as a control for understanding retention of the dye in
specific organs or locations in the body along with clearance of the dye itself172. The
structure, molecular weight and chemical formula of the IRDye is shown in Figure 4.2.

92
Figure 4.2 Structure of IRDye 800CW, chemical formulation: C46H50N2Na4O15S4, molecular weight of 1091.1 g/mol173.
Figure 4.3 is the montage of overlapped images of X-ray signal and IRDye
fluorescence signal in mice using prone and side views at 2, 4 and 24 h after intranasal
administration of the dye. High levels of IRDye were observed in the urinary tract and
digestive system of the mice within 2 h following nasal administration; an increase in the
fluorescence intensity in these regions was observed during the 24 h observation period.
The fluorescence intensity in the nasal region of the mice decreased during the 24 h
post-administration period, but from the images it can be observed that most of the
IRDye remained in the nose during this 24 h period. The decrease in the fluorescence
intensity in the nasal region suggests the absorption of the dye from the nasal mucosa into
the systemic circulation, and the strong fluorescence in the urinary system (urethra and
bladder) suggests the dye is primarily eliminated via the kidney.

93
Figure 4.3 Co-registered fluorescence and x-ray whole animal images of a representative mouse showing biodistribution of IRDye after intranasal administration. Green color represents the pseudo-colored NIR emission signal from the IRDye. Presence of IRDye in the nasal region can be observed in both dorsal and side views up to 4 h and only in the dorsal view at 24 h. In the 2 h side view image, a strong presence of dye in the throat region can be observed. The majority of the dye seemed to reside in the abdominal region and was likely associated with the digestive and urinary systems.
Prone view
Side View
2 h 4 h 24 h

94
A study by Marshall et al. also reported the accumulation of IRDye in the kidneys
and urinary system of rats following intravenous administration (5 mg/kg dose), along
with additional accumulation in the lungs, liver, spleen, and reproductive organs 174.
However in the present study, when the IRDye was administered intranasally
(0.25 mg/kg) in mice, no such accumulation in the lungs, liver and spleen was observed,
instead a diffuse signal from the abdominal cavity and urethra was observed which might
be the result of intranasal absorption into the systemic circulation followed by elimination
from blood through the urinary system. Also, the fluorescence signal from the throat
region 2 h after intranasal administration suggest that a portion of the IRDye was
swallowed or cleared from nasal cavity through mucociliary clearance into nasopharynx,
and subsequently into the GI tract. The IRDye from GI tract may also be absorbed into
the systemic circulation and eliminated through urinary system. Some portion of the
administered dye also appeared to be lost from the nose when the mice rubbed their paws
on their noses (fluorescence from the paws can be seen in Figure 4.3).
Distribution of COOH-QDs Following Intranasal
Administration
Figure 4.4 shows typical NIR fluorescence images co-registered with x-ray
images of whole mice (dorsal view) after intranasal and intravenous administration of
COOH-QDs (carboxylate-modified quantum dots with 800 nm emission). Fluorescence
intensities reported in arbitrary units (a.u.) in the nasal region as a function of time are
depicted in Figure 4.5. Following intranasal dosing, a strong fluorescence signal was
observed only in the nasal region of the mice. The intensity became stronger from 5 min
to 5 h post injection and eventually dissipated from 7 h to 24 h.

95
Figure 4.4 Composite fluorescence images co-registered with x-ray images of mice showing the distribution of COOH-QDs after intranasal (top row) and intravenous (middle row) administration. The control group received normal saline is shown in the bottom row. The red color represents the fluorescence signal from COOH-QDs. A gradual decrease of fluorescence intensity in the nasal region (yellow circle in top row image) from 5 min to 24 h can be observed after intranasal dosing, whereas intravenous dosing resulted in high fluorescence intensities in the abdominal region within 2 h. Gradual decreasing intensities can be seen up to 24 h. Sequential images for an individual mouse are provided in Appendix-F.

96
0 2 4 6 8
0
2 0 0 0
4 0 0 0
6 0 0 0
2 0 2 5
T im e (h )
Me
an
Flu
ro
sc
en
ce
In
ten
sit
y
(a
.u.)
C O O H -Q D s i.n .
C O O H -Q D s i.v .
N o rm a l S a lin e i.n .*
*
Figure 4.5 Mean fluorescence intensity from nasal regions (55 mm2 ROI; circled region shown in insert) of animals administered COOH-QDs via intranasal (i.n.), or intravenous (i.v.) routes. * represents statistical significance between i.n. and i.v. fluorescence intensities when tested with Student’s t-test at p<0.05 (n=3).
The dissipation of fluorescence intensity in the nasal cavity within 24 h might be
the result of redistribution of the nanoparticles into other regions of the body from the
deeper tissue regions of the nasal mucosa, but no measurable signal was observed in any
other anatomical region of the animal at the 24 h imaging session. Following intravenous
dosing, a weak fluorescence was observed initially (5 min) in the nasal region which
dissipated within 1 h of dosing (Figure 4.5). This might be due to close proximity of
retro-orbital sinus to the nasal regions, where a portion of the signal from the
nanoparticles administered to the eye could “spill over” and be measured in the identified
nasal ROI. In one of the animals (Mouse 1), a strong fluorescence was observed in eye
region following the retro-orbital injection (Figure F.3 in Appendix-F) for the entire

97
study period (24 h), this might be due to accumulation of the nanoparticles in the retro-
orbital sinus. Transfer of particles to the nasal region through the dorsal nasal vein from
the retro-orbital sinus may also occur and contribute to the initial fluorescence signal in
the nasal region following retro-orbital injection175. Strong fluorescence in the abdominal
region, likely liver and spleen regions of the mice following administration via the
intravenous route shows the typical systemic distribution pattern of the nanoparticles. The
cells of the reticuloendothelial system in the liver and the spleen effectively remove the
great majority of particles from blood176. Immune cells including macrophages,
specialized endothelial cells lining the sinusoids of the liver, spleen and bone marrow
may internalize administered QDs and present them to the reticuloendothelial system
(RES), specifically the liver and spleen. Intranasal administration of normal saline in a
control group of animals did not show any signs of fluorescence in either the nasal region
or in any other anatomical region, but enables the quantification of the baseline
autofluorescence from these tissues.
To investigate any accumulation of particles in the deeper nasal tissues, animals
were sacrificed 24 h after dosing and the nasal mucosa was exposed by making an
incision through the nasal septum and the nasal cavity was opened to prior to imaging
along the incision. A strong fluorescence signal in the nasal tissues was observed, which
can be seen in Figure 4.6 and Figure 4.7. The signal was quite diffuse, the exact location
of the nanoparticles was unclear. The fluorescence signal observed in the deeper nasal
tissues of animals following intravenous QD administration or in the control group was
very weak compared to the signal from animals administered QDs via intranasal route
(Figure 4.7).

98
These results demonstrate the accumulation of the nanoparticles in the deeper
nasal tissues over long (up to 24 h) post-exposure. To further investigate the distribution
of particles in other anatomical regions, various organs of interest (liver, spleen, lungs,
kidneys, heart, brain and olfactory bulb) were harvested from euthanized animals 24 h
after intranasal and intravenous dosing and the organs were imaged using the same
instrument settings as described for the whole animal imaging.
Figure 4.6 Fluorescence images co-registered with x-ray images of mice 24 h after COOH-QD administration. Upper panel shows images of anesthetized, live mice with intact nasal cavity and lower panel shows images of euthanized mice with exposed nasal cavity. Opening of the nasal cavity enabled visualization of the strong fluorescence signal from COOH-QD accumulation in the deeper nasal tissues following intranasal administration that was not visible in the mice with intact nasal cavities. Intravenous administration did not show nasal tissue accumulation, even in the exposed nasal cavity images. Images of all mice after opening nasal cavity are provided in Appendix-F.

99
Figure 4.7 Mean fluorescence intensities of COOH-QDs from the nasal regions of mice with intact nasal cavities and exposed nasal cavities after 5 min and 24 h following intranasal (30 ug/animal) and intravenous (60 ug/animal) administration. * represents statistical significance between i.n. and i.v. fluorescence intensities when tested using Student’s t-test at p < 0.05 (n=3).
Figure 4.8 shows the QD fluorescence images co-registered with the x-ray signal
from the harvested organs; images from the control animals are also included. Figure 4.9
shows the numerical comparison of the fluorescence intensities (a.u) from the harvested
organs based on treatment group. From these images it can be observed that the
distribution of QDs beyond the nasal cavity to more distant regions is negligible as the
fluorescence intensities from all of the organs, including brain and olfactory bulb, were
similar to the intensities measured from the control group. In contrast, quantum dots
administered via the intravenous route accumulated in the liver and spleen of the animals,
even up to 24 h after dosing. The transfer of particles to the liver and spleen following
intravenous dosing is expected, based on known distribution patterns for nano-and
microparticles to the reticuoloendothelial organs147.
5 m
in a
fter
dosi
ng
24 h
after
dosi
ng
Exp
osed n
asal
cav
ity
24 h
after
dosi
ng
0
1000
2000
3000
4000
5000
Mean
F
luo
rescen
ce In
ten
sit
y (
a.u
.)
Control (IN NS)
COOH-QDs i.v.
COOH-QDs i.n.
*

100
Figure 4.8 Fluorescence images co-registered with X-ray images from various harvested organs of mice 24 h following intranasal administration (A) and intravenous administration (B).

101
Figure 4.9 Mean fluorescence intensities from various organs of mice 24 h after intranasal (30 ug/animal) and intravenous administration (60 ug/animal) of QDs.* represents statistical significance between i.n. and i.v. fluorescence intensities when tested using Student’s t-test at p < 0.05 (n=3).
The imaging results suggest that the majority of the quantum dots remained in the
nasal tissues even after 24 h of intranasal administration. This is in good agreement with
observations of the in vitro transport of quantum dots through the excised bovine nasal
epithelium (Chapter 3), where during a 2h of study period, nanoparticles were observed
to accumulate in the epithelial and submucosal regions of respiratory and olfactory
epithelium, and in no cases were the particles observed to cross the full-thickness tissues
and transfer into the receiver chamber.
Intranasal uptake of nanoparticles (diameter < 100 nm) have been reported by
several investigators70, 72, 82, however there are very few studies showing evidence of
distribution of intact particles from the nasal mucosa to distant tissues. Brooking et al.
previously reported that small, 20 nm 125I-radiolabelled latex nanoparticles showed a
cumulative uptake of ~ 3.25% of the administered dose from the nasal mucosa of rats into
Liver
Lungs
Bra
in
Kid
neys
Sple
en
Hea
rt
Olf
Bulb
1
10
100
1000
10000
100000
Mean
Flu
roscen
ce In
ten
sit
y (
a.u
.)
COOH-QDs i.n.
Control (IN NS)
COOH-QDs i.v.*
*

102
the systemic circulation while larger, 100 nm particles showed ~2% transfer37. However,
the fate of the remaining dose was not discussed in the report; It is likely that the majority
of these nanoparticles remained in the nasal cavity for longer periods of time. Brooking et
al. used liquid scintillation gamma counters to quantify the concentration of radiolabeled
particles in blood and tissues. Gamma counters have a higher sensitivity and are able to
detect trace amounts of the radioactivity, whereas fluorescence imaging has limited
sensitivity and the quantification of the present COOH-QDs uptake using whole animal
images will be difficult. Brooking et al. also reported higher levels of radioactivity in the
liver (~0.05 % of administered dose) and kidneys (~0.1% of administered dose) 3 h after
intranasal instillation of 20 nm nanoparticles in rat, which is not in agreement with the
findings from this QD intranasal uptake study. QDs, which are ~20 nm might be expected
to reach the systemic circulation and further accumulate in more distant organs like the
liver and spleen due to their extremely small sizes and likely enhanced mobility. No such
distribution was observed even when the harvested organs were imaged (Figure 4.8) to
improve the accuracy. This may be the result of too low of an amount of QDs transferred
to be detected with the fluorescence imaging, whereas the radioactive labeling of the
particles enabled Brooking et al. to quantify amounts as low as 0.1 μg particle mass in
tissues.
Numerous studies have been reported about the nose-to-brain transport of
materials via the olfactory and trigeminal neuronal pathway pathways70, 72, 82. In one
study, Oberdorster et al. reported significant transfer of 35 nm 13C radiolabeled graphite
particles to the lungs, cerebrum, and cerebellum within 24 h after nasal inhalation in
rats70. However, these authors did not clearly differentiate whether the uptake into the

103
brain was primarily via neuronal pathways or, instead, via the systemic circulation. De
Lorenzo reported the transfer of silver-coated gold nanoparticles (~50 nm) from the
olfactory mucosa to the olfactory bulb of squirrel monkeys within 30-60 min of intranasal
administration using the olfactory neuronal pathway74. These investigators were able to
visualize individual gold particles in the cytoplasm of axons of olfactory neurons using
transmission electron microscopy73. In another study, Mistry et al., used confocal
microscopy and showed that larger, either 100 or 200 nm, fluorescent polystyrene
microparticles did not have access to the olfactory neuronal pathways in mice even after
repeated intranasal administration up to 4 days. Instead, the majority of the polystyrene
microparticles were accumulated in the olfactory and respiratory epithelium177.
The average diameter of the olfactory axons in 2-month-old rabbits (age
equivalent to 8 yr old human) was shown to be around 200 nm, and since the diameter of
the olfactory axons reduces as they pass through the basement membrane, the passage of
particles > 100 – 200 nm within the axon is difficult73. The QDs used in these studies are
smaller (~20 nm) compared to 50 nm gold nanoparticles used by De Lorenzo and 35 nm
carbon particles used by Oberdorster et al., which might enable relatively easy access to
olfactory neuronal pathways and the olfactory bulb. Unlike the previously discussed
reports, however, when the quantum dots were administered intranasally, no signs of QD
transfer to the brain or olfactory bulb were observed either using whole animal images or
images of the extracted brain. This finding again may be the result of the limited
resolution and sensitivity of fluorescence whole animal imaging. Utilization of electron
microscopy enabled DeLorenzo to visualize either individual particle or small aggregates
in the cells; such visualization with whole animal fluorescence imaging would be

104
difficult. However, all of the previously published studies used extensive microscopy
techniques including confocal and electron microscopy to qualitatively determine the
biodistribution of particles. The fluorescence whole animal imaging used in the present
study enabled an examination of the distribution of the intranasally administered
nanoparticles, both qualitatively and semi-quantitatively using a simple non-invasive
method and was able to show that majority of nanoparticles remained in the nasal cavity
after 24 h following intranasal administration.
Effect of Particle Surface Modifications on Intranasal
Uptake
The surface properties of nanoparticles also play a major role in determining their
uptake across the nasal mucosa177. In this study, the distribution of ~20 nm PEGylated
quantum dots (PEG-QD) was compared with the distribution of ~20 nm carboxylate
surface modified quantum dots (COOH-QD) following intranasal administration in mice.
The fluorescence images co-registered with x-ray images of mice which were
administered PEGylated QDs (PEG-QD) are shown in Figure 4.10 and the mean
fluorescence intensities in the nasal region as a function of time are depicted in Figure
4.11. From these images it appears that the majority of the PEG-QDs remained in the
nasal cavity for only 2h, whereas COOH-QD particles remained in the nasal tissues for
longer periods (up to 24 h).
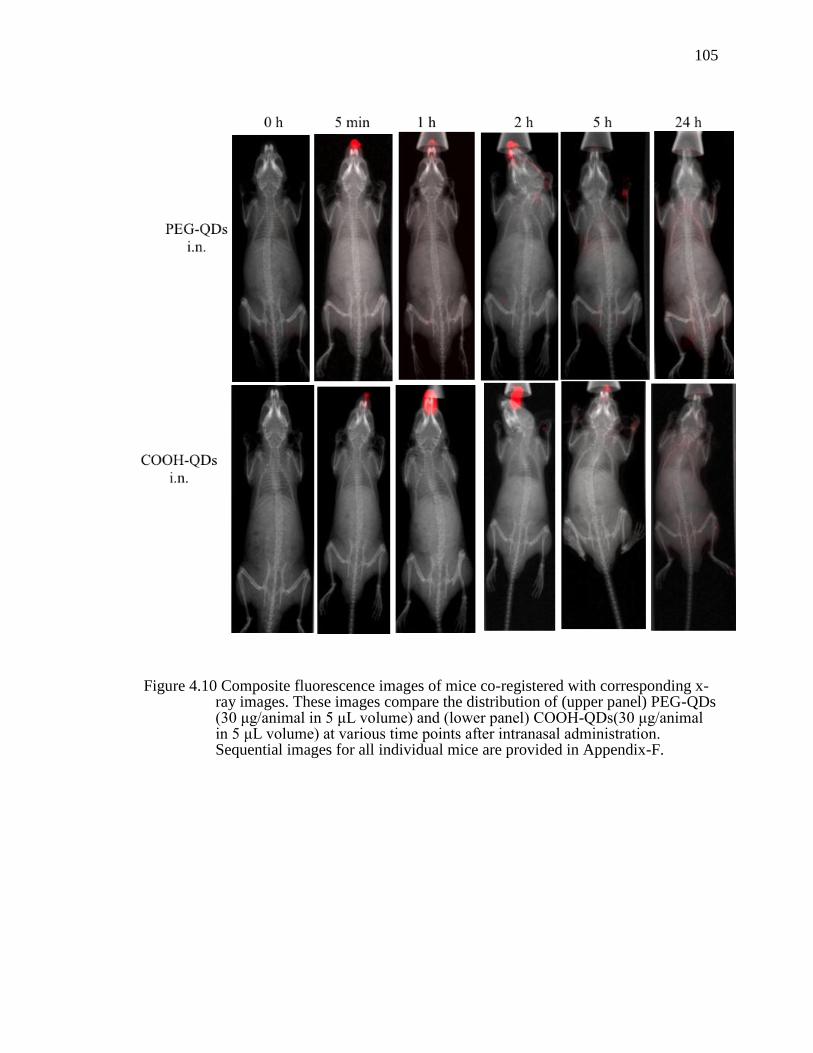
105
Figure 4.10 Composite fluorescence images of mice co-registered with corresponding x-ray images. These images compare the distribution of (upper panel) PEG-QDs (30 μg/animal in 5 μL volume) and (lower panel) COOH-QDs(30 μg/animal in 5 μL volume) at various time points after intranasal administration. Sequential images for all individual mice are provided in Appendix-F.

106
0 2 4 6 8
0
2 0 0 0
4 0 0 0
6 0 0 0
2 0 2 5
T im e (h )
Me
an
Flu
ro
sc
en
ce
In
ten
sit
y
(a
.u.)
C O O H -Q D s i.n .
N o rm a l S a lin e i.n .
P E G -Q D s i.n .
Figure 4.11 Comparison of mean fluorescence intensities from the intact nasal region of mice (from a 55 mm2 area ROI as shown in Figure 4.4) following intranasal administration of COOH-QDs and PEG-QDs at same dose of 30 μg/animal in 5 μL volume. (n=3).
Interestingly, no fluorescence signal was observed when the deeper nasal tissues
of mice receiving PEG-QDs were exposed by opening nasal cavity and directly
visualized after 24 h of dosing (Figure 4.12 and Figure 4.13), whereas a significant
accumulation of COOH-QDs was observed. It is likely that the PEG-QDs on the nasal
tissues may have been emptied into gastro intestinal tract through either mucocilary
clearance or swallowing, and are either in the GI mucosal tissues (difficult to detect using
whole animal fluorescence) or excreted. After 24 h, no fluorescence signal from PEG-
QDs was observed either in whole animal images or in the excised organs or in the nasal
tissues. This observation is in agreement with the previous in vitro studies, where PEG-
QDs showed negligible uptake into excised bovine respiratory and olfactory tissues
(Chapter 3.4.3), and the majority of particles remained in the donor chamber of the
Navicyte® diffusion apparatus.

107
Figure 4.12 Fluorescence images of mice co-registered with corresponding x-ray images 24 h after intranasal administration of PEG-QDS and COOH-QDs. The upper panels are images of mice with intact nasal cavities. Lower panels are images of mice following the opening of the nasal cavity along the septum prior to imaging. Images of all mice after opening nasal cavity are provided in Appendix-F.

108
Figure 4.13 Mean fluorescence intensities from the deeper nasal tissues of mice with intact and exposed nasal cavities 24 h after intranasal administration of PEG-QDs and COOH-QDs, at same dose of 30 μg/animal * represents statistical significance between COOH-QDs and PEG-QDs fluorescence intensities tested using Student’s t-test at p<0.05 (n=3).
Several previous studies have investigated the effect of surface modification of
micro/nanoparticles with PEG on the uptake of particles across the nasal mucosa178-179.
The results reported are inconsistent or unclear regarding whether PEGylation improves
the uptake of intact nanoparticles across the epithelial tissues. For example, a study
reported by Vila et al. showed improved antibody levels in the blood of intranasally
administered tetanus toxoid when delivered in PEG-PLA microparticles (~ 196 nm and
1500 nm) compared to the administration of the toxoid in PLA particles of similar size148.
There was no clear evidence in the report if the PEG-PLA particles were taken up to a
5 m
in a
fter d
osing
24 h
afte
r dosi
ng
Expose
d nas
al c
avity
24 h
afte
r dosi
ng
0
1000
2000
3000
4000
5000M
ean
Flu
ore
scen
ce In
ten
sit
y (
a.u
.)
Control (IN NS)
COOH-QDs i.n.
PEG-QDs i.n.
*
*

109
greater extent or whether the dissociated/released tetanus toxoid was taken up as free
protein, instead. In comparison, the observations from the present study using PEG-QDs
(~10 - 20 nm) showed no such uptake/presence of these ultrafine nanoparticles when they
were either incubated with bovine nasal tissue explants or after their intranasal
administration in mice. This disagreement in results may be related to the presence of
unentrapped antigen (tetanus toxoid) on PEG-PLA microparticles (~200 and 1500 nm)
surfaces which potentially may trigger immune cells including M cells in the NALT and
assist in internalization of these microparticles into nasal epithelial cells. Whereas in the
present study, the surfaces of QDs might be completely passivized by PEGylation which
might result in improved stealth properties with resulting lack of uptake by any cells.
There are also additional reports that show negligible or reduced uptake of PEGylated
nanoparticles across other cells. An in vitro investigation by Kumaraswamy et al.
reported that 45 – 70 nm polystyrene nanoparticles with PEGylated surfaces showed
almost no uptake into microglial cells following 1 h incubation with neural cells whereas
carboxylated surface functionalization showed significantly higher uptake into those
cells149. This result is somewhat in agreement with the findings from presenty study using
PEG-QDs administered intranasally in mice, which showed no accumulation in deeper
nasal tissues compared to COOH-QDs.
Passivation of nanoparticles by surface modification with a hydrophilic PEG is a
widely used technology to avoid rapid uptake by scavenger macrophages or other cells of
the immune system or RES. The PEGylated particles are believed to avoid non-targeted,
non-specific binding of proteins which can result in their increased circulation time in
blood147. It has been shown that charged nanoparticles, especially cationic nanoparticles

110
interact with proteins present on the cell surfaces and can trigger endocytic uptake which
increases uptake into the epithelial cells through the vesicular pathways45. PEGylation of
nanoparticles may decrease these interactions with proteins and thus the extent of uptake
of these particles into epithelial cells through endocytic pathways. This suggests that
most of the PEG-QDs in the nasal cavity likely cleared rapidly from the nasal cavity via
mucociliary clearance rather than being transferred into tissues.
Mechanistic Evaluation of COOH-QD Uptake from Nasal
Tissues Using Whole Animal Imaging
In above sections it was shown that the majority of the intranasally administered
COOH-QDs accumulated in the deeper nasal tissues in mice. In chapter 3 using an ex
vivo bovine nasal tissue model, it was shown that the pharmacological inhibitors
chlorpromazine (CPZ), methyl- β- cyclodextrin (MBC) and amiloride inhibited clathrin-
mediated endocytosis, caveolae-mediated endocytosis and macropinocytosis pathways
affecting the uptake of COOH-QDs across bovine nasal tissues, respectively. The
involvement of these endocytic pathways was investigated in live animals using NIR
imaging techniques along with the administration of a cocktail of inhibitors of
endocytosis to halt the these uptake processes. A 5 μL volume of inhibitor solution
containing 0.1 mg/mL CPZ, 0.1 mg/mL amiloride and 10 mg/mL MBC was administered
to one nostril of each mouse. After 15 min, 30 μg of COOH-QDs dispersed in the
inhibitor cocktail was administered into the same nostril. Figure 4.14 shows the
fluorescence images of whole animals at various time points after dosing and Figure 4.15
shows a graphical representation of the mean fluorescence intensities of COOH-QDs in
the nasal region as a function of time.

111
Figure 4.14 Whole animal fluorescence images of mice co-registered with corresponding x-ray images comparing the distribution of COOH-QDs (top row) in the presence of a cocktail of endocytic inhibitors (bottom row) at various time points after intranasal administration. The red fluorescence in the nose region represents signal from QDs. Inclusion of inhibitors resulted in no difference in QD fluorescence signal when compared to QDs without inhibitors. Sequential images for all individual mice are provided in Appendix-F.

112
0 2 4 6 8
0
2 0 0 0
4 0 0 0
6 0 0 0
2 0 2 5
T im e (h )
Me
an
Flu
ro
sc
en
ce
In
ten
sit
y
(a
.u.)
C O O H -Q D s i.n .
N o rm a l S a lin e i.n .
In h ib ito r c o c k ta il + C O O H -Q D s i.n .
Figure 4.15 Mean fluorescence intensities from nasal regions (from a 55 mm2 area ROI as shown in Figure 4.4) of live animals in presence and absence of inhibitor cocktail. No difference in fluorescence signal from QDs in presence of inhibitor cocktail is observed. (n=3).
The nanoparticles appeared to remain in the nasal cavity for 2 h to 5 h and then
from 7 h to 24 h the fluorescence signal from the particles slowly dissipated. The
endocytic inhibitors did not appear to affect the transport behavior of COOH-QDs in the
nasal region. The fluorescence images of mice that received inhibitor cocktail were
observed to be similar to the images of mice which received COOH-QDs without
inhibitors.
From Figure 4.16 and Figure 4.17, it can be observed that 24 h of post
administration, particles accumulated in the deeper nasal tissues, even in presence of
inhibitors. These results are somewhat different from the results from in vitro studies,
where uptake of particles into the nasal tissues was shown to be negligible in presence of
these inhibitors. A possible explanation for these inconsistent results may be an

113
insufficient sustained concentration of inhibitors used in whole animal studies where
endocytic inhibition was not sustained over the 24 h imaging interval. The inhibitors
administered to the mice may have been eliminated via mucociliary clearance or, more
likely, were absorbed into the systemic circulation. In the case of in vitro studies, the
concentration of the inhibitor was maintained throughout the entire study period.
Figure 4.16 Images of mice showing the fluorescence from the deeper nasal regions 24 h after intranasal administration of COOH-QDs in the presence and absence of an endocytic inhibitor cocktail. The upper panels are images of mice with intact nasal cavities. Lower panels are images of mice following the opening of the nasal cavity along the septum prior to imaging. Images of all mice after opening nasal cavity are provided in Appendix-F.
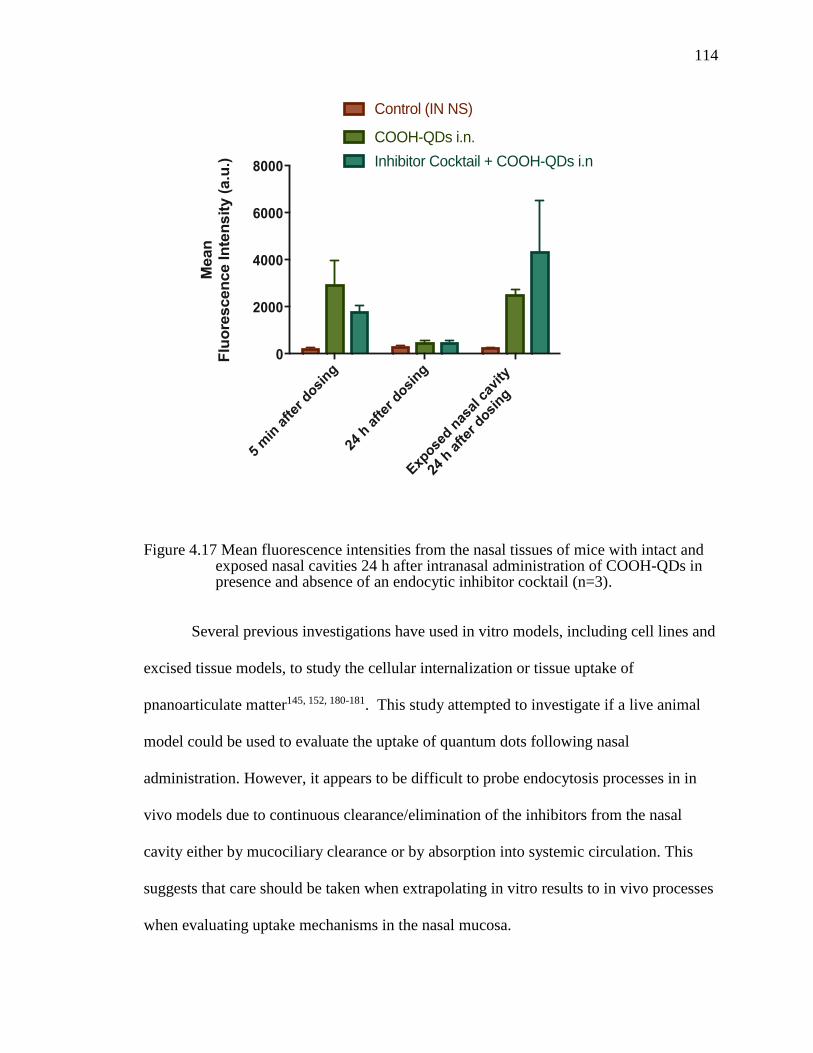
114
Figure 4.17 Mean fluorescence intensities from the nasal tissues of mice with intact and exposed nasal cavities 24 h after intranasal administration of COOH-QDs in presence and absence of an endocytic inhibitor cocktail (n=3).
Several previous investigations have used in vitro models, including cell lines and
excised tissue models, to study the cellular internalization or tissue uptake of
pnanoarticulate matter145, 152, 180-181. This study attempted to investigate if a live animal
model could be used to evaluate the uptake of quantum dots following nasal
administration. However, it appears to be difficult to probe endocytosis processes in in
vivo models due to continuous clearance/elimination of the inhibitors from the nasal
cavity either by mucociliary clearance or by absorption into systemic circulation. This
suggests that care should be taken when extrapolating in vitro results to in vivo processes
when evaluating uptake mechanisms in the nasal mucosa.
5 m
in a
fter
dosi
ng
24 h
after
dosi
ng
Exp
osed n
asal
cav
ity
24 h
after
dosi
ng
0
2000
4000
6000
8000
Mean
F
luo
rescen
ce In
ten
sit
y (
a.u
.)
Control (IN NS)
COOH-QDs i.n.
Inhibitor Cocktail + COOH-QDs i.n

115
Translocation of Gold Nanoparticles Measured Using
Micro-CT
Using quantum dots, it was shown that these extremely small nanoparticles
accumulate in the deeper nasal tissues following nasal administration. However, due to
the limitations of poor spatial resolution and the diffusive signal strength of the
fluorescence whole animal imaging technique, it was difficult to determine the exact
anatomical location or the dynamics of tissue distribution of the quantum dots following
intranasal administration. An alternative attempt to visualize the distribution of
intranasally administered ultrafine nanoparticles in live animals was made using
computed tomography (CT) and readily available, 15 nm gold nanoparticles (AuNPs).
Figure 4.18 shows micro-CT images of the mouse head region in three-
dimensional axial, dorsal and lateral views, obtained 24 h after administration of a single
dose of AuNPs. Particles were observed in the deeper middle and superior turbinate
regions of the nasal mucosa. Reconstruction of the head region in 3D mode (Figure 4.19)
revealed the presence of AuNPs as an accumulated mass in the anterior nasal tissues;
small amounts of the nanoparticles were also observed to transverse into the posterior
region of the nasal cavity and into the superior turbinate region of the nasal mucosa.
Nanoparticles in the superior turbinate region were observed to be in closer proximity to
the olfactory bulb, however, there was no clear indication of the presence of particles in
the olfactory bulb or in any regions of the brain. This finding is similar to observations
from the fluorescence imaging of mice administered COOH-QDs. The high contrast
signal from the micro-CT images enabled the visualization of the discrete location of the
nanoparticle mass unlike the nasal cavity and associated tissues.

116
Figure 4.18 In vivo micro-CT imaging of a mouse head region 24 h after intranasal (A) and intravenous (B) administration of 15 nm gold nanoparticles. Axial (left column), dorsal (middle column) and lateral views (right column) are depicted. Yellow colored arrows show the accumulation of gold particles in the nasal conche following intranasal administration, whereas no such accumulation was observed in the same regions after intravenous administration.

117
Figure 4.19 In vivo micro-CT 3D lateral view of the head regions of a mouse showing the accumulation of AuNPs in anterior and posterior regions of the nasal cavity (yellow arrows) 24 h after intranasal administration.
Following intravenous administration of AuNPs, a greater contrast was observed
in the blood vessels, spleen, heart and liver of the animals (Figure 4.20), which are the
primary RES organs involved in the uptake of particulate matter from blood. Immediately
after the retro-orbital injection of AuNPs, the mice exhibited a bluish skin color that
remained over the following 24 h period. This change is due to presence of gold
nanoparticles in the blood, trapped in the endothelium, or leached into interstitial spaces.
No accumulation of particles was observed in the deeper nasal tissues of animals
following intravenous administration, however excised organs including the liver, spleen,
and heart appeared bluish color compared to the control organs, which also support the
conclusion of particle transfer to these organs.

118
Figure 4.20 In vivo micro-CT images of mouse in axial (left), dorsal (middle) and lateral (right) views 24 h after intravenous administration of AuNPs. High contrast CT signal in heart (yellow arrow), liver (purple arrow) and spleen (blue arrow) can be observed.

119
In a follow up study in order to increase the total dose of gold nanoparticles, mice
were given four intranasal doses of AuNPs every 1 h and imaged 6 h and 24 h after the
first dose. Six hours post administration of the first dose accumulated masses of gold
particles were visible as high contrast regions in the deeper nasal tissues of mice (Figure
4.21a). A gradient of accumulation of the gold particles from the anterior to posterior
regions of the mouse nasal mucosa showed the gradual transfer of particles from the
nostrils to the deeper nasal tissues. However, a 24 h-post administration micro-CT image
(Figure 4.21b) showed that the majority of the nanoparticles has disappeared from the
nasal tissues while a small quantity remained in the anterior and posterior regions of the
nasal mucosa (Figure 4.21). There was no evidence of the gold nanoparticles transferring
or remaining in the brain or other head regions of the mice. A previous report by De
Lorenzo showed that ~50 nm gold particles can be transported to the olfactory bulb
following intranasal administration and appeared as small aggregates74. It is likely that
the smaller gold particles (~15 nm) should also have access to this pathway and most
likely, some portion of the gold nanoparticles may be either distributed to parts of the
brain or distant tissues as small aggregates or individual particles and are not detectable
using the micro-CT technique. While, no evidence of high contrast discrete signal from
gold nanoparticles was observed either in throat region or the GI, some portion of the
gold nanoparticles might have also been cleared from the nasal cavity through
mucociliary clearance to the GI tract.

120
Figure 4.21 In vivo micro-CT images of the head region of a mouse 6 h (A) and 24 (B) after multiple dosing of AuNPs via the intranasal route. Accumulation of AuNPs (colored in red) in the nasal mucosa can be observed.

121
While both fluorescence imaging and micro-CT imaging are both non-invasive
methods used for studying ultrafine nanoparticle uptake in whole animals, the signal from
quantum dots in whole animal fluorescence images is very diffuse and scattered, which
increases the difficulty of identifying the discrete anatomical locations of the
nanoparticles. Additional imaging of harvested organs is able to confirm that QDs
accumulate in a variety of tissues and organs. In comparison, micro-CT enabled
visualization of the nanoparticle accumulation in animal organs without the need for
organ isolation and the signal obtained with micro-CT was more resolute compared to the
diffuse signal from the fluorescence images. The distribution and elimination of ultrafine
nanoparticles from the nasal tissues is better demonstrated using AuNPs with micro-CT
compared to QDs and NIR imaging, yet with regard to the understanding of drug-
containing ultrafine nanoparticles distribution, it is unlikely that gold nanoparticles will
be a suitable matrix for drug delivery, thus further use of these nanoparticles may have
limited application in drug delivery.
Conclusions
From these studies it can be concluded that extremely small nanoparticles are
transferred from the nasal cavity into the posterior turbinate region and in close proximity
to the olfactory bulb. Both NIR imaging and micro-CT imaging were useful tools for
visualization of in vivo nanoparticle distribution. However, neither of these techniques
was able to visualize a discrete signal associated with nanoparticles in the brain or other
parts of the body, due to the inability to capture the signal from small aggregates or
individual nanoparticles.

122
The accumulation of nanoparticles in the nasal tissues is dependent on the
physical properties of the particles, where surface modifications providing negatively-
charged particles (COOH-QDs) increased the uptake of nanoparticles from the nasal
cavity compared to neutral, PEGylated surface modifications.
These studies suggest that ultrafine nanoparticles instilled in the nose can transfer
to posterior regions of the nasal cavity and accumulate in the tissues associated with the
turbinate regions. The accumulation of extremely small nanoparticles in the turbinate
regions can result in release of the encapsulated cargo into the local external
environment, which may eventually result in transfer to the brain via olfactory neuronal
pathways, including the perineuronal spaces, or to other distant tissues following
absorption and transfer to the systemic circulation. There is great interest in transnasal
vaccine delivery using nanoparticulate systems and the accumulation of these
nanosystems in and around lymphatic vessels in the deeper nasal mucosa may result in
the release of antigens from the particles, transfer to circulating immune cells, and uptake
into the lymphatics for subsequent antigen processing and antibody production.

123
CHAPTER V
UPTAKE OF MICROEMULSIONS FROM NASAL TISSUES
Introduction
In most current drug delivery application, nanomaterials are assumed to be solids
composed of single or multiple materials. There are other nano-sized systems that exist in
liquid form, and some of these systems have also been evaluated for their potential as
drug delivery systems. Microemulsions, for example are two phase liquid dispersions
where the droplet sizes of the emulsified materials are typically 10 – 100 nm.
Microemulsion dosage forms have been developed for nasal administration, and
numerous reports exist regarding their success in improving nasal bioavailability182-187.
Unlike solid nanoparticles, drugs in microemulsions do not require a nanoparticle support
for conjugation, instead these systems form drug-loaded microemulsions spontaneously
while simultaneously increasing the solubulization capacity of drugs in the
microemulsions188-189. Microemulsions are thermodynamically stable, isotropic,
translucent systems consisting of a lipid phase, and an aqueous phase with surfactants and
stabilizers at the interface between phases. The dispersed phase in a microemulsion is
typically 10-100 nm in size190. The high lipid content in microemulsions enable improved
bioavailability of lipophilic drugs with low water solubility and, also unlike macro-
emulsions, preparation of microemulsions use relatively simple methods without the need
of high sheer mixing190. These advantages encouraged investigators to explore
microemulsions as alternative delivery systems for various routes of administration
including the oral188, 191-192, transdermal193-194, ocular195-196 and intranasal197-201. Several
studies have shown improved delivery of drugs across the nasal mucosa to the brain when

124
delivered in microemulsions184-187. However, very little information is known about the
mechanisms of drug transfer from microemulsions across the nasal mucosa or the
interaction of the microemulsions with the mucosal tissues. Some researchers have
suggested that the oil droplets in microemulsions act as drug reservoirs and improve drug
absorption by maintaining a constant concentration gradient182-183. There are also reports
that describe components of the microemulsions as permeation enhancers which can
improve the absorption of drugs by altering the mucosal membrane permeability202. It is
well known that particulate matter is taken into cells by endocytic mechanisms, and the
previous chapters in this dissertation describe the endocytic uptake of small, solid
nanoparticles like quantum dots. Similar to solid nanoparticles, the dispersed phase in
microemulsions could act as a fluid-phase nanoparticle with greater mechanical
flexibility, which may change the droplets/particles access to various endocytic pathways.
However, the involvement of any energy-dependent endocytic pathway in the uptake of a
drug-rich dispersed phase of a microemulsion has not been previously investigated. The
purpose of this work is to investigate pathways involved in the transfer of drug from an
oil-in-water microemulsion across the bovine nasal mucosa to evaluate the importance of
the material phase (solid vs liquid) on the uptake of nanomaterials.
Figure 5.1 Chemical structure of diazepam203.

125
Diazepam, (7-chloro-1-methyl-5-phenyl-3H-1,4-benzodiazepin-2-one) is a
benzodiapine derivative with anti-anxiety, sedative, hypnotic and anticonvulsant
properties. It is a lipophilic compound with low water solubility (0.05 mg/mL), a pKa of
3.4 and a logP of 2.8203. The structure of diazepam is shown in Figure 5.1. Currently,
intravenous or rectal administration of diazepam can be used in the initial treatment of
status epilepticus204. Even though these methods are effective, more convenient
administration would improve patient comfort and potentially enable more rapid
treatment. Diazepam intranasal delivery has gained the attention of several investigators
recently. A variety of formulation approaches are reported in literature for intranasal
delivery of diazepam, including biodegradable PLGA nanoparticles65 and
microemulsions199. Acorda Pharmaceuticals developed a proprietary diazepam-
containing microemulsion formulation using diethylene glycol monoethyl ether,
propylene glycol monocaprylate, methyl laurate, N-methyl-2-pyrrolidone, ethanol and
water as inactive ingredients205. In a pilot clinical study in healthy human volunteers, the
intranasal administration of microemulsion formulation resulted in similar bioavailability
results of diazepam to that of commercial rectal formulation. However, the formulation
did not show bioequivalent results when administered in epilepsy patients and further
development has been discontinued206. Also, intranasal administration of the
microemulsion resulted in moderate to severe adverse events like nasal discomfort, and
lacrimation205. Another investigational intranasal diazepam formulation (NRL-1)
developed by Neurelis, Inc. using proprietary technology showed ~ 97% absolute
bioavailability (compared to intravenous diazepam administration) in healthy human
volunteers in a pilot clinical study with good tolerability and reasonable variability207.
126
Though the composition of the new NRL-1 formulation is not disclosed, the company has
previously reported another diazepam intranasal formulation consisting of permeation
enhancers like glycofurol, which showed poor tolerability and moderate to severe nasal
discomfort in healthy human volunteers208.
The nasal delivery of diazepam is challenging because of its poor water solubility,
which limits the amount of diazepam able to be administered into the nasal cavity and the
resulting amount absorbed across nasal mucosa due to the low concentration gradient.
Although, use of permeation enhancers and microemulsions show good bioavailability of
diazepam after intranasal administration, the components may cause temporary or
permanent discomfit to nasal mucosa, which further reduces the tolerability and safety of
these formulation.
Materials and Methods
Diazepam, isopropyl myristate, sorbitol, polysorbate 80 (Tween 80), and 2, 4-
dinitrophenol (2,4-DNP) were obtained from Sigma Aldrich (St. Louis, MO). High
performance liquid chromatography (HPLC) grade methanol and water were purchased
from Fisher Scientific (Pittsburgh, PA).
Composition and Preparation of Krebs Ringer Bicarbonate buffer (KRB) is
described in previous chapter (Chapter 3).
Solubility Studies
The solubility of diazepam in individual components of the microemulsion was
measured by adding an excess amount of diazepam to individual scintillation vials, each
containing 2 mL of either water, KRB, isopropyl myristate, Tween 80, 70 %w/v sorbitol
solution. The vials were mixed vigorously using a vortex mixer (Analog Vortex Mixer,

127
Fisher Scientific, Hampton NH) for 2 min, followed by shaking at 100 rpm using a
VWR®
incubating orbital shaker (Henry Troemner LLC, Thorofare, NJ) for 48 hours at
25 °C. The contents of the vials were centrifuged for 15 min at 3000 g using an
Eppendorf®
AG5810R centrifuge (Hamburg, Germany). The resulting supernatant was
filtered using Millex®
-GS (0.22μm) filter units into HPLC vials and analyzed using the
HPLC method described in above section.
Microemulsion Formulation
The selection of microemulsion system was based on obtaining an oil-in-water
system with dispersed phase diameters <50 nm in size. In a series of papers published by
Ktistis et al.209 and Attwood et al.210, the properties and phase behavior of o/w
microemulsions prepared using polysorbate/sorbitol/IPM/water systems were described.
The key factors influencing the formation of microemulsion were identified to be the
IPM fraction and the polysorbate to sorbitol ratio. In an initial study, Attwood and Ktistis
reported that a 1:2 ratio of polysorbate 60: sorbitol at 40% by weight with 2.7 – 6.7 %
IPM by weight resulted in largest region of stable microemulsion formation with 20-30
nm diameter dispersed phase210. In another report, Ktistis et al., showed that replacement
of polysorbate 60 with polysorbate 80 a higher ratio of sorbitol was needed. A ratio of 1:
2.5 polysorbate 80/sorbitol at 40% by weight with 2.7-6.7% IPM resulted in largest
region of stable microemulsion region in phase diagram209.
Preparation of the microemulsion was modified slightly as published by Attwood
and Ktistis210. The composition of the microemulsion is shown in Table 5-1.
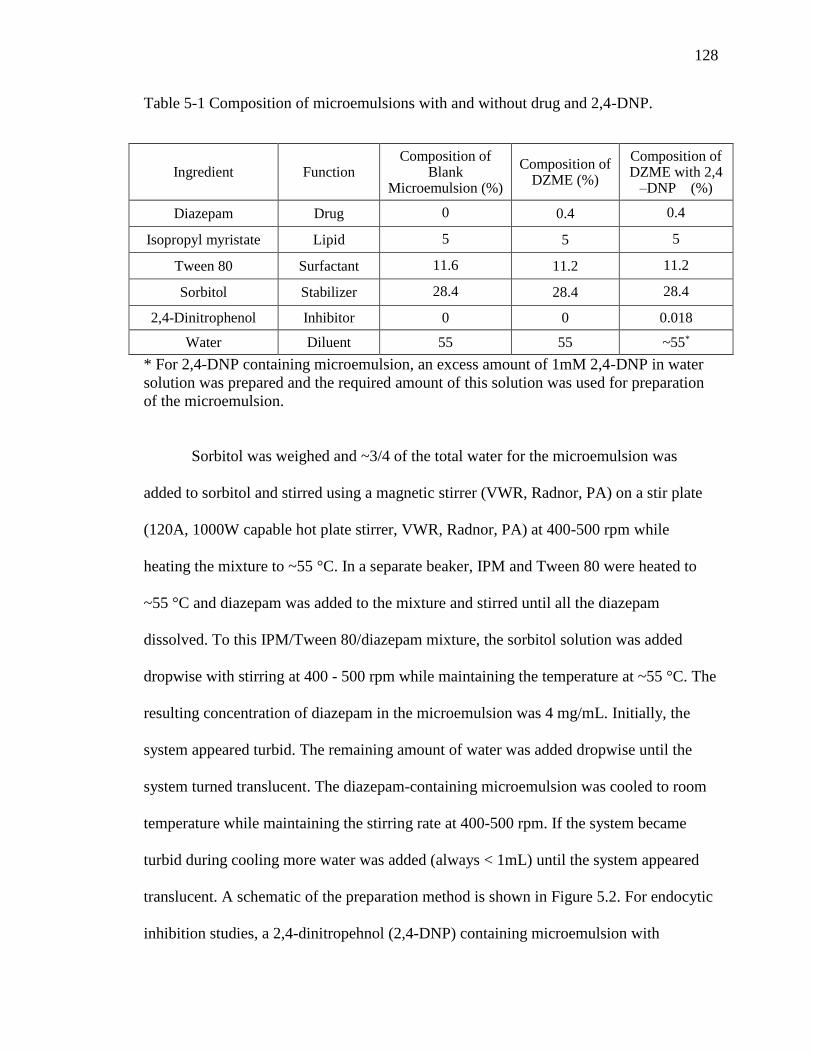
128
Table 5-1 Composition of microemulsions with and without drug and 2,4-DNP.
Ingredient Function Composition of
Blank Microemulsion (%)
Composition of DZME (%)
Composition of DZME with 2,4
–DNP (%)
Diazepam Drug 0 0.4 0.4
Isopropyl myristate Lipid 5 5 5
Tween 80 Surfactant 11.6 11.2 11.2
Sorbitol Stabilizer 28.4 28.4 28.4
2,4-Dinitrophenol Inhibitor 0 0 0.018
Water Diluent 55 55 ~55*
* For 2,4-DNP containing microemulsion, an excess amount of 1mM 2,4-DNP in water
solution was prepared and the required amount of this solution was used for preparation
of the microemulsion.
Sorbitol was weighed and ~3/4 of the total water for the microemulsion was
added to sorbitol and stirred using a magnetic stirrer (VWR, Radnor, PA) on a stir plate
(120A, 1000W capable hot plate stirrer, VWR, Radnor, PA) at 400-500 rpm while
heating the mixture to ~55 °C. In a separate beaker, IPM and Tween 80 were heated to
~55 °C and diazepam was added to the mixture and stirred until all the diazepam
dissolved. To this IPM/Tween 80/diazepam mixture, the sorbitol solution was added
dropwise with stirring at 400 - 500 rpm while maintaining the temperature at ~55 °C. The
resulting concentration of diazepam in the microemulsion was 4 mg/mL. Initially, the
system appeared turbid. The remaining amount of water was added dropwise until the
system turned translucent. The diazepam-containing microemulsion was cooled to room
temperature while maintaining the stirring rate at 400-500 rpm. If the system became
turbid during cooling more water was added (always < 1mL) until the system appeared
translucent. A schematic of the preparation method is shown in Figure 5.2. For endocytic
inhibition studies, a 2,4-dinitropehnol (2,4-DNP) containing microemulsion with

129
diazepam was prepared using water which contained 1mM 2,4-DNP in solution. A blank
microemulsion was prepared using the same procedure without the addition of diazepam.
The prepared microemulsion systems were stored for not more than 24 h at ambient
temperature.
Figure 5.2 Schematic showing the preparation of diazepam-containing microemulsion. Microemulsions were prepared by adding the required amount of a sorbitol solution of known concentration to a mixture containing IPM, Tween 80, and diazepam in a stirred beaker at 55 °C followed by cooling to room temperature.

130
Characterization of Microemulsions
The mean diameter of the dispersed phase in the blank and diazepam-loaded
microemulsions was measured using dynamic light scattering (Nicomp Particle Sizer,
Model 380 ZLS, Santa Barbara, CA). Size measurements were made at room temperature
using a HeNe laser at a wavelength of 632.8 nm, viscosity of 0.933 cPs and refractive
index of 1.333. Approximately 3 mL of the microemulsions were transferred into a
disposable cuvette (Fisher Scientific, Hanover Park, IL) and placed into the sample
holder followed by a 2 min equilibration period. The neutral density filter was adjusted
until the scattered intensity oscillated around a setting point of 300 kHz. Data processing
software (Nicomp® ZW380, Ver. 1.51) was used for data analysis; channel width,
detector sensitivity, and baseline were automatically adjusted. The zeta potential of the
microemulsion system was measured using a Malvern Nano ZS Zetasizer
(Worcestershire, UK). Approximately 2 mL of the microemulsion were placed into a
disposable folded capillary cell (DTS1070, Malvern, Worcestershire, UK). Measurements
were made using freshly prepared microemulsion prior to any exposure to nasal tissues.
Preparation of Bovine Nasal Tissues
Bovine nasal respiratory and olfactory tissues were obtained from a local abattoir
and prepared as explained in Chapter 3. Small pieces of fresh respiratory and olfactory
tissue was cut and immediately placed in 4% formalin solution for histological
evaluation. Remaining tissues were transported to lab in cold KRB maintained on ice.
Uptake Studies of Diazepam-containing Microemulsions
The underlying cartilage from the mucosal tissues was peeled off, and the fresh
tissues were used immediately for transport studies. Respiratory and olfactory mucosal

131
tissues were mounted between the donor and receiver chambers of a Navicyte® diffusion
chamber system (Harvard Apparatus, Holliston, MA), such that the mucosal side of the
tissue faced the donor solution and transport took place from the mucosal to the
submucosal surfaces. The membranes were equilibrated for 20-30 min with 1 mL of pre-
warmed (37 ˚C) KRB in both donor and receiver chambers. The tissues were kept aerated
with carbogen (95% O2 + 5% CO2) at a rate of 2-4 bubbles/second, and the temperature
was maintained at 37 ˚C throughout the experiment. Aeration helps with mixing the
contents of the chambers and supplies oxygen to the tissues. Transepithelial electrical
resistance (TEER) was measured at the beginning and at the end of transport studies
using an EVOM volt-ohmmeter (Model: EVOM2; World Precision Instruments Inc.,
Sarasota, FL). TEER values below 100 Ω*cm2 were indicative of a compromise in
mucosal integrity and those tissues were excluded from use.
After equilibration, buffer in the donor chamber was replaced with 1 mL of the
diazepam-loaded microemulsion (4 mg/mL) and 1 mL of fresh KRB buffer in the
receiver chamber. The transport of diazepam across the tissues was measured by
withdrawing aliquots (200 μL) from the receiver chamber at regular intervals (20, 40, 60,
80, 100 and 120 min). The aliquots removed were replaced with fresh buffer (200 μL) to
maintain a constant volume in the receiver chamber. After 120 min, a 200 μL aliquot of
microemulsion from the donor chamber was taken to determine the amount of diazepam
that remained in the donor chamber. All samples were refrigerated until further analysis.
Total recovery of diazepam after the 120 min transport study was calculated by
adding the amount remaining in the donor chamber and the cumulative amount recovered
from the receiver chamber. Any unaccounted diazepam was assumed to be present

132
within the mucosal tissues. A control study using a synthetic artificial membrane was
performed to justify this assumption and to determine if any diazepam loss was due to
experimental technique. A synthetic, polytetrafluoroethylene (PTFE) membrane of
~ 90 μm thickness was selected as the artificial membrane to eliminate transport across
the membrane so any diazepam transfer or loss would not be due to failures in the
apparatus or sampling error. The PTFE membrane was too thin and did not fit snugly
between the diffusion chambers, hence it was wrapped around a silicone rubber (Silastic®
membrane) of 1.27 mm thickness to avoid any loss of material due to leakage. PTFE
wrapped Silastic® membranes were placed between the donor and receiver chambers of
the Navicyte® diffusion chambers and 1 mL of 4 mg/mL diazepam microemulsion was
added to the donor side and 1 mL of fresh KRB to the receiver side. The transport of
diazepam across the artificial membranes was measured using the same methods as
described above. Total diazepam was measured after 120 min by summing the amount of
diazepam recovered from donor chamber and the cumulative amount of diazepam
recovered from the receiver chamber.
In another control study, diazepam was dissolved in isopropyl myristate and the
uptake of diazepam from the isopropyl myristate solution and the microemulsion were
compared. In this experiment, instead of adding 1 mL of diazepam-containing
microemulsion to the donor chamber, 1 mL of diazepam dissolved in isopropyl myristate
(4 mg/mL) was added to the donor chamber, and the transport of diazepam across the
bovine nasal tissues was measured using the same methods as described above.

133
Histological Evaluation of Bovine Nasal Tissues Exposed
to Microemulsions
Microemulsion-exposed nasal respiratory and olfactory tissues were subjected to
histological evaluations to observe any potential adverse effects caused by the
microemulsion on the tissue integrity. After a DZME transport study, the exposed nasal
tissue area was carefully cut from the mounted tissue and fixed in 10 mL of zinc formalin
solution (Sigma Aldrich, St Louis, MO) for 48 hours. The fixed tissues were treated with
10%, 20%, and 30% sucrose (Spectrum Chemicals, New Brunswick, NJ) solutions each
for 24 hours, successively. The tissue samples were placed into molds containing tissue-
freezing media (TFM-CTM) (Triangle Biomedical Science, Durham, NC) and cryo-frozen
in liquid nitrogen using a snap freezing system (Gentle Jane® Instrumedics Inc.,
Hackensack, NJ). Thin sections (10 μm) of frozen tissues were cut using a Microm®
Cryostat II (HM505E) with a CryoJane system (Microm Ineternational, Waldorf,
Germany) at -35°C. These thick sections were placed on Surgipath® adhesive-coated
glass microscope slides (CSFA-1X, Lecia Bioystems Richmond Inc., Richmond, IL) and
stained using hematoxylin and eosin (Sigma Aldrich, St Louis, MO) at room temperature
using an automatic staining machine (DRS-601 Sakura stainer, Sakura Finetec Inc.,
Torrance, CA). Coverslips were placed on the slides and the stained tissue sections were
imaged using bright field microscopy using an Olympus BX-61 motorized light
microscope (Olympus Microscope and Imagining System Inc., Melville, NY).
For control images, freshly harvested respiratory and olfactory tissue samples
were placed in zinc formalin immediately after harvesting and treated under similar
conditions as described above and examined using bright field microscopy.

134
Transport Inhibitor Studies
To investigate the involvement of energy dependent pathways in the uptake of
diazepam from microemulsions, bovine nasal respiratory and olfactory tissues were
exposed to 2,4-dinitrophenol (2,4-DNP), a metabolic inhibitor that interferes with
synthesis of ATP required for energy-dependent processes, including endocytosis. Nasal
tissues were exposed for 30 min with 1 mL of KRB containing 1 mM 2,4-DNP in the
donor and receiver chambers prior to the subsequent DZME transport study. After 30
min, the donor chamber fluid was replaced with 1 mL of DZME (4 mg/mL) also
containing 1mM 2,4-DNP and the receiver chamber fluid was replaced with1 mL of KRB
containing 2,4-DNP (1 mM). The transport of diazepam through the tissue and into the
receiver chamber was monitored as described in above section.
HPLC Analysis
The HPLC method for quantification of diazepam was developed based on a
previously reported method199. The HPLC system used was an Agilent1100 (Agilent
Technologies Co., Santa Clara, CA) consisting of a G1311A quaternary pump, G1313
ALS autosampler and G1315B diode array detector. Separation of diazepam was carried
out at ambient temperature with a Phenomenx Luna C18 (2) (256 x 4.6 mm, 5 μm
particle size) column protected by a Phenomenex Gemini–NX C18 (4 x 2.0 mm ID)
guard cartridge (Phenomenex Inc., Torrance, CA). The mobile phase consisted of
methanol: water (70: 30 %v/v) as an isocratic mobile phase at a flow rate of 1 ml/min
with a run time of 10 min and a post run time of 2 min between 10 μL sample injections.
Diazepam was eluted at ~ 7.6 min and detected at 254 nm. Concentrations of diazepam
were calculated from a calibration curve obtained using fresh diazepam standard solution.
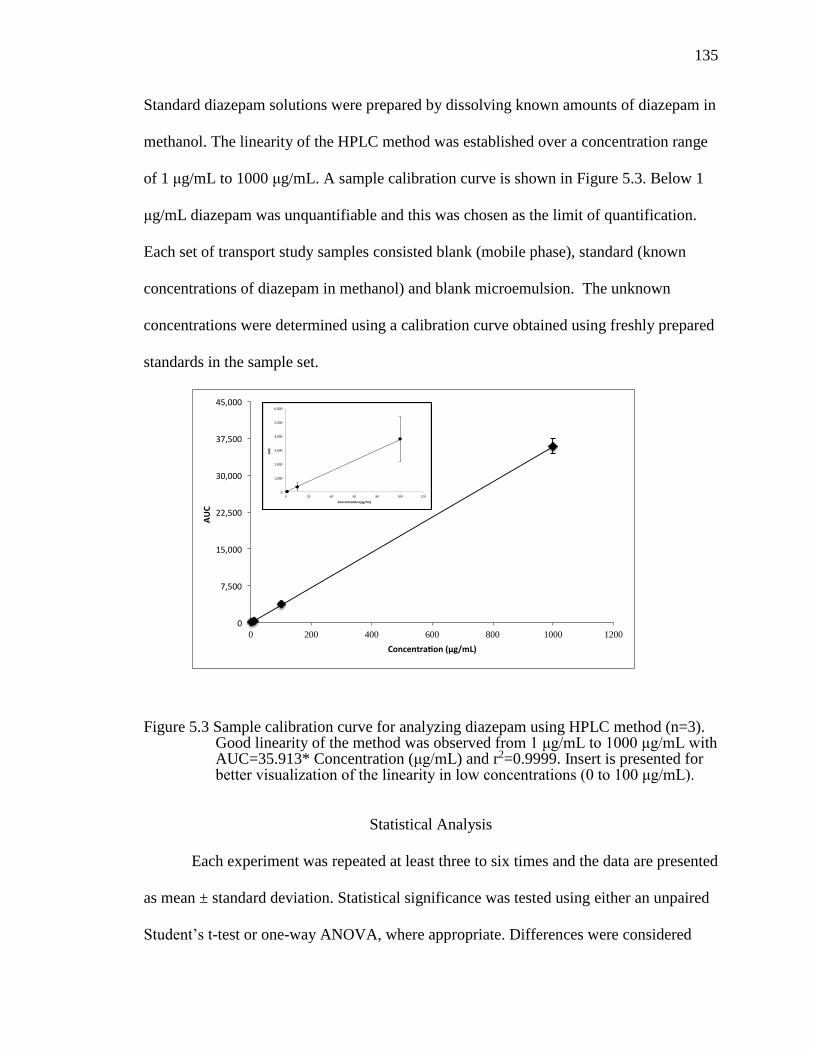
135
Standard diazepam solutions were prepared by dissolving known amounts of diazepam in
methanol. The linearity of the HPLC method was established over a concentration range
of 1 μg/mL to 1000 μg/mL. A sample calibration curve is shown in Figure 5.3. Below 1
μg/mL diazepam was unquantifiable and this was chosen as the limit of quantification.
Each set of transport study samples consisted blank (mobile phase), standard (known
concentrations of diazepam in methanol) and blank microemulsion. The unknown
concentrations were determined using a calibration curve obtained using freshly prepared
standards in the sample set.
Figure 5.3 Sample calibration curve for analyzing diazepam using HPLC method (n=3). Good linearity of the method was observed from 1 μg/mL to 1000 μg/mL with AUC=35.913* Concentration (μg/mL) and r2=0.9999. Insert is presented for better visualization of the linearity in low concentrations (0 to 100 μg/mL).
Statistical Analysis
Each experiment was repeated at least three to six times and the data are presented
as mean ± standard deviation. Statistical significance was tested using either an unpaired
Student’s t-test or one-way ANOVA, where appropriate. Differences were considered
0
7,500
15,000
22,500
30,000
37,500
45,000
0 200 400 600 800 1000 1200
AUC
Concentra on(μg/mL)
0
1,000
2,000
3,000
4,000
5,000
6,000
0 20 40 60 80 100 120
AUC
Concentra on(μg/mL)

136
significant at p < 0.05. GraphPad Prism Inc. (La Jolla, CA) was used to perform the
statistical testing.
Results and Discussion
Solubility Studies
To develop a microemulsion of a highly hydrophobic molecule like diazepam, the
components selected should have ability to solubilize higher concentrations of diazepam
than water. Figure 5.4 shows the solubility of diazepam in IPM, Tween 80, sorbitol
solution (70 %w/v in water) and water. Among the microemulsion components
selected, Tween 80 and IPM showed the highest solubulization capacity for diazepam.
Figure 5.4 Solubility of diazepam in various components used in microemulsions. Column bars are labeled with the mean solubility value (mg/mL). Results are expressed as mean ± standard deviation of three replicates.
Characterization of Microemulsions
Diazepam-containing microemulsions and blank microemulsions were prepared
and characterized for dispersed phase size, zeta potential, and conductivity (Table 5-2).
The microemulsion reported by Attwood et al.210 contained IPM (4.7 %w/w), polysorbate
Tween 80 IPM Sorbitol (70%w/v) Water0.01
0.1
1
10
100
So
lub
ilit
y o
f d
iaze
pam
(m
g/m
L)
IPM
Sorbitol (70%w/v)
Tween 80
Water
0.05
64.55
0.19
10.23
137
60 (13.3 %w/w), sorbitol (26.7 %w/w) and water (55.3 % w/w), which resulted in
dispersed phase diameter of ~29 nm. In the current study, for the blank microemulsion
(without diazepam), the weight percent of surfactant: sorbitol was kept at 40 %w/w and
the mass ratio of surfactant: sorbitol was changed from 1: 2 (polysorbate 60: sorbitol) to
1: 2.5 (polysorbate 80: sorbitol), and the IPM content was slightly increased (5 %w/w).
The mean diameter of the dispersed phase in the control increased to ~ 48 nm. This
increase in size may be attributed to: 1) the greater mass ratio (1:2.5) of polysorbate
80/sorbitol (40% w/w) compared to the 1:2 polysorbate 60/sorbitol (40% w/w); 2)
polysorbate 80 may also occupy a greater area per molecule compared to polysorbate 60
thus increasing the droplet size; 3) Attwood et al. used a time-averaged light scattering
technique to determine droplet size. This technique measures the size using diffraction
principles, whereas in the current study, the size of the dispersed phase was determined
using a photon correlation spectroscopy autocorrelation function calculated based on the
Brownian motion of the particles; 4) the viscosity and refractive index of the
microemulsion was not accounted for in the particle size analysis and the autocorrelation
function depends on accurate values for these parameters to determine the correct particle
size. Since it is likely that the viscosity of the microemulsion was greater than water, the
size of the dispersed phase may have been over-predicted.
Inclusion of diazepam in the microemulsion resulted in a slight decrease in
dispersed phase diameter to ~42 nm. The zeta potential of blank and diazepam-containing
microemulsions were found to be ~ 0 mV due to the use of nonionic surfactant, Tween
80. No visual phase separation was observed after 7 days of storage at ambient
temperature (Figure 5.5). Since the chemical stability of the DZME formulation was

138
unknown, all studies were performed with DZME formulations stored for not more than
24 h.
Table 5-2 Size and zeta potential of microemulsions with and without drug and 2,4-DNP (mean ± std dev).
Formulation Droplet Size (nm) Zeta potential (mV)
Blank microemulsion 41.9 (9.8) -0.2(2.3)
Diazepam containing microemulsion 47.5 (4.5) -0.4 (3.2)
Diazepam containing microemulsion with 2,4-DNP
39.6 (10.2) 0.3 (4.2)
Figure 5.5 Appearance of diazepam-containing microemulsion.

139
Microemulsion Uptake Studies
The mass transfer of diazepam from the microemulsion and from an IPM solution
across both respiratory and olfactory tissues is shown in Figure 5.6. The transfer of
diazepam across both tissues appeared to be similar with only negligible quantities of
diazepam (<0.5% of administered dose) transferred across the tissues to reach the
receiver chamber after 120 min. Most of the diazepam (75 % - 90 %) remained in the
donor chamber after 120 min of exposure to the tissue explants (Figure 5.7). There was a
decrease of diazepam content (10 % - 25 %) in the donor chamber, but negligible
diazepam (<1%) was recovered from the receiver chamber. The unaccounted diazepam in
these experiments (15 % - 25 %) may be the result of accumulation within the tissues or
may be the result of experimental error. When the transfer of diazepam from DZME was
tested using an impermeable, artificial membrane, ~ 100% of the diazepam remained in
the donor chamber after 120 min of exposure (Figure 5.7), with negligible transfer to the
receiver chamber. As the total mass of loaded diazepam was recovered from the
impermeable membrane study, it appears unlikely that the experimental loss of diazepam
during the transport study was significant. As a result, any unaccounted for diazepam in
the tissue transport studies was assumed to accumulate within the tissues.
The unaccounted for diazepam was determined by taking the difference between
the initial diazepam in the donor fluids and the concentration of the diazepam recovered
from the donor and receiver chambers. Figure 5.8 shows the percent of unaccounted for
diazepam, which was assumed to accumulate within the respiratory and olfactory tissues.

140
A.
B.
Figure 5.6 Comparison of the cumulative percent of diazepam (relative to the donor chamber initial concentration) appearing in the receiver chamber as a function of time across bovine respiratory and olfactory tissue explants following exposure to DZS (diazepam IPM solution, 4 mg/mL) and DZME (diazepam-containing microemulsion, 4 mg/mL). A) Data shown are mean ± standard deviation (n=6 per tissue type). B) Mean percent diazepam transferred to receiver results shown without error bars.
0 50 100 1500.00
0.05
0.10
0.15
0.20
0.25
Time (min)
Perc
en
t D
iazep
am
Tra
nsfe
red
to R
eceiv
er
(%) DZME Respiratory
DZME Olfactory
DZS Respiratory
DZS olfactory
0 5 0 1 0 0 1 5 0
0 .0 0
0 .0 5
0 .1 0
0 .1 5
0 .2 0
0 .2 5
T im e (m in )
Pe
rc
en
t D
iaz
ep
am
Tra
ns
fere
d
to R
ec
eiv
er (
%)

141
Figure 5.7 Comparison of diazepam percent remaining in the donor chamber after 120 min exposure of diazepam IPM solution (DZS) and diazepam-containing microemulsion (DZME) to the respiratory, olfactory and artificial membrane. Dashed line represents 100%. Data shown are mean ± standard deviation (n=6 per tissue/membrane type).
Figure 5.8 Comparison of diazepam percent (relative to the initial diazepam concentration in the donor chamber) accumulated in the respiratory and olfactory tissues after 120 min exposure to diazepam-IPM solution (DZS) and diazepam-containing microemulsion (DZME). Data shown are mean ± standard deviation (n=6 for each tissue type). * Indicates a statistically significant difference when compared using an unpaired, two-tailed Student’s t-test with p<0.05.
Res
pirato
ry
Tissu
e
Olfa
ctory
Tissu
eArtifi
cial
Mem
brane
0
50
100
150
% o
f D
iaze
pa
m
Re
ma
inin
g in
Do
no
r
DZS
DZME
Res
pirat
ory
Tissu
e
Olfa
ctory
Tissu
e
0
10
20
30
40
% o
f D
iaze
pa
m
in T
iss
ue
[by
diffe
ren
ce
]
DZS
DZME
* *

142
Although the tissues were exposed to equivalent diazepam concentrations, the
uptake of diazepam into the tissues from DZME was ~2-fold higher compared to uptake
from the diazepam-containing IPM solution. The increased uptake of diazepam from
microemulsion suggests that the components of the microemulsion may act as permeation
enhancers. There are reports that suggest that the dispersed phase in a microemulsion can
act as a reservoir for hydrophobic drugs which helps to maintain a constant concentration
gradient across the membrane182-183. For example, in a study by Patel et al.182, the authors
claimed that increased uptake of risperidone across sheep nasal mucosa from a
microemulsion compared to drug in solution was due to maintenance of constant
concentration gradient of drug across membrane where the dispersed phase acted as
reservoir of the drug. However, while the authors used a mathematical model to describe
the mechanism, no direct evidence of the mechanism of drug uptake from microemulsion
was provided.
The influence of structural differences between the bovine respiratory and
olfactory tissues may also influence the permeation of diazepam across these tissues.
Similar amounts (~25%) of diazepam were accumulated in these two different tissues. It
is well understood, however, that the two tissues are morphologically different, especially
their thicknesses. The respiratory tissue is ~1.6-fold thicker than the olfactory tissue
(average thickness of bovine respiratory mucosa: 0.096 cm, average thickness of bovine
olfactory mucosa: 0.059 cm). When the amount of diazepam permeated across each
tissue was normalized to the tissue thickness (Figure 5.9), due to the high variation of the
mass determined for each tissue, no statistical differences between the tissues could be
observed. In comparison, in Chapter 3 it was shown that quantum dots (QDs)
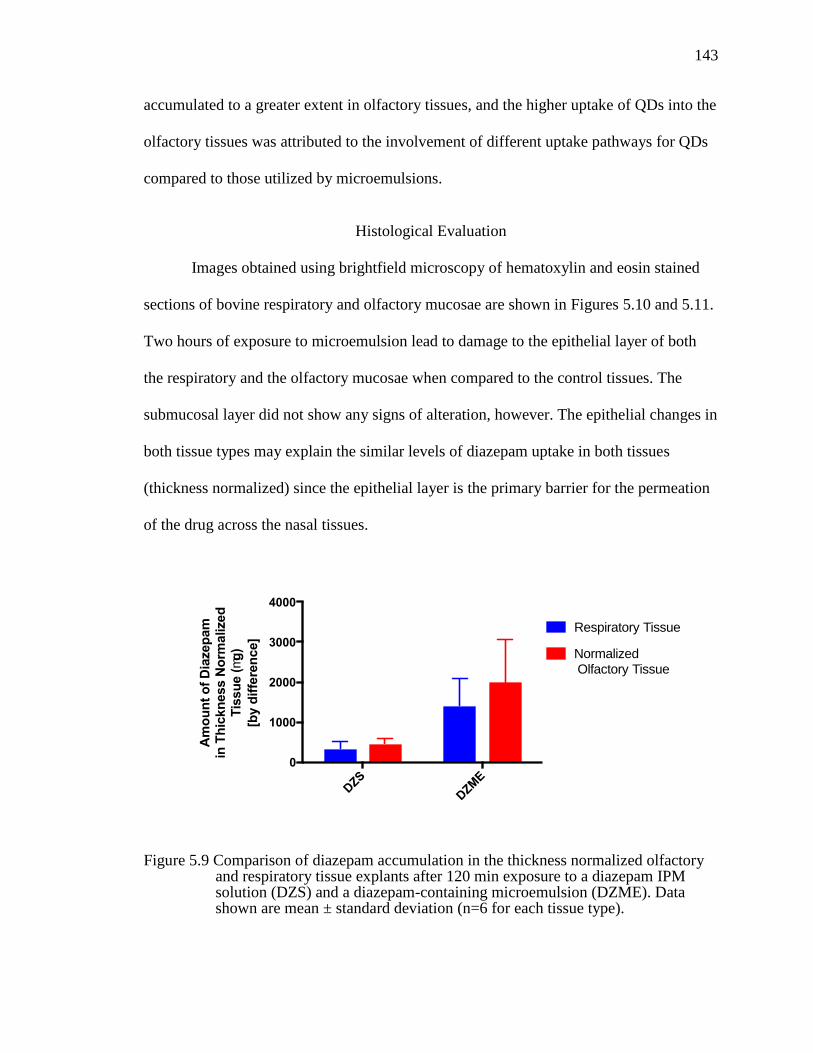
143
accumulated to a greater extent in olfactory tissues, and the higher uptake of QDs into the
olfactory tissues was attributed to the involvement of different uptake pathways for QDs
compared to those utilized by microemulsions.
Histological Evaluation
Images obtained using brightfield microscopy of hematoxylin and eosin stained
sections of bovine respiratory and olfactory mucosae are shown in Figures 5.10 and 5.11.
Two hours of exposure to microemulsion lead to damage to the epithelial layer of both
the respiratory and the olfactory mucosae when compared to the control tissues. The
submucosal layer did not show any signs of alteration, however. The epithelial changes in
both tissue types may explain the similar levels of diazepam uptake in both tissues
(thickness normalized) since the epithelial layer is the primary barrier for the permeation
of the drug across the nasal tissues.
Figure 5.9 Comparison of diazepam accumulation in the thickness normalized olfactory and respiratory tissue explants after 120 min exposure to a diazepam IPM solution (DZS) and a diazepam-containing microemulsion (DZME). Data shown are mean ± standard deviation (n=6 for each tissue type).
DZS
DZM
E
0
1000
2000
3000
4000
Am
ou
nt
of
Dia
zep
am
in
Th
ickn
ess N
orm
alized
Tis
su
e (
mg
)
[by d
iffe
ren
ce]
Respiratory Tissue
Normalized Olfactory Tissue

144
Figure 5.10 Brightfield microscopic images of control (left) and DZME exposed (right) respiratory tissue explant. Solid line arrow shows intact epithelium in control tissue and the dashed-line arrow shows the damaged epithelium in DZME-exposed respiratory tissue.
Figure 5.11 Brightfield microscopic images of control (left) and DZME exposed (right) olfactory tissue explant. Solid line arrow shows intact epithelium in control tissue and the dashed-line arrow shows the damaged epithelium in DZME-exposed olfactory tissue.
Mechanism of DZME Uptake into Nasal Tissues
Drug permeation from a microemulsion is a complex process involving several
pathways. Possible mechanisms of drug permeation from surfactant rich microemulsions
include passive diffusion of free drug from the continuous phase and uptake of the drug-
containing dispersed phase using vesicular uptake mechanisms. Diazepam, being a

145
hydrophobic molecule, has limited ability to access paracellular transport pathways. It
has not been reported to be a substrate for any transporter systems, so the likely primary
mechanism for uptake would be transcellular passive diffusion. In order to further
investigate whether any energy-dependent processes were involved in the uptake of
diazepam in the nasal tissue explants, diazepam uptake from DZME in the presence of
2,4-DNP was investigated (Figure 5.12). A slight decrease in diazepam uptake into the
tissues was measured in the respiratory tissues (p < 0.1) while no difference was observed
in diazepam uptake in the presence of 2,4 DNP in the olfactory tissues. These results
suggest that there may be additional, additional energy-dependent pathways that assist in
the uptake of diazepam from the microemulsion into the respiratory tissues. The
endocytic pathways would be the most likely energy-dependent mechanisms to be
involved; yet most comparison results to date suggest that the olfactory tissues are more
endocytically active than the respiratory tissues. Another potential pathway may be via
the paracellular route. In the presence of 2, 4 DNP, the junctional proteins are unable to
maintain their size-based regulation of the intercellular junctions. Hence, it suggests that
the drug transfer via passive diffusion through the transcellular route is likely the major
pathway in diazepam microemulsion uptake.

146
Figure 5.12 Comparison of diazepam accumulation in the respiratory and olfactory tissues after 120 min exposure to DZME in the presence and absence of the metabolic inhibitor 2,4 –dinitrophenol (2,4-DNP). Data shown are mean ± standard deviation (n=6 for each tissue type). * Indicates a statistically significant difference when compared using an unpaired two-tailed Student’s t-test with p<0.1.
In previous chapter 3, quantum dots were shown to internalize into the nasal
respiratory and olfactory tissues via multiple endocytic pathways (Chapter 3) along with
some energy-independent pathways in the olfactory mucosa. However, in the case of the
microemulsions, it is difficult to determine whether the fluid-phase oil droplets were
internalized via endocytic pathways, because the integrity of the tissue was compromised
and the endocytic processes were likely no longer operative (Figures 5.10 and 5.11).
Res
pirat
ory
Tissu
e
Olfa
ctory
Tissu
e
0
10
20
30
40
% o
f D
iaze
pa
m
in T
iss
ue
[b
y d
iffe
ren
ce
]
DZME*
DZME + 2,4-DNP
147
Conclusions
The diazepam-loaded, oil-in-water microemulsion formulation showed enhanced
drug transfer into both nasal olfactory and respiratory tissues. These results suggest that
microemulsions may improve the bioavailability of poorly water-soluble drugs
administered intranasally. However, formulators should be careful in the selection of the
components of the microemulsion system due to the potential to damage the mucosa with
high concentrations of surfactants and non-aqueous solvents. These studies showed that
drug transfer from a diazepam-containing microemulsion into bovine nasal tissues was
independent of tissue region and appeared to primarily involve energy-independent
pathways, likely passive diffusion. It is unclear if endocytosis of the fluid-phase
nanodispersions of oil droplets played a role in drug absorption from the microemulsions
in a manner similar to the uptake of solid-phase nanoparticles due to the significant loss
of the epithelial cell layer following exposure to the microemulsion formulation.

148
CHAPTER VI
CONCLUSIONS
Various types of nanomaterial have been shown to cross the nasal mucosa and
reach the brain or the systemic circulation. Exploiting the nasal route in delivering
therapeutic agents using colloidal dispersions presents a promising new strategy for
targeted or improved efficacy delivery systems. Despite the potential delivery
advantages, the percentage of the administered nanomaterials reaching their desired
targets is minimal. While it has been reported that the size and surface characteristics of
nanoparticles affect their translocation efficiency, there is still a significant knowledge
gap regarding how nanomaterials, especially ultrafine nanomaterials (< 20 nm) interact
with cells and specifically interact with the cells in the nasal mucosa following
administration of drug products or vaccines. Careful characterization of the uptake and
distribution of particles in the olfactory and respiratory tissues, subsequent transfer to the
brain, or the systemic vasculature, or the lymphatics is needed to identify particle
characteristics that can be leveraged in advanced drug delivery strategies.
The use of quantum dots (< 20 nm) as model ultrafine nanoparticles assisted in
the evaluation of the uptake mechanisms in bovine nasal respiratory and olfactory tissues.
The unique composition of QDs enabled the measurement of the concentration of QDs in
the nasal tissues using ICP-OES and their inherent optical properties also enabled their
visualization within the bovine nasal tissues using confocal and electron microscopy.
Based on these studies, it is suggested that ultrafine nanoparticles show greater uptake in
the olfactory tissues compared to the respiratory tissues. COOH-QDs showed
accumulation in both the epithelial and submucosal regions of the bovine nasal tissues.

149
The uptake pathways utilized by these two tissues were also found to be different. In
respiratory tissues, clathrin-dependent, macropinocytosis and caveolae-dependent
endocytosis processes were all involved in the uptake of QDs whereas in olfactory tissues
clathrin-dependent endocytosis was the major endocytic pathway utilized. Additional
energy-independent pathways also appeared to be active in the internalization of QDs
into the olfactory mucosa, however the effect of surface chemistry on these pathways still
requires further investigation.
Observations from in vivo biodistribution studies in mice following intranasal
administration of quantum dots suggest that extremely small nanoparticles are transferred
from the nasal cavity into the posterior turbinate region and subsequently in close
proximity to the olfactory bulb. The majority of the administered COOH-QDs appear to
remain in the deeper nasal regions for relatively long periods of time (up to 24 h). The
accumulation of nanoparticles in the nasal tissues was also dependent on the surface
characteristics of the nanoparticles. Both in vitro and in vivo studies demonstrated that
the internalization of PEGylated QDs was less than COOH-QDs.
Non-invasive in vivo biodistribution studies carried out in mice after intranasal
administration of quantum dots also showed that whole animal fluorescence imaging and
micro-CT techniques are useful tools in qualitative and semi-quantitative evaluation of
biodistribution in live animals. However, neither of these techniques was able to visualize
the discrete signals associated with individual nanoparticles in the brain or in other parts
of the body. Signal from aggregates of QDs was able to be visualized, however.
A novel attempt to study the effect of the physical state of the colloidal systems
on subsequent uptake was made using microemulsions. Unlike solid nanomaterials, it is

150
difficult to either visualize or measure oil droplets/dispersed phase of a microemulsion in
the nasal tissues. Hence, a diazepam-containing microemulsion was developed to
investigate the uptake mechanisms of microemulsions. The microemulsion system
showed similar permeation of diazepam into both the nasal respiratory and olfactory
tissues, unlike solid-nanoparticles (QDs) which showed greater uptake into the olfactory
tissues. Exposure of a diazepam-containing microemulsion to the bovine nasal tissues
resulted in damage to the epithelial barrier and may have contributed to the increased
permeation. Involvement of endocytosis for the internalization of fluid-phase oil
droplets/dispersed phase of the microemulsion for enhanced permeation of diazepam
across bovine nasal tissues is difficult with a surfactant rich microemulsion which caused
damage to the epithelial barrier.
Overall, these studies have increased the fundamental understanding of the
ultrafine nanoparticle uptake in nasal tissues and their biodistribution in the whole body.
While ultrafine nanoparticles may have limited application in the development of
efficient drug delivery systems, due to limitations of low drug loading efficiency and
potential toxic effects, these results contribute to the rational development of
nanoparticulate drug delivery strategies investigating the nasal and other routes of
administration.

151
REFERENCES
1. Everett, D. H., Manual of symbols and terminology for physicochemical quantities and units, Appendix II: Definitions, terminology and symbols in colloid and surface chemistry. In Pure and Applied Chemistry, 1972; Vol. 31, p 577.
2. Bochot, A.; Fattal, E., Liposomes for intravitreal drug delivery: A state of the art. Journal of Controlled Release 2012, 161 (2), 628-634.
3. Uchegbu, I. F.; Vyas, S. P., Non-ionic surfactant based vesicles (niosomes) in drug delivery. International Journal of Pharmaceutics 1998, 172 (1-2), 33-70.
4. Kataoka, K.; Harada, A.; Nagasaki, Y., Block copolymer micelles for drug delivery: design, characterization and biological significance. Advanced Drug Delivery Reviews 2001, 47 (1), 113-131.
5. Lawrence, M. J.; Rees, G. D., Microemulsion-based media as novel drug delivery systems. Advanced Drug Delivery Reviews 2000, 45 (1), 89-121.
6. Cho, K. J.; Wang, X.; Nie, S. M.; Chen, Z.; Shin, D. M., Therapeutic nanoparticles for drug delivery in cancer. Clinical Cancer Research 2008, 14 (5), 1310-1316.
7. Kumar, C.; Mohammad, F., Magnetic nanomaterials for hyperthermia-based therapy and controlled drug delivery. Advanced Drug Delivery Reviews 2011, 63 (9), 789-808.
8. Gao, L.; Liu, G. Y.; Ma, J. L.; Wang, X. Q.; Zhou, L.; Li, X., Drug nanocrystals: In vivo performances. Journal of Controlled Release 2012, 160 (3), 418-430.
9. Kowalczuk, A.; Stoyanova, E.; Mitova, V.; Shestakova, P.; Momekov, G.; Momekova, D.; Koseva, N., Star-shaped nano-conjugates of cisplatin with high drug payload. International Journal of Pharmaceutics 2011, 404 (1-2), 220-230.
10. Barenholz, Y., Doxil (R) - The first FDA-approved nano-drug: Lessons learned. Journal of Controlled Release 2012, 160 (2), 117-134.
11. Mistry, A.; Stolnik, S.; Illum, L., Nanoparticles for direct nose-to-brain delivery of drugs. International Journal of Pharmaceutics 2009, 379 (1), 146-157.
12. Csaba, N.; Garcia-Fuentes, M.; Alonso, M. J., Nanoparticles for nasal vaccination. Advanced Drug Delivery Reviews 2009, 61 (2), 140-157.
13. Lucchini, R.; Dorman, D.; Elder, A.; Veronesi, B., Neurological impacts from inhalation of pollutants and the nose–brain connection. Neurotoxicology 2012, 33 (4), 838-841.

152
14. Wang, J.; Liu, Y.; Jiao, F.; Lao, F.; Li, W.; Gu, Y.; Li, Y.; Ge, C.; Zhou, G.; Li, B., Time-dependent translocation and potential impairment on central nervous system by intranasally instilled TiO2 nanoparticles. Toxicology 2008, 254 (1), 82-90.
15. Yokel, R.; Grulke, E.; MacPhail, R., Metal‐based nanoparticle interactions with the nervous system: the challenge of brain entry and the risk of retention in the organism. Wiley Interdiciplinary Reviews: Nanomedicine and Nanobiotechnology 2013, 5 (4), 346-373.
16. Brouwer, D., Exposure to manufactured nanoparticles in different workplaces. Toxicology 2010, 269 (2-3), 120-7.
17. Buzea, C.; Pacheco, II; Robbie, K., Nanomaterials and nanoparticles: Sources and toxicity. Biointerphases 2007, 2 (4), MR17-MR71.
18. Xia, T.; Kovochich, M.; Liong, M.; Madler, L.; Gilbert, B.; Shi, H. B.; Yeh, J. I.; Zink, J. I.; Nel, A. E., Comparison of the mechanism of toxicity of zinc oxide and cerium oxide nanoparticles based on dissolution and oxidative stress properties. ACS Nano 2008, 2 (10), 2121-2134.
19. Carlson, C.; Hussain, S. M.; Schrand, A. M.; Braydich-Stolle, L. K.; Hess, K. L.; Jones, R. L.; Schlager, J. J., Unique cellular interaction of silver nanoparticles: Size-dependent generation of reactive oxygen species. Journal of Physical Chemistry B 2008, 112 (43), 13608-13619.
20. Mygind, N.; Dahl, R., Anatomy, physiology and function of the nasal cavities in health and disease. Advanced Drug Delivery Reviews 1998, 29 (1-2), 3-12.
21. Illum, L., Transport of drugs from the nasal cavity to the central nervous system. European Journal of Pharmaceutical Sciences 2000, 11 (1), 1-18.
22. Elad, D.; Wolf, M.; Keck, T., Air-conditioning in the human nasal cavity. Respiratory Physiology & Neurobiology 2008, 163 (1–3), 121-127.
23. Bromley, S. M., Smell and taste disorders: a primary care approach. American Family Physician 2000, 61 (2), 427-36, 438.
24. Mygind, N.; Dahl, R., Anatomy, physiology and function of the nasal cavities in health and disease. Advanced Drug Delivery Reviews 1998, 29 (1), 3-12.
25. Kuper, C. F.; Koornstra, P. J.; Hameleers, D. M. H.; Biewenga, J.; Spit, B. J.; Duijvestijn, A. M.; Vriesman, P.; Sminia, T., The role of nasopharyngeal lymphoid-tissue. Immunology Today 1992, 13 (6), 219-224.
26. Kiyono, H.; Fukuyama, S., Nalt- versus Peyer's-patch-mediated mucosal immunity. Nature Reviews Immunology 2004, 4 (9), 699-710.

153
27. Cacesi, T. Respiratory System I: Mammals. http://www.doctorc.net/Labs/Lab25/lab25.htm (accessed 25th April 2017).
28. Tortora, G. J.; Derrickson, B. H., Principles of anatomy and physiology. John Wiley & Sons: 2008.
29. Illum, L., Nanoparticulate systems for nasal delivery of drugs: a real improvement over simple systems? Journal of Pharmaceutical Sciences 2007, 96 (3), 473-483.
30. Mathison, S.; Nagilla, R.; Kompella, U. B., Nasal route for direct delivery of solutes to the central nervous system: Fact or fiction? Journal of Drug Targeting 1998, 5 (6), 415-441.
31. Donovan, M. D.; Flynn, G. L.; Amidon, G. L., Absoprtion of polyethylene glycol- 600 through polyethyle glycol-2000. The molecular-weight dependence of gastrointestinal and nasal absorption. Pharmaceutical Research 1990, 7 (8), 863-868.
32. Yu, G.; Zhang, Z.; Lessmann, R., Fluid flow and particle diffusion in the human upper respiratory system. Aerosol Science and Technology 1998, 28 (2), 146-158.
33. Shanley, K. T.; Zamankhan, P.; Ahmadi, G.; Hopke, P. K.; Cheng, Y.-S., Numerical simulations investigating the regional and overall deposition efficiency of the human nasal cavity. Inhalation Toxicology 2008, 20 (12), 1093-1100.
34. Schroeter, J. D.; Kimbell, J. S.; Asgharian, B.; Tewksbury, E. W.; Singal, M., Computational fluid dynamics simulations of submicrometer and micrometer particle deposition in the nasal passages of a Sprague-Dawley rat. Journal of Aerosol Science 2012, 43 (1), 31-44.
35. Garcia, G. J. M.; Kimbell, J. S., Deposition of inhaled nanoparticles in the rat nasal passages: Dose to the olfactory region. Inhalation Toxicology 2009, 21 (14), 1165-1175.
36. Jiang, J. B.; Zhao, K., Airflow and nanoparticle deposition in rat nose under various breathing and sniffing conditions-A computational evaluation of the unsteady and turbulent effect. Journal of Aerosol Science 2010, 41 (11), 1030-1043.
37. Brooking, J.; Davis, S.; Illum, L., Transport of nanoparticles across the rat nasal mucosa. Journal of Drug Targeting 2001, 9 (4), 267-279.
38. Chen, N. Size and surface properties determining nanoparticle uptake and transport in the nasal mucosa. Ph.D., The University of Iowa, 2013.
39. Hillaireau, H.; Couvreur, P., Nanocarriers’ entry into the cell: relevance to drug delivery. Cellular and Molecular Life Sciences 2009, 66 (17), 2873-2896.

154
40. Mistry, A.; Stolnik, S.; Illum, L., Nose-to-Brain Delivery: Investigation of the Transport of Nanoparticles with Different Surface Characteristics and Sizes in Excised Porcine Olfactory Epithelium. Molecular Pharmaceutics 2015, 12 (8), 2755-2766.
41. Huang, Y.; Donovan, M. D., Microsphere transport pathways in rabbit Nasal mucosa. International Journal of Pharmaceutical Advances 1996, 1 (3), 298-309.
42. Costantino, H. R.; Illum, L.; Brandt, G.; Johnson, P. H.; Quay, S. C., Intranasal delivery: Physicochemical and therapeutic aspects. International Journal of Pharmaceutics 2007, 337 (1–2), 1-24.
43. Heritage; Brook; Underdown; McDermott, Intranasal immunization with polymer-grafted microparticles activates the nasal-associated lymphoid tissue and draining lymph nodes. Immunology 1998, 93 (2), 249-256.
44. Aderem, A.; Underhill, D. M., Mechanisms of phagocytosis in macrophages. Annual Review of Immunology 1999, 17, 593-623.
45. Sahay, G.; Alakhova, D. Y.; Kabanov, A. V., Endocytosis of nanomedicines. Journal of Controlled Release 2010, 145 (3), 182-195.
46. Conner, S. D.; Schmid, S. L., Regulated portals of entry into the cell. Nature 2003, 422 (6927), 37-44.
47. Rejman, J.; Oberle, V.; Zuhorn, I. S.; Hoekstra, D., Size-dependent internalization of particles via the pathways of clathrin-and caveolae-mediated endocytosis. Biochemical Journal 2004, 377, 159-169.
48. Lim, J. P.; Gleeson, P. A., Macropinocytosis: an endocytic pathway for internalising large gulps. Immunology and Cell Biology 2011, 89 (8), 836-843.
49. Wang, L.-H.; Rothberg, K. G.; Anderson, R. G., Mis-assembly of clathrin lattices on endosomes reveals a regulatory switch for coated pit formation. Journal of Cell Biology 1993, 123, 1107-1107.
50. Parton, R. G.; Joggerst, B.; Simons, K., Regulated internalization of caveolae. Journal of Cell Biology 1994, 127 (5), 1199-1216.
51. Slutter, B.; Bal, S.; Keijzer, C.; Mallants, R.; Hagenaars, N.; Que, I.; Kaijzel, E.; van Eden, W.; Augustijns, P.; Lowik, C.; Bouwstra, J.; Broere, F.; Jiskoot, W., Nasal vaccination with N-trimethyl chitosan and PLGA based nanoparticles: Nanoparticle characteristics determine quality and strength of the antibody response in mice against the encapsulated antigen. Vaccine 2010, 28 (38), 6282-6291.
52. Gavini, E.; Hegge, A. B.; Rassu, G.; Sanna, V.; Testa, C.; Pirisino, G.; Karlsen, J.; Giunchedi, P., Nasal administration of carbamazepine using chitosan microspheres: In vitro/in vivo studies. International Journal of Pharmaceutics 2006, 307 (1), 9-15.

155
53. Sundaram, S.; Roy, S. K.; Ambati, B. K.; Kompella, U. B., Surface-functionalized nanoparticles for targeted gene delivery across nasal respiratory epithelium. FASEB Journal 2009, 23 (11), 3752-3765.
54. Chemuturi, N. V.; Hayden, P.; Klausner, M.; Donovan, M. D., Comparison of human tracheal/bronchial epithelial cell culture and bovine nasal respiratory explants for nasal drug transport studies. Journal of Pharmaceutical Sciences 2005, 94 (9), 1976-1985.
55. Stieneker, F.; Kreuter, J.; Lower, J., High antibody titres in mice with polymethylmethacrylate nanoparticles as adjuvant for HIV vaccines. AIDS 1991, 5 (4), 431-5.
56. Al Khafaji, A. S. A. Understanding the uptake of polystyrene nanoparticles by the nasal mucosa. The University of Iowa, 2016.
57. Mistry, A.; Glud, S. Z.; Kjems, J.; Randel, J.; Howard, K. A.; Stolnik, S.; Illum, L., Effect of physicochemical properties on intranasal nanoparticle transit into murine olfactory epithelium. Journal of Drug Targeting 2009, 17 (7), 543-52.
58. Marin, E.; Briceño, M. I.; Caballero-George, C., Critical evaluation of biodegradable polymers used in nanodrugs. International Journal of Nanomedicine 2013, 8, 3071-3091.
59. Zhang, L.; Gu, F.; Chan, J.; Wang, A.; Langer, R.; Farokhzad, O., Nanoparticles in medicine: therapeutic applications and developments. Clinical Pharmacology and Therapeutics 2008, 83 (5), 761-769.
60. Pawar, D.; Goyal, A. K.; Mangal, S.; Mishra, N.; Vaidya, B.; Tiwari, S.; Jain, A. K.; Vyas, S. P., Evaluation of mucoadhesive PLGA microparticles for nasal immunization. AAPS Journal 2010, 12 (2), 130-7.
61. Seju, U.; Kumar, A.; Sawant, K. K., Development and evaluation of olanzapine-loaded PLGA nanoparticles for nose-to-brain delivery: in vitro and in vivo studies. Acta Biomaterialia 2011, 7 (12), 4169-76.
62. Kumar, M.; Pandey, R. S.; Patra, K. C.; Jain, S. K.; Soni, M. L.; Dangi, J. S.; Madan, J., Evaluation of neuropeptide loaded trimethyl chitosan nanoparticles for nose to brain delivery. International Journal of Biological Macromolecules 2013, 61, 189-95.
63. Rassu, G.; Soddu, E.; Cossu, M.; Gavini, E.; Giunchedi, P.; Dalpiaz, A., Particulate formulations based on chitosan for nose-to-brain delivery of drugs. A review. Journal of Drug Delivery Science and Technology 2016, 32, Part B, 77-87.
64. Pawar, D.; Mangal, S.; Goswami, R.; Jaganathan, K., Development and characterization of surface modified PLGA nanoparticles for nasal vaccine delivery: effect of mucoadhesive coating on antigen uptake and immune adjuvant activity. European Journal of Pharmaceutics and Biopharmaceutics 2013, 85 (3), 550-559.

156
65. Sharma, D.; Sharma, R. K.; Sharma, N.; Gabrani, R.; Sharma, S. K.; Ali, J.; Dang, S., Nose-to-brain delivery of PLGA-diazepam nanoparticles. AAPS PharmSciTech 2015, 16 (5), 1108-1121.
66. Liu, Q. F.; Shen, Y. H.; Chen, J.; Gao, X. L.; Feng, C. C.; Wang, L.; Zhang, Q. Z.; Jiang, X. G., Nose-to-brain transport pathways of wheat germ agglutinin conjugated PEG-PLA nanoparticles. Pharmaceutical Research 2012, 29 (2), 546-558.
67. Vila, A.; Sanchez, A.; Evora, C.; Soriano, I.; Jato, J. L. V.; Alonso, M. J., PEG-PLA nanoparticles as carriers for nasal vaccine delivery. Journal of Aerosol Medicine-Deposition Clearance and Effects in the Lung 2004, 17 (2), 174-185.
68. Albarki, M. A. H. In vitro assessment of the transport of Poly D, L Lactic-Co-Glycolic Acid (PLGA) nanoparticles across the nasal mucosa. The University of Iowa, 2016.
69. Sarlo, K.; Blackburn, K. L.; Clark, E. D.; Grothaus, J.; Chaney, J.; Neu, S.; Flood, J.; Abbott, D.; Bohne, C.; Casey, K., Tissue distribution of 20nm, 100nm and 1000nm fluorescent polystyrene latex nanospheres following acute systemic or acute and repeat airway exposure in the rat. Toxicology 2009, 263 (2), 117-126.
70. Oberdörster, G.; Sharp, Z.; Atudorei, V.; Elder, A.; Gelein, R.; Kreyling, W.; Cox, C., Translocation of inhaled ultrafine particles to the brain. Inhalation Toxicology 2004, 16 (6-7), 437-445.
71. Garzotto, D.; De Marchis, S. In Quantum Dot Distribution in the Olfactory Epithelium After Nasal Delivery, Bonsai Project Symposium: Breakthroughs in Nanoparticles for Bio-imaging, AIP Publishing: 2010; pp 118-123.
72. Elder, A.; Gelein, R.; Silva, V.; Feikert, T.; Opanashuk, L.; Carter, J.; Potter, R.; Maynard, A.; Ito, Y.; Finkelstein, J., Translocation of inhaled ultrafine manganese oxide particles to the central nervous system. Environmental Health Perspectives 2006, 114 (8), 1172.
73. De Lorenzo, A. In Electron microscopy of the olfactory and gustatory pathways, Transactions of the annual meeting of the American Laryngological Association. American Laryngological Association. Meeting, 1960; pp 39-49.
74. De Lorenzo, A. In The olfactory neuron and the blood‐brain barrier, Ciba foundation symposium-taste and smell in vertebrates, Wiley Online Library: 2008; pp 151-176.
75. Morrison, E. E.; Costanzo, R. M., Morphology of olfactory epithelium in humans and other vertebrates. Microscopy Research and Technique 1992, 23 (1), 49-61.
76. Hopkins, L. E.; Patchin, E. S.; Chiu, P.-L.; Brandenberger, C.; Smiley-Jewell, S.; Pinkerton, K. E., Nose-to-brain transport of aerosolised quantum dots following acute exposure. Nanotoxicology 2014, 8 (8), 885-893.
157
77. Liong, M.; Lu, J.; Kovochich, M.; Xia, T.; Ruehm, S. G.; Nel, A. E.; Tamanoi, F.; Zink, J. I., Multifunctional inorganic nanoparticles for imaging, targeting, and drug delivery. ACS Nano 2008, 2 (5), 889-896.
78. Gao, X. H.; Cui, Y. Y.; Levenson, R. M.; Chung, L. W. K.; Nie, S. M., In vivo cancer targeting and imaging with semiconductor quantum dots. Nature Biotechnology 2004, 22 (8), 969-976.
79. Xing, Y.; Rao, J., Quantum dot bioconjugates for in vitro diagnostics & in vivo imaging. Cancer Biomarkers 2008, 4 (6), 307-319.
80. Bhumkar, D. R.; Joshi, H. M.; Sastry, M.; Pokharkar, V. B., Chitosan reduced gold nanoparticles as novel carriers for transmucosal delivery of insulin. Pharmaceutical Research 2007, 24 (8), 1415-1426.
81. Joshi, H. M.; Bhumkar, D. R.; Joshi, K.; Pokharkar, V.; Sastry, M., Gold nanoparticles as carriers for efficient transmucosal insulin delivery. Langmuir 2006, 22 (1), 300-305.
82. Wang, B.; Feng, W. Y.; Wang, M.; Shi, J. W.; Zhang, F.; Ouyang, H.; Zhao, Y. L.; Chai, Z. F.; Huang, Y. Y.; Xie, Y. N., Transport of intranasally instilled fine Fe2O3 particles into the brain: micro-distribution, chemical states, and histopathological observation. Biological Trace Element Research 2007, 118 (3), 233-243.
83. Abbasi, E.; Kafshdooz, T.; Bakhtiary, M.; Nikzamir, N.; Nikzamir, N.; Nikzamir, M.; Mohammadian, M.; Akbarzadeh, A., Biomedical and biological applications of quantum dots. Artificial Cells Nanomedicine and Biotechnology 2016, 44 (3), 885-891.
84. Mieszawska, A. J.; Mulder, W. J. M.; Fayad, Z. A.; Cormode, D. P., Multifunctional gold nanoparticles for diagnosis and therapy of disease. Molecular Pharmaceutics 2013, 10 (3), 831-847.
85. Gao, J. H.; Gu, H. W.; Xu, B., Multifunctional magnetic nanoparticles: Design, synthesis, and biomedical applications. Accounts of Chemical Research 2009, 42 (8), 1097-1107.
86. Weir, A.; Westerhoff, P.; Fabricius, L.; von Goetz, N., Titanium dioxide nanoparticles in food and personal care products. Environmental Science & Technology 2012, 46 (4), 2242.
87. Bendall, J. S.; Paderi, M.; Ghigliotti, F.; Li Pira, N.; Lambertini, V.; Lesnyak, V.; Gaponik, N.; Visimberga, G.; Eychmüller, A.; Torres, C. M. S., Layer‐by‐layer all‐inorganic quantum‐dot‐based LEDs: A simple procedure with robust performance. Advanced Functional Materials 2010, 20 (19), 3298-3302.
88. Deng, Z. J.; Liang, M.; Monteiro, M.; Toth, I.; Minchin, R. F., Nanoparticle-induced unfolding of fibrinogen promotes Mac-1 receptor activation and inflammation. Nature Nanotechnology 2011, 6 (1), 39-44.

158
89. Wu, J.; Xie, H., Effects of titanium dioxide nanoparticles on α-synuclein aggregation and the ubiquitin-proteasome system in dopaminergic neurons. Artificial Cells, Nanomedicine, and Biotechnology 2016, 44 (2), 690-694.
90. Wang, B.; Feng, W.; Zhu, M.; Wang, Y.; Wang, M.; Gu, Y.; Ouyang, H.; Wang, H.; Li, M.; Zhao, Y., Neurotoxicity of low-dose repeatedly intranasal instillation of nano-and submicron-sized ferric oxide particles in mice. Journal of Nanoparticle Research 2009, 11 (1), 41-53.
91. Wu, J.; Wang, C.; Sun, J.; Xue, Y., Neurotoxicity of silica nanoparticles: Brain localization and dopaminergic neurons damage pathways. ACS Nano 2011, 5 (6), 4476-4489.
92. Genter, M. B.; Newman, N. C.; Shertzer, H. G.; Ali, S. F.; Bolon, B., Distribution and systemic effects of intranasally administered 25 nm silver nanoparticles in adult mice. Toxicologic Pathology 2012, 40 (7), 1004-1013.
93. Uner, M.; Yener, G., Importance of solid lipid nanoparticles (SLN) in various administration routes and future perspectives. International Journal of Nanomedicine 2007, 2 (3), 289.
94. MuÈller, R. H.; MaÈder, K.; Gohla, S., Solid lipid nanoparticles (SLN) for controlled drug delivery–a review of the state of the art. European Journal of Pharmaceutics and Biopharmaceutics 2000, 50 (1), 161-177.
95. Schwarz, C.; Mehnert, W.; Lucks, J.; Müller, R., Solid lipid nanoparticles (SLN) for controlled drug delivery. I. Production, characterization and sterilization. Journal of Controlled Release 1994, 30 (1), 83-96.
96. Kaur, I. P.; Bhandari, R.; Bhandari, S.; Kakkar, V., Potential of solid lipid nanoparticles in brain targeting. Journal of Controlled Release 2008, 127 (2), 97-109.
97. Martins, S. M.; Sarmento, B.; Nunes, C.; Lúcio, M.; Reis, S.; Ferreira, D. C., Brain targeting effect of camptothecin-loaded solid lipid nanoparticles in rat after intravenous administration. European Journal of Pharmaceutics and Biopharmaceutics 2013, 85 (3, Part A), 488-502.
98. Patel, S.; Chavhan, S.; Soni, H.; Babbar, A. K.; Mathur, R.; Mishra, A. K.; Sawant, K., Brain targeting of risperidone-loaded solid lipid nanoparticles by intranasal route. Journal of Drug Targeting 2011, 19 (6), 468-474.
99. Kumar, M.; Kakkar, V.; Mishra, A. K.; Chuttani, K.; Kaur, I. P., Intranasal delivery of streptomycin sulfate (STRS) loaded solid lipid nanoparticles to brain and blood. International Journal of Pharmaceutics 2014, 461 (1), 223-233.
100. Bhatt, R.; Singh, D.; Prakash, A.; Mishra, N., Development, characterization and nasal delivery of rosmarinic acid-loaded solid lipid nanoparticles for the effective management of Huntington’s disease. Drug Delivery 2015, 22 (7), 931-939.
159
101. Joshi, A. S.; Patel, H. S.; Belgamwar, V. S.; Agrawal, A.; Tekade, A. R., Solid lipid nanoparticles of ondansetron HCl for intranasal delivery: development, optimization and evaluation. Journal of Materials Science: Materials in Medicine 2012, 23 (9), 2163-2175.
102. Heurtault, B.; Frisch, B.; Pons, F., Liposomes as delivery systems for nasal vaccination: strategies and outcomes. Expert Opinion on Drug Delivery 2010, 7 (7), 829-844.
103. Ninomiya, A.; Ogasawara, K.; Kajino, K.; Takada, A.; Kida, H., Intranasal administration of a synthetic peptide vaccine encapsulated in liposome together with an anti-CD40 antibody induces protective immunity against influenza A virus in mice. Vaccine 2002, 20 (25–26), 3123-3129.
104. Tiwari, S.; Verma, S. K.; Agrawal, G. P.; Vyas, S. P., Viral protein complexed liposomes for intranasal delivery of hepatitis B surface antigen. International Journal of Pharmaceutics 2011, 413 (1), 211-219.
105. Rosada, R. S.; de la Torre, L. G.; Frantz, F. G.; Trombone, A. P.; Zárate-Bladés, C. R.; Fonseca, D. M.; Souza, P. R.; Brandão, I. T.; Masson, A. P.; Soares, É. G., Protection against tuberculosis by a single intranasal administration of DNA-hsp65 vaccine complexed with cationic liposomes. BMC Immunology 2008, 9 (1), 38.
106. Abraham, E.; Shah, S., Intranasal immunization with liposomes containing IL-2 enhances bacterial polysaccharide antigen-specific pulmonary secretory antibody response. The Journal of Immunology 1992, 149 (11), 3719-3726.
107. Tafaghodi, M.; Jaafari, M.-R.; Tabassi, S. A. S., Nasal immunization studies using liposomes loaded with tetanus toxoid and CpG-ODN. European Journal of Pharmaceutics and Biopharmaceutics 2006, 64 (2), 138-145.
108. Khatri, K.; Goyal, A. K.; Gupta, P. N.; Mishra, N.; Mehta, A.; Vyas, S. P., Surface modified liposomes for nasal delivery of DNA vaccine. Vaccine 2008, 26 (18), 2225-2233.
109. Yang, Z. Z.; Zhang, Y. Q.; Wang, Z. Z.; Wu, K.; Lou, J. N.; Qi, X. R., Enhanced brain distribution and pharmacodynamics of rivastigmine by liposomes following intranasal administration. International Journal of Pharmaceutics 2013, 452 (1-2), 344-354.
110. Allen, T. M.; Cullis, P. R., Liposomal drug delivery systems: from concept to clinical applications. Advanced Drug Delivery Reviews 2013, 65 (1), 36-48.
111. McClements, D. J., Nanoemulsions versus microemulsions: terminology, differences, and similarities. Soft Matter 2012, 8 (6), 1719-1729.
112. Lawrence, M. J., Microemulsions as drug delivery vehicles. Current Opinion in Colloid & Interface Science 1996, 1 (6), 826-832.

160
113. Kumar, M.; Misra, A.; Babbar, A. K.; Mishra, A. K.; Mishra, P.; Pathak, K., Intranasal nanoemulsion based brain targeting drug delivery system of risperidone. International Journal of Pharmaceutics 2008, 358 (1–2), 285-291.
114. Zhang, Q.; Jiang, X.; Jiang, W.; Lu, W.; Su, L.; Shi, Z., Preparation of nimodipine-loaded microemulsion for intranasal delivery and evaluation on the targeting efficiency to the brain. International Journal of Pharmaceutics 2004, 275 (1–2), 85-96.
115. Narang, A. S.; Delmarre, D.; Gao, D., Stable drug encapsulation in micelles and microemulsions. International Journal of Pharmaceutics 2007, 345 (1), 9-25.
116. Yang, S.; Gursoy, R. N.; Lambert, G.; Benita, S., Enhanced oral absorption of paclitaxel in a novel self-microemulsifying drug delivery system with or without concomitant use of P-glycoprotein inhibitors. Pharmaceutical Research 2004, 21 (2), 261-270.
117. Kang, B. K.; Lee, J. S.; Chon, S. K.; Jeong, S. Y.; Yuk, S. H.; Khang, G.; Lee, H. B.; Cho, S. H., Development of self-microemulsifying drug delivery systems (SMEDDS) for oral bioavailability enhancement of simvastatin in beagle dogs. International Journal of Pharmaceutics 2004, 274 (1), 65-73.
118. Gursoy, R. N.; Benita, S., Self-emulsifying drug delivery systems (SEDDS) for improved oral delivery of lipophilic drugs. Biomedicine and Pharmacotherapy 2004, 58 (3), 173-182.
119. Hosny, K. M.; Hassan, A. H., Intranasal in situ gel loaded with saquinavir mesylate nanosized microemulsion: Preparation, characterization, and in vivo evaluation. International Journal of Pharmaceutics 2014, 475 (1), 191-197.
120. Vyas, T. K.; Babbar, A.; Sharma, R.; Singh, S.; Misra, A., Intranasal mucoadhesive microemulsions of clonazepam: preliminary studies on brain targeting. Journal of Pharmaceutical Sciences 2006, 95 (3), 570-580.
121. Shah, B.; Khunt, D.; Misra, M.; Padh, H., Non-invasive intranasal delivery of quetiapine fumarate loaded microemulsion for brain targeting: formulation, physicochemical and pharmacokinetic consideration. European Journal of Pharmaceutical Sciences 2016, 91, 196-207.
122. Geraets, L.; Oomen, A. G.; Schroeter, J. D.; Coleman, V. A.; Cassee, F. R., Tissue distribution of inhaled micro-and nano-sized cerium oxide particles in rats: Results from a 28-day exposure study. Toxicological Sciences 2012, 127 (2), 463-473.
123. Kettler, K.; Veltman, K.; van de Meent, D.; van Wezel, A.; Hendriks, A. J., Cellular uptake of nanoparticles as determined by particle properties, experimental conditions, and cell type. Environmental Toxicology and Chemistry 2014, 33 (3), 481-492.

161
124. Resch-Genger, U.; Grabolle, M.; Cavaliere-Jaricot, S.; Nitschke, R.; Nann, T., Quantum dots versus organic dyes as fluorescent labels. Nature Methods 2008, 5 (9), 763-775.
125. Robe, A.; Pic, E.; Lassalle, H.-P.; Bezdetnaya, L.; Guillemin, F.; Marchal, F., Quantum dots in axillary lymph node mapping: biodistribution study in healthy mice. BMC Cancer 2008, 8 (1), 111.
126. Fitzpatrick, J. A.; Andreko, S. K.; Ernst, L. A.; Waggoner, A. S.; Ballou, B.; Bruchez, M. P., Long term persistence and spectral blue shifting of quantum dots in vivo. Nano Letters 2009, 9 (7), 2736.
127. Schipper, M. L.; Iyer, G.; Koh, A. L.; Cheng, Z.; Ebenstein, Y.; Aharoni, A.; Keren, S.; Bentolila, L. A.; Li, J.; Rao, J., Particle size, surface coating, and PEGylation influence the biodistribution of quantum dots in living mice. Small 2009, 5 (1), 126-134.
128. Fischer, H. C.; Liu, L.; Pang, K. S.; Chan, W. C., Pharmacokinetics of nanoscale quantum dots: in vivo distribution, sequestration, and clearance in the rat. Advanced Functional Materials 2006, 16 (10), 1299-1305.
129. Choi, H. S.; Ipe, B. I.; Misra, P.; Lee, J. H.; Bawendi, M. G.; Frangioni, J. V., Tissue-and organ-selective biodistribution of NIR fluorescent quantum dots. Nano Letters 2009, 9 (6), 2354.
130. Kato, S.; Itoh, K.; Yaoi, T.; Tozawa, T.; Yoshikawa, Y.; Yasui, H.; Kanamura, N.; Hoshino, A.; Manabe, N.; Yamamoto, K.; Fushiki, S., Organ distribution of quantum dots after intraperitoneal administration, with special reference to area-specific distribution in the brain. Nanotechnology 2010, 21 (33).
131. Choi, H. S.; Liu, W.; Misra, P.; Tanaka, E.; Zimmer, J. P.; Ipe, B. I.; Bawendi, M. G.; Frangioni, J. V., Renal clearance of quantum dots. Nature Biotechnology 2007, 25 (10), 1165-1170.
132. Kandimalla, K. K.; Donovan, M. D., Carrier mediated transport of chlorpheniramine and chlorcyclizine across bovine olfactory mucosa: Implications on nose‐to‐brain transport. Journal of Pharmaceutical Sciences 2005, 94 (3), 613-624.
133. Hoshino, A.; Fujioka, K.; Oku, T.; Suga, M.; Sasaki, Y. F.; Ohta, T.; Yasuhara, M.; Suzuki, K.; Yamamoto, K., Physicochemical properties and cellular toxicity of nanocrystal quantum dots depend on their surface modification. Nano Letters 2004, 4 (11), 2163-2170.
134. Fischer, H. C.; Fournier-Bidoz, S.; Chan, W.; Pang, K., Quantitative detection of engineered nanoparticles in tissues and organs: An investigation of efficacy and linear dynamic ranges using ICP-AES. Nanobiotechnology 2007, 3 (1), 46-54.
135. Simultaneous determination of manganese and nickel in steel by inductively coupled plasma atomic emission spectrometry.

162
https://sites.google.com/a/cord.edu/analytical-chemistry-lab-manual---fall-2015/experiments/icp-aes (accessed 05 April 2017).
136. McBride, M. B., A comparison of reliability of soil cadmium determination by standard spectrometric methods. Journal of Environmental Quality 2011, 40 (6), 1863-9.
137. Smith, A. M.; Gao, X.; Nie, S., Quantum dot nanocrystals for in vivo molecular and cellular imaging. Photochemistry and Photobiology 2004, 80 (3), 377-385.
138. Domingos, R. F.; Franco, C.; Pinheiro, J. P., Stability of core/shell quantum dots-role of pH and small organic ligands. Environmental Science and Pollution Research International 2013, 20 (7), 4872-80.
139. Brauser, E.; Bartl, M.; Rose, P. In Thermal stability and chemistry of fluorescent nanocrystals for use as a novel geothermal tracer, Thirty-Eighth Workshop on Geothermal Reservoir Engineerin, Stanford University, Stanford, California, Stanford University, Stanford, California.
140. Williams, D. B.; Carter, C. B., The transmission electron microscope. In Transmission Electron Microscopy, Springer: 1996; pp 3-17.
141. Zhang, S.; Li, J.; Lykotrafitis, G.; Bao, G.; Suresh, S., Size-dependent endocytosis of nanoparticles. Advanced Materials 2009, 21 (4), 419-424.
142. Dausend, J.; Musyanovych, A.; Dass, M.; Walther, P.; Schrezenmeier, H.; Landfester, K.; Mailänder, V., Uptake mechanism of oppositely charged fluorescent nanoparticles in HeLa cells. Macromolecular Bioscience 2008, 8 (12), 1135-1143.
143. Rejman, J.; Oberle, V.; Zuhorn, I. S.; Hoekstra, D., Size-dependent internalization of particles via the pathways of clathrin- and caveolae-mediated endocytosis. Biochemical Journal 2004, 377 (Pt 1), 159-69.
144. Lim, J. P.; Gleeson, P. A., Macropinocytosis: an endocytic pathway for internalising large gulps. Immunology and Cell Biology 2011, 89 (8), 836-43.
145. Zhang, L. W.; Monteiro-Riviere, N. A., Mechanisms of quantum dot nanoparticle cellular uptake. Toxicological Sciences 2009, 110 (1), 138-155.
146. Alpar, H.; Almeida, A.; Brown, M., Microsphere absorption by the nasal mucosa of the rat. Journal of Drug Targeting 1994, 2 (2), 147-149.
147. Yoo, J.-W.; Chambers, E.; Mitragotri, S., Factors that control the circulation time of nanoparticles in blood: challenges, solutions and future prospects. Current Pharmaceutical Design 2010, 16 (21), 2298-2307.

163
148. Vila, A.; Sanchez, A.; Evora, C.; Soriano, I.; Vila Jato, J.; Alonso, M., PEG-PLA nanoparticles as carriers for nasal vaccine delivery. Journal of Aerosol Medicine 2004, 17 (2), 174-185.
149. Murali, K.; Kenesei, K.; Li, Y.; Demeter, K.; Környei, Z.; Madarász, E., Uptake and bio-reactivity of polystyrene nanoparticles is affected by surface modifications, ageing and LPS adsorption: in vitro studies on neural tissue cells. Nanoscale 2015, 7 (9), 4199-4210.
150. He, C.; Hu, Y.; Yin, L.; Tang, C.; Yin, C., Effects of particle size and surface charge on cellular uptake and biodistribution of polymeric nanoparticles. Biomaterials 2010, 31 (13), 3657-3666.
151. Xiao, Y.; Forry, S. P.; Gao, X.; Holbrook, R. D.; Telford, W. G.; Tona, A., Dynamics and mechanisms of quantum dot nanoparticle cellular uptake. Journal of Nanobiotechnology 2010, 8 (1), 13.
152. Jiang, X.; Röcker, C.; Hafner, M.; Brandholt, S.; Dörlich, R. M.; Nienhaus, G. U., Endo- and Exocytosis of Zwitterionic Quantum Dot Nanoparticles by Live HeLa Cells. ACS Nano 2010, 4 (11), 6787-6797.
153. Kelf, T.; Sreenivasan, V.; Sun, J.; Kim, E.; Goldys, E.; Zvyagin, A., Non-specific cellular uptake of surface-functionalized quantum dots. Nanotechnology 2010, 21 (28), 285105.
154. Kerr, M. C.; Teasdale, R. D., Defining macropinocytosis. Traffic 2009, 10 (4), 364-71.
155. Liu, Q.; Shen, Y.; Chen, J.; Gao, X.; Feng, C.; Wang, L.; Zhang, Q.; Jiang, X., Nose-to-brain transport pathways of wheat germ agglutinin conjugated PEG-PLA nanoparticles. Pharmaceutical Research 2012, 29 (2), 546-558.
156. Md, S.; Khan, R. A.; Mustafa, G.; Chuttani, K.; Baboota, S.; Sahni, J. K.; Ali, J., Bromocriptine loaded chitosan nanoparticles intended for direct nose to brain delivery: pharmacodynamic, pharmacokinetic and scintigraphy study in mice model. European Journal of Pharmaceutical Sciences 2013, 48 (3), 393-405.
157. Seju, U.; Kumar, A.; Sawant, K., Development and evaluation of olanzapine-loaded PLGA nanoparticles for nose-to-brain delivery: in vitro and in vivo studies. Acta Biomaterialia 2011, 7 (12), 4169-4176.
158. Al-Ghananeem, A. M.; Saeed, H.; Florence, R.; Yokel, R. A.; Malkawi, A. H., Intranasal drug delivery of didanosine-loaded chitosan nanoparticles for brain targeting; an attractive route against infections caused by AIDS viruses. Journal of Drug Targeting 2010, 18 (5), 381-388.

164
159. Yu, L. E.; Lanry Yung, L.-Y.; Ong, C.-N.; Tan, Y.-L.; Suresh Balasubramaniam, K.; Hartono, D.; Shui, G.; Wenk, M. R.; Ong, W.-Y., Translocation and effects of gold nanoparticles after inhalation exposure in rats. Nanotoxicology 2007, 1 (3), 235-242.
160. Almeida, A.; Alpar, H.; Brown, M., Immune response to nasal delivery of antigenically intact tetanus toxoid associated with poly (l‐lactic acid) microspheres in rats, rabbits and guinea‐pigs. Journal of Pharmacy and Pharmacology 1993, 45 (3), 198-203.
161. Kumar, N. N.; Gautam, M.; Lochhead, J. J.; Wolak, D. J.; Ithapu, V.; Singh, V.; Thorne, R. G., Relative vascular permeability and vascularity across different regions of the rat nasal mucosa: implications for nasal physiology and drug delivery. Scientific Reports 2016, 6, 31732.
162. Leblond, F.; Davis, S. C.; Valdés, P. A.; Pogue, B. W., Pre-clinical whole-body fluorescence imaging: Review of instruments, methods and applications. Journal of Photochemistry and Photobiology B: Biology 2010, 98 (1), 77-94.
163. Rao, J.; Dragulescu-Andrasi, A.; Yao, H., Fluorescence imaging in vivo: recent advances. Current Opinion in Biotechnology 2007, 18 (1), 17-25.
164. Frangioni, J. V., In vivo near-infrared fluorescence imaging. Current Opinion in Chemical Biology 2003, 7 (5), 626-634.
165. Holdsworth, D. W.; Thornton, M. M., Micro-CT in small animal and specimen imaging. Trends in Biotechnology 2002, 20 (8), S34-S39.
166. Domey, J.; Teichgräber, U.; Hilger, I., Gold nanoparticles allow detection of early-stage edema in mice via computed tomography imaging. International Journal of Nanomedicine 2015, 10, 3803.
167. Peng, C.; Zheng, L.; Chen, Q.; Shen, M.; Guo, R.; Wang, H.; Cao, X.; Zhang, G.; Shi, X., PEGylated dendrimer-entrapped gold nanoparticles for in vivo blood pool and tumor imaging by computed tomography. Biomaterials 2012, 33 (4), 1107-1119.
168. Kim, D. E.; Kim, J. Y.; Sun, I. C.; Schellingerhout, D.; Lee, S. K.; Ahn, C. H.; Kwon, I. C.; Kim, K., Hyperacute direct thrombus imaging using computed tomography and gold nanoparticles. Annals of Neurology 2013, 73 (5), 617-625.
169. Andersen, M. L.; Tufik, S., Rodent model as tools in ethical biomedical research. Springer: 2015.
170. Adams, K. E.; Ke, S.; Kwon, S.; Liang, F.; Fan, Z.; Lu, Y.; Hirschi, K.; Mawad, M. E.; Barry, M. A.; Sevick-Muraca, E. M., Comparison of visible and near-infrared wavelength-excitable fluorescent dyes for molecular imaging of cancer. Journal of Biomedical Optics 2007, 12 (2), 024017-024017-9.

165
171. Hong, H.; Zhang, Y.; Severin, G. W.; Yang, Y.; Engle, J. W.; Niu, G.; Nickles, R. J.; Chen, X.; Leigh, B. R.; Barnhart, T. E., Multimodality imaging of breast cancer experimental lung metastasis with bioluminescence and a monoclonal antibody dual-labeled with 89Zr and IRDye 800CW. Molecular Pharmaceutics 2012, 9 (8), 2339.
172. Kovar, J. L.; Simpson, M. A.; Schutz-Geschwender, A.; Olive, D. M., A systematic approach to the development of fluorescent contrast agents for optical imaging of mouse cancer models. Biochemistry--Faculty Publications 2007, 9.
173. IRDye 800CW Dye Structures. https://www.licor.com/bio/products/reagents/irdye/800cw/structure.html (accessed 27 April 2017).
174. Marshall, M. V.; Draney, D.; Sevick-Muraca, E. M.; Olive, D. M., Single-dose intravenous toxicity study of IRDye 800CW in Sprague-Dawley rats. Molecular Imaging and Biology 2010, 12 (6), 583-594.
175. Yardeni, T.; Eckhaus, M.; Morris, H. D.; Huizing, M.; Hoogstraten-Miller, S., Retro-orbital injections in mice. Lab Animal 2011, 40 (5), 155.
176. Illum, L.; Davis, S., The organ uptake of intravenously administered colloidal particles can be altered using a non-ionic surfactant (Poloxamer 338). FEBS Letters 1984, 167 (1), 79-82.
177. Mistry, A.; Glud, S. Z.; Kjems, J.; Randel, J.; Howard, K. A.; Stolnik, S.; Illum, L., Effect of physicochemical properties on intranasal nanoparticle transit into murine olfactory epithelium. Journal of Drug Targeting 2009, 17 (7), 543-552.
178. Zhang, X. G.; Zhang, H. J.; Wu, Z. M.; Wang, Z.; Niu, H. M.; Li, C. X., Nasal absorption enhancement of insulin using PEG-grafted chitosan nanoparticles. European Journal of Pharmaceutics and Biopharmaceutics 2008, 68 (3), 526-534.
179. Gao, X. L.; Tao, W. X.; Lu, W.; Zhang, Q. Z.; Zhang, Y.; Jiang, X. G.; Fu, S. K., Lectin-conjugated PEG-PLA nanoparticles: Preparation and brain delivery after intranasal administration. Biomaterials 2006, 27 (18), 3482-3490.
180. Chithrani, B. D.; Chan, W. C., Elucidating the mechanism of cellular uptake and removal of protein-coated gold nanoparticles of different sizes and shapes. Nano Letters 2007, 7 (6), 1542-1550.
181. Pepić, I.; Lovrić, J.; Filipović-Grčić, J., How do polymeric micelles cross epithelial barriers? European Journal of Pharmaceutical Sciences 2013, 50 (1), 42-55.
182. Patel, R. B.; Patel, M. R.; Bhatt, K. K.; Patel, B. G., Risperidone-Loaded Mucoadhesive Microemulsion for Intranasal Delivery: Formulation Development, Physicochemical Characterization and Ex Vivo Evaluation. Journal of Drug Delivery Science and Technology 2013, 23 (6), 561-567.

166
183. Patel, R. B.; Patel, M. R.; Bhatt, K. K.; Patel, B. G., Formulation consideration and characterization of microemulsion drug delivery system for transnasal administration of carbamazepine. Bulletin of Faculty of Pharmacy, Cairo University 2013, 51 (2), 243-253.
184. Patel, R. B.; Patel, M. R.; Bhatt, K. K.; Patel, B. G.; Gaikwad, R. V., Evaluation of brain targeting efficiency of intranasal microemulsion containing olanzapine: pharmacodynamic and pharmacokinetic consideration. Drug Delivery 2016, 23 (1), 307-15.
185. Patel, M. R.; Patel, R. B.; Bhatt, K. K.; Patel, B. G.; Gaikwad, R. V., Paliperidone microemulsion for nose-to-brain targeted drug delivery system: pharmacodynamic and pharmacokinetic evaluation. Drug Delivery 2016, 23 (1), 346-54.
186. Shinde, R. L.; Bharkad, G. P.; Devarajan, P. V., Intranasal microemulsion for targeted nose to brain delivery in neurocysticercosis: Role of docosahexaenoic acid. European Journal of Pharmaceutics and Biopharmaceutics 2015, 96, 363-79.
187. Bshara, H.; Osman, R.; Mansour, S.; El-Shamy Ael, H., Chitosan and cyclodextrin in intranasal microemulsion for improved brain buspirone hydrochloride pharmacokinetics in rats. Carbohydr Polym 2014, 99, 297-305.
188. Singh, B.; Bandopadhyay, S.; Kapil, R.; Singh, R.; Katare, O., Self-emulsifying drug delivery systems (SEDDS): formulation development, characterization, and applications. Critical Reviews in Therapeutic Drug Carrier Systems 2009, 26 (5), 427-521.
189. He, C. X.; He, Z. G.; Gao, J. Q., Microemulsions as drug delivery systems to improve the solubility and the bioavailability of poorly water-soluble drugs. Expert Opinon on Drug Delivery 2010, 7 (4), 445-60.
190. Lawrence, M. J.; Rees, G. D., Microemulsion-based media as novel drug delivery systems. Advanced Drug Delivery Reviews 2012, 64, 175-193.
191. Sarciaux, J. M.; Acar, L.; Sado, P. A., Using microemulsion formulations for oral drug delivery of therapeutic peptides. International Journal of Pharmaceutics 1995, 120 (2), 127-136.
192. Ghosh, P. K.; Majithiya, R. J.; Umrethia, M. L.; Murthy, R. S. R., Design and development of microemulsion drug delivery system of acyclovir for improvement of oral bioavailability. AAPS PharmSciTech 2006, 7 (3), E172-E177.
193. Sintov, A. C.; Shapiro, L., New microemulsion vehicle facilitates percutaneous penetration in vitro and cutaneous drug bioavailability in vivo. Journal of Controlled Release 2004, 95 (2), 173-183.
194. Kogan, A.; Garti, N., Microemulsions as transdermal drug delivery vehicles. Advances in Colloid and Interface Science 2006, 123–126, 369-385.

167
195. Klang, S. H.; Siganos, C. S.; Benita, S.; Frucht-Pery, J., Evaluation of a positively charged submicron emulsion of piroxicam on the rabbit corneum healing process following alkali burn. Journal of Controlled Release 1999, 57 (1), 19-27.
196. Gan, L.; Gan, Y.; Zhu, C.; Zhang, X.; Zhu, J., Novel microemulsion in situ electrolyte-triggered gelling system for ophthalmic delivery of lipophilic cyclosporine A: in vitro and in vivo results. International Journal of Pharmaceutics 2009, 365 (1-2), 143-9.
197. Jogani, V. V.; Shah, P. J.; Mishra, P.; Mishra, A. K.; Misra, A. R., Intranasal mucoadhesive microemulsion of tacrine to improve brain targeting. Alzheimer Disease and Associated Disorders 2008, 22 (2), 116-124.
198. Kumar, M.; Misra, A.; Babbar, A. K.; Mishra, A. K.; Mishra, P.; Pathak, K., Intranasal nanoemulsion based brain targeting drug delivery system of risperidone. International Journal of Pharmaceutics 2008, 358 (1-2), 285-291.
199. Li, L. L.; Nandi, I.; Kim, K. H., Development of an ethyl laurate-based microemulsion for rapid-onset intranasal delivery of diazepam. International Journal of Pharmaceutics 2002, 237 (1-2), 77-85.
200. Vyas, T. K.; Babbar, A. K.; Sharma, R. K.; Misra, A., Intranasal mucoadhesive microemulsions of zolmitriptan: Preliminary studies on brain-targeting. Journal of Drug Targeting 2005, 13 (5), 317-324.
201. Zhang, Q. Z.; Jiang, X. G.; Jiang, W. M.; Lu, W.; Su, L. N.; Shi, Z. Q., Preparation of nimodipine-loaded microemulsion for intranasal delivery and evaluation on the targeting efficiency to the brain. International Journal of Pharmaceutics 2004, 275 (1-2), 85-96.
202. Gupta, S.; Kesarla, R.; Omri, A., Formulation strategies to improve the bioavailability of poorly absorbed drugs with special emphasis on self-emulsifying systems. ISRN Pharmaceutics 2013, 2013, 848043.
203. National Center for Biotechnology Information Diazepam. PubChem Compound Database; CID=3016. https://pubchem.ncbi.nlm.nih.gov/compound/diazepam (accessed May 30).
204. Fitzgerald, B. J.; Okos, A. J.; Miller, J. W., Treatment of out-of-hospital status epilepticus with diazepam rectal gel. Seizure 2003, 12 (1), 52-5.
205. Henney, H. R.; Sperling, M. R.; Rabinowicz, A. L.; Bream, G.; Carrazana, E. J., Assessment of pharmacokinetics and tolerability of intranasal diazepam relative to rectal gel in healthy adults. Epilepsy Research 2014, 108 (7), 1204-1211.
206. Therapeutics, A., Acorda to discontinue development of PLUMIAZ for treatment of epilepsy seizure clusters. Business Wire, 2016.

168
207. Agarwal, S. K.; Kriel, R. L.; Brundage, R. C.; Ivaturi, V. D.; Cloyd, J. C., A pilot study assessing the bioavailability and pharmacokinetics of diazepam after intranasal and intravenous administration in healthy volunteers. Epilepsy Research 2013, 105 (3), 362-367.
208. Ivaturi, V. D.; Riss, J. R.; Kriel, R. L.; Siegel, R. A.; Cloyd, J. C., Bioavailability and tolerability of intranasal diazepam in healthy adult volunteers. Epilepsy Research 2009, 84 (2), 120-126.
209. Ktistis, G., A viscosity study on oil-in-water microemulsions. International Journal of Pharmaceutics 1990, 61 (3), 213-218.
210. Attwood, D.; Ktistis, G., A light scattering study on oil-in-water microemulsions. International Journal of Pharmaceutics 1989, 52 (2), 165-171.

169
APPENDIX-A
Technical Specifications and Optical Spectrum of COOH-QDs
Table A-1 Specifications of COOH-QDs provided by NN-Labs, LLC (Fayetteville, AR). Catalog # CZW-R.
Composition Cadmium Selenide / Zinc sulfide
Stabilizing ligand Carboxylic acid ligand (mercaptoundecanoic acid)
Organic impurities <1% (not including ligands)
Solvent Water
Concentration 1 mg/mL
Cd content Each mg of QD contains 0.350 mg of Cd
Absorption and emission spectrum See Figure A-1
Figure A.1 Typical UV-Vis absorption (a) and emission (b) spectrum of COOH-QDs purchased from NN-Labs, Inc (Fayetteville, AR), Lot # LW074414A21104.
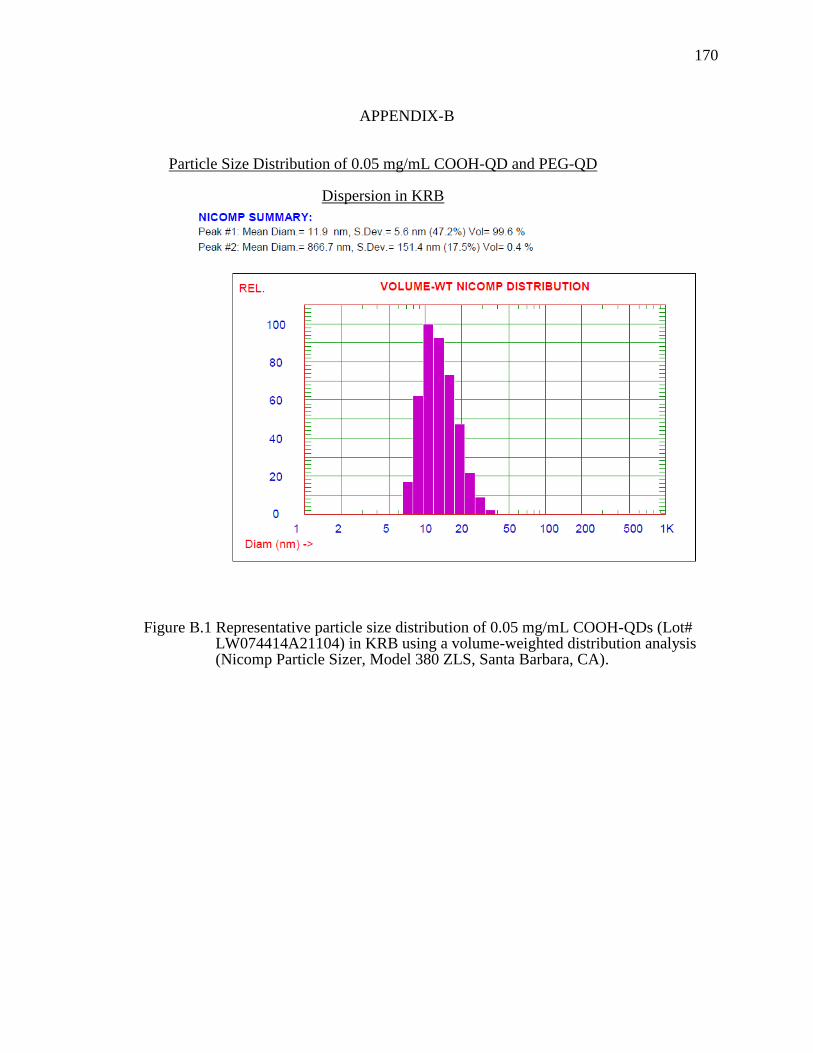
170
APPENDIX-B
Particle Size Distribution of 0.05 mg/mL COOH-QD and PEG-QD
Dispersion in KRB
Figure B.1 Representative particle size distribution of 0.05 mg/mL COOH-QDs (Lot# LW074414A21104) in KRB using a volume-weighted distribution analysis (Nicomp Particle Sizer, Model 380 ZLS, Santa Barbara, CA).

171
Figure B.2 Representative particle size distribution of 0.05 mg/mL PEG-QDs (Lot# LW134414A23108) in KRB using a volume-weighted distribution analysis (Nicomp Particle Sizer, Model 380 ZLS, Santa Barbara, CA).

172
172
APPENDIX-C
Data Showing Efficiency of ICP-OES Measurements in Presence of Blank Tissues
Table C-1 Correlation between theoretical mass of Cd as added QDs to blank olfactory tissues and the Cd concentration measured from the digested samples of those tissues. QD dispersion (0.2 mL) spiked into known olfactory tissue weight and digested in 1 mL of nitric acid followed by dilution to 10 mL with DI water.
Concentration of QD spiked
(mg/mL)
Concentration of Cd spiked
(ng/mL)
Theoretical Mass of QDs
(μg)
Olfactory Tissue Weights
(g)
Theoretical Mass of QDs
per g of Olfactory
Tissue (μg/g)
Measured concentration of Cd (ng/mL)
Measured Mass of QDs (μg)
Calculated Mass of QDs
per g of Olfactory
Tissue (μg/g)
0.01 70 2 0.0901 22.4 69.2 1.98 22.0
0.02 140 4 0.0608 69.7 136.7 3.90 67.7
0.05 350 10 0.0879 122.5 349.2 9.98 121.7
0.1 700 20 0.0586 347.4 698.8 19.96 346.7
From manufacturer specification each mg of QD contains 350 μg of Cd
Calibration curve equation using known standards of Cd was y=4.5567x, r2=0.994

173
173
Table C-2 Correlation between theoretical mass of Cd as added QDs to blank respiratory tissues and the Cd concentration measured from the digested samples of those tissues. QD dispersion (0.2 mL) spiked into known respiratory tissue weight and digested in 1 mL of nitric acid followed by dilution to 10 mL with DI water.
Concentration of QD spiked
(mg/mL)
Concentration of Cd spiked
(ng/mL)
Theoretical Mass of QDs
(μg)
Respiratory Tissue Weight
(g)
Theoretical Mass of QDs
per g of Respiratory
Tissue (μg/g)
Measured concentration of
Cd (ng/mL) Measured Mass
of QDs (μg)
Calculated Mass of QDs
per g of Olfactory
Tissue (μg/g)
0.01 70 2 0.0906 22.2 69.7 1.99 22.1
0.02 140 4 0.1320 31.5 140.2 4.00 31.6
0.05 350 10 0.1073 93.2 346.6 9.90 92.3
0.1 700 20 0.1240 162.7 699.6 19.99 162.7
From manufacturer specification each mg of QD contains 350 μg of Cd
Calibration curve equation using known standards of Cd was y=4.5567x, r2=0.994
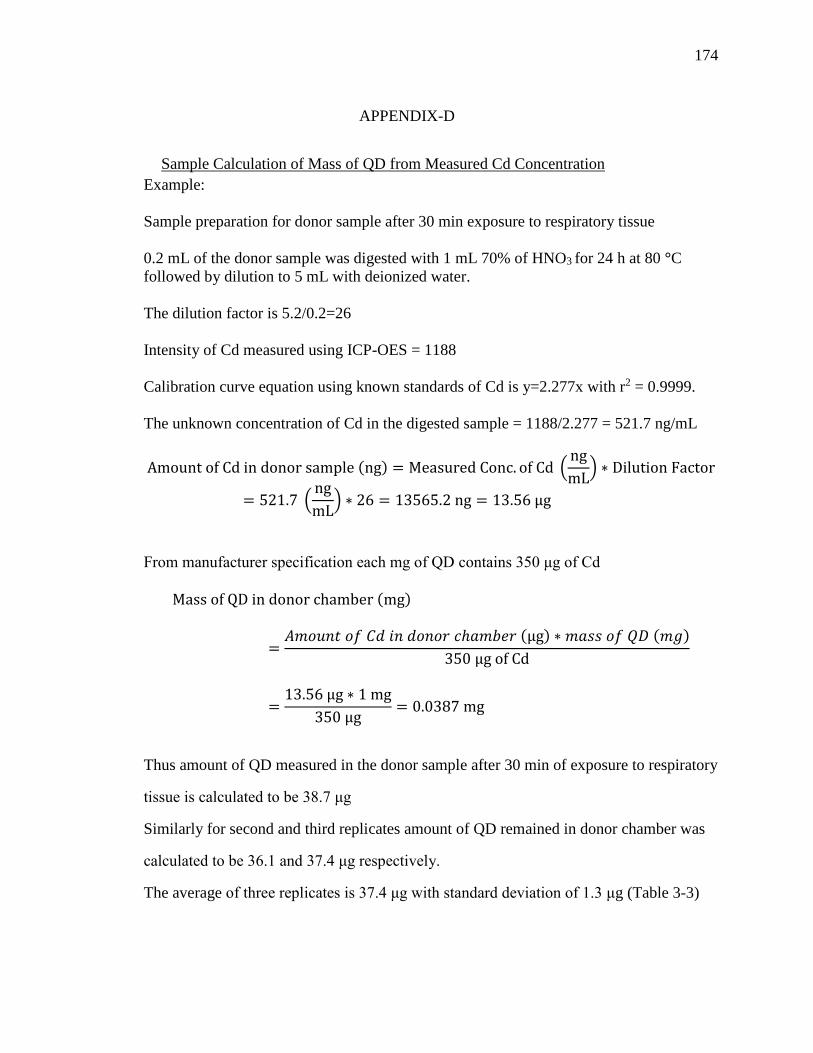
174
APPENDIX-D
Sample Calculation of Mass of QD from Measured Cd Concentration
Example:
Sample preparation for donor sample after 30 min exposure to respiratory tissue
0.2 mL of the donor sample was digested with 1 mL 70% of HNO3 for 24 h at 80 °C
followed by dilution to 5 mL with deionized water.
The dilution factor is 5.2/0.2=26
Intensity of Cd measured using ICP-OES = 1188
Calibration curve equation using known standards of Cd is y=2.277x with r2 = 0.9999.
The unknown concentration of Cd in the digested sample = 1188/2.277 = 521.7 ng/mL
Amount of Cd in donor sample (ng) = Measured Conc. of Cd (ng
mL) ∗ Dilution Factor
= 521.7 (ng
mL) ∗ 26 = 13565.2 ng = 13.56 μg
From manufacturer specification each mg of QD contains 350 μg of Cd
Mass of QD in donor chamber (mg)
=𝐴𝑚𝑜𝑢𝑛𝑡 𝑜𝑓 𝐶𝑑 𝑖𝑛 𝑑𝑜𝑛𝑜𝑟 𝑐ℎ𝑎𝑚𝑏𝑒𝑟 (μg) ∗ 𝑚𝑎𝑠𝑠 𝑜𝑓 𝑄𝐷 (𝑚𝑔)
350 μg of Cd
=13.56 μg ∗ 1 mg
350 μg= 0.0387 mg
Thus amount of QD measured in the donor sample after 30 min of exposure to respiratory
tissue is calculated to be 38.7 μg
Similarly for second and third replicates amount of QD remained in donor chamber was
calculated to be 36.1 and 37.4 μg respectively.
The average of three replicates is 37.4 μg with standard deviation of 1.3 μg (Table 3-3)

175
175
APPENDIX-E
TEER Measurements Representing Respiratory and Olfactory Tissue Integrity
Table E-1 TEER values across respiratory and olfactory tissues exposed to COOH-QD dispersion measured at the beginning and end of the transport study for each time point. Values represent maintenance of tissue integrity before and after the transport.
Tissue Type Time (min)
TEER (Ω.cm2)
Experiment 1 Experiment 2 Experiment 3 Mean (std. dev)
Beginning End Beginning End Beginning End Beginning End
Respiratory
30 225 236 292 307 284 332 267 (37) 292 (50)
60 249 259 276 274 230 233 252 (23) 255 (21)
120 247 274 360 383 264 315 290 (61) 324 (55)
Olfactory
30 190 180 193 182 261 255 215 (40) 206 (43)
60 265 266 210 203 220 219 232 (29) 229 (33)
120 202 195 211 189 264 255 226 (34) 213 (36)

176
APPENDIX-F
Sequential Fluorescence Images from Individual Mice after Intranasal
Administration of COOH-QDs
Figure F.1 Fluorescence images co-registered with x-ray images from individual mice showing the distribution of COOH-QDs after intranasal administration. The red color represents the fluorescence signal from COOH-QDs.

177
Figure F.2 Fluorescence images co-registered with x-ray images of euthanized individual mice with exposed nasal cavities observed 24 h after intranasal administration of COOH-QDs. The red color represents the fluorescence signal from COOH-QDs.

178
Sequential Fluorescence Images from Individual Mice after Intravenous
Administration of COOH-QDs
Figure F.3 Fluorescence images co-registered with x-ray images from individual mice showing the distribution of COOH-QDs after intravenous (retro-orbital injection) administration. The red color represents the fluorescence signal from COOH-QDs. Mouse 2 died after the 2 h time point.

179
Figure F.4 Fluorescence images co-registered with x-ray images of euthanized individual mice with exposed nasal cavities observed 24 h after intravenous administration of COOH-QDs.

180
Sequential Fluorescence Images of Individual Mice after Intranasal
Administration of PEG-QDs
Figure F.5 Fluorescence images co-registered with x-ray images from individual mice showing the distribution of PEG-QDs after intranasal administration. The red color represents the fluorescence signal from PEG-QDs.

181
Figure F.6 Fluorescence images co-registered with x-ray images of euthanized individual mice with exposed nasal cavities observed 24 h after intranasal administration of PEG-QDs.

182
Sequential Fluorescence Images of Individual Mice after Intranasal
Administration of COOH-QDs in the Presence of an Endocytic Inhibitor
Cocktail
Figure F.7 Fluorescence images co-registered with x-ray images of individual mice showing the distribution of COOH-QDs in the presence of an endocytic inhibitor cocktail following intranasal administration. The red color represents the fluorescence signal from COOH-QDs.

183
Figure F.8 Fluorescence images co-registered with x-ray images of euthanized individual mice with exposed nasal cavities observed 24 h after intranasal administration of COOH-QDs in the presence of an endocytic cocktail inhibitor. The red color represents the fluorescence signal from COOH-QDs.
Copyright © 2022 FDOKUMEN