Fabrication of ultrafine powder from eri silk through attritor and jet milling
Upload
independentCategory
view
1download
0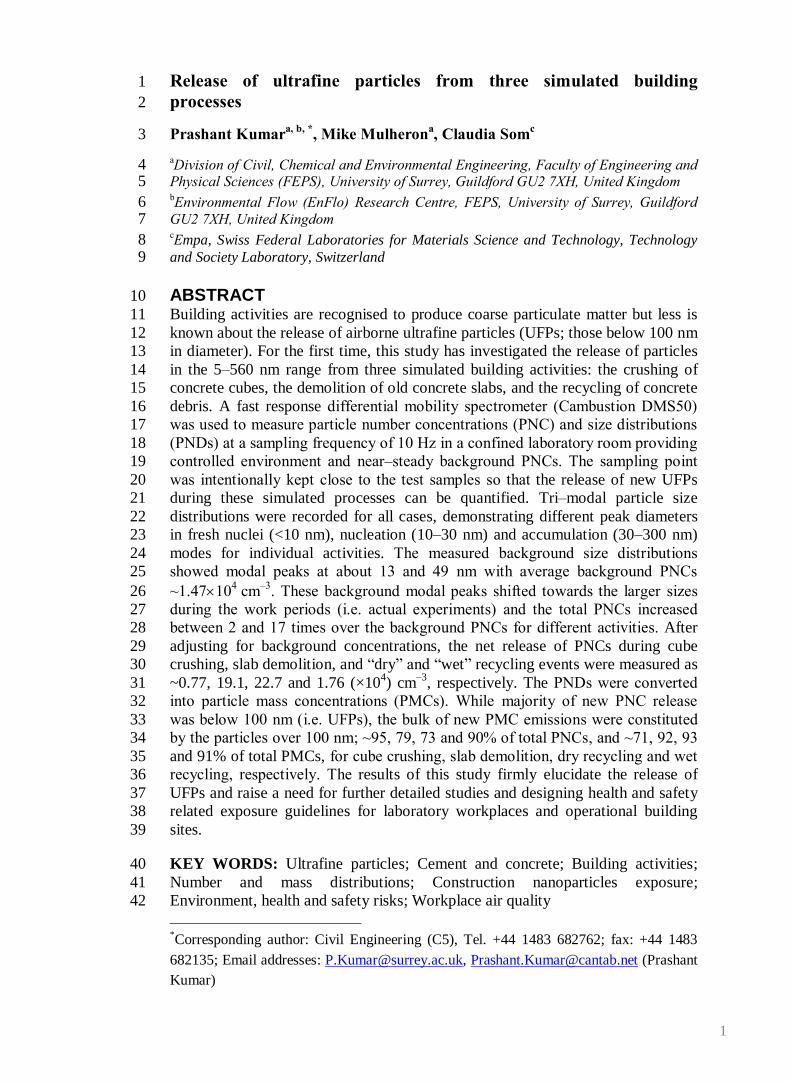
1
Release of ultrafine particles from three simulated building 1
processes 2
Prashant Kumara, b, *
, Mike Mulherona, Claudia Som
c 3
aDivision of Civil, Chemical and Environmental Engineering, Faculty of Engineering and 4
Physical Sciences (FEPS), University of Surrey, Guildford GU2 7XH, United Kingdom 5 bEnvironmental Flow (EnFlo) Research Centre, FEPS, University of Surrey, Guildford 6
GU2 7XH, United Kingdom 7 cEmpa, Swiss Federal Laboratories for Materials Science and Technology, Technology 8
and Society Laboratory, Switzerland 9
ABSTRACT 10
Building activities are recognised to produce coarse particulate matter but less is 11
known about the release of airborne ultrafine particles (UFPs; those below 100 nm 12
in diameter). For the first time, this study has investigated the release of particles 13
in the 5–560 nm range from three simulated building activities: the crushing of 14
concrete cubes, the demolition of old concrete slabs, and the recycling of concrete 15
debris. A fast response differential mobility spectrometer (Cambustion DMS50) 16
was used to measure particle number concentrations (PNC) and size distributions 17
(PNDs) at a sampling frequency of 10 Hz in a confined laboratory room providing 18
controlled environment and near–steady background PNCs. The sampling point 19
was intentionally kept close to the test samples so that the release of new UFPs 20
during these simulated processes can be quantified. Tri–modal particle size 21
distributions were recorded for all cases, demonstrating different peak diameters 22
in fresh nuclei (<10 nm), nucleation (10–30 nm) and accumulation (30–300 nm) 23
modes for individual activities. The measured background size distributions 24
showed modal peaks at about 13 and 49 nm with average background PNCs 25
~1.47104
cm–3
. These background modal peaks shifted towards the larger sizes 26
during the work periods (i.e. actual experiments) and the total PNCs increased 27
between 2 and 17 times over the background PNCs for different activities. After 28
adjusting for background concentrations, the net release of PNCs during cube 29
crushing, slab demolition, and “dry” and “wet” recycling events were measured as 30
~0.77, 19.1, 22.7 and 1.76 (×104) cm
–3, respectively. The PNDs were converted 31
into particle mass concentrations (PMCs). While majority of new PNC release 32
was below 100 nm (i.e. UFPs), the bulk of new PMC emissions were constituted 33
by the particles over 100 nm; ~95, 79, 73 and 90% of total PNCs, and ~71, 92, 93 34
and 91% of total PMCs, for cube crushing, slab demolition, dry recycling and wet 35
recycling, respectively. The results of this study firmly elucidate the release of 36
UFPs and raise a need for further detailed studies and designing health and safety 37
related exposure guidelines for laboratory workplaces and operational building 38
sites. 39
KEY WORDS: Ultrafine particles; Cement and concrete; Building activities; 40
Number and mass distributions; Construction nanoparticles exposure; 41
Environment, health and safety risks; Workplace air quality 42
*Corresponding author: Civil Engineering (C5), Tel. +44 1483 682762; fax: +44 1483
682135; Email addresses: [email protected], [email protected] (Prashant
Kumar)
ManuscriptClick here to download Manuscript: NanoBuilding_2ndSubmission_J Nano Res_CLEAN.doc Click here to view linked References
2
1. INTRODUCTION 43
When concrete structures approach the end of their useful life, they can 44
require extensive building works such as refurbishment and strengthening or even 45
demolition and replacement through new construction. All such building activities 46
are known to release significant amounts of coarse particles into the local 47
environment. For instance, Dorevitch et al. (2006) found a 74% increase in PM10 48
(particulate matter with 10 m aerodynamic diameter) concentrations 100 m 49
downwind of a high–rise building demolition site in Chicago, USA. Likewise, 50
Fuller et al. (2002) showed that fugitive PM10 emissions produced from building 51
works at Marylebone Road in London during September 1999 contributed to daily 52
mean PM10 concentrations in excess of 50 g m–3
. In a subsequent publication, the 53
same authors reiterated that local fugitive PM10 episodes arising from building 54
and road works in London and south east England can cause daily mean PM10 55
concentrations to exceed 50 g m–3
, breaching the EU limit value (Fuller and 56
Green 2004). However, there are limited studies that quantify the release of 57
ultrafine particles (UFPs; those below 100 nm in diameter) that arise from 58
building works. A rare study on this topic by Hansen et al. (2008) found UFP 59
concentrations in the vicinity of an old four–story reinforced concrete hospital 60
building undergoing demolition to increase by up to 1.6 times. The UFPs 61
produced during the demolition of such structures have the potential to carry 62
airborne pathogens or viruses into the surrounding environment, including schools 63
and densely populated residential or commercial areas. This is of some concern as 64
currently there is very little documented about the release of UFPs from building 65
activities associated with concrete structures and their subsequent redistribution 66
both within, and across, the surrounding infrastructure. 67
The hydration of Portland cement is known to produce a series of hydrates silicate 68
structures at the nanoscale which are characterised by having a extremely high 69
surface area and associated multi-scale, inter-connected, pore system (McDonald 70
et al. 2007). The fracture of these complex hydrated silicates within cement paste 71
(and also some aggregates) during the demolition, refurbishment and recycling of 72
concrete structures has the potential to release nano–sized particles of a range of 73
potentially reactive aluminosilicates. Such processes appear to be poorly 74
understood and require targeted studies. Recent trends to incorporate carbon 75
nanotubes and plasticizers (e.g. nano–silica, Fe2O3, SiO2, TiO2) within a concrete 76
mix to improve workability, pore structure, thermal behaviour, compressive and 77
flexural strengths (Mann 2006; Nazari and Riahi 2011) introduce additional 78
sources of UFPs within the structure of the cement paste and have been reviewed 79
by Sanchez and Sobolv (2010). Thus, besides the usual emissions due to the 80
fracture of conventional concrete, which is the topic of this study, the 81
nanomodifications incorporated into the concrete mixes may also become 82
airborne during construction, transport, storage or demolition (Bystrzejewska–83
Piotrowska et al. 2009). It is important to note that the physical and chemical 84
characteristics of UFPs produced during the processing of concrete structures are 85
likely to differ from other airborne UFPs which are mainly produced from the 86
combustion of fossil fuels in vehicles or industries (Kumar et al. 2010a; Kumar et 87
al. 2011a). As a consequence, exposure to UFPs arising from building activities 88
may have a different effect on both public health and the environment than UFP 89
that arise from combustion (Kumar et al. 2010b). 90
91
3
Guidelines from the International Labour Organisation (ILO 1995) and national 92
Governments, such as the Health and Safety Act at Work (The Stationary Office 93
1974), place a duty on employers to provide adequate protection to workers 94
undertaking building and demolition activities. Despite the common nature of 95
these activities, there is neither very much known about the types of UFPs 96
generated from building activities nor do any health and safety regulations 97
currently exist to limit their emission and associated exposure levels. An obvious 98
exception to this is the routine monitoring of asbestos during demolition and 99
refurbishment activities; the presence of which activates special methods of 100
decommissioning and subsequent handling of the generated waste stream (The 101
Stationary Office 1974). 102
Several review studies have appeared in the recent past to suggest strategies to 103
measure and analyse the airborne UFP data within the workplace (Brouwer et al. 104
2009) and support the development of benchmark levels (Brouwer 2010). A 105
variety of personal exposure sources of UFPs such as laser printers (McGarry et 106
al. 2011), cooking activities (Buonanno et al. 2009), driving, operating small 107
appliances such hair dryers, cigarette smoke and eating at restaurants and cooking 108
in kitchen (Wallace and Ott 2011) have also been investigated in great detail by 109
recent research articles. There have also been comprehensive reviews of various 110
UFP related aspects such as measurements (Kumar et al. 2010b), dispersion 111
modelling (Kumar et al. 2011b), technical regulatory challenges (Kumar et al. 112
2011c; Kumar 2011d), ambient and commuters‟ exposure to UFPs (Knibbs et al. 113
2011; Morawska et al. 2008), besides exposure at nanotechnology workplaces 114
(Kuhlbusch et al. 2011). There remains, however, no mention of building 115
activities produced UFPs and related exposure. 116
Given the scarcity of information on this topic, the investigation of the release of 117
UFPs from construction processes is crucial for the following reasons: (i) 118
assessing the source strength and exposure of people working at building sites or 119
living (and travelling) in their close vicinity, (ii) analysing the impacts of UFPs 120
arising from building activities on local air quality, (iii) to provide regulatory 121
bodies with information for setting safe guidelines for activities involved in 122
construction, renovation and demolition of concrete structures, and (iv) 123
determining the penetration of UFPs arising from building activities into nearby 124
indoor shelters (e.g. residential and commercial buildings, and sensitive areas 125
such as hospital and schools). This article investigates the release and physical 126
characteristics of particles during the crushing of concrete, demolition of concrete 127
slabs, and recycling of “dry” and “wet” concrete debris by means of a laboratory 128
study. UFPs related health and safety implications at the laboratory workplaces 129
and building sites are also discussed. Note that the focus of this article is on 130
particle numbers for determining the emissions rates from selected sources and 131
processes. Chemical characterisation or the quantification of exposure doses is not 132
the primary aim of this work. 133
2. MATERIALS AND METHODS 134
2.1 Instrumentation 135
Experiments were carried out at the University of Surrey‟s Construction 136
Materials Laboratory. A fast response differential mobility spectrometer 137
(Cambustion DMS50) was used to measure number and size distributions of 138
particles, released during three simulated building activities undertaken on 139
samples of hardened concrete manufactured from three standard Portland cement 140
4
concrete mixes. The three test arrangements used were: (i) the compressive failure 141
of concrete (cubes) under progressive loading, (ii) the demolition of concrete slabs 142
under (simulated) impact load, and (iii) the processing of concrete debris to 143
produce recycled concrete aggregate. During each test, the DMS50 measured 144
particles in the 5–560 nm range in 32 size channels. This size range is of interest 145
and generally comprises over 99% of particles by number in the ambient 146
environment (Kumar et al. 2008b; Kumar et al., 2009). Unlike other similar 147
instruments reviewed by Kumar et al. (2010b), the DMS50 is one of the fastest, 148
commercially available, portable, both DC and AC operatable, particle 149
spectrometers and has been successfully deployed in previous experiments 150
(Carpentieri and Kumar 2011). The DMS50 uses a sampling flow rate of 6.5 lit 151
min–1
which is maintained by an electric pump and a classifier restrictor located 152
within body of the instrument. The main limitation of the instrument is the largest 153
size range measured, but this is not a concern in these experiments as the 154
measurements focus mainly on particle numbers and desired size range is covered. 155
The instrument uses a differential mobility classifier that provides a sampling 156
frequency up to 10 Hz, with a time response (T10-90%) equal to 500 ms, without the 157
inlet tube. Therefore, the use of the DMS50 offered an opportunity to measure 158
size resolved particle number and size distributions in real time under non–steady 159
state conditions. The highest sampling frequency available with the DMS50 was 160
used for measurements since the particle emission events during experiments 161
typically lasted for only few seconds (see Section 3). The DMS50 measures 162
particle diameters based on the electrical mobility detection technique which 163
provides equivalent diameter of a particle after implicitly taking into account their 164
shape and size. The instrument was calibrated by Cambustion Ltd. in July 2010 165
and the experimental duration was within the calibration validity period of 12 166
months. A 0.25 m long thermally conductive sampling tube, made of silicon 167
rubber and having 0.0055 m internal diameter, was used to connect the DMS50 168
and the sampling location for the experiments described in Section 2.2. Sampling 169
flow rate was kept to 6 slpm with a line pressure of 80 kPa. Losses of particles 170
due to diffusion within the sampling tubes were neglected considering its small 171
length (Kumar et al. 2008c). Detailed descriptions of the working principle and 172
the application of DMS50 for ambient measurements can be found in Kumar et al. 173
(2010b), and Carpentieri and Kumar (2011). Over the duration of the experiments, 174
the average ambient temperature and relative humidity (RH), measured using a 175
LaCrosse WS–2350 weather station, was found to be 18±1 C and 60±2%, 176
respectively. 177
The testing of the concrete cubes was undertaken using a Farnell, 200 Tonnes 178
capacity, standard cube compression testing machine (BS EN 12390-4:2000 179
2000). The cubes were loaded through steel sub–platens at constant rate until 180
failure (BS EN 12390-3:2009 2009). Three loading rates were employed for 181
assessing the sensitivity of UFPs produced during the stress applied to concrete 182
cubes: P1 (120 kN min–1
), P2 (240 kN min–1
) and P3 (360 kN min–1
). Demolition 183
of the concrete slabs was carried out using standard hand tools to simulate the 184
impact hammer method of demolition (Blake 1989). To simulate some of the 185
processes that occur during recycling samples of concrete debris were processed 186
using a standard rotating drum mixer with both fixed and floating arms. 187
2.2 Samples and experimental set up 188
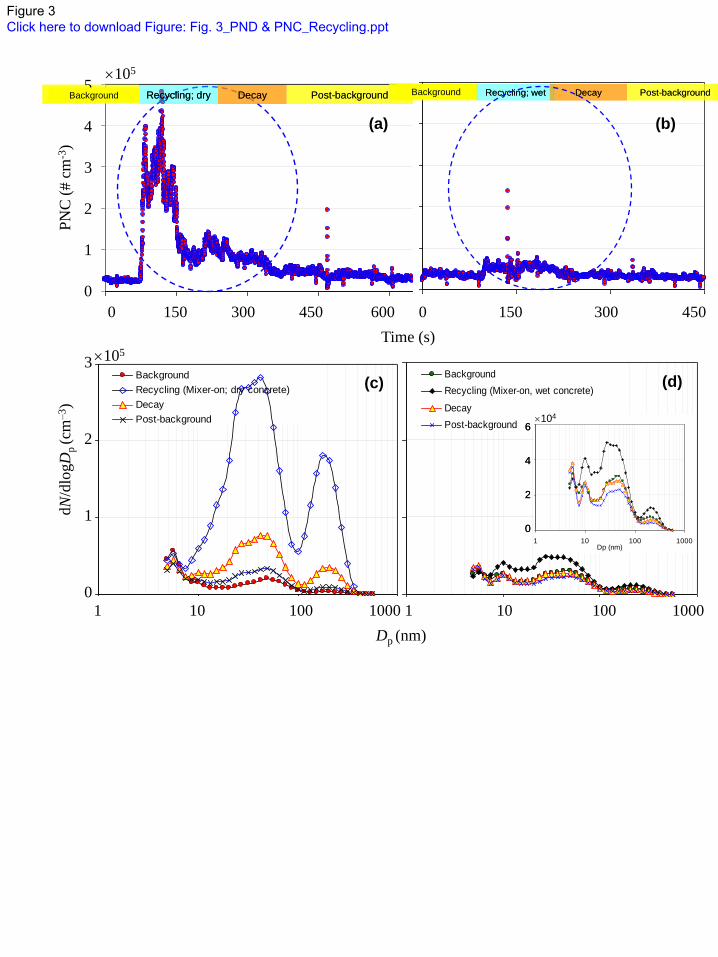
Testing was undertaken on samples of hardened concrete manufactured from 189
three cement concrete mixes, M1 (Grade C35/45), M2 (Grade C30/37) and M3 190
5
(Grade C25/30), incorporating a CEM Type I Portland cement (42.5) and a flinty 191
river gravel aggregate (see details in Table 1). These mixes were selected to 192
represent the typical strength range, and properties, of normal concrete mixes that 193
might be encountered in conventional reinforced concrete buildings. It should be 194
noted that no admixtures of any kind were employed in the manufacture of the 195
concrete used in this study. A total of 13 samples were used during the three tests: 196
(i) Three (100100100 mm) concrete cubes were manufactured from 197
each of the mixes M1, M2 and M3 using standard methods (BS EN 198
12390-2:2009 2009) and the resulting nine cubes were cured for 42 199
days at 100% RH and 20 C. The cubes were tested to failure in 200
compression under progressive loading at loading rates P1, P2 and P3. 201
These samples were designated as M1P1, M1P2, M1P3, M2P1, M2P2, 202
M2P3, M3P1, M3P2, and M3P3; with M1-3 and P1-3 referring to the 203
strength grade and loading rate, respectively. A rectangular steel case 204
was placed around the cubes crushing area of the compression testing 205
machine to help prevent any fugitive particles from coming into the 206
casing area. The head of the sampling tube was kept at 0.05 m away 207
from the cube surface to measure the source emissions in the form of 208
particle number and size distributions produced. 209
(ii) Simulated demolition was carried out on two 100050050 mm fully 210
compacted plain concrete slabs manufactured from mix M2 that had 211
been cured at 100% RH and 20 C for 28 days and subsequently stored 212
in laboratory air for 8 months at 50–75% RH and 19±2 C. The slabs 213
were placed, in turn, on wooden supports at their ends and subject to 214
impact at their centre point using a hand–held “lump” hammer. This 215
caused immediate failure of each slab into two parts each of which 216
were then broken into smaller sections. The head of the DMS50 217
sampling tube was placed at 0.05 m above the centre of the slab for 218
measuring the release of UFPs simultaneously with the demolition 219
process. 220
(iii) Debris from the crushed concrete cubes and broken slabs (described 221
above) was mixed with 25 kg of recycled concrete aggregate (with a 222
particle size in the range 5–20 mm) obtained from a commercial 223
processing plant. To simulate some of the processes that occur during 224
the recycling process the combined “dry” material was placed into a 225
standard rotating drum mixer. The mixer was then operated at a speed 226
of 20 rpm and the levels of PNCs produced monitored. Subsequently, 227
4 kg of water was sprayed over the surface of the aggregate and the 228
experiment was repeated to determine the UFPs produced when 229
processing the “wet” material. Simultaneous measurements of number 230
and size distributions of particles were made during both experiments 231
by placing the head of the sampling tube at 0.15 m above the mixer‟s 232
perforated lid. 233
For all the tests, selection of an appropriate location of the sampling point was 234
crucial as this can appreciably change the amount of measured PNCs. Earlier 235
studies have demonstrated that number concentration and size distributions of 236
particles may vary with distance to the source due to effect of transformation 237
processes (e.g. nucleation, coagulation, condensation, deposition) (Kumar et al. 238
2011b), limiting the reliability of estimates for personal exposure assessments 239
(Brouwer 2010; Brouwer et al. 2004). Since the aim of this work was to 240
6
investigate the release of new UFPs during the processing of concrete but not their 241
spatial dispersion into the surrounding environment or the exposure assessment, 242
the measurement points were kept as close as possible to the samples so that the 243
source can be monitored and the volumetric release rate (# cm–3
) of new particles 244
into the ambient environment can be captured. It should also be noted that this 245
work aimed to investigate three simulated building processes (crushing, 246
demolition and recycling) using conventional Portland cement concrete samples 247
representative of that encountered in real structures. None of the samples used in 248
this study included any commercial additives and so the influence of concrete 249
admixtures on the release of UFPs is not considered in this work. 250
2.3 Estimation of particle mass distributions (PMDs) and concentrations 251
(PMCs) 252 The PMDs (dM/dlogDp) are estimated by multiplying the measured PNDs 253
(dN/dlogDp) with the mass per particle M(Dp) (Park et al. 2003) based on the 254
mobility diameter, Dp, as seen in Eq. (1) below: 255
P
p
p Dd
dNDM
Dd
dM
loglog and
Df
Pp DDM6
)( 256
(1) 257
Where ρ (= 2.3 gm cm–3
) is particle density which is assumed same as the density 258
of a typical standard mix of concrete and Df is the fractal dimension of particles. 259
Generally, the particles are not expected to be in ideal spherical shape and their 260
volume is no longer proportional to Dp3, therefore a typical value of Df (= 2.34) is 261
adopted from the experiments of Park et al. (2003). The obtained dM/dlogDp in 262
each of 32 size bins were further integrated and summed up for obtaining PMCs 263
(µg cm–3
) in desired size ranges (Kumar et al. 2008b). 264
3. RESULTS AND DISCUSSION 265
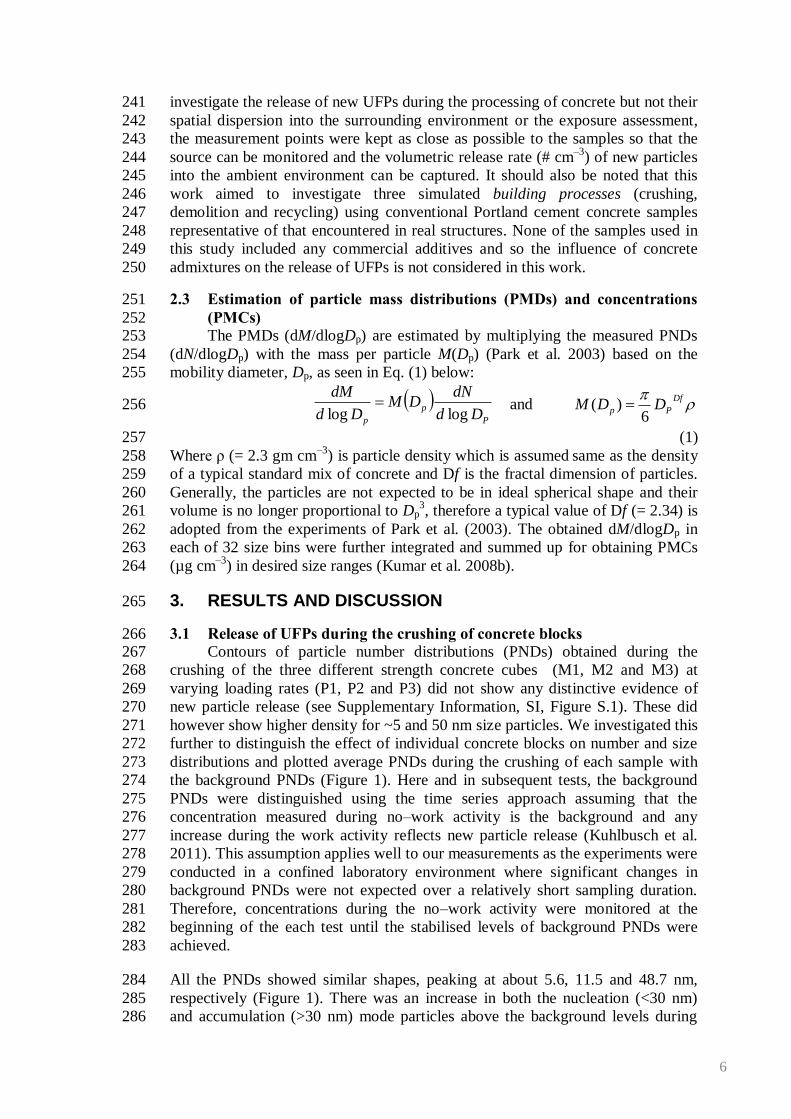
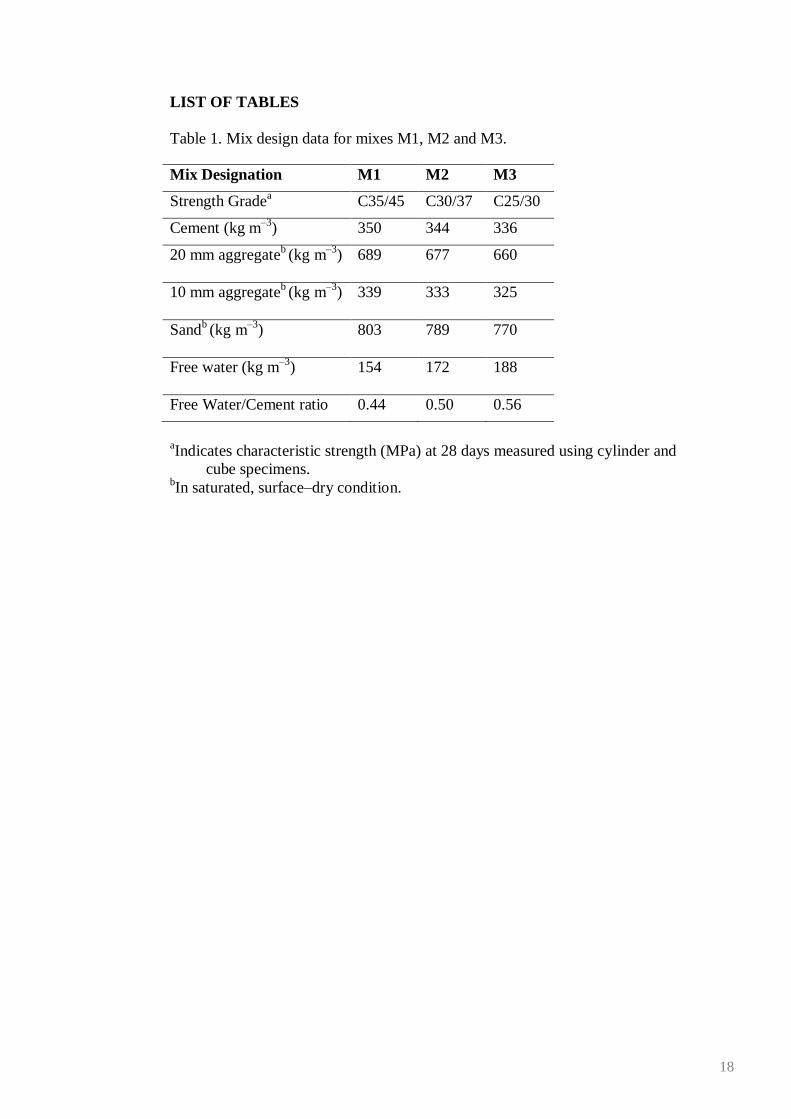
3.1 Release of UFPs during the crushing of concrete blocks 266 Contours of particle number distributions (PNDs) obtained during the 267
crushing of the three different strength concrete cubes (M1, M2 and M3) at 268
varying loading rates (P1, P2 and P3) did not show any distinctive evidence of 269
new particle release (see Supplementary Information, SI, Figure S.1). These did 270
however show higher density for ~5 and 50 nm size particles. We investigated this 271
further to distinguish the effect of individual concrete blocks on number and size 272
distributions and plotted average PNDs during the crushing of each sample with 273
the background PNDs (Figure 1). Here and in subsequent tests, the background 274
PNDs were distinguished using the time series approach assuming that the 275
concentration measured during no–work activity is the background and any 276
increase during the work activity reflects new particle release (Kuhlbusch et al. 277
2011). This assumption applies well to our measurements as the experiments were 278
conducted in a confined laboratory environment where significant changes in 279
background PNDs were not expected over a relatively short sampling duration. 280
Therefore, concentrations during the no–work activity were monitored at the 281
beginning of the each test until the stabilised levels of background PNDs were 282
achieved. 283
All the PNDs showed similar shapes, peaking at about 5.6, 11.5 and 48.7 nm, 284
respectively (Figure 1). There was an increase in both the nucleation (<30 nm) 285
and accumulation (>30 nm) mode particles above the background levels during 286
7
individual crushing events. Total PNCs averaged over the crushing events of all 9 287
samples in the 5–560 nm size range were measured as 2.27±0.41 ×10⁴
cm–3
, with 288
a background contributions of about 1.47×10⁴
cm–3
. If we divide them into various 289
size bins, average PNCs over the all crushing events were ~37, 55 and 27% higher 290
than the background PNCs in the 5–10, 10–30 and 30–300 nm size ranges, 291
respectively. In all cases (background, total average over all events, and net after 292
subtracting background) the majority (~95%) of total PNCs were found in the 293
UFP size range (<100 nm). If we subtract the background fraction from the 294
average PNCs over the all crushing events, the remaining particles should reflect 295
the quantity of new particles release during the crushing process. Such a release in 296
the 5–100, 100–300 and 300–560 nm size ranges constituted ~94.8, 4.8 and 0.4%, 297
respectively, of total averaged PNCs in the 5–560 nm size range (~0.77±0.50 ×10⁴
298
cm–3
). These observations clearly indicate that the majority of particles were 299
generated in the UFP size range. 300
It had originally been expected that a greater release of UFPs would be produced 301
as the rate of loading and concrete strength increased. However, a more complex 302
picture emerged with the PNDs increasing with decrease in loading rate for cubes 303
manufactured from the highest strength mix (M1) while an opposite trend was 304
seen for the cubes manufactured from the lowest strength mix (M3) (Figure 1). 305
This may reflect the different failure modes observed for the M1 and M3 mixes 306
and maximum load (stress) they sustained. The concrete cubes manufactured from 307
the lowest strength mix (M3) were observed to fail non–explosively by Poisson 308
splitting with the predominant failure mode being debonding at the 309
aggregate/cement interface with little sign of failure of the individual aggregate 310
particles. This was expected given both the nature of the aggregate used, which 311
was a relatively smooth surfaced river gravel, and the high water/cement ratio 312
(0.55) of the cement paste that acted together to limit the maximum stress that the 313
concrete could sustain without failure to 30–36 N mm–2
. In contrast, the cubes 314
manufactured from mix M1 tended to fail explosively with aggregate failure being 315
the main mode of failure with clear evidence of debonding at the 316
aggregate/cement interface occurring only at the lower loading rate (P3). The 317
failure stress carried by the M1 concrete cubes was between 51–57 N mm–2
and, 318
as expected, increased with loading rate. This increased load capacity reflects the 319
improved interaction between the aggregate and the hydrated cement resulting 320
from the lower free water/cement ratio of the M1 mix (0.40). It may be noted that 321
the cubes manufactured from the M2 mix showed “mixed” failure modes with a 322
complex dependence on loading rate. 323
Looking at the results in Figure 1 in detail it can be seen that there are two main 324
peaks of UFPs produced during the crushing of the concrete cubes: Peak (i) (Dp = 325
5–6 nm) and Peak (ii) (Dp = 40–60 nm, along with a side peak). The loading rate 326
can be seen to influence the Peak (i) behaviour differently, i.e. decreasing for the 327
M1 (high strength) mix and increasing for the M3 (low strength) mix. In contrast, 328
Peak (ii) values for the M1 concrete mix are always higher than those for the M3 329
mix and in both cases are relatively independent of the loading rate. Thus, 330
considering the failure modes of the cubes this suggests that Peak (ii) reflects 331
processes associated with the explosive failure of the cubes and which are 332
connected with fracture of the aggregate particles and associated failure of the 333
cement paste. Peak (i) would appear to reflect processes that occur predominantly 334
during debonding at the aggregate/cement interface perhaps with associated crack 335
formation through the cement paste. 336
8
The above observations generally indicate an increase in UFP concentrations, 337
with a relatively larger change in nucleation mode particles in comparison with 338
accumulation mode particles, during the crushing events (Figure 1). Whilst the 339
effect of loading rate and concrete strength on PNC release could not be 340
conclusively demonstrated the observed emissions seem to relate to failure mode. 341
However, confirmation of this proposal would require further investigation on a 342
larger number of samples. The findings do, however, carry an implication for 343
those involved in the construction, repair and demolition of concrete structures in 344
that the processes of compressive failure are capable of creating a different size 345
range of particles depending on the strength grade and loading rates. This leads to 346
the need for the protection of personnel exposure and improvements in 347
construction practices (Section 3.5). 348
3.2 Release of UFPs during demolition of concrete slabs 349
Two concrete slabs, Slab–1 and Slab–2, were used to simulate the release of 350
UFPs during their demolition through an impact hammer method (Blake 1989). 351
Contour plots for each case showing their number and size distributions are 352
plotted in SI Figure S.2. For analysing the number and size distributions of 353
particles generated during the different stages of the experiment, the data here 354
(and in Section 3.3) are divided into four sub–stages based on the temporal 355
evolution of particles. These include: (i) background (just before the start of the 356
experiments; no–work period), (ii) demolition events (during the actual time of 357
impact demolition; work period), (iii) decay (starting just after the end of work 358
period and ending when the concentrations become near steady; no–work period), 359
and (iv) post–background (starting after the decay period when concentration 360
decay becomes near steady; no–work period). These sub–stages are marked in SI 361
Figures S.2 and S.3 but the concentrations measured during the first two sub–362
stages (background and actual events) were of most interest to identify new 363
release of UFPs and are considered below for detailed discussion. 364
365
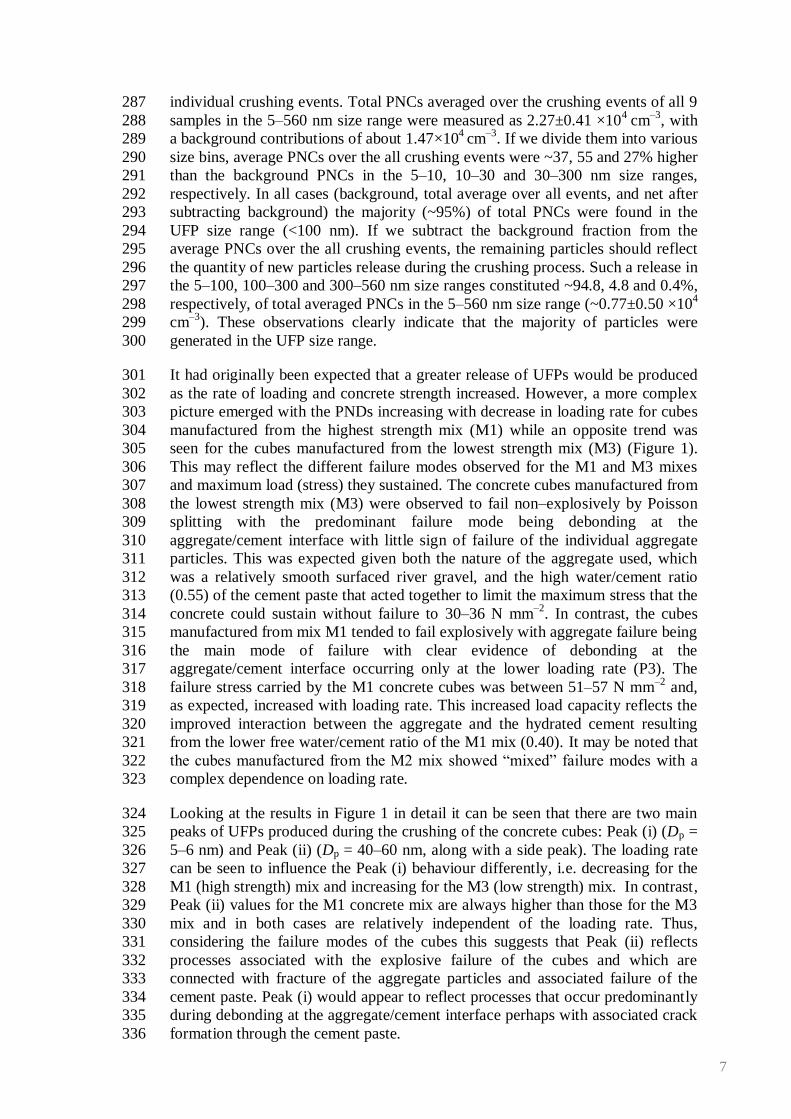
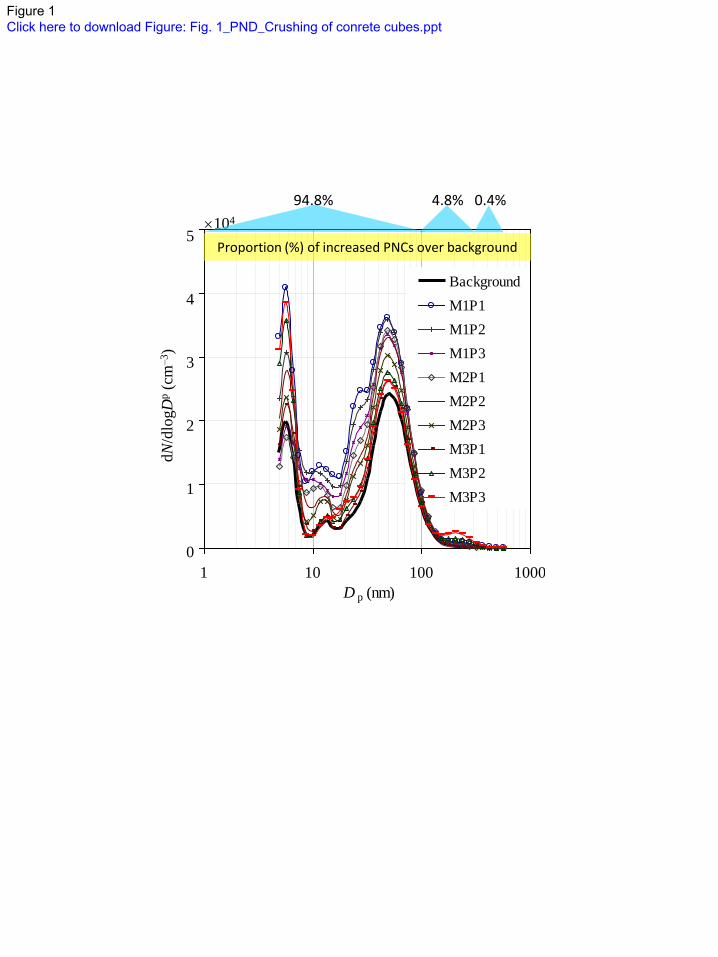
The two slabs produced different quantities of PNCs during the demolition stage 366
(i.e. 2.41×10⁵
and 1.66×105 cm
–3) but the physical characteristics of the contour 367
plots (SI Figure S.2), the temporal pattern of PNC release (Figures 2a and b) and 368
size distributions (Figures 2c and d) were very similar. For instance, a distinct rise 369
in PNDs can be seen in both cases during the demolition process for both samples 370
where the peak diameters were found at about 30 and 200 nm, respectively 371
(Figures 2c and d). Furthermore, in both cases peak PNCs increased by about 20 372
times during the demolition stage relative to the background PNCs (Figures 2 a 373
and b) and then reverted back to post–background levels after a decay process of 374
about 25 s. The post–background stage exhibited an elevated level of PNCs 375
relative to the background stage due to the accumulation of particles in the local 376
background; the post–background stage lasted for 10‟s of seconds before 377
returning back to background PNCs. 378
379
PNDs plotted for various stages in Figures 2c and d provide a clear indication of 380
the release of particles in the UFP size range. Interestingly, the shape of PNDs 381
remains the same for all the four stages, except for the changes in their magnitude. 382
As expected, the highest PNDs were observed during the demolition stage, 383
showing peak diameters at about 30 and 200 nm. This was then followed by the 384
PNDs in decay and post–background stage. One of the interesting observations 385
from these plots is that the PND spectrum moves up and down without any 386
appreciable changes in their modes and peak diameters during all stages. This 387
9
negligible change in the shapes of modes indicates the influence of dilution 388
controlling the magnitude of PNDs (Kumar et al. 2008b). 389
390
Another interesting aspect to analyse from these results is the changes in 391
proportion of PNCs in various size ranges during different sub–stages. Depending 392
on the PND modes shown in Figure 2c and d, we divided the entire size range of 393
particles into three ranges: 5–100 nm (i.e. UFPs), 100–300 nm, and 300–562 nm 394
(SI Figure S.3). Generally, particles over 300 nm were found to be modest (i.e. 395
~1% of total PNCs) during all the sub–stages whereas particles in the 5–100 nm 396
range dominated (up to 93%) the total PNCs. Further, background PNCs were 397
subtracted from the total PNCs to identify the release of new particles during the 398
demolition stage. Average particle release in the 5–560 nm size range were 399
estimated as 1.91±0.36 ×104 cm
–3 with UFPs constituting over two third (~79%) 400
of total PNCs. 401
402
Since there are no data available in the literature to directly compare our results, 403
we have sought to put our results in perspective of the study by Hansen et al. 404
(2008). They measured the particles in various size ranges nearby the demolition 405
site of a hospital building and found UFP concentrations to increase by about 1.6 406
times above those before the demolition. If we average our PNCs over the 407
demolition and decay periods and divide them by the background PNCs, this ratio 408
for UFPs turns out to be 1.53 which is co–incidentally very similar to that 409
reported by Hansen et al. (2008). This comparison is encouraging but requires 410
further substantiation by means of laboratory investigation on a large number of 411
samples and field measurements close to the building demolition sites, as 412
described in Section 4. 413
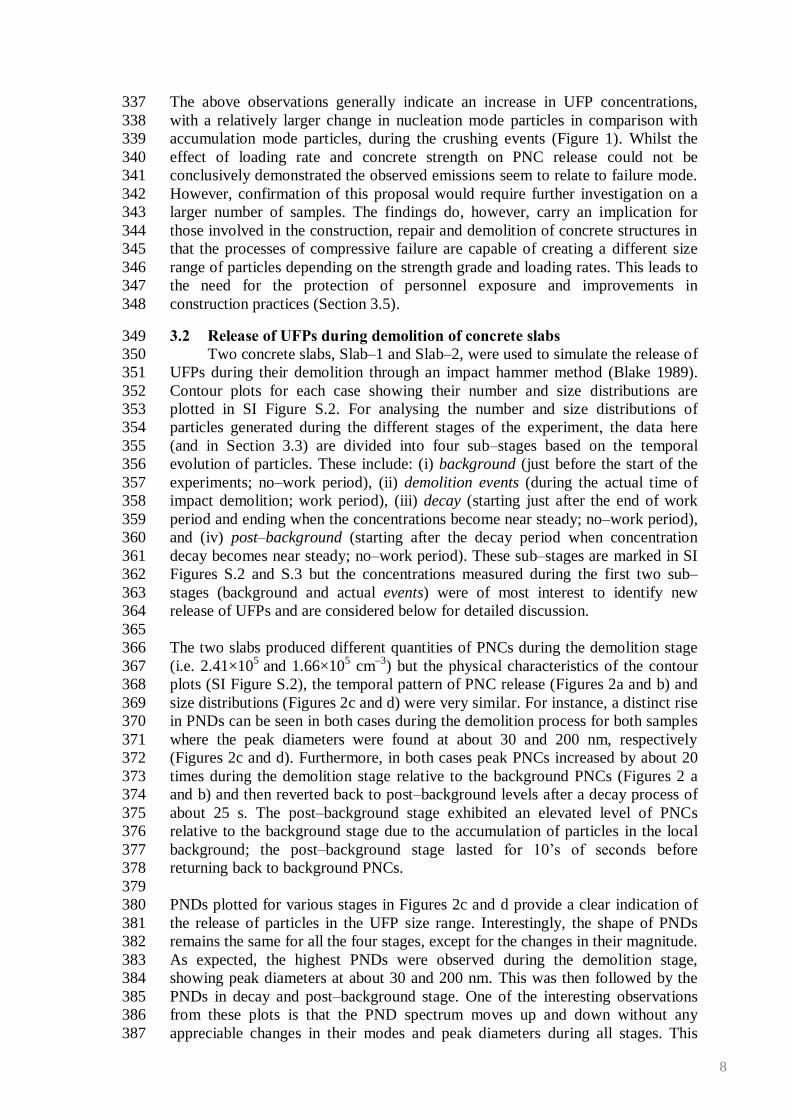
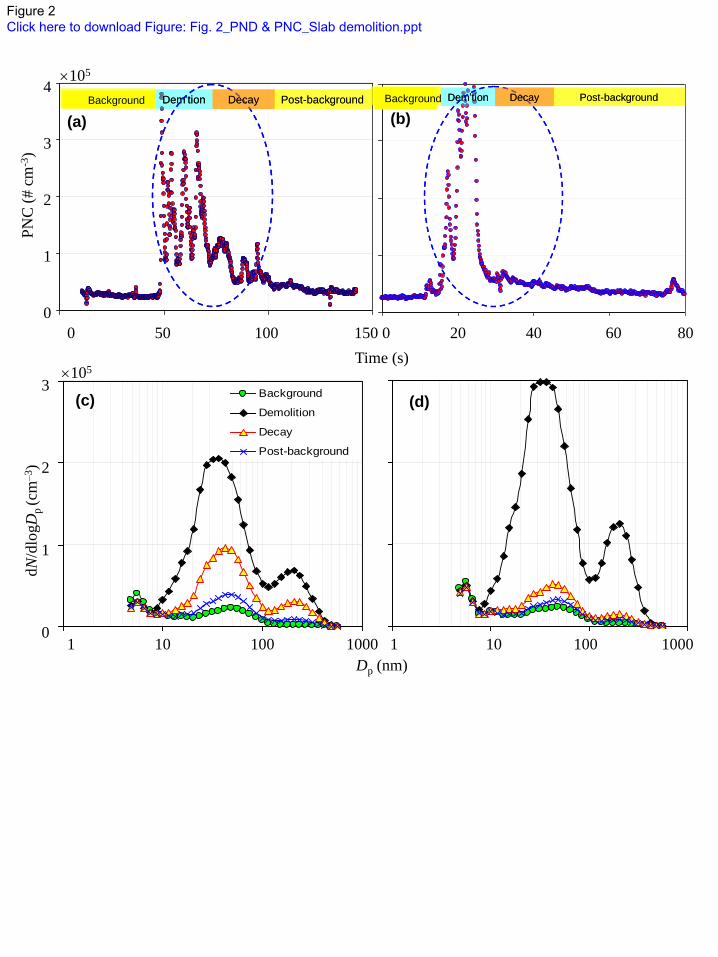
3.3 Release of UFPs during dry and wet recycling of concrete debris 414 Contour plots showing PND spectrum (SI Figures S.4a and b) indicate 415
differences in release of new particles during “dry” and “wet” recycling of 416
concrete debris. As in Section 3.2, the experimental data were divided into four 417
temporal sub–stages (background, recycling (“dry” and “wet”), decay and post–418
background) to identify the UFPs released during recycling. 419
The use of water spraying is a common method for suppressing airborne dust 420
particles during construction activities (Tjoe Nij et al. 2003). This method can 421
suppress PM10 concentrations that occur during the demolition of buildings by up 422
to 10 times (Kukadia et al. 2003). Studies have also shown a decrease in UFP 423
concentrations with increasing relative humidity and, conversely, an increase in 424
UFPs during dry weather conditions (de Hartog et al. 2005). This is further 425
substantiated by the fundamental phenomena of UFP scavenging (rainout) due to 426
rainfall (Andronache et al. 2006) and aerosol–hydrometer coagulation (washout) 427
(Kumar et al. 2011b). Our results appears to compliment these observations since 428
a significant difference was found between the total PNCs measured during “dry” 429
(2.51×105 cm
–3; SI Figure S.4a) and “wet” (0.52×10
5 cm
–3; SI Figure S.5b) 430
recycling. UFPs contributed to a major proportion of these particles; 1.88×10⁵
cm–
431 3
during “dry” recycling compared with 0.46×10
5 cm
–3 during “wet”
recycling. 432
Similar to the other cases (Sections 3.1and 3.2), particles over 300 nm were found 433
to be modest (i.e. ~1% of total PNCs) during both recycling processes (SI Figure 434
S.5). 435
10
As expected during the temporal sub–stages, largest magnitudes of PNDs were 436
found during “dry” recycling that was followed by decay and post–background 437
stages (Figure 3c). Figure 3d show a clear picture of suppressed PNDs over the all 438
size ranges during “wet” recycling as opposed to “dry recycling” (Figure 3c). 439
Particle diameters peaked at about 40 and 200 nm during the “dry” recycling 440
whereas these peaks shifted to about 30 and 200 nm, in addition to a 10 nm peak, 441
during the “wet” recycling (Figure 3d). This additional peak at ~10 nm during 442
“wet” recycling indicates a transient nuclei mode, presumably developed due to 443
the nucleation of sprayed water during rapid mixing (Kumar et al. 2011b). The 444
slight shift of 40 nm peak diameter during “dry” recycling to 30 nm during “wet” 445
recycling could well be due to the relative effect of coagulation processes as the 446
PNCs during the latter event were up to an order of magnitude larger, and high 447
enough to initiate rapid coagulation (Kumar et al. 2011b). 448
Peak PNCs increased to about 17 times against the background during the “dry” 449
recycling (Figure 3a) compared with a modest increase (~3 times) in peak PNCs 450
during the “wet” recycling (Figure 3b). Subtraction of the background from the 451
total PNCs during recycling events provided estimates of new particle release in 452
addition to the indication of suppression effect of water spray on various size 453
ranges of particles. New PNC release during the “wet” recycling was computed as 454
~13 times smaller (1.76×104 cm
–3) than those found during “dry” recycling 455
(2.27×105 cm
–3). For both cases, majority of this release was in the ultrafine size 456
range which constituted nearly two third (~73%) and 90% of total new PNCs 457
during the “dry” and “wet” recycling processes, respectively. Particles in the 100–458
300 contributed about 26 and 9% during “dry” and “wet” recycling, respectively, 459
with only a modest (~1%) contribution by the 300–560 nm size range in both 460
cases. The ratio of new PNCs release in the ultrafine size range (5–100 nm) to the 461
remaining size range (100–560 nm) changed from ~2.7 during “dry” recycling to 462
~8.7 during “wet” recycling. The higher relative proportion of PNCs in the 5–100 463
size range with respect to larger size particles during “wet” recycling suggest that 464
the latter are better suppressed by the water spray compared with UFPs (Kumar et 465
al. 2011b). 466
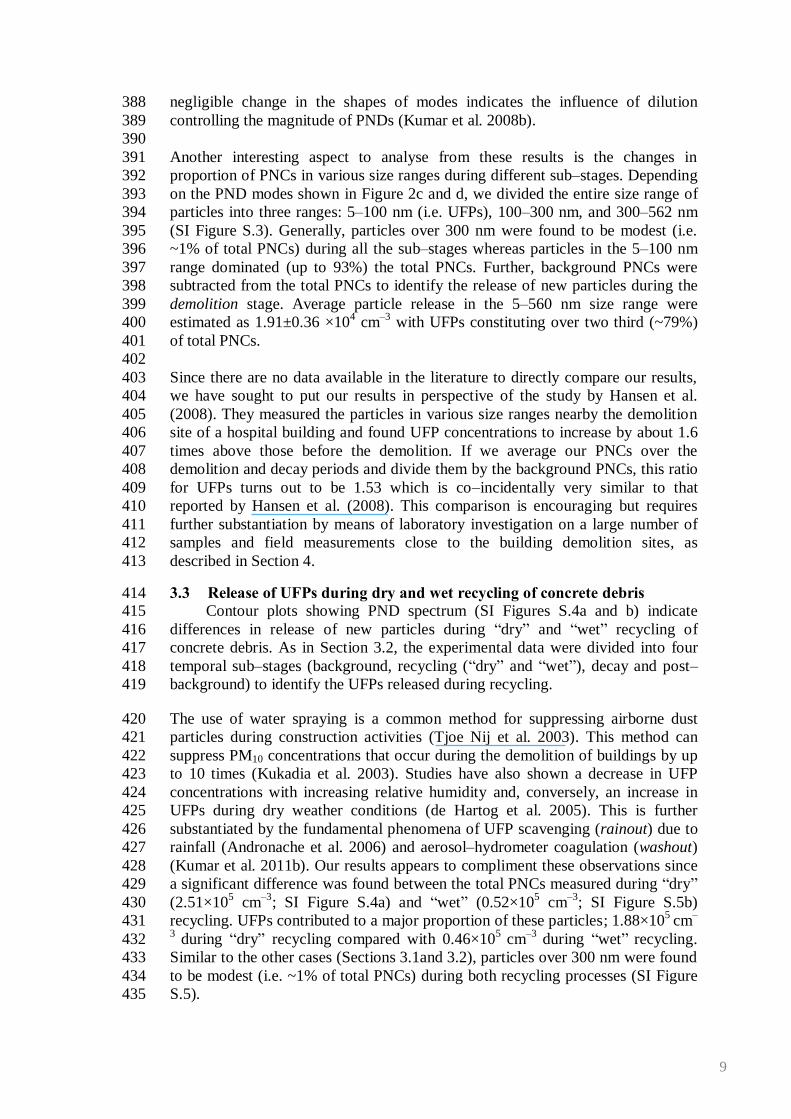
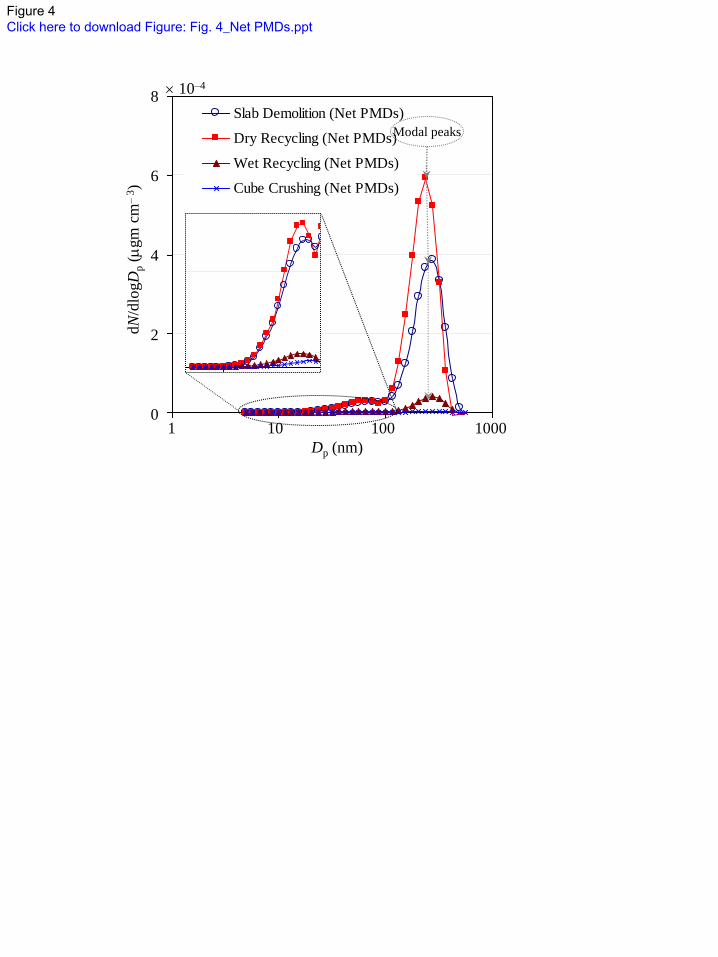
3.4 The PMDs and corresponding PMCs generated by various processes 467 Following the methodology presented in Section 2.3, the net PMDs are 468
computed (Figure 4) after subtracting the background PMDs which correspond to 469
background PNDs in Figures 1–3. Unlike the PNDs for various processes where 470
up to 95% of total PNCs were below the 100 nm size range (Figures 1–3), the 471
majority of contribution extending up to 93% came from the particles above 100 472
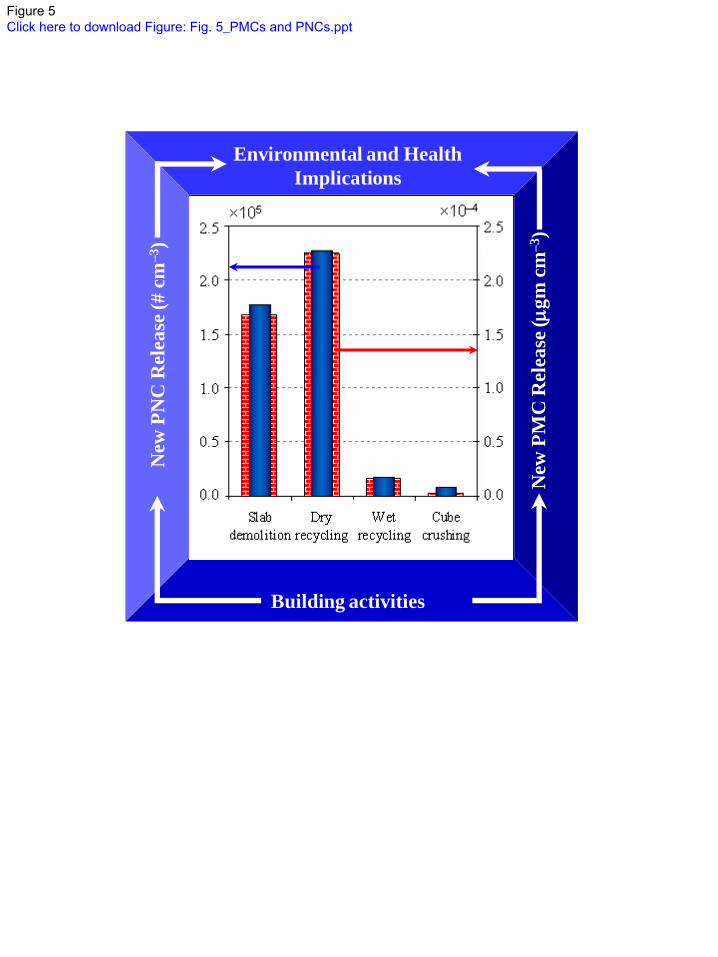
nm in size range (Figure 4). More precisely, this mass based contribution was 93, 473
92, 91 and 71% of total PMCs in the 5–560 nm size range for “dry” recycling, 474
slab demolition, “wet” recycling and cube crushing, respectively (Figure 5). These 475
results are in line with the observations reported for engine (Kittelson 1998), 476
indoor (Wallace and Ott 2011) and ambient monitoring studies (Harrison et al. 477
2011; Kumar et al. 2010b; Kumar et al. 2011c) due to the fact that the tiny 478
particles in the UFP size range possess negligible PMCs but notable PNCs. Also it 479
can be argued that targeted mitigation measures are required for the UFPs 480
produced from these activities since the mass based measures will not be effective 481
to limit the exposure to building activities produced UFPs. 482
Closer inspection of the PMDs demonstrated bi–modal distributions for all the 483
four processes, showing a shrink in smaller, and the other over a magnitude larger, 484
11
peak at about 65 and 274 nm in both modes, respectively, as opposed to the 485
background peaks at about 78 and 300 nm (Figure 4). The PMDs were also found 486
to be relatively similar in shape for each process which was not the case for the 487
PNDs. As expected, the magnitude of each PMD spectrum followed the same 488
trend as was found for the PNDs i.e. the largest for dry recycling followed by slab 489
demolition and cube crushing (Figures 1–3). No published studies could be 490
located for direct comparison but these results can be put in the context of ambient 491
studies for drawing interesting observations. For instance, Kumar et al. (2008b) 492
measured the PNDs in the 5–2500 nm size range in an urban street canyon and 493
converted them into the PMDs which showed two peaks at about 237 and 649 nm. 494
The shapes of the PMDs in these two studies were different, with an additional 495
peak in UFP size range at about 65 nm in current study, reconfirming the 496
emissions of new particles in the UFP size range. 497
3.5 Implications of results towards health and safety regulations 498 The ILO uses the concept of “decent work” for all workers with temporary 499
or formal employment deployed at building sites (ILO 1995), though these 500
guidelines do not include anything specific for UFP exposure. In Europe, the 501
general framework is provided by the regulation on occupational safety and health 502
of workers (EU Directive 89/391/EEC; Directive 98/24/EC) and under the 503
REACH (Registration, Evaluation, Authorization and Restriction of Chemicals) 504
framework. This framework includes guidelines for risk assessments related to 505
synthesis, handling and transport of nanomaterials at workplaces but do not 506
include anything relevant to UFPs arising from construction materials. In view of 507
the above, various countries have set out their own guidelines to control exposure 508
at operational building sites. For instance, the Building and Research 509
Establishment (UK) provides specific guidance for dust particles and PM10 that 510
may become airborne (Kukadia et al. 2003). They can carry deposited biological 511
debris (e.g. fungal spores, moulds, bird droppings or aspergillus) on the building 512
surfaces during the demolition via explosives, demolition ball, sledge and jack 513
hammers or other demolition plan and equipment if appropriate control measures 514
are not adopted (Kukadia et al. 2003). Furthermore, the Health and Safety 515
Executive provide guidelines for very fine dust such as respirable crystalline silica 516
(RCS) for the use of cut–off saws during construction; exposure to RCS can cause 517
serious health effects such as lung cancer or silicosis and its 8–hour time averaged 518
exposure limit at workplaces is kept to 0.1 mg m–3
(HSE 2010). Exposure to other 519
hazardous substances, including RCS, at the workplaces is controlled through the 520
control of Substances Hazardous to Health regulations (COSHH 2005). Currently, 521
however, there is no international or local guidance for controlling the release and 522
exposure of UFPs at buildings sites. There is a HSE Research Report on the 523
assessment of different metrics of the concentration of nano (ultrafine) particles in 524
existing and new industries (HSE 2006) but this limit its scope to UFP exposure in 525
industrial work places. Moreover, current control measures in terms of exposure 526
limits for dust particles or RCS are based on mass concentrations which is not 527
appropriate for UFPs as they carry negligible PMCs (Kumar et al. 2008a). 528
Physicochemical characteristics of particles, especially produced from buildings 529
activities, can be substantially different in terms of their size distributions 530
(Sections 3.1–3.3), shape, morphology, chemical composition, oxidant potential 531
and toxicity than other nanoparticles, mainly produced from the combustion of 532
fossil fuels (Kumar et al. 2010a; Nowack and Bucheli 2007). Even a small 533
increase in PNCs originating from concrete demolition might have negative health 534
12
effects to the people exposed at workplaces, operation building, demolition or 535
renovation sites, or in surrounding areas, though allied health effects are still 536
needed to be established. Building activities has been initially thought of as being 537
source of particles in the PM2.5 and the PM10 ranges. Our study identified the UFP 538
generation which is likely to occur during demolition and related construction 539
activities in community settings. The levels of new UFP release (in the order of 540
~104–10
5 cm
–3) identified here are not trivial and exposure can increase 541
appreciably if these occur for longer durations as would be the case in typical 542
operational situations. Thus, workers and at–risk communities may require 543
additional respiratory protection than would be needed if only coarse particulates 544
were generated. Also there is a need for the production of appropriate guidelines 545
for those involved in such activities. 546
4. SYNTHESIS AND FUTURE RESEARCH CHALLENGES 547
This study presents the preliminary estimates of UFP release during the 548
crushing of concrete cubes, demolition of concrete slabs and recycling of concrete 549
debris. Particle size distributions were measured simultaneously in the 5–560 nm 550
size range close to the test samples to estimate the emission strengths of various 551
simulated building activities. The results are discussed in terms of both number 552
and mass distributions of particles and implications associated with the health and 553
environment at laboratory workplaces and at operational building sites. 554
The shapes of PND spectrums for each activity were distinctly different from each 555
other, except for a consistent and unchanged small peak in all cases at about 5.6 556
nm, with the other two background modal peaks at ~13 and 49 nm diameters. 557
Detailed inspection of modal peaks during work against the background indicate 558
that cube crushing produced relatively fine particles (with modal peaks at ~11.5 559
and 49 nm), followed by slab demolition (~20 and 300 nm), “wet” recycling (~30 560
and 200 nm, with an additional small peak at about 10 nm) and “dry” recycling 561
(~40 and 200 nm). The total PNCs increased about 2, 3, 14 and 17 times over the 562
backgrounds during cube crushing, “wet” recycling, slab demolition and “dry” 563
recycling respectively. The releases of new particles during individual events were 564
estimated by subtracting the background PNCs from the total PNCs obtained 565
during an event. These releases were found to be ~0.77, 19.1, 22.7, 0.18 (×104) 566
cm–3
during cube crushing, slab demolition, “dry” and “wet” recycling events, 567
respectively. The majority of new particle emissions were detected in the ultrafine 568
(<100 nm) size range, contributing ~95, 79, 73 and 90% of total PNCs for cube 569
crushing, demolition, “dry” and “wet” recycling events, respectively. 570
Furthermore, particle release in the 100–300 nm size range during these events 571
corresponded to ~4, 19, 26 and 9%, respectively, leaving a modest fraction (~1%) 572
of particles over 300 nm size range. 573
As was the trend for measured PNDs during different events, the corresponding 574
PMDs were also found to be increasing in the similar following order: cube 575
crushing, “wet” recycling, slab demolition and “dry” recycling. A largest modal 576
peak in PNDs was noticed in the UFP size range (i.e. between 20 and 40 nm) for 577
PNDs whereas the similar largest modal peak in case for PMDs was found in 578
accumulation mode range (~274 nm). Like the indoor or outdoor ambient studies, 579
the major fraction of PMCs stayed over the 100 nm size range and reverse was the 580
case for the PNCs. 581
13
The study also has its explainable limitations. Firstly, it can be argued that 582
laboratory simulations do not represent the real operational conditions at building 583
sites. The second related argument can be the generalisation of results for real 584
world conditions. As discussed earlier, this was unclear at the first place whether 585
such activities produce UFPs and if yes then how much proportions in various 586
particle size ranges. Investigating this uncultivated source, confirmation of UFP 587
release, preliminary quantification of their concentrations and outlining a 588
transferable methodology in itself justifies this work. Furthermore, the release 589
rates estimated through laboratory studies, such as here, are important for 590
workplace modelling and offer a complimentary route to derive possible exposure 591
to UFPs (Kuhlbusch et al. 2011; Schneider et al. 2011), besides providing base 592
information for designing detailed studies at operational building sites. Such 593
laboratory studies are also essential to assess the potential risks, especially in 594
cases when there is rarely any published literature available on a topic like the one 595
covered here. 596
Besides the above, this work has also opened up a number of novel questions for 597
further inter–disciplinary research to envisage related mitigation strategies. For 598
example, measurements on a large number of samples, including concrete mixes 599
with „nanoparticles–based‟ admixtures (Sanchez and Sobolev 2010), are required 600
to analyse the impact of admixtures on the rate of release and changes in 601
physicochemical characteristics of released particles. Also, measuring PNCs at 602
different locations during the testing can aid in mapping their spatial distributions 603
and dispersion into the surrounding environment which could help facilitate 604
exposure assessment in laboratory environments. There is also an equal need for 605
field monitoring at building sites to link the results of various processes with the 606
measurements. As mentioned before “exposure to UFPs arising from building 607
activities may have different effect on both public health and the environment 608
than UFP arise from combustion”. Consequently, for an efficient risk assessment 609
and management, the ecotoxicity and the environmental behaviour of UFPs 610
arising from building activities should also be investigated as thoroughly as of 611
UFP evolving from combustion or engineered processes. In future these 612
investigations might influence environmental regulation. 613
5. ASSOCIATED CONTENT 614
Please see Figures S.1 to S.5 in supporting information. 615
6. ACKNOWLEDGEMENT 616
The authors thank Mr. Prasana Kunapalan, Mr. Fred Auckland, Mr. Thomas 617
Pagkalis and Mr. Rex Packiyarajah for their help during the laboratory 618
experiments. PK also thanks Drs. Hong Chen and Vina Kukadia from the 619
Building and Research Establishment (BRE), UK, for providing BRE pollution 620
guide. 621
7. REFERENCES 622
Andronache C, Gronholm T, Laakso L, Phillips V, Venalainen A (2006) 623
Scavenging of ultrafine particles by rainfall at a boreal site: observations and 624
model estimations. Atmos Chem Phys 6: 4739-4754 625
Blake LS (1989) Civil Engineer's Reference Handbook. 4th Edition 626
Brouwer D (2010) Exposure to manufactured nanoparticles in different 627
workplaces. Toxicol 269: 120-127 628
14
Brouwer D, van Duuren-Stuurman B, Berges M, Jankowska E, Bard D, Mark D 629
(2009) From workplace air measurement results toward estimates of 630
exposure? Development of a strategy to assess exposure to manufactured 631
nano-objects. J Nanopartcle Res 11: 1867-1881 632
Brouwer DH, Gijsbers JHJ, Lurnvink MWM (2004) Personal Exposure to 633
Ultrafine Particles in the Workplace: Exploring Sampling Techniques and 634
Strategies. Ann Occup Hyg 48: 439-453 635
BS EN 12390-2:2009 (2009) Testing hardened concrete. Making and curing 636
specimens for strength tests. ISBN 9780580670688 637
BS EN 12390-3:2009 (2009) Testing hardened concrete. Compressive strength of 638
test specimens ISBN 9780580587979 639
BS EN 12390-4:2000 (2000) Testing hardened concrete. Compressive strength. 640
Specification for testing machines ISBN 0580354008 641
Buonanno G, Morawska L, Stabile L (2009) Particle emission factors during 642
cooking activities. Atmos Environ 43: 3235-3242 643
Bystrzejewska–Piotrowska G, Golimowski J, Urban PL (2009) Nanoparticles: 644
Their potential toxicity, waste and environmental management. Waste 645
Manage 29: 2587-2595 646
Carpentieri M, Kumar P (2011) Ground-fixed and on-board measurements of 647
nanoparticles in the wake of a moving vehicle. Atmos Environ 45: 5837-648
5852 649
COSHH (2005) Control of substances hazardous to health (Fifth edition). The 650
Control of Substances Hazardous to Health Regulation 2002 (as amended) 651
Approved code of practice and guidance L5, HSE Books, ISBN 978 970 652
7176 2981 7177. 653
de Hartog JJ, Hoek G, Mirme A, Tuch T, Kos GPA, ten Brink HM, Brunekreef B, 654
Cyrys J, Heinrich J, Pitz M, Lanki T, Vallius M, Pekkanen J, Kreyling WG 655
(2005) Relationship between different size classes of particulate matter and 656
meteorology in three European cities. J Environ Monit 7: 302-310 657
Dorevitch S, Demirtas H, Perksy VW, Erdal S, Conroy L, Schoonover T, Scheff 658
PA (2006) Demolition of high-rise public housing increases particulate 659
matter air pollution in communities of high-risk asthmatics. J Air Waste 660
Manage Assoc 56: 1022-1032 661
Fuller G, Carslaw DC, Lodge HW (2002) An empirical approach for the 662
prediction of daily mean PM10 concentrations. Atmos Environ 36: 1431-663
1441 664
Fuller GW, Green D (2004) The impact of local fugitive PM10 from building 665
works and road works on the assessment of the European Union Limit 666
Value. Atmos Environ 38: 4993-5002 667
Hansen D, Blahout B, Benner D, Popp, W (2008) Environmental sampling of 668
particulate matter and fungal spores during demolition of a building on a 669
hospital area. J Hosp Infect 70: 259-264 670
Harrison RM, Beddows DCS, Dall‟Osto M (2011) PMF analysis of wide-range 671
particle size spectra collected on a major highway. Environ Sci Technol 45: 672
5522-5528 673
HSE (2006) The assessment of different metrics of the concentration of nano 674
(ultrafine) particles in exisiting and new industries. Health and Safety 675
Executive Research Report RR513, pp. 72. 676
HSE (2010) Dust control on cut-off saws used for stone or concrete cutting. 677
Health and Safety Executive Construction Information Sheet No 54 678
(Revision 1), 1-4. 679
15
ILO (1995) Safety, health and welfare on construction sites: A training manual. 680
International Labour Organization ISBN 92-2-109182-1, pp. 134. 681
Kittelson DB (1998) Engines and nano-particles: a review. J Aerosol Sci 29: 575-682
588 683
Knibbs LD, Cole-Hunter T, Morawska L (2011) A review of commuter exposure 684
to ultrafine particles and its health effects. Atmos Environ 45: 2611-2622 685
Kuhlbusch T, Asbach C, Fissan H, Gohler D, Stintz M (2011) Nanoparticle 686
exposure at nanotechnology workplaces: A review. Part Fibre Toxicol 8: 22 687
Kukadia V, Upton S, Grimwood C (2003) Contorlling particles, vapour and noise 688
pollution from construction sites; Part 2: Site Preparation, demolition, 689
earthworks and landscaping. BRE Pollution Guide, 1-8. 690
Kumar P, Fennell P, Britter R (2008a) Measurements of particles in the 5-1000 691
nm range close to road level in an urban street canyon. Sci Total Environ 692
390: 437-447 693
Kumar P, Fennell P, Langley D, Britter R (2008b) Pseudo-simultaneous 694
measurements for the vertical variation of coarse, fine and ultra fine particles 695
in an urban street canyon. Atmos Environ 42: 4304-4319 696
Kumar P, Fennell P, Symonds J, Britter R, (2008c) Treatment of losses of 697
ultrafine aerosol particles in long sampling tubes during ambient 698
measurements. Atmos Environ 42: 8819-8826 699
Kumar P, Fennell P, Hayhurst A, Britter RE (2009) Street versus rooftop level 700
concentrations of fine particles in a Cambridge street canyon. Boundary-701
Layer Meteorol 131: 3-18 702
Kumar P, Fennell P, Robins A (2010a) Comparison of the behaviour of 703
manufactured and other airborne nanoparticles and the consequences for 704
prioritising research and regulation activities. J Nanopartcle Res 12: 1523-705
1530 706
Kumar P, Robins A, Vardoulakis S, Britter R (2010b) A review of the 707
characteristics of nanoparticles in the urban atmosphere and the prospects 708
for developing regulatory controls. Atmos Environ 44: 5035-5052 709
Kumar P, Gurjar BR, Nagpure A, Harrison RM (2011a) Preliminary estimates of 710
nanoparticle number emissions from road vehicles in megacity Delhi and 711
associated health impacts. Environ Sci Technol 45: 5514-5521 712
Kumar P, Ketzel M, Vardoulakis S, Pirjola L, Britter R (2011b) Dynamics and 713
dispersion modelling of nanoparticles from road traffic in the urban 714
atmospheric environment - a review. J Aerosol Sci 42: 580-603 715
Kumar P, Robins A, Vardoulakis S, Quincey P (2011c) Technical challenges in 716
tackling regulatory concerns for urban atmospheric nanoparticles. 717
Particuology 9: 566-571. 718
Kumar P (2011d) Footprints of airborne ultrafine particles on urban air quality 719
and public health. J Civil Environ Eng 1:e101: doi:10.4172/jcee.1000e4101. 720
Mann S (2006) Nanotechnology and construction. Nanoforum Report. Institute of 721
nanotechnology, Stirling. 722
McDonald PJ, Aptaker PS, Mitchell J, Mulheron M (2007) A unilateral NMR 723
magnet for sub-structure analysis in the built environment: The Surface 724
GARField. J Magn Reson 185: 1-11 725
McGarry P, Morawska L, He C, Jayaratne R, Falk M, Tran Q, Wang H (2011) 726
Exposure to Particles from Laser Printers Operating within Office 727
Workplaces. Environ Sci Technol 45: 6444-6452 728
Morawska L, Ristovski Z, Jayaratne ER, Keogh DU, Ling X (2008) Ambient 729
nano and ultrafine particles from motor vehicle emissions: Characteristics, 730
16
ambient processing and implications on human exposure. Atmos Environ 731
42: 8113-8138 732
Nazari A, Riahi S (2011) Splitting tensile strength of concrete using ground 733
granulated blast furnace slag and SiO2 nanoparticles as binder. Energ 734
Buildings 43: 864-872 735
Nowack B, Bucheli TD (2007) Occurrence, behavior and effects of nanoparticles 736
in the environment. Environ Pollut 150: 5-22 737
Park K, Cao F, Kittelson DB, McMurray PH (2003) Relationship between particle 738
mass and mobility for diesel exhaust particles. Environ Sci Technol 37: 577-739
583 740
Sanchez F, Sobolev K (2010) Nanotechnology in concrete - A review. Constr 741
Build Mater 24: 2060-2071 742
Schneider T, Brouwer DH, Koponen IK, Jensen KA, Fransman W, Van Duuren-743
Stuurman B, Van Tongeren M, Tielemans E (2011) Conceptual model for 744
assessment of inhalation exposure to manufactured nanoparticles. J Expos 745
Sci Environ Epidemiol 21: 450-463 746
The Stationary Office (1974) Health and Safety at Work etc Act. Ch37, ISBN 747
010543774 748
Tjoe Nij E, Hilhorst S, Spee T, Spierings J, Steffens F, Lumens M, Heederik D 749
(2003) Dust Control Measures in the Construction Industry. Ann Occup Hyg 750
47: 211-218 751
Wallace L, Ott W (2011) Personal exposure to ultrafine particles. J Expos Sci 752
Environ Epidemiol 21: 20-30 753
754
17
LIST OF FIGURE CAPTIONS 755
Figure 1. PNDs averaged over the crushing durations of concrete cubes having 756
different compressive strengths. Also are shown percent increase in PNCs after 757
adjusting for background in the 5–100, 100–300 and 300–562 nm size ranges. 758
Figure 2. Temporal changes in the PNCs during the demolition of concrete (a) 759
slab–1, and (b) slab–2, and corresponding changes in average PNDs during 760
various stages of demolition process for concrete (c) slab–1, and (d) slab–2. 761
Figure 3. Temporal evolution of PNCs during (a) “dry” and (b) “wet” recycling 762
of concrete. Also are shown corresponding mean PNDs during (c) “dry” and (d) 763
“wet” recycling of concrete. 764
Figure 4. The net PMDs during the cube crushing, slab demolition, “dry” and 765
“wet” recycling processes. The net PMDs reflect new release of particle mass in 766
various size range since these are obtained by subtracting the background PMDs 767
(during no–work) from the total PMDs recorded during the event (during work) 768
time. 769
Figure 5. Release of new particle number and mass concentrations from different 770
building activities. These are estimated by subtracting the background 771
concentrations. 772
18
LIST OF TABLES
Table 1. Mix design data for mixes M1, M2 and M3.
aIndicates characteristic strength (MPa) at 28 days measured using cylinder and
cube specimens. bIn saturated, surface–dry condition.
Mix Designation M1 M2 M3
Strength Gradea C35/45 C30/37 C25/30
Cement (kg m–3
) 350 344 336
20 mm aggregateb (kg m
–3)
689 677 660
10 mm aggregateb (kg m
–3)
339 333 325
Sandb (kg m
–3)
803 789 770
Free water (kg m–3
)
154 172 188
Free Water/Cement ratio 0.44 0.50 0.56
0.00E+00
1.00E+04
2.00E+04
3.00E+04
4.00E+04
5.00E+04
1 10 100 1000
D p (nm)
dN
/dlo
gDp (
cm-3
)
Background
M1P1
M1P2
M1P3
M2P1
M2P2
M2P3
M3P1
M3P2
M3P3
5
4
3
2
1
0
104
dN
/dlo
gD
p(c
m–
3)
94.8% 4.8% 0.4%
Proportion (%) of increased PNCs over background
Figure 1Click here to download Figure: Fig. 1_PND_Crushing of conrete cubes.ppt
0.00E+00
1.00E+05
2.00E+05
3.00E+05
1 10 100 1000
Dp (nm)
dN
/dlo
gD
p (
cm-3
)
Background
Demolition
Decay
Post-background
0.00E+00
1.00E+05
2.00E+05
3.00E+05
4.00E+05
100 150 200 250
Time (s)
PN
C (
# c
m-3
)
Pre-background Post-backgroundDem’tion Decay
0.00E+00
1.00E+05
2.00E+05
3.00E+05
4.00E+05
100 150 200 250
Time (s)
PN
C (
# c
m-3
)
Pre-background Post-backgroundDem’tion DecayPre-background Post-backgroundDem’tion Decay
0.00E+00
1.00E+05
2.00E+05
3.00E+05
4.00E+05
280 300 320 340 360
Time (s)
PN
C (
# c
m-3
)
Pre-backg’d Post-backgroundDem’tion DecayPre-backg’d Post-backgroundDem’tion Decay
0.00E+00
1.00E+05
2.00E+05
3.00E+05
4.00E+05
100 150 200 250
Time (s)
PN
C (
# c
m-3
)
Pre-background Post-backgroundDem’tion Decay
0.00E+00
1.00E+05
2.00E+05
3.00E+05
4.00E+05
100 150 200 250
Time (s)
PN
C (
# c
m-3
)
Pre-background Post-backgroundDem’tion DecayPre-background Post-backgroundDem’tion Decay
0.00E+00
1.00E+05
2.00E+05
3.00E+05
4.00E+05
280 300 320 340 360
Time (s)
PN
C (
# c
m-3
)
Pre-backg’d Post-backgroundDem’tion DecayPre-backg’d Post-backgroundDem’tion Decay4
3
2
1
0
PN
C (
# c
m-3
)
105
0 50 100 150 0 20 40 60 80
Time (s)
0.00E+00
1.00E+05
2.00E+05
3.00E+05
1 10 100 1000
Dp (nm)
dN
/dlo
gD
p (
cm
-3)
3
2
1
0
dN
/dlo
gD
p (cm
–3)
1 10 100 1000 1 10 100 1000
Dp (nm)
105
(c) (d)
(a) (b)
Background Background
Figure 2Click here to download Figure: Fig. 2_PND & PNC_Slab demolition.ppt
PN
C (
# c
m-3
)
0.00E+00
1.00E+05
2.00E+05
3.00E+05
4.00E+05
5.00E+05
150 300 450 600 750
Time (s)
PN
C (
# c
m-3
)
Pre-background Post-backgroundRecycling; dry Decay
0.00E+00
1.00E+05
2.00E+05
3.00E+05
4.00E+05
5.00E+05
150 300 450 600 750
Time (s)
PN
C (
# c
m-3
)
Pre-background Post-backgroundRecycling; dry DecayPre-background Post-backgroundRecycling; dry Decay
0.0E+00
1.0E+05
2.0E+05
3.0E+05
4.0E+05
5.0E+05
100 250 400 550
Time (s)
PN
C (
# c
m-3
)
Pre-background Post-backgroundRecycling; wet Decay
0.0E+00
1.0E+05
2.0E+05
3.0E+05
4.0E+05
5.0E+05
100 250 400 550
Time (s)
PN
C (
# c
m-3
)
Pre-background Post-backgroundRecycling; wet DecayPre-background Post-backgroundRecycling; wet Decay5
4
3
2
1
0
105
3
2
1
0
dN
/dlo
gD
p (cm
–3)
105
0 150 300 450 600 0 150 300 450
Time (s)
(a) (b)
1 10 100 1000 1 10 100 1000
Dp (nm)
Background Background
0.00E+00
1.00E+05
2.00E+05
3.00E+05
1 10 100 1000
Dp (nm)
dN
/dlo
gD
p (
nm
)
Background
Recycling (Mixer-on; dry concrete)
Decay
Post-background
0.00E+00
1.00E+05
2.00E+05
3.00E+05
1 10 100 1000
Dp (nm)
dN
/dlo
gD
p (
cm
-3)
Background
Recycling (Mixer-on, wet concrete)
Decay
Post-background
0.E+00
2.E+04
4.E+04
6.E+04
1 10 100 1000Dp (nm)
dN
/dlo
gD
p (
cm
-3)
6
4
2
0
104
0.E+00
2.E+04
4.E+04
6.E+04
1 10 100 1000Dp (nm)
dN
/dlo
gD
p (
cm
-3)
6
4
2
0
104
(c) (d)
Figure 3Click here to download Figure: Fig. 3_PND & PNC_Recycling.ppt
0.00E+00
1.00E-04
2.00E-04
3.00E-04
4.00E-04
1 10 100 1000
Dp (nm)
dM
/dlo
gD
p (
ug/c
m3)
Slab Demolition (Net PMDs)
Dry Recycling (Net PMDs)
Wet Recycling (Net PMDs)
Cube Crushing (Net PMDs)
1 10 100 1000
Dp (nm)
dN
/dlo
gD
p(
gm
cm
–3)
8
6
4
2
0
10–4
0.00E+00
1.00E-05
2.00E-05
3.00E-05
1 10 100 1000
Dp (nm)
dM
/dlo
gD
p (
ug
/cm
3)
Modal peaks
Figure 4Click here to download Figure: Fig. 4_Net PMDs.ppt
New
PM
C R
elea
se (
gm
cm
–3)
New
PN
C R
elea
se (
# c
m–
3)
Building activities
Environmental and Health
Implications
Figure 5Click here to download Figure: Fig. 5_PMCs and PNCs.ppt
Copyright © 2022 FDOKUMEN