Simulated silica
12
doi: 10.1098/rsta.2004.1506 , 525-535 363 2005 Phil. Trans. R. Soc. A Ivan Saika-Voivod, Francesco Sciortino, Tor Grande and Peter H. Poole Simulated silica Email alerting service here right-hand corner of the article or click Receive free email alerts when new articles cite this article - sign up in the box at the top http://rsta.royalsocietypublishing.org/subscriptions go to: Phil. Trans. R. Soc. A To subscribe to This journal is © 2005 The Royal Society on May 18, 2011 rsta.royalsocietypublishing.org Downloaded from
Transcript of Simulated silica

doi: 10.1098/rsta.2004.1506, 525-535363 2005 Phil. Trans. R. Soc. A
Ivan Saika-Voivod, Francesco Sciortino, Tor Grande and Peter H. Poole Simulated silica
Email alerting service hereright-hand corner of the article or click Receive free email alerts when new articles cite this article - sign up in the box at the top
http://rsta.royalsocietypublishing.org/subscriptions go to: Phil. Trans. R. Soc. ATo subscribe to
This journal is © 2005 The Royal Society
on May 18, 2011rsta.royalsocietypublishing.orgDownloaded from

Phil. Trans. R. Soc. A (2005) 363, 525–535doi:10.1098/rsta.2004.1506
Published online 22 December 2004
Simulated silica
By Ivan Saika-Voivod1, Francesco Sciortino
1,2,
Tor Grande3
and Peter H. Poole4
1Dipartimento di Fisica and Istituto Nazionale per la Fisica della Materia,2INFM-CRS SOFT: Complex Dynamics in Structured Systems,
Universita di Roma ‘La Sapienza’, Piazzale Aldo Moro 2, 00185 Roma, Italy3Department of Chemistry, Norwegian University of Science
and Technology, 7491 Trondheim, Norway4Department of Physics, St Francis Xavier University,
Antigonish, Nova Scotia B2G 2W5, Canada ([email protected])
We review how molecular dynamics computer simulations are providing a compre-hensive picture of the behaviour of silica, as modelled by the van Beest–Kramer–van Santen (BKS) potential. We have recently evaluated a number of key propertiesof this model system: the phase diagram, including melting lines of three crystalphases; the equation of state and free energy of the liquid phase; the dynamical equa-tion of state; the average energy of inherent structures, and configurational entropy,associated with the potential energy landscape of the liquid; and a characterizationof the local coordination environments in the supercooled liquid. The results revealthe interplay among a number of phenomena, in particular, the relationship betweenthe energy landscape and the fragile-to-strong crossover of the liquid dynamics; andthe relation of both of these to the possibility of a liquid–liquid phase transition inthe supercooled liquid.
Keywords: silica; computer simulations; energy landscape; liquid–liquid transitions
1. Introduction
Materials with a tetrahedral molecular structure at ambient pressure P play impor-tant roles in many areas of science and technology. Water, silicon, carbon and silicaare all examples of this class of material. Silica in particular has received muchattention because it is commonly encountered in an amorphous solid state, or glass,consisting of a random tetrahedral network (RTN), as opposed to the ordered tetra-hedral network found in crystalline phases such as quartz. The RTN of silica glasshas its origins in the RTN-like structure of the liquid phase above the glass transitiontemperature, Tg. The robustness of the RTN structure in the liquid underlies the factthat silica, according to Angell’s strong–fragile classification of glass-forming liquids(Angell 1991), is among the strongest of all liquids known (Richet 1984). That is, the
One contribution of 17 to a Discussion Meeting ‘Configurational energy landscapes and structural tran-sitions in clusters, fluids and biomolecules’.
525c© 2004 The Royal Society
on May 18, 2011rsta.royalsocietypublishing.orgDownloaded from

526 I. Saika-Voivod and others
temperature dependence of the transport properties of the liquid are nearly perfectlyArrhenius on approach to Tg, in contrast to almost all other liquids.
In computer simulations of fragile liquids (i.e. those with non-Arrhenius behaviourapproaching Tg) the potential energy landscape, or potential energy surface (PES),has proved to be a useful conceptual tool for elucidating the connection betweendynamics and thermodynamics (Goldstein 1969; Stillinger & Weber 1984; Stillinger1995; Sastry et al . 1998; Sciortino et al . 1999; Sastry 2001; Debenedetti & Stillinger2001). In this context, the PES refers to the potential energy hypersurface of thesystem, expressed as a function of the 3N coordinates that specify the positions ofthe N atoms of the system.
However, understanding the interrelationship of the PES, the dynamics andthermodynamics of strong RTN-based liquids presents new challenges and oppor-tunities. Liquids such as silica, silicon and water exhibit a range of exotic behaviour,notably density maxima, and the possibility of liquid–liquid phase transitions (Pooleet al . 1997). As we will describe below, recent computer simulation studies haveallowed us to show that the origins of silica’s strong behaviour can be found in thebehaviour of its PES (Saika-Voivod et al . 2001b). Yet, at the same time, we alsofind that these observations are intimately related to the thermodynamic anomaliesof the system. Hence, from a coordinated simulation study of structure, dynamicsand thermodynamics (including phase behaviour), we illustrate the pervasive roleplayed by the RTN in determining the properties of liquid silica: how its formationon cooling relates to strong liquid behaviour and how its breakdown with pressurerelates to the density maximum and the possibility of a liquid–liquid transition.
2. Simulation methods
All of the results described here are obtained via molecular dynamics simulationsemploying the van Beest–Kramer–van Santen (BKS) potential (van Beest et al .1990), a widely used model of atomic interactions in silica. Detailed descriptions ofthe simulation protocols and techniques are given by Saika-Voivod et al . (2004a, b).As described in these works, we evaluate the properties of the liquid over a wide rangeof temperatures T and volumes V , yielding structural, thermodynamic and dynam-ical information on the liquid phase over greatly varying conditions. Employing aconjugate gradient quenching technique, we also evaluate the inherent structures ofthe liquid over this wide range of states, and evaluate the average inherent structureenergy, eIS. As outlined below, the dependence of eIS on T is then used to estimatethe T dependence of Sc, the configurational entropy of the liquid. In this context, Scquantifies the number of basins of the PES explored by the liquid at a given state.
We also carry out free-energy calculations for the liquid phase, and for three crystalphases: β-quartz, coesite and stishovite. This information allows us to construct thephase diagram of BKS silica (Saika-Voivod et al . 2004b). As we will show below, thisphase diagram provides a key perspective on the behaviour of this model material,allowing us to self-consistently relate the behaviour of the liquid to the location ofits phase boundaries, as is common practice in experiments.
3. Fragile-to-strong dynamical crossover
While silica is a strong liquid in experiments conducted near and below the meltingT , the simulation study of Horbach & Kob (1999) showed that BKS silica behaves as
Phil. Trans. R. Soc. A (2005)
on May 18, 2011rsta.royalsocietypublishing.orgDownloaded from

Simulated silica 527
0.1 0.2 0.3 0.4 0.51000 / T (K−1)
3.90 g cm−3
3.553.263.012.802.612.452.362.31
0 4000 8000
−1.88
−1.86
−1.84
4000 8000 4000 8000
10−7
10−8
10−9
10−10
10−11
10−12
D/T
(cm
2 s−1
K−1
)
(a)
e IS (
MJ
mol
−1)
T (K) T (K) T (K)
(b) (c) (d )
Figure 1. (a) Isochores of D/T . For the low density isochores, the curvature is greater at highT than at low T , indicating that the liquid is crossing over from fragile to strong behaviour asT decreases. (b)–(d) Isochores of eIS for three densities spanning the range of our calculations:(b) 3.90 g cm−3; (c) 3.01 g cm−3; (d) 2.36 g cm−3. The thick horizontal lines show the value ofthe T = 0 ground state crystal energies for each density.
a fragile liquid at the very highest T . However, in the vicinity of 4000 K, the dynam-ics crosses over to that of a strong liquid, establishing an Arrhenius dependence ofrelaxation on T consistent with experimental results obtained at lower T (figure 1).This ‘fragile-to-strong’ crossover (FSC) represents a valuable opportunity to test therobustness of the Adam–Gibbs (AG) relation (Adam & Gibbs 1965), which predictsa relationship between the characteristic relaxation time of the system and the con-figurational entropy, Sc. Using the diffusion coefficient D, we substitute D/T for the
Phil. Trans. R. Soc. A (2005)
on May 18, 2011rsta.royalsocietypublishing.orgDownloaded from
528 I. Saika-Voivod and others
relaxation time, and write the AG relation as
D
T= µ0 exp
(− A
TSc
), (3.1)
where µ0 and A are presumed to be constant with respect to T . BKS silica providesa context in which we can test if equation (3.1) is obeyed throughout the region inwhich an FSC occurs. If so, we can then use the AG relation to connect transportproperties, such as D, to properties of the PES, such as Sc and eIS.
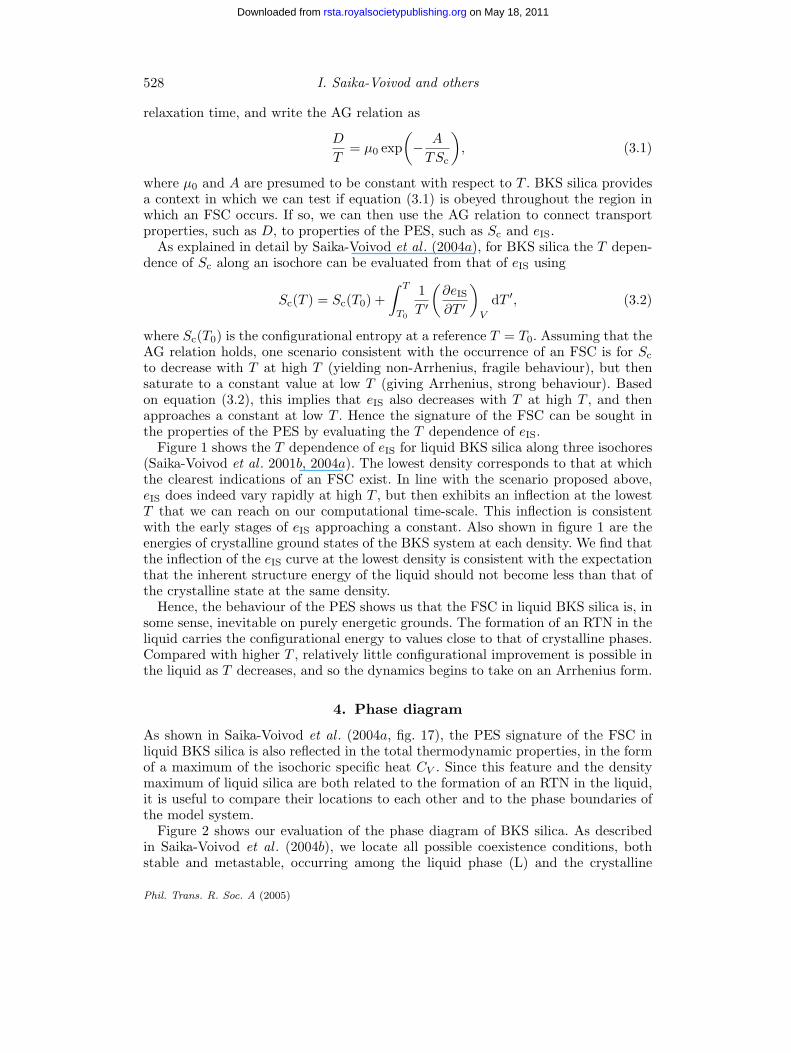
As explained in detail by Saika-Voivod et al . (2004a), for BKS silica the T depen-dence of Sc along an isochore can be evaluated from that of eIS using
Sc(T ) = Sc(T0) +∫ T
T0
1T ′
(∂eIS
∂T ′
)V
dT ′, (3.2)
where Sc(T0) is the configurational entropy at a reference T = T0. Assuming that theAG relation holds, one scenario consistent with the occurrence of an FSC is for Scto decrease with T at high T (yielding non-Arrhenius, fragile behaviour), but thensaturate to a constant value at low T (giving Arrhenius, strong behaviour). Basedon equation (3.2), this implies that eIS also decreases with T at high T , and thenapproaches a constant at low T . Hence the signature of the FSC can be sought inthe properties of the PES by evaluating the T dependence of eIS.
Figure 1 shows the T dependence of eIS for liquid BKS silica along three isochores(Saika-Voivod et al . 2001b, 2004a). The lowest density corresponds to that at whichthe clearest indications of an FSC exist. In line with the scenario proposed above,eIS does indeed vary rapidly at high T , but then exhibits an inflection at the lowestT that we can reach on our computational time-scale. This inflection is consistentwith the early stages of eIS approaching a constant. Also shown in figure 1 are theenergies of crystalline ground states of the BKS system at each density. We find thatthe inflection of the eIS curve at the lowest density is consistent with the expectationthat the inherent structure energy of the liquid should not become less than that ofthe crystalline state at the same density.
Hence, the behaviour of the PES shows us that the FSC in liquid BKS silica is, insome sense, inevitable on purely energetic grounds. The formation of an RTN in theliquid carries the configurational energy to values close to that of crystalline phases.Compared with higher T , relatively little configurational improvement is possible inthe liquid as T decreases, and so the dynamics begins to take on an Arrhenius form.
4. Phase diagram
As shown in Saika-Voivod et al . (2004a, fig. 17), the PES signature of the FSC inliquid BKS silica is also reflected in the total thermodynamic properties, in the formof a maximum of the isochoric specific heat CV . Since this feature and the densitymaximum of liquid silica are both related to the formation of an RTN in the liquid,it is useful to compare their locations to each other and to the phase boundaries ofthe model system.
Figure 2 shows our evaluation of the phase diagram of BKS silica. As describedin Saika-Voivod et al . (2004b), we locate all possible coexistence conditions, bothstable and metastable, occurring among the liquid phase (L) and the crystalline
Phil. Trans. R. Soc. A (2005)
on May 18, 2011rsta.royalsocietypublishing.orgDownloaded from

Simulated silica 529
1000 3000 5000
0
10
20
30
L
SL
S
C
Q
Q
C
1000 2000 3000 4000 5000 6000T (K)
0
10
20
30
P (
GPa
)
Figure 2. Phase diagram of BKS silica in the P–T plane. The solid lines locate the phaseboundaries for the liquid (L), stishovite (S), coesite (C) and β-quartz (Q). Metastable coexistencelines (dashed) are also shown that meet at the metastable S–L–Q triple point. The locationsof the TMD line (filled circles) and CV maxima (open squares) are indicated. The star locatesa state point of the supercooled liquid at which simulation evidence for liquid–liquid phaseseparation was reported in Saika-Voivod et al . (2001a). The inset shows the experimentallydetermined coexistence lines, and their metastable extensions, for the same phases as in themain figure. The location of the observed TMD of the real liquid is shown as a filled circle.
phases β-quartz (Q), coesite (C) and stishovite (S). We compare the model phasediagram to that determined experimentally in figure 2. The quantitative comparisonis poor, especially the pressures at which corresponding features occur. For example,the S–L–C triple point occurs at 13.4 GPa in real silica, but at only 5.8 GPa in themodel. Overall the P range of the crystal stability fields is substantially lower in themodel. The correspondence in the thermal properties is better, but not impressive.The T of the S–L–C and C–L-Q triple points are respectively 15% and 32% higherthan their experimental values. At the same time, it is noteworthy that the topologyof the real silica phase diagram is preserved in the model. Characteristic features,such as the melting line maxima in both the Q–L and C–L coexistence lines are alsoreproduced. Thus, despite its quantitative deficiencies, the model is appropriate forstudying the qualitative behaviour of a substance with a silica-like phase diagram.
As shown in figure 2, the location of the lines of maxima of CV and of densityapproximately coincide, consistent with the connection of both to the RTN formationin the liquid. At the same time, one perplexing feature of the BKS liquid stands outwhen placed in the context of the phase boundaries: the location of the densitymaximum. The occurrence of a temperature of maximum density (TMD) in liquidsilica is a feature that is characteristic of tetrahedral liquids (Angell & Kanno 1976),the TMD in liquid water at 277 K being the best known example. The experimentallyobserved TMD in silica occurs at T = 1823 K at ambient P , in the supercooled liquid.Yet in BKS silica it occurs well above melting at T as high as 4950 K, an increaseon the experimental value of 170%. This is much larger than the increase in T ofother characteristic features, such as the triple points, which are not more than 32%
Phil. Trans. R. Soc. A (2005)
on May 18, 2011rsta.royalsocietypublishing.orgDownloaded from
530 I. Saika-Voivod and others
2000
2500
3000
3500
4000
4500
5000
T (
K)
S
L
S + L
S + C C C + Q Q
Q + LC + L
0
50
100150
200
0.2 0.40
5
10
15
0.2 0.4r (nm)
0.2 0.4
4.63 5.645.14 6.15 6.65 7.16 7.67 8.17 8.68
4 5 6 7 8 9V (cm3 mol−1)
g4
g5
(a)
(b)
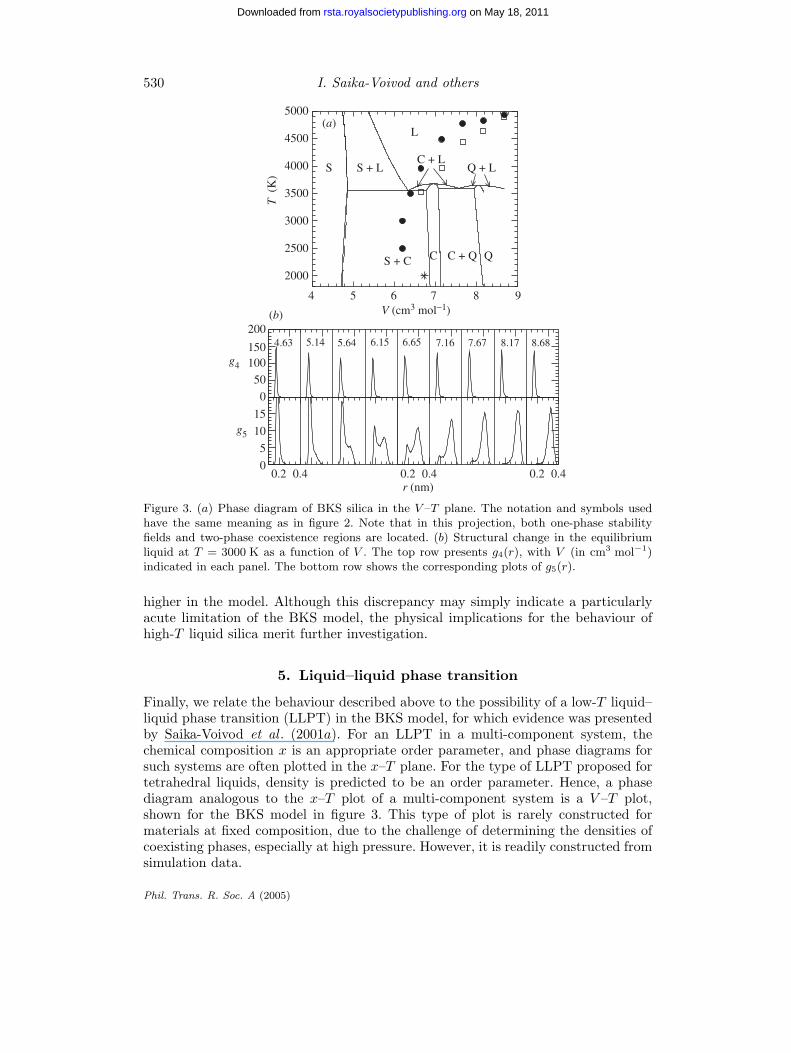
Figure 3. (a) Phase diagram of BKS silica in the V –T plane. The notation and symbols usedhave the same meaning as in figure 2. Note that in this projection, both one-phase stabilityfields and two-phase coexistence regions are located. (b) Structural change in the equilibriumliquid at T = 3000 K as a function of V . The top row presents g4(r), with V (in cm3 mol−1)indicated in each panel. The bottom row shows the corresponding plots of g5(r).
higher in the model. Although this discrepancy may simply indicate a particularlyacute limitation of the BKS model, the physical implications for the behaviour ofhigh-T liquid silica merit further investigation.
5. Liquid–liquid phase transition
Finally, we relate the behaviour described above to the possibility of a low-T liquid–liquid phase transition (LLPT) in the BKS model, for which evidence was presentedby Saika-Voivod et al . (2001a). For an LLPT in a multi-component system, thechemical composition x is an appropriate order parameter, and phase diagrams forsuch systems are often plotted in the x–T plane. For the type of LLPT proposed fortetrahedral liquids, density is predicted to be an order parameter. Hence, a phasediagram analogous to the x–T plot of a multi-component system is a V –T plot,shown for the BKS model in figure 3. This type of plot is rarely constructed formaterials at fixed composition, due to the challenge of determining the densities ofcoexisting phases, especially at high pressure. However, it is readily constructed fromsimulation data.
Phil. Trans. R. Soc. A (2005)
on May 18, 2011rsta.royalsocietypublishing.orgDownloaded from

Simulated silica 531
We see in figure 3 that the line of CV maxima and the TMD line envelop thelow-T , high-V region of the V –T plane in which the one-phase stability fields ofcoesite and β-quartz occur. Both of these crystals are based on four-coordinate Siatoms and, as will be shown below, this is also the region in which four-coordinateSi atoms dominate the liquid structure. Notable in figure 3 is the large two-phasecoexistence region between the one-phase stability fields of coesite and stishovite,across which the density changes by ca. 30%. The point studied for signs of an LLPToccurs near the high-V side of this region, and at V just above that of the TMD.In multi-component systems, there are numerous cases where liquid–liquid demixingoccurs in a supercooled melt at compositions within that of a broad crystal–crystalcoexistence region. The simulations on which our phase boundary evaluations arebased do not penetrate to low enough T to reveal an explicit LLPT in the supercooledliquid phase, if indeed one occurs at all. At the same time, the thermodynamic andstructural properties of the supercooled liquid in the vicinity of the stishovite–coesitecoexistence region exhibit striking mixture-like behaviour.
To characterize the local structure, we consider g(r), the Si–O radial distributionfunction (RDF); 4πr2g(r) dr is the probability that an oxygen atom will be foundat a distance between r and r + dr from a reference Si atom. We decompose g(r)according to the contributions made by successive nearest-neighbour (NN) O atomsof a given Si atom, labelled in ascending order of distance from an Si atom. That is,we define sub-RDFs gi(r) according to
g(r) =∞∑
i=1
gi(r),
where 4πr2gi(r) dr is the probability that the ith NN O atom of a given Si atomwill be found at a distance between r and r + dr. In figure 3b we show g4(r) andg5(r), the contributions to the conventional Si–O radial distribution function madeby those O atoms that are, respectively, a fourth and fifth NN of an Si atom.
We use g4(r) and g5(r) to monitor the structural evolution of the supercooledliquid as the density changes across the phase diagram in figure 3. The change ing4(r) with V is unremarkable. The progression simply shows that there are always atleast four NN O atoms in the first coordination shell of Si atoms. We use the positionof the peak in g4(r) as a reference, approximately locating the first coordination shell.
The change in g5(r) with V is much more interesting. Over a range of V , from 5.5 to7.5 cm3 mol−1, the g5(r) distribution is bimodal, with one of the peaks occurring at adistance consistent with the first coordination shell, and the second outside it. Thisindicates that two distinct populations of Si atoms occur under these conditions:those having four O atoms in the first coordination shell, and those having five.That is, the liquid in this regime is behaving as a mixture of two ‘species’ of Si atom,distinguished by their coordination environments.
The thermodynamic behaviour of the supercooled liquid also suggests mixture-likeproperties. Notably, the V where the numbers of these species are equal coincideswith the V at which isotherms of S versus V exhibit a maximum, shown in figure 4.(Note that this maximum formally corresponds to the TMD line of the liquid, plottedin figure 3.) Analogous behaviour is observed in multi-component systems, where theentropy maximum arises due to the entropy of mixing of the chemical species. TheHelmholtz free energy A and potential energy E are also shown in figure 4. As in
Phil. Trans. R. Soc. A (2005)
on May 18, 2011rsta.royalsocietypublishing.orgDownloaded from

532 I. Saika-Voivod and others
75
80
85
−1.73
−1.72
−1.71
−1.70
9−2.14
−2.12
−2.10
−2.08
A (
MJ
mol
−1)
S (J
mol
−1 K
−1)
E (
MJ
mol
−1)
4 5 6 7 8 94 5 6 7 8V (cm mol−1)
94 5 6 7 8V (cm mol−1)
V (cm mol−1)
(a) (b)
(c)
Figure 4. Isotherms of (a) A, (b) E and (c) S as a function of V . Note that all curves have beenshifted by arbitrary amounts for clarity. As a reference, the vertical dashed lines indicate thevolumes of stishovite and coesite at the S–L–C triple point. The temperatures shown are 2500 K(circles), 3000 K (squares), 3500 K (diamonds), 4000 K (triangles), 4500 K (left triangles) and5000 K (down triangles).
the case of S, these quantities display a pattern of behaviour (as a function of V )analogous to that of the Gibbs free energy and enthalpy in a two-component system(as a function of x). At high T , the contributions from the curvature of both S(V ) andE(V ) to the thermodynamic stability of the homogeneous liquid phase are positive.At low T in the vicinity of the S maximum, the contribution of E(V ) decreases tonearly zero, and so the homogeneous liquid is ‘entropy stabilized’ in this range of V .If the trend in the curvature of E(V ) continues to lower T , an LLPT may occur. Athigher V , the trends are reversed. E(V ) contributes more strongly to stability, whileS(V ) contributes negatively: the liquid is ‘energy stabilized’. At intermediate V lies alocus of states along which (∂2S/∂V 2)T = 0. In this region, (∂2E/∂V 2)T seems alsoto be decreasing toward zero, making this the most likely V at which the LLPT canbe observed at the highest T . This interplay of behaviour almost certainly underlieswhy evidence was found for an LLPT near this particular V by Saika-Voivod et al .(2001a).
In summary, our phase diagram, thermodynamic and structural results on BKSsilica all suggest a picture in which, as T decreases, the liquid phase self-organizesinto a mixture of two distinct coordination species. An LLPT need not necessarilyoccur in such a ‘self-organized mixture’, for the same reasons that an LLPT does notnecessarily occur in all chemical mixtures. However, our results make clear that theexplicit mixture-like behaviour of BKS silica (and potentially, of the large class ofrelated tetrahedral materials, both real and simulated) needs to be considered to fully
Phil. Trans. R. Soc. A (2005)
on May 18, 2011rsta.royalsocietypublishing.orgDownloaded from

Simulated silica 533
understand their behaviour. ‘Mixture’ or ‘two-state’ models of chemically pure liquidshave a long history in theoretical treatments of the liquid state (see, for example,Rapoport 1968), but most studies in recent decades have opted to consider liquids interms of an undifferentiated continuum of local configurations. The present resultsindicate that a reconsideration of the mixture model approach, for some materials,is justified at low T .
This research was supported by NSERC (Canada), SHARCNET, the Canada Research ChairsProgram, the INFM ‘Iniziativa Calcolo Parallelo’, PRA-HOP, MIUR FIRB and PRIN 2000.
References
Adam, G. & Gibbs, J. H. 1965 On the temperature dependence of cooperative relaxation prop-erties in glass-forming liquids. J. Chem. Phys. 43, 139–146.
Angell, C. A. 1991 Relaxation in liquids, polymers and plastic crystals: strong/fragile patternsand problems. J. Non-cryst. Solids 131–133, 13–31.
Angell, C. A. & Kanno, H. 1976 Density maxima in high-pressure supercooled water and liquidsilicon dioxide. Science 193, 1121–1122.
Debenedetti, P. G. & Stillinger, F. H. 2001 Supercooled liquids and the glass transition. Nature410, 259–267.
Goldstein, M. 1969 Viscous liquids and the glass transition: sources of the excess heat capacity.J. Chem. Phys. 51, 3728–3739.
Horbach, J. & Kob, W. 1999 Static and dynamic properties of a viscous silica melt. Phys. Rev.B60, 3169–3181.
Poole, P. H., Grande, T., Angell, C. A. & McMillan, P. F. 1997 Polymorphic phase transitionsin liquids and glasses. Science 275, 322–323.
Rapoport, E. 1968 Melting-curve maxima at high pressure. II. Liquid cesium. Resistivity, Halleffect, and composition of molten tellurium. J. Chem. Phys. 48, 1433–1437.
Richet, P. 1984 Viscosity and configurational entropy of silicate melts. Geochim. Cosmochim.Acta 48, 471–483.
Saika-Voivod, I., Sciortino, F. & Poole, P. H. 2001a Computer simulation of liquid silica: equationof state and liquid–liquid phase transition. Phys. Rev. E 63, 011202.
Saika-Voivod, I., Sciortino, F. & Poole, P. H. 2001b Fragile-to-strong transition and polyamor-phism in the energy landscape of liquid silica. Nature 412, 514–517.
Saika-Voivod, I., Sciortino, F. & Poole, P. H. 2004a Free energy and configurational entropy ofliquid silica: fragile-to-strong crossover and polyamorphism. Phys. Rev. E 69, 041503.
Saika-Voivod, I., Sciortino, F., Grande, T. & Poole, P. H. 2004b Phase diagram of silica fromcomputer simulation. (Preperint cond-mat/0406192.)
Sastry, S. 2001 The relationship between fragility, configurational entropy and the potentialenergy landscape of glass-forming liquids. Nature 409, 164–167.
Sastry, S., Debenedetti, P. G. & Stillinger, F. H. 1998 Signatures of distinct dynamical regimesin the energy landscape of a glass-forming liquid. Nature 393, 554–557.
Sciortino, F., Kob, W. & Tartaglia, P. 1999 Inherent structure entropy of supercooled liquids.Phys. Rev. Lett. 83, 3214–3217.
Stillinger, F. H. 1995 A topographic view of supercooled liquids and glass formation. Science267, 1935–1939.
Stillinger, F. H. & Weber, T. A. 1984 Packing structures and transitions in liquids and solids.Science 225, 983–989.
van Beest, B. W. H., Kramer, G. J. & van Santen, R. A. 1990 Force fields for silicas andaluminophosphates based on ab initio calculations. Phys. Rev. Lett. 64, 1955–1958.
Phil. Trans. R. Soc. A (2005)
on May 18, 2011rsta.royalsocietypublishing.orgDownloaded from

534 I. Saika-Voivod and others
Discussion
C. R. A. Catlow (Department of Chemistry, University College London, UK ).Have you considered using more sophisticated potentials for SiO2, such as thosewhich include the effects of covalence and polarizability?
P. H. Poole. It will certainly be important to confirm the qualitative aspects ofthe results with better potentials. Ours is an initial survey, requiring of the orderof 100 state points to be equilibrated, many at the lowest temperatures accessibleto current computing power. This approach leads us to use an approximate, butcomputationally efficient potential.
P. G. Wolynes (Department of Chemistry and Biochemistry, Department ofPhysics and Center for Theoretical Biological Physics, University of California, SanDiego, La Jolla, CA, USA). According to the random first-order transition approachto glass formation there is a crossover temperature for activated behaviour. Can youtell us where this occurs for BKS silica? Is it distinguishable from the fragile-strongcrossover?
P. H. Poole. Horbach & Kob (1999) estimated that the critical temperature ofmode coupling theory (MCT) occurs in BKS silica at 3330 K. A crossover to activatedbehaviour is suggested by the temperature range in which the liquid dynamics devi-ates significantly from the prediction of MCT; this occurs in the vicinity of 3600 K.This temperature range is in approximate correspondence with the crossover in thelandscape properties that we find underlies the fragile-to-strong crossover: the inflec-tion in the inherent structure energy occurs at ca. 3900 K. This is the temperature atwhich deviations from high-temperature fragile behaviour can be expected to begin,with a fully developed activated behaviour emerging as the temperature decreasesbelow this value. We have not examined the microscopic dynamics in detail to assessthe degree to which purely activated behaviour has set in at the lowest temperaturesstudied, but it would be enlightening to do so for the reasons you suggest.
J. L. Finney (Department of Physics and Astronomy, University College London,UK ). The theoretical work of George Stell and others convinces me that, in prin-ciple, a liquid–liquid transition can exist in a system whose structure is determinedby a potential function with particular—one might say pathological—properties. Inlooking at candidate systems for the possible existence of a liquid–liquid transitionphase boundary, rather than trying to decide if such a transition exists by calculatingor simulating the system’s behaviour, would it be more effective to focus on sortingout the details of the appropriate potential function to see if it has the propertiesappropriate to the existence of two liquid phases? Or are the necessary potentialfunction characteristics not that well defined?
P. H. Poole. I agree that this should be the long-term goal: to identify the pos-sibility of a liquid–liquid phase transition from the properties of the intermolecularpotential. As you point out, Stell and others have identified potential properties suf-ficient to induce the occurrence of a liquid–liquid phase transition in certain classesof system, particularly spherically symmetric atomic potentials. The properties that
Phil. Trans. R. Soc. A (2005)
on May 18, 2011rsta.royalsocietypublishing.orgDownloaded from
Simulated silica 535
a multi-site molecular potential should have to yield a liquid–liquid transition aremuch less well understood. Computational work can serve to identify candidate sys-tems and suggest trends, as we have tried to do here. The pursuit of a generalanalytical theory connecting potential properties to the thermodynamics of a liquid–liquid phase instability is a daunting theoretical task, yet a successful attempt wouldgenerate some much needed insight. It deserves more attention.
Phil. Trans. R. Soc. A (2005)
on May 18, 2011rsta.royalsocietypublishing.orgDownloaded from