Surface Functionalization of Silica NPs
10
Effect of pH, citrate treatment and silane-coupling agent concentration on the magnetic, structural and surface properties of functionalized silica-coated iron oxide nanocomposite particles H. Mohammad-Beigi a,b , S. Yaghmaei b , R. Roostaazad b , H. Bardania a , A. Arpanaei a,n a Department of Industrial and Environmental Biotechnology, National Institute of Genetic Engineering and Biotechnology, P.O. Box: 14965/161, Tehran, Iran b Department of Chemical and Petroleum Engineering, Sharif University of Technology, P.O. Box: 9465-11365, Tehran, Iran article info Article history: Received 25 June 2011 Received in revised form 31 August 2011 Accepted 19 October 2011 Available online 28 October 2011 abstract Superparamagnetic iron oxide nanoparticles were synthesized by coprecipitation of iron chloride salts at various pH values (9, 10, 11 and12) that were adjusted using an ammonia solution. Increasing the pH from 9 to 12 led to decreases in the size of iron oxide nanoparticles from 7.9 71.4 to 5 70.6 nm and the saturation magnetization (M s ) from 82.73 to 67.14 emu/g, respectively, when analyzed with transmis- sion electron microscopy (TEM) and vibrating sample magnetometer (VSM). X-ray diffraction patterns as well as M s values showed that magnetite is the dominantly synthesized phase in the examined pH values. Unmodified iron oxide nanoparticles were coated with silica via the hydrolysis and condensa- tion of tetraethyl orthosilicate (TEOS), designated P1 particles. The size distribution diagram of P1 particles showed two regions with mean sizes of 143.3 715.4 and 216.9 713.7 nm corresponding to silica and iron oxide@silica particles, respectively. Stabilization of iron oxide nanoparticles using sodium citrate prior to coating with silica (P2 particles) resulted in nanocomposites with a mean size of 275 716.1 nm and an M s value of 2.9 emu/g. Subsequently, the surface of P2 particles was functiona- lized by amine groups using N-(2-aminoethyl)-3-aminopropyltrimethoxysilane (EDS). Results obtained from the measurement of zeta potential revealed that the highest value of isoelectric point (PI) change, indicating a more efficient surface functionalization, occurs when the EDS concentration of 90 mM is used, as compared to that for particles aminated using 25 and 180 mM EDS. & 2011 Elsevier B.V. All rights reserved. 1. Introduction The recent advances in nanotechnology especially in the production of core/shell nanostructures have presented new opportunities to use simultaneously the advantages of various materials and enhance their chemical, physical and optical properties [1,2]. The shell layer not only ensures the chemical stability of the core but also prepares an ideal surface chemistry for the surface modification and immobilization of biomolecules such as DNA and proteins [3,4]. Magnetite nanoparticles (Fe 3 O 4 ) are one of the most used structures as a core to fabricate core/shell systems due to their special superparamagnetic properties. Based on the superpara- magnetic properties, magnetic nanoparticles have been suggested for many applications in biomedicine and biotechnology, such as drug delivery [5], bioseparation [6] and magnetic resonance imaging (MRI) [7]. However, there are some challenges for the in vivo application of bare nanoparticles due to the presence of biological barriers [8]. Superparamagnetic properties arise from a finite-size effect. When the particle size is smaller than the critical parameter diameter, D c , the particle is called a single-domain particle. A further reduction of the diameter below superparamagnetic dia- meter, D sp , which is a certain value for magnetite nanoparticles, causes the spins in the nanoparticle to be affected by thermal fluctuations. Such a single-domain particle is called superparamag- netic, where magnetization curve exhibits no hysteresis [9,10]. Several synthesis procedures have been developed for prepar- ing magnetite nanoparticles, such as chemical coprecipitation [11], sol–gel [12], microemulsion [13] and so on. A wide variety of experimental factors such as pH, temperature, Fe 2 þ /Fe 3 þ molar ratio and stirring velocity affect the synthesis of iron oxide nanoparticles and their properties [14,15]. Synthesis of nanopar- ticles in high pH values ( 47, [16]) can lead to changes in the chemical composition of crystals and the electrostatic surface charge of the particles, allowing the increase of their surface to volume ratio and leading to the formation of smaller nanoparti- cles [15]. Contents lists available at SciVerse ScienceDirect journal homepage: www.elsevier.com/locate/physe Physica E 1386-9477/$ - see front matter & 2011 Elsevier B.V. All rights reserved. doi:10.1016/j.physe.2011.10.015 n Corresponding author. Tel.: þ98 2144580463; fax: þ98 2144580399. E-mail address: [email protected] (A. Arpanaei). Physica E 44 (2011) 618–627
Transcript of Surface Functionalization of Silica NPs
Physica E 44 (2011) 618–627
Contents lists available at SciVerse ScienceDirect
Physica E
1386-94
doi:10.1
n Corr
E-m
journal homepage: www.elsevier.com/locate/physe
Effect of pH, citrate treatment and silane-coupling agent concentration onthe magnetic, structural and surface properties of functionalizedsilica-coated iron oxide nanocomposite particles
H. Mohammad-Beigi a,b, S. Yaghmaei b, R. Roostaazad b, H. Bardania a, A. Arpanaei a,n
a Department of Industrial and Environmental Biotechnology, National Institute of Genetic Engineering and Biotechnology, P.O. Box: 14965/161, Tehran, Iranb Department of Chemical and Petroleum Engineering, Sharif University of Technology, P.O. Box: 9465-11365, Tehran, Iran
a r t i c l e i n f o
Article history:
Received 25 June 2011
Received in revised form
31 August 2011
Accepted 19 October 2011Available online 28 October 2011
77/$ - see front matter & 2011 Elsevier B.V. A
016/j.physe.2011.10.015
esponding author. Tel.: þ98 2144580463; fa
ail address: [email protected] (A. Arpanaei).
a b s t r a c t
Superparamagnetic iron oxide nanoparticles were synthesized by coprecipitation of iron chloride salts
at various pH values (9, 10, 11 and12) that were adjusted using an ammonia solution. Increasing the pH
from 9 to 12 led to decreases in the size of iron oxide nanoparticles from 7.971.4 to 570.6 nm and the
saturation magnetization (Ms) from 82.73 to 67.14 emu/g, respectively, when analyzed with transmis-
sion electron microscopy (TEM) and vibrating sample magnetometer (VSM). X-ray diffraction patterns
as well as Ms values showed that magnetite is the dominantly synthesized phase in the examined pH
values. Unmodified iron oxide nanoparticles were coated with silica via the hydrolysis and condensa-
tion of tetraethyl orthosilicate (TEOS), designated P1 particles. The size distribution diagram of P1
particles showed two regions with mean sizes of 143.3715.4 and 216.9713.7 nm corresponding to
silica and iron oxide@silica particles, respectively. Stabilization of iron oxide nanoparticles using
sodium citrate prior to coating with silica (P2 particles) resulted in nanocomposites with a mean size of
275716.1 nm and an Ms value of 2.9 emu/g. Subsequently, the surface of P2 particles was functiona-
lized by amine groups using N-(2-aminoethyl)-3-aminopropyltrimethoxysilane (EDS). Results obtained
from the measurement of zeta potential revealed that the highest value of isoelectric point (PI) change,
indicating a more efficient surface functionalization, occurs when the EDS concentration of 90 mM is
used, as compared to that for particles aminated using 25 and 180 mM EDS.
& 2011 Elsevier B.V. All rights reserved.
1. Introduction
The recent advances in nanotechnology especially in theproduction of core/shell nanostructures have presented newopportunities to use simultaneously the advantages of variousmaterials and enhance their chemical, physical and opticalproperties [1,2]. The shell layer not only ensures the chemicalstability of the core but also prepares an ideal surface chemistryfor the surface modification and immobilization of biomoleculessuch as DNA and proteins [3,4].
Magnetite nanoparticles (Fe3O4) are one of the most usedstructures as a core to fabricate core/shell systems due to theirspecial superparamagnetic properties. Based on the superpara-magnetic properties, magnetic nanoparticles have been suggestedfor many applications in biomedicine and biotechnology, such asdrug delivery [5], bioseparation [6] and magnetic resonanceimaging (MRI) [7]. However, there are some challenges for the
ll rights reserved.
x: þ98 2144580399.
in vivo application of bare nanoparticles due to the presence ofbiological barriers [8].
Superparamagnetic properties arise from a finite-size effect.When the particle size is smaller than the critical parameterdiameter, Dc, the particle is called a single-domain particle. Afurther reduction of the diameter below superparamagnetic dia-meter, Dsp, which is a certain value for magnetite nanoparticles,causes the spins in the nanoparticle to be affected by thermalfluctuations. Such a single-domain particle is called superparamag-netic, where magnetization curve exhibits no hysteresis [9,10].
Several synthesis procedures have been developed for prepar-ing magnetite nanoparticles, such as chemical coprecipitation[11], sol–gel [12], microemulsion [13] and so on. A wide varietyof experimental factors such as pH, temperature, Fe2þ/Fe3þ
molar ratio and stirring velocity affect the synthesis of iron oxidenanoparticles and their properties [14,15]. Synthesis of nanopar-ticles in high pH values (47, [16]) can lead to changes in thechemical composition of crystals and the electrostatic surfacecharge of the particles, allowing the increase of their surface tovolume ratio and leading to the formation of smaller nanoparti-cles [15].

H. Mohammad-Beigi et al. / Physica E 44 (2011) 618–627 619
Due to the large surface to volume ratio, magnetite nanopar-ticles are highly prone to aggregate in order to reduce theirsurface energy. The stabilization of magnetite nanoparticles priorto fabrication of the core/shell nanostructure can be achieved byvarious stabilizers such as sodium citrate to prepare electrostaticrepulsion between nanoparticles [17]. This stability is based onthe equilibrium between attractive and repulsive forces. Further-more, magnetite nanoparticles are subjected to oxidation tomaghemite (g-Fe2O3) in the presence of oxygen, which lead tonecessity of using various materials such as Au [18] or SiO2 [19] asa shell coating around the magnetic nanoparticles. SiO2 nanopar-ticles and shells have flexible and biocompatible surfaces becauseof hydroxyl (OH) groups on their surfaces. This enables silicasurfaces to be functionalized with silane coupling agents (SCAs)like aminosilanes for biomolecules’ conjugation [20].
Two kinds of methods have mainly been used to fabricatesilica-coated magnetic nanoparticles, i.e., microemulsion system[21] and Stober process [22]. The later is based on the hydrolysisand condensation of tetraethyl orthosilicate (TEOS) or tetra-methyl orthosilicate (TMOS) in an ethanol–ammonia mixture.
SCAs can form a covalent bond with silica surface by theirhydrozable group and with organic molecules by a non-hydroz-able end. Functionalized surfaces can also be coated by biomole-cules or even covered with oppositely charged nanoparticles [23].Different parameters, such as concentration, temperature andreaction time, affect the final structure and morphology of theadsorbed SCA layers [24]. The effect of concentration of SCAs onthe properties of the functional silane layer was studied in someworks and it was shown that applying high concentration of SCAscan lead to the polymerization of SCA molecules on the silicasurfaces or in the solution [24,25].
Through several researches, the effect of operational parameterson the physical or chemical properties of iron oxide-based nanocom-posites has been studied [15,24]. In this work, we focused on someoperational parameters including (i) the effect of pH adjusted byammonia solution on iron oxide nanoparticles’ size, magnetic proper-ties and crystalline structure; (ii) stabilization of iron oxide nanopar-ticles by addition of sodium citrate and its effect on the magneticproperties and size of resulted silica-coated iron oxide nanocompositeparticles and finally (iii) the effect of concentration of the aminosilanecompound (N-(2-aminoethyl)-3-aminopropyltrimethoxysilane (EDS))on the functionalization efficiency of silica surfaces studied using zetapotential measurements. Transmission electron microscopy (TEM),vibrating sample magnetometer (VSM), zeta potential measurement,X-ray diffraction spectroscopy, TEM electron diffraction and TEMenergy dispersive X-ray spectroscopy techniques were employed toinvestigate the effect of the above parameters on the properties ofsynthesized nanocomposite particles.
2. Experimental
2.1. Materials
Ferrous chloride tetrahydrate (FeCl2 �4H2O), ferric chloridehexahydrate (FeCl3 �6H2O), hydrochloric acid (HCl, 37%), ammo-nia solution (NH3, 28–30%), sodium citrate dehydrate(C6H5Na3O7 �2H2O), tetraethyl orthosilicate (TEOS, 99%), anhy-drous ethanol (99.99%), N-(2-aminoethyl)-3-aminopropyltri-methoxysilane (EDS), acetic acid (100%), sodium hydroxide(NaOH) and sodium chloride (NaCl, 99.5%) were purchased fromMerck-Chemicals. All the chemicals and solvents were usedwithout further purification. In all experiments, Millipure waterwith a resistivity of greater than 18.0 MO cm was deoxygenatedin ultrasonic bath and then by bubbling N2 gas for 30 minbefore use.
2.2. Synthesis
2.2.1. Preparation of iron oxide nanoparticles
Iron oxide nanoparticles were prepared by reverse coprecipi-tation of iron salts with ammonia according to the Massartmethod [11]. For precisely controlling the pH, the ammoniasolution is more appropriate than other basic sources like NaOH.Under vigorous mechanical stirring, 5 mL of aqueous mixture ofFeCl2 �4H2O (0.4 M) and FeCl3 �6H2O (0.8 M) in HCl (0.4 M) wasadded dropwise to the 50 mL of ammonia solution under N2
protection and at the adjacent pH (9–12). The color of solutionturned black immediately. Nucleation and growth of magnetitenanoparticles were allowed to continue for 30 min at ambienttemperature. Subsequently, the black solid product was sonicatedin an ultrasonic bath for 20 min. Magnetite nanoparticles wereisolated from solution and washed three times with deoxyge-nated water by applying an external magnetic field, dispersed in40 mL (10 mg/mL) deoxygenated water and prepared for TEM andVSM analyses.
2.2.2. Stabilization of iron oxide nanoparticles with citrate groups
To stabilize iron oxide nanoparticles, once they were isolatedby an external magnetic field, the precipitate was redispersed in44 mL of deoxygenated water by sonication. 6 mL of sodiumcitrate solution (0.16 mM) was added to the dispersion andstirred for 1 h at 60 1C. Magnetite nanoparticles were washedaccording to the method described above and redispersed indeoxygenated DI-water.
2.2.3. Preparation of iron oxide@silica nanoparticles
Iron oxide nanoparticles were coated subsequently by silicaaccording to the modified Stober method by hydrolysis andcondensation of TEOS [22,26]. Both citrate modified and non-modified magnetite nanoparticles were coated by silica through asimilar procedure. 1 mL of previously washed magnetite nano-particles were redispersed in 15 mL of DI-water by sonication.3 mL of the redispersed magnetite nanoparticles was added to thesolution containing 14 mL water, 14 mL ethanol and 3 mL ammo-nia. TEOS solution was prepared by addition of 1 mL TEOSto15 mL ethanol and subsequently was added dropwise to themagnetite solution. The solution was stirred for 4 h at ambienttemperature. The whole procedure was done under N2 protection.The resulting nanoparticles were centrifugated three times byethanol (14,000 rpm, 10 min). Silica-coated magnetite nanocom-posite particles were isolated from the uncored silica particles byan external magnetite field and then dispersed in 10 mL ethanol.
2.2.4. Functionalization of silica surface with EDS.
After washing silica-coated magnetite nanocomposite particlesby ethanol, they were redispersed in the mixture of 14 mL ethanoland 0.6 mL water. Under stirring condition, acetic acid (2% v/v)and different concentrations of EDS (25, 90 and 180 mM) wereadded to this solution. After hydrolyzing for 1 h at room tem-perature, amine-functionalized particles were centrifugated threetimes by ethanol and water (14,000 rpm, 10 min). The resultingnanoparticles were redispersed in 20 mL water [27].
2.3. Data analysis
Analysis of Variance (ANOVA) was used to determine whetherthe effect of pH on the size of magnetite nanoparticles isstatistically significant. The significance of differences betweenmagnetite nanoparticles sizes prepared at different pH values wasanalyzed by the Duncan test, as a Post Hoc test.

H. Mohammad-Beigi et al. / Physica E 44 (2011) 618–627620
2.4. Material characterization
The X-ray diffraction (XRD) patterns of magnetite nanoparti-cles were collected by XRD measurements using CuKa radiation(l¼1.5406 A) at 40 kV/40 mA on a Shimadzu 1001/SC diffract-ometer, in the Bragg–Bretano geometry in the 2y range of 4–70(scan speed (deg./min) 2, preset time (s) 0.6 and step (deg.) 0.02).
Particles size, morphology and structure were studied usingTEM (Philips CM 200, 200 kV TEM, ATM 2kn2k CCD Camera).
Zeta potential measurements were carried out using a MalvernZetasizer Nano (S90, UK) at different pH values to determine theisoelectric point of synthesized particles. The pH of nanoparticlessuspension was adjusted with standard solutions of 0.1 N HCl andNaOH. Amine-functionalized iron oxide@silica nanocompositeparticles were dispersed by ultrasonic bath for about 10 min priorto each measurement. Measurements were repeated three timesand averaged.
The magnetic properties of nanoparticles were analyzed usinga Vibrating Sample Magnetometer (VSM) equipment (Imax¼150 A,Pr9 kW) at room temperature.
Fig. 1. XRD patterns for Fe3O4 nanoparticles synthesized at pH¼9 (a), 10 (b),
11 (c) and 12 (d).
3. Result and discussion
3.1. The effect of pH on the iron oxide nanoparticles’ properties
In this work, ammonia was used as a base for the precipitationof Fe salts. Based on the previous works, magnetite nanoparticles,which were synthesized by ammonia, had better magnetiteproperties and smaller sizes compared to those prepared bysodium hydroxide [28]. Gribanov et al.’s results [14] confirmedthe presence of non-magnetic compounds like a-FeOOH in thesolid state, precipitated with the help of sodium hydroxide. Onthe other hand, non-magnetic compounds were absent when themagnetite was precipitated by ammonia solution. It is alsoobvious that a precise and easier control of pH is achievableusing ammonia solution rather than sodium hydroxide.
Magnetite nanoparticles were synthesized in the pH range of9–12. Fig. 1 displays the XRD patterns of the synthesized ironoxide nanoparticles. The peaks’ position and the correspondingMiller indexes of the nanoparticles were compared to the stan-dard patterns of iron oxide products of the JCPDS databases.g-Fe2O3, Fe(OH)3 and a-Fe2O3 could be important impurities andusual co-products in a chemical coprecipitation process as a resultof oxidation of magnetite (Fe3O4) in the presence of smallamounts of O2 in the reaction solution. Both magnetite andmaghemite have spinel structure with six diffraction patterns([2 2 0], [3 1 1], [4 0 0], [4 2 2], [5 1 1], [4 4 0]). The XRD patternsfor nanoparticles at different pH values are consistent with thosefor magnetite/maghemite structures, which are difficult to bedistinguished by XRD. The absence of characteristics peaks ofa-Fe2O3, which can be synthesized under the thermal dehydrationcondition, at the XRD patterns of nanoparticles at different pHvalues indicates that a-Fe2O3 is not formed. Goethite (a-FeOOH)is another iron oxide compound, which can be synthesized at highpH values. Therefore, the increasing pH of the solution preparesthe condition to form goethite. Peaks related to the goethite werenot detected in the XRD analysis of synthesized iron oxidenanoparticles. Consequently, no impurities were observed in thephase of highly pure magnetite/maghemite nanoparticles synthe-sized at different pH values in the range of 9–12. This could beattributed to the well preservation of the aqueous solution fromoxygen in this work. These results are consistent with the findingsof Gribanov et al. [14]. However, Faiyas et al. [29] showed thate-Fe2O3 was one of the major phases at synthesized nanoparticles
at pH values of 6 and 9 in the presence of mercaptoethanol,whereas applying a pH of 11 produces a magnetite phase.
Based on XRD data, the mean crystalline size of the magneticnanoparticles can be calculated using the Debye–Sherrer’s for-mula [30]:
dXRD ¼kl
bcosyð1Þ
where dXRD is the mean crystalline size, k is Sherrer’s constant(0.89), l is the wavelength of the incident X-ray (l¼1.5406 A), bis the broadening of full width at half maximum intensity of the[3 1 1] peak and y is the Bragg angle. Based on Sherrer’s formula,widening of peaks at higher pH can be attributed to smaller sizesof synthesized nanoparticles. The dXRD values for nanoparticles at

Table 1Magnetic properties of nanoparticles at various conditions.
pH dTEM (nm) Std. dev. pa FWHM (deg.) dXRD (nm) a (A)b dm (nm)
9 7.9 1.38 0.175 0.77 10.8 8.43 6.39
10 7.1 0.96 0.135 0.9 9.3 8.46 5.5
11 5.5 0.65 0.118 1.1 7.6 8.41 4.3
12 5 0.64 0.128 1.42 5.7 8.42 3.9
a p¼standard deviation/mean.b Lattice parameter.
Fig. 2. TEM images of Fe3O4 nanoparticles synthesized at pH¼9 (a), 10 (b),
11 (c) and 12 (d), and histogram particle size distribution of Fe3O4 nanoparticles
synthesized at pH¼9 (e), 10 (f), 11 (g) and 12 (h).
H. Mohammad-Beigi et al. / Physica E 44 (2011) 618–627 621
all pH values examined are higher than the mean size measuredby TEM images (Table 1).
The average values of the lattice parameter were calculatedfrom [3 1 1] and [4 4 0] plane peaks using the following formula[30]:
a¼ dhlk
ffiffiffiffiffiffiffiffiffiffiffiffiffiffiffiffiffiffiffiffiffiffiffih2þ l2þk2
qð2Þ
where h, l and k are the Miller indexes, and dhlk is the interplanarspacing (dhlk ¼ l=2siny).
TEM images and the histogram of size distribution for magne-tite nanoparticles synthesized at different pH values are shown inFig. 2. The mean particles’ size and size distribution of magnetitenanoparticles were obtained from TEM images (Table 1). Theseresults revealed that nanoparticles’ mean size changes from7.971.38 to 570.64 nm by increasing the initial pH from 9 to 12.
The TEM images also confirmed the nearly spherically shape ofmagnetite nanoparticles.
The exact composition of magnetite nanoparticles were deter-mined by the energy dispersive X-ray (EDX) spectroscopy (datanot shown). The EDX analysis shows the Fe and O peaks for the allnanoparticles synthesized at the examined pH values.
Electron diffraction (ED) patterns of magnetite nanoparticlesprepared at tested pH values were used to analyze the crystallinestructure (inset of Fig. 2). For that, the R-values, the distancebetween the center spot and the peripheral different rings in EDpatterns, were measured to be able to calculate d-spacing valuesusing following formula:
Ll¼ Rd ð3Þ
where Ll is a fixed value for TEM (in this work, 200 kV). All thediffraction rings l, h and k at examined pH values are either all oddor all even. This confirms the face-centered cubic (f.c.c.) structureof nanoparticles. In all the ED patterns, the six planes ([2 0 0],[3 1 1], [4 0 0], [5 1 1], [4 2 2], [4 4 0]), which are related to thef.c.c. structure of magnetite nanoparticles are shown.
TEM images show differences in the size of magnetite nano-particles at tested pH values. One-way ANOVA was used to verifythe significance of the effect of pH on the size of magnetitenanoparticles. Based on one-way ANOVA, the significance wasassessed at 95% confidence level (po0.05). The significance wasless than 0.05, which shows that there is a significant differenceamong the mean values of magnetite nanoparticles’ size. The sizeof magnetite nanoparticles was significantly different at all pHvalues examined, according to Post Hoc Duncan test. Based onANOVA and Duncan test, the pH has a significant effect on the sizeof magnetite nanoparticles.
The magnetite nanoparticles’ sizes obtained in different waysare shown in Table 1. Despite the differences between mean sizevalues calculated with different methods, changes in the sizevalues follow a similar trend, based on which the mean size andsize distribution broadness of the magnetite nanoparticles aredecreased by increasing the pH from 9 to 12. According to theliterature, the particles’ mean size and the size distribution of
magnetite nanoparticles are strongly affected by the acidity andionic strength of the solution [15]. The higher pH and ionicstrength values change the chemical composition of the crystalsand the electrostatic surface charge of the particles leading to adecrease in the interfacial tension and the free enthalpy ofparticles allowing the increase of surface to volume ratio [15].On the other hand, the polydispersity of the nanoparticles(p, standard deviation/mean) decreased by increasing pH (Table 1);however, there was an exception, pH 12, in which the p-value wasincreased compared to that obtained at the lower pH.
Kim et al. [16] studied the effect of pH on the magnetitenanoparticles’ size when sodium hydroxide was the basic solution

Table 2Particle diameters and crystalline parameters of Fe3O4 nanoparticles prepared at
different pH values.
pH Citrate Silica Ms
(emu/g)Hc (Oe) Mr (emu/g) Mr/Ms vini
(emu/g/Oe)
9 � � 82.73 5.49 0.873 0.010 0.159
10 � � 73.82 2.98 0.373 0.005 0.135
11 � � 69.62 2.43 0.349 0.005 0.131
12 � � 67.14 2.17 0.315 0.004 0.126
9 þ � 79.26 2.77 0.433 0.005 0.156
9 � þ 6.04 1.58 0.03 0.01 0.019
9 þ þ 2.9 3.625 0.029 0.005 0.008
H. Mohammad-Beigi et al. / Physica E 44 (2011) 618–627622
and obtained similar results (decrease in the particle size byincreasing pH). The Forge et al. [15] data, however, showedopposite results, based on which changing pH by a sodiumhydroxide solution has no significant effects on the size ofnanoparticles. Faiyas et al. [29] examined the effect of pH changedfrom 9 to 11 by an ammonia solution on the size and crystallinestructure of magnetic nanoparticles. They showed that not onlynanoparticles’ size decreases significantly, similar to this work,but also the crystalline structures of synthesized nanoparticles inthese two pH values are different too. The later results are notconsistent with our findings, as explained above based on the XRDanalysis (Fig. 1).
Magnetization loops related to the produced iron oxide nano-particles are used to study their magnetic properties (Fig. 3). Datarelated to initial magnetic susceptibility (wini), magnetic remanace(Mr), coercivity (Hc) and saturation magnetization (Ms), as themagnetic characteristics of nanoparticles are summarized inTable 2.
Ms was defined through the fitting of the M vs. 1/H curves,extrapolating the magnetization value to 1/H¼0. wini, the mag-netic susceptibility, is equal to ðdM=dHÞH-0, Hc is the fieldstrength required to bring the material back to zero magnetiza-tion and Mr is the value of magnetization at zero field. Nanopar-ticles synthesized at different pH values showed high values of Ms
(82.73–67.14 emu/g).The Ms values for all the nanoparticles synthesized in this work
are lower than the Ms(bulk) (92–100 emu/g for magnetite nano-particles [31]), which may be attributed to the surface disorderedor spin canting and random orientation of magnetic moments atthe particle surface [32,33]. The existence of this layer might becaused by the broken bonds of iron ions [34], the absence of someoxygen ions from the spinel structure and the disturbance in thespinel structure inversion as a result of Laplace pressure [35–37].As the particle size decreases with the increasing pH, a largepercentage of all the atoms become surface atoms. This causes amore significant role for the surface and interface effects andresults in increasing the ratio of dead layer to magnetic core aswell as decreasing Ms values [38]. On the other hand, a reducedsaturation magnetization might suggest a mixture with maghe-mite phase, which is difficult to be distinguished by XRD and hasan Ms(bulk) value of 76 emu/g [39]. With respect to high values ofthe measured Ms (82.73–67.14 emu/g), it can also be concludedthat the dominant phase must be magnetite rather than maghe-mite when nanoparticles are prepared at lower pH values, such as
Fig. 3. Magnetization loop of the Fe3O4 nanoparticles synthesized at pH¼9 (a),
10 (b), 11 (c) and 12 (d), and magnetization loop of citrate modified magnetite
nanoparticles synthesized at pH¼9 (e).
9 and 10. As a whole, particles’ size effect, surface disorderedmagnetic moments and presence of maghemite phase could bethe main parameters that affect the magnetic properties ofnanoparticles. The saturation magnetization values of obtainednanoparticles are consistent with the range of values reported inthe literature [40,41]. Additional to Ms, the Hc, Mr and wini valueshave decreasing trends with the decreasing nanoparticles’ size, inconsistence with the previous works [42,43]. The higher wini canbe implied to the greater magnetic interaction between nanopar-ticles [42].
The decrease of Hc with decreasing particle size is due to amono-domain behavior of the particles at dodc (dc is the criticalparticle size). The estimated value for dc is about 20–30 nm formagnetite nanoparticles [44].
Chantrell et al. [45] presented Eq. (3) for estimation ofmagnetic particles’ mean size (dm) in terms of magnetic proper-ties of nanoparticles (Ms and 1/H0)
dm ¼18kbT
pMs
ffiffiffiffiffiffiffiffiffiffiffiffiffiffiffiffiffiffiffiffiffiffiffiffiffiwi
3MsðbulkÞ
1
H0
s" #1=3
ð4Þ
The relationship between M and 1/H for a large H is a straight line,which will cross the 1/H axis at 1/H0. Since the computed curvesfit the data at high and low field, the dm values were calculatedfrom these portions of the magnetization curve. Using Eq. (4), dm
values were obtained for nanoparticles prepared at different pHvalues (Table 1). For magnetite nanoparticles at all pH valuesexamined, it was found that the mean diameter estimated byEq. (7) is less than that measured from TEM images (dmod),which could be attributed to the presence of magnetic dead layercaused by surface spin disorder around the magnetic core ofnanoparticles [46]. These results are consistent with the results ofthe previous studies in that dm values of magnetite nanoparticlesproduced by coprecipitation are smaller than physical diameters[16,42].
As discussed above, the Ms of magnetite nanoparticles is lessthan the Ms(bulk) at all pH values examined, which is due to thepresence of a dead layer. According to the model proposed byChen et al. [47], the thickness of dead layer (t) and the Ms(bulk) ofthe magnetite nanoparticles can be calculated from fitting thevariation of Ms with inverse of the mean diameter (1/d) by astraight line
Ms ¼MsðbulkÞ 1�6t
d
� �ð5Þ
The Ms(bulk) and t were calculated to be 98.85 emu/g and 2.72 A,respectively, by fitting saturation magnetization and diameterdata with Eq. (5). These results support the dead layer theory. Thethickness of dead layer was comparable to what was obtained byCaruntu et al. [37] for oleate-capped magnetite nanoparticlesprepared by the coprecipitation method, with a t value of 2.26 Aat 300 K, and was much smaller than that, 6 A, for Fe3O4
H. Mohammad-Beigi et al. / Physica E 44 (2011) 618–627 623
nanoparticles prepared by Zheng et al. [48] using the microemul-sion method.
3.2. Citrate modification of magnetite nanoparticles
Due to the presence of the hydroxyl (OH) groups on thesurface of magnetite nanoparticles, the point of zero charge(PZC) is located at 6.8 [49]. Around this point, the surface chargedensity is too small and the particles flocculate and precipitateeasily. Therefore, the magnetite nanoparticles synthesized at pH9 were modified with citrate to make surface possess a negativecharge and particles’ aggregation is prevented. FTIR analysis wasused to confirm the modification of magnetite nanoparticles withcitrate groups (data not shown).
The magnetization curve related to citrate modified magnetitenanoparticles showed a superparamagnetic property (Fig. 3).However, the Ms value of citrate modified magnetite nanoparti-cles (79.26 emu/g) is slightly lower than that for the baremagnetite nanoparticles (82.73 emu/g). The decrease in the Ms
value of the citrate modified nanoparticles can be attributed tothe presence of non-magnetic layer on the surface of magnetitenanoparticles or the direct attachment of carboxyl groups to theiron ions that could result in the pinning of the surface magneticspins [50].
3.3. Silica coating of magnetite nanoparticles
Recently, Fe3O4@SiO2 (core/shell) structures have found anintense interest for many biological and medical applications dueto their unique superparamagnetic and chemical properties.Different researches have been conducted on optimization ofmagnetic properties, size, size distribution and chemical proper-ties of these structures [51–55]. Yang et al. [51] provided analternative way to prepare Fe3O4@SiO2 core/shell nanoparticleswith different diameters and amounts of magnetic cores byadjusting the time of ultrasonic treatment of magnetic nanopar-ticles prior to the growth of silica layers. Lu et al. [52] developed afacile method for the preparation of Fe3O4@SiO2 nanocompositeparticles from the primary silica particles in the Stober process. Inthat work, the number of magnetic cores was mediated bychanging the concentration of the magnetic particles introducedinto the reaction system.
In this work, citrate was used to stabilize the magnetitenanoparticles prior to coating with silica. In order to study theeffect of citrate stabilization, citrate modified and non-modifiedmagnetite nanoparticles synthesized at pH 9 were coated withamorphous silica through Stober method. The silica-coated baremagnetite particles and silica-coated citrate modified magnetiteparticles were designated P1 and P2, respectively (Fig. 4).
Fig. 4. Schematic illustration of the effect of modification of magnetite nanoparticles w
TEM images and histogram of size distribution of P1 and P2particles are shown in Fig. 5. The diffused nature of the diffractionpattern of silica-coated particles in a cloud form is the character-istic of the amorphous silica (inset of Fig. 5(b)).
The TEM images confirm the spherical shape of the nanocom-posite particles. As illustrated in Fig. 5 (c), the size distribution ofP1 particles shows two bands: the first band belongs to the silicaparticles of diameters in the range of 110–180 nm (band A, with amean diameter of 143.3715.4 nm), while the second bandbelongs to the P1 particles of diameters from 180 to 240 nm(band B, with a mean diameter of 216.85713.7 nm). The pre-sence of the first band indicates a tendency to synthesize silicananoparticles with no magnetic core (Fig. 5(a)). The EDX spectrafor particles A and B shown in Fig. 5(a) are presented inFig. 6(a) and (b), respectively. For particles B, strong Si peak andweak Fe peaks were observed, indicating the silica coating onmagnetite nanoparticles. However, for particles A, the peakscorresponding to Fe are not detected, which is attributed to thepresence of silica particles with no magnetic core in the TEMimages (Fig. 5(a)). Based on EDX and TEM images, it can beconcluded that unmodified magnetite nanoparticles tend toaggregate prior to be coated with silica nanoparticles, whichcould be ascribed to the strong dipole–dipole interaction amongunmodified magnetite nanoparticles and increased ionic strengthduring hydrolysis of TEOS [51]. Decreasing the number of mag-netite cores as nucleation sites due to aggregation resulted in thepromotion of nucleation rate and consequently led to formationof the iron oxide-free colloidal silica particles (A) with a smallermean size compared to silica-coated iron oxide particles (B).
As anticipated, the citrate modified magnetite nanoparticlesare well distributed in the P2 particles. The presence of citrategroups prevents magnetite nanoparticles from aggregation andenables them to disperse in the solution. The mean diameter andpolydispersity of P2 particles are measured to be 275716.1 nmand 0.06, respectively. The EDX spectra of P2 particles show thestrong Si and weak Fe peaks, indicating the silica coating of theiron oxide nanoparticles (Fig. 6(c)). The dispersed citrate modifiednanoparticles acted as nucleation seeds for the growth of thesilica layer, diminished the nucleation rate, promoted the growthrate of the particles and consequently led to larger sizes and lessnumber of P2 particles in comparison with the P1 ones (Fig. 5(b)).However, few silica nanoparticles with no magnetic core wereobserved under this condition too.
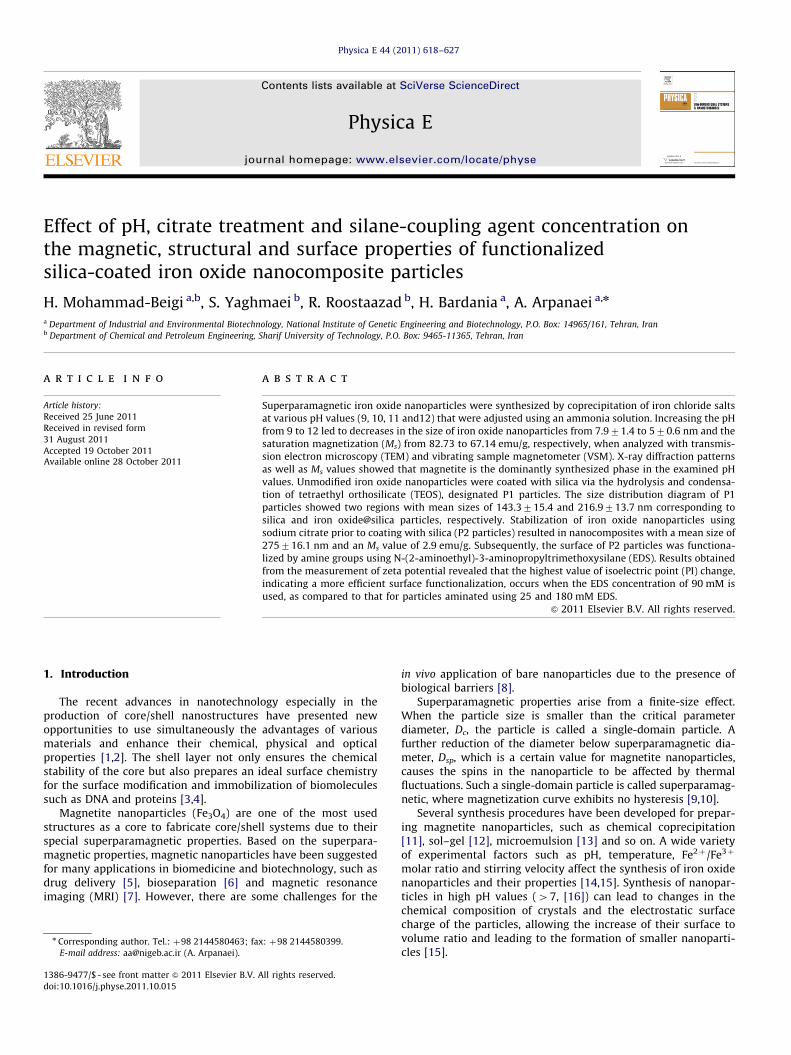
In order to study the magnetic properties, free silica nanopar-ticles were separated from silica-coated iron oxide particles. Thehysteresis loops related to P1 (portion B) and P2 particles at roomtemperature show that silica-coated iron oxide particles remainsuperparamagnetic by a minimal coercivity (Fig. 7); however, bothP1 and P2 particles have lower Ms values relative to their magneticcores (6.04 vs. 82.73 emu/g for P1 and 2.9 vs. 79.26 emu/g for P2
ith citrate groups on the morphology and structure of Fe3O4@SiO2 nanoparticles.

Fig. 5. TEM images of Fe3O4@SiO2 nanoparticles. P1 nanoparticles (a) and P2 nanoparticles (d), and histogram particle size distribution of Fe3O4@SiO2 nanoparticles, P1 (c),
and P2 nanoparticles (d).
Fig. 6. Energy dispersive X-ray (EDX) emission spectra of Fe3O4@SiO2 nanoparticles: particle A (a), particle B (b) and P2 nanoparticles (c).
H. Mohammad-Beigi et al. / Physica E 44 (2011) 618–627624
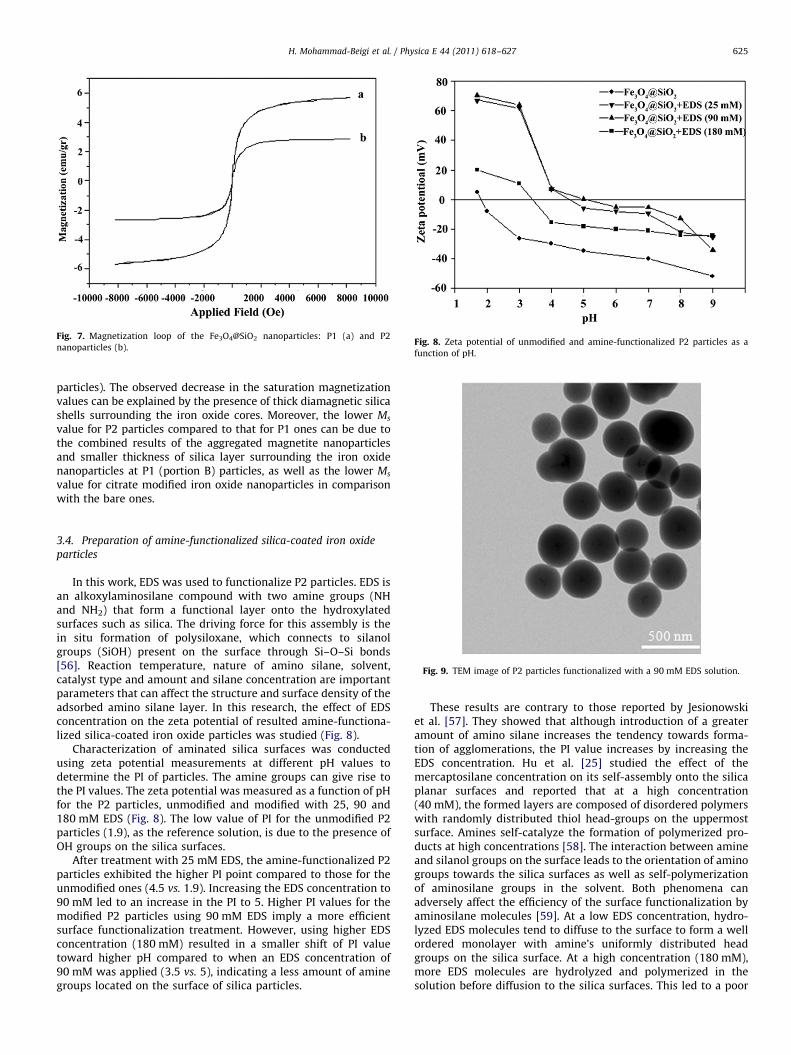
Fig. 7. Magnetization loop of the Fe3O4@SiO2 nanoparticles: P1 (a) and P2
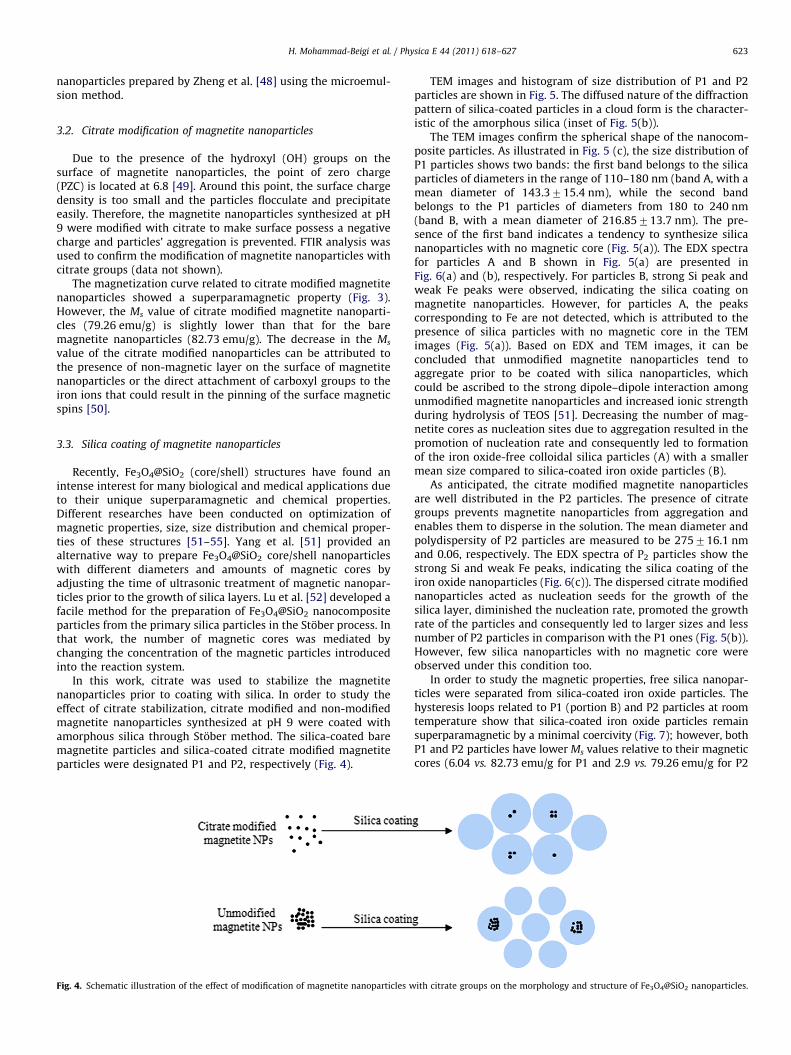
nanoparticles (b).Fig. 8. Zeta potential of unmodified and amine-functionalized P2 particles as a
function of pH.
H. Mohammad-Beigi et al. / Physica E 44 (2011) 618–627 625
particles). The observed decrease in the saturation magnetizationvalues can be explained by the presence of thick diamagnetic silicashells surrounding the iron oxide cores. Moreover, the lower Ms
value for P2 particles compared to that for P1 ones can be due tothe combined results of the aggregated magnetite nanoparticlesand smaller thickness of silica layer surrounding the iron oxidenanoparticles at P1 (portion B) particles, as well as the lower Ms
value for citrate modified iron oxide nanoparticles in comparisonwith the bare ones.
Fig. 9. TEM image of P2 particles functionalized with a 90 mM EDS solution.
3.4. Preparation of amine-functionalized silica-coated iron oxide
particles
In this work, EDS was used to functionalize P2 particles. EDS isan alkoxylaminosilane compound with two amine groups (NHand NH2) that form a functional layer onto the hydroxylatedsurfaces such as silica. The driving force for this assembly is thein situ formation of polysiloxane, which connects to silanolgroups (SiOH) present on the surface through Si–O–Si bonds[56]. Reaction temperature, nature of amino silane, solvent,catalyst type and amount and silane concentration are importantparameters that can affect the structure and surface density of theadsorbed amino silane layer. In this research, the effect of EDSconcentration on the zeta potential of resulted amine-functiona-lized silica-coated iron oxide particles was studied (Fig. 8).
Characterization of aminated silica surfaces was conductedusing zeta potential measurements at different pH values todetermine the PI of particles. The amine groups can give rise tothe PI values. The zeta potential was measured as a function of pHfor the P2 particles, unmodified and modified with 25, 90 and180 mM EDS (Fig. 8). The low value of PI for the unmodified P2particles (1.9), as the reference solution, is due to the presence ofOH groups on the silica surfaces.
After treatment with 25 mM EDS, the amine-functionalized P2particles exhibited the higher PI point compared to those for theunmodified ones (4.5 vs. 1.9). Increasing the EDS concentration to90 mM led to an increase in the PI to 5. Higher PI values for themodified P2 particles using 90 mM EDS imply a more efficientsurface functionalization treatment. However, using higher EDSconcentration (180 mM) resulted in a smaller shift of PI valuetoward higher pH compared to when an EDS concentration of90 mM was applied (3.5 vs. 5), indicating a less amount of aminegroups located on the surface of silica particles.
These results are contrary to those reported by Jesionowskiet al. [57]. They showed that although introduction of a greateramount of amino silane increases the tendency towards forma-tion of agglomerations, the PI value increases by increasing theEDS concentration. Hu et al. [25] studied the effect of themercaptosilane concentration on its self-assembly onto the silicaplanar surfaces and reported that at a high concentration(40 mM), the formed layers are composed of disordered polymerswith randomly distributed thiol head-groups on the uppermostsurface. Amines self-catalyze the formation of polymerized pro-ducts at high concentrations [58]. The interaction between amineand silanol groups on the surface leads to the orientation of aminogroups towards the silica surfaces as well as self-polymerizationof aminosilane groups in the solvent. Both phenomena canadversely affect the efficiency of the surface functionalization byaminosilane molecules [59]. At a low EDS concentration, hydro-lyzed EDS molecules tend to diffuse to the surface to form a wellordered monolayer with amine’s uniformly distributed headgroups on the silica surface. At a high concentration (180 mM),more EDS molecules are hydrolyzed and polymerized in thesolution before diffusion to the silica surfaces. This led to a poor

H. Mohammad-Beigi et al. / Physica E 44 (2011) 618–627626
functionalization and less value of zeta potential compared withthat at lower EDS concentration [24].
Analysis of magnetic properties showed a little decrease in thevalue of saturation magnetization of the amine-functionalized P2particles, which can be attributed to the presence of a non-magneticlayer (EDS) on the surface of P2 particles. The Ms values weremeasured to be 2.8, 2.85 and 2.78 emu/g for amine-functionalizedP2 particles treated with 25, 90 and 180 mM EDS solutions,respectively. Furthermore, the TEM image of those particles ami-nated using 90 mM EDS (279716.9 nm) showed that there is nosignificant change in the size of the aminated P2 particles comparedto the unmodified ones (Fig. 9). Based on the VSM and TEM results,it can be concluded that the hydrolysis of the EDS molecules on thesilica surfaces does not have any significant effect on the size andmagnetic properties of functionalized particles.
4. Conclusion
Results obtained in this study showed that the pH valueadjusted using an ammonia solution has a major role in the sizeand magnetic properties of synthesized superparamagnetic ironoxide nanoparticles. It was also revealed that increasing the pHfrom 9 to 12 results in a decrease in the size and saturationmagnetization of the magnetic nanoparticles. The analysis of X-raydiffraction and Ms measurement revealed that the structure ofsynthesized magnetic nanoparticles is spinel type and magnetite isthe dominant phase at examined pH values. Results of TEManalysis indicated that modifying magnetic nanoparticles withsodium citrate prior to coating with silica leads to a morehomogeneous formation of nanocomposites with a smaller meansize and narrower particle size distribution. The presence of citrategroups prevented iron oxide nanoparticles’ aggregation andenabled them to disperse in the solution. However, the magneticproperties of silica-coated citrate modified magnetite nanocompo-site particles (P2) were weaker than those for particles with a non-modified magnetic core (P1). This could be attributed to the higherMs values for unmodified magnetite nanoparticles and largeraggregated magnetic cores within P1 particles compared to thosein P2 ones. The zeta potential of amine-functionalized silicasurfaces prepared through treatment with EDS showed thatincreasing the EDS concentration from 25 to 90 mM increases thePI value, but a further increase in this to 180 mM results in a poorersurface functionalization, possibly due to the polymerization ofEDS molecules in the solvent at such a high concentration.
Acknowledgment
This work is financially supported by the National Institute ofGenetic Engineering and Biotechnology of Iran. The authors thankProf. Hojatollah Vali (Facility for Electron Microscopy research,McGill University, Montreal, Canada) for expert technical assis-tance with TEM analysis.
References
[1] Y.P. He, S.Q. Wang, C.R. Li, Y.M. Miao, Z.Y. Wu, B.S. Zou, Journal of Physics D:Applied Physics 38 (2005) 1342.
[2] L. Hao, D. Cox, P. See, J. Gallop, O. Kazakova, Journal of Physics D: AppliedPhysics 43 (2010) 474004.
[3] M. Zhang, D. Cheng, X. He, L. Chen, Y. Zhang, Chemistry—An Asian Journal 5(2010) 1332.
[4] D. Shao, A. Xia, J. Hu, C. Wang, W. Yu, Colloids and Surfaces A: Physicochem-ical and Engineering Aspects 322 (2008) 61.
[5] J.E. Lee, N. Lee, H. Kim, J. Kim, S.H. Choi, J.H. Kim, T. Kim, I.C. Song, S.P. Park,W.K. Moon, T. Hyeon, Journal of the American Chemical Society 132 (2010)552.
[6] J. Kim, Y. Piao, N. Lee, Y.I. Park, I.H. Lee, J.H. Lee, S.R. Paik, T. Hyeon, AdvancedMaterials 22 (2010) 57.
[7] M. Mahmoudi, A. Simchi, M. Imani, A.S. Milani, P. Stroeve, Journal of PhysicalChemistry B 112 (2008) 14470.
[8] M. Melancon, W. Lu, C. Li, Materials Research Bulletin 34 (2009) 415.[9] A. Figuerola, R. Di Corato, L. Manna, T. Pellegrino, Pharmacological Research
62 (2010) 126.[10] V.K. Varadan, L. Chen, J. Xie, Index, in: Nanomedicine: Design and Applica-
tions of Magnetic Nanomaterials, Nanosensors and Nanosystems, John Wiley& Sons, Ltd., Chichester, UK, 2008.
[11] R. Massart, IEEE Transactions on Magnetics MAG-17 (1981) 1247.[12] J. Xu, H. Yang, W. Fu, K. Du, Y. Sui, J. Chen, Y. Zeng, M. Li, G. Zou, Journal of
Magnetism and Magnetic Materials 309 (2007) 307.[13] Z.L. Liu, X. Wang, K.L. Yao, G.H. Du, Q.H. Lu, Z.H. Ding, J. Tao, Q. Ning, X.P. Luo,
D.Y. Tian, D.J. Xi, Journal of Materials Science 39 (2004) 2633.[14] N.M. Gribanov, E.E. Bibik, O.V. Buzunov, V.N. Naumov, Journal of Magnetism
and Magnetic Materials 85 (1990) 7.[15] D. Forge, A. Roch, S. Lauren, H. Tellez, Y. Gossuin, F. Renaux, L.V. Elst,
R.N. Muller, Journal of Physical Chemistry C 112 (2008) 19178.[16] D.K. Kim, Y. Zhang, W. Voit, K.V. Rao, M. Muhammed, Journal of Magnetism
and Magnetic Materials 225 (2001) 30.[17] M.E. Khosroshahi, L. Ghazanfari, Physica E 42 (2010) 1824.[18] I.Y. Goon, L.M.H. Lai, M. Lim, P. Munroe, J.J. Gooding, R. Amal, Chemistry of
Materials 21 (2009) 673.[19] A. Bumb, M.W. Brechbiel, P.L. Choyke, L. Fugger, A. Eggeman, D. Prabhakaran,
J. Hutchinson, P.J. Dobson, Nanotechnology 19 (2008) 335601.[20] A.K. Singh, A.W. Flounders, J.V. Volpoui, C.S. Ashley, K. Wally, J.S. Schoeniger,
Biosensors and Bioelectronics 14 (1999) 703.[21] D.K. Yi, S.T. Selvan, S.S. Lee, G.C. Papaefthymiou, D. Kundaliya, J.Y. Ying,
Journal of the American Chemical Society 127 (2005) 4990.[22] W. Stober, A. Fink, E. Bohn, Journal of Colloid and Interface Science 26 (1968)
62.[23] J.T. Sheu, C.C. Chen, P.C. Huang, M.L. Hsu, Microelectronic Engineering 78–79
(2005) 294.[24] J.A. Howarter, J.P. Youngblood, Langmuir 22 (2006) 11142.[25] M. Hu, S. Noda, T. Okubo, Y. Yamaguchi, H. Komiyama, Applied Surface
Science 181 (2001) 307.[26] V.S. Maceira, M.A. Correa-Duarte, M. Farle, A. Lopez-Quintela, K. Sieradzki,
R. Diaz, Chemistry of Materials 18 (2006) 2701.[27] B. Arkles, Techniques for Silylation in Silicon Compounds, Petrarch Systems
Inc., 1979.[28] R. Hong, J. Li, J. Wang, H. Li, China Particuology 5 (2007) 186.[29] A.P.A. Faiyas, E.M. Vinod, J. Joseph, R. Ganesan, R.K. Pandey, Journal of
Magnetism and Magnetic Materials 322 (2010) 400.[30] P.J. Vikesland, A.M. Heathcock, R.L. Rebodos, K.E. Makus, Environmental
Science & Technology 41 (2007) 5277.[31] M.A. Morales, T.K. Jain, V. Labhasetwar, D.L. Leslie-Pelecky, Journal of Applied
Physics 97 (2005) 10Q905.[32] J.L. Dormann, D. Fiorani, E. Tronc, Advances in Chemical Physics 98 (1997)
283.[33] X. Battle, A. Labarta, Journal of Physics D: Applied Physics 35 (2002) R15.[34] S. Mørup, H.J. Topsøe, Applied Physics 11 (1976) 63.[35] L.D. Tung, V. Kolesnichenko, D. Caruntu, N.H. Chou, C.J. O’Connor, L. Spinu,
Journal of Applied Physics 93 (2003) 7486.[36] I. Nedkov, S. Kolev, K. Zadro, K. Krezhov, T. Merodiiska, Journal of Magnetism
and Magnetic Materials 272–276 (2004) 1175.[37] D. Caruntu, G. Caruntu, C.J. O’Connor, Journal of Physics D: Applied Physics 40
(2007) 5801.[38] P. Tartaj, European Journal of Inorganic Chemistry 2009 (2009) 333.[39] D.B. Cullity, Introduction to Magnetic Materials, Addison-Wesley, Reading,
MA, 1972 (p. 201).[40] M. Yamaura, R.L. Camilo, L.C. Sampaio, M.A. Macedo, M. Nakamura,
H.E. Toma, Journal of Magnetism and Magnetic Materials 279 (2004) 210.[41] R.D. Ambashta, P.K. Wattal, S. Singh, D. Bahadur, Journal of Magnetism and
Magnetic Materials 267 (2003) 335.[42] R.L. Rebodos, P.J. Vikesland, Journal of the American Chemical Society 26
(2010) 16745.[43] S. Trudel, C.H.W. Jones, R.H. Hill, Journal of Materials Chemistry 17 (2007)
2206.[44] R.C. O’Handley, Modern Magnetic Materials: Principles and Applications,
John Wiley & Sons Inc., New York, 2000.[45] R.W. Chantrell, J. Popplewell, S.W. Charles, IEEE Transactions on Magnetics 14
(1978) 975.[46] R. Kaiser, G. Miskolczy, Journal of Applied Physics 41 (1970) 1064.[47] J.P. Chen, C.M. Sorensen, K.J. Klabunde, G.C. Hadjipanayis, E. Devlin,
A. Kostikas, Physical Review B 54 (1996) 9288.[48] M. Zheng, X.C Wu, B.S. Zou, W.J. Wang, Journal of Magnetism and Magnetic
Materials 183 (1998) 152.[49] J.C. Bacri, R. Perzynski, D. Salin, V. Cabuil, R. Massart, Journal of Magnetism
and Magnetic Materials 85 (1990) 27.[50] L.F. Cotica, I.A. Santos, E.M. Girotto, E.V. Ferri, A.A. Coelho, Journal of Applied
Physics 108 (2010) 064325.[51] C. Yang, G. Wang, Z. Lu, J. Sun, J. Zhuang, W. Yang, Journal of Materials
Chemistry 15 (2005) 4252.[52] Z. Lu, J. Dai, X. Song, G. Wang, W. Yang, Colloids and Surfaces A: Physico-
chemical and Engineering Aspects 317 (2008) 450.

H. Mohammad-Beigi et al. / Physica E 44 (2011) 618–627 627
[53] Y. Cheng, R. Tan, W. Wang, Y. Guo, P. Cui, W. Song, Journal of MaterialsScience 45 (2010) 5347.
[54] Z.Z. Xu, C.C. Wang, W.L. Yang, S.K. Fu, Journal of Materials Science 40 (2005)4667.
[55] J. Lee, Y. Lee, J.K. Youn, H.B. Na, T. Yu, H. Kim, S.M. Lee, Y.M. Koo, J.H. Kwak,H.G. Park, H.N. Chang, M. Hwang, J.G. Park, J. Kim, T. Hyeon, Small 1 (2008)143.
[56] A. Ulham, Chemical Reviews 96 (1996) 1533.[57] T. Jesionowski, F. Ciesielczyk, A. Krysztafkiewicz, Materials Chemistry and
Physics 119 (2010) 65.[58] E.T. Vandenberg, L. Bertilsson, B. Liedberg, V. Uvdal, R. Erlandsson, H. Elwing,
I.J. Lundstroem, Colloid Interface Science 147 (1991) 103.[59] M. Ma, Y. Zhang, W. Yu, H.Y. Shen, H.Q. Zhang, N. Gu, Colloids and Surfaces A:
Physicochemical and Engineering Aspects 212 (2003) 219.
![Grana acalculia 2006[1]NPS](https://static.fdokumen.com/doc/165x107/6313b81efc260b71020f3816/grana-acalculia-20061nps.jpg)