tmUSGS - NPS History
103
) ) ) tmUSGS science for a changing world 1 FINAL REPORrf Five Years of Monitoring Reconstructed Freshwater Tidal Wetlands in the Urban Anacostia River (2000-2004)
-
Upload
khangminh22 -
Category
Documents
-
view
4 -
download
0
Transcript of tmUSGS - NPS History

)
)
)
tmUSGS science for a changing world
1
FINAL REPORrf
Five Years of Monitoring Reconstructed Freshwater Tidal Wetlands in the
Urban Anacostia River (2000-2004)
)
)
)
)
)
)
)
)
)
-)
)
)
)
-)
)
)
)
j
)
)
)
)
)
)
J J ~
) ,/ ~
J )
)
J J j
J )
j
J J j
j
J 1
J
J
Contributors
Richard S. Hammerschlag
USGS Patuxent Wildlife Research Center
Beltsville Lab, BARC-East 308
10300 Baltimore Avenue
Beltsville, MD 20705
(301) 497-5555
Andrew H. Baldwin
Department of Biological Resources Engineering
University of Maryland
College Park, MD 20742
(301) 405-7855
ab 17 [email protected]
Cairn C. Krafft
USGS Patuxent Wildlife Research Center
Beltsville Lab, BARC-East 308
10300 Baltimore Avenue
Beltsville, Maryland 20705
(301) 497-5546
cairn [email protected]
Kelly Phyllaier Neff
Maryland Department of the Environment
Water Management Administration, Wetlands and Waterways Program
1800 Washington Boulevard,
Baltimore, Maryland 21230
(410) 537-4018

2
MaryM. Paul
USGS Patuxent Wildlife Research Center
Beltsville Lab, BARC-East 308
10300 Baltimore Avenue
Beltsville, Maryland 20705
(301) 497-5725
mary [email protected]
Kevin D. Brittingham
Baltimore Co. Dept. of Environmental Protection And Natural Resources
401 Bosley A venue
Towson, Maryland 21204
(410) 887-3980
Kristin Rusello Damage Assessment Center
National Oceanic and Atmospheric Administration 1305 East-West Highway
Silver Spring, Maryland 20910 (301) 713-3038
Jeff S. Hatfield
USGS Patuxent Wildlife Research Center
12100 Beech Forest Road
Laurel, MD 20708
(301) 497-5725
Jeff [email protected]

TABLE OF CONTENTS
Cover (Kingman Marsh Area 1-1999-2004) Contributors ................................................................................... . 1 Table of Contents ............................................................................... 3 Title Page (Kingman Marsh Area 2 - 1998, 2000-2004 .................................... 6 Executive Summary ............................ -................................................. 7 Introduction ........................................................................................ 10 Study Background ................................................................................ 11
PART I - Vegetation and Associated Studies ............................................ 13 INTRODUCTION .............................................................................. 13 METHODS ....................................................................................... 14
Statistical Methods for Vegetation ......................................................... 15 RESULTS and DISCUSSION ................................................................ 16 1. Total vegetative cover ....................................................................... 15 2. Species richness .............................................................................. 19
2a. Shannon Index ............................................................................ 20 2b. Sorenson's Similarity Index ............................................................ 21
3. Elevations ..................................................................................... 21 4. Cover from planted versus unplanted species ............................................ .25 5. Cover from annuals and perennials ........................................................ 25 6. Cover from non-native species (exotic species) .......................................... 26 7. Sediment surface elevation dynamics ...................................................... 27 8. Hydro logger data ............................................................................ 28 9. Exclosures .................................................................................... 29 10. Biomass ....................................................................................... 29 CONCLUSIONS ................................................................................ . 30 REFERENCES ................................................................................... 31 ACKNOWLEDGEMENTS .................................................................... 34
List of Photographs 1. COVER: Kingman Area 1 series: 1999-2004 2. TITLE PAGE: Kingman Area 2 series: 1998, 2000-2004 ................................ 6 3. Benning Road Bridge1927 ...................................................................... 35 4. Composite image of Anacostia study wetlands 2003 ........................................ 36 5. Patuxent River Marsh study area .............................................................. 37 6. USGS/U. of Md. plots (aerial)- 2002 ........................................................ .38 7. Diagram of USGS/U. of Md. plots with elevations ........................................ .39 8. USGS/U. of Md. exclosure plots -horizontal view ........................................ .40 9. Anacostia Watershed Society exclosure displaying growth of protected wild rice ... .41
3

List of Maps 1. Chesapeake Bay area with Anacostia watershed ......................................... .42 2. Kingman Area 1 ............................................................................... 43 3. Kingman Area 2 ................................................................................ 44 4. Kenilworth Mass Fill Areas 1 and 2 ........................................................ .45 5. Reference wetlands: Dueling Creek and Patuxent River marshes ...................... 46
List of Tables
1. Repeated measures analysis of variance of vegetative parameters ..................... 47 2. Sorenson's Similarity Matrices ............................................................. .48 3. Sediment Elevation Changes: 2001 and 2004 ............................................. .49
List of Figures
1. Total vegetation cover of areas over time ................................................... 50 2. Dominant cover types ......................................................................... 51 3. Species richness over time ................................................................... 52 4. Shannon Index of diversity over time ....................................................... 53 5. Elevation change over time over time ...................................................... 54 6. Percent time inundated for each wetland area ............................................... 55. 7. Relationship of percent cover of Phragmites australis .. ................................... 56 8. Sector-based analysis of total cover vs. elevation ......................................... 57 9. Sector-based analysis of richness vs. elevation ............................................ 58 10. Cover contributed by planted species ...................................................... 59 11. Planted species cover compared to total vegetation cover .............................. 60 12. Cover by species planted and replanted at Kingman ..................................... 61 13. Cover by annuals over time ................................................................. 62 14. Cover by perennials over time .............................................................. 63 15. Cover by annuals at Patuxent over time ................................................... 64 16. Cover by exotics over time .................................................................. 65 17. Changes in elevation and accretion (deposition) at Kingman ... ,,, ..................... 66 18. Cumulative changes in elevation and accretion (deposition) at Kenilworth .......... 67 19. Average changes in elevation and accretion at Kingman and Kenilworth ........... 68 20. Water level readings for Dueling Creek ('02 vs. '03) ................................... 69 21. Biomass ( of living material) over time ..................................................... 70
Appendix 1 List of plant species at Kingman Marsh ....................................... 71
PART II - Soils ................................................................................... 73 Introduction ........................................................................................ 73 Methods ............................................................................................ 67 Results .............................................................................................. 67 Discussion ......................................................................................... 68 References ......................................................................................... 68
4

List of Tables 1. Soil variables at study wetlands (2000) ................................................... 69
PART III - Seed Dispersal .................................................................. 70 Abstract .......................................................................................... 70 Introduction ..................................................................................... 70 Methods .......................................................................................... 71 Data Analyses .................................................................................. 74 Results ........................................................................................... 76 Discussion ....................................................................................... 77 References ...................................................................................... 78
List of Tables 1. Densities of the top five most abundant species ..................................... 80 2. Comparisons of species richness based on rarefaction curves ....................... 83
PART IV - Seed Bank . ...................................................................... 84 Abstract .......................................................................................... 84 Introduction ...................................................................................... 85 Methods .......................................................................................... 85 Data analysis .................................................................................... 86 Results ............................................................................................ 87 Discussion ....................................................................................... 89 References. . . . . . . . . . . . . . . . . . . . . . . . . . . . . . . . . . . . . . . . . . . . . . . . . . . . . . . . . . . . . . . . . . . . . . . . . . . . .......... 91
List of Tables 1. The number of transects at each study site in 2000, 2001 and 2003 ................. 92
List of Figures
1. Number of seedlings, taxa density and Pielou's evenness at the ..................... 93 study areas ...
5
)
,
)
)
)
)
)
)
)
)
)
)
)
)
)
)
J
J )
)
)
)
)
)
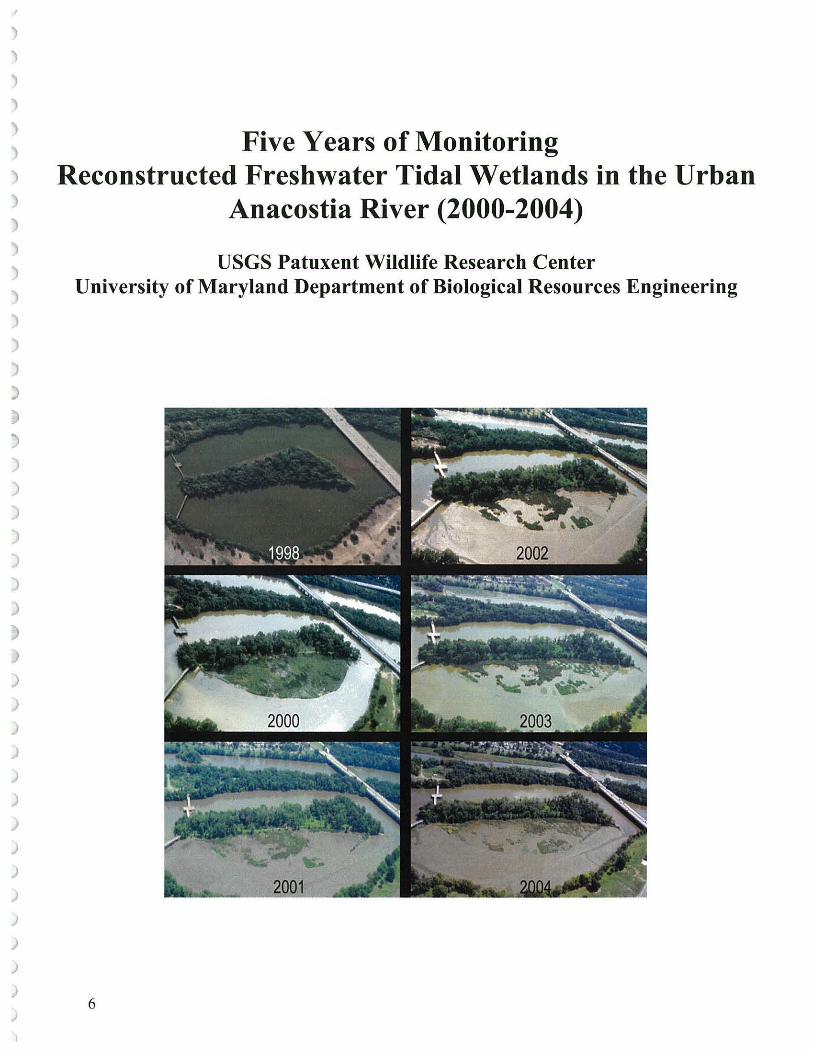
Five Years of Monitoring Reconstructed Freshwater Tidal Wetlands in the Urban
Anacostia River (2000-2004)
USGS Patuxent Wildlife Research Center University of Maryland Department of Biological Resources Engineering
6
Executive Summary
The Anacostia watershed (Map 1) and especially the upper tidal reaches have recently undergone intensive restoration efforts. In 2000, portions of Kingman Lake along the Anacostia estuary in Washington, DC were reconstructed to emergent freshwater tidal wetlands (Kingman Marsh). The process involved using a hydraulic dredge to pump a slurry of somewhat contaminated Anacostia channel sediments (variable amounts of anthropogenically derived chemicals such as chlordane, PCBs and P AHs) by a U.S. Army Corps of Engineers (CoE) contractor into two separate containment cells at Kingman (Kingman Area 1 and Kingman Area 2). Following dewatering and consolidation the resultant sediment flats covered about 35 acres and were planted with 700,000 plants comprising 6 native species. Volunteer plants also began to grow from the seed bank derived at first mostly from propagules transported in by water and air. Much of the planted areas were surrounded by galvinized metal perimeter fencing and corrals of plastic mesh interior fencing to exclude geese and ducks which put herb ivory pressure on the new plantings. As a component of this reconstruction project the CoE in conjunction with the District of Columbia Department of Environment (D.C.) established funding for 5 years of post- reconstruction monitoring (2000-2004) for two elements: food chain accumulation of contaminants (conducted by the U.S. Fish Wildlife Service) and vegetation establishment ( conducted cooperatively by USGS Patuxent Wildlife Research Refuge (PWRC) and the University of Maryland Biological Resources Engineering Department (U. of Md)). PWRC, under the leadership of Dr. Richard Hammerschlag, took primary responsibility for Part I dealing with vegetation response associated parameters; while the U. of Md, under the leadership of Dr. Andy Baldwin, took primary responsibility for Parts II - IV dealing with soil parameters, seed dispersal and the seed bank.
The goals of the monitoring project were to document both the status and the degree to which the reconstructed marsh achieved a wetland condition similar to reference emergent freshwater tidal wetland habitat. The expectation was that reconstruction would lead to restoration.
To determine the vegetation status and trends 17 one meter wide by 35 meter long (belt) transects were randomly established at Kingman Marsh. Vegetative species composition and cover were measured each year in late May, July and September. Results from Kingman Marsh transect studies were compared to local freshwater tidal emergent wetland reference sites at Kenilworth, Dueling Creek and Patuxent Marshes. Comparisons could also be made between Kingman Marsh Area 1 and 2.
Additional walk through surveys throughout the marsh were conducted to identify species not encountered along transects. The list of species identified over the course of the project is presented in Appendix 1.
Concern for influence from unwanted invasive non-native species was also investigated. Vegetation biomass, as peak standing vegetation, was determined by collecting above ground vegetation in August 2001 from 0.25 meter plots along the transects and then obtaining dry weights.
7

)
)
)
)
)
)
J )
_J
J J )
)
)
)
J _)
_)
_)
_)
_)
_)
j
_J
Soils were analyzed by collecting soil cores from 3 shallow depths in the rooting zone along the transects and measured for soil structure, organic matter, pH and redox potential. Seed sources were determined by collecting soil and germinating the soil seed bank, as well as by trapping floating and air born seed to be identified by germinating in trays under greenhouse conditions.
We also wanted to determine the role played by the planted species, in context with the contribution by volunteer species, as a measure justifying the investment in that effort. Additional study components were included through this project to amplify our understanding of the hydrologic and sediment deposition/sediment elevation processes controlling the wetland functions at this urban reconstructed freshwater tidal marsh.
An associated task involved observing the effects of exclosures as a means to assist and protect wetland vegetation establishment in the presence of wildlife grazing pressure.
Hand held camera low elevation aerial photographs were obtained each September as a result of the generosity of the National Park Service Park Police Aviation Division (Cover and Title Page). In addition use was made of higher elevation vertical aerial photographs taken in 2003 as part of the annual submersed aquatic vegetation surveys obtained through the Chesapeake Bay Program and the Metropolitan Washington Council of Governments. Some of the imagery was modified by the USGS PWRC Information Resource Management Team.
8
• Results derived over the course of the study substantiated significant loss of vegetative cover, species richness and diversity at Kingman Marsh but not at any of the other studied wetlands. The vegetation impacts at Kingman could be attributed to herbivory by resident Canada geese (Branta canadensis maxima and Be moffitti) (Hindman et al. 2004) coupled with effectively lowered sediment elevations following reconstruction. Populations of resident Canada geese were several times higher in the area of Kingman Marsh than Kenilworth Marsh. Greater vegetation loss and reduced ability to recover following grazing occurred at lower elevations likely due to slower vegetation growth, fewer species and greatly reduced contribution from annuals as a result of seed germination inhibition. Sediment processes indicated the propensity for accretion but this could be negated locally by erosion, especially where vegetation was missing, and by subsidence including sediment consolidation of both the placed material and unconsolidated pre-existing substrate.
• In many areas, especially where vegetation was depleted for a period of time, sediment elevation dropped probably as a result of tidal scour erosion as well as subsidence of placed sediments and consolidation of underlying sediments. Ten Surface Elevation Tables (SETs) are in place (5 at Kingman and 5 at Kenilworth Marsh) to help measure these processes. Surface elevations may also be tracked using a laser level keyed to benchmarks.
• Higher water levels in 2003 and 2004 from above average rainfall likely exacerbated effects from sediment loss (in effect, lowering sediments even more) and consequently reduced the ability of vegetation to rebound from grazing at Kingman. Thus many factors point out the important role that sediment elevation plays not just in supporting
)
)
)
)
)
)
)
)
)
)
)
)
-)
)
)
) -)
:) -)
)
)
)
)
)
__)
)
J __)
J )
J )
J J J J J _)
J _)
_)
_) 9
vegetation but also selecting which species will survive along the sediment elevation gradient ( controlled by the resultant hydroperiod).
• Observations drawn from exclosure experiments, as well as exclosed fenced plantings by CoE contractors and the Anacostia Watershed Society, clearly demonstrated the ability of marsh vegetation to grow at suitable sediment elevations when protected from herbivory.
• Seed bank studies substantiated an ample, diverse seed presence in the Kingman sediments that was provided initially primarily by water borne dispersal. The presence of viable seed bank at Kingman corroborates that failure of grazed wetland areas to recover were not due to a lack of seed source. The ability of ample seed to be water borne dispersed in the Anacostia, along with the successful revegetation at the few unplanted patches at suitable sediment elevations, suggest that there might not need to be extensive planting of vegetation as part of the reconstruction process.
• Plantings could be justified to include native species not well represented in the seed bank, to help ensure a greater contribution by selected species, and to help guarantee rapid, comprehensive vegetation establishment. However, at Kingman most planted species did not persist. Only in the first year (2000) did planted species yield as much as 40% cover, while in subsequent years less than half of that. Though supplying important cover over time especially as other species were grazed out, the unpalatable Peltandra virginica never (even though partially replanted in 2002) provided more than 20% cover.
• Non native invasive species such as Phragmites and Lythrum are playing increasing roles at Kingman where elevations permit, since they also are not palatable. The NPS did successfully reduce Phragmites using a herbicide at Kenilworth, where our monitoring showed successful rebound of desirable marsh vegetation following treatments ..
• The population of annuals, both in terms ofnurnber of species and cover, were sharply reduced at Kingman Marsh in response to grazing and also at Patuxent Marsh following flooding from the newly constructed beaver darn. In both instances revival of the annuals were likely thwarted by increased periods of inundation (hydroperiod) which hindered seed germination and slowed growth.
• Visual appreciation of Kingman Marsh site vegetation cover changes over the years involved with the study including the site before reconstruction rnay be seen in the COVER PAGE photograph series of Kingman Marsh Area 1 (1999 - 2004) and the TITLE PAGE photograph series of Kingman Marsh Area 2 (1998, 2000-2004).

_)
j
j
j
j
Introduction: Historically, the Anacostia estuary (Map 1) was a fully functional freshwater tidal marsh comprising several thousand acres that sustained considerable food and habitat for wildlife which in tum was an invaluable support resource for Indians and subsequent colonists. Towards the end of the nineteenth century as sewage pollution, agriculturally derived sediments filling the shipping channel creating a requirement for maintenance dredging, surrounding development and disease threats increased in the Anacostia, intense pressure developed to remove the problematic wetlands. The U.S. Army Corps of Engineers (CoE) was charged to dredge the tidal Anacostia from its mouth at the Potomac River in Washington, D.C. up to Bladensburg, Maryland. In addition to dredging, a stone seawall was constructed which formed a sharp boundary between the dredged river channel and the deposited fill behind the seawall (Photograph 3 - note downstream (right) of the Benning Road Bridge where dredge and fill has occurred.). Essentially no emergent wetlands remained, including areas within the newly formed Kenilworth and Kingman tidal lakes. The National Park Service (NPS) became the custodian of these newly built landscapes which were to be used mostly for recreation. In the 1980s park planners and resource managers began to envision the opportunity of restoring areas like Kenilworth Lake as a vestige of the once productive wetland habitat. Following a long series of planning and technical evaluations Kenilworth Marsh was reconstructed by the CoE for the NPS as a freshwater tidal marsh (32 acres/13 hectares) in the highly urbanized Anacostia watershed in 1993 (Bowers 1995, Syphax and Hammerschlag 1995). This project was justified by the CoE for channel maintenance.
A similar reconstruction of tidal wetlands at the Kingman Lake site began during the spring of 2000 also using pumped dredge material from the Anacostia channel. The project this time was justified on the basis of habitat reconstruction. Monitoring of various aspects of the restored wetlands at the Kingman site was conducted over a 5-year period (2000-2004) as a project component. This report describes monitoring conducted by PWRC and the U. of Md concerning the vegetation and soil characteristics of the site. These ecosystem properties affect the value of the site as habitat for fish and wildlife, the biogeochemical and hydrologic functioning, and the aesthetic value. Vegetation monitoring included two components: standing vegetation and seeds which involved viable buried seeds as well as water and air born sources. Monitoring of soils involved measurements of soil particle size, organic matter, and redox potential (Eh). The vegetation, soil structure and seed bank were compared between the reconstructed and reference wetlands. Independent but related physical studies pertaining to site hydrologic function and sediment processes, as well as biologically oriented avian and benthic populations were also pursued. Separately, the US Fish and Wildlife Service traced the concentrations of organic and metallic contaminants through the food chain from the soil (Pinkney et al. 2003).
The five year monitoring project measured the progress of the reconstructed marsh toward becoming a functioning, viable freshwater tidal wetland. The results provide an evaluation of the reconstruction processes useful to the CoE as builders of wetlands and both the National Park Service and District of Columbia as managers. As such the project will also serve as a learning

)
)
j
j
j
)
)
j
j
j
j
j
curve and example for future restorations along the Anacostia and elsewhere. The project helped identify and characterize situations that required actions to correct the defects during the formative stages of the wetland (adaptive management actions). It was hypothesized that documentation of the avi-fauna and benthic macro-invertebrate use over time (Final Reports are on the Patuxent Wildlife Research Center website - http://www.pwrc.usgs.gov/) would also help describe the rate and degree of maturation processes at the urban reconstructed freshwater tidal wetlands. Having two similar almost adjacent (one half mile apart) urban reconstructed wetlands (Kingman 2000 and Kenilworth 1993) provides an excellent opportunity to study the marsh restoration processes relative to each other over time.
Study Background The five-year post-reconstruction monitoring project (2000-2004) was designed to track the development of the freshwater tidal Kingman Marsh in the urbanized Anacostia River estuary, Washington, D.C. following reconstruction in 2000 (Photograph 1: cover page-Kingman Marsh Area 1 and Photograph 2: title page - Kingman Marsh Area 2). To do so effectively the reference wetlands were monitored concurrently with the reconstructed ones.
The project was supported by funding from the Baltimore District of the Corps of Engineers (CoE), the Department of Health for the District of Columbia Department of Environment (D.C.) and the US Geological Survey Patuxent Wildlife Research Center (PWRC). The study was conducted by staff from PWRC and the University of Maryland Department of Biological Resources Engineering (U .of Md). The goal of the monitoring study was to track the Kingman Marsh evolution and compare it with a series of other local wetlands as references: Kenilworth Marsh (1993), a similarly reconstructed marsh (thus does not constitute a natural or unreconstructed reference marsh but was considered as a yardstick of potential progress for Kingman Marsh) just a half mile upstream; Dueling Creek Marsh (Photograph 4), the last best remaining tidal marsh in the urban Anacostia; and the Patuxent River Marsh, a rural freshwater tidal wetland in the adjacent Patuxent watershed (Photograph 5).
The Anacostia at one time had over 809 hectares (2000 acres) of wetland, but most were removed by mandatory dredge and fill operations during the first half of the 20th century (Photograph 3). Reconstruction of the once extensive wetlands in the Anacostia was promoted by the National Park Service which has management responsibility (Federal land manager) for the reconstructed landscapes (Bowers, 1995; Syphax and Hammerschlag, 1995). Further background, methodology and study result details are contained in Annual Reports (Hammerschlag et al. 2001, 2002, 2003 and 2004) prepared for CoE and D.C. for 2000, 2001, 2002 and 2003, as well as the Scope of Work (contact: Dr. Dick Hammerschlag at USGS Patuxent Wildlife Research Center, Beltsville Lab. [email protected]) and the USGS Patuxent Wildlife Research Center website: http://www.pwrc.usgs.gov/our research/wetlands and communities.
This Final Report includes important results of the 2004 field year and synthesizes results from all five years of the study. The scope of this study has permitted an extraordinary opportunity to gain insights into the ramifications of wetland reconstruction, and perhaps most importantly to provide data that has been used to guide adaptive management actions following unforeseen or uncontrollable interventions in the marsh restoration processes. Monitoring habitat restoration projects is vital for evaluating the quality and sustainability of the product(s) in addition to
11

)
)
_)
)
_)
J )
)
)
)
)
)
)
)
)
)
)
)
)
)
establishing usefulness as a demonstration or reference model for new projects (Zedler, 2001; Baldwin. 2004). Wetland restoratiol). efforts rarely proceed exactly as planned. In this situation efforts were hampered by vegetation depletion from herbivory of over-abundant resident Canada geese along with a concomitant reduction of marsh surface elevation likely from a combination of erosion, consolidation, and compression forces as well as from extended periods of considerably higher than normal water levels. Comparisons to Kenilworth Marsh were confounded by intensive invasion by the likely non-native form (haplotype) of Phragmites (Phragmites australis) and purple loosestrife (Lythrum salicaria) which ultimately triggered necessary herbicide treatments by a special NPS vegetation management team. Comparisons to Patuxent Marsh were also confounded by freshly initiated beaver activity. As a result this study is not really poised to reflect a pattern of restoration success from the Kingman reconstruction, but can document well what has occurred both before and after complications and any adopted management actions. Results of the study were supplemented by a three-year funded benthic study, a four-year bird study, two years of Surface Elevation Table (SETs) and hydrologger data collections, four years of fenced exclusion plots, and observations from fenced plantings by the Anacostia Watershed Society (AWS).
12
)
)
J )
J J )
_)
J _)
j
j
j
j
_)
j
j
j
J )
PART I- VEGETATION AND ASSOCIATED STUDIES
Richard S. Hammerschlag, Andy H. Baldwin, Cairn C. Krafft, Mary M. Paul, Kevin D. Brittingham, Kelly P. Neff, Kristen Rusello and Jeff S. Hatfield
INTRODUCTION
Following reconstruction (2000), Kingman Marsh was comprised of two separate areas: Kingman Area 1 (Map 1) north of Benning Road included about 30 acres (11 hectares) surrounded by the Langston Golf Course; and Kingman Area 2 (Map 2) south of Benning Road consisted of about 5 acres (2 hectares) adjacent to RFK Stadium to the west and Heritage Island to the east.
After sediment deposition (Anacostia channel sediment was pumped behind containment structures for consolidation and dewatering through extensive lengths of pipe site by a hydraulic dredge) the site was contoured and final graded with a large mud cat Planting of one year seedling plugs from flats started almost immediately following sediment placement in late May, 2000 at Kingman Area 2 using seven pre-adapted wetland plant species: Peltandra virginica (arrow arum), Schoenoplectus tabernaemontani (soft-stemmed bulrush), Juncus effusus ( common rush), Pontedaria cordata (pickerelweed), Sagittaria latifolia ( duck potato) and Shoenoplectus pungens (three-square), as well as lesser amounts of Nuphar lutea (yellow pond lily) in lower spots around the reconstructed marsh edges ( Nomenclature conforms to USDA PLANTS: USDA, NRCS 2001 and was checked against ITIS). These species were ones that were successful at Kenilworth Marsh (planted with 16 species in 1993) and were readily commercially available. A similar planting scheme was used at Kingman Area 1 once sediment and contouring was completed in early June. Our expectation was that we would get rapid colonization by a large number of species both planted and volunteer which would over time sort out (self design) according to the most successful (some would become dominant) based on elevation and aggressiveness (Kusler and Kentula, 1990; Mitsch et al. 1998; Mitsch and Gosselink, 2000). The original planting at Kingman (both Area 1 and 2) called for roughly 700,000 plugs of which Peltandra (154,000) and Pontederia (200,000) were planted in the greatest numbers. No J. effusus or S. pungens was planted at Kingman Area 2. When resident Canada geese started grazing the seedling plugs as soon as planted, it became necessary for ERM (a construction based component of Bio Habitats) to erect 4'galvanized metal fencing as perimeter fencing and lighter (less expensive, less durable) plastic mesh fencing to form internal cells to try to keep the geese out. The cells averaged about 50 feet by 50 feet wide and about four feet (1 1/3 meter) tall. About 40,000 plugs had to be replanted where the goose damage had occurred before fencing. The fencing helped considerably but was not completely goose-proof. The idea was to insure rapid cover with the planted species and allow volunteer species from the seed bank to fill in. This would give succession a head start relying on self design/self organization as the process of ultimately controlling community structure (Willis and Mitsch, 1995; Mitsch et al. 1998; Zedler, 2001)). The plants were planted on about 2' centers in groups related to the number of plants in the plant trays (40-50). A small area of Kingman Area 1 was left unplanted to test which, if any, of the planted vegetation species might
13
colonize via seed dispersal (Neff and Baldwin 2005) and also to indicate how much vegetation establishment would occur on its own. It would also provide an indication of cover that might be achieved without planting; i.e., strictly from available seed sources. Kingman was deliberately reconstructed lower than Kenilworth (mostly mid and low marsh less than 2.0' NGVD '29), so as not to incur as much invasive non-native species establishment (particularly Phragmites and L ythrum) as occurred at the higher elevations of Kenilworth. We were aware that optimum wetland establishment with respect to cover and diversity lies close to mean high water (MHW) which in the Anacostia is 2.1 fl. NGVD '29. We fully expected that Typha species (cattail), though not planted, would likely become dominant in portions of the marsh. Thus to the extent possible we tried to use information learned from our experiences at Kenilworth. The goal was to achieve rapid complete vegetative cover during the first growing seasons comprised almost entirely of native, local obligate wet marsh species.
Vegetation was chosen as a primary parameter by which to track the progress of marsh establishment at the reconstructed Kingman Marsh. The vegetative community is recognized as a useful surrogate for such marsh functions as wetland habitat, sediment deposition, aesthetics, marsh stability, nutrient cycling, etc. Its establishment also reflectsl the status of marsh hydrology, which is the key driver controlling wetland establishment under normal conditions. Monitoring was designed to determine whether differences between the reference and reconstructed wetlands were due to restoration efforts or some other phenomena. We will succinctly address whether reconstruction actually led to restoration at Kingman Marsh especially as compared to marsh development at the other built marsh in the study, Kenilworth, which was reconstructed seven years prior.
METHODS (Methods covered here are for the vegetation based study components of Part I. As appropriate, methods for other associated components will be covered in those subsections).
Thirty five randomly located transects each 35 meters long (Hammerschlag et al. 2000; Appendix A; Neff, 2002) were distributed among the four primary study areas (Photographs 4 and 5): Kingman Marsh and Kenilworth Marsh (both reconstructed); Dueling Creek Marsh (Anacostia reference marsh) and Patuxent River Marsh ( outside watershed reference) as follows: Kingman (reconstructed in 2000) Area 1 (Map 2) contained 15 transects, 12 of which were in areas that received planted species, and 3 at sites where no plantings were made; Kingman Area 2 (Map 3) contained 3 transects; Kenilworth Marsh, about one half mile upstream from Kingman Marsh, was the first reconstructed marsh- 1993, consisted of Mass Fill 1 (MFl) (Map 4), about 10 acres (4 hectares) northeast of Kenilworth Aquatic Gardens and contained 3 transects; Kenilworth Marsh Mass Fill 2 (MF2) (Map 4), about 17 acres (6.8 hectares) ofreconstructed marsh(1993) southeast of Kenilworth Aquatic Gardens contained 5 transects; Dueling Creek Marsh (Map 5), a less than 3 acre ( 1.2 hectares) bench of best remaining freshwater tidal wetland in the Anacostia north of New York Avenue and about one half mile upstream from Kenilworth Marsh, contained 3 transects; and Patuxent River Marsh (Map 5), a large more rural freshwater tidal marsh in an adjacent watershed (Mapl) on both sides of the Route 450 Bridge, contained 6 transects. All transects were sampled 3 times a year for each of the five study years (2000-2004) during the growing season: late May, late July and mid September. Each transect was divided into seven 5 meter sectors which were 1 meter wide yielding a belt of 35 sq. meters. The sector was the unit of
14
)
)
)
J )
)
)
)
)
)
)
J
J
measure for field data collection (but the transect was the primary unit for data analysis) in which all plants were identified (USDA Plants, 2001 http://plants.usda.gov) as nearly as possible to species (there were times especially early in the season when flowers and fruits were absent that not all plants could be identified to species). The absolute cover of each species, unvegetated sediment and detritus was estimated for each sector such that there would never be less than 100% cover, but frequently more, as vegetation could occur in vertical strata. Cover was estimated as 0.1 % ( effectively a trace), 0.5%, units of 1 % up to 15%, and to the nearest 5% thereafter. Integers were used to estimate cover rather than ranges to simplify calculations. Estimates were usually made by two persons each reading a portion (usually one half) of the 5 meter2 sector and with practice duplicated estimates were close. The mean height of each sector was recorded as a growth indicator since two sectors could both have 100% cover, but one might have considerably less biomass relative to height. The May data was used mostly to identify species growing early in the season. Where indicated, data from July and September would be averaged to yield a stronger statistical base.
While we were aware of methods to discriminate among the several Typha species (latifolia, glauca and angustifolia), we found inconsistencies in the way the differences were being interpreted in the field. Thus we have lumped all the Typha together simply as cattail.
A list of species identified at Kingman Marsh may be found in Appendix 1.
Statistical Methods for Vegetation
The vegetation data for this report were collected from six wetland areas: Kingman Areas 1 and 2, reconstructed in 2000; Kenilworth Mass Fills 1 and 2, reconstructed in 1993 and providing a reconstruction reference site; and two reference areas, Dueling Creek (located nearby on the Anacostia) and Patuxent Marsh (located on the Patuxent River in Anne Arundel County). Data were collected during three sampling timeframes (May, July, and September) over the course of five years (2000 through 2004). Data were collected on a sector basis (Im by 5m) and then averaged over the seven sectors constituting each belt transect. ANOV As were performed on the transect means rather than the sectors to insure the necessary independence.
Vegetation data were analyzed using a mixed model repeated measures analysis of variance (SAS, 2004, proc mixed) comparing the data among areas, years, and months within years. Pairwise comparisons were made using Tukey's Studentized Range Test of Least Squares Means (familywise error rate with a= 0.05). These analyses were conducted on the following dependent variables: total vegetative cover (the sum of covers from individual species or other taxa), species richness (the number of species observed per 5 m2 sector), diversity (an index incorporating both richness and evenness), and cover by annuals, perennials, and exotics ( classifications based on The PLANTS Database, USDA, NRCS, 2006). Graphs display least squares means ± 1 standard error (SE). Least squares means are displayed rather than arithmetic means, since the Tukey tests are based on least squares means. Least squares means are either the same or very close to the arithmetic means.
Diversity was calculated using the Shannon diversity index (Kent and Coker 1992):
15

)
)
)
)
)
)
)
s
Diversity H'= LP;(Inp;) i=I
J Where s = number of species
J Pi = proportion of individuals or the abundance of the ith
)
)
)
)
)
J )
)
J )
)
)
)
j
)
j
j
j
)
J
J
J
J
species expressed as a proportion of total cover
In = log basen .
Values of the Shannon diversity index usually fall between 1.5 and 3.5, with greater values indicating greater diversity.
Similarity between areas based on presence absence was calculated using the S0rensen similarity coefficient (Kent and Coker 1992):
S = 2a s 2a+b+c
Where Ss= S0rensen similarity coefficient
a = number of species common to both areas
b = number of species in area 1
c = number of species in area 2
Values of the S0rensen similarity coefficient range from O to 1, with greater values indicating greater similarity between sites.
Repeated measures ANOV A and Tukeys were also used on Kingman data alone to examine trends exhibited by sector elevations, individual planted species, total planted versus total unplanted species, and planted versus unplanted portions of this site.
Dominant species were identified for each area as those species with an annual cover average of at least 5% in one or more years (based on July and September data). Dominant species are graphed as means (arithmetic, since no statistical tests were conducted)± 1 SE.
Linear regressions of sector elevation versus total vegetative cover were performed for Kingman and Kenilworth data using statistical functions contained in Sigma Plot (2004).
RESULTS and DISCUSSION
1. Total Vegetation Cover
We initiated our scheduled monitoring in July 2000 which was just after planting was completed. Kingman Area 2 had been planted first which likely accounts for vegetation cover being closer to 50%, while Kingman Area 1 was less than 20% cover much of which consisted of the new plantings (Figure 1). It is a testimony to the rapid establishment of these freshwater tidal marshes
16
that total cover by September 2000 increased to roughly 100% (120% at Kingman Areas 2 and 80% at Kingman Area 1) of which the planted species provided about 30% of the cover. Total cover in September 2000 at Kingman was similar to that of the other marshes. (Total species count also was high with upwards of 125 species, though a few were not wetland plants.) Thus, despite some delay in the completion of the plantings partially caused by the need to construct fence exclosures, the first year revegetation was successful in terms of cover and species resulting from the combination of planted and volunteer species.
During the following winter of2000-2001 the fencing was deliberately removed since it had partially deteriorated, was becoming an eyesore and a concern for possibly trapping wildlife. That decision was reinforced by the scenerio that the vegetation had established well at Kingman, as it had at Kenilworth (Baldwin and Derico, 1999) in its first year (1993) seven years prior without any fencing, and that the fencing needed to be ultimately removed anyway. The miscalculation about the value of the fencing at Kingman is evident in the 2001 (Year 2) cover data. The reconstructed marsh is surrounded by the Langston Golf course which attracts resident Canada geese. Cover plummeted at Kingman Area 2 to less than 30 % and at Kingman Area 1 to about 60 % (Figure la). The cover at Kingman Area 1 was significantly lower than Patuxent and the Kenilworth sites in July 2001(Figure lb). The repeated measures analysis of variance (Table 1) did reflect a highly significant difference in cover(< 0.0001) for the areas over the 5-year study period as well as for the Area x Month (Year) interaction. The cover decline at Kingman continued at a lesser rate in the succeeding years such that by September 2003 cover at Kingman Area 1 was significantly less than in September 2000 and at Kingman Area 2 cover was significantly less in 2002 than it was in 2000.
The September 2001 declines in cover at Kenilworth Mass Fill 1 followed the first herbicide treatments to remove the invasive non-native species there - primarily the Phragmites and Lythrum. Cover recovered rapidly following the herbicide treatment at Kenilworth Mass Fill 1. At Kenilworth Mass Fill 2 only 3 sectors out of 35 received Phragmites treatment (most of the sectors contained no Phragmites) so the impact from treatment was not picked up as dramatically as at Kenilworth Mass Fill 1.
Due to marsh loss in 2001, the CoE/D.C. funded a partial replanting in 2002 at Kingman. This consisted of 75,000 plants most of which were either Peltandra or S. tabernaemontani, species which have been noted not to be preferred by geese. These plantings were protected by newly installed fencing. The Peltandra plantings were successful but the S. tabernaemontani disappeared totally from Kingman Area 2 by the end of 2002 along with decline of Typha ( cattail) in the middle areas of the marsh. This suggests a stronger role for lowered effective sediment elevation in this case ( elevation relationships will be discussed further in that section) since there was little evidence of grazing ( and both cattail and soft-stemmed bulrush are not that palatable to the geese particularly once established).
Much of the marsh growth at Kenilworth was luxuriant with cover frequently exceeding 100% and proving almost impenetrable by summer's end. Cover at Dueling remained fairly stable over the five-year period as did that at Patuxent, although a slight decline at Patuxent by September 2004 likely resulted from flooding effects along several Patuxent transects from the newly constructed beaver dam. By September 2004 cover at Kingman Areas 1 and 2 was significantly different from
17

)
j
_)
j
)
j
_)
_)
_)
j
what it had been in 2000, while Kingman Area 1 remained significantly different within the year for September, 2004 from the Kenilworth sites.
As shown in Figure la vegetation declined at the Kingman Areas from 2000 onward, whereas reference marshes displayed consistent cover of nearly 100% over the same interval. It is likely that the geese were responsible for the initial decline at Kingman but that in succeeding years eroding and consolidating sediment along with higher water levels in 2002 and 2003 made it difficult for the marsh to recover from grazing effects. Thus total vegetation cover that was near 100% initially has been reduced to close to 25% cover at Kingman while the reference areas all have been close to 100% cover. Differences between sites within years or sampling periods were not as dramatic as between years (Figure la and b). Other differences may also be noted.
Dominant species (Figure 2) (species with greater than 5% cover in at least one of the study years) differed among the study sites. Kingman Area 1 displayed cover in the early years by the low sprawling pioneer Ludwigia species. Even though Ludwigia palustris and L. peploides contributed cover at Kingman Area 1 (20 -30%) in the early years ofreconstruction, their low growth habit didn't contribute much to marsh vertical structure. Salix and Lythrum provided about 5% cover. Only the planted and replanted Peltandra showed a steady increase from 2000 to 2004. Kingman Area 2, especially in 2000 - 2001, had a number of species providing over 5% cover but by 2004 the only dominant species were Peltandra and Typha. However, in 2004 much of the Typha was no longer in the transects (having retreated up gradient closer to the marsh transition to woodland).
At both Kenilworth sites a number of species formed important components of plant communities, especially Leersia oryzae (rice cut grass), S. latifolia, Impatiens capensis (marsh touch-me-not), Peltandra and Phragmites. Reed canary grass (Phalaris arundinacea) at Kenilworth Mass Fill 1 along with Zizania aquatica (wild rice) and Schoenoplectus fluviatilis (river bulrush) at Mass Fill 2 also yielded good cover. River bulrush was a planted species not used at Kingman and wild rice spread from a pre-existing patch at Kenilworth. The presence of both of these species suggested a healthy marsh. In terms of dominant species the reference wetlands (Dueling and Patuxent Marshes) were unalike while Dueling was more similar to the reconstructed Anacostia wetlands. Three annual Polygonum species (P. arifolium, P. punctatum and P. sagittatum) were important at Dueling along with Leersia, Phalaris and Impatiens. Patuxent on the other hand supported a suite of species including Nuphar, Acorus calamus, Pilea pumila Sparganium eurycarpum and Carex lacustris which were not important in the Anacostia. Also contributing were the aquatic species Hydrilla and Lemna minor ( duckweed). The Polygonum tearthumb species P. arifolium and P. sagittatum were both important species at Patuxent, although as annuals, happened to decline in our study as a result of the beaver dam flooding. Only Peltandra was dominant in all of our project areas at some time during the course of the study.
It is interesting that most portions of Kenilworth Marsh, except for some edge areas, proved resilient to the goose population even though some grazing occurred early in the growing season. It appeared that marsh vegetation was able to outgrow the goose grazing pressure and dense vegetation oriented the geese away from penetrating the marsh. Geese appeared to prefer the more open perimeter areas around the marsh. From observations, the geese preferred landing in open water. They might then float over to the marsh; if large openings should occur, the geese continue to enter the marsh and feed especially on young vegetation trying to regenerate. Thus one might
18
_)
)
j
J _)
J _)
_)
J j
j
J
suspect a psychological barrier as well as a physical one provided by dense vegetation. On the other hand if the geese 'learn' they can get into semi-open areas, they will keep pressing in often with the effect of enlarging the openings as a result of the persistent grazing.
2. Species Richness The number of species (Appendix I) was very high immediately following reconstruction compared to the 30-40 species commonly found at the other sites. We identified 125 species at Kingman Marsh in 2000. Of these 76 were facultative wet or wetter (National Wetland Inventory status) and would likely continue to contribute as pioneers to the reconstructed marsh structure; but the remaining species were more upland oriented and seemingly volunteered on the open, still aerobic and still consolidating sediments. Most of these adventitious species would die off and be out-competed by the better adapted wetland species. The number of species at Kingman Area 2 on a per sector basis was higher in July 2000 than for any other time or for any of the other wetlands (Figure 3). Kingman Area 1 which was completed (final filling and grading) a couple months after Kingman Area 2 also exhibited an increase in the number of species to a high level by September 2000. Clearly there are an important number of species that volunteer in the newly exposed sediments which would likely get competed down to a more normal level as depicted by the other wetlands thereafter (Leck and Simpson, 1995; Leck, 2003).
What this rapid colonization by a great number of species suggests is that it may not be that vital under conditions similar to that found in the Anacostia to plant heavily other than to introduce important local native species that might not otherwise get well established. However at Kingman, this phenomenon did not have an opportunity to be expressed because the fence removal and consequent grazing by the geese reduced the species number in Year 2 (2001) at both Kingman areas below that of the other wetlands. By September 2001 the species/sector at Kingman was already significantly less than the year before (Year 1 ). At Kingman Area 2 the number of species per sector in September 2001 was about 25% of the number in 2000. Correspondingly the total number of species observed in 2001 at Kingman was less than half that in 2000 and many of the species were represented by only a few plants. Thus, while one would anticipate a drop in species in the marsh after the first year, just as might occur even at reconstructed terrestrial sites, the species loss at Kingman greatly exceeded expectations and remained well below the species number found at the other studied wetlands.
Neff (2002) noted that the 18 transects captured 75% of the total species identified at Kingman which provides a rough measure of efficiency. Knowing that transects would not capture all the species, we incorporated random walk-throughs of the marsh as a means of identifying additional species present.
Apparently the herbicide applied by NPS for Phragmites control also affected other species at Kenilworth Mass Fill 1 in 2001 because the number of species was significantly reduced, but that number rebounded the next year. The number of species at the other sites remained fairly stable over the five year period. By July 2002 the number of species at Kingman Area 2 was significantly less than for Patuxent at the same time. Species richness at Kingman Areas 1 and 2 remained significantly less than at the other marshes from 2001 thru 2004 (Figure 3). Results from the repeated measures analysis for species richness did define a difference between the study
19
areas over the time frame of the study (Table 1). The significant decline in Year 2 and the continued decline through Year 5 (2004) at the Kingman areas can be attributed to persistent grazing pressure and low sediment elevations that repress regeneration. Fewer species germinated and those few that did germinate at the lower elevations were readily grazed in the exposed areas. Such a syndrome might reinforce itself by reducing the amount of seed available from seed rain, though tidally dispersed seed would still be present.
We observed several of the wild rice exclosures installed and planted by the Anacostia Watershed Society (A WS) that were located at similar low elevations parallel to the tidal channel that appeared as mudflats at low tide. Very few seedlings emerged other than the sown wild rice until chance elevation gradients, usually in exclosures closer to the shoreline, reached the higher elevation end where numerous Polygonum spp. and Bidens spp. grew. It also seemed that planted seedlings of several species survived at lower elevations than could their seed. Most seed germination appeared to be suppressed below 1.8' NGVD '29 when some of the lower elevation pioneer species like Polygonum, Ludwigia and some Bidens species germinated and grew.
By 2004 there were but a few species per sector in the transects at Kingman and these were growing at the higher elevations. Only Peltandra and Nuphar plants were growing at the lower elevations and even young Peltandra came under some herbivory. So the general pattern at Kingman was that planted species (plugs) as well as volunteer vegetation survived for a while when protected from the geese, but once grazing commenced and sediment elevation lowered, revegetation was almost non-existent. Much of the remaining marsh consists of Peltandra and Nuphar at the lower elevations, while the perennials Typha spp, Lythrum, Phragmites and Salix persist at the higher elevations along with some contribution from annuals such as Polygonum spp and Bidens spp. No grasses or grass-like species persist under grazing pressure (e.g. Leersia and Echinochloa or even Cyperus spp.) but might reappear at higher elevations if protected.
Wild rice planted by A WS tended to grow luxuriantly at the lower elevations, although dense cells of wild rice succumbed to fungal attacks (rice blast, often Pericularia oryzae or Helminthosporium species) in 2004. It may be that the especially dense, luxuriant, and likely high nitrogen content growth actually predisposed the rice to rapid disease spread and demise. Since 2004 was the first year of intensive rice plantings and the first year of disease, considerably more work is needed to understand what the long term consequences will be. It will need to be determined if the blast was serious enough to prevent fertile seed formation and whether the wild rice will return in the diseased exclosures. Serious rice blast has not been observed at Kenilworth Aquatic Gardens or Kenilworth Marsh in the Anacostia where the rice has grown in previous years, nor has it been noted to be a problem in the extensive Patuxent River Marsh wild rice stands around Jug Bay. We interacted with Dr. Ethel Dutky, an extension biologist for the State of Maryland at the University of Maryland, to verify the causal fungi and learn more about the disease etiology. The likely source of the fungi was from local grasses, probably turf grasses, where the fungi subsist as relatively minor pathogens.
2a. Shannon Index The Shannon Index of plant diversity (reflects evenness of plant distribution) differed over time in the Kingman Marsh areas but remained constant at the other marshes (Figure 4a). This signals an important shift at Kingman that did not occur elsewhere. There were few significant differences in
20

diversity between sites within sampling times, except that Kingman Areal differed significantly from Patuxent River Marsh much of the time after 2001 and differed from Kenilworth MF 1 in September 2004 (Figure 4b). Repeated measures analysis of variance did demonstrate a difference among the study sites over the study years with respect to diversity (Table 1). The pattern of diversity over time paralleled that of species richness and showed a significant decrease at the Kingman marshes from 2000 (Figure 4a), again attributable to goose grazing. The decline in diversity at the two unplanted transects was not significant. It should be noted that the Shannon Diversity Index was calculated only on the basis of sectors supporting vegetation since unvegetated sectors would count as zero and confound the calculation process. Actually, 217 out of the 973 sector records at Kingman (2000 through 2002) possessed no vegetation (that is roughly one-quarter of the sectors, which is quite considerable - Figure 8 a, b ). None of the other marshes had any sector with no vegetation. This, too, demonstrates the extreme effect of the goose grazing and elevation problem at Kingman.
2b. Sorenson's Similarity Index Similarity of species composition at the study wetlands was determined using S0renson's similarity index (Table 2). S0renson's similarity index compares presence/absence data from two areas to produce an index that varies from O if the areas have no species in common, to 1, if both areas have all species in common. A review of Sorenson's Similarity Matricies (Table 2) over the course of the study shows that Kingman Area 2, which had been somewhat similar to Kingman Area 1 in 2000 and 2003, was dissimilar in 2004 (as it was to all the comparison sites in 2004). This sharp 2004 dissimilarity is due to the total disappearance of species at Kingman Area 2 where they had been declining in prior years from the grazing and lowered sediment elevations but still exhibited minor presence. By 2004, other than Kingman Area 2, the sites were similar to each other to the extent that about half their species were in common (0.50).
One of the study goals was to track vegetation community development (natural reassembly of plant associations) as a sign of maturation in comparison to the reference wetlands. However, despite marsh evolution disruption at Kingman especially for the mid-marsh species as a result of grazing pressure, at Kenilworth due to strong invasion by non-native species, and at Patuxent with the advent of the beaver dam, vegetation associations remain a worthwhile indicator to track marsh restoration (Caldwell and Crow, 1992).
The collection of plant species found in the Anacostia. closely resembles current plant lists for nearby Dyke Marsh (Johnston, 2000) and Piscataway Bay along the Potomac, the middle Patuxent (Sipple, 1990), as well as for a list of species noted by Dr. Fran Uhler when he walked through a last intact remaining portion of the Anacostia marshes in 1944. In fact each of the 26 species noted by Uhler in his memo currently may be commonly found in the reconstructed Anacostia wetlands. This means that the germplasm is still available to reconstitute the Anacostia marshes similar to what one might expect (Odum et al., 1984). It is mostly a matter ofrestoring sediments to their proper elevations and avoiding detrimental impacts from such things as non-native invasive species and over abundant resident geese. The development of plant communities and the proportion of various species present should be a product of competition and processes associated with self-design principles (Mitsch et al., 1998).
3. Elevations
21
)
)
)
)
)
)
)
)
)
)
)
)
)
)
)
)
)
)
)
)
)
)
)
)
)
)
)
)
)
)
)
)
)
)
)
)
)
)
)
)
)
)
Sediment elevations and closely related duration of inundation (hydroperiod) at any location as driven by hydrology directly control vegetation response in terms of species establishment (Good et al. 1978, Odum et. al 1984, Baldwin et al. 2001, Kellogg and Bridgham 2002, Lech 2003). Thus it is knowledge of the sediment elevations that can be useful in the interpretation of the vegetation community as well as resilience to stressors such as the geese, erosion, sediment consolidation and higher than ordinary water levels. A restoration goal for Kingman Marsh was to achieve vegetation cover with local, native species for designated portions of the marsh. To accomplish this, there was an acknowledged attempt to produce sediment elevations following expected compaction of placed sediment and compression of underlying sediments that were at or slightly lower than mean high tide (MHT) or for the Anacostia about 1.8-2.1' NGVD '29 (National Geodetic Vertical Datum based on mean tide levels nationally in the 1929 time frame). The Anacostia on average has a~ 3' tidal range swinging from -0.80' = MLLW to +2.22' MHW NGVD '29. The actual average elevation of the Kingman sediments was about 1.8' in 2001 (Table 3). Levels at or above MHT seemed to promote Phragmites and Lythrum at Kenilworth, so the targeted lower elevations at Kingman were anticipated to deliver substantial revegetation but be less prone to the invasive exotics.
It is not clear what elevations the 'as builts' documented from the CoE. Neffmeasl,l.fed the elevation level of each transect sector at Kingman in 2001, one year after reconstruction. These elevations as corrected for the CoE GOLF benchmark at Kingman Area 1 (NGVD '29 = 6.63 ') and Kingman Area 2 for the Garbo-Luebke benchmark (NGVD '29 = 5.56') are shown in Table 3. The sector elevations are averaged for each transect and suggest that 5 of the 14 transects were quite low (planted transects 1,2,3,9 and unplanted transect 3 at Kingman Area 1; and 1 of the 3 transects at Kingman Area 2 in 2001). These low elevations either sustained no vegetation or strictly low marsh species ( e.g., Peltandra and Nuphar which were there as a result of planting). By 2004 following a similar survey procedure as in 2001 using the laser level keyed to the CoE benchmarks, the number of low transects was approaching 9 and by averaging the transect elevations the overall marsh elevation had dropped about 0.15' or almost 2" (Table 3). The loss of elevation was significant for Kingman Area 2 but not Area 1 (Figure 5). Transects and portions of transects closer to channels appeared to undergo the greatest sediment loss. This sediment transport is likely analogous to terrestrial stream systems where surface those areas experiencing the greatest velocity and frequency of water movement will be the areas most prone to scour. Sediment processes will be discussed further in the section concerning Surface Elevation Tables (SETs ). It should be noted that the transects provide a wider spread source of data than the SETs for surface elevations, while the SETs help define the processes involved with sediment elevation change. Thus, due to the location of the transects, there may be an overall elevation change detected that is not captured by the SETs at their locations
Study areas may be similarly compared on the basis of inundation (Figure 6 - Neff, 2002.). Inundation durations are essentially the inverse of elevation, so the highest elevations have the least inundation (e.g., Kenilworth Mass Fill 1). The duration of inundation for sections of the Kingman Areas is similar to Patuxent so that those similar locations might ultimately be expected to have similar species. On the other hand Kenilworth tends to be inundated less than Kingman and Patuxent and is more similar to Dueling Marsh. Sediment process will be discussed further in the section concerning Surface Elevation Tables (SE Ts). Transects provide a spatially extensive data set, while the SETs help define processes involved with sediment elevation change.
22

To attain desired vegetation cover at Kingman as an adaptive management exercise, once there is some control on the resident goose population, then either the low elevation areas (1.5' - 1.8' NGVD '29) could be replanted with a suite of low marsh species, or additional sediments could be supplied to regain mid-marsh elevations (1.8' -2.2' NGVD '29). Once rebuilt, these latter marsh areas could at least be partially planted with a suite of mid-marsh species. If the low marsh route is selected then the goal of primarily mid-marsh restoration would have to be altered. Currently, despite ample sediments suspended carried in the Anacostia waters, overall there is not a net elevation gain at the reconstructed wetlands as measured by the laser level or Surface Elevation Tables. What one might hope for, and could be documented by sustaining monitoring efforts, would be that an established low marsh with its vegetation would serve as a better sediment trap than the existing conspicuous unvegetated mudflats. Under such conditions over time, considerable low marsh might aggrade into mid marsh vegetation.
Kenilworth Marsh, particularly the Mass Fill 2 portion, provides a model as to what could be expected at Kingman for mid-marsh. Despite the presence of geese, but lesser numbers than at Kingman Marsh, the vegetation growth outpaces goose herbivory, so the main marsh is self sustaining. Even following herbicide treatments for Phragmites which formed monocultural colonies in higher portions of the marsh, the marsh recovered. The presence of marsh vegetation hindered use by geese as they prefer to land in open water. The geese would graze around the marsh perimeter but never really impacted the marsh interior. However, vegetation in lower, more exposed areas near channels was grazed down by the geese. Major plant species at Kenilworth Mass Fill 2 include Schoenoplectus fluviatilis, Typha spp., Zizania palustris, Mikenia scandens, Peltandra, Sagittaria, Polygonum spp., Amaranthus, etc. On the other hand the Patuxent Marsh represents a model for a long standing low marsh. Hydrologger data (Neff 2002) shows duration of inundation typical of a low marsh (Figure 6 - Neff, 2002). Although there has been documentation of high numbers of resident Canada geese just south of our study area at Patuxent (Elmore, 2003), we have no documentation of goose pressure for our Patuxent River Marsh study site. The important vegetation species are Nuphar, Peltandra, Acorus, Polygonum tear thumbs, etc. Just downstream, in the Jug Bay reach of the Patuxent, wild rice is growing luxuriantly under protection from geese (Elmore, 2003; Haramis, 2006).
A number of observations corroborate the sensitivity of plant growth to small changes in elevation (inches). Seed germination is generally an aerobic process such that most seed germination in tidal wetlands would be expected to occur at higher sediment elevations and would be thwarted at lower elevations by anaerobic conditions occurring with longer periods of inundation. Neff (Neff 2002) determined that the redox potential of the Anacostia sediments was near zero with just 35% inundation. Inspection of the eighteen 30' diameter exclosures placed in the marsh by the Anacostia Watershed Society as protection for their wild rice plantings revealed no volunteer establishment of wetland plant seedlings ( other than wild rice which will germinate under anoxic conditions) at the lower elevations within an ex closure that happened to have sufficient gradient, nor in the majority of exclosures that were placed at lower elevations (about 1.5' NGVD '29) thought to encourage wild rice. However, higher portions of exclosures with gradients or exclosures placed closer to the shoreline at higher elevations (about 2.0' NGVD '29) did variously display volunteer seedlings of several smartweeds (Polygonums), tickseeds (Bidens) and Ludwigia spp. Often on soggy logs which could float with the tide and avoid much inundation, frequently seedlings of such plants as Cyperus spp, Lycopus spp., Eclipta alba, etc. could be seen growing.
23

This also demonstrates that seeds of various species are present in the marsh even though these species and others are rarely found growing currently in the marsh at Kingman. During the first year of reconstruction volunteer seedling establishment would occur quickest at the higher elevations and would not establish in areas of enduring pools. As will be discussed later, at low elevations where inundation might normally stifle seed germination, one might have better success at marsh establishment using seedlings. Most emergent wetland plants and seedlings have the capacity to move oxygen (air) down through their conducting tissues and parenchyma cells into the roots to sustain their respiration. Thus planted seedlings can establish better at lower elevations than they can from their seeds.
At the Patuxent River site annual species ( dependent on annual seed germination) disappeared following long term inundation from a newly constructed beaver dam (Russelo 2005). These observations are also strongly supported by seed tray germination trials to document seed bank species. Trays kept only moist, produced many more species and numbers of plants than trays flooded by 2-3 cm of water (Baldwin and Derico, 2000; Neff 2002, Neff and Baldwin 2005, Rusello, 2005. Such observations verify the importance of elevation/inundation period (hydroperiod) with respect to volunteer plant establishment and indicates why goose grazing pressure will have a greater impact at lower sediment elevations since those areas would only be slow to recover via re-establishment from the seed bank (Smith et al. 2002; Peterson 2004). Wetlands at the lower elevations are not conducive to rapid vegetation growth, so grazing pressure is sufficient to eliminate vegetation. If elevation is not altered, replanting must focus on species that will grow well at the existing low elevations.
One might investigate the usefulness of a relationship between elevation and plant cover or elevation and species richness as parameters to measure the health and success of reconstructed wetlands. Wetland plant species respond differently to elevation, thereby providing the basis for the broad classification into low, mid and high marsh communities (Simpson et al. 1983; Odum et al., 1984; Willis and Mitsch, 1995; Baldwin, 2004). For example, essentially no Phragmites was found lower than 2.2' (Figure 7 -Neff, 2002).
When we used only odd numbered sectors, there was a strong relationship (p = 0.0001 in 2001) between cover and elevation using Kenilworth Marsh as the reference site (Figure 8c) ( even though data was taken from transects most portions of which were at relatively high elevations (1.6-2.7' NGVD '29). The cover/elevation relationship was highly significant at Kingman in 2001 (Figure 8a, p :::; 0.0001) which likely does reflect in part the stronger grazing effect at the lower elevations and more vigorous growth at the higher elevations. However, by 2004, the relationship was weak at Kingman (Figure 8b, p = 0.0297). Grazed plants may be prone to inundation, in effect drowning, as the cut stems are covered with water which prevents air (oxygen) uptake and consequent mobility down to the roots where needed for aerobic respiration (Sipple 1999). The longer plants are inundated, the more vulnerable will be the plants.
We should be able to use the species richness/elevation relationship to reflect successful marsh restoration with more species occurring at the high marsh as opposed to the low marsh due to the stifling effect of flooding on survival of many emergent plant species. Unfortunately, Kenilworth Marsh 2001 (Figure 9c) did not display a significant relationship (p = 0.6753) possibly due to much of the marsh being high and the influence of the non-native invasive species or even Typha
24
)
)
_)
)
J J )
J J )
J J
J j
)
j
j
j
j
J
patches limiting species number. However, Kingman did display a significant relationship in 2001 (p ::;0.00001) possibly enhanced by species reduction from grazing at the lower elevation end (Figure 9a). The same significant relationship held at Kingman in 2004 (Figure 9b) where there was a severe depression of species numbers with a compression of more than half the sectors having 2 or less species. At any rate it is important to understand the elevation/species richness relationship and be able to apply it to the reconstructed wetlands as compared to reference wetlands. Neff (2005) did obtain a significant relationship (inverse) between inundation and species richness at the reference marshes at Dueling Creek (p = 0.0012) and Patuxent (p ::;0.0001) in 2001 but similarly to us did not obtain a significant relationship (using inundation instead of elevation) at Kenilworth.
4. Contribution from Planted versus Unplanted Species The planting at Kingman in 2000 consisted of seven species: Pontederia cordata (200,000 plugs), Peltandra virginica (153,000), Schoenoplectus tabernaemontani (130,000), Sagittaria latifolia (120,00), Juncus effusus (44,000), Schoenoplectus pungens (41,000), and Nuphar lutea (20,000 quart sized plantings). This total of roughly 700,00 plants includes about 40,000 plants that had to be replanted due to initial goose grazing before fencing was installed to protect the new plantings. These species were selected from the sixteen species planted at Kenilworth based on availability and survival. The goal of planting on approximate 2' centers was to insure rapid colonization cover of important species that would strongly contribute to the ultimate marsh community structure. While it had been documented that there was abundant water-borne seed available to help establish rapid cover (Part III), the investment in planting important plant species not in abundance in the seed bank was still considered worthwhile to assure rapid establishment of a vigorous and representative freshwater tidal marsh. A small portion of the marsh was left unplanted. Planted species formed about 40% of the cover by September 2000 (the first year) but this cover declined rapidly by year two (2001) and remained at about 10% cover thereafter (Figure 8) even though there was partial replanting of P. virginica and S. tabernaemontani (both geese unpalatable species) in 2002. Even though the cover by planted species remained low, they did provide about 50% of the vegetative cover that remained in 2003 and 2004 (Figure 11). Almost none of the planted species, except less than 5% cover by P. virginica and J. effusus in 2004, were found in the unplanted transects during the study. By the end of 2004, Peltandra and Nuphar were the only planted vegetation contributing importantly to cover (Figure 12). Even the S. tabernaemontani which had been replanted in 2002 had disappeared from the transect areas. P. cordata and S. latifolia are recognized as palatable species and they declined so drastically as to be essentially non-existent in 2001. Confounding effects from goose grazing precluded determining the benefit of planting at Kingman Marsh to marsh revegetation efforts.
5. Contribution by Annuals and Perennials
Annuals succeed by producing seed that germinates and yields new plants on site each year. If conditions become less favorable for this process to occur, annuals will decline. For many annuals seed germination and seedling growth is dependent on aerobic respiration which requires at least modest oxygen levels in the sediment. The longer sediments are inundated, and the more active the microbial populations, the more likely the sediments will be anaerobic. Consequently, conditions that lower sediment elevations or raise water levels may lead to decline of annuals or make it more difficult for annuals to recover from grazing pressure. There may also be competition among bacteria, fungi, benthic organisms and seed for available soil oxygen. Redox
25

potential declined from about 75mV in 2000 to 40mV in 2001 at Kingman Area 1 and remained near 50mV at Kingman Area 2 for that time frame (Neff, 2002). These levels compare to Dueling Creek at 160Mv and Patuxent about 15mV.
At Kingman there has almost been a complete loss (significant) of annuals since 2000 (Figure 13a) when annuals provided as much as 30 % cover (although some of that annual cover was provided by transitional terrestrial species). Annuals were accessible to geese and other herbivores at low elevations and thus had little opportunity to outgrow the grazing pressure. At the unfenced Kenilworth Marsh, where elevations were more favorable to support vegetative growth, annuals were able to out-compete geese. The section on Exclosures helps illustrate the adequate seed bank and seed dispersal potential as based on suitable elevations. Data from Neff (2000) and Rusello, (2005) (see Parts III and IV) indicated the presence of a substantial seed bank both in terms of seed volume and species richness. Kenilworth supports about 10-20% cover by annuals. Dueling Creek Marsh, as an unreconstructed wetland bench in the Anacostia, sustained about 30% annuals throughout the study. The Patuxent wetland supported about 60% cover by annuals until flooding by beaver activity in 2002 (Figure 15). Until this decline, the Patuxent wetland significantly more annuals (none planted) than Kingman and Kenilworth (Figure 13 b ). It is impressive to note the significant collapse in annuals along the transects (2,3,4,6) flooded by the beaver dam (Map 4) but not by the transect (1) that was across the road and unaffected by the dam. Transect 5 was low in elevation along the channel and never supported annuals.
Perennials may be better adapted to lower sediment oxygen levels since many can transport oxygen from emergent tissues down to the roots. Also, perennials that re-grow each year from rhizomes and tubers, are not as dependent on seeds for survival or even spread. Perennials declined sharply (Figure 14a) with removal of fencing at Kingman Area 2 in early 2001 and has continued to slowly decline throughout the study. At Kingman Area 1 which has some higher elevations where some of the transects are located the perennials declined significantly from 60% cover in 2000 to about 25% cover in 2004. Kenilworth seemed to experience some modest increase in perennials after 2002, possibly as a recolonization response following herbicide treatment for Phragmites (note the dramatic decline in perennial cover at Kenilworth MFl in 2001 from treatment). It may also be that perennials could compete better at these sites in these years of higher water level (higher than normal rainfall in 2003-2004, whereas 2000-2002 were drought years). Perennial growth at Patuxent also increased after 2002 possibly in response to reduction in competition from the annuals lost to beaver dam flooding. Meanwhile, perennial cover at Dueling Creek, the one site in our study that didn't undergo any evident traumatic impacts, remained at about 70% cover throughout the study. The only significant within year differences (Figure 14b) occurred between Kingman area 1 and the Kenilworth areas in 2003 and 2004. Thus in this study the absolute cover by annuals and perennials seemed to reflect well the conditions under which they were forced to grow.
6. Non-native species (exotic species) Non-native species contribution remained relatively constant across the course of the study at the study sites (Figure16) with the only significant change in cover from exotics resulting from removal of the invasive presumably non-native Phragmites (from behavior, likely the non-native haplotype) in 2001 at Kenilworth Mass Fill 1. Exotic cover was consistently high at Kenilworth Mass Fill 2 mostly from Phragmites but also due to Lythrum. Our transects were mostly not in areas receiving herbicide treatment. The most important non-native species at the Anacostia study
26
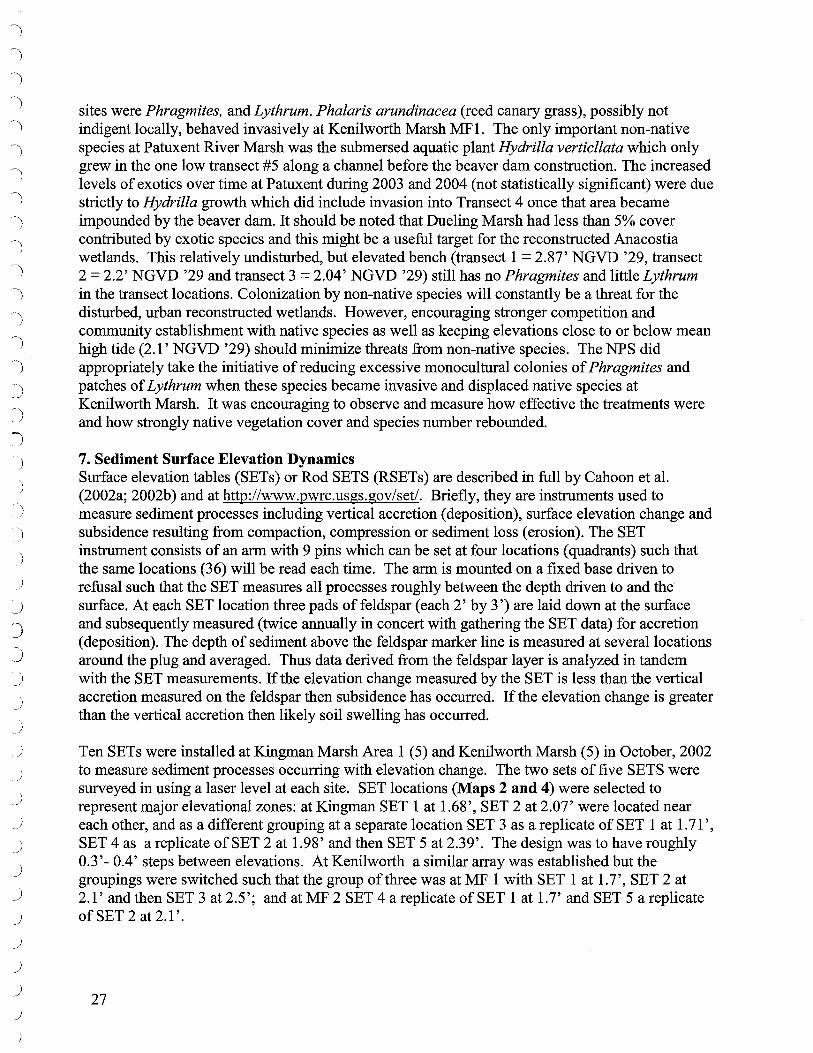
)
__)
J J -)
)
J )
)
~
~
)
)
_)
_)
_)
j
)
_j
sites were Phragmites, and Lythrum. Phalaris arundinacea (reed canary grass), possibly not indigent locally, behaved invasively at Kenilworth Marsh MFl. The only important non-native species at Patuxent River Marsh was the submersed aquatic plant Hydrilla verticllata which only grew in the one low transect #5 along a channel before the beaver dam construction. The increased levels of exotics over time at Patuxent during 2003 and 2004 (not statistically significant) were due strictly to Hydrilla growth which did include invasion into Transect 4 once that area became impounded by the beaver dam. It should be noted that Dueling Marsh had less than 5% cover contributed by exotic species and this might be a useful target for the reconstructed Anacostia wetlands. This relatively undisturbed, but elevated bench (transect I= 2.87' NGVD '29, transect 2 = 2.2' NGVD '29 and transect 3 = 2.04' NGVD '29) still has no Phragmites and little Lythrum in the transect locations. Colonization by non-native species will constantly be a threat for the disturbed, urban reconstructed wetlands. However, encouraging stronger competition and community establishment with native species as well as keeping elevations close to or below mean high tide (2.1' NGVD '29) should minimize threats from non-native species. The NPS did appropriately take the initiative of reducing excessive monocultural colonies of Phragmites and patches of L ythrum when these species became invasive and displaced native species at Kenilworth Marsh. It was encouraging to observe and measure how effective the treatments were and how strongly native vegetation cover and species number rebounded.
7. Sediment Surface Elevation Dynamics Surface elevation tables (SETs) or Rod SETS (RSETs) are described in full by Cahoon et al. (2002a; 2002b) and at http://www.pwrc.usgs.gov/set/. Briefly, they are instruments used to measure sediment processes including vertical accretion ( deposition), surface elevation change and subsidence resulting from compaction, compression or sediment loss ( erosion). The SET instrument consists of an arm with 9 pins which can be set at four locations (quadrants) such that the same locations (36) will be read each time. The arm is mounted on a fixed base driven to refusal such that the SET measures all processes roughly between the depth driven to and the surface. At each SET location three pads of feldspar ( each 2' by 3 ') are laid down at the surface and subsequently measured (twice annually in concert with gathering the SET data) for accretion ( deposition). The depth of sediment above the feldspar marker line is measured at several locations around the plug and averaged. Thus data derived from the feldspar layer is analyzed in tandem with the SET measurements. If the elevation change measured by the SET is less than the vertical accretion measured on the feldspar then subsidence has occurred. If the elevation change is greater than the vertical accretion then likely soil swelling has occurred.
Ten SETs were installed at Kingman Marsh Area 1 (5) and Kenilworth Marsh (5) in October, 2002 to measure sediment processes occurring with elevation change. The two sets of five SETS were surveyed in using a laser level at each site. SET locations (Maps 2 and 4) were selected to represent major elevational zones: at Kingman SET 1 at 1.68', SET 2 at 2.07' were located near each other, and as a different grouping at a separate location SET 3 as a replicate of SET 1 at 1. 71 ', SET 4 as a replicate of SET 2 at 1.98' and then SET 5 at 2.39'. The design was to have roughly 0.3 ' - 0.4' steps between elevations. At Kenilworth a similar array was established but the groupings were switched such that the group of three was at MF 1 with SET 1 at 1. 7', SET 2 at 2.1' and then SET 3 at 2.5'; and at MF 2 SET 4 a replicate of SET 1 at 1.7' and SET 5 a replicate of SET 2 at 2.1'.
27

)
)
_)
J J
)
)
_)
j
_)
_)
j
_)
j
_)
j
_)
_)
J _)
The SETs are read twice annually: April and October. The data reported here are for 2003 and 2004, but data collection is ongoing. Based on Analysis of Variance of the SET data there was not a significant difference in elevation change between Kingman and Kenilworth Marshes. At Kingman vertical accretion occurred at four of the five sites (SETs 2-5) (Figure 17b . The one location where scouring was observed (SET 1) was at a low elevation (1.7'). The other four locations were not scour prone and in fact SETs 3 and 4 happened to be in a location exposed to fetch that actually delivered sediment. SETs 2-5 at Kingman had little or no net positive elevation change (Figure 17a). All five SETs at Kenilworth displayed vertical accretion (Figure 18b) with the greatest accretion at the single highest elevation (80 mm at 2.5' at MF 1 ). However, two SETs (SET 1 - MF 1 = 1. 7' and SET 2 - MF 1 = 2.1 ') displayed loss of elevation while the other SE Ts had less elevation gain than accretion (Figure 18a). At both sites vertical accretion is just keeping up with subsidence, resulting in little net change in average elevation over time (Figure 19).
Peterson (2004) has shown a direct relationship between rates of sediment deposition and reduction in seedling recruitment. The strongest effect could be on species requiring light for germination, those having a strong oxygen requirement, and annuals. For example, the locations of SET #1 at Kingman and SETs #1 and 2 at Kenilworth display subsidence as well as deposition. Thus, sedimentation under certain conditions may be an additional factor suppressing marsh regeneration which may make it easier for the geese to keep the area grazed down. To the extent the marsh cannot grow faster than the grazing pressure, the geese and other grazers will continue to graze on the more open mudflats that normally would support marsh vegetation.
8. Hydrologger Data Data logging wells (hydro loggers) that record the tidal water elevations every fifteen minutes (Ecotone Model WL-80; Remote Data Systems, Inc., Whiteville, North Carolina) were at five locations in the Anacostia (Maps 2-5): Kingman Areas 1 and 2, Kenilworth Mass Fills 1 and 2, and Dueling Creek. They were placed at low points of channels so as to cover as wide a tide range (about 3' tidal range in the Anacostia) as possible. Data were downloaded onto a laptop or Palmcorder seasonally in the field from the hydrologgers and subsequently analyzed. Overall, Patuxent was the lowest site (inundated the longest), while Kenilworth Mass Fill 1 was inundated the least (Figure 6). Data from years 2002-2004 could not be consistently collected throughout the year(s) as the data loggers did not function properly for periods at a time. Nonetheless, we were able to obtain confirmed functional pieces of data ( essentially identical hydro logic patterns from the different hydrologgers) from different hydrologgers for the same stretch of time during the growing season which correlated with 2002 being a low rainfall year (lower water levels on average) in contrast to 2003 and 2004 which were wet years (higher water levels). For example, when we compared Dueling Creek data from mid-April to early August for 2002 (dry year) and 2003 (wet year) the water levels were 5-10 cm (2-5") higher in 2003 (Figure 20 -The differing linearized slope and separation of the lines depicting water levels for the measured period each year is shown and labeled with the slopes.). Water level differences at Kingman Area 2 were 5-25 cm (2" -1 O") higher in 2003 for the same period. These higher water levels would have the same effect as lowering the sediment levels by an equivalent amount (Baldwin et al. 2001 ). Thus higher water levels in 2003 and 2004 were likely a factor in restraining seed germination and rate of growth at all the sites but would be most enhanced and noticeable at the depredated Kingman Marsh areas which were dependent on revegetation following grazing and also sediment loss at many locations.
28
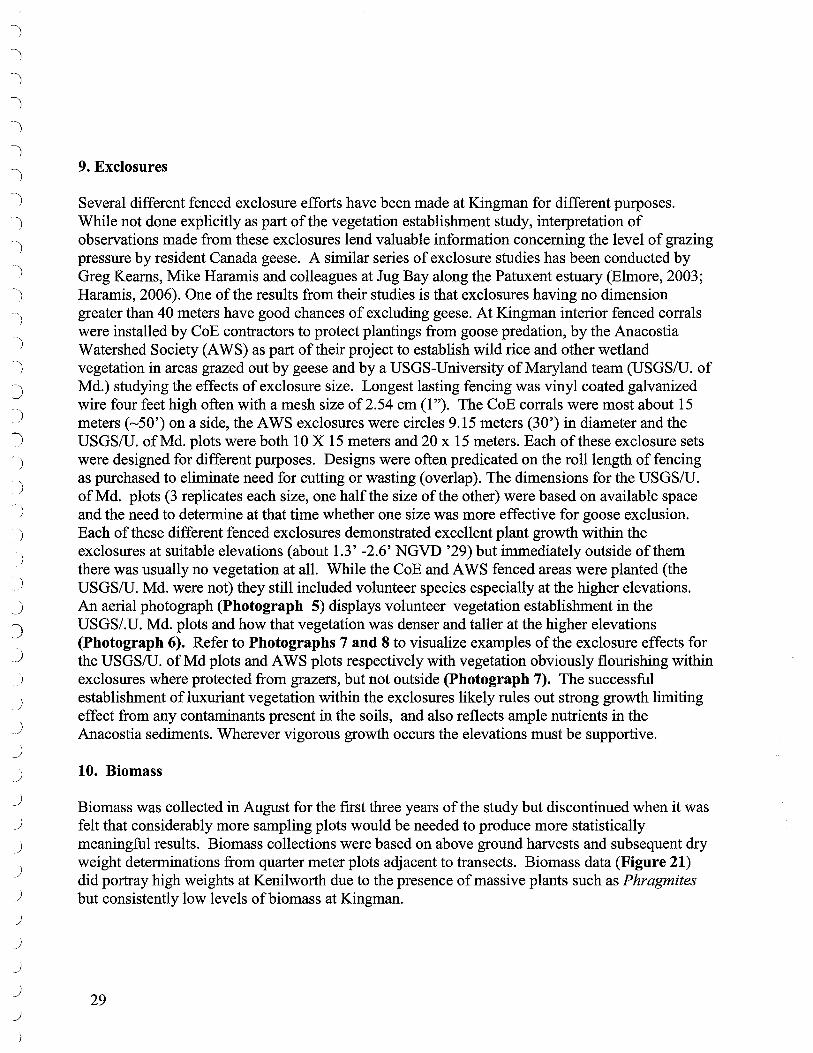
9. Exclosures
Several different fenced exclosure efforts have been made at Kingman for different purposes. While not done explicitly as part of the vegetation establishment study, interpretation of observations made from these exclosures lend valuable information concerning the level of grazing pressure by resident Canada geese. A similar series of exclosure studies has been conducted by Greg Keams, Mike Haramis and colleagues at Jug Bay along the Patuxent estuary (Elmore, 2003; Haramis, 2006). One of the results from their studies is that exclosures having no dimension greater than 40 meters have good chances of excluding geese. At Kingman interior fenced corrals were installed by CoE contractors to protect plantings from goose predation, by the Anacostia Watershed Society (A WS) as part of their project to establish wild rice and other wetland vegetation in areas grazed out by geese and by a USGS-University of Maryland team (USGS/U. of Md.) studying the effects of ex closure size. Longest lasting fencing was vinyl coated galvanized wire four feet high often with a mesh size of2.54 cm (1"). The CoE corrals were most about 15 meters ( ~50 ') on a side, the A WS ex closures were circles 9 .15 meters (30 ') in diameter and the USGS/U. of Md. plots were both 10 X 15 meters and 20 x 15 meters. Each of these ex closure sets were designed for different purposes. Designs were often predicated on the roll length of fencing as purchased to eliminate need for cutting or wasting (overlap). The dimensions for the USGS/U. of Md. plots (3 replicates each size, one half the size of the other) were based on available space and the need to determine at that time whether one size was more effective for goose exclusion. Each of these different fenced ex closures demonstrated excellent plant growth within the exclosures at suitable elevations (about 1.3' -2.6' NGVD '29) but immediately outside of them there was usually no vegetation at all. While the CoE and A WS fenced areas were planted (the USGS/U. Md. were not) they still included volunteer species especially at the higher elevations. An aerial photograph (Photograph 5) displays volunteer vegetation establishment in the USGS/.U. Md. plots and how that vegetation was denser and taller at the higher elevations (Photograph 6). Refer to Photographs 7 and 8 to visualize examples of the exclosure effects for the USGS/U. of Md plots and AWS plots respectively with vegetation obviously flourishing within exclosures where protected from grazers, but not outside (Photograph 7). The successful establishment of luxuriant vegetation within the exclosures likely rules out strong growth limiting effect from any contaminants present in the soils, and also reflects ample nutrients in the Anacostia sediments. Wherever vigorous growth occurs the elevations must be supportive.
10. Biomass
Biomass was collected in August for the first three years of the study but discontinued when it was felt that considerably more sampling plots would be needed to produce more statistically meaningful results. Biomass collections were based on above ground harvests and subsequent dry weight determinations from quarter meter plots adjacent to transects. Biomass data (Figure 21) did portray high weights at Kenilworth due to the presence of massive plants such as Phragmites but consistently low levels of biomass at Kingman.
29

CONCLUSIONS
1) Vegetation parameters such as cover, richness, diversity, relative presence of annuals and perennials,etc. were effective in tracking the marsh restoration process. a) By September 2004 there was a significant loss of vegetation cover (~80%), species richness and diversity at Kingman Marsh from what it was in 2000. b) There was little similarity of the most prevalent species among the four study areas: Kingman, Kenilworth, Dueling Creek and Patuxent Marshes.
2) Significant vegetation loss ( especially as marked by cover and species richness) in the years following removal of fencing in the winter of 2000-2001 at Kingman Marsh where concentrations of resident Canada geese existed did not occur at the other wetlands where geese were considerably less prevalent.
3) As measured by laser level there was a significant elevation loss (2 inches) at Kingman Area 1 from 2001 through 2004. Elevation loss at Kingman Area 2 was also considerable (1.5'') over the 5-year period.
4) In context with #2, longer periods of inundation reduced the ability of wetland vegetation to rebound from grazing as seedling germination was reduced and plant growth slowed.
5) Erosion linked to grazing and subsidence led to lower than planned sediment elevations which further hindered the ability of the grazed wetlands to rebound.
6) Data from SETs at Kingman and Kenilworth Marshes documented ongoing vertical accretion in areas not subject to erosion, but no net change in elevation revealed subsidence is still occurring.
7) Data from hydrologgers revealed higher than normal water levels from greater than normal rainfall in 2003 and 2004 which further hindered revegetation processes by extending periods of inundation.
8) Observations from exclosures placed at various elevations revealed the potential for revegetation where grazing was averted and where elevations were suitable to support vegetation growth.
9) Marsh establishment and re-establishment at Kingman was severely impacted from by overabundant resident Canada geese herbivory coupled with areas of low sediment elevation.
10) Of the 7 planted species only Peltandra made important contributions to cover by 2004 at Kingman. Even in Year 1 (2000) planted species provided but 30% of the cover.
11) The reconstructed wetlands were prone to invasion by non-native species such as Phragmites and Lythrum. At Kenilworth where the NPS used herbicide treatment on Phragmites, vegetation
30

monitoring picked up a decline in cover and then determined recovery in the years following the treatment based on restored cover and species diversity.
12) There is need for some form ofresident Canada goose management to curb pressure on the local landscapes from the over-abundant geese. An EA has been drafted by USDA Wildlife Division under contract to the NPS and D.C. and is being reviewed.
13) While seed bank and seed dispersal are fully discussed in Parts III and IV, it may be noted here that areas depauparate in vegetation were likely so for reasons other than seed availability.
14) No rare or threatened plant species were identified in the reconstructed marshes.
15) While the study was designed to track process and progress in restoration of the reconstructed Kingman wetlands, the process was disrupted from severe herbivory by the over abundant resident Canada geese; comparison of progress to reference wetlands was also partially disrupted by the invasion and subsequent treatment of non-natives at Kenilworth Marsh as well as by flooding from the unexpected beaver dam at Patuxent Marsh.
REFERENCES
Baldwin, A.H. and E.F. Derico. 1999. The seed bank of a restored tidal freshwater marsh in Washington, D.C. Urban Ecosystems 3:5-20.
Baldwin, A.H., M.S. Egnotovich and E. Clark. 2001. Hydrologic Change and Vegetation of Tidal Freshwater Marshes: Field, Greenhouse, and Seed-Bank Experiments. Wetlands, Vol. 21, No. 4, pp 519-531.
Baldwin, A. 2004. Restoring Complex Vegetation in Urban Settings: The Case of Tidal Freshwater Marshes. Urban Ecosystems, 7:125-137.
Bowers, K.J. 1995. Innovations in tidal marsh restoration: the Kenilworth Marsh account. Restoration and Management Notes 13: 155-161.
Caldwell, F.A. and G. E. Crow. 1992. A Floristic and Vegetation Analysis of a Freshwater Tidal Marsh on the Merrimac River, West Newbury, Massachusetts. Rhodora, Vol. 94, No. 877 pp. 63-97.
Cahoon, D.R., J.C. Lynch, P. Hensel, R. Boumans, B. Perez, B. Segura, and J.W. Day, Jr. 2002a. High-precision measurements of Wetland Sediment Elevation: I. Recent Improvements to the Sedimentation-Erosion Table. J. of Sedimentary Research Vol. 72, No. 5: 730-733.
Cahoon, D.R., J.C. Lynch, B.C. Perez, B. Segura, R.D. Holland, C. Stelly, G. Stephenson, and P. Hensel. 2002b. High Precision Measurements of Wetland Sediment Elevation: II The ROD Surface Elevation Table. Vol. 72, No. 5, pp. 734-739.
Elmore, A. 2003. Resident Branta Canadensis Exclosure Assessment for the Jug Bay Zizania aquatica Restoration Effort. Produced for Maryland DNR
Good, R.E., D. F. Whigham, and R.L. Simpson, eds. 1978. Freshwater Wetlands: Ecological Processes and Management Potential.. Academic Press, New York. 378 p.
Hammerschlag, D., C.C. Krafft, K. Phyllaier, and M.M. Paul. 2001. First Year Annual Report (2000) for the Kingman Marsh Vegetation Monitoring Project. USGS PWRC Report at http://www.pwrc.usgs.gov/resshow/hammerschlag/anacostia.cfm Accessed 2005
31
)
)
)
)
J J )
J J J )
J )
J
J
J
J
J
J
J
J
J
J
Hammerschlag, D.,, K.P. Neff, C.C.Krafft, MM.Paul, and K.D. Brittingham. 2002. Second Year Annual Report (2001) for the Kingman Marsh Vegetation Monitoring Project. USGS PWRC Report at http://www.pwrc.usgs.gov/resshow/hammerschlag/anacostia.cfm Accessed 2005
Hammeschlag, D., A.H. Baldwin, C.C. Krafft, J.S. Hatfield, M.M. Paul and K.D.Brittingham. 2003. Year 3 (2002) Annual Reports for the Kingman Monitoring Project. USGS PWRC Report http:/ /www.pwrc.usgs.gov/resshow/hammerschlag/anacostia.cfm Accessed 2005
Hammerschlag, D., A.H. Baldwin, C.C. Krafft, M.M. Paul, K.D. Brittingham, K. Rusello and J.S. Hatfield 2004. Year 4 (2003) Annual Report for the Kingman Monitoring Project. USGS PWRC Report http://www.pwrc.usgs.gov/resshow/hammerschlag/anacostia.cfm Accessed 2005
Haramis, G. M. 2006. Invasive herbivory by resident Canada geese: the loss and restoration of wild rice along the tidal Patuxent River. Wildlife Society Bulletin In Review
Johnston, D.W. 2000. The Dyke Marsh Preserve Ecosystem. Virginia Journal of Science Vol 51, #4 pp. 223-272.
Kellogg, C.H. and S.D. Bridgham. 2002. Colonization during early succession ofrestored freshwater marshes. Canadian Journal of Botany Vol. 80 pp.176-185.
Kent, Martin and Paddy Coker. 1992. Vegetation description and analysis: a practical approach. John Wiley and Sons. New York, New York.
Kusler, J. A. and M.E. Kentula, eds. 1990. Wetland Creation and Restoration: the Status of the Science. Island Press, Washington, D.C. 594 pp.
Leck, M.A., and R.L. Simpson. 1995. Ten-year Seed Bank and Vegetation Dynamics of a Tidal Freshwater Marsh. American Journal of Botany 82(12): 1547-1557.
Leck, M.A. 2003. Seed-Bank and Vegetation Development in a Created Tidal Freshwater Wetland on the Delaware River, Trenton, New Jersey, USA. Wetlands, Vol. 23. No. 2. pp. 310-343.
Mitsch, J.M., X .. Wu, R.W. Nairn, P.E. Weihe, N. Wang, R. Deal, and C.E. Boucher. 1998. Creating and Restoring Wetlands: A Whole-ecosystem Experiment in Self-design. BioScience Vol. 48 No. 12 pp.1019-103.
Mitsch, W.J. and J. G. Gosselink .. 2000. Wetlands 3rd• ed. John Wiley and Sons, Inc. New
York, N.Y. 920 pp. Neff, K.P. 2002. Plant Colonization and Vegetation Change in a Restored Tidal Freshwater
Wetland in Washington, D.C. M.S. Thesis. University of Maryland, College Park, Md. Neff, K.P. and A.H. Baldwin. 2005. Seed Dispersal into Wetlands: Techniques and Results for a
Restored Tidal Freshwater Marsh. Wetlands, Vol. 25, No. 2. pp. 392-404. Neff, K.P., R. S. Hammerschlag and A.H. Baldwin. 2005. Relationship of Hydrology and
Edaphic Variables to Vegetation Development in Two Restored Urban Wetlands. In Review.
Odum, W.E., T.J. Smith III, J. K. Hoover and C.C. Mcivor. 1984. The Ecology of Tidal Freshwater Marshes of the United States east coast: a community profile. U.S. Fish Wild. Serv. FWS/OBS-83/17. 177 pp.
Peterson, J.E. 2004. Seedling Emergence from Seed Banks of Tidal Freshwater Wetland Response to Inundation and Sedimentation. Aquatic Botany 78: 243-254.
Pinkney, A. E., P.D. Brown, B.L. McGee, K.N. Johnson and D.L.Fisher. 2003. Contaminant Monitoring in the Kingman Lake Restored Wetland, Washington, D.C. FWS-CBFO Pub .. No.CBFO-C03-07.
32

)
)
)
)
j
)
)
j
)
J )
J )
)
J j
J
J
J )
Rusello, K. 2005. Wetland Restoration in Urban Settings: Studies of Vegetation and Seed Banks in Restored and Reference Tidal Freshwater Marshes. M.S. Thesis. University of Maryland,
CollegePark, Maryland.
SAS. 2002 through 2003. SAS/STAT Software: Changes and Enhancements Through Release 9.1. SAS Institute, Cary, N.C.
SigmaPlot 2004 for Windows Version 9.01. 2004. Systat Software Inc. Point Richmond, California.
Simpson, R.L., R.E.Good, M.A. Leck and D.F. Whigham. 1982. The Ecology of Freshwater Tidal Wetlands. BioScience 33: 255-259.
Sipple, W. S. 1990. Exploring Maryland's freshwater wetlands. Atlantic Naturalist 40:3-18 Sipple, W. S. 1999. Day's Afield. Gateway Press, Baltimore, Md. 558 pp. Smith, M.S., P.V. McCormick, J.A. Leeds, and P. B. Garrett. 2002. Restraints of Seed Bank
Species Composition and Water Depth for Restoring Vegetation in the Florida Everglades, U.S.A. Society for Ecological Restoration Vol. 10 No.I, pp. 138-145.
Syphax, S.W. and R.S. Hammerschlag. 1995. The Reconstruction of Kenilworth Marsh-The Last Tidal Marsh in Washington, D.C. Park Science 15: 16-19.
USDA, NRCS. 2006. The PLANTS Database, Version 3.5 (http://plants.usda.gov). Data LA compiled from various sources by Mark W. Skinner. National Plant Data Center, Baton Rouge,70874-4490 USA.
Whigham, D.F., J. McCormick, R.E.Good, and R.L.Simpson. 1978. Biomass and Primary Production in Freshwater Tidal Wetlands of the Middle Atlantic Coast. Pages 3-20 In R.E.Good, D.F.Whigham, and R.L.Simpson, (Eds.). Freshwater Wetlands: ecological processes and management potential. Academic Press, New York, New York.
Willis, C. and W.J. Mitsch. 1995. Effects of Hydrology and Nutrients on Seedling Emergence and Biomass of Aquatic Macrophytes from Natural and Artificial Seed Banks. Ecological Engineering 4: 65-76.
Zedler, J.B., ed. 2001. Handbook for Restoring Tidal Wetlands. CRC Press, Washington, D.C. 439 pp.
33
)
_)
J
J
j
j
ACKNOWLEDGMENTS This Report was produced in part through a five-year post-reconstruction monitoring Agreement to the USGS Patuxent Wildlife Research Center which included direct funding by the Baltimore District of the Corps of Engineers (CoE) and the District of Columbia Department of Environmental Health (D. C. DOH). Comprehensive assistance as cooperator on the project has been provided by Dr. Andy Baldwin and his graduate students, especially Kelly Phyllaier Neff, and Kristin Rusello, of the University of Maryland, College Park.
The ex closure experiment at the upper end of Kingman Marsh Area 1 was conducted in conjunction with Peter May of the University of Maryland. All the work included in these studies, some as others well beyond the initial scope, could not have been conducted without the full support received from Claire O'Neill who was the CoE Project Manager. Strong encouragement, project review and abundant field support has been contributed by Steven Pugh and Kevin Luebke of the CoE and Pete Hill ofD.C. DOH. Steven Pugh deserves special recognition for his unending energetic role in supporting and promoting our studies, as well as many other works in the Anacostia watershed. Vital support and approved permits have been received from Stephen Syphax and Susan Rudy as the land managers from the National Park Service, National Capital Parks East. We would also acknowledge the efforts of Steven McKindley Ward of the Anacostia Watershed Society who cooperated with us in the placement of his planting ex closures and provided insights to the workings of the marsh. Lastly, but far from least, must be recognized the good works and efforts of the USGS staff: Cairn Krafft - my noble assistant and critic through all of this, Mary Paul, Kevin Brittingham, Jeff Hatfield, Jim Lynch and Reggie Graves. Special acknowledgment should go to Kinard Boone for his professional contribution in converting photographs and digital images into high quality products used in the support of the study and this report.
34

\...., '- \...., \...., '- '- \,_.. '- '--· '- \_,, \_,, '-..,. uu uuu JJJ...)JJJ.J
35
Photograph 3. Benning Road Bridge 1927 across Anacostia River with dredged portion downstream (right side) and still intact freshwater tidal wetlands upstream (left side of photograph). Note complete conversion of wetlands to fastland and tidal water below Benning Road.
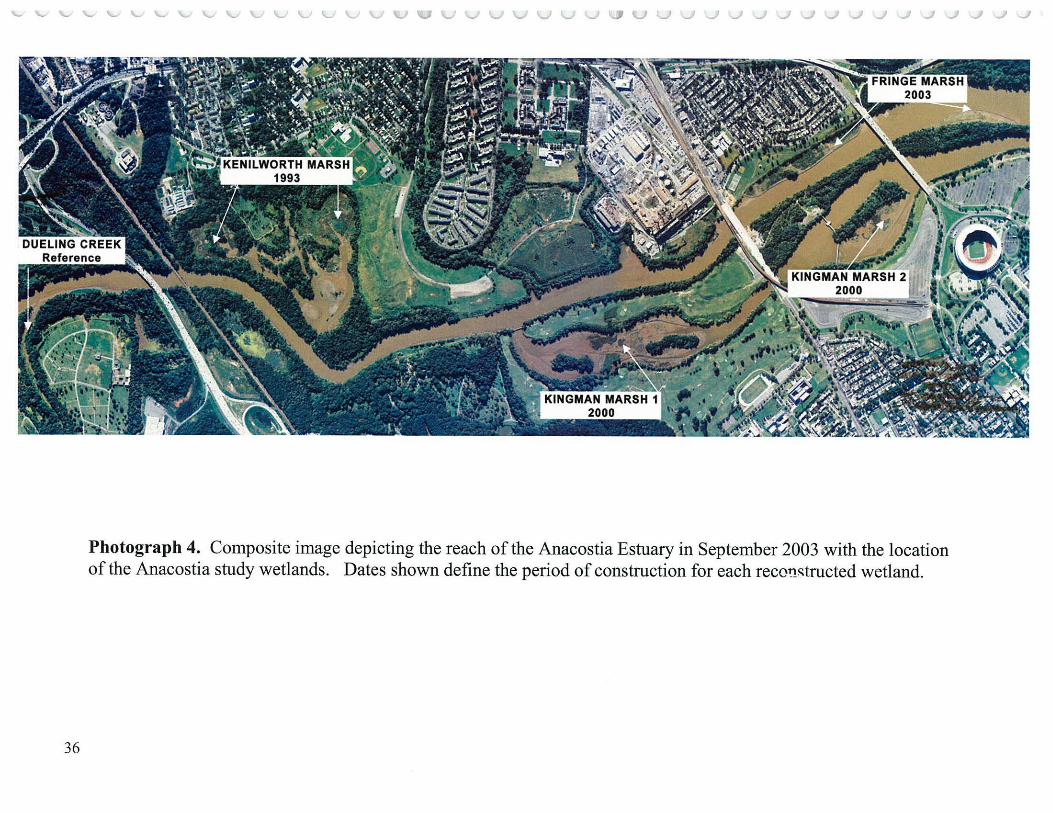
36
Photograph 4. Composite image depicting the reach of the Anacostia Estuary in September 2003 with the location of the Anacostia study wetlands. Dates shown define the period of construction for each rec01J.~tructed wetland.

37
Photograph 5. Photograph of Patuxent Marsh study area on either side of Route 4 Bridge which crosses the Patuxent River

38
UVVVVVVVV~UVVVVvVVVvvJJJ~~
Photograph 6. USGS/University of Maryland exclosure plots (2002) at low tide. Corresponding unexclosed plots surround the fenced exclosure area.
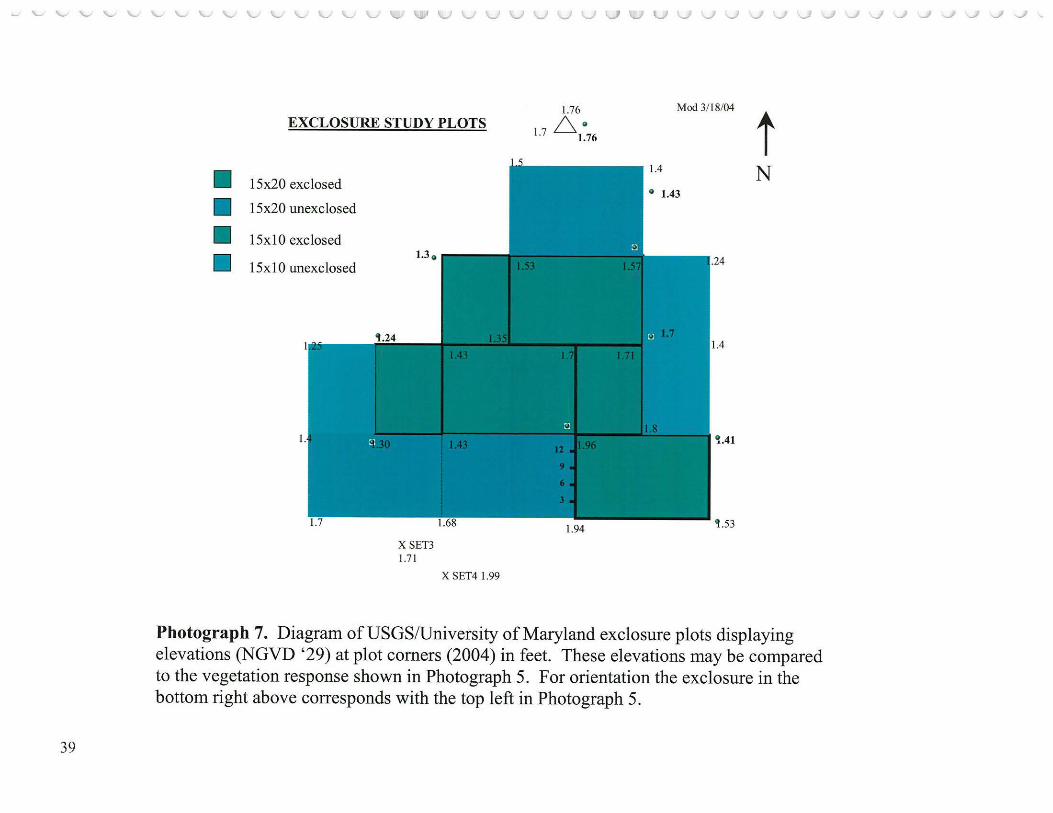
39
■ ■ ■ ■
~VVVVVVVV~UVVVVVVJJJVJJJJJ
EXCLOSURESTUDYPLOTS
15x20 exclosed
15x20 unexclosed
15xl0 exclosed
15x 10 unexclosed
I.
X SET3 1.7 1
X SET4 1.99
1.76 Mod 3/ 18/04
D,_ O t 1.7 1.76
N
.24
1.4
't.41
'l.53
Photograph 7. Diagram ofUSGS/University of Maryland exclosure plots displaying elevations (NGVD '29) at plot corners (2004) in feet. These elevations may be compared to the vegetation response shown in Photograph 5. For orientation the exclosure in the bottom right above corresponds with the top left in Photograph 5.

40
U'VVVV VVVVVVVVVVVVVJVJJVJJ.
Photograph 8. USGS/ University of Maryland exclosure plots displaying protection of volunteer vegetation within fencing but lack of any vegetation outside exclosures (unexclosed plots). The exclosure plot to the right is the same as diagrammed in the bottom right of Photograph 6.
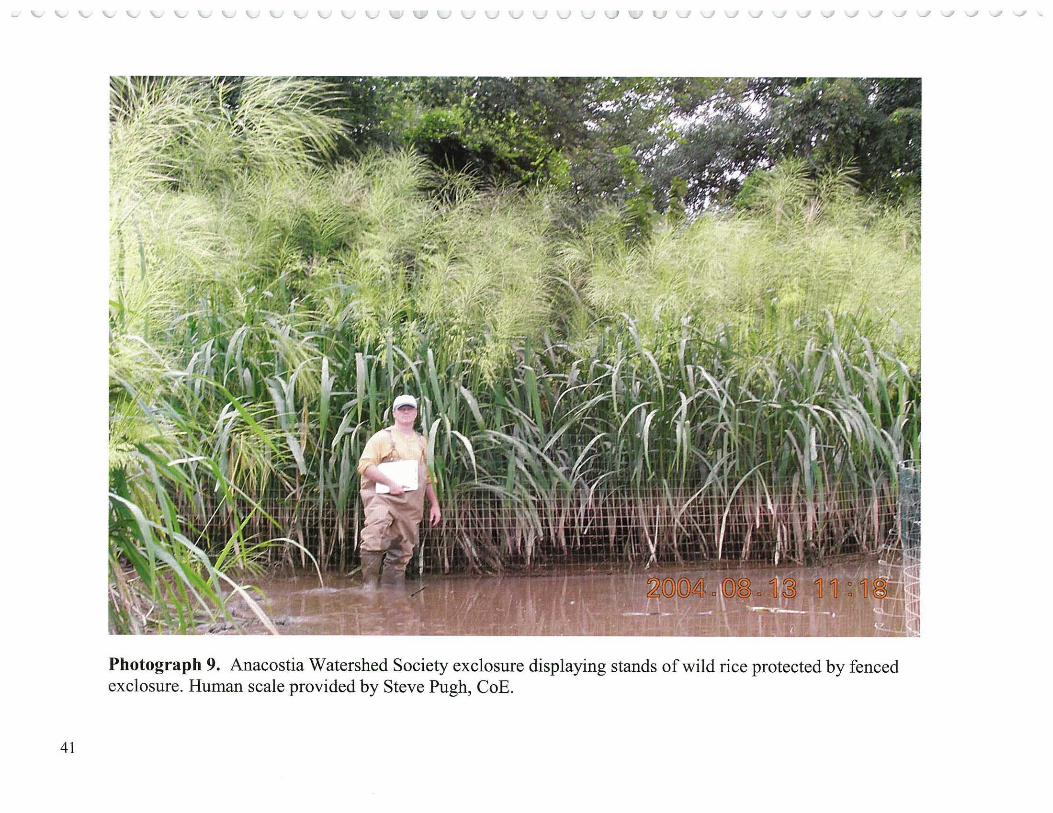
41
Photograph 9. Anacostia Watershed Society exclosure displaying stands of wild rice protected by fenced exclosure. Human scale provided by Steve Pugh, CoE.

42
10 20 MlES
10 20 KlOMETEAS
Map 1. Chesapeake Bay area map depicting location of the Anacostia watershed. The Anacostia wetland study sites occur in the shaded tidal watershed area within Washington, D.C. The Patuxent Marsh study site lies along the Patuxent River east of Washington, D.C.
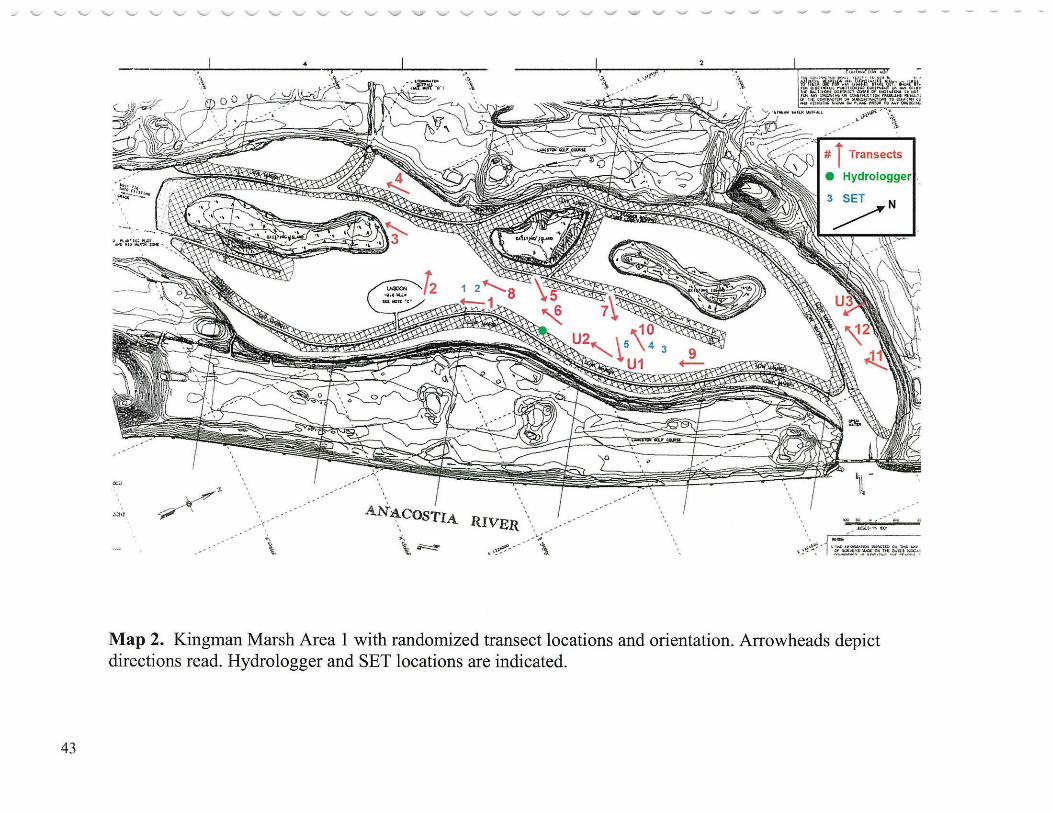
43
. , :.:;; ;:1 ·-~~""' . '
A.N ~COSTIA. RIVER \
,•!'~--- - - \ ..
# T Transects
• Hydrologger ..
--O , ' 100
~l•l"o CO'
Map 2. Kingman Marsh Area 1 with randomized transect locations and orientation. Arrowheads depict directions read. Hydrologger and SET locations are indicated.

44
' -, East ·. Capitol
'- Street--- ----'. .. - - -- - --
- \ Bridge I
I I I
I
I I
'IJ,/V VVVVV
' ' I
I
Heritage lsl~nd
VUVVVVVVVVVJJJJJJJ
---
\
\
# j Transects
• Hydrologger
\ ---.>..----- - -- - - - / Footbridge
/
Map 3. Kingman Marsh Area 2 with randomized transect and hydrologger locations. Arrowheads depict the directions the transects were read.
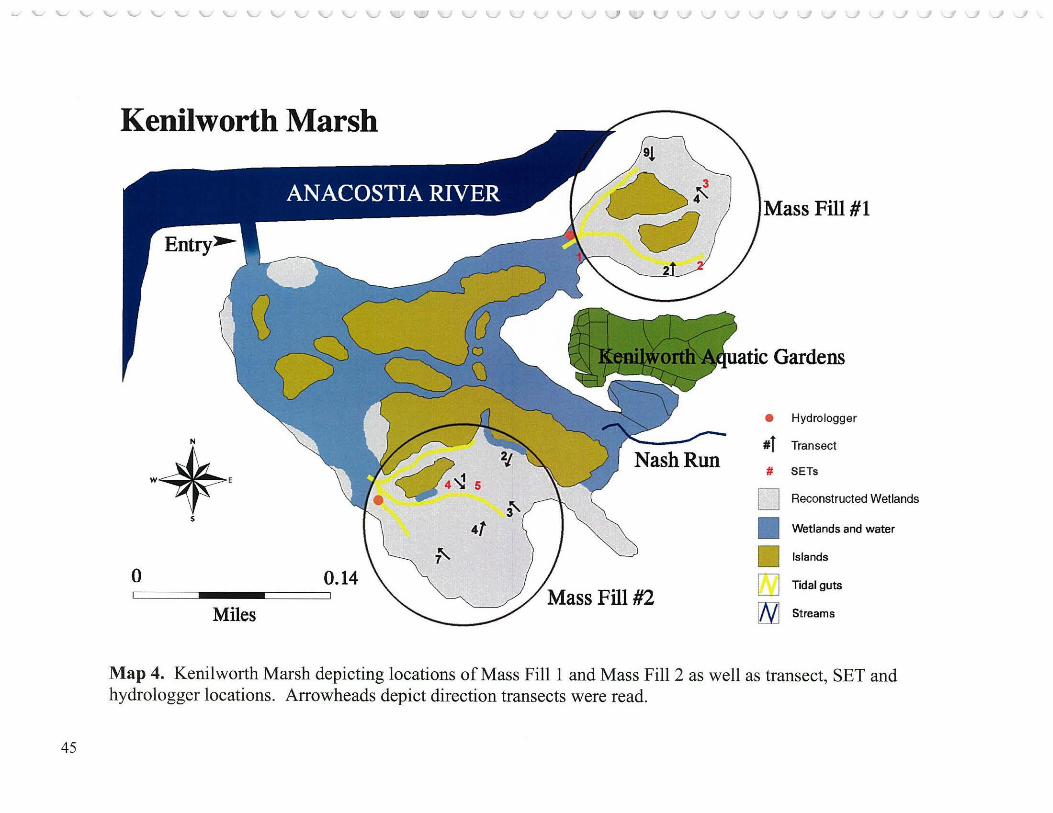
45
Kenilworth Marsh
Mass Fill#l
• Hydro logger
N #f Transect
·♦· 4 -._J 5 # SETs
□ Reconstructed Wetlands
s 4f ■ Wetlands and water
7' Islands
0 0.14 □ Tidal guts
Miles WJ Streams
Map 4. Kenilworth Marsh depicting locations of Mass Fill 1 and Mass Fill 2 as well as transect, SET and hydrologger locations. Arrowheads depict direction transects were read.

46
'UIV VVV
Dueling Creek Marsh
Patuxent Marsh
,.._ (l) >
ii: ro
"_;j Vl 0 u ro C
<t:
VVV~VVVVvVVVJJJJJJJJ
#I Transect
• Hydrologger
Marsh
tN Notto scale
Route 4
Map 5. Sketch map locations of transects and hydro loggers at Dueling creek and Patuxent Marshes, the unreconstructed reference wetlands.

~LLLLLLLLLLLLLL~GUL~~L~~~JUU~~~~~~~~~~~~~~~
Table 1. Repeated measures analysis of variance table for vegetative parameters. Analyses were conducted on July and September data for all areas for the five-year period 2000 through 2004. Significance noted as* (<0.05); ** (<0.01); *** (<0.001); **** (<0.0001). Expression written: Fvalue (Numerator df, Denominator df).
Areax Area Year Area x Year Month(Year) Month(Year)
Cover 15.18****(5,27.88) 5.93***(4,82.97) 3. 70****(20,95. 72) 4.87***(5,82.92) 3.69****(25,98.06) Species Richness 2.83*(5,27 .87) 71.45****(4, 101.60) 20.02****(20,98.95) 1.94(5, 101.49) 2.39**(25, 101.4 7)
Diversity 4.49**(5,27 .56) 48.45****(4,88.11) 15.27****(20,93.83) 2 .. 70*(5,89.10) 1. 79*(25,96.02)
Annuals 11.19****(5,30.52) 18.05****(4,255.64) 12.83****(20,255.20) 3.02*(5,255.62) 0.93(25,255.12)
Perennials 6.32***(5,29.54) 1.53(4,98.59) 3.87****(20,91.58) 4.22**(5,98.55) 3.21 ****(25,93.71)
Exotics 1.23(5,30.45) 0.0.20(4,254.54) 2.40***(20,254.22) 1. 75(5,254.52) 1.78*(25,254.18)
47
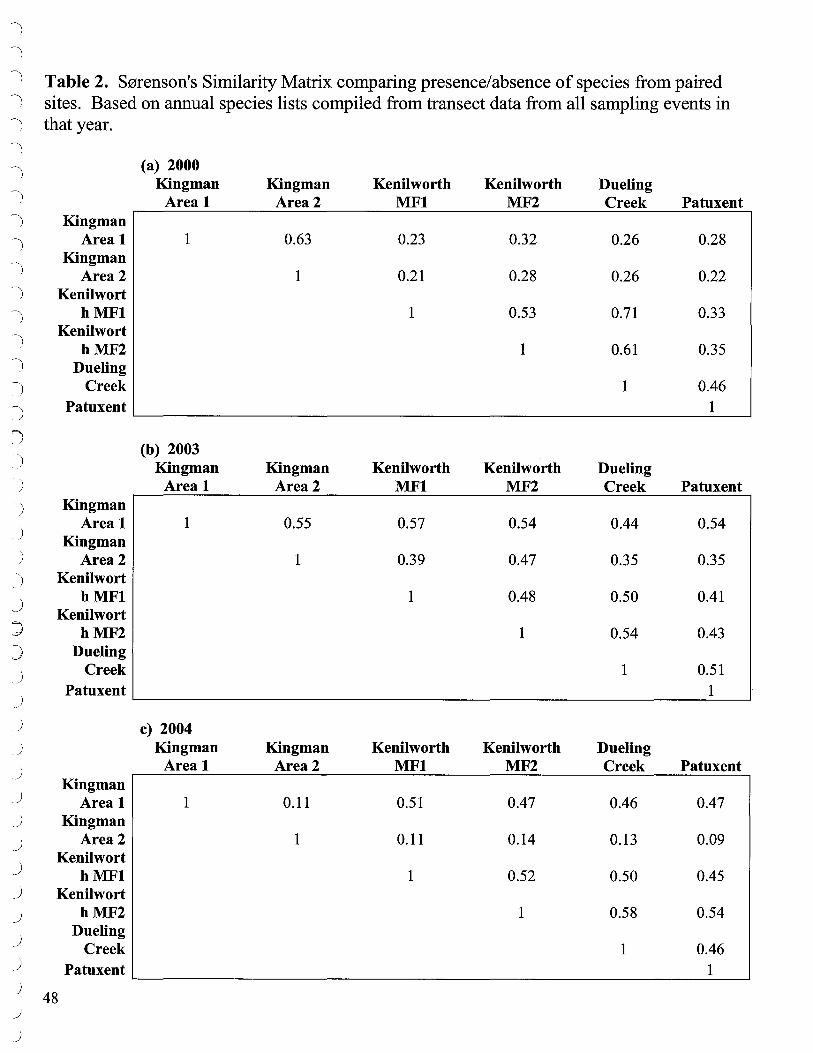
)
)
) Table 2. S0renson's Similarity Matrix comparing presence/absence of species from paired ) sites. Based on annual species lists compiled from transect data from all sampling events in ) that year. )
) (a) 2000 Kingman Kingman Kenilworth Kenilworth Dueling
) Area 1 Area2 MFl MF2 Creek Patuxent ) Kingman
) Area 1 1 0.63 0.23 0.32 0.26 0.28
~) Kingman Area2 1 0.21 0.28 0.26 0.22
-) Kenilwort ) hMFl 1 0.53 0.71 0.33
) Kenilwort
hMF2 1 0.61 0.35 --) Dueling ) Creek 1 0.46
:-) Patuxent 1
'; (b) 2003
) Kingman Kingman Kenilworth Kenilworth Dueling ) Area 1 Area2 MFl MF2 Creek Patuxent ) Kingman
) Area 1 1 0.55 0.57 0.54 0.44 0.54
Kingman ) Area2 1 0.39 0.47 0.35 0.35 ) Kenilwort
_) hMFl 1 0.48 0.50 0.41 Kenilwort
J hMF2 1 0.54 0.43 ) Dueling
_) Creek 1 0.51
_) Patuxent 1
) c) 2004 ) Kingman Kingman Kenilworth Kenilworth Dueling
) Area 1 Area2 MFl MF2 Creek Patuxent Kingman
_) Area 1 1 0.11 0.51 0.47 0.46 0.47 _) Kingman _) Area2 1 0.11 0.14 0.13 0.09
Kenilwort _) hMFl 1 0.52 0.50 0.45 _) Kenilwort _) hMF2 1 0.58 0.54
J Dueling
Creek 1 0.46 J Patuxent 1 J
48 J )

Table 3. Change in average sediment elevations of transects at Kingman Marsh Area 1 and 2 from 2001 to 2004 as determined using a laser level tied to CoE benchmarks. Elevations are NGVD '29 datum, that is elevations are relative to sea level mean for the years near 1929. Almost all transects lost elevation.
Transect# Elevation Elevation Sediment Elevation 2001 2004 Change
Kingman Area 1 feet feet Feet Cm planted 1 1.51 1.11 -0.40 -12.2
2 1.37 1.15 -0.22 - 6.7 3 1.53 1.53 0.00 -0.0 4 1.93 1.73 -0.20 -6.1 5 1.89 1.67 -0.22 -6.7 6 2.18 2.04 -0.14 -4.3 7 1.86 1.68 -0.18 -5.5 8 1.82 1.76 -0.06 -1.8 9 1.57 1.47 -0.10 -3.1 10 2.02 2.05 +0.03 +0.9 11 1.82 1.66 -0.16 -4.9
unplanted 1 2.25 2.14 -0.11 -3.4 2 2.16 1.88 -0.28 -8.5 3 1.53 1.40 -0.13 -4.0
Kin2man area 2 planted 1 1.97 1.80 -0.17 -5.2
2 1.87 1.87 0.00 -0.0 3 1.64 1.48 -0.16 -4.9
49

)
"')
)
j
; j
')
j
)
)
J
.)
.)
)
)
J )
.)
)
.)
)
)
)
)
160 ~----------------------~
--
140
120
100
~ 80 ... Q)
~ 60 u
40
20
0
1 (a) Differences between years within areas and months.
C B
-20 ~----.------.----,-----,--,---.-----,----,---------,------,--
~ 0 -... Q) > 0 u
• Kingman Area 1 -:::>-- Kingman Area 2
160 ~------------------------i ---.--1(b) Differences between areas within a sampling event.
Kenilworth Mass Fill 1 Kenilworth Mass Fill 2
140
120
100
80
60 a
40
20
0
Time
- - - Dueling Creek (Ref) - ~ - Patuxent Marsh (Ref)
a ab a ab
b ab
Figure 1. Total vegetative cover. Data points represent least squares means± SE. Labels are based on Tukey test results (family-wise error rate a = 0.05). Within areas (Fig. l a), monthly means sharing the same upper-case letters are not significantly different from year to year within the same month. Within a sampling event (Fig. 1 b ), means sharing the same lowercase letters are not significantly different Unlabeled series have no significant differences .
50
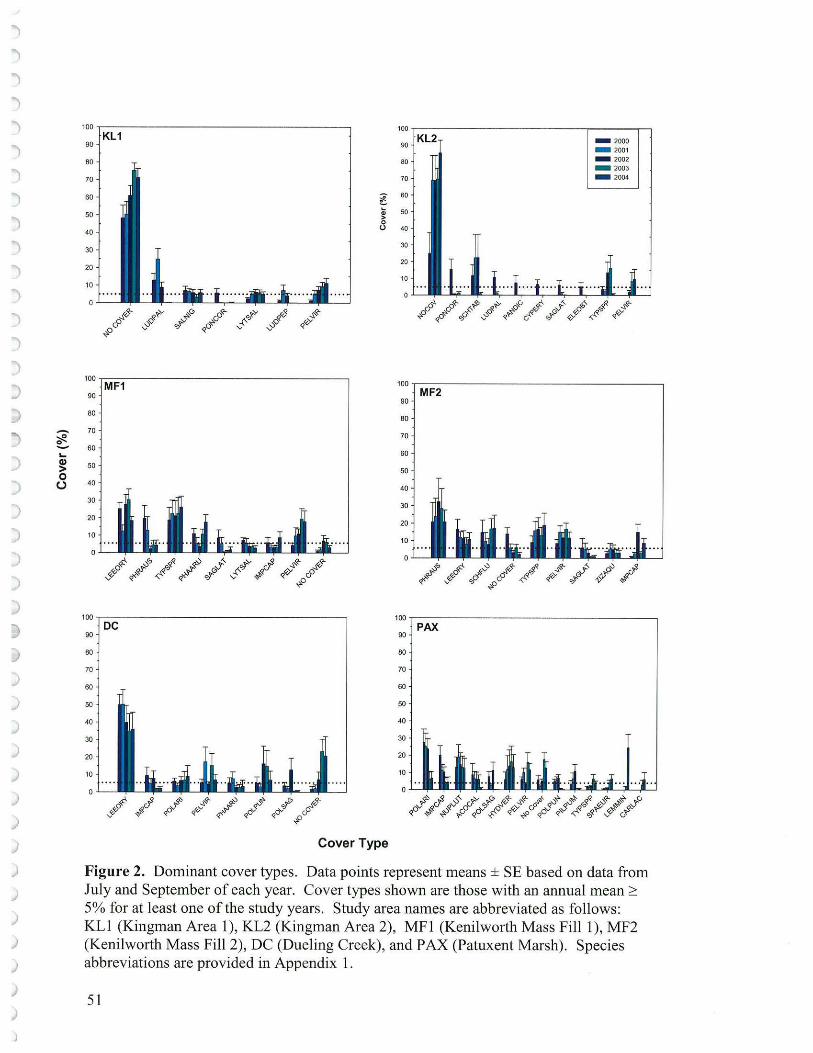
"")
"')
j
")
j
j
")
"')
)
')
j
")
')
')
)
)
j
)
)
)
)
,)
)
)
)
)
)
)
,)
)
)
)
)
)
~ ~ ... ~ 0
(.J
100
KL1 90
80
70
60 ~ ~ .. > 50 0
40 u
30
20
10
0
1<,'<- !Ii" ~0 o'<- ~ r!} .,,~ 0.:. ,§) c,i" -.!'G -00 ~ !<,'-
OG v ,:P 'v .y <I -<'
100 MF1
90
80
70
60
50
40
30
20
10
0
§!- ..:,<o !l<I #"" ,f- ct' ,;? .,,~ ,,,_<,,'<-,,,,,,o ~<if' -<:'q<o K" .,..0 -0 ~f' q<v" c,O
V q q ~ 'v "\ ~o
100 DC
90
80
70
60
50
40
30
20
10
0
!F' c,,;i f ..,,~ ;-" ~" ,,.0 ,.<v'<-!vo ~ qO !<," 0" c,O
""' 'I 'I~ q& 'I "o
Cover Type
100
KL2 90 - 2000
- 2001
80 - 2002 - 2003
70 - 2004
60
50
40
30
20
10
100 MF2
90
80
70
60
50
40
30
20
10
0
!ti'""" o<f ~v" r,,'<- ~'I ..,,~,f & ;i "' -<:'q'<i <1"'" <:, ... (j f;1J' ~<P 'I~ ..,<ff c,~ c,O
<;; "o
100,--------- ---------
90
70
60
50
40
30
PAX
Figure 2. Dominant cover types. Data points represent means ± SE based on data from July and September of each year. Cover types shown are those with an annual mean~ 5% for at least one of the study years. Study area names are abbreviated as follows: KLI (Kingman Area 1), KL2 (Kingman Area 2), MFl (Kenilworth Mass Fill 1), MF2 (Kenilworth Mass Fill 2), DC (Dueling Creek), and PAX (Patuxent Marsh). Species abbreviations are provided in Appendix 1.
51

)
"')
"')
)
)
)
j
")
")
j
"')
j
J
' '.)
'.)
~
)
)
;> )
)
)
)
)
)
)
,)
.)
.)
)
)
)
)
)
)
20 --,------------------ --------, 1 (a) Differences between years within areas and months. --... 0 ...
(.) Q) 15 II)
"' E It') ... Q) 10 -3: II) Q)
·u Q) Q. 5 II)
0 ... Q) .c E 0
::I z
Kingman Area 1 -:>--- Kingman Area 2
20 --,-----------------------, Kenilworth Mass Fill 1
It')
li; 10 -3: II) Q)
·u Q) Q. II)
0 ... Q) .c E ::I z
5
0
1(b) Differences between areas within a sampling event. ~ Kenilworth Mass Fill 2
- - - Dueling Creek (Ref) - -o - Patuxent Marsh (Ref)
a
Time
Figure 3. Species richness. Data points represent least squares means ± SE. Labels are based on Tukey test results (family-wise error rate a = 0.05). None of the areas exhibited significant differences between years for the same months. Within a sampling event (Fig. lb), means sharing the same lower-case letters are not significantly different. Unlabeled series have no significant differences.
52
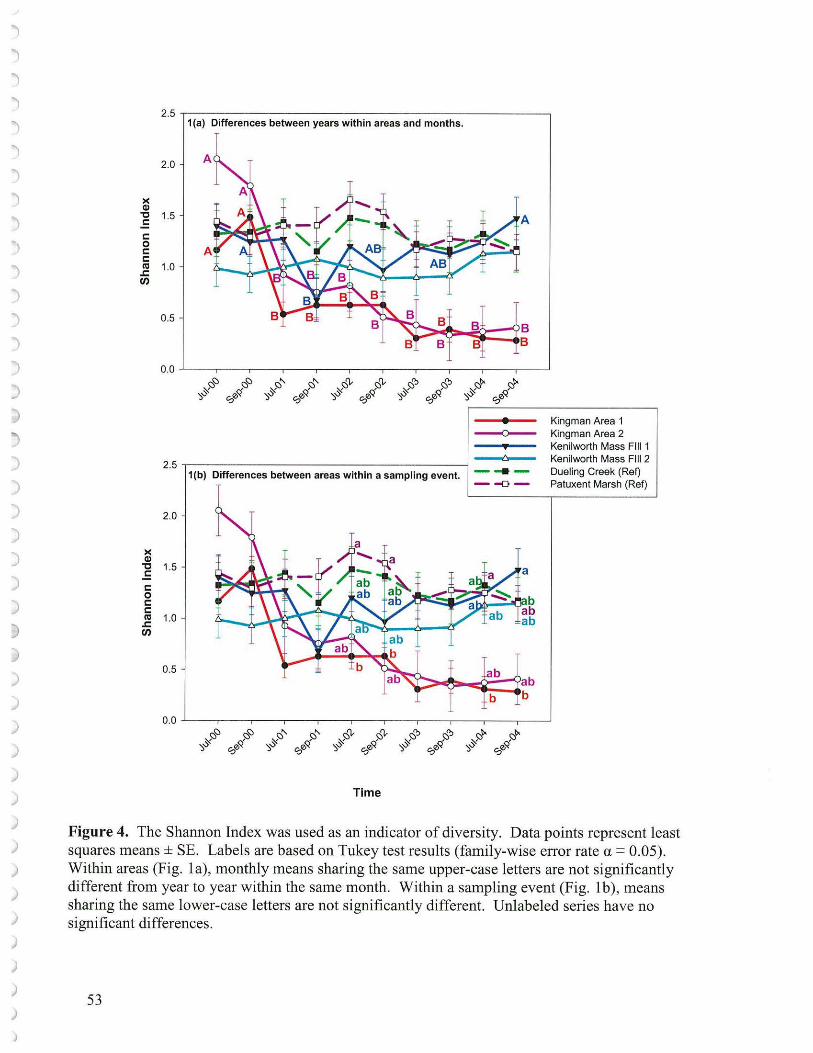
")
"')
j
")
")
; ")
")
")
)
)
)
)
)
)
)
;,)
)
)
)
)
)
)
)
)
)
)
)
)
)
)
)
)
>< Cl) "C = C: 0 C: C: co .c: en
>< Cl) "C = C: 0 C: C: co .c: en
2.5 -.------------------------~ 1 {a) Differences between years within areas and months.
2.0
1.5
A 1.0
0.5
0.0 ~---r-----r-----r------.----.----,--,---.,..---.------.---~
---0--
2·5 -,--1(-b)- Di-ff-er-e-nc_e_s_b-etw-e-en_ a_r-ea_s_w-it-h-in_a_s_a_m_p_lin_g_e_v-en-t-----i. - - -- -o -
2.0
1.5
1.0
0.5
Kingman Area 1 Kingman Area 2 Kenilworth Mass FIii 1 Kenilworth Mass FIii 2 Dueling Creek (Ref) Patuxent Marsh (Ref)
0.0 ~---.-----r-----r-----r-----r---.----,--,--- .---.---~
Time
Figure 4. The Shannon Index was used as an indicator of diversity. Data points represent least squares means ± SE. Labels are based on Tukey test results (family-wise error rate a = 0.05). Within areas (Fig. la), monthly means sharing the same upper-case letters are not significantly different from year to year within the same month. Within a sampling event (Fig. lb), means sharing the same lower-case letters are not significantly different. Unlabeled series have no significant differences.
53
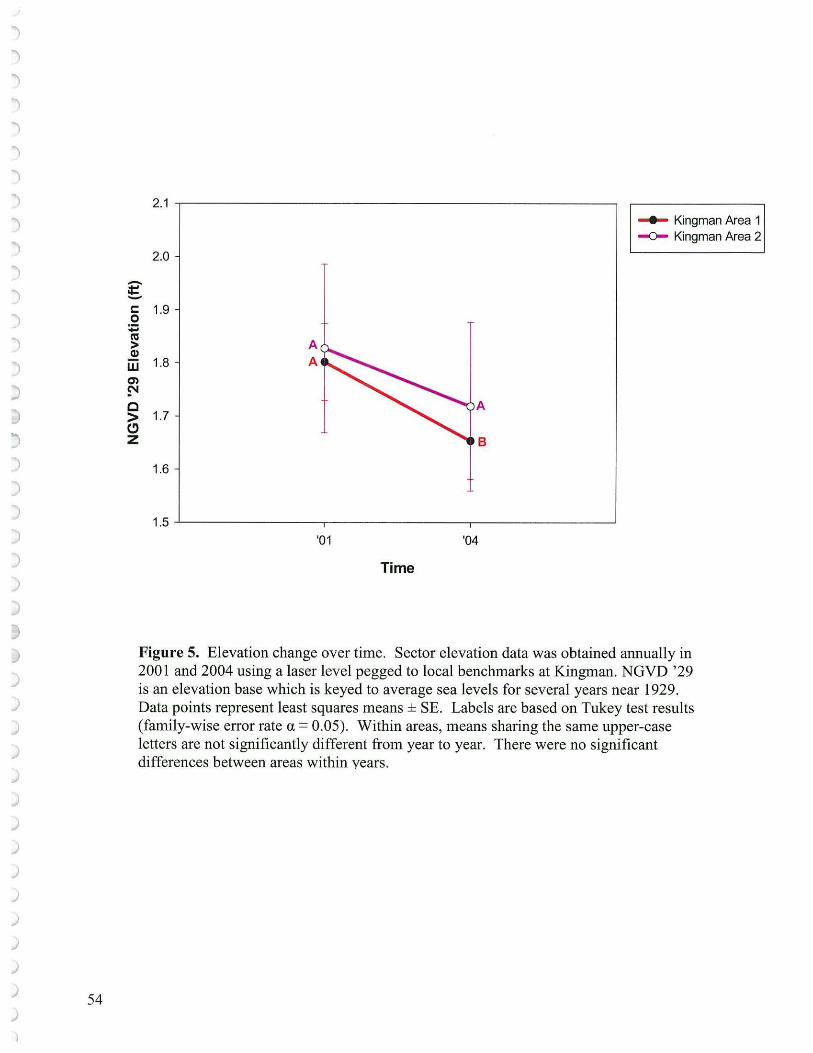
J j
j
j
")
')
")
)
')
'j
')
......
")
J
J ::,
)
J )
J )
.)
)
)
J
.)
)
)
)
)
) 54
2.1
..... Kingman Area 1 -:::>- Kingman Area 2
2.0
--= -C: 0
1.9
:.:; c,, > A ~ 1.8 A w a, ~ C A > 1.7 C) z B
1.6
1.5 ~---------.----- - ----r--------~
'01 '04
Time
Figure 5. Elevation change over time. Sector elevation data was obtained annually in 2001 and 2004 using a laser level pegged to local benchmarks at Kingman. NGVD '29 is an elevation base which is keyed to average sea levels for several years near 1929. Data points represent least squares means ± SE. Labels are based on Tukey test results (family-wise error rate a = 0.05). Within areas, means sharing the same upper-case letters are not significantly different from year to year. There were no significant differences between areas within years.

Inundation 0.5
a
- All transects ab 1 /·'""· 1 Without transect 5
0.4
--"O Cl)
"O 0 0
t:j:: 0.3 Cl)
E :p
-;::R_ 0 .._,,., C 0 0.2 :p co
"O C :::J C
0.1
0.0 ..,__ __
KL1 KL2 MF1 MF2 DC PAX Area
Figure 6. Percent time inundated for each wetland area. Values are means ± SE. Labels are based on Tukey test results (family-wise error rate a= 0.05). Means sharing the same letter are not significantly different. Data is derived from hydro loggers operating in 2001. Areas are abbreviated as follows: KLI (Kingman Area 1), KL2 (Kingman Area 2), MFI (Kenilworth Mass Fill 1 ), MF2 (Kenilworth Mass Fill 2), DC (Dueling Creek), and PAX (Patuxent Marsh). From K. P. Neffs Masters Thesis, 2002. University of Maryland
55

120
100
80
C
... Q)
8 60
~ '-' r/l 2 .E 40 O') ro ... J: 0.
20
1.00 1.25
Phragmites versus Elevation
1.50
♦
□
□ 'f
1.75 2.00 2.25
□
□ □
□
[D
♦
□
□
□
2.50
Elevation (feet above NGVD)
□ ♦
♦
♦
♦♦
♦ ♦
2.75
♦ ♦ ♦
♦
3.00
,. KL 1 1::. KL2 ♦ MF1 □ MF2
3.25
Figure 7. Relationship of per cent cover of Phragmites australis to elevations at Kingman and Kenilworth Marshes. NGVD '29 is an elevation base which is keyed to average sea levels for several years near 1929. Areas are abbreviated as follows: KLl (Kingman Area 1), KL2 (Kingman Area 2), MFl (Kenilworth Mass Fill 1), MF2 (Kenilworth Mass Fill 2), DC (Dueling Creek), and PAX (Patuxent Marsh). From K. P. Neff Master's Thesis, 2002. University of Maryland)
56
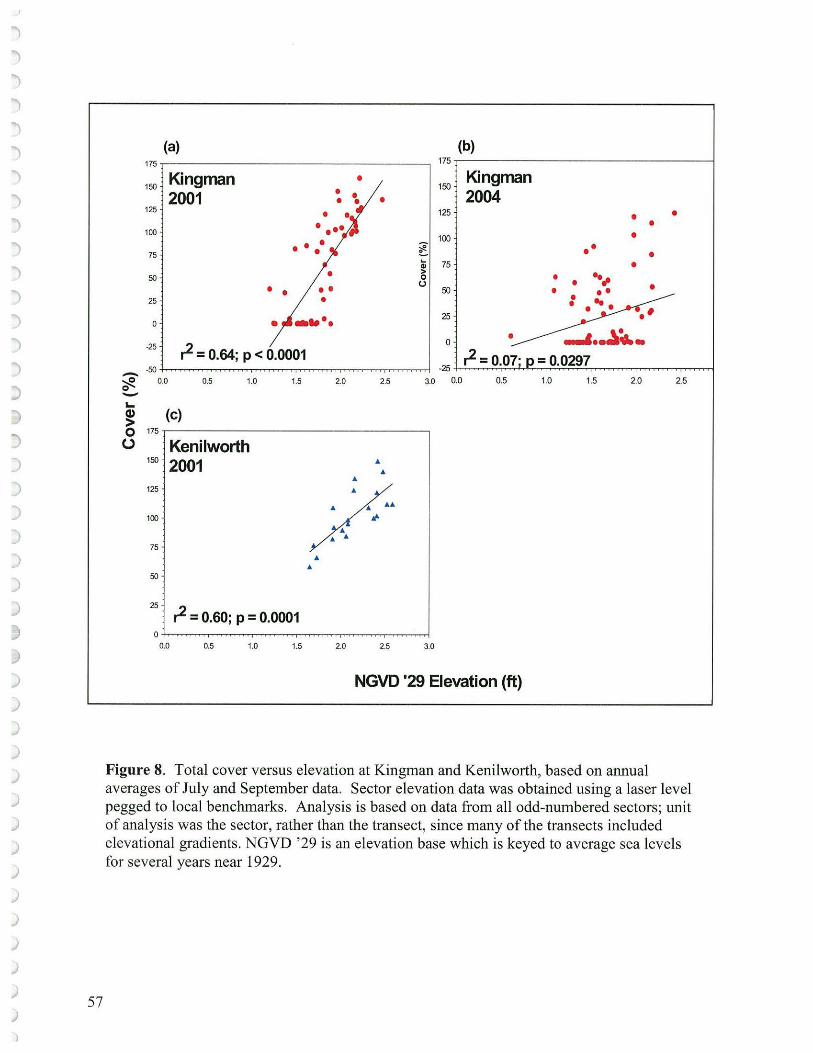
}
}
j
j
j
")
)
")
")
")
")
j
'.)
')
)
)
)
)
)
J J )
)
)
)
)
)
)
)
)
57
(a) (b) 175 175
Kingman • Kingman 150 150
2001 • 2004 • • 125 125
100 100 • • l 75 • •
Qi 75
• > 50 0
u • • • • 50 25 • ..... 25 0 •
-25 r2 = 0.64; p < 0.0001 0
r2 = 0.07· -50 -25
0.0 0.5 1.0 1.5 2.0 2.5 3.0 0.0 0.5
I..
~ (c) 0 175~--------------~
(.) Kenilworth 150 2001 125
100
75
50
25 ? , = 0.60; p = 0.0001
0.0 0.5 1.0 1.5 2.0 2.5 3.0
NGVD '29 Elevation (ft)
• • • •
•• • • • • • • • •
...... ~"--=0.0297 1.0 1.5 2.0 2.5
Figure 8. Total cover versus elevation at Kingman and Kenilworth, based on annual averages of July and September data. Sector elevation data was obtained using a laser level pegged to local benchmarks. Analysis is based on data from all odd-numbered sectors; unit of analysis was the sector, rather than the transect, since many of the transects included elevational gradients. NGVD '29 is an elevation base which is keyed to average sea levels for several years near 1929.

j
")
")
j
")
; ")
")
')
")
")
")
")
")
)
)
)
)
)
)
)
:>
" )
)
)
)
)
,)
)
)
)
)
)
)
)
) 58
)
(a) 20~--------------~
Kingman 15 2001
10
-I.. 5 0 .... CJ
~ 0
• , ... , • • • •• • I . .., .
• ... • • ! ' ,__._ .
•
.. , • • . , • •
•
(b) 20
Kingman 15 2004
• 10
• 5
• I 0
"Cl) r2 = 0.62; p < 0.0001 r2 = 0.32; p < 0.0001
C. -en 1.0 1.5
,g? CJ Cl) C.
2.0 2.5 0.5 1.0
en (c) 0 20~- - ------------~ i.. Kenilworth -8 2001 E 15 :::::s z
10
5
1.5
.. .. ..
.. ... ..
... 4
2.0
.. .. .. .. .... ..
..
.. ..
..
2.5
.. ..
r2 = 0.01 ; p = 0.6753
3.0
NGVD '29 Elevation (ft)
1.5 2.0 2.5
Figure 9. Richness versus elevation at Kingman and Kenilworth, based on annual averages of July and September data. Sector elevation data was obtained using a laser level pegged to local benchmarks. Analysis is based on data from all odd-numbered sectors; unit of analysis was the sector, rather than the transect, since many of the transects included elevational gradients. NGVD '29 is an elevation base which is keyed to average sea levels for several years near 1929.

'")
j
j
j
j
j
)
")
")
")
")
j
')
')
)
:,
)
)
)
)
)
)
)
)
)
)
)
,)
)
)
)
80 _._ Kingman Area 1 Planted -0- Kingman Area 1 Unplanted _. Kingman Area 2 Planted
60 A
~ 40 ~ ... Cl)
> 0
(.) 20
0
Time
Figure 10. Cover contributed by planted species. Data points represent least squares means ± SE. Labels are based on Tu.key test results (family-wise error rate a = 0.05). Within areas, means sharing the same upper-case letters are not significantly different from year to year. Series lacking labels had no significant differences between years for the same months. There were no significant differences between areas within sampling events.
59
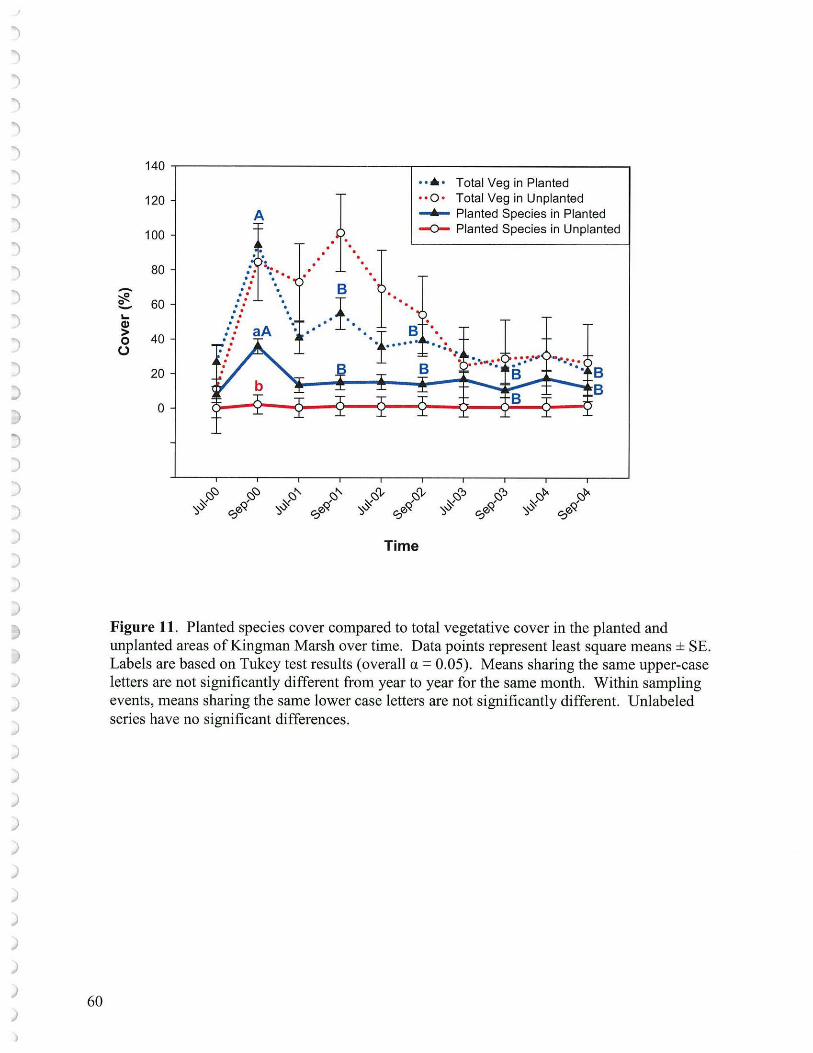
")
)
")
j
j
")
")
")
")
")
")
")
j
)
)
:)
)
)
)
)
~ )
)
)
)
.)
.)
)
)
)
)
)
)
)
)
) 60
~ 0 -... g? 0
(.)
140 .--------- ------,--------------,
120
100
80
60
40
20
0
A
-~---. . .. . . . . . . . . . . . . . . . . . . . . . . . . . . . . . . .. . :
.. • • Total Veg in Planted ••O • Total Veg in Unplanted _.,_ Planted Species in Planted -0- Planted Species in Unplanted
Time
B B
Figure 11. Planted species cover compared to total vegetative cover in the planted and unplanted areas of Kingman Marsh over time. Data points represent least square means ± SE. Labels are based on Tukey test results ( overall a = 0.05). Means sharing the same upper-case letters are not significantly different from year to year for the same month. Within sampling events, means sharing the same lower case letters are not significantly different. Unlabeled series have no significant differences.

)
)
)
)
)
~
D )
)
)
)
J )
)
)
)
)
)
)
)
) 61
)
25 --------------~
20 a) Peltandra virginica •
15
~ 10
~
~ ., > 0 0
-5
-10
30 ,---- ------------, b) Schoen p lr tus tabernaemontani •
25 f • A
20
15
10
-5
30
25
20
15
10
-5
c) Pontedaria corda ta ,A
B B ~ B
I f
30 ,---------------
25
20
d) Sagittaria latifolia
Time
30,-------------------, e) Nuphar lutea •
"
f) Juncus effusus
20
l ~ ,o ., > 0 0
30 ,----------------,
25
20
f 15 ., ~ 10 0
g) Schoenop/ectus pungens
y-::;:--,,,
Time
-- Kingman Area 1 Planted -o-- Kingman Area 1 Unplanted - Kingman Area 2 Planted
Figu re 10. Cover by species planted and replanted• at Kin11 man.
Figure 12. Cover by species planted and replanted at Kingman. Data points represent least squares means± SE. Labels are based on Tukey test results (family-wise error rate a= 0.05). Within areas, means sharing the same upper-case letters are not significantly different from year to year within the same month Within a sampling event, means sharing the same lowercase letters are not significantly different. Unlabeled series have no significant differences.
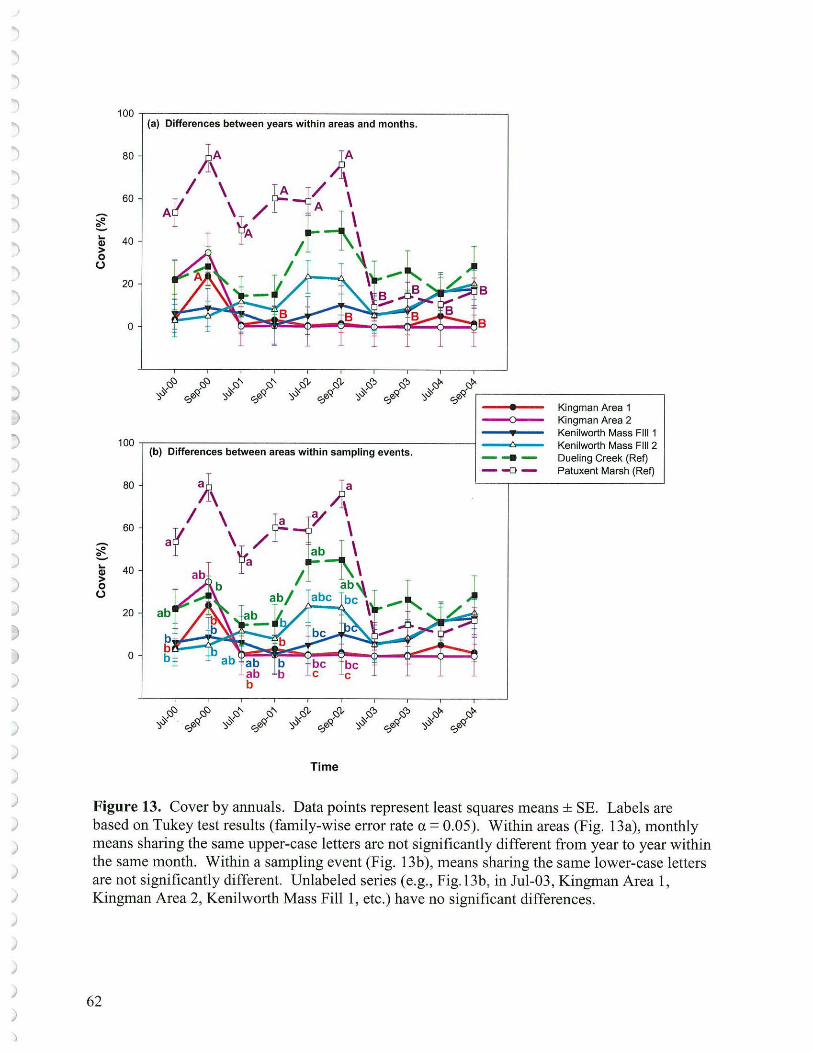
"')
i ")
'")
j
j
')
")
')
')
")
')
')
')
)
:,
)
)
)
)
)
)
)
)
)
)
)
)
)
)
)
)
100 ~------- - -------------(a) Differences between years within areas and months.
80
60
40
20
0
':x<:::,<:::, s::,<:::, -:xr:::," s::,'- ':xr:::,'l- s::,'l- ':xr:::,":> s::,":> ':x~ cl" ·f> c::?<:[ -:,-S 0q,<:f -:,-S 0q,<:f -:,-S 0q,<:f -:,-S 0q,<:f ,--------------,
Kingman Area 1 Kingman Area 2 Kenilworth Mass FIii 1 Kenilworth Mass FIii 2 Dueling Creek (Ref) Patuxent Marsh (Ref)
-0---
100 .-----------------------1 - ~ -(b) Differences between areas within sampling events.
80
60
40
20
0
ab
b b b
---- -o -
Time
Figure 13. Cover by annuals. Data points represent least squares means ± SE. Labels are based on Tukey test results (family-wise error rate a = 0.05). Within areas (Fig. 13a), monthly means sharing the same upper-case letters are not significantly different from year to year within the same month. Within a sampling event (Fig. 13b), means sharing the same lower-case letters are not significantly different. Unlabeled series (e.g., Fig.13b, in Jul-03, Kingman Area 1, Kingman Area 2, Kenilworth Mass Fill 1, etc.) have no significant differences.
62
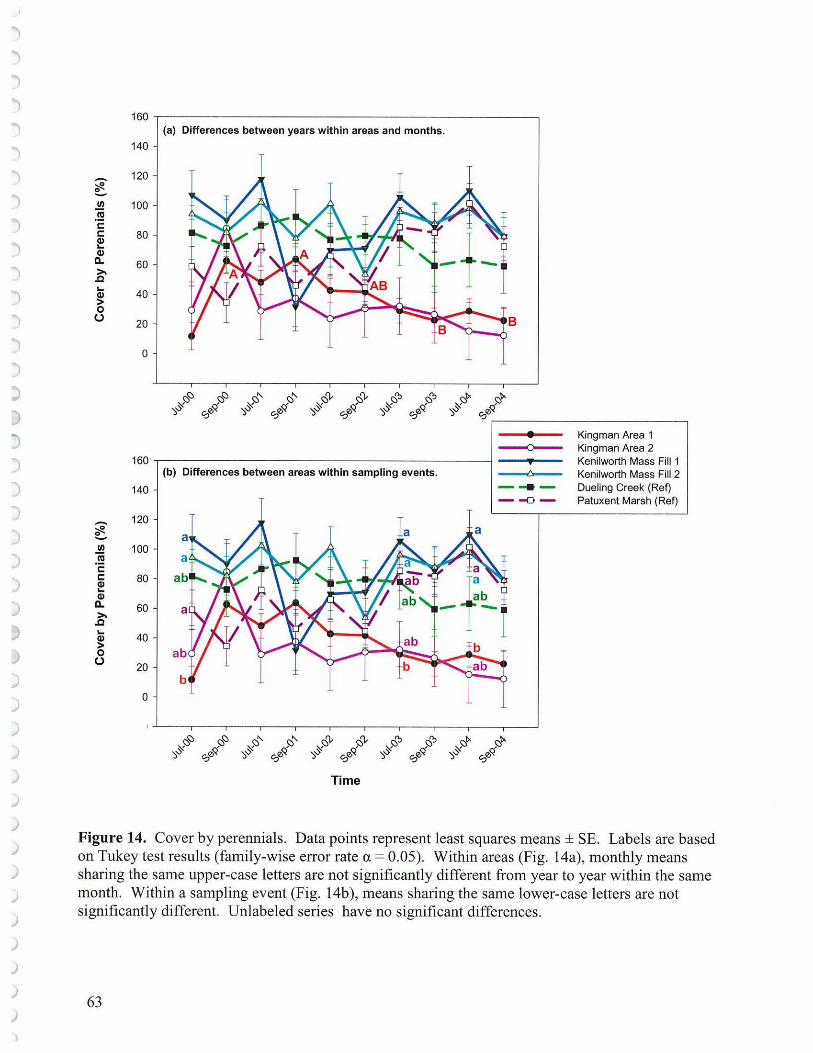
)
)
)
)
)
)
)
)
)
)
)
)
)
)
)
)
Ill
~ C C ~ Q) c.. ~
~ 0 (.)
--~ ~ Ill
~ C C Q) ... Q) c.. >, .0 ... Q)
> 0 (.)
160 -,---------------------------, (a) Differences between years within areas and months.
140
120
100
80
60
40
20
0
160
140
120
100
80
60
40
20
0
s:) ()() " ()" (\, (\, r., ()~ ~<:s ~() ~() 5) ~() ':," e:;'b<:[ ':," e:;'b<:[ ':," e:;l~ ':," e:;'b<:[
(b) Differences between areas within sampling events.
s:) ()() " ()" (\, ()'1, r., ()~ ~<:s ~() ~() ~() ':," e:;'b<:[ ':," e:;'b<:[ ':," e:;'b<:[ ':," e:;'ll<:[
Time
b< ~ ~<:s ':," e:;'b<:[
-=>----
----~-
b< ~ ~<:s ':," e:;'b<:[
Kingman Area 1 Kingman Area 2 Kenilworth Mass Fill 1 Kenilworth Mass Fill 2 Dueling Creek (Ref) Patuxent Marsh (Ref)
Figure 14. Cover by perennials. Data points represent least squares means± SE. Labels are based on Tukey test results (family-wise error rate a = 0.05). Within areas (Fig. 14a), monthly means sharing the same upper-case letters are not significantly different from year to year within the same month. Within a sampling event (Fig. 14b), means sharing the same lower-case letters are not significantly different. Unlabeled series have no significant differences.
63
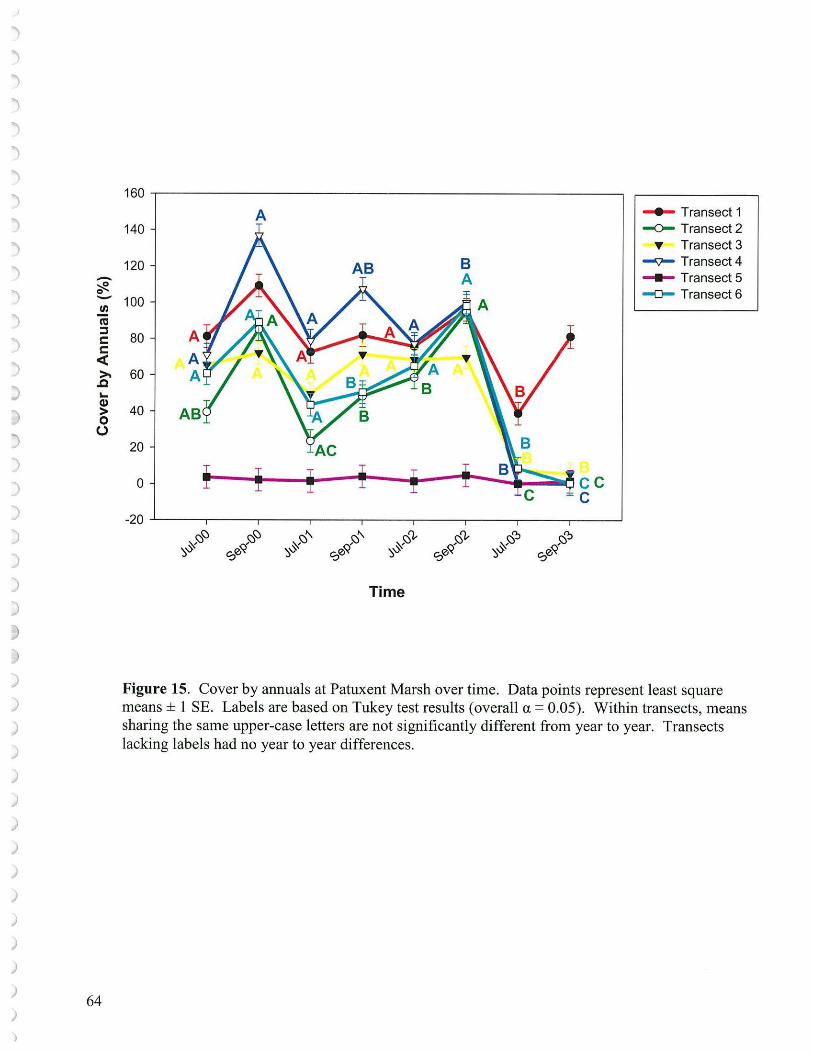
j
")
")
")
j
j
j
")
")
")
")
')
)
")
)
~
)
)
)
)
)
)
)
)
)
)
)
)
)
)
)
)
)
)
)
-~ 0 -1/)
cu :l C: C: <( >,
.Q '-Q)
> 0 (.)
64
160
140
120
100
80
60
40
20
0
-20
A
A A
AB
A
B A
~ - -.-.- ---- ~ - -tlt-- r--;;..,._;=:a~ cc C
Time
......,. Transect 1 -0- Transect 2 ~ Transect 3
-::- Transect4 - Transects -a- Transect 6
Figure 15. Cover by annuals at Patuxent Marsh over time. Data points represent least square means ± 1 SE. Labels are based on Tukey test results ( overall a = 0.05). Within transects, means sharing the same upper-case letters are not significantly different from year to year. Transects lacking labels had no year to year differences.

)
j
"')
j
j
'")
'")
"')
")
j
}
')
"')
")
')
'.)
)
)
)
)
)
)
)
)
)
)
)
)
,)
)
)
50
40
30
-~ 20 ... Cl) > 0 10 0
0
Time
Kingman Area 1 -----<=--- Kingman Area 2
Kenilworth Mass Fill 1 Kenilworth Mass FIii 2
- - - Dueling Creek (Ref) - ~ - Patuxent Marsh (Ref)
Figure 16. Cover by exotics. Data points represent least squares means ± SE. Labels are based on Tukey test results (family-wise error rate a = 0.05). Within areas, monthly means sharing the same upper-case letters are not significantly different from year to year within the same month. Unlabeled series have no significant differences. There were no significant differences between areas within sampling events.
65
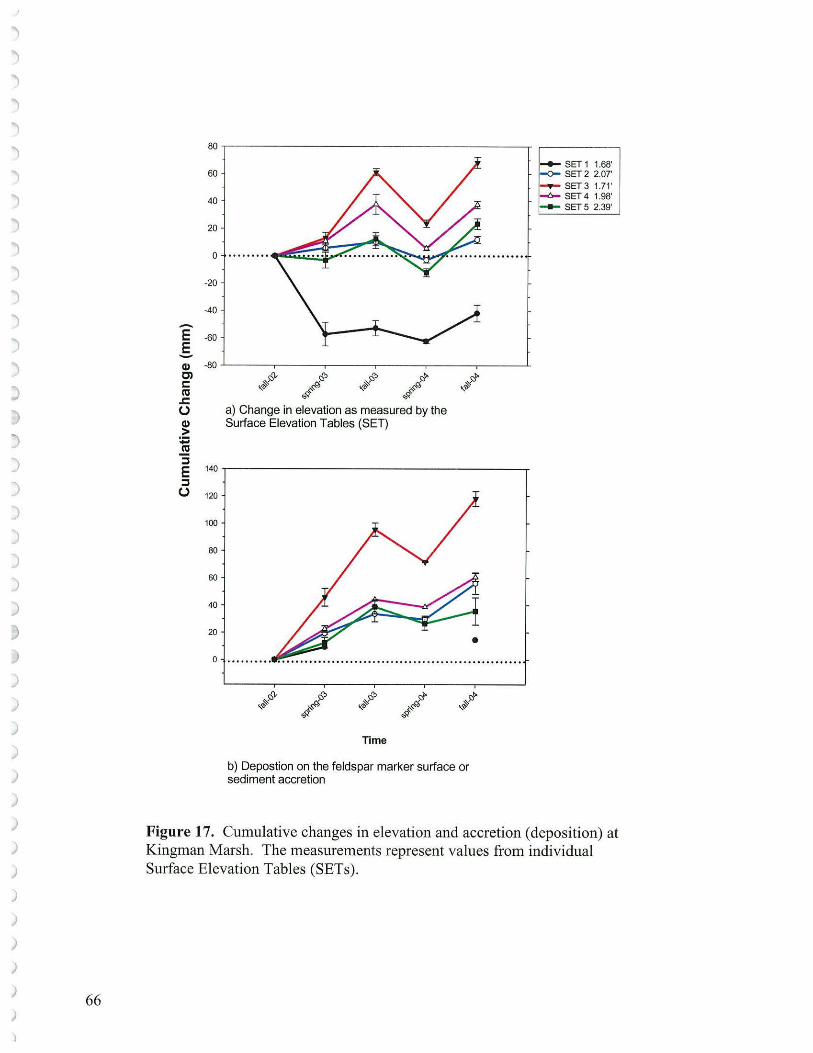
")
""l
""l
j
j
")
")
")
")
)
")
")
')
)
)
:>
)
)
)
)
)
)
)
)
)
)
)
)
)
)
)
)
) 66
-E E -(I) C) C: ra
.c: 0 (I) > :;:::; ~ :::, E :::, 0
80 -,-------- ---------------,- ,------,
60
40
20
0 ••• ••••••
-20
-40
-60
-80 -'------.-----.-----,-----,---,-----'-
~ -~Ci,
,;:f a) Change in elevation as measured by the Surface Elevation Tables (SET)
Time
b) Depostion on the feldspar marker surface or sediment accretion
- SET1 1.68' SET 2 2.07' SET 3 1.71' SET 4 1.98' SET 5 2.39'
Figure 17. Cumulative changes in elevation and accretion ( deposition) at Kingman Marsh. The measurements represent values from individual Surface Elevation Tables (SETs).
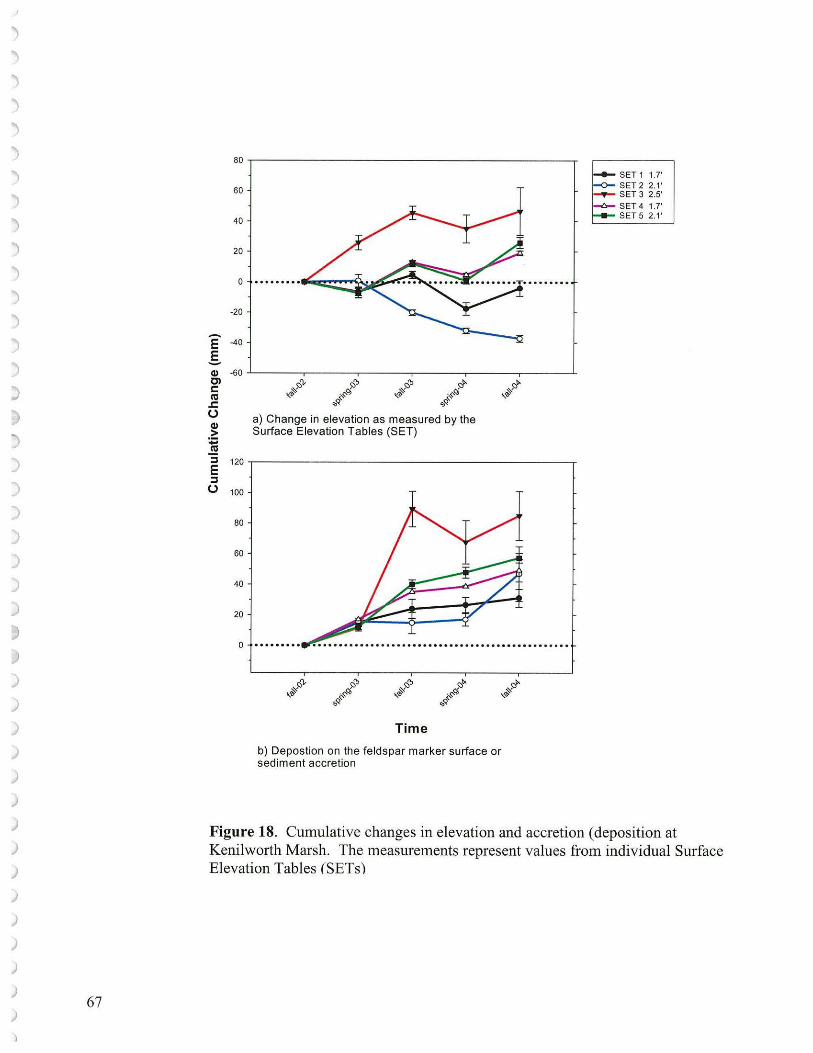
)
)
)
)
)
)
)
)
)
)
)
)
)
)
)
)
)
)
) 67
80 .-------------------------,-
80
60
40
20
a) Change in elevation as measured by the Surface Elevation Tables (SET)
Time
b) Depostion on the feldspar marker surface or sediment accretion
SET 1 1.7' SET 2 2.1' SET 3 2.5' SET 4 1.7' SET 5 2.1 '
Figure 18. Cumulative changes in elevation and accretion ( deposition at Kenilworth Marsh. The measurements represent values from individual Surface Elevation Tables (SE Ts)
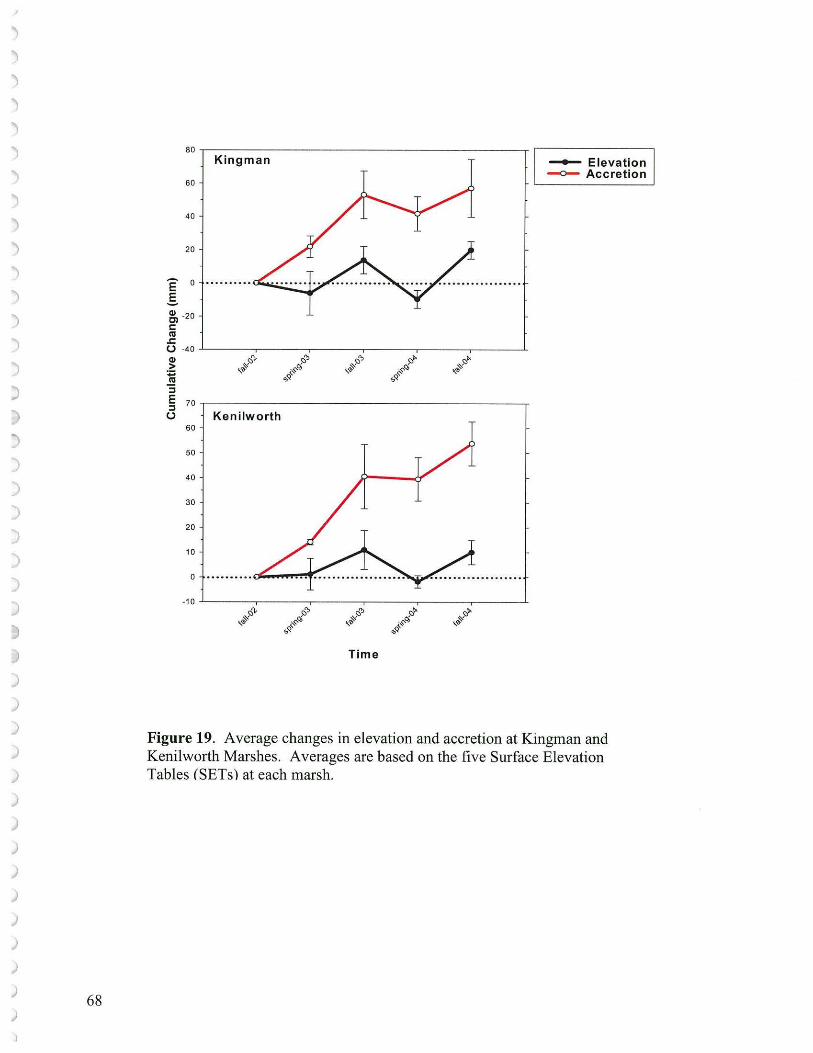
~
")
"l )
"')
")
")
")
')
')
')
')
')
')
)
:,
)
)
)
)
)
)
)
)
)
)
)
)
)
)
)
)
)
) 68
80 Kingman - Elevation
-o- Accretion 60
40
20
e 0 .......... §_ ~ -20 C: C1l .c (.) -40 Q) "'"''\, ,;,"> ,p"> ,:,'>
"'"'"' > ,.§ ~~(/, ,iif i,_-$'~ ,.§ :;:: ~
.,q .,q
:, E 70 :,
(.) Kenilworth 60
50
40
30
20
10
0 .......... -10
"'"''\, ,:,"> .,c:,"> cl' .,"'"' ,iif i,_,$'~ ,iif i,_-$'~ ,iif .,q .,q
Time
Figure 19. Average changes in elevation and accretion at Kingman and Kenilworth Marshes. Averages are based on the five Surface Elevation Tables (SETs) at each marsh.

E 0 ,_ -(/) +-' 0) C C ·-·- 0 -0 Q_ ro (1) C
0::: .Q +-'
(1) ro ,_ > ..0 (1) = _J ro ,_ 0 (1) +-' ro s
)
Water Level Readings for Dueling Creek ('02 'vS . '03)
10.0
0.0
-1 0.0
-20.0
-30.0
-40.0
Time (5/23-8/7)
- 100 per. rvt>v. Avg. (D.Jeling 0-eek '03)
100 per. rvt>v. Avg. ( D.Jeling 0-eek '02)
- Linear ( D.Jeling a-eek '03)
- Linear ( D.Jeling 0-eek '02)
y =-0.0007x - 24.138 y = -3E-05x - 29.535
) Figure 20. Water levels at Dueling Creek for the period 5/23 -8/7 for 2003 (a wet year) averaged ) 2-5" higher than for the same period in 2002 (a dry year).
)
)
)
,)
)
)
)
)
)
J )
)
)
)
) 69

')
")
")
')
') 3500
") Kingman Area 1 3000
") ----0---- Kingman Area 2 Kenilworth Mass Fill 1
") 2500 Kenilworth Mass Fill 2
') - --- Dueling Creek (Ref) N
- -c) - Patuxent Marsh (Ref) E ab ') - 2000 Cl -') II)
II)
) IO E 1500 0
') ffi ') 1000
)
:, 500
0
'00 '01 '02
Year
)
Figure 21. Biomass (of living material). Data points represent least squares means ± SE of ) biomass data collected annually. Labels are based on Tukey test results (family-wise error rate
a= 0.05). Within a year, means sharing the same lower-case letters are not significantly different. Unlabeled series have no significant differences.
)
)
)
)
)
)
)
)
)
)
)
)
)
)
) 70

\ ___)
J J )
)
)
)
)
)
j
j
J
J
J )
Species Acalypha rhomboidea Acer saccharinum Ailanthus altissima Albizia iulibrissin Alisma subcordatum Amaranthus blitum Amaranthus cannabinus Ammannia coccinea Arctium minus
Artemisia vulgaris Azolla caroliniana Bidens cemua Bidens connata Bidens frondosa Bidens laevis Bidens tripartita Boehmeria cylindrica Callitriche heterophylla Cardamine pensylvanica Carex frankii Carex lurida Carex stricta Carex tribuloides Carex vulpinoidea Catalpa speciosa Cephalanthus occidentalis Chamaesyce maculata Chenopodium ambrosioides Cleome hassleriana Convolvulus arvensis Conyza canadensis var. canadensis Cuscuta gronovii Cynodon dactylon Cyperus difformis Cyperus erythrorhizos Cyperus flavescens Cyperus iria Cyperus odoratus Cyperus squarrosus Cyperus strigosus Dichanthelium clandestinum Digitaria sanguinalis Duchesnea indica
71
Appendix 1 Plant Species Observed at Kingman
2000 through 2004
Common Name Virginia threeseed mercury silver maple tree of heaven silktree American water plantain purple amaranth tidalmarsh amaranth valley redstem lesser burrdock
common wormwood Carolina mosquitofem nodding beggartick purplestem beggarticks devil's beggartick smooth beinmrtick threelobe beggarticks smallspike false nettle two-headed water-starwort Pennsylvania bittercress Frank's sedge shallow sedge upright sedge blunt broom sedge fox sedge northern catalpa common buttonbush spotted sandmat Mexican tea pink queen field bindweed Canadian horseweed scald weed Bermudagrass variable flatsedge redroot flatsedge yellow flatsedge ricefield flatsedge fragrant flatsedge bearded flatsedge strawcolored flatsedge deertongue hairy crabgrass Indian strawberry
NWI Acronym Ind Status ACARHO FACU-ACESAC FACW AILALT ALBillL ALISUB OBL AMABLI NI
AMACAN OBL AMMCOC OBL ARCMIN FACU-
ARTVUL UPL AZOCAR OBL BIDCER OBL BIDCON OBL BIDFRO FACW BIDLAE OBL BIDTRI FACW
BOECYL FACW+ CALHET OBL CARPEN OBL
CARFRA OBL CARLUR OBL CARSTR OBL CARTRI FACW+ CARVUL OBL CATSPE FAC CEPOCC OBL
CHAMAC FACU-CHEAMB FACU CLEHAS FACU-CONARY CONCAN UPL CUSGRO CYNDAC FACU CYPDIF OBL CYPERY FACW+ CYPFLA OBL CYPIRI FACW
CYPODO FACW CYPSQA FACW+ CYPSTR FACW DICCLA FAC+ DIGSAN FACU-DUCIND FACU-
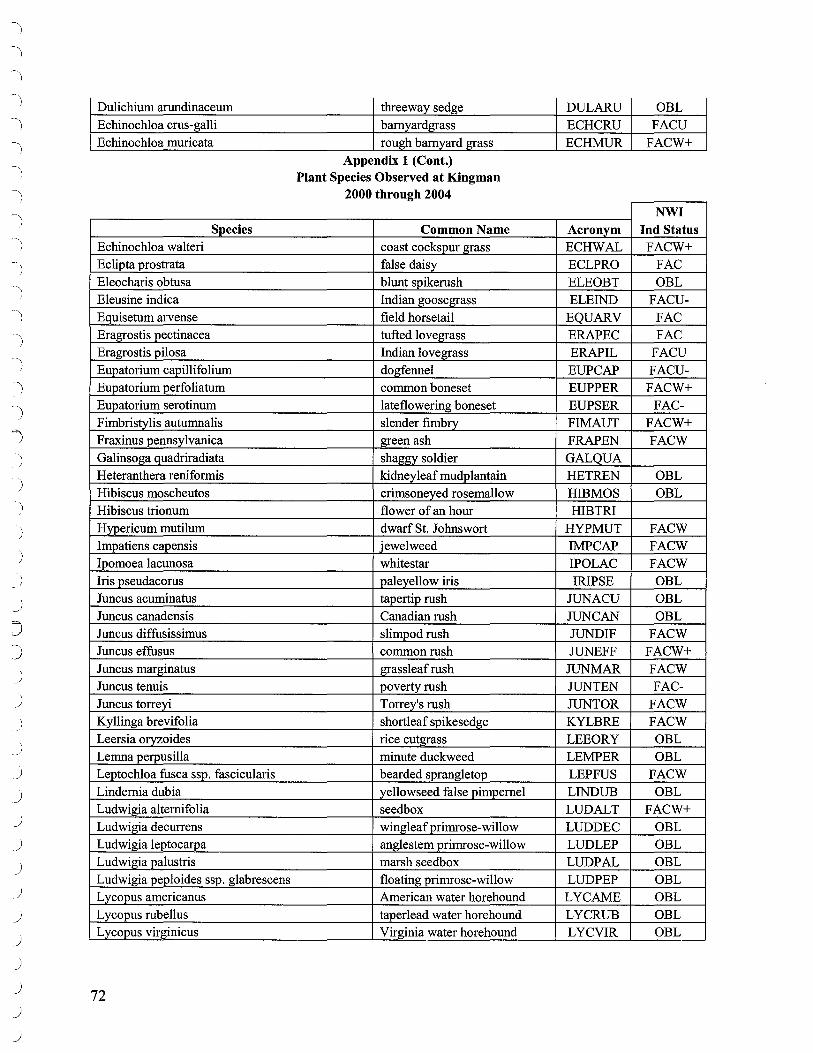
Dulichium arundinaceum threeway sedge DULARU OBL Echinochloa crus-galli barnyardgrass ECHCRU FACU Echinochloa muricata rough barnyard grass ECHMUR FACW+
Appendix 1 (Cont.) Plant Species Observed at Kingman
2000 through 2004 NWI
Species Common Name Acronym Ind Status Echinochloa walteri coast cockspur grass ECHWAL FACW+ Eclipta prostrata false daisy ECLPRO FAC Eleocharis obtusa blunt spikerush ELEOBT OBL Eleusine indica Indian goosegrass ELEIND FACU-Equisetum arvense field horsetail EQUARV FAC Eragrostis pectinacea tufted lovegrass ERAPEC FAC Eragrostis pilosa Indian lovegrass ERAPIL FACU Eupatorium capillifolium dogfennel EUPCAP FACU-Eupatorium perfoliatum common boneset EUPPER FACW+ Eupatorium serotinum lateflowering boneset EUPSER FAC-Fimbristylis autumnalis slender fimbry FIMAUT FACW+ Fraxinus pennsylvanica green ash FRAPEN FACW Galinsoga quadriradiata sha1rn:v soldier GALQUA Heteranthera reniformis kidney leaf mudplantain HETREN OBL Hibiscus moscheutos crimsoneyed rosemallow HIBMOS OBL Hibiscus trionum flower of an hour HIBTRI
) Hypericum mutilum dwarf St. Johnswort HYPMUT FACW Impatiens capensis jewel weed IMPCAP FACW lpomoea lacunosa whitestar IPOLAC FACW Iris pseudacorus paleyellow iris IRIPSE OBL Juncus acuminatus tapertip rush JUNACU OBL Juncus canadensis Canadian rush JUNCAN OBL Juncus diffusissimus slimpod rush JUNDIF FACW Juncus effusus common rush JUNEFF FACW+ Juncus marginatus grassleaf rush JUNMAR FACW Juncus tenuis poverty rush JUNTEN FAC-Juncus torreyi Torrey's rush JUNTOR FACW Kyllinga brevifolia shortleaf spikesedge KYLBRE FACW Leersia oryzoides rice cutgrass LEEORY OBL Lemna perpusilla minute duckweed LEMPER OBL Leptochloa fusca ssp. fascicularis bearded sprangletop LEPFUS FACW Lindernia dubia yellowseed false pimpernel LINDUB OBL Ludwigia alternifolia seedbox LUDALT FACW+ Ludwigia decurrens wingleaf primrose-willow LUDDEC OBL Ludwigia leptocarpa anglestem primrose-willow LUDLEP OBL Ludwigia palustris marsh seedbox LUDPAL OBL Ludwigia peploides ssp. glabrescens floating primrose-willow LUDPEP OBL Lycopus americanus American water horehound LYCAME OBL Lycopus rubellus taperlead water horehound LYCRUB OBL Lycopus virginicus Virginia water horehound LYCVIR OBL
72
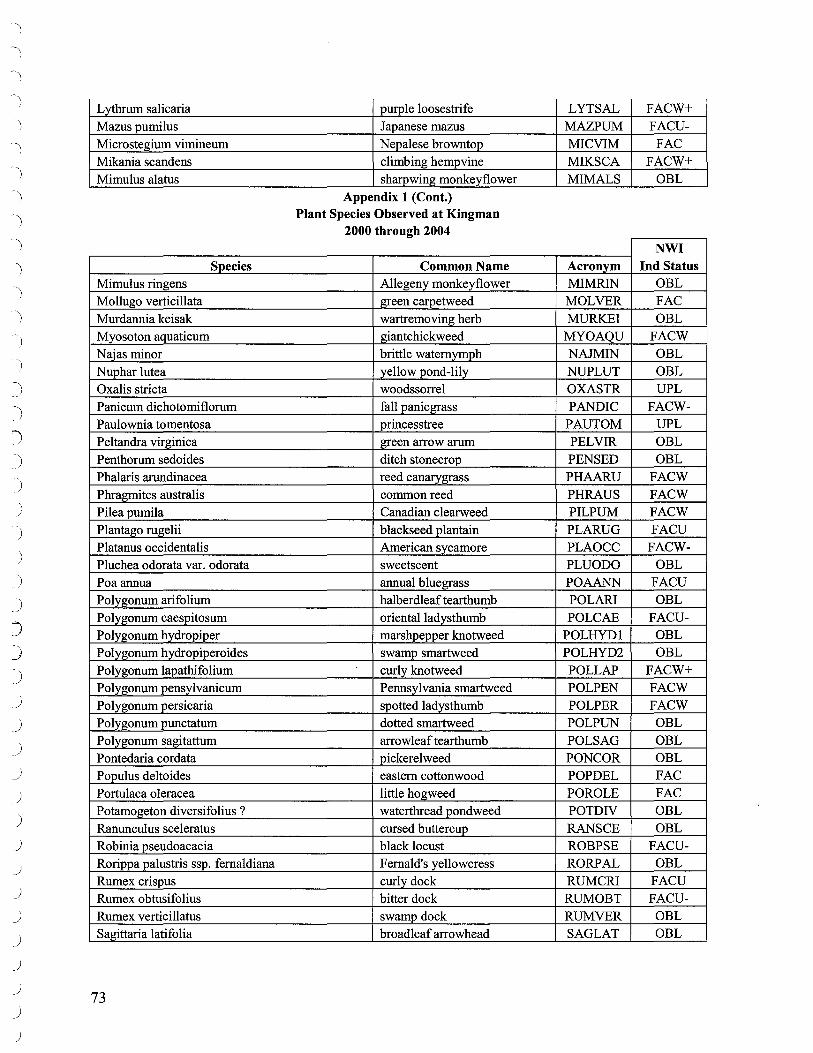
)
)
)
J J )
j
)
)
)
_)
)
J
J _)
J
J _)
)
j
J )
Lythrum salicaria Mazus pumilus Microstegium vimineum Mikania scandens Mimulus alatus
Species Mimulus ringens Mollugo verticillata Murdannia keisak Myosoton aquaticum Najas minor Nuphar lutea Oxalis stricta Panicum dichotomiflorum Paulownia tomentosa Peltandra virginica Penthorum sedoides Phalaris arundinacea Phragmites australis Pilea pumila Plantago rugelii Platanus occidentalis Pluchea odorata var. odorata Poaannua Polygonum arifolium Polygonum caespitosum Polygonum hydropiper Polygonum hydropiperoides Polygonum lapathifolium Polygonum pensylvanicum Polygonum persicaria Polygonum punctatum Polygonum sagitattum Pontedaria cordata Populus deltoides Portulaca oleracea Potamogeton diversifolius ? Ranunculus sceleratus Robinia pseudoacacia Rorippa palustris ssp. femaldiana Rumex crispus Rumex obtusifolius Rumex verticillatus Sagittaria latifolia
73
purple loosestrife Japanese mazus Nepalese browntop climbing hempvine sharpwing monkeyflower
Appendix 1 (Cont.) Plant Species Observed at Kingman
2000 through 2004
Common Name Allegeny monkeyflower green carpetweed wartremoving herb giantchickweed brittle watemymph yellow pond-lily woodssorrel fall panicgrass princesstree green arrow arum ditch stonecrop reed canarygrass common reed Canadian clearweed blackseed plantain American sycamore sweetscent annual bluegrass halberdleaf tearthumb oriental ladysthumb marshpeooer knotweed swamp smartweed curly knotweed Pennsylvania smartweed spotted ladysthumb dotted smartweed arrowleaf tearthumb pickerel weed eastern cottonwood little hogweed waterthread pondweed cursed buttercup black locust Femald's yellowcress curly dock bitter dock swamp dock broadleaf arrowhead
LYTSAL FACW+ MAZPUM FACU-MICVIM FAC MIKSCA FACW+
MIMALS OBL
NWI Acronym Ind Status MIMRIN OBL MOLVER FAC MURKEI OBL
MYOAQU FACW NAJMIN OBL
NUPLUT OBL OXASTR UPL PANDIC FACW-
PAUTOM UPL PELVIR OBL PENSED OBL PHAARU FACW PHRAUS FACW PILPUM FACW
PLARUG FACU PLAOCC FACW-PLUODO OBL
POAANN FACU POLARI OBL POLCAE FACU-
POLHYDl OBL POLHYD2 OBL POLLAP FACW+
POLPEN FACW POLPER FACW POLPUN OBL POLSAG OBL PONCOR OBL POPDEL FAC POROLE FAC POTDIV OBL RANSCE OBL ROBPSE FACU-RORPAL OBL RUMCRI FACU RUMOBT FACU-RUMVER OBL SAGLAT OBL

I J
)
J
J
J
J j
j
Salix nigra black willow
Schoenoplectus fluviatilis river bulrush Schoenoplectus pungens common threesquare Schoenoplectustabemaemontani softstem bulrush Scirpus cyperinus woolgrass Scirpus polyphyllus leafy bulrush Scutellaria lateriflora blue skullcap
Appendix 1 (Cont.) Plant Species Observed at Kingman
2000 through 2004
Species Common Name Setaria parviflora marsh bristlegrass Sium suave hemlock waterparsnip Solanum nigrum black nightshade Sonchus asper spiny sowthistle Spirodela polyrrhiza common duckmeat Symphyotrichum dumosum var. dumosum rice button aster Taraxacum officinale common dandelion Trifolium repens white clover Typha angustifolia narrowleaf cattail Typha x glauca Typha latifolia broadleaf cattail Ulmus rubra slippery elm
Verbena hastata swamp verbena Veronica peregrina neckweed Zizania aquatica annual wildrice
74
SALNIG FACW+
SCHFLU OBL
SCHPUN FACW+
SCHTAB OBL
SCICYP FACW+
SCIPOL OBL
SCULAT FACW+
NWI Acronym Ind Status SETPAR FAC SIUSUA OBL SOLNIG
SONASP FAC
SPIPOL OBL
SYMDUM FAC TAROFF FACU-
TRIREP FACU-
TYPANG OBL TYPGLA OBL TYPLAT OBL ULMRUB FAC
VERHAS FACW+
VERPER FACU-ZIZAQU OBL

-, _}
)
)
)
J )
_)
j
j
j
J
J
J
J
J
)
)
Introduction
Part 2: SOILS
Andrew H. Baldwin and Kelly Phyillaier Neff Department of Biological Resources Engineering
1423 Animal Science Building University of Maryland
College Park, Maryland, USA 20742
Soils were investigated to provide a context for understanding vegetation development as well as to examine development of soils in Kingman Marsh relative to other restored and natural marshes. Soil samples were collected in 2000 and 2001 at Kingman Marsh, Kenilworth Marsh, Dueling Creek, and Patuxent. Additional work concerning the impact of flooding on wetland soils from a beaver impoundment may be found in Kristin Rusello's M.S. Thesis (Rusello, K. 2005), as well as freshwater tidal wetland soil development in the Anacostia in Stephanie Kassner's M.S. Thesis (Kassner, S. L., 2001).
Methods
Soil samples were collected in mid-August of 2000 and 2001 from all transects. Samples were taken at 5, 10, and 15 meters along each transect in, 2000 and at 7.5, 12.5, and 17.5 meters in, 2001 (to avoid sampling the exact same location twice). Samples were taken from depths of 0-7.5 cm, 7.5-15 cm, and 15-30 cm and combined to form a composite sample for each of the three depths along the transect. Soil samples were analyzed for organic matter, total nitrogen, total carbon, total sulfur, total phosphorus, and texture. Additionally, samples from, 2000 at a depth of 0-7 .5 cm were analyzed for cadmium, copper, chromium, lead, nickel, and zinc. In August, 2000 and, 2001, we measured soil water pH for each transect and soil redox potential (EH) in each sector.
Since the measured values at the different soil depths were similar, we combined soil depths for analysis (Neff, 2002). We used RMANOVA to determine differences among sites and years for sand, silt, clay, organic matter, total nitrogen, phosphorus, total sulfur, total carbon, redox potential, and pH. We used ANOV A to determine differences among sites for cadmium, chromium, copper, lead, nickel, and zinc.
Results
Soil characteristics did not change much between 2000 and 2001, so values for 2001 are not shown but can be found in Neff (2002). Soils at Kingman consisted of significantly less clay than the natural sites Dueling Creek and Patuxent, but were similar to those from Kenilworth (Table 1 ). The soil parameters organic matter, total carbon, total nitrogen, and total phosphorus were significantly higher at Patuxent than the urban sites. There were no significant differences in metal concentrations between the sites with the exception of cadmium, which was significantly higher at Patuxent.
75
Discussion
Kingman and Kenilworth had soils of coarser texture than the natural sites that may limit germination and growth of certain species. The other measured soil properties at all three urban sites were similar to each other, but quite different from the natural rural site. This was unexpected because restored wetland soils are would be expected to differ from reference wetland soils, but in this case it seems that landscape setting was an important factor in soil structure and apparently limited organic matter (3-5%) at the Dueling reference site (Kassner, S.L. 2001). Wetland soils take considerable time to develop fully. Organic matter accumulation may especially take time as freshly deposited organic matter may be prone to oxidation in a newly established wetland. Thus while it is important to have a grasp on the baseline condition of newly established wetland soils, one might not rely on them much as a functional indicator in relatively short term studies such as these. Thus, the Anacostia wetland soils possessed expectable qualities, especially for more urban, disturbed locations. The wetland soils at the Patuxent site, especially with respect to the elevated organic matter (nearly 50%), reflect a long established, undisturbed location that has existed under anaerobic conditions.
References Kassner, S.L. 2001. Soil Development as a Functional Indicator of a Reconstructed Freshwater Tidal Marsh. M. S. Thesis. University of Maryland, College Park.
Neff, K.P., 2002. Plant Colonization and Vegetation Change in a Restored Tidal Freshwater Wetland in Washington, DC. M. S. Thesis. University of Maryland, College Park.
Rusello, K. 2005. Wetland Restoration in Urban Settings: Studies of Vegetation and Seed Banks in Restored and Reference Tidal Freshwater Marshes. M. S. Thesis. University of Maryland, College Park.
76

)
)
)
)
)
) Table 1. Soil variables at restored (Kingman, Kenilworth) and natural wetlands ) (Dueling, Patuxent) in, 2000. Values are meansE, averaged across depth, with
) the exception of lead, which is mean ucL, LcL • Different letter denote significant difference between sites (Tukey-Kramer test).
)
) 2000
) Parameter Kingman Kenilworth Dueling Patuxent -)
49.1 4·6 45.1 8·0 24.0 l0.4 35.6 7·3 )
Sand(%)
-) Silt(%) 34.4 2.8 36.8 4·8 42.9 63 306.8
) Clay(%) 16.4 2.1b 18.2 3·5ab 33.1 4·6a 36.3 5·1a
) ,) Total Carbon (%) 2.7°·6b 3.11.1b 3.21.4b 141.2a
) Organic Matter (%) 5.21.1b 6.4 2.ob 6.8 2·6b 21.9 2·7a )
0.13o.41b O.16°·07b 0.21 °·09b l.09o.o9a )
Total Nitrogen(%)
--) Total Phosphorus (mg/kg) 586 112b 590 194b 7O3 252b 2263 215a
) TN:TP 2.14°·28b 2.31 o.47b 2.86°·63b 5.67°·58a
)
) Total Sulphur(%) 0.12 o.15b 0.17°·26ab 0.13°34ab l.07°·27a
_) Cadmium (mg/kg) 3.31 °34b 2.6o 0·57b 4.01 °·81b 8.12 °·81a )
Chromium (mg/kg) 63.3 6.9 62.6 11.6 74.2 16.4 49.8 16.4 )
J Copper (mg/kg) 45.9 4·8 47.4 8.1 51.4 11.5 29.7 11.5
J Nickel (mg/kg) 35.9 3"6 35.4 6.1 45.6 6·1 37.6 8·6
j Lead (mg/kg) 74 102 144 56 j
98,56 163,64 266, 78 104,30
-) Zinc (mg/kg) 241 26 239 44 259 62 209 62
_)
j pH 6.97°.I0b 6.41 o.16ab 6.19°·22a 6.15°.22a
J Redox (mV) 12O 13ab 136 21 ab 2O2 28a 37 28b j
J
J _)
_)
_) 77
J )
l
l
l
l
l
l
Abstract:
Part III SEED DISPERSAL
Andrew H. Baldwin and Kelly Phyillaier Neff Department of Biological Resources Engineering
1423 Animal Science Building University of Maryland
College Park, Maryland, USA 20742
Although seed dispersal is assumed to be a major factor determining plant community development in restored wetlands, little research exists on density and species richness of seed available through dispersal in these systems. We measured composition and seed dispersal rates at a restored tidal freshwater marsh in Washington, DC, USA by collecting seed dispersing through water and wind. Seed dispersal by water was measured using two methods of seed collection: (1) stationary traps composed of coconut fiber mat along an elevation gradient bracketing the tidal range and (2) a floating surface trawl net attached to a boat. To estimate wind dispersal rates, we collected seed from stationary traps composed of coconut fiber mat positioned above marsh vegetation. We also collected a small number of samples of debris deposited along high tide lines ( drift lines) and feces of Canada Goose to explore their seed content. We used the seedling emergence method to determine seed density in all samples, which involved placing the fiber mats or sample material on top of potting soil in a greenhouse misting room and enumerating emerging seedlings. Seedlings from a total of 125 plant species emerged during this study (including 82 in river trawls, 89 in stationary water traps, 21 in drift lines, 39 in wind traps, and 10 in goose feces). The most abundant taxa included Ridens .frondosa, Boehmeria cylindrica, Cyperus spp., Eclipta prostrata, and Ludwigia palustris. Total seedling density was significantly greater for the stationary water traps (212±30.6 seeds/m2/month) than the equal-sized stationary wind traps (18±6.0 seeds/m2/month). Lower-bound estimates of total species richness based on the non-parametric Chao 2 asymptotic estimators were greater for seeds in water (106±1.4 for stationary water traps and 104±5.5 for trawl samples) than for wind (54±6.4). Our results indicate that water is the primary source of seeds dispersing to the site and that a species-rich pool of dispersing propagules is present, an interesting result given the urbanized nature of the surrounding landscape. However, species composition of dispersing seeds differed from vegetation of restored and natural tidal freshwater marshes, indicating that planting is necessary for certain species. At other restoration sites, information on densities of dispersing seeds can support decisions on which species to plant.
Introduction
Seed dispersal studies can describe the species composition and density of propagules available for regeneration of vegetation in restored sites, thereby informing decisions on the necessity or species of plantings. While wetland species can be dispersed by more than one
78
)
)
)
)
)
)
)
)
)
)
)
)
)
)
)
)
)
)
)
)
)
)
)
)
)
)
)
)
)
J )
)
j
J
J
j
j
j
J
J
J j
)
mechanism, water dispersal is the primary method of seed dispersal in many wetland systems, where seeds and fruits can float for extended periods.
Seed dispersal may be of critical importance in the natural reassembly of a diverse plant community in restored wetlands. Numerous volunteer species established shortly after restoration of Kenilworth Marsh in Washington, DC, USA, where dredge material from an adjacent river was used to raise sediment elevations (Syphax and Hammerschlag 1995). Based on a seedling emergence assay, seeds probably were dispersed to the site rather than residing in dredge material (Baldwin and DeRico 2000). While natural revegetation of several kinds of• restored wetlands via colonization has been documented (Middleton 1999), data regarding the densities and species of naturally dispersing seeds necessary to predict the volunteers that will colonize a site are not available.
Our initial objective for this study was to evaluate the composition of seeds dispersing via water and wind into Kingman Marsh (Figure 1). We hypothesized that water dispersal would be a more important dispersal pathway than wind, given the tidal hydrologic connection of the restored wetland to the Anacostia River and the reported predominance of water dispersal for wetland plants. To accomplish this objective, we designed and used stationary water and wind traps and a floating seed trawl net to collect seeds at and near the site. During our site visits, we also observed drift lines and goose feces and collected a small number of samples of these materials to explore their seed content.
Methods
Seed Collections
Water Surface Trawling. We trawled for seeds along the surface of the Anacostia River in November 2000, early April 2001, and early June 2001. This sampling period began after seed production in 2000 was complete and extended until after the period of maximum seedling recruitment in tidal freshwater marshes of the mid-Atlantic region (early spring). We designed a seed trawling sampler that was built according to our specifications by Wildlife Supply Company (Saginaw, Ml). Specifically, this sampler had a 600 um Nitex® mesh net (with an opening of 40.9 cm width x 25.6 cm height) that funneled seeds into a Dolphin™ bucket (with a 582-um stainless steel mesh), allowing river water to flow through the net and deposit seeds and small debris into the bucket and the net (Figure 2). Two floats were attached to the sides of the net and one float to the Dolphin bucket to allow the top of the net to float about 7.6 cm above the water surface. The net was attached by a rope to a perforated metal beam, allowing the trap to float about 0.6 m from the side of our boat. The trap was dragged along the front side of the boat, ahead of the wake, at a motoring speed of 2.7-2.9 km/hr. When the Dolphin bucket was full, debris and seeds from the net and Dolphin bucket were scraped and rinsed into a plastic container. Coarse material such as twigs, leaves, trash, and rhizomes was rinsed over the trawl net in the field to remove seeds and discarded. Trawl distance was determined by GPS (12 Map, Garmin, Olathe, KS).
We sampled multiple locations each time we trawled. On the Anacostia River, we collected samples along three trawl transects. One location extended upstream from the northern inlet of Kingman Marsh (Figure 1) to the inlet of Kenilworth Marsh, another restored tidal freshwater marsh (~ 773 m), a second began at the Kenilworth inlet and extended to the mouth of Dueling Creek, which has a small natural tidal freshwater marsh adjacent to it(~ 1175 m), and a
79

---I
)
)
)
)
)
)
J
J
J
J
J
)
third extended upstream from Dueling Creek to a boat ramp at Bladensburg Historic Waterfront Park (~ 869 m). Additionally, we collected samples along one trawl transect in a deep water area of Kenilworth Marsh(~ 508 m) and another transect in Dueling Creek adjacent to a natural marsh (~ 208 m).
The density and species composition of seeds from the trawl samples was determined using the seedling emergence technique. Material from trawl samples was spread on top of 3.5 cm of moist potting soil in 25.4 x 50.8 cm plastic pans with perforations on the bottom to allow for drainage. The pans were then placed on a greenhouse misting bench along with randomly placed control pans containing potting soil. Samples from November 2000 and April 2001 were placed in the greenhouse in April 2001. The November samples were stored at 4°C until April for stratification. Samples from June 2001 were placed unstratified in the greenhouse in June 2001. For seven months, we periodically counted and removed seedlings that could be taxonomically identified and transplanted and grew unknown seedlings until they could be identified.
The seedling emergence method is effective in determining the species composition of viable seeds buried in wetland soils (Poiani and Johnson 1988, Gross 1990). Based on past results of seed bank emergence studies in the same region in which few species germinated only in flooded treatments (Baldwin and DeRico 2000), we did not conduct an inundated treatment in the greenhouse.
Stationary Water Traps. As another method for characterizing the seed entering Kingman Marsh through water dispersal, we collected seeds using stationary water traps during three periods, October 1999 - May 2000, November 2000 - April 2001, and April 2001 - June 2001. These time periods roughly span the time between completion of seed production in one year and initiation of seed germination in the subsequent year. Traps were attached to the supports of a golf cart bridge at Kingman Marsh at the north surface hydrologic connection to the Anacostia River (Figure 1 ). Three traps were facing the Anacostia River and three traps were facing Kingman Marsh to intercept seeds from both inflowing and outflowing tides. Each trap had four seed collectors, A, B, C, and D, each positioned at a different height (Figure 3). The intent was for the collectors to receive water inputs from the tidal range of low to high tide, with the lowest collector (D) being inundated by water during most of the tidal cycle and the highest collector (A) receiving tidal water input only during extreme high tides.
Each stationary seed trap was constructed by first attaching a 132 x 3.8 x 19.1 cm plank of pressure-treated wood to one of the six bridge supports to form the base. Four seed collectors were constructed by attaching four 46.5-cm-long planks of pressure treated wood perpendicular to the base, and attaching to each of these at a 30-degree angle from horizontal a 25.4 x 55.8 cm plate of2-mm-thick aluminum sheet metal, with two 10.2 x 15.2 cm rectangular holes cut out to allow for percolation of water. The 2.5-cm-wide section at each narrow end of the sheet metal was bent upward so that the ends of the sheet metal rested flat against the wooden base and support; screws were then used to attached the sheet metal to the wood. On top of the sheet metal, two 25.4 x 50.8 cm coconut fiber mats (CF Mats, BonTerra, America, Inc., Genesee, ID) were attached with plastic electrical cable ties. The bottom mat was a 0.7-cm-thick coconut fabric held together by plastic netting, and the top mat was a 0.7-cm-thick coconut fabric within a plastic reinforcement structure. This plastic structure created an undulating or terraced effect to slow water runoff and increase the likelihood of seeds getting caught in the fabric. We used coconut mats to allow water to infiltrate through and trap seeds, therefore reducing seed losses by water runoff, as well as providing a substrate for seed germination after removal.
80
i
For the first sample period (October 1999-May 2000), we used a slightly different design than that for the second and third sample periods. This first design (installed by Rebecca Stack, University of Maryland) had coconut fiber seed collectors of the same size but a different type of coconut fiber mat, Bog Mat (BonTerra America, Inc., Genesee, ID), which is no longer available. This first design, which was built from thinner planks of wood and no metal, also proved to be too weak in structure for the high-energy system, based on the loss of eight of a total of24 seed collectors by the end of the sample period (missing traps were from heights B-D; no level A collectors were missing). In contrast, no collectors were missing from the improved traps (made partially of sheet metal and installed in November 2000) during the remaining sampling periods. Previously, we had used the floating bucket trap design of Middleton (1995) but found that the trap tether lines became tangled due to changes in water flow direction during each tidal cycle, and the bucket liners quickly tore, possibly due to the tidal energy and extensive floating trash and organic debris in this system; for additional details on trap development, see Neff (2002).
We collected mats from the original traps in May 2000 (after seven months of exposure). After installing the stronger traps in November 2000, we collected and replaced their coconut mats in early April 2001 (after five months of exposure) and then collected the coconut mats in early June 2001 ( after two months of exposure). All of the collected mats were placed directly on top of moist potting soil in 25.4 x 50.8 cm plastic pans with perforations on the bottom to allow for drainage and subjected to the emergence method for seven months on a greenhouse misting bench as described for trawl samples. Samples from the 2000 collection were placed in the greenhouse in May 2000, and samples from 2001 were put in the greenhouse in April 2001 and June 2001, depending on collection date.
Drift Line Samples. After the majority of dredged sediment was placed in the wetland, we observed deposition of pockets of coarse organic debris at the upper tidal limits ( drift lines; Bakker et al. 2002). To examine which species and relative contributions of seeds could be measured from this material, we collected four drift line samples within Kingman Marsh in early May 2000 ( after sediment placement but prior to planting and natural establishment of vegetation). We recognize that we collected fewer samples than those collected in other studies but wanted to explore the utility of drift line sampling as a cost-effective method. Samples were collected at haphazardly chosen locations where debris had accumulated by scraping off seeds and debris from the upper 1 cm of the soil surface using a plastic scoop with a rectangular opening to a volume of approximately 500 cm3 (surface area= 0.05 m2
). All samples were stored at 4 ° C until processed. Coarse material such as sticks, leaves, trash, living roots, rhizomes, or other obviously vegetative material was rinsed with distilled water over the sample to remove any seeds and then discarded. Each sample was spread over 3.5 cm of potting soil in 25.4 x 50.8 cm plastic pans and subjected to the emergence method as described previously. Seeds in the samples were allowed to germinate for seven months, with sediment in the pans remaining moist but not inundated.
Stationary Wind Traps. We collected seeds via wind traps during two periods. We set up six wind seed traps in November 2000, two on the Anacostia River (one on the west side of the river at the northern end of Kingman and the other on the east side of the river at the southern end), and four in the restored portion of Kingman Marsh (Figure 1 ). Each trap had two sheet metal collectors (similar to those described for the stationary water traps) welded onto a metal frame
81
attached to two perforated metal beams driven into the ground (Figure 4). Like the stationary water traps, these seed collectors each had two 10.2 x 15.2 cm holes for drainage and four 0.7 cm holes for attaching the coconut mats. These collectors were set about 2.4 m above the ground to minimize seed deposition from adjacent vegetation. As for the water traps, two coconut mats were attached to each collector using plastic cable ties. The intention was for rain to percolate through these mats, reducing seed losses from water runoff. To direct airborne seeds onto the traps, we welded a 25.4 x 25.4 cm cross-shaped wind deflector on top of the trap.
The traps were positioned to face the prevailing wind directions in the area, 320° and 140°, as reported by the National Weather Service. These coconut mats were installed in November 2000, collected and replaced in early April 2001 (after five months exposure), and collected again in early June 2001 (after two months exposure). Seedling emergence on these coconut mats was monitored for seven months as described previously. Birds, especially Redwinged Blackbirds (Agelaius phoeniceus Linnaeus), were seen perching on the wind traps, and bird droppings were observed on their coconut mats. Therefore, these wind traps also collected any seed remaining viable after excretion from the bird's gut and seed from their feathers and feet, as well as wind-dispersed seed (this limitation of wind traps has been noted elsewhere; Kollmann and Goetze 1998).
Goose Feces Samples. Five total Canada Goose (Branta canadensis Linnaeus) feces samples, each comprising two fecal cylinders, were collected between Fall 2000 and Spring 2001 to explore the utility of goose feces sampling as a seed dispersal monitoring tool for tidal freshwater wetlands. These samples were stored at 4°C until processing. In April 2001, they were spread into a thin layer onto 3.5 cm of moist vermiculite in aluminum pans (15.6 x 21.8 cm surface area, 5 .1 cm depth) with perforations on the bottom to allow drainage and placed randomly with the other seed samples on the greenhouse misting bench. The emergence method was conducted for seven months on these samples.
Data Analyses
Species composition data were summarized by calculating arithmetic mean and standard error (SE) of number of seedlings emerging from samples. For conciseness, we present mean and SE only for the five most abundant species from each sampling technique, with the addition of Lythrum salicaria L. and Phragmites australis (Cav.) Trin. ex Steud., two species of particular interest to environmental managers. Also calculated were mean and SE of seedling density (total number of seedlings per sample), species density ( equivalent to number of species per sample ( or area of sample), and species richness per sample (Simpson 1964, Gotelli and Colwell 2001)). For all sample types except goose feces, we calculated area-adjusted density (seedling density divided by sample surface area, expressed as seedlings/m2
), and for stationary water and wind traps, we calculated and time- and area-adjusted density ( density divided by sample surface area and duration of deployment, expressed as seedlings/m2 /month). Data from the trawl samples in open water areas adjacent to Dueling Creek Marsh and Kenilworth Marsh, referred to hereafter as "Offsite Wetland" trawl samples, were separated from trawl samples collected along the main stem of the Anacostia River to see if seed densities were greater near other wetlands (i.e., the wetlands were seed sources) and because we thought the Anacostia River samples would be more representative of the composition of seeds actually entering the Kingman site. For the
82

)
)
)
)
_J
J J _)
j
_)
)
J _J
_j
_)
_)
_)
_)
_)
_)
_)
_)
Anacostia River trawling samples, we used repeated measures Analysis of Variance (ANOVA) to determine differences between months for area-adjusted seedling density (seedlings/m2
,
calculated from width of trawl net and distance trawled). Data from stationary water and wind traps were log1o(x+l)-transformed to meet assumptions of ANOVA, which was used to compare the two methods for the November 2000-April 2001 and April 2001 - June 2001 periods combined. Since the top collector of the stationary water traps (height A) likely collected wind as well as water dispersed seeds, data from collectors at this height were separated from collectors B, C, and D data for analysis. There was no significant difference in seed density or species density of seeds between collectors B, C, or D, so the data from these three collectors were combined.
Because of the wide range in numbers of individuals collected using the various methods, direct comparisons of species density and total number of species between the various pathways and sampling methods are difficult. This is because the number of species observed often increases with an increasing number of individuals sampled (Gotelli and Colwell 2001). As a means of improving comparisons between the various sampling techniques, we calculated sample-based rarefaction curves using Estimates 5.0.1 (Colwell 1997). Rarefaction curves are created by repeatedly determining richness for random samples of individuals from the data. These curves allow for comparisons of species richness at specific numbers of individuals, which may be more appropriate in many situations than comparing species density between samples having different numbers of individuals (Colwell and Coddington 1994, Gotelli and Colwell 2001).
Richness estimation and rarefaction analyses were performed for Anacostia River trawl samples, stationary water trap collectors B, C, and D combined, wind traps, and drift line and goose feces samples. We acknowledge that the various sampling techniques we used necessarily differed in mechanism and level of effort and thus may have over- or under-represented certain species (Gotelli and Colwell 2001). However, we also believe it is more meaningful to use rarefaction curves to compare richness of different sampling techniques than to use the species density data (Gotelli and Colwell 2000), which are strongly dependent on densities of individuals observed and, hence, level of sampling effort. As another means of comparing between different sampling techniques, we estimated "S," the total number of species in the sampled community, using non-parametric asymptotic species richness estimators for the stationary wind and water traps and the trawl samples in Estimates (estimators used were Chao 1 (Chao 1984), Chao 2 (Chao 1987), and Jackknife 1 and Jackknife 2 (Burnham and Overton 1978, 1979), reviewed by Colwell and Coddington (1994)). We used multiple species richness estimators because the individual estimators may or may not reach asymptotes, depending on the data set.
Plant nomenclature follows the USDA PLANTS database (USDA, NRCS 2001) and taxonomy was determined according to Brown and Brown (1984, 1992). Identification was to species level, with the exception of Typha spp. (which did not flower in the greenhouse), sedges that did not flower or were not identifiable based on vegetative morphology (there were identified as Cyperaceae ), and dicot seedlings that never flowered or died before they grew large enough to identify (these were identified as dicotyledons (Class Magnoliopsida)). Hereafter, seedlings at all taxonomic levels are referred to as "species" for simplicity.
83
Results
We found a total of 125 species using the various dispersal sampling methods, with the most species (80-90) and greatest total number of emerging seedlings (1,900-3,700) occurring in the Anacostia River trawl samples and the lower levels of the stationary water traps (Table 1). Species density (number of species per sample) and seedling density (number of seedlings emerging per sample) were greatest in the trawl samples, intermediate in the stationary water and drift line samples, and lowest in the wind and goose feces samples. However, the sample types varied widely in the number of samples collected ( 4-46), surface area of samples (0.05-384 m2
),
and duration of sample collection (ranging from instantaneous grab sampling to 7 months). Adjustment of seedling emergence for area revealed that the greatest densities of
emerging seedlings on an areal basis were present in the drift line samples (about 1500 seedlings/m2
). Time- and area-adjusted seedling density and species density were significantly greater for stationary water traps (about 210 seedlings/m2/month and 14 species/sample) than wind traps (about 18 seedlings/m2/month and 2 species/sample) for November 2000 through June 2001 (F1,58 =88.7, P<0.0001 and F1,5s=123.8, P<0.0001, respectively). There were no significant differences between months for seedling density (seedlings/m2
) of trawl samples along the river or for seedling density of stationary water traps facing Kingman Marsh compared to those facing the Anacostia River (P>0.05). The trawling samples collected more individuals per sample than any other method, although density was lower than in samples using the other methods when expressed on an areal basis (Table 1 ). Additionally, the area-adjusted seedling density of Offsite Wetland trawl samples was about four times that of the Anacostia River trawl samples, suggesting that these wetlands are potential seed sources for downstream wetlands.
Ofthe most abundant species, Cyperus odoratus, Ludwigia palustris, and unknown dicot seedlings were widespread in the environment, occurring in samples from all sample types (Table 1 ). Additionally, Bidens frondosa, Boehmeria cylindrica, unknown Cyperaceae, Cyperus erythrorhizos, and Eclipta prostrata occurred in all sample types except for goose feces. Schoenoplectus fluviatilis occurred in all sample types except drift line and was the most abundant species in goose samples. While not among the five most abundant species in any sample type, the non-native invasive Lythrum salicaria (purple loosestrife) occurred in wind and water traps and trawl samples, and two seedlings of the invasive grass Phragmites australis occurred in one Offsite Wetland trawl sample.
Despite the occurrence of these species in most or all sampled dispersal pathways, there was considerable variability in abundance of seeds between sample types. For example, Boehmeria cylindrica, Leersia oryzoides, Ludwigia palustris, Pi/ea pumila, and Typha spp. were much more abundant in the trawl samples than in the stationary water traps (Table 1 ). Additionally, these species occurred at their greatest abundance in the Offsite Wetland trawl samples. The distributions of these species contrast with those of Cyperus erythrorhizos and Bidens frondosa, which were most abundant in stationary water traps (heights B-D), and unknown Cyperaceae, Juncus ejfusus, Lindernia dubia, and Ulmus rubra, which were most abundant in drift line samples. Celastrus scandens occurred primarily in stationary wind trap samples and height A of the stationary water traps, suggesting it was primarily wind- or birddispersed.
While the total number of species observed was greatest in trawl and water trap samples, rarefaction analysis indicated that, at 20 individuals, the goose feces species richness was greater than that of the other dispersal methods (Table 2). This means that, even though few seedlings
84
were identified in a low number of goose feces samples (Table I), the species richness of those individual seedlings was greater than would be expected at similar numbers of individuals sampled using the other methods. Similarly, when comparing the remaining methods at a larger number of individuals (up to 250), drift-line samples had the largest number of species for a given number of individuals. The lower stationary water traps (heights B-D), the seed dispersal method with the largest number of discovered individuals and most samples (Table I) had estimated total richness reaching an asymptote for estimators Chao 1 (111±1.8 species), Chao 2 (106±1.4), and Jackknife 2 (121; no variance equation developed for this estimator). This suggests that if we continued to sample using this method until we collected every possible seed species, the total number of seed species would be at least 105-120 (for a review of species richness estimators, see Colwell and Coddington 1994). For the other sampling methods, Chao 2 was the only estimator reaching an asymptote, and this estimate could only be made for trawl samples and wind traps, with the drift line and goose feces methods having too few samples to reach asymptotes (Table 2). Comparing the number of species observed (Table 1) with the Chao 2 estimates indicates that the percent of the total species pool we collected was 79% for river trawling, 84% for stationary water traps, and 72% for wind traps.
Discussion
Relative Importance of Dispersal Pathways
Water dispersal was the predominant seed dispersal pathway in the environment of the Kingman Marsh site, a finding consistent with Middleton (1995). Stationary water traps had an order of magnitude greater seedling density and more than twice the species density and total number of species than wind traps. Similarly, species richness estimators of stationary water and wind trap data indicate that the pool of species dispersing via water was about twice that of wind-dispersed species. Even though total seed densities expressed on an area basis were much lower in trawling samples than for stationary water trap samples, similar numbers of species were found in both, further demonstrating the importance ofhydrochory in establishing and maintaining diversity. Drift line samples, while few in number, had the greatest area-adjusted seedling emergence densities, providing additional evidence of prolific water dispersal. The few goose feces samples we collected are insufficient to characterize the importance of this pathway relative to wind and water dispersal, but our results suggest that this is an important pathway for some species.
The species composition of dispersed seeds differed from that of the vegetation at the restored Kingman Marsh and at natural tidal freshwater wetlands of the mid-Atlantic U.S. coast. For example, several of the important annuals we observed occur in natural tidal freshwater marshes (e.g., Bidens.frondosa, Cyperus odoratus, Lindernia dubia, and Pilea pumila), but seeds of other annuals common in vegetation of tidal freshwater marshes were rare in or absent from our dispersal samples (e.g., Amaranthus cannabinus (L.) Sauer, Ridens laevis (L.) B.S.P., Impatiens capensis Meerb., and Polygonum arifolium L. Similarly, we observed dispersing seeds of Boehmeria cylindrica, Leersia oryzoides, and Schoenoplectus fluviatilis, perennial species of natural tidal freshwater marshes, but seeds of other common marsh perennials, such as Acorus calamus, Peltandra virginica, Pontederia cordata, Sagittaria latifolia, and Schoenoplectus tabernaemontani, were rare in or absent from our samples.
85
)
J J )
_)
)
)
)
)
)
J
)
)
)
_)
_)
)
Implications for Wetland Restoration
Species that are absent or rare in seed dispersal pathways are potential candidates for reintroduction. Conversely, those that are prolific colonizers need not be planted. For example, at the Kenilworth Marsh restoration site mentioned in the Introduction, Leersia oryzoides was planted at considerable cost but after construction was observed to be a prolific colonizer (Syphax and Harnrnerschlag 1995). Our results show that Leersia is dispersed via water on the Anacostia River, a finding that, had it been available at the time, would likely have eliminated Leersia from the planting list for Kenilworth. Seed dispersal studies can also provide advance warning of potential colonization by non-native or invasive species. For example, we observed water- and wind-dispersed seeds of Lythrum salicaria, which colonized the Kingman Marsh site even before planting was completed.
While sampling of seed dispersal pathways may describe the pool of propagules available for colonization at restored sites, the species that actually become established will be constrained by the availability of sites suitable for germination, seedling establishment, and growth. In particular, factors such as flooding and animal disturbance can inhibit seedling recruitment in restored and natural tidal freshwater marshes (Neff 2002). In the case of our drift line samples, for example, the abundance of seeds does not mean that plants will become established at that location. Therefore, the pool of seeds dispersing via wind, water, and animals is an indicator of the propagules available for colonization but not a determinant of species that will ultimately colonize. At the Kingman Marsh site, hydrology and animal activity are important determinants of vegetation establishment from dispersing seeds (Neff 2002)
References
Bakker, J.P., P. Esselink, K. S. Dijkema, W. E. van Duin, and D. J. de Jong. 2002. Restoration of salt marshes in the Netherlands. Hydrobiologia 478:29-51.
Baldwin, A.H. and E. F. DeRico. 2000. The seed bank of a restored tidal freshwater marsh in Washington, DC. Urban Ecosystems 3:5-20.
Brown, M. L. and R. G. Brown. 1984. Herbaceous Plants of Maryland. Port City Press, Baltimore, MD, USA.
Brown, M. L. and R. G. Brown. 1992. Woody Plants of Maryland. Port City Press, Baltimore, MD,USA.
Burnham, K. P. and W. S. Overton. 1978. Estimation of the size of a closed population when capture probabilities vary among animals. Biometrika 65:623-633.
Burnham, K. P. and W. S. Overton. 1979. Robust estimation of population size when capture probabilities vary among animals. Ecology 60:927-936.
Chao, A. 1984. Nonparametric estimation of the number of classes in a population. Scandinavian Journal of Statistics 11 :265-270.
86
Chao, A. 1987. Estimating the population size for capture-recapture data with unequal catchability. Biometrics 43 :783-791.
Colwell, R. K. 1997. Estimates: statistical estimation of species richness and shared species from samples. Version 5. User Guide and Application. http://viceroy.eeb.uconn.edu/estimates.
Colwell, R. K. and J. A. Coddington. 1994. Estimating terrestrial biodiversity through extrapolation. Philosophical Transactions of the Royal Society of London 345: 101-118.
Gotelli, N. J. and R. K. Colwell. 2001. Quantifying biodiversity: procedures and pitfalls in the measurement and comparison of species richness. Ecology Letters 4:379-391.
Gross, K. L. 1990. A comparison of methods for estimating seed numbers in the soil. Journal of Ecology 78:1079-1093.
Middleton, B. A. 1995. Sampling devices for the measurement of seed rain and hydrochory in rivers. Bulletin of the Torrey Botanical Society 122:152-155.
Middleton, B. 1999. Wetland Restoration, Flood Pulsing, and Disturbance Dynamics. John Wiley and Sons, New York, NY, USA.
Neff, K. P. 2002. Plant colonization and vegetation change in a restored tidal freshwater wetland in Washington, DC. M. S. Thesis. University of Maryland, College Park, MD, USA.
Poiani, K. A. and W. C. Johnson. 1988. Evaluation of the emergence method in estimating seed bank composition of prairie wetlands. Aquatic Botany 32:91-97.
Syphax, S. W. and R. S. Hammerschlag. 1995. The reconstruction of Kenilworth Marsh-the last tidal marsh in Washington, D.C. Park Science 15:16-19.
87
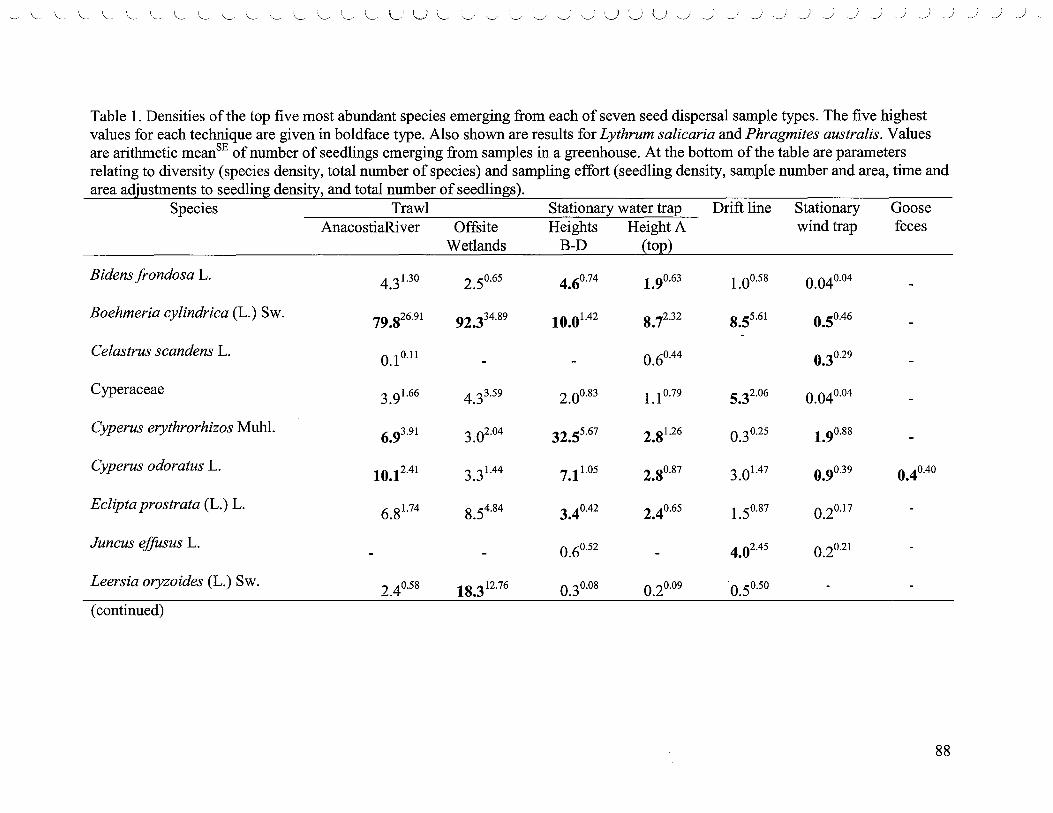
~ "-- "-- "-- "-- "--- \__ \__ \__ \__ \__ \__ ,_____ L L L \___i U L '-_./ '-.../ u ~· '-../ '-.../. 0 J U J _) _) _) _J _J _) _J _) _) _J _) -;
Table 1. Densities of the top five most abundant species emerging from each of seven seed dispersal sample types. The five highest values for each technique are given in boldface type. Also shown are results for Lythrum salicaria andPhragmites australis. Values are arithmetic mean SE of number of seedlings emerging from samples in a greenhouse. At the bottom of the table are parameters relating to diversity (species density, total number of species) and sampling effort (seedling density, sample number and area, time and area adjustments to seedling density, and total number of seedlings).
Species Trawl Stationary water trap Drift line Stationary Goose AnacostiaRiver Offsite Heights Height A wind trap feces
Wetlands B-D (top)
Ridens frondosa L. 4.31.30 2.50.65 4.60.74 1.90.63 1.00.58 0.040.04
Boehmeria cylindrica (L.) Sw. 79.826.91 92.334.89 10.01.42 8.72.32 8.55.61 0.50.46
Celastrus scandens L. 0.10.11 0.60.44 0.30.29 - -
Cyperaceae 3_91.66 4.33.59 2.00.83 1.10.79 5.32.06 0.040.04
Cyperus erythrorhizos Muhl. 6.93.91 3.02.04 32.55.67 2.81.26 0.30.25 1.90.88
Cyperus odoratus L. 10.12.41 3.31.44 7.11.05 2.80.87 3.01.47 0.90.39 0.40.40
Eclipta prostrata (L.) L. 6.81.74 8.54.84 3.40.42 2.40.65 1.50.87 0.20.17
Juncus ejfusus L. 0.60.52 - 4.02.45 0.20.21
Leersia oryzoides (L.) Sw. 2.40.58 18.312.76 0.30.08 0.20.09 0.50.50
( continued)
88
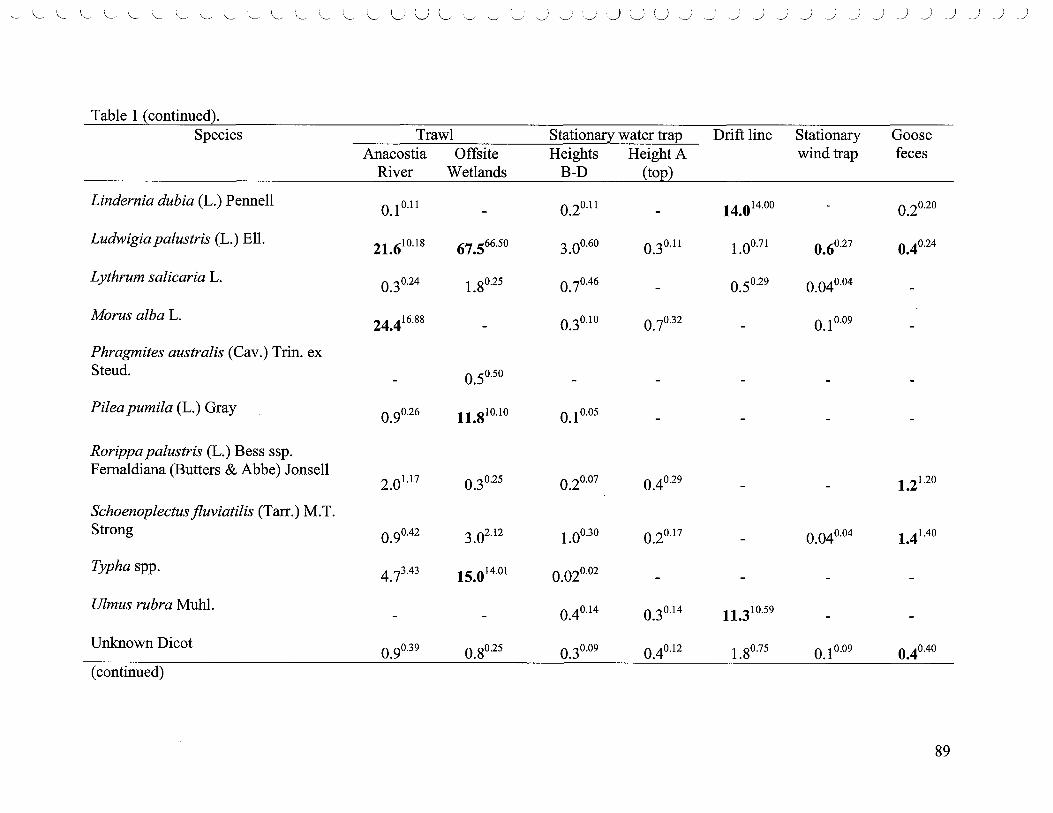
~ \_. \.... \_ \_ \_ \..... "- \..... \_ L \..... L .\_. \_ '"- L U L ·'-./ '-./ ~ '-./ '__,/ u ~ .__) (._) _; ._) ._) ~ ._) ~ ._) ~ ~ ~ ~ ~ ~ ~
Table 1 ( continued). Species Trawl Stationary water trap Drift line Stationary Goose
Anacostia Offsite Heights Height A wind trap feces River Wetlands B-D (top)
Lindernia dubia (L.) Pennell 0.10.11 - 0.20.11 - 14.014.00 0.20.20
Ludwigia palustris (L.) Ell. 21.610.18 67.566.50 3.00.60 0_30.11 1.00.71 0.60.27 0.40.24
L ythrum salicaria L. 0.30.24 1.80.25 0.70.46 - 0.50.29 0.040.04
Marus alba L. 24.416.88 0.30.10 0.70.32 O. l o.o9 - -
Phragmites australis (Cav.) Trin. ex Steud. 0.50.50
Pi/ea pumila (L.) Gray 0.90.26 11.810.10 0.10.05
Rorippa palustris (L.) Bess ssp. Femaldiana (Butters & Abbe) Jonsell
2.01.17 0.30.25 0.20.07 0.40.29 1.21.20 - -
Schoenoplectusjluviatilis (Tarr.) M.T. Strong 0.90.42 3.02.12 1.00.30 0.20.17 - 0.040.04 1.41.40
Typha spp. 4.73.43 15.014.01 0.020.02
Ulmus rubra Muhl. 0.40.14 0.30.14 11.310.59
Unknown Dicot 0.90.39 0.80.25 0.30.09 0.40.12 l _80.15 O. l o.o9 0.40.40
( continued)
89
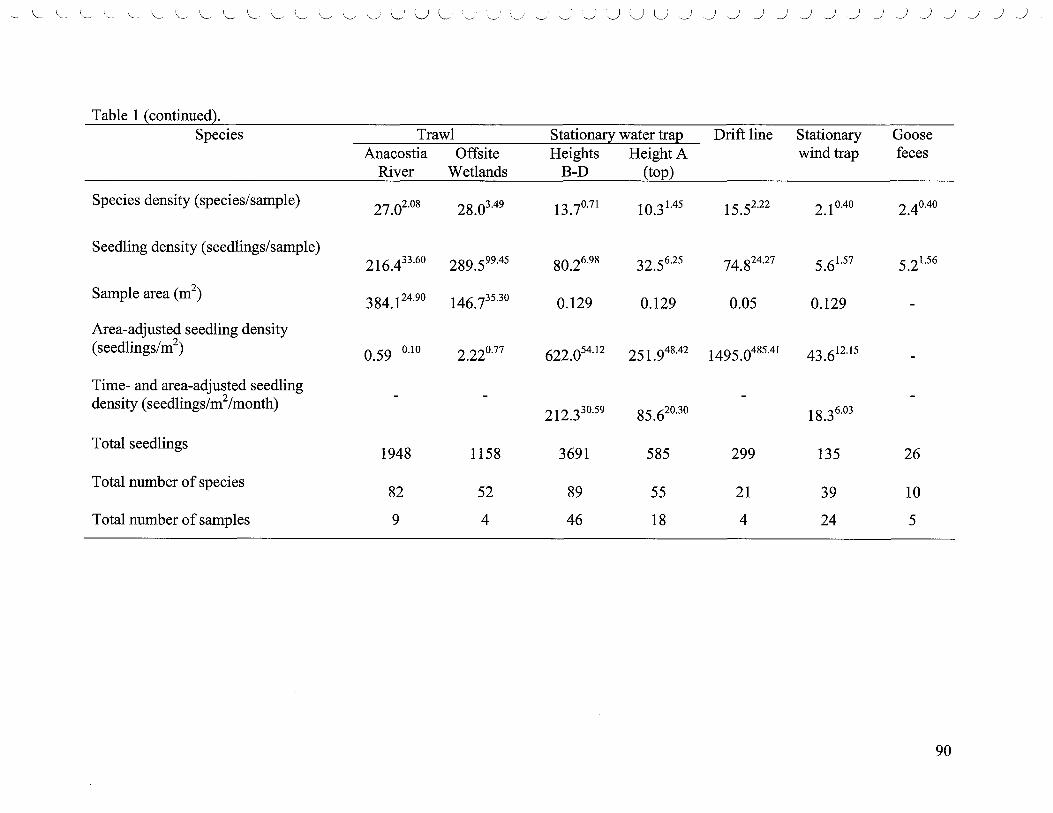
- ~~~~~LL LL LL LL LL L' UL L ~ 0 ~ ~ ~ ~ U ~ ~ ~ ~ ~ ~ ~ ~ ~ ~ ~ ~ ~ ~ ~
Table 1 ( continued). Species Trawl Stationary water trap Drift line Stationary Goose
Anacostia Offsite Heights Height A wind trap feces River Wetlands B-D (top)
Species density (species/sample) 27.02.08 28.03.49 13.70.71 10.31.45 15.52.22 2. 10.40 2.40.40
Seedling density (seedlings/sample) 216.433.60 289.599.45 80.26.98 32.5625 74.824.27 5.61.57 5.21.56
Sample area (m2) 384.i24.90 146.73530 0.129 0.129 0.05 0.129
Area-adjusted seedling density ( seedlings/m2) 0.59 0.10 2.220.77 622.054.12 251.948.42 1495.0485.41 43.612.15
Time- and area-adjusted seedling - - -density ( seedlings/m2 /month) 212.330.59 85.620.30 18.36.03
Total seedlings 1948 1158 3691 585 299 135 26
Total number of species 82 52 89 55 21 39 10
Total number of samples 9 4 46 18 4 24 5
90
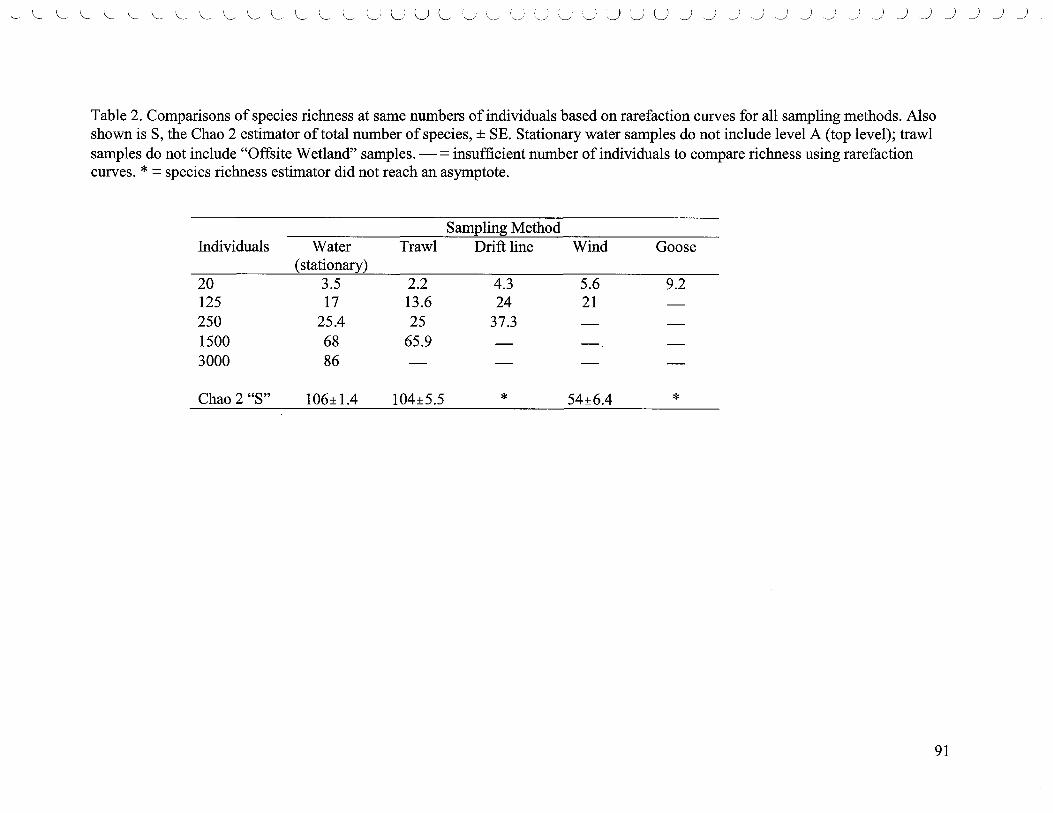
~LLLLLLLLLLLLLLL~UL~~~~~~~uu~~~~~~~~~~~~~~~
Table 2. Comparisons of species richness at same numbers of individuals based on rarefaction curves for all sampling methods. Also shown is S, the Chao 2 estimator of total number of species, ± SE. Stationary water samples do not include level A (top level); trawl samples do not include "Offsite Wetland" samples. - = insufficient number of individuals to compare richness using rarefaction curves. * = species richness estimator did not reach an asymptote.
Sampling Method Individuals Water Trawl Drift line Wind Goose
(stationary) 20 3.5 2.2 4.3 5.6 9.2 125 17 13.6 24 21 250 25.4 25 37.3 1500 68 65.9 - -3000 86
Chao 2 "S" 106±1.4 104±5.5 * 54±6.4 *
91
----I
' _)
)
j
)
)
)
)
)
)
)
)
j
J
J
J
J
)
j
Abstract
Part IV SEED BANK
Andrew H. Baldwin, Kelly Phyillaier Neff, and Kristen Rusello Department of Biological Resources Engineering
1423 Animal Science Building University of Maryland
College Park, Maryland, USA 20742
Seed banks play a key role in the establishment and maintenance of vegetation in many wetlands, but studies of seed bank development have rarely been included in evaluations of wetland restoration success. We compared the seed bank of a recently restored tidal freshwater marsh in Washington, DC (Kingman Marsh) with seed banks of three other tidal freshwater marshes (the 7-year old Kenilworth restored urban marsh, and two "natural" marshes, one urban and one relatively rural). Kingman Marsh was restored in 2000 by increasing sediment elevations using river dredge material and planting. We collected soil samples for seed bank assay using the emergence method in 2000 (after sediment placement but before planting), 2001 and 2003. Kingman rapidly colonized between 2000 and 2001. By 2003, Kingman was similar to each of the other marshes with regards to emerged seedlings, tax.a density, and evenness. In 2000, Kingman contained an average of2 species/pan; in 2003, there were approximately 10 species/pan. The evenness at Kingman in 2003 was 0.67. This was less than the evenness of the two natural marshes, but higher than the other restored marsh. Based on S0renson's Similarity Index for species composition, Kingman was most similar to the other restored marsh in 2001 and 2003. It is, however, becoming more similar to the natural marshes with time. In 2003, six of the top ten dominant species at Kingman were also found in at least one of the two natural marshes and included: Cyperus spp., Juncus effusus, Ludwigia palustris, Lythrum salicaria, Rorippa palustris, and Typha sp. Seed banks of both of the restored sites contained few or no seeds of several important species at the natural sites, including Polygonum sagittatum, Polygonum punctatum, and Pilea pumila.
Restored wetlands starting with few seeds in the soil can thereby quickly develop a dense seed bank, provided sufficient densities of propagules can be dispersed to the site. In these situations, supplemental planting may not be necessary. Seed banks are relatively easy to study and, in conjunction with vegetation monitoring, provide an understanding of vegetation dynamics that integrates species composition, seed dispersal, germination, establishment, and growth. Therefore, we suggest that seed banks are a valuable metric of wetland restoration success and urge that seed bank studies be incorporated into monitoring programs for restored wetlands.
92

)
)
_)
)
j
J )
)
)
)
l j
J
_)
J
)
_)
J
J
J
J
Introduction
The seed bank is an important component of wetland plant community dynamics, particularly in tidal freshwater marshes. Standing vegetation composition in tidal freshwater marshes, including vegetation reproduction, is strongly influenced by the seed at the site, with different species having different degrees of dependence on seed. The seed bank (i.e., buried viable seeds and propagules) is determined by the production of seed from past and current vegetation and the seed longevity in the site, and develops over decades.
Constructed wetlands often start with poor seed banks, and seed bank richness in some restored wetland systems has been reported to be lower than in reference. Leck (2003) reported seed density and seed bank richness to be low the first year in a restored tidal wetland and quickly increased, with high seed dispersal implicated as a possible cause. After only a short amount of time, seed density and richness was found to be higher in restored sites than reference sites of tidal freshwater wetlands (Baldwin and DeRico, 2000; Leck, 2003).
Comparisons of seed banks of restored wetlands to reference wetlands may be a good measure of restoration success (Baldwin and DeRico, 2000). In addition, examining the seed bank for presence of invasive or undesirable species allows predictions of the susceptibility of the restored site to an invasion. In order to understand the initial development of seed banks after a wetland restoration, we examined changes in the seed bank of the Kingman Marsh restored wetland the first year after construction then two years later and compared these seed banks with those of an older restored wetland (Kenilworth Marsh) and two natural wetlands. We hypothesized that the seed bank of the newly restored site would develop quickly as reported for other sites (Baldwin and DeRico, 2000; Leck, 2003). We also began the exploration of a hypothesis that species either exhibit allobanking, when a species establishes through environmental factors, or autobanking, when a species mainly establishes through its own seeding when populating a site. Through a quantitative evaluation of seed bank development, we also hoped to explore the utility of seed bank studies in evaluating the success of restored or constructed wetlands for determining the types and quantities of plantings needed.
Methods
Seed bank sampling
Seed bank samples were collected at each of the transects used in the vegetation monitoring program, although that number changed between 2000 and 2001 (Table 1). These study sites were Kingman Marsh (restored in 2000), Kenilworth Marsh (restored in 1992-93), and two natural wetlands, one urban (Dueling Creek) and one relatively rural (Patuxent Wetland Park). Samples collected from different cells or fill areas within each restored site were combined to increase sample number for analysis.
93
)
)
J )
j
j
j
)
j
)
)
j
j
j
)
j
j
j
j
j
Transects were divided into seven 5 meter long sectors, and a 4.8 cm diameter by 5 cm deep core of soil (surface area= 18.1 cm2
, volume= 90.4 cm3) was taken for seed bank
assay at each of the five middle sectors. Samples were taken from the first third of these sectors in May 2000, the middle third in March 2001, and the last third in March 2003, so that samples were not taken from the exact location as those from previous years. Samples were combined for the entire transect to form a composite sample of approximately 450 cm3 per transect (surface area= 90.4 cm2
). The later collection date in 2000 was due to the late placement of dredge material at Kingman in May 2000. In both 2000, 2001, and 2003 the seed bank sampling date was after the period of natural cold stratification.
In order to see if surface sediments contained recently dispersed seeds that were not present in the dredge material, we collected Kingman fill soil samples at the depth 0.45 to 0.50 musing an Edelman auger in May 2000 (Eijkelkamp, Agrisearch Equipment, Giesbeek, The Netherlands). These samples were taken near the location of the surface seed bank samples. Three subsurface samples were taken from each transect and mixed to create one composite sample for each transect.
All samples were stored at 4 ° C until processed. Coarse organic matter and large vegetative parts (e.g., living rhizomes), if present, were removed from the soil. The sample was thoroughly mixed. One half of this soil sample was spread in an approximately 1.3 cm thick layer on top of 3.5 cm of moist vermiculite in aluminum pans (15.6 cm by 21.8 cm surface area, 5.1 cm depth) with perforations on the bottom to allow drainage. These were randomly placed on a greenhouse misting bench at the University of Maryland. Samples from 2000 were put in the greenhouse in mid May 2000, samples from 2001 were put in the greenhouse in early April 2001, and samples from 2003 were placed in the greenhouse in mid-March 2003. Sediment in the pans remained moist but not inundated. In 2000 and 2001, only half of the sample was used in the experiment, while in 2003 the experiment utilized the whole sample because a flooded treatment was included to determine flooding effect on seedling emergence. Emerging seedlings were identified and counted for seven months in 2000 and 2001, and for nine months in 2003. Unknown species were transplanted and grown until they could be identified. This emergence method gives an acceptable estimate of species composition of buried wetland viable seeds (Poiani and Johnson, 1988) and is commonly used in wetland seed bank. The USDA Plants Database Version 3.5 (http://plants.usda.gov/; 2005) and Brown and Brown (1984;1992) were consulted for plant taxonomy, nomenclature and life history (Neff, 2002).
Data analysis
Total seedling emergence (number of total seedlings emerged/pan), density/m2
(number of seedlings/pan extrapolated to a square meter), taxa density (number of species/sample), and Pielou's J (a measure of evenness) were analyzed with a repeated measures ANOV A (SAS version 8.2 for Windows, SAS Institute, Cary, NC, Proc Mixed) to detect differences in these parameters across years and sites. An alpha level of 0.05 determined significance. We ran the Tukey-K.ramer test to determine pairwise mean comparisons on these parameters. Total seedling emergence and density/m2 were log transformed [log10 (x + 1)] to meet the assumptions of analysis of variance; all other
94
)
)
_)
J _)
J )
)
)
)
__)
__)
)
_)
)
_)
J
j
j
j
parameters met the assumptions. Means were detransformed for presentation. Pielou's J was calculated as: J = H' /log S (McCune and Grace, 2002). The closer a value to one, the more even the distribution of abundance across species. H' is the Shannon-Wiener diversity measure, calculated as: H' = - L (pi log pi) where pi is the percentage importance based on relative density and S is the species richness per plot (McCune and Grace, 2002). S0renson's quotient of similarity was used to examine the similarity in seed bank species composition between the four sites: qs=2c/(a+b); c = number of species occurring in common at both sites; a = total number of species found at site a; and b = total number of species occurring at site b (S0renson, 1948). The closer a value is to one between two sites, the more similar they are.
The total number of annuals and natives was determined for each site in each year. The Chi-square test of independence (SAS version 8.2 for Windows, SAS Institute, Cary, NC, Proc Freq) was then used to determine if the composition of annuals vs. perennials and natives vs. non-natives found at each site was independent of site. Species classified as annual/biennial or annual/perennial in the USDA PLANTS Database Version 3.5 (http://plants.usda.gov/; 2005) were included with the annuals. Fisher's Exact Test was used for 2000 data because the sample size was potentially too small for a valid Chi-square test. Vegetation identified only to family or genus was not included in the S0renson's similarity index or Chi-square calculations. In addition, the number of samples taken increased in 2001 at some sites (i.e., Kingman increased from 12 to 18 samples and Patuxent from 5 to 6 samples) and total seedling emergence increased over the year at some sites. Dominant species in 2003 were determined based on the arithmetic mean number of seedlings per pan. Arithmetic means were used because sample sizes were too small for mixed model analysis of variance. Unidentified dicots and monocots were not included in the dominant species list. Phragmites australis was assumed to be the non-native genotype for classification purposes.
Results
Seedling emergence density, taxa density, and evenness all varied siginificantly between sites and sample years, and site x year interactions were also significant, indicating that the degree of difference between sites depended on sample year (Table 2). In 2000, Kingman had lower seedling emergence densities ( approximately 310 seeds/m2
)
than all other sites, with values being significantly lower at Kingman than at Kenilworth (Figure 1, see Number of Seedlings). Density varied significantly between 2000 and 2001 only at Kingman (Figure 1 ). Between 2000 and 2001, seedling densities increased significantly and by >58 times at Kingman to more than 25,300 seeds/m2
• At this point, Kingman had seedling densities greater than the natural sites, but not higher than densities at Kenilworth. In 2003, there was no significant difference between the four sites with regard to seedling density. The mean seed bank densities, adjusted to a square meter basis, for each site in 2003 were: 19,092 seeds/m2 at Dueling Creek; 28,985 seeds/m2 at Kingman Marsh; 48,498 seeds/m2 at Kenilworth Marsh; and 9073 seeds/m2 at Patuxent River Park. In 2000, seed bank taxa density was significantly lower at Kingman (approximately 2 species per sample) than at Kenilworth (approximately 11 species per sample) (Figure 1). In 2003, 38 species emerged from Kingman seed bank samples, more than at any other site (Table 3). Taxa density at Kingman increased significantly in 2001
95
by 6 times to levels higher than at the other sites, being significantly higher than at Patuxent. Taxa density at Patuxent increased significantly from 2000 to 2003, becoming similar to all other sites by 2003 with regard to number of species. As was the case for seedling density, interactions between site and year were significant, indicating that changes in taxa density between 2000 and 2003 differed between sites. Evenness, which is a measure of how well species are distributed across a site, showed a significant decline from 2000 to 2003 at Kingman (Figure 1). Kingman's evenness fell from its initial high in 2000 of 0.9 to 0.6 in 2001 and 0.65 in 2003. Overall, Patuxent maintained the greatest evenness across years, although it did experience a continuous but not significant decline in evenness from 2000 to 2003, which did not occur at the other sites. By 2003, all the sites were similar in their evenness. There were no significant differences between surface and subsurface samples in 2000 at Kingman for seed bank seedling density (F1,1s<0.0l, P=0.95), species density (F1,15=0.0l, P=0.94), or diversity (F 1,1s=0.06, P=0.80).
S0renson's similarity index for 2003 suggests that species composition of Kingman was most similar to Kenilworth and least similar to Patuxent, the same results found in 2001 (Table 4). Kenilworth species composition was about as similar with Dueling Creek as Kingman was with Kenilworth. Similarity values in 2001 were low, with the most similar sites sharing <60% of the species, suggesting the populations were fairly different even between the most similar sites. Similarity indices increased across the board in 2003, however, with the exception of Patuxent and Kenilworth, which decreased by 0.01. All urban sites were least similar to Patuxent in both years.
In 2000, about 6% of emerging seedlings from Kingman were annual species, increasing by >6 times in 2001, and then decreased by more than half in 2003 to 11 % (Table 5). In 2001, Kingman had approximately 26% annual seeds in the seed bank, more than any other site. By 2003 Patuxent had the highest percentage of annual species with 57% annuals. Kenilworth had approximately 7% annuals and Dueling Creek had about 9% in 2003. Fisher's Exact Test (for 2000) and the chi-square test of independence (for 2001 and 2003) were significant all three years (2000: p <0.0001; 2001: x20.os,3=359.8310, p <0.0001; 2003: x20.os,3=518.1178, p <0.0001) demonstrating that the percentage of annuals is not randomly distributed across sites. The percentage of native species at Kingman decreased in 2003 to about 70% from a high of approximately 97% in 2001 (Table 5). Dueling's native species steadily increased across years, while Patuxent remained fairly static. Patuxent's seed bank, however, was already largely comprised of native species ( ~90% + ). Kenilworth Marsh varied between years, but became similar to Dueling Creek. The chi-square test of independence (for 2000, 2001 and 2003) was significant all three years (2000: x2o.o5,3=172.4, p <0.0001; 2001: x2o.os,3= 1507.2, p <0.0001; 2003: x2o.os,3= 434.8, p <0.0001). These findings signify that the distribution of native species is dependent on site.
Species of importance at Kingman differed between years and between other sites. Kingman seed bank samples were dominated by Juncus effusus and Juncus tenuis in 2000, although even these species occurred at only about 2 seedlings/sample of each species. In 2001, Lindernia dubia, Ludwigia palustris, and Cyperaceae species were predominant and many other species occurred at levels higher than Juncus spp. did in 2000. Dominants in 2003 at Kingman included Ludwigia palustris and Lythrum salicaria (with approximately 70 seedlings/sample for each species) (Table 3). Dominant species at
96
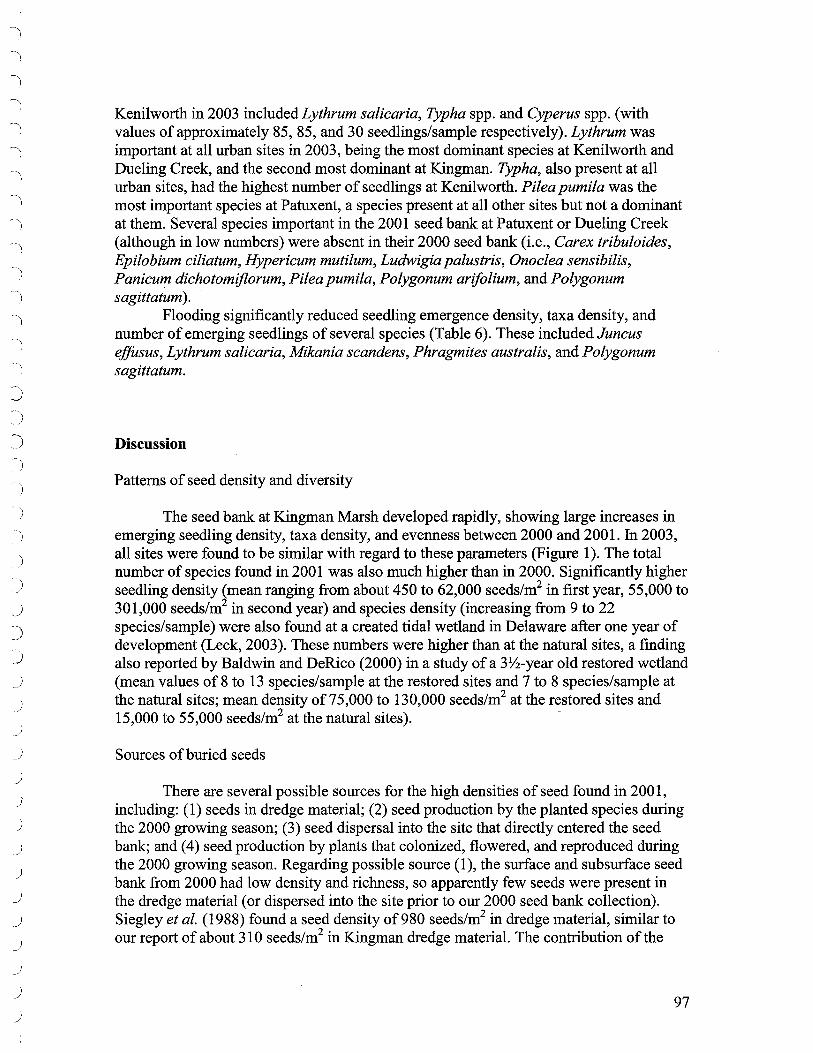
Kenilworth in 2003 included Lythrum salicaria, Typha spp. and Cyperus spp. (with values of approximately 85, 85, and 30 seedlings/sample respectively). Lythrum was important at all urban sites in 2003, being the most dominant species at Kenilworth and Dueling Creek, and the second most dominant at Kingman. Typha, also present at all urban sites, had the highest number of seedlings at Kenilworth. Pi/ea pumila was the most important species at Patuxent, a species present at all other sites but not a dominant at them. Several species important in the 2001 seed bank at Patuxent or Dueling Creek (although in low numbers) were absent in their 2000 seed bank (i.e., Carex tribuloides, Epilobium ciliatum, Hypericum mutilum, Ludwigia palustris, Onoclea sensibilis, Panicum dichotomiflorum, Pi/ea pumila, Polygonum arifolium, and Polygonum sagittatum ).
Flooding significantly reduced seedling emergence density, taxa density, and number of emerging seedlings of several species (Table 6). These included Juncus effusus, Lythrum salicaria, Mikania scandens, Phragmites australis, and Polygonum sagittatum.
Discussion
Patterns of seed density and diversity
The seed bank at Kingman Marsh developed rapidly, showing large increases in emerging seedling density, taxa density, and evenness between 2000 and 2001. In 2003, all sites were found to be similar with regard to these parameters (Figure 1 ). The total number of species found in 2001 was also much higher than in 2000. Significantly higher seedling density (mean ranging from about 450 to 62,000 seeds/m2 in first year, 55,000 to 301,000 seeds/m2 in second year) and species density (increasing from 9 to 22 species/sample) were also found at a created tidal wetland in Delaware after one year of development (Leck, 2003). These numbers were higher than at the natural sites, a finding also reported by Baldwin and DeRico (2000) in a study of a 3½-year old restored wetland (mean values of 8 to 13 species/sample at the restored sites and 7 to 8 species/sample at the natural sites; mean density of 75,000 to 130,000 seeds/m2 at the restored sites and 15,000 to 55,000 seeds/m2 at the natural sites). -
Sources of buried seeds
There are several possible sources for the high densities of seed found in 2001, including: (1) seeds in dredge material; (2) seed production by the planted species during the 2000 growing season; (3) seed dispersal into the site that directly entered the seed bank; and ( 4) seed production by plants that colonized, flowered, and reproduced during the 2000 growing season. Regarding possible source (1), the surface and subsurface seed bank from 2000 had low density and richness, so apparently few seeds were present in the dredge material ( or dispersed into the site prior to our 2000 seed bank collection). Siegley et al. (1988) found a seed density of 980 seeds/m2 in dredge material, similar to our report of about 310 seeds/m2 in Kingman dredge material. The contribution of the
97

)
)
_j
)
_j
j
)
J _)
_J
_)
J _J
_J
_J
_J
_J
j
j
planted species to the seed bank, potential source (2), was negligible; four of the seven planted species were not detected in the 2001 seed bank and the remaining three that were occurred at low density. A low early contribution of planted species to the seed bank was also found by Collins and Wein (1995), with planting not affecting richness or species composition and only one species, Eleocharis quadrangulata, being present mainly in seed bank samples from planted sections. In addition, in a study by Leck (2003), of 14 species planted, only Sagittaria latifolia was found in the seed bank. Since this species was in the vegetation cover prior to the restoration, Leck suggests the seed was already present in the seed bank.
Of the remaining potential seed sources, (3) and (4), the seed dispersal studies at Kingman Marsh (included elsewhere in this report) have shown that high densities of seeds dispersed into Kingman Marsh, with the majority of species originally entering through tidal water dispersal and the rest entering through wind and animal dispersal. Since high densities of seed continued to be dispersed into Kingman throughout 2000, it seems likely that seed dispersal directly contributed some seed to the seed bank. By looking at the 2001 seed bank collected from transects with little or no vegetation cover in 2000, we were able to estimate relative quantities of seed entering through direct dispersal and seed entering through seed rain of adjacent vegetation. The three Kingman transects with low or absent 2000 vegetation cover had low seedling density (approximately 2,200 seeds/m2
) and species density (6 species/sample) in 2001, values only twice as high as those found for the seed bank in 2000, and values much lower than the overall seedling density and species density in 2001. Since seed rain directly from the vegetation cover contributed little seed to these three transects and increases in seed were dependent on dispersal, these findings suggest that seed rain from established volunteer (i.e., non-planted) vegetation was the source of the majority of seeds found in the 2001 seed bank. Many seeds that were dispersed into Kingman in 2000 grew, flowered, and seeded during the 2000 growing season (personal observation), with most species in the 2001 seed bank also being documented in the 2000 vegetation. Although dispersal of seed was responsible for originally getting the seed to the site, overall it appears that the majority of seed in the 2001 seed bank was a result of the rapid species establishment and seed production from 2000 vegetation.
We suggest two pathways that species follow when contributing to the seed bank, allobanking and autobanking. Allobanking applies to species such as Ludwigia palustris, which produces lots of seed that often disperses through hydrochory. Neff (2002) conducted trawls in the Anacostia River and at Kenilworth in 2000 and found an abundance of L. palustris seeds. Environmental factors, here tidal waters and soil elevations, primarily contribute to seed set and germination in allobanking, much the same way that species distribution is dictated by response to environmental factors in the allogenic succession model (Mitsch and Gosselink, 2000). Species such as Lythrum salicaria follow the autobanking process whereby a minor amount of seed comes in on the wind or in water, but most comes from the seeds already in the soil. Neff (2002) found few L. salicaria seeds in river trawls. Autobanking seeds rapidly germinate, flower and populate the seedbank with a large amount of seed that then continues the cycle. Autobanking follows the autogenic succession model where species determine their fate through environmental modification of the habitat (Mitsch and Gosselink, 2000).
98

~ )
)
)
)
)
_)
J
_j
J
J _)
_)
_j
Implications for wetland restoration
This study suggests that a large seed bank will quickly develop in restored or created wetlands with surface water connectivity to other wetlands. Before spending large sums of money in providing supplemental plant material, inexpensive seed bank tests may be a worthwhile investment before planting. If these seed assays reveal adequate densities of seed and the seed composition has low densities of undesirable species, there may be little need to provide additional propagules through planting or seeding. However, it may be necessary to supplement these propagules if there are certain desired species missing from the seed bank, as some species may take a long time to naturally reach the site (e.g., Acorus calamus, Impatiens capensis, Polygonum arifolium, Polygonum sagittatum ). It is still unclear if these restored wetland seed banks will ever resemble those of natural wetlands or if they will develop into something altogether different. The seed bank of Kenilworth still does not resemble those of the natural sites. Comparisons of Kenilworth at 10 years old (this study) versus Kenilworth at 3½ years old (Baldwin and DeRico, 2000) show that Kenilworth seed densities have decreased over time (mean of75,000-95,000 seeds/m2 to 40,000 seeds/m2
). In addition, richness values have increased over time (mean of 8.5-10.5 species/samples to 11 species/sample), suggesting that the seed bank at Kenilworth continues to change.
Comparison of the flooded and nonflooded treatments demonstrate the importance of hydrology for seedling recruitment. Only a few cm of flooding reduced the abundance of emerging seedlings and taxa density. This suggests that higher water levels will reduce establishment of nonnative species such as L ythrum salicaria, but will similarly influence colonization by natives. Small changes in elevation of restored sites will therefore likely have large effects on seedling recruitment.
In conclusion, seed banks are an important component of vegetation dynamics, providing a picture of the plant history at the site as well as the availability of seeds for regeneration following disturbance. Since the seed bank is a reflection of biotic and abiotic factors (e.g., vegetation, hydrology, disturbance, herbivores), and is relatively easy to study, we suggest that the seed bank is a valuable metric for evaluating the success of wetland restoration projects.
References
Baldwin, A.H. and Derico, E.F., 2000. The seed bank of a restored tidal freshwater marsh in Washington, D.C. Urban Ecosystems 3, 5-20.
Brown, M.L. and Brown, R.G., 1984. Herbaceous Plants of Maryland. Port City Press, Inc., Baltimore, MD.
Brown, M.L. and Brown, R.G., 1992. Woody Plants of Maryland. Port City Press, Inc., Baltimore, MD.
99
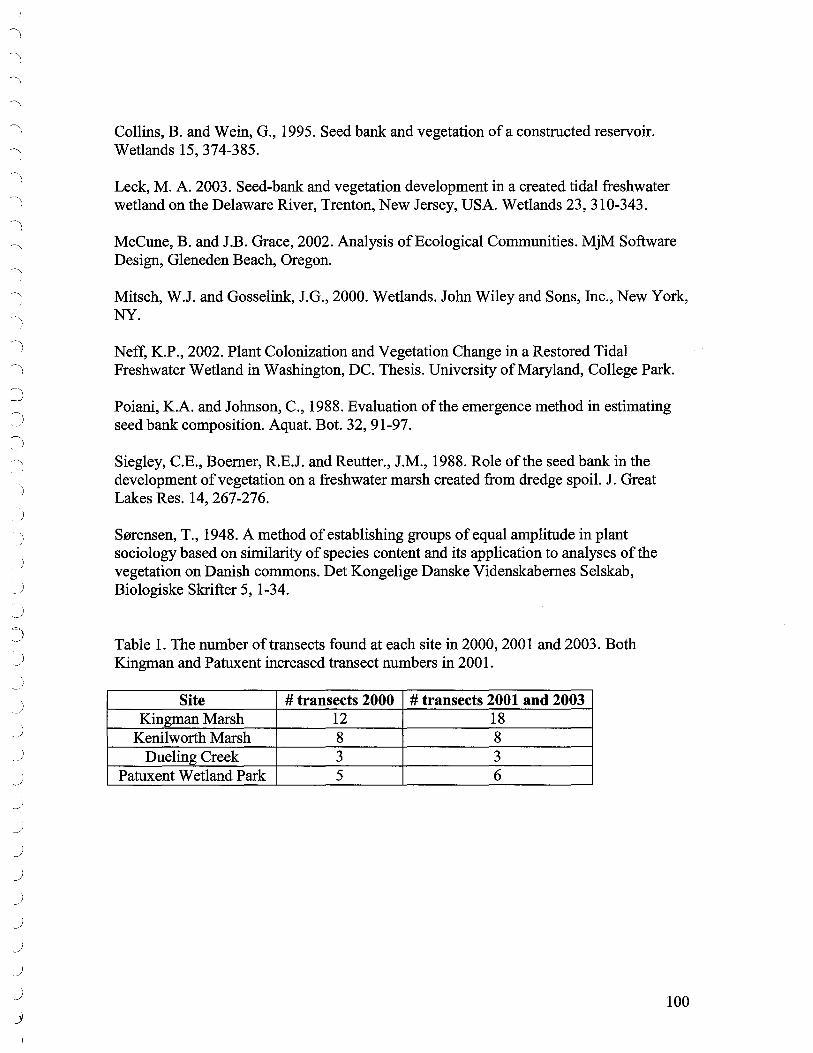
Collins, B. and Wein, G., 1995. Seed bank and vegetation of a constructed reservoir. Wetlands 15, 374-385.
Leck, M.A. 2003. Seed-bank and vegetation development in a created tidal freshwater wetland on the Delaware River, Trenton, New Jersey, USA. Wetlands 23, 310-343.
McCune, B. and J.B. Grace, 2002. Analysis of Ecological Communities. MjM Software Design, Gleneden Beach, Oregon.
Mitsch, W.J. and Gosselink, J.G., 2000. Wetlands. John Wiley and Sons, Inc., New York, NY.
Neff, K.P., 2002. Plant Colonization and Vegetation Change in a Restored Tidal Freshwater Wetland in Washington, DC. Thesis. University of Maryland, College Park.
Poiani, K.A. and Johnson, C., 1988. Evaluation of the emergence method in estimating seed bank composition. Aquat. Bot. 32, 91-97.
Siegley, C.E., Boemer, R.E.J. and Reutter., J.M., 1988. Role of the seed bank in the development of vegetation on a freshwater marsh created from dredge spoil. J. Great Lakes Res. 14, 267-276.
S0rensen, T ., 1948. A method of establishing groups of equal amplitude in plant sociology based on similarity of species content and its application to analyses of the vegetation on Danish commons. Det Kongelige Danske Videnskabemes Selskab, Biologiske Skrifter 5, 1-34.
Table 1. The number of transects found at each site in 2000, 2001 and 2003. Both Kingman and Patuxent increased transect numbers in 200 I.
Site # transects 2000 # transects 2001 and 2003 Kingman Marsh 12 18
Kenilworth Marsh 8 8 Dueling Creek 3 3
Patuxent Wetland Park 5 6
100

" I
)
J )
)
)
)
)
~ )
)
)
j
J j
)
j
j
)
j
j
J j
_/
)
)
J
J
J
j
)
Figure I. Values are least squares means± SE based on the 45.2 cm 2 surface area of each soil sample. Seedling numl: means and SEs were log 10+1 transformed, then detransformed for presentation.Means with different letters are significantly different across sites and years.These data rep resent non-flooded soil samp Jes only.
350
------Kingman
300 _._ Kenilworth Cl) -0- Dueling Ol 250 C -t::-- Patuxent
"O a Q) 200 a Q) Cl) ..... 150 0 a ... Q)
100 .n ab E ::J 50 z ab ab
0 e e
14
12 ab ab ab
10 ab
z. ab "iii C
8 Q) "O
Ill 6 X
Ill I-
4 e
2 e
0
1 .0
::::;-0.9 Cl)
-::J 0 a5 0.8 ~ abed Cl) abed Cl) 0.7 Q) bed C C Q)
0.6 ed > L1J d
0.5
Jan-00 Jan-01 Jan-02 Jan-03 Jan-04
Date of sample collection
101

)
)
)
)
)
)
~ )
) I
)
)
)
)
)
,!
)
J l )
)
)
)
J )
)
_)
)
)
J )
)
J )
) ~
J )
)
)
)
)
'1 /
) 102 )