Morphology of polypropylene/silica nano- and microcomposites
8
Morphology of Polypropylene/Silica Nano- and Microcomposites And - ela Pustak, 1 Irina Pucic ´, 1 Matjaz ˇ Denac, 2 Iztok S ˇ vab, 3 Janez Pohleven, 2 Vojko Musil, 2 Ivan S ˇ mit 1 1 Rud - er Bos ˇkovic ´ Institute, Division of Materials Chemistry, Bijenic ˇka 54, 10002 Zagreb, Croatia 2 FEB Maribor, Institute of Technology, University of Maribor, Razlagova 14, 2000 Maribor, Slovenia 3 ISOKON, Production and Processing of Thermoplastics, Ltd, Mestni trg 5a, 3210 Slovenske Konjice, Slovenia Correspondence to: I. S ˇ mit (E-mail: [email protected]) ABSTRACT: The aim of this study was to compare the effects of different silica grades on the structure and morphology of isotactic polypropylene (iPP)/silica composites to better understand their structure–property relationships. Isotactic polypropylene composites with 2, 4, 6, 8 vol % of added silica fillers differing in particle size (micro- vs. nanosilica) and surface modification (untreated vs. treated surface) were prepared by nonisothermal compression molding and characterized by different methods. The addition of all silica fillers grades to the iPP matrix significantly influenced the spherulitic morphology, while phase characteristics of the iPP matrix seemed to be unaffected. Surface modification of silica fillers exhibited stronger effects on spherulite size than size of silica particles. Nonpolar silica particles, more miscible or compatible with iPP chains than polar silica particles, enabled better spherulitic growth. The spherulite sizes tended to reach equal values at 8 vol % of added silicas showing that spherulite size became independent of filler concentration and surface modification above optimum filler concentration. V C 2012 Wiley Periodicals, Inc. J. Appl. Polym. Sci. 000: 000–000, 2012 KEYWORDS: composites; morphology; polyolefins; structure–property relations Received 27 January 2012; accepted 19 August 2012; published online DOI: 10.1002/app.38487 INTRODUCTION Among polyolefins polypropylene is one of the most widely used commodity plastomers because of its outstanding properties and versatile applications of its composites. Because of favorable cost/ performance ratio, compounding of polymers with different fill- ers is the economic venue for shaping the desired properties and expanding the product range. 1–3 Common mineral fillers used in composites for modification of isotactic polypropylene (iPP) [0]are talc, calcium carbonate, glass beads and fibers, mica, silica, and wollastonite. 1–3 Fillers affect the ultimate mechanical proper- ties in two ways: (i) by acting as reinforcement (effect of shape, size, and modulus) 4 and (ii) by affecting crystallization of poly- mer matrix (phase and supermolecular structure of semicrystal- line polymer) and composite morphology. 5 Accordingly, impor- tant reinforcing effect is caused by the filler, while the structure and morphology of composites depend on particle–particle and particle–polymer interactions. 2–6 Shaping of polymer composites optimal mechanical properties could be achieved by studying their structure–property relation- ships. In presented part of study the main focus is on the struc- ture of the iPP/silica composites. Previously published studies of binary iPP/silica composites were mainly focused on two goals: preparation of new composite materials with improved mechanical properties 6–11 and phenomenological study of crys- tallization usually under nonisothermal conditions. 12–19 Improv- ing of mechanical properties was mainly focused on reduction of silica particle agglomeration by nanoparticles surface treat- ment. 7–11 Early investigations of composites showed the decrease of spherulite size in polymer matrix caused by nuclea- tion effect of fillers. 20 Crystallization studies of the iPP/silica composites comprised the investigations of nanosilica properties (size, surface properties, shape, and concentration) effects on nucleation and spherulite growth. Although the results on nanosilica effects concerning nucleation and crystallization rate complied to expectations of the investigators, the effects of sur- face modification of silica nanoparticles on the crystallization in the iPP matrix were controverisal. 11–15 Also, some authors pointed out to the effects of reduced diffuse chain mobility due to the presence of nanoparticles 15–17 and specific particle prop- erties 18 on the crystallization behavior of composites. Having in mind the complex correlation of the properties and content of various silica grades, systematic research of the struc- ture/morphology–mechanical/adhesion property relationships of non-isothermally crystallized compression molded iPP/silica composites was performed. Such approach enables shaping of V C 2012 Wiley Periodicals, Inc. WWW.MATERIALSVIEWS.COM WILEYONLINELIBRARY.COM/APP J. APPL. POLYM. SCI. 2012, DOI: 10.1002/APP.38487 1
-
Upload
independent -
Category
Documents
-
view
1 -
download
0
Transcript of Morphology of polypropylene/silica nano- and microcomposites

Morphology of Polypropylene/Silica Nano- and Microcomposites
And-ela Pustak,1 Irina Pucic,1 Matjaz Denac,2 Iztok Svab,3 Janez Pohleven,2
Vojko Musil,2 Ivan Smit1
1Rud-er Boskovic Institute, Division of Materials Chemistry, Bijenicka 54, 10002 Zagreb, Croatia2FEB Maribor, Institute of Technology, University of Maribor, Razlagova 14, 2000 Maribor, Slovenia3ISOKON, Production and Processing of Thermoplastics, Ltd, Mestni trg 5a, 3210 Slovenske Konjice, SloveniaCorrespondence to: I. Smit (E-mail: [email protected])
ABSTRACT: The aim of this study was to compare the effects of different silica grades on the structure and morphology of isotactic
polypropylene (iPP)/silica composites to better understand their structure–property relationships. Isotactic polypropylene composites
with 2, 4, 6, 8 vol % of added silica fillers differing in particle size (micro- vs. nanosilica) and surface modification (untreated vs.
treated surface) were prepared by nonisothermal compression molding and characterized by different methods. The addition of all silica
fillers grades to the iPP matrix significantly influenced the spherulitic morphology, while phase characteristics of the iPP matrix seemed
to be unaffected. Surface modification of silica fillers exhibited stronger effects on spherulite size than size of silica particles. Nonpolar
silica particles, more miscible or compatible with iPP chains than polar silica particles, enabled better spherulitic growth. The spherulite
sizes tended to reach equal values at 8 vol % of added silicas showing that spherulite size became independent of filler concentration
and surface modification above optimum filler concentration. VC 2012 Wiley Periodicals, Inc. J. Appl. Polym. Sci. 000: 000–000, 2012
KEYWORDS: composites; morphology; polyolefins; structure–property relations
Received 27 January 2012; accepted 19 August 2012; published onlineDOI: 10.1002/app.38487
INTRODUCTION
Among polyolefins polypropylene is one of the most widely used
commodity plastomers because of its outstanding properties and
versatile applications of its composites. Because of favorable cost/
performance ratio, compounding of polymers with different fill-
ers is the economic venue for shaping the desired properties and
expanding the product range.1–3 Common mineral fillers used in
composites for modification of isotactic polypropylene (iPP)
[0]are talc, calcium carbonate, glass beads and fibers, mica, silica,
and wollastonite.1–3 Fillers affect the ultimate mechanical proper-
ties in two ways: (i) by acting as reinforcement (effect of shape,
size, and modulus)4 and (ii) by affecting crystallization of poly-
mer matrix (phase and supermolecular structure of semicrystal-
line polymer) and composite morphology.5 Accordingly, impor-
tant reinforcing effect is caused by the filler, while the structure
and morphology of composites depend on particle–particle and
particle–polymer interactions.2–6
Shaping of polymer composites optimal mechanical properties
could be achieved by studying their structure–property relation-
ships. In presented part of study the main focus is on the struc-
ture of the iPP/silica composites. Previously published studies
of binary iPP/silica composites were mainly focused on two
goals: preparation of new composite materials with improved
mechanical properties6–11 and phenomenological study of crys-
tallization usually under nonisothermal conditions.12–19 Improv-
ing of mechanical properties was mainly focused on reduction
of silica particle agglomeration by nanoparticles surface treat-
ment.7–11 Early investigations of composites showed the
decrease of spherulite size in polymer matrix caused by nuclea-
tion effect of fillers.20 Crystallization studies of the iPP/silica
composites comprised the investigations of nanosilica properties
(size, surface properties, shape, and concentration) effects on
nucleation and spherulite growth. Although the results on
nanosilica effects concerning nucleation and crystallization rate
complied to expectations of the investigators, the effects of sur-
face modification of silica nanoparticles on the crystallization in
the iPP matrix were controverisal.11–15 Also, some authors
pointed out to the effects of reduced diffuse chain mobility due
to the presence of nanoparticles15–17 and specific particle prop-
erties18 on the crystallization behavior of composites.
Having in mind the complex correlation of the properties and
content of various silica grades, systematic research of the struc-
ture/morphology–mechanical/adhesion property relationships of
non-isothermally crystallized compression molded iPP/silica
composites was performed. Such approach enables shaping of
VC 2012 Wiley Periodicals, Inc.
WWW.MATERIALSVIEWS.COM WILEYONLINELIBRARY.COM/APP J. APPL. POLYM. SCI. 2012, DOI: 10.1002/APP.38487 1

composites properties or at least selecting of an appropriate
silica filler to obtain optimal (mechanical) properties for a par-
ticular application.
This article relates to the structure and morphology of binary
iPP/silica composites. Silica fillers used in this study differed in
size (nano- vs. micro-) and surface properties (hydrophilic vs.
hydrophobic, e.g., polar vs. nonpolar). Effects of fillers were
investigated on the new special hydrophobic fumed nanosilica
generation (Aerosil R7200 and Aerosil R8200) and compared
with the parent hydrophilic Aerosil 200 nanosilica as well as
precipitated hydrophobic Sipernat D17 with hydrophilic Siper-
nat 120 microsilicas. Mechanical properties and adhesion phe-
nomena of the iPP/silica composites will be presented in the
following paper.19
EXPERIMENTAL
Materials
The materials used in this study were isotactic polypropylene
(iPP) and five types of silica fillers. The iPP used for sample
preparation was Moplen HP501L, LyondellBasell Industries,
Rotterdam, Netherlands (melt flow rate [MFR] (230�C/2.16 kg)
¼ 6 g/10 min, q ¼ 0.90 g cm�3, Mn ¼ 120,000 g mol�1). Silica
fillers were two proprietary microsilicas (unmodified Sipernat
120 and surface modified Sipernat D17) and three proprietary
nanosilicas (unmodified Aerosil 200 and two surface modified
nanosilicas Aerosil R7200 and Aerosil R8200); all silica grades
were kindly supplied by Evonic Industries (Degussa), Essen,
Germany. Filler characteristics are listed in Table I.
Sample Preparation
Binary iPP/silica composites with volume content ratios 100/0,
98/2, 96/4, 94/6, and 92/8 were prepared in an oil-heated Bra-
bender kneading chamber. The components were put into a
chamber preheated up to 200�C with a rotor speed of 50 min�1
and then kneaded for 7 min. After homogenization, the melt
was rapidly transferred to a preheated laboratory press and
compression molded into 1- and 4-mm-thick plates. The press-
ing temperature was 220�C, pressure 100 bar and the pressing
time of 14 min for 1-mm and 11.5 min for 4-mm-thick plates.
Afterward, the plates were cooled to room temperature in air.
Characterization
Wide-Angle X-Ray Diffraction (WAXD). Wide-angle X-ray
diffraction (WAXD) was performed to determine possible effects
of silica filler on some phase characteristics of the composites:
phase structure, degree of crystallinity (evaluated by the Ruland
method21), orientation (A110 and C parameters calculated by
Zipper formulae22) and crystallite size. Wide-angle X-ray dif-
fractograms of 1-mm-thick plates were taken with a Philips dif-
fractometer PW 1820 diffractometer using monochromatized
Cu Ka radiation in the diffraction range of 2h ¼ 5–40�.
Fourier Transform Infrared Spectroscopy. Samples of pure
iPP and composites with iPP/silica content ratios 92/8 and 94/6
cut from 1-mm-thick compression molded plates were addition-
ally pressed into thin films for infrared analysis. Fourier Trans-
form Infrared Spectroscopy (FTIR) spectra of the samples were
recorded on a Bruker Tensor 27 in the MID region (4000 to
400 cm�1) and were processed using Bruker Opus software.
Differential Scanning Calorimetry. Thermal analysis was per-
formed on a Perkin Elmer Diamond Differential Scanning Calo-
rimetry (DSC). Samples (9.3–10.3 mg) were cut from 1-mm-
thick compression molded plates, placed in aluminum pans and
sealed. The instrument was calibrated using In and Zn according
to the procedure defined by the manufacturer. Thermograms of
the samples of pure iPP and composites with iPP/silica content
ratios 92/8 and 94/6 were recorded in dynamic mode, at a heat-
ing rate of 5�C min�1 in an extra pure nitrogen environment.
Two heating-cooling cycles were performed by first heating the
sample from 50 to 200�C, keeping it at that temperature for 5
min and then cooling to 50�C at a cooling rate of 5�C min�1.
Scanning Electron Microscopy. A SIRION 400 NC and Philips
XL 30 scanning electron microscope (SEM) were used to study
the morphology of composites. Samples were fractured in liquid
nitrogen and covered with gold before being examined with a
microscope at an acceleration voltage up to 10 kV at various
magnifications. All SEM micrographs are secondary electron
images.
Optical Microscopy (OM). A Leica light microscope (Model
DMLS) coupled with a digital camera was used for observation of
thin crossed microtomed sections (taken from 1-mm thick plates)
Table I. Filler Characteristics
Samples Trade name of fillerTappeddensity (g L�1)
Surfacemodification
Specific surfacearea (BET) (m2 g�1)
Average particlesize, d50
A-200 Aerosil 200; unmodifiednanosilica
� 50 none 200 6 25 12 nm
A-R7200 Aerosil R7200; modifiednanosilica
� 230 methacryl-silane 150 6 25 12 nm
A-R8200 Aerosil R8200; modifiednanosilica
140 hexamethyl-disilazane 160 6 25 12 nm
S-120 Sipernat 120; unmodifiedmicrosilica
185 none 125 14.5 lm
S-D17 Sipernat D17; modifiedmicrosilica
150 2% chem. boundedcarbon
100 10 lm
ARTICLE
2 J. APPL. POLYM. SCI. 2012, DOI: 10.1002/APP.38487 WILEYONLINELIBRARY.COM/APP

under crossed polarizers (POM) or phase contrast (PC). Maximal
anisotropic diameter of spherulites (di,max) was measured on sev-
eral polarization micrographs of each sample and average spheru-
lite diameter (dsph) was calculated according to eq. (1):
dsph ¼ Nidi;max
Ni
(1)
where Ni is the number of measured spherulites with the aver-
age diameter di.
RESULTS AND DISCUSSION
Phase Characteristics
X-ray diffraction (XRD) patterns of all pure silica powders (not
shown) exhibit very similar diffraction curves with the main
diffuse diffraction maxima at �21.3� 2T for nanosilicas and at
�22.0� 2T for microsilicas, showing the amorphous character of
all silica fillers. Small difference in peak position between nano-
and microsilicas indicates somewhat higher average interplanar
distances in disordered SiAOA networks of nanosilicas than
microsilicas.
Diffraction curves of pure iPP and iPP/silica composites exhibit
patterns of mainly monoclinic a-form of the iPP (Figure 1).
Addition of a small amount of silica (2 vol %) negligibly
changes half-maximum widths of the main diffraction peaks
(110, 040, 130) of the a-iPP phase. Further addition of silica
doesn’t change the profile of any reflection. Obviously, the a-
iPP crystallite size was not affected either by the type of silica
filler or by the filler content. The values of orientation parame-
ters A110 and C, calculated according to equations proposed by
Zipper et al.,22 also exhibit imperceptible changes with filler
content (not shown).
Incorporation of amorphous silicas into the iPP matrix
increases the intensity of the amorphous diffraction maximum,
thus reflecting the increase in overall amorphous content
(amorphous iPP phase þ amorphous silica). The decrease in
Figure 1. X-ray diffraction patterns of pure iPP and iPP/silica composites
with 96/4 volume ratio (middle concentration range).
Figure 2. Degree of crystallinity of iPP/silica composites evaluated from
X-ray diffractograms. [Color figure can be viewed in the online issue,
which is available at wileyonlinelibrary.com.]
Figure 3. FTIR spectra of iPP (bottom black line) and iPP/silica compo-
sites with micro- and nanosilica fillers in volume ratios 92/8 (dark lines)
and 94/6 (light lines).
ARTICLE
WWW.MATERIALSVIEWS.COM WILEYONLINELIBRARY.COM/APP J. APPL. POLYM. SCI. 2012, DOI: 10.1002/APP.38487 3
the degree of crystallinity, wc,x, depended almost linearly on the
content of silica in the samples (Figure 2). Theoretical crystal-
linity values of iPP, wc,x, recalculated to the iPP fraction in com-
posites, are presented by line in Figure 2. Experimental crystal-
linity values that are mainly below the theoretical ones are
within the method resolution. The highest decrease in crystal-
linity and deviation from linearity were observed in all samples
with the highest silica amount (8 vol %).
FTIR spectra were recorded to determine changes due to incor-
poration of micro- and nanosilica fillers to iPP. According to
Painter et al.23 the changes of absorptions at 1498, 1376, 1167,
and 998 cm�1 could be related to crystallinity of iPP. In the
spectra of samples containing silica relative intensities of these
absorption bands were changed but no shifts were observed
(Figure 3). The ASiAOASiA bending absorption at 1100 cm�1
was one of the strongest absorptions in the spectra of all iPP-
silica composites. The iPP peak at 1167 cm�1 appears as a
shoulder on the strong SiAO absorption and the iPP absorption
at 998 cm�1 is very close to the same silica absorption.
Other relevant silica absorptions are wide peak at 810 cm�1 of
medium intensity and stronger and sharper absorption at 470
cm�1, both caused by ASiAOA stretching vibrations.24 Low in-
tensity wide absorption centered around 3400 cm�1 corresponds
to the AOH groups. In samples with A-R7200, a small peak is
present at 1720 cm�1 which originates from C¼¼O groups in
the methacrylsilane layer.24
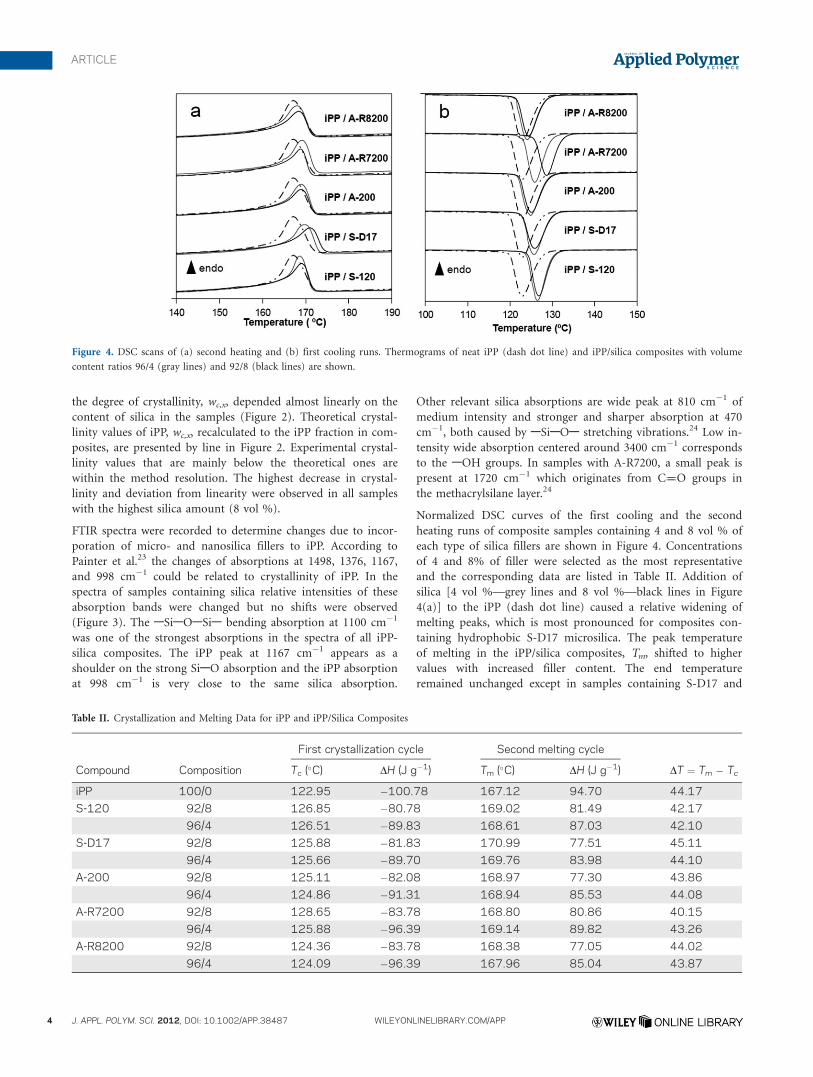
Normalized DSC curves of the first cooling and the second
heating runs of composite samples containing 4 and 8 vol % of
each type of silica fillers are shown in Figure 4. Concentrations
of 4 and 8% of filler were selected as the most representative
and the corresponding data are listed in Table II. Addition of
silica [4 vol %—grey lines and 8 vol %—black lines in Figure
4(a)] to the iPP (dash dot line) caused a relative widening of
melting peaks, which is most pronounced for composites con-
taining hydrophobic S-D17 microsilica. The peak temperature
of melting in the iPP/silica composites, Tm, shifted to higher
values with increased filler content. The end temperature
remained unchanged except in samples containing S-D17 and
Figure 4. DSC scans of (a) second heating and (b) first cooling runs. Thermograms of neat iPP (dash dot line) and iPP/silica composites with volume
content ratios 96/4 (gray lines) and 92/8 (black lines) are shown.
Table II. Crystallization and Melting Data for iPP and iPP/Silica Composites
First crystallization cycle Second melting cycle
Compound Composition Tc (�C) DH (J g�1) Tm (�C) DH (J g�1) DT ¼ Tm � Tc
iPP 100/0 122.95 �100.78 167.12 94.70 44.17
S-120 92/8 126.85 �80.78 169.02 81.49 42.17
96/4 126.51 �89.83 168.61 87.03 42.10
S-D17 92/8 125.88 �81.83 170.99 77.51 45.11
96/4 125.66 �89.70 169.76 83.98 44.10
A-200 92/8 125.11 �82.08 168.97 77.30 43.86
96/4 124.86 �91.31 168.94 85.53 44.08
A-R7200 92/8 128.65 �83.78 168.80 80.86 40.15
96/4 125.88 �96.39 169.14 89.82 43.26
A-R8200 92/8 124.36 �83.78 168.38 77.05 44.02
96/4 124.09 �96.39 167.96 85.04 43.87
ARTICLE
4 J. APPL. POLYM. SCI. 2012, DOI: 10.1002/APP.38487 WILEYONLINELIBRARY.COM/APP

A-R7200 fillers. Both melting and crystallization heats have
lower values in composites compared to pure iPP.
Crystallization temperatures in the first and the second cooling
cycles, Tc, also increased on addition of silica fillers [Figure
4(b), Table II]. A decrease of supercooling, DT ¼ Tm � Tc, is
related to ability of filler particles to promote heterogeneous
nucleation in the iPP matrix.14,25 Silica particles with polar
surfaces (microsilica S-120 with hydroxyl groups and nanosilica
A-R7200 with methacryl layers) produced greater Tc shifts, less
supercooling and stronger nucleation effect in the iPP matrix.
Regarding the size of unmodified silica fillers, nucleation effect
of nanosilica A-200 was somewhat weaker than of microsilica
S-120.
Morphology of the iPP/Silica Composites
The influence of size and properties of silica particles on the
spherullite size of iPP matrix was studied. SEM micrographs of
the iPP microsilica 92/8 composites reveal few micro-sized silica
particles at fractured surfaces [Figure 5(a)]. Lower number of
hollows from which microsilica particles were pulled out at the
etched surface of the iPP/S-D17 than iPP/S-120 composite
might indicate better compatibility of the iPP matrix with non-
polar S-D17 compared to polar S-120 particles. SEM micro-
graphs of fractured iPP/nanosilicas [represented by iPP/A-200
and iPP/A-R8200 92/8 composites in Figure 5(b)] reveal rela-
tively homogeneous distribution of nanosilica particles and
agglomerates. Micrographs in Figure 5(b) also reveal more ho-
mogeneous dispersion and lower degree of agglomeration of
modified nonpolar A-R8200 than hydrophilic A-200 nanosilica.
Higher amount of nanosilicas than microsilicas in SEM micro-
graphs of fractured surfaces indicates better interactivity of the
iPP matrix with nanosized silica particles than with microsized
silica particles.
Fillers might affect nucleation, microstructure, crystallization
rate, transcrystallinity, orientation, and crystallite and spherulite
size in a polymer matrix.2,3 The most pronounced effect of the
silica filler in iPP/silica composites is on the iPP spherulite size
(diameter, dsph in Figure 6). The effect of the particle properties
(size, shape, and surface treatment) on the spherulite growth
rate and size under isothermal and nonisothermal crystallization
conditions were observed by different authors.15–18,26,27 Through
the whole concentration range of added silica fillers following
changes of the spherulite size could be recognized: (1) decrease
of spherulite size up to 2 vol %, (2) plateaus in the concentra-
tion range 2–6 vol %, and (3) second decrease with tendency to
equal values of spherulite size at 8 vol % of added silica.
Abrupt decrease in spherulite size with the lowest silica addition
(up to 2%) can be ascribed to the strong nucleation effect.2–5,20
Filler particles could act as heterogeneous nuclei, thus increasing
the total number of nuclei and leading to a larger number of
smaller spherulites. Addition of silicas with polar surfaces (S-
120, A-200, and A-R7200) caused higher crystallization temper-
ature and affected nucleation stronger than modified nonpolar
silicas (S-D17 and A-R8200). The levels of two plateaus at the
intermediate silica concentration (2–6 vol %) seem to be ini-
tially determined by the different nucleation ability of various
silica grades observed at 2 vol % of added silica. Accordingly,
silicas with modified nonpolar surfaces (S-D17 and A-R8200)
exhibit higher spherulite size than silicas with polar surfaces (S-
120, A-200, and A-R7200) in whole concentration range. The
shape of all silica particles could not cause such differences in
spherulite size because there are no tubular silica species with
stronger nucleation effect than spherical silica particles.18 The
fact, that spherulite size is stronger affected by character of silica
Figure 5. SEM micrographs of the iPP/silica 92/8 composites with (a)
microsilicas S-120 and S-D17 and (b) nanosilicas A-200 and A-R8200.
Figure 6. Average spherulite diameter, dsph, of iPP/silica composites vs.
volume fraction of added silica (/silica) determined from POM micro-
graphs. [Color figure can be viewed in the online issue, which is available
at wileyonlinelibrary.com.]
ARTICLE
WWW.MATERIALSVIEWS.COM WILEYONLINELIBRARY.COM/APP J. APPL. POLYM. SCI. 2012, DOI: 10.1002/APP.38487 5

filler surfaces than by silica particle size (micro vs. nano) was
unexpected, but explainable. Ray et al.26 proved lower primary
average nucleation density of the crystallites in poly[(butylene
succinate)-co-adipate] (PBSA) nanocomposite with filler cloisi-
te*30B which is more miscible with PBSA matrix than with
cloisite*20A. Authors also proposed, that secondary nucleation
in nonisothermal crystallization of the PBSA/C30B nanocompo-
site is not active what led to significantly enlarged spherulites.
Wang et al.27 also concluded that spherulite growth rate of the
isothermally crystallized polypropylene matrix is influenced by
interfacial adhesion that was altered by surface treatment of the
BaSO4 filler. They also proposed that retardations of polymer
chains movement by particle–matrix interaction may decrease
spherulite growth rate additionally.27 According to above expla-
nation26,27 nonpolar silicas might nucleate lower number of the
crystallites than polar silicas during primary and secondary
crystallization. Therefore, considerably larger spherulite arose in
the iPP matrix with more miscible nonpolar S-D17 and A-
R8200 silicas than with hydrophylic silicas (S-120 and A-200)
and methacrylsilanized A-R7200 nanosilica.
Analysis of SEM and OM/POM micrographs of the iPP/silica
96/4 composites (typical of the middle concentration range
from 2 to 6 vol %) confirmed intraspherulitic accommodation
of nanosilica particles (dp ¼ 12 nm) and agglomerates (dp �100
nm) besides of their interspherulitic locations. Separated dark
areas without nanosilica particles and areas with white nanosil-
ica spots in SEM micrographs represented by Figure 5(b) indi-
cate preferential accommodation of the nanosilica particles/
aggregates within some regions. SEM micrographs in Figure 7
suggest accommodation of nanosilica particles and agglomerates
within holes. Schematic presentation in Figure 8, constructed
on the basis of the polyethylene TEM micrograph from the pa-
per of Keith et al.,28 illustrated suitable accomodation of nano-
silica agglomerates (up to �100 nm) between interlamellar links
without distortions. Despite of their preferential allocation in
less ordered regions [white spots areas in Figure 5(b)], the dis-
persion looks relatively homogeneous (Figure 8). Such illustra-
tion suggests the possibility of undisturbed spherulite growth
and application of structural models like cluster model15 to iPP/
nanosilica composites. Because there is no argument was found
in literature for a modified morphology around nanoparticles,3
it might be supposed that filler particles became embedded into
growing spherulite and were not ejected by the forces in the
crystallizing material. The study of Karger-Kocsis et al.29 of
analogous polypropylene blends, which revealed intraspheruliti-
cally and interspherulitically disperded particles of propylene-
based copolymers, might support this conclusion. Namely,
intraspherulitically dispersed EPDM particles did not influence
radial spherulite growth despite of their relatively high average
size (�1 lm). The spherulites grew until dispersed particle sur-
face became encompassed and then continued to grow further
without modifying radial lamellar growth.29 Lipatov30 also pro-
posed that filler particles up to 1 lm in particulated polymer
composites may be fully situated in the disordered interstruc-
tural regions.
Well-developed spherulites in the iPP composites with relatively
high microsilica S-D17 contents (4 and 6 vol %, Figure 6) is an
astonishing result. Smaller nano-sized silica particles in these
composites could be accommodated intra- and interspheruliti-
cally as POM and SEM micrographs suggested (not shown).
POM micrograph (left) and its schematic presentation (right)
in Figure 9 revealed prevalent interspherulitic accommodation
of micro-sized silica particles in the composite with 4 vol % of
S-D17 (Figure 9). Obviously, silica microparticles (10 lm) could
not be engulfed by spherulites like filler and elastomer particles
Figure 7. SEM micrographs of iPP composites with 4 vol % of nanosilica
A-R7200 (top) and A-R8200 (bottom) fillers.
Figure 8. Schematic presentation of the nanosilica agglomerates (full
circles �100 nm) accommodated into low ordered interlamellar regions.
[Color figure can be viewed in the online issue, which is available at
wileyonlinelibrary.com.]
ARTICLE
6 J. APPL. POLYM. SCI. 2012, DOI: 10.1002/APP.38487 WILEYONLINELIBRARY.COM/APP

up to 1 lm. OM/POM micrographs in Figure 10 illustrate suit-
able interspherulitic allocations of the microsized S-D17 par-
ticles that do not obstruct the growth of large spherulites even
in the iPP composite with 6 vol % of S-D17. However, inter-
spherulitic accommodation of microsized silica particles could
not explain are these microparticles ejected to the spherulite
surfaces or they stopped the spherulite growth regardless of
their nucleation ability.3,30–33
A second pronounced decrease in spherulite size occurred at 8
vol % of silica (third concentration range in Figure 6) implies
either diminishing effect of factor(s) favorable for the spherulite
growth, or some new effect is superposed to the nucleation
effect. Abrupt decrease with tendency to equal the values of
spherulite size at 8 vol % of added silica in Figure 6 confirm
that the influence of filler (size, surface modification) on the
size and growth rate of reduced spherulite size could be
explained by lamellar clustering crystallization process and by restricted diffusive mobility of polymer chains due to the pres-
ence of silica nanoparticles.14–18 Moreover, restrained spherulite
growth in composites with microsilicas could be also explained
by topological or spatial constraints caused by inorganic fillers,
that promote spherulites to reach sizes comparable to the dis-
tance between filler particles.32,33
However, regular spherulites still persist in the composites
containing silica fillers with nonpolar surfaces (S-D17 and
A-R8200) despite possible restraining steric hindrances of fillers
[Figure 11(a)]. In composites with polar silica surfaces (S-120,
A-200, and A-R7200), the morphology with thin, dark branched
spherulitic grains without Maltese crosses prevails, especially in
composites with methacrylsilanized A-R7200 [Figure 11(b)].
This transformation of spherulites confirms the conclusion that
polymers containing high filler concentration crystallize to a
loose spherulite structure.30
CONCLUSIONS
Microsilica particles and their agglomerates were relatively
homogeneously incorporated into the iPP matrix and influenced
final supermolecular structure rather than the phase structure of
iPP/silica composites. Structural characteristics (phase structure,
crystallite size, crystallite orientation, crystallinity) were almost
Figure 9. POM micrograph of the iPP/S-D17 96/4 composite (left) and
its schematic presentation (right). [Color figure can be viewed in the
online issue, which is available at wileyonlinelibrary.com.]
Figure 10. OM (top) and POM (bottom) micrographs of the iPP/S-D17
94/6 composite with accommodated microparticles surrounded by circles.
Figure 11. POM micrographs of the iPP/silica 98/2 composite with (a)
hydrophobic S-D17 microsilica and (b) polar A-R7200 nanosilica.
ARTICLE
WWW.MATERIALSVIEWS.COM WILEYONLINELIBRARY.COM/APP J. APPL. POLYM. SCI. 2012, DOI: 10.1002/APP.38487 7

unaffected by incorporation of filler and interactions in the iPP/
silica composites were negligible. The addition of all silica
grades affected crystallization and decreased spherulite size in
the iPP matrix as well as transformed well-developed spherulitic
morphology to the morphology with irregular spherulitic grains.
Altough filler particle size played important role in spherulite
growth, surface modification of considered silica fillers exhibited
stronger influence on spherulite size than size of silica particles.
Filler particles S-D17 and A-R8200 with nonpolar surfaces
enabled better spherulitic growth than polar S-120, A-200, and
A-R7200 filler particles. Accordingly, nucleation ability of non-
polar silicas is supposed to be lower since they are more misci-
ble/compatible with iPP chains than silicas with polar surfaces.
Suitable interspherulitical accommodations of the micro-sized
S-D17 particles enable growth of well developed spherulites
even in the iPP composite with 6 vol % of the S-D17. Almost
equal values of spherulite sizes at 8 vol % of silicas confirmed
the conclusion that the size and growth rate of the spherulites
becomes insignificant above optimum filler concentration and
independent of the surface modification.
ACKNOWLEDGMENTS
Financial support of the Ministry of Science, Education and Sports
of the Republic of Croatia (Grant No. 098-0982904-2955) and the
Ministry of Higher Education, Science and Technology of the
Republic of Slovenia is acknowledged. The authors are most grate-
ful to Dr. Uwe Schachtely for his advice concerning the choice of
nano- and microsilicas as well as Degussa AG for generous dona-
tion of silica samples.
REFERENCES
1. Wagner, M. P. In Additives for Plastics; Seymour, R. B., Ed.;
Academic Press: New York, 1978; Vol. 1, p 9.
2. Rothon, R. N. Particulate-Filled Polymer Composites, 2nd
ed. Rapra: Shawbury, 2006; Chapter 8, p 357.
3. Wypych, G. Handbook of Fillers, 2nd ed.; ChemTec Pub-
lishing: Toronto, 2000; Chapters 10 and 15.
4. Pukanszky, B. In Handbook of Polyolefins, 2nd ed.; Vasile,
C., Ed.; Marcel Dekker: New York, 2000; p 689.
5. Smit, I.; Denac, M.; Svab, I.; Radonjic, G.; Musil, V.; Jurkin,
T.; Pustak, A. Polimeri 2009, 30, 183.
6. Garcia, M.; Van Vliet, G.; Jain, S.; Schrauwen, A. G.; Sarkis-
sov, A.; van Zyl, W. E.; Boukamp, B. Rev. Adv. Mater. Sci.
2004, 6, 169.
7. Rong, M. Z.; Zhang, M. Q.; Pan, S. L.; Friedrich, K. J. Appl.
Polym. Sci. 2004, 92, 1771.
8. Wu, C. L.; Zhang, M. Q.; Rong, M. Z.; Friedrich, K. Com-
pos. Sci. Technol. 2002, 62, 1327.
9. Cai, L. F.; Huang, X. B.; Rong, M. Z.; Ruan, W. H.; Zhang,
M. Q. Polymer 2006, 47, 7043.
10. Zhou, T. H.; Ruan, W. H.; Mai, Y. L.; Rong, M. Z.; Zhang,
M. Q. Compos. Sci. Technol. 2008, 68, 2858.
11. Bikiaris, D. N.; Papageorgiou, G. Z.; Pavlidou, E.; Vourout-
zis, N.; Palatzoglou, P.; Karayannidis, G. P. J. Appl. Polym.
Sci. 2006, 100, 2684.
12. Papageorgiou, G. Z.; Achilias, D. S.; Bikiaris, D. N.;
Karayannidis, G. P. Thermochim. Acta 2005, 427, 117.
13. Jain, S.; Goossens, H.; van Duin, M.; Lemstra, P. Polymer
2005, 46, 8805.
14. Asuka, K.; Liu, B.; Terano, M.; Nitta, K. Macromol. Rapid
Commun. 2006, 27, 910.
15. Nitta, K.; Asuka, K.; Liu, B.; Terano, M. Polymer 2006, 47,
6457.
16. Waddon, A. J.; Petrovic, Z. S. Polym. J. 2002, 34, 876.
17. Xu, J. T.; Zhao, Y. Q.; Wang, Q.; Fan, Z. Q. Polymer 2005,
46, 11978.
18. Palza, H.; Vera, J.; Wilhelm, M.; Zapata, P. Macromol.
Mater. Eng. 2011, 296, 744.
19. Pustak, A.; Leskovac, M.; Denac, M.; Svab, I.; Pohleven, J.;
Makarovic, M.; Musil, V.; Smit, I. Submitted to publication.
20. Pukanszky, B.; Belina, K.; Rockenbauer, A.; Maurer, F. H. J.
Compos. A 1994, 25, 205.
21. Alexander, L. E. X-Ray Diffraction Methods in Polymer Sci-
ence; Wiley: New York, 1969; p 138.
22. Zipper, P.; Janosi, A.; Wrentschur, E. J. Phys. IV Suppl. J.
Phys. I 1993, 3, 33.
23. Painter, P. C.; Watzek, M.; Koenig, J. L. Polymer 1977, 18,
1169.
24. Vijayalakshmi, U.; Balamurugan, A.; Rajeswari, S. Trends
Biomater Artif Organs 2005, 18, 101.
25. Lonkar, S. P.; Morlat-Therias, S.; Caperaa, N.; Leroux, F.;
Gardette, J. L.; Singh, R. P. Polymer 2009, 50, 1505.
26. Ray, S. S.; Bandyopadhyay, J.; Bousmina, M. Eur. Polym. J.
2008, 44, 3133.
27. Wang, K.; Wu, J. S.; Zeng, H. Eur. Polym. J. 2003, 39, 1647.
28. Keith, H. D.; Padden, F. J.; Vadimsky, R. G. J. Polym. Sci.
A2 1966, 4, 267.
29. Karger-Kocsis, J.; Kiss, L.; Kuleznev, V. N. Polym. Commun.
1984, 25, 122.
30. Lipatov, Y. S. Polymer Reinforcement; ChemTec Publishing:
Toronto-Scarborough, 1995; Chapter 4, p 153.
31. Singhal, A.; Fina, L. J. Polymer 1996, 37, 2335.
32. Burke, M.; Young, R. J.; Stanford, J. L. Plast. Rubber Process
Appl. 1993, 20, 121.
33. Manias, E.; Polizos, G.; Nakajima, H.; Heidecker, M. J. In
Flame Retardant Polymer Nanocomposites; Wilkie, C., Ed.;
Hoboken: New York, 2007; p 31.
ARTICLE
8 J. APPL. POLYM. SCI. 2012, DOI: 10.1002/APP.38487 WILEYONLINELIBRARY.COM/APP