Quiescent crystallization of natural fibers–polypropylene composites
Upload
khangminh22Category
view
2download
0
Development of polylactide and polypropylene composites
reinforced with sisal fibres and halloysite nanotubes for
automotive and structural engineering applications
Prakash Krishnaiah, M.Sc. M.Tech
Thesis submitted to the University of Nottingham
for the degree of Doctor of Philosophy
March 2017
Department of Chemical and Environmental Engineering
Faculty of Engineering
The University of Nottingham

ii
Dedication;
To my beloved father and my family

iii
Abstract
In recent decades, scientific research giving more attention to the development of bio-
based polymer composites due to the extensive usage of petroleum based fillers as
well as polymer matrices for the generation of polymer composites. It is a well-known
fact that the petroleum derived polymer composites raise inevitable issues such as
environmental pollution, waste management and depletion of petroleum resources etc.
So it is important to develop fully or partially biodegradable polymer composites
without compromising the mechanical, physical and thermal properties which are
required for the end use applications. In this investigation, two different types of filler
materials such as sisal fibres and halloysite nanotubes were used to prepare PLA
polymer composites and their morphology, physical, mechanical, dynamic
mechanical, thermal, water absorption and biodegradable properties were studied.
This work also involves the preparation and properties of polypropylene composites
reinforced with sisal fibres and halloysite nanotubes to compare the mechanical and
thermal properties with PLA composites.
First, surface treatment was performed for sisal fibres in order to remove the
amorphous materials such as hemicellulose, lignin and pectin from the surface of the
fibres which enhances the fibre-matrix interfacial strength and mechanical properties
of the fibres and their polymer composites. Sisal fibres were subjected to different
surface treatments such as alkali, high intensity ultrasound (HIU), and the
combination of alkali and HIU and their effects on the morphology, fibre diameter,
moisture absorption, mechanical and thermal properties of untreated and surface
treated sisal fibres were studied. Fourier transform infrared spectroscopy (FTIR) and
field emission scanning electron microscopy (FE-SEM) results confirmed the removal

iv
of amorphous materials after the combined treatments of alkali and ultrasound.
Moisture absorption and diameter of the sisal fibres were significantly reduced by 40
and 200% respectively after the combination of alkali and HIU treatment as compared
to untreated sisal fibres. TGA results revealed that the thermal stability of sisal fibres
obtained with the combination of alkali and HIU treatment significantly increased by
38.5 o
C as compared to the untreated fibres. Tensile properties of single fibre showed
a reduction in the tensile strength and modulus by 25% and 26% respectively as
compared to the untreated sisal fibre owing to surface treatments. A reduction in the
tensile properties is mainly due to the removal of amorphous materials from the
surface of sisal fibres which act as binding materials for cellulose.
Second, the effect of different surface treatments on the morphology, mechanical,
thermal, water absorption and biodegradable properties of sisal fibres reinforced PLA
(SF/PLA) composites has been investigated. For this, different ratio of untreated and
surface treated sisal fibres was mixed with PLA polymer matrix by using an internal
mixer. Compounded materials from the internal mixer were subjected to compression
moulding to prepare the test specimens. FE-SEM analysis confirmed the good
dispersion of different surface treated SF in the PLA composites. The tensile strength
and modulus increased by 10 and 75.4% for 15 wt% and 30 wt% of fibre loading
respectively with the combined treatment of alkali and HIU PLA composites as
compared to the untreated fibre reinforced PLA composites. Young’s modulus of the
composites has also been predicted by using the theoretical models which fit well to
the obtained experimental values. Dynamic-mechanical analysis (DMA) revealed that
the combination of alkali and HIU treated SF/PLA composites showed an increase in
the storage modulus by 15% and 30% as compared to the untreated fibre composites
and pure PLA respectively. TGA and DSC analysis revealed that the thermal stability

v
and crystallinity increased significantly for the PLA composites reinforced with sisal
fibres of combined treatment of alkali and HIU. Water absorption study showed a
considerable reduction in the water absorption and coefficient of diffusion by 136%
and 130% respectively for the combination of alkali and HIU treated SF/PLA
composites as compared to untreated SF/PLA composites. The degradation of SF/PLA
composites was studied by composting the samples into the soil. A significant weight
loss of 17.87% could be observed for the addition of 30 wt% of untreated SF/PLA
composites after soil composting for 120 days.
Apart from sisal fibres, halloysite (Hal) nanotubes were also used as reinforcement
fillers to study their effectiveness in improving the mechanical and thermal properties
of PLA nanocomposites. Hal nanotubes were surface modified with 3-
aminopropyltriethoxysilane (APTES) to enhance the surface interaction of Hal
nanotubes with PLA and to achieve good dispersion of Hal nanotubes across the PLA
matrix. Nitrogen adsorption-desorption, FTIR and TGA analysis results were
confirmed the successful modification of Hal nanotubes surface with APTES. The
different wt% of unmodified and APTES modified Hal-PLA nanocomposites were
prepared by using internal mixer and compression moulding machine. The resultant
Hal-PLA nanocomposites were characterized for their morphology, thermal,
mechanical and dynamic-mechanical properties. Tensile strength increased to 62.6
MPa with the addition of 4 wt% of APTES modified Hal-PLA nanocomposites which
is 26.5% higher than pure PLA and 15% higher than unmodified (4 wt%) Hal-PLA
nanocomposites. Impact strength of 4 wt% APTES modified Hal-PLA
nanocomposites increased by 20% and 40% as compared to unmodified Hal-PLA
nanocomposites and the pure PLA respectively. TGA analysis revealed that the
thermal stability increased significantly by 17 oC with the addition of 4 wt % of

vi
APTES modified Hal nanotubes onto PLA. Storage modulus increased by more than
10% with the addition of 4 wt% of APTES modified Hal nanotubes as compared to
pure PLA.
To compare the PLA composites with conventional polymer matrix composites,
composites of polypropylene (PP) were prepared by reinforcing with sisal fibres and
Hal nanotubes and the effect of surface treatment of sisal fibres and surface
modification of Hal nanotubes on the mechanical and thermal properties of SF/PP and
Hal-PP nanocomposites were studied. Tensile properties were increased for the
combined treated SF/PP composites as compared to the untreated and pure PP. Tensile
modulus and strength increased by more than 50% and 10% respectively as compared
to the untreated SF/PP composites. TGA and DSC results revealed that the
combination of alkali and HIU treatments increased the thermal stability and
crystallinity by 8 oC and 8% respectively as compared to untreated SF/PP composites.
DMA analysis confirmed the significant enhancement of storage modulus for the
combined treated SF/PP composites by 50% as compared to pure PP. Mechanical and
thermal properties were studied for unmodified and APTES modified Hal nanotubes
reinforced PP nanocomposites. The investigations suggest that the mechanical
properties of APTES modified Hal-PP nanocomposites were found to be superior to
the unmodified Hal-PP nanocomposites. The tensile strength and modulus increased
by 31 and 72% with the addition of 6 wt% of APTES modified Hal-PP
nanocomposites as compared to pure PP. Impact strength also increased by 44% than
pure PP with 6 wt% loading of APTES modified Hal nanotubes. Thermal analysis
revealed that the thermal stability and percentage crystallinity increased by 15 oC and
22% respectively for the Hal-PP nanocomposites with surface modification by

vii
APTES. DMA analysis shows the improved storage modulus by 28% as compared to
pure PP.
Based on the present work, it can be said that the sisal fibres and Hal nanotubes have
potential as reinforcing materials in the generation of fully bio-based polymer
composites. However, surface treatments and/or modification were playing an
important role in order to tune the required mechanical and thermal properties of the
polymer composites. This study also proved that in comparison to the conventional
polymer matrix materials such as PP, PLA is a strong competitor with respect to its
good mechanical properties and improved thermal stability apart from the fact that
PLA is one of the best known biodegradable and biocompatible polymer matrices in
the current market to use not only in medical application, but also in various
commercial applications such as packaging, automotive and home appliances.

viii
Publications
Prakash Krishnaiah, Sivakumar Manickam and C.T. Ratnam, 2017. “Enhancements in
Crystallinity, Thermal stability, Tensile modulus and Strength of Sisal Fibres and their
PP Composites Induced by the Synergistic Effects of Alkali and High Intensity
Ultrasound (HIU) treatments”. Ultrasonics Sonochemistry. Vol 34, P 729-742.
Prakash Krishnaiah, Sivakumar Manickam and C.T. Ratnam, 2016. “Development of
silane grafted halloysite nanotube reinforced polylactide nanocomposites for the
enhancement of mechanical, thermal and dynamic-mechanical properties”. Applied
Clay Science. Vol 135, P 583-595.
Conference presentations
Prakash Krishnaiah, Sivakumar Manickam and C.T. Ratnam, 2015. “Simultaneous
Effects of Alkaline and Ultrasound Treatments on the Thermal and Morphological
Properties of Sisal fibres”. In: 2nd
Asia-Oceania Sonochemical Society (AOSS-2)
Conference, Kuala Lumpur, Malaysia, 25-28 July, 2015.
Prakash Krishnaiah, Sivakumar Manickam and C.T. Ratnam, 2014. “Effect of silane
compatibilizers on morphological, mechanical and thermal properties of Halloysite
nanoclay reinforced PLA polymer nanocomposites”. Postgraduate Research Week 22-
26 September 2014, The University of Nottingham Malaysia campus, Semenyih,
Malaysia.
Manuscripts under submission
Prakash Krishnaiah, Sivakumar Manickam and C.T. Ratnam, 2017. “Improved
Mechanical Properties and Theoretical Prediction of Young’s modulus of PLA
Composites Reinforced with Sisal Fibres”.
Prakash Krishnaiah, Sivakumar Manickam and C.T. Ratnam, 2017. “Synergistic
effects of alkali and high intensity ultrasound treatments on thermal stability, water
absorption and soil biodegradation of polylactide based bio-composites reinforced
sisal fibres”.
Prakash Krishnaiah, Sivakumar Manickam and C.T. Ratnam, 2017. “Bio-composites
based on polypropylene reinforced with surface treated sisal fibres: Investigation of
dynamic-mechanical, water absorption and thermal properties”.

ix
Acknowledgement
I would like to express my profound gratitude and deep appreciation to my academic
chief supervisor Professor Sivakumar Manickam for his valuable guidance, support,
patience and enthusiastic encouragement throughout the entire period of this research
which enabled me to complete the important milestone in my life.
I am also thankful to my co-supervisor Dr. Chantara Thevy Ratnam for her valuable
guidance, support and suggestions throughout this research work.
I would like to thank Dr. Ibrahim Alzorqi for his encouragement and support during
his stay as a PhD student in the University of Nottingham.
I would also like to thank to Dr. Abdul Khaliq Rasheed and Mr. Debabrata Panda
for their help during this research work.
Special thanks to Ms. Noor Fatihah Suhaimi and Mr. Ahmad Fareez Mohd Rawi
(laboratory technical staff, faculty of engineering) for their valuable support for
completing this work.
Many thanks to all my friends and well-wishers for their encouragement which
inspired me to complete the assignment.

x
Table of contents
Abstract………………………………………………………………………...…….iii
Publications……………………………………………………………………...….viii
Acknowledgement……………………………………………………………………ix
Table of contents……………………………………………………………………...x
List of figures…………………………………………………………………...…xviii
List of tables…………………………………………………………………....…xxvii
Abbreviations…………………………………………………………………...…xxix
CHAPTER I………………………………………………………………………..001
Introduction………………………………………………….……………………..001
1.1 Background……………………………………….……………………..001
1.2 Problem statement……………………………………………………….003
1.3 Scope of the work……………………………………………………….004
1.4 Objectives……………………………………………………………….005
1.5 Outline of the thesis……………………………………………………..006
CHAPTER II………………………………………………………………………008
Literature review…………………………………………………………………..008

xi
2.1 Polymer composites…………………………………….……………….008
2.2 Natural fibres……………………………………………………………009
2.2.1 Properties of natural fibres………….…………………………010
2.2.2 Composition of natural fibres…………………………………012
2.2.2.1 Cellulose…………………………………………….014
2.2.2.2 Hemicellulose……………………………………….015
2.2.2.3 Lignin……………………………………………….016
2.2.2.4 Pectin………………………………………………..018
2.2.3 Sisal fibres…………………………………………………….018
2.3 Major concern over usage of natural fibres……………………………..022
2.4 Surface treatments on natural fibres…………………………………….022
2.4.1 Alkali treatment…………………………………………….....024
2.4.2 High intensity ultrasound (HIU) treatment……………..…..…026
2.4.3 The combined treatment of alkali and HIU…………………...028
2.5 Clay based nanofillers…………………………………………….……..029
2.5.1 Halloysite (Hal) nanotubes...………………………………….030
2.6 Polymer matrix materials……………………………………….……….032
2.6.1 Polylactide or Poly lactic acid (PLA)…………………………032
2.6.2. Polypropylene (PP)……………………………….…………..037

xii
2.7 Methods used for the processing of polymer composites………………038
2.7.1 Melt mixer…………………………………………………….038
2.7.2 Compression moulding…………………….………………….039
2.8 Factors affecting the properties of fibre reinforced composites………...040
2.8.1 Dispersion of fibres in the composites…………….…………..040
2.8.2 Fibre orientation………………………………………….……041
2.8.3 Aspect ratio of fibres……………………………………….….041
2.8.4 Fibre volume fraction…………………………………….……042
2.9 Theoretical predictions of Young’s modulus…………………………....042
2.9.1 Parallel and series model……………………………………...043
2.9.2 Hirsch model…………………………………………….…….045
2.9.3 Bowyer and Baber model……………………………………..046
2.10 Summary of literature review………………………………………….047
CHAPTER III……………………………………………………………………...048
Experimental……………………………………………………………………….048
3.1 Introduction……………………………………………………………..048
3.2 Materials………………………………………………………………...048
3.3 Surface treatment methods……………………………………………...049
3.3.1. Fibre surface treatments……………………………………...049

xiii
3.3.1.1 Alkali treatment……………………………………..049
3.3.1.2 Treatment with high intensity ultrasound (HIU)……049
3.3.2 Surface modification of Halloysite (Hal) nanotubes………….050
3.4 Fabrication of composites…………………….…………………………052
3.4.1 Sisal-PLA composites………………….……….……………..052
3.4.2 Sisal-PP composites……………………….…………….…….053
3.4.3 Hal-PLA nanocomposites………………………………….….054
3.4.4 Hal-PP nanocomposites……………………………………….055
3.5 Characterisation techniques……………………………………………..055
3.5.1 FTIR analysis…………………………….……………………055
3.5.2 FE-SEM analysis……………………………………………...056
3.5.3 Nitrogen absorption-desorption analysis……………………...056
3.5.4 XRD analysis………………………………………………….057
3.5.5 Tensile properties of single sisal fibre………………..……….057
3.5.6 Density measurement……………………………….…………058
3.5.7 Tensile properties of the composites………………………….059
3.5.8 Impact properties of the composites…………………………..059
3.5.9 TGA analysis………………………………………………….059
3.5.10 DSC analysis……………………………………….………...060

xiv
3.5.11 DMA analysis………………………………………………..061
3.5.12 Water absorption studies……………………….…………….061
3.5.13 Biodegradability analysis……………………………….……062
CHAPTER IV……………………………………………………………………...064
Results and discussion: surface treatments and characterisation of sisal
fibres………………………………………………………………………………...064
4.1 Effects of alkali and HIU treatments on sisal fibres…………………….064
4.2 FTIR analysis……………………………………………….…………...068
4.3 Morphology of sisal fibres…………………………………….………...071
4.4 Analysis of moisture absorption………………………………………...073
4.5 Analysis of fibre diameter………………………………………….……075
4.6 XRD analysis……………………………………………………………077
4.7 TGA analysis……………………………………………………………081
4.8 Tensile properties of single sisal fibre…………………………………..085
4.9 Conclusions……………………………………………………………...088
CHAPTER V………………………………………………………….……………089
Results and discussion: Sisal-PLA composites……………………………...……089
5.1 FE-SEM analysis………………………………………………………..089

xv
5.2 FTIR analysis…………………………………………………….……...092
5.3 Tensile properties……………………….…………………………….....094
5.4 Predictions of Young’s modulus………………………………………..098
5.5 Impact properties………………………………………………………..103
5.6 DMA analysis…………………………………………………………...104
5.7 TGA analysis……………………………………………………………109
5.8 DSC analysis……………………………………………………….……111
5.9 Water absorption studies………………………………………….……..114
5.10 Biodegradability analysis………………………………………….…...118
5.11 Conclusions…………………………………………………………….122
CHAPTER VI………………………………………………………….…………..123
Results and discussion: Hal-PLA nanocomposites………………………………123
6.1 Nitrogen absorption-desorption analysis………………………………..123
6.2 FTIR analysis…………………………………….……………………...124
6.3 FE-SEM analysis………………………………………………………..129
6.4 FE-SEM with EDX analysis for Hal nanotubes………………………...131
6.5 Tensile and impact properties…………………………………………...132
6.6 DMA analysis…………………………………………………………...137

xvi
6.7 TGA analysis…………...……………………………………………….140
6.8 DSC analysis………………………...………………………….……….143
6.9 Conclusions……………………………………………………………...146
CHAPTER VII…………………………………………………………..…………147
Results and discussion: Sisal-PP composites………………………..…………....147
7.1 FE-SEM analysis………………………………………………………..147
7.2 Tensile and impact properties…………………………………….……..148
7.3 TGA analysis……………………………………………………………153
7.4 DSC analysis………………………………………………….…………155
7.5 DMA analysis…………………………………………………………...158
7.6 Water absorption studies…………………………………………….…..162
7.7 Conclusions……………………………………………………………...167
CHAPTER VIII……………………………………………………………………168
Results and discussion: Hal-PP nanocomposites………………………………...168
8.1 FE-SEM analysis………………………………………………………..168
8.2 Tensile and impact properties…………………………………….……..169
8.3 TGA analysis……………………………………………………………174

xvii
8.4 DSC analysis…………………………………………………….………175
8.5 DMA analysis…………………………………………………………...177
8.6 Conclusions……………………………………………………………...181
CHAPTER IX……………………………………………………………………...183
Conclusions and future work………………………………………………….…..183
9.1 Conclusions………………………………………….…………………..183
9.2 Suggestions for future work………………………………………….….185
References…………………………………….…………………………………….186
Appendices………………………………………………………………………….216

xviii
List of figures
Figure 2.1 General classifications of natural fibres…………………………………010
Figure 2.2 Constituents and structural arrangements of plant cell wall……….…….014
Figure 2.3 Haworth projection formula of cellulose……………………….………..015
Figure 2.4 Chemical structure of hemicellulose…………………………………….016
Figure 2.5 Chemical structure of lignin……………………………………………..016
Figure 2.6 Chemical structure of three main precursors of lignin…………………..017
Figure 2.7 Chemical structure of pectin…………………………………………….018
Figure 2.8 Photograph of sisal plant………………………………………………...019
Figure 2.9 Cross sectional view of sisal leaf and ribbon-fibre bundles………….….020
Figure 2.10 Schematic diagram showing the mechanism of HIU treatment on natural
fibres………………………………………………………………………………...027
Figure 2.11 Pictorial representations of chemical and ultrasound treatments on natural
fibres………………………………………………………………………………...028
Figure 2.12 The two stereo-isomeric forms of lactic acid…………………………..034
Figure 2.13 Synthesis of PLA from L- and D-lactic acids………………………….034
Figure 3.1 Schematic diagram of the method followed to determine the tensile
strength of single fibre………………………………………………..……………..058

xix
Figure 4.1 Schematic representation of the effects of alkali and HIU treatments on the
sisal fibres…………………………………………………………………………...066
Figure 4.2 Visual examination of sisal fibres: (A) Untreated (UT), (B) High intensity
ultrasound treated (ULT), (C) Alkali treated (ALKT), (D) Combination of alkali and
high intensity ultrasound treated (ALKT-ULT) sisal fibres………………………...067
Figure 4.3 FTIR spectra of untreated (UT), ultrasound treated (ULT), alkali treated
(ALKT) and the combination of alkali and ultrasound treated (ALKT-ULT) sisal
fibres………………………………………………………………………………...070
Figure 4.4 FE-SEM micrographs of sisal fibres: (A) Untreated (UT) (B) Ultrasound
treated (ULT) (C) Alkali treated (ALKT) (D) the combination of alkali and ultrasound
treated (ALKT-ULT)………………………………………………………….…….072
Figure 4.5 Moisture content of untreated (UT), ultrasound treated (ULT), alkali treated
(ALKT) and the combination of alkali and ultrasound treated (ALKT-ULT) sisal
fibres………………………………………………………………………………...074
Figure 4.6 FE-SEM images of sisal fibres with the diameter for different concentration
of alkali treatment and combination of alkali and ultrasound treatments (A) Untreated
(B) HIU treated (C) Alkali treated (D) the combination of alkali and HIU
treated……………………………………………………………………………….076
Figure 4.7 X-ray diffractogram of untreated (UT), alkali treated (ALKT) and the
combination of alkali and HIU treated (ALKT-ULT) sisal fibres (A: Untreated, B:
HIU treated, C-G: Alkali treated (3, 5, 7, 9 and 15 wt% of alkali), H-L: Combination
of alkali and HIU treated (3, 5, 7, 9 and 15 wt% of alkali)…………………...…….079

xx
Figure 4.8 Percentage of crystallinity as a function of percentage of alkali
concentration for untreated (UT), high intensity ultrasound treated (ULT), alkali
treated (ALKT) and the combination of alkali and high intensity ultrasound treated
(ALKT-ULT) sisal fibres………………………………………………………...….080
Figure 4.9 TGA curves of untreated (UT), ultrasound (ULT) and alkali treated
(ALKT) sisal fibres…………………………………………………..……………...081
Figure 4.10 TGA curves of untreated (UT), ultrasound treated (ULT) and the
combination of alkali and ultrasound treated (ALKT-ULT) sisal fibres…………....083
Figure 4.11 Thermal stability of untreated (UT), alkali (ALKT) and the combination
of alkali and ultrasound treated (ALKT-ULT) sisal fibres……………………..…...084
Figure 4.14 Typical stress-strain curves of single sisal fibre………………….…….085
Figure 4.15 Tensile properties of untreated (UT), high intensity ultrasound treated
(ULT), alkali treated (ALK) and the combination of alkali and high intensity
ultrasound treated (ALKTULT) sisal fibres: (A) tensile strength (B) tensile
modulus……………………………………………………………………………...087
Figure 5.1 FE-SEM images of (A) untreated (UT), (B) ultrasound treated (ULT), (C)
alkali treated (ALK) and (D) the combination of alkali and ultrasound treated
(ALKTULT) SF/PLA composites…………………………………………………..090
Figure 5.2 FTIR spectra of sisal fibre, pure PLA and SF/PLA composites…….......092
Figure 5.3 Tensile strength of untreated (UT), ultrasound treated (ULT), alkali treated
(ALK) and the combination of alkali and ultrasound treated (ALKTULT) sisal fibres
reinforced PLA composites………………………………………………..………..094

xxi
Figure 5.4 Tensile modulus of untreated (UT), HIU treated (ULT), alkali treated
(ALK) and the combination of alkali and HIU treated (ALKULT) SF/PLA
composites……………………………………………………………………..……096
Figure 5.5 Tensile elongation at break of untreated (UT), HIU treated (ULT), alkali
treated (ALK) and the combination of alkali and HIU treated (ALKULT) sisal fibres
reinforced PLA composites………………………………………………………....098
Figure 5.6 Variations of theoretical and experimental values of tensile modulus for the
untreated sisal fibre reinforced PLA composites…………………………………....099
Figure 5.7 Variations in the theoretical and experimental values of tensile modulus for
the HIU treated SF/PLA composites……………………………………………..…100
Figure 5.8 Variations in the theoretical and experimental values of tensile modulus of
alkali treated SF/PLA composites……………………………………………...……101
Figure 5.9 Variations in the theoretical and experimental values of tensile modulus of
the combination of alkali and HIU treated SF/PLA composites…………………....102
Figure 5.10 Impact strength of untreated (UT), ultrasound treated (ULT), alkali treated
(ALK) and the combination of alkali and HIU treated (ALKULT) SF/PLA
composites…………………………………………………………………………..103
Figure 5.11 Storage modulus (Eʹ) of untreated (UT), HIU treated (ULT), alkali treated
(ALK) and the combination of alkali and HIU treated (ALKULT) sisal fibres
reinforced PLA composites………………………………………..………………..105

xxii
Figure 5.12 Loss modulus (E") curves of untreated (UT), HIU treated (ULT), alkali
treated (ALK) and the combination of alkali and HIU treated (ALKULT) SF/PLA
composites…………………………………………………………………………..107
Figure 5.13 Tan delta curves of untreated (UT), HIU treated (ULT), alkali treated
(ALK) and the combination of alkali and HIU treated (ALKULT) SF/PLA
composites……………………………………………………………………..……108
Figure 5.14 TGA of untreated (UT), HIU treated (ULT), alkali treated (ALK) and the
combination of alkali and HIU treated (ALKULT) SF/PLA composites…………...110
Figure 5.15 DSC thermograms of pure PLA, untreated (UT), HIU treated (ULT),
alkali treated (ALK), and the combination of alkali and HIU treated (ALKULT)
SF/PLA composites………………………………………………………..………..112
Figure 5.16 Effect of fibre loading on water absorption of untreated SF/PLA
composites…………………………………………………………………………..114
Figure 5.17 Effect of high intensity ultrasound (ULT), alkali (ALK) and the
combination of alkali and HIU (ALKULT) surface treatments on the water absorption
of SF/PLA composites……………………………………………………..………..116
Figure 5.18 Biodegradation of untreated (UT), HIU treated (ULT), alkali treated
(ALK) and the combination of alkali and HIU treated (ALKULT) sisal fibre
reinforced PLA composites with different weight percentage of fibre
loading……………………………………………………………………..………..119
Figure 5.19 FE-SEM images of outer surface of the soil buried samples (A) Pure PLA
before soil burial, (B) Pure PLA after 60 days, (C) Pure PLA after 120 days, (D) 15
wt% untreated sisal fibre (UT) + PLA composites before soil burial, (E) 15UT+PLA

xxiii
after 60 days, (F) 15UT+PLA after 120 days, (G) 15 wt% of alkali and HIU treated
sisal fibre (ALKULT) + PLA composites before soil burial, (H) 15ALKULT+PLA
after 60 days, (I) 15ALKULT+PLA after 120 days………………………………...121
Figure 6.1 Nitrogen adsorption-desorption isotherms of unmodified (uHal) and
APTES modified Hal nanotubes (mHal)………………………………………...….124
Figure 6.2 FTIR spectra of unmodified (uHal) (A) and APTES modified Hal
nanotubes (mHal) (B)………………………………………………………...……..125
Figure 6.3 FTIR spectra of PLA/unmodified Hal nanotubes (PLAuHal) (A) and
PLA/APTES modified Hal nanotubes (PLAmHal) (B)………………………...…...127
Figure 6.4 FE-SEM images of impact fractured samples of unmodified (uHal) and
APTES modified (mHal) Hal-PLA nanocomposites: (A) Hal nanotubes (B) Pure PLA
(C) 4 wt% uHal (D) 4 wt% mHal………………………………………………..….130
Figure 6.5 FE-SEM images of (A) unmodified (uHal) and (B) APTES modified Hal
nanotubes (mHal)……………………………………………………………….…...131
Figure 6.6 Tensile strength of unmodified and APTES modified Hal-PLA
nanocomposites……………………………………………………………………..133
Figure 6.7 Tensile modulus of Hal nanotubes (unmodified (uHal) and APTES
modified Hal nanotubes (mHal)) PLA nanocomposites…………………………....134
Figure 6.8 Impact strength of Hal nanotubes (unmodified (uHal) and APTES modified
(mHal)) PLA nanocomposites………………………………………………………136
Figure 6.9 storage modulus of Hal (unmodified (uHal) and APTES modified (mHal))
PLA nanocomposites………………………………………………………………..138

xxiv
Figure 6.10 Comparison of Tan delta values of Hal nanotubes (unmodified (uHal) and
APTES modified (mHal)) PLA nanocomposites…………………………………....139
Figure 6.11 TGA curves of (A) unmodified (uHal) and (B) APTES modified Hal
nanotubes (mHal)……………………………………………………………………140
Figure 6.12 TGA curves of Hal nanotubes (modified and unmodified) PLA
nanocomposites……………………………………………………………………..142
Figure 6.13 DSC curves of Hal nanotubes (unmodified (uHal) and APTES modified
(mHal)) PLA nanocomposites…………………………………………………..…..143
Figure 7.1 FE-SEM micrographs of sisal fibres reinforced PP composites (A)
Untreated (UT), (B) HIU treated (ULT), (C) Alkali treated (ALKT), (D) Combined
treatment of alkali and HIU (ALKT-ULT)………………………………………….148
Figure 7.2 Tensile strength of untreated and treated sisal fibre reinforced PP
composites 1) Untreated (UT) 2) HIU treated (ULT) 3) Alkali treated (ALKT) 4)
combined treatment of alkali and HIU (ALKT-ULT)……………………...……….149
Figure 7.3 Elongation at break of untreated and treated sisal fibre reinforced PP
composites…………………………………………………………………………..151
Figure 7.4 Tensile modulus of untreated and treated sisal fibre reinforced PP
composites…………………………………………………………………………..152
Figure 7.5 TGA of untreated (UT), HIU treated (ULT), alkali treated (ALK) and the
combination of alkali and HIU treated (ALKULT) SF/ PP composites…………….153

xxv
Figure 7.6 DSC endothermic heating curves of untreated (UT), HIU treated (ULT),
alkali treated (ALK), and the combination of alkali and HIU treated (ALKULT)
SF/PP composites………………………………………………………….………..156
Figure 7.7 DSC exothermic cooling curves of untreated (UT), HIU treated (ULT),
alkali treated (ALK), and the combination of alkali and HIU treated (ALKULT)
SF/PP composites………………………………………………………….………..157
Figure 7.8 Storage modulus (E') of untreated (UT), HIU treated (ULT), alkali treated
(ALK), and the combination of alkali and HIU treated (ALKULT) SF/PP
composites……………………………………………………………………….….159
Figure 7.9 Tan δ curves of untreated (UT), HIU treated (ULT), alkali treated (ALK),
and the combination of alkali and HIU treated (ALKULT) SF/PP composites…….160
Figure 7.10 Loss modulus curves of untreated (UT), HIU treated (ULT), alkali treated
(ALK), and the combination of alkali and HIU treated (ALKULT) SF/PP
composites…………………………………………………………………………..162
Figure 7.11 Effect of fibre loading on the water absorption of untreated SF/PP
composites…………………………………………………………………………..163
Figure 7.12 Effect of HIU (ULT), alkali (ALK) and the combination of alkali and HIU
(ALKULT) surface treatments on the water absorption of SF/PP composites……...164
Figure 8.1 FE-SEM image of unmodified (a) and APTES modified (b) Hal nanotubes
reinforced PP nanocomposites………………………………………………….…...168
Figure 8.2 Tensile strength of untreated and APTES modified Hal nanotubes
reinforced PP nanocomposites……………………………………………..………..170

xxvi
Figure 8.3 Tensile modulus of unmodified and APTES modified Hal nanotubes
reinforced PP nanocomposites……………………………………………..………..171
Figure 8.4 Elongation at break of unmodified and APTES modified Hal nanotubes
reinforced PP nanocomposites………………………………………………………172
Figure 8.5 Izod impact strength of notched unmodified and APTES modified Hal-PP
nanocomposites……………………………………………………………….……..173
Figure 8.6 TGA thermo-grams of pure PP, unmodified and APTES modified Hal-PP
nanocomposites……………………………………………………………………...174
Figure 8.7 DSC melting curves of pure PP, unmodified and APTES modified Hal-PP
nanocomposites……………………………………………………………………..176
Figure 8.8 DSC cooling curves of pure PP, unmodified and APTES modified Hal-PP
nanocomposites……………………………………………………………………..177
Figure 8.9 Storage modulus (E') curves of unmodified and APTES modified Hal
nanotubes reinforced PP nanocomposites…………………………………………...179
Figure 8.10 Loss modulus curves of unmodified and APTES modified Hal nanotubes
reinforced PP nanocomposites……………………………………………………....180
Figure 8.11 Tan δ curves of unmodified and APTES modified Hal nanotubes
reinforced PP nanocomposites………………………………………………...…….181

xxvii
List of tables
Table 2.1 Mechanical and physical properties of few important natural fibres…….011
Table 2.2 Chemical composition of few important natural fibres…………………..013
Table 2.3 Comparison of physical and mechanical properties PLA and other
commodity polymers..................................................................................................036
Table 3.1 Composition of untreated and treated sisal fibres reinforced PLA
composites…………………………………………………………………………..052
Table 3.2 Composition of PP/Sisal composites……………………………….…….053
Table 3.3 Composition of Hal nanotubes (APTES modified/unmodified) PLA
nanocomposites…………………………………………………………….………..054
Table 3.4 Composition of Hal nanotubes (APTES modified/unmodified) PP
nanocomposites……………………………………………………………….……..055
Table 4.1 FTIR transmittance peaks of the constituents of sisal fibres……………..069
Table 4.2 Diameter of untreated and different surface treated sisal fibres………….077
Table 5.1 Effects of surface treatments on thermal stability of SF/PLA composites.111
Table 5.2 Thermal properties of pure PLA and SF/PLA composites……………….113
Table 5.3 Water absorption properties of SF/PLA composites……………………..118
Table 6.1 Nitrogen adsorption and desorption data of surface area (SBET), Langmuir
surface area, volume (Vpore) and width (Wpore) for unmodified (uHal) and APTES
modified Hal nanotubes (mHal)………………………………………………….....123

xxviii
Table 6.2 FTIR bands and assignments for uHal, mHal and Hal-PLA
nanocomposites……………………………………………………………………...128
Table 6.3 EDX results of unmodified and APTES modified Hal
nanotubes………………………………………………………………………...….131
Table 6.4 Mechanical properties of Hal nanotubes (unmodified and APTES modified)
PLA nanocomposites………………………………………………………………..135
Table 6.5 storage modulus (at room temperature) and peak temperature of tan δ (Tg)
of Hal nanotubes (unmodified (uHal) and APTES modified (mHal)) PLA
nanocomposites……………………………………………………………………...139
Table 6.6 Thermal properties of Hal nanotubes (unmodified (uHal) and APTES
modified (mHal)) PLA nanocomposites………………………………………….…143
Table 6.7 DSC results of Hal nanotubes (unmodified (uHal) and APTES modified
(mHal)) PLA nanocomposites…………………………………………………..…..145
Table 7.1 Thermal properties of PP and untreated and different surface treated SF/PP
composites…………………………………………………………………………..157
Table 7.2 Storage modulus of SF/PP composites…………………………………...159
Table 7.3 Water absorption properties of SF/PP composites……………………….166
Table 8.1 TGA and DSC data of melting temperature (Tm), cold crystallization
temperature (Tc) and percentage of crystallinity (Xc)……………………………….177

xxix
List of Abbreviations
APTES 3-Aminopropyltriethoxysilane
ASTM American society for Testing and Materials
CPN Clay Polymer Nanocomposites
DMA Dynamic Mechanical Analysis
DSC Differential Scanning Calorimetry
exo Exothermic
FTIR Fourier Transform Infrared spectroscopy
FE-SEM Field-emission scanning electron microscopy
Fig Figure
GPa Giga Pascal
h Hours
Hal Halloysite
HDPE High-density Polyethylene
HIU High intensity ultrasound
ISO International Standard Organisation
KBr Potassium Bromide
kHz Kilohertz
LDPE Low-density Polyethylene
mg Milligram
MPa Mega Pascal
ml Millimetre
Mw Molecular weight
NaOH Sodium hydroxide
nm Nanometre
OH Hydroxide

xxx
Pa Pascal
PE Polyethylene
PLA Polylactide or Poly (lactic acid)
PP Polypropylene
PS Polystyrene
PVC Polyvinyl Chloride
SF Sisal Fibres
s Second
TGA Thermo-gravimetric analysis
Wt% Weight Percentage
W/v Weight/volume ration
oC Celsius

1
CHAPTER I
Introduction
1.1 Background
Polymer composite materials are playing an important role in our day-to-day life from
aerospace industries to common household applications due to their low density, high
strength, easy processability, easy availability and more importantly low cost as
compared to metal matrix composites. However, extensive usage of petroleum based
fibres such as glass fibres, Kevlar fibres, carbon fibres, and phenolic based fibres etc.
as reinforcement fillers in the generation of polymer composites raises many issues
such as depletion of petroleum resources, waste management due to non-degradable
fillers and matrices used and environmental pollution etc. Thus, it is important to
develop fully or partially biodegradable polymer matrices as well as fillers to produce
the biodegradable polymer composites to combat the above-mentioned challenges
(Raquez et al., 2013).
Currently researchers focus on the development of bio-derived polymer matrix and
filler materials to produce biodegradable polymer composites. Poly (lactic acid) or
Polylactide (PLA) is one such polymer matrix with high potential to replace many
conventional synthetic polymer matrices. It is derived from the renewable resources
such as corn, starch and sugarcane (Raquez et al., 2013). PLA is getting wide
attention owing to its attractive mechanical properties, recyclability, biocompatibility
and biodegradability (Wu et al., 2013; Arrieta et al., 2014). However, PLA has
limitations of low thermal stability, low toughness and extreme brittleness (Pandey et
al., 2005; Lim et al., 2008). It is therefore necessary to improve the mechanical and

2
thermal properties of PLA when we aim for specific applications more importantly on
a large scale (Raquez et al., 2013).
To overcome the limitations of PLA, it is necessary to incorporate different types of
filler materials into PLA matrix. Natural fibres and natural clay materials are the two
different types of fillers which are highly cost-effective and offer many benefits such
as improved mechanical and thermal properties of the composites, easy processing,
light weight, recyclability, biodegradability and biocompatibility. Over the last few
decades, natural fibres are emerging as one of the best reinforcing fillers in the
production of polymer composites due to their properties that are environmentally
favourable (Dittenber and Gangarao, 2012). Some of the important properties of
natural fibres as compared to their synthetic counterparts are ready availability with
low cost, good mechanical properties, low weight, eco-friendly, biocompatibility and
biodegradability (Azwa et al., 2013).
Natural fibres are derived from plant based materials such as banana, hemp, sisal, jute,
kenaf blast, flax, bamboo, palm sugarcane, date etc. (Sudhakara et al., 2013; Šutka et
al., 2013; Saba et al., 2016). Amongst all cellulosic fibres, sisal fibres are the well
accepted natural fibres to use them as reinforcing fillers in the generation of polymer
composites due to their higher cellulosic content (>78%), high stiffness and good
tensile strength (>600MPa). Sisal fibres are hard and stiff and are extracted from the
leaves of sisal plant (Li et al., 2000).
However, unlike many other synthetic fibres, natural fibres have limitations due to
their hydrophilic nature which causes incompatibility with hydrophobic nature of
polymer matrices to use them as reinforcing fillers. This is mainly due to the presence
of amorphous materials such as hemicellulose, lignin, pectin and other waxy materials

3
on the surface of natural fibres. These amorphous materials have the tendency of
absorbing moisture which leads to a significant reduction in the mechanical, thermal
and structural properties of natural fibre reinforced polymer composites (John and
Thomas, 2008). Thus, it is important to remove the amorphous materials from the
surface of natural fibres in order to achieve the targeted mechanical, thermal and
structural properties depending on the end use applications. Surface treatment is often
the used method in the removal of amorphous materials which enhances the
interfacial adhesion between the reinforcing fillers and polymer matrices which leads
to improved mechanical and thermal properties of the composites (Kabir et al., 2012).
It has already been proved that the incorporation of nanofillers onto PLA matrix
increases crystallization ability, elongation and thermal properties. The incorporation
of exfoliated graphite onto PLA matrix increased the tensile strength and thermal
stability by 12% and 14 oC respectively as compared to pure PLA (Evagelia et al.,
2011; Kim and Jeong, 2010). The clay based nanofillers as plasticizer are good
substitutes which also improved the thermal properties of PLA more than 20% as
compared to pure PLA (Liu et al., 2013).
1.2 Problem statement
In recent years, there are growing concerns of environmental pollution due to
extensive usage of synthetic polymer composites which are derived from petroleum
resources. These synthetic polymer composites are completely non-degradable which
cause a huge threat to environment. Since these polymeric materials are non-
degradable, waste management is the major issue. It is reported that more than 275
million metric tons of plastic wastage is getting generated from 192 countries in
which around 12 million metric tons entering to the ocean every year (Jambeck et al.,

4
2015) which cause severe environmental pollution. Another major problem by using
the petroleum based polymers is the depletion of petroleum resources. It is therefore
important to develop fully or partially biodegradable polymer composites in order to
overcome the above-said environmental issues.
1.3 Scope of the work
PLA is an important biodegradable polymer which has good tensile properties,
biodegradability, biocompatibility and derived from renewable sources such as corn,
starch etc. However, PLA has major drawbacks such as high brittleness, lower impact
strength, low thermal stability and high cost as compared to conventional polymers
which cause limitations to its usage in many technical applications. The main scope of
this work is to improve the mechanical and thermal properties of PLA with the
incorporation of different types of fillers.
Among many natural fibres, sisal fibres are gaining good attention owing to their
good tensile strength, easy availability, low density, low cost and biodegradability.
However, sisal fibres are hydrophilic in nature due to the presence of amorphous
materials on the surface of fibres which cause incompatibility between sisal fibres and
polymer matrix leading to a major issue in employing the sisal fibres as fillers in the
generation of PLA polymer composites. Amorphous materials from the surface of
sisal fibres can be removed by using different surface treatments which are effective
in removing the amorphous materials and enhance the interfacial adhesion between
sisal fibres and polymer matrices.
On the other hand, halloysite (Hal) nanotubes are naturally occurring aluminosilicates
having the formula, Al2Si2O5 (OH)4.nH2O. Their tubular structure in nano dimension
with high aspect ratio makes them as unique materials to be used as fillers in the

5
generation of clay-polymer nanocomposites (CPN). However, similar to other
nanoparticles, dispersion of Hal nanotubes into polymer matrix is challenging (Kim
and Jeong, 2010; Raquez et al., 2013). Modification or functionalization of nanofillers
is a way to enhance their dispersion into polymer matrix. Functionalization of Hal
nanotubes can enhance the surface properties and leads to good dispersion into PLA
matrix of the CPN. Surface modification of Hal nanotubes with different types of
silane coupling agents is the most common method to improve the surface properties
of Hal nanotubes. This method is referred as the grafting of silanes and is carried out
via condensation between hydrolysed silanes and surface hydroxyl groups of Hal
nanotubes. The modification of Hal nanotubes with silane coupling agent enhanced
the dispersion of Hal nanotubes into polymer matrix and improved the mechanical
properties and thermal stability of the resultant nanocomposites (Rooj et al., 2010).
1.4 Objectives:
To study the effect of different surface treatments such as alkali, high intensity
ultrasound (HIU) and the combination of alkali and HIU treatments on the
removal of amorphous materials from the surface of sisal fibres and
characterising the structural and morphological changes of sisal fibres. This
study also involves the investigations of crystallinity, thermal stability and
tensile properties of untreated and different surface treated sisal fibres.
To prepare sisal fibre reinforced PLA composites and to study the effect of
alkali, HIU and the combination of alkali and HIU surface treatments on
morphology, mechanical, thermal, water absorption and biodegradability
properties of sisal fibres reinforced PLA biocomposites. This study also
involves the theoretical predications of Young’s modulus of the effect of
different surface treatments of sisal fibres reinforced with PLA biocomposites.

6
To study the effect of silane coupling agent i.e., 3-Aminopropyltriethoxy
silane (APTES) on the surface of Halloysite (Hal) nanotubes and
characterising APTES modified Hal nanotubes and their PLA nanocomposites
for their structural modifications, morphology, mechanical and thermal
properties.
To study the effect of different surface treatments of sisal fibres and their
polypropylene (PP) composites on their morphological, mechanical, thermal
and water absorption properties.
To investigate the effect of APTES modified Hal nanotubes on the
mechanical, dynamic mechanical, thermal and water absorption properties of
PP nanocomposites reinforced with Hal nanotubes.
1.5 Outline of the thesis:
This thesis consists of nine chapters. Chapter one is the introduction which describes
the background and objectives of the present study and also summarises the outline of
the thesis. Chapter two consists of a comprehensive literature review which addresses
the relevant background of the present work. Chapter three gives the details of
materials, experimental procedures and characterisation techniques used in this
investigation. Chapter four represents the results and discussion of the effects of
different surface treatments such as alkali, HIU, and the combination of alkali and
HIU treatments on the structural, mechanical and thermal properties of sisal fibres.
Chapter five deals with the results and the detailed discussion of the effect of fibre
surface treatments and fibre loading on the morphology, mechanical, physical,
thermal, water absorption properties as well as the biodegradability of sisal fibres
reinforced PLA composites. Chapter six describes the results and discussion of the
effect of surface modification on the morphology, structural changes and thermal

7
properties of APTES modified Hal nanotubes. This chapter also deals with the results
and discussion of the effect of surface modification and filler loading on the
morphological, mechanical and thermal properties of Hal nanotubes reinforced PLA
nanocomposites. Chapter seven gives the results and detailed discussion of the
morphological, mechanical, thermal and water absorption properties of untreated and
different surface treated sisal fibre reinforced PP composites. Chapter eight presents
the results and discussion of the effect of APTES modified Hal nanotubes on the
morphology, mechanical and thermal properties of PP composites reinforced with Hal
nanotubes. Chapter nine draws the conclusions of this investigation and also gives the
suggestions for the further investigation on this specialised area.

8
CHAPTER II
Literature Review
2.1 Polymer composites
Composites are combining and orienting of two or more different materials to achieve
superior properties which is a well-known and proven concept. There are many
examples for natural composites such as teeth, bones, bird feathers and plant leaves.
Composites can be produced with ceramics, metal or polymers which are used as
matrices and for the reinforcement phases different fibres can be used such as
ceramic, metallic or polymeric (Malhotra et al., 2012). However, a more common
classification relates to whether they are synthetic or natural (Gibson, 2010).
Polymer composites are low in strength and stiffness compared to metallic and
ceramic composites but their density is low and are easily formed. The reinforcing
phase of a composite can be either fibrous or particulate, the difference being that a
particle has almost equal dimensions in all the directions, whilst a fibre has a greater
length than its cross-sectional area and both of these reinforcements have been used to
produce composites. Fibre materials are receiving much attention in recent years due
to their high tensile strength and young’s modulus, low density and ability to give
better mechanical and thermal properties to end use applications. In the fibre
reinforced composite materials, fibres are used to carry the loads while the matrices
are used to bind the fibres together. Many fibre reinforced polymer matrix composites
offer a combination of strength and stiffness that are comparable to, or even better
than some of the traditional metallic composite materials (Tjong, 2013).

9
Different types of fibrous materials are used in the reinforcement phase of the
composites in order to get good mechanical properties. Generally fibres are classified
as natural and synthetic fibres. Few examples of synthetic fibres are carbon, acrylic,
phenolic, aramid and glass fibres. Synthetic fibres are strong and stiff as compared to
natural fibres (Diez-Pascual et al., 2014). However, synthetic fibres have drawbacks
such as high density, non-degradability, non-biocompatibility and also concern about
depletion of petroleum resources, waste management issues etc., so it is important to
develop biodegradable and renewable fibre materials such as natural fibres as
reinforcement fillers in the polymer composites (Mantia and Morreale, 2011).
The use of natural fibres as reinforcement fillers in the polymer composites to replace
conventional fibres like glass is the current trend. The usage of natural fibres gives
much attention to the materials engineers mainly because of the growing
environmental issues and advantages of natural fibres over their conventional
counterparts (Koronis et al., 2013a). In the last few years, research activities are
focussing on the application of natural fibres as reinforcement materials in the
polymer composites. The use of natural fibres in the generation of polymer
composites offers many advantages such as economically cheaper, their ability to
recycle and their good mechanical properties by which they compete with many
synthetic fibres (John et al. 2008).
2.2 Natural fibres
Natural fibres can be derived from plant, animal and minerals. General classification
of natural fibres is shown in Fig. 2.1. Plant or cellulosic fibres are the most commonly
used natural fibres in the generation of fibre reinforced polymer composites.
According to literature, apart from the wood based fibres, there are more than 1000

10
different types of natural fibres are available (Mwaikambo and Ansell, 2002). Natural
fibres can be extracted from different parts of the plant such as stem, leaves, fruits etc.
Fibres which are extracted from the stem are called as bast fibres. Few examples of
bast fibres are hemp, Ramie, Kenaf, flux, jute etc. Sisal, pineapple and abaca are the
common leaf fibres (Dittenber and Gangarao, 2012). Since the last two decades, the
production of natural fibres is being increased significantly due to awareness that non-
renewable resources are getting depleted.
Fig. 2.1 General classification of natural fibres (Abdul Khalil et al., 2012)
2.2.1 Properties of natural fibres
Natural fibres tend to be stronger and stiffer as compared to their animal counterparts
which make them useful as reinforcement materials to produce polymer composites.
Moreover naturally available fibre materials having advantages over animal fibres
such as easy processing, comparatively cheaper and are readily available. Natural
fibres reinforced polymer composites possess lower tensile strength as compared to
glass fibre composites though the modulus is of the same order of magnitude

11
(Pickering et al., 2016). Table 2.1 shows the mechanical and physical properties of
different natural fibres in order to have a broader view of their properties to compare
with their synthetic counterparts.
Table 2.1 Mechanical and physical properties of few important natural fibres (Dicker
et al., 2014; Dittenber and Gangarao, 2012; Ho et al., 2012; Koronis et al., 2013b)
Fibre type Density
(g/cm3)
Diameter
(μm)
Tensile
strength
(MPa)
Tensile
modulus
(GPa)
Moisture
content
(wt%)
Price
(USD/kilo)
Abaca 1.5 10 – 30 430 – 980 6 – 20 5 – 10 0.345
Bamboo 0.6 – 1.1 25 – 40 140 – 800 11 – 32 - 0.5
Banana 1.35 12 – 30 140 – 800 12 – 30 8.7 – 12 -
Coir 1.2 10 – 460 130 – 240 4 – 6 8 0.25 – 0.5
Cotton 1.5 – 1.6 10 – 45 350 – 800 7 – 12 7.85 – 8.5 2.1 – 4.2
Flax 1.5 12 – 600 750 – 940 75 – 90 8 – 12 2.1 – 4.2
Hemp 1.47 25 – 250 550 – 900 38 – 70 6.2 – 12 1.55
Jute 1.3 – 1.4 20 – 200 393 – 800 13 – 26 12 – 13 0.925
Kenaf 1.5 – 1.6 2.6 – 4 350 – 930 40 – 53 - 0.378
Oil palm 0.7 – 1.5 150 – 500 80 – 248 0.5 – 3.2 - -
Ramie 1.0 – 1.5 20 – 80 400 – 1000 24.5 – 128 7.5 – 17 2
Sisal 1.3 – 1.5 8 – 200 360 – 700 9 – 25 10 – 22 0.6 – 0.7
E-glass 2.55 15 – 25 345 – 1500 27 – 39 - 1.6 – 3.5
Carbon 1.8 <17 4400 – 4800 225 – 260 - 124 – 166

12
Mechanical and physical properties of natural fibres vary depending on factors such
as crop production, temperature, soil condition in which plants are growing and the
weather conditions. Fibre selection plays an important role in the achievement of
specific required properties. The location of the fibres within the plant influences the
properties of fibre materials (Dittenber and Gangarao, 2012). However, when the
specific modulus of natural fibres is considered, natural fibres show values that are
comparable to or even better than glass fibres. Savings on the material cost due to the
use of natural fibres and high fibre filling levels, coupled with the advantage of being
non-abrasive to the mixing and moulding equipment make natural fibres important
materials in the production of polymer composites. These benefits mean natural fibres
could be used in many applications which include building, automotive, household
appliances and others (Gurunathan et al., 2015; Yan et al., 2016b).
2.2.2 Composition of natural fibres
Chemical composition as well as structure of the natural fibres mainly depend on
several factors such as nature of the plant source, growing conditions of the plant,
climate, age of the plant and extraction process of the fibres (Faruk et al., 2012).
Table 2.2 shows the percentage composition of different natural fibres. A single
natural fibre filament has a diameter approximately in the range of 10 to 650 μm,
which itself is a kind of natural composite. It consists of three major components,
namely cellulose, hemicellulose and lignin in different proportions in different fibres.
From 80 to 90% of natural fibres made up of cellulose, hemicellulose, lignin and
pectin. Apart from these, natural fibres also have minerals, waxes and other water-
soluble components (Majeed et al., 2013). The inner cell wall contains rigid cellulose
component which is embedded in a soft lignin and hemicellulose matrix in the
secondary cell wall of the fibre materials (Dittenber and Gangarao, 2012).

13
Table 2.2 Chemical composition of few important natural fibres (John and
Anandjiwala, 2008; Abdul Khalil et al., 2012; Dittenber and Gangarao, 2012; Dicker
et al., 2014; Yan et al., 2016b)
Cellulosic
fibres
Composition (wt%)
Cellulose Hemicellulose Lignin Pectin
Hard wood 43 – 47 25 – 35 16 – 24 -
Soft wood 40 – 44 25 – 29 25 – 31 -
Abaca 56 – 63 20 – 25 7 – 13 0.8
Bagasse 32 – 55 30 20 10
Coir 32 – 43 10 – 20 43 – 49 4
Cotton 95 2 1 6
Oil palm 50 30 17 -
Flax 62 – 72 18.6 – 20.6 2 – 5 0.9
Hemp 68 – 74.4 15 – 22 3.7 – 10 0.9
Henequen 60 – 77 4 – 28 8 – 13 -
Jute 71 14 13 0.2
Kenaf 31 – 72 20.3 – 21.5 8 – 19 2
Ramie 76 17 1 2
Sisal 60 – 78 10 – 14 8 – 11 1.2
Composition and structural arrangements of plant fibre cell wall have been shown in
Fig. 2.2. The lignin material in the secondary cell wall bonds together with cellulose
and hemicellulose and it acts as a cementing material. Pectin is another component
which helps to attach the cellulose fibre with all other component together. Both

14
lignin and pectin are the weak amorphous polymers as compared to cellulose (Dicker
et al., 2014).
Fig. 2.2 Constituents and structural arrangements of plant cell wall (Rong et al., 2001)
2.2.2.1 Cellulose
Cellulose is one of the most abundant polymers on the earth and it is commercially
exploited in the form of wood. In the natural fibres, cellulose is the main structural
component and the mechanical properties of these fibres mainly depend on the
percentage of cellulose content. The crystalline cellulose is the elementary building
material which is responsible to give the strength to the plant stem and the variation in
strength is attributed to growth conditions of the plant such as botanical origin, soil
characteristics and weather conditions (Majeed et al., 2013). Cellulose is a linear,
semi-crystalline polysaccharide composed of polymer chains consisting of the
repeating units of anhydro-glucose linked via 1,4-β-D-glucosidic linkages as shown in
Fig. 2.3. The repeating units of these monomers are called as cellobiose (Zhu et al.,
2016). The molecular weight of these 1,4-β-D-glucosidic linkages depends on the

15
source of cellulose. General lignocellulosic fibres have the degree of polymerisation
(number of glucose units) up to 10000 (Abdul Khalil et al., 2012). The glucose
monomers in the cellulose chain form the hydrogen bonds within the chain forming
fibrils as well as neighbouring chains. The formation of these intra and intermolecular
hydrogen binding leads to the formation of linear crystalline structure (Eichhorn et al.,
2010).
Fig. 2.3 Haworth projection formula of cellulose (Bledzki and Gassan, 1999; Sawpan,
2009)
2.2.2.2 Hemicellulose
Hemicellulose is a heterogeneous branched polysaccharide composed of many
different glucose monomers whereas cellulose contains only 1,4-β-D-glucopyranose
repeating units. Fig. 2.4 shows the chemical structure of hemicellulose. Unlike
cellulose, hemicellulose constituents differ from one plant source to another.
Hemicellulose contains high degree of chain branching which confirms that
amorphous nature of hemicellulose. The degree of polymerisation for hemicellulose is
as low as 200 as compared to the cellulose molecule which has more than 10000
(Bledzki and Gassan, 1999).

16
Fig. 2.4 Chemical structure of hemicellulose (Kabir et al., 2012)
2.2.2.3 Lignin
Lignin is a complex hydrocarbon polymer which contains both aliphatic and aromatic
constituents. Along with cellulose, lignin is the most abundant organic polymer on the
earth. The chemical structure of lignin is shown in Fig. 2.5.
Fig. 2.5 Chemical structure of lignin (Bledzki and Gassan, 1999)

17
Lignin gives the compression strength to the plant by binding the fibres together to
form a stiff structure of the fibre surface (Bledzki and Gassan, 1999). The chemical
structure of lignin consists of phenylpropane units derived from an enzyme-initiated
dehydrogenate polymerisation of three different primary precursors namely trans-
coniferyl, trans-sinapyl and trans-p-coumaryl as shown in Fig. 2.6. These phenolic
substructures are also called p-hydroxyphenyl monolignols which form a complex 3-
dimensional chemical structure during the biological lignification process via radical
coupling reactions (Stephanie, 2014).
Fig. 2.6 Chemical structure of three main precursors of lignin (Stephanie, 2014)

18
2.2.2.4 Pectin
Pectin is a component of acidic polysaccharides with complex branched structure. The
pectin mainly consists of homopolymeric acid and partially residues of methylated
poly-α-(1-4)-D-galacturonic acid (Fig. 2.7). Pectin will become water soluble polymer
only after a partial neutralisation with alkali or ammonium hydroxide solution
(Bledzki and Gassan, 1999). Pectin acts as a binding material inside the natural fibres.
It binds the cellulose, hemicellulose and lignin along with pectin itself to form as
bundles. High concentration of pectin can be seen in the primary cell wall and the
middle lamella of natural fibres (Li et al., 2007). Most of the pectin removed during
retting process of the natural fibres. It is important to remove the pectin in order to get
technical fibres in the application of fibre reinforced polymer composites as
reinforcement material (Gurunathan et al., 2015).
Fig. 2.7 Chemical structure of pectin (Gurunathan et al., 2015)
2.2.3 Sisal fibres
Many different types of natural fibres are being exploited for the production of
biodegradable polymer composites (Herrmann et al., 1998; Satyanarayana et al.,
2009; Abdul Khalil et al., 2012; De Rosa et al., 2010; Kabir et al., 2012). More than
thousand types of natural fibres are already available (Mwaikambo and Ansell, 2002).
Among these, sisal fibres are one of the best reinforcing materials for polymer

19
composites owing to their higher cellulose content (78%), good tensile strength
(˃600MPa), easy availability and low cost (Li et al., 2000). Sisal fibres tend to be
hard and stiff and extracted from the sisal plant (Agave sisalana) (Fig. 2.8). Sisal
plants are mainly growing in tropical and sub-tropical countries like Brazil, Tanzania,
India, West Indies etc. A single sisal plant can produce 200-250 leaves in which 150
kilograms of fibres can be extracted in a year (Mishra et al., 2004).
Fig. 2.8 Photograph of sisal plant (http://www.flickriver.com/photos/40295335@N00/5219408347/)
The processing methods for the extraction of sisal fibres from sisal leaves include
retting followed by scrapping and mechanical methods by using decorticators. By
using mechanical extraction methods only 2-3% of good quality fibres can be
extracted. Whereas, a large quantity of fibres can be extracted by means of retting
methods. However, retting method gives poor quality of fibres with less lustrous
colour. Sisal fibres consist of 60-78% of cellulose, 10-14% of hemicellulose, 8-11%
of lignin and about 1.2% of pectin (Barkakaty, 1976). Three different types of fibres

20
can be extracted from the sisal leaf namely mechanical, ribbon and xylem fibres.
Mechanical fibres are extracted easily from the periphery part of the sisal leaf during
retting process.
Fig. 2.9 Cross sectional view of sisal leaf and ribbon-fibre bundles (Li et al., 2000)
These mechanical fibres are the commonly used sisal fibres for commercial purpose.
Ribbon fibres are extracted from the conducting tissues in the median line of the sisal
leaf. Ribbon fibres are the lengthy fibres as compared to mechanical fibres and they

21
are easily split longitudinally from the leaf during mechanical extraction process.
Xylem fibres are irregular in shape with very thin cell wall due to which they have
low strength and easily broken during processing. Xylem fibres are extracted from the
vascular bundles of the sisal leaf just opposite of the ribbon fibres as shown in Fig.
2.9 (Li et al., 2000). The sisal fibre cell wall itself is a form of composite structure
with spirally oriented cellulose in a hemicellulose and lignin matrix (Mishra et al.,
2004). The strength and stiffness of natural fibres mainly depending on the percentage
of cellulose content in the fibres. Since the sisal fibres have relatively high percentage
of cellulose content (60-78%), they demonstrate good mechanical properties (Li et al.,
2000). Table 2.2 compares the mechanical and physical properties of sisal fibres and
other natural fibres. Sisal fibres are one of the widely used natural fibres for the
generation of fibre reinforced polymer composites and Joseph et al. (1996) studied the
interfacial adhesion on the mechanical properties and fracture behaviour of short sisal
fibre reinforced polymer composites. They found that the tensile strength increased
significantly by 66%, 55%, 50% and 60% for sisal fibre reinforced LDPE, epoxy,
phenolic and polyester composites respectively.
Joseph et al. (2003) studied the thermal and crystallisation properties of short sisal
fibres reinforced polypropylene composites. They noticed that the thermal stability
and crystallinity increased by 14 oC and 23% respectively as compared to pure
polypropylene resin. The increased thermal and crystallinity were due to significant
enhancement of interfacial adhesion between the sisal fibre and the polypropylene
matrix. Dynamic mechanical properties of short sisal fibre reinforced polymer
composites were also studied extensively (Joseph et al., 2003; Nair et al., 2001).

22
2.3 Major concern over the usage of natural fibres
Similar to the advantages of natural fibres as reinforcement fillers in the generation of
polymer composites they also pose many drawbacks such as poor consistency in their
performance, hydrophilic nature, and inconsistency in the physical dimensions in a
specific period. Physical properties of natural fibres vary with different harvesting
methods and the season of harvesting. Moreover, the physical properties are
surprisingly depending on the soil conditions, rain pattern and the maturity of the
plant. So the selection of fibre materials plays an important role to achieve the specific
engineering properties of the composites.
In addition to the above mentioned drawbacks, natural fibres are incompatible with
many polymeric matrices which causes the poor fibre dispersion within the polymer
matrix of the polymer composites and leads to severe reduction in the mechanical and
physical properties of the final composite materials. More importantly plant fibres are
chemically hydrophilic in nature and most of the polymeric matrices are hydrophobic
materials (similar to water and oil which never mix together). In order to improve the
compatibility and enhance the interfacial adhesion between the natural fibres and the
polymer matrices, surface treatments have to be employed on the surface of natural
fibres.
2.4 Surface treatments on natural fibres
Natural fibres are highly hydrophilic in nature due to the presence of amorphous
materials such as hemicellulose, lignin and pectin on the surface. These amorphous
materials are responsible for incompatibility between fibres and the matrix materials
which result in lowering of mechanical performance of the fibre reinforced
composites. In addition to this, amorphous materials absorb moisture due to their

23
hydrophilic nature which leads to a significant reduction in the mechanical and
thermal properties (Faruk et al., 2012). Fibre surface treatments are essential in order
to improve the interfacial adhesion between the fibre and matrix. Fibre surface
treatment also helps to improve the fibre dispersion across the matrix material in the
composites. In addition, surface treatments decrease the water absorption by removing
amorphous materials from the surface of fibres which are responsible for the
absorption of moisture. Many different types of surface treatment methods are
employed in order to remove the amorphous materials from the surface of natural
fibres. Surface treatments can be classified as chemical, physical and biological
treatments (Kabir et al., 2012).
Chemical surface treatments are employed by using chemicals to treat the fibre
surface. Few examples of chemical treatments which utilise alkali (Fiore et al., 2015),
acetylation (Mokaloba and Batane, 2014; Pothan et al., 2003), silanisation (Pothan et
al., 2003), esterification, benzoyl peroxide (Kaushik et al., 2012), acrylic acid (Vilay
et al., 2008), potassium permanganate and bleaching (Rosa et al., 2009). Biological
treatments involve using naturally occurring microorganisms such as bacteria, fungi
(Li et al., 2009; Li and Pickering, 2009) and enzyme (Cao et al., 2012). These
treatments are performed in the aqueous medium and are relatively cheaper as
compared to other surface treatments. Physical surface treatments are employed by
using ionised gas or heat energy. Few examples of physical treatments are corona
(Ragoubi et al., 2012), heat (Wootthikanokkhan et al., 2013) and ultrasound (Batalha
et al., 2011). The following sections give a brief review on some of the important
fibre surface treatment methods.

24
2.4.1 Alkali treatment
Alkali treatment is one of the common and widely used chemical surface treatments
for the removal of amorphous materials from the surface of natural fibres. Alkali
treatment is also called mercerisation in which different concentration of sodium
hydroxide solution is used to treat the fibre surfaces. Alkali surface treatment reduced
the fibre diameter by removing or dissolving amorphous materials such as lignin,
hemicellulose, pectin and other waxy materials which bind on the surface of natural
fibres.
A reduction on the fibre surface due to alkali treatment leads to an increase in the
fibre aspect ratio (i.e. ratio of width to length) and surface roughness. In addition,
alkali treatment also helps to expose active hydrogen molecules of cellulose which
enhance the surface adhesion of fibres with hydrophobic matrix materials in the fibre
reinforced polymer composites. Hydrophilic hydroxyl groups on the surface of natural
fibres are reduced due to alkali treatment and this enhances the moisture resistance
property. Alkali treatment also enhances the uniformity of fibre surface by dissolving
the waxy and gummy materials on the surface of natural fibres (Kabir et al., 2012).
During alkali treatment, natural fibres go through swelling reaction which leads to
relaxation of the structure of natural cellulose.
The native cellulose is called as cellulose as it occurs in the nature which is the
monoclinic crystalline lattice of cellulose-I structure. This cellulose-I structure can be
changed to alkali-cellulose (Na-cellulose-I) after reaction with alkali solution as
shown in Scheme 1 (Oh et al., 2005). Na-cellulose-I is an intermediate phase of the
native cellulose. Na-cellulose-I is transformed to cellulose-II after washing alkali
cellulose with distilled water (Cai et al., 2015).

25
𝐅𝐢𝐛𝐫𝐞 − 𝐎𝐇 + 𝐍𝐚𝐎𝐇 → 𝐅𝐢𝐛𝐫𝐞 − 𝐎− 𝐍𝒂+ + 𝐇𝟐𝐎
Scheme 1 Chemical reaction of alkali solution with natural fibres
Since last few years, many research activities focussed on the effect of alkali
treatment on the mechanical and thermal properties of natural fibres and their polymer
composites (Ray et al., 2002; Le Troedec et al., 2008; Mokaloba and Batane, 2014;
Chikouche et al., 2015). Kabir et al. (2013) studied the effects of chemical treatments
on the tensile properties of hemp fibres. They noticed that a significant reduction in
the tensile strength by 35% due to the removal of hemicellulose, lignin and pectin
components from the surface of hemp fibres which were acting as binding materials
for the cellulose. Removal of these binding materials leads to least support to
withstand the tensile loading. Yan et al. (2016a) investigated the effect of alkali
treatment on the microstructure and mechanical properties of coir fibres and their
epoxy and cementitious composites. They noticed that the interfacial adhesion
between the fibre and the matrix enhanced significantly which was confirmed by
SEM analysis. A considerable increase in the tensile strength and modulus was also
observed i.e. 17.8% and 6.9% respectively after alkali treatment. Cai et al. (2015)
studied the influence of alkali treatment on the internal microstructure and tensile
properties of abaca fibres. They used three different concentration of NaOH solution
(5, 10 and 15 wt%) to conduct the alkali treatments. They found that the native
cellulose (cellulose-I) of abaca fibres was partially converted into cellulose-II which
was confirmed by XRD. FTIR analysis revealed that the removal of amorphous
materials from the surface of abaca fibres after the application of alkali treatment.
They also reported that the Young’s modulus increased by 41% after subjected to an
alkali treatment using 5 wt% of NaOH. However, the Young’s modulus significantly
decreased by 24 and 29% when the concentration of NaOH was 10 and 15 wt%

26
respectively. These results confirmed that higher concentration of alkali not only
removes the amorphous materials from the surface of natural fibres but also causes
severe damage of cellulose structure which leads to a significant reduction in the
mechanical properties of natural fibres.
2.4.2 High intensity ultrasound (HIU) treatment
In recent years, high intensity ultrasound (HIU) treatment is gaining more attention
owing to its effective removal of amorphous materials from the surface of natural
fibres. Moreover, HIU treatment is more effective in the separation of cellulose
nanofibers from its bundles which enhances the surface area of fibres and leads to
improve the interfacial adhesion between the fibres and the matrix in the fibre
reinforced polymer composites (Chen et al., 2011). Ultrasound refers to a sound
spectrum in the range of 20 kHz to 10 MHz generated by using transducer which
converts the electrical energy into high frequency sound waves. Ultrasound transducer
can produce high energy microscopic air bubbles in the solution and causes cavitation
(Siqun and Wang, 2009). Cavitation is the physical phenomenon which refers to the
formation, expansion and violent collapse of the microscopic air bubbles on the
surface of materials in the solution. The energy produced by the violent implosion of
cavitation is approximately equal to hydrogen bond energy (10-100 kJ/mol). Thus, the
HIU treatment can disintegrate the hydrogen bonds between the cellulose and the
amorphous materials which results in the removal of amorphous materials from the
surface of natural fibres (Chen et al., 2011). For the better understanding of the action
of HIU treatment, a schematic diagram of the mechanism of HIU treatment on the
surface of natural fibre is shown in Fig. 2.10.

27
Fig. 2.10 Schematic diagram showing the mechanism of HIU treatment on natural
fibres (Li et al., 2012)
Siqun and Wang. (2009) studied the effect of HIU treatment on the isolation of
cellulose nanofibrils from the natural fibres. They optimised the time, temperature,
distance of the probe from the fibres, fibre size and fibre concentration. They reported
that HIU treatment is effective for the isolation of cellulose nanofibers from the
natural fibres. Li et al. (2012) produced the nanocellulose from microcellulose by
using HIU treatment and studied the mechanical and thermal properties of
nanocellulose and their poly (vinyl alcohol) (PVA) composites. They reported that
HIU treatment is highly effective to remove amorphous materials from the surface of
fibres. A significant increment (145%) in the storage modulus was observed with HIU
treated nanocellulose as compared to pure PVA resin.

28
2.4.3 The combined treatment of alkali and HIU
HIU treatment is emerged as an effective treatment for the separation and isolation of
crystalline cellulose from the natural fibres. However, its effectiveness is limited to
microcrystalline cellulose (MCC) materials and HIU treatment alone is not an
effective treatment for the removal of amorphous materials from the surface of natural
fibres.
Fig. 2.11 Pictorial representation of chemical and ultrasound treatments on natural
fibres (Chen et al., 2011)
Chen et al. (2011) studied the isolation of cellulose nanofibers by using HIU treatment
from chemically pre-treated wood fibres, where the wood fibres were subjected to
chemical pre-treatment before the application of HIU treatment. They have optimised
the HIU treatment in terms of varying the time, temperature and output power. They
noticed that the separation of cellulose nanofibers increased with a gradual increase in
the power output. Crystallinity of the isolated cellulose nanofibers was increased by
69% as compared to pure wood fibres. Fig. 2.11 shows the graphical representation of
stages in the surface treatments for the wood fibres. Lee et al. (2008) studied the effect
of combined treatment of alkali and ultrasound treatment on the interfacial and

29
mechanical properties of henequen fibre reinforced polypropylene (PP) composites.
Henequen fibres were soaked with both water as well as alkali solution before the
application of ultrasound. They noticed that the alkali pre-treated fibre composites
showed a significant increment in the interfacial shear strength, flexural strength and
modulus by 48%, 38% and 49% respectively as compared to the untreated henequen
fibres/PP composites. Moshiul Alam et al. (2012) studied the combined effects of
alkali and ultrasound treatments on oil palm empty fruit bunch fibres and reinforced
them with poly (lactic acid), where they observed a significant improvement of tensile
strength, modulus and impact strength by 33%, 62% and 53.8% respectively for the
combination of alkali and ultrasound treated fibre composites as compared to
untreated fibre composites.
2.5 Clay based nanofillers
Last few decades, natural clay minerals such as halloysite (Hal) nanotubes, kaoline,
and montmorillonite (MMT) etc. are also used extensively owing to their easy
availability, biocompatibility and good thermal and physical properties. Clay as
nanofillers offers a variety of advantages in the polymer nanocomposites such as high
thermal stability, good barrier, thermomechanical, and fire-retardant properties. It is
worth noted that the high mechanical and thermal properties could be achieved by
introducing a very small content of clay nanofillers (Raquez et al., 2013).
It has already been proved that the incorporation of nanofillers onto PLA matrix
increases the crystallization ability, elongation and thermal properties. The
incorporation of exfoliated graphite onto PLA matrix increased the tensile strength
and thermal stability by 12% and 14 oC respectively as compared to pure PLA (Kim
and Jeong, 2010; Evagelia et al., 2011). It is reported that the introduction of a smaller

30
amount (0.2 wt%) of carbon nanotubes (CNTs) as nanofillers into PLA enhanced the
tensile strength and modulus by 25% and 12% respectively (Park et al., 2013).
However, nanofillers such as graphene, CNTs, fullerenes and oxide nanoparticles are
toxic to the environment and therefore using them as fillers in the polymer matrix
again causes pollution (Nel, 2007).
It is reported that clay based nanofillers as plasticizer are good substitutes which also
improved the thermal properties of PLA by more than 20% as compared to pure PLA
(Liu et al., 2013). Aluminosilicate-based nanofillers are also widely used in the
polymer nanocomposites to enhance the mechanical and thermal properties.
Aluminosilicates are also called as layered silicate nanocomposites which are a new
class of hybrid materials, making them more interesting in academic and industrial
realms due to their excellent thermal barrier, thermo-mechanical and fire-resistance
properties which have been achieved at a lower loading of fillers (˂5 wt%). However,
improvements in the desired properties rely on how well the dispersion of nanofillers
within the polymer matrix (Sinha Ray and Okamoto, 2003).
2.5.1 Halloysite (Hal) nanotubes
Hal nanotubes are naturally occurring aluminosilicates having the formula, Al2Si2O5
(OH)4.nH2O. Their tubular structure in nano dimension with high aspect ratio makes
them as unique materials to be used as fillers in the generation of CPN (clay polymer
nanocomposites). Hal nanotubes are chemically similar to kaolinite group which
consist of multiple layers of hollow cylinders with nanometre dimensions (Joussein et
al., 2005). Hal nanotubes consist of gibbsite like array of aluminol groups (Al-OH)
which are located inside the lumen while the outer surface covered with siloxane (Si-
O-Si) groups. These two unit layers are separated by a barrier of water molecules

31
which lead to hydrated Hal nanotubes with a basal spacing of 10 Ǻ which is larger
than that of kaolinite (~3 Ǻ) (Yuan et al., 2008, 2015). Hal nanotubes are naturally
formed in the earth crust over millions of years and having unique and versatile
mechanical and thermal properties (Du et al., 2010; Rooj et al., 2010). However, the
presence of a large number of hydroxyl groups on the surface of Hal nanotubes leads
to its hydrophilic nature which limits its applications to use them as fillers in the
generation of CPN (Yuan et al., 2008; Pasbakhsh et al., 2010; Jin et al., 2015).
In recent times, a sizeable number of reports being published on Hal nanotubes
reinforced CPN (Liu et al., 2014). The loading of Hal nanotubes into PLA matrix
significantly improved the mechanical properties. Tensile and flexural strength
increased by 34% and 25% respectively with the addition of 30phr of unmodified Hal
nanotubes into PLA as compared to pure PLA. Thermal stability of 30phr loaded
unmodified Hal-PLA nanocomposite slightly increased by 4.4 oC as compared to pure
PLA (Liu et al., 2013). However, similar to other nanoparticles, dispersion of Hal
nanotubes into polymer matrix is challenging (Kim and Jeong, 2010; Raquez et al.,
2013). Modification or functionalization of nanofillers is a way to enhance their
dispersion into the polymer matrix. Functionalization of Hal nanotubes can enhance
the surface properties and leads to good dispersion into PLA matrix of CPN. Surface
modification of Hal nanotubes with different types of silane coupling agents is the
most common method to improve the surface properties of Hal nanotubes. This
method is referred as the grafting of silanes and is carried out via condensation
between hydrolysed silanes and surface hydroxyl groups of Hal nanotubes. The
modification of Hal nanotubes with silane coupling agent enhanced the dispersion of
Hal nanotubes into natural rubber (NR) matrix and improved the thermal stability by
64 oC as compared to unmodified Hal nanotubes (Rooj et al., 2010). The modified Hal

32
nanotubes with silane coupling agent enhanced its dispersion in Ethylene propylene
diene monomer (EPDM) matrix and increased the mechanical properties. 30phr of
silane modified Hal nanotubes into EPDM matrix increased the tensile strength,
modulus and elongation at break by 360%, 65% and 135% respectively as compared
to unmodified Hal-EPDM composites (Pasbakhsh et al., 2010).
2.6 Polymer matrix materials
Polymers are mainly classified into three classes of thermoplastics, thermosets and
elastomers. Elastomers are the rubbery materials which have both viscous and elastic
nature. Few important elastomers are natural polyisoprene, polybutadiene,
chloroprene, etc., Thermoset polymers are polymers which are interlinked by covalent
bonds and possess a three dimensional network structure. Thermoset polymer
composites cannot be remoulded and recycled. On the other hand, thermoplastic
polymers possess linear and branched molecular chains with weak intermolecular
bonding such as van der Waals force or hydrogen bonding. Thermoplastic polymer
composites can be recycled. In this work, polylactide or poly lactic acid (PLA), a bio-
derived thermoplastic polymer is compared with polypropylene (PP) which is a
petroleum based synthetic thermoplastic polymer matrix.
2.6.1 Polylactide or Poly lactic acid (PLA)
The term poly lactic acid is a misinterpretation. PLA is synthesized from ring opening
polymerisation of lactide, a dimer of lactic acid. Thus, it should be referred as
polylactide instead of poly lactic acid. PLA is an important semicrystalline
thermoplastic polyester biopolymer derived from annual renewable resources such as
corn, sugarcane etc. (Lim et al., 2008; Pandey et al., 2005). The developmental history
of PLA biopolymer dates back to 1893 when Bischoff and Walden published lactide

33
formulas. Carothers and his co-workers started producing low molecular weight PLA
in 1932. In 1954, medical grade PLA was produced and marketed by DuPont de
Nemours and Ethicon, Inc. In 1994, Japan started the production of commercial PLA
fibres. PLA derived from the starch was produced by Cargill Dow LLC, USA under
the trade name of NatureWorks at a capacity of 140,000 tons/year in 2002 (Rasal et
al., 2010). More recently NatureWorks has changed the trade name of commercial
PLA as IngeoTM
.
PLA draws more interest owing to its renewability, biodegradability, biocompatibility
and good mechanical properties (Raquez et al., 2013). Moreover, PLA degradation
releases non-toxic gases at a lower level (Nel, 2007). Besides, for packaging,
automotive, and electronic applications it has comparable tensile strength and
Young’s modulus with several commercial polymers such as polypropylene,
polyethylene, polystyrene etc. (Notta-cuvier et al., 2014). However, PLA has
limitations of low thermal stability, low toughness and extreme brittleness (Lim et al.,
2008; Pandey et al., 2005). It is therefore necessary to reduce the brittleness and to
improve the mechanical and thermal properties of PLA when we aim for long-term
applications more importantly on a large scale (Raquez et al., 2013).
The PLA polymer belongs to a family of aliphatic polyester which is derived from 2-
hydroxy propionic acid (i.e. lactic acid). The basic monomer for the production of
PLA is lactic acid which can be produced by either fermentation of carbohydrates or
chemical synthesis route. Lactic acid has two stereo-isomeric forms which are L
(Laevorotatory) – lactic acid and D (Dextrorotatory) – lactic acid (Fig. 2.12). Both the
forms of lactic acid can be produced from either petrochemical or agricultural by-
products (Lim et al., 2008). Lactic acid produced from petrochemical synthesis route
gives 50:50 ratios of both L-lactide and D-lactide forms.

34
Fig. 2.12 The two stereo-isomeric forms of lactic acid
In contrast to the petrochemical route, lactic acid produced from agricultural by-
products exists mainly in L-lactic acid stereo-isomeric form. Currently lactic acid
which is used to produce PLA comes from agricultural by-products by using a
fermentation process (Rasal et al., 2010). Polymerisation of lactic acid can be
achieved by two main methods. Fig. 2.13 shows the different types of PLA synthesis.
Fig. 2.13 Synthesis of PLA from L- and D-lactic acids (Lim et al., 2008)
The first method involves the direct condensation of lactic acid under high
temperature and vacuum. However, only low molecular weight PLA can be produced

35
with this method mainly due to the presence of water as a by-product in this reaction
which is difficult to separate from the polymer. The second method of producing PLA
from lactic acid involves two steps. First the low molecular weight pre-polymer was
produced with the condensation polymerisation reaction of lactic acid.
The low molecular weight pre-polymer is then catalytically depolymerised to form
intermediate of lactic acid called dilactide which is the primary feedstock to produce
high molecular weight PLA. Finally the dilactide is polymerised in the solvent free
ring opening polymerisation (ROP) to produce high molecular weight PLA polymer
(Rathin Datta and Michael Henry, 2006). PLA is a semicrystalline polymer having the
glass transition temperature (Tg) ranging from ~55 to 65 oC available from amorphous
glassy grades to highly crystalline grades with melting temperature from ~160 to 180
oC (Nampoothiri et al., 2010; Saeidlou et al., 2012; Raquez et al., 2013). Physical and
mechanical properties of PLA are mostly superior and are comparable to many
commodity polymer matrices such as polypropylene (PP), polystyrene (PS),
polyethylene terephthalate (PET) etc. Comparison of mechanical and physical
properties of PLA and other conventional polymer matrices are represented in Table
2.3.
Until last few years, the application of PLA was mainly focused on packaging,
diapers, planting and in other sanitary products. However, several reports suggested
that PLA is a potential bio-derived polymer matrix for a wide range of applications
such as structural, automotive etc. with the incorporation of fibrous filler. Natural
fibres as fillers for the generation of PLA polymer composites offer many advantages
such as light-weight, lower manufacturing cost, easy to handle, good thermal and
acoustic insulation properties (Dittenber and Gangarao, 2012). Porras and Maranon.
(2012) studied the mechanical properties of laminate composite material of PLA and

36
woven bamboo fabric. They noticed that the tensile strength and modulus
significantly increased by 43 and 47% respectively as compared to pure PLA. Yu et
al. (2014) reported that the incorporation of short ramie fibres into PLA matrix
increased the tensile strength and modulus by 42% and 73% respectively as compared
to pure PLA.
Table 2.3 Comparison of physical and mechanical properties PLA and other
commodity polymers (Carrasco et al., 2010; NatureWorks LLC, 2013)
Properties PLA Polystyrene
(PS)
Polypropylene
(PP)
Polyethylene
terephthalate
(PET)
Density (g/cm3) 1.24 1.04 - 1.06 0.91 1.37
Clarity Transparent Transparent Translucent Transparent
Tensile yield strength
(MPa)
48 – 110 34 – 46 21 – 37 47
Tensile modulus (GPa) 3.5 – 3.8 2.9 – 3.5 1.1 – 1.5 3.1
Tensile elongation (%) 2.5 – 100 3 – 4 72 79
Impact strength (J/m) 13 72 79
Glass transition
temperature (oC)
60 95 0 75
Melting temperature (oC) 153 163 250
Heat distortion
temperature (oC)
55 – 60 84 – 106 80 – 140 74 – 200
Processing temperature
(oC)
210 230 225 255

37
Environmental conditions such as humidity, temperature, pH, salinity, supply of
different nutrients and presence and absence of oxygen etc., have important role on
the polymer degradation directly as well as influence the microbial population to
degrade it. Degradation of PLA initiates with scission of main or side chains of the
macromolecules. Biodegradation by soil burial of PLA and natural fibre reinforced
PLA composites have been reported by several authors (Ohkita and Lee, 2006; Dong
et al., 2014; Rajesh et al., 2015). Dong et al. (2014) studied the soil biodegradation of
coir fibre reinforced PLA composites. They found that the degradation of pure PLA is
much slower than coir fibre reinforced PLA composites. Higher the fibre loading
faster the degradation of fibre reinforced polymer composites. It was found that PLA
composites reinforced with 10 wt% of coir fibres showed a significant reduction in
the weight by 34.9% as compared to pure PLA which showed a weight loss of 18%
after 18 days of open soil burial.
2.6.2 Polypropylene (PP)
PP is one of the most widely used thermoplastic polymers in the applications such as
automotive, home appliances, packaging, construction, etc. owing to its ease of
processing, low cost and high recyclability (Pérez et al., 2013). However, in recent
years, plastic waste management is a major issue due to an extensive usage of
petroleum based synthetic polymers (Azwa et al., 2013). Natural fibres are the best
alternatives as reinforcing materials into thermoplastic polymers such as PP to address
the issue of waste management owing to their environmentally friendly properties
(Abdul Khalil et al., 2014; Azwa et al., 2013; El-Sabbagh, 2014). Kaewkuk et al.
(2013) studied the effect of interfacial modification and fibre content on the physical
properties of sisal fibre reinforced PP composites. They found that the tensile
modulus increased significantly by more than 90% with the addition of 30 wt% of

38
alkali treated sisal fibres in the fibre reinforced PP composites as compared to pure
PP. Elkhaoulani et al. (2013) studied the mechanical and thermal properties of
Moroccan hemp fibres reinforced PP composites. They reported that the tensile
modulus of the hemp fibre reinforced PP composites increased by 50% as compared
to pure PP resin. Yao et al. (2013) studied the mechanical and thermal properties of
furfural modified clam shell waste reinforced PP composites. They found that the
addition of modified clam shell waste into PP composites resulted in a significant
enhancement of flexural modulus and impact strength both by 50% as compared to
pure PP resin.
2.7 Methods used for the processing of polymer composites
Selection of a suitable processing method for the generation of fibre reinforced
polymer composites is an important task in order to enhance the mechanical, physical
and thermal properties of the final product. Same processing methods were used to
produce both synthetic and natural fibre reinforced polymer composites. Currently
there are no separate processing methods developed for the natural fibre composites.
Common processing methods to generate fibre reinforced thermoplastic polymer
composites are melt mixing, injection moulding, extrusion, and compression
moulding.
2.7.1 Melt mixer
An enhancement in the mechanical properties of short fibre reinforced polymer
composites directly depends on how well the fibre materials disperse into polymer
matrix. Conventional processing methods such as single screw extruder is not useful
in order to improve the dispersion of the fibre materials in the fibre reinforced
polymer composites. Twin screw mixer such as melt mixer is an ideal equipment for

39
the better achievement of fibre dispersion across the polymer matrix (Lim et al.,
2008). Melt mixer is a very common polymer mixing equipment for the mixing
especially for the generation of short fibres reinforced thermoplastic polymer
composites. Initially thermoplastic polymer was heated to its melting temperature and
then the short fibrous materials were added to the mixing chamber to disperse the
fibres into polymer matrix. Mixing time and rotor speed depend on the dispersion of
short fibres across the polymer matrix which directly affects the mechanical properties
of polymer composites (Gareth Beckermann, 2007). It is well reported in the literature
that the lower mixing time (<10 min) and lower rotor speed (< 50 rpm) cause poor
dispersion of the fibre materials across the polymer matrix which leads to a high level
of fibre agglomeration in the polymer composites. Lower mixing temperature also
causes severe damage of the fibres during melt mixing (Joseph et al., 1999). Melt
mixing method is widely used in the small scale scientific investigations due to its
good mixing and results in the lab scale production of short fibre reinforced polymer
composites. However, the major drawbacks of using the melt mixer are the limited
usage of materials per batch and the melt mixer can be used only for mixing and
further processing equipment is required in order to generate the composites.
2.7.2 Compression moulding
Compression moulding also called as hot pressing is a commonly used method for the
processing of polymer composites. Composite materials produced by using
compression moulding possess relatively good mechanical properties as compared to
other processing techniques. Larger and simpler composite materials can be produced
by using compression moulding. Composite materials are generated by using
compression moulding by placing a weighed amount of mixed fibre-matrix stack in
between two pre-heated mould cavity. The temperature and applied pressure of the

40
mould cavities are fixed according to the types of matrix and filler materials used and
thickness of composite samples. The top of the mould cavity moves at a constant
speed and touches the lower mould cavity. After reaching the set compression time,
composite samples are cooled by placing them under the cooling plates with same
pressure and then the composite samples are removed from the mould (Gareth
Beckermann, 2007; Ho et al., 2012).
2.8 Factors affecting the properties of fibre reinforced composites
It is important to choose specific fibres and processing methods in order to achieve
the desired engineering properties of the fibre reinforced polymer composites. Several
factors such as fibres dispersion, orientation of the fibres inside the composites, length
and width (aspect ratio) of the fibres, volume of the fibres and key properties of the
fibres are the major areas to consider in the natural fibres which are used as
reinforcement fillers in the polymer composites for achieving specific engineering
properties.
2.8.1 Dispersion of fibres in the composites
Filler dispersion is one of the key factors which affect the mechanical properties of
the fibre reinforced polymer composites specifically in the short fibre reinforced
composites. It is well reported in the literature that a significant reduction in the
tensile and impact properties occurs due to poor dispersion of fibres across the
composites. Poor fibre dispersion causes the fibre agglomeration in the composites
which creates stress concentration points and leads to sudden mechanical failure.
Compatibility between the natural fibres (hydrophilic nature) and polymer matrices
(hydrophobic) is the major reason for the poor dispersion of the fibres. Compatibility
between natural fibres and the polymer matrices can be improved by subjecting to a

41
suitable surface treatment of either natural fibres or polymer matrices. Another
important reason which causes the poor dispersion is mixing time during the
processing of composites. Higher mixing time gives better dispersion of the fibres
across the polymer matrix (Thomason, 1997).
2.8.2 Fibre orientation
Fibre orientation also called as fibre direction is an important factor to consider for
achieving specific engineering applications of the fibre reinforced composites. It is a
well-known fact that the mechanical properties are superior for the unidirectional long
fibre reinforced polymer composites as compared to short randomly orientated fibre
composites. It is very rare to achieve the fibre orientation in the short fibre reinforced
composites. Fu and Lauke (1996) studied the effect of fibre length and fibre
orientation distribution on the tensile strength of short fibre reinforced polymer
composites. They noticed that the strength of the composites increased with an
increase in the fibre orientation coefficient.
2.8.3 Aspect ratio of fibres
Aspect ratio of the fibres is defined as the ratio between length and width of the fibres.
It is an important factor which directly affects the mechanical properties of the fibre
reinforced polymer composites. Ashori and Nourbakhsh (2010) studied the chemical
composition and particle size of the oak and pine wood particle reinforced PP
composites. It was found that the pine fibre had significant impact on the
improvement of mechanical properties of pine wood fibre reinforced PP composites
as compared to oak fibre wood reinforced PP composites. It was found that the aspect
ratio of pine fibre wood was higher than the oak fibre wood which enhances the
interfacial adhesion between the fibre and matrix in the fibre reinforced composites.

42
2.8.4 Fibre volume fraction
Fibre volume fraction plays an important role in improving the mechanical and
thermal properties of the fibre reinforced composites. It is well reported that the
mechanical properties of natural fibre reinforced polymer composites decreased
significantly with low volume fraction of fibres. This is because at low fibre content it
created flaws between the fibre and the matrix materials and led to mechanical failure.
At higher fibre volume fractions, short fibres cause agglomeration of the fibres across
the matrix in the composites which cause stress concentration points and leads to a
reduction in the mechanical properties. However, optimisation of fibre loading is
important in order to achieve the maximum mechanical properties of the natural fibre
reinforced polymer composites. López et al. (2013) studied the effect of fibre loading
on the mechanical properties of thermoplastic starch (TPS) bio-composites reinforced
with newspaper fibre. They noticed that the tensile strength significantly increased by
150% with the addition of 15 wt% of newspaper fibres as compared to pure TPS
resin. However, with the further addition of fibre materials the tensile strength started
decreasing. In addition, cellulosic fibres have thermal stability due to the presence of
amorphous materials on the surface of fibres. Thus, increasing the fibre loading in the
fibre reinforced composites leads to lower the thermal stability.
2.9 Theoretical predictions of Young’s modulus
The mechanical and elastic properties of fibres reinforced polymer composites depend
on many different parameters such as fibre length, fibre orientation, fibre geometry,
fibre dispersion and interfacial adhesion between fibre and matrix. Young’s modulus
is an important intrinsic property of the composite materials which solely depends on
the volumetric fibre fractions of the composites, Young’s modulus of the matrix

43
materials and intrinsic Young’s modulus of the fibres are used for the generation of
the composites.
In order to predict the theoretical values of the Young’s modulus of natural fibres
reinforced polymer composites the Young’s modulus for the natural fibres has to be
measured experimentally. However, it is quite difficult to measure the elastic
properties of natural fibres due to their characteristic properties such as fibre length,
orientation and fibre geometry (Kalaprasad et al., 1997; Joseph et al., 2003; Cabral,
2005; Granda et al., 2016). The mechanical properties of fibres could be predicted by
theoretical models which are based on different assumptions and experimental data.
Several researchers were also used these theoretical models to predict the Young’s
modulus of the fibres reinforced composites (Kalaprasad et al., 1997; Nayak et al.,
2013; Serrano et al., 2014).
2.9.1 Parallel and series model
Parallel or Voigt model and Series or Reuss model are the simplest and widely used
models to predict the experimental data of Young’s modulus of short fibres reinforced
composite materials (Kalaprasad et al., 1997; Cabral, 2005; Nayak et al., 2013). The
Young’s modulus of the short sisal fibre reinforced PLA composites could be
calculated by using the following eqns. 2.1 and 2.2:
Parallel model

44
Series model
Where Mc, Mm and Mf are the Young’s modulus of the composites, matrix and the
fibres respectively and Vf is the volume fraction of the fibres. ηe is the fibre efficiency
or compatibility factor for the strength of the composite which is used to correct the
contribution of semi-aligned short fibres in the composites. Fibre efficiency factor
(ηe) is the product of fibre orientation efficiency factor (η0) and fibre length efficiency
factor (η1) (Fu and Lauke, 1996). According to Cox-Krenschel’s model, the fibre
length efficiency factor is defined by the following eqn. 2.3 (Vilaseca et al., 2010):
Where LF is the weighted fibre length and β is the coefficient of stress concentration
rate at the ends of the fibres according to the following eqn. 2.4:
Where r is the radius of the fibre, νm is the Poisson’s ratio of the matrix which is
assumed to be 0.36 (Espinach et al., 2013). Fibre efficiency factor (η0) can be
calculated by considering the fibre orientation across the matrix in the composites. It
is assumed to be a rectangular or square distribution of discontinuous phase of short

45
fibres inside the matrix phase. (Granda et al., 2016; Sanomura and Kawamura, 2003)
studied the fibre orientation of short fibre reinforced thermoplastics. According to
them, the function of orientation distribution is represented by the following eqn. 2.5:
Where α is the average orientation angle of the fibres inside the matrix and α0 is the
fibre orientation limit angle.
The Young’s modulus of the fibre reinforced polymer composites largely depends on
the angle of fibre orientation inside the composite system. The angle of fibre
orientations can be calculated by the following eqn. 2.6:
By using the eqns 2.2, 2.3, 2.4, and 2.5, the fibre efficiency factor (ηe) can be
calculated.
2.9.2 Hirsch model
The intrinsic Young’s modulus of the short sisal fibre reinforced PLA composites was
predicted by using the Hirsch’s model which is a combination of Parallel and Series
models (Espinach et al., 2013; López et al., 2012).
According to this model, Young’s modulus can be calculated by using the following
eqn. 2.7:

46
Where Mc, Mm and Mf are the Young’s modulus of the composites, matrix and the
fibres respectively and Vf is the volume fraction of the fibres. Where x is an empirical
parameter which is related to fibre-matrix interface.
2.9.3 Bowyer and Baber model
According to Bowyer and Baber model, the tensile properties of short fibre reinforced
composites are the sum of contributions from subcritical and supercritical fibres and
the matrix. According to this model, the Young’s modulus can be calculated by using
the following eqn. 2.8:
Where K1 is the fibre orientation factor which depends on the fibre orientation during
the preparation of composite. K2 is the fibre length factor. According to Fu and Lauke
(1996), for short fibre composites, fibre length and fibre interface factor (K2) can be
calculated by using the following eqns. 2.9 and 2.10:
For fibre length L > Lc
For fibre length L < Lc
Where, L and Lc represent the length and the critical length of the fibres respectively.
Critical length of the fibre is defined as the minimum length of the fibre required for
the stress to reach the fracture stress of the fibre. Fibres which are shorter than critical

47
fibre length will not carry the maximum possible load and become inefficient
(Lacroix et al., 1992).
2.10 Summary of literature review
From the literature survey, it could be noted that there are significant findings in PLA
polymer nanocomposites especially for the medical applications. However, there is a
lack of literature for tuning the mechanical and thermal properties of PLA composites
for other applications especially for the automotive and structural applications. In
addition, a detailed study of the effects of high intensity ultrasound (HIU) and the
combination of alkali and HIU treatments on sisal fibres reinforced PLA composites
are yet to be reported. Hence, in this study; PLA and PP composites reinforced with
different fillers (sisal fibres and halloysite nanotubes) will be prepared and a detailed
study of the effects of surface modification in tuning the mechanical and thermal
properties will be attempted.

48
CHAPTER III
Experimental
3.1 Introduction
Sisal fibres and halloysite (Hal) nanotubes were used to produce polylactide and
polypropylene composites. Surface modification methods were employed for both
sisal fibres and Hal nanotubes in order to improve the surface interactions of fillers
(sisal fibres and Hal nanotubes) with matrix materials to enhance the mechanical and
thermal properties of the resultant composites. Physical, morphological, mechanical
and thermal properties were investigated for untreated and surface treated sisal fibres.
Untreated and 3-Aminopropyltriethoxysilane (APTES) modified Hal nanotubes were
subjected to SEM, FT-IR, nitrogen absorption-desorption analysis and TGA to
confirm the structural modifications of Hal nanotubes by the surface modification of
APTES. A set of physical, morphological, mechanical, thermal and biodegradable
properties were investigated for sisal fibres and Hal nanotubes reinforced polylactide
and polypropylene composites. This chapter describes in brief the materials, surface
treatment methods, composite processing and characterisation techniques.
3.2 Materials
Sisal fibres were obtained from vibrant nature, Chennai, India. PLA (trade name of
IngeoTM
2003D) was supplied by NatureWorks LLC Inc, USA. The melt flow index
of PLA was 6 g/10 min (210 oC, 2.16 kg) with the density of 1.24 g/cm
3. General
purpose injection moulding grade polypropylene (Titanpro 6331) was used with the
melt flow index of 14 g/ 10 min and the density of 0.9 g/cm3. Hal nanotubes were

49
purchased from Sigma-Aldrich, Malaysia. 3-Aminopropyltriethoxysilane (APTES)
was supplied by Fisher Scientific, Malaysia. Dichloromethane was supplied by
Merck. Commercial grade NaOH, ethanol, and acetic acid were supplied from RM
Chemicals and were used for the alkali and silane treatments.
3.3 Surface treatment methods
3.3.1 Fibre surface treatment
Sisal fibres were subjected to different surface treatments such as alkali, HIU
treatment and the combination of alkali and HIU treatments. Prior to the surface
treatments, sisal fibres were washed with distilled water in order to remove dirt and
impurities on the surface of sisal fibres and then fibres were dried at 80 oC using a hot
air oven for 24 h.
3.3.1.1 Alkali treatment
The alkali solution was prepared with different concentrations of NaOH (w/v) (0%,
3%, 5%, 7%, 9% and 15%) with distilled water. At first, the clean and dried sisal
fibres were soaked in an alkali solution at room temperature for 24 h with constant
stirring. The fibres were then washed several times with distilled water containing
acetic acid to neutralise the remaining NaOH in the fibres and then dried at 100 oC for
24 h using a hot air oven.
3.3.1.2 Treatment with high intensity ultrasound (HIU)
Untreated and sisal fibres that were treated with different concentrations of alkali
were subjected to HIU for 90 min. An ultrasonic processor (Hielscher UIP1000hd,
transducer tip diameter of 24 mm) with the frequency of 20 kHz, output power of
1000 W has been employed. Optimisation studies were also carried out of ultrasound

50
irradiation parameters such as for output power, frequency and time. Distilled water
was used as the medium and the weight of fibres to water solution ratio was
maintained as 1:20 (w/v). The total volume of the solution was 1000 ml and the
transducer tip was dipped approximately 50% inside the solution medium. The
temperature was maintained between 25 to 30 oC by using an ice/water bath. The
optimization of ultrasound irradiation time and the temperature were also carried out
as described in the literature (Lee et al., 2008; Moshiul Alam et al., 2012). The fibres
were then washed with distilled water and dried at 100 oC in a hot air oven for 24 h
and the resultant sisal fibres were then studied for their morphological and thermal
properties.
3.3.2 Surface modification of Halloysite (Hal) nanotubes
The functionalisation of Hal nanotubes was carried out with the silane coupling agent,
APTES. The amount of APTES was determined by using the eqn. 3.1 (MacMillan,
2009) to ensure the uniform distribution of silane onto the surface of Hal nanotubes.
Typical surface area of Hal nanotubes is 65 m2/g and the specific surface area of
APTES is 355 m2/g (Arkles, 1977).
12 g of silane coupling agent i.e. APTES was dissolved in 500 mL of ethanol (95%)
solution and 1 mL of acetic acid was added to keep the pH between 4.5 and 5.5. This
solution was then stirred vigorously at 60 oC for 15 min. 50 g of Hal nanotubes were
added to the solution and stirred at 60 oC for 2 h. The silane modified Hal nanotubes
were then filtered and washed with ethanol and dried at room temperature for 24 h
and then dried under vacuum at 100 oC for 8 h to remove the moisture and ethanol.

51
Scheme 2: Reaction of APTES with Hal nanotubes (Arkles et al., 1992; Du et al.,
2006)
In case of Hal nanotubes, the aluminol groups (Al-OH) on the surface of the inner
layer of Hal nanotubes have high degree of chemical reactivity with organic
compounds such as APTES (Scheme 2). Yuan et al. (2008) investigated the
modifications of Hal nanotubes with APTES by grafting on the inner surface of Hal
nanotubes. The external surface of Hal nanotubes consists of siloxane (Si-O-Si)
groups and few aluminols (Al-OH) and silanols (Si-OH) at the edges and surface
defects of Hal nanotubes. They reported that the amino-propyl groups as well as the
hydroxyl groups of the hydrolysed APTES formed the covalent bonds between Al-
OH groups of the inner surface of Hal nanotubes and the siloxane (Si-O-Si) groups at
the edges or the surface defects of Hal nanotubes (Yuan et al., 2015). On the other
hand, since the modification of Hal nanotubes was carried out using the mixture of
water and ethanol solution, some of the hydrolysed APTES reacts with each other to
form oligomers which grafted by hydrogen bonding. These oligomers were further
reacted with aluminols and siloxanes to form the cross-linked network in the lumen of
Hal nanotubes (Arkles et al., 1992; Yuan et al., 2008). It is also believed that more
hydroxyl groups exist on the surface of Hal nanotubes due to surface defects. These
hydroxyl groups are the potential reactive sites for the surface modification on the
external surface of Hal nanotubes which increased the interaction of APTES with Hal
nanotubes (Yuan et al., 2008).

52
3.4 Fabrication of composites
3.4.1 Sisal-PLA composites
Different ratio of untreated and different surface treated (HIU, alkali (7 wt%)) and the
combination of alkali (7 wt%) and HIU treated) sisal fibres and PLA (Table 3.1) were
mixed with an internal mixer (Brabender Plasticoder PL2000-6 equipped with co-
rotating blades and a mixing head with a volumetric capacity of 69 cm3). The rotor
speed and the blending temperature and time were set at 50 rpm, 180 oC and 15 min
respectively.
Table 3.1 Composition of untreated and treated SF/PLA composites
S. No. PLA
(wt
%)
Untreated
sisal fibres
(wt %)
Ultrasound
treated sisal
fibres (wt %)
Alkali treated
sisal fibres (wt
%)
Alkali +
ultrasound
treated sisal
fibres (wt %)
1 100 0 0 0 0
2 90 10 0 0 0
3 85 15 0 0 0
4 80 20 0 0 0
5 75 25 0 0 0
6 70 30 0 0 0
7 90 0 10 0 0
8 85 0 15 0 0
9 80 0 20 0 0
10 75 0 25 0 0
11 70 0 30 0 0
12 90 0 0 10 0
13 85 0 0 15 0
14 80 0 0 20 0
15 75 0 0 25 0
16 70 0 0 30 0
17 90 0 0 0 10
18 85 0 0 0 15
19 80 0 0 0 20
20 75 0 0 0 25
21 70 0 0 0 30

53
Before mixing all the samples were dried under vacuum at 60 oC for 4 h to remove
any moisture. Materials obtained from the internal mixer were compression moulded
to obtain the test specimens. The compounded materials were placed onto a steel
frame mould covered by aluminium plates on both sides. The materials were pressed
into sheets of 1 and 3 mm thickness at 180 oC. The moulding cycles involved 3 min of
preheating without any pressure, 20 sec of venting and 3 min of compression under
100 bar using hot and cold pressing machine (LP-S-50 Scientific Hot and Cold Press).
Then the hot moulded samples were cooled immediately between two platens of cold
press at 20 oC for 2 min.
3.4.2 Sisal-PP composites
Table 3.2 Composition of Sisal/PP composites
S. No. PP
(wt
%)
Untreated
sisal fibres
(wt %)
Ultrasound
treated sisal
fibres (wt %)
Alkali treated
sisal fibres (wt
%)
Alkali +
ultrasound
treated sisal
fibres (wt %)
1 100 0 0 0 0
2 90 10 0 0 0
3 85 15 0 0 0
4 80 20 0 0 0
5 70 30 0 0 0
6 90 0 10 0 0
7 85 0 15 0 0
8 80 0 20 0 0
9 70 0 30 0 0
10 90 0 0 10 0
11 85 0 0 15 0
12 80 0 0 20 0
13 70 0 0 30 0
14 90 0 0 0 10
15 85 0 0 0 15
16 80 0 0 0 20
17 70 0 0 0 30

54
Composites of PP reinforced with untreated and different surface treated (HIU treated,
alkali (7 wt%) and the combination of alkali (7 wt%) and HIU treated) sisal fibres by
using internal mixer and compression moulding at 175 °C as described in the section
3.4.1. Table 3.2 shows the composition of SF/PP composites.
3.4.3 Hal-PLA nanocomposites
PLA nanocomposites were prepared with reinforcement of different weight
percentage of unmodified and APTES modified Hal nanotubes by using internal
mixer and compression moulding machine as described in the section 3.4.1. Before
mixing, all the samples were dried under vacuum at 60 oC for 4 h to remove any
moisture. Table 3.3 shows the composition of PLA nanocomposites reinforced with
unmodified and APTES modified Hal nanotubes.
Table 3.3 Composition of Hal nanotubes (APTES modified/unmodified) PLA
nanocomposites
S. No. Sample PLA
(wt%)
uHal
(wt%)
mHal
(wt%)
1 Pure PLA 100 0 0
2 2uHal 98 2 0
3 4uHal 96 4 0
4 6uHal 94 6 0
5 8uHal 92 8 0
6 2mHal 98 0 2
7 4mHal 96 0 4
8 6mHal 94 0 6
9 8mHal 92 0 8
uHal: unmodified Hal nanotubes and mHal: APTES modified Hal nanotubes

55
3.4.3 Hal-PP nanocomposites
PP nanocomposites were prepared with the incorporation of different ratio of
unmodified and APTES modified Hal nanotubes by using internal mixer and
compression moulding as described in the section 3.4.1. Table 3.4 shows the
composition of PP nanocomposites reinforced with unmodified and APTES modified
Hal nanotubes.
Table 3.4 Composition of Hal nanotubes (APTES modified/unmodified) PP
nanocomposites
S. No. Sample PP
(wt%)
uHal
(wt%)
mHal
(wt%)
1 Pure PP 100 0 0
2 2uHal 98 2 0
3 4uHal 96 4 0
4 6uHal 94 6 0
5 8uHal 92 8 0
6 2mHal 98 0 2
7 4mHal 96 0 4
8 6mHal 94 0 6
9 8mHal 92 0 8
uHal: unmodified Hal nanotubes and mHal: APTES modified Hal
nanotubes
3.5 Characterisation techniques
3.5.1 FTIR analysis
FTIR analysis was conducted in between 400 and 4000 cm-1
with 0.4 cm-1
resolution
by using FTIR spectrophotometer (PerkinElmer Spectrum RX1) to confirm the
surface modification of alkali, ultrasound and the combination of alkali and

56
ultrasound treated sisal fibres. FTIR was used to confirm the structural modifications
of untreated and different surface treated sisal fibre reinforced PLA composites. FTIR
was conducted in between 400 and 4000 cm-1
with 0.85 cm-1
resolution using FTIR
(8300 Shimadzu, Japan) to confirm the structural modification of Hal nanotubes and
Hal-PLA nanocomposites. For this, fibre samples were grounded well with KBr (~2%
by weight) and pressed into a pellet with the thickness of about 1 mm. All FTIR
spectra were recorded in Transmittance units.
3.5.2 FE-SEM analysis
The surface morphology of untreated, ultrasound treated and the combination of alkali
and ultrasound treated sisal fibres and their PLA and PP composites of the tensile
fractured surfaces were investigated by using Quanta 400 FE-SEM. The FE-SEM also
used to measure the fibre diameter of the untreated and different surface treated sisal
fibres. The morphology of tensile fractured surfaces of Hal-PLA and Hal-PP
nanocomposites and the elemental analysis for the unmodified and APTES modified
Hal nanotubes was carried out by using FE-SEM with EDX using Quanta 400 FE-
SEM.
3.5.3 Nitrogen adsorption-desorption analysis
Nitrogen adsorption-desorption isotherm analysis was carried out for unmodified and
APTES modified Hal nanotubes at -196 oC by using porosimeter (ASAP2020,
Micromeritics). The specific surface area and total pore volume of both unmodified
and APTES modified Hal nanotubes were calculated by Brunauer-Emmett-Teller
(BET) method and Barrett-Joyner-Halenda (BJH) methods respectively by using
MicroActive 4.0 software. Before measurements, samples of unmodified and APTES

57
modified Hal nanotubes were dried at 110 oC for 12 h and out-gassed at 100
oC under
vacuum for 8 h (Barrientos-Ramirez et al., 2011).
3.5.4 XRD analysis
The crystallinity of cellulose in sisal fibres was analysed with X’Pert Pro MRD
(PANalytical) diffractometer using CuKα (1.2405980Å) radiation Ni-filter and
scintillation counter as detector at 45 kV and at 23 mA. Experiments were carried out
in the continuous mode at a scan speed of 2o per min and with a step size of 0.02
o.
The X-ray diffracto-grams were recorded from 10 to 50o (Bragg angle). The
crystallinity index and percentage of crystallinity (%Cr) of cellulose were calculated
according to peak height method (eqn. 3.2) (Segal et al., 1959; Park et al., 2013).
Where I002 is the peak intensity at a 2θ angle close to 22o
and Iam is the amorphous
counter reading at a 2θ angle at around 18o.
3.5.5 Tensile properties of single sisal fibre
Tensile properties of untreated and surface treated sisal fibres were carried out
according to ASTM D3379-75 standard test method for a single filament. For this
purpose, untreated and surface treated single fibre was fixed to the rectangular
cardboard sheet with the dimensions of 50 mm × 20 mm (length × width) which has a
20 mm hole in the middle of the cardboard sheet as shown in Fig. 3.1. The single fibre
was mounted on the cardboard sheet by using polyvinyl acetate glue. The mounted
fibres were then placed in the grips of tensile testing machine (Toyoski tensile testing
machine) and a cutter was used to cut the supporting sides of the cardboard. The

58
tensile test was carried out at a cross head speed of 0.5 mm/min using 10 N-cell load.
The fibres were assumed to be cylindrical and the diameter of the fibres was measured
at five different points using optical microscopy (Olympus SZX7). The obtained
average diameter was then used to calculate the tensile properties of fibres
considering twenty specimens.
Fig. 3.1 Schematic diagram of the method followed to determine the tensile strength
of single fibre
3.5.6 Density measurements
The density (ρc) of the composites was calculated by using a pycnometer which was
carried out according to ISO 118-3. Distilled water was used as a reference liquid for
this test at 23 oC. The density of the composites was then calculated by using the
following eqn. 3.3

59
Where Wc, Wm and Wf are the weights of the composites, matrix and fibres
respectively, whereas ρm and ρf are the density of matrix and fibres respectively.
3.5.7 Tensile properties of the composites
Dumb-bell shaped specimens were punched from the moulded sheets of pure PLA,
pure PP, untreated and different surface treated sisal fibres reinforced PLA and PP
composites after 24 h of storage. Tensile properties were also evaluated for the
unmodified and APTES modified Hal nanotubes reinforced PLA and PP composites.
Ultimate tensile strength (maximum stress), elongation at break and Young’s modulus
were measured according to ASTM D638 standard using Toyoski tensile testing
machine at a constant crosshead speed of 5 mm/min. Six specimens were tested and at
least five replicate specimens have been presented as an average of tested specimens.
3.5.8 Impact properties of the composites
Impact tests were performed for pure PLA, pure PP, untreated and different surface
treated sisal fibres reinforced PLA and PP composites after 24 h of storage. Impact
properties were also evaluated for the unmodified and APTES modified Hal
nanotubes reinforced PLA and PP composites by using CEAST Izod impact tester
(Model CE UM-636) with a 4 J hammer according to ASTM D256 standard. For this,
samples with the final dimensions of 3 x 25 x 150 mm3
were cut and the impact
strength was performed at room temperature for six notched samples taken from each
nanocomposite and the average values and the standard deviation have been reported.
3.5.9 TGA analysis
TGA was conducted using Perkin-Elmer (STA6000 TA instrument) from room
temperature to 600 oC at a heating rate of 10
oC/min under nitrogen atmosphere at a

60
flow rate of 20 ml/min and the sample weight was taken as an average of 8 mg for
each sample.
3.5.10 DSC analysis
DSC analysis was carried out for pure PLA, pure PP, and untreated and different
surface treated sisal fibres reinforced PLA and PP composites. DSC test was also
carried out for unmodified and APTES modified Hal nanotubes reinforced PLA and
PP composites. For this purpose computerised DSC (Mettler Toledo DSC 1/32
equipped with STARe System) was used to determine the crystallization and melting
temperatures, heat of fusion and degree of crystallinity of the samples. The tests were
conducted by heating the samples in a covered aluminium pan from room temperature
to 120 °C at 10 °C/min followed by cooling to 30 °C at a cooling rate of 10 °C/min to
remove the thermal history. Second heating was carried out at a rate of 10 °C/min up
to 120 °C to obtain heat flow vs. temperature thermogram. All the analysis was
carried out using 5 to 10 mg of samples in an atmosphere of nitrogen (20 ml/min).
First heating scan was omitted from the data analysis. The crystallinity of PLA and PP
in the composites was calculated by using the following eqn. 3.4
Where ∆Hm and ∆Hom are the endothermic enthalpy of samples and that of 100%
crystallized PLA and PP (heat of fusion of 100% crystallinity of PLA and PP are 93
J/g and 209 J/g respectively) (Avella et al., 1992; Arbelaiz et al., 2006; Battegazzore
et al., 2011). ∆Hcc is the enthalpy of cold crystallization and C is the mass percentage
of pure PLA and PP composites respectively.

61
3.5.11 DMA analysis
DMA was measured by using a dynamic mechanical analyser (Perkin-Elmer
DMA8000). The samples were subjected to a cyclic tensile strain with the force
amplitude of 0.1 N at a frequency of 1.0 Hz. Storage modulus, tan delta and loss
modulus were determined from room temperature to 120 o
C at a heating rate of 3
oC/min.
3.5.12 Water absorption studies
Water absorption tests were carried out according to ASTM D570-98. The composite
samples were cut into square shape with the dimensions of 20 mm × 20 mm × 3 mm.
The composite samples were first dried in an oven at 70 o
C for 24 h to remove the
moisture and then the composite samples were weighed and soaked in a beaker with
distilled water. The water soaked samples were taken out at regular time intervals and
the experiments were continued over a period of 60 days. Composite samples were
dried using tissue paper after taken out from the beaker and the samples were weighed
by using a digital balance. A digital weighing scale (Mettler Toledo model: XS204-3)
with a weighing precision of 0.0001 g was used to weigh the samples. The percentage
weight of water absorbed (WA) was calculated by using the following eqn. 3.5
Where, Wi and Wf are the initial and final weights of the composite samples
respectively. Water or moisture absorption is an important property in which the
mechanical properties of fibre reinforced composite materials decrease greatly with
increasing water absorption (Chow et al., 2007). The diffusion properties of
composite materials could be explained by Fick’s law. The coefficient of diffusion

62
(D) is defined as the rate of diffusion takes place with respect to unit area of sample
and square root of time (Dhakal et al., 2007b; Sreekala and Thomas, 2003). Diffusion
coefficient (D) behaviour of untreated and treated SF/PLA composites was calculated
by the following eqn. 3.6.
Where k is the initial slope of a plot M (t) versus t1/2
; Mm is the maximum weight gain
and h is the thickness of the sample.
3.5.13 Biodegradability analysis
The biodegradability of the untreated, HIU treated, alkali treated and the combination
of alkali and HIU treated SF/PLA polymer composites were conducted by natural soil
burial test for a period of 4 months (January to April 2016). This biodegradability test
was carried out according to Kim et al. (2005). For this purpose, samples were cut
into square shape with the dimensions of 20 mm × 20 mm × 3 mm. Each month, one
set of samples were dig out from the soil and washed with distilled water and then
dried at 60 o
C in an oven for 24 h before subjecting the samples to morphological
studies and weight loss measurements. The weight loss was estimated with an
electronic digital balance with the precision of 0.0001.
Weight loss was calculated by using following eqn. 3.7.

63
Where Wi and Wf are the initial and final weight of the samples. Morphological
aspects of the exposed area of the samples were analysed by using Quanta 400 FE-
SEM.

64
CHAPTER IV
Results and Discussion: Surface treatments and
characterisation of sisal fibres
4.1 Effects of alkali and HIU treatments on sisal fibres
Alkali treatment is one of the most common and efficient chemical methods used for
cleaning and/or mercerising the surface of natural fibres (Gurunathan et al., 2015). On
the surface of sisal fibres, free space exists between the cellulose and amorphous
materials, which is responsible for the absorption of moisture. Absorption of moisture
leads to the reduction in the mechanical and thermal properties of fibres. Scheme 1
(section 2.4.1) shows the alkali reaction with sisal fibres in which Na+ ions from the
alkali solution replace the hydroxyl groups on the surface of fibres whereby the fibre
surface becomes hydrophobic which leads to the enhancement of moisture resistance
property of the fibre surface (Kabir et al., 2012). Alkali treatment also dissolves the
waxy and oily materials that cover the surface of fibres thereby making the surface to
become cleaner. Besides, micro-voids are eliminated due to the clean surface and the
stress transfer property of fibres is increased (John and Anandjiwala, 2009;
Mwaikambo et al., 2007). With the removal of these amorphous materials from the
surface of fibres, mechanical and thermal properties of the fibre reinforced composites
increased (Mwaikambo et al., 2007; Lu et al., 2013; Kabir et al., 2013b; Mahjoub et
al., 2014). However, improvement of these properties mainly depends on the
concentration of alkali solution. It is proved that the optimized percentage of alkali
treatment can only remove the amorphous materials partially from the surface of
natural fibres ( Mwaikambo and Ansell, 1999; Cai et al., 2015). If the concentration of

65
alkali is higher than the optimum, delignification takes place and the fibres become
weakened or damaged, which leads to the reduction in the mechanical and thermal
properties of the reinforced composites (John and Anandjiwala, 2009; Kabir et al.,
2012).
On the other hand, in recent years, HIU has gained wide popularity as an effective
method for the surface modification of natural fibres especially for the separation of
fibres (Chen et al., 2011b). HIU waves can produce powerful mechanically oscillating
bubbles which lead to cavitation that consists of formation, expansion and violent
collapse of bubbles in the water and result in the generation of high pressure and
temperature locally. The energy produced by the cavitation during violent collapse is
approximately equals to hydrogen bond energy (10-100 kJ/mol). Thus, the ultrasonic
impact can gradually disintegrate the complicated multilayer structure and separates
the cellulose fibrils from the amorphous materials (Tischer et al., 2010). The effect of
HIU treatment of sisal fibres was studied without alkali pre-treatment. It was noticed
that the ultrasound treatment alone not effective in the removal of amorphous
materials from the surface of fibres and to reduce the fibre diameter. This may be due
to the strong intermolecular hydrogen bonding of hemicellulose and lignin present on
the surface of fibres with the cellulose molecule. However, alkali treatment replaces
the hydrogen bonding as shown in the scheme 1 (section 2.4.1). This is in agreement
with the results of FE-SEM, FTIR and tensile strength and modulus. Similar results
were reported by other researchers (Lee et al., 2008; Moshiul Alam et al., 2012; Beg
et al., 2015).
Application of HIU treatment for the alkali treated sisal fibres significantly improved
the aspect ratio due to well-separated fibre strands which leads to improve the
mechanical and thermal properties of the fibre reinforced polymer composites. Fig.

66
4.1 shows the schematic representation of the effects of alkali and HIU treatments on
the surface of fibres. Chen et al. (2011) described the key effects of HIU for the
chemically pre-treated wood fibres. They mentioned that HIU with an output power
equals to 1000 W or more was efficiently individualised the fibres and significantly
increased the aspect ratio of fibres. Tischer et al. (2010) reported the pre-treatment of
bacterial cellulose with 0.1M NaOH solution before applying HIU treatment. They
found that the combination of alkali and HIU treatments were effective in promoting
the removal of amorphous materials from the surface of bacterial cellulose.
Fig. 4.1 Schematic representation of the effects of alkali and HIU treatments on the
sisal fibres
A significant reduction of water absorption by 50% and an increase in the tensile
strength by 4.52% were found out with alkali and ultrasound treated banana fibres
reinforced vinyl ester composites as compared to untreated banana fibre composites
(Ghosh et al., 2014). Combined treatments of alkali and ultrasound treatments were
applied to oil palm empty fruit bunch fibres reinforced PLA composites and the

67
mechanical and thermal properties were evaluated. It was noticed that the tensile
strength, modulus and impact strength increased by 33%, 62% and 53.8% respectively
for the combined treatments of alkali and ultrasound as compared to pure PLA
(Moshiul Alam et al., 2012). Fig. 4.2 shows the visual examination of untreated and
different surface treated sisal fibres. It can be seen that the untreated fibres (Fig. 4.2A)
possess higher diameter as compared to alkali and the combined treatment of alkali
and HIU (Figs. 4.2C and D). HIU treatment (Fig. 4.2B) could remove the impurities
whereby the fibres become cleaned.
Fig. 4.2 Visual examination of sisal fibres: (A) Untreated (UT), (B) High intensity
ultrasound treated (ULT), (C) Alkali treated (ALKT), (D) Combination of alkali and
high intensity ultrasound treated (ALKT-ULT) sisal fibres
A B
C D

68
Abdul Khalil et al. (2014) and Iskalieva et al. (2012) have also studied the HIU effects
on the separation of hemicellulose and lignin from the fibre surface and indicated that
the pre-treatment of fibres with high power input of ultra-sonication enhanced the
removal of amorphous materials from the surface of natural fibres along with
individualisation of fibre strands. This is in agreement with the observed results from
FE-SEM and tensile strength.
4.2 FTIR analysis
The chemical structure of untreated, ultrasound, alkali and the combination of alkali
and ultrasound treated sisal fibres was analysed through FTIR. The functional groups
of cellulose, hemicellulose, pectin and lignin present on these fibres and their
respective IR bands have been listed in Table 4.1 (Boopathi et al., 2012; Ramadevi et
al., 2012; Cai et al., 2015). FTIR spectrum is useful to investigate the shifted
functional groups within the fibre constituents after subjected to surface treatments
(Carrillo et al., 2004; Abidi et al., 2014).
Fig. 4.3 shows the FTIR spectra of untreated, ultrasound, alkali and the combination
of alkali and ultrasound treated sisal fibres. The broad peaks at 3431 cm-1
and at 3434
cm-1
are attributed to the hydroxyl groups of cellulose and hemicellulose. In the
untreated fibres, the band at 2916 cm-1
indicates the C-H stretching of lignin which
shifted to 2893 cm-1
with the treatment of ultrasound, alkali and the combination of
alkali and ultrasound on the sisal fibres and this clearly indicates the removal of lignin
(Zhou et al., 2014). In the untreated fibres, the band appearing at 1742 cm-1
indicates
the C=O groups of hemicellulose and pectin which disappeared with the alkali
treatment (Ramadevi et al., 2012). However, with ultrasound treatment the sisal fibres

69
still indicates the peak at 1742 cm-1
, which confirms that ultrasound treatment alone is
not effective in removing hemicellulose and lignin from the surface of fibres.
Table 4.1 FTIR transmittance peaks of the constituents of sisal fibres
Wavenumbers (cm-1
) Functional groups Possible assignment
3431, 3434 -OH stretching vibrations Cellulose, hemicellulose
and lignin
2916, 2921, 2893 C-H stretching vibrations Lignin, hemicellulose and
cellulose
1742 C=O stretching vibrations Carboxyl groups of
hemicellulose and pectin
1636 -OH bending mode Presence of water in
hemicellulose
1376 C-H bending and C-O
stretching
Hemicellulose
1261 C-O stretching Acetyl groups of lignin
1053, 1060 C-O stretching Lignin and cellulose
Similarly, the peak corresponding to C-O stretching of acetyl groups of lignin at 1261
cm-1
no longer appears with the combined treatment of alkali and ultrasound. The
characteristic peak at 1053 cm-1
represents the C-O stretching of lignin in the
untreated fibres which shifted to a higher wavelength at 1060 cm-1
due to the removal
of lignin from the surface of sisal fibres with the treatments of alkali and the
combination of alkali and ultrasound (Kabir et al., 2013a; Belaadi et al., 2014; Cai et
al., 2015).

70
Fig. 4.3 FTIR spectra of untreated (UT), ultrasound treated (ULT), alkali treated
(ALKT) and the combination of alkali and ultrasound treated (ALKT-ULT) sisal
fibres
From these observations it could be noted that hemicellulose, pectin and lignin from
the surface of sisal fibres could be removed when they were subjected to alkali and
the combined treatment of alkali and ultrasound. Previous studies indicated that
ultrasound treatment alone did not cause any significant effect on the removal of
hemicellulose and pectin (Chen et al., 2011). On the other hand, alkali treatment alone
found to have good impact on the removal of amorphous materials such as
hemicellulose, lignin and pectin from the surface of sisal fibres (Lu et al., 2013; Cai et
al., 2015).
In this investigation no difference was observed between the spectra of alkali treated
and the combination of alkali and ultrasound treated sisal fibres. This indicates the
importance of alkali in removing the amorphous components from the surface of
fibres. Besides, it confirms that the molecular structure of cellulose was not changed
4000 3500 3000 2500 2000 1500 1000 500
ALKT-ULT ALKT ULT UT
Wavenumber (cm-1)
% T
ran
smit
tan
ce
2916 3431 1742
2893 1376
1060
1261

71
with any of the above treatments. Thus, alkali as well as the combination of alkali and
ultrasound treatments successfully removed the amorphous materials such as
hemicellulose, lignin and pectin from the surface of sisal fibres. Similar observations
were reported on the preparation of cellulose I nanofibers from bamboo fibres (Chen
et al., 2011).
4.3 Morphology of sisal fibres
The changes in the morphology of sisal fibres with alkali, ultrasound and their
combined treatments were studied using FE-SEM (Fig. 4.4). Fig. 4.4A clearly shows
that the surface of untreated fibres contains impurities such as waxy and gummy
materials which are attached onto the surface. Whereas, the partial removal of
impurities, waxy and gummy materials could be seen in the case of ultrasound treated
sisal fibres as compared to the untreated fibres (Fig. 4.4B). Thus, ultrasound treatment
alone is not effective to remove the hemicellulose, lignin and pectin from the surface
of sisal fibres owing to the strong hydrogen bonding between lignin and cellulose
structure. Whereas, alkali treatment helps to dissolve the oily, waxy and other
impurities which stick onto the surface of sisal fibres and results in the cleaning of
fibre surface (Fig. 4.4C).
Besides, the alkali treatment reduced the fibre diameter owing to the removal of
hydrogen bonding between the cellulose and lignin materials on the surface of fibres
and leads to their easy separation (Li et al., 2007). A reduction in the fibre diameter
enhances the aspect ratio (length/diameter) of sisal fibres which assists in the
improvement of mechanical and thermal properties of fibre reinforced polymer
composites (Vilay et al., 2008; Dong et al., 2014; Shukor et al., 2014). These

72
observed results of removal of amorphous components from the fibre surface are in
agreement with FTIR results.
Fig. 4.4 FE-SEM micrographs of sisal fibres: (A) Untreated (UT) (B) Ultrasound
treated (ULT) (C) Alkali treated (ALKT) (D) the combination of alkali and ultrasound
treated (ALKT-ULT)
With the combined treatment of alkali and ultrasound, the fibre surface becomes
highly rough with loosened structure (Fig. 4.4D) as compared to the untreated,
ultrasound and alkali treated fibres. Thus, alkali treatment removed the waxy, oily and
other impurities present on the surface of fibres whereby fibres become swollen and
soft. Whereas, the application of HIU causes the removal of amorphous materials as
B
C D
A

73
well as the separation or disintegration of cellulose effectively which in turn enhances
the surface roughness of sisal fibres.
An increase in the surface roughness is very important to enhance the adhesion or
mechanical interlocking between fibre surface and polymer matrix to improve the
mechanical and thermal properties of fibre reinforced polymer composites (Cheng et
al., 2010; Chen et al., 2011a, 2011b). Other researchers also noted similar results
using different natural fibres where they have observed the removal of wax and pectin
from the fibre surface after alkali and ultrasound treatments. Besides, they observed
an irregularity in the structure on the fibre surface which increased the adhesion of
fibre and matrix of polymer composites (Mwaikambo and Ansell, 2002; Chen et al.,
2011b; Kaushik et al., 2012; Moshiul Alam et al., 2012; Zhang et al., 2013; Cai et al.,
2015).
4.4 Analysis of moisture absorption
Similar to other natural fibres, sisal fibres absorb moisture, mainly due to the presence
of amorphous materials on the surface of fibres which induce the absorption of
moisture from the atmosphere. With the absorption of moisture, the mechanical and
thermal properties of fibres are reduced. Besides, it causes poor compatibility between
the polymer matrix and fibre. Analysis of moisture content of the untreated, HIU
treated, alkali treated and the combination of alkali and HIU treated fibres have been
shown in Fig. 4.5. It is obvious that the untreated fibres show a higher moisture
content, as discussed in the earlier sections where the large gap between the cellulose
and amorphous materials such as hemicellulose, lignin and pectin on the surface of
sisal fibres absorb the moisture in the untreated fibres (Somerville et al., 2004).
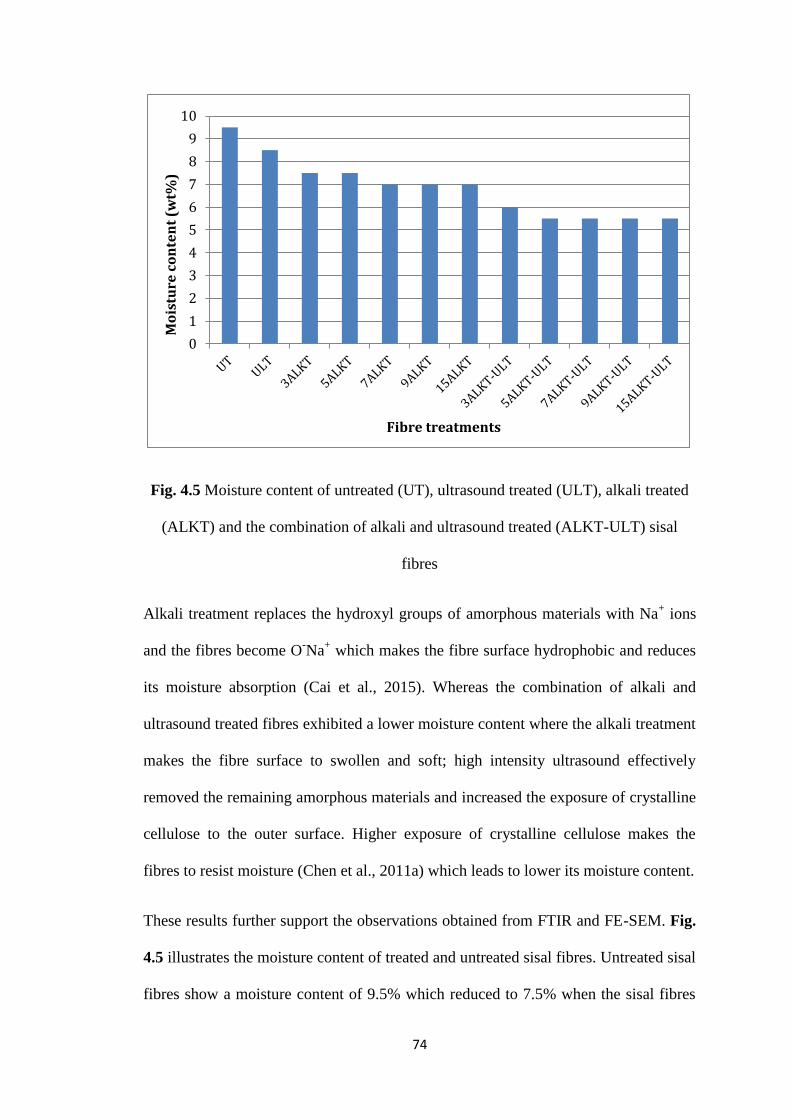
74
Fig. 4.5 Moisture content of untreated (UT), ultrasound treated (ULT), alkali treated
(ALKT) and the combination of alkali and ultrasound treated (ALKT-ULT) sisal
fibres
Alkali treatment replaces the hydroxyl groups of amorphous materials with Na+ ions
and the fibres become O-Na
+ which makes the fibre surface hydrophobic and reduces
its moisture absorption (Cai et al., 2015). Whereas the combination of alkali and
ultrasound treated fibres exhibited a lower moisture content where the alkali treatment
makes the fibre surface to swollen and soft; high intensity ultrasound effectively
removed the remaining amorphous materials and increased the exposure of crystalline
cellulose to the outer surface. Higher exposure of crystalline cellulose makes the
fibres to resist moisture (Chen et al., 2011a) which leads to lower its moisture content.
These results further support the observations obtained from FTIR and FE-SEM. Fig.
4.5 illustrates the moisture content of treated and untreated sisal fibres. Untreated sisal
fibres show a moisture content of 9.5% which reduced to 7.5% when the sisal fibres
0
1
2
3
4
5
6
7
8
9
10
Fibre treatments
Mo
istu
re c
on
ten
t (w
t%)

75
were treated with NaOH (3 wt%). Moisture content further reduced to 7% when the
conc of NaOH increased to 7%. Whereas, for the combined alkali and ultrasound
treated fibres, the moisture content significantly dropped to 5.5% which reveals that
the combined treatments of alkali and ultrasound made significant effects on the fibre
surface. Boopathi et al. (2012) reported that the absorption of moisture significantly
reduced (30%) after alkali treatment of Borassus fibres. Moisture absorption is an
important property as it modifies the mechanical and thermal properties of fibres. A
lower moisture content of the fibres enhances the adhesion between the fibres and the
matrix which results in its wider applications as reinforcing fillers in the production of
polymer composites.
4.5 Analysis of fibre diameter
Fibre diameter analysis was carried out by taking 25 samples each of untreated, alkali
treated, HIU treated and the combination of alkali and HIU treated sisal fibres. Fig.
4.6 shows the FE-SEM images from which the diameter of sisal fibres could be
established. A reduction in the fibres diameter was observed and the obtained results
have been summarised in Table 4.2. Untreated fibres show a higher fibre diameter
(240-305 µm) as compared to HIU treatment, alkali and the combination of alkali and
HIU treated sisal fibres. In case of HIU treatment, a slight reduction in the fibre
diameter was observed which is due to the effect of ultrasonication. In case of alkali
treated fibres, a considerable reduction in the fibre diameter was observed which
clearly indicated the removal of amorphous materials as well as waxy, oily and other
impurities from the surface of fibres. It is noteworthy that the diameter of fibre
decreased constantly with an increase in the concentration of NaOH from 3 to 15
wt%. Similar observations were also noted for the simultaneous treatment of alkali
and HIU.

76
Fig. 4.6 FE-SEM images of sisal fibres with the diameter for different concentration
of alkali treatment and the combination of alkali and ultrasound treatments (A)
Untreated (B) HIU treated (C) Alkali treated (D) the combination of alkali and HIU
treated
In case of the combination of alkali and HIU treated sisal fibres, the fibre diameter
reduced by about 200% (Table 4.2), implying an increased aspect ratio. These
observations show that the combined treatments of alkali and HIU affect the fibre
diameter of the sisal fibres. Kabir et al. (2013) observed the same trends in the hemp
fibres where the diameter of fibres reduced to 20% of their original diameter after
subjecting the fibres to NaOH (10 wt%) which is due to the removal of hemicellulose
and lignin from the surface of fibres. Mahjoub et al. (2014) determined the fibre

77
diameter after alkali treatment and observed a reduction in the fibre diameter by 15 to
25%.
Table 4.2 Diameter of untreated and different surface treated sisal fibres
S.
No.
Fibre type Maximum
diameter (µm)
Minimum
diameter (µm)
Average
diameter (µm)
1 UT 305 240.0 275.25
2 ULT 285 175 240.50
3 3ALKT 245.50 135.84 185.67
4 5ALKT 206.52 136.33 155.95
5 7ALKT 195.30 92.22 147.40
6 9ALKT 190 103.52 136.50
7 15ALKT 175.20 97.60 133.99
8 3ALK-ULT 228.60 187.35 195.60
9 7ALK-ULT 187 122.68 145.70
10 9ALK-ULT 125 85.50 105.00
11 15ALK-ULT 120 85 97.50
4.6 XRD analysis
XRD is an important technique to investigate the crystallinity of materials. Fig. 4.7
shows the diffraction patterns of untreated, HIU, alkali and the combination of alkali
and HIU treated sisal fibres. The X-ray spectrum of untreated and treated sisal fibres
show three main peaks at 15.3o, 23.0
o and 35.0
o, which are assigned to (101), (002)
and (040) reflection planes of cellulose I structure. The untreated sisal fibre shows a
broad peak at 15.3o which is related to the amorphous phase of lignin and

78
hemicellulose. The sharp peak with high intensity refers to the crystalline cellulose
phase of sisal fibres (Ouajai and Shanks, 2005; Mohan and Kanny, 2012). After alkali
treatment, cellulose in the sisal fibres converted into alkali cellulose. Formation of
alkali cellulose purely depends on the concentration of alkali and the treatment
conditions. Na+-cellulose I and Na
+-cellulose II are the commonly existing types of
alkali cellulose with the alkali treatment. Na+-cellulose I is formed at room
temperature with the concentration of alkali between 3-5%. Whereas, Na+-cellulose II
is formed at a higher concentration of alkali (7% and higher) and at higher
temperatures (60-1000C). Subsequent washing of Na
+- cellulose leads to the formation
of Na+-cellulose II which is of a crystalline structure. Nishiyama et al. (2000) reported
that the alkali treatment involves rearrangement of amorphous form of cellulose
molecules into crystalline phase. Cai et al. (2015) also observed similar results in
abaca fibres using higher concentrations of alkali.
The crystalline index (CrI) of untreated, HIU, alkali and the combination of alkali and
HIU treated sisal fibres was calculated by using the Segal method and the obtained
values of CrI have been shown in Fig. 4.8. Segal method is simple and effective and is
based on the intensity measured at two points of XRD according to eqn. 3.2 (Park et
al., 2010). Crystallinity index of untreated sisal fibres was 64.67% which slightly
increased to 66.21% for the HIU treated sisal fibres and this indicates the partial
removal of amorphous materials from the surface of sisal fibres. However, with the
treatment of alkali, crystallinity index of the sisal fibres increased gradually. The
crystallinity continuously increased with an increase in alkali from 3 wt% up to 7
wt%, and resulted in about 10% higher crystallinity than the untreated sisal fibres.
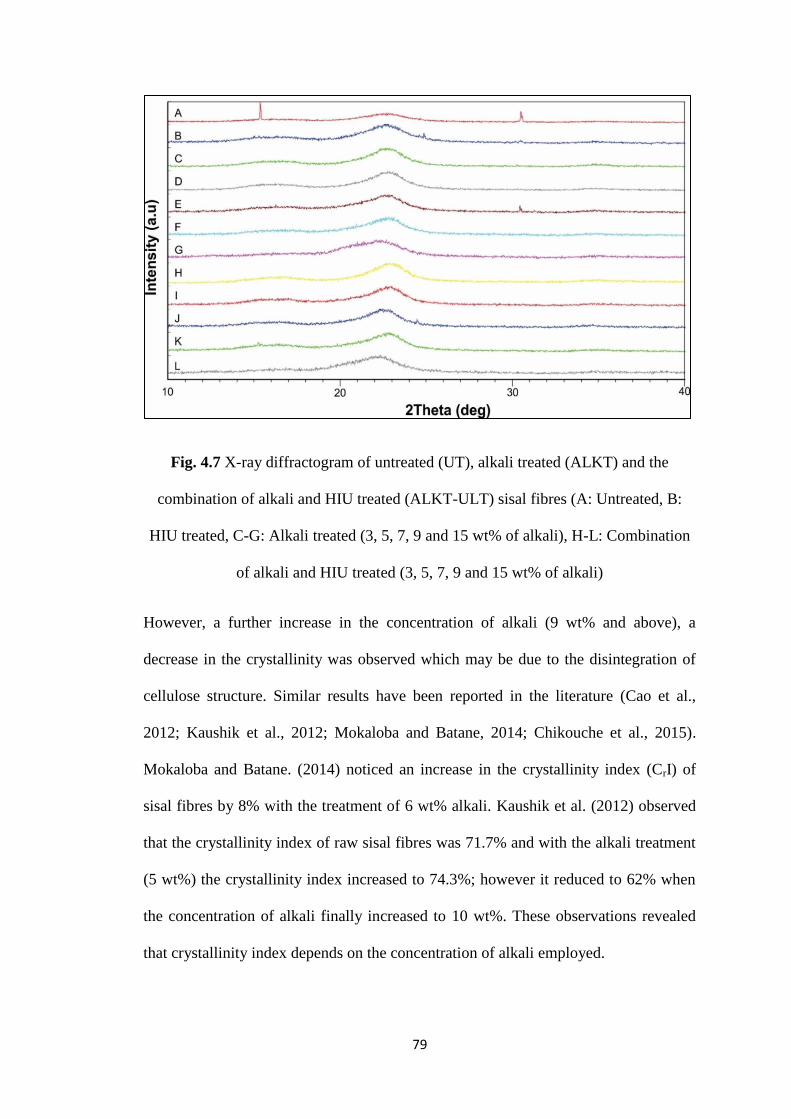
79
Fig. 4.7 X-ray diffractogram of untreated (UT), alkali treated (ALKT) and the
combination of alkali and HIU treated (ALKT-ULT) sisal fibres (A: Untreated, B:
HIU treated, C-G: Alkali treated (3, 5, 7, 9 and 15 wt% of alkali), H-L: Combination
of alkali and HIU treated (3, 5, 7, 9 and 15 wt% of alkali)
However, a further increase in the concentration of alkali (9 wt% and above), a
decrease in the crystallinity was observed which may be due to the disintegration of
cellulose structure. Similar results have been reported in the literature (Cao et al.,
2012; Kaushik et al., 2012; Mokaloba and Batane, 2014; Chikouche et al., 2015).
Mokaloba and Batane. (2014) noticed an increase in the crystallinity index (CrI) of
sisal fibres by 8% with the treatment of 6 wt% alkali. Kaushik et al. (2012) observed
that the crystallinity index of raw sisal fibres was 71.7% and with the alkali treatment
(5 wt%) the crystallinity index increased to 74.3%; however it reduced to 62% when
the concentration of alkali finally increased to 10 wt%. These observations revealed
that crystallinity index depends on the concentration of alkali employed.

80
Fig. 4.8 Percentage of crystallinity as a function of percentage of alkali concentration
for alkali treated (ALKT) and the combination of alkali and high intensity ultrasound
treated (ALKT-ULT) sisal fibres
With the combined treatment of alkali and HIU, the crystallinity index improved
further and reached the maximum of 78.74% for alkali concentration of 7 wt% and
HIU combination as compared to individual HIU and alkali treated sisal fibres which
is associated with the swelling of sisal fibres after the alkali treatment. With the
swelling and smooth surface of sisal fibres after alkali treatment, it becomes easy for
the HIU treatment to remove the amorphous materials effectively. Thus, 7 wt% alkali
and HIU treated sisal fibres shows 14% higher crystallinity as compared to the
untreated sisal fibres. However, similar to alkali treated sisal fibres, the combination
of alkali (9 and 15 wt%) and HIU treated sisal fibres resulted into a slight reduction in
the crystallinity of 70.21 and 69.43% respectively, which is due to the disintegration
of cellulose structure. These observations indicate that the fibre surface becomes more
crystalline upon the removal of amorphous materials with the combination of alkali
55
60
65
70
75
80
3 5 7 9 15
ALKT ALKT-ULT
Percentage of alkali concentration
Cry
sta
llin
ity
(%
)

81
and HIU treatments. These results are in agreement with the observations from FTIR
and FE-SEM results.
4.7 TGA analysis
Fig. 4.9 shows the TGA curves of alkali treated sisal fibres with untreated and HIU
treated sisal fibres respectively. Whereas, Fig. 4.10 shows the TGA curves of
combined treatment of alkali and HIU with untreated and HIU treated sisal fibres
respectively.
Fig. 4.9 TGA curves of untreated (UT), ultrasound (ULT) and alkali treated (ALKT)
sisal fibres
It could be observed that the untreated sisal fibres show a primary weight loss in the
temperature range of 90 to 110 oC which is due to the evaporation of surface water
(De Rosa et al., 2010; Orue et al., 2016). HIU treated sisal fibres also show a similar
weight loss in the temperature range of 90 to 110 o
C which clearly indicates that the
ultrasound alone could not be effective for the removal of amorphous materials from
10
20
30
40
50
60
70
80
90
100
110
30 80 130 180 230 280 330 380 430 480
UT ULT 3ALKT 5ALKT7ALKT 9ALKT 15ALKT
Re
sid
ua
l m
ass
(w
t%)
Temperature (oC)

82
the surface of fibres, since the amorphous materials are responsible for the absorption
of moisture. However, this primary degradation peak reduced with an increase in the
concentration alkali from 3 wt% and completely disappeared at an optimum
concentration of alkali (7 wt%). This observation strongly supports the reduction in
the moisture after alkali treatment which is due to the removal of amorphous materials
as well as surface impurities i.e. wax and oil which lead to make the fibre surface
becomes cleaned and enhances the thermal stability of fibres. Secondary thermal
degradation peak could be noticed around 300 oC for the untreated and ultrasound
treated sisal fibres which is due to the thermal degradation of hemicellulose.
However, this secondary degradation peak could not be observed in the alkali and the
combination of alkali and ultrasound treated sisal fibres which confirms the removal
of hemicellulose. This is further supported by FTIR analysis.
Similar observations were noted for the untreated sisal fibres which show a second
degradation peak around 190 to 220 oC due to the degradation of hemicellulose which
starts degrading around 190 oC owing to the amorphous characteristics of
hemicellulose (Rosa et al., 2009; Wu et al., 2013; Hossain et al., 2014; Orue et al.,
2015). In case of alkali treated sisal fibres, a weight loss of 10% could be seen at 282
oC which is 25
oC higher than the untreated fibres. This indicates that the alkali
treatment influenced the removal of hemicellulose and pectin considerably. However,
in case of combined treatments of alkali and ultrasound, a weight loss of 10% could
be noticed at 295.5 oC, which is 38.5
oC and 25
oC higher than the untreated and alkali
treated sisal fibres respectively (Fig. 4.11). This again clearly confirms that the
thermal stability is significantly increased in the combined alkali and ultrasound
treated fibres.

83
Fig. 4.10 TGA curves of untreated (UT), ultrasound treated (ULT) and the
combination of alkali and HIU treated (ALK-ULT) sisal fibres
The combined alkali and ultrasound treated sisal fibres show better thermal stability
as compared to untreated, ultrasound treated and alkali treated fibres. As discussed in
the earlier section 4.3, this may be due to the ultrasound of high intensity which may
induce the disintegration of sisal fibres to increase the overall surface area of fibres
and to enhance the surface roughness. Kabir et al. (2013b) reported that the thermal
stability of pure cellulose was much higher than lignin and hemicellulose. They
observed that the thermal stability of cellulose was 350 oC, whereas hemicellulose
degraded at 290 oC and lignin degraded at 320
oC. Hence, these observations confirm
that the thermal stability of cellulose is higher than hemicellulose and lignin.
Besides, in the combined treatment of alkali and HIU, HIU treatment effectively
exposes the crystalline cellulose to the outer surface by disintegrating the fibre which
makes these fibres to become more hydrophobic with improved thermal stability
10
20
30
40
50
60
70
80
90
100
110
30 80 130 180 230 280 330 380 430 480
UT ULT 3ALK-ULT 5ALK-ULT
7ALK-ULT 9ALK-ULT 15ALK-ULT
Temperature (oC)
Res
idu
al
mass
(w
t%)

84
(Cheng et al., 2009; Chen et al., 2011b). This supports the observations made from
FE-SEM and FTIR. 50% weight loss could be observed in the temperature range from
350 to 370
oC (Fig. 4.11) which shows an increase in the thermal stability by 19
oC for
the alkali treated as compared to the untreated sisal fibres.
Fig. 4.11 Thermal stability of untreated (UT), alkali (ALKT) and the combination of
alkali and ultrasound treated (ALKT-ULT) sisal fibres
However, thermal stability decreased slightly to 357 oC (10
oC) at 50% weight loss for
the combination of alkali and HIU treated fibres which may be due to the
disintegration of small portion of cellulose structure of sisal fibres caused by high
intensity ultrasonication. Similar observations of an increased thermal stability with
alkali treatment have been reported by several researchers (Mohan and Kanny, 2012;
Hossain et al., 2014; Zhou et al., 2014; Orue et al., 2015). It could also be observed
that the char residue obtained with the combination of alkali (9 wt%) and HIU treated
sisal fibres is 22%, whereas for the untreated sisal fibres it is 12% which is 10 wt%
0
50
100
150
200
250
300
350
400
Temperature at 10% wt loss Temperature at 50% wt loss
Fibre treatments
Tem
per
atu
re (
oC
)

85
higher char residue as compared to the untreated sisal fibres. This again confirms that
the combined treatment of alkali and HIU is better in the removal of hemicellulose,
lignin and pectin from the surface of sisal fibres and causes the exposure of cellulose
to the outer surface.
4.8 Tensile properties of single sisal fibre
Fig. 4.12 shows the typical stress-strain curve obtained from the tensile tests. Similar
to other natural fibres, sisal fibres showed brittle nature under tensile test conditions
and a sudden drop in the load was observed when the fibres break. It is evident from
Fig. 4.12 that the stress-strain curves were initially linear until the fibre fracture
occurred and the failure strain was found to be approximately 1-3%. It is difficult to
analyse the results of tensile test obtained from single filament due to its very small
size and brittleness.
Fig. 4.12 Typical stress-strain curves of single sisal fibre
0
50
100
150
200
250
300
350
400
450
0 0.06 0.12 0.18 0.24 0.3
ALK UT
Strain (%)
Str
ess
(MP
a)

86
The results of tensile test of single fibre depend on three main factors: the test
parameters/conditions, plant characteristics and the area measurements. The plant age,
source, mechanism of fibre extraction and the presence of defects are the few which
affect the mechanical properties of fibres (Silva et al., 2008; Belaadi et al., 2014).
Figs. 4.13 (A) and (B) show the plot of tensile strength and modulus values against
different surface treatments of sisal fibres respectively. Tensile strength and modulus
of HIU treated sisal fibres showed a slight decrease by 5.6% and 5% respectively as
compared to the untreated fibres. However, a significant reduction in the tensile
strength and modulus was observed for the alkali and the combination of alkali and
HIU treated sisal fibres.
The tensile strength and modulus reduced by 25% and 26% respectively for the
combination of alkali and HIU treated sisal fibres as compared to untreated sisal
fibres. This is mainly due to the removal of amorphous materials such as
hemicellulose, lignin and other waxy materials from the surface of fibres.
Hemicellulose and lignin are the two main components on the cell wall structure of
natural fibres which tightly bound to the cellulose. Removal of these amorphous
materials due to alkali treatment causes fibre degradation and leads to the reduction in
the mechanical properties of fibres (Mahjoub et al., 2014; Haameem et al., 2016; Orue
et al., 2016). Moreover, the application of HIU for alkali pre-treated sisal fibres
significantly damages the surface of fibres and reduces the fibre diameter which
significantly reduces the mechanical properties (Chen et al., 2011b; Iskalieva et al.,
2012). These observations are in agreement with the obtained results of FE-SEM.

87
(A)
(B)
Fig. 4.13 Tensile properties of untreated (UT), ultrasound treated (ULT), alkali treated
(ALK) and the combination of alkali and ultrasound treated (ALKTULT) sisal fibres:
(A) tensile strength (B) tensile modulus
0
100
200
300
400
500
600
UT ULT ALK ALKULT
Fibre treatments
Ten
sile
str
ength
(M
Pa)
0
2
4
6
8
10
12
14
16
18
20
UT ULT ALK ALKULT
Fibre treatments
Ten
sile
mod
ulu
s (G
Pa)

88
4.9 Conclusions
In this investigation, sisal fibres were subjected to different surface treatments such as
alkali, HIU and the combination of alkali and HIU treatments in order to remove the
amorphous materials such as hemicellulose, pectin and lignin from the surface of sisal
fibres by which the interfacial strength, mechanical and thermal properties of PLA
and PP matrix composites were enhanced. FTIR analysis confirmed the removal of
amorphous materials from the fibre surface with alkali and the combination of alkali
and HIU treatments. FE-SEM indicated the removal of amorphous materials by which
the fibre surface became rougher and enhanced the adhesion. The fibre diameter and
moisture absorption significantly decreased for the combination of alkali and HIU
treatment by 200% and 40% as compared to untreated sisal fibres. Crystallinity index
increased to 10 % and 14 % for alkali treatment (7 wt%) and the combined treatment
of alkali (7 wt%) and HIU respectively as compared to the untreated sisal fibres. This
again supports the removal of amorphous materials from the surface of fibres which
increased the crystalline phase. The thermal stability found to increase significantly
by 38.5 o
C for the combined treatments of alkali (7 wt%) and HIU as compared to the
untreated fibres. This is in agreement with FTIR and FE-SEM analysis which
confirmed the removal of amorphous materials whereby the fibres become more
crystalline and thermally more stable. Tensile properties of single sisal fibre showed a
reduction in the tensile strength and modulus by 25% and 26% respectively for the
combined treatment of alkali and HIU as compared to the untreated sisal fibre owing
to surface treatments.

89
CHAPTER V
Results and Discussion: Sisal-PLA Composites
5.1 FE-SEM analysis
FE-SEM was used to analyse the morphology and failure mechanism of sisal fibres
reinforced PLA composites. Fig. 5.1 shows the morphology of impact fractured
samples of untreated, HIU treated, alkali treated and the combination of alkali and
HIU treated (15 wt% loading) SF/PLA composites. Large voids could be noted at the
fibre-matrix interface of untreated SF/PLA composites (Fig. 5.1 A). These large voids
maybe due to fibre pull-out from the matrix phase when impact force was applied
which indicates the poor interfacial adhesion between the fibre and matrix interface in
the untreated SF/PLA composites. In addition, a large number of cracks could also be
observed on the fractured surface which is mainly due to the presence of amorphous
materials such as hemicellulose, pectin, lignin and other waxy materials on the surface
of untreated sisal fibres. These amorphous materials are responsible for the absorption
of moisture causing incompatibility between untreated sisal fibres and PLA. It is a
well-known fact that the interfacial adhesion between fibre and matrix plays an
important role on the mechanical properties of fibre reinforced composites (Asumani
et al., 2012). Treatment of sisal fibres with HIU helps to remove the amorphous
materials from the surface of fibres which reduces the incompatibility between the
fibres and matrix (Fig. 5.1 B). However, the agglomeration of fibre and a large
number of voids on the surface of HIU treated sisal fibre composites confirm that HIU
treatment alone could not be sufficient to reduce the amorphous materials from the
surface of sisal fibres. Fig. 5.1 C shows the surface morphology of alkali treated

90
SF/PLA composites, where a reduction in the number of voids and air bubbles could
be noticed.
Fig. 5.1 FE-SEM images of impact fractured samples of (A) untreated (UT), (B)
ultrasound treated (ULT), (C) alkali treated (ALK) and (D) the combination of alkali
and ultrasound treated (ALKTULT) SF/PLA composites
This may be due to the mercerisation effects of alkali which dissolves the amorphous
and other impurities that stick on the surface of sisal fibres. However, in the alkali
treated composites, micro voids and cracks could be seen in the matrix phase which is
mainly due to fibre agglomeration. In the case of combination of alkali and HIU
treated sisal fibres composites (Fig. 5.1 D), the fibres are well dispersed across the

91
matrix and the interfacial adhesion increases between the fibre-matrix phases. This is
mainly due to the effects of combined treatment of alkali and HIU which resulted in
good fibre separation across the PLA matrix. It could also be noticed that the FE-SEM
images of the impact fractured samples show that fibres are fractured rather than pull
out when sudden impact force was applied for the combination of alkali and HIU
treated SF/PLA composites. This confirms that the stress transfers from the matrix to
the fibres. Similar results have been reported by other authors (Silva et al., 2009; Das
and Satapathy, 2011; Li et al., 2011; Zhong et al., 2011; Asumani et al., 2012; Dong
et al., 2014; Shanmugam and Thiruchitrambalam, 2013).
Moshiul Alam et al. (2012) studied the effect of combined treatment of alkali and
ultrasound on oil palm empty fruit bunch fibres reinforced PLA composites. They
noticed that in case of untreated fibres surface, fibres seem to be pulled out due to
poor interfacial adhesion between the fibre and matrix. However, fibres were
fractured rather than pull out for the simultaneous treatment of alkali and ultrasound.
Chen et al. (2011) reported that the combined treatment of alkali and HIU is an
effective way to remove the amorphous materials and to reduce the diameter of the
fibres in which the aspect ratio of the fibres increased which leads to improving the
mechanical properties of fibre reinforced composites. Dong et al. (2014) observed
large voids on the tensile fractured surface of untreated coir fibres PLA composites
due to the presence of amorphous materials and other impurities on the surface of coir
fibres. The large voids in the untreated coir fibres composites tend to decrease the
load bearing capacity of composites and lead to lowering the mechanical strength. In
contrast, numbers of voids were reduced in the alkali treated coir fibres which
improved the interfacial bonding between the fibre and matrix. This again confirms
the removal of amorphous and other waxy materials with alkali treatment.

92
5.2 FTIR analysis
FTIR spectroscopy is an important technique to study the structural changes of
composite materials. This technique was used in the investigation of structural
modification SF/PLA composites. The FTIR spectra of SF, PLA and SF/PLA
composites have been represented in Fig. 5.2.
Fig. 5.2 FTIR spectra of sisal fibre, pure PLA and SF/PLA composites
The peaks obtained in the FTIR spectra of PLA are as follows: the peak of
asymmetric mode of the ester group (O-C) appeared at 1083 cm-1
; a sharp peak at
1456 cm-1
could be assigned to symmetric bending vibrations of CH3 and the peaks
obtained at 956 and 922 cm-1
could be attributed to the rocking mode of CH3 group. A
relatively smaller peak appeared at around 3500 cm-1
from PLA is related to the
stretching deformation of hydroxyl group. However, the characteristic peak of PLA
(i.e. 3500 cm-1
) found to be different for the composites (3437 cm-1
) and for the sisal

93
fibres (3410 cm-1
). This peak disappeared for the composites with the incorporation of
sisal fibres and appeared as a broad peak which is similar to sisal fibres. This indicates
that the OH groups from the fibres formed hydrogen bonds with the carbonyl groups
(C=O) of PLA. Similar results have been reported for the rice starch reinforced PLA
composites (Yew et al., 2005). There is no change in the peaks appeared at 2998 and
2944 cm-1
could be assigned to asymmetric and symmetric mode of C-H stretching
respectively.
The C=O stretching appeared approximately at 1756 cm-1
is assigned for the ester
group of PLA. This ester peak has higher intensity for the composites than for PLA.
This is due to the esterification reaction which took place between OH groups of sisal
fibres and terminal carboxylic acid groups (COOH) of PLA. This agrees with the
observations reported by Semba et al. (2006). They noted that the peak intensity of
C=O group at 1756 cm-1
increased due to the reaction between dicumyl peroxide and
PLA. It is already reported that similar to any other natural fibres sisal fibres are
made-up of cellulose as a main component. It is assumed that majority of
physicochemical bonding interactions occur between the hydroxyl groups of cellulose
from the surface of sisal fibres with the carbonyl groups (C=O) of PLA matrix. The
untreated sisal fibres contain amorphous materials such as hemicellulose, pectin and
other waxy materials on the surface of fibres which allow limited hydroxyl groups to
interact with the carbonyl groups (C=O) and carboxyl groups (COOH) of PLA.
However, in case of alkali and the combination of alkali and HIU treated sisal fibers,
these amorphous materials are removed from the surface of fibres thereby exposing
more number of hydroxyl groups of cellulose for hydrogen and covalent bonding with
the carbonyl groups (C=O) and the carboxyl groups (COOH) of PLA (Sawpan et al.,
2011).

94
5.3 Tensile properties
Tensile strength of untreated, HIU treated, alkali treated and the combination of alkali
and HIU treated SF/PLA composites was evaluated and is illustrated in Fig. 5.3. It
could be noted from this figure that the tensile strength decreased with an increase in
the fibre loading as compared to pure PLA except for 15 wt% of fibre loading for
which the tensile strength slightly increased to 54.24 MPa (10% higher than pure
PLA). However, as compared to the untreated sisal fibre composites, surface treated
sisal fibres composites showed a gradual increment in the tensile strength at all the
percentages of fibre loading. Combination of alkali and HIU treated SF/PLA
composites showed superior tensile properties. PLA composites with the fibre loading
of 15 wt% showed higher tensile strength among all other fibre content.
Fig. 5.3 Tensile strength of untreated (UT), ultrasound treated (ULT), alkali treated
(ALK) and the combination of alkali and ultrasound treated (ALKTULT) sisal fibres
reinforced PLA composites
0
10
20
30
40
50
60
0 10 15 20 25 30
Pure PLA UT ULT ALKT ALKT-ULT
Fibre loading (wt%)
Ten
sile
str
ength
(M
Pa)

95
The tensile strength of HIU treated, alkali treated and the combination of alkali and
HIU treated SF/PLA composites were 43 MPa, 47 MPa and 54.24 MPa respectively
as compared to the untreated sisal fibre composites, which were 10%, 20% and 33%
higher than the untreated fibres composites with the same weight percentage (15 wt%)
of fibre loading. This trend is almost the same at all fibre loading. An increase in the
tensile strength for the treated sisal fibres composites as compared to the untreated
sisal fibre composites indicates the removal of non-cellulosic (amorphous) materials
and other impurities from the surface of sisal fibres during surface treatment
(Arrakhiz et al., 2012; Dong et al., 2014). These results further support the
observations obtained from FTIR and FE-SEM. Ma and Joo. (2011) reported that the
bamboo fibres reinforced PLA composites with different surface treatments such as
Plasma, UV irradiation and direct silane treatments showed an increase in the tensile
strength by 43.7%, 60.7% and 71.1% respectively.
As compared to pure PLA, the tensile strength decreased for the SF/PLA composites
with an increase in the fibre loading from 10 to 30% irrespective of the surface
treatments. This may be due to an increase in the fibre agglomeration in the fibre-
matrix interface which leads to poor interfacial adhesion between the fibres and
matrix. Similar results have already been reported. Tisserat et al. (2013) observed that
the tensile strength of PLA composites decreased significantly by 20% with the
addition of 25 wt% of paulownia wood filler as compared to pure PLA. They also
indicated that the aspect ratio of filler materials play an important role in improving
the mechanical properties of composite materials. Lee et al. (2012) observed a
reduction in the tensile strength by 10% with the addition of 20 wt% of sisal fibres in
the PLA composites as compared to pure PLA. They also indicated that the poor

96
interfacial adhesion between the fibre and matrix and the agglomeration of fibres
across the matrix resulted in reducing the tensile strength.
In contrast to the tensile strength, tensile modulus enhanced significantly with the
incorporation of sisal fibres into PLA matrix at all the fibre loading as compared to
pure PLA. It can be seen from Fig. 5.4 that the sisal fibre loading of 30 wt % on the
PLA composite increased the tensile modulus by 25%, 46%, 54% and 75.4% for the
untreated, HIU treated, alkali treated and the combination of alkali and HIU treated
sisal fibres PLA composites respectively as compared to pure PLA. These results are
in agreement with the observations of Ragoubi et al. (2012). They reported that the
tensile modulus increased by 19% and 31% for miscanthus grass fibres reinforced
PLA composites with and without fibre surface treatments respectively as compared
to pure PLA.
Fig. 5.4 Tensile modulus of untreated (UT), HIU treated (ULT), alkali treated (ALK)
and the combination of alkali and HIU treated (ALKULT) SF/PLA composites
0
200
400
600
800
1000
1200
1400
1600
1800
2000
0 10 15 20 25 30
Pure PLA UT ULT ALK ALKULT
Fibre loading (wt%)
Ten
sile
mod
ulu
s (M
Pa)

97
A significant enhancement in the observed tensile modulus is attributed to improved
interfacial adhesion between the sisal fibres and PLA matrix which enhances the load
transfer from the matrix phase to filler phase (Ma and Whan Joo, 2011; Asumani et
al., 2012; Lee et al., 2012; Cran et al., 2014).
Arrakhiz et al. (2012) reported that the tensile modulus increased significantly by
more than 70% and 100% for the alkali and esterification treatments respectively for
the same fibre loading (20 wt%). They also observed an improved interfacial adhesion
between the alfa fibres and the PP matrix due to the effective removal of non-
cellulosic materials from the surface of fibres during the surface treatments which leds
to improve the tensile properties. The aspect ratio of the fibres playing an important
role in altering the mechanical properties of fibre reinforced polymer composites.
Tisserat et al. (2013) observed that the tensile modulus increased by 35% for smaller
filler size as compared to larger filler particles.
On the other hand, the percentage of elongation at break reduced with an increase in
the sisal fibres content in the PLA composites (Fig. 5.5). A significant reduction of
more than 50% could be seen with an addition of even 10 wt% of untreated sisal
fibres. It is further reduced with an increase in the fibre content. Addition of fibre
materials into the PLA matrix restricts the mobility of polymer chain and making it
more resistant to elongation at break as compared to pure PLA. This is in agreement
with the reports of Petinakis et al. (2009) and other researchers (Cran et al., 2014; Lee
et al., 2012; Ragoubi et al., 2012; Tisserat et al., 2013).

98
Fig. 5.5 Tensile elongation at break of untreated (UT), HIU treated (ULT), alkali
treated (ALK) and the combination of alkali and HIU treated (ALKULT) sisal fibres
reinforced PLA composites
5.4 Predictions of Tensile modulus
Practically, it is very difficult to calculate the experimental values of tensile or
Young’s modulus of natural fibre reinforced polymer composites accurately due to
large variation in the matrix and fibres parameters such as aspect ratio of fibres, fibre
orientation, surface treatments of fibres etc., However, intrinsic tensile modulus of the
reinforcing fibres is the key parameter to predict the modulus or strength of the fibre
reinforced composites (López et al., 2012). Mathematical models are commonly used
to estimate the theoretical values of the tensile or flexural modulus of natural fibre
reinforced polymer composites (Serrano et al., 2014).
Figs. 5.6-5.9 show the comparison of tensile modulus obtained from the experimental
values of different surface treated (untreated, HIU treated, alkali treated and the
combination of alkali and HIU treated) SF/PLA composites with the theoretical
0
2
4
6
8
10
12
0 10 15 20 25 30
Pure PLA UT ULT ALK ALKULT
Fibre loading (wt%)
% E
lon
gati
on
at
bre
ak

99
values calculated by using different mathematical models. It can be seen that Young’s
modulus gradually increases with an increase in the volume fraction of fibres. It is
well-known that the stiffness of the fibre reinforced composites increases with the
addition of filler materials to the polymer matrix.
The modulus mainly depends on the intrinsic rigidity of the fibres and the matrix
(López et al., 2012; Granda et al., 2016). The fibre efficiency factor (ηe) was
calculated using the eqns 2.3, 2.4, 2.5 and 2.6 which was 0.53. This theoretically
calculated value of the fibre efficiency factor was found to fit with the experimental
values. It could be seen from Figs. 5.6-5.9 that at initial fibre loading there is a good
agreement between the experimental and theoretical values in all the models. This
may be due to low volume of fibre loading.
Fig. 5.6 Variations of theoretical and experimental values of tensile modulus for the
untreated sisal fibre reinforced PLA composites
0
0.5
1
1.5
2
2.5
0.089 0.135 0.184 0.228 0.275
Experimental Parallel Series Hirsch BBM
Ten
sile
mod
ulu
s (G
Pa)
Volume fraction of fibres (Vf)

100
It is well known that at low volume fractions of fibres, it can be assumed to be a
uniform distribution of stress and strain which results in better load transformation
across the fibres from the matrix phase in the composite which leads to improving the
mechanical properties of fibre reinforced polymer composites.
Fig. 5.7 Variations in the theoretical and experimental values of tensile modulus for
the HIU treated SF/PLA composites
However, in case of higher fibre volume fractions, there could be large variations
between experimental and theoretical values. This may be due to more possibilities
for the fibre agglomeration across the matrix which causes an uneven distribution of
stress and strain and leads to a reduction in the mechanical properties. Kalaprasad et
al. (1997) studied the theoretical modelling of tensile properties of short sisal fibres
reinforced low density polyethylene composites. Parallel and series models were
commonly used for continuous fibre reinforced polymer composites, where the stress
transfer mechanism is different as compared to short fibre reinforced polymer
0
0.5
1
1.5
2
2.5
3
0.089 0.135 0.184 0.228 0.275
Experimental Parallel Series Hirsch BBM
Ten
sile
mod
ulu
s (G
Pa)
Volume fraction of fibres (Vf)

101
composites. In short fibre composites, the stress transfer largely depends on the fibre
orientations inside the composite, stress concentration at the end of the fibres as well
as on the critical fibre length.
It could be seen from Figs. 5.6-5.9 that the experimental values of surface treated
SF/PLA composites do not show much variation as compared to theoretical values.
However, there is a marginal agreement between the experimental and theoretical
values for the alkali treated and the combination of alkali and HIU treated SF/PLA
composites (Figs. 5.8-5.9). Hirsch model is a combination of parallel and series
models which shows a good agreement between theoretical and experimental values
in all the cases. It is mentioned that the prediction of Hirsch model largely depends on
the value of x in eqn. 2.7 (López et al., 2012; Serrano et al., 2014).
Fig. 5.8 Variations in the theoretical and experimental values of tensile modulus of
alkali treated SF/PLA composites
0
0.5
1
1.5
2
2.5
3
0.089 0.135 0.184 0.228 0.275
Experimental Parallel Series Hirsch BBM
Ten
sile
mod
ulu
s (G
Pa)
Volume fraction of fibres (Vf)

102
The factors which control the x values are: fibre orientation, fibre length and the effect
of stress concentration of the fibres. The stress transfer factor x is approximately 0.4
which is in agreement with the semi-aligned fibre reinforced polymer composites
(Kalaprasad et al., 1997). The theoretical values of tensile modulus of modified
Bowyer and Bader model (BBM) were calculated using the eqn. 2.8. The values of K2
and K1 were calculated to be 0.5 and 1 respectively by using eqns. 2.9 and 2.10.
These values are in agreement with the observations of Joseph et al. (2003). It was
noticed that there is a marginal variation with the experimental and theoretical values
when BBM model was applied for predicting the Young’s modulus of SF/PLA
composites. Unlike other theoretical models, BBM model exhibits higher values as
compared to the experimental values. This may be due to variations in the fibre
orientation factor (K1) and fibre length factor (K2) for the untreated and HIU treated
SF/PLA composites.
Fig. 5.9 Variations in the theoretical and experimental values of tensile modulus of
the combination of alkali and HIU treated SF/PLA composites
0
0.5
1
1.5
2
2.5
0.089 0.135 0.184 0.228 0.275
Experimental Parallel Series Hirsch BBM
Volume fraction of fibres (Vf)
Ten
sile
mod
ulu
s (G
Pa)

103
From these observations, it is noticed that the values of Young’s modulus of
theoretical models are in reasonable correlation with the experimental values in all the
models except a little variation in the BBM model. A good agreement in the
experimental and theoretical values of Young’s modulus of untreated and different
surface treated SF/PLA composites reveals better utilization of sisal fibres and PLA
matrix for the generation of SF/PLA composites.
5.5 Impact properties
The impact property of SF/PLA composites was also investigated. Fig. 5.10 shows
the impact strength of untreated, HIU treated, alkali treated and the combination of
alkali and HIU treated SF/PLA composites. It could be observed that the impact
strength of sisal fibre reinforced composites for the entire fibre loading from 10 to 30
wt% was higher than pure PLA.
Fig. 5.10 Impact strength of untreated (UT), ultrasound treated (ULT), alkali treated
(ALK) and the combination of alkali and HIU treated (ALKULT) SF/PLA composites
0
5
10
15
20
25
30
35
0 10 15 20 25 30
Pure PLA UT ULT ALK ALKULT
Fibre loading (wt%)
Imp
act
str
ength
(J/m
)

104
It is notable that the impact strength of notched samples of SF/PLA composites
increased to 30.5 J/m which is 42% higher as compared to pure PLA. However, the
impact strength decreased gradually with an increase in the loading of sisal fibre. This
may be due to an increase in the brittleness of the composite with an increase in the
fibre content. Similar results have been reported (Mwaikambo et al., 2007; Li et al.,
2011; Luo et al., 2014). It is worth noted that the impact strength decreased to 12.5%,
10.5% and 4.5% for the combined treated, alkali treated and HIU treated sisal fibre
composites respectively as compared to untreated sisal fibre composites. A decrease
in the impact strength of treated sisal fibre composites was noticed. This is may be
due to the surface treatment of sisal fibres which increased the interfacial adhesion
between the fibre and matrix. Sisal fibres in the composites were fractured instead of
pull-out from the matrix when applied with sudden impact force. This is due to an
increase in the adhesion between fibre and matrix phase. Similar results were
reported by other researchers (Mwaikambo et al., 2007; Luo et al., 2014). Luo et al.
(2014) reported similar results where they noticed a decrease in the impact strength by
approximately 14% and 8% for the alkali and sizing treated corn fibre reinforced PLA
composites as compared to untreated fibre composites. Mwaikambo et al. (2007) also
reported that the impact strength decreased by more than 50% for the alkali treated
hemp fibre reinforced euphorbia composites than the untreated one.
5.6 DMA analysis
DMA measurements were carried out to evaluate the effect of different surface
treatments on the visco-elastic behaviour of SF/PLA composites. The dynamic-
mechanical properties of the fibre reinforced composites can be expressed in terms of
storage modulus (E'), loss modulus (E") and damping factor (tan δ) which depend on
time, temperature and frequency. Fig. 5.11 shows the effect of different surface

105
treatments and temperature on the storage modulus (E') of SF/PLA composites as a
function of temperature. It could be seen that in all the cases the storage modulus
decreased as the temperature increased at constant frequency (1.0 Hz). Pure PLA
showed the lowest storage modulus as compared to SF/PLA composites.
The increased storage modulus for the fibre reinforced composites is due to the
restriction in the free mobility of polymer chains which leads to an increased stiffness
(Pothan et al., 2003; Li et al., 2011; Das and Satapathy, 2011; Lavoratti et al., 2015).
It is also worth noted that the surface treated SF/PLA composites showed higher
storage modulus as compared to untreated fibre composites.
Fig. 5.11 Storage modulus (Eʹ) of untreated (UT), HIU treated (ULT), alkali treated
(ALK) and the combination of alkali and HIU treated (ALKULT) sisal fibres
reinforced PLA composites
The storage modulus of SF/PLA composites resulted from the combination of alkali
and HIU treatment was 3.50 GPa which is 30% and 15% higher as compared to pure
0.00E+00
5.00E+08
1.00E+09
1.50E+09
2.00E+09
2.50E+09
3.00E+09
3.50E+09
4.00E+09
35 45 55 65 75 85 95
Pure PLA PLA+UT PLA+ULT
PLA+ALK PLA+ALKULT
Sto
rage
mod
ulu
s (G
Pa)
Temperature (oC)

106
PLA and untreated fibre composites respectively. These results show that the surface
treatment of sisal fibres increased the compatibility and interfacial adhesion between
SF and PLA matrix which leads to an increased stiffness of the resultant composites
(Ray et al., 2002; De Rosa et al., 2011). Sreenivasan et al. (2015) studied the effect of
different surface treatment on the dynamic-mechanical properties of sisal fibre
reinforced polyester composites and found that the sisal fibres treated with alkali
increased the storage modulus by more than 30% as compared to untreated fibre
composites. They also mentioned that the increased storage modulus for the treated
fibre composites is due to an enhancement in the interfacial adhesion between the
fibres and the matrix.
Loss modulus (E") is defined as the ability of a material to dissipate the absorbed
energy as heat owing to viscous motions within the material. Loss modulus could be
associated to impact strength and internal friction of the composite materials. It is
sensitive to molecular motions, transitions and relaxation processes. When the
temperature increased gradually, the material changes from rigid to more elastic state
depending on the movement of its fillers and main polymer chain (Saba et al., 2016).
Fig. 5.12 shows the loss modulus (E") of the untreated and different surface treated
SF/PLA composites as a function of temperature. It could be seen that the loss
modulus peak increased by more than 15% as compared to pure PLA with the
addition of 15 wt% of sisal fibres into PLA matrix.

107
Fig. 5.12 Loss modulus (E") curves of untreated (UT), HIU treated (ULT), alkali
treated (ALK) and the combination of alkali and HIU treated (ALKULT) SF/PLA
composites
An increase in the loss modulus with the addition of sisal fibres into PLA matrix gives
the evidence that the reduction of brittleness and uniform dispersion of fibres across
the matrix material which leads to increased mechanical and thermal properties
(Pothan et al., 2003). It is worth noted that the loss modulus was 25% higher for the
combination of alkali and HIU treated fibre composites as compared to untreated
SF/PLA composites. These results confirmed the increased interfacial adhesion
between the fibres and the matrix for the combination of alkali and HIU treated
SF/PLA composites.
Tan δ or damping factor is a dimensionless number and is the ratio of storage modulus
to loss modulus of the material (Saba et al., 2016). Fig. 5.13 shows the Tan δ peaks of
untreated and different surface treated SF/PLA composites as a function of
temperature.
0.00E+00
5.00E+07
1.00E+08
1.50E+08
2.00E+08
2.50E+08
3.00E+08
3.50E+08
4.00E+08
4.50E+08
5.00E+08
35 45 55 65 75 85 95
Pure PLA PLA+UT PLA+ULT
PLA+ALK PLA+ALKULT
Loss
mod
ulu
s (G
Pa)
Temperature (oC)

108
Fig. 5.13 Tan δ curves of untreated (UT), HIU treated (ULT), alkali treated (ALK)
and the combination of alkali and HIU treated (ALKULT) SF/PLA composites
It could be noticed that the peaks of tan delta reduced significantly by 50% for the
combination of alkali and HIU treated SF/PLA composites as compared to pure PLA.
A reduction in the tan δ peak indicates that the combination of alkali and HIU treated
SF/PLA composites have high elasticity and good interfacial bonding between fibre
and matrix since the mobility of the polymer chains decreased. Pure PLA showed a
higher Tan δ peak which clearly indicates the non-elastic and highly brittle nature
(Lee et al., 2012). It is to be noted that the peak of damping factor decreased gradually
for HIU treated, alkali treated and the combination of alkali and HIU treatments.
Similar results have been reported by other researchers (Ray et al., 2002; Sreenivasan
et al., 2015). Vilay et al. (2008) studied the effect of fibre surface treatment and fibre
loading on the properties of bagasse fibre reinforced unsaturated polyester
composites. They reported that the peak of loss modulus decreased significantly by
90% for the alkali treated bagasse fibre composites as compared to pure resin. Lee et
0
0.2
0.4
0.6
0.8
1
1.2
1.4
1.6
35 45 55 65 75 85 95
Pure PLA PLA+UT PLA+ULT
PLA+ALK PLA+ALKULT
Tan
δ
Temperature (oC)

109
al. (2012) studied the dynamic-mechanical properties of short sisal fibre reinforced
bacterial cellulose polylactide composites and noted the amplitude of damping peak
was higher for pure PLA as compared to sisal fibre reinforced composites. They
mentioned that the higher damping peak indicates the poor interfacial adhesion
between the fibres and matrix whereas the lower tan delta peak represents the good
interfacial adhesion of fibres and matrix.
DMA results also revealed that the temperature of tan δ peak slightly increased with
the addition of untreated sisal fibre into PLA matrix. This is due to the restriction of
molecular mobility of PLA polymer with sisal fibres. However, in case of surface
treated sisal fibres, the temperature of tan δ shifted to lower temperature as compared
to pure PLA. For the combined treatment of alkali and HIU treatments, a significant
reduction of tan δ peak temperature was observed. This may be due to the increased
compatibility between the surface treated sisal fibres and PLA matrix which increased
the interfacial adhesion between the fibre and matrix. Similar results were reported by
other researchers (Liu Xiaohui, 2001; Vilay et al., 2008; Guo et al., 2009)
5.7 TGA analysis
The effect of different surface treatments on the thermal stability of SF/PLA
composites was evaluated by using TGA. Fig. 5.14 shows the TGA curves of
untreated, HIU treated, alkali treated and the combination of alkali and HIU treated
SF/PLA composites. A relatively smaller degradation could be observed in the
temperature range from 90 to 150
oC in case of SF/PLA composites due to the
presence of moisture in the sisal fibres. However, this step could not be seen in case
of pure PLA. Pure PLA shows degradation in a single stage between 280 and 390 o
C
with the maximum degradation occurred at 375 o
C. From Fig. 5.14 it is clearly seen

110
that the degradation temperature of SF/PLA composites decreased with the addition
of fibres as compared to pure PLA. For the untreated sisal fibre composites, 10%
weight loss could be noticed at 313 oC for the untreated SF/PLA composites which is
20 oC lower than pure PLA (333
oC).
Fig. 5.14 TGA of untreated (UT), HIU treated (ULT), alkali treated (ALK) and the
combination of alkali and HIU treated (ALKULT) SF/PLA composites
This trend was same for the ultrasound treated sisal fibre composites which is in
agreement with FE-SEM results. It is well known that any type of natural fibres will
exhibit lower thermal stability as compared to polymer matrices. Adding fibres of low
thermal stability into polymer matrix leads to a reduction in the thermal stability of
the composite materials (Ohkita and Lee, 2006; Yussuf et al., 2010; Cran et al., 2014;
Dong et al., 2014). Yussuf et al. (2010) investigated the thermal stability of pure PLA
and kenaf fibre reinforced PLA composites with 20 wt% loading of kenaf fibres. They
noticed that the composite degraded at 321 oC as compared to pure PLA which
degraded at 323 oC with a weight loss of 10%. However, the thermal stability
0
10
20
30
40
50
60
70
80
90
100
110
30 80 130 180 230 280 330 380 430 480 530 580
Pure PLA UT ULT ALK ALKULT
Temperature (oC)
Rel
ati
ve
ma
ss (
wt%
)

111
considerably increased for the alkali and the combination of alkali and HIU treated
SF/PLA composites as compared to untreated SF/PLA composites.
Table 5.1 Effects of surface treatments on thermal stability of SF/PLA composites
S No Fibre treatments T10% wt loss (oC) T50% wt loss (oC) T90% wt loss (oC)
1 Pure PLA 332.7 356.8 372.7
2 UT 313.7 343 360.5
3 ULT 315.2 344 362
4 ALK 321.6 348 365
5 ALKULT 324.5 349 367
10% weight loss occurred at 321 o
C and at 325 oC for the alkali treated and the
combination of alkali and HIU treated SF/PLA composites respectively which are 8
oC and 12
oC higher than the untreated SF/PLA composites. It is also interesting to
note that the addition of 15 wt% of alkali and the combination of alkali and HIU
treated SF/PLA composites showed an increase in the char residue by 4% and 6%
respectively as compared to pure PLA. This is in agreement with the observations as
reported by Yussuf et al. (2010) and Mitra et al. (1998).
5.8 DSC analysis
The thermal properties of PLA and SF/PLA composites were studied by DSC analysis
and the obtained DSC thermograms have been presented in Fig. 5.15. The glass
transition temperature (Tg), the cold crystallisation temperature (Tcc) and melting
temperature (Tm), melting enthalpy (ΔHm) and percentage of crystallinity (Χc) were
obtained from the DSC analysis and have been summarised in Table 5.1.
The percentage crystallinity was calculated by using the eqn. 3.4. As seen from Fig.
5.15, peaks observed around 60 oC are considered as Tg of PLA due to the thermal

112
transition from glossy state to rubbery. The pure PLA exhibits higher Tg as compared
to SF/PLA composites. The Tcc was found to be around 117 oC and for pure PLA Tm
was at 155.2 oC which supports that the PLA is a semi-crystalline polymer (Cran et
al., 2014).
Fig. 5.15 DSC thermo-grams of pure PLA, untreated (UT), HIU treated (ULT), alkali
treated (ALK), and the combination of alkali and HIU treated (ALKULT) SF/PLA
composites
The Tg increased gradually with the addition of sisal fibres into SF/PLA composites.
This is mainly due to the reinforcement effect with the addition of sisal fibres which
causes the restriction of polymer chain mobility in PLA (Khalid et al., 2008). The Tcc
significantly decreased with an increase in the sisal fibres into PLA. The percentage
crystallinity decreased by more than 50% with the addition of 15 wt% of untreated
sisal fibres as compared to pure PLA (Table 5.2). The percentage crystallinity
decreased mainly because of an increase in the amorphous region and due to the
-60
-50
-40
-30
-20
-10
0
10
20
30
32.9464 64.7097 99.3999 134.961 170.992
ALKULT+PLA ALK+PLA ULT+PLA
UT+PLA Pure PLA
Temperature (oC)
Hea
t fl
ow
(m
W)
ex
o
Tm
Tc
Tg

113
disruption in the crystalline structure of PLA polymer (Wootthikanokkhan et al.,
2013; Yu et al., 2014). However, it was found that the percentage crystallinity
increased significantly for the sisal fibre composites with surface treatments. The
percentage crystallinity drastically increased by 75% for the combination of alkali and
HIU treated SF/PLA composites as compared to untreated SF/PLA composites (Table
5.2).
Table 5.2 Thermal properties of pure PLA and SF/PLA composites
Samples Tg (oC) Tcc (
oC) Tm (
oC) ΔHm (J/g) Χc (%)
Pure PLA 63.05 114.25 148.2 14.22 15.5
15UT+PLA 63.52 113.6 149.5 11.54 6.86
15ULT+PLA 64.2 111.8 149.6 10.72 7.67
15ALK+PLA 64.7 110.5 150.5 12.5 9.51
15ALKULT+PLA 66.3 108.6 151.85 16.35 11.97
This may be due to an increase in the cellulose content of sisal fibres in the treated
SF/PLA composites after the combined treatment of alkali and HIU. It is also believed
that the increased interfacial adhesion between the surface treated sisal fibres and
PLA matrix leads to increase the percentage crystallinity (Dong et al., 2014). This
supports TGA, water absorption and DMA analyses.

114
5.9 Water absorption studies
The water absorption properties have been investigated for the untreated and different
surface treated SF/PLA composites. Figs. 5.16 and 5.17 show the effect of fibre
loading and different surface treatments of sisal fibres on the percentage of water
absorption for SF/PLA composites respectively. As seen in the Figs. 5.16 and 5.17,
the water absorption graphs show linear curves for all the composites during the
initial period of water immersion followed by saturation. According to Mishra et al.
(2014) the water absorption graphs with linear curves obeyed Fick’s law of diffusion.
The water absorption purely depends on its rate of diffusion into the composite
materials (Yew et al., 2005).
Fig. 5.16 Effect of fibre loading on the water absorption of untreated SF/PLA
composites
The percentage of water absorption of pure PLA was 0.78% which is the lowest as
compared to SF/PLA composites which confirms the hydrophobic nature of PLA
0
2
4
6
8
10
12
0 8 16 24 32 40 48 56
Pure PLA 10UT 15UT 20UT 25UT 30UT
Time (Days)
Wate
r ab
sorp
tion
(%
)

115
matrix. The percentage of water absorption gradually increased with an increase in the
fibre loading (Fig. 5.16) which is in agreement with the results as reported by other
researchers (Badia et al., 2014; Rajesh et al., 2015). The percentages of water
absorption, initial slope versus t1/2 and diffusion coefficient have been calculated by
using eqns. 3.5 and 3.6 and the obtained results have been summarised in Table 5.3.
The composites with 30 wt% sisal fibre loading show the highest water absorption
(10.62%) as compared to pure PLA. The presence of sisal fibres in the composites
increases the water absorption which is due to the presence of amorphous materials on
the surface of sisal fibres with a large number of hydroxyl groups. These hydroxyl
groups attract the water molecules through hydrogen bonding (Alamri and Low,
2013). Dhakal et al. (2007b) reported that the composites show an increase in the
trend of water absorption with an increase in the fibre loading. They observed an
increase in the water absorption to 10.97% for 5 layers of hemp fibre mat reinforced
unsaturated polyester composites as compared to pure unsaturated polyester resin
which showed 0.87% of water absorption.
Similar observations have been reported (Yew et al., 2005; Badia et al., 2014; Rajesh
et al., 2015). Alamri and Low (2013) studied the water absorption behaviour of
recycled cellulose fibre reinforced with epoxy composites. They noticed that the water
absorption significantly increased by more than 15% with the addition of 46 wt%
fibre loading into epoxy matrix. These results proved that the addition of natural
fibres into the hydrophobic nature of the polymer matrices resulting into higher water
absorption and leads to decrease the mechanical and physical properties. Espert et al.
(2004) reported that the addition of 30 wt% of cellulose fibres into PPEVA polymer
increased the water absorption by 6% as compared to pure PPEVA polymer. The
effect of different surface treatments on the water absorption has been studied and the

116
obtained results have been presented in Fig. 5.17. It was found that the surface
treatment has a good impact on reducing the water absorption significantly for sisal
fibres composites. The combined treatment of alkali and HIU on the composites
showed the lowest water absorption by 2.24% which is 45% and 80% lower than the
alkali and HIU treated SF/PLA composites. A significant reduction in the water
absorption in the treated sisal fibre composites confirms the removal of amorphous
materials from the surface of sisal fibres.
Fig. 5.17 Effect of high intensity ultrasound (ULT), alkali (ALK) and the combination
of alkali and HIU (ALKULT) surface treatments on the water absorption of SF/PLA
composites
Mohan and Kanny (2012) reported that after the surface treatment with alkali and the
combination of alkali and clay treatments, the water absorption reduced to 11.5% and
10.3% respectively as compared to pure PP which was 12.5%. Ghosh et al. (2013)
studied the effect of air bubbling through alkali solution and sonication on the water
0
1
2
3
4
5
6
0 8 16 24 32 40 48 56
Pure PLA 15UT 15ULT 15ALK 15ALKULT
Wate
r ab
sorp
tion
(%
)
Time (Days)

117
absorption of banana fibre-vinyl ester composites. They reported that the combined
treatment of air bubbling through alkali solution and sonication decreased the water
absorption by 100% as compared to banana fibre composites treated only with an
alkali solution.
These results proved that the surface treatments of natural fibres have considerable
effects on the reduction of water absorption. The rate of diffusion of water in the
composite materials was studied using Fick’s steady state flow and the coefficient of
diffusion (D) was calculated and the results have been summarised in Table 5.3. The
coefficient of diffusion increased with an increase in the fibre loading in the
composites which may be due to the following. First, similar to any other natural
fibres, sisal fibres are highly hydrophilic in nature which favours the diffusion of
water molecules into the composites. Second, due to an increase in the fibre loading in
the composites, fibres become agglomerated within the composites which lead to the
formation of voids and air bubbles. These voids and air bubbles allow rapid
penetration of water molecules into the composites.
Generally polymer matrices are hydrophobic in nature and the natural fibres are
hydrophilic which cause the incompatibility between polymer matrix and the natural
fibres. This incompatibility caused poor interfacial adhesion between fibre and matrix
phase which leads to an increase in the diffusion of water (Espert et al., 2004; Paul et
al., 2015). The coefficient of diffusion decreased drastically for the treated SF/PLA
composites (Table 5.3). The coefficient of diffusion was 0.6873 for 15 wt% of fibre
loading with the combination of alkali and HIU treated sisal fibre composite which is
130% lower than the untreated fibre composite with the same fibre loading. This
confirms the removal of amorphous materials from the surface of fibres which

118
significantly enhanced the interfacial adhesion between matrix and fibres. This
observation is in agreement with the results obtained from FTIR and DMA.
Table 5.3 Water absorption properties of SF/PLA composites
S. No. Samples Fibre
loading
(wt %)
Type of surface
treatment
Maximum
water
absorption
(%)
Initial slope of
plot (k) M(t)
versus t1/2
Diffusion
coefficient,
D, ×10-3
(mm2/sec)
1 Pure PLA 0 - 0.78 0.01 0.13
2 10UT 10 Untreated 3.08 0.07 1.02
3 15UT 15 Untreated 5.30 0.15 1.56
4 20UT 20 Untreated 7.40 0.26 2.33
5 25UT 25 Untreated 8.84 0.37 3.20
6 30UT 30 Untreated 10.62 0.48 3.74
7 15ULT 15 HIU treated 4.05 0.09 0.87
8 15ALK 15 Alkali treated 3.24 0.06 0.68
9 15ALKULT 15 Alkali + HIU
treated
2.24 0.04 0.58
5.10 Biodegradability analysis
Soil burial test was performed to evaluate the effect of different surface treatments
and fibre loading on the biodegradability of SF/PLA composites. Samples of
untreated and different surface treated SF/PLA composites were buried in open soil
and the degradation experiments were carried out as described in the section 3.6. The
percentage of weight loss was calculated for pure PLA and sisal fibre (untreated and
surface treated) reinforced composites after the removal of composite samples from
the soil. Fig. 5.18 shows the percentage of weight loss with the function of fibre
loading and different surface treatments. The biodegradation results revealed that the
percentage weight loss for all the fibre reinforced composites was gradually increased

119
with increased fibre loading as well as number of days of soil burial. From Fig. 5.18,
it could be seen that pure PLA shows the least degradation of 2.59% after 120 days of
soil burial. However, the percentage of degradation increased with an increase in the
fibre loading into PLA matrix. It is worth noted that the percentage weight loss
increased with an increase in the fibre volume of the composites. After 180 days of
soil burial, the percentage weight loss increased significantly by more than 180%,
400% and 550% with the addition of sisal fibres of 15, 20 and 30 wt% respectively as
compared to pure PLA. An increase in the weight loss is mainly due to the exposure
of cellulosic fibres to microbial degradation during soil burial.
Fig. 5.18 Biodegradation of untreated (UT), HIU treated (ULT), alkali treated (ALK)
and the combination of alkali and HIU treated (ALKULT) sisal fibre reinforced PLA
composites with different weight percentage of fibre loading
Besides, it may be due to the hydrophilic nature of untreated sisal fibres which has the
tendency to absorb more water into the composite materials leading to faster
0
2
4
6
8
10
12
14
16
18
2030days 60days 90days 120days
Fibre loading (wt%) and different surface treatments
Wei
gh
t lo
ss (
%)

120
degradation (Yussuf et al., 2010; Dong et al., 2014). On the other hand, different
surface treated SF/PLA composites showed slower degradation as compared to
untreated fibre composites (Fig. 5.18). For instance, 30 wt% of sisal fibre composites
that were treated with the combination of alkali and HIU treatment showed 10%
slower degradation than the untreated fibre composites. Fibre surface treatments make
the fibres more hydrophobic and enhance the fibre-matrix interfacial adhesion which
leads to slower degradation. Moreover, surface treatments remove the amorphous
materials from the surface of fibres which significantly reduced the water absorption
of the composites and leads to slower degradation as compared to untreated SF/PLA
composites (Rajesh et al., 2015). In order to analyse and compare the morphological
changes due to soil biodegradation, samples of pure PLA, untreated and surfaced
treated SF/PLA composites were collected at different degradation stages and
subjected to FE-SEM (Fig. 5.19).
As seen from Fig. 5.19 A, before soil burial, pure PLA shows a smooth and glassy
surface. After 60 and 120 days the erosion and etching out of the surface of pure PLA
clearly show gradual degradation (Figs. 5.19 B-C). In case of untreated SF/PLA
composites with exposure to soil degradation (Figs. 5.19 D-F), it can be clearly seen
that the fibres degrade rapidly as compared to PLA matrix. This is obvious as the
cellulosic fibres are more prone to exposure and hence faster degradation than the
matrix phase. Moreover, the untreated sisal fibres contain amorphous materials on the
surface of fibres which undergo rapid degradation than the crystalline cellulose
materials inside the fibre lumen (Alvarez et al., 2006; Zhao et al., 2008). In case of the
combination of alkali and HIU treated SF/PLA composites (Fig. 5.19 G-I), the
degradation was slower by 10% as compared to untreated fibre composites. This is
mainly due to an improved compatibility between the treated sisal fibres and PLA

121
matrix that leads to an increased interfacial adhesion, due to which the degradation
became slower as compared to untreated SF/PLA composites (Rajesh et al., 2015).
Fig. 5.19 FE-SEM images of outer surface of the soil buried samples (A) Pure PLA
before soil burial, (B) Pure PLA after 60 days, (C) Pure PLA after 120 days, (D) 15
wt% untreated sisal fibre (UT) + PLA composites before soil burial, (E) 15UT+PLA
after 60 days, (F) 15UT+PLA after 120 days, (G) 15 wt% of alkali and HIU treated
sisal fibre (ALKULT) + PLA composites before soil burial, (H) 15ALKULT+PLA
after 60 days, (I) 15ALKULT+PLA after 120 days

122
5.11 Conclusions
In this investigation, untreated and different surface treated sisal fibres reinforced
PLA composites were successfully prepared by melt mixing and compression
moulding techniques and the effect of fibre surface treatments on the morphology,
mechanical, dynamic mechanical, thermal, water absorption and biodegradable
properties were investigated. FE-SEM analysis indicated the well dispersion of fibres
across the matrix after the combined treatment of alkali and HIU. FTIR studies
confirm the surface treatments of sisal fibres and their addition into PLA matrix.
Tensile strength, modulus and the impact strength increased by 10%, 75.4% and 42%
respectively with the loading of surface treated sisal fibres as compared to the
untreated fibres. The theoretical models were used to predict the effect of untreated
and different surface treated short SF/PLA composites on Young’s modulus and to fit
the obtained experimental values. All the models except Bowyer and Bader model
(BBM) show a reasonably good agreement with the experimental values particularly
at lower fractions of fibres. The results of theoretical models revealed that the surface
treatments of fibres influence the tensile properties of short SF/PLA composites.
DMA analysis revealed that the increased fibre loading into PLA matrix significantly
increased the storage modulus by 15% and 30% as compared to untreated fibre
composites and pure PLA respectively. Thermal analysis showed an improved
thermal stability by 12 oC and the crystallinity increased by 75% for the combined
treatment of alkali and HIU as compared to untreated SF/PLA composites. Water
absorption and soil biodegradation analysis were in favour of improved mechanical
properties of SF/PLA composites with the incorporation of sisal fibres which were
surface treated with the combination of alkali and HIU.

123
CHAPTER VI
Results and Discussion: Hal-PLA
Nanocomposites
6.1 Nitrogen adsorption-desorption analysis
Nitrogen adsorption-desorption isotherms of unmodified and APTES modified Hal
nanotubes have been shown in Fig. 6.1 The specific surface area (SBET), Langmuir
surface area, pore volume (Vpore) and pore width (Wpore) values of unmodified and
APTES modified Hal nanotubes have been shown in Table 6.1. Isotherms of both
unmodified and APTES modified Hal nanotubes belong to type II with H3 hysteresis
loop according to IUPAC classification (Sing, 1982; Thommes et al., 2015). It could
be seen from Fig. 6.1 that the untreated Hal nanotubes show a minor hysteresis loop
which corresponds to the relatively large mesopores with non-uniform diameter of the
Hal nanotubes lumen.
Table 6.1 Nitrogen adsorption and desorption data of surface area (SBET), Langmuir
surface area, volume (Vpore) and width (Wpore) for unmodified (uHal) and APTES
modified Hal nanotubes (mHal)
Samples SBET
(m2/g)
Langmuir
surface area
(m2/g)
Vpore (cm3/g) Wpore (Ǻ)
Adsorption Desorption Adsorption Desorption
uHal 61.74 84.45 0.165 0.177 107.34 115.23
mHal 18.38 25.43 0.069 0.079 150.77 171.94

124
In case of APTES modified Hal nanotubes, there is a noticeable absorption of
nitrogen which corresponds to the multilayer adsorption with uniform pore size. The
BET specific surface area and pore volume of the unmodified Hal nanotubes were
61.74 cm3/g
and 0.165 cm
3/g respectively (Table 6.1) which indicate a larger surface
area and pore volume. However, in case of APTES modified Hal nanotubes, the
surface area, Langmuir surface area, and pore volume significantly decreased to 18.38
cm3/g, 25.43 m
2/g
and 0.069 cm
3/g respectively. This is due to the grafting of organo-
silane compounds and the associated structural shrinkage in the APTES modified Hal
nanotubes which lead to a significant decrease in the surface area (Yuan et al., 2008;
Jin et al., 2015; Freire et al., 2016).
Fig. 6.1 Nitrogen adsorption-desorption isotherms of unmodified (uHal) and APTES
modified Hal nanotubes (mHal)
6.2 FTIR analysis
Fig. 6.2 shows the FTIR spectra of unmodified (A) and surface modified Hal
nanotubes (B) using the silane coupling agent, APTES. Table 6.2 presents the

125
wavenumbers and assignments of FTIR spectra of unmodified Hal nanotubes, APTES
modified Hal nanotubes and their PLA nanocomposites.
Fig. 6.2 FTIR spectra of unmodified (uHal) (A) and APTES modified Hal nanotubes
(mHal) (B)
In the FTIR spectra of unmodified (uHal) and silane modified Hal nanotubes (mHal),
the high intensity peaks at 3693 cm-1
, 3618 cm-1
, 3695 cm-1
and 3622 cm-1
are
A
B

126
associated with O-H stretching of Al-OH groups. In these OH groups, each OH linked
to two Al atoms. The peaks at around 3434 cm-1
and 3460 cm-1
are attributed to
intercalated water and OH groups on the surface of Hal nanotubes (Joussein et al.,
2005). The bands in the region between 1000 and 1200 cm-1
are related to asymmetric
stretching of siloxane groups in the Hal nanotubes (Barrientos-Ramirez et al., 2011).
The peaks at around 470 cm-1
and 474 cm-1
are assigned to stretching vibrations of Si-
O-Si groups (Yuan et al., 2008; Pasbakhsh et al., 2010; Albdiry and Yousif., 2014).
As compared to unmodified Hal nanotubes, APTES modified Hal nanotubes (mHal)
exhibit new FTIR bands.
The new peak at 3365 cm-1
for APTES modified Hal nanotubes is associated with
asymmetric stretching of amino group. The deformation vibrations of CH2 at 2935
cm-1
and the deformation peak of Si-CH3 at around 1249 cm-1
have been noted. Due
to silanisation, hydrolysis and condensation take place which lead to the generation of
siloxane (-Si-O-Si-) and creates a bond between Hal nanotubes and the hydroxyl
groups (-OH) on the surface of silane (Scheme 2). Hal nanotubes surface becomes
hydrophobic due to these siloxanes (Albdiry and Yousif, 2014). Moreover, the new
peak at 1560 cm-1
for APTES modified Hal nanotubes is attributed to the stretching
vibration of amino group, which also proves the modification of APTES with Hal
nanotubes. The high intensity peaks in the APTES modified Hal nanotubes from 3600
to 3700 cm-1
indicate the presence of inner hydroxyl groups as well as the hydroxyl
groups located on the octahedral surfaces of Hal nanotubes. FTIR spectra of PLA with
unmodified (A) and APTES modified (B) Hal nanocomposites have been represented
in Fig. 6.3. The band at 3504 cm-1
indicates the interaction of hydroxyl groups of PLA
with Si-O-Si groups of Hal nanotubes via hydrogen bonding (Liu et al., 2013).

127
The hydrogen bond interaction between PLA matrix and other nanofillers was
reported by Matusik et al. (2011). The PLA shows absorption bands at 2999 cm-1
and
at 2682 cm-1
arising from C-H stretching vibrations of CH3
and CH groups
respectively, whereas the stretching vibrations of carbonyl groups are appearing at
1755 cm-1
.
Fig. 6.3 FTIR spectra of PLA/unmodified Hal nanotubes (PLAuHal) (A) and
PLA/APTES modified Hal nanotubes (PLAmHal) (B)
A
B

128
Table 6.2 FTIR bands and assignments for uHal, mHal and Hal-PLA nanocomposites
(Joussein et al., 2005; Yuan et al., 2008; Pasbakhsh et al., 2010; Carli et al., 2014)
Assignments
uHal mHal PLAuHal PLAmHal
Positions (cm-1
)
O-H stretching of inner-surface hydroxyl
groups
3693,
3618
3695, 3622 3625 3625, 3693
O-H stretching of inner hydroxyl groups 3618 3622 - -
O-H stretching of water 3434 3460 - -
Asymmetric stretching of N-H2 - 3365 - -
Symmetric stretching of C-H2 - 2935 - -
Stretching vibration of C-H3 - - 2999, 2945 2999, 2948
Stretching vibration of C-H - - 2682 -
Stretching vibration of C=O - - 1753 1755
O-H deformation of water 1635 1637 - -
Deformation (scissoring) of N-H2 - 1560 - -
Bending vibration of C-H - - 1456 1458
Symmetric deformation of Si-CH3 - 1249 - -
Asymmetric stretching of siloxanes 1033,
1010
1093, 1058,
1000
- -
Deformation of Al-O-Si 538 530 536 536
Deformation of Si-O-Si 470 474 478 478
Deformation of Si-O 426 424 - -

129
A high intensity peak appears at 536 cm-1
for APTES modified Hal-PLA
nanocomposites is related to the deformation of Al-O-Si from Hal nanotubes which
confirms the hydrogen bond interaction between APTES modified Hal nanotubes and
PLA matrix. The intensity of the peak appearing at 1755 cm-1
for the carbonyl groups
is higher for the APTES modified Hal nanotubes incorporated PLA nanocomposites
as compared to unmodified Hal-PLA nanocomposites. The higher intensity of
absorption bands at 3504 and 3691 cm-1
for the surface modified Hal-PLA
nanocomposites confirm the formation of more hydrogen bonds between the APTES
modified Hal nanotubes and PLA.
6.3 FE-SEM analysis
The FE-SEM image of Hal nanotubes is presented in Fig. 6.4A. Halloysite nanotubes
are natural 1D nanomaterial having a cylindrical shape with hollow and open-ended
tubular morphology. Impact fractured samples were used for the morphological
studies to investigate the dispersion and interfacial features of fillers and matrix phase
of Hal-PLA nanocomposites. The FE-SEM Image of impact fractured surface of pure
PLA is presented in Fig. 6.4B, the glossy surface of which indicates the brittle nature
of pure PLA (Liu et al., 2013).The large number of agglomeration could be seen in
the FE-SEM image (Fig. 6.4C) of PLA nanocomposites with the addition of 4 wt% of
unmodified Hal owing to the poor interfacial adhesion between Hal nanotubes and
PLA. The above poor interfacial adhesion causes stress concentration and leads to
reduced tensile and impact properties of Hal-PLA nanocomposites. The interfacial
adhesion between Hal nanotubes and PLA matrix increased with APTES modified
Hal-PLA nanocomposites (Fig. 6.4D).

130
Similar results were reported by Pasbakhsh et al. (2010) where they noticed more
agglomeration in case of unmodified Hal nanotubes as compared to modified Hal
nanotubes. An increase in the mechanical and thermal properties of the CPN is
controlled by the reduction in the agglomeration which leads to an enhancement in the
compatibility between matrix and filler. According to Carli et al. (2014), the
mechanical and thermal properties of APTES modified Hal-PLA nanocomposites
were purely dependent on the reaction between the functional groups of organo-silane
modifier and the carbonyl groups of PLA matrix.
Fig. 6.4 FE-SEM images of impact fractured samples of unmodified (uHal) and
APTES modified (mHal) Hal-PLA nanocomposites: (A) Hal nanotubes (B) Pure PLA
(C) 4 wt% uHal (D) 4 wt% mHal
A B
D C

131
6.4 FE-SEM with EDX analysis for Hal nanotubes
The FE-SEM images and the EDX results of elemental analysis of unmodified and
APTES modified Hal nanotubes are represented in Fig. 6.5 and Table 6.3. These
results revealed that Hal nanotube has a tubular structure with nanometer dimension.
Besides, they show that Hal nanotubes were successfully modified with APTES.
Fig. 6.5 FE-SEM images of (A) unmodified (uHal) and (B) APTES modified Hal
nanotubes (mHal)
Table 6.3 EDX results of unmodified and APTES modified Hal nanotubes
S. No. Samples Elements (wt%)
Carbon Oxygen Silicon Aluminium Nitrogen
1 uHal 8.16 60.67 15.95 15.22 0.0
2 mHal 4.66 58.59 20.40 15.48 0.87
Silane grafting can be confirmed by the presence of nitrogen content and from an
increase in the silane (APTES modified Hal nanotubes). However, according to Carli

132
et al. (2014), it is impossible to quantify the silane content using the EDX method.
The quantity of amino groups in the APTES modified Hal nanotubes depends on the
type of functionality of amino groups in the silane coupling agent (Yuan et al., 2008).
6.5 Tensile and impact properties
Tensile strength of unmodified and APTES modified Hal/PLA nanocomposites was
shown in Fig. 6.6. The experimental values of tensile strength, elongation at break,
tensile modulus and impact strength have been summarised in Table 6.4. The tensile
strength increased with an increase in the loading of Hal nanotubes. Tensile strength
of Hal-PLA nanocomposites with 2 wt% of APTES modified Hal nanotubes is 55.9
MPa which is 15% higher than pure PLA. Tensile strength further increased to 62.6
MPa for 4 wt% of silane modified Hal nanotubes i.e. 26.5% higher than pure PLA.
This may be due to the presence of hydroxyl groups on the APTES modified Hal
nanotubes which results in more hydrogen bond interactions between the modified
Hal nanotubes and PLA matrix and consequently mHal are more uniformly dispersed
across the PLA matrix. Thus, mHal are more effective in improving the mechanical
properties of Hal-PLA nanocomposites. However, higher loading of Hal nanotubes
led to decreased tensile strength.
In case of 8 wt% addition of APTES modified and unmodified Hal nanotubes into
PLA show decreased tensile strength by more than 15%. This is mainly due to
aggregation of Hal nanotubes across the PLA matrix which enhances the formation of
stress concentration points lead to reduce mechanical properties (Liu et al., 2013). The
decreased tensile strength of Hal-PLA nanocomposites with higher loading of Hal
nanotubes may be due to the weakening of interfacial hydrogen bonding and also due
to more agglomeration (as shown in the morphology results of Fig. 6.4). The

133
agglomeration of Hal nanotubes acts as the stress-concentration points which
decreases the tensile strength. These observations corroborate the results obtained
from FTIR and FE-SEM analyses. Thus, Hal nanotubes above 4 wt% decreased the
tensile strength by more than 15%. Similar results have been reported (Du et al.,
2006; Evagelia et al., 2011). Even a smaller loading (2 wt%) of nanosilica into PLA
matrix increased the tensile strength and modulus by 15% and 37% respectively as
compared to pure PLA (Evagelia et al., 2011).
Fig. 6.6 Tensile strength of unmodified and APTES modified Hal-PLA
nanocomposites
Tensile modulus (Fig. 6.7) increased gradually with the loading of Hal nanotubes into
the PLA matrix. Tensile modulus increased to 1270 MPa for 8 wt% of APTES
modified Hal nanotubes into PLA, which is 20% higher than pure PLA and
approximately 5% higher than the unmodified Hal-PLA nanocomposites. Similar
observations were reported by many other researchers (Wu et al., 2013). Prashantha et
al. (2011) reported that the tensile strength and modulus increased from 22 to 35%
0
10
20
30
40
50
60
70
0 2 4 6 8
Pure PLA uHal mHal
Hal nanotubes loading (wt%)
Ten
sile
str
ength
(M
Pa)

134
and 32 to 40% respectively, with the addition of quaternary ammonium salts modified
Hal nanotubes into PP matrix as compared to pure PP. The addition of MAPTS (3-
(trimethoxysilyl) propyl methacrylate) modified Hal nanotubes into polyamide 6
(PA6) matrix resulted in a significant improvement in the tensile properties, where the
tensile strength increased by 21% with the addition of 10 wt% MAPTS modified Hal-
PA6 nanocomposites as compared to unmodified Hal-PA6 nanocomposites (Guo et
al., 2009).
Fig. 6.7 Tensile modulus of Hal nanotubes (unmodified (uHal) and APTES modified
Hal nanotubes (mHal)) PLA nanocomposites
Percentage of elongation at break are summarised in Table 6.4. Elongation at break
increased significantly both for the unmodified and APTES modified Hal nanotubes
(4 wt%) reinforced PLA nanocomposites as compared to pure PLA. Elongation at
break reached 15.6% with the addition of 4 wt% APTES modified Hal nanotubes
which is 50% higher than pure PLA.
0
200
400
600
800
1000
1200
1400
0 2 4 6 8
Pure PLA uHal mHal
Hal nanotubes loading (wt%)
Ten
sile
mod
ulu
s (M
Pa)

135
An increase in the elongation at break clearly shows that the added Hal nanotubes
(both unmodified and APTES modified) into PLA matrix act as plasticizer and
dissipate the energy during fracture. Similar results were reported by Liu et al. (2013),
where they noticed that the elongation at break increased significantly (>90%) with
the addition of 20phr of unmodified Hal nanotubes into PLA matrix as compared to
pure PLA. However, elongation at break reduced with the addition of Hal nanotubes
above 20phr which clearly shows that small quantities of Hal nanotubes act as
plasticizer of PLA.
Table 6.4 Mechanical properties of Hal nanotubes (unmodified and APTES modified)
PLA nanocomposites (data in the parentheses indicate the standard deviation)
S.
No.
Sample Hal
loading
(wt%)
Tensile
strength
(MPa)
Elongation
at break
(%)
Tensile
modulus
(MPa)
Impact
strength
(J/m)
1 Pure PLA 0 49.5 9.2 (0.5) 1052 21.4
2 2uHal 2 51.8 10.5 (0.4) 1088 22.6
3 2mHal 2 55.9 13 (0.5) 1104 25.6
4 4uHal 4 54.8 12.9 (0.2) 1152 25.9
5 4mHal 4 62.6 15.6 (0.2) 1198 29.8
6 6uHal 6 54.7 9.1 (0.4) 1185 29.4
7 6mHal 6 55.4 9.5 (0.5) 1208 30.3
8 8uHal 8 52.7 9.5 (0.2) 1225 23.9
9 8mHal 8 53.3 10.3 (0.2) 1270 24.8

136
The impact strength of unmodified and APTES modified Hal nanotubes reinforced
PLA nanocomposites measured according to ASTM 256 and the results have been
shown in Fig. 6. 8. The impact strength for the Hal-PLA nanocomposites increased by
loading Hal nanotubes into PLA matrix and it was higher than pristine PLA. For
instance, the impact strength of 6 wt% mHNT loading was 30.3 J/m, which is 41.5%
higher than pure PLA. However, a further increase in Hal nanotubes loading (8 wt%)
to PLA led to a decrease (up to 25%) in the impact strength, which may be due to
more aggregation of Hal nanotubes as well as poor interactions between Hal
nanotubes and PLA.
Fig. 6.8 Impact strength of Hal nanotubes (unmodified (uHal) and APTES modified
(mHal)) PLA nanocomposites
Similar results were reported by Albdiry and Yousif (2013), where they noticed that
the impact strength increased by 50% with the addition of 3 wt% APTES modified
Hal nanotubes into unsaturated polyester as compared to neat unsaturated polyester.
But, a further addition of Hal nanotubes decreased the impact strength of the CPN.
0
5
10
15
20
25
30
35
0 2 4 6 8
Pure PLA uHal mHal
Loading of Hal nanotubes (wt%)
Imp
act
str
ength
(J/m
)

137
Liu et al. (2013) reported that the flexural and impact strength increased by 34% and
70% respectively with the addition of 30 phr of unmodified Hal nanotubes into PLA
matrix as compared to pure PLA. However, a further addition of Hal nanotubes into
the PLA matrix caused a reduction in the flexural and impact strength by 10% and
50% respectively. Lin et al. (2011) also reported similar results, where they noted that
the addition of 5 wt% Hal nanotubes into polystyrene increased the impact strength by
300%. However, a further addition of Hal nanotubes (10 wt%) decreased the impact
strength by 150%.
6.6 DMA analysis
The visco-elastic properties of unmodified and APTES modified Hal nanotubes filled
PLA polymer nanocomposites were studied by dynamic mechanical analysis. This
study is useful to evaluate the performance of materials under stress and temperature.
The dynamic mechanical properties of 4 and 8 wt % of both the unmodified and
APTES modified Hal nanotubes reinforced PLA nanocomposites as well as pure PLA
were studied in terms of storage modulus (E') and damping factor (tan δ) as a function
of temperature and the obtained results have been represented in Figs. 6.9 and 6.10.
At room temperature the Hal-PLA nanocomposites exhibit higher storage modulus
(Fig. 6.9 and Table 6.5) as compared to pure PLA. The APTES modified Hal-PLA
nanocomposites show higher storage modulus than unmodified Hal nanotubes and
pure PLA. This is a clear evidence for the better dispersion of Hal nanotubes across
the PLA matrix. APTES modified Hal nanotubes fillers have good interaction with
PLA matrix and lead to the formation of stiffened interphase, which restricts the
mobility of polymer chains resulting in an increase in the storage modulus.

138
Fig. 6.9 storage modulus of Hal (unmodified (uHal) and APTES modified (mHal))
PLA nanocomposites
Storage modulus increased by more than 15% with the addition of 4 wt% of APTES
modified Hal nanotubes as compared to pure PLA. Surprisingly there is only a slight
increase (<5%) in the storage modulus with the addition of APTES modified Hal-PLA
nanocomposites as compared to unmodified Hal nanotubes. A further addition of
APTES modified Hal nanotubes (8 wt%) led to a decrease in the modulus, may be due
to an increase in the aggregation of fillers. Filler aggregation in the CPN causes stress
concentration points which lead to decrease the mechanical properties (Liu et al.,
2013; Khonakdar, 2015). The elastic properties of CPN are measured by tan δ, which
is the ratio of energy dissipated (loss modulus) to energy stored (storage modulus) per
cycle. Hence, the elastic property of a material is inversely propositional to tan δ. The
glass transition temperature (Tg) is determined by the maximum peak of tan δ with
respect to temperature (Fig. 6. 10).
0.00E+00
5.00E+08
1.00E+09
1.50E+09
2.00E+09
2.50E+09
3.00E+09
3.50E+09
35 45 55 65 75 85 95 105 115
Pure PLA 4uHal 4mHal 8uHal 8mHal
Sto
rage
mod
ulu
s (P
a)
Temperature (oC)

139
The Tg of Hal-PLA nanocomposites is higher as compared to pure PLA due to the
addition of unmodified Hal nanotubes into the PLA matrix which restricts the
mobility of polymer chains resulting into an increase in Tg (Khonakdar, 2015).
Fig. 6.10 Comparison of Tan delta values of Hal nanotubes (unmodified (uHal) and
APTES modified (mHal)) PLA nanocomposites
However, this is not the case with APTES modified Hal-PLA nanocomposites, where
a slight reduction in the Tg was observed as compared to pure PLA (Table 6.5). This
again confirms the improvement in the elasticity of CPN with APTES modified Hal
nanotubes which is in agreement with the tensile properties. Similar results have been
reported by Rong et al. (2001), where they noticed that Tg of pure PP was 19.45 o
C,
but with the addition of 1 wt% clay filler Tg reduced to 12.54 oC. Pasbakhsh et al.
(2010) and Shelley et al. (2001) were also reported similar reductions in the Tg with
the addition of surface modified clay fillers into EPDM and nylon-6 CPN.
0
0.2
0.4
0.6
0.8
1
1.2
1.4
1.6
1.8
30 40 50 60 70 80 90 100 110 120
Pure PLA 4uHal 4mHal 8uHal 8mHal
Temperature (oC)
Tan
δ

140
Table 6.5 storage modulus (at room temperature) and peak temperature of tan δ (Tg)
of Hal nanotubes (unmodified (uHal) and APTES modified (mHal)) PLA
nanocomposites
S. No. Pure PLA 4uHal 4mHal 8uHal 8mHal
Storage modulus (GPa) 2.69 2.98 3.06 2.92 2.37
Tg (oC) 66.7 70.8 66.3 74.3 69.98
6.7 TGA analysis
The thermal stability of unmodified and APTES modified Hal nanotubes and their
PLA nanocomposites were studied by TGA and the results have been reported in
Figs. 6.11 and 6.12 and Table 6.6). The first mass loss for the unmodified Hal (uHal)
reinforced PLA nanocomposites is in the temperature range from 60 to 180 oC (Fig.
6.11).
Fig. 6.11 TGA curves of (A) unmodified (uHal) and (B) APTES modified Hal
nanotubes (mHal)
70
80
90
100
30.3 144.78 269.07 397.01 521.53 647.57 773.83
uHal mHal
Temperature (oC)
Rel
ati
ve
mass
(w
t%)

141
This mass loss corresponds to the evaporation of absorbed water from the surface and
internal channels of Hal nanotubes. However, this mass loss curve has not been
observed in case of APTES modified Hal nanotubes. This proves that the
modification of Hal nanotubes with APTES leads to more water repellent property.
The second mass loss in the temperature range between 200 and 330 oC is associated
with the decomposition of hydrogen bond of Hal nanotubes by the secondary
interaction or grafting onto Al-OH and Si-O-Si on the inner or outer surface of Hal
nanotubes. These hydrogen bonds are much less thermally stable than the covalent
bonding (Yuan et al., 2008). The final mass loss peak could be seen approximately
from 330 to 550 oC which is related to the dehydroxylation of the residual structure of
Al-OH and Si-O-Si groups of the inner and outer surface of Hal nanotubes (Yuan et
al., 2008; Albdiry and Yousif, 2014; Carli et al., 2014).
It is also worth mention that APTES modified Hal nanotubes show higher mass loss
as compared to unmodified Hal nanotubes. This is due to the decomposition of
organic compounds of the APTES grafted onto Hal nanotubes. This again confirms
the successful grafting of APTES with Hal nanotubes. Similar results have been
reported by other researchers (Yuan et al., 2008; Barrientos-Ramirez et al., 2011;
Carli et al., 2014). Thermal stability of both APTES modified and unmodified Hal
nanotubes (4 and 8 wt%) filled PLA nanocomposites was studied (Fig. 6.12). The
characteristic mass loss temperatures obtained from the TGA curves have been
summarized in Table 6.6. The characteristic temperature at which 5% and 10% mass
loss occurs is essential to evaluate the thermal stability of Hal-PLA nanocomposites.
The obtained data reveal that the loading of unmodified Hal nanotubes and APTES
modified Hal nanotubes have significant impact on the thermal stability of the
resultant CPN. For pure PLA, 5% mass loss occurs at a temperature of 320 oC.

142
Fig. 6.12 TGA curves of Hal nanotubes (modified and unmodified) PLA
nanocomposites
However, the same mass loss of 5% occurs when the temperature was increased to
330 oC, an increase of 10
oC by using 4 wt% unmodified Hal nanotubes filled CPN as
compared to pure PLA (Table 6.6). This temperature is further increased to 337 oC,
an increase of 17 o
C for the CPN filled with 4 wt% APTES modified Hal nanotubes.
Gilman (1999) reported that the thermal barrier of Hal nanotubes in the Hal-PLA
nanocomposites protects the PLA polymer from contacting with fire which slows
down the degradation of PLA during the degradation of CPN. It is also reported that
the degradation products of polypropylene polymer may be entrapped inside the
lumens of Hal nanotubes, resulting in an effective delay in mass transfer which
remarkably improves the thermal stability of the nanocomposites (Du et al., 2006). It
is mentioned that the intercalated layered silicate nanofillers had much better effects
on the thermal stability of polymer matrix than the exfoliated layered silicate
nanofillers (Gilman, 1999; Wang and Huang, 2013).
0
20
40
60
80
100
120
30 80 130 180 230 280 330 380 430 480 530 580
Pure PLA 4uHal 4mHal 8uHal 8mHal
Temperature (oC)
Rel
ati
ve
mass
(w
t %
)

143
Table 6.6 Thermal properties of Hal nanotubes (unmodified (uHal) and APTES
modified (mHal)) PLA nanocomposites
S. No. Sample Hal nanotubes
loading (wt %)
T5% mass
loss (oC)
T10% mass
loss (oC)
Tmax mass
loss (oC)
1 Pure PLA 0 320 328 370
2 2uHal 2 325 333 375
3 2mHal 2 326 335 376
4 4uHal 4 330 338 377
5 4mHal 4 337 343 378
6 6uHal 6 329 337 374
7 6mHal 6 332 341 375
8 8uHal 8 328 336 373
9 8mHal 8 318 331 376
However, a further increase in Hal nanotubes (˃6 wt%) decreased the thermal
stability which is similar to the results observed in the previous investigations. A
decrease in the thermal stability with a relatively higher Hal nanotubes loading due to
the fact that Hal nanotubes started degradation at above 400 oC which caused higher
weight loss. This is in agreement with the previous reported studies of
PLA/montmorillonite (Jiang et al., 2007; Chen et al., 2015).
6.8 DSC analysis
PLA is a semicrystalline polymer and its mechanical and thermal properties depend
on its crystal microstructure. Enhancement of crystallinity of PLA is an important task
for its easy processability. It is reported that the addition of Hal nanotubes into PLA

144
increased the crystallinity of Hal-PLA nanocomposites. The cold crystallisation peak
of PLA (Tcc) shifted to lower temperature with the addition of Hal nanotubes into
PLA (Fig. 6.13 and Table 6.7).
The Tcc of 4 wt% loading of mHal was at 122.8 o
C, which was 9.8 oC lower than 2
wt% loading of Hal nanotubes. The heterogeneous nucleating effect can be observed
with the addition of Hal nanotubes on the PLA (Kontou et al., 2011; Liu et al., 2013;
Wang and Qiu, 2011). With a small amount of Hal nanotubes, the nucleating effect of
Hal nanotubes dominates and increases the cold crystallinity temperature. In case of
higher loading of Hal nanotubes, the restriction of mobility of chains dominates in the
PLA matrix which leads to decrease the crystallinity temperature.
Fig. 6.13 DSC curves of Hal nanotubes (unmodified (uHal) and APTES modified
(mHal)) PLA nanocomposites
Hal nanotubes play a dual role of improving the crystallinity of Hal-PLA
nanocomposites. On one hand, it acts as a nucleating agent and on the other hand, the
strong hydrogen bond interactions between Hal nanotubes and PLA chains restrict the
-10
-8
-6
-4
-2
0
2
4
6
32.9 64 99.3 134.9 170.9
Pure PLA PLA4uHal PLA4mHal
Temperature (oC)
Hea
tflo
w (
mW
) ex
o
T
Tcc
Tm

145
mobility of PLA chains. According to the reports by Krikorian and Pochan, (2005)
and Liu et al., (2009) the exfoliated Hal/PLA nanocomposites form stable intercalated
tactoids which act as heterogeneous nucleation sites, which significantly lower the
crystallisation temperature. Addition of Hal nanotubes into PLA matrix increased the
percentage crystallinity (%Xc).
Table 6.7 DSC results of Hal nanotubes (unmodified (uHal) and APTES modified
(mHal)) PLA nanocomposites
S. No. Sample Hal nanotubes loading
(wt%)
Tg
(oC)
Tcc
(oC)
Tm
(oC)
Xc
(%)
1 Pure PLA 0 58.4 117.9 153 15.25
2 2uHal 2 59.1 115.8 148.6 22.9
3 2mHal 2 59.7 116.2 151.34 17.20
4 4uHal 4 59.8 111.2 150.34 23.8
5 4mHal 4 60.2 106.4 150.25 19.82
6 6uHal 6 61.1 105.5 149.5 25.2
7 6mHal 6 61.8 105.18 149.0 23.5
The crystallinity increased significantly by 65% with the addition of 6 wt% of Hal
nanotubes into Hal/PLA nanocomposites. A significant increase in the crystallinity
(by 65%) could be seen in the Hal/PLA nanocomposites with the addition of Hal
nanotubes due to nucleating effects. However, in case of APTES modified Hal/PLA
nanocomposites, percentage of crystallinity slightly reduced with an increase in the
loading of Hal nanotubes. This may be due to increased covalent bonding between
Hal nanotubes and PLA matrix which leads to restricting the mobility of PLA

146
polymer chain around the Hal nanotubes and the crystal growth was retarded. Glass
transition temperature (Tg) also increased by increasing the loading of Hal nanotubes
in the Hal-PLA nanocomposites. All the Hal nanotubes filled CPN showed higher Tg
at 59.7 oC, 60.2
oC and 61.8
oC for 2, 4 and 6 wt % of APTES modified Hal nanotubes
respectively as compared to pure PLA. This supports the restriction of mobility in the
polymer chain induced by the addition of Hal nanotubes and also the effective
interfacial interaction between the Hal nanotubes and PLA matrix (Rittigstein et al.,
2007).
6.9 Conclusions
In this investigation, halloysite (Hal) nanotubes were surface modified with 3-
aminopropyltriethoxysilane (APTES) to enhance the surface interaction of Hal
nanotubes with PLA and to achieve a good dispersion of Hal nanotubes across the
PLA matrix. FTIR, Nitrogen adsorption-desorption analysis and FE-SEM with EDX
analysis confirmed not only the grafting of APTES at the edges and surface of Hal
nanotubes, but also confirmed the hydrogen bond interactions between PLA and Hal
nanotubes. Morphological studies of the PLA nanocomposites with APTES modified
Hal nanotubes using FE-SEM revealed good dispersion of nanofillers into PLA which
lead to improving the mechanical and thermal properties. Tensile strength and
modulus increased significantly by 26.5% and 20% with the addition of 4 and 8 wt%
of APTES modified Hal nanotubes respectively as compared to pure PLA. Impact
strength of 4 wt% APTES modified Hal-PLA nanocomposites was 29.8 MPa, which
is 20% higher than the unmodified Hal-PLA nanocomposites and 40% higher than the
pure PLA. DMA results showed a considerable increase (>10%) in the storage
modulus after the addition of silane treated Hal nanotubes as compared to pure PLA.
Thermal stability also increased by 17 oC as compared to pure PLA.

147
CHAPTER VII
Results and Discussion: Sisal-PP Composites
7.1 FE-SEM analysis
The morphology of untreated, alkali and HIU treated short sisal fibre reinforced PP
(SF/PP) composites was studied by examining the fractured surfaces of tensile tested
samples using FE-SEM. FE-SEM micrographs of fracture surface of untreated and
treated SF/PP composites (containing 30 wt%) have been shown in Fig. 7.1. It could
be seen that the sisal fibres are in unidirectional and well dispersed throughout PP
matrix. Untreated SF/PP composites (Fig. 7.1A) exhibit fibre debonding due to the
accumulation of moisture at the interface specifically from the surface of sisal fibres.
It also indicates the number of voids between the fibre and matrix which is the
evidence of poor adhesion responsible for the reduction in the mechanical properties.
However, reduction of voids for alkali and HIU SF/PP composites confirmed the
removal of amorphous materials after the treatment (Figs. 7.1B, 7.1C and 7.1D). HIU
treated sisal fibre composites showed good dispersion across the matrix and the
reduction of voids resulting in good mechanical properties (Fig. 7.1B). Morphology
of alkali treated sisal fibre composites exhibits good dispersion as well as improved
adhesion between fibre and matrix phase (Fig. 7.1C). Fig. 7.1D shows the FE-SEM
image of combined alkali and HIU treated SF/PP composites. It could be seen that the
fibres are well separated with the combined treatment of alkali and HIU which leads
to enhancing the reactive surface area and resulting into good adhesion between fibre
and matrix.

148
Fig. 7.1 FE-SEM micrographs of impact fractured SF/PP composites (A) Untreated
(UT), (B) HIU treated (ULT), (C) Alkali treated (ALKT), (D) Combined treatment of
alkali and HIU (ALKT-ULT)
7.2 Tensile properties
Tensile properties were studied to understand the effects of fibre loading and surface
treatments on the mechanical properties of SF/PP composites. Tensile properties
(tensile strength, modulus and elongation) of untreated and HIU treated, alkali treated
and the combination of alkali and HIU treated SF/PP composites have been shown in
Figs. 7.2, 7.3 and 7.4. It could be seen that the tensile strength is higher for 10 wt%
fibre loading as compared to 15, 20 and 30 wt%. This is may be due to more number

149
of voids with higher filler content as well as weak interfacial adhesion between the
hydrophilic filler and the hydrophobic polymer matrix with higher percentage of filler
loading. Similar observations were found by other researchers. Paraparita et al. (2014)
found that the tensile strength decreased significantly by more than 40% for 30 wt%
of filler loading. Demir et al. (2006) observed a reduction in the tensile strength by
41% with more than 15 wt% of fibre loading in luffa fibres reinforced PP composites.
Das and Satapathy (2011) observed similar results with cenosphere fibres reinforced
PP composites. They indicated that the tensile strength decreased by the addition of
filler. However, tensile modulus increased by more than 35% with the addition of 20
wt% of fibre fillers.
Fig. 7.2 Tensile strength of untreated and treated sisal fibre reinforced PP composites
1) Untreated (UT) 2) HIU treated (ULT) 3) Alkali treated (ALK) 4) combined
treatment of alkali and HIU (ALK-ULT)
It could be seen from the Fig. 7.2 the tensile strength of pure PP was 33.18 MPa. With
the addition 10 wt% of untreated sisal fibres into PP matrix leads to significant
0
5
10
15
20
25
30
35
40
0 10 15 20 30
Pure PP UT +PP ULT +PP ALK + PP ALKULT + PP
Fibre loading (wt %)
Ten
sile
str
ength
(M
Pa)

150
reduction of tensile strength by 67%. This is mainly due to presence of amorphous
materials on the surface of the sisal fibres which are the responsible for water
absorption and causing incompatibility with PP matrix which results of reduced
mechanical properties. However, a significant increment of tensile strength could be
observed with the addition of surface treated sisal fibres. Addition of 10 wt% of the
combination of alkali and HIU treated sisal fibres into PP matrix increased the tensile
strength by 25% as compared to untreated sisal fibre reinforced PP composites (Fig.
7.2). This is mainly due to an increase in the adhesion between treated fibres and
matrix materials owing to the removal of amorphous materials by alkali and HIU
treatments from the fibre surface whereby the fibre surface becomes clean and rough.
Removal of amorphous materials from the fibre surface also reduces the moisture
absorption which leads to an increase in the tensile strength and modulus of the fibre
reinforced composites. Similar to tensile strength, elongation at break significantly
decreased as the filler content increased (Fig. 7.3). Percentage elongation decreased
by more than 65% with the addition of 10 wt% of untreated sisal fibres. This may be
due to the restriction of molecular mobility with an increase in the filler in the matrix.
However, only 35% of elongation at break was reduced for the combined treated
alkali and HIU treated sisal fibres as compared to pure PP composites. This indicates
that after the combined treatment with alkali and HIU, fibres surface become
hydrophobic which improved the compatibility between fibre materials and
hydrophobic polymer matrix. However, with higher filler content above 10 wt%,
elongation decreased to the maximum of 80 % for 30 wt% of filler loading. This may
be due to an increase in the fibre agglomeration and voids which lead to decrease the
elongation.

151
Tensile modulus of untreated, HIU treated, alkali and the combination of alkali and
HIU treated SF/PP composites is shown in Fig. 7.4. Tensile modulus significantly
increased by more than 55% for 30 wt% addition of sisal fibres with the combined
treatment of alkali and HIU as compared to pure PP. It is to be noted that the tensile
modulus increased gradually with the addition of sisal fibres from 10 wt% onwards.
Fig. 7.3 Elongation at break of untreated and treated sisal fibre reinforced PP
composites
Combination of alkali and HIU treated SF/PP composites show a significant
increment in tensile modulus. This indicates that after the combined treatment of
alkali and HIU a good interaction occurs between the sisal fibres and PP matrix which
resulting into a good dispersion of fibre materials across the matrix and leads to an
enhancement in the material stiffness. Kaewkuk et al. (2013) reported that the tensile
modulus increased by two-fold for alkali treated SF/PP composites as compared to
untreated fibres and considerable improvement was observed in the tensile strength
for alkali treated sisal fibres. Elongation at break was reduced with increasing the
0
5
10
15
20
25
0 10 15 20 30
Pure PP UT ULT ALKT ALKTULT
Fibre loading (wt %)
Elo
ngati
on
at
bre
ak
(%
)

152
filler content. However, it slightly increased with alkali treated fibres composites as
compared to untreated fibres.
Arrakhiz et al. (2012) and Elkhaoulani et al. (2013) studied the effects of alkali
treatments on the mechanical and thermal properties of natural fibre reinforced
polymer composites. They observed that the tensile modulus increased significantly
by 145% with the addition of 30 wt% of treated Doum fibres reinforced low density
polyethylene as compared to pure matrix. However, tensile strength significantly
decreased with an increase in the filler. Mohan and Kanny (2012) reported that after
alkali treatment tensile modulus increased by 30% with 20 wt% of filler content.
Mwaikambo et al. (2007) reported that after alkali treatment the hemp fibres
reinforced euphorbia composites showed an increase in the tensile strength and
modulus by 31 and 13% respectively as compared to the untreated fibres.
Fig. 7.4 Tensile modulus of untreated and treated sisal fibre reinforced PP composites
0
100
200
300
400
500
600
700
800
900
0 10 15 20 30
Pure PP UT ULT ALKT ALKTULT
Ten
sile
mod
ulu
s (M
Pa)
Fibre loading (wt %)

153
7.3 TGA analysis
The effect of different surface treatments on the thermal stability of SF/PP composites
was evaluated. Fig. 7.5 shows the TGA curves of pure PP, untreated and different
surface treated SF/PP composites. Relatively a small degradation could be observed
for the SF/PP composites in the temperature range from 90 to 150
oC are due to the
presence of moisture in sisal fibres. However, this step could not be seen in case of
pure PP. Pure PP has single stage degradation in the temperature range between 330
and 460 oC with the maximum degradation occurred at 450
oC.
Fig. 7.5 TGA of untreated (UT), HIU treated (ULT), alkali treated (ALK) and the
combination of alkali and HIU treated (ALKULT) SF/ PP composites
As seen in the Fig. 7.5, the thermal stability reduced significantly in the temperature
range from 250 to 430
oC for the PP composites reinforced with untreated and surface
treated sisal fibres as compared to pure PP. For instance, 10% weight loss could be
noticed at 371.5 oC for the untreated SF/PP composites which is 28.5
oC higher than
pure PP. This could be due to the presence of amorphous materials such as
0
10
20
30
40
50
60
70
80
90
100
110
30 80 130 180 230 280 330 380 430 480 530 580
Pure PP PP+UT PP+ULT
PP+ALK PP+ALKULT
Rel
ati
ve
wei
gh
t (w
t%)
Temperature (oC)

154
hemicellulose, pectin and lignin in the untreated sisal fibres which are low in thermal
stability as compared to pure PP matrix and thus leads to faster thermal degradation.
Similar results were reported by other researchers.
Essabir et al. (2013b) studied the mechanical and thermal properties of PP based
composites reinforced with argan particle net shells and observed that the thermal
stability of argan particle reinforced PP composites was considerably reduced which
is mainly due to the presence of amorphous materials on the surface of untreated
fibres. Arrakhiz et al. (2012) studied the effect of different surface treatments (alkali,
etherification and esterification treatments) on the mechanical and thermal properties
of alfa fibre reinforced PP composites and reported a significant increment in the
thermal stability for the surface treated alfa fibre reinforced PP composites as
compared to untreated alfa fibre composites. The esterification (combination of alkali
and ethyl ether) treatment showed better in removing the amorphous materials from
the surface of alfa fibres and resulted in improving the thermal stability.
However, in case of surface treated sisal fibres (HIU (ULT), alkali (ALK) and the
combination of alkali and HIU treated (ALKULT)) reinforced PP composites showed
a marginal high thermal stability as compared to untreated SF/PP composites.
Combination of alkali and HIU treated SF/PP composites showed 10% weight loss
temperature at 372 oC which is 8
oC higher than untreated SF/PP composites. A
significant increment in the thermal stability for the combination of alkali and HIU
treated SF/PP composites proves that the amorphous materials from the surface of
sisal fibres were removed significantly thereby increased the number of cellulose
molecules on the surface of sisal fibres.

155
Kaewkuk et al. (2013) studied the effect of interfacial modification on the physical
properties of SF/PP composites and found that alkali treated SF/PP composites
showed higher thermal stability by more than 10 oC as compared to untreated SF/PP
composites. Oza et al. (2014) also studied the effect of fibre surface treatment on the
thermal stability of hemp fibres reinforced PLA composites and reported that the
alkali treated hemp fibres reinforced PLA composites showed higher thermal stability
by more than 6 oC as compared to untreated hemp fibres reinforced PLA composites.
They also indicated that the increased thermal stability for the alkali treated fibre
composites is due to the mercerisation which removed the amorphous materials from
the surface of fibres and exposed more number of cellulose molecules.
7.4 DSC analysis
Pure PP, sisal fibres with surface treated and untreated reinforced PP composites were
subjected to DSC analysis to evaluate the crystallisation and thermal properties. Figs.
7.6 and 7.7 show the DSC thermograms of melting endotherm and cooling exotherm
curves of PP and their sisal fibre composites with untreated and different surface
treatments respectively. From Fig. 7.7, only a marginal effect of crystallisation
temperature (Tcc) with the addition of fibres into PLA matrix could be noticed.
However, melting temperature (Tm) increased with the addition of surface treated
fibre to PP matrix. The combination of alkali and HIU treated SF/PP composite
displayed a melting temperature around 166.25 oC which is 3.1
oC higher as compared
to pure PP. This observation of higher melting temperature after the addition of
surface treated sisal fibre is due to an increased interfacial adhesion between the
surface treated sisal fibres and PP matrix.

156
Fig. 7.6 DSC endothermic heating curves of untreated (UT), HIU treated (ULT),
alkali treated (ALK), and the combination of alkali and HIU treated (ALKULT)
SF/PP composites
Similar results have been reported by Joseph et al. (2003) where they noted an
increase in the melting temperature by 14 oC after the addition of sisal fibres treated
with maleic anhydride into PP composites. The percentage of crystallinity (Xc) shows
that the pure PP has highest percentage of crystallinity which was 43.68%. However,
loading of small quantity (10 wt%) of untreated sisal fibres into PP matrix results of
disturbed in the crystalline structure of PP polymer which leads to significant
reduction of percentage of crystallinity to 30.35%. However, addition of surface
treated sisal fibres into PP leads to a considerable increment in the percentage of
crystallinity could be observed. The percentage of crystallinity (Xc) is correlated with
mechanical properties. In case of tensile strength, tensile strength of pure PP was
slightly more than 33 MPa. With the addition 10 wt% of untreated sisal fibres into PP
-25
-20
-15
-10
-5
0
5
31.57 54.76 80 107.5 135 162.5 190
Pure PP PP+UT PP+ULT
PP+ALK PP+ALKULT
Temperature (oC)
Hea
t fl
ow
(m
W)
e
xo

157
matrix leads to significant reduction of tensile strength by 67%.
Fig. 7.7 DSC exothermic cooling curves of untreated (UT), HIU treated (ULT), alkali
treated (ALK), and the combination of alkali and HIU treated (ALKULT) SF/PP
composites
Table 7.1 Thermal properties of PP and untreated and different surface treated SF/PP
composites
S. No. Samples Tc (oC) Tm (
oC) Xc (%)
1 Pure PP 119.15 166.25 43.68
2 10UT+PP 119.45 166.34 30.35
3 10ULT+PP 120.62 167.01 32.40
4 10ALK+PP 120.37 168.08 35.63
5 10ALKULT+PP 120.85 169.35 38.13
-20
-15
-10
-5
0
5
10
15
20
25
30
198.5 178.24 147.74 117.5 90 62.5 35
Pure PP PP+UT PP+ULT
PP+ALK PP+ALKULT
Temperature (oC)
Hea
t fl
ow
(m
W)
e
xo

158
This is mainly due to presence of amorphous materials on the surface of the sisal
fibres which are the responsible for water absorption and causing incompatibility with
PP matrix which results of reduced mechanical properties. However, a significant
increment of tensile strength could be observed with the addition of surface treated
sisal fibres. Addition of 10 wt% of the combination of alkali and HIU treated sisal
fibres into PP matrix increased the tensile strength by 25% as compared to untreated
sisal fibre reinforced PP composites. Increased tensile strength with the addition of
combined treated sisal fibres confirms the removal of amorphous materials and
increased the compatibility between sisal fibres and PP matrix. Increased the tensile
strength for the combined treated sisal fibres also confirms the increased cellulose
content.
7.5 DMA analysis
Storage modulus (E') is defined as the maximum energy stored during one cycle of
oscillation. It also gives the material stiffness with the variation of temperature and
load bearing capacity of the composite materials (Shinoj et al., 2011). Fig. 7.8 shows
the variations in the storage modulus of pure PP and untreated and different surface
treated SF/PP composites with the fibre loading of 10 wt%. As seen in Fig. 7.8, at
lower temperature the storage modulus (E') for pure PP and their composites filled
with different surface treated sisal fibres exhibited higher values. It is worth noted that
the storage modulus increased with the addition of sisal fibres into PP polymer. For
instance, the storage modulus was 3.5 GPa for pure PP at -51 oC. However, the
storage modulus increased marginally to 4 GPa with the addition of 10 wt% of
untreated sisal fibres into PP matrix. The increased storage modulus with the
incorporation of sisal fibres is due to the reinforcement effect of the fibres that

159
allowed good stress transfer at the fibre-matrix interface in the composites (Joseph et
al., 2003; Idicula et al., 2005; Vilay et al., 2008; Essabir et al., 2013a).
Fig. 7.8 Storage modulus (E') of untreated (UT), HIU treated (ULT), alkali treated
(ALK), and the combination of alkali and HIU treated (ALKULT) SF/PP composites
In case of alkali treated and the combination of alkali and HIU treated SF/PP
composites, the storage modulus (E') significantly increased by 27.5% and 50%
respectively as compared to pure PP. These results proved that sisal fibres treated with
alkali and the combination of alkali and HIU show better compatibility with polymer
matrix and increased the interfacial adhesion as compared to untreated SF/PP
composites (Pothan et al., 2006; Li et al., 2011; Sreenivasan et al., 2015).
Table 7.2 Storage modulus of SF/PP composites
Properties
at 30oC
Pure PP PP + UT PP + ULT PP + ALK PP + ALKULT
Storage modulus 1.17 1.91 2.0 2.1 2.25
0.00E+00
1.00E+09
2.00E+09
3.00E+09
4.00E+09
5.00E+09
6.00E+09
-50 -30 -10 10 30 50 70 90
Pure PP PP+UT PP+ULT
PP+ALK PP+ALKULT
Sto
rage
mod
ulu
s E
' (M
Pa)
Temperature (oC)

160
A similar trend has been observed by Ray et al. (2002) and Shinoj et al. (2011) for
alkali treated jute fibre reinforced vinyl-ester composites and alkali treated oil palm
fibre reinforced with LLDPE composites respectively. The damping factor (tan δ) is
the ratio of storage modulus and the loss modulus (i.e. E'/E"). Fig. 7.9 shows the
curves of damping factor against temperature for pure PP and untreated as well as
different surface treated SF/PP composites with 10% fibre loading. The damping peak
reduced for sisal fibres composites as compared to pure PP which could be due to the
incorporation of sisal fibres into the polymer matrix which restricts the mobility of
polymer chain and leads to an increase in the storage modulus and a reduction in the
viscoelastic lag between stress and the strain, thereby decreasing the damping factor
with the addition of filler material (Jawaid et al., 2013; Ray et al., 2002; Sreenivasan
et al., 2015).
Fig. 7.9 Tan δ curves of untreated (UT), HIU treated (ULT), alkali treated (ALK), and
the combination of alkali and HIU treated (ALKULT) SF/PP composites
0
0.02
0.04
0.06
0.08
0.1
0.12
-50 -30 -10 10 30 50 70 90
Pure PP PP+UT PP+ULT
PP+ALK PP+ALKULT
Temperature (oC)
Tan
δ

161
It was also found that the peak of damping factor further decreased for the surface
treatment of SF with HIU, alkali and the combination of alkali and HIU treatments.
This further confirms the improved interfacial adhesion between surface treated sisal
fibres and PP matrix after the surface treatment of sisal fibres with the combined
alkali and HIU treatments (Ray et al., 2002; Pothan et al., 2003; Jawaid et al., 2013).
Loss modulus (E") indicates the ability of a material to dissipate the absorbed energy
within it in the form of heat or molecular rearrangements when force is applied. It
shows the viscous nature of the polymer material (Saba et al., 2016). Fig. 7.10 shows
the loss modulus (E") curves of pure PP and untreated as well as different surface
treated SF/PP composites with 10% fibre loading. The results of loss modulus
revealed that the incorporation of sisal fibres into PP matrix leads to an increase in the
loss modulus which is due to the restriction in the molecular motion with an increase
in the filler materials (Khonakdar, 2015; Sreenivasan et al., 2015). Broad peaks could
be noticed in Fig. 7.10 in the temperature range between -20 and 30 oC which
represent the transition from glassy to rubbery state. The maximum temperature peak
of loss modulus represents the maximum energy dissipation during the deformation
occurred. It is observed that E" curves reach maximum peak value and then decreased
sharply with a further increase in the temperature which is due to free molecular
motion of the polymer matrix. However, it is noticed that the sisal fibres composite
obtained by the combination of alkali and HIU shows higher loss modulus (E") by 0.9
GPa as compared to pure PP. This could be due to the increased stiffness after the
combined treatment of alkali and HIU which is also an evidence of good compatibility
between sisal fibres and PP matrix (Sreenivasan et al., 2015).

162
Fig. 7.10 Loss modulus curves of untreated (UT), HIU treated (ULT), alkali treated
(ALK), and the combination of alkali and HIU treated (ALKULT) SF/PP composites
7.6 Water absorption studies
Water absorption characteristics of different weight percentage of untreated, HIU
treated, alkali treated and the combination of alkali and HIU treated SF/PP composites
have been evaluated. Fig. 7.11 shows the effect of water absorption with increased
fibre loading into PP matrix. It can be seen that the water absorption gradually
increased with an increase in the fibre loading. In the initial stage of water immersion
the composites showed very rapid diffusion of water absorption linearly. After
reaching the equilibrium, the water absorption then slowed down and became
constant. These findings indicate that the water absorption of SF/PP composites obeys
the Fick’s law of diffusion. Yew et al. (2005) reported the water absorption and
enzymatic degradation of Polylactide (PLA) composites reinforced with rice starch
where they observed a rapid water absorption in the first few days for the rice starch
0.00E+00
5.00E+07
1.00E+08
1.50E+08
2.00E+08
2.50E+08
-50 -30 -10 10 30 50 70 90
Pure PP PP+UT PP+ULT
PP+ALK PP+ALKULT
Loss
mod
ulu
s E
" (
MP
a)
Temperature (oC)

163
reinforced PLA composites. The water absorption was as high as 5.7% for the fibre
reinforced composites as compared to pure PLA which was 1%.
Fig. 7.11 Effect of fibre loading on the water absorption of untreated SF/PP
composites
Alamri and Low (2013) studied the water absorption properties of cellulose fibre and
nanoclay reinforced epoxy composites where they also noticed that the water
absorption was higher in the initial time of immersion for all the fibre reinforced
epoxy composites and then reached to a saturation point. As seen in Fig. 7.11, the rate
of water absorption significantly increased with the addition of sisal fibres which is
obvious that sisal fibres are hydrophilic in nature due to the presence of amorphous
materials which allow the absorption of water molecules. It is observed that the water
absorption rate increased by 8%, 5.69%, 3.83% and 2.17% with the addition of 30,
20, 15 and 10 wt% of untreated sisal fibres into PP matrix respectively after continued
water immersion for 60 days. Fig. 7.12 shows the comparison of the effect of different
0
1
2
3
4
5
6
7
8
9
0 4 8 12 16 20 24 28 32 36 40 44 48 52 56 60
Pure PP PP+10UT PP+15UT PP+20UT PP+30UT
Wate
r u
pta
ke (
%)
Time (Days)

164
surface treatments of SF/PP composites on water absorption. Rate of water absorption
significantly decreased for the PP composites reinforced with sisal fibres treated with
the combination of alkali and HIU.
Fig. 7.12 Effect of HIU (ULT), alkali (ALK) and the combination of alkali and HIU
(ALKULT) surface treatments on the water absorption of SF/PP composites
Water absorption for the combined alkali and HIU treated sisal fibres reduced to
0.52% which is more than a reduction of 300% as compared to untreated sisal fibre
composites. This proves that the combined treatment of alkali and HIU significantly
removed the amorphous materials from the surface of sisal fibres and increased the
interfacial adhesion between PP matrix and sisal fibres in the composites and is in
agreement with FTIR and FE-SEM results.
Rajesh et al. (2015) studied the effect of different weight percentage and surface
treatments of SF loading on PLA composites and noticed an increase in the rate of
water absorption by more than 9% with the addition of untreated sisal fibres (25 wt%)
0
0.5
1
1.5
2
2.5
0 4 8 12 16 20 24 28 32 36 40 44 48 52 56 60
Pure PP PP+UT PP+ULT PP+ALK PP+ALKULT
Time (Days)
Wate
r u
pta
ke
(%)

165
into PLA matrix. However, the water absorption rate reduced to more than 3% in case
of alkali treated sisal fibres (25 wt%) into PLA matrix. Also, with the addition of 30
wt% of sisal fibres into PP polymer matrix, the water absorption increased
significantly by 600% as compared to 10 wt% of SF/PP composites (Chow et al.,
2007). Mohan and Kanny (2012) studied the effect of alkali and clay treatments on
water absorption for SF/PP composites and observed that the alkali and the
combination of alkali and clay treated SF/PP composites show a considerable
reduction in the water absorption by 8% and 17.6% as compared to untreated SF/PP
composites.
The diffusion properties of SF/PP composites were explained by Fick’s law and the
values of percentage of water absorption and the coefficient of diffusion at room
temperature for the untreated and different surface treated SF/PP composites have
been calculated by using eqns. 3.5 and 3.6 respectively and the obtained results have
been given in Table 7.2. It can be seen that the diffusion coefficient increased with an
increase in the fibre content. The diffusion coefficient increased by 3.42 mm2/sec
with the addition of 30 wt% of untreated sisal fibres into PP matrix, which is 250%
and 190% higher as compared to pure PP and 10 wt% addition of untreated SF/PP
composites respectively. A significant increment in the rate of diffusion coefficient
with higher loading of sisal fibres is due to an increase in the cellulose content.
Similar results were reported by Dhakal et al. (2007a) where they noticed an increase
in the rate of diffusion coefficient significantly by 180% with the addition of 26 wt%
of hemp fibre/unsaturated polyester composites as compared to adding 10 wt% hemp
fibre/unsaturated polyester composites. There is a considerable reduction in the rate of
diffusion coefficient for the surface treated sisal fibre composites as compared to
untreated fibre composites. The combination of alkali and HIU treated SF/PP

166
composites showed a decrease in the diffusion coefficient by 30% as compared to
untreated SF/PP composites.
Table 7.3 Water absorption of SF/PP composites
Samples Fibre
loading
(wt%)
Type of surface
treatments
Maximum
water
absorption
(%)
Initial slope
of plot (k)
M(t) versus
t1/2
Diffusion
coefficient
, D, ×10-3
(mm2/sec)
Pure PP 0 - 0.166 0.0038 0.9561
10UT 10 Untreated 2.176 0.0601 1.5495
15UT 15 Untreated 3.8368 0.0844 2.0451
20UT 20 Untreated 5.69 0.1287 2.6242
30UT 30 Untreated 7.966 0.1937 3.4251
10ULT 10 HIU treated 1.459 0.0378 1.3713
10ALK 10 Alkali treated 0.914 0.0238 1.1873
10ALKULT 10 Alkali + HIU
treated
0.522 0.0105 1.0883
This again proved that the removal of amorphous materials from the surface of sisal
fibres which are mainly responsible for the absorption of water. Mohan and Kanny
(2012) studied the effect of chemical surface treatment on the water absorption of
SF/PP composites where they noticed a reduction in the water absorption by 2.2% for
the surface treated sisal fibre composites as compared to pure PP which is due to an
improved interfacial adhesion between the sisal fibres and the matrix with the removal
of hemicellulose, lignin and pectin from the surface of sisal fibres which are highly

167
hydrophilic in nature. Rajesh et al. (2015) and Yeh et al. (2015) also reported a
significant reduction of water absorption for the chemically surface treated SF/PLA
composites and rice husk/PP composites respectively as compared to their respective
matrix.
7.7 Conclusions
In this investigation, halloysite (Hal) nanotubes were surface modified with 3-
aminopropyltriethoxysilane (APTES) to enhance the surface interaction of Hal
nanotubes with polylactide or poly (lactic acid) (PLA) and to achieve a good
dispersion of Hal nanotubes across the PLA matrix. FTIR, Nitrogen adsorption-
desorption analysis and FE-SEM with EDX analysis confirmed not only the grafting
of APTES at the edges and surface of Hal nanotubes, but also confirmed the hydrogen
bond interactions between PLA and Hal nanotubes. Morphological studies of the PLA
nanocomposites with APTES modified Hal nanotubes using FE-SEM revealed good
dispersion of nanofillers into PLA which lead to improving the mechanical and
thermal properties. Tensile and impact properties significantly increased with the
addition of APTES modified Hal nanotubes into PLA matrix. Tensile strength and
modulus increased significantly by 26.5% and 20% with the addition of 4 and 8 wt%
of APTES modified Hal nanotubes respectively as compared to pure PLA. Impact
strength of 4 wt% APTES modified Hal-PLA nanocomposites was 29.8 MPa, which
is 20% higher than the unmodified Hal-PLA nanocomposites and 40% higher than the
pure PLA. DMA results showed a considerable increase (>10%) in the storage
modulus after the addition of silane treated Hal nanotubes as compared to pure PLA.
Thermal stability also increased by 17 oC as compared to pure PLA.

168
CHAPTER VIII
Results and Discussion: Hal-PP Composites
8.1 FE-SEM analysis
The surface morphology of the impact fractured samples of unmodified and APTES
modified Hal nanotubes reinforced PP nanocomposites was investigated. Figs. 8.1A
and B show the PP nanocomposites reinforced with unmodified and APTES modified
Hal nanotubes respectively. The surface pore analysis, nitrogen absorption-desorption,
FTIR and FE-SEM analysis of unmodified and APTES modified Hal nanotubes were
investigated and discussed in sections 6.2, 6.3, 6.4 and 6.5 respectively.
Fig. 8.1 FE-SEM images of impact factured samples of unmodified (A) and APTES
modified (B) Hal nanotubes reinforced PP nanocomposites
From Fig. 8.1A, it is clearly seen that the filler agglomeration and poor dispersion of
unmodified Hal nanotubes across the PP matrix. As discussed in section 6.3, the filler
agglomeration is due to the poor interfacial interaction between unmodified Hal
A B

169
nanotubes and PP polymer matrix which causes stress concetration and hence leads to
lowering the mechanical and thermal properties of Hal-PP nanocomposites. However,
in case of APTES modified Hal-PP nanocomposites, nanotubes were well-dispersed
across the PP matrix and relatively less agglomeration could be seen as compared to
unmodified Hal-PP nanocomposites (Fig. 8.1B).
Surface modification of Hal nanotubes with APTES enhances the interfacial adhesion
between Hal nanotubes and PP matrix which leads to improve the mechanical and
thermal properties of Hal-PP nanocomposites. Moreover, modification of APTES
significantly reduced the stress concentration points by increased filler dispersion
across PP matrix which leads to good mechanical properties of the nanocomposites
(Albdiry and Yousif, 2014; Carli et al., 2014).
8.2 Tensile and impact properties
Fig. 8.2 shows the tensile strength of pure PP and PP nanocomposites reinforced with
untreated and APTES treated Hal nanotubes. It is clear from Fig. 8.2 that a
considerable increment of tensile strength with the addition of Hal nanotubes
irrespective of their surface modification as compared to pure PP. Addition of 6 wt%
of untreated and APTES modified Hal nanotubes into PP matrix increased the tensile
strength by 16 and 31% respectively as compared to pure PP. It is observed that
APTES modified Hal-PP nanocomposites showed good tensile properties as
compared to untreated PP composites. This result proved the well dispersion of Hal
nanotubes after the surface modification with APTES which enhances the efficient
load transfer and thus good mechanical properties.
In addition to this, a number of hydrogen bond interaction between APTES modified
Hal nanotubes and the PP polymer matrix due to the presence of hydroxyl groups on

170
the surface of APTES modified Hal nanotubes which enhances the compatibility
between PP polymer matrix and APTES modified Hal nanotubes leads to increased
tensile strength. In addition to the surface modification, high aspect ratio of Hal
nanotubes promotes the high number of filler-matrix interaction which further leads to
improve the mechanical properties of Hal-PP nanocomposites. These findings well
correlate with other reports (Guo et al., 2009; Prashantha et al., 2011).
Fig. 8.2 Tensile strength of untreated and APTES modified Hal nanotubes reinforced
PP nanocomposites
Guo et al. (2009) reported a significant increment of tensile strength by 21% with the
addition of 10 wt% surface modified Hal-Polyamide 6 (PA6) nanocomposites as
compared to pure PA6 resin. It is also reported that the tensile strength and modulus
increased by 30.3 and 30.4% respectively with the incorporation of 6 wt% of Hal
nanotubes into polyamide 6 (PA6) polymer matrix as compared to pure PA6 resin
(Prashantha et al., 2011). However, PP nanocomposites with 8 wt% of Hal nanotubes
loading show a slight decline in the tensile strength. This may be due to the increased
0
5
10
15
20
25
30
35
40
45
0 2 4 6 8
Pure PP uHal mHal
Hal loading (wt%)
Ten
sile
str
ength
(M
Pa)

171
filler aggregation in the nanocomposites with a further addition of Hal nanotubes
above 6 wt%. The filler aggregation with the addition of above optimum quantity of
Hal nanotubes leads to poor interfacial adhesion between filler and polymer matrix.
Fig. 8.3 shows the tensile modulus of PP nanocomposites reinforced with unmodified
and APTES modified Hal nanotubes. Similar to tensile strength, tensile modulus also
significantly increased with an increase in Hal content into PP polymer matrix.
Fig. 8.3 Tensile modulus of unmodified and APTES modified Hal nanotubes
reinforced PP nanocomposites
Similar trend was also reported by Albdiry and Yousif (2014) where they noticed that
the tensile strength and modulus tend to decrease with a further addition (above 3
wt%) of Hal nanotubes into unsaturated polyester nanocomposites. It was found that
the tensile modulus increased significantly by 72% with the addition of 8 wt% of
APTES modified Hal-PP nanocomposites as compared to pure PP resin. This result
again proved the good dispersion of surface modified Hal nanotubes with APTES
across the PP matrix and improved the interfacial adhesion between fillers and the PP
0
100
200
300
400
500
600
700
800
900
0 2 4 6 8
Pure PP uHal mHal
Hal loading (wt%)
Ten
sile
mod
ulu
s (M
Pa)

172
polymer matrix. In contrast to the tensile strength and modulus, a slight reduction in
the percentage of elongation at break could be seen with increased loading of Hal
nanotubes into PP matrix. Fig. 8.4 shows the percentage of elongation at break for PP
nanocomposites reinforced with unmodified and APTES modified Hal nanotubes.
Fig. 8.4 Elongation at break of unmodified and APTES modified Hal nanotubes
reinforced PP nanocomposites
The elongation at break decreased by 30% with 8 wt% loading of Hal nanotubes as
compared to pure PP. This may be due to an increased rigidity of the polymer chain
after the addition of filler. Similar trend has been reported by Prashantha et al. (2011)
where they observed that 25% of elongation at break decreased with an increase in the
Hal nanotubes by 8 wt% into PP polymer matrix. The effect of APTES modified Hal-
PP nanocomposites on the impact property of Hal-PP nanocomposites was
investigated. Fig. 8.4 represents the impact strength of notched samples of unmodified
and APTES modified Hal-PP nanocomposites.
0
5
10
15
20
25
0 2 4 6 8
Pure PP uHal mHal
Hal loading (wt%)
Elo
ngati
on
at
bre
ak
(%
)

173
A gradual increase in the impact strength could be observed with the addition of Hal
nanotubes into PP matrix. It is noticed from Fig. 8.5 that the impact strength of 6 wt%
loading of APTES modified Hal-PP nanocomposites shows 27.8 J/m which is 44%
higher than the impact strength of pure PP. It is also worth noted that the surface
modified Hal-PP nanocomposites show better impact property as compared to
unmodified Hal-PP nanocomposites. The small amount of Hal nanofillers acts as a
plasticizer in the nanocomposites which helps to distribute the impact energy
throughout the nanocomposites.
Fig. 8.5 Izod impact strength of notched samples of unmodified and APTES modified
Hal-PP nanocomposites
However, decreased toughness could be observed for Hal-PP nanocomposites with a
further increase in the filler loading above 6 wt%. Similar results were found out by
other researchers (Liu et al., 2013). Prashantha et al. (2011) found that the impact
toughness increased by more than 80% with the addition of quaternary ammonium
salt modified Hal nanotubes reinforced PP nanocomposites as compared to pure PP.
0
5
10
15
20
25
30
35
0 2 4 6 8
Pure PP uHal mHal
Imp
act
str
ength
(J/m
)
Hal loading (wt%)

174
8.3 TGA analysis
The thermal stability of PP nanocomposites reinforcement with unmodified and
APTES modified Hal nanotubes was investigated using TGA. The TGA curves of
pure PP and its nanocomposites reinforcement with unmodified and APTES modified
Hal nanotubes have been shown in Fig. 8.6. It is noticed that only a slight increment
in the thermal stability with the addition of Hal nanotubes into PP matrix. The values
of temperature at which 50% weight loss occurred and percentage of char residue at
maximum temperature (600 oC) are given in Table 8.1. It is worth noted that the
thermal stability is considerably increased by 15 oC for the APTES modified Hal-PP
nanocomposites as compared to pure PP.
Fig. 8.6 TGA thermograms of pure PP, unmodified and APTES modified Hal-PP
nanocomposites
The increased thermal stability shows the good interfacial adhesion between APTES
modified Hal nanotubes and the PP matrix. However, it is also noted that a
considerable decrease in the thermal stability for unmodified Hal nanotubes loaded PP
-20
0
20
40
60
80
100
120
30.68 103.78 185.25 269 354.41 438.92 522.37
P-PP 6uHNT 6sHNT 8uHNT 8sHNT
Temperature (oC)
Rel
ati
ve
mass
(w
t%)

175
nanocomposites at maximum weight loss stage as compared to pure PP. Similar
results were reported by Wang and Huang (2013). They indicated that the Hal
nanotubes were acted as catalyst to enhance the degradation process during the
volatilization. It is also believed that the Hal nanotubes weaken the PP polymer chain
which influences the thermal oxidative degradation. The acidic groups present on the
Hal nanotubes or the air entrapped inside the tubular lumen of the Hal nanotubes
cause the thermal oxidative aging (Liu et al., 2010). It is important to mention that the
char residue of Hal-PP nanocomposites was significantly higher than pure PP. No
char residue could be observed for pure PP resin, whereas 6 and 8 wt% of Hal loading
nanocomposites showed more than 5 and 10% of char residue respectively (Table
8.1). This result clearly shows the incorporation of Hal nanotubes and hence an
improved thermal stability of the Hal-PP nanocomposites.
8.4 DSC analysis
A non-isothermal DSC analysis was carried out to investigate the effect of addition of
unmodified and APTES modified Hal nanotubes into PP nanocomposites. Figs. 8.7
and 8.8 show the melting temperature and cold crystallinity thermograms of Hal-PP
nanocomposites respectively. Table 8.1 shows the values of melting temperature
(Tm), cold crystallization temperature (Tc) and percentage of crystallinity (Xc) for
unmodified and APTES modified Hal-PP nanocomposites. The melting temperature
(Tm) peak shows a considerable increment of melting temperature (Fig. 8.7). The
melting temperature peak shifted to 169.83 oC with the addition of 8 wt% of APTES
modified Hal nanotubes, whereas the melting temperature peak of pure PP was at
166.65 oC.

176
Fig. 8.7 DSC melting curves of pure PP, unmodified and APTES modified Hal-PP
nanocomposites
The increment of melting temperature may be due to the reinforcement effect which
restricts the free movement of polymer chain segments in the Hal-PP nanocomposites
(Wang and Huang, 2013). It has been already reported that the addition of Hal
nanotubes induced the nucleating effects in the nanocomposites which enhances the
crystallinity of Hal-PP nanocomposites (Prashantha et al., 2011; Wang and Huang,
2013).
The cold crystalline temperature (Tcc) of Hal-PP nanocomposites shifted to lower
temperature after the addition of Hal nanotubes. The Tcc for the pure PP was at 123.52
oC and with the addition of 8 wt% of Hal nanotubes into PP matrix the Tcc shifted to
121.02 oC. The lower the Tcc with respect to pure PP indicates the addition of
nanofillers promoting the kinetics of nucleating effect in the Hal-PP nanocomposites
and thus improved crystallinity (Kontou et al., 2011; Wang and Qiu, 2011).
-100
-80
-60
-40
-20
0
20
40
31.57 54.76 80 107.5 135 162.5 190
PP8sHal PP8uHal PP6sHal PP6uHal Pure PP
Temperature (oC)
Hea
t fl
ow
(m
W)
e
xo

177
Fig. 8.8 DSC cooling curves of pure PP, unmodified and APTES modified Hal-PP
nanocomposites
Table 8.1 TGA and DSC data of melting temperature (Tm), cold crystallization
temperature (Tc) and percentage of crystallinity (Xc)
Samples Tm (oC) Tcc (
oC) Xc (%) Temperature at
50% weight loss (oC)
Char residue
(wt %)
Pure PP 166.65 123.52 38.5 433.14 0.0
PP + 6uHal 168.57 122.8 42.3 430.29 5.89
PP + 6sHal 168.8 121.56 46.8 445.24 7.25
PP + 8uHal 169.21 121.5 44.71 414.81 8.99
PP + 8sHal 169.83 121.02 47.1 427.97 10.2
8.5 DMA analysis
DMA analysis was carried out to study the effect of APTES modified Hal nanotubes
reinforced PP nanocomposites on the visco-elastic properties. This analysis is useful
-40
-20
0
20
40
60
80
100
120
140
160
198.5 185.39 159.14 134 112 90 68 46
PP8sHal PP8uHal PP6sHal PP6uHal Pure PP
Temperature (oC)
Hea
t fl
ow
(m
W)
e
xo

178
in the evaluation of composite dynamic mechanical performance under different
temperature and mechanical stress (Saba et al., 2016). Fig. 8.9 shows the curves of
storage modulus (E') of unmodified and APTES modified Hal nanotubes reinforced
PP composites. It is noticed from Fig. 8.9 that the storage modulus was higher at
lower temperature at around -50 oC and then a gradual decrease with increasing
temperature could be noticed.
At lower temperature (-51 oC) the storage modulus (E') was much higher for Hal-PP
nanocomposites as compared to pure PP and even it increased significantly with the
further addition of APTES modified Hal nanotubes into PP matrix. It was found that
the addition of 6 wt% of APTES modified Hal nanotubes into PP matrix increased the
storage modulus to 5.55 GPa which is 28% higher as compared to pure PP. Higher
storage modulus for APTES modified Hal-PP nanocomposites as compared to pure
PP clearly confirms the increased dispersion and interfacial interactions between the
modified Hal nanofiller and the PP matrix. Similar results were reported by other
researchers. Prashantha et al (2011) studied the effect of surface modification on the
dynamic mechanical properties of Hal-PP nanocomposites and reported that the
storage modulus increased with increased Hal nanotubes loading into PP matrix. They
also noticed that the storage modulus was much higher for surface modified Hal-PP
nanocomposites as compared to pure PP.
Lecouvet et al. (2013) studied the thermal and flammability properties of Hal
nanotubes reinforced polyethersulfone (PES) nanocomposites prepared by melt
compounding and found that the storage modulus significantly increased by more
than 40% with the addition of 16 wt% of Hal-PES nanocomposites than pure PES
resin. This may be due to higher intrinsic stiffness of Hal nanotubes, their orientation
in the stretching direction and also their interfacial adhesion with PES polymer matrix

179
which lead to improved storage modulus higher for the Hal nanotubes reinforced PES
nanocomposites than pure polymer resin.
Fig. 8.9 Storage modulus (E') curves of unmodified and APTES modified Hal
nanotubes reinforced PP nanocomposites
Loss modulus (E") is defined as the capacity of the composite materials to dissipate
the absorbed energy within the system as heat or intermolecular rearrangements when
force is applied. It shows the viscous property of polymeric materials. Loss modulus
is a sensitive property of the composite materials with molecular motions, transitions
and relaxation process within the same system. With a gradual increase in the
temperature, the materials change from rigid state to more elastic and the rate of
change purely depends on the nature of fillers and polymer matrices (Saba et al.,
2016). Fig. 8.10 shows the loss modulus (E") of the unmodified and APTES
modified Hal-PP nanocomposites with different filler loading as a function of
temperature. It is noticed that the peak of loss modulus curve was seen to be broad
0.00E+00
1.00E+09
2.00E+09
3.00E+09
4.00E+09
5.00E+09
6.00E+09
-50 -30 -10 10 30 50 70 90
Pure PP PP6uHal PP6sHal PP8uHal PP8sHal
Temperature (oC)
Sto
rage
mod
ulu
s (E
') (
GP
a)

180
and the peak height was relatively higher for pure PP resin as compared to Hal loaded
nanocomposites.
Fig. 8.10 Loss modulus curves of unmodified and APTES modified Hal nanotubes
reinforced PP nanocomposites
The lower the peak height of the loss modulus for the APTES modified Hal-PP
nanocomposites shows the increased storage modulus and decreased loss factor. This
may be due to an increased interfacial adhesion and well dispersed Hal nanotubes
across the PP matrix (Khonakdar, 2015). The damping factor which is also called as
tan delta (δ) is the ratio of storage modulus (E') and loss modulus (E") and has no
dimension.
It is believed that the temperature at the peak of tan delta is considered as the glass
transition temperature (Tg) of the material (Liu et al., 2013). It could be noticed from
Fig. 8.11 that there is a considerable increment in the Tg with the addition of Hal
nanotubes into Hal-PP nanocomposites than pure PP.
0.00E+00
5.00E+07
1.00E+08
1.50E+08
2.00E+08
2.50E+08
-50 -30 -10 10 30 50 70 90
Pure PP PP6uHal PP6sHal PP8uHal PP8sHal
Loss
mod
ulu
s (E
'')
(GP
a)
Temperature (oC)

181
Fig. 8.11 Tan δ curves of unmodified and APTES modified Hal nanotubes reinforced
PP nanocomposites
The Tg for pure PP was at 6.8 oC whereas the Tg for the addition of APTES modified
Hal nanotubes of 6 and 8 wt% were at 7.2 and 8.3 oC respectively. This may be due to
the restriction of segment motion in the polymer chain after the addition of Hal
nanotubes which causes the increased modulus and leads to increased Tg of the
composite materials (Russo et al., 2014).
8.6 Conclusions
The effect of APTES modified Hal nanotubes on mechanical and thermal properties
of Hal-PP nanocomposites was studied. Morphological investigation revealed that the
surface modified Hal nanotubes were better dispersed across the PP matrix and less
agglomeration as compared to unmodified Hal-PP nanocomposites. Mechanical
properties of the APTES modified Hal-PP nanocomposites were found to be superior
to the unmodified Hal-PP nanocomposites. The tensile strength, modulus and impact
0
0.02
0.04
0.06
0.08
0.1
0.12
-50 -30 -10 10 30 50 70 90
Pure PP PP6uHal PP6sHal PP8uHal PP8sHal
Tan
δ
Temperature (oC)

182
strength increased by 31, 72% and 44% respectively with the addition of 6 wt% of
APTES modified Hal-PP nanocomposites as compared to pure PP. Thermal analysis
revealed that the thermal stability and percentage crystallinity increased by 15 and
22% respectively for the Hal-PP nanocomposites with surface modification by
APTES. DMA analysis showed the improved storage modulus by 28% as compared
to pure PP. Overall, the investigation confirms the surface modification of Hal
nanotubes with APTES which helps to enhance the mechanical and thermal properties
of Hal-PP nanocomposites.

183
CHAPTER IX
Conclusions and future work
9.1 Conclusions
In this work, firstly, sisal fibres were surface treated with alkali, high intensity
ultrasound (HIU) and the combination of alkali and HIU treatments to study the
effective removal of amorphous materials such as hemicellulose, pectin, lignin and
other waxy materials from the surface of sisal fibres. FE-SEM and FTIR analysis of
surface treated sisal fibres revealed that the combination of alkali and HIU treatment
was more effective in the removal of amorphous materials from the surface of sisal
fibres and increased the fibre aspect ratio which plays an important role in achieving
good mechanical properties of the resultant composites. XRD analysis confirmed a
significant increase in the crystallinity in case of combined treated sisal fibres. TGA
analysis indicated that the combination of alkali and HIU treated sisal fibres have high
thermal stability as compared to untreated sisal fibres. However, due to the removal of
amorphous materials from the fibre surface, tensile properties decreased significantly
which may be due to the removal of amorphous materials which bind the cellulose
materials tightly on the surface of fibres.
Second, PLA composites reinforced with sisal fibres were successfully prepared and
the effect of different surface treatments of sisal fibres on the morphology,
mechanical, thermal and biodegradability properties was studied. Morphological
analysis showed that the surface treated sisal fibres were well dispersed across the
PLA matrix and increased the interfacial adhesion which is a crucial property for the
improvement of mechanical and thermal properties of composites. A significant

184
increment in the tensile properties could be observed for the combination of alkali and
HIU treated sisal fibre composites as compared to untreated and pure PLA matrix.
TGA and DSC analysis revealed that the improved thermal stability and crystallinity
by 12 oC and 75% respectively with the combined treated sisal fibre reinforced PLA
composites. DMA results showed that the stiffness increased significantly by 30% as
compared to pure PLA. Water absorption and soil biodegradation analysis were also
in favour of improved mechanical and thermal properties of SF/PLA composites with
the incorporation of the combined treated sisal fibre.
Apart from sisal fibres, halloysite (Hal) nanotubes were also used as nano-fillers in
order to tune the mechanical and thermal properties of PLA composites. Hal
nanotubes were successfully surface modified with APTES silane coupling agent and
the effects of APTES modified Hal/PLA nanocomposites on the morphology,
mechanical and thermal properties of Hal/PLA composites were studied. Nitrogen
adsorption-desorption, FTIR analysis confirmed the well dispersion of Hal nanotubes
across the PLA matrix which improved the interfacial adhesion. Tensile and impact
properties were significantly increased with the incorporation of APTES modified
Hal/PLA nanocomposites. TGA analysis showed that the thermal stability improved
significantly for APTES modified Hal/PLA nanocomposites as compared to pure PLA
matrix. In this investigation, PP composites reinforced with sisal fibre and halloysite
nanotubes were also prepared and the effect of surface modification on the
mechanical and thermal properties of PP composites was studied. Similar to PLA
composites, PP/Sisal fibre composites showed better improved mechanical and
thermal properties as compared to pure PP.
Finally, sisal fibres and Hal nanotubes have significant effects to overcome the
drawbacks of PLA polymer and improved the mechanical and thermal properties.

185
Surface modification of sisal fibres as well as Hal nanotubes was playing an important
role in order to tune the mechanical and thermal properties of PLA composites. PLA
polymer has the potential to replace PP polymer not only in the medical applications
but also in automotive and other structural engineering applications.
9.2 Suggestions for future work
The results obtained from this investigation lead to confirm that the combination of
alkali and HIU treatment could be very effective in order to remove the amorphous
materials from the surface of fibres which improved the overall properties of fibre
reinforced composites. It is suggested that in order to achieve industrial scale
production of sisal fibre reinforced PLA composites a detailed process optimisation is
needed. In this study, we revealed that the fibre orientation or alignment is one of the
important factors which directly affect the mechanical properties of the composites.
Therefore, it will be a good choice of development of uniaxially aligned fibre
composites for the better performance of composites. Different types of coupling
agents could be proposed in order to obtain more improved mechanical and thermal
properties of the natural fibre reinforced polymer composites. Addition of coupling
agents in the generation of polymer composites is another effective method to
enhance the interfacial bonding between fibres and the matrices. Fire-retardant
additives could be used in PLA nanocomposites along with Hal nanotubes in order to
achieve good thermally stabilised composites which are required in specific
applications such as aerospace, outdoor fabrications etc. PLA is very brittle and thus
plasticisers and compatibilisers could be used for a further reduction in the brittleness
as per the end use requirements.

186
References:
Abdul Khalil, H.P.S., Bhat, A.H., Ireana Yusra, A.F., 2012. Green composites from
sustainable cellulose nanofibrils: A review. Carbohydr. Polym. 87, 963–979.
Abdul Khalil, H.P.S., Davoudpour, Y., Islam, M.N., Mustapha, A., Sudesh, K.,
Dungani, R., Jawaid, M., 2014. Production and modification of nanofibrillated
cellulose using various mechanical processes: A review. Carbohydr. Polym. 99,
649–665.
Abidi, N., Cabrales, L., Haigler, C.H., 2014. Changes in the cell wall and cellulose
content of developing cotton fibers investigated by FTIR spectroscopy.
Carbohydr. Polym. 100, 9–16.
Alamri, H., Low, I.M., 2013. Effect of water absorption on the mechanical properties
of nanoclay filled recycled cellulose fibre reinforced epoxy hybrid
nanocomposites. Compos. Part A Appl. Sci. Manuf. 44, 23–31.
Albdiry, M.T., Yousif, B.F., 2014. Role of silanized halloysite nanotubes on
structural, mechanical properties and fracture toughness of thermoset
nanocomposites. Mater. Des. 57, 279–288.
Albdiry, M.T., Yousif, B.F., 2013. Morphological structures and tribological
performance of unsaturated polyester based untreated/silane-treated halloysite
nanotubes. Mater. Des. 48, 68–76.
Alvarez, V.A., Ruseckaite, R.A., Va, A., 2006. Degradation of sisal fibre/Mater Bi-Y
biocomposites buried in soil. Polym. Degrad. Stab. 91, 3156–3162.
Arbelaiz, A., Fernández, B., Ramos, J.A., Mondragon, I., 2006. Thermal and

187
crystallization studies of short flax fibre reinforced polypropylene matrix
composites: Effect of treatments. Thermochim. Acta 440, 111–121.
Arkles, B., 1977. Tailoring surfaces with silanes. Chemtech 7, 766-772.
Arkles, B., Steinmetz, J.R., Zazyczny, J., Mehta, P., 1992. Factors contributing to the
stability of alkoxysilanes in aqueous solution. J. Adhes. Sci. Technol. 1. 91-104.
Arrakhiz, F.Z., Elachaby, M., Bouhfid, R., Vaudreuil, S., Essassi, M., Qaiss, A., 2012.
Mechanical and thermal properties of polypropylene reinforced with Alfa fibre
under different chemical treatment. Mater. Des. 35, 318–322.
Arrieta, M.P., Lopez, J., Hernandez, A., Rayon, E., 2014. Ternary PLA-PHB-
Limonene blends intended for biodegradable food packaging applications. Eur.
Polym. J. 50, 255–270.
Ashori, A., Nourbakhsh, A., 2010. Reinforced polypropylene composites: Effects of
chemical compositions and particle size. Bioresour. Technol. 101, 2515–2519.
Asumani, O.M.L., Reid, R.G., Paskaramoorthy, R., 2012. The effects of alkali–silane
treatment on the tensile and flexural properties of short fibre non-woven kenaf
reinforced polypropylene composites. Compos. Part A Appl. Sci. Manuf. 43,
1431–1440.
Avella, M., Volpe, G. Della, Martuscelli, E., 1992. Transcrystallinity phenomena in a
polypropylene/kevlar fibre system I: influence of crystallisation conditions.
Polym. Eng. Sci. 32, 376–382.
Azwa, Z.N., Yousif, B.F., Manalo, A.C., Karunasena, W., 2013. A review on the
degradability of polymeric composites based on natural fibres. Mater. Des. 47,

188
424–442.
B. C. Barkakaty, 1976. Some structural aspects of sisal fibres. J. Appl. Polym. Sci. 20,
2921–2940.
Badia, J.D., Kittikorn, T., Strömberg, E., Santonja-Blasco, L., Martínez-Felipe, A.,
Ribes-Greus, A., Ek, M., Karlsson, S., 2014. Water absorption and hydrothermal
performance of PHBV/sisal biocomposites. Polym. Degrad. Stab. 108, 166–174.
Barrientos-Ramirez, S., Oca-Ramirez, G.M. De, Ramos-Fernandez, E. V., Sepulveda-
Escribano, A., Pastor-Blas, M.M., Gonzalez-Montiel, A., 2011. Surface
modification of natural halloysite clay nanotubes with aminosilanes. Application
as catalyst supports in the atom transfer radical polymerization of methyl
methacrylate. Appl. Catal. A Gen. 406, 22–33.
Batalha, L.A.R., Silva, J.C. da, Jardim, C.M., Oliveira, R.C., Colodette, J.L., 2011.
Effect of ultrasound and xylanase treatment on the physical-mechanical
properties of bleached eucalyptus kraft pulp. Nat. Resour. 2, 125–129.
Battegazzore, D., Bocchini, S., Frache, A., 2011. Crystallization kinetics of
poly(lactic acid)-talc composites. Express Polym. Lett. 5, 849–858.
Beg, M.D.H., Akindoyo, J.O., Ghazali, S., Mamun, A.A., 2015. Impact modified oil
palm empty fruit bunch fibre/poly(lactic) acid composite. Int. J. Chem. Mol.
Nucl. Mater. Metallurgical Eng. 9, 165–170.
Belaadi, A., Bezazi, A., Bourchak, M., Scarpa, F., Zhu, C., 2014. Thermochemical
and statistical mechanical properties of natural sisal fibres. Compos. Part B Eng.
67, 481–489.
189
Bledzki, A.K., Gassan, J., 1999. Composites reinforced with cellulose based fibres.
Prog. Polym. Sci. 24, 221–274.
Boopathi, L., Sampath, P.S., Mylsamy, K., 2012. Investigation of physical, chemical
and mechanical properties of raw and alkali treated Borassus fruit fibre. Compos.
Part B Eng. 43, 3044–3052.
Cabral, H., 2005. Structure-properties relationship of short jute fibre reinforced
polypropylene composites. J. Compos. Mater. 39, 51–65.
Cai, M., Takagi, H., Nakagaito, A.N., Katoh, M., Ueki, T., Waterhouse, G.I.N., Li,
Y., 2015. Influence of alkali treatment on internal microstructure and tensile
properties of abaca fibres. Ind. Crops Prod. 65, 27–35.
Cao, Y., Chan, F., Chui, Y.H., Xiao, H., 2012. Characterization of flax fibres
modified by alkaline, enzyme, and steam-heat treatments. BioResources 7,
4109–4121.
Carli, L.N., Daitx, T.S., Soares, G. V., Crespo, J.S., Mauler, R.S., 2014. The effects of
silane coupling agents on the properties of PHBV/halloysite nanocomposites.
Appl. Clay Sci. 87, 311–319.
Carrasco, F., Pagès, P., Gámez-pérez, J., Santana, O.O., Maspoch, M.L., 2010.
Processing of poly (lactic acid): Characterization of chemical structure, thermal
stability and mechanical properties. Polym. Degrad. Stab. 95, 116–125.
Carrillo, F., Colom, X., Suñol, J.J., Saurina, J., 2004. Structural FTIR analysis and
thermal characterisation of lyocell and viscose-type fibres. Eur. Polym. J. 40,
2229–2234.

190
Chen, W., Yu, H., Liu, Y., 2011a. Preparation of millimeter-long cellulose nanofibres
with diameters of 30-80 nm from bamboo fibers. Carbohydr. Polym. 86, 453–
461.
Chen, W., Yu, H., Liu, Y., Chen, P., Zhang, M., Hai, Y., 2011b. Individualization of
cellulose nanofibres from wood using high-intensity ultrasonication combined
with chemical pretreatments. Carbohydr. Polym. 83, 1804–1811.
Cheng, Q., Wang, S., Han, Q., 2010. Novel process for isolating fibrils from cellulose
fibres by high-intensity ultrasonication. II. Fibril characterization. J. Appl.
Polym. Sci. 115, 2756–2762.
Cheng, Q., Wang, S., Rials, T.G., 2009. Poly(vinyl alcohol) nanocomposites
reinforced with cellulose fibrils isolated by high intensity ultrasonication.
Compos. Part A Appl. Sci. Manuf. 40, 218–224.
Chikouche, M.D.L., Merrouche, A., Azizi, A., Rokbi, M., Walter, S., 2015. Influence
of alkali treatment on the mechanical properties of new cane fibre/polyester
composites. J. Reinf. Plast. Compos. 34, 1329–1339.
Chow, C.P.L., Xing, X.S., Li, R.K.Y., 2007. Moisture absorption studies of sisal fibre
reinforced polypropylene composites. Compos. Sci. Technol. 67, 306–313.
Cran, M.J., Bigger, S.W., S.M.A., I., 2014. Effect of kenaf fibre loading and thymol
concentration on the mechanical and thermal properties of PLA/kenaf/thymol
composites. Ind. Crops Prod. 61, 74–83.
Das, A., Satapathy, B.K., 2011. Structural, thermal, mechanical and dynamic
mechanical properties of cenosphere filled polypropylene composites. Mater.
Des. 32, 1477–1484.

191
De Rosa, I.M., Kenny, J.M., Puglia, D., Santulli, C., Sarasini, F., 2010.
Morphological, thermal and mechanical characterization of okra (Abelmoschus
esculentus) fibres as potential reinforcement in polymer composites. Compos.
Sci. Technol. 70, 116–122.
Demir, H., Atikler, U., Balköse, D., Tıhmınlıoğlu, F., 2006. The effect of fibre surface
treatments on the tensile and water sorption properties of polypropylene–luffa
fibre composites. Compos. Part A Appl. Sci. Manuf. 37, 447–456.
Dhakal, H.N., Zhang, Z.Y., Richardson, M.O.W., 2007a. Effect of water absorption
on the mechanical properties of hemp fibre reinforced unsaturated polyester
composites. Compos. Sci. Technol. 67, 1674–1683.
Dhakal, H.N., Zhang, Z.Y., Richardson, M.O.W., Alhuthali, A., Low, I.M., Dong, C.,
Ghosh, R., Ramakrishna, A., Reena, G., Mohan, T.P., Kanny, K., Ramadevi, P.,
Sampathkumar, D., Srinivasa, C.V., Bennehalli, B., Dhakal, H.N., Zhang, Z.Y.,
Richardson, M.O.W., 2007b. Effect of water absorption on the mechanical
properties of hemp fibre reinforced unsaturated polyester composites. Compos.
Sci. Technol. 67, 1674–1683.
Dicker, M.P.M., Duckworth, P.F., Baker, A.B., Francois, G., Hazzard, M.K., Weaver,
P.M., 2014. Green composites: A review of material attributes and
complementary applications. Compos. Part A 56, 280–289.
Diez-Pascual, A.M., Naffakh, M., Marco, C., Gomez-Fatou, M.A., Ellis, G.J., 2014.
Multiscale fibre reinforced thermoplastic composites incorporating carbon
nanotubes: A review. Curr. Opin. Solid State Mater. Sci. 18, 62–80.
Dittenber, D.B., Gangarao, H.V.S., 2012. Critical review of recent publications on use

192
of natural composites in infrastructure. Compos. Part A Appl. Sci. Manuf. 43,
1419–1429.
Dong, Y., Ghataura, A., Takagi, H., Haroosh, H.J., Nakagaito, A.N., Lau, K.-T., 2014.
Polylactic acid (PLA) biocomposites reinforced with coir fibres: Evaluation of
mechanical performance and multifunctional properties. Compos. Part A Appl.
Sci. Manuf. 63, 76–84.
Du, M., Guo, B., Jia, D., 2010. Newly emerging applications of halloysite nanotubes:
a review. Polym. Int. 59, 574–582.
Du, M., Guo, B., Jia, D., 2006. Thermal stability and flame retardant effects of
halloysite nanotubes on poly(propylene). Eur. Polym. J. 42, 1362–1369.
Eichhorn, S., Thielemans, W., Benight, A.B., 2010. Review : Current international
research into cellulose nanofibres and nanocomposites. J. Mater. Sci. 45, 1–33.
El-Sabbagh, A., 2014. Effect of coupling agent on natural fibre in natural
fibre/polypropylene composites on mechanical and thermal behaviour. Compos.
Part B Eng. 57, 126–135.
Elkhaoulani, A., Arrakhiz, F.Z., Benmoussa, K., Bouhfid, R., Qaiss, A., 2013.
Mechanical and thermal properties of polymer composite based on natural fibres:
Moroccan hemp fibres/polypropylene. Mater. Des. 49, 203–208.
Espert, A., Vilaplana, F., Karlsson, S., 2004. Comparison of water absorption in
natural cellulosic fibres from wood and one-year crops in polypropylene
composites and its influence on their mechanical properties. Compos. Part A
Appl. Sci. Manuf. 35, 1267–1276.

193
Espinach, F.X., Julian, F., Verdaguer, N., Torres, L., Pelach, M.A., Vilaseca, F.,
Mutje, P., 2013. Analysis of tensile and flexural modulus in hemp
strands/polypropylene composites. Compos. Part B Eng. 47, 339–343.
Essabir, H., Elkhaoulani, A., Benmoussa, K., Bouhfid, R., Arrakhiz, F.Z., Qaiss, A.,
2013a. Dynamic mechanical thermal behavior analysis of doum fibres reinforced
polypropylene composites. Mater. Des. 51, 780–788.
Essabir, H., Hilali, E., Elgharad, A., El Minor, H., Imad, A., Elamraoui, A., Al
Gaoudi, O., 2013b. Mechanical and thermal properties of bio-composites based
on polypropylene reinforced with Nut-shells of Argan particles. Mater. Des. 49,
442–448.
Evagelia, K., Michael, N., Panayiotis, G., 2011. Comparative study of PLA
nanocomposites reinforced with clay and silica nanofillers and their mixtures. J.
Appl. Polym. Sci. 122, 1519–1529.
Faruk, O., Bledzki, A.K., Fink, H.P., Sain, M., 2012. Biocomposites reinforced with
natural fibers: 2000-2010. Prog. Polym. Sci. 37, 1552–1596.
Fiore, V., Di Bella, G., Valenza, A., 2015. The effect of alkaline treatment on
mechanical properties of kenaf fibres and their epoxy composites. Compos. Part
B Eng. 68, 14–21.
Freire, C., Peixoto, A.F., Fernandes, A.C., Pereira, C., 2016. Microporous and
mesoporous materials physicochemical characterization of organosilylated
halloysite clay nanotubes. Microporours Mesoporous Mater. 219, 145–154.
Fu, S.Y., Lauke, B., 1996. Effects of fibre length and fiber orientation distributions on
the tensile strength of short fibre reinforced polymers. Compos. Sci. Technol. 56,

194
1179–1190.
Gareth Beckermann, 2007. Performance of Hemp-Fibre Reinforced Polypropylene
Composite Materials. PhD Thesis, The University of Waikato.
Ghosh, R., Ramakrishna, A., Reena, G., 2013. Effect of air bubbling and ultrasonic
processing on water absorption property of banana fibre-vinylester composites. J.
Compos. Mater. 48 (14), 1691-1697.
Ghosh, R., Ramakrishna, A., Reena, G., Ravindra, A., Verma, A., 2014. Water
absorption kinetics and mechanical properties of ultrasonic treated banana fibre
reinforced-vinyl ester composites. Procedia Mater. Sci. 5, 311–315.
Gibson, R.F., 2010. A review of recent research on mechanics of multifunctional
composite materials and structures. Compos. Struct. 92, 2793–2810.
Gilman, J., 1999. Flammability and thermal stability studies of polymer layered-
silicate (clay) nanocomposites. Appl. Clay Sci. 15, 31-49.
Granda, L.A., Espinach, X., López, F., García, J.C., Delgado-Aguilar, M., Mutjé, P.,
2016. Semichemical fibres of Leucaena collinsii reinforced polypropylene:
Macromechanical and micromechanical analysis. Compos. Part B Eng. 92, 332–
337.
Guo, B., Zou, Q., Lei, Y., Jia, D., 2009. Structure and performance of polyamide
6/halloysite nanotubes nanocomposites. Polym. J. 41, 835–842.
Gurunathan, T., Mohanty, S., Nayak, S.K., 2015. A review of the recent
developments in biocomposites based on natural fibres and their application
perspectives. Compos. Part A Appl. Sci. Manuf. 77, 1–25.

195
Haameem J.A., M., Abdul Majid, M.S., Afendi, M., Marzuki, H.F.A., Fahmi, I.,
Gibson, A.G., 2016. Mechanical properties of Napier grass fibre/polyester
composites. Compos. Struct. 136, 1–10.
Herrmann, A.S., Nickel, J., Riedel, U., 1998. Construction materials based upon
biologically renewable resources from components to finished parts. Polym.
Degrad. Stab. 59, 251–261.
Ho, M., Wang, H., Lee, J., Ho, C., Lau, K., Leng, J., Hui, D., 2012. Critical factors on
manufacturing processes of natural fibre composites. Compos. Part B 8, 3549–
3562.
Hossain, M.K., Karim, M.R., Chowdhury, M.R., Imam, M.A., Hosur, M., Jeelani, S.,
Farag, R., 2014. Comparative mechanical and thermal study of chemically
treated and untreated single sugarcane fibre bundle. Ind. Crops Prod. 58, 78–90.
I.M. De Rosa, A. Iannoni, J.M. Kenny, D. Puglia, C. Santulli, F. Sarasini, A.T., 2011.
Poly(lactic acid)/phormium tenax composites: Morphology and thermo-
mechanical behavior. Polym. Compos. 1362-1368.
Idicula, M., Malhotra, S.K., Joseph, K., Thomas, S., 2005. Dynamic mechanical
analysis of randomly oriented intimately mixed short banana/sisal hybrid fibre
reinforced polyester composites. Compos. Sci. Technol. 65, 1077–1087.
Iskalieva, A., Yimmou, B.M., Gogate, P.R., Horvath, M., Horvath, P.G., Csoka, L.,
2012. Cavitation assisted delignification of wheat straw: A review. Ultrason.
Sonochem. 19, 984–993.
Jawaid, M., Abdul Khalil, H.P.S., Hassan, A., Dungani, R., Hadiyane, A., 2013.
Effect of jute fibre loading on tensile and dynamic mechanical properties of oil

196
palm epoxy composites. Compos. Part B Eng. 45, 619–624.
Jambeck, J.R., Geyer, R., Wilcox, C., Siegler, T.R., Perryman, M., Andrady, A.,
Narayan, R., Law, K.L., 2015. Plastic waste inputs from land into the ocean.
Science 80. 347-352.
Jiang, L., Zhang, J., Wolcott, M.P., 2007. Comparison of polylactide/nano-sized
calcium carbonate and polylactide/montmorillonite composites: Reinforcing
effects and toughening mechanisms. Polymer. 48, 7632–7644.
Jin, J., Fu, L., Yang, H., Ouyang, J., 2015. Carbon hybridized halloysite nanotubes for
high-performance hydrogen storage capacities. Sci. Rep. 5, 1-10.
John, M.J., Anandjiwala, R.D., 2009. Chemical modification of flax reinforced
polypropylene composites. Compos. Part A Appl. Sci. Manuf. 40, 442–448.
John, M.J., Anandjiwala, R.D., 2008. Recent developments in chemical modification
and characterization of natural fiber-reinforced composites. Polym. Compos. 29,
187–207.
John, M.J., Thomas, S., 2008. Biofibres and biocomposites. Carbohydr. Polym. 71,
343–364.
Joseph, K., James, B., Thomas, S., Carvalho, L.H. De, 1999. A review on sisal fiber
reinforced polymer composites. Eng. Agrícola 3, 367–379.
Joseph, K., Varghese, S., Kalaprasad, G., Thomas, S., Prasannakumari, L., Koshy, P.,
Pavithran, C., 1996. Influence of interfacial adhesion on the mechanical
properties and fracture behaviour of short sisal fibre reinforced polymer
composites. Eur. Polym. J. 32, 1243–1250.

197
Joseph, P.V., Joseph, K., Thomas, S., Pillai, C.K.S., Prasad, V.S., Groeninckx, G.,
Sarkissova, M., 2003. The thermal and crystallisation studies of short sisal fibre
reinforced polypropylene composites. Compos. Part A Appl. Sci. Manuf. 34,
253–266.
Joseph, P. V., Mathew, G., Joseph, K., Thomas, S., Pradeep, P., 2003. Mechanical
properties of short sisal fibre reinforced polypropylene composites: Comparison
of experimental data with theoretical predictions. J. Appl. Polym. Sci. 88, 602–
611.
Joseph, P. V, Joseph, K., Thomas, S., 1999. Effect of processing variables on the
mechanical properties of sisal fibre reinforced polypropylene composites.
Compos. Part B Eng. 59, 1625–1640.
Joseph, P. V, Mathew, G., Joseph, K., Groeninckx, G., Thomas, S., 2003. Dynamic
mechanical properties of short sisal fibre reinforced polypropylene composites.
Compos. Part A Appl. Sci. Manuf. 34, 275–290.
Joussein, E., Petit, S., Churchman, J., Theng, B., Righi, D., Delvaux, B., 2005.
Halloysite clay minerals – a review. Clay Miner. 40, 383–426.
Kabir, M.M., Wang, H., Lau, K.T., Cardona, F., 2013a. Tensile properties of
chemically treated hemp fibres as reinforcement for composites. Compos. Part B
Eng. 53, 362–368.
Kabir, M.M., Wang, H., Lau, K.T., Cardona, F., 2013b. Effects of chemical
treatments on hemp fibre structure. Appl. Surf. Sci. 276, 13–23.
Kabir, M.M., Wang, H., Lau, K.T., Cardona, F., 2012. Chemical treatments on plant-
based natural fibre reinforced polymer composites: An overview. Compos. Part

198
B Eng. 43, 2883–2892.
Kaewkuk, S., Sutapun, W., Jarukumjorn, K., 2013. Effects of interfacial modification
and fiber content on physical properties of sisal fibre/polypropylene composites.
Compos. Part B Eng. 45, 544–549.
Kalaprasad, G., Joseph, K., Thomas, S., Pavithran, C., 1997. Theoretical modelling of
tensile properties of short sisal fibre-reinforced low-density polyethylene
composites. J. Mater. Sci. 32, 4261–4267.
Kaushik, V.K., Kumar, A., Kalia, S., 2012. Effect of mercerization and benzoyl
peroxide treatment on morphology, thermal stability and crystallinity of sisal
fibres. Int. J. Text. Sci. 1, 101–105.
Khonakdar, H.A., 2015. Dynamic mechanical analysis and thermal properties of
LLDPE/EVA/modified silica nanocomposites. Compos. Part B Eng. 76, 343–
353.
Kim, H., Yang, H., Kim, H., 2005. Biodegradability and mechanical properties of
agro-flour – filled polybutylene succinate biocomposites. J. Appl. Phys. 97,
1513–1521.
Kim, I.-H.H., Jeong, Y.G., 2010. Polylactide/exfoliated graphite nanocomposites with
enhanced thermal stability, mechanical modulus, and electrical conductivity. J.
Polym. Sci. Part B Polym. Phys. 48, 850–858.
Kontou, E., Niaounakis, M., Georgiopoulos, P., Evagelia, K., Michael, N., Panayiotis,
G., Kontou, E., Niaounakis, M., Georgiopoulos, P., 2011. Comparative study of
PLA nanocomposites reinforced with clay and silica nanofillers and their
mixtures. J. Appl. Polym. Sci. 122, 1519–1529.

199
Koronis, G., Silva, A., Fontul, M., 2013a. Green composites: A review of adequate
materials for automotive applications. Compos. Part B Eng. 44, 120–127.
Koronis, G., Silva, A., Fontul, M., 2013b. Green composites : A review of adequate
materials for automotive applications. Compos. Part B 44, 120–127.
Krikorian, V., Pochan, D., 2005. Crystallization behavior of poly(lactic acid)
nanocomposites: nucleation and growth probed by infrared spectroscopy.
Macromolecules 38, 6520–6527.
Krishnaiah, P., Ratnam, C.T., Manickam, S., 2017. Enhancements in crystallinity,
thermal stability, tensile modulus and strength of sisal fibres and their PP
composites induced by the synergistic effects of alkali and high intensity
ultrasound (HIU) treatments. Ultrason. Sonochem. 34, 729–742.
Lacroix, T., Tilmans, B., Keunings, R., Desaeger, M., Verpoest, I., 1992. Modelling
of critical fibre length and interfacial debonding in the fragmentation testing of
polymer composites. Compos. Sci. Technol. 43, 379–387.
Lavoratti, A., Scienza, L.C., Zattera, A.J., 2015. Dynamic-mechanical and
thermomechanical properties of cellulose nanofibre/polyester resin composites.
Carbohydr. Polym. 136, 955–963.
Le Troedec, M., Sedan, D., Peyratout, C., Bonnet, J.P., Smith, A., Guinebretiere, R.,
Gloaguen, V., Krausz, P., 2008. Influence of various chemical treatments on the
composition and structure of hemp fibres. Compos. Part A Appl. Sci. Manuf. 39,
514–522.
Lecouvet, B., Sclavons, M., Bourbigot, S., Bailly, C., 2013. Thermal and flammability
properties of polyethersulfone/halloysite nanocomposites prepared by melt

200
compounding. Polym. Degrad. Stab. 98, 1993–2004.
Lee, H.S., Cho, D., Han, S.O., 2008. Effect of natural fiber surface treatments on the
interfacial and mechanical properties of henequen/polypropylene biocomposites.
Macromol. Res. 16, 411–417.
Lee, K.-Y.Y., Bharadia, P., Blaker, J.J., Bismarck, A., 2012. Short sisal fibre
reinforced bacterial cellulose polylactide nanocomposites using hairy sisal fibres
as reinforcement. Compos. Part A Appl. Sci. Manuf. 43, 2065–2074.
Li, W., Yue, J., Liu, S., 2012. Preparation of nanocrystalline cellulose via ultrasound
and its reinforcement capability for poly (vinyl alcohol) composites. Ultrason-
Sonochem. 19, 479–485.
Li, X., Tabil, L.G., Panigrahi, S., 2007. Chemical treatments of natural fibre for use in
natural fiber-reinforced composites: A review. J. Polym. Environ. 15, 25–33.
Li, Y., Mai, Y.-W., Ye, L., 2000. Sisal fibre and its composites: A review of recent
developments. Compos. Sci. Technol. 60, 2037–2055.
Li, Y., Pickering, K.L., 2009. The effect of chelator and white rot fungi treatments on
long hemp fibre-reinforced composites. Compos. Sci. Technol. 69, 1265–1270.
Li, Y., Pickering, K.L., Farrell, R.L., 2009. Determination of interfacial shear strength
of white rot fungi treated hemp fibre reinforced polypropylene. Compos. Sci.
Technol. 69, 1165–1171.
Li, Z., Zhou, X., Pei, C., 2011. Effect of sisal fibre surface treatment on the properties
of sisal fibre reinforced polylactide composites. Int. J. Polym. Sci. 2011, 1–7.
Lim, L.-T., Auras, R., Rubino, M., 2008. Processing technologies for poly (lactic

201
acid). Prog. Polym. Sci. 33, 820–852.
Lin, Y., Ng, K.M., Chan, C.-M., Sun, G., Wu, J., 2011. High-impact
polystyrene/halloysite nanocomposites prepared by emulsion polymerization
using sodium dodecyl sulfate as surfactant. J. Colloid Interface Sci. 358, 423–
429.
Liu, M., Guo, B., Du, M., Chen, F., Jia, D., 2009. Halloysite nanotubes as a novel β-
nucleating agent for isotactic polypropylene. Polymer. 50, 3022–3030.
Liu, M., Jia, Z., Jia, D., Zhou, C., 2014. Recent advance in research on halloysite
nanotubes-polymer nanocomposite. Prog. Polym. Sci. 39, 1498–1525.
Liu, M., Jia, Z., Liu, F., Jia, D., Guo, B., 2010. Tailoring the wettability of
polypropylene surfaces with halloysite nanotubes. J. Colloid Interface Sci. 350,
186–193.
Liu, M., Zhang, Y., Zhou, C., 2013. Nanocomposites of halloysite and polylactide.
Appl. Clay Sci. 75–76, 52–59.
López, J.P., Boufi, S., Mansouri, N.E. El, Mutjé, P., Vilaseca, F., 2012. PP
composites based on mechanical pulp, deinked newspaper and jute strands: A
comparative study. Compos. Part B 43, 3453–3461.
López, J.P., Mutjé, P., Carvalho, A.J.F., Curvelo, A.A.S., Gironès, J., 2013.
Newspaper fibre-reinforced thermoplastic starch biocomposites obtained by melt
processing : Evaluation of the mechanical , thermal and water sorption
properties. Ind. Crop. Prod. 44, 300–305.
Lu, T., Jiang, M., Jiang, Z., Hui, D., Wang, Z., Zhou, Z., 2013. Effect of surface

202
modification of bamboo cellulose fibres on mechanical properties of
cellulose/epoxy composites. Compos. Part B Eng. 51, 28–34.
Luo, H., Xiong, G., Ma, C., Chang, P., Yao, F., Zhu, Y., Zhang, C., Wan, Y., 2014.
Mechanical and thermo-mechanical behaviors of sizing-treated corn
fibre/polylactide composites. Polym. Test. 39, 45–52.
Ma, H., Whan Joo, C., 2011. Influence of surface treatments on structural and
mechanical properties of bamboo fibre-reinforced poly(lactic acid)
biocomposites. J. Compos. Mater. 45, 2455–2463.
MacMillan, J., 2009. Using Silanes as Adhesion Promoters. United Chem. Technol.
Inc. 4–23.
Mahjoub, R., Yatim, J.M., Mohd Sam, A.R., Hashemi, S.H., 2014. Tensile properties
of kenaf fibre due to various conditions of chemical fiber surface modifications.
Constr. Build. Mater. 55, 103–113.
Majeed, K., Jawaid, M., Hassan, A., Abu Bakar, A., Abdul Khalil, H.P.S., Salema,
A.A., Inuwa, I., 2013. Potential materials for food packaging from
nanoclay/natural fibres filled hybrid composites. Mater. Des. 46, 391–410.
Malhotra, S., Goda, K., Sreekala, M.S., 2012. Advances in polymer composites:
Macro- and microcomposites – state of the art, new challenges and opportunities,
in: Introduction to Polymer Composites. 1. 1–16.
Mantia, F.P. La, Morreale, M., 2011. Green composites : A brief review. Compos.
Part A 42, 579–588.
Matusik, J., Stodolak, E., Bahranowski, K., 2011. Synthesis of polylactide/clay

203
composites using structurally different kaolinites and kaolinite nanotubes. Appl.
Clay Sci. 51, 102–109.
Mishra, S., Mohanty, A.K., Drzal, L.T., Misra, M., Hinrichsen, G., 2004. A review on
pineapple leaf fibres, sisal fibres and their biocomposites. Macromol. Mater.
Eng. 289, 955–974.
Mishra, S., Rathore, D.K., Ray, B.C., 2014. A recent understanding on theories of
moisture ingression and its effect on FRP composites. J. Adv. Res. Manuf.
Mater. Sci. Metall. Eng. 1, 29–52.
Mitra, Basak, Sarkar, 1998. Studies on jute-reinforced composites, its limitations, and
some solutions through chemical modifications of fibres. J. Appl. Polym. Sci. 67,
1093–1100.
Mohan, T.P., Kanny, K., 2012. Chemical treatment of sisal fibre using alkali and clay
method. Compos. Part A Appl. Sci. Manuf. 43, 1989–1998.
Mokaloba, N., Batane, R., 2014. The effects of mercerization and acetylation
treatments on the properties of sisal fibre and its interfacial adhesion
characteristics on polypropylene. Int. J. Eng. Sci. Technol. 6, 83–97.
Moshiul Alam, A.K.M., Beg, M.D.H., Reddy Prasad, D.M., Khan, M.R., Mina, M.F.,
2012. Structures and performances of simultaneous ultrasound and alkali treated
oil palm empty fruit bunch fibre reinforced poly(lactic acid) composites.
Compos. Part A Appl. Sci. Manuf. 43, 1921–1929.
Mwaikambo, L.Y., Ansell, M.P., 2002. Chemical modification of hemp, sisal, jute,
and kapok fibres by alkalization. J. Appl. Polym. Sci. 84, 2222–2234.

204
Mwaikambo, L.Y., Ansell, M.P., 1999. The effect of chemical treatment on the
properties of hemp, sisal, jute and kapok for composite reinforcement. Angew.
Makromol. Chemie 272, 108–116.
Mwaikambo, L.Y., Tucker, N., Clark, A.J., 2007. Mechanical properties of hemp-
fibre-reinforced euphorbia composites. Macromol. Mater. Eng. 292, 993–1000.
Nair, K.C.M., Thomas, S., Groeninckx, G., 2001. Thermal and dynamic mechanical
analysis of polystyrene composites reinforced with short sisal fibres. Compos.
Sci. Technol. 61, 2519–2529.
Nampoothiri, K.M., Nair, N.R., John, R.P., 2010. An overview of the recent
developments in polylactide (PLA) research. Bioresour. Technol. 101, 8493–
8501.
NatureWorks LLC, 2013. Ingeo TM
Biopolymer 2003D Technical Data Sheet For
Fresh Food Packaging and Food Serviceware.
Nayak, S.K., Dixit, G., Appu Kuttan, K.K., 2013. Mechanical properties of eco-
friendly recycled polymer composites: A comparative study of theoretical and
experimental results. Int. J. Plast. Technol. 17, 75–93.
Nel, A., 2007. Toxic Potential of Materials. Science. 311, 622–627.
Nishiyama, Y., Kuga, S., Okano, T., 2000. Mechanism of mercerization revealed by
X-ray diffraction. J. Wood Sci. 46, 452–457.
Notta-cuvier, D., Odent, J., Delille, R., Murariu, M., Lauro, F., Raquez, J.M., 2014.
Tailoring polylactide (PLA) properties for automotive applications : Effect of
addition of designed additives on main mechanical properties. Polym. Test. 36,

205
1–9.
Oh, S.Y., Dong, I.Y., Shin, Y., Hwan, C.K., Hak, Y.K., Yong, S.C., Won, H.P., Ji,
H.Y., 2005. Crystalline structure analysis of cellulose treated with sodium
hydroxide and carbon dioxide by means of X-ray diffraction and FTIR
spectroscopy. Carbohydr. Res. 340, 2376–2391.
Ohkita, T., Lee, S.H., 2006. Thermal degradation and biodegradability of poly (lactic
acid)/corn starch biocomposites. J. Appl. Polym. Sci. 100, 3009–3017.
Orue, A., Jauregi, A., Peña-Rodriguez, C., Labidi, J., Eceiza, A., Arbelaiz, A., 2015.
The effect of surface modifications on sisal fibre properties and sisal/poly(lactic
acid) interface adhesion. Compos. Part B Eng. 73, 132–138.
Orue, A., Jauregi, A., Unsuain, U., Labidi, J., Eceiza, A., Arbelaiz, A., 2016. The
effect of alkaline and silane treatments on mechanical properties and breakage of
sisal fibres and poly (lactic acid)/ sisal fibre composites. Compos. - Part A Appl.
Sci. Manuf. 84, 186–195.
Ouajai, S., Shanks, R.A., 2005. Composition, structure and thermal degradation of
hemp cellulose after chemical treatments. Polym. Degrad. Stab. 89, 327–335.
Oza, S., Ning, H., Ferguson, I., Lu, N., 2014. Effect of surface treatment on thermal
stability of the hemp-PLA composites: Correlation of activation energy with
thermal degradation. Compos. Part B Eng. 67, 227–232.
Pandey, J.K., Raghunatha Reddy, K., Pratheep Kumar, A., Singh, R.P., 2005. An
overview on the degradability of polymer nanocomposites. Polym. Degrad. Stab.
88, 234–250.

206
Paraparita, E., Darie, R.N., Popescu, C.M., Uddin, M.A., Vasile, C., 2014. Structure-
morphology-mechanical properties relationship of some
polypropylene/lignocellulosic composites. Mater. Des. 56, 763–772.
Park, S., Baker, J.O., Himmel, M.E., Parilla, P.A., Johnson, D.K., 2010. Cellulose
crystallinity index: measurement techniques and their impact on interpreting
cellulase performance. Biotechnol. Biofuels. 3, 1-10.
Park, S.H., Lee, S.G., Kim, S.H., 2013. Isothermal crystallization behavior and
mechanical properties of polylactide/carbon nanotube nanocomposites. Compos.
Part A Appl. Sci. Manuf. 46, 11–18.
Pasbakhsh, P., Ismail, H., Fauzi, M.N.A., Bakar, A., 2010. EPDM/modified halloysite
nanocomposites. Appl. Clay Sci. 48, 405–413.
Paul, V., Kanny, K., Redhi, G.G., 2015. Mechanical, thermal and morphological
properties of a bio-based composite derived from banana plant source. Compos.
Part A Appl. Sci. Manuf. 68, 90–100.
Pérez, E., Alvarez, V., Pérez, C.J., Bernal, C., 2013. A comparative study of the effect
of different rigid fillers on the fracture and failure behavior of polypropylene
based composites. Compos. Part B Eng. 52, 72–83.
Petinakis, E., Yu, L., Edward, G., Dean, K., Liu, H., Scully, A.D., 2009. Effect of
matrix-particle interfacial adhesion on the mechanical properties of poly(lactic
acid)/wood-flour micro-composites. J. Polym. Environ. 17, 83–94.
Pickering, K.L., Efendy, M.G.A., Le, T.M., 2016. A review of recent developments in
natural fibre composites and their mechanical performance. Compos. Part A
Appl. Sci. Manuf. 83, 98–112.

207
Porras, A., Maranon, A., 2012. Development and characterization of a laminate
composite material from polylactic acid (PLA) and woven bamboo fabric.
Compos. Part B 43, 2782–2788.
Pothan, L.A., Oommen, Z., Thomas, S., 2003. Dynamic mechanical analysis of
banana fibre reinforced polyester composites. Compos. Sci. Technol. 63, 283–
293.
Pothan, L.A., Thomas, S., Groeninckx, G., 2006. The role of fibre/matrix interactions
on the dynamic mechanical properties of chemically modified banana
fibre/polyester composites. Compos. Part A Appl. Sci. Manuf. 37, 1260–1269.
Prashantha, K. Lacrampe, M. F. Krawczak, P., 2011. Processing and characterization
of halloysite nanotubes filled polypropylene nanocomposites based on a
masterbatch route: effect of halloysites treatment on structural and mechanical
properties. Express Polym. Lett. 5, 295–307.
Prashantha, K., Schmitt, H., Lacrampe, M.F., Krawczak, P., 2011. Mechanical
behaviour and essential work of fracture of halloysite nanotubes filled polyamide
6 nanocomposites. Compos. Sci. Technol. 71, 1859–1866.
Ragoubi, M., George, B., Molina, S., Bienaimé, D., Merlin, A., Hiver, J.M., Dahoun,
A., 2012. Effect of corona discharge treatment on mechanical and thermal
properties of composites based on miscanthus fibres and polylactic acid or
polypropylene matrix. Compos. Part A Appl. Sci. Manuf. 43, 675–685.
Rajesh, G., Prasad, A.R., Gupta, A., 2015. Mechanical and degradation properties of
successive alkali treated completely biodegradable sisal fibre reinforced poly
lactic acid composites. J. Reinf. Plast. Compos. 34, 951–961.

208
Ramadevi, P., Sampathkumar, D., Srinivasa, C.V., Bennehalli, B., 2012. Effect of
alkali treatment on water absorption of single cellulosic abaca fibre.
BioResources 7, 3515–3524.
Raquez, J.-M., Habibi, Y., Murariu, M., Dubois, P., 2013. Polylactide (PLA)-based
nanocomposites. Progr Polym Sci 38, 1504–1542.
Rasal, R.M., Janorkar, A. V., Hirt, D.E., 2010. Poly(lactic acid) modifications. Prog.
Polym. Sci. 35, 338–356.
Rathin Datta and Michael Henry, 2006. Lactic acid: recent advances in products,
processes and technologies – a review. J. Chem. Technol. Biotechnol. 81, 1119–
1129.
Ray, D., Sarkar, B.K., Das, S., Rana, A.K., 2002. Dynamic mechanical and thermal
analysis of vinylester-resin-matrix composites reinforced with untreated and
alkali-treated jute fibres. Compos. Sci. Technol. 62, 911–917.
Rittigstein, P., Priestley, R.D., Broadbelt, L.J., Torkelson, J.M., 2007. Model polymer
nanocomposites provide an understanding of confinement effects in real
nanocomposites. Nat. Mater. 6, 278–282.
Rong, M.Z., Zhang, M.Q., Liu, Y., Yang, G.C., Zeng, H.M., 2001. The effect of fibre
treatment on the mechanical properties of unidirectional sisal-reinforced epoxy
composites. Compos. Sci. Technol. 61, 1437–1447.
Rooj, S., Das, A., Thakur, V., Mahaling, R.N., Bhowmick, A.K., Heinrich, G., 2010.
Preparation and properties of natural nanocomposites based on natural rubber
and naturally occurring halloysite nanotubes. Mater. Des. 31, 2151–2156.

209
Rosa, M.F., Chiou, B. S, Medeiros, E.S., Wood, D.F., Williams, T.G., Mattoso,
L.H.C., Orts, W.J., Imam, S.H., 2009. Effect of fibre treatments on tensile and
thermal properties of starch/ethylene vinyl alcohol copolymers/coir
biocomposites. Bioresour. Technol. 100, 5196–5202.
Russo, P., Acierno, D., Rosa, R., Leonelli, C., Corradi, A., Rizzuti, A., 2014.
Mechanical and dynamic-mechanical behavior and morphology of
polystyrene/perovskite composites: Effects of filler size. Surf. Coatings Technol.
243, 65–70.
Saba, N., Jawaid, M., Alothman, O.Y., Paridah, M.T., 2016. A review on dynamic
mechanical properties of natural fibre reinforced polymer composites. Constr.
Build. Mater. 106, 149–159.
Saeidlou, S., Huneault, M.A., Li, H., Park, C.B., 2012. Poly (lactic acid)
crystallization. Prog. Polym. Sci. 37, 1657–1677.
Sanomura, Y., Kawamura, M., 2003. Fiber orientation control of short-fibre
reinforced thermoplastics by ram extrusion. Polym. Compos. 24, 587–596.
Satyanarayana, K.G., Arizaga, G.G.C., Wypych, F., 2009. Biodegradable composites
based on lignocellulosic fibres-An overview. Prog. Polym. Sci. 34, 982–1021.
Sawpan, M.A., 2009. Mechanical Performance of Industrial Hemp Fibre Reinforced
Polylactide and Unsaturated Polyester Composites. PhD Thesis, The University
of Waikato.
Sawpan, M.A., Pickering, K.L., Fernyhough, A., 2011. Effect of fibre treatments on
interfacial shear strength of hemp fibre reinforced polylactide and unsaturated
polyester composites. Compos. Part A Appl. Sci. Manuf. 42, 1189–1196.

210
Semba, T., Kitagawa, K., Ishiaku, U.S., Hamada, H., 2006. The effect of crosslinking
on the mechanical properties of polylactic acid/polycaprolactone blends. J. Appl.
Polym. Sci. 101, 1816–1825.
Serrano, A., Espinach, F.X., Tresserras, J., del Rey, R., Pellicer, N., Mutje, P., 2014.
Macro and micromechanics analysis of short fibre composites stiffness: The case
of old newspaper fibres-polypropylene composites. Mater. Des. 55, 319–324.
Shanmugam, D., Thiruchitrambalam, M., 2013. Static and dynamic mechanical
properties of alkali treated unidirectional continuous palmyra palm leaf stalk
fibre/jute fiber reinforced hybrid polyester composites. Mater. Des. 50, 533–542.
Shelley, J.S., Mather, P.T., DeVries, K.L., 2001. Reinforcement and environmental
degradation of nylon-6/clay nanocomposites. Polymer (Guildf). 42, 5849–5858.
Shinoj, S., Visvanathan, R., Panigrahi, S., Varadharaju, N., 2011. Dynamic
mechanical properties of oil palm fibre (OPF)-linear low density polyethylene
(LLDPE) biocomposites and study of fibre-matrix interactions. Biosyst. Eng.
109, 99–107.
Shukor, F., Hassan, A., Saiful Islam, M., Mokhtar, M., Hasan, M., 2014. Effect of
ammonium polyphosphate on flame retardancy, thermal stability and mechanical
properties of alkali treated kenaf fibre filled PLA biocomposites. Mater. Des. 54,
425–429.
Silva, F. de A., Chawla, N., de Toledo Filho, R.D., 2009. An experimental
investigation of the fatigue behavior of sisal fibres. Mater. Sci. Eng. A 516, 90–
95.
Silva, F.D.A., Chawla, N., Filho, R.D.D.T., 2008. Tensile behavior of high

211
performance natural (sisal) fibres. Compos. Sci. Technol. 68, 3438–3443.
Sing, K.S.W., 1982. Reporting physisorption data for gas/solid systems with special
reference to the determination of surface area and porosity. Pure Appl. Chem. 54,
2201–2218.
Sinha Ray, S., Okamoto, M., 2003. Polymer/layered silicate nanocomposites: A
review from preparation to processing. Prog. Polym. Sci. 28, 1539–1641.
Siqun Wang, Q.C., 2009. A novel process to isolate fibrils from cellulose fibres by
high-intensity ultrasonication, part 1: Process optimization. J. Appl. Polym. Sci.
113, 1270–1275.
Somerville, C.R., Bauer, S., Brininstool, G., Facette, M., Hamann, T., Milne, J.,
Osborne, E., Paredez, A.R., Persson, S., Raab, T., Vorwerk, S., Youngs, H.,
2004. Toward a Systems Approach to Understanding Plant Cell Walls.
ScienceMag 306, 2206–2211.
Sperling, L.H., 2005. Introduction to physical polymer science, Introduction to
Physical Polymer Science.
Sreekala, M.S., Thomas, S., 2003. Effect of fibre surface modification on water-
sorption characteristics of oil palm fibres. Compos. Sci. Technol. 63, 861–869.
Sreenivasan, V.S., Rajini, N., Alavudeen, A., Arumugaprabu, V., 2015. Dynamic
mechanical and thermo-gravimetric analysis of Sansevieria cylindrica/polyester
composite: Effect of fibre length, fibre loading and chemical treatment. Compos.
Part B Eng. 69, 76–86.
Stephanie, L.A., 2014. Chemical modification of lignins: Towards biobased polymers.

212
Prog. Polym. Sci. 39, 1266–1290.
Sudhakara, P., Jagadeesh, D., Wang, Y., Venkata Prasad, C., Devi, A.P.K.,
Balakrishnan, G., Kim, B.S., Song, J.I., 2013. Fabrication of Borassus fruit
lignocellulose fibre/PP composites and comparison with jute, sisal and coir
fibres. Carbohydr. Polym. 98, 1002–1010.
Šutka, A., Kukle, S., Gravitis, J., Grave, L., 2013. Characterization of cellulose
microfibrils obtained from hemp. Conf. Pap. Mater. Sci. 2013, 1–5.
Thomason, J.L., 1997. Thomason J. L., Vlug M. A. Influence of fibre length and
concentration on the properties of glass fibre-reinforced polypropylene: Part 4.
Impact Properties. Compos. Part A 28A, 277–88.
Thommes, M., Kaneko, K., Neimark, A. V., Olivier, J.P., Rodriguez-Reinoso, F.,
Rouquerol, J., Sing, K.S.W., 2015. Physisorption of gases, with special reference
to the evaluation of surface area and pore size distribution (IUPAC Technical
Report). Pure Appl. Chem. 87, 1051–1069.
Tischer, P.C.S.F., Sierakowski, M.R., Westfahl, H., Tischer, C.A., 2010.
Nanostructural reorganization of bacterial cellulose by ultrasonic treatment.
Biomacromolecules 11, 1217–1224.
Tisserat, B., Joshee, N., Mahapatra, A.K., Selling, G.W., Finkenstadt, V.L., 2013.
Physical and mechanical properties of extruded poly(lactic acid)-based
Paulownia elongata biocomposites. Ind. Crops Prod. 44, 88–96.
Tjong, S.C., 2013. Recent progress in the development and properties of novel metal
matrix nanocomposites reinforced with carbon nanotubes and graphene
nanosheets. Mater. Sci. Eng. R Reports 74, 281–350.

213
Vilaseca, F., Valadez-Gonzalez, A., Herrera-Franco, P.J., Pelach, M.A., Lopez, J.P.,
Mutje, P., 2010. Biocomposites from abaca strands and polypropylene. Part I:
Evaluation of the tensile properties. Bioresour. Technol. 101, 387–395.
Vilay, V., Mariatti, M., Mat Taib, R., Todo, M., 2008. Effect of fibre surface
treatment and fibre loading on the properties of bagasse fibre-reinforced
unsaturated polyester composites. Compos. Sci. Technol. 68, 631–638.
Wang, B., Huang, H.-X., 2013. Effects of halloysite nanotube orientation on
crystallization and thermal stability of polypropylene nanocomposites. Polym.
Degrad. Stab. 98, 1601–1608.
Wang, H., Qiu, Z., 2011. Crystallization behaviors of biodegradable poly(l-lactic
acid)/graphene oxide nanocomposites from the amorphous state. Thermochim.
Acta 526, 229–236.
Wootthikanokkhan, J., Cheachun, T., Sombatsompop, N., Thumsorn, S.,
Kaabbuathong, N., Wongta, N., Wong-On, J., Na Ayutthaya, S.I.,
Kositchaiyong, A., 2013. Crystallization and thermomechanical properties of
PLA composites: Effects of additive types and heat treatment. J. Appl. Polym.
Sci. 129, 215–223.
Wu, W., Cao, X., Zhang, Y., He, G., 2013. Polylactide/halloysite nanotube
nanocomposites: Thermal, mechanical properties, and foam processing. J. Appl.
Polym. Sci. 130, 443–452.
Yan, L., Chouw, N., Huang, L., Kasal, B., 2016a. Effect of alkali treatment on
microstructure and mechanical properties of coir fibres , coir fibre reinforced-
polymer composites and reinforced-cementitious composites. Constr. Build.

214
Mater. 112, 168–182.
Yan, L., Kasal, B., Huang, L., 2016b. A review of recent research on the use of
cellulosic fibres, their fibre fabric reinforced cementitious, geo-polymer and
polymer composites in civil engineering. Compos. Part B 92, 94–132.
Yao, Z.T., Chen, T., Li, H.Y., Xia, M.S., Ye, Y., Zheng, H., 2013. Mechanical and
thermal properties of polypropylene (PP) composites filled with modified shell
waste. J. Hazard. Mater. 262, 212–217.
Yeh, S.K., Hsieh, C.C., Chang, H.C., Yen, C.C.C., Chang, Y.C., 2015. Synergistic
effect of coupling agents and fiber treatments on mechanical properties and
moisture absorption of polypropylene-rice husk composites and their foam.
Compos. Part A Appl. Sci. Manuf. 68, 313–322.
Yew, G.H., Mohd Yusof, A.M., Mohd Ishak, Z.A., Ishiaku, U.S., 2005. Water
absorption and enzymatic degradation of poly(lactic acid)/rice starch composites.
Polym. Degrad. Stab. 90, 488–500.
Yu, T., Jiang, N., Li, Y., 2014. Study on short ramie fibre/poly(lactic acid) composites
compatibilized by maleic anhydride. Compos. Part A Appl. Sci. Manuf. 64, 139–
146.
Yuan, P., Southon, P.D., Liu, Z., Green, M.E.R., Hook, J.M., Antill, S.J., Kepert, C.J.,
2008. Functionalization of halloysite clay nanotubes by grafting with 3-
aminopropyltriethoxysilane. J. Phys. Chem. C 112, 15742–15751.
Yuan, P., Tan, D., Annabi-Bergaya, F., 2015. Properties and applications of halloysite
nanotubes: recent research advances and future prospects. Appl. Clay Sci. 112–
113, 75–93.

215
Yussuf, A.A., Massoumi, I., Hassan, A., 2010. Comparison of polylactic Acid/Kenaf
and polylactic Acid/Rise husk composites: The influence of the natural fibres on
the mechanical, thermal and biodegradability properties. J. Polym. Environ. 18,
422–429.
Zhang, L., Ye, X., Xue, S.J., Zhang, X., Liu, D., Meng, R., Chen, S., 2013. Effect of
high-intensity ultrasound on the physicochemical properties and nanostructure of
citrus pectin. J. Sci. Food Agric. 93, 2028–2036.
Zhao, Q., Tao, J., Yam, R.C.M., Mok, A.C.K., Li, R.K.Y., Song, C., 2008.
Biodegradation behavior of polycaprolactone/rice husk ecocomposites in
simulated soil medium. Polym. Degrad. Stab. 93, 1571–1576.
Zhong, L.X., Fu, S.Y., Zhou, X.S., Zhan, H.Y., 2011. Effect of surface
microfibrillation of sisal fibre on the mechanical properties of sisal/aramid fibre
hybrid composites. Compos. Part A Appl. Sci. Manuf. 42, 244–252.
Zhou, F., Cheng, G., Jiang, B., 2014. Effect of silane treatment on microstructure of
sisal fibres. Appl. Surf. Sci. 292, 806–812.
Zhu, C., Richardson, R.M., Potter, K., Koutsomitopoulou, A., Van Duijneveldt, J.S.,
Vincent, S.R., Wanasekara, N.D., Eichhorn, S.J., Rahatekar, S.S., 2016. High
Modulus Regenerated Cellulose Fibres Spun from a Low Molecular Weight
Microcrystalline Cellulose Solution. ACS Sustain. Chem. Eng. 4, 4545–4553.

216
Appendices
Appendix – A
Calculation of the volume fraction of fibres for 10 wt% of sisal fibre loading
Volume fraction of fibres (Vf) can be calculated by using the following equation
1(Messiry, 2013):
𝑉𝑓 =𝑊𝑓 × 𝜌𝑚
(𝜌𝑚 × 𝑊𝑓) + (𝜌𝑓 × 𝑊𝑚)
Whereas ρf and ρm are the density of fibres and matrix respectively. Wf and Wm are
the weight of the fibres and matrix respectively.
ρf = 1.41 g/cm3
ρm = 1.25 g/cm3
Wf = 0.01 kg
Wm = 0.09 kg
𝑉𝑓 =0.01 × 1.25
(1.25 × 0.01) + (1.41 × 0.09)
𝑉𝑓 = 0.089
Calculation of the tensile modulus by Parallel and Series models:
Tensile modulus was calculated by using the equation 2.1 and 2.2
𝑀𝑐 = η𝑒 ∗ 𝑀𝑓 ∗ 𝑉𝑓 + (1 − 𝑉𝑓) ∗ 𝑀𝑚
Where, Mc, Mf and Mm are the modulus of composites, fibre and matrix respectively.
ηe and Vf is the efficiency factor and volume fractions of fibres respectively.
The fibre efficiency factor (ηe) is the product of fibre orientation efficiency factor (η0)
and fibre length efficiency factor (η1). It can be calculated by using eqn 2.3, 2.4, 2.5
and 2.6.
Mf = 16.3 GPa
Mm = 1.052 GPa
Vf = 0.089
ηe = 0.43

217
Parallel model:
𝑀𝑐 = η𝑒 ∗ 𝑀𝑓 ∗ 𝑉𝑓 + (1 − 𝑉𝑓) ∗ 𝑀𝑚
𝑀𝑐 = 0.43 × 16.3 × 0.089 + (1 − 0.089) × 1.052
𝑀𝑐 = 1.03 GPa
Series model:
𝑀𝑐 =𝑀𝑚 × 𝑀𝑓
(𝑀𝑚 × 𝑉𝑓) + 𝑀𝑓(1 − 𝑉𝑓)
𝑀𝑐 =1.052 × 16.3
(1.052 × 0.089) + 16.3(1 − 0.089)
𝑀𝑐 = 1.147 GPa
Hirsch model:
𝑀𝑐 = 𝑥 (𝑀𝑓𝑉𝑓 + 𝑀𝑚(1 − 𝑉𝑓) + (1 − 𝑥) 𝑀𝑚 × 𝑀𝑓
(𝑀𝑚 × 𝑉𝑓) + 𝑀𝑓(1 − 𝑉𝑓)
The factors which control the 𝑥 values are: fibre orientation, fibre length and the
effect of stress concentration of the fibres. The stress transfer factor 𝑥 is
approximately 0.4 which is in agreement with the semi-aligned short fibre reinforced
polymer composites (Kalaprasad et al., 1997).
𝑀𝑐 = 0.4 (16.3 × 0.089 + 1.052(0.911))
+ (0.6) 1.052 × 16.3
(1.052 × 0.089) + 16.3 (0.911)
𝑀𝑐 = 1.652 GPa

218
Appendix – B
Fig. 1.1 Slope of diffusion coefficient of water uptake for pure PLA
Fig. 1.2 Slope of diffusion coefficient of water uptake for PLA + untreated sisal
fibre (10 wt%) composites
10UT: 10 wt% untreated sisal fibres
y = 0.0123x + 0.4932
0
0.1
0.2
0.3
0.4
0.5
0.6
0.7
0.8
0.9
1
0 10 20 30 40 50 60
Pure PLA Linear (Pure PLA)
Time (t1/2)
Mass
up
tak
e (w
t%)
y = 0.0716x + 1.414
0
0.5
1
1.5
2
2.5
3
3.5
4
0 10 20 30 40 50 60
10UT Linear (10UT)
Time (t1/2)
Mass
up
tak
e (w
t%)
Copyright © 2022 FDOKUMEN