Processing and Wear analysis of Blast Furnace Slag Filled Polypropylene Composites Using Taguchi...
35
International Polymer Processing Processing and Wear analysis of Blast Furnace Slag Filled Polypropylene Composites Using Taguchi Model and ANN --Manuscript Draft-- Manuscript Number: IP2841 Full Title: Processing and Wear analysis of Blast Furnace Slag Filled Polypropylene Composites Using Taguchi Model and ANN Article Type: Regular Contributed Article Corresponding Author: prasanta kumar padhi, Ph.D Rourkela Steel Plant Rourkela, ODISHA INDIA Corresponding Author Secondary Information: Corresponding Author's Institution: Rourkela Steel Plant Corresponding Author's Secondary Institution: First Author: prasanta kumar padhi, Ph.D First Author Secondary Information: Order of Authors: prasanta kumar padhi, Ph.D Alok Satapathy, Ph.D Order of Authors Secondary Information: Manuscript Region of Origin: INDIA Abstract: This paper analyses and reports on processing and solid particle erosion wear response of a new class of hybrid composites prepared by reinforcement of short glass fibers (SGF) in blast furnace slag (BFS) filled polypropylene (PP) matrix. In this investigation, composites with different BFS content (0, 10, 20 and 30 wt %) in a polypropylene matrix base, with and without 20 wt% SGF reinforcement, are prepared by injection molding route. To study the erosion wear response of these BFS filled composites, a plan of experiments based on the Taguchi technique is followed to acquire the wear data in a controlled way. This systematic experimentation has led to identification of significant process parameters and material variables that predominantly influence the erosion rate and also enables us to determine optimal parameter settings that lead to minimization of the erosion rate. An artificial neural network (ANN) approach is also implemented to predict the wear rate of the composites. The morphology of eroded surfaces is then examined by scanning electron microscopy (SEM) and possible erosion mechanisms are discussed. This study reveals that addition of blast furnace slag improves the erosion resistance of glass-polypropylene composites significantly and thus makes them suitable for tribological applications. Powered by Editorial Manager® and ProduXion Manager® from Aries Systems Corporation
Transcript of Processing and Wear analysis of Blast Furnace Slag Filled Polypropylene Composites Using Taguchi...

International Polymer Processing
Processing and Wear analysis of Blast Furnace Slag Filled Polypropylene CompositesUsing Taguchi Model and ANN
--Manuscript Draft--
Manuscript Number: IP2841
Full Title: Processing and Wear analysis of Blast Furnace Slag Filled Polypropylene CompositesUsing Taguchi Model and ANN
Article Type: Regular Contributed Article
Corresponding Author: prasanta kumar padhi, Ph.DRourkela Steel PlantRourkela, ODISHA INDIA
Corresponding Author SecondaryInformation:
Corresponding Author's Institution: Rourkela Steel Plant
Corresponding Author's SecondaryInstitution:
First Author: prasanta kumar padhi, Ph.D
First Author Secondary Information:
Order of Authors: prasanta kumar padhi, Ph.D
Alok Satapathy, Ph.D
Order of Authors Secondary Information:
Manuscript Region of Origin: INDIA
Abstract: This paper analyses and reports on processing and solid particle erosion wearresponse of a new class of hybrid composites prepared by reinforcement of short glassfibers (SGF) in blast furnace slag (BFS) filled polypropylene (PP) matrix. In thisinvestigation, composites with different BFS content (0, 10, 20 and 30 wt %) in apolypropylene matrix base, with and without 20 wt% SGF reinforcement, are preparedby injection molding route. To study the erosion wear response of these BFS filledcomposites, a plan of experiments based on the Taguchi technique is followed toacquire the wear data in a controlled way. This systematic experimentation has led toidentification of significant process parameters and material variables thatpredominantly influence the erosion rate and also enables us to determine optimalparameter settings that lead to minimization of the erosion rate. An artificial neuralnetwork (ANN) approach is also implemented to predict the wear rate of thecomposites. The morphology of eroded surfaces is then examined by scanningelectron microscopy (SEM) and possible erosion mechanisms are discussed. Thisstudy reveals that addition of blast furnace slag improves the erosion resistance ofglass-polypropylene composites significantly and thus makes them suitable fortribological applications.
Powered by Editorial Manager® and ProduXion Manager® from Aries Systems Corporation

`
1
Processing and Wear analysis of Blast Furnace Slag Filled
Polypropylene Composites Using Taguchi Model and ANN
Prasanta Kumar Padhia*
, Alok Satapathya
a Department of Mechanical Engg, National Institute of Technology, Rourkela-769008, India
* Corresponding author : Email: [email protected]
Tel No. +916612481385 Fax: +916612462182
Abstract
This paper analyses and reports on processing and solid particle erosion wear response of a new class
of hybrid composites prepared by reinforcement of short glass fibers (SGF) in blast furnace slag (BFS)
filled polypropylene (PP) matrix. In this investigation, composites with different BFS content (0, 10, 20
and 30 wt %) in a polypropylene matrix base, with and without 20 wt% SGF reinforcement, are
prepared by injection molding route. To study the erosion wear response of these BFS filled
composites, a plan of experiments based on the Taguchi technique is followed to acquire the wear data
in a controlled way. This systematic experimentation has led to identification of significant process
parameters and material variables that predominantly influence the erosion rate and also enables us to
determine optimal parameter settings that lead to minimization of the erosion rate. An artificial neural
network (ANN) approach is also implemented to predict the wear rate of the composites. The
morphology of eroded surfaces is then examined by scanning electron microscopy (SEM) and possible
erosion mechanisms are discussed. This study reveals that addition of blast furnace slag improves the
erosion resistance of glass-polypropylene composites significantly and thus makes them suitable for
tribological applications.
Keywords: Polypropylene, Solid Particle erosion, Blast Furnace Slag, Taguchi Method, ANN
ManuscriptClick here to download Manuscript: manuscript.doc

`
2
1. INTRODUCTION
An important feature of fiber reinforced polymers that makes them so promising as engineering
materials is the opportunity to tailor the materials’ properties through the control of fiber and matrix
combinations. In principle, there can be an infinite range of composite types from randomly oriented
chopped fiber based materials at the low property end to continuous unidirectional fiber composites at
the high-performance end. A judicious selection of matrix and the reinforcing phase can lead to a
composite with a combination of strength and modulus comparable to or even better than those of
conventional metallic materials (Jang;1994). The physical and mechanical characteristics of the fiber
reinforced polymers can further be modified by adding a solid filler phase to the matrix body during the
composite preparation and such multi-component composite systems are termed as hybrid composites.
Hard particulate fillers consisting of ceramic or metal particles and fiber fillers made of glass are being
used these days to dramatically improve the wear resistance of composites, even up to three orders of
magnitude (Gregory et al. ; 2003). A possibility that the incorporation of both particles and fibers in
polymer could provide a synergism in terms of improved wear resistance has not been adequately
addressed so far. Attempts to understand the modifications in the tribological behavior of the polymers
with the addition of fillers or fiber reinforcements have been made by a few researchers (Bijwe et al.;
1990, Wang et al. ;2003). The enhancement in tribological properties of poly-phenylene-sulfide (PPS)
with the addition of inorganic fillers has been reported by (Hanmin et al.;1987, Sunkara; 2000).
(Bahadur et al. ;1996) reported that the fillers such as CuS, CuF2, CaS, and CaO reduced the wear rate
of polyamide, but many other fillers such as CaF2 increased the wear rate. But most of the above
studies are confined either to dry sliding or to abrasive wear behavior of composites. The erosive wear
aspects of polymer composites reinforced with both fibers as well as particulates have not been
adequately investigated. In view of the above, the present work studies the effect of inclusion of a
particulate filler (which also happens to be an industrial waste) on the erosive wear behavior of
`
3
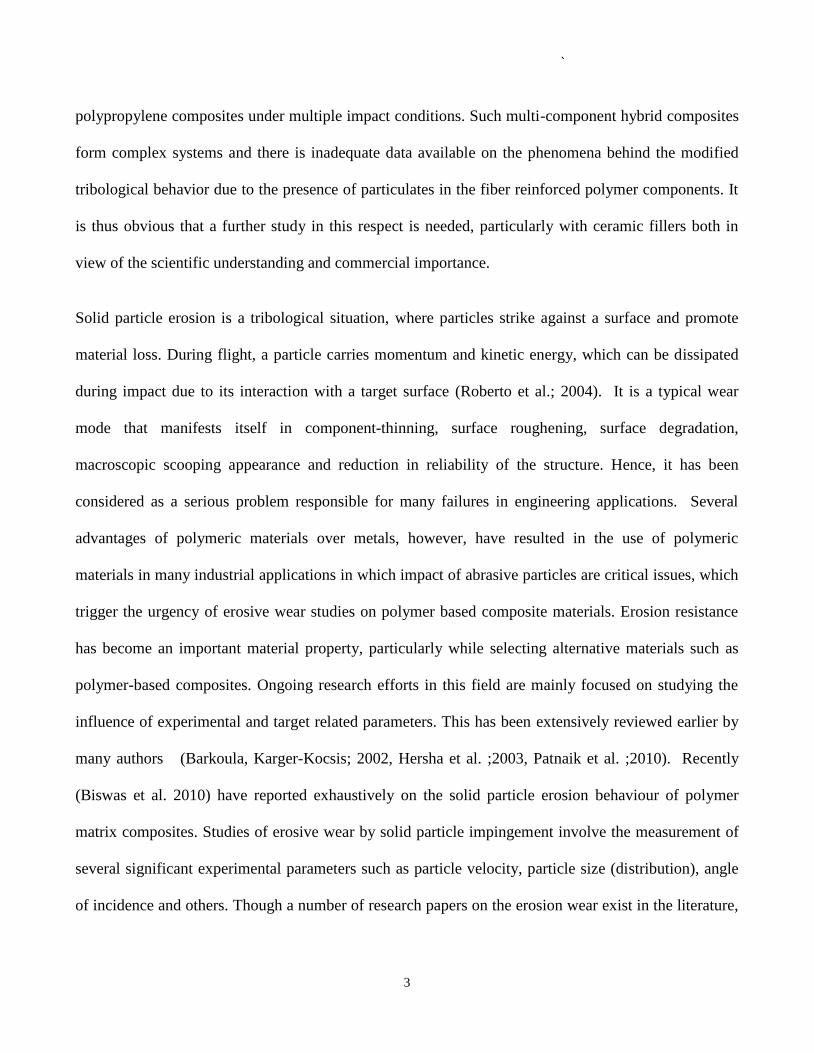
polypropylene composites under multiple impact conditions. Such multi-component hybrid composites
form complex systems and there is inadequate data available on the phenomena behind the modified
tribological behavior due to the presence of particulates in the fiber reinforced polymer components. It
is thus obvious that a further study in this respect is needed, particularly with ceramic fillers both in
view of the scientific understanding and commercial importance.
Solid particle erosion is a tribological situation, where particles strike against a surface and promote
material loss. During flight, a particle carries momentum and kinetic energy, which can be dissipated
during impact due to its interaction with a target surface (Roberto et al.; 2004). It is a typical wear
mode that manifests itself in component-thinning, surface roughening, surface degradation,
macroscopic scooping appearance and reduction in reliability of the structure. Hence, it has been
considered as a serious problem responsible for many failures in engineering applications. Several
advantages of polymeric materials over metals, however, have resulted in the use of polymeric
materials in many industrial applications in which impact of abrasive particles are critical issues, which
trigger the urgency of erosive wear studies on polymer based composite materials. Erosion resistance
has become an important material property, particularly while selecting alternative materials such as
polymer-based composites. Ongoing research efforts in this field are mainly focused on studying the
influence of experimental and target related parameters. This has been extensively reviewed earlier by
many authors (Barkoula, Karger-Kocsis; 2002, Hersha et al. ;2003, Patnaik et al. ;2010). Recently
(Biswas et al. 2010) have reported exhaustively on the solid particle erosion behaviour of polymer
matrix composites. Studies of erosive wear by solid particle impingement involve the measurement of
several significant experimental parameters such as particle velocity, particle size (distribution), angle
of incidence and others. Though a number of research papers on the erosion wear exist in the literature,

`
4
most of them are confined to fiber-reinforced composites and only limited reports are available on
particulate filled polymers or hybrid kind of composites.
Erosion is a nonlinear process with respect to its variables, either materials or operating conditions. In
order to achieve certain values of the erosion rate accurately and repeatedly, the influencing parameters
of the process have to be controlled accordingly. Since the number of such parameters is too large and
the parameter-property correlations are not always known, statistical methods can be employed for
precise identification of significant control parameters for optimization. In recent years, the Taguchi
method has become a widely accepted methodology for improving productivity. This method consists
of a plan of a minimal number of experiments with the objective of acquiring data in a controlled way,
executing these experiments, and analyzing data, in order to obtain information about the behaviour of
a given process. One of the advantages of the Taguchi method over the conventional experiment design
methods is that it minimizes the variability around the target when bringing the performance value to
the target value in addition to keeping the experimental cost and time at the minimum level. Another
advantage is that optimum working conditions determined from the laboratory work can also be
reproduced in the real production environment (Sahin; 2005). Precisely, Taguchi’s design is a simple,
efficient, and systematic approach to optimize designs for performance, quality and cost (Chua et al.
;1993, Phadke; 1989, Prasad et al. ;1997, Taguchi; 1990, Yang, Tam ;1998). Successful
implementation of this method for parametric appraisal of tribological processes has also been reported
by (Mahapatra et al. ;2008, Padhi, Satapathy; 2013a, Padhi, Satapathy; 2013b, Patnaik et al. ;2008,
Satapathy et al.; 2009) . Hence, in this work, the Taguchi experimental design method is adopted to
investigate the effects of the process parameters and material composition on the erosion wear rate of
blast furnace slag reinforced polypropylene composites.
`
5
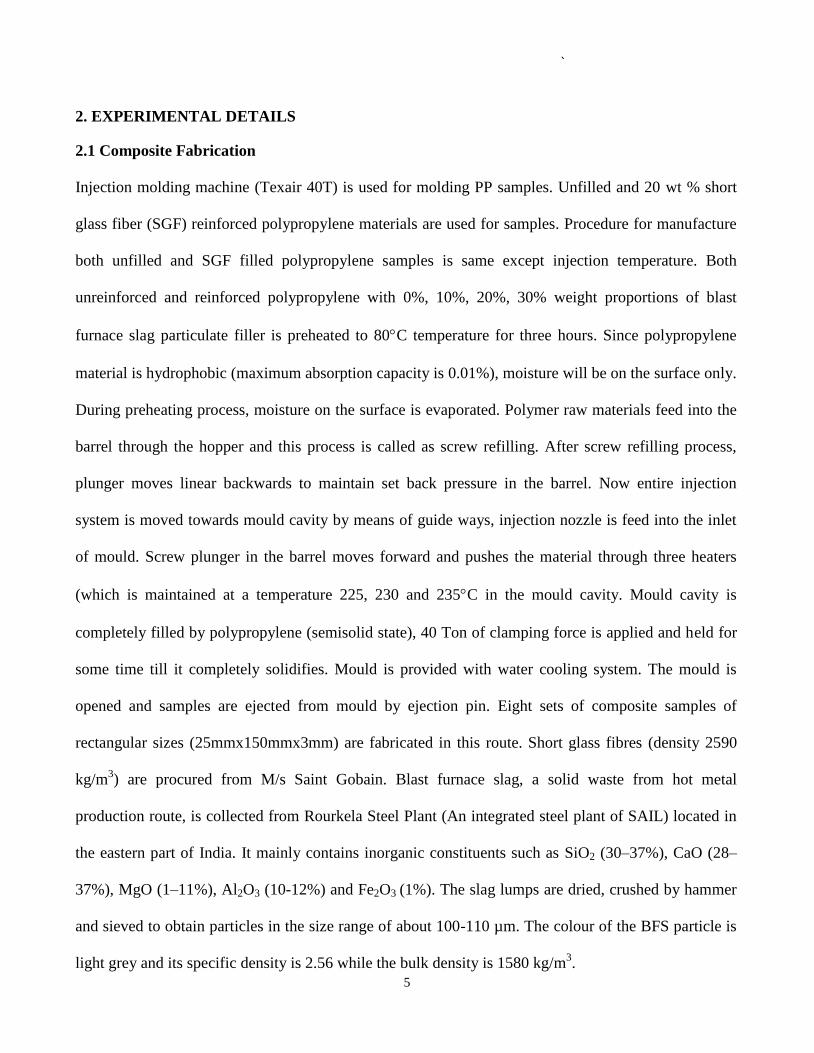
2. EXPERIMENTAL DETAILS
2.1 Composite Fabrication
Injection molding machine (Texair 40T) is used for molding PP samples. Unfilled and 20 wt % short
glass fiber (SGF) reinforced polypropylene materials are used for samples. Procedure for manufacture
both unfilled and SGF filled polypropylene samples is same except injection temperature. Both
unreinforced and reinforced polypropylene with 0%, 10%, 20%, 30% weight proportions of blast
furnace slag particulate filler is preheated to 80C temperature for three hours. Since polypropylene
material is hydrophobic (maximum absorption capacity is 0.01%), moisture will be on the surface only.
During preheating process, moisture on the surface is evaporated. Polymer raw materials feed into the
barrel through the hopper and this process is called as screw refilling. After screw refilling process,
plunger moves linear backwards to maintain set back pressure in the barrel. Now entire injection
system is moved towards mould cavity by means of guide ways, injection nozzle is feed into the inlet
of mould. Screw plunger in the barrel moves forward and pushes the material through three heaters
(which is maintained at a temperature 225, 230 and 235C in the mould cavity. Mould cavity is
completely filled by polypropylene (semisolid state), 40 Ton of clamping force is applied and held for
some time till it completely solidifies. Mould is provided with water cooling system. The mould is
opened and samples are ejected from mould by ejection pin. Eight sets of composite samples of
rectangular sizes (25mmx150mmx3mm) are fabricated in this route. Short glass fibres (density 2590
kg/m3) are procured from M/s Saint Gobain. Blast furnace slag, a solid waste from hot metal
production route, is collected from Rourkela Steel Plant (An integrated steel plant of SAIL) located in
the eastern part of India. It mainly contains inorganic constituents such as SiO2 (30–37%), CaO (28–
37%), MgO (1–11%), Al2O3 (10-12%) and Fe2O3 (1%). The slag lumps are dried, crushed by hammer
and sieved to obtain particles in the size range of about 100-110 µm. The colour of the BFS particle is
light grey and its specific density is 2.56 while the bulk density is 1580 kg/m3.

`
6
2.2 Erosion Test
Erosion tests are carried out using an Air Jet Erosion test rig as per ASTM G 76. Fig. 1 shows the
schematic figure of the erosion test apparatus, which is composed of an air compressor, air drying unit,
a magnetic particle feeder, an air particle mixing and accelerating chamber. Dry compressed air is
mixed with the particles, which are fed at a constant rate from a conveyor belt type feeder in the mixing
chamber and then accelerated by passing the mixture through a converging nozzle of 5 mm diameter.
These accelerated particles impact the specimen, which can hold at various angles with respect to the
impacting particles using an adjustable sample holder. Monitoring the distance between the particle
feeding hopper and belt drive, the particles to the mixing chamber control the feed rate of the particles.
Changing the pressure of the compressed air results in the variation of the impact velocity of the
particles. The velocity of the eroding particles is determined using a rotating disc method. Square
samples of size 25 mm × 25 mm with 3.0 mm of thickness were utilized for erosion tests. The
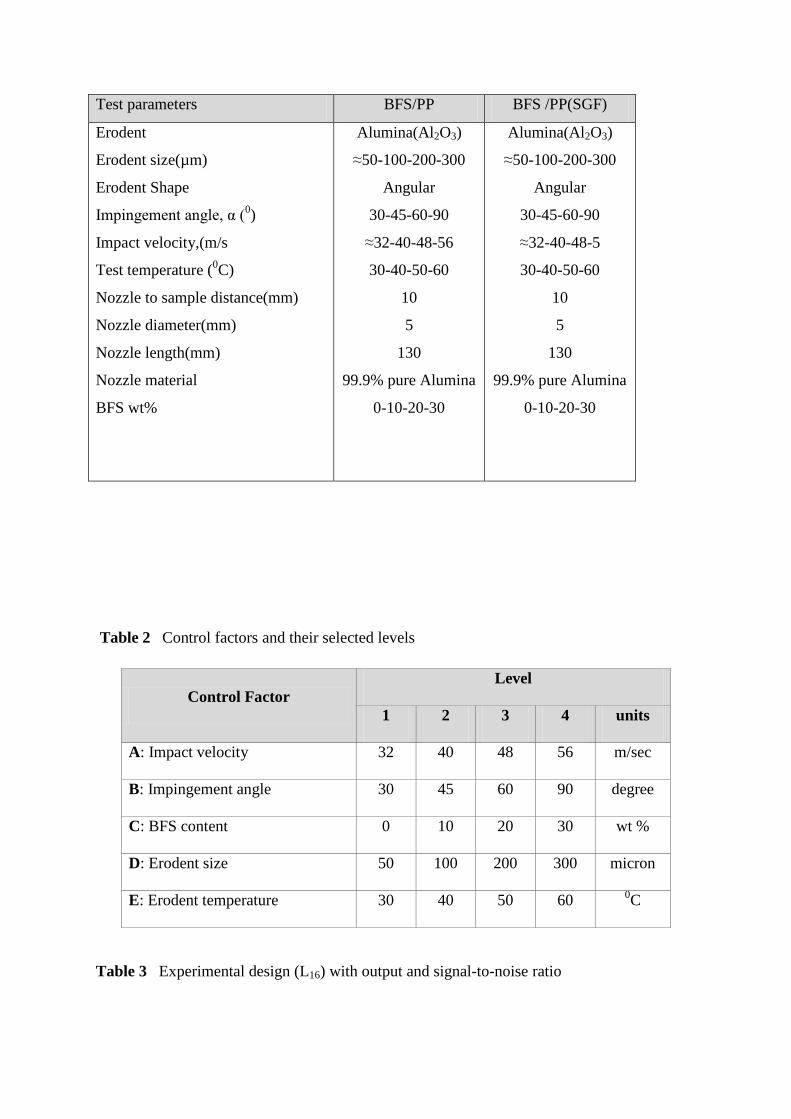
conditions under which erosion tests are carried out are given in Table 1. In the present study, dry
alumina particles of four different size (50, 100, 200 and 300 micron) are used as erodent (Fig.2). A
standard test procedure is employed for each erosion test. The samples are cleaned in acetone, dried
and weighed to an accuracy of ±0.1 mg using a precision electronic balance. These are then eroded in
the test rig and weighed again to determine the weight loss. The ratio of this weight loss to the weight
of the eroding particles causing the loss (testing time × particle feed rate) is then computed as the
dimensionless incremental erosion rate. This procedure is repeated till the erosion rate attains a
constant steady state value.
`
7
2.3 Taguchi Experimental Design
Design of experiment is a powerful analysis tool for modelling and analyzing the influence of control
factors on performance output. The most important stage in the design of experiment lies in the
selection of the control factors. Therefore, a number of factors are included so that non-significant
variables can be identified at the earliest opportunity. The wear tests on the composites are carried out
under different operating conditions considering five parameters, impact velocity, erodent size, erodent
temperature, impingement angle and filler content each at four levels as listed in Table 2 in accordance
with Taguchi’s L16 (44) orthogonal array. The impacts of these five parameters are studied using this
L16 array and the tests are conducted at room temperature as per this experimental design described in
Table 3. In a conventional full factorial experiment design, it would require 45 = 1024 runs to study five
parameters each at four levels whereas, Taguchi’s factorial experiment approach reduces it to only 16
runs offering a great advantage in terms of experimental time and cost. The experimental observations
are further transformed into signal-to-noise (S/N) ratios. The S/N ratio for minimum wear rate can be
expressed as ‘‘smaller is better” characteristic, which is calculated as logarithmic transformation of loss
function as shown below.
[1]
where ‘n’ the number of observations, and y the observed data.
2.4 Prediction Based on Neural Computation
Neural computation based on artificial neural networks or ANN is a technique that involves database training
to predict input–output evolutions. Basically this technology is suitable for some complex, non-linear and multi-
dimensional problems because it is able to imitate the learning capability of human beings. This means the
network can learn directly from the examples without any prior formulae about the nature of the problem and
S 1 210log yN n

`
8
generalize by itself some knowledge, which could be applied for new cases. A neural network is a system
composed of many cross-linked simple processing units called neurons. The network generally consists of three
parts connected in series: input layer, hidden layer and output layer. The coarse information is accepted by the
input layer and processed in the hidden layer. Finally the results are exported via the output layer. A software
package NEURALNET for neural computation using back propagation algorithm is used in this investigation as
the prediction tool for erosive wear rate of the composite samples under various test conditions.
3. RESULTS AND DISCUSSION
3.1 Erosion Test Results
The erosion wear rates obtained for all the 16 test runs for each set of composites along with the corresponding S/N ratios are
presented in Table 3. From this table, the overall mean for the S/N ratio of the wear rate for composites without SGF is found
to be -22.1860 dB and for composites with SGF is -44.7895 dB. This is done using the software MINITAB 14 specifically
used for design-of-experiment applications. The S/N ratio response analysis for the PP composites without SGF (Table 4)
shows that among all the factors, BFS content is the most significant factor followed by the impact velocity while other
factors have relatively less significance on wear rate of the composites under this investigation. The effects of individual
control factors are assessed by calculating the response and the results of response analysis lead to the conclusion that factor
combination of A1, B4, C4, D4 and E4 gives the minimum wear rate for PP composites without SGF and it is evident from Fig.
3. Similarly, Table 5 shows the S/N ratio response analysis for PP composites with SGF which indicates that among all the
factors, BFS content is the most significant factor followed by the impact velocity while other factors have relatively less
significance on wear rate of the composites under this investigation. Here, the factor combination of A1, B2, C4, D4, E4 gives
the minimum wear rate (Fig.4).
3.2 Predictive Equation for Determination of Erosion Rate
In this study, an attempt is made to derive predictive equations in terms of the significant control
factors for determination of erosion rate. The single-objective function requires quantitative
determination of the relationship between erosion rates with combination of control factors. In order to

`
9
express, erosion rate for both the types of composites in the form of a mathematical model, the
following correlation is suggested.
Er = K0 + K1 × A + K2 × B + K3 × C + K4 × D + K5 × E [2]
Here, E is the performance output term and Ki (i = 0, 1…3) are the model constants. The constants are
calculated using non-linear regression analysis with the help of SYSTAT 7 software and the following
relations are obtained.
Er = 2.479 + 0.572 × A + 0.053 × B – 0.802 × C + 0.006 × E [3]
r2=0.988
Er = 132.387 + 4.254 × A + 0.355 × B – 6.566 × C + 0.041× D – 1.137 × E [4]
r2= 0.979
The correctness of the calculated constants is confirmed as high correlation coefficients (r2) in the tune
of 0.988 and 0.979 are obtained for Eq. [3] and Eq. [4] respectively. Here, Eq. [3] and Eq. [4] are the
suggested correlations for predicting erosion rates of PP-BFS composites without and with SGF
respectively.
3.3 Wear Analysis and Prediction using Neural Computation
In the present analysis, the impact velocity, impingement angle, filler content, erodent size and erodent
temperature are taken as the five input parameters. Each of these parameters is characterized by one
neuron in the input layer in the ANN structure. Experimental result sets are used to train the ANN in
order to understand the input–output correlations. The database is then divided into three categories,
namely: (i) a validation category, which is required to define the ANN architecture and adjust the
number of neurons for each layer, (ii) a training category, which is exclusively used to adjust the

`
10
network weights and (iii) a test category, which corresponds to the set that validates the results of the
training protocol. The input variables are normalized so as to lie in the same range group of 0–1. The
outer layer of the network has only one neuron to represent the erosion rate. To train the neural network
used for this work, about 75% of data sets obtained during erosion wear trials on different composite
samples are taken. Different ANN structures with varying number of neurons in the hidden layer are
tested at constant cycles, learning rate, error tolerance, momentum parameter, noise factor and slope
parameter. Based on least error criterion, one structure, shown in Table 6, is selected for training of the
input-output data. The learning rate is varied in the range of 0.001- 0.100 during the training. Neuron
number in the hidden layer is varied and in the optimized structure of the network, this number is 7 for
this case. The number of cycles selected during training is high enough so that the ANN models could
be rigorously trained. A software package NEURALNET for neural computation using back
propagation algorithm is used as the prediction tool for wear rate of the composites within and beyond
the experimental domain.
Table 7 and Table 8 present comparisons between the experimental values and the ANN predicted
results for the erosion wear rates of blast furnace slag filled PP composites without and with SGF. The
percentage errors associated in each test run with respect to the experimental results are also given in
the tables. It is observed that the error in ANN prediction lies in the range of 0 - 5% which establishes
the validity of the neural computation. The prediction curves indicating the effects of filler (BFS)
content on erosion wear rates of polypropylene composites (without SGF reinforcement) at different
impact velocities and BFS content are presented in Figs. 5 and 6 respectively.
Similarly, the effects of impact velocity and BFS content on erosion wear rates of polypropylene
composites (with SGF reinforcement) have been illustrated by the prediction curves given in Figs. 7
and 8 respectively. It is noteworthy that while the erosion rate increases almost exponentially with the

`
11
increase in impact velocity, it is reduced invariably with increase in filler content. The presence of BFS
particles seems to have helped in restricting the mass loss from the composite surface due to erosion
wear. It is seen from all the prediction curves that the wear rate is gradually decreasing with the BFS
content in the matrix indicating an improvement in the wear resistance of the composite.
3.4 Steady State Erosion
The erosion wear response of polymer composites can be grouped into ductile and brittle categories
although this grouping is not definitive because the erosion characteristics depend on the experimental
conditions as much as on the composition of the target material. It is well known that impingement
angle is one of the important parameters in the erosion process and for ductile materials the peak
erosion normally occurs at 15–300
angle while for brittle materials the erosion damage is maximum
usually at normal impact, i.e., at 900 impingement angle.
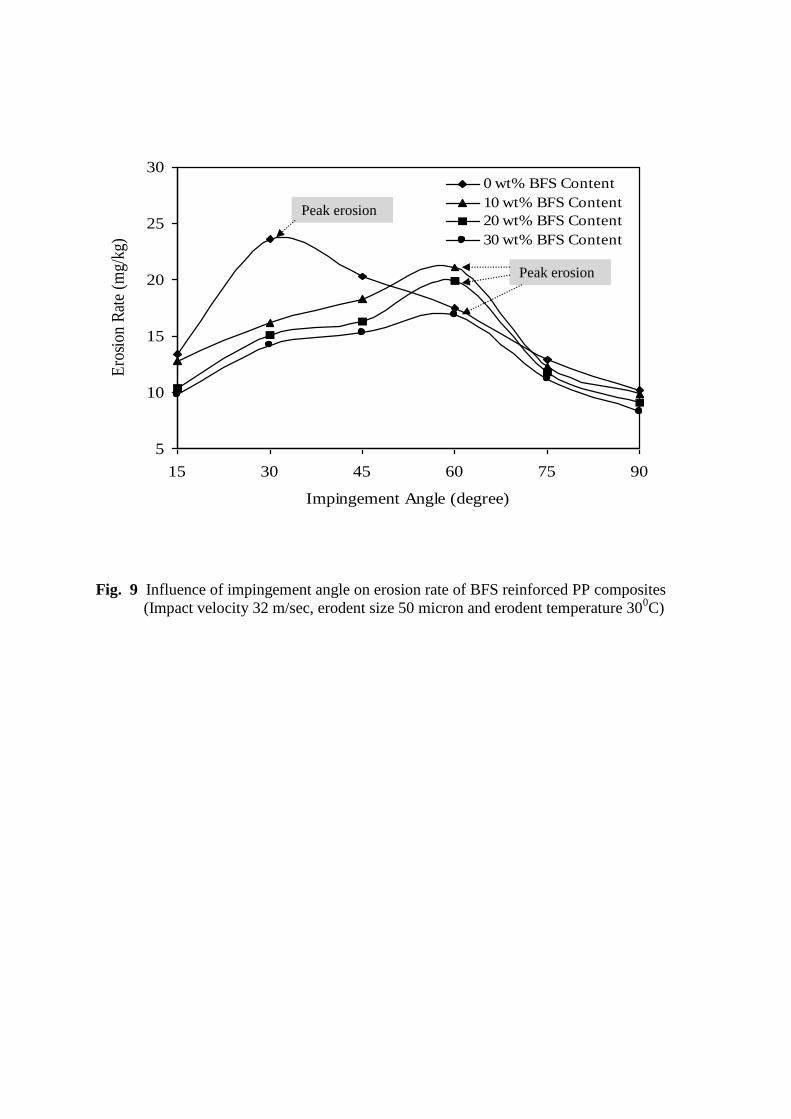
In the present study, the variation of erosion wear rate of the composites with impingement angle is
studied by conducting experiments under specified operating conditions. The results are presented in
Fig. 9 which shows that the peak erosion for neat PP occurs at 300
impingement angle. It is obvious as
thermoplastic polymers exhibit ductile erosion response. But for the BFS filled PP composites, as
shown in Fig. 9, the peak erosion takes place at an impingement angle of 600 irrespective of the filler
weight fraction, indicating a semi-brittle response. This behaviour may be attributed to the
incorporation of hard crystalline BFS particles within the matrix body.
3.5 Morphology of the Worn Surface
The morphology of the worn surface of polypropylene composite with 10wt% BFS is illustrated in Figure 10a.
This micrograph is taken for the surface of the composite eroded with an impact 48 m.s-1 velocity while the
erodent temperature is high (600C). Plastic flow of the matrix material with formation of grooves of sizable
dimension is visible. It is understandable that with a high impact velocity and erodent temperature, the
thermoplastic polypropylene softens due to frictional heat generation. The wear is characterized by the

`
12
obvious material loss from the surface as a result of which these grooves are formed. For composites with 20
wt% BFS, grooves of smaller dimension are seen (Figs. 10b and 10c). These micrographs show clusters of BFS
particulates distributed over the matrix body. These particles by virtue of their size, shape, brittleness and high
hardness influence and modify the wear behavior of the composites. Fig. 10d represents a typical eroded
surface of the composite with 30 wt% BFS. There are traces of plastic deformation but no sign of wear debris
and crater/groove formation.
Fig. 11 presents the SEM of surfaces of the unfilled and BFS filled glass–polypropylene composites
eroded under various test conditions. In Fig. 11a, showing the SEM image of the unfilled glass–
polypropylene composite, chipping off of the matrix body is seen and in the subsequent image Fig.
11b, the broken and partially fragmented glass fibers are clearly visible beneath the chipped off matrix
layer after the impact of erodent particles (temperature 400C) of smaller grit size (100 micron) with a
lower impact velocity (32 m/s) at a low impingement angle of 300. The micrograph with the same
magnification for the BFS (10 wt %) filled glass–polypropylene composite presented in Fig. 11c
distinctly illustrates a crater formed due to material loss and the arrays of broken and semi-broken glass
fibers within. Due to repeated impact of hard erodent particles (at very high impact velocity) there is
initiation of cracks on the fibers and as erosion progresses; these cracks subsequently propagate on the
fiber bodies both in transverse as well as in longitudinal manner. The presence of BFS particles and
cracks on them resulting from absorption of particle impact are also seen.
But as the erosion tests are carried out on the composite with high BFS content the morphology of the
eroded surface becomes different as in Fig. 11d. It shows signs of plastic deformation of the matrix
material. The broken fiber and BFS filler fragments are mixed with the matrix micro-flake debris and
the damage of the composite is characterized by separation and detachment of this debris. But it is
noteworthy that the extent of surface damage in this case is relatively lower even though the erosion

`
13
trial has been conducted with 300 micron sized erodent at very high impact velocity. The reduction in
material degradation from the composite may be attributed to the inclusion of hard BFS particles
distributed throughout the soft polypropylene matrix. During the erosion process, the BFS particles
absorb a good part of the kinetic and thermal energy associated with the erodent. This results in less
amount of energy being available to be absorbed by the matrix body and the reinforcing fiber phase.
4. CONCLUSIONS
Based on the research presented in this article the following conclusions are drawn:
1. These composites suitable for applications in highly erosive environments can be prepared by
reinforcement of short glass fibers and filling of micro-sized blast furnace slag particles in
polypropylene resin. The experimental results support the conclusion that blast furnace slag can
be used as a potential filler material in thermoplastic polymers for producing wear-resistant
composites.
2. Erosion characteristics of these composites can be successfully analyzed using a Taguchi
experimental design scheme. The factors like BFS content, impact velocity and impingement
angle show significant contributions to the erosion rate for composites both with and without
short glass fibers.
3. A study of influence of impingement angle on erosion rate of the composites filled with
different weight percentage of BFS reveals their semi-brittle response with respect to erosion
wear. The peak erosion rate is found to occur at 600
impingement angle for all BFS filled
composite samples under various experimental conditions.
4. This article illustrates that the use of a neural network model to simulate experiments with
parametric design strategy is effective and helps to predict the solid particle erosion response of
`
14
blast furnace slag filled composites under different test conditions within and beyond the
experimental domain.
5. The predicted and the experimental values of erosion wear rate exhibit good agreement and
validate the remarkable capability of a well trained neural network for these kinds of processes.
References
Bahadur S., .Gong D, Anderegg ,J. “Investigation of the Influence of CaS, CaO, and CaF2 Fillers
on the Transfer and Wear of Nylon by Microscopy and XPS Analysis”, Wear, 197, 271–279
(1996).
Barkoula N. M., Karger-Kocsis J., “Review—Processes and Influencing Parameters of the Solid
Particle Erosion of Polymers and Their Composites”, J. Mater. Sci. , 37, 3807–3820 (2002).
Bijwe J., Logani C. M., Tewari U. S., “Influence of Fillers and Fiber Reinforcement on Abrasive
Wear Resistance of Some Polymeric Composites”, Wear, 138, 77–92 (1990).
Biswas S., Satapathy A., Patnaik A., “Erosion Wear Behaviour of Polymer Composites: A
Review”, J. Reinf. Plast. Compos., 29 ,2898-2924 (2010).
Chua M. S, Rahman M., Wong Y.S., Loh H.T., “Determination of Optimal Cutting Conditions
Using Design of Experiments and Optimization Techniques”, Int. J. Mach. Tools Manuf., 32(2),
297-305 (1993).
Gregory S. W., Freudenberg K. D., Bhimaraj P., Schadler L. S., “A Study on the Friction and Wear
Behavior of PTFE Filled With Alumina Nanoparticles,” Wear, 254, 573–580 (2003).
Hanmin Z., Guoren H., Guicheng Y., “ Friction and Wear of Poly(Phenylene Sulfide) and Its
Carbon Fiber Composites: I Unlubricated”, Wear, 11,6, 59–68 (1987).
Harsha A. P., Tewari U. S., Venkataraman B., “Solid Particle Erosion Behaviour of Various
Polyaryletherketone Composites”, Wear, 254, 693–712 (2003).
`
15
Jang, B. Z. “Advanced Polymer Composites: Principles and Applications”, ASM International
185–197 (1994).
Mahapatra S. S., Patnaik A., Satapathy A., Dash R. R., “Taguchi Method Applied to Parametric
Appraisal of Erosion Behavior of GF Reinforced Polyester Composites”, Wear, 265 , 214–222
(2008).
Padhi P.K., Satapathy A. and Nakka A.M. “Proceesing, characterization, andwear analysis of short
glass-fiber reinforced polypropylene composites filled withblast furnace slag”. J. Thermoplast.
Compos., DOI:10.1177/0892705713486142 (2013).
Padhi P.K. and Satapathy A. “Analysis of Sliding Wear Characteristics of BFSfilled Composites
using an Experimental Design Approach integrated with ANN”. Trib. Trans. , DOI:
10.1080/10402004.2013.798448 , (2013).
Patnaik A., Satapathy A. , Chand N. , Barkoula N.M., Biswas S., “Solid particle erosion wear
characteristics of fiber and particulate filled polymer composites: A review”, Wear, 268 249–
263(2010).
Phadke M.S., “Quality Engineering using Robust Design” AT&T, Bell Laboratories Report. NJ:
Prentice-Hall International Editions, 1989.
Patnaik A., , Satapathy A., Mahapatra S. S, Dash R. R., “A Modeling Approach for Prediction of
Erosion Behavior of Glass Fiber-Polyester Composites”, J. Polym. Res., 15 , 147–160 (2008).
Prasad B.K., Das S., Jha A.K.., Modi O.P., Dasgupta R., Yegneswaran A.H., “Factors Controlling
the Abrasive Wear Response of a Zinc based Alloys Silicon Carbide Particle Composite,” Compos.
Part A ,28A, 301-8 (1997).
`
16
Roberto J., Branco T., Gansert R., Sampath S., Berndt C.C., Herman H., “Solid Particle Erosion of
Plasma Sprayed Ceramic Coatings”, Mater. Res. ,147-153 , (2004).
Sahin Y., “The Prediction of Wear Resistance Model for the Metal Matrix Composites”, Wear,
258, 1717-1722 (2005).
Satapathy A., Patnaik A., Pradhan M. K., , “A study on processing, characterization and erosion behavior of
fish (Labeo-rohita) scale filled epoxy matrix composites”, Mater. Des. , 30 , 2359–2371 (2009).
Sunkara, C.: “The Role of Particulate Inorganic Fillers on the Tribological Behavior of
Polyphenylene Sulfide”, MS thesis, Iowa State University, Ames, IA. (2000).
Taguchi, G. “Introduction to Quality Engineering, Asian Productivity Organization”, Tokyo,
1990.
Wang J., Gu M., Songhao B., .Ge S, “Investigation of the Influence of MoS2 Filler on the
Tribological Properties of Carbon Fiber Reinforced Nylon 1010 Composites”, Wear, 255, 774–779
(2003).
Yang W.H, Tarn Y.S., “Design Optimization of Cutting Parameters for Turning Operations Based
on the Taguchi Method”, J. Mater. Process. Technol. , 84, 21-129 (1998).

`
17

List of Figures:
1. Schematic of the Air Jet Type Erosion test rig
2. SEM images of erodent (50μm Al2O3) particles with different magnifications
3. Main effect plots (PP/BFS without SGF)
4. Main effect plots (PP/BFS with SGF)
5. ANN prediction values of erosion rate with impact velocities at different filler
content for composites without SGF (at 45 degree impingement angle, 100 micron
erodent size and 300C erodent temperature)
6. ANN prediction values of erosion rate with BFS filler content at different impact
velocities for composites without SGF (at 45 degree impingement angle, 100
micron erodent size and 300C erodent temperature)
7. ANN prediction values of erosion rate with impact velocities at different filler
content for composites with SGF (at 45 degree impingement angle, 100 micron
erodent size and 300C erodent temperature)
8. ANN prediction values of erosion rate with impact velocities at different filler
content for composites with SGF (at 45 degree impingement angle, 100 micron
erodent size and 300C erodent temperature)
9. Influence of impingement angle on erosion rate of BFS reinforced PP Composites
(Impact velocity 32 m/sec, erodent size 50 micron and erodent temperature 300C)
10. Morphology of eroded surfaces of BFS filled PP composites
11. Morphology of eroded surfaces of SGF reinforced BFS filled PP composites
Figure
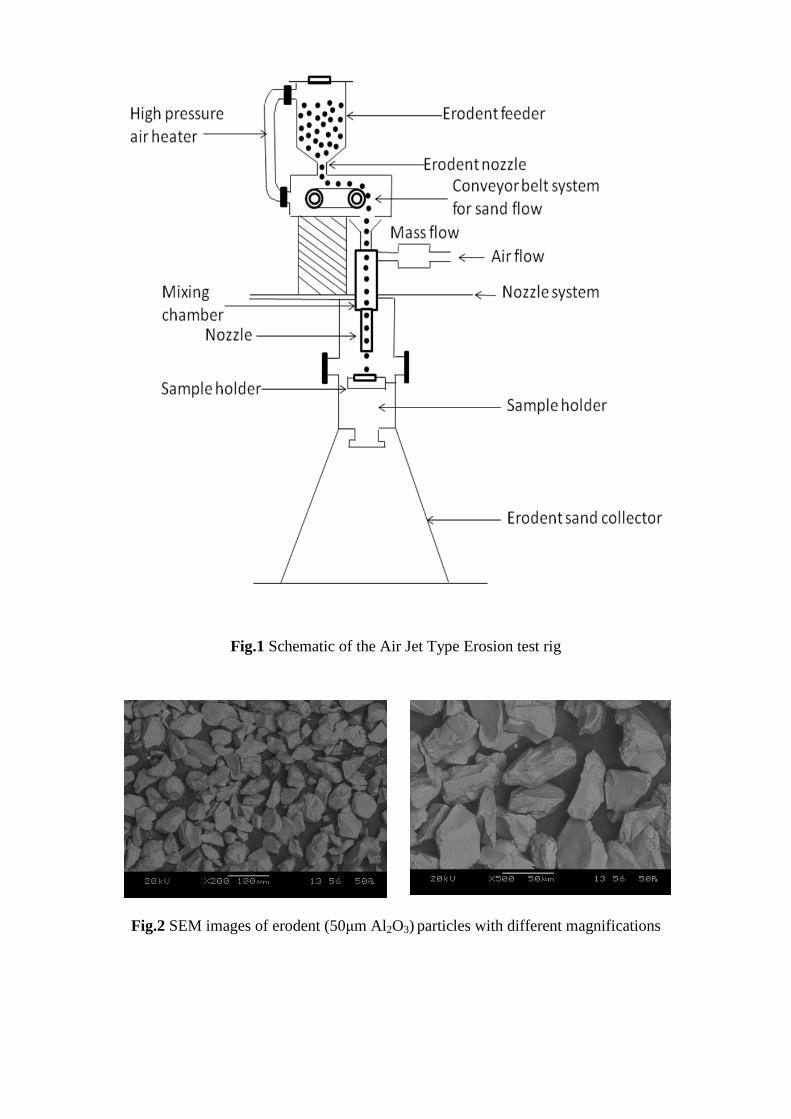
Fig.1 Schematic of the Air Jet Type Erosion test rig
Fig.2 SEM images of erodent (50μm Al2O3) particles with different magnifications

Me
an
of
SN
ra
tio
s
56484032
-15
-20
-25
-30
90604530 3020100
30020010050
-15
-20
-25
-30
60504030
A B C
D E
Main Effects Plot (data means) for SN ratios
Signal-to-noise: Smaller is better
Fig.3 Main effect plots (PP/BFS without SGF)
Me
an
of
SN
ra
tio
s
56484032
-40.0
-42.5
-45.0
-47.5
-50.0
90604530 3020100
30020010050
-40.0
-42.5
-45.0
-47.5
-50.0
60504030
A B C
D E
Main Effects Plot (data means) for SN ratios
Signal-to-noise: Smaller is better
Fig. 4 Main effect plots (PP/BFS with SGF)
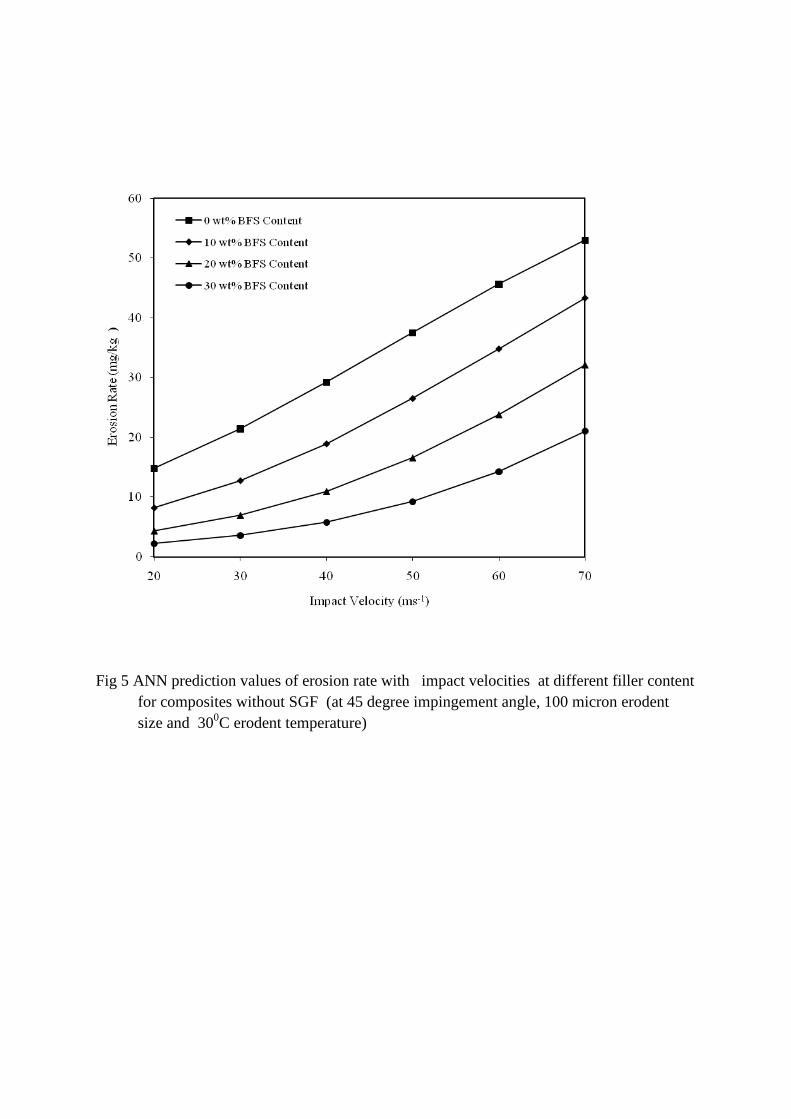
Fig 5 ANN prediction values of erosion rate with impact velocities at different filler content
for composites without SGF (at 45 degree impingement angle, 100 micron erodent
size and 300C erodent temperature)

Fig . 6 ANN predictions of erosion rates with BFS content at different impact velocities for
composites without SGF (at 450 impingement angle, 100 micron erodent size and
300C erodent temperature)
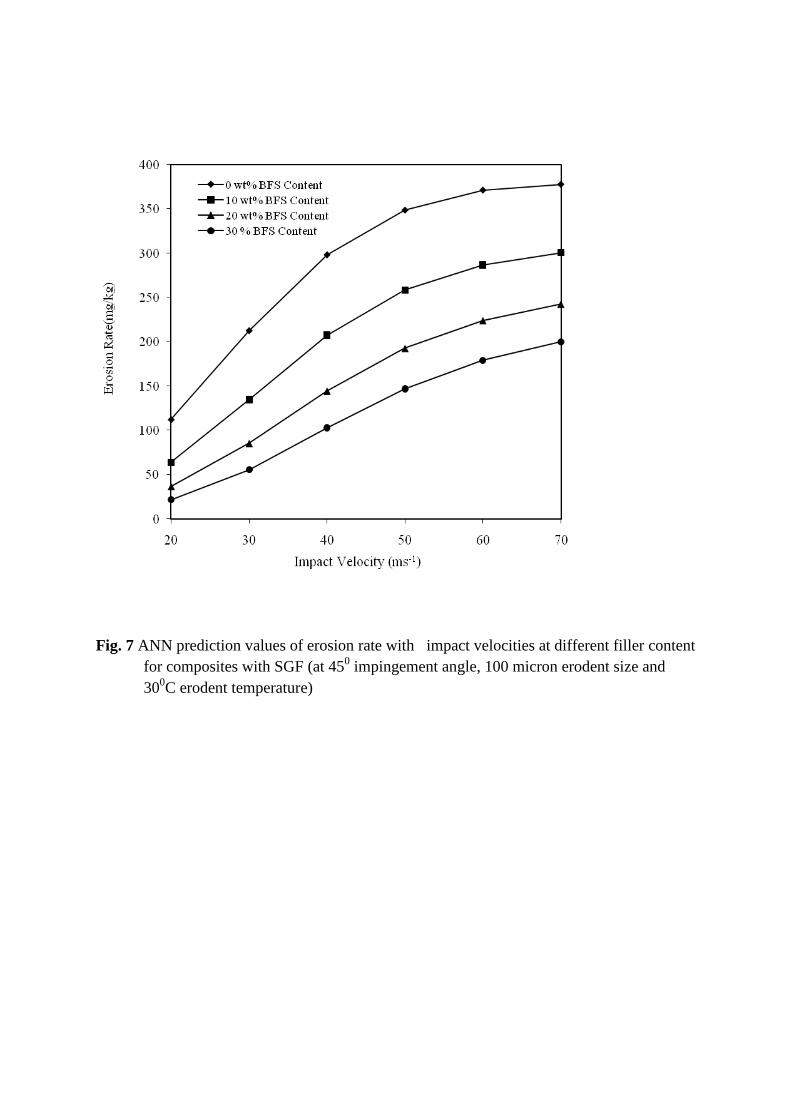
Fig. 7 ANN prediction values of erosion rate with impact velocities at different filler content
for composites with SGF (at 450 impingement angle, 100 micron erodent size and
300C erodent temperature)
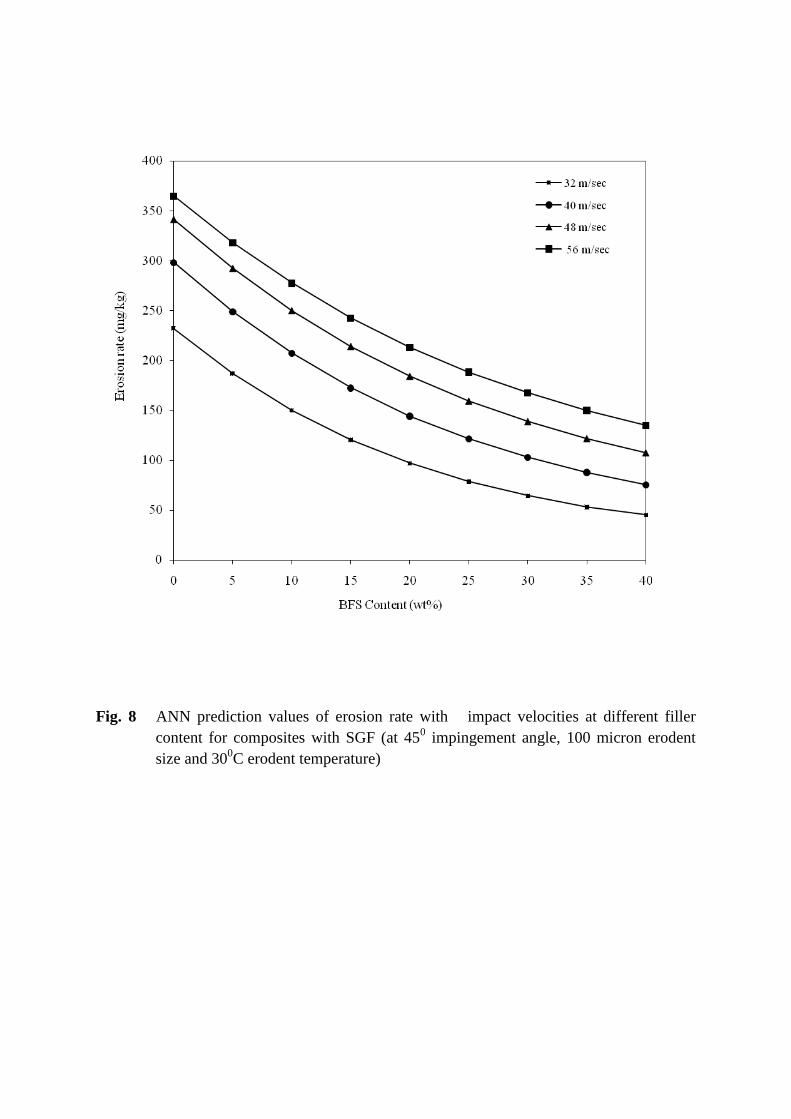
Fig. 8 ANN prediction values of erosion rate with impact velocities at different filler
content for composites with SGF (at 450 impingement angle, 100 micron erodent
size and 300C erodent temperature)
5
10
15
20
25
30
15 30 45 60 75 90
Impingement Angle (degree)
Ero
sion
Rat
e (m
g/kg
)
0 wt% BFS Content
10 wt% BFS Content
20 wt% BFS Content
30 wt% BFS Content
Fig. 9 Influence of impingement angle on erosion rate of BFS reinforced PP composites
(Impact velocity 32 m/sec, erodent size 50 micron and erodent temperature 300C)
Peak erosion
Peak erosion
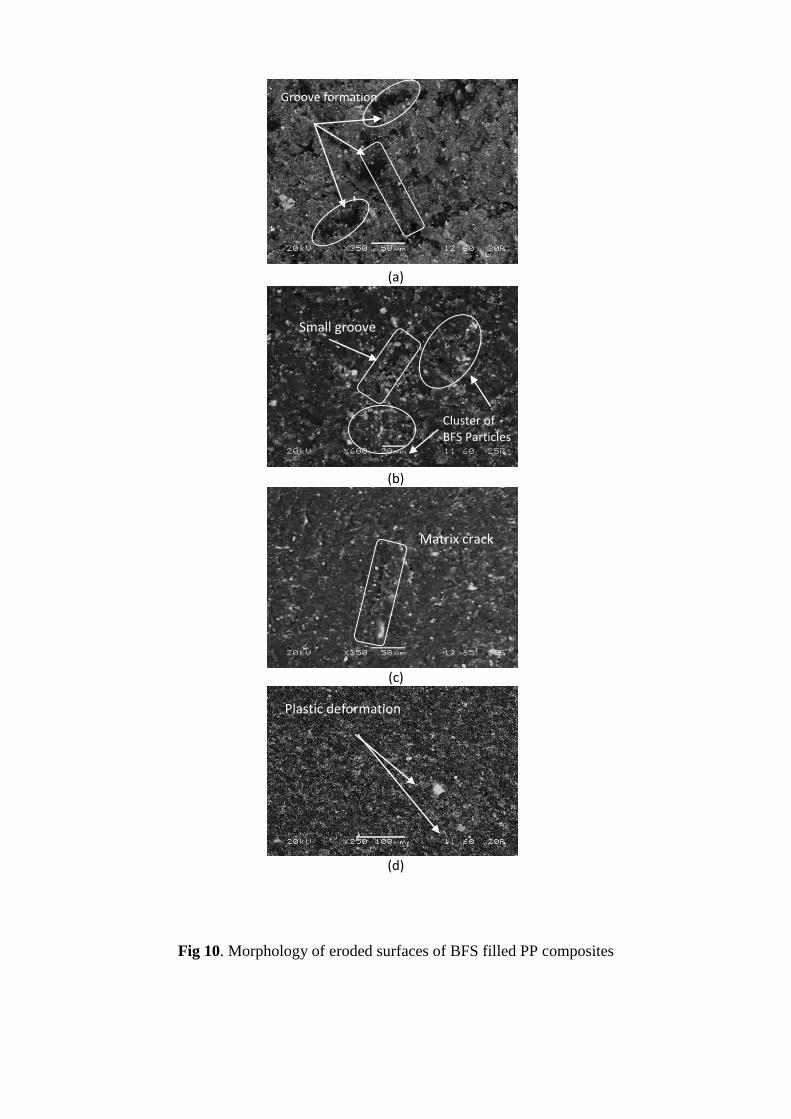
Fig 10. Morphology of eroded surfaces of BFS filled PP composites
(a)
(b)
(c)
(d)
Groove formation
Small groove
Cluster of BFS Particles
Matrix crack
Plastic deformation
in the matrix body

(a)
(b)
(c )
(d)
Fig. 11 Morphology of eroded surfaces of SGF reinforced BFS filled PP composites
Crack formation in particulate filler
Fiber Crack
Plastic flow of matrix material
Transverse Crack in Fiber
Broken Fiber
Matrix chipping off
BFS particles


List of Tables:
1 Erosion test conditions
2 Control factors and their selected levels
3 Experimental design (L16) with output and signal-to-noise ratio
4 Response Table for Signal to Noise Ratios Smaller is better (PP/BFS without SGF)
5 Response Table for Signal to Noise Ratios Smaller is better (PP/BFS with SGF)
6 Input parameters selected for training
7 Comparison of experimental results with ANN predicted values
(Composites without short glass fiber)
8 Comparison of experimental results with ANN predicted values
(Composites with short glass fiber)
Table 1 Erosion test conditions
Table
Test parameters BFS/PP BFS /PP(SGF)
Erodent
Erodent size(µm)
Erodent Shape
Impingement angle, α (0)
Impact velocity,(m/s
Test temperature (0C)
Nozzle to sample distance(mm)
Nozzle diameter(mm)
Nozzle length(mm)
Nozzle material
BFS wt%
Alumina(Al2O3)
≈50-100-200-300
Angular
30-45-60-90
≈32-40-48-56
30-40-50-60
10
5
130
99.9% pure Alumina
0-10-20-30
Alumina(Al2O3)
≈50-100-200-300
Angular
30-45-60-90
≈32-40-48-5
30-40-50-60
10
5
130
99.9% pure Alumina
0-10-20-30
Table 2 Control factors and their selected levels
Table 3 Experimental design (L16) with output and signal-to-noise ratio
Control Factor
Level
1 2 3 4 units
A: Impact velocity 32 40 48 56 m/sec
B: Impingement angle 30 45 60 90 degree
C: BFS content 0 10 20 30 wt %
D: Erodent size 50 100 200 300 micron
E: Erodent temperature 30 40 50 60 0C
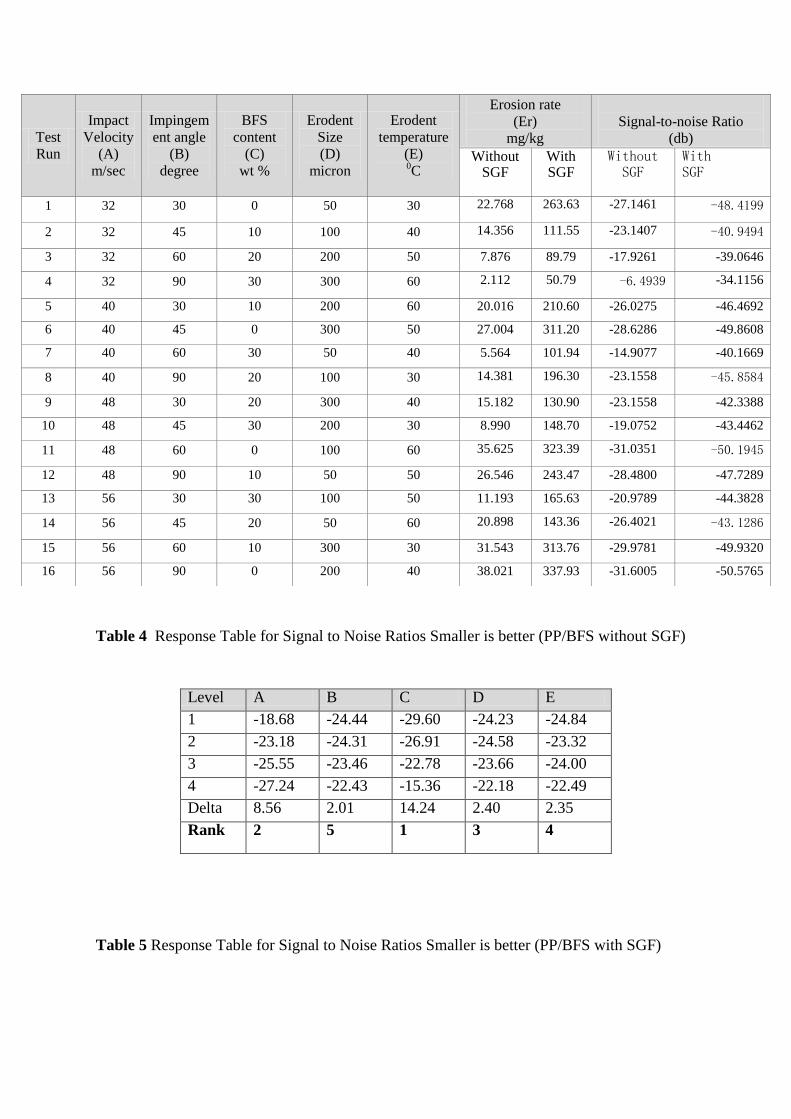
Table 4 Response Table for Signal to Noise Ratios Smaller is better (PP/BFS without SGF)
Table 5 Response Table for Signal to Noise Ratios Smaller is better (PP/BFS with SGF)
Test
Run
Impact
Velocity
(A)
m/sec
Impingem
ent angle
(B)
degree
BFS
content
(C)
wt %
Erodent
Size
(D)
micron
Erodent
temperature
(E) 0C
Erosion rate
(Er)
mg/kg
Signal-to-noise Ratio
(db)
Without SGF
With SGF
Without SGF
With SGF
1 32 30 0 50 30 22.768 263.63 -27.1461 -48.4199
2 32 45 10 100 40 14.356 111.55 -23.1407 -40.9494
3 32 60 20 200 50 7.876 89.79 -17.9261 -39.0646
4 32 90 30 300 60 2.112 50.79 -6.4939 -34.1156
5 40 30 10 200 60 20.016 210.60 -26.0275 -46.4692
6 40 45 0 300 50 27.004 311.20 -28.6286 -49.8608
7 40 60 30 50 40 5.564 101.94 -14.9077 -40.1669
8 40 90 20 100 30 14.381 196.30 -23.1558 -45.8584
9 48 30 20 300 40 15.182 130.90 -23.1558 -42.3388
10 48 45 30 200 30 8.990 148.70 -19.0752 -43.4462
11 48 60 0 100 60 35.625 323.39 -31.0351 -50.1945
12 48 90 10 50 50 26.546 243.47 -28.4800 -47.7289
13 56 30 30 100 50 11.193 165.63 -20.9789 -44.3828
14 56 45 20 50 60 20.898 143.36 -26.4021 -43.1286
15 56 60 10 300 30 31.543 313.76 -29.9781 -49.9320
16 56 90 0 200 40 38.021 337.93 -31.6005 -50.5765
Level A B C D E
1 -18.68 -24.44 -29.60 -24.23 -24.84
2 -23.18 -24.31 -26.91 -24.58 -23.32
3 -25.55 -23.46 -22.78 -23.66 -24.00
4 -27.24 -22.43 -15.36 -22.18 -22.49
Delta 8.56 2.01 14.24 2.40 2.35
Rank 2 5 1 3 4
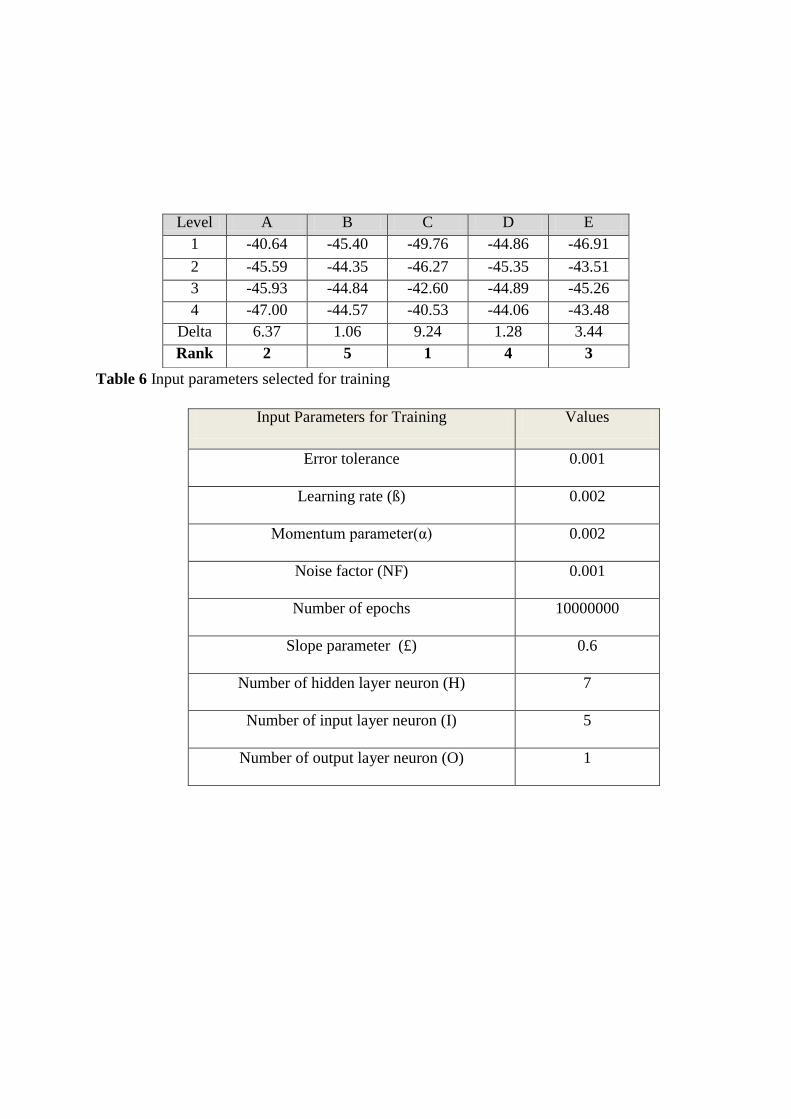
Table 6 Input parameters selected for training
Level A B C D E
1 -40.64 -45.40 -49.76 -44.86 -46.91
2 -45.59 -44.35 -46.27 -45.35 -43.51
3 -45.93 -44.84 -42.60 -44.89 -45.26
4 -47.00 -44.57 -40.53 -44.06 -43.48
Delta 6.37 1.06 9.24 1.28 3.44
Rank 2 5 1 4 3
Input Parameters for Training Values
Error tolerance 0.001
Learning rate (ß) 0.002
Momentum parameter(α) 0.002
Noise factor (NF) 0.001
Number of epochs 10000000
Slope parameter (£) 0.6
Number of hidden layer neuron (H) 7
Number of input layer neuron (I) 5
Number of output layer neuron (O) 1

Table 7 Comparison of experimental results with ANN predicted values
(Composites without glass fiber)
Test Run Erosion Rate ( mg/kg) Error percentage (%) Values from
ANN Prediction
Values from Predictive Equation
Experimental Values
ANN Prediction
Predictive Equation
1 22.891 22.553 22.768 0.5 0.95
2 13.902 15.388 14.356 3.0 7.18
3 7.851 8.223 7.876 0.5 4.40
4 2.048 1.853 2.112 3.0 12.37
5 19.053 19.289 20.016 5.0 3.64
6 28.364 28.044 27.004 5.0 3.85
7 5.726 4.719 5.564 3.0 15.20
8 13.926 14.289 14.381 3.2 0.64
9 15.602 15.725 15.182 2.76 3.57
10 8.773 8.441 8.990 1.44 6.12
11 35.869 33.475 35.625 0.68 6.04
12 26.421 22.409 26.546 0.47 15.19
13 12.060 12.341 11.193 3.26 10.25
14 20.594 21.236 20.898 1.46 3.11
15 30.596 29.851 31.543 3.0 5.37
16 39.151 39.521 38.021 2.97 3.94
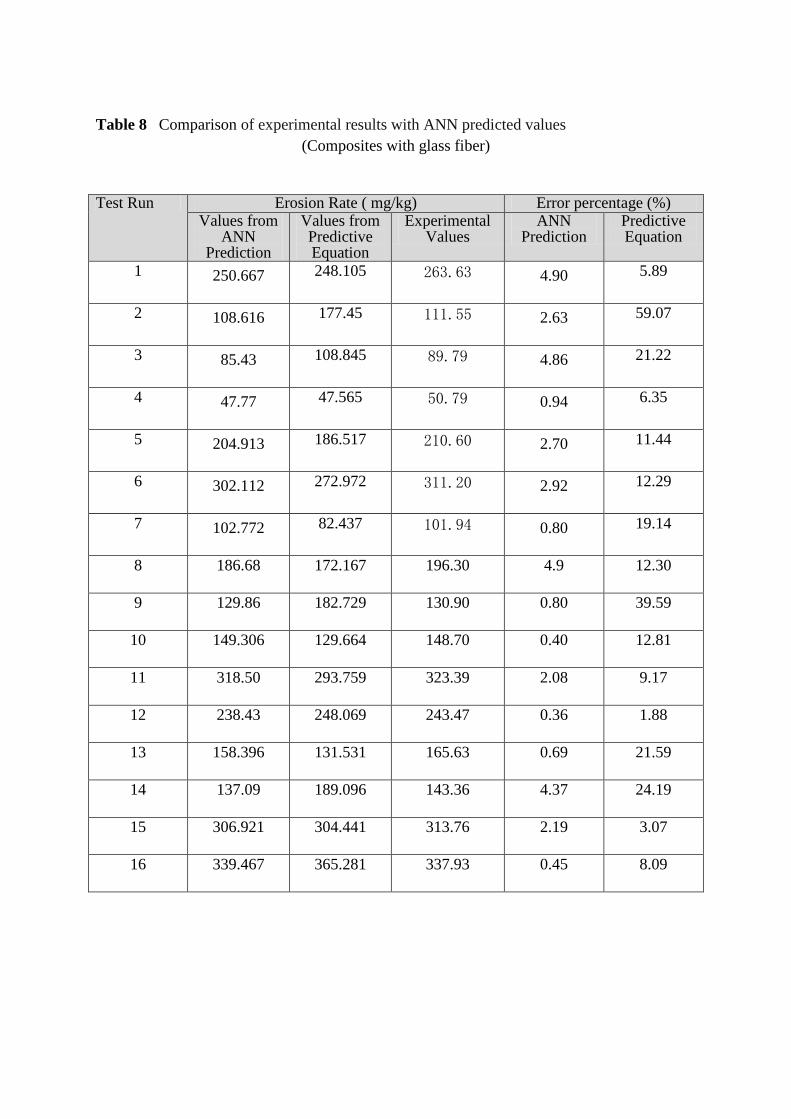
Table 8 Comparison of experimental results with ANN predicted values
(Composites with glass fiber)
Test Run Erosion Rate ( mg/kg) Error percentage (%)
Values from ANN
Prediction
Values from Predictive Equation
Experimental Values
ANN Prediction
Predictive Equation
1 250.667 248.105 263.63 4.90 5.89
2 108.616 177.45 111.55 2.63 59.07
3 85.43 108.845 89.79 4.86 21.22
4 47.77 47.565 50.79 0.94 6.35
5 204.913 186.517 210.60 2.70 11.44
6 302.112 272.972 311.20 2.92 12.29
7 102.772 82.437 101.94 0.80 19.14
8 186.68 172.167 196.30 4.9 12.30
9 129.86 182.729 130.90 0.80 39.59
10 149.306 129.664 148.70 0.40 12.81
11 318.50 293.759 323.39 2.08 9.17
12 238.43 248.069 243.47 0.36 1.88
13 158.396 131.531 165.63 0.69 21.59
14 137.09 189.096 143.36 4.37 24.19
15 306.921 304.441 313.76 2.19 3.07
16 339.467 365.281 337.93 0.45 8.09