Iron, Steel & Scrap and Slag - Indian Bureau of Mines
33
Indian Minerals Yearbook 2019 (Part- II : Metals & Alloys) 58 th Edition IRON, STEEL & SCRAP AND SLAG (ADVANCE RELEASE) GOVERNMENT OF INDIA MINISTRY OF MINES INDIAN BUREAU OF MINES Indira Bhavan, Civil Lines, NAGPUR – 440 001 PHONE/FAX NO. (0712) 2565471 PBX : (0712) 2562649, 2560544, 2560648 E-MAIL : [email protected] Website: www.ibm.gov.in December, 2020
-
Upload
khangminh22 -
Category
Documents
-
view
0 -
download
0
Transcript of Iron, Steel & Scrap and Slag - Indian Bureau of Mines
Indian Minerals Yearbook 2019
(Part- II : Metals & Alloys)
58th Edition
IRON, STEEL & SCRAP AND SLAG
(ADVANCE RELEASE)
GOVERNMENT OF INDIA MINISTRY OF MINES
INDIAN BUREAU OF MINES
Indira Bhavan, Civil Lines, NAGPUR – 440 001
PHONE/FAX NO. (0712) 2565471
PBX : (0712) 2562649, 2560544, 2560648 E-MAIL : [email protected]
Website: www.ibm.gov.in
December, 2020

9-2
IRON, STEEL & SCRAP AND SLAG
9 Iron, Steel & Scrap and Slag
Iron & steel is decidedly the vital component of acountry's economy and is considered pivotal
amongst the driving forces of modernisation. Thelevel of per capita consumption of steel is treated asone of the important indicators ofsocio-economic development and l ivingstandards in any country. Steel continues tobe the foremost of engineering materials, which isnot only environment-friendly but also is recyclable.
The total finished steel (alloy/stainless+non-alloy) production in India has grown from a mere 1.1million tonnes in 1951 to 101.287 million tonnes(measured in terms of crude steel equivalent) in 2018-19. The contribution of non-alloy, alloy and stainlesssteel segment is 94.844 million tonnes, 3.538 milliontonnes and 2.905 million tonnes respectively.Thegrowth in the Steel Sector in the early decades afterindependence was mainly in the Public Sector units.However, following the adoption of new economicpolicy and subsequent deregulation and decontrolof Indian Iron & Steel Sector, the 1990s witnessedaccelerated growth in the Private Sector, catapultingits share of finished steel production from 45% in
1992-93 to 83 % in 2018-19.
Steel exports from India began in 1964. Exportsin the first five years were mainly as a result of lowdemand in the domestic Iron and Steel market.Exports subsequently declined due to revival ofdomestic demand. India once again startedexporting s teel in 1975 which subsequentlyregistered a slump due to rising domestic demand.Post liberalisation, a rejuvenation in the Steel Sectorresulted in large-scale exports of iron and steel. In2018-19, India's total finished steel (alloy/stainless+non-alloy) exports & imports were at 6.36 & 7.83million tonnes, respectively. Though the country'sproduction of iron & steel is sufficient to meet thedomestic demand, it imports mainly finished/semi-finished steel and iron & steel (scrap) to meet
specific requirements and supply of essential grades.
Liberalisation of the Indian Steel SectorAt the time of independence in 1947, India had
only three steel plants – the Tata Iron & SteelCompany, the Indian Iron & Steel Company and
Visveswaraya Iron & Steel Ltd and a few electric arcfurnace-based plants. In the period till 1947, the viablesteel producers in the country that operated with acapacity of about 1 million tonne was wholly underthe Private Sector. The provisions of the economicpolicy implemented during the different phase oftime engendered several marked changes in IndianSteel Industry. From the fledgling one million tonnecapacity status at the time of independence, Indiahas now risen to be the 2nd largest crude steelproducer in the world and the largest producer ofSponge Iron. From a negligible global presence, theIndian Steel Industry is now globally acknowledgedfor its product quality.
The rapid pace of growth of the Industry andthe observed market trends called for certainguidelines and framework. Thus,was born theconcept of the National Steel Policy, with the aim toprovide a roadmap of growth and development forthe Indian Steel Industry. The National Steel Policy(NSP), 2005 was announced in November 2005 as abasic blueprint for the growth of a self-reliant andglobally competitive steel sector. The long-termobjective of the National Steel Policy 2005 was toensure that India has a modern and efficient steelindustry of world standards, catering to diversifiedsteel demand. The focus of the policy was to attainlevels of global competitiveness in terms of globalbenchmarks of efficiency and productivity. Then,after a detailed review in 2017, the Governmentreleased the National Steel Policy 2017, which laiddown the broad roadmap for encouraging long-termgrowth for the Indian Steel Industry, both on demandand supply sides, by 2030-31, with a vision to createa technologically advanced and globally competitivesteel industry that which would promote economicgrowth. At the same time, as a facilitator in thepresent-day de-regulated, liberalised economic/market scenario, the Government also announced apolicy for providing preference to domesticallymanufactured Iron & Steel products in Governmentprocurement. This policy seeks to accomplishHon’ble Prime Minister’s vision of ‘Make in India’with the objective of nation building and to encourage
domestic manufacturing.
9-3
IRON, STEEL & SCRAP AND SLAG
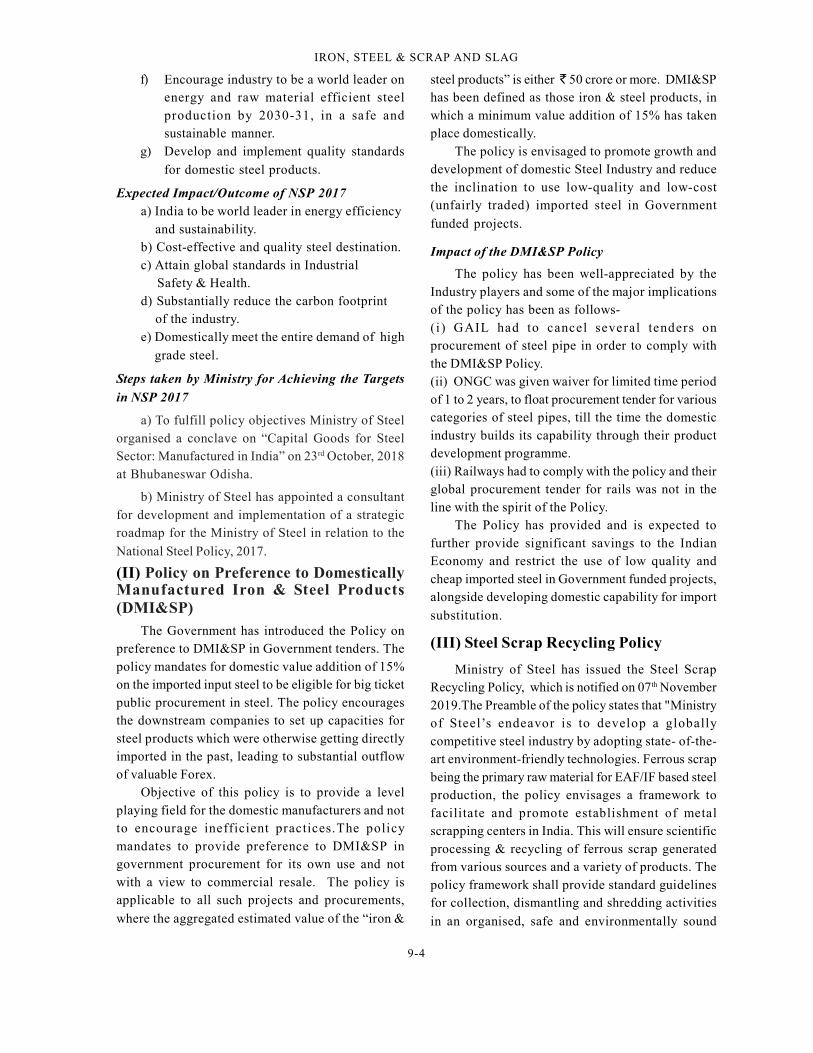
NATIONAL STEEL POLICYThe Government has recently rolled out three
national landmark policies
(i) National Steel Policy 2017.
(ii) Policy on Preference to DomesticallyManufactured Iron & Steel Products.
(iii) Steel Scrap Recycling Policy.
(I) National Steel Policy 2017
NSP 2017 aims to increase focus on expansionof MSME sector, improve raw material security,enhance R&D activities, reduce import dependencyand cost of production, and thus develop atechnologically advanced and globally competitivesteel industry that which would promote economicgrowth eyeing self-sufficiency in production,developing globally economical steel manufacturingcapabilities by facilitating investments and costefficient productions with adequate availability ofraw materials.
With focus on R&D through establishment likeSteel Research Technology Mission of India(SRTMI), the technology would be of utmost focusover the next decade and MSME steel plants wouldbe the key drivers to achieve the additional capacityrequired for the India’s consumption led growth andimprovement in the overall productivity and quality.
Some of the Highlights of the National Steel
Policy 2017 are enumerated below:
1. The Indian Steel Sector has grown rapidlyover the past few years and presently India hasbecome the world’s 2nd largest producer of crude steelin January- December 2019, producing 111.245 milliontonnes (MT) (provisional) crude steel with growthrate 1.8% over the corresponding period last year(CPLY).
2. The New Steel Policy, 2017 aspires to achieve300 million tonnes of steel making capacity by 2030.This would translate into additional investment of
10 lakh crore by 2030-31.
3. The Policy seeks to increase consumption ofsteel and the major segments that are likely toinfluence consumption would be Infrastructure,Automobiles and Housing. New Steel Policy seeks
to increase per capita steel consumption to the levelof 160 kg by 2030.
4. Potential of MSME Steel Sector has beenrecognised. Policy stipulates encouragement andadoption of energy-efficient technologies in theMSME Steel Sector to improve the overallproductivity and reduce energy intensity.
5. Steel Ministry will facilitate R&D in the Sectorthrough the establishment of Steel Research andTechnology Mission of India (SRTMI). The initiativeis aimed with a purpose of creating on environmentto spearhead R&D of national importance in Iron &Steel Sector utilising tripartite synergy amongstIndustry, national R&D laboratories and academicinstitutions.
6. Ministry through policy measures will ensureavailability of raw materials like iron ore, coking coaland non-coking coal, natural gas etc. at competitiverates.
7. With the roll out of the National Steel Policy-2017, it is envisaged that the Industry will be steeredin creating an environment for promoting domesticsteel and thereby ensuring a scenario whereproduction meets the anticipated pace of growth inconsumption, through a technologically advancedand globally competitive Steel Industry. This will befacilitated by Ministry of Steel, in coordination with
relevant Ministries, as may be required.
The principal objectives that the National SteelPolicy 2017 aims to achieve are the following:
a) Build a globally competitive industry witha crude steel capacity of 300 million tonnesby 2030-31.
b) Increase per Capita Steel Consumption to160 kg by 2030-31.
c) To domestically meet entire demand of high-grade automotive steel, electrical steel,special steels and alloys for strategicapplications by 2030-31.
d) Increase domestic availability of washedcoking coal so as to reduce importdependence on coking coal to 50% by 2030-31.
e) To be net exporter of steel by 2025-26.
9-4
IRON, STEEL & SCRAP AND SLAG
f) Encourage industry to be a world leader onenergy and raw material efficient steelproduction by 2030-31, in a safe andsustainable manner.
g) Develop and implement quality standards
for domestic steel products.
Expected Impact/Outcome of NSP 2017a) India to be world leader in energy efficiency and sustainability.b) Cost-effective and quality steel destination.c) Attain global standards in Industrial Safety & Health.d) Substantially reduce the carbon footprint of the industry.e) Domestically meet the entire demand of high
grade steel.
Steps taken by Ministry for Achieving the Targets
in NSP 2017
a) To fulfill policy objectives Ministry of Steelorganised a conclave on “Capital Goods for SteelSector: Manufactured in India” on 23rd October, 2018at Bhubaneswar Odisha.
b) Ministry of Steel has appointed a consultantfor development and implementation of a strategicroadmap for the Ministry of Steel in relation to the
National Steel Policy, 2017.
(II) Policy on Preference to DomesticallyManufactured Iron & Steel Products(DMI&SP)
The Government has introduced the Policy onpreference to DMI&SP in Government tenders. Thepolicy mandates for domestic value addition of 15%on the imported input steel to be eligible for big ticketpublic procurement in steel. The policy encouragesthe downstream companies to set up capacities forsteel products which were otherwise getting directlyimported in the past, leading to substantial outflowof valuable Forex.
Objective of this policy is to provide a levelplaying field for the domestic manufacturers and notto encourage inefficient practices.The policymandates to provide preference to DMI&SP ingovernment procurement for its own use and notwith a view to commercial resale. The policy isapplicable to all such projects and procurements,
where the aggregated estimated value of the “iron &
steel products” is either 50 crore or more. DMI&SPhas been defined as those iron & steel products, inwhich a minimum value addition of 15% has takenplace domestically.
The policy is envisaged to promote growth anddevelopment of domestic Steel Industry and reducethe inclination to use low-quality and low-cost(unfairly traded) imported steel in Government
funded projects.
Impact of the DMI&SP Policy
The policy has been well-appreciated by theIndustry players and some of the major implicationsof the policy has been as follows-(i ) GAIL had to cancel several tenders onprocurement of steel pipe in order to comply withthe DMI&SP Policy.(ii) ONGC was given waiver for limited time periodof 1 to 2 years, to float procurement tender for variouscategories of steel pipes, till the time the domesticindustry builds its capability through their productdevelopment programme.(iii) Railways had to comply with the policy and theirglobal procurement tender for rails was not in theline with the spirit of the Policy.
The Policy has provided and is expected tofurther provide significant savings to the IndianEconomy and restrict the use of low quality andcheap imported steel in Government funded projects,alongside developing domestic capability for import
substitution.
(III) Steel Scrap Recycling Policy
Ministry of Steel has issued the Steel ScrapRecycling Policy, which is notified on 07th November2019.The Preamble of the policy states that "Ministryof Steel’s endeavor is to develop a globallycompetitive steel industry by adopting state- of-the-art environment-friendly technologies. Ferrous scrapbeing the primary raw material for EAF/IF based steelproduction, the policy envisages a framework tofacilitate and promote establishment of metalscrapping centers in India. This will ensure scientificprocessing & recycling of ferrous scrap generatedfrom various sources and a variety of products. Thepolicy framework shall provide standard guidelinesfor collection, dismantling and shredding activities
in an organised, safe and environmentally sound

9-5
IRON, STEEL & SCRAP AND SLAG
manner”. The policy aims to achieve the following
objectives –(i) To promote circular economy in the steel sector(ii) To promote a formal and scientific collection,dismantling and processing activities for end of lifeproducts that are sources of recyclable (ferrous, non-ferrous and other non-metallic) scraps which will leadto resource conservation and energy savings andsetting up of an environmentally sound managementsystem for handling ferrous scrap.(iii) Processing and recycling of products in anorganised, safe and environment-friendly manner.(iv) To evolve a responsive ecosystem by involvingall stakeholders.(v) To produce high quality ferrous scrap for qualitysteel production thus minimising the dependency onimports.(vi) To decongest the Indian cities from ELVs andreuse of ferrous scrap.(vii) To create a mechanism for treating waste streamsand residues produced from dismantling andshredding facilities in compliance to Hazardous &Other Wastes (Management & TransboundaryMovement) Rules, 2016 issued by MoEF & CC.(viii) To promote 6Rs principles of Reduce, Reuse,Recycle, Recover, Redesign and Remanufacturethrough scientific handling, processing and disposalof all types of recyclable scraps including non-
ferrous scraps, through authorised centers/ facilities.
STRUCTURE AND ROLE OFINDIAN STEEL INDUSTRYIndia has become the world's 2nd largest producer
of crude steel in the calender year 2018. Earlier, asper the Notifications released by Ministry of Steeldated 12.12.2013 and 24.04.2015, a steel plant hadbeen classified on the basis of process route/technology adopted and on the basis of size/capacity.The classification was Primary steel producers,Integrated steel producers, Secondary steelproducers and other steel producers. Subsequently,the guidelines for classification have been revisedvide Notification dated 12.05.2016, and as per thelatest classification, steel producers with theirregistered office addresses will be listed plant-wise& location-wise in accordance with the crude steelproduction capacity.The earlier classification along
with process route adopted for iron/steel making as'Integrated steel plants', 'Primary steel producers','Secondary steel producers', 'Main producers', 'Majorproducers' and 'Others' stands to be withdrawn asper the latest notification.
In 2018-19, the total production of pig iron was6.414 million tonnes and the percentage share ofPrivate Sector and Public Sector was about 91% and9% respectively.
In the year 2018-19, the production of spongeiron was 34.705 million tonnes. The production ofcrude steel was 110.922 million tonnes and finishedsteel was 101.287 million tonnes.
The Secondary Steel Sector constitutes ElectricArc Furnace/Induction Furnace, pig iron/spongeiron units, re-rolling units, HR units, CR units,galvanised/colour coated units, tin plate units, wire-drawing units, etc. for producing either semi-finishedor finished steel.
The important iron & steel units in India are SteelAuthority of India, Rashtriya Ispat Nigam, Tata Steel,Essar Steel, JSW Steel and Jindal Steel & Power aswell as large number of Mini Steel Plants based onElectric Furnaces & Energy Optimising Furnaces(EOF). Besides the steel producing units, there are alarge number of Sponge Iron Plants, Mini BlastFurnace units, Hot & Cold Rolling Mills &Galvanising/Colour Coating units which are spreadacross the country.
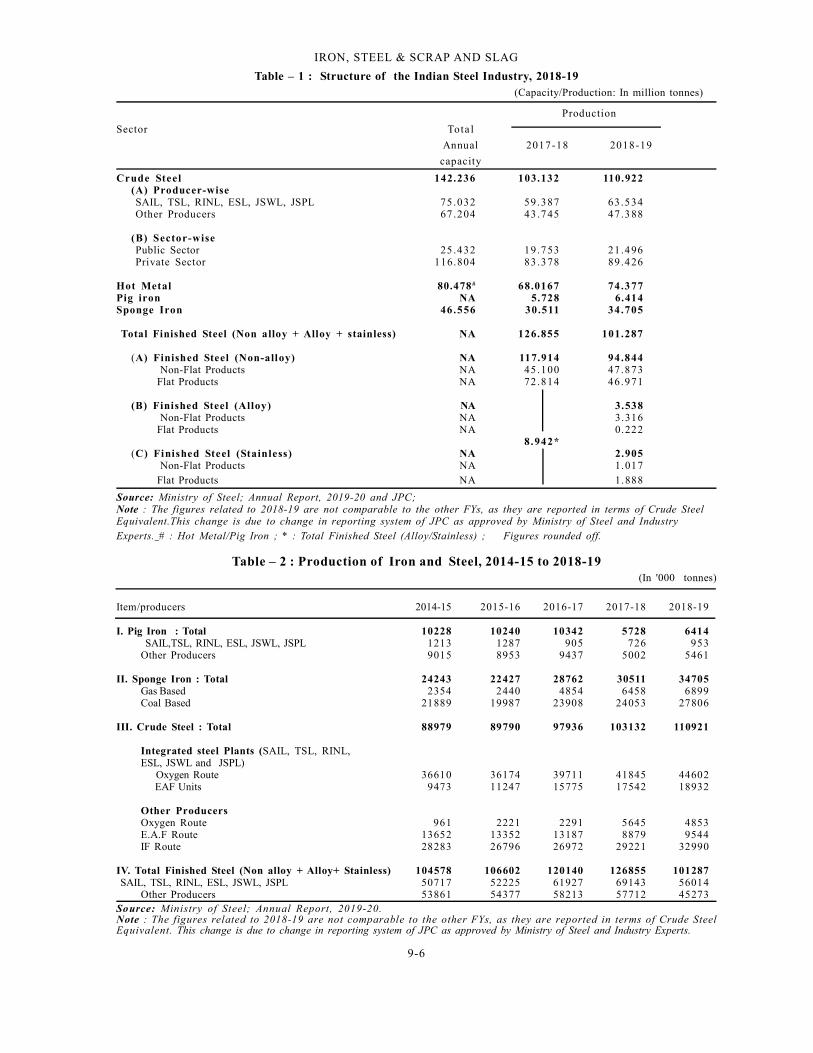
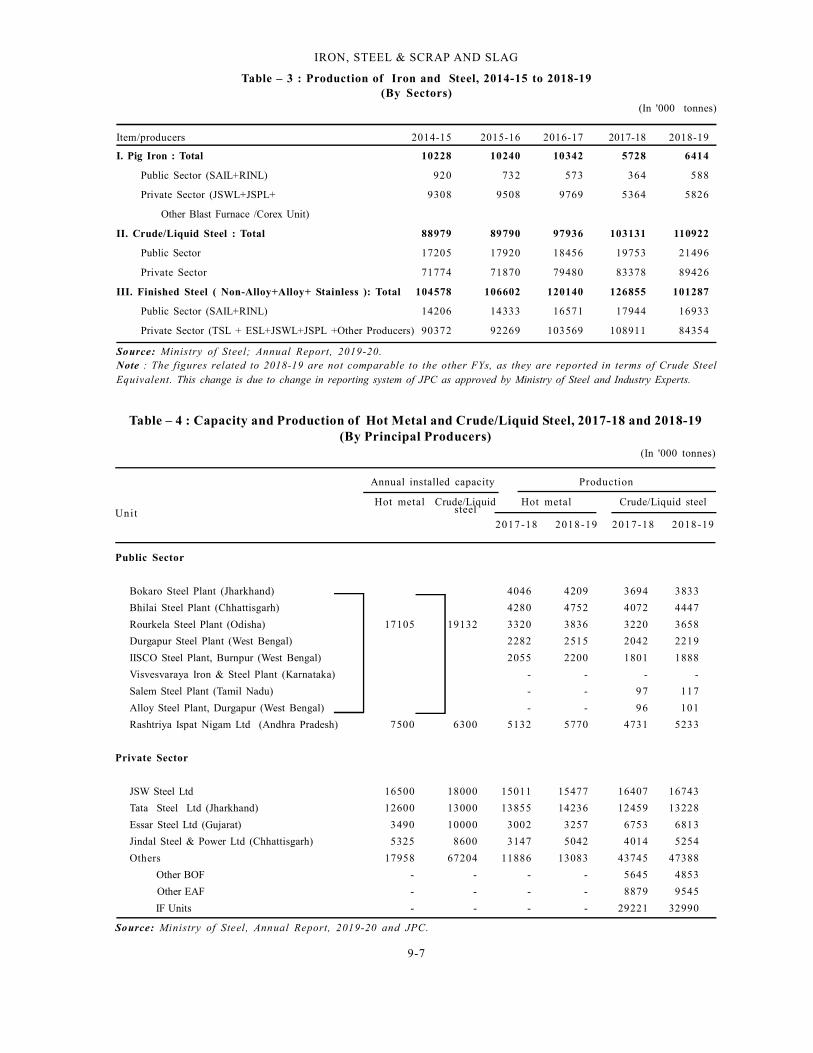
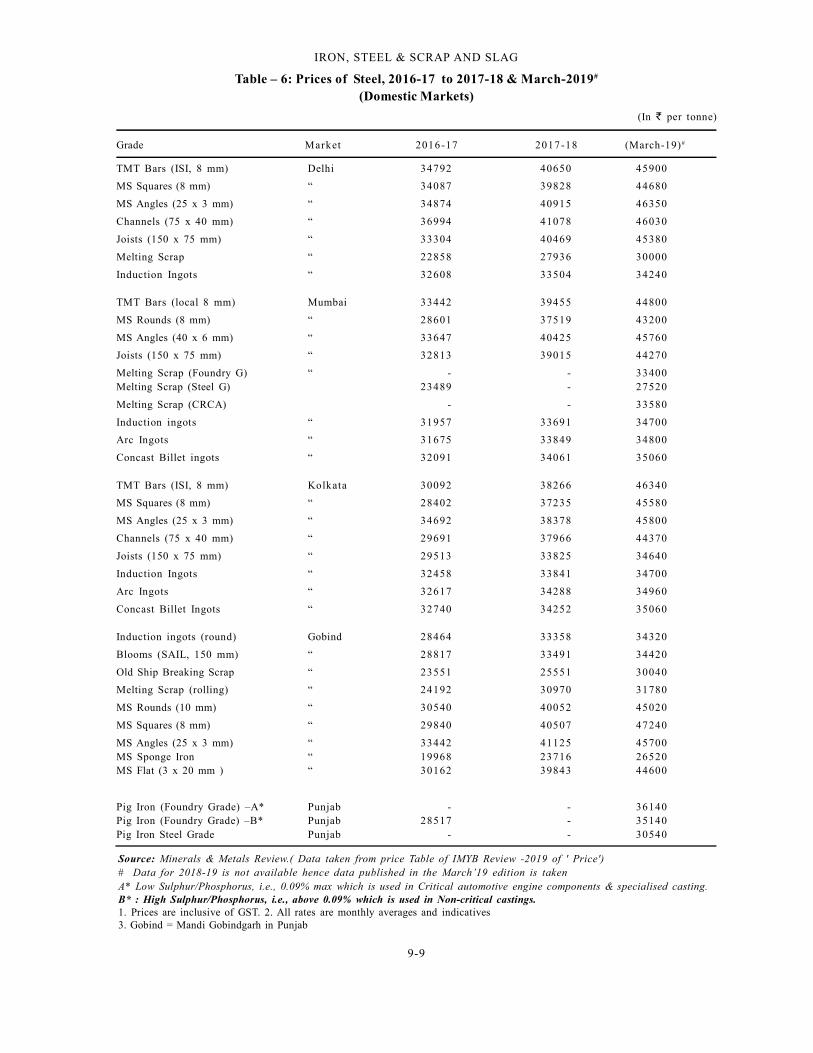
The structure of the Indian Steel Industry in2018-19 is furnished in Table-1. Production of iron &steel, crude steel, pig iron and finished steel (alloy +non-alloy) by SAIL, TSL, RINL, ESL, JSWL, JSPLand other producers along with production of crudesteel from oxygen route, electric arc furnace routeand induction furnace route during the year2014-15 to 2018-19 has been reflected in Table-2along with the production of sponge iron throughgas-based & coal-based units during the year2014-15 to 2018-19. The production of iron & steelby Public and Private Sectors during 2014-15 to2018-19 is furnished in Table-3. The details on plant-wise capacity and production of hot metal and crude/liquid steel are listed out in Table-4. Table-5elucidates the production of crude/liquid steel byBOF and EAF/IF routes. Prices of steel are providedin Table-6.
9-6
IRON, STEEL & SCRAP AND SLAG
Table – 1 : Structure of the Indian Steel Industry, 2018-19 (Capacity/Production: In million tonnes)
Production
Sector Tota l
Annual 2017-18 2018-19
capacity
Crude Steel 142.236 103.132 110.922(A) Producer-wiseSAIL, TSL, RINL, ESL, JSWL, JSPL 75.032 59.387 63.534Other Producers 67 .204 43.745 47.388
(B) Sector-wisePublic Sector 25 .432 19.753 21.496Private Sector 116.804 83.378 89.426
Hot Metal 80.478# 68.0167 74.377Pig iron NA 5.728 6.414Sponge Iron 46.556 30.511 34.705
Total Finished Steel (Non alloy + Alloy + stainless) NA 126.855 101.287
(A) Finished Steel (Non-alloy) NA 117.914 94.844 Non-Flat Products NA 45.100 47.873
Flat Products NA 72.814 46.971
(B) Finished Steel (Alloy) NA 3.538 Non-Flat Products NA 3.316
Flat Products NA 0.2228.942*
(C) Finished Steel (Stainless) NA 2.905 Non-Flat Products NA 1.017
Flat Products NA 1.888
Source: Ministry of Steel; Annual Report, 2019-20 and JPC;Note : The figures related to 2018-19 are not comparable to the other FYs, as they are reported in terms of Crude SteelEquivalent.This change is due to change in reporting system of JPC as approved by Ministry of Steel and IndustryExperts. # : Hot Metal/Pig Iron ; * : Total Finished Steel (Alloy/Stainless) ; Figures rounded off.
Table – 2 : Production of Iron and Steel, 2014-15 to 2018-19(In '000 tonnes)
Item/producers 2014-15 2015-16 2016-17 2017-18 2018-19
I. Pig Iron : Total 10228 10240 10342 5728 6414 SAIL,TSL, RINL, ESL, JSWL, JSPL 1213 1287 905 726 953
Other Producers 9015 8953 9437 5002 5461
II. Sponge Iron : Total 24243 22427 28762 30511 34705Gas Based 2354 2440 4854 6458 6899Coal Based 21889 19987 23908 24053 27806
III. Crude Steel : Total 88979 89790 97936 103132 110921
Integrated steel Plants (SAIL, TSL, RINL,ESL, JSWL and JSPL) Oxygen Route 36610 36174 39711 41845 44602 EAF Units 9473 11247 15775 17542 18932
Other ProducersOxygen Route 961 2221 2291 5645 4853E.A.F Route 13652 13352 13187 8879 9544IF Route 28283 26796 26972 29221 32990
IV. Total Finished Steel (Non alloy + Alloy+ Stainless) 104578 106602 120140 126855 101287 SAIL, TSL, RINL, ESL, JSWL, JSPL 50717 52225 61927 69143 56014
Other Producers 53861 54377 58213 57712 45273Source: Ministry of Steel; Annual Report, 2019-20.Note : The figures related to 2018-19 are not comparable to the other FYs, as they are reported in terms of Crude SteelEquivalent. This change is due to change in reporting system of JPC as approved by Ministry of Steel and Industry Experts.
9-7
IRON, STEEL & SCRAP AND SLAG
Table – 4 : Capacity and Production of Hot Metal and Crude/Liquid Steel, 2017-18 and 2018-19(By Principal Producers)
(In '000 tonnes)
Annual installed capacity Production
Hot metal Crude/Liquid Hot metal Crude/Liquid steelUnit steel
2017-18 2018-19 2017-18 2018-19
Public Sector
Bokaro Steel Plant (Jharkhand) 4046 4209 3694 3833
Bhilai Steel Plant (Chhattisgarh) 4280 4752 4072 4447
Rourkela Steel Plant (Odisha) 17105 19132 3320 3836 3220 3658
Durgapur Steel Plant (West Bengal) 2282 2515 2042 2219
IISCO Steel Plant, Burnpur (West Bengal) 2055 2200 1801 1888
Visvesvaraya Iron & Steel Plant (Karnataka) - - - -
Salem Steel Plant (Tamil Nadu) - - 97 117
Alloy Steel Plant, Durgapur (West Bengal) - - 96 101
Rashtriya Ispat Nigam Ltd (Andhra Pradesh) 7500 6300 5132 5770 4731 5233
Private Sector
JSW Steel Ltd 16500 18000 15011 15477 16407 16743
Tata Steel Ltd (Jharkhand) 12600 13000 13855 14236 12459 13228
Essar Steel Ltd (Gujarat) 3490 10000 3002 3257 6753 6813
Jindal Steel & Power Ltd (Chhattisgarh) 5325 8600 3147 5042 4014 5254
Others 17958 67204 11886 13083 43745 47388
Other BOF - - - - 5645 4853
Other EAF - - - - 8879 9545
IF Units - - - - 29221 32990
Source: Ministry of Steel, Annual Report, 2019-20 and JPC.
Table – 3 : Production of Iron and Steel, 2014-15 to 2018-19(By Sectors)
(In '000 tonnes)
Item/producers 2014-15 2015-16 2016-17 2017-18 2018-19
I. Pig Iron : Total 10228 10240 10342 5728 6414
Public Sector (SAIL+RINL) 920 732 573 364 588
Private Sector (JSWL+JSPL+ 9308 9508 9769 5364 5826
Other Blast Furnace /Corex Unit)
II. Crude/Liquid Steel : Total 88979 89790 97936 103131 110922
Public Sector 17205 17920 18456 19753 21496
Private Sector 71774 71870 79480 83378 89426
III. Finished Steel ( Non-Alloy+Alloy+ Stainless ): Total 104578 106602 120140 126855 101287
Public Sector (SAIL+RINL) 14206 14333 16571 17944 16933
Private Sector (TSL + ESL+JSWL+JSPL +Other Producers) 90372 92269 103569 108911 84354
Source: Ministry of Steel; Annual Report, 2019-20.Note : The figures related to 2018-19 are not comparable to the other FYs, as they are reported in terms of Crude SteelEquivalent. This change is due to change in reporting system of JPC as approved by Ministry of Steel and Industry Experts.

9-8
IRON, STEEL & SCRAP AND SLAG
Table – 5 : Production of Crude/Liquid Steel, 2015-16 to 2018-19(By Route)
(In '000 tonnes)
Route/plant 2015-16 2016-17 2017-18 2018-19
All Routes: (A+B) Total 89 79 0 97 93 6 1 0 3 1 31 110 92 1A. Oxygen Route : Total 38 27 5 41 89 4 47 39 2 49 45 5
Bhilai Steel Plant (Chhattisgarh) 5 0 5 8 4 7 3 7 4 0 7 2 4 4 4 7
Durgapur Steel Plant (West Bengal) 1 9 7 5 2 0 4 2 2 0 4 2 2 2 1 9
Rourkela Steel Plant (Odisha) 2 7 3 0 2 9 3 2 3 2 2 0 3 6 5 8
Bokaro Steel Plant (Jharkhand) 3 3 9 2 3 1 5 4 3 6 9 4 3 8 3 3
IISCO Steel Plant (West Bengal) 8 7 1 1 3 9 4 1 8 0 1 1 8 8 8
Visvesvaraya Iron & Steel Ltd (Karnataka) 4 2 3 9 -
Visakhapatnam Steel Plant (RINL, Andhra Pradesh) 3 6 4 1 3 9 6 2 4 7 3 1 5 2 3 3
Tata Steel Ltd (Jharkhand) 9 9 6 0 1168 8 12 45 9 13 228
JSW Steel Ltd (Karnataka) 8 3 8 5 9 6 5 5 9 7 2 8 10 096
Bhushan Steel Ltd - - 3 1 6 7 2 8 1 0
Other Oxygen Route 2 2 2 1 2 2 9 1 2 4 7 8 2 0 4 3
B. Electric Route: Total 51 51 5 56 04 2 55 73 9 61 46 6
Electric Arc Furnace 24 719 2907 0 26 51 8 28 476
Salem Steel Plant (Tamil Nadu) 1 2 0 1 0 8 9 7 1 1 7
Alloy Steel Plant, Durgapur (West Bengal) 9 1 8 8 9 6 1 0 1
Essar Steel Ltd (Gujarat) 3 6 8 5 5 3 9 1 6 7 5 3 6 8 1 3
JSW Ispat Steel Ltd//JSW Steel Ltd (Maharashtra) 4 2 9 4 6 8 5 1 6 6 7 9 6 6 4 7
Jindal Steel & Power Ltd (Chhattisgarh) 3 1 7 7 3 4 4 5 4 0 1 4 5 2 5 4
Lloyds Steel Ltd. 5 6 9 5 7 5 56 0 5 1 8
Jindal Stainless Ltd. 1 2 5 8 1 3 9 1 1 4 9 7 1 5 5 4
Bhushan Steel Ltd. 3 0 7 8 5 6 0 1 8 7 1 3 4 4
Bhushan Power & Steel Ltd (Odisha) 1 8 3 2 3 3 2 4 2 0 1 8 2 7 7 8
Other Electric Arc Furnace 6 6 1 5 2 2 9 6 4 7 1 7 3 3 5 0
Electric Induction Furnace 26 79 6 26 97 2 29 22 1 32 99 0
Source: Ministry of Steel, Annual Report, 2019- 2020Figures rounded off
9-9
IRON, STEEL & SCRAP AND SLAG
Table – 6: Prices of Steel, 2016-17 to 2017-18 & March-2019#
(Domestic Markets)
(In per tonne)
Grade Market 2016-17 2017-18 (March-19)#
TMT Bars (ISI, 8 mm) Delhi 34792 40650 45900
MS Squares (8 mm) “ 34087 39828 44680
MS Angles (25 x 3 mm) “ 34874 40915 46350
Channels (75 x 40 mm) “ 36994 41078 46030
Joists (150 x 75 mm) “ 33304 40469 45380
Melting Scrap “ 22858 27936 30000
Induction Ingots “ 32608 33504 34240
TMT Bars (local 8 mm) Mumbai 33442 39455 44800
MS Rounds (8 mm) “ 28601 37519 43200
MS Angles (40 x 6 mm) “ 33647 40425 45760
Joists (150 x 75 mm) “ 32813 39015 44270
Melting Scrap (Foundry G) “ - - 33400Melting Scrap (Steel G) 23489 - 27520
Melting Scrap (CRCA) - - 33580
Induction ingots “ 31957 33691 34700
Arc Ingots “ 31675 33849 34800
Concast Billet ingots “ 32091 34061 35060
TMT Bars (ISI, 8 mm) Kolkata 30092 38266 46340
MS Squares (8 mm) “ 28402 37235 45580
MS Angles (25 x 3 mm) “ 34692 38378 45800
Channels (75 x 40 mm) “ 29691 37966 44370
Joists (150 x 75 mm) “ 29513 33825 34640
Induction Ingots “ 32458 33841 34700
Arc Ingots “ 32617 34288 34960
Concast Billet Ingots “ 32740 34252 35060
Induction ingots (round) Gobind 28464 33358 34320
Blooms (SAIL, 150 mm) “ 28817 33491 34420
Old Ship Breaking Scrap “ 23551 25551 30040
Melting Scrap (rolling) “ 24192 30970 31780
MS Rounds (10 mm) “ 30540 40052 45020
MS Squares (8 mm) “ 29840 40507 47240
MS Angles (25 x 3 mm) “ 33442 41125 45700MS Sponge Iron “ 19968 23716 26520MS Flat (3 x 20 mm ) “ 30162 39843 44600
Pig Iron (Foundry Grade) –A* Punjab - - 36140Pig Iron (Foundry Grade) –B* Punjab 28517 - 35140Pig Iron Steel Grade Punjab - - 30540
Source: Minerals & Metals Review.( Data taken from price Table of IMYB Review -2019 of ' Price')# Data for 2018-19 is not available hence data published in the March’19 edition is takenA* Low Sulphur/Phosphorus, i.e., 0.09% max which is used in Critical automotive engine components & specialised casting.B* : High Sulphur/Phosphorus, i.e., above 0.09% which is used in Non-critical castings.1. Prices are inclusive of GST. 2. All rates are monthly averages and indicatives3. Gobind = Mandi Gobindgarh in Punjab
9-10
IRON, STEEL & SCRAP AND SLAG
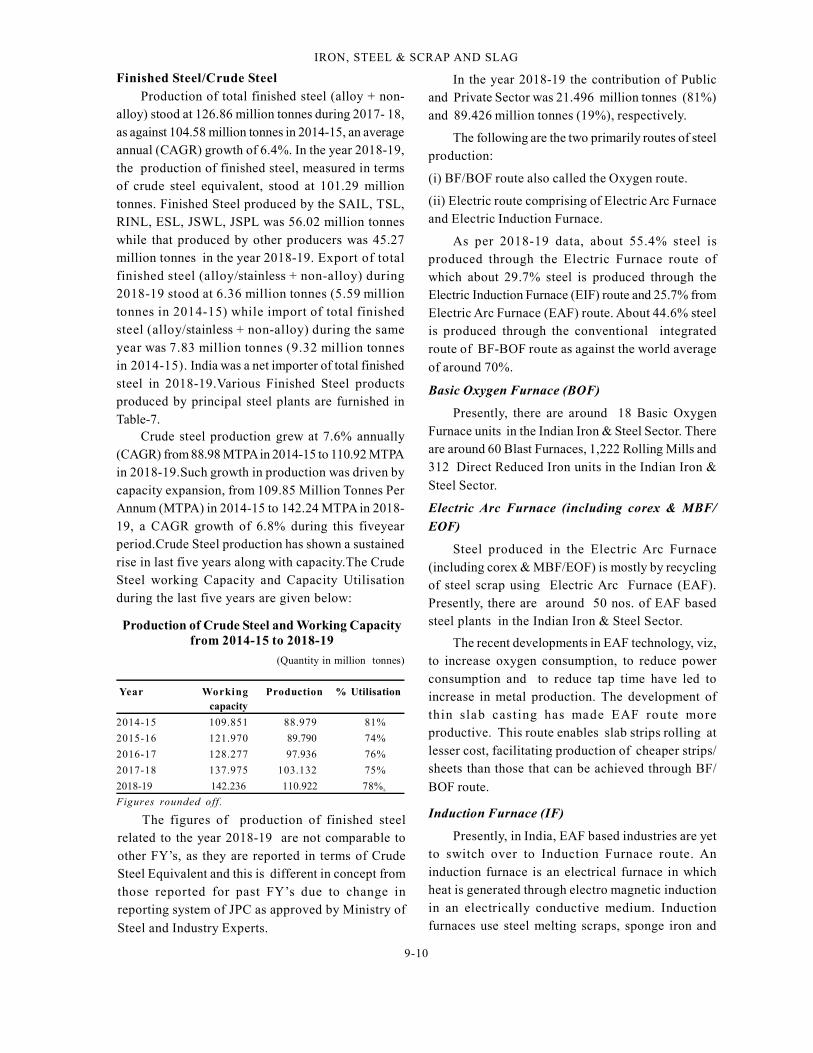
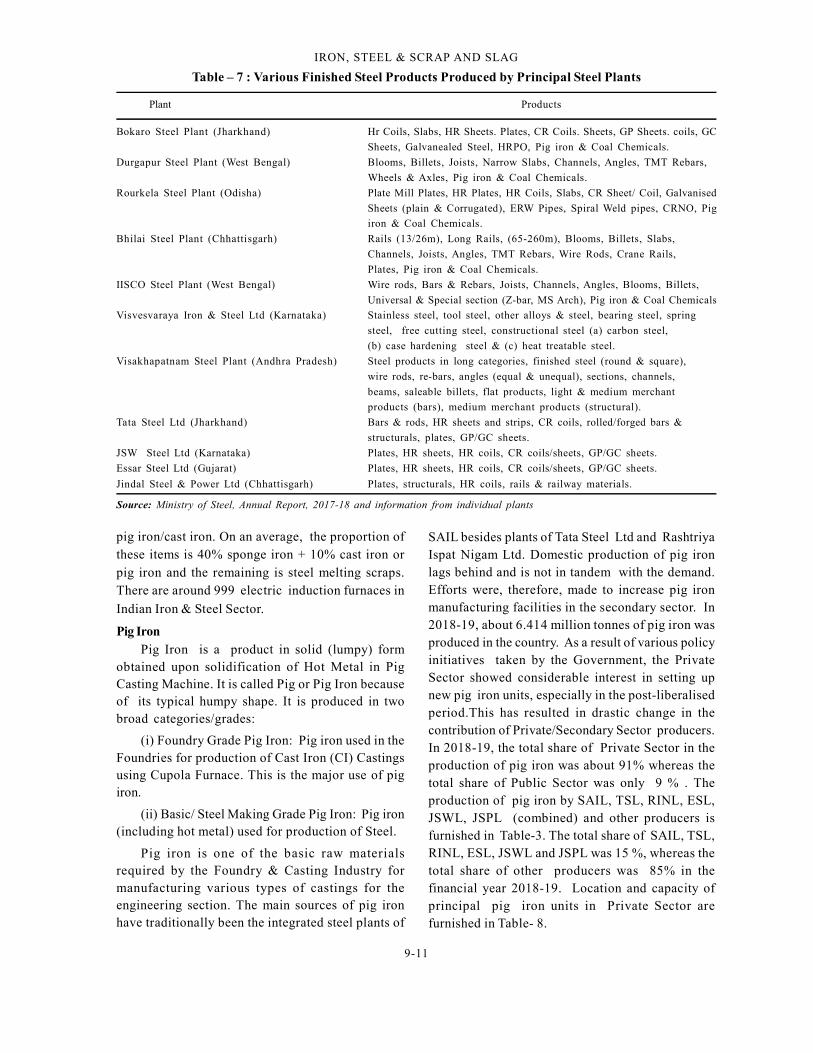
Finished Steel/Crude SteelProduction of total finished steel (alloy + non-
alloy) stood at 126.86 million tonnes during 2017- 18,as against 104.58 million tonnes in 2014-15, an averageannual (CAGR) growth of 6.4%. In the year 2018-19,the production of finished steel, measured in termsof crude steel equivalent, stood at 101.29 milliontonnes. Finished Steel produced by the SAIL, TSL,RINL, ESL, JSWL, JSPL was 56.02 million tonneswhile that produced by other producers was 45.27million tonnes in the year 2018-19. Export of totalfinished steel (alloy/stainless + non-alloy) during2018-19 stood at 6.36 million tonnes (5.59 milliontonnes in 2014-15) while import of total finishedsteel (alloy/stainless + non-alloy) during the sameyear was 7.83 million tonnes (9.32 million tonnesin 2014-15). India was a net importer of total finishedsteel in 2018-19.Various Finished Steel productsproduced by principal steel plants are furnished inTable-7.
Crude steel production grew at 7.6% annually(CAGR) from 88.98 MTPA in 2014-15 to 110.92 MTPAin 2018-19.Such growth in production was driven bycapacity expansion, from 109.85 Million Tonnes PerAnnum (MTPA) in 2014-15 to 142.24 MTPA in 2018-19, a CAGR growth of 6.8% during this fiveyearperiod.Crude Steel production has shown a sustainedrise in last five years along with capacity.The CrudeSteel working Capacity and Capacity Utilisationduring the last five years are given below:
The figures of production of finished steelrelated to the year 2018-19 are not comparable toother FY’s, as they are reported in terms of CrudeSteel Equivalent and this is different in concept fromthose reported for past FY’s due to change inreporting system of JPC as approved by Ministry of
Steel and Industry Experts.
In the year 2018-19 the contribution of Publicand Private Sector was 21.496 million tonnes (81%)and 89.426 million tonnes (19%), respectively.
The following are the two primarily routes of steelproduction:
(i) BF/BOF route also called the Oxygen route.
(ii) Electric route comprising of Electric Arc Furnaceand Electric Induction Furnace.
As per 2018-19 data, about 55.4% steel isproduced through the Electric Furnace route ofwhich about 29.7% steel is produced through theElectric Induction Furnace (EIF) route and 25.7% fromElectric Arc Furnace (EAF) route. About 44.6% steelis produced through the conventional integratedroute of BF-BOF route as against the world average
of around 70%.
Basic Oxygen Furnace (BOF)
Presently, there are around 18 Basic OxygenFurnace units in the Indian Iron & Steel Sector. Thereare around 60 Blast Furnaces, 1,222 Rolling Mills and312 Direct Reduced Iron units in the Indian Iron &
Steel Sector.
Electric Arc Furnace (including corex & MBF/
EOF)
Steel produced in the Electric Arc Furnace(including corex & MBF/EOF) is mostly by recyclingof steel scrap using Electric Arc Furnace (EAF).Presently, there are around 50 nos. of EAF basedsteel plants in the Indian Iron & Steel Sector.
The recent developments in EAF technology, viz,to increase oxygen consumption, to reduce powerconsumption and to reduce tap time have led toincrease in metal production. The development ofthin slab cast ing has made EAF route moreproductive. This route enables slab strips rolling atlesser cost, facilitating production of cheaper strips/sheets than those that can be achieved through BF/
BOF route.
Induction Furnace (IF)
Presently, in India, EAF based industries are yetto switch over to Induction Furnace route. Aninduction furnace is an electrical furnace in whichheat is generated through electro magnetic inductionin an electrically conductive medium. Inductionfurnaces use steel melting scraps, sponge iron and
Production of Crude Steel and Working Capacityfrom 2014-15 to 2018-19
(Quantity in million tonnes)
Year Working Production % Utilisation capacity
2014-15 109.851 88.979 81%
2015-16 121.970 89.790 74%
2016-17 128.277 97.936 76%
2017-18 137.975 103.132 75%
2018-19 142.236 110.922 78%.
Figures rounded off.
9-11
IRON, STEEL & SCRAP AND SLAG
Table – 7 : Various Finished Steel Products Produced by Principal Steel Plants
Plant Products
Bokaro Steel Plant (Jharkhand) Hr Coils, Slabs, HR Sheets. Plates, CR Coils. Sheets, GP Sheets. coils, GC
Sheets, Galvanealed Steel, HRPO, Pig iron & Coal Chemicals.
Durgapur Steel Plant (West Bengal) Blooms, Billets, Joists, Narrow Slabs, Channels, Angles, TMT Rebars,
Wheels & Axles, Pig iron & Coal Chemicals.
Rourkela Steel Plant (Odisha) Plate Mill Plates, HR Plates, HR Coils, Slabs, CR Sheet/ Coil, Galvanised
Sheets (plain & Corrugated), ERW Pipes, Spiral Weld pipes, CRNO, Pig
iron & Coal Chemicals.
Bhilai Steel Plant (Chhattisgarh) Rails (13/26m), Long Rails, (65-260m), Blooms, Billets, Slabs,
Channels, Joists, Angles, TMT Rebars, Wire Rods, Crane Rails,
Plates, Pig iron & Coal Chemicals.
IISCO Steel Plant (West Bengal) Wire rods, Bars & Rebars, Joists, Channels, Angles, Blooms, Billets,
Universal & Special section (Z-bar, MS Arch), Pig iron & Coal Chemicals
Visvesvaraya Iron & Steel Ltd (Karnataka) Stainless steel, tool steel, other alloys & steel, bearing steel, spring
steel, free cutting steel, constructional steel (a) carbon steel,
(b) case hardening steel & (c) heat treatable steel.
Visakhapatnam Steel Plant (Andhra Pradesh) Steel products in long categories, finished steel (round & square),
wire rods, re-bars, angles (equal & unequal), sections, channels,
beams, saleable billets, flat products, light & medium merchant
products (bars), medium merchant products (structural).
Tata Steel Ltd (Jharkhand) Bars & rods, HR sheets and strips, CR coils, rolled/forged bars &
structurals, plates, GP/GC sheets.
JSW Steel Ltd (Karnataka) Plates, HR sheets, HR coils, CR coils/sheets, GP/GC sheets.
Essar Steel Ltd (Gujarat) Plates, HR sheets, HR coils, CR coils/sheets, GP/GC sheets.
Jindal Steel & Power Ltd (Chhattisgarh) Plates, structurals, HR coils, rails & railway materials.
Source: Ministry of Steel, Annual Report, 2017-18 and information from individual plants
pig iron/cast iron. On an average, the proportion ofthese items is 40% sponge iron + 10% cast iron orpig iron and the remaining is steel melting scraps.There are around 999 electric induction furnaces in
Indian Iron & Steel Sector.
Pig IronPig Iron is a product in solid (lumpy) form
obtained upon solidification of Hot Metal in PigCasting Machine. It is called Pig or Pig Iron becauseof its typical humpy shape. It is produced in twobroad categories/grades:
(i) Foundry Grade Pig Iron: Pig iron used in theFoundries for production of Cast Iron (CI) Castingsusing Cupola Furnace. This is the major use of pigiron.
(ii) Basic/ Steel Making Grade Pig Iron: Pig iron(including hot metal) used for production of Steel.
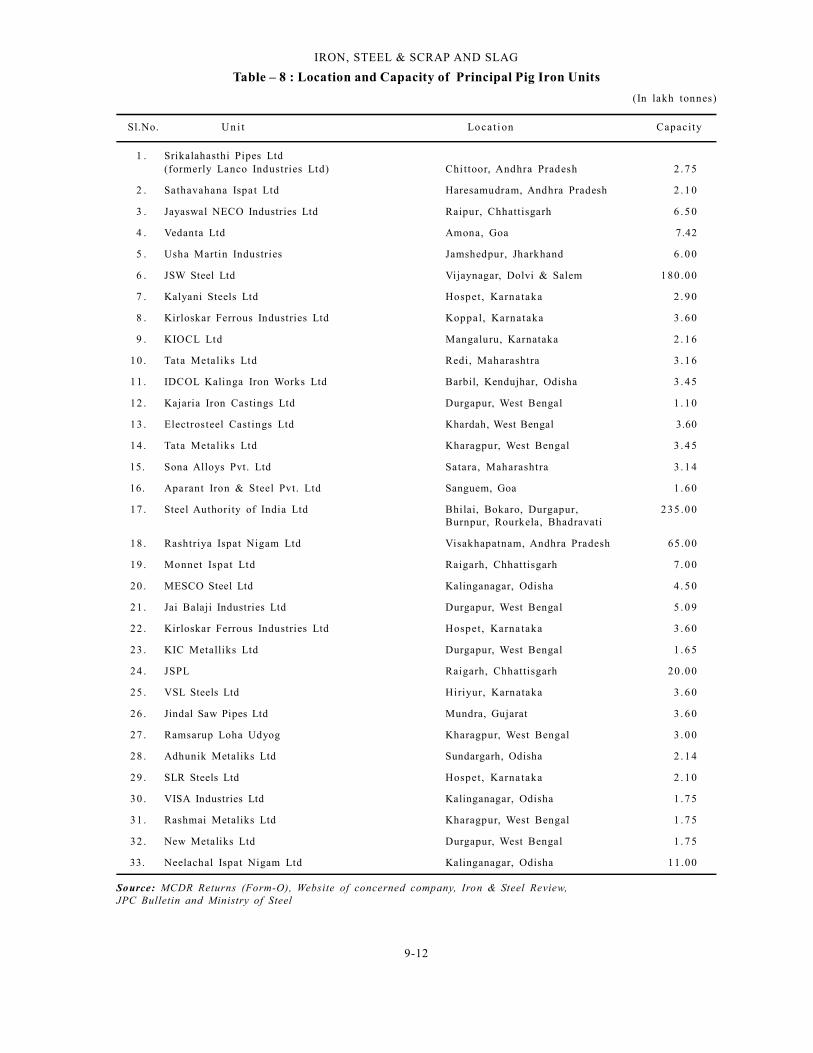
Pig iron is one of the basic raw materialsrequired by the Foundry & Casting Industry formanufacturing various types of castings for theengineering section. The main sources of pig ironhave traditionally been the integrated steel plants of
SAIL besides plants of Tata Steel Ltd and RashtriyaIspat Nigam Ltd. Domestic production of pig ironlags behind and is not in tandem with the demand.Efforts were, therefore, made to increase pig ironmanufacturing facilities in the secondary sector. In2018-19, about 6.414 million tonnes of pig iron wasproduced in the country. As a result of various policyinitiatives taken by the Government, the PrivateSector showed considerable interest in setting upnew pig iron units, especially in the post-liberalisedperiod.This has resulted in drastic change in thecontribution of Private/Secondary Sector producers.In 2018-19, the total share of Private Sector in theproduction of pig iron was about 91% whereas thetotal share of Public Sector was only 9 % . Theproduction of pig iron by SAIL, TSL, RINL, ESL,JSWL, JSPL (combined) and other producers isfurnished in Table-3. The total share of SAIL, TSL,RINL, ESL, JSWL and JSPL was 15 %, whereas thetotal share of other producers was 85% in thefinancial year 2018-19. Location and capacity ofprincipal pig iron units in Private Sector arefurnished in Table- 8.
9-12
IRON, STEEL & SCRAP AND SLAG
Table – 8 : Location and Capacity of Principal Pig Iron Units
(In lakh tonnes)
Sl.No. Un i t Locat i on Capacity
1 . Srikalahasthi Pipes Ltd(formerly Lanco Industries Ltd) Chi ttoor, Andhra Pradesh 2 . 7 5
2 . Sathavahana Ispat Ltd Haresamudram, Andhra Pradesh 2 . 1 0
3 . Jayaswal NECO Industries Ltd Raipur, Chhattisgarh 6 . 5 0
4 . Vedanta Ltd Amona, Goa 7.42
5 . Usha Martin Industries Jamshedpur, Jharkhand 6 . 0 0
6 . JSW Steel Ltd Vijaynagar, Dolvi & Salem 1 80 .0 0
7 . Kalyani Steels Ltd Hospet , Karnataka 2 . 9 0
8 . Kirloskar Ferrous Industries Ltd Koppal, Karnataka 3 . 6 0
9 . KIOCL Ltd Mangaluru, Karnataka 2 . 1 6
10 . Tata Metaliks Ltd Redi, Maharashtra 3 . 1 6
11 . IDCOL Kalinga Iron Works Ltd Barbil, Kendujhar, Odisha 3 . 4 5
12 . Kajaria Iron Castings Ltd Durgapur, West Bengal 1 . 1 0
13 . Electrosteel Castings Ltd Khardah, West Bengal 3.60
14 . Tata Metaliks Ltd Kharagpur, West Bengal 3 . 4 5
15. Sona Alloys Pvt. Ltd Satara, Maharashtra 3 . 1 4
16. Aparant Iron & Steel Pvt. Ltd Sanguem, Goa 1 . 6 0
17 . Steel Authority of India Ltd Bhilai, Bokaro, Durgapur, 2 35 .0 0Burnpur, Rourkela, Bhadravati
18 . Rashtriya Ispat Nigam Ltd Visakhapatnam, Andhra Pradesh 65 .00
19 . Monnet Ispat Ltd Raigarh, Chhattisgarh 7 . 0 0
20 . MESCO Steel Ltd Kalinganagar, Odisha 4 . 5 0
21 . Jai Balaji Industries Ltd Durgapur, West Bengal 5 . 0 9
22 . Kirloskar Ferrous Industries Ltd Hospet , Karna taka 3 . 6 0
23 . KIC Metalliks Ltd Durgapur, West Bengal 1 . 6 5
24 . JSPL Raigarh, Chhattisgarh 20 .00
25 . VSL Steels Ltd Hiriyur, Karnataka 3 . 6 0
26 . Jindal Saw Pipes Ltd Mundra, Gujarat 3 . 6 0
27 . Ramsarup Loha Udyog Kharagpur, West Bengal 3 . 0 0
28 . Adhunik Metaliks Ltd Sundargarh, Odisha 2 . 1 4
29 . SLR Steels Ltd Hospet , Karna taka 2 . 1 0
30 . VISA Industries Ltd Kalinganagar, Odisha 1 . 7 5
31 . Rashmai Metaliks Ltd Kharagpur, West Bengal 1 . 7 5
32 . New Metaliks Ltd Durgapur, West Bengal 1 . 7 5
33. Neelachal Ispat Nigam Ltd Kalinganagar, Odisha 11.00
Source: MCDR Returns (Form-O), Website of concerned company, Iron & Steel Review,JPC Bulletin and Ministry of Steel
9-13
IRON, STEEL & SCRAP AND SLAG
Table – 9 : Capacities of Principal Sponge Iron (DRI) Plants(In lakh tonnes)
Unit Locat ion Capacity
Ga s-b a sed
Essar Steel Ltd Hazira, Gujarat 6 8 . 0
JSW Steel Ltd. (Salav) Salav, Raigad, Maharashtra 9 . 0 0(formerly Welspun Maxsteel Ltd)
JSW Steel Geetapuram, Dolvi, Raigad, Maharashtra 16 .00(formerly Ispat Industries Ltd)
Co al - ba se d
Action Ispat & Power Pvt. Ltd Marakuta & Pandaripathar, Jharsuguda, Odisha 2 . 5 0
Adhunik Metaliks Ltd Chandrihariharpur, Sundargarh, Odisha 1 . 8 0
Alliance Integrated Metallics Ltd Bemta, Raipur, Chhattisgarh 5 . 0 0
Anjani Steel Ltd Ujalpur, Raigarh, Chhattisgarh 1 . 0 2
Anindita Steels Ltd Rabodh, Jharkhand 1 . 4 6
API Ispat Powertech Pvt . Ltd IGC Siltara, Raipur, Chhattisgarh 1 . 0 5
Beekay Steel & Power Ltd Uliburu, Barbil, Odisha 1 . 0 5
Bhushan Steel & Strips Ltd Meramandali, Dhenkanal, Odisha 2 . 8 0
Bihar Sponge Iron Ltd Chandil, Singhbhum, Jharkhand 2 . 1 0
Crest Steel & Power Pvt. Ltd Joratarai , Rajnandgaon, Chhattisgarh 2 . 1 0
Deepak Steel & Power Ltd Topadihi, Kendujhar, Odisha 1 . 4 4
Gallant Metal Ltd Samakhiali, Kachchh, Gujarat 1 . 7 0
Gallant Ispat Ltd Sahjanwa, Gorakhpur, UP 1 . 0 0
Global Hi-tech Industries Ltd Gandhidham, Gujarat 1 . 0 5
Goa Sponge Iron & Power Ltd Santona, Sanguem, Goa 1 . 0 0
Godawari Power & Ispat Ltd IGC Siltara, Raipur, Chhattisgarh 4 . 9 5(Con td)
Sponge IronIndia is the largest producer of sponge iron in
the world. Sponge iron is produced by directreduction method which may be either gas-based orcoal-based. Direct Reduced Iron (DRI), called assponge iron is a metallic material formed byreduction of iron oxide at temperatures below thefusion point of iron. Hot Briquetted Iron (HBI) is aproduct obtained after densification process wherethe DRI feed material is at temperature more than650 0 C at the time of moulding (hot briquetting) withdensity more than 5.0 g/cm3.
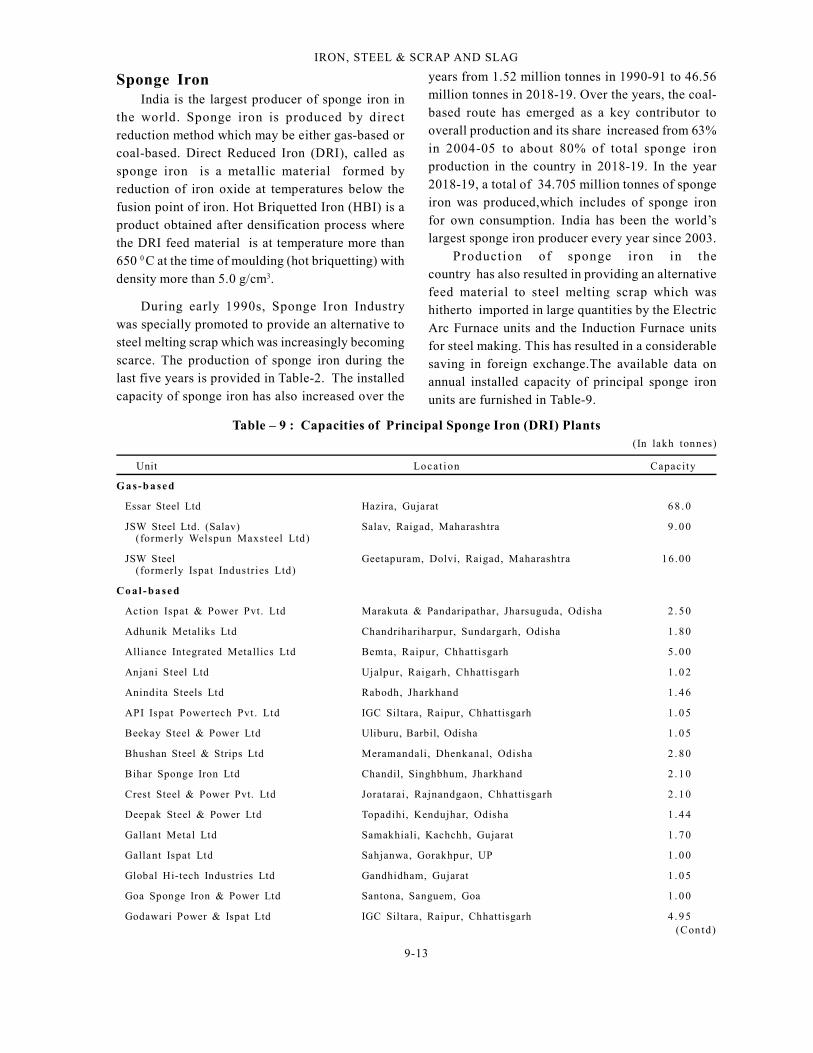
During early 1990s, Sponge Iron Industrywas specially promoted to provide an alternative tosteel melting scrap which was increasingly becomingscarce. The production of sponge iron during thelast five years is provided in Table-2. The installedcapacity of sponge iron has also increased over the
years from 1.52 million tonnes in 1990-91 to 46.56million tonnes in 2018-19. Over the years, the coal-based route has emerged as a key contributor tooverall production and its share increased from 63%in 2004-05 to about 80% of total sponge ironproduction in the country in 2018-19. In the year2018-19, a total of 34.705 million tonnes of spongeiron was produced,which includes of sponge ironfor own consumption. India has been the world’slargest sponge iron producer every year since 2003.
Production of sponge iron in thecountry has also resulted in providing an alternativefeed material to steel melting scrap which washitherto imported in large quantities by the ElectricArc Furnace units and the Induction Furnace unitsfor steel making. This has resulted in a considerablesaving in foreign exchange.The available data onannual installed capacity of principal sponge ironunits are furnished in Table-9.

9-14
IRON, STEEL & SCRAP AND SLAG
Table - 9 (Concld)
Unit Locat ion Capacity
Gopani Iron & Power Pvt. Ltd Tadali, Chandrapur, Maharashtra 1 . 2 0
Goldstar Steel & Alloys Ltd Srirampuram, Vizianagaram, Andhra Pradesh 2 . 2 0
Grewal Associates Pvt. Ltd Matkambed, Kendujhar, Odisha 1 . 2 0
Haldia Steels Pvt. Ltd Durgapur, West Bengal 1 . 2 0
Ind Synergy Ltd Kotmar, Raigarh, Chhatt isgarh 3 . 0 0
Jai Balaji Sponge Ltd Baktarnagar, Raniganj, West Bengal 1 . 0 5
Jai Balaji Jyoti Steels Ltd Sundargarh, Odisha 1 . 2 0
Jai Shri Balaji Steel Pvt. Ltd (HEG Ltd) Borai, Durg, Chhattisgarh 1 . 2 0
Jaiswal Neco Ltd IGC Siltara, Raipur, Chhattisgarh 2 . 5 5
Janki Corporation Ltd Sidiginamola, Ballari, Karnataka 1 . 8 0
Jindal Steel & Power Ltd Kharsia Road, Raigarh, Chhattisgarh 1 . 3 7
Lloyds Metals & Engineering Ltd Ghuggus, Chandrapur, Maharashtra 2 . 7 0
Mastek Steels Pvt. Ltd Holakundi, Ballari, Karnataka 1 . 0 5
MGM Steels Ltd Chintapokhri, Dhenkanal, Odisha 1 . 0 5
Monnet Ispat Energy Ltd Chandkhuri Marg, Hasaud, Raipur, Chhattisgarh 3 . 0 0
Monnet Ispat & Energy Ltd Naharpalli, Raigarh, Chhattisgarh 5 . 0 0
MSP Steel & Power Ltd Jamgaon, Raigarh, Chhattisgarh 1 . 9 2
Nalwa Steel & Power Ltd Taraimal, Raigarh, Chhattisgarh 1 . 9 8
Nova Iron & Steel Ltd Dagori, Bilaspur, Chhattisgarh 1 . 5 0
OCL Iron & Steel Ltd Lamloi, Sundargarh, Odisha 1 . 2 0
Orissa Sponge Iron Ltd Palaspanga, Kendujhar, Odisha 2 . 5 0
Prakash Industries Ltd Champa, Janj-gir-Champa, Chhattisgarh 4 . 5 0
Rungta Mines Ltd Karakola and Kamando, Sundargarh, Odisha 4 . 2 0
Rashmi Cement Ltd Barbil, Kendujhar, Odisha 3 . 6 0
Sarda Energy & Minerals Ltd IGC Siltara, Raipur, Chhattisgarh 2 . 1 0
Scaw Industries Pvt. Ltd Gundichapara, Dhenkanal, Odisha 1 . 0 0
Shivshakti Steel Ltd Chakradharpur, Raigarh, Chhattisgarh 1 . 0 0
Shri Bajrang Power & Ispat Ltd Urla, Raipur, Chhattisgarh 2 . 1 0
Shyam Sel Ltd Dewabdighi, Burdwan, West Bengal 1 . 0 0
Singhal Enterprises Pvt. Ltd Taraimal, Raigarh, Chhattisgarh 2 . 5 3
Sree Metaliks Ltd Loidapada, Kendujhar, Odisha 1 . 7 4
Sri Venkatesh Iron & Alloys Ltd Ramgarh, Jharkhand 1 . 2 0
S.K.S. Ispat & Power Ltd Raipur, Chhattisgarh 2 . 7 0
Sunflag Iron & Steel Co Ltd Bhandara, Maharashtra 1 . 5 0
Sunil Ispat & Power Ltd IGC Siltara, Raipur, Chhattisgarh 1 . 1 5
Sunil Sponge Iron Ltd Chiraipani, Raigarh, Chhattisgarh 1 . 0 5
Tata Sponge Iron Ltd Joda, Kendujhar, Odisha 3 . 9 0
Vandana Global Ltd IGC Siltara, Raipur, Chhattisgarh 2 . 1 6
Vallabh Steels Ltd Sahnewal, Ludhiana, Punjab 1 . 2 0
Visa Steels Ltd KIC, Jajpur Road, Odisha 3 . 00
Zoom Vallabh Steels Ltd Dughda, Saraikela-Kharswan, Jharkhand 1 . 2 0
I.G.C.: Industrial Growth CentreSource: Sponge Iron Manufacturers' Association (SIMA) and individual plants

9-15
IRON, STEEL & SCRAP AND SLAG
The modernisation & expansion of Bokaro SteelPlant (BSL), Durgapur Steel Plant (DSP), RourkelaSteel Plant (RPS), IISCO Steel Plant (ISP) and SalemSteel Plant has been completed. The modernisedRourkela Steel Plant and IISCO Steel Plant havebeen dedicated to the Nation by the Hon’ble PrimeMinister on 01.04.2018 and 10.05.2018 respectively.At IISCO Steel Plant, Burnpur, India's largest blastfurnace (4,160 m3) has been installed.
At Bhilai Steel Plant, major facilities have beencompleted except one Caster and one Converter inSMS-III and the integrated process route has been
Consumption of SteelPer capita finished steel consumption in the year
2018 was 224.5 kg for world and 590.1 kg for China(Source: World Steel Association). The same for Indiawas 73.3 kg in 2018 (Source: JPC) and 75.7 kg (prov.) in2019.The per capita consumption of India in 2018-19was 74.1 kg (Source: JPC).
Apparent consumption of steel is calculated bytaking into consideration with respect to export of steel,total domestic production and import of steel in thecountry. It is also treated as the actual domestic demandof steel in the country. The apparent consumption/domestic consumption of finished steel in India since2014-15 is furnished in Table-10.
Table-10: Domestic Consumption of
Finished Steel, 2014-15 to 2018-19
(In million tonnes)
Year Consumption % increase
2014-15 76.99 3.91%
2015-16 81.52 5.88%
2016-17 84.04 3.09%
2017-18 90.71 7.94%
2018-19 98.71 8.82%
Source: Ministry of Steel, Annual Report, 2019-20 & Anoverview of Steel Sector as available on the website ofMinistry of Steel.
Domestic consumption of total finished steel(alloy/stainless + non-alloy) which was at 98.71 milliontonnes in 2018-19 as against 76.99 million tonnes in2014-15 has been growing at a CAGR of 6% during thelast five years.
With the expansion of capacities in the integratedplants and installation of new plants, additional supplyof steel in Indian markets has increased considerably.This has created an intense competition in thedomestic market in the short run.
MODERNISATION & EXPANSIONModernisation and expansion works undertaken
by different plants are as follows:
SAILSteel Authority of India Limited has undertaken
modernisation and expansion of its integrated steelplants at Bhilai, Bokaro, Rourkela, Burnpur and specialsteel plant at Salem. In the current phase, the crudesteel capacity is being enhanced from 19.132 million
tonnes to 21.4 million tonnes per annum. Theindicative investment for current phase is about
61,870 crore. The cumulative expenditure forvarious modernisation & expansion has been
69,255 crore including expenditure of 2,009 croreduring the Financial Year 2018-19.
The plant-wise capacity enhancement detailsby 2017-18 are given below:
Hot Metal(In million tonnes)
Plant Name Installed Expansion
Capacity Capacity
BSP 4.08 7.50
DSP 2.09 2.45
RSP 2.00 4.50
BSL 4.59 5.77
ISP 0.85 2.91
VISL 0.22 0.33
Total 13.82 23.46
Crude Steel(In million tonnes)
Plant Name Installed Expansion
Capacity Capacity
BSP 3.93 7.00
DSP 1.80 2.20
RSP 4.40 4.20
BSL 4.36 4.61
ISP 2.50 2.50
ASP 0.23 0.48
SSP 0.18 0.18
VISL 0.12 0.23
Total 17.52 21.40
Note : The present installed capacity of SAIL for HotMetal and crude steel is reportedly about 17.105 milliontonnes and 19.132 million tonnes respectively.
9-16
IRON, STEEL & SCRAP AND SLAG
of the various supporting/auxiliary facilities requiredfor achieving 7.3 MTPA production and otherprojects.
National Mineral Development Corporation(NMDC)
NMDC is setting up a 3.0 MTPA GreenfieldIntegrated Steel Plant at Nagarnar, Bastar district inChhattisgarh. Construction work for the project is inprogress and about 93% of civil work, 90% structuralerection, 76% equipment erection have beencompleted as on 31.3.2019.
NMDC is in process of developing 2.0 MTPAPellet Plant at Nagarnar along with 2.0 MTPA OreProcessing Plant at Bacheli interconnected by aSlurry Pipeline System between Bacheli and Nagarnarin Chhattisgarh.
NMDC is also in the process of augmenting itsproduction & evacuation capacities by installing thefollowing additional infrastructure facilities:-
Construction of 5th Screening line in existingScreening Plant-II and upgradation of downstreamConveyor at Kirandul Complex, Bailadila,Chhattisgarh.
Construction of 5th Screening line in existingScreening Plant and upgradation of downhillconveyor system at Deposit-5, Bacheli Complex,Bailadila, Chhattisgarh.
Installation of 12.0 MTPA Screening Plant-III at Kirandul Complex, Bailadila, Chhattisgarh.
Installation of 7.0 MTPA Screening &Beneficiation Plant-II at Donimalai Complex,Karnataka.
Doubling of Kirandul - Kothavalasa Railline between Kirandul and Jagdalpur.
Tata Steel Ltd (TSL)
The Company has been rechristened as TataSteel Ltd (TSL). The Company has an integrated steelplant located at Jamshedpur, Jharkhand, with annualcrude steel making capacity of 13.00 million tonnesand variety of finishing mills.
Tata Steel Group is among the top global steelcompanies with an annual crude steel capacity of 33million tonnes per annum (MTPA). It is one of theworld’s most geographically-diversified steelproducers, with operations in Europe, south east Asia
set into operation, stabilisation and ramp-up. Hon’blePrime Minister of India dedicated the modernised andexpanded Bhilai Steel Plant to the Nation on14.6.2018. At Bhilai Steel Plant, Rail Welding Line,Ore Handling Plant Part-A, 2nd Sinter Machine inSinter Plant-3, Coke Oven Battery-11 and UniversalRail Mill are in regular operation. Hot-trial of Bar Millhas started. Balance facilities of Steel Melting Shop-III are at advanced stages of completion.
SAIL is finalising its Vision-2025 document,proposals for innovation are expected to steer theCompany to increase its production capacity of HotMetal to 50 MTPA, along with related/enablingbusiness activities in line with growing demand ofsteel in the country. This will not only enhanceSAIL's contribution to nation building but will alsoplace SAIL amongst the top steel companies globally.
Rashtriya Ispat Nigam Ltd (RINL)
Visakhapatnam Steel Plant (VSP) is a 7.3 MTPAplant located at Visakhapatnam in Andhra Pradesh.It was commissioned in 1992 with a capacity of 3.0MTPA of liquid steel. The Company subsequentlycompleted its capacity expansion to 6.3 MTPA inApril, 2015 and to 7.3 MTPA in December, 2017. RINLis one of the major players in the country for LongProducts.
The Company has one subsidiary, viz. EasternInvestment Limited (EIL) with 51% shareholding,which in turn has two subsidiaries, viz. M/s OrissaMineral Development Company Ltd (OMDC) and M/s Bisra Stone Lime Company Ltd (BSLC). TheCompany has partnership in RINMOIL Ferro AlloysPrivate Limited and International Coal VenturesLimited in the form of Joint Ventures with 50% and26.49 % shareholding respectively.
RINL, with an exclusive product mix of longs isthe largest producer of “Bars and Rods” in thecountry with a market share of 9.5% in 2018-19. Theproducts of RINL include Rebars, Wire Rods,Rounds, Structurals, Blooms & Billets and Pig Ironand the Company also markets the resultant by-products like coal chemicals (Ammonium Sulphate,Benzol products etc.) and Slag. RINL products areknown for its quality.
With the completion of modernisation of majorUnits, the focus during the year was on completion
9-17
IRON, STEEL & SCRAP AND SLAG
and India and commercial presence across the world.In 2018, Tata Steel acquired Bhushan Steel Ltd (nowrenamed as Tata Steel BSL Ltd). Currently, Tata Steel’sIndian operations (Jamshedpur, Kalinganagar, Angul)
has crude steel production capacity of 18.6 MTPA.
JSW Steel LtdJSW Steel Ltd is one of the foremost integrated
steel company in India with an installed capacity of18 MTPA, and has plans to scale it up in India andoverseas. JSW Steel’s manufacturing facility atVijayanagar, Karnataka, is the largest single locationsteel-producing facility in India with a capacity of 12MTPA. It is the first Company to manufacture high-strength and advanced high-end steel products forits automotive segments. Today, JSW Steel exportsits products to over 100 countries across the globe.
Jindal Steel & Power Ltd (JSPL)Jindal Steel & Power Limited (JSPL) is amongst
India’s fastest growing and leading businessconglomerates with significant presence in coreinfrastructure sectors including steel, power, miningand infrastructure. JSPL’s business operations spanacross the States of Chhattisgarh, Odisha andJharkhand in India, where it operates some of India’smost advanced steel manufacturing and powergeneration capacities of global scale. JSPL is India’sfirst and only private manufacturer of rails. It isamong the lowest cost producers of steel and power
in India.
Jindal Stainless Ltd (JSL)Jindal Stainless Limited (JSL) is one of the largest
integrated manufacturers of stainless steel in India.The Odisha plant has world class technology andequipment sourced from Siemens VAI, SMS Siemagand Andritz Sundwig and the complex is equippedwith a Ferro Alloys set up and captive powergeneration unit, the plant is capable of producingunique and wide range of products both in terms ofgrades and dimensions. Hot Rolled Plates and Coilsof 1,650 mm width and minimum thickness of 2 mm inall grades of stainless steel can be produced as perthe customers demand. Also, Cold Rolled Coils ofminimum thickness of 0.3 mm with maximum width of
1,650 mm can be achieved based on customers' need.
Jindal Stainless (Hisar) LtdJindal Stainless (Hisar) Limited (JSHL) has a fully
integrated stainless steel plant with a capacity of
0.8 MTPA. It is also the world's largest producer ofstainless steel strips for razor blades and India'slargest producer of coin blanks, serving the needsof India and international mints.
The JSHL plant works on the strategy of bothbackward and forward integration, starting frommelting, casting, hot rolling to cold rolling and othervalue additions. JSHL's speciality product divisioncaters to the high-end precision and specialitystainless steel requirements of reputed Indian andInternational customers. The product range includesSlabs & Blooms, Hot Rolled Coils, Strips, Plates, Coin
Blanks, Precision Strips and Cold Rolled Coils.
Essar Steel Limited (ESL)Essar Steel is known for its high quality of flat
steel products. The Company focuses on high value-added grade steels and has developed over 300grades of flat steel for different applications. EssarSteel is a 10 MTPA integrated steel producer andhas made many prudent investments by creatingfacilities to complete the value chain both upstreamand downstream. Its investments in state-of-the-artfacilities give it full control over its manufacturing
process and ensures consistent quality of products.
IRON & STEEL SCRAPIron & steel scrap is one of the essential
requirements for manufacture of steel in Mini-steelIndustry. It is also consumed by some major steelplants. Scrap, especially from the Ship BreakingIndustry supplies substantial quantity of re-rollablesteel as well as steel scrap for the Iron & SteelIndustry and Secondary Sector, such as, Micro, Small& Medium Enterprises (MSME). Other form of scrap,i.e., end of life cycle scrap or obsolete scrap theseget generated in la rge quanti ties and formsubstantial reserves of scrap that could be efficientlyput to use. Iron scrap is available in the country inthe form of pressed bundles, a mixture of used steelcomponents (called as a commercial scrap), turnings& borings and heavy melting scrap. These aregenerated by industr ies of al l sectors likeautomobiles, railways and engineering workshops.
The collection and processing of scrap inan organised manner is undertaken by a fewunits in the country. In the local market, scrapis supplied by dealers who in turn arrange tohave scrap collected manually or through sub-dealers.
9-18
IRON, STEEL & SCRAP AND SLAG
The consumption of scrap is mainly reported byInduction Furnace & Electric Arc Furnace units,Integrated Steel Plants and Alloy Steel & Foundryindustries. Scraps are used in the Steel Sector afterrecycling. Recycling of one tonne of steel scrapsaves about 1.1 tonnes of iron ore, 0.6 to 0.7 tonnesof coking coal and around 0.2 to 0.3 tonnes of fluxes.Besides, saving of energy by about 16-17%. It alsoreduces the water consumption and GHG emissionby 40% and 58% respectively. Recycling scrap helpsin conservation of energy as remelting of scraprequires much less energy than production of ironor steel from iron ore. Also, the consumption of ironand scrap by remelting reduces the burden onlandfill disposal facil i ties and prevents theaccumulation of abandoned steel products in theenvironment. It increases the availability of semi-finished material, which otherwise would have to beproduced using the ore. Thus, it helps inconservation of natural resources.
Ship Breaking
Ship breaking has been a major source of scrapgeneration. Ship breaking activities are carried outat various places on the Indian coast, the largestconcentration being in the West coast. Privateentrepreneurs handle the task of ship breaking inIndia. It is a labour-intensive job, and in India, it isa cost-efficient activity. Locations of present shipbreaking activities are:
(i) Alang and Sosiya yards in Bhavnagardistrict, Gujarat,
(ii) Sachana district, Gujarat
(iii) Mumbai and
(iv) Kolkata
Alang & Sosiya yards account for 98%concentration of the Ship Breaking Industry inIndia.The yard has capacity to recycle about 450ships per year generating re-rollable steel of > 4.5million tonnes per annum. There are a total of 167plots available for ship recycling spread over 10 kmstretch along the coast of Alang.
The NGO Shipbreaking Platform is a globalcoalition of environmental, human and labour rightsorganisations working to promote safe andenvironmentally sound ship recycling practices. The
coalition quickly evolved from being a EuropeanPlatform to a global one, including NGOs based inthe major shipbreaking countries, such as, India,Bangladesh, Pakistan and Turkey. It now has 18member organisations and six partners in 12countries. The Platform is recognised by UnitedNations agencies, the European Union and leadingmedia outlets as the preeminent international civilsociety advocacy organisation on ship recycling. In2018 and 2019, 1,418 vessels were dismantled out ofwhich 453 beached ships were dismantled in India.About 987 of these ships were sold for dirty anddangerous breaking on the beaches of South Asia.
Today, Alang possibly represents the singlelargest concentration of Ship Breaking Industry inthe world. The life of an average ocean-going ship isabout 25-30 years. About 40% of the ships brokenare dry cargo ships, while the remaining 60% of theships broken are wet cargo, tanker and specialisedships etc. These recyclable steels mainly as steelscrap provide feed to Steel and Foundry Industry inIndia. The steel generated f rom ship recyclingcontributes to around 1% to 2% of the domestic steeldemand.
The recommendations of a Committee ofTechnical Experts on Ship Breaking, set up by theGovernment of India on the directions of the Hon'bleSupreme Court, on the issue of handl ing &management of the hazardous industrial wastegenerated during ship breaking have been acceptedby the Hon'ble Supreme Court on 06.09.2007. Inpursuance of the directions of the Hon’ble SupremeCourt in CWP 657 of 1995, Government of Indiathrough the Ministry of Steel had formulated andnotified the comprehensive code for ship breakingand ship recycling, namely, Ship breaking Code, 2013,
vide Notification dated 7th March, 2013.
MSTC Ltd(Formerly Metal Scrap Trade Corp. Ltd)
MSTC Limited was incorporated as “Metal ScrapTrade Corporation Limited”, under the provisions ofthe then Companies Act, 1956 on September 9, 1964at Kolkata for regulating export of ferrous scrapfrom India. The status of the Company underwent achange in February 1974 when it was made asubsidiary of Steel Authority of India (SAIL). In the

9-19
IRON, STEEL & SCRAP AND SLAG
year 1982-83, the Corporation was converted into anindependent PSU under administrative control ofMinistry of Steel. It was the canalising agency forimport of carbon steel melting scrap, sponge iron,hot briquetted iron and re-rollable scrap till February1992.
Presently, the Company has diversified mainlyinto providing e-auction /e-procurement services.Under this segment, the Company undertakesdisposal of ferrous and non-ferrous scrap arisings,surplus stores, condemned plants, minerals, Agri &forest produce etc. from Public Sector Undertakingsand Government Departments including privatecompanies. The Trading Division is engaged inimport as well as domestic sourcing of bulk industrialraw material for actual users as well as traders. ThisDivision looks after sourcing, purchase and sale ofindustrial raw materials like low ash metallurgical coke,HR coil, naphtha, crude oil, coking coal, steam coal,line pipes etc. on behalf of customers across steel,oil & gas, power sectors under Private and PublicSector. It also undertakes trading of items within the
country in competition with any other private trader.
Ferro Scrap Nigam Ltd (FSNL)FSNL is a wholly owned subsidiary of MSTC
Ltd under the Ministry of Steel. The Companyundertakes the recovery and processing of scrapfrom slag and refuse dumps in the nine steel plantsat Bhilai, Bokaro, Burnpur, Durgapur, Rourkela,Visakhapatnam, Dolvi, Duburi and Haridwar and alsoat Rail Wheel factory Bengaluru. The scrap sorecovered is returned to the steel plants for recyclingdisposal and the Company is paid processing chargeson the quantity recovered at varying rates dependingon the category of scrap. Scrap is generated duringiron & steel making and also in the rolling mills. Inaddition, the Company provides steel mill services,such as, scarfing of slabs, handling of BOF slag, etc.During the year 2018-19, the Company recovered ascrap of 35.66 lakh tonnes.
SLAG - IRON AND STEEL
Slag is a by-product generated during
manufacturing of pig iron and steel. It is producedby action of various fluxes upon gangue materialswithin the iron ore during the process of pig ironmaking in blast furnace and steel manufacturing insteel melting shop. Primarily, slag consists of calcium,
magnesium, manganese and aluminium silicates andoxides in various combinations. The cooling processof slag is responsible mainly for generating differenttypes of slags required for various end-useconsumers. Although the chemical composition ofslag may remain unchanged, physical propertiesvary widely with the changing process of cooling.
In an integrated steel plant, 2-4 tonnes of wastes(including solid, liquid and gas) are generated forevery tonne of steel produced. The major wastesproduced in integrated steel plants (ISP) include BFiron slag. Steel slag accounting for nearly more thanhalf a tonne gets generated for each tonne of steelproduced in ISPs. Among all the solid/liquid wastes,slags generated at iron making and steel making unitsare in such a large quantities that management ofslag has become a critical component of steelproduction. Over the last few years, with betterunderstanding of slags, its functions andimprovements in process technologies have led to asignificant reduction in the volume of slag generated.At the same time, the re-use of iron and steel has ledto a significant reduction in the environmental impactof these by-products.
Production of Slag
The slag produced at blast furnace during pigiron manufacturing is called blast furnace slag. Theslag produced at steel melting shop is known as steelslag. Slag output obtained during pig iron and steelproduction is variable and depends mainly oncomposition of raw materials and type of furnace.Typically, for ore feed containing 60 to 65% iron,blast furnace (BF) slag production ranges from about300 to 540 kg per tonne of pig or crude iron produced,whereas in steel making 150 to 200 kg per tonne ofslag is generated per tonne of liquid steel. Lowergrade ores yield much higher slag fractions,sometimes as high as one tonne of slag per tonneof pig i ron produced. Steel slag output isapproximately 20-30% by mass of the crude steeloutput in the country.
Ferro Scrap Nigam Ltd (FSNL), a wholly ownedsubsidiary of MSTC Ltd rendering its specialisedservices of scrap and slag management to plants atSAIL-Rourkela, Burnpur, Bhilai, Bokaro, Durgapur,Bhadravati, Salem, RINL-Visakhapatnam, NINL-Duburi, BHEL-Haridwar, RWF (Rail Wheel Factory) -Bengaluru, Air India- Mumbai and Essar- Hazira.

9-20
IRON, STEEL & SCRAP AND SLAG
The information regarding plant-wise capacityof iron and steel slag in the country is reflected inTable- 11.
Blast Furnace Slag
In the blast furnace, the slag floating over mol-ten pig iron (hot metal) is flushed out in slag pot andthen sent to slag granulating plant or to cooling pits.
Depending upon the cooling process, threetypes of slags are generated, namely, air-cooled slag,granulated slag and expanded slag.
Air-cooled slag is produced by allowing the mol-ten slag to cool under atmospheric conditions in a pit. Under slow cooling conditions, escapinggases leave behind porous and low-density aggre-gates with special physical properties, making it suit-able for many applications. When formed under con-trolled cooling, the slag tends to be hard and dense,making it especially suitable for use in ready-mixedconcrete, concrete products, road bases and similarapplications in construction.
Granulated slag is produced by quenching themolten slag by means of high-pressure water jets.Quenching prevents crystallisation, thus resultingin granular, glassy aggregates. This slag is crushed,pulverised and screened for use in variousapplications, particularly in cement productionbecause of i ts pozzolanic characteris tics.
Steel plants utilise cold slag for internalconsumption and also for outside sale. The slagafter cooling is crushed and used as road metal andrailway ballast. Granulated slag produced in steelplants is also sold outside to cement plants. Slagapplicat ion also reduces the overall cost ofproduction of cement.
Expanded slag is formed through controlledcooling of molten slag in water or water withcombination of steam and compressed air. Formationof steam and other gases enhances the porosity andvesicular nature of slag, resulting in light weightaggregate suitable for use in concrete. However,expanded slag is not produced at any domestic ironand steel plant.
A fourth product made from blast furnace slag ismineral wool/slag wool. Cooled slag for this purposeis melted and poured through an air stream or a jet ofdried stream of other gases to produce a spray ofmolten droplets or the same is also formed by passing
the melt through a perforated or fast-spinning disc.The droplets, elongate to long fibres, are collectedmechanically and layered. The material has excellentthermal insulation properties.
The five different slags generated at variouspoints of the steel making process are describedbelow:
HMT Slag: This slag is primarily generated after de-siliconisation or de-phosphorisation treatment. Ithas high content of silica and lime. Sometimes italso contains BF slag.
HMDS Slag: This is the raked slag at the de-
sulfurisation station. These slags are poorly mixedcomposites of spilled BF slag, spent and/or unreactedde-sulphurisation agents, lime fines and trappeddroplet of hot metal and raked iron.
LD Slag: These slags are a well mixed aggregate of
FeO, lime, silica and MgO generated at the LDconverter. They are in the form of di-calcium and tri-calcium silicates. These slags also contain free limeand metal, which create problems due to expansioncharacteristics.Steel Slag: These slags vary in composition withrespect to the varied treatment. The common steelslags are fused calcium aluminates with less than 2%
Table – 11 : Plant-wise Capacity of Iron andSteel Slag in the Country
Steel Plant Capacity('000 tpy)
Bhilai Steel Plant, Durg, Chhattisgarh 2675
Bokaro Steel Plant, Bokaro, Jharkhand 7884
Rourkela Steel Plant, Rourkela, Odisha 1570
Durgapur Steel Plant, Durgapur,
West Bengal 5 6 6
IISCO Steel Plant, Burnpur, West Bengal 40 0
kg/THM*
Visvesvaraya Iron & Steel Plant, 4 0 0
Bhadravati, Karnataka kg/THM*
Rashtriya Ispat Nigam Ltd,
Visakhapatnam, Andhra Pradesh 1440
IDCOL Kalinga Iron Works Ltd,
Barbil, Odisha 53
JSW Steel Ltd, Ballari, Karnataka NA
Tata Steel Ltd, Jamshedpur, Jharkhand 2100
Visa Steel Ltd, Kalinganagar, Odisha 1 7 5
Neelachal Ispat Nigam Ltd -
Kalinganagar, Odisha
*THM : Tonne Hot Metal
9-21
IRON, STEEL & SCRAP AND SLAG
(FeO + MnO). These readily crumble to dust due toallotropic phase transformation at lower temperaturesand are difficult to manage.SGP Slag: LD slag is subjected to granulationthrough a quenching technology adopted at JSW,which houses the first of its kind in India. Due tosudden quenching of the molten slag, contraction ofmetal and slag occurs and results in good separationof metal and slag. Adequate granulation takes placeand leads to good stability of the final slag. Processcan be described as an accelerated ageing processthat reduces the free lime content. As a result ofrapid cooling, it generates more glassy structurethan the BOF slag. Removal of free lime also confirmsits volumetric stability.
Steel SlagBOF slag, commonly known as steel slag, is
another waste from Iron & Steel Industry. It hasshown potential for use as a raw mix component upto 10% in the manufacture of cement clinker. Steelslag can also replace granulated blast furnace slagup to 10% in the manufacture of Portland SlagCement. Steel slags are produced at steel meltingshop during steel manufacturing. To produce steel,removal of excess silicon and carbon from iron isachieved through oxidation by adding limestone andcoke. The steel slag contains higher amount of ironand its physical characteristics are similar to air-cooled iron slag. The LD slag is cooled, crushedand screened. The fines are utilised in sinter makingand lumps are charged in the blast furnace.
The iron content is the major basic differencebetween BF slag and steel slag. In BF slag, FeO isaround 0.70%, whereas in case of steel slag, the totaliron content varies from 16 to 25%.
JSW Steel has set up a unique BOF slaggranulation plant, producing slag with lower free limecontent and is vigorously pursuing the matter withBIS. JSPL has set up a plant to produce around 4.0lakh brick products/day by utilising fly ash and slaggenerated from integrated steel plant.
Uses of SlagSlag, based on their types, has different uses.
The air-cooled BF slag is crushed, screened and usedmainly as road metal and bases, asphalt paving, trackballast, landfills and concrete aggregate. Theexpanded or foamed slag binds well with cement andis used mainly as aggregate for light weight concrete.
However, it is not produced by domestic steel plants.Granulated BF slag is used as a pozzolanic materialfor producing portland slag cement. It is also usedfor soil conditioning. BF slag is used in makingmineral wool for insulation purposes.
Steel slag has found use as a barrier materialremedy for waste sites where heavy metals tend toleach into the surrounding environment. Steel slagforces the heavy metals to drop out of solution inwater run off because of its high oxide mineralcontent. Steel slag has been used successfully totreat acidic water discharges from abandoned mines.
Slags are useful alternative raw material forclinker production and such use can reduce a cementplant's fuel consumption and overall emission ofcarbon dioxide per tonne of cement.The granulatedslag obtained from various steel plants is dried inslag dryer. The clinker is ground in ball mill with40-50% dry slag and 6% gypsum. The resultantproduct is portland slag cement. Portland blastfurnace slag cement contains up to 60% groundgranulated slag from steel production processes.
Slag cement has low heat of hydration, low alkaliaggregate reaction, high resistance to chlorides andsulphate and it can substitute the use of 43 and 53grades of ordinary Portland Cement. For otherconsuming sectors like road making, landfilling andballasting, the cooled slag is crushed by machinesor broken manually by hammers into smaller piecesand supplied to the various end-use consumers.Theutilisation of SMS (particularly LD) slag is limiteddue to its (i) Phosphorous content (ii) high free limecontent and (iii) higher specific-weight.
Consumption of SlagThe Steel Industry in India is producing about
24 million tonnes of blast furnace slag and 12 milliontonnes of steel slag annually. It is expected that theBF slag generation may reach around 45 to 50 milliontonnes and BOF slag around 15-20 million tonnesper year by 2030. Besides, EAF and IF slaggeneration will also increase to more than 10 milliontonnes per year from the present level of around 5million tonnes per year by 2030. The BF slag in Indiais used mainly in the cement manufacture and in otherunorganised work, such as, landfills and railwayballast. A small quantity is also used by the GlassIndustry for making slag wool fibres. Cement plantsin the country producing slag cement require BF slagin granulated form.

9-22
IRON, STEEL & SCRAP AND SLAG
TRADE POLICYAs per the notified Export-Import Policy
incorporated under the Foreign Trade Policy(FTP) for 2015-20, the imports of primary formsof pig iron, spiegeleisen, sponge iron, ferroalloys,stainless steel, remelting scrap, as also the semi-finished products of iron, non-alloy steel or stainlesssteel (such as flat-rolled products, bars, rods, coilsand wires), primary and semi-finished forms of otheralloy-steels, etc. are unrestricted. Similarly, the
exports are also allowed freely.
WORLD REVIEWThe world production of pig iron in 2018 was
about 1,340 million tonnes as against 1,265 million
tonnes in 2017. China (58%), India (8%), Japan (6%),Russia (4%), Rep. of Korea (3%), and Brazil, Iran,Germany & USA (2% each) , were the main producers.Countries, namely, Ukraine, Taiwan, Turkey, Franceand Mexico too featured in the list as principalproducers (Table-12).
The world crude steel production in 2018increased by 5% to 1,812 million tonnes from 1,731million tonnes in 2017. China was the top produceraccounting for 51% of world's crude steel production,followed by India & Japan (6% each), USA (5% )and Russia & Rep. of Korea (4% each), and Germany,Turkey & Brazil (2% each). Other important producerswere Italy, Iran,Taiwan, Ukraine, Mexico and France(Table-13).
Table – 12 : World Production of Pig Iron
(By Principal Countries)
(In tonnes)
Country 2016 2017 2018
World 1227000000 1265000000 1340000000
China 702273300 713619300 771054400
India* 77254000 96313000 106823000
Japan 80186246 78329729 77327888
Russia 51900000 52200000 51800000
Korea, Rep of 46336000 47100000 47124000
Brazil 29680000 32151000 32500000
Iran 18264000 21694000 28100000
Germany 27269000 27816000 27271000
USA 22293000 22395000 24058000
Ukraine 23560000 19797900 20531200
Taiwan 14890000 14361000 14841000
Turkey 10304000 10589000 10536000
France 9724062 10677830 10529559
Mexico 9782000 10256000 10373000 e
Other countries 103120615 107785155 106854527
Figures rounded off.
Source: BGS, World Mineral Production, 2014-2018,
* India's production of Pig Iron during 2016-17, 2017-
1 8 and 2018-19 was 1,03,42,000 tonnes, 57,28,000
tonnes and 64,14,000 tonnes respectively.
Note: The data in this table include sponge iron and
direct reduced iron (DRI) where these have been sepa-
rately identified ; e : estimated
Table – 13 : World Production of Crude Steel
(By Principal Countries)
(In tonnes)
Country 2016 2017 2018
World Total 1627000000 1731000000 1812000000
China 807609400 870740900 928009000
India*(b) 97443000 102338000 110920000
Japan 104775329 104661087 104318836
USA 78475000 81612000 86607400
Russia 69600000 72968168 74144495
Korea, Rep. of 68575000 71080000 72464000
Germany 42081000 43297000 42435000
Turkey 33163000 37524000 37311700
Brazil 31275000 34350000 34900000
Ita ly 23372000 24069000 24532000
Iran (c) 18466000 21840000 24500000
Taiwan 20858000 21370000 23200000
Ukraine 24218000 21334000 21100000
Mexico 18811000 19924000 20694000
France 14412574 15504683 15387355
Other countries 174242839 188450235 191581173
Figures rounded off.
Source: BGS, World Mineral Production, 2014-2018,
* India's production of crude steel during 2016-17,2017-1 8 and 2018-19 was 9,79,36,000 tonnes,10,31,32,000 tonnes and 11,09,21,000 tonnes, respec-tively.(b) : Years ended 31st March following that stated.(c): Years ended 20th March following that stated.

9-23
IRON, STEEL & SCRAP AND SLAG
ExportsIn terms of value, exports of iron and steel (total)
increased slightly by 2.54% in the year 2018-19 to1,02,276 crore from 99,738 crore in the previous
year. Iron and Steel exports in 2018-19 comprisedmainly of Other Finished Steel, NES with 35,153crore (34%), Finished Steel Including Cold RolledSheet with 32,612 crore (32%) and Semi-finishedSteel (including Steel Ingots) with 29,365 crore(29%). Other items together accounted for theremaining 5% exports. In terms of value, exports ofiron and steel in the year 2018-19 were mainly toUSA (13%), Nepal (9%), Italy (7%), UAE (6%),Belgium (5%) and Germany (4%) (Tables- 14 to 24).
In terms of quantity, the exports of Pig andCast I ron including Spiegele isen decreaseddrastically by 38% to 347 thousand tonnes in2018-19 from 558 thousand tonnes in the previousyear. Exports were mainly to Bangladesh (40%),Thailand (28%) followed by Japan & Malaysia (5%each) and UAE (4%) (Table-25).
In terms of quantity, the exports of slag (dross,etc.) in 2018-19 sharply decreased by 47% to about149 thousand tonnes from 279 thousand tonnes inthe previous year. Exports were mainly to Japan(40%), Nepal (29%), Philippines (26%) and Bhutan
(3%) (Table-26).
Imports
In terms of value, imports of iron and steel (total)in 2018-19 increased by 32% to 1,14,788 crore from
86,887 crore in the previous year. Iron and steelimports in 2018-19 comprised mainly of Finished SteelIncluding Cold Rolled Sheet with 37,720 crore(33%), Scrap with 25,669 crore (22%), Other FinishedSteel, NES with 22,680 crore (20%) and Semi-finished Steel including Ingots with 20,546 crore(18%). Other items together accounted for theremaining 7% imports. In terms of value, the importsin 2018-19 were mainly from China & Republic ofKorea (18% each), Japan (10%), UAE (6%), USA (5%),Germany (4%) and Singapore, UK & Vietnam (3%each) (Tables- 27 to 37) .
In terms of quantity, the imports of Pig andCast Iron (including Spiegeleisen) increased by14% to 73 thousand tonnes in 2018-19 from 64thousand tonnes in the previous year. Importswere mainly from China (21%), Germany (15%),
Russia (12%), South Africa (11%),Thialand (6%)and France (5%) (Table-38).
In terms of quantity, the imports of slagdecreased by 20% to 136 thousand tonnes in 2018-19 from 171 thousand tonnes in the previous year.Imports were mainly from Japan (62%), Rep. of Korea(36%) and Hong Kong (2%) (Table-39).
Table – 15 : Exports of Iron & Steel (FinishedSteel Including CR Sheet)
(By Countries)
2017-18 (R) 2018-19 (P)Country
Qty Value Qty Value(t) ( ’000) (t) ( ’000)
All Countries 5940761 340298284 4523368 326116006
Nepal 966786 28057407 1140049 40181240
USA 456555 39750216 252491 36841362
Belgium 404796 27069221 358288 27109255
UAE 326346 18272648 226195 17545822
Italy 254501 16868254 192468 16497767
Indonesia 450174 21505513 206856 12917541
Spain 169102 12112259 121853 10747343
Canada 92316 7677768 85459 8403654
UK 90993 6186774 90467 7060719
Chile 8325 594177 97823 6958411
Other countries 2720867 162204047 1751418 141852893
Figures rounded off
Table – 14 : Exports of Iron & Steel (Total)(By Countries)
2017-18 (R) 2018-19 (P)
Qty Value Qty Value
(**) ( ’000) (**) ( ’000)
All Countries ** 997377251 ** 1022758509
USA * * 120532620 * * 130668959
Nepal ** 61911447 ** 87745087
Italy * * 70762885 * * 69623930
UAE * * 59377823 * * 66396628
Belgium ** 56327058 * * 49166143
Germany * * 33467588 * * 40943191
Vietnam * * 37627796 * * 35576543
UK * * 25226261 * * 28703189
Spain * * 32325604 * * 28472860
Netherlands ** 19212796 * * 23252187
Other countries* * 480605372 * * 462209792
Figures rounded off

9-24
IRON, STEEL & SCRAP AND SLAG
Table – 16 : Exports of Iron & Steel(Steel wire)
(By Countries)
2017-18 (R) 2018-19 (P)Country
Qty Value Qty Value(t) ( ’000) (t) ( ’000)
All Countries 174735 21901011 152597 25449317
USA 25747 4336867 22596 4916455
Netherlands 21959 3313493 21733 3600484
Russia 4647 806136 6676 1412720
Turkey 7701 1198853 7572 1338156
Germany 3512 700136 3862 845151
UK 3550 566326 5121 838182
Korea, Rep. of 3420 655943 3384 753264
Ita ly 4375 736582 3656 751320
UAE 8688 671672 7461 700503
Brazil 3708 565261 3390 669483
Other countries 87429 8349741 67145 9623599
Figure rounded off
Table – 18 : Exports of Iron & Steel(Semi-finished Steel Including Steel Ingot)
(By Countries)
2017-18 (R) 2018-19 (P)Country
Qty Value Qty Value(t) ( ’000) (t) ( ’000)
All Countries 8115641 317011255 5979824 293653659
Italy 1080836 41557309 938912 41453916
Nepal 824458 27855205 930030 37486919
Vietnam 1036353 33896649 837121 31718647
UAE 590788 20610816 580408 24834089
Belgium 619034 24859559 341092 17196766
Spain 433887 16396971 258724 12599921
Malaysia 402643 13958658 229764 10082489
Germany 37122 5856542 48783 9108323
Saudi Arabia 217545 8306285 190521 8948591
Turkey 173060 7612421 102130 7248211
Other countries 2699915 116100838 1522341 92975787
Figures rounded off
Table – 17 : Exports of Iron & Steel(Other Finished Steel, NES)
(By Countries)
2017-18 (R) 2018-19 (P)Country
Qty Value Qty Value(**) ( ’000) (**) ( ’000)
All Countries ** 296503963 ** 351532808
USA * * 66364629 * * 81202450
Germany * * 22050914 * * 25609517
UAE * * 19443351 * * 22924458
UK * * 15545948 * * 18575853
Netherlands * * 8363013 * * 10166011
Canada * * 6289121 * * 9077816
Italy * * 8413491 * * 8873095
Nepal * * 3949893 * * 7223303
Saudi Arabia * * 7228406 * * 7196841
France * * 6532053 * * 6964907
Other countries * * 132323144 * * 153718557Figure rounded off

9-25
IRON, STEEL & SCRAP AND SLAG
Table – 19 : Exports of Iron & Steel : Alloy Steel(Granules)
(By Countries)
2017-18 (R) 2018-19 (P)Country
Qty Value Qty Value(t) ( ’000) (t ) ( ’000)
All Countries 183 18118 312 21811
USA 65 10891 61 12785
Saudi Arabia 8 619 44 2151
Bangladesh 17 892 26 1691
Nigeria - - 28 1595
Kuwait - - 20 1073
Nepal 12 641 116 939
China - - 3 509
Sri Lanka - - 3 357
UAE 19 1216 2 233
Jordan 6 287 5 216
Other countries 56 3572 4 264
Figures rounded off
Table – 20 : Exports of Iron & Steel: Alloy Steel
(Powder)
(By Countries)
2017-18 (R) 2018-19 (P)Country
Qty Value Qty Value(t) ( ’000) (t ) ( ’000)
All Countries 19 3711 128 36775
UK - - 34 25356
China ++ 18 92 9629
Brazil - - 1 811
Turkey 1 617 1 751
Indonesia - - ++ 123
Singapore ++ 109 ++ 99
Thailand - - ++ 6
Korea, Rep. of 10 1379 - -
Bangladesh 2 765 - -
Nepal 5 759 - -
Other countries 1 64 ++ ++
Figures rounded off
Table – 21 : Exports of Iron & Steel (Scrap)
(By Countries)
2017-18 (R) 2018-19 (P)Country
Qty Value Qty Value(t) ( ’000) (t ) ( ’000)
All Countries 6813 567051 8490 648537
Sweden 2102 287086 2069 329860
Bhutan 82 4635 1326 38828
Germany 251 62426 253 36405
Belgium 76 53745 92 30207
Brazil 109 9016 276 24444
Thailand ++ 51 474 24342
USA 198 13219 327 21635
Singapore 914 28838 656 14377
Ukraine 346 12231 209 13621
France 18 4797 44 13523
Other countries 2718 91008 2763 101295
Figures rounded off
Table–22 : Exports of Iron & Steel
(Sponge iron)
(By Countries)
2017-18 (R) 2018-19 (P)Country
Qty Value Qty Value(t) ( ’000) (t) ( ’000)
All Countries 588622 11054668 686152 15725353
Bangladesh 278707 5606866 406970 9541147
Nepal 83068 1516092 110678 2339719
Bhutan 84887 1518248 107588 2305903
Malaysia 30119 508311 40181 936732
Kenya 1399 25682 7437 177751
Madagascar 2581 53457 3943 94038
USA 437 68631 755 94015
Sudan 1377 25159 2545 59177
Indonesia 21976 360146 1414 41650
Sri Lanka 552 10638 1543 35496
Other countries 83519 1361438 3097 99725
Figures rounded off
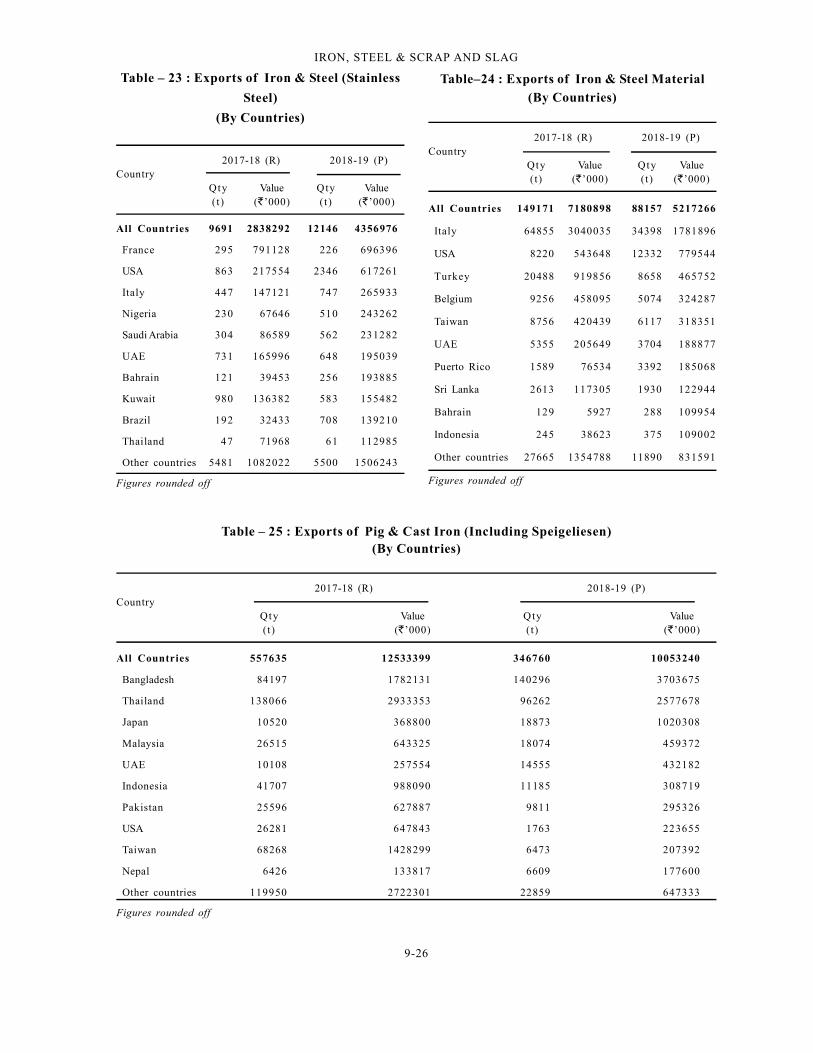
9-26
IRON, STEEL & SCRAP AND SLAG
Table–24 : Exports of Iron & Steel Material
(By Countries)
2017-18 (R) 2018-19 (P)Country
Qty Value Qty Value(t) ( ’000) (t) ( ’000)
All Countries 149171 7180898 88157 5217266
Italy 64855 3040035 34398 1781896
USA 8220 543648 12332 779544
Turkey 20488 919856 8658 465752
Belgium 9256 458095 5074 324287
Taiwan 8756 420439 6117 318351
UAE 5355 205649 3704 188877
Puerto Rico 1589 76534 3392 185068
Sri Lanka 2613 117305 1930 122944
Bahrain 129 5927 288 109954
Indonesia 245 38623 375 109002
Other countries 27665 1354788 11890 831591
Figures rounded off
Table – 23 : Exports of Iron & Steel (Stainless
Steel)
(By Countries)
2017-18 (R) 2018-19 (P)Country
Qty Value Qty Value(t) ( ’000) (t ) ( ’000)
All Countries 9691 2838292 12146 4356976
France 295 791128 226 696396
USA 863 217554 2346 617261
Italy 447 147121 747 265933
Nigeria 230 67646 510 243262
Saudi Arabia 304 86589 562 231282
UAE 731 165996 648 195039
Bahrain 121 39453 256 193885
Kuwait 980 136382 583 155482
Brazil 192 32433 708 139210
Thailand 47 71968 61 112985
Other countries 5481 1082022 5500 1506243
Figures rounded off
Table – 25 : Exports of Pig & Cast Iron (Including Speigeliesen)(By Countries)
2017-18 (R) 2018-19 (P)Country
Qty Value Qty Value(t) ( ’000) (t) ( ’000)
All Countries 557635 12533399 346760 10053240
Bangladesh 84197 1782131 140296 3703675
Thailand 138066 2933353 96262 2577678
Japan 10520 368800 18873 1020308
Malaysia 26515 643325 18074 459372
UAE 10108 257554 14555 432182
Indonesia 41707 988090 11185 308719
Pakistan 25596 627887 9811 295326
USA 26281 647843 1763 223655
Taiwan 68268 1428299 6473 207392
Nepal 6426 133817 6609 177600
Other countries 119950 2722301 22859 647333
Figures rounded off
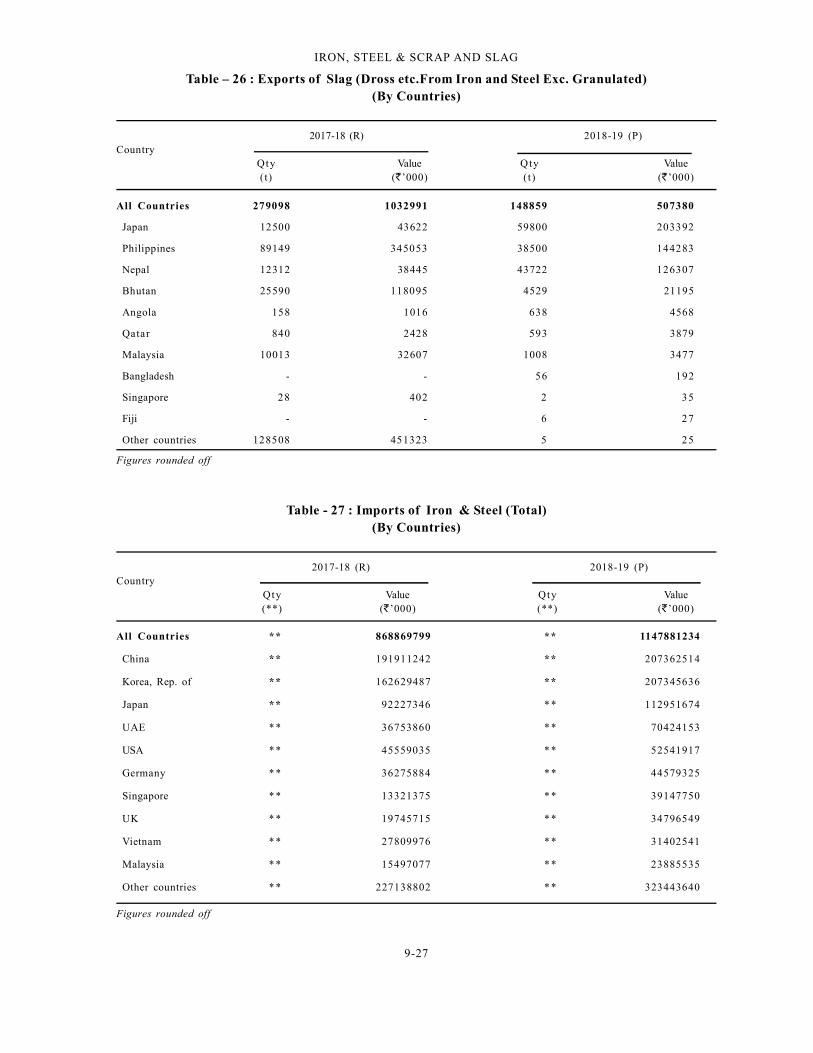
9-27
IRON, STEEL & SCRAP AND SLAG
Table – 26 : Exports of Slag (Dross etc.From Iron and Steel Exc. Granulated)(By Countries)
2017-18 (R) 2018-19 (P)Country
Qty Value Qty Value(t) ( ’000) (t) ( ’000)
All Countries 279098 1032991 148859 507380
Japan 12500 43622 59800 203392
Philippines 89149 345053 38500 144283
Nepal 12312 38445 43722 126307
Bhutan 25590 118095 4529 21195
Angola 158 1016 638 4568
Qatar 840 2428 593 3879
Malaysia 10013 32607 1008 3477
Bangladesh - - 56 192
Singapore 28 402 2 35
Fiji - - 6 27
Other countries 128508 451323 5 25
Figures rounded off
Table - 27 : Imports of Iron & Steel (Total)(By Countries)
2017-18 (R) 2018-19 (P)Country
Qty Value Qty Value(**) ( ’000) (**) ( ’000)
All Countries ** 868869799 ** 1147881234
China ** 191911242 ** 207362514
Korea, Rep. of ** 162629487 ** 207345636
Japan ** 92227346 * * 112951674
UAE * * 36753860 * * 70424153
USA ** 45559035 * * 52541917
Germany * * 36275884 * * 44579325
Singapore * * 13321375 * * 39147750
UK * * 19745715 * * 34796549
Vietnam * * 27809976 * * 31402541
Malaysia * * 15497077 * * 23885535
Other countries * * 227138802 * * 323443640
Figures rounded off
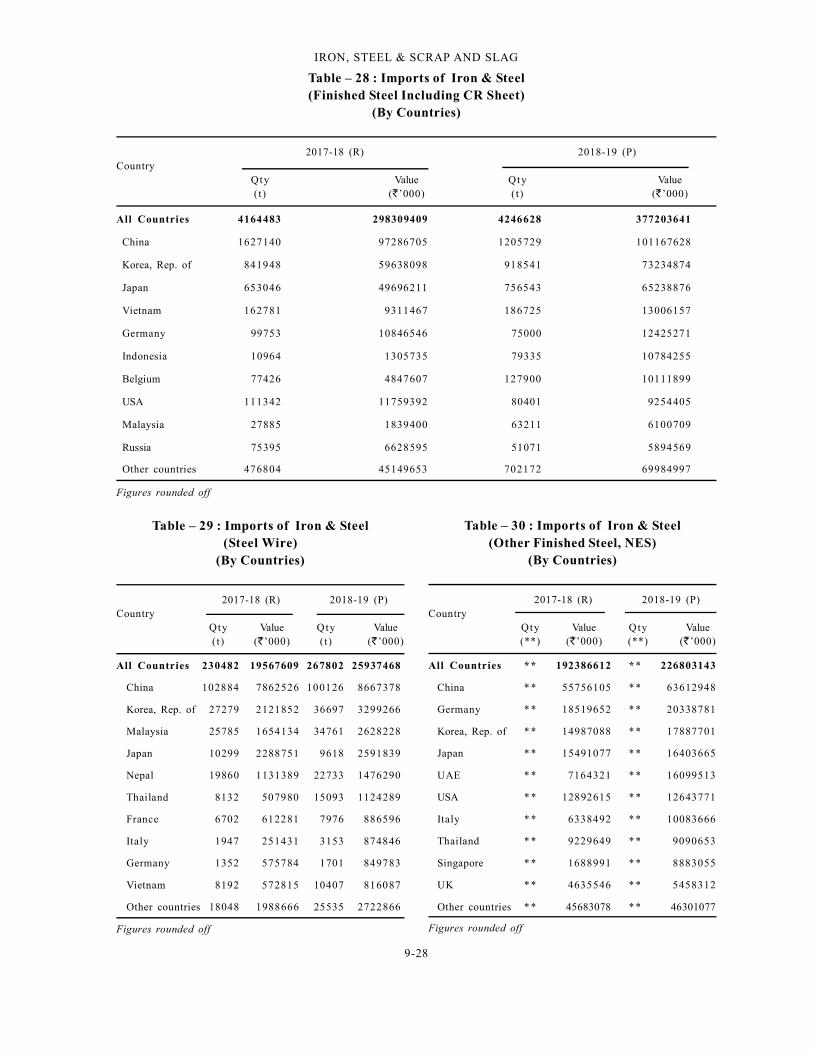
9-28
IRON, STEEL & SCRAP AND SLAG
Table – 28 : Imports of Iron & Steel(Finished Steel Including CR Sheet)
(By Countries)
2017-18 (R) 2018-19 (P)Country
Qty Value Qty Value(t) ( ’000) (t) ( ’000)
All Countries 4164483 298309409 4246628 377203641
China 1627140 97286705 1205729 101167628
Korea, Rep. of 841948 59638098 918541 73234874
Japan 653046 49696211 756543 65238876
Vietnam 162781 9311467 186725 13006157
Germany 99753 10846546 75000 12425271
Indonesia 10964 1305735 79335 10784255
Belgium 77426 4847607 127900 10111899
USA 111342 11759392 80401 9254405
Malaysia 27885 1839400 63211 6100709
Russia 75395 6628595 51071 5894569
Other countries 476804 45149653 702172 69984997
Figures rounded off
Table – 29 : Imports of Iron & Steel(Steel Wire)
(By Countries)
2017-18 (R) 2018-19 (P)Country
Qty Value Qty Value(t) ( ’000) (t) ( ’000)
All Countries 230482 19567609 267802 25937468
China 102884 7862526 100126 8667378
Korea, Rep. of 27279 2121852 36697 3299266
Malaysia 25785 1654134 34761 2628228
Japan 10299 2288751 9618 2591839
Nepal 19860 1131389 22733 1476290
Thailand 8132 507980 15093 1124289
France 6702 612281 7976 886596
Italy 1947 251431 3153 874846
Germany 1352 575784 1701 849783
Vietnam 8192 572815 10407 816087
Other countries 18048 1988666 25535 2722866
Figures rounded off
Table – 30 : Imports of Iron & Steel(Other Finished Steel, NES)
(By Countries)
2017-18 (R) 2018-19 (P)Country
Qty Value Qty Value(**) ( ’000) (**) ( ’000)
All Countries ** 192386612 * * 226803143
China * * 55756105 * * 63612948
Germany * * 18519652 * * 20338781
Korea, Rep. of * * 14987088 * * 17887701
Japan * * 15491077 * * 16403665
UAE * * 7164321 * * 16099513
USA * * 12892615 * * 12643771
Italy * * 6338492 * * 10083666
Thailand * * 9229649 * * 9090653
Singapore * * 1688991 * * 8883055
UK * * 4635546 * * 5458312
Other countries * * 45683078 * * 46301077
Figures rounded off
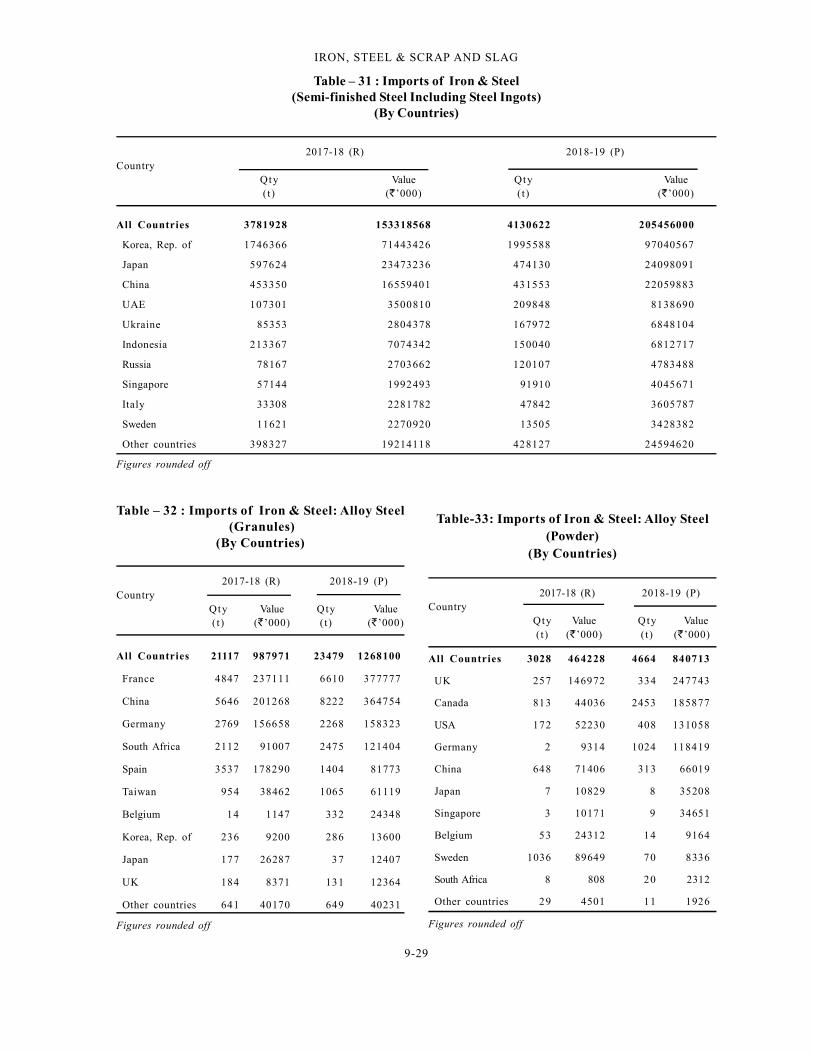
9-29
IRON, STEEL & SCRAP AND SLAG
Table – 31 : Imports of Iron & Steel(Semi-finished Steel Including Steel Ingots)
(By Countries)
2017-18 (R) 2018-19 (P)Country
Qty Value Qty Value(t) ( ’000) (t) ( ’000)
All Countries 3781928 153318568 4130622 205456000
Korea, Rep. of 1746366 71443426 1995588 97040567
Japan 597624 23473236 474130 24098091
China 453350 16559401 431553 22059883
UAE 107301 3500810 209848 8138690
Ukraine 85353 2804378 167972 6848104
Indonesia 213367 7074342 150040 6812717
Russia 78167 2703662 120107 4783488
Singapore 57144 1992493 91910 4045671
Italy 33308 2281782 47842 3605787
Sweden 11621 2270920 13505 3428382
Other countries 398327 19214118 428127 24594620
Figures rounded off
Table – 32 : Imports of Iron & Steel: Alloy Steel (Granules)
(By Countries)
2017-18 (R) 2018-19 (P)Country
Qty Value Qty Value(t) ( ’000) (t) ( ’000)
All Countries 21117 987971 23479 1268100
France 4847 237111 6610 377777
China 5646 201268 8222 364754
Germany 2769 156658 2268 158323
South Africa 2112 91007 2475 121404
Spain 3537 178290 1404 81773
Taiwan 954 38462 1065 61119
Belgium 14 1147 332 24348
Korea, Rep. of 236 9200 286 13600
Japan 177 26287 37 12407
UK 184 8371 131 12364
Other countries 641 40170 649 40231
Figures rounded off
Table-33: Imports of Iron & Steel: Alloy Steel(Powder)
(By Countries)
2017-18 (R) 2018-19 (P)Country
Qty Value Qty Value(t) ( ’000) (t) ( ’000)
All Countries 3028 464228 4664 840713
UK 257 146972 334 247743
Canada 813 44036 2453 185877
USA 172 52230 408 131058
Germany 2 9314 1024 118419
China 648 71406 313 66019
Japan 7 10829 8 35208
Singapore 3 10171 9 34651
Belgium 53 24312 14 9164
Sweden 1036 89649 70 8336
South Africa 8 808 20 2312
Other countries 29 4501 11 1926
Figures rounded off
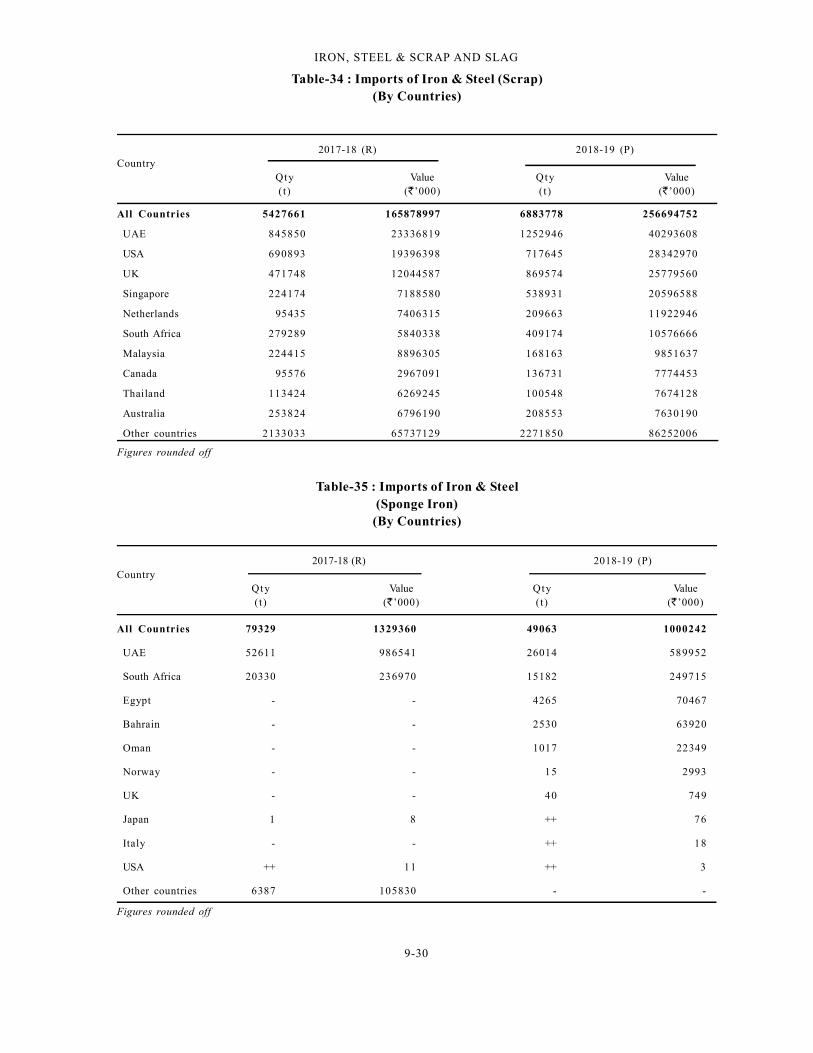
9-30
IRON, STEEL & SCRAP AND SLAG
Table-34 : Imports of Iron & Steel (Scrap)(By Countries)
2017-18 (R) 2018-19 (P)Country
Qty Value Qty Value(t) ( ’000) (t ) ( ’000)
All Countries 5427661 165878997 6883778 256694752
UAE 845850 23336819 1252946 40293608
USA 690893 19396398 717645 28342970
UK 471748 12044587 869574 25779560
Singapore 224174 7188580 538931 20596588
Netherlands 95435 7406315 209663 11922946
South Africa 279289 5840338 409174 10576666
Malaysia 224415 8896305 168163 9851637
Canada 95576 2967091 136731 7774453
Thailand 113424 6269245 100548 7674128
Australia 253824 6796190 208553 7630190
Other countries 2133033 65737129 2271850 86252006
Figures rounded off
Table-35 : Imports of Iron & Steel(Sponge Iron)
(By Countries)
2017-18 (R) 2018-19 (P)Country
Qty Value Qty Value(t) ( ’000) (t) ( ’000)
All Countries 79329 1329360 49063 1000242
UAE 52611 986541 26014 589952
South Africa 20330 236970 15182 249715
Egypt - - 4265 70467
Bahrain - - 2530 63920
Oman - - 1017 22349
Norway - - 15 2993
UK - - 40 749
Japan 1 8 ++ 76
Italy - - ++ 18
USA ++ 11 ++ 3
Other countries 6387 105830 - -
Figures rounded off

9-31
IRON, STEEL & SCRAP AND SLAG
Table–37: Imports of Iron & Steel Material
(By Countries)
2017-18 (R) 2018-19 (P)Country
Qty Value Qty Value(t) ( ’000) (t) ( ’000)
All Countries 583091 25375960 639656 37058227
Korea, Rep. of 199270 8527955 194437 9877500
Taiwan 217388 7720934 190374 8019105
Vietnam 17303 1124654 95959 5854324
China 92500 4560500 58370 4498865
Germany 32691 1587043 44374 2745681
Japan 2069 144178 7732 1774646
France 7290 546498 10760 942112
Belgium 964 50784 10504 842802
Singapore 2688 156086 4644 331644
Russia 1564 76745 5023 314344
Other countries 9364 880583 17479 1857204
Figures rounded off
Table-38 : Imports of Pig & Cast Iron(Incl. Speigeliesen)
(By Countries)
2017-18 (R) 2018-19 (P)Country
Qty Value Qty Value(t) ( ’000) (t) ( ’000)
All Countries 64223 4325786 73261 5175320
Germany 1860 482600 10684 1105065
China 10392 592948 15174 912906
Russia 6525 245238 8778 350554
South Africa 6766 212344 8270 304050
Thailand 3910 189286 4666 277111
Italy 1298 135244 1851 271733
Japan 513 306659 464 253533
France 2064 137914 3497 244903
UK 963 341690 361 230008
USA 1028 161398 1557 226963
Other countries 28904 1520465 17959 998494
Figures rounded off
Table – 36 : Imports of Iron & Steel(Stainless Steel)(By Countries)
2017-18 (R) 2018-19 (P)Country
Qty Value Qty Value(t) ( ’000) (t ) ( ’000)
All Countries 79479 11251090 97278 15618954
China 42213 6034277 44604 6749947
Vietnam 17837 2789663 17408 3118710
Japan 1365 239873 3292 1301460
Brazil 1 587 12304 1240318
Italy 5657 808453 4395 712725
USA 1677 207455 1857 326709
UAE 347 33819 2558 326014
Korea, Rep. of 6573 481903 2011 319796
Singapore 64 9388 1548 267649
Germany 144 28896 572 205074
Other countries 3601 616776 6729 1050552
Figures rounded off
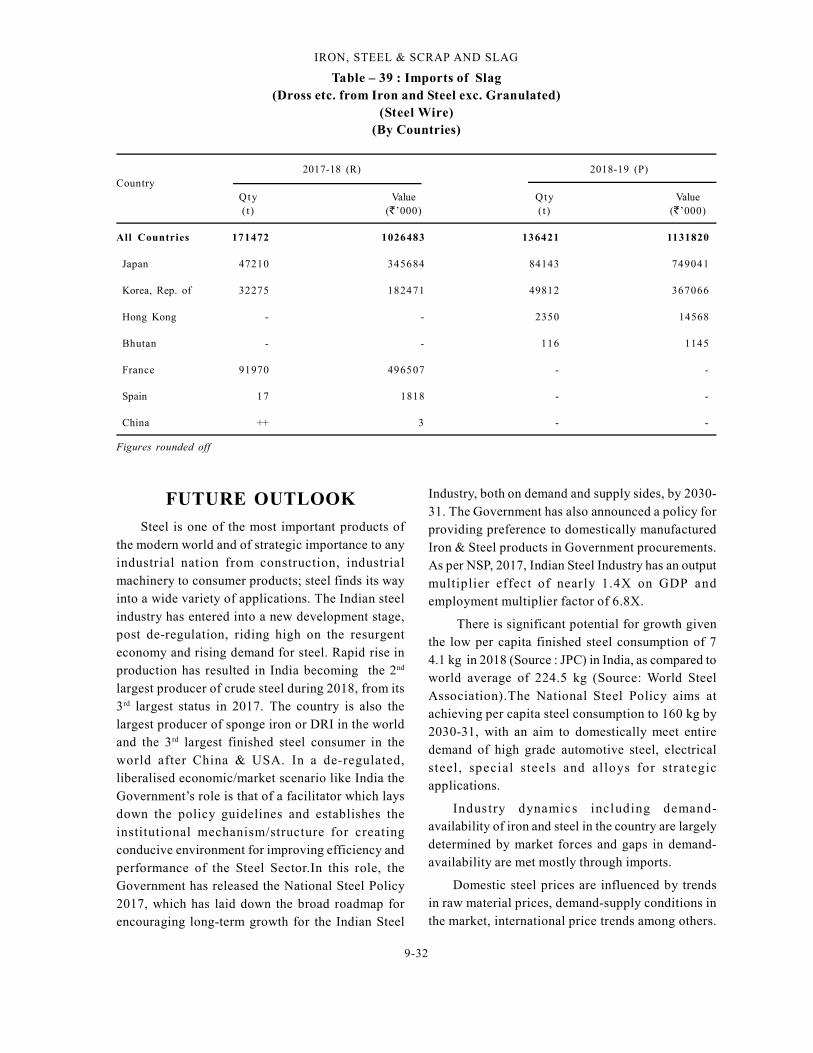
9-32
IRON, STEEL & SCRAP AND SLAG
Table – 39 : Imports of Slag(Dross etc. from Iron and Steel exc. Granulated)
(Steel Wire)(By Countries)
2017-18 (R) 2018-19 (P)Country
Qty Value Qty Value(t) ( ’000) (t) ( ’000)
All Countries 171472 1026483 136421 1131820
Japan 47210 345684 84143 749041
Korea, Rep. of 32275 182471 49812 367066
Hong Kong - - 2350 14568
Bhutan - - 116 1145
France 91970 496507 - -
Spain 17 1818 - -
China ++ 3 - -
Figures rounded off
FUTURE OUTLOOK
Steel is one of the most important products ofthe modern world and of strategic importance to anyindustrial nation from construction, industrialmachinery to consumer products; steel finds its wayinto a wide variety of applications. The Indian steelindustry has entered into a new development stage,post de-regulation, riding high on the resurgenteconomy and rising demand for steel. Rapid rise inproduction has resulted in India becoming the 2nd
largest producer of crude steel during 2018, from its3rd largest status in 2017. The country is also thelargest producer of sponge iron or DRI in the worldand the 3rd largest finished steel consumer in theworld after China & USA. In a de-regulated,liberalised economic/market scenario like India theGovernment’s role is that of a facilitator which laysdown the policy guidelines and establishes theinstitutional mechanism/structure for creatingconducive environment for improving efficiency andperformance of the Steel Sector.In this role, theGovernment has released the National Steel Policy2017, which has laid down the broad roadmap forencouraging long-term growth for the Indian Steel
Industry, both on demand and supply sides, by 2030-31. The Government has also announced a policy forproviding preference to domestically manufacturedIron & Steel products in Government procurements.As per NSP, 2017, Indian Steel Industry has an outputmultiplier effect of nearly 1.4X on GDP andemployment multiplier factor of 6.8X.
There is significant potential for growth giventhe low per capita finished steel consumption of 74.1 kg in 2018 (Source : JPC) in India, as compared toworld average of 224.5 kg (Source: World SteelAssociation).The National Steel Policy aims atachieving per capita steel consumption to 160 kg by2030-31, with an aim to domestically meet entiredemand of high grade automotive steel, electricalsteel , special steels and al loys for strategicapplications.
Industry dynamics including demand-availability of iron and steel in the country are largelydetermined by market forces and gaps in demand-availability are met mostly through imports.
Domestic steel prices are influenced by trendsin raw material prices, demand-supply conditions inthe market, international price trends among others.
9-33
IRON, STEEL & SCRAP AND SLAG
\
As a facilitator, the Government monitors the steel
market conditions and adopts fiscal and other policy
measures based on its assessment. Currently, GST
of 18% is applicable on steel and there is no export
duty on steel items. A Steel Price Monitoring
Committee has been constituted by the Government
with the aim to monitor price rationalisation, analyse
price fluctuations and advise all concerned regarding
any irrational price behaviour of steel commodity.
To avoid any distortion in prices in view of ad-hoc
and rising imports, the Government had taken several
steps including raising import duty and imposed a
gamut of measures including anti-dumping and
safeguard duties on a host of applicable iron and
steel items. In a further move to curb steel imports,
Government of India banned the production and sale
of steel products that does not meet Bureau of Indian
Standard (BIS) approval and to check the sale of
defective and sub-standard stainless steel products
used for making utensils and various kitchen
appliances, it issued the Stainless Steel (Quality
Control) Order, 2016 for products used in making
utensils and kitchen appliances, that will help filter
imports of the metal.Further, while the main focus of the industry is
on the domestic market, being in close vicinity of thedeveloped west and developing east, provides it astrategic location that augurs well for the industryseeking opportunities for exports of finished goodsand imports of some scarcely available raw materials.
As per NSP, 2017, it is expected that at thecurrent rate of GDP growth, i.e. 7.5% (Average GDPgrowth rate of India was 7.5% during 2010 – 2015;World Bank), the steel demand would grow threefoldin the next 15 years to reach a demand of 230 milliontonnes by 2030-31. Demand for pig iron for merchantuse, such as, for castings and supplementary metallicin the electric arc or induction furnaces, is projectedto increase to 17 million tonnes by 2030-31. Similarly,demand for sponge iron is projected to increase to80 million tonnes by 2030-31. It is projected that thesponge iron capacity may increase to 114 milliontonnes by 2030-31 with around 30% share of gas-based capacities under increased environmentalconsiderations and long-term availability of gas.