Transient Kinetics of Slag Metal Reactions
10
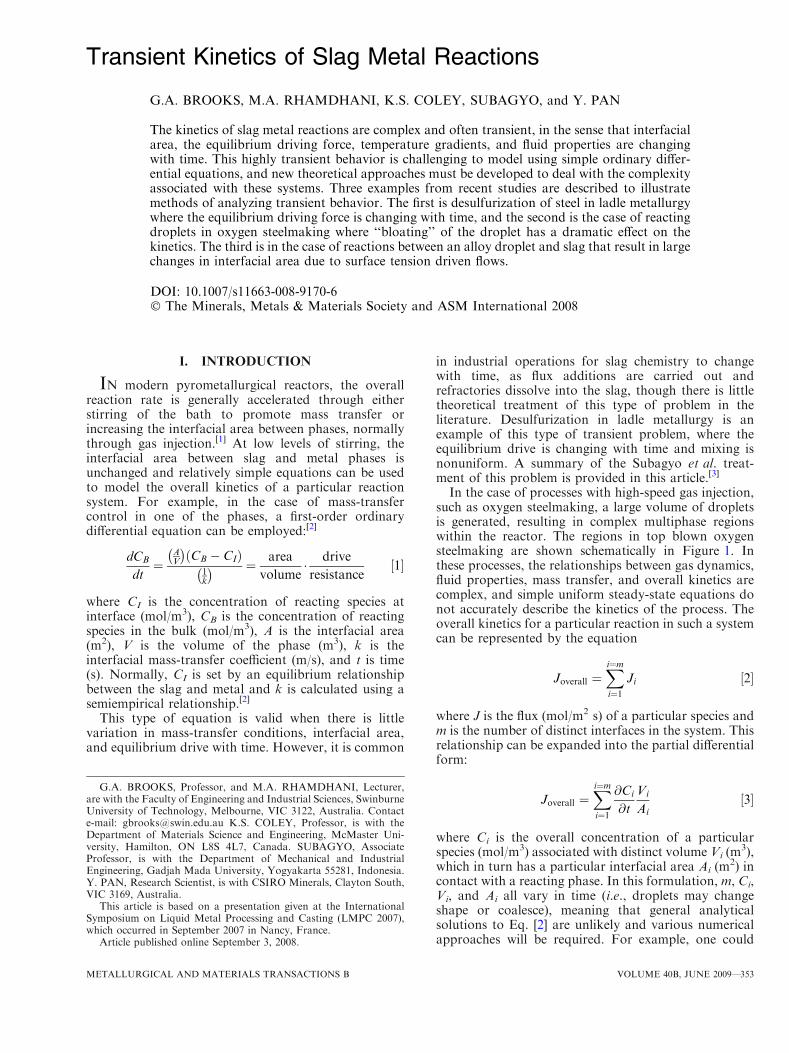
Transient Kinetics of Slag Metal Reactions G.A. BROOKS, M.A. RHAMDHANI, K.S. COLEY, SUBAGYO, and Y. PAN The kinetics of slag metal reactions are complex and often transient, in the sense that interfacial area, the equilibrium driving force, temperature gradients, and fluid properties are changing with time. This highly transient behavior is challenging to model using simple ordinary differ- ential equations, and new theoretical approaches must be developed to deal with the complexity associated with these systems. Three examples from recent studies are described to illustrate methods of analyzing transient behavior. The first is desulfurization of steel in ladle metallurgy where the equilibrium driving force is changing with time, and the second is the case of reacting droplets in oxygen steelmaking where ‘‘bloating’’ of the droplet has a dramatic effect on the kinetics. The third is in the case of reactions between an alloy droplet and slag that result in large changes in interfacial area due to surface tension driven flows. DOI: 10.1007/s11663-008-9170-6 ȑ The Minerals, Metals & Materials Society and ASM International 2008 I. INTRODUCTION IN modern pyrometallurgical reactors, the overall reaction rate is generally accelerated through either stirring of the bath to promote mass transfer or increasing the interfacial area between phases, normally through gas injection. [1] At low levels of stirring, the interfacial area between slag and metal phases is unchanged and relatively simple equations can be used to model the overall kinetics of a particular reaction system. For example, in the case of mass-transfer control in one of the phases, a first-order ordinary differential equation can be employed: [2] dC B dt ¼ A V C B C I ð Þ 1 k ¼ area volume drive resistance ½1 where C I is the concentration of reacting species at interface (mol/m 3 ), C B is the concentration of reacting species in the bulk (mol/m 3 ), A is the interfacial area (m 2 ), V is the volume of the phase (m 3 ), k is the interfacial mass-transfer coefficient (m/s), and t is time (s). Normally, C I is set by an equilibrium relationship between the slag and metal and k is calculated using a semiempirical relationship. [2] This type of equation is valid when there is little variation in mass-transfer conditions, interfacial area, and equilibrium drive with time. However, it is common in industrial operations for slag chemistry to change with time, as flux additions are carried out and refractories dissolve into the slag, though there is little theoretical treatment of this type of problem in the literature. Desulfurization in ladle metallurgy is an example of this type of transient problem, where the equilibrium drive is changing with time and mixing is nonuniform. A summary of the Subagyo et al. treat- ment of this problem is provided in this article. [3] In the case of processes with high-speed gas injection, such as oxygen steelmaking, a large volume of droplets is generated, resulting in complex multiphase regions within the reactor. The regions in top blown oxygen steelmaking are shown schematically in Figure 1. In these processes, the relationships between gas dynamics, fluid properties, mass transfer, and overall kinetics are complex, and simple uniform steady-state equations do not accurately describe the kinetics of the process. The overall kinetics for a particular reaction in such a system can be represented by the equation J overall ¼ X i¼m i¼1 J i ½2 where J is the flux (mol/m 2 s) of a particular species and m is the number of distinct interfaces in the system. This relationship can be expanded into the partial differential form: J overall ¼ X i¼m i¼1 @ C i @ t V i A i ½3 where C i is the overall concentration of a particular species (mol/m 3 ) associated with distinct volume V i (m 3 ), which in turn has a particular interfacial area A i (m 2 ) in contact with a reacting phase. In this formulation, m, C i , V i , and A i all vary in time (i.e., droplets may change shape or coalesce), meaning that general analytical solutions to Eq. [2] are unlikely and various numerical approaches will be required. For example, one could G.A. BROOKS, Professor, and M.A. RHAMDHANI, Lecturer, are with the Faculty of Engineering and Industrial Sciences, Swinburne University of Technology, Melbourne, VIC 3122, Australia. Contact e-mail: [email protected] K.S. COLEY, Professor, is with the Department of Materials Science and Engineering, McMaster Uni- versity, Hamilton, ON L8S 4L7, Canada. SUBAGYO, Associate Professor, is with the Department of Mechanical and Industrial Engineering, Gadjah Mada University, Yogyakarta 55281, Indonesia. Y. PAN, Research Scientist, is with CSIRO Minerals, Clayton South, VIC 3169, Australia. This article is based on a presentation given at the International Symposium on Liquid Metal Processing and Casting (LMPC 2007), which occurred in September 2007 in Nancy, France. Article published online September 3, 2008. METALLURGICAL AND MATERIALS TRANSACTIONS B VOLUME 40B, JUNE 2009—353
-
Upload
independent -
Category
Documents
-
view
5 -
download
0
Transcript of Transient Kinetics of Slag Metal Reactions
Transient Kinetics of Slag Metal Reactions
G.A. BROOKS, M.A. RHAMDHANI, K.S. COLEY, SUBAGYO, and Y. PAN
The kinetics of slag metal reactions are complex and often transient, in the sense that interfacialarea, the equilibrium driving force, temperature gradients, and fluid properties are changingwith time. This highly transient behavior is challenging to model using simple ordinary differ-ential equations, and new theoretical approaches must be developed to deal with the complexityassociated with these systems. Three examples from recent studies are described to illustratemethods of analyzing transient behavior. The first is desulfurization of steel in ladle metallurgywhere the equilibrium driving force is changing with time, and the second is the case of reactingdroplets in oxygen steelmaking where ‘‘bloating’’ of the droplet has a dramatic effect on thekinetics. The third is in the case of reactions between an alloy droplet and slag that result in largechanges in interfacial area due to surface tension driven flows.
DOI: 10.1007/s11663-008-9170-6� The Minerals, Metals & Materials Society and ASM International 2008
I. INTRODUCTION
IN modern pyrometallurgical reactors, the overallreaction rate is generally accelerated through eitherstirring of the bath to promote mass transfer orincreasing the interfacial area between phases, normallythrough gas injection.[1] At low levels of stirring, theinterfacial area between slag and metal phases isunchanged and relatively simple equations can be usedto model the overall kinetics of a particular reactionsystem. For example, in the case of mass-transfercontrol in one of the phases, a first-order ordinarydifferential equation can be employed:[2]
dCB
dt¼
AV
� �CB � CIð Þ
1k
� � ¼ area
volume� drive
resistance½1�
where CI is the concentration of reacting species atinterface (mol/m3), CB is the concentration of reactingspecies in the bulk (mol/m3), A is the interfacial area(m2), V is the volume of the phase (m3), k is theinterfacial mass-transfer coefficient (m/s), and t is time(s). Normally, CI is set by an equilibrium relationshipbetween the slag and metal and k is calculated using asemiempirical relationship.[2]
This type of equation is valid when there is littlevariation in mass-transfer conditions, interfacial area,and equilibrium drive with time. However, it is common
in industrial operations for slag chemistry to changewith time, as flux additions are carried out andrefractories dissolve into the slag, though there is littletheoretical treatment of this type of problem in theliterature. Desulfurization in ladle metallurgy is anexample of this type of transient problem, where theequilibrium drive is changing with time and mixing isnonuniform. A summary of the Subagyo et al. treat-ment of this problem is provided in this article.[3]
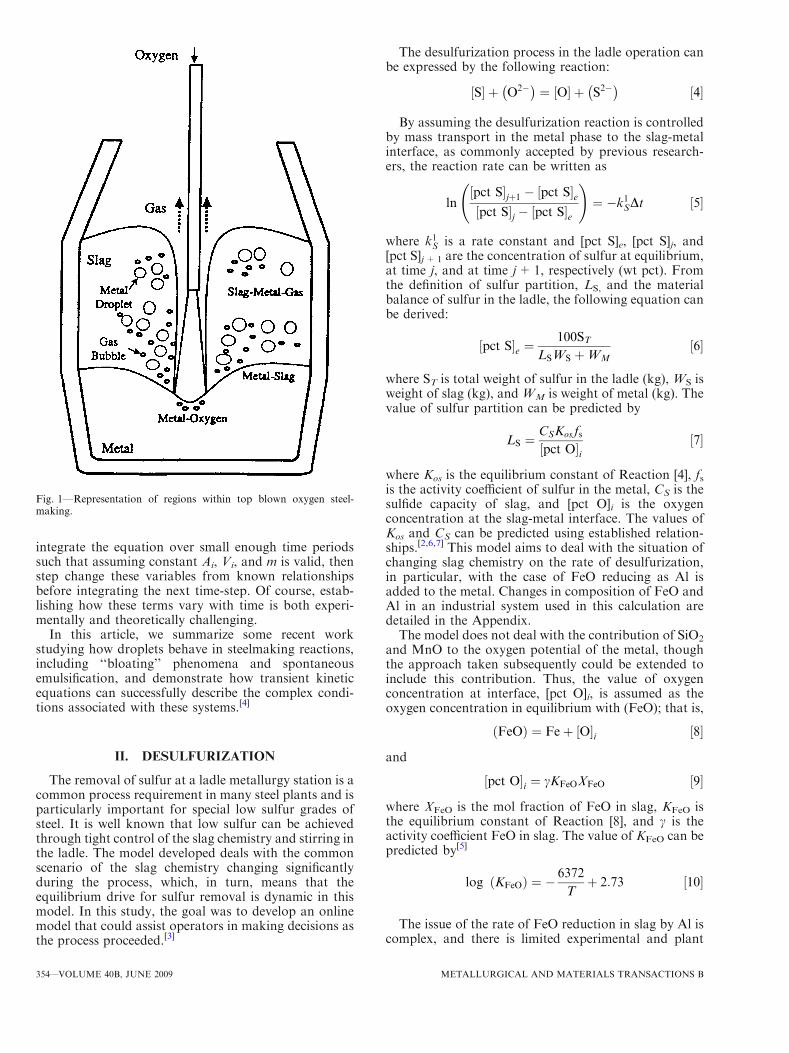
In the case of processes with high-speed gas injection,such as oxygen steelmaking, a large volume of dropletsis generated, resulting in complex multiphase regionswithin the reactor. The regions in top blown oxygensteelmaking are shown schematically in Figure 1. Inthese processes, the relationships between gas dynamics,fluid properties, mass transfer, and overall kinetics arecomplex, and simple uniform steady-state equations donot accurately describe the kinetics of the process. Theoverall kinetics for a particular reaction in such a systemcan be represented by the equation
Joverall ¼Xi¼m
i¼1Ji ½2�
where J is the flux (mol/m2 s) of a particular species andm is the number of distinct interfaces in the system. Thisrelationship can be expanded into the partial differentialform:
Joverall ¼Xi¼m
i¼1
@Ci
@t
Vi
Ai½3�
where Ci is the overall concentration of a particularspecies (mol/m3) associated with distinct volume Vi (m
3),which in turn has a particular interfacial area Ai (m
2) incontact with a reacting phase. In this formulation, m, Ci,Vi, and Ai all vary in time (i.e., droplets may changeshape or coalesce), meaning that general analyticalsolutions to Eq. [2] are unlikely and various numericalapproaches will be required. For example, one could
G.A. BROOKS, Professor, and M.A. RHAMDHANI, Lecturer,are with the Faculty of Engineering and Industrial Sciences, SwinburneUniversity of Technology, Melbourne, VIC 3122, Australia. Contacte-mail: [email protected] K.S. COLEY, Professor, is with theDepartment of Materials Science and Engineering, McMaster Uni-versity, Hamilton, ON L8S 4L7, Canada. SUBAGYO, AssociateProfessor, is with the Department of Mechanical and IndustrialEngineering, Gadjah Mada University, Yogyakarta 55281, Indonesia.Y. PAN, Research Scientist, is with CSIRO Minerals, Clayton South,VIC 3169, Australia.
This article is based on a presentation given at the InternationalSymposium on Liquid Metal Processing and Casting (LMPC 2007),which occurred in September 2007 in Nancy, France.
Article published online September 3, 2008.
METALLURGICAL AND MATERIALS TRANSACTIONS B VOLUME 40B, JUNE 2009—353
integrate the equation over small enough time periodssuch that assuming constant Ai, Vi, and m is valid, thenstep change these variables from known relationshipsbefore integrating the next time-step. Of course, estab-lishing how these terms vary with time is both experi-mentally and theoretically challenging.
In this article, we summarize some recent workstudying how droplets behave in steelmaking reactions,including ‘‘bloating’’ phenomena and spontaneousemulsification, and demonstrate how transient kineticequations can successfully describe the complex condi-tions associated with these systems.[4]
II. DESULFURIZATION
The removal of sulfur at a ladle metallurgy station is acommon process requirement in many steel plants and isparticularly important for special low sulfur grades ofsteel. It is well known that low sulfur can be achievedthrough tight control of the slag chemistry and stirring inthe ladle. The model developed deals with the commonscenario of the slag chemistry changing significantlyduring the process, which, in turn, means that theequilibrium drive for sulfur removal is dynamic in thismodel. In this study, the goal was to develop an onlinemodel that could assist operators in making decisions asthe process proceeded.[3]
The desulfurization process in the ladle operation canbe expressed by the following reaction:
S½ � þ O2�� �¼ O½ � þ S2�
� �½4�
By assuming the desulfurization reaction is controlledby mass transport in the metal phase to the slag-metalinterface, as commonly accepted by previous research-ers, the reaction rate can be written as
ln½pct S�jþ1 � ½pct S�e½pct S�j � ½pct S�e
!
¼ �k1SDt ½5�
where k1S is a rate constant and [pct S]e, [pct S]j, and[pct S]j+1 are the concentration of sulfur at equilibrium,at time j, and at time j+1, respectively (wt pct). Fromthe definition of sulfur partition, LS, and the materialbalance of sulfur in the ladle, the following equation canbe derived:
½pct S�e ¼100ST
LSWS þWM½6�
where ST is total weight of sulfur in the ladle (kg), WS isweight of slag (kg), and WM is weight of metal (kg). Thevalue of sulfur partition can be predicted by
LS ¼CSKos fs½pct O�i
½7�
where Kos is the equilibrium constant of Reaction [4], fsis the activity coefficient of sulfur in the metal, CS is thesulfide capacity of slag, and [pct O]i is the oxygenconcentration at the slag-metal interface. The values ofKos and CS can be predicted using established relation-ships.[2,6,7] This model aims to deal with the situation ofchanging slag chemistry on the rate of desulfurization,in particular, with the case of FeO reducing as Al isadded to the metal. Changes in composition of FeO andAl in an industrial system used in this calculation aredetailed in the Appendix.The model does not deal with the contribution of SiO2
and MnO to the oxygen potential of the metal, thoughthe approach taken subsequently could be extended toinclude this contribution. Thus, the value of oxygenconcentration at interface, [pct O]i, is assumed as theoxygen concentration in equilibrium with (FeO); that is,
FeOð Þ ¼ Feþ ½O�i ½8�
and
½pct O�i ¼ cKFeOXFeO ½9�
where XFeO is the mol fraction of FeO in slag, KFeO isthe equilibrium constant of Reaction [8], and c is theactivity coefficient FeO in slag. The value of KFeO can bepredicted by[5]
log ðKFeOÞ ¼ �6372
Tþ 2:73 ½10�
The issue of the rate of FeO reduction in slag by Al iscomplex, and there is limited experimental and plant
Fig. 1—Representation of regions within top blown oxygen steel-making.
354—VOLUME 40B, JUNE 2009 METALLURGICAL AND MATERIALS TRANSACTIONS B

data to deduce rate mechanisms and the controllingstep. In this model, we assume that mass transfer ofoxygen from the slag metal interface into the metalphase controls the overall rate of FeO reduction in theslag. By assuming that oxygen transfer from theinterface into the metal determines the rate of Reaction[8], the value of [pct O]i can be predicted by thefollowing equation:
ln½pct O�i;ðjþ1Þ � ½pct O�b½pct O�i;j � ½pct O�b
!
¼ �k1ODt ½11�
where k1O is a rate constant; [pct O]b is the concentrationof oxygen in the bulk metal; and [pct O]i,j and [pctO]i,(j+1) are the oxygen concentration at interface attime j and at time j + 1, respectively. The value of [pctO]b is controlled by oxygen reaction with aluminum inmetal; i.e.,
2 Al½ � þ 3 O½ �b ¼ Al2O3ð Þinclusion ½12�
By assuming that Reaction [12] is mass transportcontrol, its rate of reactions can be written as
ln[pct O�b;ðjþ1Þ � ½pct O�b;e½pct O�b;j � [pct O�b;e
!
¼ �k1ODt ½13�
where [pct O]b,e is the equilibrium concentration ofoxygen in the bulk metal. The value of [pct O]b,e, inweight percent, can be predicted by[9]
½pct O�b;e ¼ 10�4aAl2O3
KAl2O3
½pct Al�2
!1=3
½14�
where
log ðKAl2O3Þ ¼ � 62; 680
Tþ 31:85 ½15�
and
aAl2O3=
1 Al killed no Ca0.064 Al killed with Ca
�½16�
Up to this point of discussion, the system has beenconsidered as a perfectly mixed system; however, asreported in the literature,[5,8] the system is not alwaysperfectly mixed over the entire processing time. Conse-quently, it is appropriate to add a correction factor, a, toaccount for nonuniform conditions in the system. Thiscorrection factor, a, is introduced into the rate constantas follows:
k1O ¼ akmO ½17�
where
a ¼ 1
B_eavgs
Z t
t¼0
_e dt� 1:0 ½18�
where _e is the stirring energy (W/tonne) and s is themixing time (s). Equation [17] predicts the correction
factor by taking the ratio of the total stirring going intothe bath over the total required energy for perfectlymixing. Because the total energy required for perfectlymixing is usually estimated based on single disturbanceinto the system, which is not true in ladle operation, acorrection factor B is introduced in Eq. [18] to accountfor this behavior. The value of rate constants for sulfur,kmS , and oxygen, kmO, at perfectly mixed condition, arecalculated by[2]
kmO ¼E_e0:25 _e<50E
1390:255_e2:10 _e>50
�½19�
and
kmS ¼E0 _e0:25 _e<50E0
1390:255_e2:10 _e>50
�½20�
where E and E¢ are constants. The numeric value of1390.255 is introduced into Eqs. [19] and [20] to bridgethe values of rate constants at _e ¼ 50W/tonne.The mixing time, s, is predicted by[10]
s ¼ 116_e�1=3D5=3H�1 ½21�
where D is the ladle diameter (m) and H is the depth ofinjection (m). The stirring energy can be evaluated by[10]
_e ¼ 14:23QT
MBlog
1þH
1:48Po
� �½22�
where Q is the flow rate of gas (Nm3/min), MB is thebath weight (tonne), Po is the pressure of gas at the bathsurface (atm), and H is the depth of gas injection (m).The constant values in equations, i.e. E, E¢, and B, areoptimized by minimizing
b1
X
i
ð½pct S�m;i � ½pct S�c;iÞ2
þ ð1� b1ÞX
i
ððpct FeOÞm;i � ðpct FeOÞc;iÞ2 ½23�
where [pct S] is the sulfur concentration in steel; (pctFeO) is the FeO concentration in slag; b1 is the weightedfactor; and subscripts m and c represent the measuredand computed values, respectively. In effect, the modeldeveloped relies on using plant data, with multiple slag,and metal chemistry analysis as a function of time, todetermine three semiempirical constants. For onlineapplication of the model, generally, several measure-ments of metal and slag chemistry are carried out duringladle operation. These data could be used to optimizethe values of constants in the model, namely, E, E¢, andB, in an online basis so the predictability of theinferential model can be improved. The results fromthe implementation of this strategy are illustrated inFigure 2. The initial values of the constants E, E¢, and Bare developed using past data. These values are used toconstruct the initial prediction line (showed as a dashedline in Figure 2). When measured data of processparameters are available, these values are used tooptimize the value of the constants. The improvedprediction line is shown in Figure 2 as a dash-dot line(corrected with first measurement) and solid line
METALLURGICAL AND MATERIALS TRANSACTIONS B VOLUME 40B, JUNE 2009—355
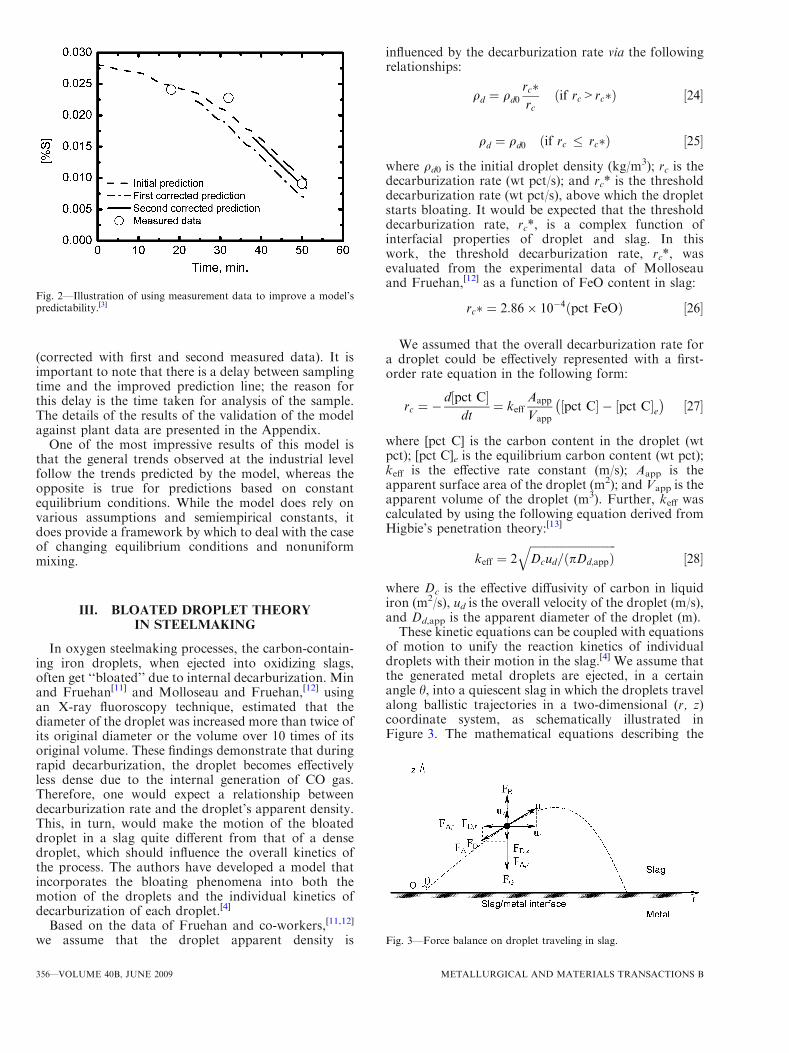
(corrected with first and second measured data). It isimportant to note that there is a delay between samplingtime and the improved prediction line; the reason forthis delay is the time taken for analysis of the sample.The details of the results of the validation of the modelagainst plant data are presented in the Appendix.
One of the most impressive results of this model isthat the general trends observed at the industrial levelfollow the trends predicted by the model, whereas theopposite is true for predictions based on constantequilibrium conditions. While the model does rely onvarious assumptions and semiempirical constants, itdoes provide a framework by which to deal with the caseof changing equilibrium conditions and nonuniformmixing.
III. BLOATED DROPLET THEORYIN STEELMAKING
In oxygen steelmaking processes, the carbon-contain-ing iron droplets, when ejected into oxidizing slags,often get ‘‘bloated’’ due to internal decarburization. Minand Fruehan[11] and Molloseau and Fruehan,[12] usingan X-ray fluoroscopy technique, estimated that thediameter of the droplet was increased more than twice ofits original diameter or the volume over 10 times of itsoriginal volume. These findings demonstrate that duringrapid decarburization, the droplet becomes effectivelyless dense due to the internal generation of CO gas.Therefore, one would expect a relationship betweendecarburization rate and the droplet’s apparent density.This, in turn, would make the motion of the bloateddroplet in a slag quite different from that of a densedroplet, which should influence the overall kinetics ofthe process. The authors have developed a model thatincorporates the bloating phenomena into both themotion of the droplets and the individual kinetics ofdecarburization of each droplet.[4]
Based on the data of Fruehan and co-workers,[11,12]
we assume that the droplet apparent density is
influenced by the decarburization rate via the followingrelationships:
qd ¼ qd0
rc�rc
if rc>rc�ð Þ ½24�
qd ¼ qd0 if rc � rc�ð Þ ½25�
where qd0 is the initial droplet density (kg/m3); rc is thedecarburization rate (wt pct/s); and rc* is the thresholddecarburization rate (wt pct/s), above which the dropletstarts bloating. It would be expected that the thresholddecarburization rate, rc*, is a complex function ofinterfacial properties of droplet and slag. In thiswork, the threshold decarburization rate, rc*, wasevaluated from the experimental data of Molloseauand Fruehan,[12] as a function of FeO content in slag:
rc� ¼ 2:86� 10�4ðpct FeOÞ ½26�
We assumed that the overall decarburization rate fora droplet could be effectively represented with a first-order rate equation in the following form:
rc ¼ �d½pct C�
dt¼ keff
Aapp
Vapp½pct C� � ½pct C�e� �
½27�
where [pct C] is the carbon content in the droplet (wtpct); [pct C]e is the equilibrium carbon content (wt pct);keff is the effective rate constant (m/s); Aapp is theapparent surface area of the droplet (m2); and Vapp is theapparent volume of the droplet (m3). Further, keff wascalculated by using the following equation derived fromHigbie’s penetration theory:[13]
keff ¼ 2ffiffiffiffiffiffiffiffiffiffiffiffiffiffiffiffiffiffiffiffiffiffiffiffiffiffiffiffiffiffiffiDcud=ðpDd;appÞ
q½28�
where Dc is the effective diffusivity of carbon in liquidiron (m2/s), ud is the overall velocity of the droplet (m/s),and Dd,app is the apparent diameter of the droplet (m).These kinetic equations can be coupled with equations
of motion to unify the reaction kinetics of individualdroplets with their motion in the slag.[4] We assume thatthe generated metal droplets are ejected, in a certainangle h, into a quiescent slag in which the droplets travelalong ballistic trajectories in a two-dimensional (r, z)coordinate system, as schematically illustrated inFigure 3. The mathematical equations describing the
Fig. 2—Illustration of using measurement data to improve a model’spredictability.[3]
Fig. 3—Force balance on droplet traveling in slag.
356—VOLUME 40B, JUNE 2009 METALLURGICAL AND MATERIALS TRANSACTIONS B
balance of various forces acting on a metal droplet canbe written as follows:
z-direction: qdVdduzdt¼ FB � FG � FD;z � FA;z ½29�
r-direction: qdVddurdt¼ �FD;r � FA;r ½30�
where the subscript d stands for droplet; the subscripts zand r stand for vertical and horizontal directions,respectively; FB, FG, FD and FA are buoyancy, gravita-tion, drag, and ‘‘added mass’’ forces (N), respectively; qd
is the droplet density (kg/m3); Vd is the droplet volume(m3); u is the droplet velocity (m/s); and t is time (s).
Further assuming the droplet is spherical in shapewith diameter Dd and introducing definitions of therelevant forces in terms of density, velocity, anddiameter of the droplet, by mathematical derivation,we can obtain the following differential equations thatgovern the motion of the metal droplet in the slag:
duzdt¼ 2 qs � qdð Þg
qs þ 2qd
� 3qsCD;z
2 qs þ 2qdð ÞDdu2z ½31�
durdt¼ � 3qsCD;r
2 qs þ 2qdð ÞDdu2r ½32�
where the subscript s denotes the slag phase and CD isthe drag coefficient. Equations [31] and [32] are themajor differential equations to be solved, based onwhich a mathematical model for predicting the trajec-tory and residence time of a metal droplet moving inslag is developed. The details of the model developmentcan be found in an earlier article by the authors.[4]
A combination of Eqs. [24] through [27] with Eqs. [31]and [32] enables us to predict the trajectory and residencetime of bloated metal droplets in slags under theinfluence of decarburization. This model is termed bythe authors as the ‘‘bloated droplet motion model,’’which accounts for the effects of both fluid mechanicsand overall rate of decarburization reactions on themotion of metal droplets in oxidizing slag. In the presentmodeling work, the following values of physical proper-ties were adopted:[4] qd = 7000 kg/m3, qs = 2991.4kg/m3, and ls = 0.0709 PaÆs.
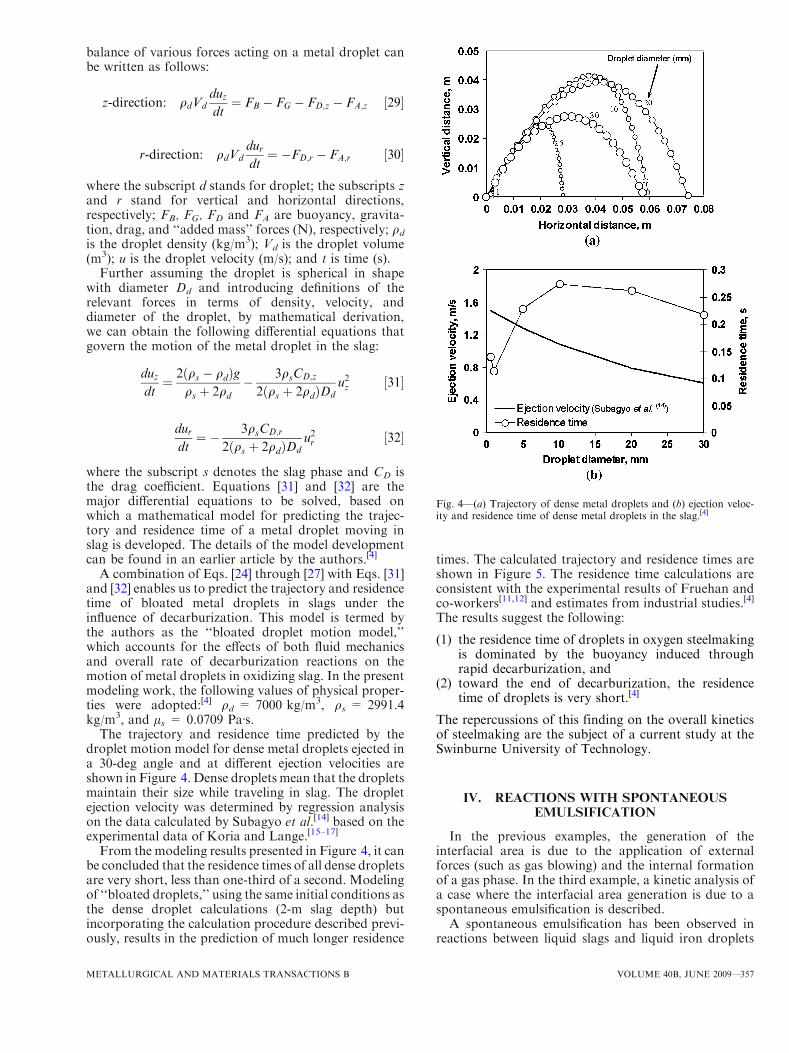
The trajectory and residence time predicted by thedroplet motion model for dense metal droplets ejected ina 30-deg angle and at different ejection velocities areshown in Figure 4. Dense droplets mean that the dropletsmaintain their size while traveling in slag. The dropletejection velocity was determined by regression analysison the data calculated by Subagyo et al.[14] based on theexperimental data of Koria and Lange.[15–17]
From the modeling results presented in Figure 4, it canbe concluded that the residence times of all dense dropletsare very short, less than one-third of a second. Modelingof ‘‘bloated droplets,’’ using the same initial conditions asthe dense droplet calculations (2-m slag depth) butincorporating the calculation procedure described previ-ously, results in the prediction of much longer residence
times. The calculated trajectory and residence times areshown in Figure 5. The residence time calculations areconsistent with the experimental results of Fruehan andco-workers[11,12] and estimates from industrial studies.[4]
The results suggest the following:
(1) the residence time of droplets in oxygen steelmakingis dominated by the buoyancy induced throughrapid decarburization, and
(2) toward the end of decarburization, the residencetime of droplets is very short.[4]
The repercussions of this finding on the overall kineticsof steelmaking are the subject of a current study at theSwinburne University of Technology.
IV. REACTIONS WITH SPONTANEOUSEMULSIFICATION
In the previous examples, the generation of theinterfacial area is due to the application of externalforces (such as gas blowing) and the internal formationof a gas phase. In the third example, a kinetic analysis ofa case where the interfacial area generation is due to aspontaneous emulsification is described.A spontaneous emulsification has been observed in
reactions between liquid slags and liquid iron droplets
Fig. 4—(a) Trajectory of dense metal droplets and (b) ejection veloc-ity and residence time of dense metal droplets in the slag.[4]
METALLURGICAL AND MATERIALS TRANSACTIONS B VOLUME 40B, JUNE 2009—357
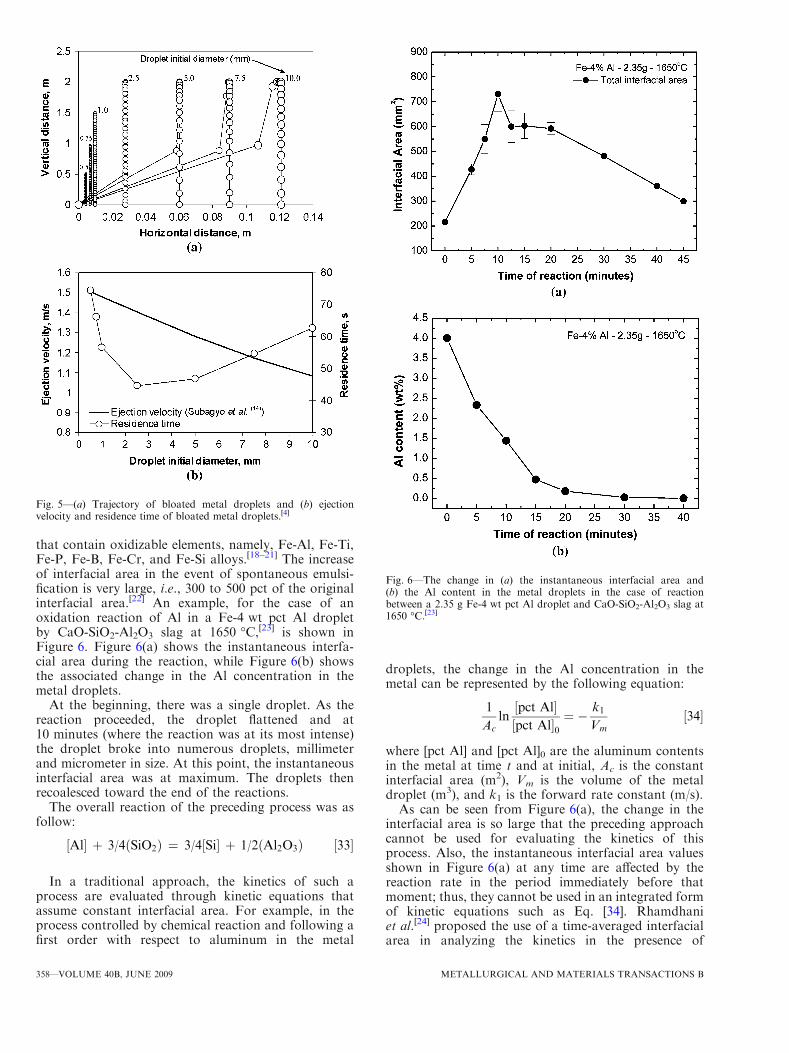
that contain oxidizable elements, namely, Fe-Al, Fe-Ti,Fe-P, Fe-B, Fe-Cr, and Fe-Si alloys.[18–21] The increaseof interfacial area in the event of spontaneous emulsi-fication is very large, i.e., 300 to 500 pct of the originalinterfacial area.[22] An example, for the case of anoxidation reaction of Al in a Fe-4 wt pct Al dropletby CaO-SiO2-Al2O3 slag at 1650 �C,[23] is shown inFigure 6. Figure 6(a) shows the instantaneous interfa-cial area during the reaction, while Figure 6(b) showsthe associated change in the Al concentration in themetal droplets.
At the beginning, there was a single droplet. As thereaction proceeded, the droplet flattened and at10 minutes (where the reaction was at its most intense)the droplet broke into numerous droplets, millimeterand micrometer in size. At this point, the instantaneousinterfacial area was at maximum. The droplets thenrecoalesced toward the end of the reactions.
The overall reaction of the preceding process was asfollow:
Al½ � þ 3/4 SiO2ð Þ ¼ 3/4 Si½ � þ 1/2 Al2O3ð Þ ½33�
In a traditional approach, the kinetics of such aprocess are evaluated through kinetic equations thatassume constant interfacial area. For example, in theprocess controlled by chemical reaction and following afirst order with respect to aluminum in the metal
droplets, the change in the Al concentration in themetal can be represented by the following equation:
1
Acln½pct Al�½pct Al�0
¼ � k1Vm
½34�
where [pct Al] and [pct Al]0 are the aluminum contentsin the metal at time t and at initial, Ac is the constantinterfacial area (m2), Vm is the volume of the metaldroplet (m3), and k1 is the forward rate constant (m/s).As can be seen from Figure 6(a), the change in the
interfacial area is so large that the preceding approachcannot be used for evaluating the kinetics of thisprocess. Also, the instantaneous interfacial area valuesshown in Figure 6(a) at any time are affected by thereaction rate in the period immediately before thatmoment; thus, they cannot be used in an integrated formof kinetic equations such as Eq. [34]. Rhamdhaniet al.[24] proposed the use of a time-averaged interfacialarea in analyzing the kinetics in the presence of
Fig. 5—(a) Trajectory of bloated metal droplets and (b) ejectionvelocity and residence time of bloated metal droplets.[4]
Fig. 6—The change in (a) the instantaneous interfacial area and(b) the Al content in the metal droplets in the case of reactionbetween a 2.35 g Fe-4 wt pct Al droplet and CaO-SiO2-Al2O3 slag at1650 �C.[23]
358—VOLUME 40B, JUNE 2009 METALLURGICAL AND MATERIALS TRANSACTIONS B
spontaneous emulsification. A first-order chemical reac-tion controlled kinetics equation is written as
ln[pct Al]
½pct Al�0¼ � k1
Vm
Z t
0
AðtÞdt ½35�
where A(t) is the instantaneous interfacial area, i.e.,interfacial area in Figure 6(a). A factor of t/t isintroduced to the right-hand side of Eq. [35], and uponrearranging the equation, the following is obtained:
1
A�ðtÞ ln½pct Al�½pct Al�0
¼ � k1Vm
t ½36�
where A*(t) is the time-averaged interfacial area, calcu-lated using the following equation:
A�ðtÞ ¼ 1
t�Z t
0
AðtÞdt ½37�
In a chaotic process such as in the event of sponta-neous emulsification, the change in interfacial area iscomplicated and cannot easily be represented by asimple function. Numerical calculation of time-averagedinterfacial area is required.
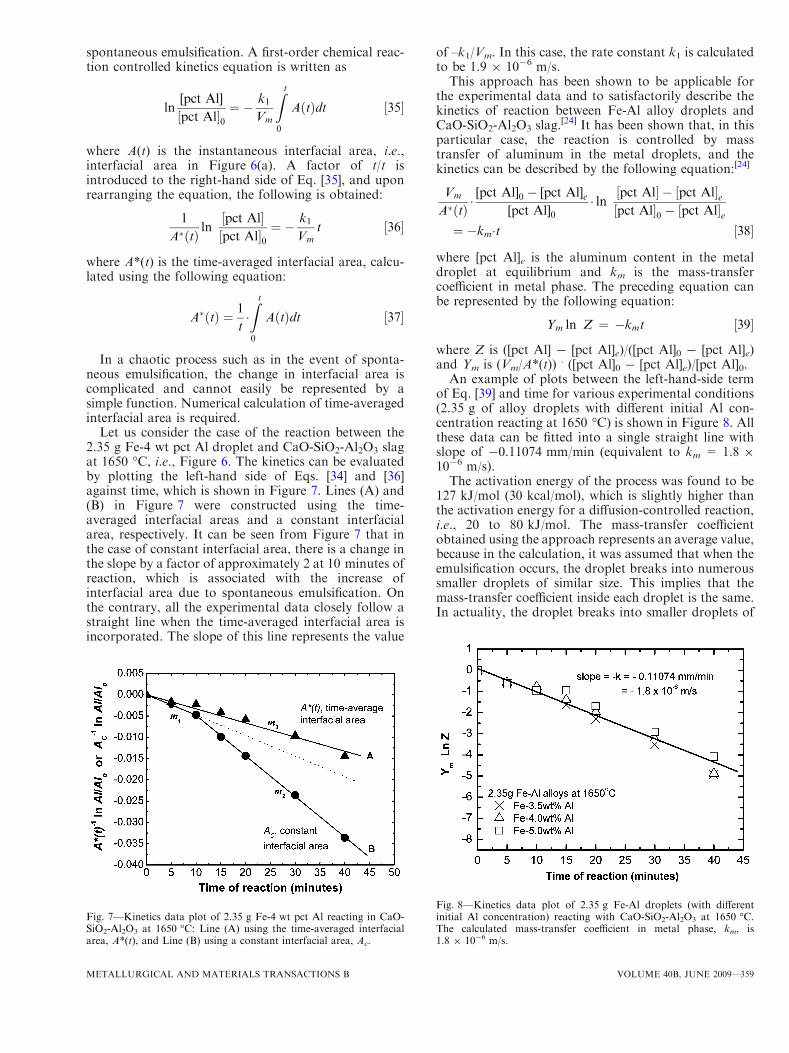
Let us consider the case of the reaction between the2.35 g Fe-4 wt pct Al droplet and CaO-SiO2-Al2O3 slagat 1650 �C, i.e., Figure 6. The kinetics can be evaluatedby plotting the left-hand side of Eqs. [34] and [36]against time, which is shown in Figure 7. Lines (A) and(B) in Figure 7 were constructed using the time-averaged interfacial areas and a constant interfacialarea, respectively. It can be seen from Figure 7 that inthe case of constant interfacial area, there is a change inthe slope by a factor of approximately 2 at 10 minutes ofreaction, which is associated with the increase ofinterfacial area due to spontaneous emulsification. Onthe contrary, all the experimental data closely follow astraight line when the time-averaged interfacial area isincorporated. The slope of this line represents the value
of –k1/Vm. In this case, the rate constant k1 is calculatedto be 1.9 9 10-6 m/s.This approach has been shown to be applicable for
the experimental data and to satisfactorily describe thekinetics of reaction between Fe-Al alloy droplets andCaO-SiO2-Al2O3 slag.
[24] It has been shown that, in thisparticular case, the reaction is controlled by masstransfer of aluminum in the metal droplets, and thekinetics can be described by the following equation:[24]
Vm
A�ðtÞ �[pct Al]0 � [pct Al]e
[pct Al]0� ln ½pct Al� � ½pct Al�e½pct Al�0 � ½pct Al�e
¼ �km�t ½38�
where [pct Al]e is the aluminum content in the metaldroplet at equilibrium and km is the mass-transfercoefficient in metal phase. The preceding equation canbe represented by the following equation:
Ym ln Z ¼ �kmt ½39�
where Z is ([pct Al] - [pct Al]e)/([pct Al]0 - [pct Al]e)and Ym is (Vm/A*(t))
. ([pct Al]0 - [pct Al]e)/[pct Al]0.An example of plots between the left-hand-side term
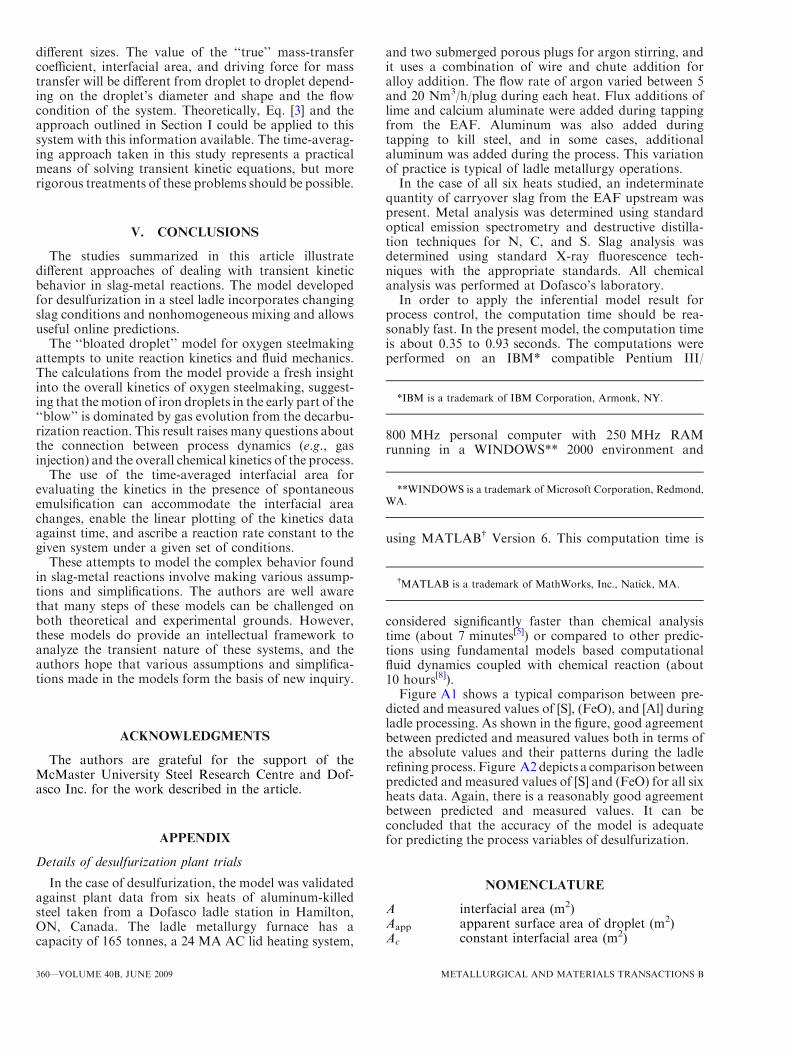
of Eq. [39] and time for various experimental conditions(2.35 g of alloy droplets with different initial Al con-centration reacting at 1650 �C) is shown in Figure 8. Allthese data can be fitted into a single straight line withslope of -0.11074 mm/min (equivalent to km = 1.8 910-6 m/s).The activation energy of the process was found to be
127 kJ/mol (30 kcal/mol), which is slightly higher thanthe activation energy for a diffusion-controlled reaction,i.e., 20 to 80 kJ/mol. The mass-transfer coefficientobtained using the approach represents an average value,because in the calculation, it was assumed that when theemulsification occurs, the droplet breaks into numeroussmaller droplets of similar size. This implies that themass-transfer coefficient inside each droplet is the same.In actuality, the droplet breaks into smaller droplets of
Fig. 7—Kinetics data plot of 2.35 g Fe-4 wt pct Al reacting in CaO-SiO2-Al2O3 at 1650 �C: Line (A) using the time-averaged interfacialarea, A*(t), and Line (B) using a constant interfacial area, Ac.
Fig. 8—Kinetics data plot of 2.35 g Fe-Al droplets (with differentinitial Al concentration) reacting with CaO-SiO2-Al2O3 at 1650 �C.The calculated mass-transfer coefficient in metal phase, km, is1.8 9 10-6 m/s.
METALLURGICAL AND MATERIALS TRANSACTIONS B VOLUME 40B, JUNE 2009—359
different sizes. The value of the ‘‘true’’ mass-transfercoefficient, interfacial area, and driving force for masstransfer will be different from droplet to droplet depend-ing on the droplet’s diameter and shape and the flowcondition of the system. Theoretically, Eq. [3] and theapproach outlined in Section I could be applied to thissystem with this information available. The time-averag-ing approach taken in this study represents a practicalmeans of solving transient kinetic equations, but morerigorous treatments of these problems should be possible.
V. CONCLUSIONS
The studies summarized in this article illustratedifferent approaches of dealing with transient kineticbehavior in slag-metal reactions. The model developedfor desulfurization in a steel ladle incorporates changingslag conditions and nonhomogeneous mixing and allowsuseful online predictions.
The ‘‘bloated droplet’’ model for oxygen steelmakingattempts to unite reaction kinetics and fluid mechanics.The calculations from the model provide a fresh insightinto the overall kinetics of oxygen steelmaking, suggest-ing that themotion of iron droplets in the early part of the‘‘blow’’ is dominated by gas evolution from the decarbu-rization reaction. This result raises many questions aboutthe connection between process dynamics (e.g., gasinjection) and the overall chemical kinetics of the process.
The use of the time-averaged interfacial area forevaluating the kinetics in the presence of spontaneousemulsification can accommodate the interfacial areachanges, enable the linear plotting of the kinetics dataagainst time, and ascribe a reaction rate constant to thegiven system under a given set of conditions.
These attempts to model the complex behavior foundin slag-metal reactions involve making various assump-tions and simplifications. The authors are well awarethat many steps of these models can be challenged onboth theoretical and experimental grounds. However,these models do provide an intellectual framework toanalyze the transient nature of these systems, and theauthors hope that various assumptions and simplifica-tions made in the models form the basis of new inquiry.
ACKNOWLEDGMENTS
The authors are grateful for the support of theMcMaster University Steel Research Centre and Dof-asco Inc. for the work described in the article.
APPENDIX
Details of desulfurization plant trials
In the case of desulfurization, the model was validatedagainst plant data from six heats of aluminum-killedsteel taken from a Dofasco ladle station in Hamilton,ON, Canada. The ladle metallurgy furnace has acapacity of 165 tonnes, a 24 MA AC lid heating system,
and two submerged porous plugs for argon stirring, andit uses a combination of wire and chute addition foralloy addition. The flow rate of argon varied between 5and 20 Nm3/h/plug during each heat. Flux additions oflime and calcium aluminate were added during tappingfrom the EAF. Aluminum was also added duringtapping to kill steel, and in some cases, additionalaluminum was added during the process. This variationof practice is typical of ladle metallurgy operations.In the case of all six heats studied, an indeterminate
quantity of carryover slag from the EAF upstream waspresent. Metal analysis was determined using standardoptical emission spectrometry and destructive distilla-tion techniques for N, C, and S. Slag analysis wasdetermined using standard X-ray fluorescence tech-niques with the appropriate standards. All chemicalanalysis was performed at Dofasco’s laboratory.In order to apply the inferential model result for
process control, the computation time should be rea-sonably fast. In the present model, the computation timeis about 0.35 to 0.93 seconds. The computations wereperformed on an IBM* compatible Pentium III/
800 MHz personal computer with 250 MHz RAMrunning in a WINDOWS** 2000 environment and
using MATLAB� Version 6. This computation time is
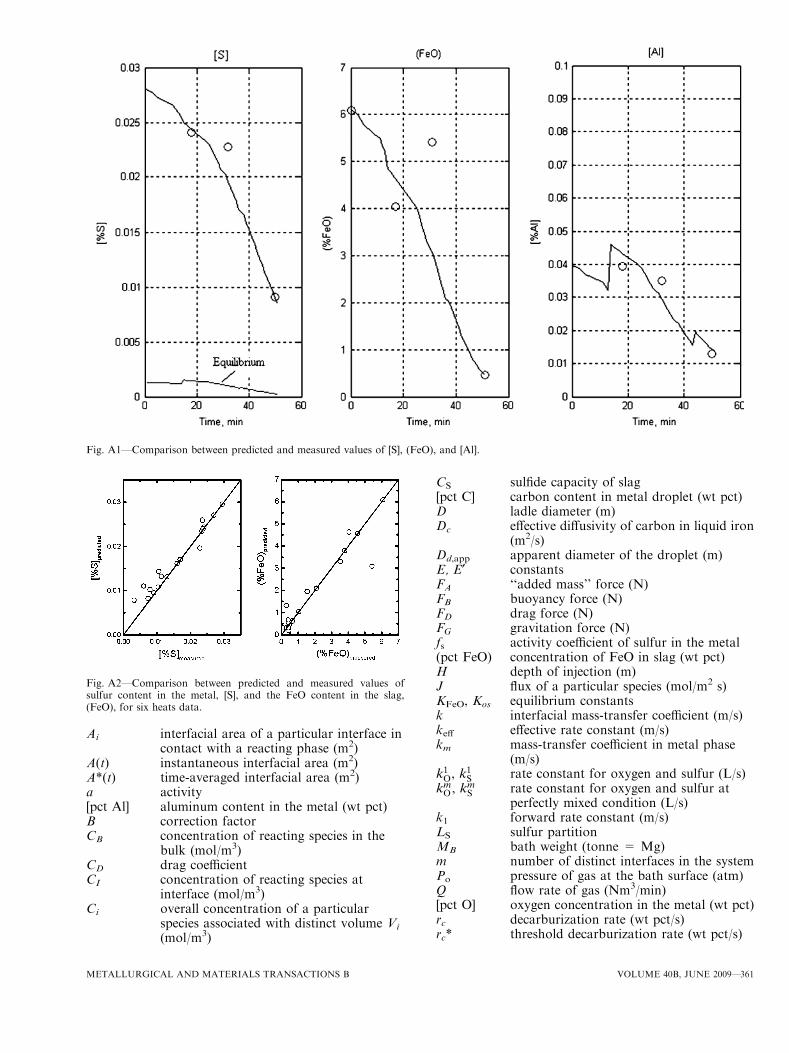
considered significantly faster than chemical analysistime (about 7 minutes[5]) or compared to other predic-tions using fundamental models based computationalfluid dynamics coupled with chemical reaction (about10 hours[8]).Figure A1 shows a typical comparison between pre-
dicted and measured values of [S], (FeO), and [Al] duringladle processing. As shown in the figure, good agreementbetween predicted and measured values both in terms ofthe absolute values and their patterns during the ladlerefining process. Figure A2depicts a comparisonbetweenpredicted and measured values of [S] and (FeO) for all sixheats data. Again, there is a reasonably good agreementbetween predicted and measured values. It can beconcluded that the accuracy of the model is adequatefor predicting the process variables of desulfurization.
NOMENCLATURE
A interfacial area (m2)Aapp apparent surface area of droplet (m2)Ac constant interfacial area (m2)
*IBM is a trademark of IBM Corporation, Armonk, NY.
**WINDOWS is a trademark of Microsoft Corporation, Redmond,WA.
�MATLAB is a trademark of MathWorks, Inc., Natick, MA.
360—VOLUME 40B, JUNE 2009 METALLURGICAL AND MATERIALS TRANSACTIONS B
Ai interfacial area of a particular interface incontact with a reacting phase (m2)
A(t) instantaneous interfacial area (m2)A*(t) time-averaged interfacial area (m2)a activity[pct Al] aluminum content in the metal (wt pct)B correction factorCB concentration of reacting species in the
bulk (mol/m3)CD drag coefficientCI concentration of reacting species at
interface (mol/m3)Ci overall concentration of a particular
species associated with distinct volume Vi
(mol/m3)
CS sulfide capacity of slag[pct C] carbon content in metal droplet (wt pct)D ladle diameter (m)Dc effective diffusivity of carbon in liquid iron
(m2/s)Dd,app apparent diameter of the droplet (m)E, E¢ constantsFA ‘‘added mass’’ force (N)FB buoyancy force (N)FD drag force (N)FG gravitation force (N)fs activity coefficient of sulfur in the metal(pct FeO) concentration of FeO in slag (wt pct)H depth of injection (m)J flux of a particular species (mol/m2 s)KFeO, Kos equilibrium constantsk interfacial mass-transfer coefficient (m/s)keff effective rate constant (m/s)km mass-transfer coefficient in metal phase
(m/s)k1O, k1
S rate constant for oxygen and sulfur (L/s)kmO, km
S rate constant for oxygen and sulfur atperfectly mixed condition (L/s)
k1 forward rate constant (m/s)LS sulfur partitionMB bath weight (tonne = Mg)m number of distinct interfaces in the systemPo pressure of gas at the bath surface (atm)Q flow rate of gas (Nm3/min)[pct O] oxygen concentration in the metal (wt pct)rc decarburization rate (wt pct/s)rc* threshold decarburization rate (wt pct/s)
Fig. A1—Comparison between predicted and measured values of [S], (FeO), and [Al].
Fig. A2—Comparison between predicted and measured values ofsulfur content in the metal, [S], and the FeO content in the slag,(FeO), for six heats data.
METALLURGICAL AND MATERIALS TRANSACTIONS B VOLUME 40B, JUNE 2009—361
ST total weight of sulfur in the ladle (kg)[pct S] concentration of sulfur (wt pct)T temperature (K)t time of reaction (s)ud overall velocity of the droplet (m/s)V volume of the phase (m3)Vi volume associated with the Ai (m
3)W weight of phase (kg)X mol fraction of component in phase
GREEK SYMBOLS
a correction factorb1 weighted factorc activity coefficient of FeO in slagl viscosity (PaÆs)qd droplet apparent density (kg/m3)qd0 initial droplet density (kg/m3)_e stirring energy (W/tonne = W/Mg)s mixing time (s)
SUBSCRIPTS
app apparent valuesb bulk valuesc computed valuesd droplete equilibrium valuesi, I values at interfacej values at time jj + 1 values at time j + 1m, M metalm measured values0 initial valuesr horizontal directions, S slagz vertical direction
REFERENCES1. H.H. Kellog and C. Diaz: Proc. Savard/Lee Int. Symp. Bath
Smelting, TMS, Warrendale, PA, 1992, pp. 39–65.2. B. Deo and R. Boom: Fundamentals of Steelmaking Metallurgy,
Prentice Hall International, New York, NY, 1993.3. Subagyo, G.A. Brooks, S. Waterfall, and S. Sun: Proc. Electric
Furnace Conf. 2002, ISS Warrendale, PA, 2002, pp. 819–27.4. G. Brooks, Y. Pan, Subagyo, and K. Coley: Metall. Mater. Trans.
B, 2005, vol. 36B, pp. 525–35.5. P.G. Jonsson and L.T.I. Jonsson: ISIJ Int., 2001, vol. 41 (11),
pp. 1289–1302.6. J.Y. Choi, D.J. Kim, and H.G. Lee: ISIJ Int., 2001, vol. 41 (3),
pp. 216–24.7. I.D. Sommerville and Y. Yang: AusIMM Proc., 2001, vol. 306 (1),
pp. 71–77.8. M.A.T. Andersson, L.T.I. Jonsson, and P.G. Jonsson: ISIJ Int.,
2000, vol. 40 (11), pp. 1080–88.9. E.T. Turkdogan: Fundamentals of Steelmaking, The Institute of
Materials, Cambridge, United Kingdom, 1996, p. 198.10. The Making, Shaping, and Treating of Steel, R.J. Fruehan ed., The
AISE Steel Foundation, Pittsburgh, PA, 1998, p. 670.11. D.J. Min and R.J. Fruehan: Metall. Mater. Trans. B, 1992,
vol. 23B, pp. 29–37.12. C.L. Molloseau and R.J. Fruehan: Metall. Mater. Trans. B, 2002,
vol. 33B, pp. 335–44.13. R. Higbie: Trans. AIChE, 1935, vol. 35, pp. 365–89.14. Subagyo, G.A. Brooks, and K. Coley: Can. Metall. Q., 2005,
vol. 44 (1), pp. 119–29.15. S.C. Koria and K.W. Lange: Ironmaking and Steelmaking, 1983,
vol. 10 (4), pp. 160–68.16. S.C. Koria and K.W. Lange: Metall. Mater. Trans. B, 1984,
vol. 15B, pp. 109–16.17. S.C. Koria and K.W. Lange: Ironmaking and Steelmaking, 1986,
vol. 13 (5), pp. 236–40.18. P. Kozakevitch, G. Urbain, and M. Sage: Rev. Metall., 1955,
vol. 2, pp. 161–72.19. H. Ooi, T. Nozaki, and H. Yoshii: Trans. Iron Steel Inst. Jpn.,
1974, vol. 14, pp. 9–16.20. P.V. Riboud and L.D. Lucas: Can. Metall. Q., 1981, vol. 20 (2),
pp. 199–208.21. Y. Chung and A.W. Cramb: Phil. Trans. R. Soc. London A, 1998,
vol. 356, pp. 981–93.22. M.A. Rhamdhani, G.A. Brooks, and S.A. Nightingale: Proc. Int.
Symp. on Metal/Ceramic Interactions COM 2002, Aug. 2002,Montreal, Canada, MetSoc-CIM, Montreal, Canada, 2002,pp. 303–13.
23. M.A. Rhamdhani, G.A. Brooks, and K.S. Coley: Metall. Mater.Trans. B, 2006, vol. 37B, pp. 1087–91.
24. M.A. Rhamdhani, G.A. Brooks, and K.S. Coley: Metall. Mater.Trans. B, 2005, vol. 36B, pp. 219–27.
362—VOLUME 40B, JUNE 2009 METALLURGICAL AND MATERIALS TRANSACTIONS B