Calcium Silicate Insulation Board Manufacturing Business ...
Upload
michiganstateCategory
view
0download
0
N:Na
nosc
ale
Food
Scie
nce
Thermal and Rheological Properties ofL-Polylactide/Polyethylene Glycol/SilicateNanocomposites FilmsJasim Ahmed, Sunil K. Varshney, Rafael Auras, and Sung W. Hwang
Abstract: The melt rheology and thermal properties of polylactide (PLA)-based nanocomposite films that were preparedby solvent casting method with L-PLA, polyethylene glycol (PEG), and montmorillonite clay were studied. The neatPLA showed predominantly solid-like behavior (G′ > G′′) and the complex viscosity (η∗) decreased systematically as thetemperature increased from 184 to 196 ◦C. The elastic modulus (G′) of PLA/clay blend showed a significant improvementin the magnitude in the melt, while clay concentration was at 6% wt or higher. At similar condition, PEG dramaticallyreduced dynamic modulii and complex viscosity of PLA/PEG blend as function of concentration. A nanocompositeblend of PLA/PEG/clay (74/20/6) when compared to the neat polymer and PLA/PEG blend exhibited intermediatevalues of elastic modulus (G′) and complex viscosity (η∗) with excellent flexibility. Thermal analysis of different clayloading blends indicated that the melting temperature (Tm) and glass transition temperature (Tg) remained unaffectedirrespective of clay concentration due to immobilization of polymer chain in the clay nanocomposite. PEG incorporationreduced the Tg and the Tm of the blends (PLA/PEG and PLA/PEG/clay) significantly, however, crystallinity increasedin the similar condition. The transmission electron microscopy (TEM) image of nanocomposite films indicated goodcompatibility between PLA and PEG, whereas clay was not thoroughly distributed in the PLA matrix and remained asclusters. The percent crystallinity obtained by X-ray was significantly higher than that of differential scanning calorimeter(DSC) data for PLA.
Keywords: blends, complex viscosity, elastic modulus, intercalation, melting temperature, thermal analysis
IntroductionThere is a considerable interest in polymer/biopolymer-clay
nanocomposites currently due to significant property enhance-ments by incorporating of only a few weight percent of rigid parti-cles (nanofillers) in the nanometer range (approximately 100 nm).These nanofillers have been found to improve the mechanical,barrier, electrical, gas permeability, and thermal properties of basepolymer significantly at very low filler concentration with re-spect to their conventional microcomposite counterparts (SinhaRay and others 2002; Angellier and others 2005; Joshi and oth-ers 2006; Ginzburg and others 2009). These remarkable propertyenhancements make nanocomposites superior candidates for ma-terials application in the food packaging, electronics, and automo-tive industries (Treece and Oberhauser 2007). The nanocompositeproperties depend upon the state of nanoparticle dispersion in apolymer matrix (Mackay and others 2006), and the quality of nan-oclay dispersion in the matrix. However, the relationship betweenmechanical behavior and nanoparticle dispersion still remains un-resolved (Akcora and others 2010). Occasionally, clay platelets
MS 20100415 Submitted 4/15/2010, Accepted 7/28/2010. Authors Ahmed andVarshney are with Polymer Source, Inc., 124 Avro Street, Dorval, Montreal, Quebec,Canada H9P 2×8. Authors Auras and Hwang are with The School of Packaging,Michigan State Univ., East Lansing, MI 48824-1223, U.S.A. Author Hwang is alsowith Korea Packaging Center, Korea Inst. of Industrial Technology, Bucheon-si 421-742, South Korea. Direct inquiries to author Ahmed (E-mail: [email protected],[email protected]).
fail to disperse and remain aggregated into large “stacks” and inthis situations modulus and strength of the composite could becomparable to those of the matrix polymer but toughness and ul-timate elongation could even worsen (Ginzburg and others 2009).Therefore, the ability to disperse nanoclays on a molecular level hasbeen considered early on as the critical problem in nanocompositescience and technology.
The existing polymers are based on nonrenewable sources andtheir disposal by incineration generates carbon dioxide that con-tributes to global warming. Therefore, there is a need for thedevelopment of “green” materials that could be decomposed andrecycled to reduce gas emission and substitute conventional ma-terials. Polylactide (PLA) is one of such biopolymers and is cur-rently exploited for food packaging and biomedical applications.PLA has been approved as generally regarded as safe (GRAS) sta-tus for food packaging (Conn and others 1995; Jin and Zhang2008). PLA has a high mechanical strength, and excellent shapingand molding properties. Major limitations of PLA are its inherentbrittleness and low toughness. Thus, various approaches includingcopolymerization, blending, and incorporation of filler materialshave been experimented to enhance flexibility and toughness ofPLA for packaging applications. Much attention has been paid toblending which one is the simplest and economic way to obtainflexible packaging materials. PLA is commonly blended with lowmolecular weight and low glass transition temperature (Tg) poly-mers such as polyethylene glycol (PEG), polypropylene glycol(PPG), polyhydroxy butyrate to improve their flexibility. In ourearlier publication (Ahmed and others 2010), we reported that
C© 2010 Institute of Food Technologists R©doi: 10.1111/j.1750-3841.2010.01809.x Vol. 75, Nr. 8, 2010 � Journal of Food Science N97Further reproduction without permission is prohibited
N:NanoscaleFood
Science
Properties of PLA composite film . . .
incorporation of 10% PEG drastically reduced mechanical prop-erty of the blend with significant drop in Tg and the rheologicalmeasurement was impossible, while 25% PEG was used in theblend. In addition, incorporation of plasticizers has many limita-tions including too low Tg may not be suitable for processing andmolding; and migration to surface, which may be unsuitable forfood packaging. Other properties including thermal stability andgas barrier properties of the plasticized PLA blend still need tobe improved to fulfill for food packaging applications (Paul andothers 2003). To overcome these limitations incorporation of lay-ered silicates (clay) in nanoscale to plasticized, PLA has increasedinterests in food and packaging research.
Understanding of thermodynamic properties of lactides requiresquantitative thermal analysis and reliable interpretation of the un-derlying molecular mobility (Pyda 2004). Rheological and ther-mal properties of PLA are significantly affected by stereosequencedistribution, architecture, and molecular weight so on. (Tsuji andIkada 1995; Thakur and others 1996; Ahmed and others 2009).Despite its importance, the dependences of rheological proper-ties on the intercalated/exfoliated structures and the surface char-acteristics between the polymer chains and clays have not beenthoroughly investigated. Interestingly, PLAs exhibit both amor-phous and semicrystallinity and, therefore, a wide variation inthermal and rheological properties are expected for PLAs. In ourprevious study, rheological and thermal properties of nanocom-posites based on amorphous PLA (DL) were examined (Ahmedand others 2010). It is, therefore, interesting to study the roleof semicrystalline PLA (L-form) in the preparation of nanocom-posites films since compatibility should be assessed by evaluatingthe intermolecular interactions among participating polymers andhow they interact among layered silicates and plasticizers. To date,the melt rheology of PLA (L)/PEG/clay nanocomposites has notbeen thoroughly investigated. In this article, the thermal prop-erties and melt rheology of solvent processed L isomer of PLA,PLA/clay, PLA/PEG, and PLA/PEG/clay blends are examined.This study will elucidate on the interrelationship between thermaland rheological properties in the nanocomposite.
Materials and Methods
MaterialsPolymers studied in this work (PLAs [PLA, L-form] [P6467
LA2OH] and PEG [P8771-EG2OH]) were synthesized at Poly-mer Source Inc. (Montreal, Canada). The lactide sample was syn-thesized by tin-catalyzed ring-opening bulk polymerization ofmonomer (Purac, Gorinchem, The Netherlands) and PEG wasobtained by living anionic polymerization. The weight averagemolecular weight (Mw) and polydispersity index of PLA were ap-proximately 150000 g/mol and 1.70, respectively, and the corre-sponding values for PEG was 1210 and 1.10, respectively, based onsize exclusion chromataography (SEC) measurement on a Varianinstrument (Varian Inc., Calif., U.S.A.) equipped with refractiveindex, ultraviolet (UV), and dual detectors (light scattering andviscosity detectors). The nanoclay (Cloisite 30B: alkyl quaternaryammonium bentonite) was supplied by Southern Clay Products(Gonzales, Tex., USA) and used as received.
Composite film preparationPure polymers and blend specimens (PLA/clay, PLA/PEG,
and PLA/PEG/clay) were prepared by solvent casting withdichloromethane (DCM). The detailed compositions of films arepresented in Table 1. Film preparation details are described in our
earlier publication (Ahmed and others 2010). Briefly, all ingredi-ents were accurately weighted and thoroughly mixed followed byaddition of DCM (Fisher Scientific, ON, Canada). The resultantsolution was poured into a glass petri dish and DCM was allowedto evaporate at room temperature under a chemical hood. Eachdish was stored over a desiccant for overnight, and then films werepeeled from the dishes and placed in a sealed container until timeof use.
Film thickness. Thickness of blend films was determined us-ing a micrometer (Shenzhen Dikai Industrial Co. Ltd, Hong Kong,China) to the nearest 0.005 mm at 10 random locations aroundthe film. Precision of thickness measurement was ±5%. At least10 measurements were made randomly at 5 locations on each filmspecimen and the mean value was used as the film thickness. Filmspecimens of 55-μm thickness were selected for all experiments.
Gel permeation chromatography (GPC). The number av-erage (Mn) and weight average (Mw) molecular weights of the PLAmatrix before and after film preparation were determined by gelpermeation chromatography (GPC, Varian) that was based on thecalibration using polystyrene standards and tetrahydrofuran (THF)as a carrier solvent at 35 ◦C with a flow rate of 0.5 mL/min.
X-ray diffraction (XRD). XRD patterns were obtained us-ing a Rigaku Rotaflex 200B X-ray diffractometer equipped witha nickel-filtered Cu Kα radiation beam in the angular range of 0to 80 (2θ ) at a voltage of 45 kV and current of 100 mA. Peakintensities were obtained by counting with the NaI Scintillationdetector every 0.02◦ at sweep rates of 1.0◦ 2θ/min. The percentcrystallinity was calculated by separating intensities due to amor-phous and crystalline phase on diffraction patterns. The equipmentsoftware was used to resolve the curve for separating crystalline andamorphous regions. Percent crystallinity can be obtained from theratio of crystalline area to total area as shown in Eq. (1).
Xc = Ac
(Aa + Ac )× 100 (1)
where Xc is percent crystallinity; Ac is the area of crystalline region,and Aa is the area of amorphous region.
Transmission electron microscopy (TEM). TEM micro-graphs were obtained with a JEOL 100 CX-II (JEOL, Tokyo,Japan) electron microscope operated at an accelerated voltage of10 keV. The thin crosssections of the film samples were obtained byan ultramicrotome, a Power Tome XL (PTXL) (RMC, BoekelerInstruments, Tucson, Ariz., U.S.A.) with a CR-X cryo- section-ing unit for cryo-ultramicrotomy (RMC, Boekeler Instruments).At least 6 images were analyzed.
Melt rheology. Rheological measurements of PLA and com-posites were performed on a controlled-stress rheometer (AR2000Ex, TA Instruments, New Castle, Del., U.S.A.) with par-allel plate geometry (40 mm diameter) in the melt state (184 to196 ◦C). The temperature range was chosen because the range was
Table 1–Details of PLA-based materials.
1. 100% PLA2. PLA (90%) + PEG (10%)3. PLA (85%) + PEG (15%)4. PLA (80%) + PEG (20%)5. PLA (75%) + PEG (25%)6. PLA (97%)+ clay (3%)7. PLA (94%)+ clay (6%)8. PLA (91%)+ clay (9%)9. PLA (74%)+ PEG (20%) + Clay (6%)
N98 Journal of Food Science � Vol. 75, Nr. 8, 2010
N:Na
nosc
ale
Food
Scie
nce
Properties of PLA composite film . . .
above the melting temperature of PLA (180 ◦C). The width ofthe gap between 2 plates was 1000 μm. The sample temperaturewas internally controlled by a Peltier system (−20 to 200 ◦C withan accuracy of ±0.1 ◦C) attached with a water circulation unit. Aplatinum resistance thermometer sensor positioned at the center ofthe plate ensured temperature control and measurement. For eachtest, PLA neat film and composite films (about 1000 μm) wereplaced at the center of the rheometer plate for 5 min for com-plete melting and temperature equilibration before the actual mea-surements. The domain of linear viscoelasticity was established bythe oscillatory stress sweep tests for each sample and the magnitudeof stress varied between 0.001 and 10 Pa. Rheology Advantagesoftware (TA Instruments) was used to acquire data. The deviationdid not exceed 5% between duplicate runs, as the experiment wasrepeated. The average of the triplicate runs was reported as themeasured value. The master curves were generated by using theprinciple of time-temperature superposition (TTS) and shifted toa common reference temperature (Tref ) of 190 ◦C, which waschosen as the temperature above melting point of PLA.
Thermal analysisThermal analysis was performed on a TA Q100 differential
scanning calorimeter (DSC) (TA Instruments) calibrated with in-dium under an ultra high purity nitrogen atmosphere (flow rate50 mL/min). An empty aluminum pan served as reference. Sampleweights of approximately 10 mg were employed and the sampleswere encapsulated in aluminum pans and sealed. The samples wererun at a 10 ◦C/min heating/cooling ramp in 2 heating–coolingcycles. In the 1st cycle, PLA samples were cooled to −85 ◦C fol-lowed by heating at 10 ◦C/min to 200 ◦C and back to −85 ◦C.Same steps were followed for the 2nd cycle. The sample was heldat −85 ◦C and 200 ◦C for 5 min in each cycle. The melting tem-perature (Tm) and the value of fusion heat (�Hm) were taken fromthe 2nd heating curve to erase thermal history. The crystallizationtemperature (Tc) was considered as the minimum of the exother-mic peak. The crystallization and glass transition temperature (Tg)were calculated by the 2nd heating–cooling cycle. The area un-der the curve was calculated as the enthalpy from the instrumentsoftware. The degree of crystallinity (χ c) of PLA samples can becalculated based on the enthalpy value of a 100% crystalline PLAsample (Fisher and others 1973) from the Eq. (2). The enthalpyof fusion for neat PLA crystal is considered as 93 (J/g). Thermalscans for each sample were carried out in triplicate and the averagevalues are reported in this article:
%χC = (�Hm − �Hc )
93 (1 − xclay)× 100 (2)
where xclay is the amount of clay in the sample (that is, 3, 6, and9%wt.)
Data analysisStatistical analysis was carried out using Minitab statistical soft-
ware package (Minitab Inc. 2000). Trends were considered signif-icant while means of compared sets differed at P < 0.05 (student’st-test).
Results and DiscussionThe thickness of films made by solvent casting methods was
found to be uniform and the range varied between 0.054 and0.057 mm with addition of PEG and clay. The thicknesses ofthe films vary from the previous work conducted by the authors
(Ahmed and others 2010) since the solvent ratio, molecular weightof PLA, and the diameter of the Petri dish to prepare the filmschanged. The prepared films range from transparent to uniformlytranslucent and showed excellent sealing properties (Model Vac1060; Tilia Intl., N.Y., U.S.A.). GPC measurement revealed thatthere was almost no degradation of the PLA matrix after nanocom-posites film preparation (Mn 153000 and polydispersity index:1.73).
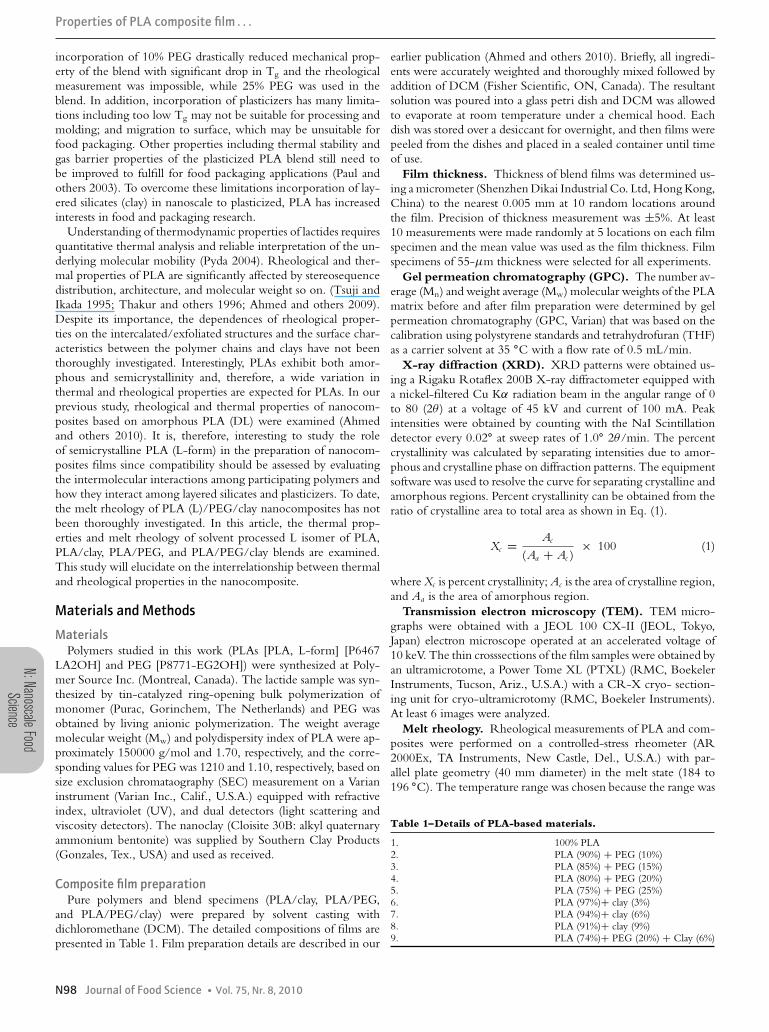
X-ray diffractionFigure 1 shows the XRD patterns of the nanocomposite film
containing PLA, PEG, and clay. The XRD pattern was similar asreported in the literature Lin and others (2007). The amorphousregion presented the broad scattered region, while the crystallineregion showed a typical sharp diffraction peak pattern where thed-spacing was marked in Figure 1. The percent crystallinity ofthe film was found to be 35%. Our observation of d-spacingat 5.3 A was well supported by earlier reports by Lin and oth-ers (2007) and Brizzolara and others 1996. PLA crystallizes in 3forms α, β and γ . The α-form, which is the most stable thanthe β and γ form, is commonly found and distinguished by 2θ
values of 15, 17, and 19◦, and it is described by 2 antiparallelchains in a left-handed 103 helix conformation packed in pseu-doorthorhombic unit cell (a = 10.6 A, b = 6.10 A, and c =2.8 A) (Brizzolara and others 1996). Blending of L-isomer ofpolylactide (PLLA) with other materials like PEG and further an-nealing of the produced films cause irreversible transformationinto the α-form with changes in the a, b, and c dimensions. Adetailed description on change of PLLA cell dimension as affectedby annealing and blending is available elsewhere (Brizzolara andothers 1996). Lee and Han (2003) reported the gallery distanceof Cloisite 30B as 18.5 A, with values increasing with the de-gree of exfoliation. In this report, exfoliation was not observed forthe clay between 0 and 10 (2-theta, deg; data not shown). There-fore, the XRD graph was used to calculate the absolute crystallinityof the samples.
TEM measurementsThe internal structures of the nanocomposites (PLA/PEG/clay)
in the nanometer scale were observed via a TEM. TEM al-lows a qualitative understanding of the microstructure throughdirect visualization. Figure 2 shows the TEM images of thenanocomposite films where the white arrow indicates the layeredclay. It was observed that the film (×10000) did not retain the
Figure 1–XRD patterns for PLA/PEG/clay films.
Vol. 75, Nr. 8, 2010 � Journal of Food Science N99

N:NanoscaleFood
Science
Properties of PLA composite film . . .
regular shape due to the poor interfacial adhesion. Several holesand splits were found to confirm their poor adhesion. It is clearfrom TEM that stacks of clay layers forming the clay crystallitesare not well dispersed within the polymer matrix and remainedin layered structures (white arrow) as shown in Figure 2B. Thelack of clay exfoliation is mainly attributed due to the solvent castprocessing technique. The white and gray areas in Figure 2B andC may be mainly attributed as regions in the polymer matrix withdifferent concentrations of PEG. Hence, further research is neededto determine the distribution of PEG in the polymer matrix.
RheologyThe typical melt rheogram of the neat PLA is shown in Figure 3.
Both the elastic modulus (G′) and the viscous modulus (G′′) in-creased systematically as function of frequency (ω). However, G′increased more quickly than G′′ thus leading to a decrease in phaseangle (δ). The continuous drop in phase angle (δ) indicated grad-ual increase in solid-like behavior of the melt. A similar solid-likeproperty was observed for amorphous PLA (Ahmed and others2010). However, Lin and others (2007) reported predominantlyviscous behavior of PLA (L-form) with MW of 80 kDa. The solid-like response of the PLA is solely attributed by higher molecularweight of the polymer.
In thermorheology, log–log plots of the isotherms of the elasticmodulus, (G′), viscous modulus (G′′), and complex viscosity (η∗)
can be superimposed by horizontal shifts log (aT), along the log(ω) axis, and vertical shifts given by log (bT) such that (Sinha Rayand others 2002; Sinha Ray and Okamoto 2003):
bTG′(aTω, Tref ) = bTG′(ω, T) (3)
Figure 3–Typical rheogram for melt PLA.
Figure 2–TEM images for PLA(L)/PEG/clay film (74/24/6). (B) and (C) are high-magnification images of (A). The white and black arrows indicatelayered clay and PEG, respectively.
N100 Journal of Food Science � Vol. 75, Nr. 8, 2010
N:Na
nosc
ale
Food
Scie
nce
Properties of PLA composite film . . .
bTG′′(aTω, Tref ) = bTG′′(ω, T) (4)
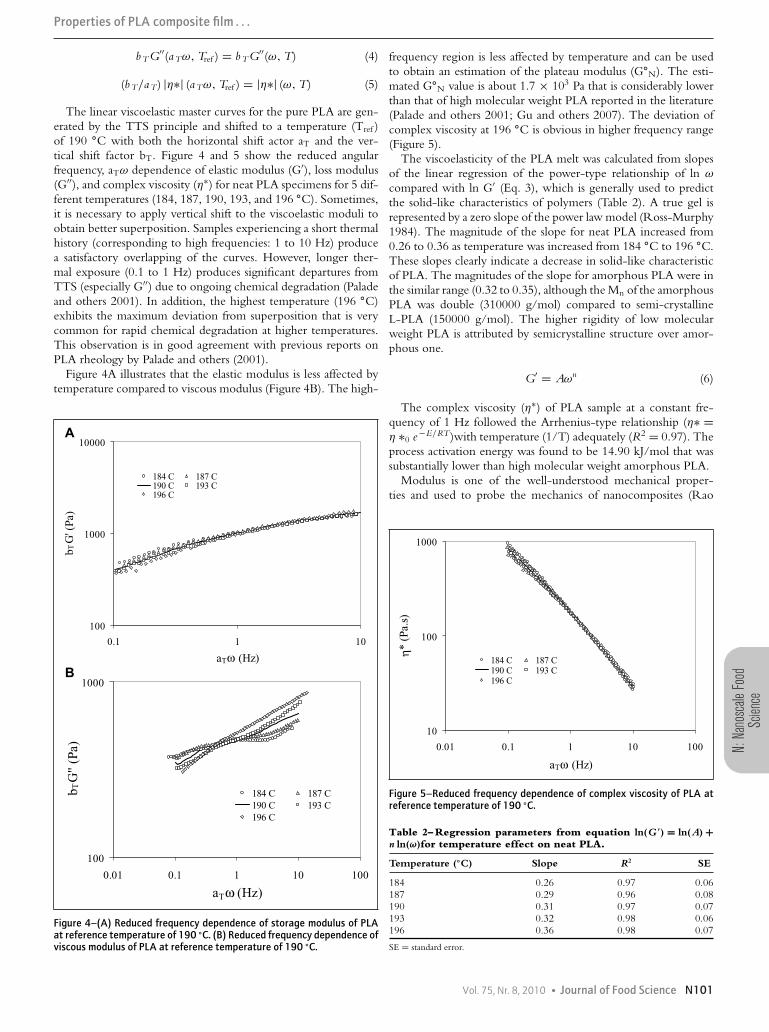
(bT/aT) |η∗| (aTω, Tref ) = |η∗| (ω, T) (5)
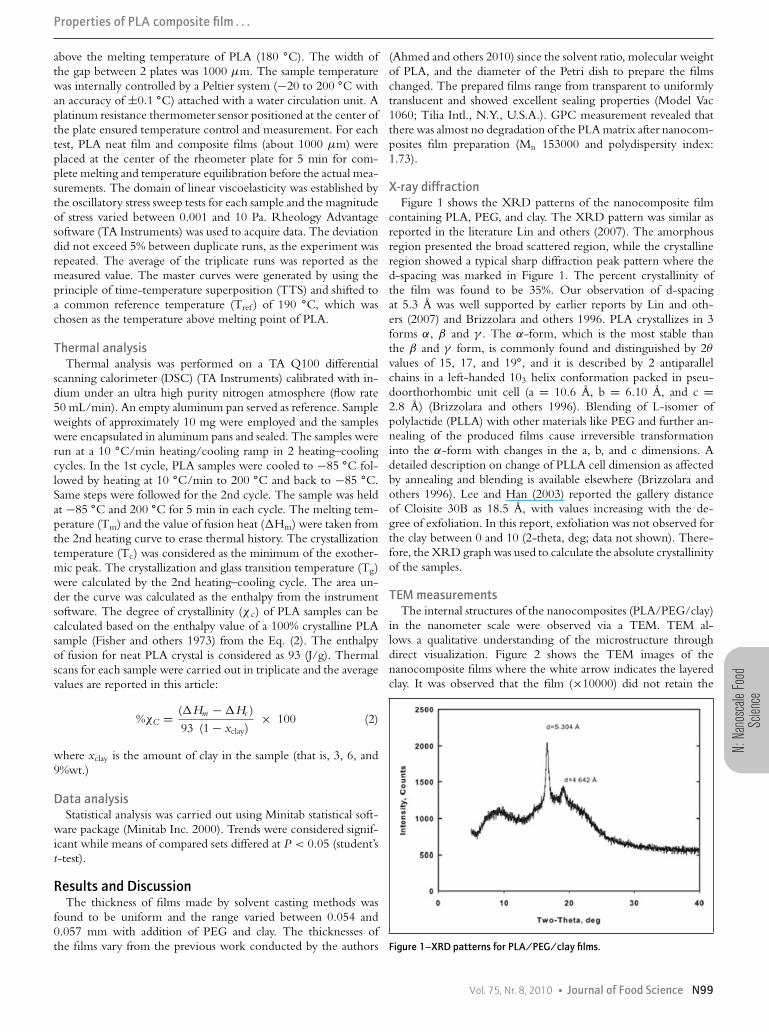
The linear viscoelastic master curves for the pure PLA are gen-erated by the TTS principle and shifted to a temperature (Tref )of 190 ◦C with both the horizontal shift actor aT and the ver-tical shift factor bT. Figure 4 and 5 show the reduced angularfrequency, aTω dependence of elastic modulus (G′), loss modulus(G′′), and complex viscosity (η∗) for neat PLA specimens for 5 dif-ferent temperatures (184, 187, 190, 193, and 196 ◦C). Sometimes,it is necessary to apply vertical shift to the viscoelastic moduli toobtain better superposition. Samples experiencing a short thermalhistory (corresponding to high frequencies: 1 to 10 Hz) producea satisfactory overlapping of the curves. However, longer ther-mal exposure (0.1 to 1 Hz) produces significant departures fromTTS (especially G′′) due to ongoing chemical degradation (Paladeand others 2001). In addition, the highest temperature (196 ◦C)exhibits the maximum deviation from superposition that is verycommon for rapid chemical degradation at higher temperatures.This observation is in good agreement with previous reports onPLA rheology by Palade and others (2001).
Figure 4A illustrates that the elastic modulus is less affected bytemperature compared to viscous modulus (Figure 4B). The high-
Figure 4–(A) Reduced frequency dependence of storage modulus of PLAat reference temperature of 190 ◦C. (B) Reduced frequency dependence ofviscous modulus of PLA at reference temperature of 190 ◦C.
frequency region is less affected by temperature and can be usedto obtain an estimation of the plateau modulus (G◦
N). The esti-mated G◦
N value is about 1.7 × 10³ Pa that is considerably lowerthan that of high molecular weight PLA reported in the literature(Palade and others 2001; Gu and others 2007). The deviation ofcomplex viscosity at 196 ◦C is obvious in higher frequency range(Figure 5).
The viscoelasticity of the PLA melt was calculated from slopesof the linear regression of the power-type relationship of ln ω
compared with ln G′ (Eq. 3), which is generally used to predictthe solid-like characteristics of polymers (Table 2). A true gel isrepresented by a zero slope of the power law model (Ross-Murphy1984). The magnitude of the slope for neat PLA increased from0.26 to 0.36 as temperature was increased from 184 ◦C to 196 ◦C.These slopes clearly indicate a decrease in solid-like characteristicof PLA. The magnitudes of the slope for amorphous PLA were inthe similar range (0.32 to 0.35), although the Mn of the amorphousPLA was double (310000 g/mol) compared to semi-crystallineL-PLA (150000 g/mol). The higher rigidity of low molecularweight PLA is attributed by semicrystalline structure over amor-phous one.
G′ = Aωn (6)
The complex viscosity (η∗) of PLA sample at a constant fre-quency of 1 Hz followed the Arrhenius-type relationship (η∗ =η ∗0 e−E/RT)with temperature (1/T) adequately (R2 = 0.97). Theprocess activation energy was found to be 14.90 kJ/mol that wassubstantially lower than high molecular weight amorphous PLA.
Modulus is one of the well-understood mechanical proper-ties and used to probe the mechanics of nanocomposites (Rao
Figure 5–Reduced frequency dependence of complex viscosity of PLA atreference temperature of 190 ◦C.
Table 2– Regression parameters from equation ln(G ′) = ln(A) +n ln(ω)for temperature effect on neat PLA.
Temperature (◦C) Slope R2 SE
184 0.26 0.97 0.06187 0.29 0.96 0.08190 0.31 0.97 0.07193 0.32 0.98 0.06196 0.36 0.98 0.07
SE = standard error.
Vol. 75, Nr. 8, 2010 � Journal of Food Science N101
N:NanoscaleFood
Science
Properties of PLA composite film . . .
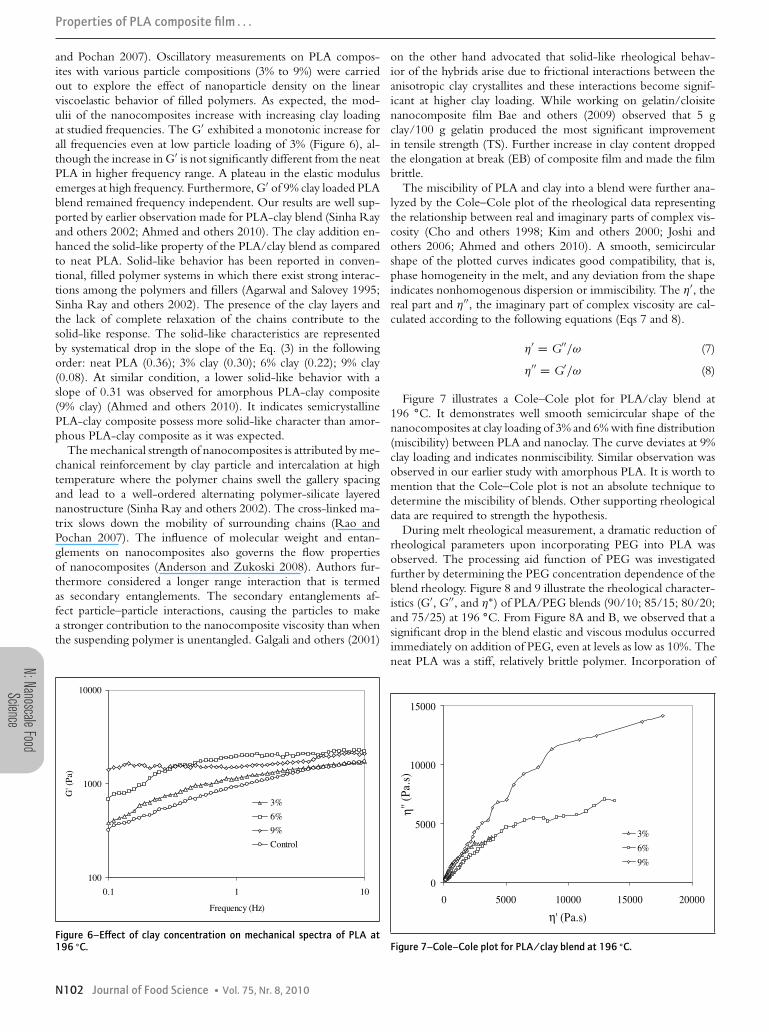
and Pochan 2007). Oscillatory measurements on PLA compos-ites with various particle compositions (3% to 9%) were carriedout to explore the effect of nanoparticle density on the linearviscoelastic behavior of filled polymers. As expected, the mod-ulii of the nanocomposites increase with increasing clay loadingat studied frequencies. The G′ exhibited a monotonic increase forall frequencies even at low particle loading of 3% (Figure 6), al-though the increase in G′ is not significantly different from the neatPLA in higher frequency range. A plateau in the elastic modulusemerges at high frequency. Furthermore, G′ of 9% clay loaded PLAblend remained frequency independent. Our results are well sup-ported by earlier observation made for PLA-clay blend (Sinha Rayand others 2002; Ahmed and others 2010). The clay addition en-hanced the solid-like property of the PLA/clay blend as comparedto neat PLA. Solid-like behavior has been reported in conven-tional, filled polymer systems in which there exist strong interac-tions among the polymers and fillers (Agarwal and Salovey 1995;Sinha Ray and others 2002). The presence of the clay layers andthe lack of complete relaxation of the chains contribute to thesolid-like response. The solid-like characteristics are representedby systematical drop in the slope of the Eq. (3) in the followingorder: neat PLA (0.36); 3% clay (0.30); 6% clay (0.22); 9% clay(0.08). At similar condition, a lower solid-like behavior with aslope of 0.31 was observed for amorphous PLA-clay composite(9% clay) (Ahmed and others 2010). It indicates semicrystallinePLA-clay composite possess more solid-like character than amor-phous PLA-clay composite as it was expected.
The mechanical strength of nanocomposites is attributed by me-chanical reinforcement by clay particle and intercalation at hightemperature where the polymer chains swell the gallery spacingand lead to a well-ordered alternating polymer-silicate layerednanostructure (Sinha Ray and others 2002). The cross-linked ma-trix slows down the mobility of surrounding chains (Rao andPochan 2007). The influence of molecular weight and entan-glements on nanocomposites also governs the flow propertiesof nanocomposites (Anderson and Zukoski 2008). Authors fur-thermore considered a longer range interaction that is termedas secondary entanglements. The secondary entanglements af-fect particle–particle interactions, causing the particles to makea stronger contribution to the nanocomposite viscosity than whenthe suspending polymer is unentangled. Galgali and others (2001)
Figure 6–Effect of clay concentration on mechanical spectra of PLA at196 ◦C.
on the other hand advocated that solid-like rheological behav-ior of the hybrids arise due to frictional interactions between theanisotropic clay crystallites and these interactions become signif-icant at higher clay loading. While working on gelatin/cloisitenanocomposite film Bae and others (2009) observed that 5 gclay/100 g gelatin produced the most significant improvementin tensile strength (TS). Further increase in clay content droppedthe elongation at break (EB) of composite film and made the filmbrittle.
The miscibility of PLA and clay into a blend were further ana-lyzed by the Cole–Cole plot of the rheological data representingthe relationship between real and imaginary parts of complex vis-cosity (Cho and others 1998; Kim and others 2000; Joshi andothers 2006; Ahmed and others 2010). A smooth, semicircularshape of the plotted curves indicates good compatibility, that is,phase homogeneity in the melt, and any deviation from the shapeindicates nonhomogenous dispersion or immiscibility. The η′, thereal part and η′′, the imaginary part of complex viscosity are cal-culated according to the following equations (Eqs 7 and 8).
η′ = G′′/ω (7)
η′′ = G′/ω (8)
Figure 7 illustrates a Cole–Cole plot for PLA/clay blend at196 ◦C. It demonstrates well smooth semicircular shape of thenanocomposites at clay loading of 3% and 6% with fine distribution(miscibility) between PLA and nanoclay. The curve deviates at 9%clay loading and indicates nonmiscibility. Similar observation wasobserved in our earlier study with amorphous PLA. It is worth tomention that the Cole–Cole plot is not an absolute technique todetermine the miscibility of blends. Other supporting rheologicaldata are required to strength the hypothesis.
During melt rheological measurement, a dramatic reduction ofrheological parameters upon incorporating PEG into PLA wasobserved. The processing aid function of PEG was investigatedfurther by determining the PEG concentration dependence of theblend rheology. Figure 8 and 9 illustrate the rheological character-istics (G′, G′′, and η∗) of PLA/PEG blends (90/10; 85/15; 80/20;and 75/25) at 196 ◦C. From Figure 8A and B, we observed that asignificant drop in the blend elastic and viscous modulus occurredimmediately on addition of PEG, even at levels as low as 10%. Theneat PLA was a stiff, relatively brittle polymer. Incorporation of
Figure 7–Cole–Cole plot for PLA/clay blend at 196 ◦C.
N102 Journal of Food Science � Vol. 75, Nr. 8, 2010

N:Na
nosc
ale
Food
Scie
nce
Properties of PLA composite film . . .
PEG into PLA improved the ductility dramatically. In comparisonwith neat PLA, G′, and η∗ of the blend with 10% PEG loweredto almost 2 log cycles of original value. When blending polymerswith PEG, several factors play significant role in order to obtain ablend with useful properties: PEG-clay interaction, PEG concen-tration and molecular weight (Zhang and Archer 2002), hydrogen
Figure 8–(A) Effect of PEG incorporation on elastic modulus of PLA/PEGblend. (B) Effect of PEG incorporation on viscous modulus of PLA/PEGblend.
0.1
1
10
100
1000
0111.0Frequency (Hz)
η* (
Pa.s
)
10% 15%20% 25%Control
Figure 9–Effect of PEG incorporation on complex viscosity of PLA/PEGblend.
bonding (Rubio and Kitchener 1976), and radius of gyration. Thepolymer-particle interactions are the most important determinantof rheological property enhancement for PEO-silica nanocom-posites in the melt state (Zhang and Archer 2002). Furthermore,the free volume of the system increased with increase of PEG andtherefore, the internal friction of molecules were decreased andmelt viscosity significantly decreased. Definitely, the blend exhibitslower toughness but at the same time enhances flexibility in theblend that is desired for making a film.
Mechanical spectra of PLA/PEG/clay (74/20/6) blend(Figure 10 and 11 and Table 3) exhibited the flexibility of thefilm. The G′, G′′, and η∗ reduced significantly to about 13%,61%, and 28%, respectively, in comparison to neat PLA, whereasincorporation of clay into PLA/PEG enhanced the value signifi-cantly higher level (25 to 50 times) than that of PLA/PEG blend.The G′′ exhibited higher magnitude over G′ throughout the fre-quency range and, hence, confirming more liquid-like properties.The slope of the plot ln G′ compared with ln ω (Eq. 3) increasedsignificantly from 0.64 to 0.81 as temperature was increased from190 to 196 ◦C (Table 3). Similar trend was noticed in our earlierstudy with amorphous PLA (Ahmed and others 2010). The blendrepresents a complex system where both plasticizing and antiplas-ticizing effects were attributed by PEG and clay, respectively, andaffect the rheological behavior (Ahmed and others 2010). The vis-coelastic behavior of the blend is believed to be attributed by PEG
Figure 10–(A) Elastic modulus of PLA/PEG/clay blend as function oftemperature. (B) Viscous modulus of PLA/PEG/clay blend as function oftemperature.
Vol. 75, Nr. 8, 2010 � Journal of Food Science N103

N:NanoscaleFood
Science
Properties of PLA composite film . . .
and clay that individually has plasticizing and mechanical strength-ening characteristics, respectively. The η∗ of PLA/PEG/clay blendwas decreased as function of frequency and temperature as shownin Figure 11. The Arrhenius plot (ln η∗ compared with 1/T) re-sulted a process activation energy of 716 kJ/mol (Figure 12) forthe blend.
Incorporation of the PEG on the rheological characteristics ofthe PLA/PEG and PLA/PEG/clay blends over neat PLA has beenwell described by a plot of G′ compared with G′′, Cole–Cole plot(Figure 13). A Cole–Cole plot provides information on elastic andviscous properties at low frequencies where linear viscoelastic dataare most sensitive to differences in structure (Lin and others 2007).The intersection (G′ = G′′) determines the transition between
Figure 11–Complex viscosity of PLA/PEG/clay blend as function oftemperature.
Table 3– Regression parameters from equation ln(G ′) = ln A +n ln(ω)for PLA/PEG/clay blends.
Sample Slope R2 SE
190 0.64 0.99 0.03192 0.67 0.99 0.06194 0.74 0.99 0.09196 0.81 0.99 0.10
SE = standard error.
Figure 12–Temperature dependency of complex viscosity forPLA/PEG/clay blend.
viscous and elastic behavior of the blend. It can be seen fromthe figure that neat PLA exhibited a solid-like behavior (abovethe intersection line) and blends (PLA/PEG and PLA/PEG/clay)shifted to liquid-like behaviors due to plasticization effect of PEGas supported by TEM images. Nanocomposites (PLA/PEG/clay)slightly improved its solid-like behavior with addition of clay andshowed an intermediate behavior, however, still remain predomi-nating liquid-like property. A similar trend has been observed byLin and others (2007) for PLA/poly (ester amide) blend.
Thermal analysisThermal analysis of PLA and its blends has of great techno-
logical importance in flexible food packaging. The used PLA isa L-isomer and, therefore, semicrystalline in nature. For the neatPLA, the glass transition temperature (Tg), melting temperature(Tm), and crystallization temperatures (Tc) were 61.4, 179.9, and99.8 ◦C, respectively. The Tg was relatively higher than that ofhigh molecular weight amorphous PLA (54 ◦C) we studied ear-lier (Ahmed and others 2010). Incorporation of clay into PLA(97/3; 94/6; and 91/9) did not affect the Tg significantly, al-though Tg dropped insignificantly at higher clay loading (Table 4).The melting (Tm) and crystallization temperature (Tc) of neat PLAchanged insignificantly with addition of clay. The melting enthalpydecreased from 47 J/g to 30 J/g, whereas crystallization enthalpyslightly increased from 8 J/g to 12 J/g. Similar DSC observa-tions of PLA and PLA/zeolite composites were reported by Yuzayand others (2010). Rao and Pochan (2007) have studied polymer-nanocomposite mobility by dynamic mechanical thermal analyzer(DMTA) and dielectric thermal analyzer (DETA) and advocatedthat a significant portion of polymer chains become immobi-lized in the clay nanocomposites. Our observation is very similarto thermal behavior reported by Paul and others (2003) wherethose authors explained the clay-polymer interaction by the rela-tive extent of exfoliation/delamination as function of the amountof organo-clay via TGA analysis. At lower clay concentration,exfoliation dominates whereas the amount of exfoliated silicatelayers is not sufficient enough to enhance the thermal stabilityof the nanocomposites. On the contrary, presence of higher fillercontent leads to relatively more exfoliated individual particles andincreases the thermal stability and a critical concentration levelis finally achieved. The critical limit varies between 3% and 6%
Figure 13–Elastic compared with viscous modulus of PLA, PLA/PEG, andPLA/PEG/clay blend at 192 ◦C.
N104 Journal of Food Science � Vol. 75, Nr. 8, 2010
N:Na
nosc
ale
Food
Scie
nce
Properties of PLA composite film . . .
and it depends upon the free volume, polymer-clay interaction,exfoliation, and space available in the polymer matrix. Above crit-ical limit, the filler concentration is expected to complete theexfoliation process but faces more hindrance due to geometricalconstraints within the limited space resulting depletion of thermalstability.
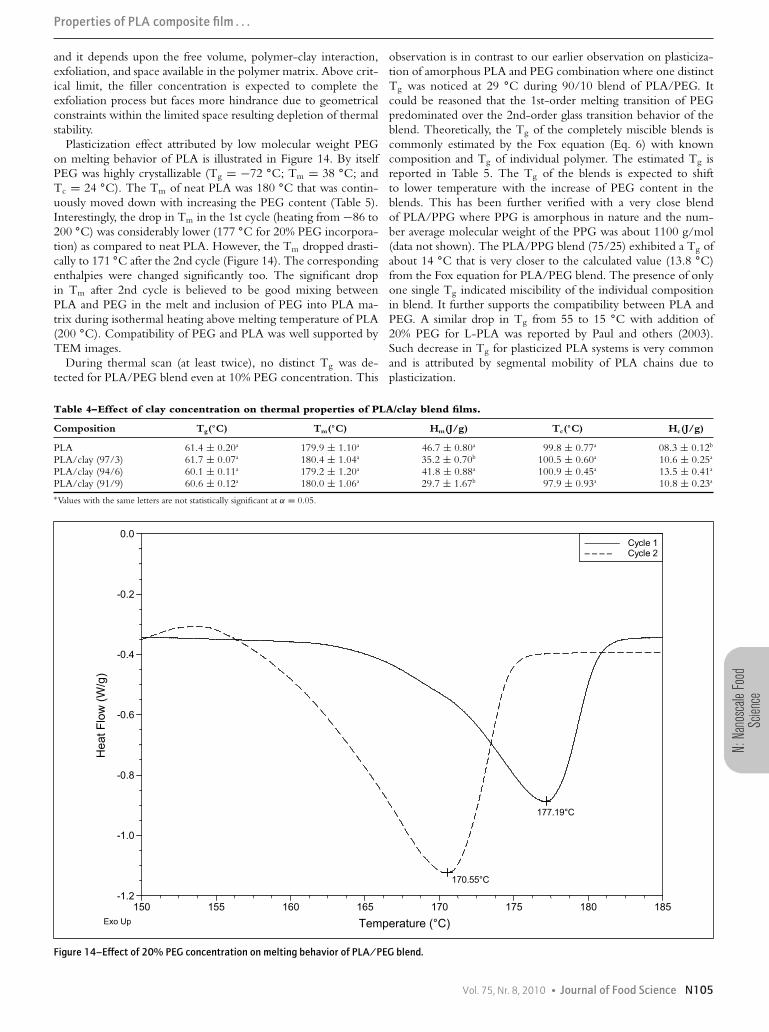
Plasticization effect attributed by low molecular weight PEGon melting behavior of PLA is illustrated in Figure 14. By itselfPEG was highly crystallizable (Tg = −72 ◦C; Tm = 38 ◦C; andTc = 24 ◦C). The Tm of neat PLA was 180 ◦C that was contin-uously moved down with increasing the PEG content (Table 5).Interestingly, the drop in Tm in the 1st cycle (heating from −86 to200 ◦C) was considerably lower (177 ◦C for 20% PEG incorpora-tion) as compared to neat PLA. However, the Tm dropped drasti-cally to 171 ◦C after the 2nd cycle (Figure 14). The correspondingenthalpies were changed significantly too. The significant dropin Tm after 2nd cycle is believed to be good mixing betweenPLA and PEG in the melt and inclusion of PEG into PLA ma-trix during isothermal heating above melting temperature of PLA(200 ◦C). Compatibility of PEG and PLA was well supported byTEM images.
During thermal scan (at least twice), no distinct Tg was de-tected for PLA/PEG blend even at 10% PEG concentration. This
observation is in contrast to our earlier observation on plasticiza-tion of amorphous PLA and PEG combination where one distinctTg was noticed at 29 ◦C during 90/10 blend of PLA/PEG. Itcould be reasoned that the 1st-order melting transition of PEGpredominated over the 2nd-order glass transition behavior of theblend. Theoretically, the Tg of the completely miscible blends iscommonly estimated by the Fox equation (Eq. 6) with knowncomposition and Tg of individual polymer. The estimated Tg isreported in Table 5. The Tg of the blends is expected to shiftto lower temperature with the increase of PEG content in theblends. This has been further verified with a very close blendof PLA/PPG where PPG is amorphous in nature and the num-ber average molecular weight of the PPG was about 1100 g/mol(data not shown). The PLA/PPG blend (75/25) exhibited a Tg ofabout 14 ◦C that is very closer to the calculated value (13.8 ◦C)from the Fox equation for PLA/PEG blend. The presence of onlyone single Tg indicated miscibility of the individual compositionin blend. It further supports the compatibility between PLA andPEG. A similar drop in Tg from 55 to 15 ◦C with addition of20% PEG for L-PLA was reported by Paul and others (2003).Such decrease in Tg for plasticized PLA systems is very commonand is attributed by segmental mobility of PLA chains due toplasticization.
Table 4–Effect of clay concentration on thermal properties of PLA/clay blend films.
Composition Tg(◦C) Tm(◦C) Hm(J/g) Tc(◦C) Hc(J/g)
PLA 61.4 ± 0.20a 179.9 ± 1.10a 46.7 ± 0.80a 99.8 ± 0.77a 08.3 ± 0.12b
PLA/clay (97/3) 61.7 ± 0.07a 180.4 ± 1.04a 35.2 ± 0.70b 100.5 ± 0.60a 10.6 ± 0.25a
PLA/clay (94/6) 60.1 ± 0.11a 179.2 ± 1.20a 41.8 ± 0.88a 100.9 ± 0.45a 13.5 ± 0.41a
PLA/clay (91/9) 60.6 ± 0.12a 180.0 ± 1.06a 29.7 ± 1.67b 97.9 ± 0.93a 10.8 ± 0.23a
∗Values with the same letters are not statistically significant at α = 0.05.
Figure 14–Effect of 20% PEG concentration on melting behavior of PLA/PEG blend.
Vol. 75, Nr. 8, 2010 � Journal of Food Science N105

N:NanoscaleFood
Science
Properties of PLA composite film . . .
1Tg b
= W1
Tg 1+ W2
Tg 2(9)
where W 1 and W 2 are weight fractions and Tg1 and Tg2 arecorresponding glass transition temperatures for PLA and PEG,respectively.
The influence of PEG on crystallization behavior of PLA/PEGblend is presented in Figure 15 and Table 5. From the data listed inthe table, it was observed that the crystallization temperature (Tc)of PLA increased significantly as incorporation of PEG. The Tc
for the neat PLA increased from 99.8 to 113.5 ◦C with increaseof PEG concentration, although the Tc decreased insignificantlyabove 20% PEG concentration. The drop in Tc could be attributedby the dilution effect of PEG. The Tm of PEG remained constantat 37 ◦C while Tc varied between 15 and 20 ◦C. The drop inmagnitude of Tc of neat PEG could be affected by PLA/PEGblending. The �Hm and �Hc of PLA showed an increase with
increasing concentration of PEG (except 80/20 blend) and simul-taneously �Hm and �Hc of PEG decreased proportionately. Itindicates PEG enhanced crystallinity in the blend.
DSC data of PLA/PEG/clay blends (74/20/6) are presentedin Table 5 and compared with PLA/PEG (80/20) blend inFigure 16. Interestingly, the Tm insignificantly increased from170.4 to 171.9 ◦C when clay was incorporated in the blend andPLA decreased by 6%. However, there was no effect on Tc. Theglass transition temperature for the blend was not distinct as dis-cussed earlier. The compatibility between PEG and clay into PLAremained a key issue in determining plasticizing/antiplasticizingeffect on the blend. The morphological studies (TEM) indicatedthat clay remained in the cluster form whereas PEG intimatelyblended in PLA matrix and therefore, compatibility of clay re-mained an issue in the solvent casting technique. Earlier it wasreported also that the intercalation of plasticized PLA chains doesnot improve with continuous increase in PEG content and the
Table 5–Thermal analysis data for various blends of PLA films.
PLA PEG∗∗
Tg(◦C)Sample Tg(◦C) Fox eqn Tm(◦C) Hm(J/g) Tc(◦C) Hc(J/g) Tm(◦C) Hm(J/g) Tc(◦C) Hc(J/g)
PLA 61.4 ± 0.20a 179.9 ± 1.10a 46.7 ± 0.80a 99.8 ± 0.77a 08.3 ± 0.12b
PEG 37.9 ± 0.17a 148.4 ± 1.23b 25.9 ± 0.76b 136.9 ± 1.37b
PLA/PEG (90/10) 35.8 ± 0.70b 40.6 175.8 ± 1.21a 48.0 ± 1.18a 101.1 ± 0.89a 33.9 ± 0.55a
PLA/PEG (85/15) ∗ 31.1 173.6 ± 1.22b 48.4 ± 1.20a 108.2 ± 1.47b 35.2 ± 0.33a 37.0 ± 0.70a 0.80 ± 0.30a 13.8 ± 0.57a 1.9 ± 0.11a
PLA/PEG (80/20) ∗ 22.2 170.3 ± 1.10b 44.1 ± 0.80a 113.5 ± 0.77b 33.7 ± 0.12a 37.1 ± 1.10a 0.80 ± 0.80a 20.3 ± 0.87b 4.2 ± 0.22a
PLA/PEG (75/25) ∗ 13.8 169.8 ± 1.10b 62.5 ± 0.80b 107.2 ± 1.17b 39.7 ± 0.67a 36.4 ± 1.10a 31.7 ± 0.80b 19.5 ± 1.22a 22.1 ± 1.35b
PLA/PEG/Clay ∗ - 177.1 ± 1.10a 16.3 ± 1.10b 111.3 ± 1.77b 28.3 ± 1.12b 30.1 ± 1.15b 0.80 ± 0.51a 15.7 ± 1.22a 2.50 ± 0.09a
(74/20//6)
Values with the same letters are not statistically significant at α = 0.05.∗Tg not distinct; ∗∗Tg of PEG = −71.55 ◦C not distinct and not reported.
Figure 15–Effect of PEG concentration on crystallization behavior of PLA.
N106 Journal of Food Science � Vol. 75, Nr. 8, 2010

N:Na
nosc
ale
Food
Scie
nce
Properties of PLA composite film . . .
Figure 16–Thermograms for PLA/PEG (80/20) and PLA/PEG/clay (74/20/6) blends.
clay interlayer distance remained constant (Paul and others 2003).It infers that the intercalation is not solely contributed by PEG,whereas PLA also intrudes into the interlayer space of the clay. Inaddition, PEG has not been intercalated into the interlayer space ofthe clay compared to the PLA, or at least that the affinity betweenthe silicates layers surface and PEG is not sufficient to force themajority of the plasticizer to intercalate into the clay (Paul and oth-ers 2003). The crystallinity of the blend decreased from the neatPLA 41.5% to 6.5% and 4.7% for PLA/PEG and PLA/PEG/clay,respectively. This observation is significantly lower than that ofX-ray diffractrogram. Similar drop in crystallinity (37% to 5%)with addition of zeolite to PLA has been reported in the literature(Yuzay and others 2010).
ConclusionsThe present work described a comprehensive study on the melt
rheological properties of PLAs (L-form) and furthermore, on plas-ticized PLA nanoclay composite films. The PLA sample exhibitedsolid-like property with predominantly higher G′ in the melt. Theviscoelasticity of PLA melt was increased as temperature increasedbeyond melting temperature. Montmormorillonite clay incorpo-ration into PLA improves mechanical property (G′) with effectiveintercalation at higher temperature. A Cole–Cole plot (G′ com-pared with G′′) effectively indicated the gradual transition fromsolid-like property of PLA melt to liquid-like property by ade-quate plasticization by poly (ethylene glycol) incorporation. DSCperformed on composites containing increasing levels of clay andPEG. Results indicated that clay did not affect thermal proper-ties significantly due to immobilization of polymer chain whereasPEG acts as an effective plasticizer and dramatically reduced rhe-
ological parameters in the blends. Well miscibility of PEG ontoPLA and poor dispersion of clay in the blend were evidencedby TEM measurement. This work demonstrates the role of in-gredients on rheological and thermal properties that would helpbetter understanding and design of various process equipments forfilm/nanocomposite manufacturing.
ReferencesAgarwal S, Salovey R. 1995. Model filled polymers. XV: the effects of chemical interactions and
matrix molecular weight on rheology. Polym Eng Sci 35:1241–51.Ahmed J, Jhang XJ, Song J, Varhney SK. 2009. Thermal characteristics of polylactides. J Ther
Anal Calorim 95:957–64.Ahmed J, Varhney SK, Auras R. 2010. Rheological and thermal properties of polylactide/silicate
nanocomposites films. J Food Sci 75:N17–N24.Akcora P, Kumar SK, Moll J, Lewis S, Schadler LS, Li Y, Benicewicz BC, Sandy A, Narayanan
S, Ilavsky J, Thiyagrajan P, Colby RH, Douglas J. 2010. Gel-like mechanical enforcement inpolymer nanocomposite melts. Macromol 43:1003–10.
Anderson BJ, Zukoski CF. 2008. Thermodynamics of polymer-clay nanocomposites revisited:rheology and microstructure of an unentangled polymer nanocomposite melt. Macromol41:9326–34.
Angellier H, Molina-Boisseau S, Lebrun L, Dufresne A. 2005. Processing and structural prop-erties of waxy maize starch nanocrystals reinforced natural rubber. Macromol 38:3783–92.
Bae HJ, Park H, Hong SI, Byun YJ, Darby DO, Kimmel RM. 2009. Effect of clay content,homogenization rpm, pH and ultrasonication on mechanical and barrier properties of fishgelatin/montmorillonite nanocomposite films. lwt-Food Sci Technol 42:1179–86.
Brizzolara D, Cantow HJ, Diederichs K, Keller E, Domb AJ. 1996. Mechanism of the stereo-complex formation between enantiomeric poly(lactide)s. Macromol 29:191–7.
Cho K, Lee BH, Hwang KM, Lee H, Choe S. 1998. Rheological and mechanical properties inpolyethylene blends. Polym Eng Sci 38:1969–75.
Conn RE, Kolstad JJ, Borzellecea JF, Dixler DS, Filer Jr LJ, LaDu Jr BN, Pariza MW. 1995.Safety assessment of polylactide (PLA) for use as a food-contact polymer. Fd Chem Toxic33:273–83.
Fisher EW, Sterzel HJ, Wegner G. 1973. Kolloid Z. Z. Polym 25:980–82.Galgali G, Ramesh C, Lele A. 2001. A rheological study on the kinetics of hybrid formation in
polypropylene nanocomposites. Macromol 34:852–9.Ginzburg VV, Weinhold JD, Jog PK, Srivastava R. 2009. Thermodynamics of polymer-
clay nanocomposites revisited: compressible self-consistent field theory modeling of melt-Intercalated organoclays. Macromol 42:9089–95.
Gu SY, Ren J, Dong B. 2007. Melt rheology of polylactide/montmorillonite nanocomposite. JPoly Sci: Part B: Poly Phys 45:3189–96.
Vol. 75, Nr. 8, 2010 � Journal of Food Science N107

N:NanoscaleFood
Science
Properties of PLA composite film . . .
Jin T, Zhang H. 2008. Biodegradable polylactic acid polymer with nisin for use in antimicrobialfood packaging. J Food Sci 73(3):M127–34.
Joshi M, Butola BS, Simon G, Kukaleva N. 2006. Rheological and viscoelastic behavior ofHDPE/Octamethyl-POSS nanocomposite. Macromol 39:1839–49.
Kim LH, Rana D, Kwag H, Choe S. 2000. Melt rheology of ethylene 1-octene copolymerblends synthesized by Ziegler-Natta and metallocene catalysts. Korea Polym J 8:34–43.
Lee KH, Han CD. 2003. Rheology of organoclay nanocomposites: effects of polymer ma-trix/organoclay compatibility and the gallery distance of organoclay. Macromol 36:7165–78.
Lin Y, Zhang K, Dong ZM, Dong LS, Li YS. 2007. Study of hydrogen-bonded blendof polylactide with biodegradable hyperbranched poly(ester amide). Macromol 40:6257–67.
Mackay ME, Tuteja A, Duxbury PM, Hawker CJ, Van Horn B, Guan Z, Chen G, KrishnanRS. 2006. General strategies for nanoparticle dispersion. Sci 311:1740–43.
Palade LI, Lehermeier HJ, Dorgan JR. 2001. Melt rheology of high L-content poly(lactic acid).Macromol 34:1384–90.
Paul MA, Alexandre M, Degee P, Henrist C, Rulmont A, Dubois O. 2003. New nanocompositematerials based on palsticized poly(L-lactide) and organo-modified montmorillonites: thermaland morphological study. Polymer 44:443–50.
Pyda M. 2004. In: Lorinczy D, editor. The nature of biological systems as revealed by thermalmethods. Amsterdam: Kluwer Academic Publisher.
Rao YQ, Pochan JM. 2007. Mechanics of polymer-clay nanaocomposites. Macromol 40:290–96.
Ross-Murphy SB. 1984. Rheological methods. In: Chan HWS, editor. Critical Reports on Ap-plied Chemistry, Vol. 5. Biophysical Methods in Food Research. Oxford: Blackwell Scientific.p 138–199.
Rubio J, Kitchener JA. 1976. The mechanism of adsorption of poly(ethylene oxide) flocculanton silica. Colloid Interface Sci 57:132–42.
Sinha Ray S, Maiti P, Okamoto M, Yamada K, Ueda K. 2002. New polylactide/layeredsilicate nanocomposites. 1. Preparation, characterization and properties. Macromol 35:3104–10.
Sinha Ray S, Okamoto M. 2003. New polylactide/layered silicate nanocomposites, melt rheologyand foam processing. Macromol Mater Eng 288:936–44.
Thakur KAM, Kean RTT, Zupfer JM, Buehler NU. 1996. Solid sate 13C CP-MASNMR studies of the crystallinity and morphology of poly(l-lactide). Macromol 29:8844–51.
Treece MA, Oberhauser. 2007. Soft glassy dynamics in polypropylene-clay nanocomposites.Macromol 40:571–82.
Tsuji H, Ikada Y. 1995. Properties and morphologies of poly(L-lactide): 1. Annealing conditioneffects on properties and morphologies of poly(L-lactide). Polymer 36:2709–15.
Yuzay IE, Auras R, Selke S. 2010. Poly(lactic acid) and zeolite composites prepared by meltprocessing: morphological and physical-mechanical properties. J App Poly Sci 115:2262–70.
Zhang Q, Archer LA. 2002. Poly(ethylene oxide)/silica nanocomposites: structure and rheology.Langmuir 18:10435–42.
N108 Journal of Food Science � Vol. 75, Nr. 8, 2010
Copyright © 2022 FDOKUMEN