Modelling of the chemo-rheological behavior of thermosetting polymer nanocomposites
12
Modelling of the Chemo–Rheological Behavior of Thermosetting Polymer Nanocomposites Govanni Lelli, Andrea Terenzi, Jose M. Kenny, Luigi Torre Department of Civil and Environmental Engineering, University of Perugia, Loc. Pentima Bassa, 21, 05100 Terni, Italy Epoxy/amine/montmorillonite nanocomposite systems are studied in this article. Both a thermo2kinetic analy- sis (performed using a differential scanning calorime- ter) and a chemorheological characterization were car- ried out. The comparison of DSC thermograms has shown that the addition the nanofiller does not change the mechanism of crosslinking from a qualitative standpoint, but the nanoreinforcement seemed to pro- duce an evident hindrance on the molecular mobility, which in turn influences the cure reactions. As none of the kinetic models available in literature was able to describe the cure behavior of the aforementioned materials, a new phenomenological model is proposed in this work, which considers the activation energy of the networking process a function of the degree of cure (rising exponentially towards infinity when the system approaches vitrification). The effects of the presence of the clay on the chemorheology of the composites was resumed as follows: the viscosity of the nanocomposite was higher at any temperature, fur- thermore the composite viscosity showed an higher heating sensitivity before networking and gelation occurred at lower degrees of cure, thus determining a narrower shape of the chemoviscosity behavior. A modified version of the classical Williams–Landel–Ferry (WLF) equation that took into account the gelation and the effects of crosslinking was uses as chemorheologi- cal model. Once the characteristic parameters of both the neat resin and the nanocomposite were found, the chemoviscosity models were integrated using a numer- ical algorithm, to check their ability to foresee the behavior of the systems during a dynamic cure pro- cess. A very good correspondence between the results and the experimental data was obtained. POLYM. COMPOS., 30:1–12, 2009. ª 2008 Society of Plastics Engineers INTRODUCTION The increased interest towards polymer/clay nanocom- posites can be ascribed not only to the chance they offer to get a noticeable improvement of mechanical, physical, and chemical properties with small amounts of nanorein- forcement, but also to the fact that the processing behav- ior of the composite material is quite similar to that of the neat matrix. Nonetheless, the interaction at a nano- scale level between an organic and an inorganic phase determines the need for a slight modification of process parameters, independently from the nature (i.e., either thermoplastic or thermosetting) of the polymeric matrix. In particular, in the case of thermosetting nanocompo- sites, the chemical reactions taking place during the cure process affect resin morphology, which in turn determines the behavior of the cured system. For this reason, the relationships between processing, morphology, and prop- erties of a wide range of epoxy systems have been deeply investigated [1, 2] in the last few years. Such researches pointed out that a deep understanding of curing mecha- nisms and cure kinetics is the key for obtaining an opti- mal cure, which allows one to model the reaction proc- esses as accurately as possible. In this framework, the elaboration of an appropriate kinetic equation is of funda- mental importance. As the behavior of a thermosetting polymer is strongly affected by the curing process, poorly controlled cure can produce unexpected variations in the thermal and rheological properties of the system during the manufacturing processes and of the final product. Therefore, an accurate model not only allows to monitor the evolution of the curing system (to plan and/or to con- trol single processes), but it can also be used for material design, to compare the behavior of different formulations. Although several studies have been carried out on the modeling of the kinetic behavior of thermosetting resins, the wide variety of resin formulations available, implies a continuous study and introduces new experimental diffi- culties and complexities. Moreover, switching to nano- composites, introduces a further variable in the complex- ity of the modelling problem, as the effects of the nanofil- lers and the compatibilizer somehow affect the reaction kinetics. A better way to assure high quality and low manufac- turing cost of the products is to create mathematical mod- els of the different processing stages. In the last decade, several studies focused on the analysis of the fundamental Correspondence to: Luigi Torre; e-mail: [email protected] DOI 10.1002/pc.20517 Published online in Wiley InterScience (www.interscience.wiley.com). V V C 2008 Society of Plastics Engineers POLYMERCOMPOSITES—-2009
Transcript of Modelling of the chemo-rheological behavior of thermosetting polymer nanocomposites

Modelling of the Chemo–Rheological Behavior ofThermosetting Polymer Nanocomposites
Govanni Lelli, Andrea Terenzi, Jose M. Kenny, Luigi TorreDepartment of Civil and Environmental Engineering, University of Perugia,Loc. Pentima Bassa, 21, 05100 Terni, Italy
Epoxy/amine/montmorillonite nanocomposite systemsare studied in this article. Both a thermo2kinetic analy-sis (performed using a differential scanning calorime-ter) and a chemorheological characterization were car-ried out. The comparison of DSC thermograms hasshown that the addition the nanofiller does not changethe mechanism of crosslinking from a qualitativestandpoint, but the nanoreinforcement seemed to pro-duce an evident hindrance on the molecular mobility,which in turn influences the cure reactions. As none ofthe kinetic models available in literature was able todescribe the cure behavior of the aforementionedmaterials, a new phenomenological model is proposedin this work, which considers the activation energy ofthe networking process a function of the degree ofcure (rising exponentially towards infinity whenthe system approaches vitrification). The effects of thepresence of the clay on the chemorheology of thecomposites was resumed as follows: the viscosity ofthe nanocomposite was higher at any temperature, fur-thermore the composite viscosity showed an higherheating sensitivity before networking and gelationoccurred at lower degrees of cure, thus determining anarrower shape of the chemoviscosity behavior. Amodified version of the classical Williams–Landel–Ferry(WLF) equation that took into account the gelation andthe effects of crosslinking was uses as chemorheologi-cal model. Once the characteristic parameters of boththe neat resin and the nanocomposite were found, thechemoviscosity models were integrated using a numer-ical algorithm, to check their ability to foresee thebehavior of the systems during a dynamic cure pro-cess. A very good correspondence between the resultsand the experimental data was obtained. POLYM.COMPOS., 30:1–12, 2009. ª 2008 Society of Plastics Engineers
INTRODUCTION
The increased interest towards polymer/clay nanocom-
posites can be ascribed not only to the chance they offer
to get a noticeable improvement of mechanical, physical,
and chemical properties with small amounts of nanorein-
forcement, but also to the fact that the processing behav-
ior of the composite material is quite similar to that of
the neat matrix. Nonetheless, the interaction at a nano-
scale level between an organic and an inorganic phase
determines the need for a slight modification of process
parameters, independently from the nature (i.e., either
thermoplastic or thermosetting) of the polymeric matrix.
In particular, in the case of thermosetting nanocompo-
sites, the chemical reactions taking place during the cure
process affect resin morphology, which in turn determines
the behavior of the cured system. For this reason, the
relationships between processing, morphology, and prop-
erties of a wide range of epoxy systems have been deeply
investigated [1, 2] in the last few years. Such researches
pointed out that a deep understanding of curing mecha-
nisms and cure kinetics is the key for obtaining an opti-
mal cure, which allows one to model the reaction proc-
esses as accurately as possible. In this framework, the
elaboration of an appropriate kinetic equation is of funda-
mental importance. As the behavior of a thermosetting
polymer is strongly affected by the curing process, poorly
controlled cure can produce unexpected variations in the
thermal and rheological properties of the system during
the manufacturing processes and of the final product.
Therefore, an accurate model not only allows to monitor
the evolution of the curing system (to plan and/or to con-
trol single processes), but it can also be used for material
design, to compare the behavior of different formulations.
Although several studies have been carried out on the
modeling of the kinetic behavior of thermosetting resins,
the wide variety of resin formulations available, implies a
continuous study and introduces new experimental diffi-
culties and complexities. Moreover, switching to nano-
composites, introduces a further variable in the complex-
ity of the modelling problem, as the effects of the nanofil-
lers and the compatibilizer somehow affect the reaction
kinetics.
A better way to assure high quality and low manufac-
turing cost of the products is to create mathematical mod-
els of the different processing stages. In the last decade,
several studies focused on the analysis of the fundamental
Correspondence to: Luigi Torre; e-mail: [email protected]
DOI 10.1002/pc.20517
Published online in Wiley InterScience (www.interscience.wiley.com).
VVC 2008 Society of Plastics Engineers
POLYMER COMPOSITES—-2009
aspects of processing conditions [3–7]. With the develop-
ment of more powerful computers and software, there are
now cheap and robust tools to perform rapidly this other-
wise complex and time-consuming analysis. It is currently
possible to build up simulation algorithms that are able to
foresee how the material behaves during the manufactur-
ing and cure processes.
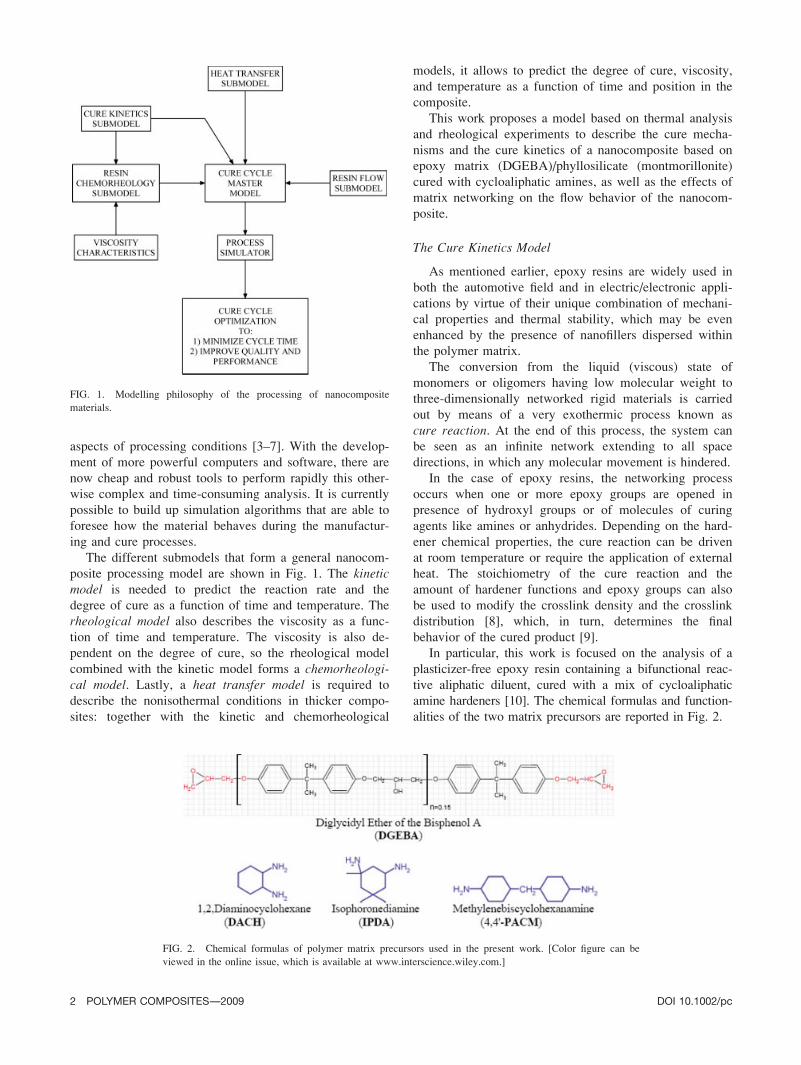
The different submodels that form a general nanocom-
posite processing model are shown in Fig. 1. The kineticmodel is needed to predict the reaction rate and the
degree of cure as a function of time and temperature. The
rheological model also describes the viscosity as a func-
tion of time and temperature. The viscosity is also de-
pendent on the degree of cure, so the rheological model
combined with the kinetic model forms a chemorheologi-cal model. Lastly, a heat transfer model is required to
describe the nonisothermal conditions in thicker compo-
sites: together with the kinetic and chemorheological
models, it allows to predict the degree of cure, viscosity,
and temperature as a function of time and position in the
composite.
This work proposes a model based on thermal analysis
and rheological experiments to describe the cure mecha-
nisms and the cure kinetics of a nanocomposite based on
epoxy matrix (DGEBA)/phyllosilicate (montmorillonite)
cured with cycloaliphatic amines, as well as the effects of
matrix networking on the flow behavior of the nanocom-
posite.
The Cure Kinetics Model
As mentioned earlier, epoxy resins are widely used in
both the automotive field and in electric/electronic appli-
cations by virtue of their unique combination of mechani-
cal properties and thermal stability, which may be even
enhanced by the presence of nanofillers dispersed within
the polymer matrix.
The conversion from the liquid (viscous) state of
monomers or oligomers having low molecular weight to
three-dimensionally networked rigid materials is carried
out by means of a very exothermic process known as
cure reaction. At the end of this process, the system can
be seen as an infinite network extending to all space
directions, in which any molecular movement is hindered.
In the case of epoxy resins, the networking process
occurs when one or more epoxy groups are opened in
presence of hydroxyl groups or of molecules of curing
agents like amines or anhydrides. Depending on the hard-
ener chemical properties, the cure reaction can be driven
at room temperature or require the application of external
heat. The stoichiometry of the cure reaction and the
amount of hardener functions and epoxy groups can also
be used to modify the crosslink density and the crosslink
distribution [8], which, in turn, determines the final
behavior of the cured product [9].
In particular, this work is focused on the analysis of a
plasticizer-free epoxy resin containing a bifunctional reac-
tive aliphatic diluent, cured with a mix of cycloaliphatic
amine hardeners [10]. The chemical formulas and function-
alities of the two matrix precursors are reported in Fig. 2.
FIG. 1. Modelling philosophy of the processing of nanocomposite
materials.
FIG. 2. Chemical formulas of polymer matrix precursors used in the present work. [Color figure can be
viewed in the online issue, which is available at www.interscience.wiley.com.]
2 POLYMER COMPOSITES—-2009 DOI 10.1002/pc

When an epoxy ring reacts with an amine, the three
reactions showed in Fig. 3 are possible However, several
authors [8] found that the only significant reaction, in the
absence of an accelerator, is that of the amine hydrogens
(i.e., the first and second reactions). The tertiary amine
formed in the second reaction was found to be too steri-
cally hindered to give the third reaction.
As in the case of all other thermosetting polymers, the
earlier reactions are exothermal. Therefore, it is possible
to relate the heat of reaction to the rate of reaction and
the degree of cure. The degree of cure (a) can be
described as the ratio between the heat evolved during
cure [DH(t)] and the total heat of reaction (DHR) as given
in Eq. 1:
aðtÞ ¼ DHðtÞDHR
¼R t0@H@t dtR end
start@H@t dt
ð1Þ
An expression of the reaction rate can be obtained differ-
entiating Eq. 1:
@a@t
¼ 1
DHTOT
@½DHðtÞ�@t
ð2Þ
The differential scanning calorimeter (DSC) is an ideal
tool to monitor these kinds of reactions. The DSC provides
the heat flow (qH/qt), or instantaneous heat, released or
absorbed by the reactive system as a function of the abso-
lute temperature or time. Dynamic and isothermal DSC
analyses are widely used to obtain an indirect estimation of
the degree of cure of a thermosetting system, assuming
that the heat released during polymerization is always pro-
portional to the consumption rate of reactive groups [1, 6,
7, 11] (which actually describes the extent of the reaction).
Calorimetric data can therefore be used to both create and
verify theoretical and empirical kinetic models and obvi-
ously to calculate kinetic parameters.
A combination of the dynamic and isothermal tests
makes possible to determine the variations of the degree
of cure and the rate of cure as a function of time and/or
temperature. In a polymerization process, the most gen-
eral kinetic model can be expressed as follows:
@a@t
¼ yðT; aÞ ¼ KðTÞ f ðaÞ ð3Þ
There are several ways to determine this relationship.
Unfortunately, none of the equations available in literature
[12] is able to describe the cure kinetics of the systems
analyzed in the present work (in each case, the nonlinear
fitting gave in fact very scattered parameters). This differ-
ence from the usual behavior of the epoxy systems can be
ascribed to several reasons. Firstly, the inhomogeneous
composition of the curing agent could determine a super-
position of networking reactions, which are activated at
different temperatures (and therefore they require different
kinetic parameters depending on the curing temperature).
Secondly, the epoxy resin contains a bifunctional reactive
aliphatic diluent, which could play an active role in the
networking process. The presence of the nanofiller (char-
acterized by the presence of organic terminations that
could in turn participate to the reaction) can only compli-
cate this situation.
For these reasons, a new kinetic equation was devel-
oped taking into account the fact that the activation
energy of the reaction is actually a function of the degree
of cure. Indeed, as the resin turns into a networked micro-
structure, the mobility of the active sites (i.e., epoxy
groups and primary and secondary amine groups) is pro-
gressively hindered, so an increasing energy is required to
keep the reaction active—which eventually becomes infi-
nite when the system reaches vitrification. To sum up,
this means that the kinetic parameter K(T) is actually a
combination between an Arrhenius function of T and a
growing exponential function of the degree of cure:
dadt
¼ Kða; TÞ am ð1� aÞn
Kða; TÞ ¼ K0 exp �Ea0
RT
� �exp �c
1� amax
amax � a
� �
amaxðTÞ ¼ 1
1þ expðbT0:5Þ expð�bTÞ
8>>>>>>><>>>>>>>:
ð4Þ
where amax is the final conversion degree reached by the
system (which was found to be a sigmoid function of the
cure temperature), T0.5 is the absolute temperature
(Kelvin) that allows the achievement of a half of the max-
imum networking degree, b is a temperature-independent
parameter that influences the slope of the sigmoid func-
tion, m and n are constant reaction orders and the cure-de-
pendent activation energy of the networking process can
be represented by the sum of the classical Arrhenius term
with a function of cure and temperature:
Eaða; TÞ ¼ Ea0 þ cRTð1� amaxÞðamax � aÞ ð5Þ
The Chemoviscosity Model
The increase of the system viscosity during isothermal
cure is a consequence of the molecular structural changes
FIG. 3. A scheme of the reactions between an epoxy ring and a pri-
mary or secondary amine.
DOI 10.1002/pc POLYMER COMPOSITES—-2009 3

induced by the polymerization reactions when crosslinked
polymer molecules form an infinite network, gelation
occurs. As the network has elastic properties, not present
in the low-molecular-weight linear or branched polymeric
chains, the gelation means the transformation of a viscous
liquid into a rubbery state solid. This significant increase
of viscosity is of critical importance from the processing
point of view, as the shaping must be completed before
gelation, i.e., while the polymer is still able to flow and
stresses can relax to zero.
The addition of reinforcing fillers to polymers is very
popular and common to realize requested properties, but
it also increases the complexity of the rheological behav-
ior. Rheological studies of the curing process indicate for
example that intragallery diffusion before curing is essen-
tial for clay exfoliation, before the morphology is frozen
by gelation and vitrification [13]. Therefore, the ability to
process these materials depends mostly on the control of
the interdependence among the material constituents
(resin, curing agent, nanoparticles, etc.), their effect on
the state of cure (cure kinetics, crosslink density) and the
morphology development of the dispersed nanoparticles.
All of this has to be accomplished within the period of
the resin gelation and vitrification, since after that point
the morphology will be essentially locked by the cross-
linked structure.
A lot of work was done to determine the appropriate
models that best describe the chemoviscosity of thermo-
sets. An advance was made from the batch-specific vis-
cosity versus time or temperature correlations to the mod-
els that evaluate the time-dependent chemoviscosity as a
function of the cure cycle and the cure kinetics of the
resin formulations [9, 14]. An extensive overview of the
chemorheology of thermosetting systems is reported by
Halley and Mackay [12].
The viscosity of a thermosetting system is influenced
by two main factors. Firstly, the increasing temperature
which increase the mobility of the molecules and there-
fore lower the viscosity, secondly the growing size of the
molecules because of the resin networking, which pro-
duces an increase of the viscosity. A commonly used
model to describe the viscosity dependence on tempera-
ture for the uncured system is the William–Landel–Ferry
(WLF) equation, derived from the free volume theory [9,
14–16]:
gðTÞ ¼ gg exp � C1ðT � Tg0ÞC2 þ T � Tg0
� �ð6Þ
where Tg0 is the glass transition temperature of the mono-
mer, gg is a constant (with an assigned value of 1012 Pa
s) representing the viscosity at the glass transition and C1
and C2 are material-dependent but temperature-independ-
ent parameters.
However, it is possible to see directly that a modifica-
tion of the WLF equation is necessary since the glass
transition of a curing resin is a function of the extent of
reaction and hence varies during the in situ polymeriza-
tion. In particular, the Tg increases because of the network
formation and must be evaluated as a function of the
degree of cure a.The gel point can be described as the point at which
the average molecular weight, Mw, of the system becomes
infinite. A consequence of Mw rising towards infinity is
that the shear viscosity also becomes infinite. To deter-
mine successfully the viscosity as a function of time and
temperature, the model must also consider this molecular
growth:
gðT; aÞ ¼ f1ðTÞ f2ðaÞ ð7Þ
FIG. 4. Dynamic tests at different heating rates for the neat resin (a) and the nanocomposite (b).
TABLE 1. A comparison among exothermic peaks and polymerization
enthalpies for the neat resin and the nanocomposite at different heating
rates.
Test
TS/Tpeak/TE (8C)Curing enthalpy
DHR (J/g)
Neat resin Nanocomp. Neat resin Nanocomp.
Dyn. 28C/min 31/83/105 58/88/124 2477.3 2522.5
Dyn. 58C/min 65/100/138 67/103/146 2480.2 2522.3
Dyn. 108C/min 75/117/167 77/117/159 2488.6 2499.6
Dyn. 158C/min 80/123/176 85/126/172 2470.4 2522.5
Avg. networking enthalpy? 2481.8 2516.5
4 POLYMER COMPOSITES—-2009 DOI 10.1002/pc
Equation (7) shows a general equation for the viscosity.
Several works [7, 9, 17] showed that a modified WLF
equation was appropriate to describe the chemorheology
of epoxy-based systems:
gðTÞ ¼ gg exp � C1
�T � TgðaÞ
�C2 þ T � TgðaÞ
� �� ag
ag � a
� �nrheo
ð8Þ
where ag is the extent of reaction at the gel point, Tg(a) isa function describing the dependence of the Tg on the net-
working degree and nrheo is a constant to be determined
by regression analysis of the experimental data. This
model was taken as a reference for the characterization of
the materials analyzed in the present work.
EXPERIMENTAL
Materials
Every compound was based on a mixture of 30 parts
of amine (W131) for every 100 parts of epoxy resin
(EC157). Nanocomposites were obtained adding 2% wt of
organo-modified montmorillonites (Cloisite1 20A, pro-
duced by Nanocor, USA) to the resin.
The first stage of the procedure for the preparation of
the nanocomposite is a preintercalation of the resin. A
batch of 200 g of DGEBA monomer was mixed with the
Cloisite1 for 1 h using a mechanical stirrer (HEIDOLPH
RZR 2041) at a temperature of 708C and a speed of
3,300 rpm. In each case, the nanoreinforcement was
added to the resin with a mixing ratio of 2% wt to obtain
an overall content of about 1.53% wt of nanofiller in the
composite. Every compound, once cooled down to room
temperature, was immediately put in a freezer at a tem-
perature of –208C, to avoid any secondary effect due to
the environmental aging.
Differential Scanning Calorimetry
Of the three submodels treated in this work, the kinetic
model is the foundation of the other two and therefore
was studied first. The model was developed using a power
compensating Differential Scanning Calorimeter MET-
TLER DSC822e (controlled by a computer and connected
to an intracooler unit that allowed the rapid cooling of the
samples), to produce data related to the evolution of the
cure process both in isothermal and in dynamic tests.
Dynamic scans from 250 to 2508C at different heating
rates were performed on both the neat resin and the nano-
composite, to make a comparison between the different
cure reactions and consequently to determine possible var-
iations induced by the addition of a nanofiller. Thereafter,
the isothermal cure processes at different temperatures for
each aforementioned system were analyzed to calculate
the temperature dependence of the kinetic parameters and
to consider the effects of diffusion controlled phenomena
during the isothermal reaction. All tests were performed
in a nitrogen atmosphere. Every sample had a mass of
about 157 20 mg, which ensured a good signal of the
heat flux without losing the homogeneity of the tempera-
ture field within the DSC crucible.
Dynamic Viscosity Tests
The rheological characterization of the system was car-
ried out using a Rheometric Scientific model ARES
dynamic viscosity spectrometer. Steel parallel plates with
a diameter of 12.5 mm were used throughout, a rotation
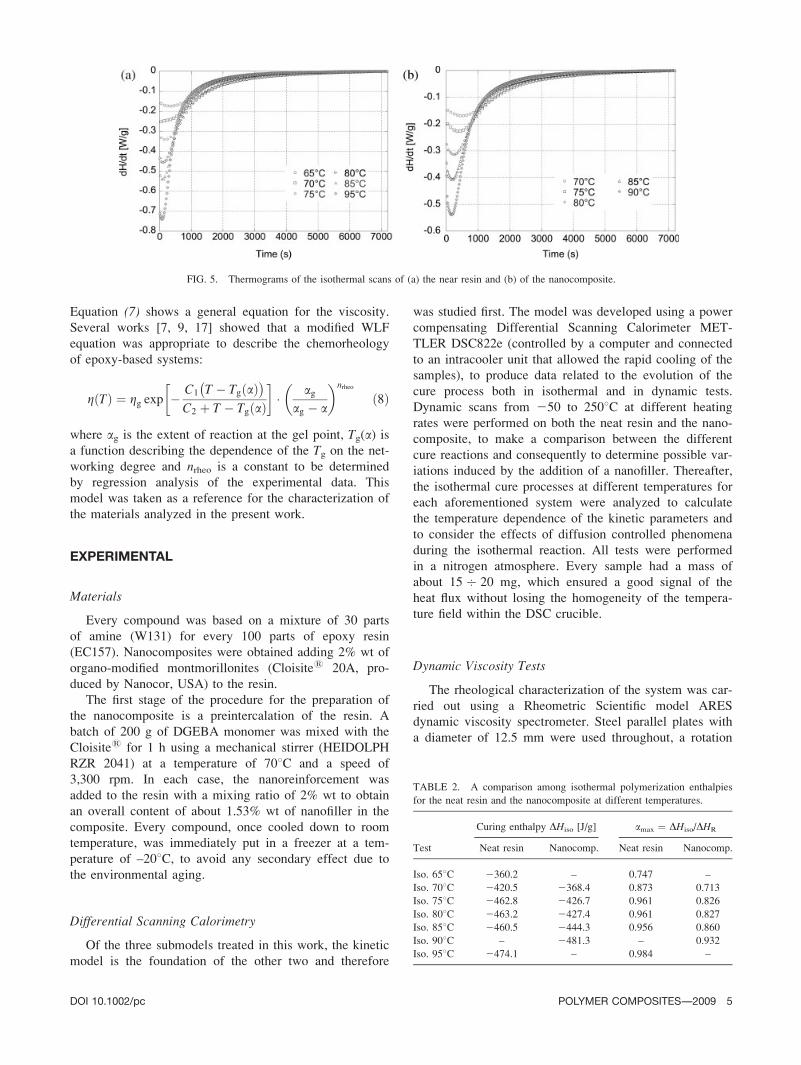
FIG. 5. Thermograms of the isothermal scans of (a) the near resin and (b) of the nanocomposite.
TABLE 2. A comparison among isothermal polymerization enthalpies
for the neat resin and the nanocomposite at different temperatures.
Test
Curing enthalpy DHiso [J/g] amax ¼ DHiso/DHR
0Neat resin0 Nanocomp. Neat resin Nanocomp.
Iso. 658C 2360.2 – 0.747 –
Iso. 708C 2420.5 2368.4 0.873 0.713
Iso. 758C 2462.8 2426.7 0.961 0.826
Iso. 808C 2463.2 2427.4 0.961 0.827
Iso. 858C 2460.5 2444.3 0.956 0.860
Iso. 908C – 2481.3 – 0.932
Iso. 958C 2474.1 – 0.984 –
DOI 10.1002/pc POLYMER COMPOSITES—-2009 5

rate is imposed to the lower plate, to perform either
steady shear or oscillatory shear flow tests. A transducer
measures the viscous response of the material under the
form of a torque exerted by the fluid on the upper plate.
RESULTS AND DISCUSSION
Dynamic and Isothermal DSC Scans
A preliminary set of dynamic scans from 2508C to
2508C of both the resin and the nanocomposite were per-
formed at heating rates of 2, 5, 10, and 158C/min as
shown in Fig. 4.
The most prominent characteristic of the thermograms is
the exothermic peak due to resin networking. The shape of
the thermograms is almost the same for the two different
mixtures and could be interpreted as the effect of a linear
combination of two peaks associated to the first two reac-
tions shown in Fig. 3. The effect of the nanofiller on the
cure kinetics can be therefore estimated only on the basis of
some characteristic parameters, namely, the total heat
released (DHR), the onset (TS) and offset (TE) temperatures
of the polymerization process, and the peak temperature
(Tpeak). A complete resume of the aforementioned values for
both the resin and the nanocomposite is given in Table 1.
It must be noticed that for both the materials the peak
shifts towards lower temperatures at lower heating rates,
while for the same heating rate the presence of the nano-
filler produces a higher curing enthalpy and a shift of the
peak towards slightly higher temperatures. This effect
could be ascribed to the presence of clay particles, which
act as an obstacle against molecular mobility. In this way,
higher temperatures are required to complete the reaction,
which in turn advances more slowly and regularly carry-
ing eventually to higher networking degrees (and there-
fore to higher values of DHR).
The information given by the dynamic scans, however,
are not sufficient to describe completely the behavior of the
reacting systems. Indeed, the self-catalysis and control effects
from the diffusion phenomena on the last stages of the cure
process can be hardly analyzed during dynamic heating.
Therefore, for an exhaustive calorimetric characterization
(i.e., to calculate the rate constants and the reaction orders)
several isothermal tests at different temperatures are needed.
Seven isothermal scans were performed from 65 to
958C at steps of 58C for 2 h for both the neat resin and
the nanocomposite (reported in Fig. 5). The integral of
each peak (corresponding to the heat of polymerization at
that temperature) is reported in Table 2, together with the
final conversion degree aMAX reached by the system. It
must be noticed that the ‘‘obstacle’’ determined by the
presence of the clay is confirmed by the lower values of
the aMAX obtained at each given temperature. Figure 6
shows the evolution of the maximum degree of cure vs.
temperature at different isothermal cure conditions respec-
tively for the neat resin and the nanocomposite.
Determination of the Kinetic Constants
The kinetic parameters of the models expressed by
Eqs. 4 and 5 were determined using a nonlinear regres-
FIG. 6. Maximum degree of cure vs. temperature and relative trend-line for both the neat resin (a) and the nanocomposite (b).
TABLE 3. Results of the non linear fitting of amax vs. T based on
Eq. 4.
Parameter
Material
Neat resin Nanocomp.
T0.5 331.3 K � 588C 330.4 K � 578Cb 0.16 K21 0.07 K21
Linear correlation coefficient (R) 0.9975 0.9868
TABLE 4. Average kinetic parameters of the analyzed materials.
Parameter
Material
Neat resin Nanocomposite
ln (K0) 10.07 14.66
Ea0/R 5834.2 7504.7
Coefficient of determination (R2) 0.9694 0.9971
c 0.15 6 0.09 0.23 6 0.06
m 0.17 6 0.02 0.24 6 0.02
n 1.53 6 0.14 1.80 6 0.12
6 POLYMER COMPOSITES—-2009 DOI 10.1002/pc
sion analysis of the experimental data obtained from DSC
test. The average values of the kinetic parameters
obtained for both the pure resin and the nanocomposite
are reported in Tables 3 and 4. All values are in good
agreement with the results obtained by several authors [1,
7, 16, 17–21] for epoxy-based systems. From those values
it was possible to evaluate the effect of the nanofiller on
the networking behavior. A 30% increase in activation
energy and a 20% increase of the overall reaction order
(m þ n) is observed: this confirms the considerations
made before about the hindrance produced by the clay, to
such an extent that, higher temperatures are required to
start and complete the cure process.
Previous considerations do not however suffice to con-
firm the validity of the proposed thermo2kinetic model.
A correct model should in fact be able to predict the
behavior of a given polymeric system not only in a partic-
ular combination of temperature and curing time, but also
in a wide range of conditions to which the system may be
exposed. For this reason, the model should describe the
evolution of the cure degree a(t) once both the properties
of the reactive system (e.g. activation energies, kinetic
constants, etc.) and the environmental conditions have
been defined. In other words, the correctness of the model
must be confirmed through the integration of the theoreti-
cal curves:
dadt
¼ Kða; TÞ am ð1� aÞn
ln½K� ¼ ln½K0� � Ea0
RT� c
1� amax
amax � a
amaxðTÞ ¼ 1
1þ expðbT0:5Þ expð�bTÞ
8>>>>>><>>>>>>:
ð9Þ
starting from a set of characteristic parameters of the ana-
lyzed compound for each reaction peak (c, m, n, ln [K0],
Ea0/R) and for user-defined curing conditions (temperature
and cure time).
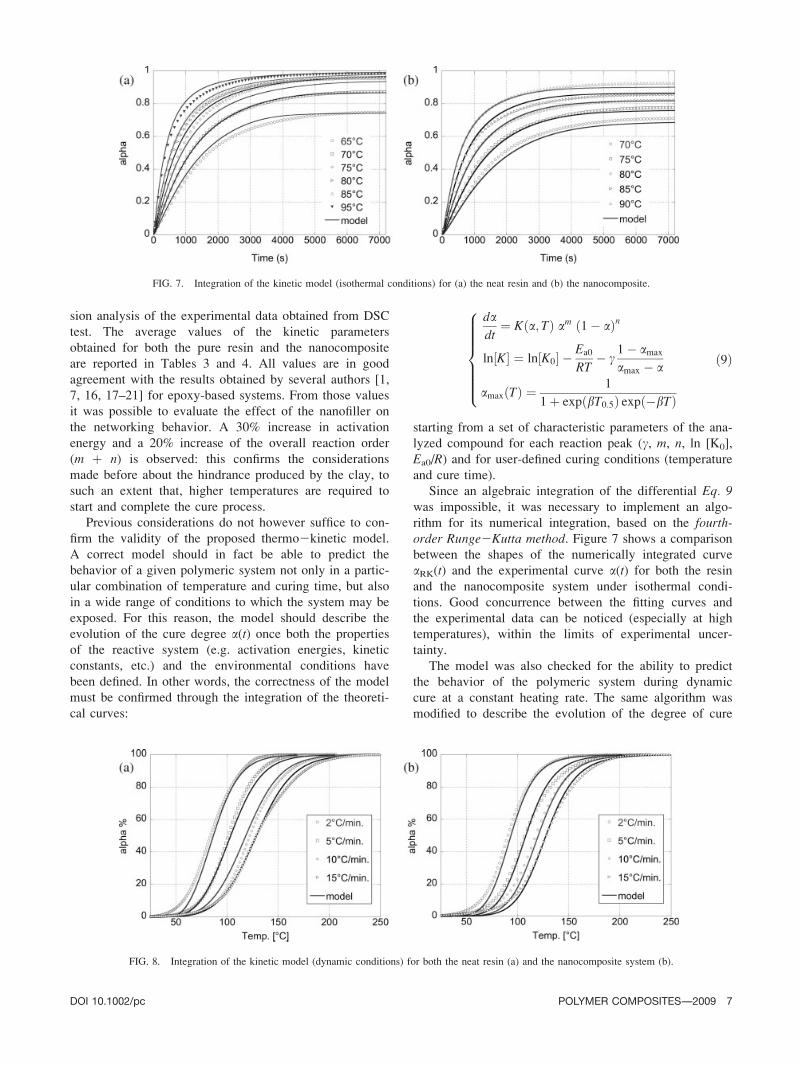
Since an algebraic integration of the differential Eq. 9was impossible, it was necessary to implement an algo-
rithm for its numerical integration, based on the fourth-order Runge2Kutta method. Figure 7 shows a comparison
between the shapes of the numerically integrated curve
aRK(t) and the experimental curve a(t) for both the resin
and the nanocomposite system under isothermal condi-
tions. Good concurrence between the fitting curves and
the experimental data can be noticed (especially at high
temperatures), within the limits of experimental uncer-
tainty.
The model was also checked for the ability to predict
the behavior of the polymeric system during dynamic
cure at a constant heating rate. The same algorithm was
modified to describe the evolution of the degree of cure
FIG. 7. Integration of the kinetic model (isothermal conditions) for (a) the neat resin and (b) the nanocomposite.
FIG. 8. Integration of the kinetic model (dynamic conditions) for both the neat resin (a) and the nanocomposite system (b).
DOI 10.1002/pc POLYMER COMPOSITES—-2009 7
using the same characteristic parameters of the material,
allowing the possibility to choose test conditions, which
in this case were the initial and final temperatures and the
heating rate. The results of the application of these mod-
els and the comparison with the experimental results are
shown in Fig. 8 for both of the analyzed systems.
Relationship Between Tg and a
To determine the chemorheological model, it is neces-
sary to know the relationship between a and Tg. In gen-
eral, for phenomenological modelling purposes, it is suffi-
cient to make a linear or exponential fit in the temperature
region of interest. However, it is also possible make a
more theoretical approach. It is possible to show that, for
a partially cured thermosetting system, the glass transition
temperature up to an extent of reaction a is given by
[22]:
1
Tg¼ 1� a
Tg0þ a
Tg1þ q a ð1� aÞ ð10Þ
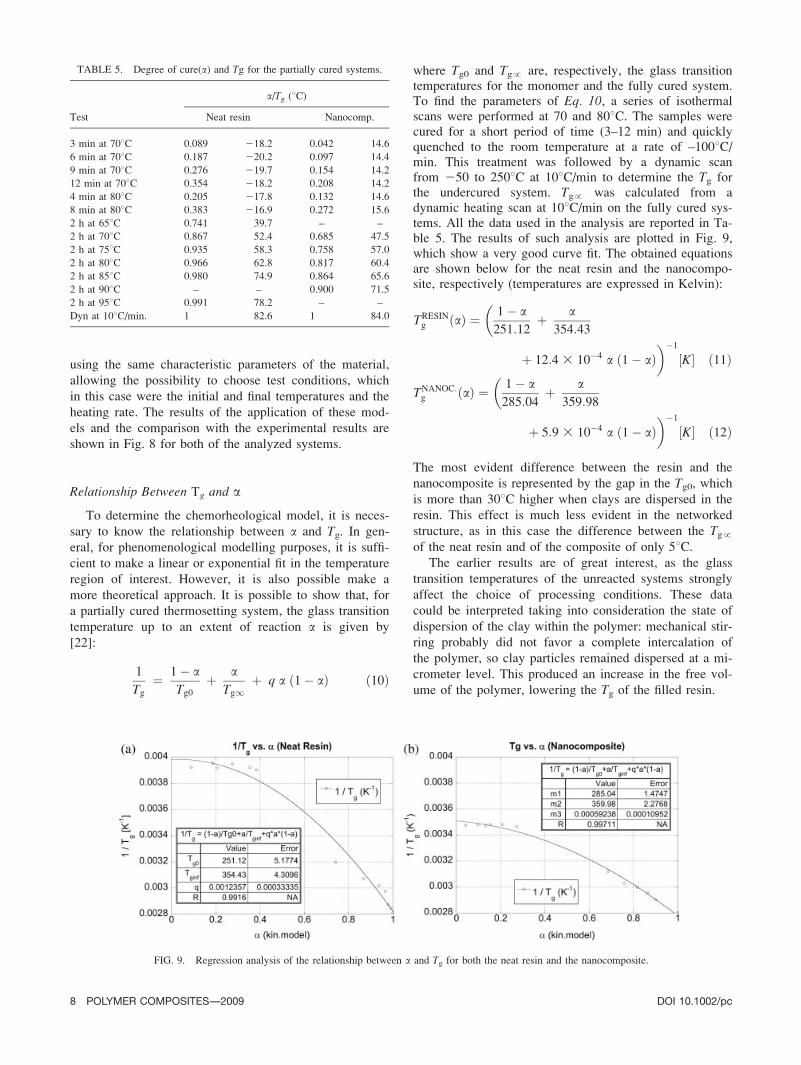
where Tg0 and Tg! are, respectively, the glass transitiontemperatures for the monomer and the fully cured system.To find the parameters of Eq. 10, a series of isothermalscans were performed at 70 and 808C. The samples werecured for a short period of time (3–12 min) and quicklyquenched to the room temperature at a rate of –1008C/min. This treatment was followed by a dynamic scanfrom 250 to 2508C at 108C/min to determine the Tg forthe undercured system. Tg! was calculated from adynamic heating scan at 108C/min on the fully cured sys-tems. All the data used in the analysis are reported in Ta-ble 5. The results of such analysis are plotted in Fig. 9,which show a very good curve fit. The obtained equationsare shown below for the neat resin and the nanocompo-site, respectively (temperatures are expressed in Kelvin):
TRESINg ðaÞ ¼ 1� a
251:12þ a
354:43
�
þ 12:4 3 10�4 a ð1� aÞ��1
½K� ð11Þ
TNANOC:g ðaÞ ¼ 1� a
285:04þ a
359:98
�
þ 5:9 3 10�4 a ð1� aÞ��1
½K� ð12Þ
The most evident difference between the resin and the
nanocomposite is represented by the gap in the Tg0, whichis more than 308C higher when clays are dispersed in the
resin. This effect is much less evident in the networked
structure, as in this case the difference between the Tg!of the neat resin and of the composite of only 58C.
The earlier results are of great interest, as the glass
transition temperatures of the unreacted systems strongly
affect the choice of processing conditions. These data
could be interpreted taking into consideration the state of
dispersion of the clay within the polymer: mechanical stir-
ring probably did not favor a complete intercalation of
the polymer, so clay particles remained dispersed at a mi-
crometer level. This produced an increase in the free vol-
ume of the polymer, lowering the Tg of the filled resin.
FIG. 9. Regression analysis of the relationship between a and Tg for both the neat resin and the nanocomposite.
TABLE 5. Degree of cure(a) and Tg for the partially cured systems.
Test
a/Tg (8C)
Neat resin Nanocomp.
3 min at 708C 0.089 218.2 0.042 14.6
6 min at 708C 0.187 220.2 0.097 14.4
9 min at 708C 0.276 219.7 0.154 14.2
12 min at 708C 0.354 218.2 0.208 14.2
4 min at 808C 0.205 217.8 0.132 14.6
8 min at 808C 0.383 216.9 0.272 15.6
2 h at 658C 0.741 39.7 – –
2 h at 708C 0.867 52.4 0.685 47.5
2 h at 758C 0.935 58.3 0.758 57.0
2 h at 808C 0.966 62.8 0.817 60.4
2 h at 858C 0.980 74.9 0.864 65.6
2 h at 908C – – 0.900 71.5
2 h at 958C 0.991 78.2 – –
Dyn at 108C/min. 1 82.6 1 84.0
8 POLYMER COMPOSITES—-2009 DOI 10.1002/pc
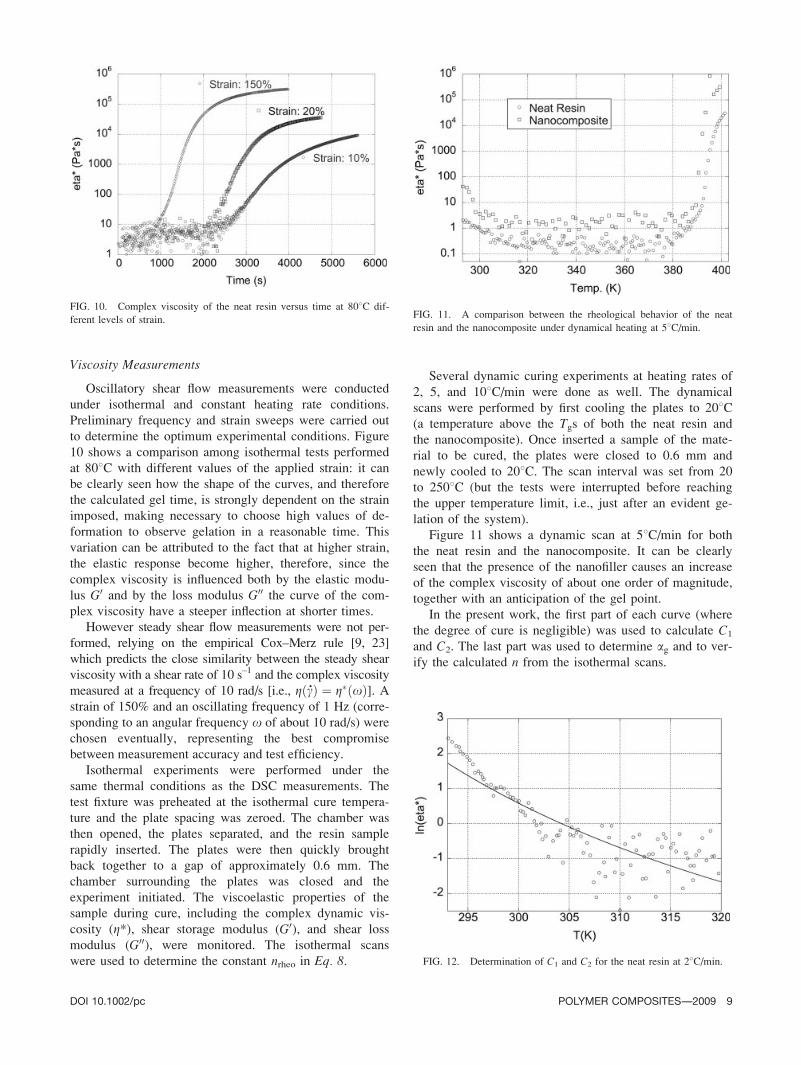
Viscosity Measurements
Oscillatory shear flow measurements were conducted
under isothermal and constant heating rate conditions.
Preliminary frequency and strain sweeps were carried out
to determine the optimum experimental conditions. Figure
10 shows a comparison among isothermal tests performed
at 808C with different values of the applied strain: it can
be clearly seen how the shape of the curves, and therefore
the calculated gel time, is strongly dependent on the strain
imposed, making necessary to choose high values of de-
formation to observe gelation in a reasonable time. This
variation can be attributed to the fact that at higher strain,
the elastic response become higher, therefore, since the
complex viscosity is influenced both by the elastic modu-
lus G0 and by the loss modulus G00 the curve of the com-
plex viscosity have a steeper inflection at shorter times.
However steady shear flow measurements were not per-
formed, relying on the empirical Cox–Merz rule [9, 23]
which predicts the close similarity between the steady shear
viscosity with a shear rate of 10 s–1 and the complex viscosity
measured at a frequency of 10 rad/s [i.e., gð _cÞ ¼ g�ðxÞ]. Astrain of 150% and an oscillating frequency of 1 Hz (corre-
sponding to an angular frequency x of about 10 rad/s) were
chosen eventually, representing the best compromise
between measurement accuracy and test efficiency.
Isothermal experiments were performed under the
same thermal conditions as the DSC measurements. The
test fixture was preheated at the isothermal cure tempera-
ture and the plate spacing was zeroed. The chamber was
then opened, the plates separated, and the resin sample
rapidly inserted. The plates were then quickly brought
back together to a gap of approximately 0.6 mm. The
chamber surrounding the plates was closed and the
experiment initiated. The viscoelastic properties of the
sample during cure, including the complex dynamic vis-
cosity (g*), shear storage modulus (G0), and shear loss
modulus (G00), were monitored. The isothermal scans
were used to determine the constant nrheo in Eq. 8.
Several dynamic curing experiments at heating rates of
2, 5, and 108C/min were done as well. The dynamical
scans were performed by first cooling the plates to 208C(a temperature above the Tgs of both the neat resin and
the nanocomposite). Once inserted a sample of the mate-
rial to be cured, the plates were closed to 0.6 mm and
newly cooled to 208C. The scan interval was set from 20
to 2508C (but the tests were interrupted before reaching
the upper temperature limit, i.e., just after an evident ge-
lation of the system).
Figure 11 shows a dynamic scan at 58C/min for both
the neat resin and the nanocomposite. It can be clearly
seen that the presence of the nanofiller causes an increase
of the complex viscosity of about one order of magnitude,
together with an anticipation of the gel point.
In the present work, the first part of each curve (where
the degree of cure is negligible) was used to calculate C1
and C2. The last part was used to determine ag and to ver-
ify the calculated n from the isothermal scans.
FIG. 11. A comparison between the rheological behavior of the neat
resin and the nanocomposite under dynamical heating at 58C/min.
FIG. 12. Determination of C1 and C2 for the neat resin at 28C/min.
FIG. 10. Complex viscosity of the neat resin versus time at 808C dif-
ferent levels of strain.
DOI 10.1002/pc POLYMER COMPOSITES—-2009 9

The extent of reaction during the first part of the
dynamic scans was assumed so low that it could be
ignored therefore Tg behaves as a constant in this region.
This assumption was also confirmed by the application of
the kinetic model. According with Eq. 8, when a ¼ 0 the
term (ag/(ag 2 a))n goes to 1 and the viscosity depends
only on the temperature therefore C1 and C2 can be easily
determined by regression analysis (Fig. 12 shows an
example of regression for the neat resin). The viscosity at
the glass transition temperature has been assumed to be
g ¼ 1012 Pa s, and Tg(a) ¼ Tg0 for both of the materials
analyzed. The following equation was used in the regres-
sion analysis:
ln½gðTÞ� ¼ 12 ln½10� þ C1
�T � Tg0
�C2 þ T � Tg0
ð13Þ
C1 and C2 are taken as the mean value of the results
obtained in the three tests (Table 6).
The Determination of the Gel Point, ag
The gel point, which is characterized by an infinite
value of the steady shear viscosity, is not as easy to dis-
cern in case of oscillatory shear flow measurements. Dif-
ferent criteria have been proposed in the literature, such
as the inflection point of the G00 curve [9], the crossover
point between the G0 and G00 curves [24], or the point
where the loss tangent (tan d) becomes independent from
the frequency [25]. In this work, gelation was assumed to
occur when the dynamic complex viscosity diagrams have
their inflection points. Figures 13 and 14 show the effect
of gelation on the complex viscosity of the neat resin and
the nanocomposite respectively. The a values, which
appear in the abscissa of the diagram, were calculated
integrating the kinetic models for each material, based on
time and temperature arrays exported from the rheometer.
Combining the dynamic rheological data with the frac-
tional conversion data obtained by means of DSC, the
values for the fractional conversion at the gel point (ag)were determined and reported in Table 7. According to
Flory’s gelation theory [26], gelation occurs at a fixed
conversion as long as the reaction mechanism is not a
function of the temperature. The deviation between agvalues for different isothermal experiments is about 2%.
To reduce the number of parameters, an average ag value
was assumed.
An anticipation of the gel point can be noticed for the
nanocomposite, which can be explained with some kind
of ‘‘linking’’ effect produced by the presence of the clay,
which enhances the stress transfer ability of the material
(and therefore reduces the degree of networking required
to get a ‘‘nearly solid’’ behavior).
To complete the chemorheological model, the constant
nrheo was determined from the isothermal scans. As the
software used in the regression analysis allowed to use
only one variable, Eq. 8 had to be rewritten in a form
that describes the viscosity as a function of the extent of
reaction only. The equation obtained is shown below.
FIG. 13. Determination of the gel point for the neat resin.
FIG. 14. Determination of the gel point for the nanocomposite.
TABLE 7. Degree of cure at the gel point of the analyzed materials.
ag
Neat resin Nanocomposite
0.762 6 0.006 0.695 6 0.012
TABLE 6. The results of the regressions for the determination of C1
and C2.
C1 C2 (K)
Neat resin Nanocomp. Neat resin Nanocomp.
235.17 6 1.41 229.05 6 0.58 15.38 6 2.87 2.13 6 0.40
10 POLYMER COMPOSITES—-2009 DOI 10.1002/pc

ln½gðaÞ� ¼ 12 ln½10�
þC1 Tiso � 1�a
Tg0þ a
Tg1þ q a ð1� aÞ
� ��1� �
C2 þ Tiso � 1�aTg0
þ aTg1
þ q a ð1� aÞ� ��1
þ nrheo lnag
ag � a
� �ð14Þ
The mean among the results of the linear regression is
reported in Table 8. After the calculation of the constants
of the chemorheological model, the model was verified
against the experimental data. With this aim, the integra-
tion algorithm described earlier was modified to take into
account also the chemoviscosity effects. Figures 15 and
16 show the logarithm of the complex viscosity versus
absolute temperature for all the heating rates and their
corresponding model simulations, respectively for the neat
resin and the nanocomposite. A very good correspondence
was obtained, so the model can be said to describe
adequately the process. Table 9 shows a resume of the
constants used in the chemorheological model.
Figures 15 and 16 allow one to make also some gen-
eral considerations about the effects of the clay on the
chemorheological behavior of the polymer matrix. It can
be clearly seen that the viscosity of the nanocomposite is
always higher than the one of the neat resin. A higher
‘‘heating sensitivity’’ of the composite viscosity before
networking can also be noticed from the higher slope of
the left horn (and obviously from the lower C1 and C2
values). Moreover, in the presence of clay, gelation
occurs at lower degrees of cure, thus determining a nar-
rower shape of the chemoviscosity diagrams (confirmed
by the higher value of nrheo).The chemorheological characteristics can be adequately
described with the following equations:
Neat Resin
dadt
¼ Kða;TÞ a0:17 ð1�aÞ1:54
Kða;TÞ ¼ expð10:07Þ exp �5834:2
T
� �
3 exp �0:151�amaxðTÞamaxðTÞ�a
� �
amaxðTÞ ¼ 1
1þ expð0:16 �331:34Þexpð�0:16 �TÞ
gða;TÞ¼ 1012 exp �35:17�T�TgðaÞ
�15:38þT�TgðaÞ
� �0:762
0:762�a
� �1:81
TgðaÞ¼ 1�a251:12
þ a354:43
þ 12:43 10�4 a ð1�aÞ� ��1
8>>>>>>>>>>>>>>>>>>>>>><>>>>>>>>>>>>>>>>>>>>>>:
TABLE 9. Constants of the chemorheological model for the materials
analyzed.
Parameter
Material
Neat resin Nanocomposite
gg 1012 1012
C1 235.17 229.05
C2 (K) 15.38 2.13
Tg0 (K) 251.12 285.04
Tg! (K) 354.43 359.98
q 12.4 3 1024 5.9 3 1024
ag 0.762 0.695
nrheo 1.81 2.53FIG. 15. Model verification at different heating rates for the neat resin.
FIG. 16. Model verification at different heating rates for the nanocom-
posite.
TABLE 8. Average chemo-rheological kinetic constant of the analyzed
materials.
nrheo
Neat resin Nanocomposite
1.81 6 0.75 2.53 6 1.05
DOI 10.1002/pc POLYMER COMPOSITES—-2009 11

Nanocomposite
dadt
¼Kða;TÞa0:24 ð1�aÞ1:80
Kða;TÞ¼expð14:66Þ exp �7504:7
T
� �
3 exp �0:231�amaxðTÞamaxðTÞ�a
� �
amaxðTÞ¼ 1
1þexpð0:073330:39Þexpð�0:07 �TÞ
gða;TÞ¼1012 exp �29:05 ��T�TgðaÞ�
2:13þT�TgðaÞ� �
0:695
0:695�a
� �2:53
TgðaÞ¼ 1�a285:04
þ a359:98
þ5:9310�4 að1�aÞ� ��1
8>>>>>>>>>>>>>>>>>>>>>><>>>>>>>>>>>>>>>>>>>>>>:
CONCLUSIONS
The neat resin and the nanocomposite underwent calo-
rimetric and rheological characterizations based on both
dynamic and isothermal tests, which allowed determining
the evolution of their viscosity during the cure process.
The main feature of the analyzed systems is represented
by their cure kinetics. As the behavior of both of them can-
not be represented by models available in literature, a new
kinetic model was developed, taking into account also the
fact that the activation energy of the networking process is
actually a function of the degree of cure (rising exponen-
tially towards infinity when the system approaches vitrifica-
tion). Moreover, the nanoparticles seem to hinder the mo-
lecular mobility, so that the cure temperature window is
broader and shifted towards higher temperatures than the
one of the neat resin. Obviously, this effect influences also
the cure kinetics, as confirmed by the higher values of the
activation energy and of the overall reaction order of the
nanocomposite.
The effects of the clay on the chemorheological behav-
ior of the polymer matrix can be resumed as follows:
higher viscosity of the nanocomposite at any temperature,
higher ‘‘heating sensitivity’’ of the composite viscosity
before networking and gelation occurring at lower degrees
of cure, thus determining a narrower shape of the chemo-
viscosity. The applied chemorheological model was a
combination of the classical Williams–Landel–Ferry
(WLF) equation and a conversion term originally used by
Castro and Macosko [27].
Once found the characteristic parameters of both the
neat resin and the nanocomposite, the chemoviscosity
models were numerically integrated using an algorithm
based on the 4th-order Runge–Kutta method, to check
their ability to foresee the behavior of the systems dur-
ing a dynamic cure process. The results fit the experi-
mental data with very good precision, so the model is
ready to be applied for the description of practical case
studies.
REFERENCES
1. J.M. Kenny, A. Trivisano, and L. Nicolais, Eds., ThermalCharacterization of the Cure Kinetics of Advanced Matricesfor High-Performance Composites, American Chemical So-
ciety, Washington, D.C. (1993).
2. C.I. Park, O.O. Park, J.G. Lim, and H.J. Kim, Polymer, 42,7465 (2001).
3. M. Alexandre and P. Dubois, Mater. Sci. Eng., 28, 1 (2000).
4. W.B. Xu, S.P. Bao, S.J. Shen, G.P. Hang, and P.S. He, J.Appl. Polym. Sci., 88, 2932 (2003).
5. W.B. Xu, Z.F. Zhou, P.S. He, and W.-P. Pan, J. Therm.Anal. Calorimetry, 78, 113 (2004).
6. J.M. Kenny, L. Torre, L. Valentini, J. Biagiotti, and D.
Puglia, ‘‘Processing Structure and Properties of Polymer Ma-
trix Nanocomposites for Industrial Applications,’’ in China–EU Forum on Nanosized Technology Proceedings, Beijing,China, 24–37 (2002).
7. J.M. Kenny, Compos. Struct., 27, 129 (1994).
8. J. Galy, A. Sabra, and J.P. Pascault, Polym. Eng. Sci., 26,1514 (1986).
9. M. Ivankovic, L. Incarnato, J.M. Kenny, and L. Nicolais, J.Appl. Polym. Sci., 90, 3012 (2003).
10. Baxxodur2: When curing makes the difference. Brochre &
Product portfolio overview from the BASF Group, 2006.
11. L. Torre, G. Lelli, and J.M. Kenny, J. Appl. Polym. Sci., 94,1676 (2004).
12. P.J. Halley and M.E. Mac Kay, Polym. Eng. Sci., 36, 593(1996).
13. D. Dean, R. Walker, M. Theodore, E. Hampton, and E.
Nyairo, Polymer, 46, 3014 (2005).
14. J. Mijovic and C.H. Lee, J. Appl. Polym. Sci., 37, 889 (1989).
15. J.M. Kenny, A. Maffezzoli, and L. Nicolais, Compos. Sci.Technol., 38, 339 (1990).
16. M. Opalicki, J.M. Kenny, and L. Nicolais, J. Appl. Polym.Sci., 61, 1025 (1996).
17. J.M. Kenny and M. Opalicki in Makromol. Chem., Macro-mol. Symp., 68, 41 (1993); Huthig & Wepf Verlag, Basel.
18. L.A. Berglund and J.M. Kenny, SAMPE J., 27, 27 (1991).
19. J.M. Kenny and A. Trivisano, Polym. Eng. Sci., 31, 1426 (1991).
20. J.M. Kenny, A. Trivisano, M.E. Frigione, and L. Nicolais,
Thermochimica Acta, 199, 213 (1992).
21. A. Trivisano, A. Maffezzoli, J.M. Kenny, and L. Nicolais,
Adv. Polym. Technol., 10, 251 (1990).
22. I. Havlicek, K. Dusek, S. Stokrova, J. Biros, J.M. Kenny,
and L. Nicolais, ‘‘Theoretical Modelling of the Rheological
Behavior of an Epoxy-amine System During Curing,’’ in
Proceeding of European Symposium on Polymeric Materi-als, Lyon, France, September 14–18, 1987, pp CA03.
23. W.P. Cox and E.H. Merz, J. Polym. Sci., 28, 619 (1958).
24. C.Y.M. Tung and P.J. Dynes, J. Appl. Polym. Sci., 27, 569(1982).
25. H.H. Winter, Polym. Eng. Sci., 27, 1698 (1987).
26. P.J. Flory, Principles of Polymer Chemistry, Cornell Univer-sity Press, Ithaca, NY (1953).
27. J.M. Castro and C. Macosko, AICHE J., 28, 251 (1982).
12 POLYMER COMPOSITES—-2009 DOI 10.1002/pc