Composition, thermal and rheological behaviour of selected Greek honeys
13
Composition, thermal and rheological behaviour of selected Greek honeys Athina Lazaridou a , Costas G. Biliaderis a, * , Nicolaos Bacandritsos b , Anna Gloria Sabatini c a Laboratory of Food Chemistry and Biochemistry, Food Science and Technology Department, School of Agriculture, Aristotle University of Thessaloniki, Thessaloniki, Greece 541 24 b Institute of Veterinary Research of Athens, N.AG.RE.F., 25 Neapoleos Street, Agia Paraskevi, 153 01 Athens, Greece c Instituto Nazionale di Apicoltura, Via di Saliceto 80, I-41128 Bologna, Italy Received 6 May 2003; accepted 13 September 2003 Abstract Several chemical and physicochemical properties (sugar composition, water content, water activity, colour, viscosity, thermal properties) were determined for 33 Greek honeys from different botanical and geographical origin. The water content and water activity values varied within 13.0–18.9 g/100 g and 0.528–0.663, respectively. Steady shear and dynamic rheological tests revealed Newtonian behaviour for all samples examined over the temperature range of 20–60 °C. The steady shear viscosity (g) and loss modulus (G 00 ) were inversely related to the water content of honey. The temperature dependence of viscosity followed both the Arrhenius and the Williams–Landel–Ferry models; for the latter model the viscosity data of different samples fitted very well into a common master curve. The glass transition temperature (T g ) of honeys, as determined by differential scanning calorimetry, varied between )34 and )47 °C depending on their composition. The plasticizing action of water on honey solids was evident for native samples as well as among diluted and concentrated honeys; T g decreased with increasing water content. Despite a broad variation in sugar composition among the samples, the T g values vs. water content fitted reasonably well to the Gordon–Taylor empirical equation. Ó 2003 Elsevier Ltd. All rights reserved. Keywords: Honey; Moisture content; Water activity; Colour; Rheology; Arrhenius model; Williams–Landel–Ferry model; Glass transition 1. Introduction Honey, the viscous and aromatic product prepared by bees, mainly from the nectar of flowers or honeydew, is a concentrated solution of various sugars. Honey contains fructose and glucose (60–85%) as the predomi- nant monosaccharides, maltose and sucrose as the most important disaccharides, melezitose as the main trisac- charide and other low molecular weight oligosaccha- rides (Doner, 1977; Doner & Hicks, 1982). The composition of honey (sugars and moisture content) is responsible for many of the physicochemical properties of honey, such as viscosity, hydroscopicity, and granu- lation. Most honeys are supersaturated solutions of glucose, which have a tendency to crystallize spontane- ously at room temperature in the form of glucose monohydrate. Crystallization of honey, commonly called granulation, is an undesirable process in liquid honey because it affects the textural properties, making it less appealing to the consumer. Moreover, in many cases, crystallization of honey results in increased moisture of the liquid phase which can allow naturally occurring yeast cells to multiply causing fermentation of the product (Doner, 1977). Water content as well as water activity are the major factors that influence the keeping quality or storability of honey. Sensory and physicochemical properties are very important parameters in determining the quality and acceptability of honey and many studies have been devoted to explore such determinants of product qua- lity (Al-Khalifa & Al-Arify, 1999; Anupama, Bhat, & Sapna, 2003; Bath & Singh, 1999; Popek, 2003; Singh & Bath, 1997). The composition and properties of honey vary with the floral and honeydew sources utilized by Journal of Food Engineering 64 (2004) 9–21 www.elsevier.com/locate/jfoodeng * Corresponding author. Tel.: +2310-471467/+30-310-998-785; fax: +2310-471257/+30-310-471-457. E-mail address: [email protected] (C.G. Biliaderis). 0260-8774/$ - see front matter Ó 2003 Elsevier Ltd. All rights reserved. doi:10.1016/j.jfoodeng.2003.09.007
Transcript of Composition, thermal and rheological behaviour of selected Greek honeys

Journal of Food Engineering 64 (2004) 9–21
www.elsevier.com/locate/jfoodeng
Composition, thermal and rheological behaviourof selected Greek honeys
Athina Lazaridou a, Costas G. Biliaderis a,*, Nicolaos Bacandritsos b,Anna Gloria Sabatini c
a Laboratory of Food Chemistry and Biochemistry, Food Science and Technology Department, School of Agriculture,
Aristotle University of Thessaloniki, Thessaloniki, Greece 541 24b Institute of Veterinary Research of Athens, N.AG.RE.F., 25 Neapoleos Street, Agia Paraskevi, 153 01 Athens, Greece
c Instituto Nazionale di Apicoltura, Via di Saliceto 80, I-41128 Bologna, Italy
Received 6 May 2003; accepted 13 September 2003
Abstract
Several chemical and physicochemical properties (sugar composition, water content, water activity, colour, viscosity, thermal
properties) were determined for 33 Greek honeys from different botanical and geographical origin. The water content and water
activity values varied within 13.0–18.9 g/100 g and 0.528–0.663, respectively. Steady shear and dynamic rheological tests revealed
Newtonian behaviour for all samples examined over the temperature range of 20–60 �C. The steady shear viscosity (g) and loss
modulus (G00) were inversely related to the water content of honey. The temperature dependence of viscosity followed both the
Arrhenius and the Williams–Landel–Ferry models; for the latter model the viscosity data of different samples fitted very well into a
common master curve. The glass transition temperature (Tg) of honeys, as determined by differential scanning calorimetry, varied
between )34 and )47 �C depending on their composition. The plasticizing action of water on honey solids was evident for native
samples as well as among diluted and concentrated honeys; Tg decreased with increasing water content. Despite a broad variation in
sugar composition among the samples, the Tg values vs. water content fitted reasonably well to the Gordon–Taylor empirical
equation.
� 2003 Elsevier Ltd. All rights reserved.
Keywords: Honey; Moisture content; Water activity; Colour; Rheology; Arrhenius model; Williams–Landel–Ferry model; Glass transition
1. Introduction
Honey, the viscous and aromatic product prepared
by bees, mainly from the nectar of flowers or honeydew,is a concentrated solution of various sugars. Honey
contains fructose and glucose (60–85%) as the predomi-
nant monosaccharides, maltose and sucrose as the most
important disaccharides, melezitose as the main trisac-
charide and other low molecular weight oligosaccha-
rides (Doner, 1977; Doner & Hicks, 1982). The
composition of honey (sugars and moisture content) is
responsible for many of the physicochemical propertiesof honey, such as viscosity, hydroscopicity, and granu-
lation. Most honeys are supersaturated solutions of
glucose, which have a tendency to crystallize spontane-
*Corresponding author. Tel.: +2310-471467/+30-310-998-785; fax:
+2310-471257/+30-310-471-457.
E-mail address: [email protected] (C.G. Biliaderis).
0260-8774/$ - see front matter � 2003 Elsevier Ltd. All rights reserved.
doi:10.1016/j.jfoodeng.2003.09.007
ously at room temperature in the form of glucose
monohydrate. Crystallization of honey, commonly
called granulation, is an undesirable process in liquid
honey because it affects the textural properties, makingit less appealing to the consumer. Moreover, in many
cases, crystallization of honey results in increased
moisture of the liquid phase which can allow naturally
occurring yeast cells to multiply causing fermentation of
the product (Doner, 1977). Water content as well as
water activity are the major factors that influence the
keeping quality or storability of honey.
Sensory and physicochemical properties are veryimportant parameters in determining the quality and
acceptability of honey and many studies have been
devoted to explore such determinants of product qua-
lity (Al-Khalifa & Al-Arify, 1999; Anupama, Bhat, &
Sapna, 2003; Bath & Singh, 1999; Popek, 2003; Singh &
Bath, 1997). The composition and properties of honey
vary with the floral and honeydew sources utilized by

Nomenclature
a�, b� chromatic components (red, yellow)
aw water activity
C1, C2 coefficients of WLF equation
Ea activation energy (kJmol�1)
G0 storage modulus (Pa)G00 loss modulus (Pa)
G–T Gordon–Taylor equation
k constant
L� lightness component
p probability level
r correlation coefficient
R universal gas constant (8.314 Jmol�1 K�1)
T temperature (�C, K)
Tg glass transition temperature
Tg1 glass transition of dry sample
Tg2 glass transition of glassy water
w2 weight fraction of waterWLF Williams–Landel–Ferry equation_c shear rate (s�1)
g viscosity (Pa s)
g� complex viscosity (Pa s)
gTg sample viscosity at Tgr shear stress (Pa)
x angular frequency (rad s�1)
10 A. Lazaridou et al. / Journal of Food Engineering 64 (2004) 9–21
honey-bees, as well as by regional and climatic condi-
tions. Some physicochemical parameters have already
been studied for their use in the identification of the
botanical and geographical origin of honey (Gomez
Barez et al., 2000; Popek, 2002; Terrab, Diez, & Here-
dia, 2002).
The rheological behaviour of honey has been investi-
gated for shelf-life, proper handling, packing and pro-cessing issues (White, 1978). The rheological properties
of honey, like many other physical properties, depend on
many factors, including composition and temperature.
The Arrhenius model is widely used for temperature
dependence of a property but models such Williams–
Landel–Ferry (WLF) that include the glass transition
temperature (Tg) as a parameter, have proved equally
useful for the viscosity–temperature relationship of foodsystems (Ollett & Parker, 1990; Soesanto & Williams,
1981; Williams, Landel, & Ferry, 1955). Depending on
concentration, and heating and cooling rates, aqueous
carbohydrate solutions exhibit several thermal events,
the most important being the Tg. At the glass transition
temperature, an amorphous material changes from the
rubbery to the glassy state upon cooling, leading to the
formation of a hard solid. As the stability of foods ismainly dependent on the water content and because Tg isalso highly sensitive to this parameter, the glass transi-
tion concept has been proposed as a useful tool for un-
derstanding the mechanisms of deteriorative processes in
food products and for controlling their shelf-life (Slade &
Levine, 1991). Indeed, the glass transition temperature is
often considered as a reference temperature; below Tg,the food is expected to be stable and above this tem-perature, the difference (T � Tg) between Tg and the
storage temperature T is assumed to control the rate of
physical, chemical and biological changes (Roos, 1995).
The present study was undertaken to determine cer-
tain physicochemical properties of selected Greek hon-
eys, and explore some relationships between them.
2. Materials and methods
2.1. Samples
Thirty-three honey samples were provided by bee-
keepers with guaranteed botanic origin. These honeys
were divided into four main groups according to the
variety type: honeydew from pine, honeydew from fir,mixed floral type, and floral from orange blossom.
Samples were sourced from different geographical areas
of Greece; pine honeydew from Thasos (6 samples),
Halkidiki (6 samples) and Evia (2 samples), fir honey-
dew from Helmos (2 samples) and Vytina (8 samples),
mixed floral from Livadia (3 samples), and orange
blossom floral from Argos (4 samples) and Sparti (2
samples). The botanical/geographical identification wasbased on their colour, aroma, taste and location of the
hives.
2.2. Moisture content and water activity, sugar composi-
tion
Refractive indices of honey samples were measured
using a refractometer at 20 �C and corresponding
moisture content (%) was calculated using the relation-
ship between refractive index and water content
(AOAC, 1990).Water activity (aw) of samples was measured at 20 �C
using an Aqualab 3TE water activity meter (Decagon
Devices Inc., Pullman, WA, USA). The determination
of aw values was performed twice; before and after the
heating of the samples at 50 �C for 1 h. This heat
treatment was carried out to dissolve crystals or nuclei,
which might be present in honey and can influence the
water activity of the system.The sugar composition was determined by a gas
chromatography (GC) method as described by Sabatini,
Marcazzan, Colombo, Carpana, and Serra (2001).
A. Lazaridou et al. / Journal of Food Engineering 64 (2004) 9–21 11
2.3. Colour
Colour was determined by a Metertech UV/VIS
SP8001 spectrophotometer (Metertech Inc., Taipei,
Taiwan) and a Minolta Dimage 5 digital camera. Sam-
ples were heated at 50 �C for 1 h before measurement to
ensure melting of any possibly formed crystals. Colour
was determined as absorbance at 420 nm after dilution
of honey with distilled water at a ratio 1:5 (Bath &Singh, 1999). Before measurement, mixtures of honey
and water were heated for better mixing and filtered for
removal of any coarse particles (plant residues, pollen),
which may also influence the colour. Images of samples
were taken by the digital camera with a proper lighting
system as described by Papadakis, Abdul-Malek,
Kamdem, and Yam (2000). L�, a� and b� colour para-
meters (CIE, 1976) were obtained using the Photoshopsoftware (v6.0, Adobe Systems Inc., San Jose, CA). L� is
the luminance or lightness component, which ranges
from 0 to 100, and a� and b� are the two chromatic
components, which range from )120 to 120 (a� from
green to red and b� from blue to yellow) (Adobe
Photoshop 5.0 User Guide for Machintosh and
Windows, 1998). The software uses a scale, ranging
from 0 to 255, to characterize Lightness, as well as thevalues of a and b. To convert these parameters to L�, a�,and b� the following formulas were used:
L� ¼ ðLightness=250Þ � 100 ð1Þ
a� ¼ ð240a=255Þ � 120 ð2Þ
b� ¼ ð240b=255Þ � 120 ð3Þ
2.4. Rheology
Rheological properties of honey were studied by arotational Physica MCR 300 rheometer (Physica Mess-
technic GmbH, Stuttgart, Germany) using a concentric
cylinder (diameter of cup and bob, 28.92 and 26.66 mm,
respectively) geometry; temperature was regulated by a
Paar Physica circulating bath and a controlled peltier
system (TEZ 150P/MCR) with an accuracy of ±0.1 �C.The data of the rheological measurements were analyzed
with the supporting rheometer software US200 V2.21.All honey samples were heated at 50 �C for 1 h before
rheological measurements to melt any crystals present
and to remove the air bubbles, factors that can influence
the viscosity of honey. Two types of measurements were
performed: (a) flow behaviour by measuring steady
shear viscosity (g) and shear stress (r) over a range of
shear rates ( _c) of 0.1–500 s�1 at 20, 30, 40, 50 and 60 �C;and (b) oscillatory measurements to obtain the storageand loss moduli (G0, G00) and complex viscosity (g�) at astrain level of 0.1% and a range of angular frequencies of
3–300 rad s�1 at 20 �C.
Temperature effects on steady shear viscosity wereanalysed using the Arrhenius relationship:
g ¼ g0 eðEa=RT Þ ð4Þ
where g is the viscosity at temperature T , g0 is a pre-
exponential factor, Ea is the activation energy for flow, Ris the perfect gas constant and T is the absolute tem-
perature (K).
The temperature dependence of honey viscosity wasalso described using the WLF model (Williams et al.,
1955):
logggTg
!¼ �C1ðTg � T Þ
C2 þ ðTg � T Þ ð5Þ
where Tg is the glass transition temperature, g is the
viscosity at temperature T , gTg is the viscosity of sample
at Tg and C1 and C2 are the WLF constants. Experi-
mental data were fitted to the model using the TableCurve 2D software (v4.0, SPSS Inc., Chicago, IL).
2.5. Differential scanning calorimetry
The glass transition temperature (Tg) of honeys was
determined by differential scanning calorimetry (DSC)
using a PL DSC-Gold calorimeter (Polymer Labs. Ltd,
Epsom, UK). Temperature calibration was made with
cyclohexane, dodecane and octane, whereas heat flow
calibration was made by reference to the known meltingenthalpy of indium and gallium (purity 99.99%) from
Goodfellows Metals (Biliaderis, Lazaridou, & Arvani-
toyannis, 1999).
For studying the effect of moisture on Tg, 14 honey
samples were chosen covering a moisture content range
of 13.0–18.9%. For increasing the above range the
sample with the lowest moisture content (13%) was
either diluted with water or concentrated under vacuum(at 50 �C) to the following levels of moisture content:
26.9%, 23.4%, 20.0%, 16.5%, 11.9%, 11.0% and 10.2%.
The native honey samples as well as the diluted and
concentrated samples were hermetically sealed into
stainless steel pans (�40–45 mg) and analysed by calo-
rimetry under continuous flow of dry N2 gas (20
mlmin�1) to avoid condensation of moisture. First, the
pans were heated from +20 to +50 �C at a heating rateof 10 �Cmin�1 and kept at +50 �C for 3–5 min to ensure
the melting of any crystals and reach at thermodynamic
equilibrium. The samples were then quenched–cooled
with liquid N2 to )100 �C and reheated to +50 �C at the
same heating rate (10 �Cmin�1). The Tg was determined
in the latter heating scans as the onset temperature of
the step-like decrease in the heat flow.
Data analysis to fit experimental values of Tg to theempirical Gordon–Taylor (G–T) model (Gordon &
Taylor, 1952) was performed using the Table Curve 2D
software:

12 A. Lazaridou et al. / Journal of Food Engineering 64 (2004) 9–21
Tg ¼w1Tg1 þ kw2Tg2
w1 þ kw2
ð6Þ
where Tg1 is the glass transition temperature of the
sample at zero moisture content, w1 is the weight frac-
tion of dry solids, Tg2 is the glass transition temperature
for glassy water, w2 is the weight fraction of water and kis a constant. The constructed G–T plots were based onthe best data fitting to the equation (i.e. optimization for
both parameters, k and Tg1), where a Tg of )138 �C was
used for water (Sugisaki, Suga, & Seki, 1968).
3. Results and discussion
3.1. Water content, water activity, sugar composition,
colour
The results of analysis of some physicochemical pa-
rameters namely, moisture, water activity (aw), and
colour (absorbance at 420 nm and L�, a�, and b� colourparameters) for the Greek honeys are summarized in
Table 1. The refractive index varied from 1.4892 to
1.5043 and the corresponding moisture content ranged
between 13.0% and 18.9%; these values are within the
range found by other researchers and indicate a proper
degree of maturity for these honey samples. In general,
the moisture content in different varieties of honey may
be as low as 13% (White, 1978) and as high as 29%(Junzheng & Changying, 1998). For example, moisture
contents have been found in the range of 14.0–16.9% for
Saudi honeys (Al-Khalifa & Al-Arify, 1999), 13.8–17.8%
for Spanish honeys (Gomez Barez et al., 2000), 15.4–
18.1% for Polish honeys (Popek, 2003), 16.8–20.3% for
Moroccan honeys (Terrab et al., 2002), and 18.7–21.8%
for Indian honeys (Singh & Bath, 1997). The difference
in moisture content was significant between all Greekhoneys; however, Greek regulations require <21%
moisture for safety from fermentation.
Honey is an intermediate moisture food with a water
activity of about 0.6 and is therefore shelf stable for a
reasonable period of time. The low aw (high osmotic
environment) does not support microbial growth, pre-
venting fermentation of honey by osmophilic yeast. The
aw values of Greek honeys obtained after heating thesamples at 50 �C varied within the range 0.528–0.663
(Table 1), whereas for most of the samples the corre-
sponding values before heating were found higher. It is
well known that crystal formation in sugars results to
water release, thus increasing water availability.
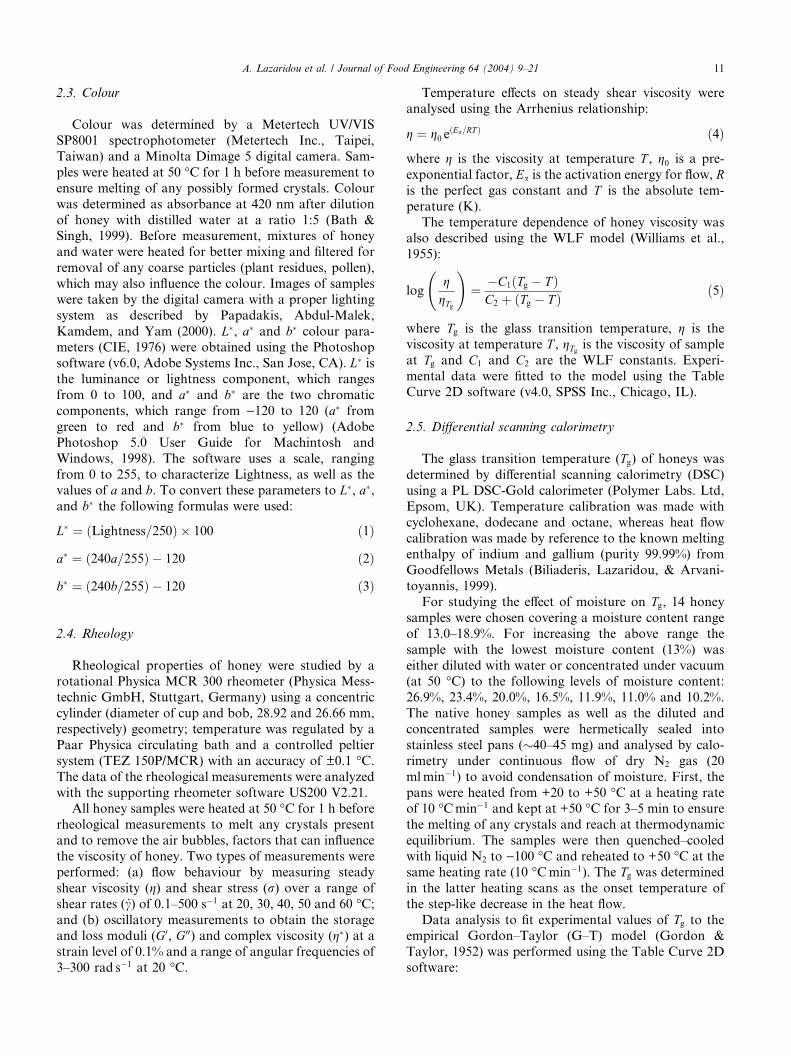
Table 2 shows the composition of sugars identified in
the honey samples. The monosaccharides fructose (22.1–
41.3%) and glucose (13.5–36.3%) were the main sugars,with fructose being always the most abundant. The
honeys with lower percentages of fructose and glucose
were those with a non-floral origin (i.e. honeydew hon-
eys). Among the disaccharides, maltose was the mostabundant one, ranging between 1.9% and 6.7%. The
relatively low levels of sucrose for most samples indicate
that the selected honeys were at an advanced stage of
ripening. Several trisaccharides were also identified and
quantified, namely raffinose, erlose, melezitose, panose,
isomaltotriose and maltotriose. It was of interest to note
that melezitose was present in relatively high amounts
(9.1–14.4%) for most of the honeydew-fir samples.The colour of honey is related to the content of
phenolics, HMF, pollen and minerals (Perez-Arquille,
Conchello, Arino, Juan, & Herresa, 1994). The absor-
bance at 420 nm varied between 0.113 and 0.915 (Table
1) and is in agreement with the finding of other authors
(Bath & Singh, 1999; Singh & Bath, 1997). It is known
that orange blossom honeys are honeys with very light
colour, which concurs with the lowest values in the ab-sorbance range for the samples shown in Table 1. The
colour parameters L�, a� and b� measured using the
digital camera were within the range of 35.79–59.56,
()5.06)–27.27 and 16.91–42.92, respectively. These val-
ues are in close agreement with those found by others
researchers using chromatometers (Anupama et al.,
2003; Popek, 2002, 2003). It is worthy to note, that or-
ange blossom honeys were found to have high values forlightness (L�), and low values for red (a�) and yellow (b�)components, showing similar responses to the results
from absorbance measurements at 420 nm.
3.2. Rheological behaviour
Fig. 1 illustrates the steady shear flow curves (Fig. 1a)
and a typical mechanical spectrum (Fig. 1b) for a Greek
honey sample. All honey samples behaved as Newtonian
fluids at all temperatures of measurement (Fig. 2).
Apparent viscosity (g) and complex viscosity (g�) wereconstant, regardless of the shear rate and angular fre-quency, respectively (Fig. 1). Moreover, the G00 was
dependent on frequency and greater than G0 at all fre-
quencies (Fig. 1b). In most of the published works,
honey was reported to have a Newtonian behaviour
(Abu-Jdayil, Al-Majeed Ghzawi, Al-Malah, & Zaitoun,
2002; Bhandari, D’Arcy, & Chow, 1999; da Costa &
Pereira, 2002).
Values of various rheological parameters obtainedfrom steady shear and dynamic measurements for all
samples are summarized in Table 3. These values ob-
tained from measurements at 20 �C varied within the
wide range of 9.9–200.0 (Pa s) for apparent viscosity (g),0.15–19.10 (Pa) for storage modulus (G0), 64–1682 (Pa)
for loss modulus (G00), and 7.7–164.4 (Pa s) for complex
viscosity. The differences among samples could be at-
tributed to natural variations in composition (individualsugars and water content), as they belong to different
plant species-specific varieties and collected from dif-
ferent geographical locations in Greece. It is clear that

Table 1
Some physicochemical parameters in 33 Greek honeys
Sample No. Botanic/geographical origin Moisture content,
Xw (g/100 g)
Water activity
(20 �C) aftermelting at 50 �C
Colour
Absorbance at
420 nm
L� a� b�
1 Honeydew (pine)/Thasos 18.9 0.610 0.387 45.48 12.13 40.15
2 Honeydew (pine)/Thasos 17.4 0.613 0.314 42.98 13.48 40.09
3 Honeydew (pine)/Thasos 18.3 0.615 0.335 43.40 12.75 40.49
4 Honeydew (pine)/Thasos 13.9 0.567 0.712 40.72 18.35 41.41
5 Honeydew (pine)/Thasos 15.4 0.570 0.702 42.18 15.05 40.42
6 Honeydew (pine)/Thasos 15.2 0.559 0.675 43.80 16.17 41.60
7 Honeydew (pine)/Halkidiki 15.0 0.580 0.703 45.38 9.48 38.48
8 Honeydew (pine)/Halkidiki 14.9 0.576 0.738 43.42 15.21 40.77
9 Honeydew (pine)/Halkidiki 15.4 0.576 0.770 44.32 11.91 36.76
10 Honeydew (pine)/Halkidiki 15.7 0.575 0.791 39.24 17.32 39.42
11 Honeydew (pine)/Halkidiki 15.4 0.577 0.651 43.70 20.76 42.79
12 Honeydew (pine)/Halkidiki 14.8 0.577 0.783 42.30 16.16 40.96
13 Honeydew (pine)/Evia 16.3 0.570 0.593 40.14 19.36 39.96
14 Honeydew (pine)/Evia 14.8 0.663 0.525 44.04 16.58 41.05
15 Honeydew (fir)/Helmos 13.4 0.562 0.557 41.63 19.36 41.53
16 Honeydew (fir)/Helmos 13.0 0.565 0.476 41.63 17.35 40.11
17 Honeydew (fir)/Vytina 13.9 0.570 0.428 39.79 18.49 40.59
18 Honeydew (fir)/Vytina 13.3 0.561 0.469 40.51 16.09 39.67
19 Honeydew (fir)/Vytina 14.6 0.555 0.450 41.66 16.35 39.65
20 Honeydew (fir)/Vytina 15.0 0.556 0.357 43.48 21.55 42.92
21 Honeydew (fir)/Vytina 14.1 0.581 0.405 39.87 18.75 38.95
22 Honeydew (fir)/Vytina 14.0 0.581 0.222 39.80 17.65 38.08
23 Honeydew (fir)/Vytina 15.2 0.609 0.378 41.45 16.16 39.65
24 Honeydew (fir)/Vytina 13.8 0.578 0.395 42.02 13.77 38.71
25 Floral/Livadia 13.8 0.528 0.915 42.97 27.27 39.50
26 Floral/Livadia 14.1 0.528 0.831 35.79 23.49 35.59
27 Floral/Livadia 15.1 0.550 0.682 39.30 21.30 40.84
28 Floral (Orange blossom)/Argos 15.1 0.542 0.183 47.34 1.70 22.72
29 Floral (Orange blossom)/Argos 15.8 0.540 0.161 45.75 0.89 19.85
30 Floral (Orange blossom)/Argos 16.2 0.584 0.127 59.56 )5.06 16.91
31 Floral (Orange blossom)/Argos 17.9 0.577 0.113 45.76 )2.79 18.93
32 Floral (Orange blossom)/Sparti 15.6 0.548 0.134 51.62 7.29 28.93
33 Floral (Orange blossom)/Sparti 15.6 0.546 0.115 47.18 2.96 23.31
A.Lazarid
ouet
al./JournalofFoodEngineerin
g64(2004)9–21
13
Table 2
Distribution of the levels of various sugars (%) among the selected honey samples
Sample
No.
Fructose
(g/100 g)
Glucose
(g/100 g)
Sucrose
(g/100 g)
Trehalose
(g/100 g)
Maltose
(g/100 g)
Isomal-
tose
(g/100 g)
Raffinose
(g/100 g)
Erlose
(g/100 g)
Melezi-
tose
(g/100 g)
Panose
(g/100 g)
Isomalto-triose
(g/100 g)
Malto-triose
(g/100 g)
Malto-tetraose
(g/100 g)
1 29.9 26.3 0.7 <0.1 4.0 1.4 0.6 3.1 0.1 0.2 0.1 0.2 7.7
2 29.0 25.6 0.8 0.1 3.9 1.4 0.6 3.3 0.1 0.2 0.1 0.2 7.9
3 30.5 26.4 0.8 <0.1 4.2 1.4 0.6 3.3 0.1 0.2 0.1 0.2 8.0
4 30.5 24.5 0.2 0.1 6.7 3.0 0.5 0.6 0.1 0.5 0.2 0.3 0.7
5 30.5 23.6 0.1 <0.1 6.1 3.2 0.2 0.6 0.1 0.5 0.2 0.3 0.7
6 30.6 23.7 0.1 <0.1 6.2 2.9 0.2 0.6 0.1 0.5 0.2 0.3 0.6
7 22.5 18.4 0.1 0.1 4.4 2.4 0.3 1.0 0.1 0.4 0.1 0.3 0.4
8 23.0 19.6 0.1 <0.1 4.4 2.4 0.6 1.1 0.1 0.4 0.1 0.3 0.4
9 22.2 19.0 0.1 <0.1 4.1 2.0 0.6 1.0 0.1 0.2 0.1 0.1 0.2
10 23.9 21.1 0.1 0.1 4.6 2.1 0.5 0.8 0.1 0.3 0.1 0.2 0.4
11 24.1 21.1 0.1 0.1 4.7 2.2 0.5 0.8 0.1 0.4 0.2 0.3 0.6
12 24.1 21.2 0.1 0.1 4.6 2.0 0.5 0.8 0.1 0.3 0.1 0.3 0.4
13 32.3 28.7 0.6 0.6 4.3 1.2 0.5 1.4 2.0 0.2 <0.1 0.2 0.3
14 29.7 25.5 1.4 0.4 4.2 1.0 0.6 2.8 1.9 0.2 <0.1 0.2 0.2
15 27.3 18.6 0.1 1.7 3.5 1.1 0.8 0.6 9.1 0.6 0.1 0.3 0.3
16 24.1 16.0 0.1 2.9 2.7 0.8 0.9 0.8 10.5 0.4 <0.1 0.3 0.3
17 25.7 16.7 0.1 2.1 3.1 1.1 0.6 0.4 11.0 1.0 0.1 0.4 0.3
18 28.1 19.0 0.2 1.6 3.6 1.0 0.5 0.5 9.8 0.7 <0.1 0.3 0.2
19 32.5 24.5 0.2 0.8 5.4 1.2 1.0 2.1 1.3 0.1 <0.1 0.5 0.5
20 31.1 25.0 0.2 0.8 5.3 0.9 1.0 2.1 1.4 0.1 <0.1 0.4 0.3
21 22.1 13.6 0.1 3.1 1.9 0.8 0.9 0.5 14.4 1.0 <0.1 0.4 0.4
22 22.2 13.5 0.1 3.0 1.9 0.7 0.9 0.5 14.2 0.9 <0.1 0.3 0.3
23 29.0 19.7 0.1 1.5 3.6 0.9 0.3 0.6 10.5 0.6 <0.1 0.2 0.2
24 22.1 14.2 0.2 2.9 2.2 1.0 0.7 0.4 13.0 1.1 0.1 0.4 0.3
25 34.8 29.2 0.2 0.6 4.7 0.9 0.4 0.8 2.5 0.2 <0.1 0.1 0.1
26 34.1 29.0 0.1 0.6 4.6 1.1 0.3 0.8 2.4 0.2 <0.1 0.2 0.2
27 34.9 30.0 0.1 0.7 4.9 1.3 0.4 0.4 2.2 0.2 <0.1 0.3 0.3
28 39.1 32.9 2.7 0.1 4.4 0.4 <0.1 0.9 0.3 <0.1 <0.01 <0.1 <0.01
29 38.1 32.8 2.7 0.1 4.3 0.4 0.5 0.8 0.3 <0.1 <0.01 <0.1 <0.01
30 39.1 36.3 0.6 0.1 3.0 0.4 0.5 0.6 0.2 <0.1 <0.01 <0.1 <0.01
31 39.9 34.7 0.6 0.1 3.3 0.5 0.5 0.6 0.2 <0.1 <0.01 0.1 <0.01
32 39.9 35.4 1.6 0.1 3.6 0.6 0.5 0.8 <0.1 0.1 <0.1 0.1 <0.01
33 41.3 32.7 1.7 <0.1 3.6 0.4 0.5 0.7 <0.1 <0.1 <0.01 <0.1 <0.01
14
A.Lazarid
ouet
al./JournalofFoodEngineerin
g64(2004)9–21

(a) (b)
Fig. 1. Steady shear viscosity profiles of three Greek honey samples (a) and a representative mechanical spectrum of a Greek honey (b) at 20�C.
Fig. 2. Temperature effect on viscosity of a representative Greek honey
and its Arrhenius plot of viscosity (at 10 s�1) vs. temperature (inset).
A. Lazaridou et al. / Journal of Food Engineering 64 (2004) 9–21 15
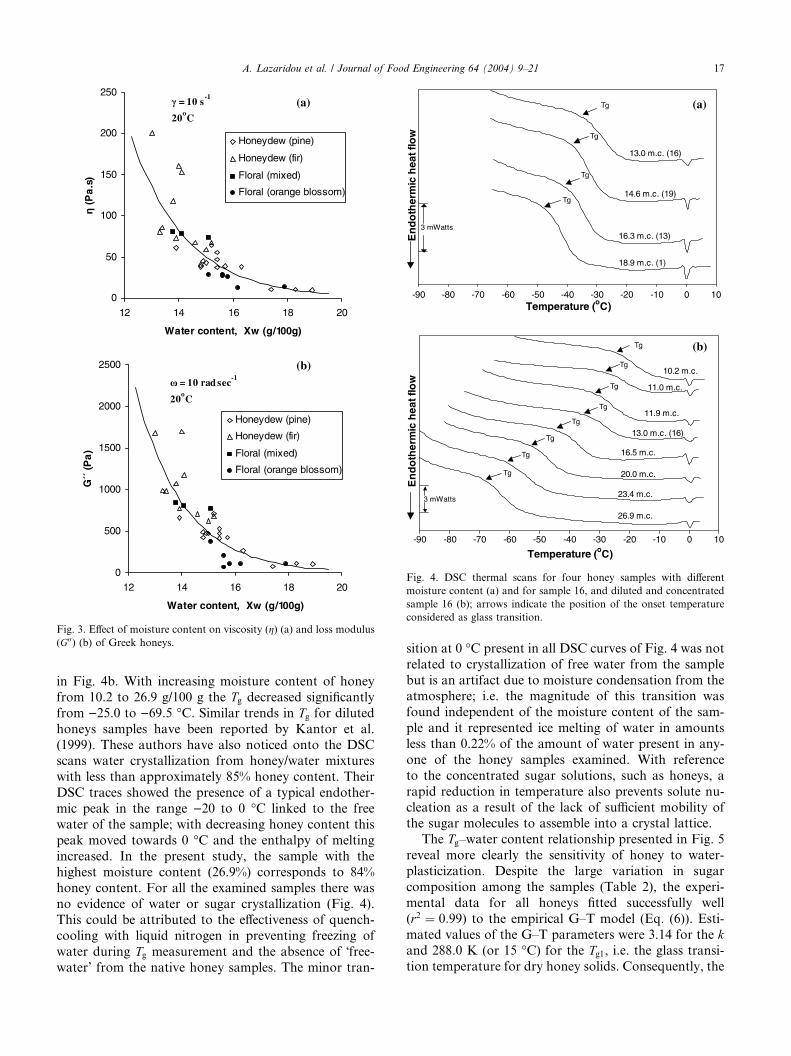
the viscosity of honey decreases with water content. As
shown in Fig. 3a there was a significant relationship
between moisture content and apparent viscosity, as
described by an exponential function: g ¼ 90071
e�0:4997Xw (r2 ¼ 0:80, p < 0:05). Such moisture content
dependence of viscosity has been also noticed by otherauthors (Anupama et al., 2003; Junzheng & Changying,
1998; Sopade et al., 2002; Zaitoun, Ghzawi, Al-Malah,
& Abu-Jdayil, 2001). Moreover, a relationship between
moisture content and the loss modulus, estimated by
dynamic rheological measurements was observed (Fig.
3b); the experimental data fitted into an exponential
equation: G00 ¼ 2 � 106 e�0:5547Xw (r2 ¼ 0:72, p < 0:05). Itis worthy here to note that the g values were very closewith the respective g� values for each individual sample
(Table 3). It appears therefore that the viscosity data
follow the Cox–Merz rule (Cox & Merz, 1958), as ex-
pected for Newtonian fluids. According to this rule the
complex viscosity from small-deformation oscillation
measurements and the steady shear viscosity from ro-
tational measurements superimpose closely at equiva-
lent numerical values of angular frequency (x, rad s�1)
and shear rate ( _c, s�1) for non-interacting moleculardispersions.
The temperature effects on honey viscosity are shown
in Fig. 2; as expected, the viscosity was reduced with
increasing temperature. The temperature dependence of
g is adequately described using the Arrhenius relation-
ship (Fig. 2, inset); the correlation coefficients (r2) for
each sample are given in Table 3 and were all greater
than 0.91. The observation that the temperature de-pendence of viscosity follows the Arrhenius relationship
has been also reported by other researchers for honey
(Al-Malah, Abu-Jdayil, Zaitoun, & Ghzawi, 2001; Bath
& Singh, 1999; Bhandari et al., 1999; Sopade et al.,
2002) as well as for other sugar-rich liquid foods such
as fruit juice concentrates and sugar syrups (Khalil,
Ramakrishna, Nanjundaswamy, & Patwardhan, 1989;
Manohar, Ramakrishna, & Udayasankar, 1991). Theactivation energies (Ea) for flow estimated from the
slope of the linear relationship of logðgÞ vs. ð1=T Þ are
presented in Table 3 for all samples and varied between
69.1 and 93.75 kJmol�1. Activation energy reflects the
sensitivity of viscosity to temperature changes; higher Ea
means that the viscosity is relatively more sensitive to
a temperature change. There was an inverse linear
relationship between Ea and moisture content (r2 ¼ 0:61,p < 0:01). Although the Arrhenius formalism seems
to adequately describe the temperature dependence
of honey viscosity, it gives relatively high values for
the activation energy, which are more typical of
chemical reactions. Similar observations concerning the

Table 3
Rheological parameters of 33 Greek honeys
Sample No. Viscosity (Pa s)
(20 �C)Ea (kJmol�1) G0 (Pa) (x ¼ 10 rad s�1)
(20 �C)G00 (Pa) (x ¼ 10 rad s�1)
(20 �C)Complex viscosity
(Pa s) (20 �C)
1 9.9 72.69 (r2 ¼ 0:97) 3.01 99 9.0
2 10.5 73.62 (r2 ¼ 0:97) 0.40 80 7.7
3 10.7 74.09 (r2 ¼ 0:97) 0.33 111 10.4
4 61.1 89.09 (r2 ¼ 0:97) 4.46 665 62.2
5 55.5 88.13 (r2 ¼ 0:97) 2.88 526 51.4
6 63.6 88.74 (r2 ¼ 0:97) 4.87 708 66.2
7 42.8 82.79 (r2 ¼ 0:97) 3.02 476 43.1
8 44.4 83.79 (r2 ¼ 0:97) 2.39 467 42.2
9 46.8 84.15 (r2 ¼ 0:97) 3.91 469 42.4
10 39.0 80.88 (r2 ¼ 0:96) 2.87 424 38.4
11 37.6 80.55 (r2 ¼ 0:96) 2.22 418 37.8
12 39.8 82.29 (r2 ¼ 0:97) 2.79 429 38.8
13 38.5 79.39 (r2 ¼ 0:95) 2.10 928 34.1
14 38.4 80.36 (r2 ¼ 0:96) 6.51 265 35.9
15 86.3 86.20 (r2 ¼ 0:96) 7.83 980 88.6
16 200.0 93.75 (r2 ¼ 0:96) 10.70 1682 164.4
17 73.2 84.00 (r2 ¼ 0:96) 3.40 772 69.7
18 80.3 85.23 (r2 ¼ 0:96) 4.91 988 89.3
19 67.4 87.33 (r2 ¼ 0:97) 3.50 708 64.0
20 59.0 84.21 (r2 ¼ 0:96) 2.98 624 56.4
21 154.0 89.77 (r2 ¼ 0:96) 19.10 1177 115.0
22 160.0 89.56 (r2 ¼ 0:96) 10.20 1701 167.0
23 67.6 89.65 (r2 ¼ 0:98) 5.58 683 67.5
24 118.0 93.33 (r2 ¼ 0:98) 4.30 1074 105.0
25 79.8 90.22 (r2 ¼ 0:97) 5.64 839 75.8
26 77.9 89.74 (r2 ¼ 0:97) 4.40 803 78.9
27 73.8 88.59 (r2 ¼ 0:97) 5.90 773 69.8
28 28.8 78.87 (r2 ¼ 0:96) 3.75 376 34.0
29 26.2 79.61 (r2 ¼ 0:96) 0.94 108 20.5
30 12.6 83.06 (r2 ¼ 0:99) 0.33 106 10.4
31 13.2 75.40 (r2 ¼ 0:98) 0.15 100 9.9
32 28.6 89.75 (r2 ¼ 0:99) 0.31 208 20.4
33 26.8 90.17 (r2 ¼ 0:99) 2.35 64 26.8
16 A. Lazaridou et al. / Journal of Food Engineering 64 (2004) 9–21
magnitude of Ea derived from viscosity data of three
Jordanian honey samples (Ea 95.6–97.7 kJmol�1, tem-
perature range 20–50 �C) have been made in a previous
study by Al-Malah et al. (2001).
3.3. DSC thermal behaviour
The effect of moisture content (m.c.) on the DSC
thermal traces of four representative native honey
samples is demonstrated in Fig. 4a. The glass transition
temperature shifted to lower temperatures with increaseof moisture content due to the plasticization effect of
water. Water is a very effective plasticizer for hydro-
philic components, such as low molecular weight car-
bohydrates (Levine & Slade, 1988); this effect has been
related to the ability of water molecules to weaken hy-
drogen bonds, dipole–dipole, and intra- and inter mole-
cular interactions (Matveev, Grinberg, & Tolstoguzov,
2000). The glass transition temperatures of the honeysamples are summarized in Table 4, varying between
)34.6 and )47.2 �C for a moisture content range of
13.0–18.9 g/100 g. These values are similar to those
found by other researchers; i.e. a range from )40 to )46�C for honey samples with 15.8–18.0% moisture content
(Sopade, Bhandari, Halley, D’Arcy, & Caffin, 2001;
Sopade et al., 2002), from )37.5 to )42.5 �C for samples
with m.c. about 17.5% (Cordella et al., 2002), and from)42.5 to )50.7 �C for samples with undetermined m.c.
(Kantor, Pitsi, & Thoen, 1999) have been reported. It is
generally accepted that differences in the composition of
carbohydrate solutions could contribute to the variation
in the Tg; i.e. the glass transition temperature is a func-
tion of both moisture content and the type of solute
(Slade & Levine, 1991). Recently, the Tg value responsesto the modification of chemical composition of honeyhas been used, concomitantly with other thermal events
detected by DSC, to develop a new method for adulte-
ration detection in this product (Cordella et al., 2002);
these authors have found that adulterations of honey by
industrial sugar syrups can be detected calorimetrically
up to a minimum of 5–10% addition.
The plasticizing action of water is also obvious at
comparative DSC traces of diluted and concentratedhoney samples using a native sample (16), as illustrated
(a)
(b)
Fig. 3. Effect of moisture content on viscosity (g) (a) and loss modulus
(G00) (b) of Greek honeys.
(a)
(b)
Fig. 4. DSC thermal scans for four honey samples with different
moisture content (a) and for sample 16, and diluted and concentrated
sample 16 (b); arrows indicate the position of the onset temperature
considered as glass transition.
A. Lazaridou et al. / Journal of Food Engineering 64 (2004) 9–21 17
in Fig. 4b. With increasing moisture content of honey
from 10.2 to 26.9 g/100 g the Tg decreased significantly
from )25.0 to )69.5 �C. Similar trends in Tg for dilutedhoneys samples have been reported by Kantor et al.
(1999). These authors have also noticed onto the DSCscans water crystallization from honey/water mixtures
with less than approximately 85% honey content. Their
DSC traces showed the presence of a typical endother-
mic peak in the range )20 to 0 �C linked to the free
water of the sample; with decreasing honey content this
peak moved towards 0 �C and the enthalpy of melting
increased. In the present study, the sample with the
highest moisture content (26.9%) corresponds to 84%honey content. For all the examined samples there was
no evidence of water or sugar crystallization (Fig. 4).
This could be attributed to the effectiveness of quench-
cooling with liquid nitrogen in preventing freezing of
water during Tg measurement and the absence of �free-water’ from the native honey samples. The minor tran-
sition at 0 �C present in all DSC curves of Fig. 4 was not
related to crystallization of free water from the sample
but is an artifact due to moisture condensation from theatmosphere; i.e. the magnitude of this transition was
found independent of the moisture content of the sam-
ple and it represented ice melting of water in amounts
less than 0.22% of the amount of water present in any-
one of the honey samples examined. With reference
to the concentrated sugar solutions, such as honeys, a
rapid reduction in temperature also prevents solute nu-
cleation as a result of the lack of sufficient mobility ofthe sugar molecules to assemble into a crystal lattice.
The Tg–water content relationship presented in Fig. 5
reveal more clearly the sensitivity of honey to water-
plasticization. Despite the large variation in sugar
composition among the samples (Table 2), the experi-
mental data for all honeys fitted successfully well
(r2 ¼ 0:99) to the empirical G–T model (Eq. (6)). Esti-
mated values of the G–T parameters were 3.14 for the kand 288.0 K (or 15 �C) for the Tg1, i.e. the glass transi-
tion temperature for dry honey solids. Consequently, the

Fig. 5. Relationship of glass transition and moisture content for honey;
the solid line gives the G–T plot of the experimental data from DSC
measurements.
Table
4
Glass
transitiontemperaturesofGreek
honeysandestimatedparametersoftheWLFmodel
Sample
No.
Moisture
con-
tent(g/100g)
T g,K
(�C)experim
ental
data
from
DSC
WLF(�u
niversal’constants)
WLF(T
gfrom
DSC
experim
entaldata)
T g,K
(�C)(predicted)
logðg
T gÞ(Pas)
r2logðg
T gÞ(Pas)
C1
C2(K
)r2
118.9
225.85()47.15)
214.09()58.91)
11.52
0.99
13.10
17.68
30.90
0.99
217.4
227.45()45.55)
213.40()59.60)
11.57
0.99
14.77
18.98
24.81
0.99
413.9
235.77()37.23)
226.73()46.27)
11.57
0.99
15.26
19.38
25.07
0.99
515.4
234.31()38.69)
226.04()46.96)
11.57
0.99
15.73
19.89
24.75
0.99
915.4
233.15()39.85)
222.72()50.28)
11.69
0.99
16.50
20.41
22.44
0.99
13
16.3
232.96()40.04)
219.65()53.35)
11.75
0.98
21.72
25.18
14.89
0.98
16
13.0
237.23()35.77)
230.53()42.47)
11.81
0.99
21.09
24.56
17.11
0.99
17
13.9
238.40()34.60)
223.17()49.83)
11.85
0.99
20.00
23.17
15.12
0.99
19
14.6
234.31()38.69)
225.65()47.39)
11.68
0.99
17.75
21.60
20.92
0.99
21
14.1
236.36()36.64)
227.68()45.32)
11.89
0.99
20.79
24.17
16.91
0.99
26
14.1
235.77()37.23)
227.42()45.58)
11.62
0.99
17.64
21.52
20.92
0.99
30
16.2
229.20()43.80)
209.88()63.12)
11.80
0.95
21.59
25.01
13.95
0.94
31
17.9
229.06()43.94)
214.92()58.08)
11.60
0.99
12.85
17.20
29.71
0.99
33
15.6
228.90()44.09)
219.96()53.04)
11.61
0.99
18.66
22.68
20.20
0.99
18 A. Lazaridou et al. / Journal of Food Engineering 64 (2004) 9–21
G–T model could be an important tool for the predic-
tion of Tg. Another usefulness of the above modeling is
the determination of Tg1, a temperature that it could not
be measured experimentally, as it is impossible to re-
move the strongly bound water from honey.
Being a molecular phenomenon, the glass transitionhas been often related to many food properties that
comprise mechanical/structural relaxation processes. The
WLF equation (Eq. (5)) includes the glass transition
temperature as a parameter and has been suggested to be
applicable in predicting the temperature dependence of
viscosity, a primary property that describes mechanical
relaxation of mobile components. This equation has been
claimed as a more appropriated model than the Arrhe-nius relationship in the rubbery domain; i.e. between Tgand about Tg þ 100 �C (Roos, 1995; Slade & Levine,
1991). The WLF equation specifies a much stronger
temperature dependence of viscosity compared to that
predicted by the Arrhenius formalism. In this context, the
Tg is considered as a reference temperature: below Tg,the viscosity is very high, whereas above this temperature,
the difference between storage and processing tempera-tures (T � Tg) is assumed to control the rate of viscosity
changes in the product. Generally, the viscosity in the
glassy state varies between 107 and 1016 Pa s as has been
estimated and/or extrapolated for a range of materials by
various procedures (Maltini & Manzocco, 1998; Ollett &
Parker, 1990; Peleg, 1992; Slade&Levine, 1993; Soesanto
& Williams, 1981; Williams et al., 1955).
3.4. WLF modeling of viscosity
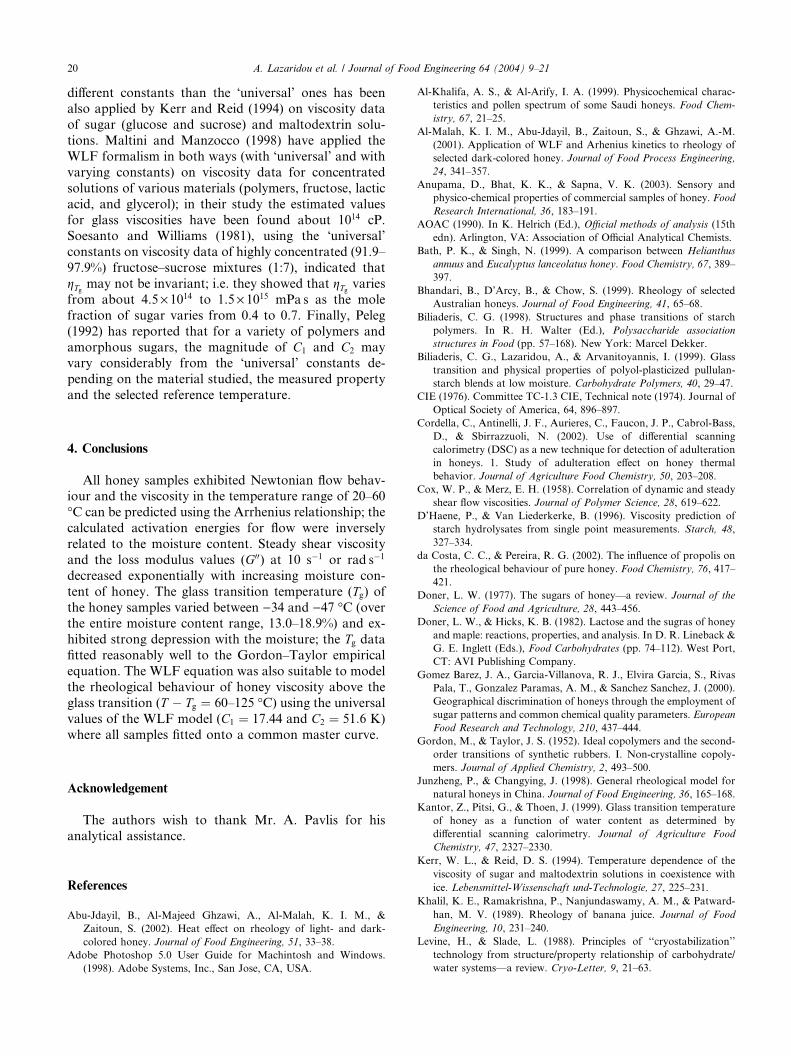
The viscosity data of 14 honey samples were fitted to
the WLF model to test its applicability at temperatures
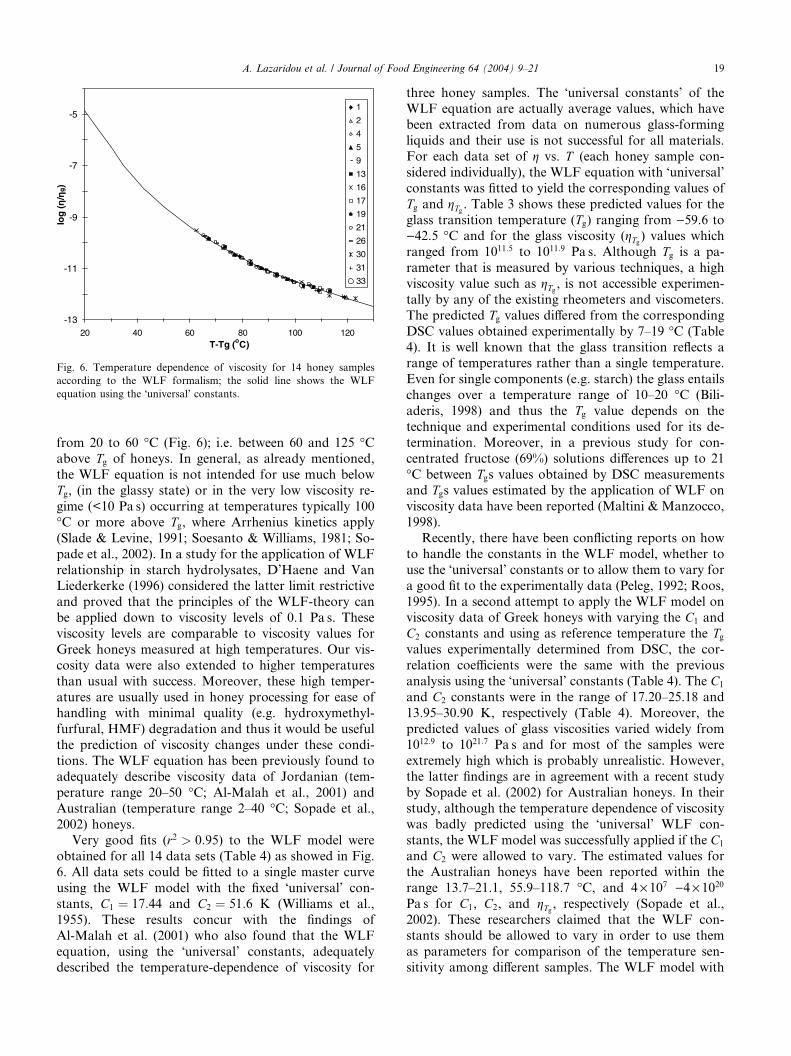
Fig. 6. Temperature dependence of viscosity for 14 honey samples
according to the WLF formalism; the solid line shows the WLF
equation using the �universal’ constants.
A. Lazaridou et al. / Journal of Food Engineering 64 (2004) 9–21 19
from 20 to 60 �C (Fig. 6); i.e. between 60 and 125 �Cabove Tg of honeys. In general, as already mentioned,
the WLF equation is not intended for use much below
Tg, (in the glassy state) or in the very low viscosity re-
gime (<10 Pa s) occurring at temperatures typically 100
�C or more above Tg, where Arrhenius kinetics apply
(Slade & Levine, 1991; Soesanto & Williams, 1981; So-
pade et al., 2002). In a study for the application of WLF
relationship in starch hydrolysates, D’Haene and VanLiederkerke (1996) considered the latter limit restrictive
and proved that the principles of the WLF-theory can
be applied down to viscosity levels of 0.1 Pa s. These
viscosity levels are comparable to viscosity values for
Greek honeys measured at high temperatures. Our vis-
cosity data were also extended to higher temperatures
than usual with success. Moreover, these high temper-
atures are usually used in honey processing for ease ofhandling with minimal quality (e.g. hydroxymethyl-
furfural, HMF) degradation and thus it would be useful
the prediction of viscosity changes under these condi-
tions. The WLF equation has been previously found to
adequately describe viscosity data of Jordanian (tem-
perature range 20–50 �C; Al-Malah et al., 2001) and
Australian (temperature range 2–40 �C; Sopade et al.,
2002) honeys.Very good fits (r2 > 0:95) to the WLF model were
obtained for all 14 data sets (Table 4) as showed in Fig.
6. All data sets could be fitted to a single master curve
using the WLF model with the fixed �universal’ con-
stants, C1 ¼ 17:44 and C2 ¼ 51:6 K (Williams et al.,
1955). These results concur with the findings of
Al-Malah et al. (2001) who also found that the WLF
equation, using the �universal’ constants, adequatelydescribed the temperature-dependence of viscosity for
three honey samples. The �universal constants’ of theWLF equation are actually average values, which have
been extracted from data on numerous glass-forming
liquids and their use is not successful for all materials.
For each data set of g vs. T (each honey sample con-
sidered individually), the WLF equation with �universal’constants was fitted to yield the corresponding values of
Tg and gTg . Table 3 shows these predicted values for the
glass transition temperature (Tg) ranging from )59.6 to)42.5 �C and for the glass viscosity (gTg ) values which
ranged from 1011:5 to 1011:9 Pa s. Although Tg is a pa-
rameter that is measured by various techniques, a high
viscosity value such as gTg , is not accessible experimen-
tally by any of the existing rheometers and viscometers.
The predicted Tg values differed from the corresponding
DSC values obtained experimentally by 7–19 �C (Table
4). It is well known that the glass transition reflects arange of temperatures rather than a single temperature.
Even for single components (e.g. starch) the glass entails
changes over a temperature range of 10–20 �C (Bili-
aderis, 1998) and thus the Tg value depends on the
technique and experimental conditions used for its de-
termination. Moreover, in a previous study for con-
centrated fructose (69%) solutions differences up to 21
�C between Tgs values obtained by DSC measurementsand Tgs values estimated by the application of WLF on
viscosity data have been reported (Maltini & Manzocco,
1998).
Recently, there have been conflicting reports on how
to handle the constants in the WLF model, whether to
use the �universal’ constants or to allow them to vary for
a good fit to the experimentally data (Peleg, 1992; Roos,
1995). In a second attempt to apply the WLF model onviscosity data of Greek honeys with varying the C1 and
C2 constants and using as reference temperature the Tgvalues experimentally determined from DSC, the cor-
relation coefficients were the same with the previous
analysis using the �universal’ constants (Table 4). The C1
and C2 constants were in the range of 17.20–25.18 and
13.95–30.90 K, respectively (Table 4). Moreover, the
predicted values of glass viscosities varied widely from1012:9 to 1021:7 Pa s and for most of the samples were
extremely high which is probably unrealistic. However,
the latter findings are in agreement with a recent study
by Sopade et al. (2002) for Australian honeys. In their
study, although the temperature dependence of viscosity
was badly predicted using the �universal’ WLF con-
stants, the WLF model was successfully applied if the C1
and C2 were allowed to vary. The estimated values forthe Australian honeys have been reported within the
range 13.7–21.1, 55.9–118.7 �C, and 4 · 107 )4 · 1020Pa s for C1, C2, and gTg , respectively (Sopade et al.,
2002). These researchers claimed that the WLF con-
stants should be allowed to vary in order to use them
as parameters for comparison of the temperature sen-
sitivity among different samples. The WLF model with
20 A. Lazaridou et al. / Journal of Food Engineering 64 (2004) 9–21
different constants than the �universal’ ones has beenalso applied by Kerr and Reid (1994) on viscosity data
of sugar (glucose and sucrose) and maltodextrin solu-
tions. Maltini and Manzocco (1998) have applied the
WLF formalism in both ways (with �universal’ and with
varying constants) on viscosity data for concentrated
solutions of various materials (polymers, fructose, lactic
acid, and glycerol); in their study the estimated values
for glass viscosities have been found about 1014 cP.Soesanto and Williams (1981), using the �universal’constants on viscosity data of highly concentrated (91.9–
97.9%) fructose–sucrose mixtures (1:7), indicated that
gTg may not be invariant; i.e. they showed that gTg variesfrom about 4.5 · 1014 to 1.5 · 1015 mPa s as the mole
fraction of sugar varies from 0.4 to 0.7. Finally, Peleg
(1992) has reported that for a variety of polymers and
amorphous sugars, the magnitude of C1 and C2 mayvary considerably from the �universal’ constants de-
pending on the material studied, the measured property
and the selected reference temperature.
4. Conclusions
All honey samples exhibited Newtonian flow behav-iour and the viscosity in the temperature range of 20–60
�C can be predicted using the Arrhenius relationship; the
calculated activation energies for flow were inversely
related to the moisture content. Steady shear viscosity
and the loss modulus values (G00) at 10 s�1 or rad s�1
decreased exponentially with increasing moisture con-
tent of honey. The glass transition temperature (Tg) ofthe honey samples varied between )34 and )47 �C (overthe entire moisture content range, 13.0–18.9%) and ex-
hibited strong depression with the moisture; the Tg datafitted reasonably well to the Gordon–Taylor empirical
equation. The WLF equation was also suitable to model
the rheological behaviour of honey viscosity above the
glass transition (T � Tg ¼ 60–125 �C) using the universalvalues of the WLF model (C1 ¼ 17:44 and C2 ¼ 51:6 K)
where all samples fitted onto a common master curve.
Acknowledgement
The authors wish to thank Mr. A. Pavlis for his
analytical assistance.
References
Abu-Jdayil, B., Al-Majeed Ghzawi, A., Al-Malah, K. I. M., &
Zaitoun, S. (2002). Heat effect on rheology of light- and dark-
colored honey. Journal of Food Engineering, 51, 33–38.
Adobe Photoshop 5.0 User Guide for Machintosh and Windows.
(1998). Adobe Systems, Inc., San Jose, CA, USA.
Al-Khalifa, A. S., & Al-Arify, I. A. (1999). Physicochemical charac-
teristics and pollen spectrum of some Saudi honeys. Food Chem-
istry, 67, 21–25.
Al-Malah, K. I. M., Abu-Jdayil, B., Zaitoun, S., & Ghzawi, A.-M.
(2001). Application of WLF and Arhenius kinetics to rheology of
selected dark-colored honey. Journal of Food Process Engineering,
24, 341–357.
Anupama, D., Bhat, K. K., & Sapna, V. K. (2003). Sensory and
physico-chemical properties of commercial samples of honey. Food
Research International, 36, 183–191.
AOAC (1990). In K. Helrich (Ed.), Official methods of analysis (15th
edn). Arlington, VA: Association of Official Analytical Chemists.
Bath, P. K., & Singh, N. (1999). A comparison between Helianthus
annuus and Eucalyptus lanceolatus honey. Food Chemistry, 67, 389–
397.
Bhandari, B., D’Arcy, B., & Chow, S. (1999). Rheology of selected
Australian honeys. Journal of Food Engineering, 41, 65–68.
Biliaderis, C. G. (1998). Structures and phase transitions of starch
polymers. In R. H. Walter (Ed.), Polysaccharide association
structures in Food (pp. 57–168). New York: Marcel Dekker.
Biliaderis, C. G., Lazaridou, A., & Arvanitoyannis, I. (1999). Glass
transition and physical properties of polyol-plasticized pullulan-
starch blends at low moisture. Carbohydrate Polymers, 40, 29–47.
CIE (1976). Committee TC-1.3 CIE, Technical note (1974). Journal of
Optical Society of America, 64, 896–897.
Cordella, C., Antinelli, J. F., Aurieres, C., Faucon, J. P., Cabrol-Bass,
D., & Sbirrazzuoli, N. (2002). Use of differential scanning
calorimetry (DSC) as a new technique for detection of adulteration
in honeys. 1. Study of adulteration effect on honey thermal
behavior. Journal of Agriculture Food Chemistry, 50, 203–208.
Cox, W. P., & Merz, E. H. (1958). Correlation of dynamic and steady
shear flow viscosities. Journal of Polymer Science, 28, 619–622.
D’Haene, P., & Van Liederkerke, B. (1996). Viscosity prediction of
starch hydrolysates from single point measurements. Starch, 48,
327–334.
da Costa, C. C., & Pereira, R. G. (2002). The influence of propolis on
the rheological behaviour of pure honey. Food Chemistry, 76, 417–
421.
Doner, L. W. (1977). The sugars of honey––a review. Journal of the
Science of Food and Agriculture, 28, 443–456.
Doner, L. W., & Hicks, K. B. (1982). Lactose and the sugras of honey
and maple: reactions, properties, and analysis. In D. R. Lineback &
G. E. Inglett (Eds.), Food Carbohydrates (pp. 74–112). West Port,
CT: AVI Publishing Company.
Gomez Barez, J. A., Garcia-Villanova, R. J., Elvira Garcia, S., Rivas
Pala, T., Gonzalez Paramas, A. M., & Sanchez Sanchez, J. (2000).
Geographical discrimination of honeys through the employment of
sugar patterns and common chemical quality parameters. European
Food Research and Technology, 210, 437–444.
Gordon, M., & Taylor, J. S. (1952). Ideal copolymers and the second-
order transitions of synthetic rubbers. I. Non-crystalline copoly-
mers. Journal of Applied Chemistry, 2, 493–500.
Junzheng, P., & Changying, J. (1998). General rheological model for
natural honeys in China. Journal of Food Engineering, 36, 165–168.
Kantor, Z., Pitsi, G., & Thoen, J. (1999). Glass transition temperature
of honey as a function of water content as determined by
differential scanning calorimetry. Journal of Agriculture Food
Chemistry, 47, 2327–2330.
Kerr, W. L., & Reid, D. S. (1994). Temperature dependence of the
viscosity of sugar and maltodextrin solutions in coexistence with
ice. Lebensmittel-Wissenschaft und-Technologie, 27, 225–231.
Khalil, K. E., Ramakrishna, P., Nanjundaswamy, A. M., & Patward-
han, M. V. (1989). Rheology of banana juice. Journal of Food
Engineering, 10, 231–240.
Levine, H., & Slade, L. (1988). Principles of ‘‘cryostabilization’’
technology from structure/property relationship of carbohydrate/
water systems––a review. Cryo-Letter, 9, 21–63.
A. Lazaridou et al. / Journal of Food Engineering 64 (2004) 9–21 21
Maltini, E., & Manzocco, L. (1998). Experimental and predicted
viscosities of model solutions at temperatures above the glass
transitions. In proceedings of ISOPOW 7 International Symposium
on water management in the design and distribution of quality
foods, Helsinki, Filand, pp. 57–60.
Manohar, B., Ramakrishna, P., & Udayasankar, K. (1991). Some
physical properties of Tamarind Tamarindus indica L. juice
concentrates. Journal of Food Engineering, 13, 241–258.
Matveev, Y. I., Grinberg, V. Y., & Tolstoguzov, V. B. (2000). The
plasticizing effect of water on proteins, polysaccharides and their
mixtures. Glassy state of biopolymers, food and seeds. Food
Hydrocolloids, 14, 425–437.
Ollett, A. L., & Parker, R. (1990). The viscosity of supercooled
fructose and its glass transition temperature. Journal of Texture
Studies, 21, 355–362.
Papadakis, S. E., Abdul-Malek, S., Kamdem, R. E., & Yam, K. L.
(2000). A versatile and inexpensive technique for measuring color
of foods. Food Technology, 54(12), 48–51.
Peleg, M. (1992). On the use of the WLF model in polymers and foods.
Critical Reviews in Food Science and Nutrition, 32, 59–66.
Perez-Arquille, C., Conchello, P., Arino, A., Juan, T., & Herresa, A.
(1994). Quality evaluation of spanish rosemary (Rosmarius offici-
nalis) honey. Food Chemistry, 51, 207–210.
Popek, S. (2002). A procedure to identify a honey type. Food
Chemistry, 79, 401–406.
Popek, S. (2003). Identification of honey types.Nahrung/Food, 47, 39–40.
Roos, Y. H. (1995). Phase transitions in foods. New York: Academic
Press.
Sabatini, A. G., Marcazzan, G. L., Colombo, R., Carpana, E., &
Serra, G. (2001). The analytical determination of sugars in honey.
Industrie Alimentari, 40(404), 623–627.
Singh, N., & Bath, P. K. (1997). Quality evaluation of different types of
Indian honey. Food Chemistry, 58, 129–133.
Slade, L., & Levine, H. (1991). Beyond water activities: recent
advances based on an alternative approach to the assessment of
food quality and safety. Critical Reviews in Food Science and
Nutrition, 30, 115–360.
Slade, L., & Levine, H. (1993). The glassy state phenomenon in food
molecules. In J. M. V. Blanshard & P. J. Lillford (Eds.), The glassy
state in foods (pp. 35–101). Sutton Bonington, UK: Nottingham
University Press.
Soesanto, T., & Williams, M. C. (1981). Volumetric interpretation of
viscosity for concentrated and dilute sugar solutions. Journal of
Physical Chemistry, 85, 3338–3341.
Sopade, P. A., Bhandari, B., Halley, P., D’Arcy, B., & Caffin, N.
(2001). Glass transition in Australian honeys. Food Australia, 53,
399–404.
Sopade, P. A., Halley, P., Bhandari, B., D’Arcy, B., Doebler, C., &
Caffin, N. (2002). Application of the Williams–Landel–Ferry model
to the viscosity–temperature relationship of Australian honeys.
Journal of Food Engineering, 56, 67–75.
Sugisaki, M., Suga, H., & Seki, S. (1968). Calorimetric study of the
glassy state IV. Heat capacities of glassy water and cubic ice.
Bulletin of the Chemical Society of Japan, 41, 2591–2599.
Terrab, A., Diez, M. J., & Heredia, F. J. (2002). Characterization of
Moroccan unifloral honeys by their physicochemical characteris-
tics. Food Chemistry, 79, 373–379.
White, J. W., Jr. (1978). Honey. Advances in Food Research, 24, 288–
354.
Williams, M. L., Landel, R. F., & Ferry, J. D. (1955). The temperature
dependence of relaxation mechanisms in amorphous polymers and
other glass-forming liquids. Journal of the American Chemical
Society, 77, 3701–3707.
Zaitoun, S., Ghzawi, A. -M., Al-Malah, K. I. M., & Abu-Jdayil, B.
(2001). Rheological properties of selected light colored Jordanian
honey. International Journal of Food Properties, 4, 139–148.


![Palynological survey in honeys of Bahia (Brazil) [Original title: Prospecção palinológica em méis da Bahia]](https://static.fdokumen.com/doc/165x107/6341f6b0e8d6d6284d07e1db/palynological-survey-in-honeys-of-bahia-brazil-original-title-prospeccao-palinologica.jpg)