MINERAL ADMIXTURE-BASED RHEOLOGICAL DESIGN OF ...
193
PONTIFICIA UNIVERSIDAD CATOLICA DE CHILE SCHOOL OF ENGINEERING MINERAL ADMIXTURE-BASED RHEOLOGICAL DESIGN OF CONCRETE IVAN NAVARRETE LESCHOT Thesis submitted to the Office of Graduate Studies in partial fulfillment of the requirements for the Degree of Doctor in Engineering Sciences Advisors: MAURICIO LOPEZ YAHYA KURAMA Santiago de Chile, April, 2021 © 2021, Ivan Navarrete Leschot
-
Upload
khangminh22 -
Category
Documents
-
view
1 -
download
0
Transcript of MINERAL ADMIXTURE-BASED RHEOLOGICAL DESIGN OF ...
PONTIFICIA UNIVERSIDAD CATOLICA DE CHILE
SCHOOL OF ENGINEERING
MINERAL ADMIXTURE-BASED
RHEOLOGICAL DESIGN OF CONCRETE
IVAN NAVARRETE LESCHOT
Thesis submitted to the Office of Graduate Studies in partial fulfillment of
the requirements for the Degree of Doctor in Engineering Sciences
Advisors:
MAURICIO LOPEZ
YAHYA KURAMA
Santiago de Chile, April, 2021
© 2021, Ivan Navarrete Leschot
PONTIFICIA UNIVERSIDAD CATOLICA DE CHILE
SCHOOL OF ENGINEERING
MINERAL ADMIXTURE-BASED
RHEOLOGICAL DESIGN OF CONCRETE
IVÁN IGNACIO NAVARRETE LESCHOT
Members of the Committee:
MAURICIO LÓPEZ
YAHYA KURAMA
BRAD WELDON
ÁLVARO PAÚL
WERNHER BREVIS
Thesis submitted to the Office of Graduate Studies in partial fulfillment of
the requirements for the Degree Doctor in Engineering Sciences
Santiago de Chile, April, 2021
DocuSign Envelope ID: FAC293A2-C5B2-4D94-9A5E-FFB96400F64C
ACKNOWLEDGMENTS
I would like to thank my mother Janine, my father Ivan, my sister Catalina, my girlfriend
Maria Ignacia, and my friends for their continuous support and encouragement during this
process. Thank you for encouraging me to follow my dreams, even when that means that
we will not be together for a long time. In addition, I want to dedicate this work to my aunt
Marisa and my grandmother Angela, who are the stars that guide my path.
I would like to express my gratitude to my advisors, Drs. Mauricio Lopez and Yahya
Kurama, for their guidance, support, and for always looking out for my personal and
professional wellbeing. In addition, I want to acknowledge the assistance and
commentaries of Drs. Wernher Brevis and Nestor Escalona. Thank you also to the faculty,
staff, thesis readers, and fellow students of Pontificia Universidad Catolica de Chile and
the University of Notre Dame, especially to Mauricio Guerra, Luis Gonzalez, and Brent
Bach for your support during the experimental work.
Finally, I would like to thank the financial support of ANID/PCHA/Doctorado
Nacional/2017-21170247, ANID/FONDECYT 1190641, ANID/FONDEF VIU16E0094,
and the Department of Civil and Environmental Engineering and Earth Sciences of the
University of Notre Dame.
Ivan Navarrete Leschot
MINERAL ADMIXTURE-BASED RHEOLOGICAL DESIGN OF
CONCRETE
Abstract
by
Ivan Navarrete Leschot
The use of supplementary cementitious materials (SCMs; e.g., slag, fly ash) to
reduce the amount of ordinary Portland cement in concrete construction has increased
significantly over the last 20 years. Previous research has shown that, as an important
benefit, SCMs can improve the long-term mechanical properties and durability of concrete.
However, there is limited and inconclusive information on the relationship between SCM
properties and concrete workability. This is particularly important for technologies that
require high workability control, such as self-consolidating concrete (SCC).
Ivan Navarrete Leschot
This thesis provides an experimental-based quantitative assessment and
understanding of the effects of the particle size and physicochemical properties of SCMs
and their interactions with the primary mixture parameters (such as water-to-cementitious
materials ratio, SCM replacement, and reactivity of cement) on the rheology of
cementitious paste (i.e., cementitious mixture with no coarse or fine aggregates). The
results from this research are intended to improve the mixture design of new construction
technologies that require better rheological control, through the use of SCMs. As a specific
application, improved design of SCC to achieve better interlayer bonding is investigated.
This is important for the construction of large concrete elements, where casting of multiple
concrete lifts is required. Specifically, due to the lack of mechanical consolidation when
casting SCC, the interfaces between multiple layers can result in reduced mechanical
resistance in the final structure.
The specific objectives of this research are to experimentally investigate, develop
and validate empirical models for the effects of: 1) SCM properties and their interactions
with the primary mixture parameters on the increase of static yield stress on time of
cementitious paste before initial set; 2) SCM properties and their interactions with the
primary mixture parameters on the viscosity of cementitious paste before initial set; and 3)
concrete mixture design (i.e., cementitious paste rheology and aggregate-to-cementitious
paste ratio), building process (i.e., layer-to-layer free-fall height and delay time), and their
interactions on the layer-to-layer flexural and shear bond strength in multilayer SCC.
iv
CONTENTS
Contents .................................................................................................................................... iv
Figures ...................................................................................................................................... vi
Tables ........................................................................................................................................ x
Chapter 1: Introduction.............................................................................................................. 1 1.1 Motivation ............................................................................................................... 1 1.2 Objectives ............................................................................................................... 6
1.3 Hypotheses .............................................................................................................. 7
1.4 Approach ................................................................................................................. 8
1.5 Scope ....................................................................................................................... 9
1.6 Outline ................................................................................................................... 10
Chapter 2: Impact of Physical and Physicochemical Properties of Supplementary Cementitious
Materials on Structural Build-up of Cement-based Pastes ............................................ 12 2.1 Introduction ........................................................................................................... 13 2.2 Research significance ............................................................................................ 18
2.3 Experimental design, materials and methods ........................................................ 19 2.3.1 Experimental design .............................................................................. 19 2.3.2 Materials characterization ..................................................................... 23
2.3.2.1 Particle size ............................................................................ 26 2.3.2.2 Physicochemical behavior....................................................... 29 2.3.2.2.1 Chemical reactivity at early age ............................... 29
2.3.2.2.2 Surface potential ...................................................... 30 2.3.3 Mixture proportions and mixing sequence ............................................ 34 2.3.4 Testing procedures................................................................................. 35
2.3.4.1 Structural build up test ........................................................... 35 2.3.4.2 Calorimetric test and boundary nucleation and growth
(BNG) model ..................................................................................... 37 2.4 Results and discussions ......................................................................................... 38 2.4.1 Growth of static yield stress in time ...................................................... 38
2.4.2 Structural build-up assessment .............................................................. 39 2.4.3 Nucleation and growth rate assessment ................................................. 56 2.5 Conclusions ........................................................................................................... 61
v
Chapter 3: Effect of Supplementary Cementitious Materials on Viscosity of Cement-based
Pastes ............................................................................................................................. 63 3.1 Introduction ........................................................................................................... 64 3.2 Research significance ............................................................................................ 69
3.3 Materials and methods .......................................................................................... 70 3.3.1 Experimental design .............................................................................. 70 3.3.2 Materials characterization ..................................................................... 73
3.3.2.1 Particle size distribution ......................................................... 76 3.3.3 Mixture proportions and mixing sequence ............................................ 79 3.3.4 Equilibrium flow curve measurement ................................................... 80 3.4 Results and discussions ......................................................................................... 82 3.4.1 Equilibrium flow curves ........................................................................ 82
3.4.2 Effect of number of contact points ........................................................ 87 3.4.3 Effect of interparticle force on viscosity ............................................... 92
3.4.4 Effect of cementitious particles properties on interparticle force ........ 102 3.5 Conclusions ......................................................................................................... 106
Chapter 4: Effect of Cementitious Paste and Casting Process on Inter-layer Bond Strength in
Multi-layer Casting of Self-consolidating Concrete .................................................... 108 4.1 Introduction ......................................................................................................... 109 4.2 Research significance .......................................................................................... 113
4.3 Materials and methods ........................................................................................ 114 4.3.1 Experimental design ............................................................................ 114 4.3.2 Mixture proportions and mixing sequences......................................... 117 4.3.3 Characterization of cementitious materials ......................................... 121 4.3.4 Characterization of cementitious paste, mortar and concrete workability
...................................................................................................................... 124
4.3.4.1 Structural build-up measurements of cementitious paste...... 124
4.3.4.2 Structural build-up measurements of mortar ........................ 125
4.3.4.3 Workability measurements of SCC ....................................... 126
4.3.5 Layer-to-layer bond strength measurements of multi-layer SCC ........ 127 4.4 Results and discussions ....................................................................................... 130 4.4.1 Fresh properties SCC ........................................................................... 130
4.4.2 Structural build-up of cement paste and mortar .................................. 131 4.4.3 Residual bond strength of SCC ........................................................... 135
4.4.4 Critical delay time analysis of SCC ..................................................... 146 4.5 Conclusions ......................................................................................................... 151
Chapter 5: Conclusions and Future Directions ...................................................................... 153
5.1 Conclusions ......................................................................................................... 153 5.2 Future directions ................................................................................................. 156
Bibliography ......................................................................................................................... 158
vi
FIGURES
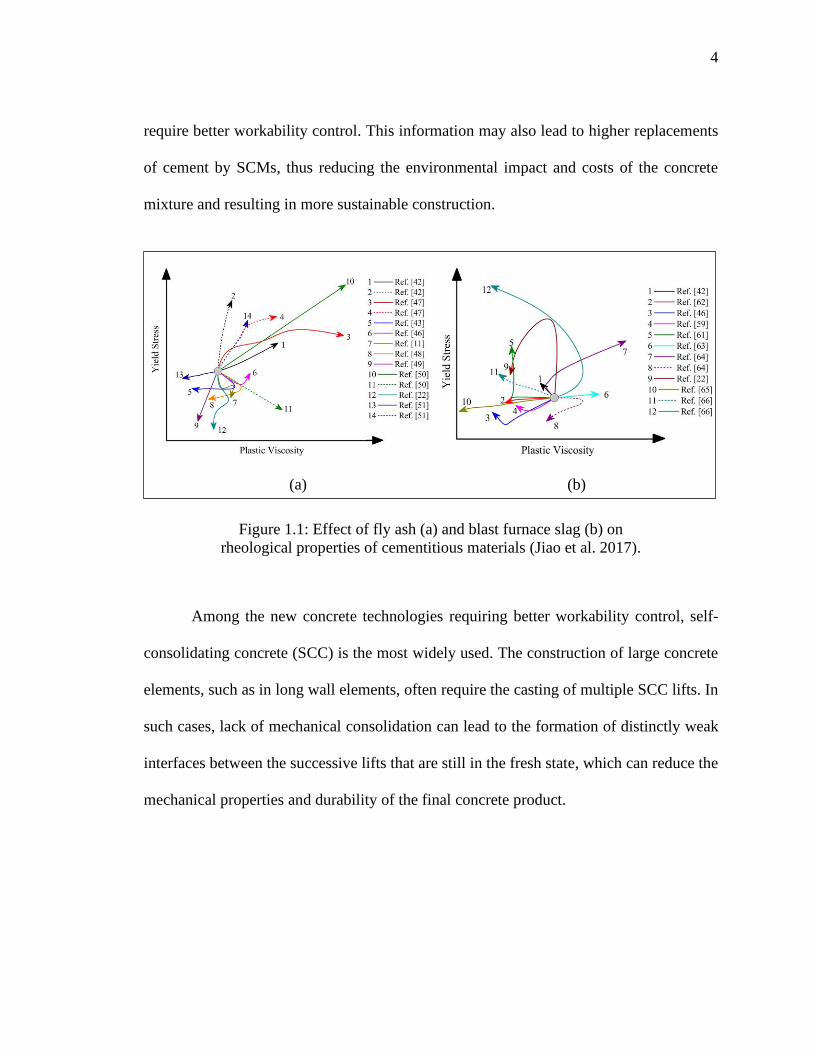
Figure 1.1: Effect of fly ash (a) and blast furnace slag (b) on rheological properties of
cementitious materials [19]. .....................................................................................4
Figure 2.1: 5000x SEM images of FFA-Co (a), FFA-Fi (b), non-milled IF (c), 7-day milled
IF (d), CFA (e), MK (f) and RHA (g) ....................................................................25
Figure 2.2: Particle size distribution of cements and SCMs in Series I (a) and Series II (b)
mixtures..................................................................................................................26
Figure 2.3: Schematic of the Stern layer and diffuse layer of a negatively charged particle
................................................................................................................................31
Figure 2.4: pH dependence of the zeta potential of studied powders ................................33
Figure 2.5: Growth of static yield stress with time ............................................................41
Figure 2.6: Comparisons between experimental Athix1
and analytical Athix1
determined with
the first SOPR model. R2 of the Series II attained -1.57 using Equation (2-4) .....45
Figure 2.7: Comparison between SCM with the same SSAPSD and different NPSD. Red and
gray circles represent SCM and cement particles, respectively ............................46
Figure 2.8: Relationship between experimental Athix1
and analytical Athix1
determined with
the second SOPR model. R2 of the Series II attained 0.77 using Equation (2-5). .48
Figure 2.9: Comparison between experimental Athix1 obtained with IF and FFA
replacements. Each point represents the average of the Athix1 of the mixtures
produced with the corresponding NPSD and type of SCM (i.e., IF or FFA). ..........49
Figure 2.10: Relationship between experimental Athix1
and analytical Athix1
determined with
the third SOPR model. R2 of the Series II attained 0.98 using Equation (2-6).. ....51

vii
Figure 2.11: Effect of w/c on Athix1 . Each point represents the average Athix
1 of the Series I
mixtures produced with each w/c. .........................................................................52
Figure 2.12: Effect of SCM properties on Athix1 , estimated with the SOPR model, for two
different w/c and R combinations. In both cases, Cr was taken equal to 300 μW/g..
................................................................................................................................54
Figure 2.13: Effect of mixture design parameters on Athix1 , estimated with the SOPR model,
for different SCMs. In both cases, Cr was taken equal to 300 μW/g .....................55
Figure 2.14: Heat flow during the first 12 hours of the Series I FFD mixtures .................57
Figure 2.15: Average normalized KN (a) and KG (b) for low (-) and high (+) levels of each
experimental factor. ...............................................................................................59
Figure 2.16: Comparison of SCMs with low (i.e., blue dots) and high (i.e., red dots) surface
potential. Calcium ions are represented by + sign and cement particles by grey dots
................................................................................................................................60
Figure 3.1: 1500x SEM images of supplementary cementitious materials. ......................75
Figure 3.2: Particle size distributions of cements and SCMs ............................................76
Figure 3.3: Effect of gap size on viscosity of cementitious paste. The shadow areas
represent the 95% confidence interval limits for each measurement ....................82
Figure 3.4: Equilibrium flow curves of cementitious pastes. ............................................83
Figure 3.5: Linear fittings used to calculate 𝜇𝐻 and 𝜇𝐿 from the measured equilibrium flow
curve of IF-Fi-1.24-20-OPC mix ...........................................................................85
Figure 3.6: Relationship between experimental and analytical viscosity (i.e., μH and μL).
(a) Prediction of μH using Eq. (3-8); (b) Prediction of μL using Eq. (3-9); (c)
Prediction of μH using Eq. (3-10); (d) Prediction of μL using Eq. (3-11). Gray
continuous lines represent the 95% confidence interval limits for each model. Black
discontinuous lines represent perfect correlation between the experimental and
analytical results.....................................................................................................91
Figure 3.7: Relationship between experimental and analytical viscosity (i.e., 𝜇𝐻 and 𝜇𝐿).
(a) Prediction of 𝜇𝐻 using Eq. (3-17); (b) Prediction of 𝜇𝐿 using Eq. (3-18). Gray
continuous lines represent the 95% confidence interval limits for each model. Black
discontinuous lines represent perfect correlation between the experimental and
analytical results.....................................................................................................97
viii
Figure 3.8: Standardized coefficients for NTPSD, ϕT, and G(h) of the SOPR model ...........98
Figure 3.9: Effect of interparticle force and particle number density on 𝜇𝐻 and 𝜇𝐿 estimated
with the SOPR models [i.e., Eq. (3-17) and (3-18)] for two different solid volume
fractions. Red triangles represent the experimental data of Series I ....................101
Figure 3.10: Average normalized G(h) for low (-) and high (+) levels of each experimental
factor ....................................................................................................................102
Figure 3.11: SEM images of Series I SCM and OPC ......................................................104
Figure 3.12: Effect of fine and coarse IF and FFA on normalized G(h) ...........................105
Figure 4.1: Face-centered central composite design. The experimental runs of the factorial
design, axial points and center point are represented by black, grey, and white dots,
respectively ..........................................................................................................115
Figure 4.2: Fresh properties measured in SCC (a), mortar (b), and cementitious paste (c)
..............................................................................................................................118
Figure 4.3: 5,000x SEM images of cementitious materials .............................................123
Figure 4.4: Particle size distribution of cementitious materials .......................................124
Figure 4.5: Casting (a), sample dimensions in mm (b), and testing set up (c) of the direct
shear strength test. Note: Numbers 1 and 2 represent the two layers used during the
casting of the specimens ......................................................................................129
Figure 4.6: Casting (a), sample dimensions in mm (b), and testing set up (c) of the flexural
strength test. Note: Numbers 1 and 2 represent the two layers used during the
casting of the specimens ......................................................................................129
Figure 4.7: Growth of static yield stress of cementitious pastes with time. Discontinuous
lines represent the best linear fits for the initial near-linear stage of 𝜏0𝑠 and for the
subsequent accelerated stage of 𝜏0𝑠 ......................................................................133
Figure 4.8: Reduction of mortar mini slump flow with time. Dash lines represent linear fit
of the results for each experimental run ...............................................................134
Figure 4.9: Residual shear bond strength, RBDSh, of Series I and Series II SCC mixtures.
Dash lines represent the best linear fit for each experimental run .......................138
Figure 4.10: RBF of Series I and Series II SCC mixtures. Dash lines represent the best
linear fit for each experimental run. .....................................................................139

ix
Figure 4.11: Standardized coefficients for the effect of studied factors on RBDSh (a) and
RBF (b) .................................................................................................................140
Figure 4.12: Relationship between experimental and analytical RBDSh results. Gray
discontinuous lines represent the 95% confidence interval limits of the model.
Black (thicker) discontinuous line represents perfect correlation between the
experimental and analytical results ......................................................................143
Figure 4.13: Effect of mixture design parameters on RBDSh, as estimated with the SOPR
model, for two different DT and HFF combinations .............................................145
Figure 4.14: Effect of casting process on RBDSh, as estimated with the SORP model, for
two different FAIm and CP%vol combinations ......................................................146
Figure 4.15: Relationship between experimental and analytical DTc. Gray discontinuous
lines represent the 95% confidence interval limits of the model. Black (thicker)
discontinuous line represents perfect correlation between the experimental and
analytical results...................................................................................................149
Figure 4.16: Standardized coefficients for FAIm, cement paste volume, and free fall height
of the SOPR model of DTc ..................................................................................150
x
TABLES
Table 2.1: Experimental factors and their selected levels ..................................................22
Table 2.2: Fractional face centered central composite design ...........................................24
Table 2.3: Chemical characterization and specific gravity of cements and SCMs used in
this study. ...............................................................................................................25
Table 2.4: Particle size parameters of cements and supplementary cementitious materials.
................................................................................................................................30
Table 2.5: Chemical reactivity at early age and zeta potential at pH values larger than 10
................................................................................................................................33
Table 2.6: Series II mixture designs ..................................................................................35
Table 2.7: Athix1 and Athix
2 results .......................................................................................42
Table 2.8: First proposed SOPR model summary and coefficient results .........................44
Table 2.9: Second proposed SOPR model summary and coefficient results .....................47
Table 2.10: Second proposed SOPR model summary and coefficient results ...................50
Table 2.11: KN and KG values of the Series I FFD mixtures ..............................................58
Table 3.1: Experimental factors and levels ........................................................................71
Table 3.2: Series I mixes and factorial levels ....................................................................73
Table 3.3: Chemical composition and specific gravity of cements and SCMs .................74
Table 3.4: Particle size parameters of cements and SCMs ................................................77
Table 3.5: Series II mixture designs ..................................................................................79
xi
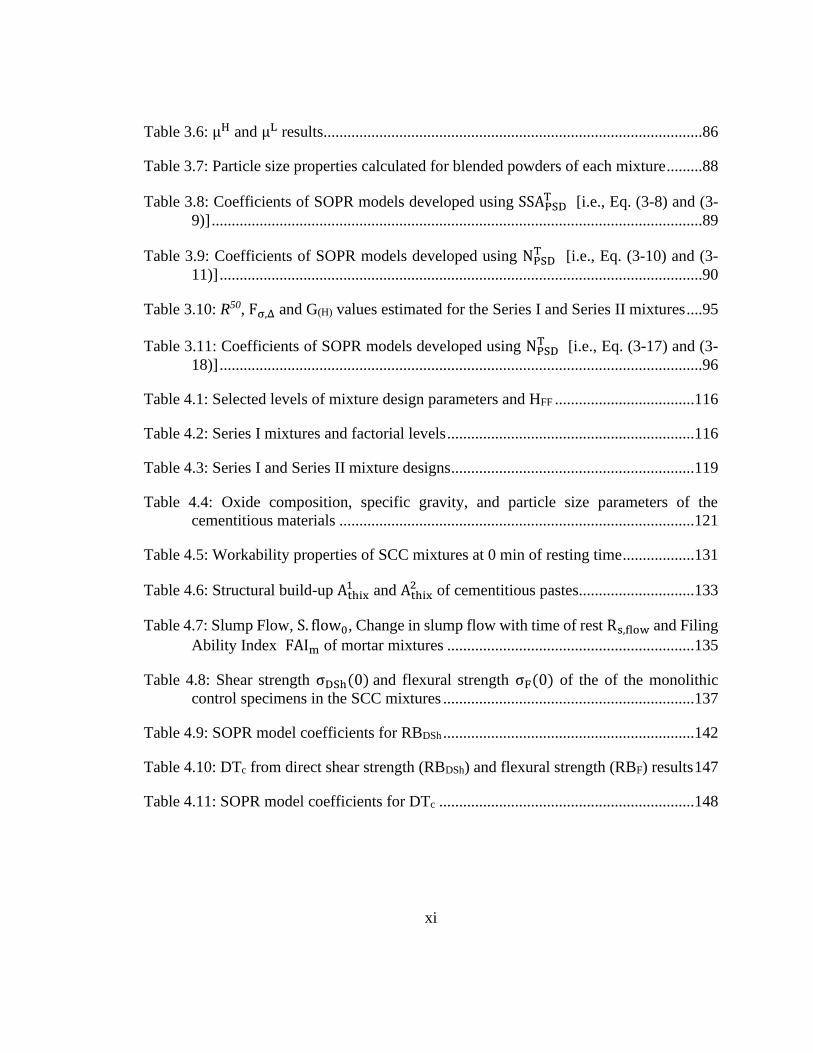
Table 3.6: μH and μL results...............................................................................................86
Table 3.7: Particle size properties calculated for blended powders of each mixture .........88
Table 3.8: Coefficients of SOPR models developed using SSAPSDT [i.e., Eq. (3-8) and (3-
9)] ...........................................................................................................................89
Table 3.9: Coefficients of SOPR models developed using NPSDT [i.e., Eq. (3-10) and (3-
11)] .........................................................................................................................90
Table 3.10: R50, Fσ,Δ and G(H) values estimated for the Series I and Series II mixtures ....95
Table 3.11: Coefficients of SOPR models developed using NPSDT [i.e., Eq. (3-17) and (3-
18)] .........................................................................................................................96
Table 4.1: Selected levels of mixture design parameters and HFF ...................................116
Table 4.2: Series I mixtures and factorial levels ..............................................................116
Table 4.3: Series I and Series II mixture designs .............................................................119
Table 4.4: Oxide composition, specific gravity, and particle size parameters of the
cementitious materials .........................................................................................121
Table 4.5: Workability properties of SCC mixtures at 0 min of resting time ..................131
Table 4.6: Structural build-up Athix1 and Athix
2 of cementitious pastes.............................133
Table 4.7: Slump Flow, S. flow0, Change in slump flow with time of rest Rs,flow and Filing
Ability Index FAIm of mortar mixtures ..............................................................135
Table 4.8: Shear strength σDSh(0) and flexural strength σF(0) of the of the monolithic
control specimens in the SCC mixtures ...............................................................137
Table 4.9: SOPR model coefficients for RBDSh ...............................................................142
Table 4.10: DTc from direct shear strength (RBDSh) and flexural strength (RBF) results 147
Table 4.11: SOPR model coefficients for DTc ................................................................148
1
CHAPTER 1:
INTRODUCTION
1.1 Motivation
According to a report by the Mckinsey Global Institute (McKinsey Global Institute
2017), the global labor-productivity growth in construction lags far behind that of other
manufacturing fields or the total economy. The main reason of the low productivity in the
construction industry is the use of traditional construction systems, which are highly labor
demanding (Proverbs et al. 1999). In the last several decades, new technologies that can
improve the productivity of concrete construction through better workability control
(Khayat and Feys 2010; Navarrete et al. 2017a; Wangler et al. 2016), such as self-
consolidating concrete (SCC) and 3D concrete printing, have been developed.
The workability of fresh concrete is a very important property that determines how
well and easily the material can be mixed, placed, consolidated, and finished. The
cementitious paste and its interactions with fine and coarse aggregates govern the
workability of concrete and its evolution with time. As such, rheological measurements of
2
the cementitious paste are reasonable indicators of concrete workability (Ferraris et al.
2001a).
Most of the concrete produced worldwide in current construction contains chemical
admixtures, such as viscosity enhancers and high-range water-reducers (i.e.,
superplasticizers), to improve the rheological properties of concrete and reduce the amount
of cement (Roussel 2012). However, the effectiveness of a chemical admixture depends on
many factors, including the type and amount of cement, water content, mixing time, and
temperatures of the concrete and air (PCA 2018). In addition, the use of high-range water-
reducers, one of the most commonly types of chemical admixtures, accelerates the loss of
workability over time (Mardani-Aghabaglou et al. 2013). Therefore, it is difficult to predict
and control the effect of a chemical admixture on the rheological properties of concrete,
which hinders the development of new concrete technologies that require better reliability
of workability.
Moreover, the use of blended cements through the introduction of supplementary
cementitious materials (SCMs), also known as mineral admixtures (e.g., fly ash, blast
furnace slag), in the cement industry has increased significantly over the last three decades.
Most SCMs are industrial byproducts, and thus, their use improves the sustainability of
concrete. In 1995, only 44% of the cements produced in the United States were blended
cements. By 2009, this figure had increased to over 80% (Schneider et al. 2011). Most of
3
the SCMs possess different surface potentials than cement (Ersoy et al. 2014). Importantly,
the adsorption of chemical admixtures onto SCMs is lower than the adsorption onto cement
particles, which reduces the effectiveness of chemical admixtures on concretes produced
with blended cements (Park et al. 2005). As a result, the amount of cement required in
many applications is controlled by concrete workability and not by its strength. This effect
is more relevant in new concrete technologies requiring better workability control, such as
SCC, which use high amounts of cement, with a detrimental effect on their cost and
environmental impacts.
Most of the previous research on SCMs has focused on the effects of these materials
on the mechanical properties and durability of concrete. Many studies have found that most
SCMs increase the concrete strength at later ages (Bendapudi and Saha 2011; Dhanya et
al. 2018). In addition, SCMs reduce the permeability of concrete and, therefore, improve
its durability (He and Shi 2008; Juenger and Siddique 2015; Mo et al. 2017; Narasimha
Reddy and Kavyateja 2020). On the other hand, fewer studies have focused on the effects
of SCMs on concrete workability. Figure 1.1 from previous research shows that SCMs
have significant effects on the rheology of cementitious materials, and therefore, on
concrete workability. However, contradictory results and trends have been found between
different studies on this topic. Ultimately, a deeper understanding of the relationships
between the chemical and physical properties of SCMs and the rheology of cementitious
paste will improve the mixture design of new concrete construction technologies that
4
require better workability control. This information may also lead to higher replacements
of cement by SCMs, thus reducing the environmental impact and costs of the concrete
mixture and resulting in more sustainable construction.
(a) (b)
Figure 1.1: Effect of fly ash (a) and blast furnace slag (b) on
rheological properties of cementitious materials (Jiao et al. 2017).
Among the new concrete technologies requiring better workability control, self-
consolidating concrete (SCC) is the most widely used. The construction of large concrete
elements, such as in long wall elements, often require the casting of multiple SCC lifts. In
such cases, lack of mechanical consolidation can lead to the formation of distinctly weak
interfaces between the successive lifts that are still in the fresh state, which can reduce the
mechanical properties and durability of the final concrete product.
5
Roussel (Roussel and Cussigh 2008) has shown that during placement, a layer of
SCC often has a short time (i.e., less than 60 minutes) to rest and flocculate before the next
layer of concrete is cast above it. If the fine particles are allowed to flocculate, the structural
build-up (Athix) of the concrete at rest increases beyond a critical value, which prevents the
two layers to combine, leading to the formation of a weak interface. Losses of layer-to-
layer bond strength of more than 40% have been reported, and can exceed 50% when the
SCC is highly thixotropic and when the elapsed time between the casting of two layers
exceeds 30 minutes (Megid and Khayat 2017, 2019; Roussel and Cussigh 2008).
The bond strength between two successive layers is highly affected by the
aggregate interlock and the surface roughness of the first layer (Megid and Khayat 2017),
which are mainly governed by the aggregate size, shape and texture, and the aggregate-to-
cementitious paste ratio. Surface roughness can be improved by applying external
mechanical vibration to the existing concrete layer, which would reduce its yield stress
(Chia et al. 2005) and, therefore, increase the bond strength. Another approach would be
to increase the free-fall height of the new concrete onto the existing material, which
increases the interlock resulting from the penetration of the top concrete layer into the lower
layer (Megid and Khayat 2019). However, these methods involving mechanical vibration
and increased free-fall height can also cause segregation or bleeding, which can lead to
impaired bond between the successive layers.
6
Previous researchers have studied the individual effects of mixture design (e.g.,
aggregate-to-cementitious paste ratio (Roussel and Cussigh 2008), rheology of
cementitious paste [i.e., Athix (Assaad and Issa 2016; Megid and Khayat 2019)], and
construction process [i.e., free-fall height and delay time (Megid and Khayat 2017)] on the
layer-to-layer bond strength of multilayer SCC. However, the interactions between these
parameters on the bond strength between SCC lifts require further investigation.
1.2 Objectives
In accordance with the research needs and gaps discussed above, the main goal of
this research is to assess and understand the fundamental effects and interactions between
SCMs and other mixture constituents on the rheology of cementitious paste (i.e., paste with
ordinary Portland cement, SCM, and water). Additionally, the findings are applied
specifically to SCC, a commonly used concrete technology, for improved layer-to-layer
flexural and shear bond strength in multilayer casting. The resulting three specific
objectives of the research are as follows:
1. To understand and quantify the effects of the particle size and physicochemical
properties of SCMs and their interactions with the primary mixture parameters (such as
water-to-cementitious materials ratio, SCM replacement, and reactivity of cement) on the
structural build-up (Athix) of cementitious paste before initial set.
7
2. To understand and quantify the effects of the particle size and type of SCMs and their
interactions with the primary mixture parameters on the viscosity of cementitious paste.
3. To assess and quantify the effects of mixture design (i.e., cementitious paste rheology
and aggregate-to-cementitious paste ratio), construction process (i.e., free-fall height and
delay time), and their interactions on the layer-to-layer bond strength in multilayer casting
of SCC.
The results of this research are intended to enhance the fundamental understanding
of the SCM properties that affect the rheology of cementitious pastes. Ultimately, this work
can lead to better use of SCMs for the control of workability in concrete applications.
1.3 Hypotheses
The following three hypotheses guide this research. The first two hypotheses are
related with the first specific objective, while the last hypothesis is related to the second
specific objective.
1. A rise in the specific surface area of the supplementary cementitious materials allows
for more nucleation points and the growth of hydration products, increasing the rate of
growth of yield stress of cement paste.
8
2. An increase in the hydraulic reactivity of the supplementary cementitious materials
accelerate the growth of hydration products, and therefore, increases the rate of growth of
yield stress of cement paste.
3. A higher specific surface area of the supplementary cementitious materials produces an
increase in the adsorbed water, which rises the solid effective volume fraction; and thus,
increasing the cement paste viscosity.
1.4 Approach
To achieve the above objectives, a series of face centered central composite designs
(FCCCD) were used to develop a comprehensive experimental program. These designs
were chosen due to the resulting efficiency in the number of experimental runs required to
effectively analyze the results and trends from experiments with four or more parameters.
In the case of objectives 1 and 2, five experimental parameters were studied, while to
realize objective 3, four experimental parameters were studied.
The FCCCD is based on an embedded fractional factorial design with center points
augmented by a group of axial points, which allow the estimation of curvature in the
resulting trends (NIST/SEMATECH 2012). The axial points are at the center of each face
of the factorial space and, therefore, three levels (i.e., -, 0 and +) are required in selecting
the values for each parameter. This design allows the measured response to be empirically
9
modelled by a second order polynomial regression (SOPR) equation, which permits the
main, quadratic, and interactive effects of the experimental parameters on the property
under study to be determined (Montgomery and Runger 2003). Analysis of variance and
backward elimination algorithm (Montgomery and Runger 2003) were conducted with the
results of the FCCCD to establish the significant factors on the studied properties for each
objective and develop SOPR equations. In addition to the FCCCD mixtures tested to
develop the SOPR models for each objective, additional samples (i.e., six mixtures for
objectives 1 and 2, and four mixtures for objective 3) were characterized to validate these
SOPR models. These validations were achieved based on the predicted residual error sum
of squares statistic (Montgomery and Runger 2003) calculated using the SORP prediction
residuals for the validation mixture data.
1.5 Scope
The study described in this thesis is based on the following considerations:
- The developed relationships are empirical, using the results from testing laboratory
mixtures.
- All mixtures are produced at ambient temperature (i.e., 17 to 23 °C).
- Class C fly ash, class F fly ash, metakaolin, rice husk ash, inert silica powder, and slag
are used as SCM. These SCMs have similar ranges of particle size distribution as
cement. Very fine powders, such as silica fume or nanomaterials, are out of scope.
- Water-to-cementitious materials ratio ranges between 0.40 and 0.50 by mass.
10
- SCM replacement ranges between 20 and 40% of cement volume.
- A crushed limestone coarse aggregate with maximum aggregate size of 3/8 in. is used
in all of the SCC mixtures.
- A high-range water-reducing admixture (i.e., MasterGlenium 7920) is used in all the
SCC mixtures.
- Measurements of rheology are made using a TA Discovery Hybrid Rheometer 2. A 25-
mm diameter parallel-plate configuration is used, with a smooth stationary base plate,
a serrated superior plate, and 1000 𝜇m gap between the plates.
- Viscosity is quantified using the equilibrium flow curve measured 8 min after the
contact of cementitious materials with water.
- Structural build-up (Athix) of cementitious paste is quantified by measuring the growth
of static yield stress with time. The first measurement is performed 15 min after the
contact of cementitious materials with water and repeated every 15 min until 120 min.
- Bond strength in multilayer casting of SCC is characterized on small-scale unreinforced
specimens by measuring the shear strength and flexural strength of the bonding plane
at 28 days after concrete mixing.
1.6 Outline
This document is written in the format of three independent journal articles
produced based on this research, where each chapter is a self-contained paper. The first
paper has been published in Cement and Concrete Research, while the second paper has
11
been submitted to the same journal, and the third paper has been submitted to Construction
and Building Materials. As such, the remaining chapters of this document are organized as
follows:
Chapter 2 (journal paper 1; published) aims to assess and understand the effects of
particle size and physicochemical properties of five different SCMs and their interactions
with the primary mixture parameters on the structural build-up (Athix) of cementitious paste,
which is the first specific objective of this research.
Chapter 3 (journal paper 2; submitted) aims to assess and understand the effects of
particle size and surface potential of SCMs and their interactions with the primary mixture
parameters on the viscosity of cementitious paste, which is the second specific objective of
this research.
Chapter 4 (journal paper 3; submitted) aims to assess the effects of the cementitious
paste volume, structural build-up of mortar, and their interactions with the casting process
(i.e., free fall height and delay time) on the residual bond strength of multi-layer SCC under
shear and flexural stresses.
Finally, Chapter 5 repeats (for the convenience of the reader) the conclusions listed
at the ends of Chapters 2-4 regarding each specific objective and discusses future
directions.
12
CHAPTER 2:
IMPACT OF PHYSICAL AND PHYSICOCHEMICAL PROPERTIES OF
SUPPLEMENTARY CEMENTITIOUS MATERIALS ON STRUCTURAL BUILD-UP
OF CEMENT-BASED PASTES
This chapter focuses on the effect of supplementary cementitious material (SCM)
particle size and physicochemical behavior, and their interactions with the primary mixture
parameters, on the structural build-up (Athix) of cementitious pastes, which is the first
specific objective of this research. To this end, a fractional face centered central composite
experimental design, composed of 29 mixtures with two SCMs, was conducted. The
measurements from these mixtures were then used to develop second order polynomial
regression (SOPR) models, which were validated based on the results from 6 additional
mixtures with three different SCMs. The increase of static yield stress with time was used
to characterize the Athix of cementitious pastes. Calorimetric curves were also measured to
characterize the effect of the studied parameters on the growth and nucleation rates of
cement.

13
This chapter includes a detailed characterization of the SCM properties and an
assessment of the effect of those properties on Athix. The results demonstrate that the effect
of SCMs on Athix is governed by the particle number density and surface potential. In
addition, Athix can be increased by increasing the number of particle contact points, the
growth rate of calcium silicate hydrate (C-S-H) bridges between particles, and/or the
reactivity of cement.
2.1 Introduction
The workability of fresh concrete is a very important property that determines how
well the material can be mixed, placed, consolidated, and finished. The cementitious paste
and its interaction with the aggregates govern the workability and its evolution with time.
As such, rheological measurements of the cementitious paste are reasonable indicators of
concrete workability (Ferraris et al. 2001a).
Fresh cement-based materials (CBM) (Jiao et al. 2017), as well as other yield stress
fluids (Cheng 1986; Sun and Gunasekaran 2009), exhibit dynamic and static yield stresses.
The dynamic yield stress (𝜏0𝐷) is the minimum stress required for maintaining flow and is
commonly obtained from the equilibrium flow curve. The static yield stress (𝜏0𝑆) is the
stress required to initiate flow (Malvern Instruments 2012). Due to the structural states of
these conditions, 𝜏0𝑆 is expected to be higher than 𝜏0
𝐷 (Qian and Kawashima 2018).
14
Fresh CBM can be defined as yield stress fluids (Tattersall and Banfill 1983). The
main characteristic of these materials is that they behave like solids when the applied stress
is below a critical shear stress value, called yield stress, and like liquids if the applied stress
is above the yield stress (Roussel 2012). The most common method to measure the
rheology of CBM is the equilibrium flow curve, plotted as the equilibrium shear stress
versus the shear rate (Qian and Kawashima 2018). The yield stress in this method is equal
to the shear stress at a shear rate of zero. Among the constitutive equations that have been
proposed to represent the equilibrium flow curve of CBM, the Bingham model (Bingham
1922), the Herschel – Bulckley model (de Larrard et al. 1998), and the modified Bingham
model (Yahia and Khayat 2001) are the most common.
The dynamic yield stress, 𝜏0𝐷 of CBM has been widely studied (Ferraris 1999;
Matos et al. 2018; Park et al. 2005; Qian and Kawashima 2018) and been related to
measurements from common field tests, such as the slump flow test (Bouvet et al. 2010a;
Lu et al. 2015). On the other hand, in the last decade, with the growing use of self-
consolidating concrete (SCC) and development of new technologies that require better
workability control (Navarrete et al. 2017a; Wangler et al. 2016), such as 3D printing of
concrete, more attention has been paid to the static yield stress, 𝜏0𝑆.
It has been shown that 𝜏0𝑆 of fresh CBM at rest increases over time (Mostafa and
Yahia 2016; Perrot et al. 2016; Roussel 2006; Tattersall and Banfill 1983). Within a few
15
minutes at rest, the cement particles flocculate and form a three-dimensional network due
to electrostatic and van der Waals forces (Ferron et al. 2013; Yim et al. 2013). In addition,
nucleation of C-S-H at the pseudo-contact points between cement and other particles
during the dormant period (Mostafa and Yahia 2017; Roussel et al. 2012) generates
formation and growth of C-S-H bridges, making 𝜏0𝑆 of the material to increase.
The term “thixotropy” is often used to describe the increase of 𝜏0𝑆 of fresh CBM.
One of the main properties of thixotropy is that it is a reversible process. However, for
CBM at rest, both reversible (i.e., flocculation) and irreversible (i.e., cement hydration
bonding, such as C-S-H bridges) processes happen simultaneously (Mostafa and Yahia
2017), and it is not simple to separate these two effects. As such, for CBM, structural build-
up (Athix), which involves both reversible and irreversible processes, is a more accurate
term than thixotropy (Yuan et al. 2017).
Athix is an important property that affects the constructability and performance of
concrete structures. Previous researchers (Bellotto 2013; Bentz et al. 2017) have found that
for CBM, setting time is highly influenced by Athix. In the case of SCC, formwork pressure
(Assaad and Khayat 2006a; Barnes and Johnston 2003; Roussel 2006), concrete stability
after casting (Navarrete and Lopez 2016; Shen et al. 2014), and bond strength in multi-
layer casting (Megid and Khayat 2017, 2019; Roussel and Cussigh 2008) are governed by
this property. It is also important to control Athix in 3D-printed concrete in order to assure
16
adequate bonding between the printed layers and adequate strength and stiffness for the
layers to withstand the weight of the layers above (Le et al. 2012; Ma and Wang 2018;
Malaeb et al. 2015; Panda et al. 2016).
To accurately measure the Athix of cementitious paste at rest, the sample should not
be distressed during the test. Previous authors have used either small-amplitude oscillatory
shear (SAOS) tests (Ma et al. 2018; Mostafa and Yahia 2017) or growth of static yield
stress tests (Bentz et al. 2017; Huang et al. 2019; Lecompte and Perrot 2017; Roussel et al.
2012; Yuan et al. 2018) to measure the development of Athix. SAOS is considered a non-
destructive test, which is less invasive and less prone to distressing the sample. On the other
hand, the growth of static yield stress test is the most common technique, which according
to Yuan et al. (Yuan et al. 2017), provides appropriate testing parameters and gives
comparable results with the SAOS test.
The Athix of cementitious paste is affected by mixture parameters, such as the
mixture composition, constituent properties, ambient conditions, and shear stress history.
Previous studies have shown that increased water-to-cementitious materials volumetric
ratio (w/c) reduces Athix (Khayat and Assaad 2007; Mostafa and Yahia 2017). Cement
properties, such as fineness (Bentz et al. 2018), electrokinetic behavior (Mostafa and Yahia
2017), and chemical composition (Assaad and Khayat 2004), also affect the change of 𝜏0𝑆
over time. Temperature has been shown as an important factor as well (Huang et al. 2019;
17
Petit et al. 2006; Vanhove et al. 2013), where a nonlinear increase in Athix was observed in
the range of 10 to 40 C° (Huang et al. 2019). Additionally, Ma et al. (Ma et al. 2018) have
shown that the Athix of cement paste is highly affected by the pre-shear and rest condition
of the sample.
In current construction technology, most of the concrete produced worldwide
contains chemical admixtures, such as viscosity enhancing admixtures and high-range
water-reducing admixtures, to improve the rheological properties of concrete and reduce
the amount of cement. Several studies (Assaad et al. 2004; Khayat and Assaad 2007; Ma
et al. 2018) have shown that the dosage and type of chemical admixtures have considerable
effects on the rate of Athix. However, the effectiveness of a chemical admixture depends on
many factors, including the cement chemical composition, the mixture design and the
mixing process (PCA 2018). Therefore, it is difficult to predict and control the effect of a
chemical admixture on the rheological properties of concrete, which hinders concrete
technologies that require better control of workability (such as 3D printing).
Supplementary cementitious materials (SCMs), also known as mineral admixtures
(e.g., fly ash, silica fume), considerably affect the rheology of CBM as well. Most of the
previous studies (Bentz et al. 2012; Burgos et al. 2014; Felekoǧlu et al. 2006; Ferraris et
al. 2001a; Fuentes et al. 2014; Jiao et al. 2017; Khan et al. 2014; Laskar and Talukdar 2008)
have investigated the effect of SCMs on 𝜏0𝐷 and viscosity of cementitious materials. In
18
comparison, only a few researchers have studied the effect of SCMs on Athix (Assaad and
Khayat 2006b; Bentz et al. 2018; Huang et al. 2019; Saleh et al. 2015; Yuan et al. 2018).
Importantly, contradictory results have been found between different studies on this topic.
For example, some researchers (Saleh et al. 2015) have found that the use of fly ash and
silica fume increases the Athix of SCC, while others (Assaad and Khayat 2004) have found
the opposite. A possible explanation of this discrepancy could be the packing density of
particles, which depends on the range of the particle size distribution of the whole solid
particles network (Kashani et al. 2014). To the best of the authors’ knowledge,
relationships for the physical and physicochemical properties of SCMs with the Athix of
cementitious paste have not been investigated.
2.2 Research significance
In accordance with the research gap identified above, this chapter discusses the
effects of the particle size and physicochemical properties of SCMs and their interactions
with the primary mixture parameters (such as w/c ratio, SCM replacement, and reactivity
of cement) on the Athix of cementitious paste. The results presented in the chapter can
contribute to enhance the fundamental understanding of the SCM properties that affect
Athix. Ultimately, this work can lead to better usage of SCMs for the control of Athix in CBM
at rest for applications such as SCC and 3D-printed concrete.
19
2.3 Experimental design, materials and methods
2.3.1 Experimental design
The effects of the SCM properties and their interactions with the main design
parameters of the cement paste mixture on Athix were experimentally determined using a
fractional face centered central composite design (FFCCD). This design was chosen due to
the resulting efficiency in the number of required test runs and physical constraints in the
levels of the experimental factors (i.e., parameters). The FFCCD is based on an embedded
fractional factorial design (FFD) with center points (CP) augmented by a group of axial
points (AP), which allow estimation of curvature (NIST/SEMATECH 2012). The AP are
at the center of each face of the factorial space and, therefore, three levels (i.e., -, 0 and +)
are required in selecting the values for each factor. This design allows the measured
response to be modelled by a second order polynomial regression (SOPR) equation, which
permits the main, quadratic, and interactive effects of the experimental factors on the
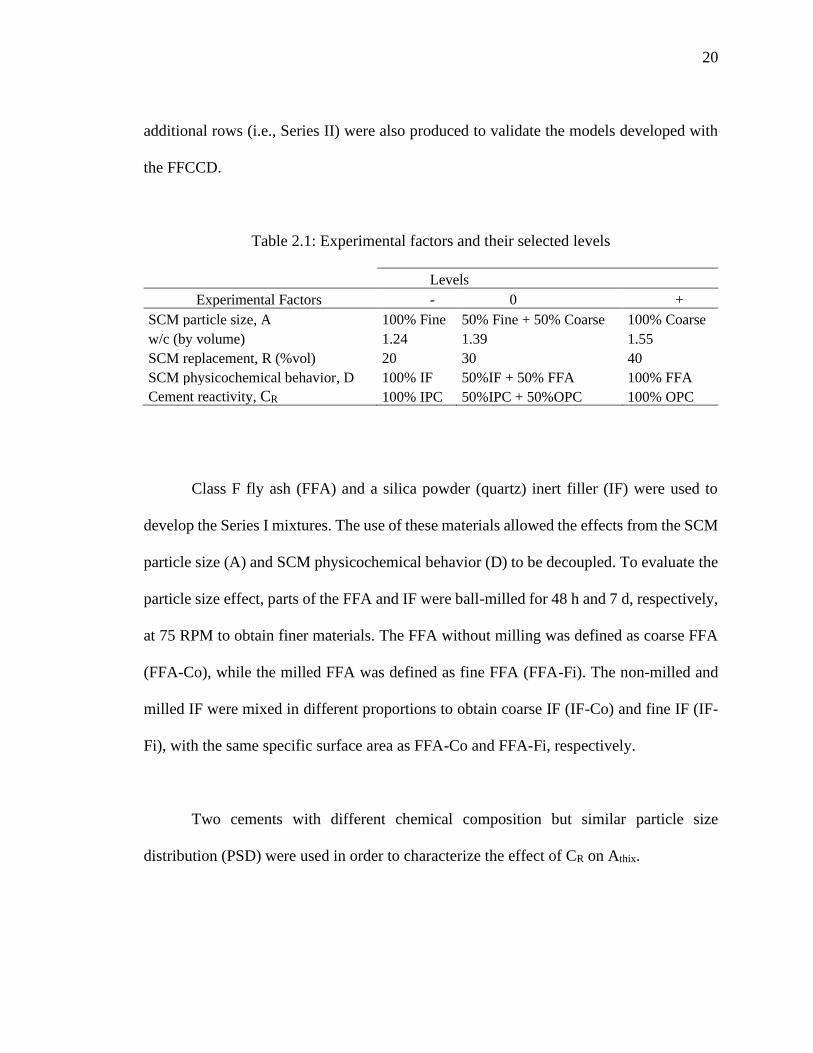
property under study to be determined (Montgomery and Runger 2014).
Table 2.1 lists the five experimental factors that were studied as follows: (1) SCM
particle size (A); (2) w/c; (3) SCM replacement (R); (4) physicochemical behavior of SCM
(D); and (5) cement reactivity (CR). A 25-1 fractional factorial design with 3 CP, and 2*5
AP were used, resulting in 29 experimental rows (i.e., Series I) as shown in Table 2.2. Six
20
additional rows (i.e., Series II) were also produced to validate the models developed with
the FFCCD.
Table 2.1: Experimental factors and their selected levels
Levels
Experimental Factors - 0 +
SCM particle size, A 100% Fine 50% Fine + 50% Coarse 100% Coarse
w/c (by volume) 1.24 1.39 1.55
SCM replacement, R (%vol) 20 30 40
SCM physicochemical behavior, D 100% IF 50%IF + 50% FFA 100% FFA
Cement reactivity, CR 100% IPC 50%IPC + 50%OPC 100% OPC
Class F fly ash (FFA) and a silica powder (quartz) inert filler (IF) were used to
develop the Series I mixtures. The use of these materials allowed the effects from the SCM
particle size (A) and SCM physicochemical behavior (D) to be decoupled. To evaluate the
particle size effect, parts of the FFA and IF were ball-milled for 48 h and 7 d, respectively,
at 75 RPM to obtain finer materials. The FFA without milling was defined as coarse FFA
(FFA-Co), while the milled FFA was defined as fine FFA (FFA-Fi). The non-milled and
milled IF were mixed in different proportions to obtain coarse IF (IF-Co) and fine IF (IF-
Fi), with the same specific surface area as FFA-Co and FFA-Fi, respectively.
Two cements with different chemical composition but similar particle size
distribution (PSD) were used in order to characterize the effect of CR on Athix.
21
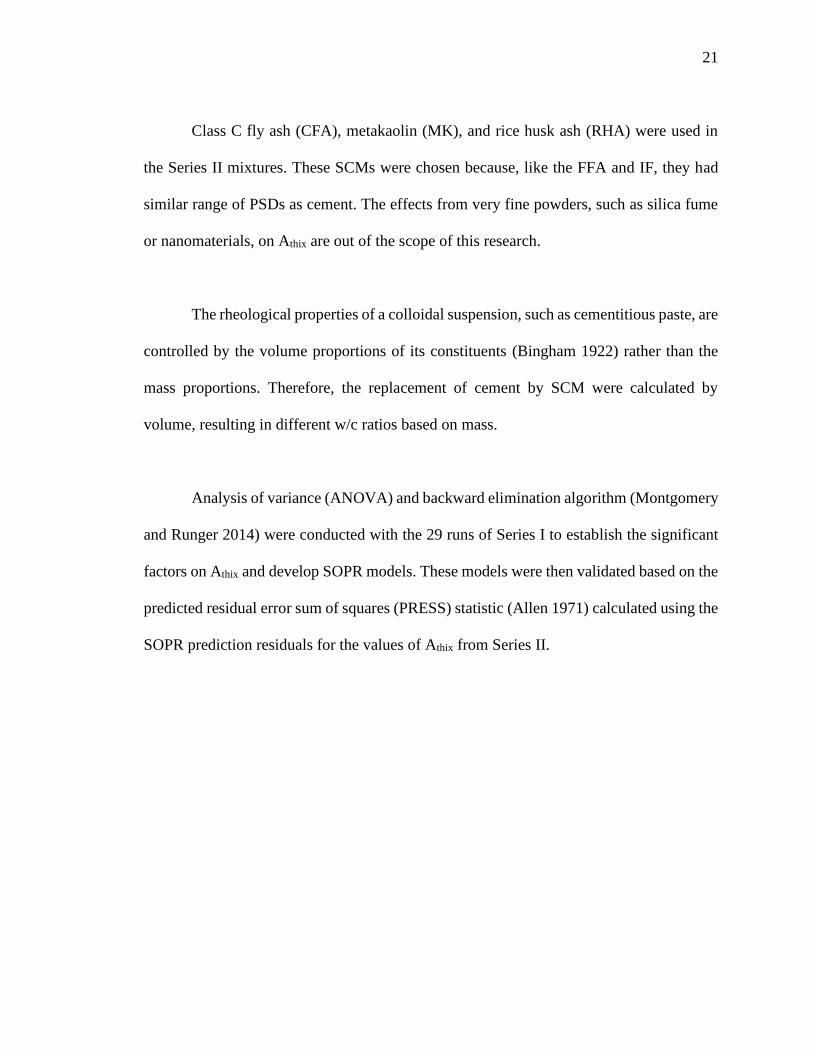
Class C fly ash (CFA), metakaolin (MK), and rice husk ash (RHA) were used in
the Series II mixtures. These SCMs were chosen because, like the FFA and IF, they had
similar range of PSDs as cement. The effects from very fine powders, such as silica fume
or nanomaterials, on Athix are out of the scope of this research.
The rheological properties of a colloidal suspension, such as cementitious paste, are
controlled by the volume proportions of its constituents (Bingham 1922) rather than the
mass proportions. Therefore, the replacement of cement by SCM were calculated by
volume, resulting in different w/c ratios based on mass.
Analysis of variance (ANOVA) and backward elimination algorithm (Montgomery
and Runger 2014) were conducted with the 29 runs of Series I to establish the significant
factors on Athix and develop SOPR models. These models were then validated based on the
predicted residual error sum of squares (PRESS) statistic (Allen 1971) calculated using the
SOPR prediction residuals for the values of Athix from Series II.
22
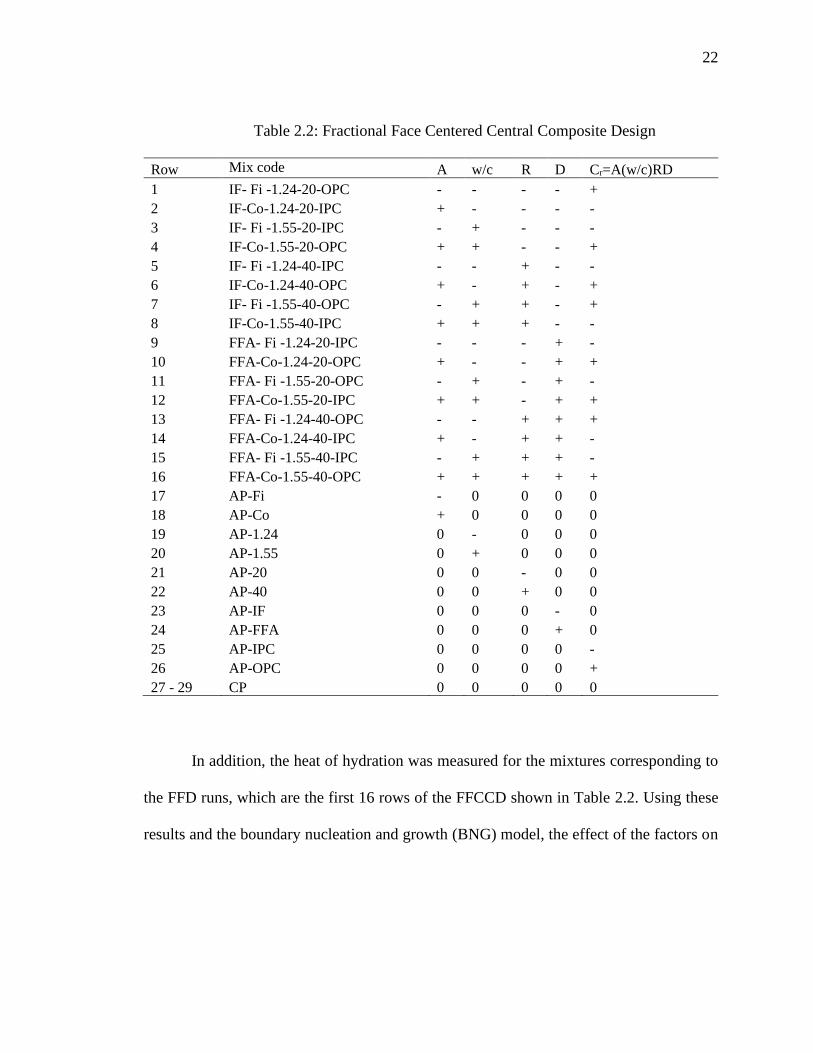
Table 2.2: Fractional Face Centered Central Composite Design
Row Mix code A w/c R D Cr=A(w/c)RD
1 IF- Fi -1.24-20-OPC - - - - +
2 IF-Co-1.24-20-IPC + - - - -
3 IF- Fi -1.55-20-IPC - + - - -
4 IF-Co-1.55-20-OPC + + - - +
5 IF- Fi -1.24-40-IPC - - + - -
6 IF-Co-1.24-40-OPC + - + - +
7 IF- Fi -1.55-40-OPC - + + - +
8 IF-Co-1.55-40-IPC + + + - -
9 FFA- Fi -1.24-20-IPC - - - + -
10 FFA-Co-1.24-20-OPC + - - + +
11 FFA- Fi -1.55-20-OPC - + - + -
12 FFA-Co-1.55-20-IPC + + - + +
13 FFA- Fi -1.24-40-OPC - - + + +
14 FFA-Co-1.24-40-IPC + - + + -
15 FFA- Fi -1.55-40-IPC - + + + -
16 FFA-Co-1.55-40-OPC + + + + +
17 AP-Fi - 0 0 0 0
18 AP-Co + 0 0 0 0
19 AP-1.24 0 - 0 0 0
20 AP-1.55 0 + 0 0 0
21 AP-20 0 0 - 0 0
22 AP-40 0 0 + 0 0
23 AP-IF 0 0 0 - 0
24 AP-FFA 0 0 0 + 0
25 AP-IPC 0 0 0 0 -
26 AP-OPC 0 0 0 0 +
27 - 29 CP 0 0 0 0 0
In addition, the heat of hydration was measured for the mixtures corresponding to
the FFD runs, which are the first 16 rows of the FFCCD shown in Table 2.2. Using these
results and the boundary nucleation and growth (BNG) model, the effect of the factors on
23
the formation and growth of C-S-H bridges between the cementitious particles was
analyzed.
2.3.2 Materials characterization
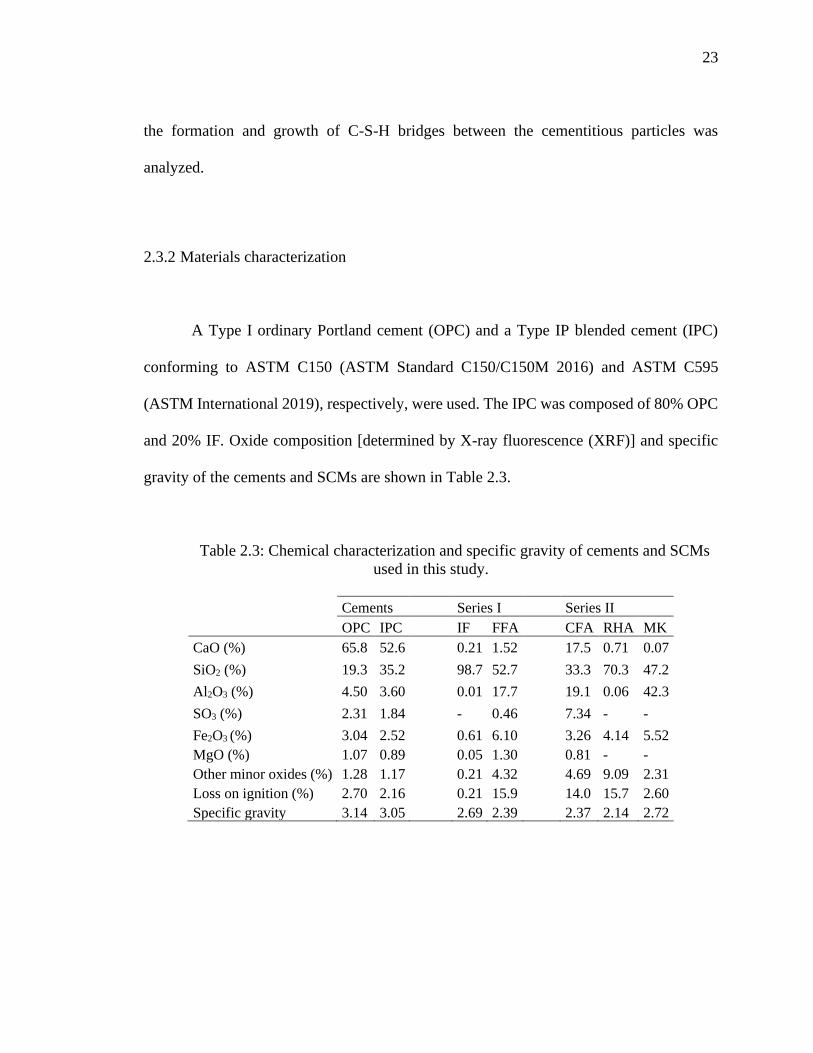
A Type I ordinary Portland cement (OPC) and a Type IP blended cement (IPC)
conforming to ASTM C150 (ASTM Standard C150/C150M 2016) and ASTM C595
(ASTM International 2019), respectively, were used. The IPC was composed of 80% OPC
and 20% IF. Oxide composition [determined by X-ray fluorescence (XRF)] and specific
gravity of the cements and SCMs are shown in Table 2.3.
Table 2.3: Chemical characterization and specific gravity of cements and SCMs
used in this study.
Cements Series I Series II
OPC IPC IF FFA CFA RHA MK
CaO (%) 65.8 52.6 0.21 1.52 17.5 0.71 0.07
SiO2 (%) 19.3 35.2 98.7 52.7 33.3 70.3 47.2
Al2O3 (%) 4.50 3.60 0.01 17.7 19.1 0.06 42.3
SO3 (%) 2.31 1.84 - 0.46 7.34 - -
Fe2O3 (%) 3.04 2.52 0.61 6.10 3.26 4.14 5.52
MgO (%) 1.07 0.89 0.05 1.30 0.81 - -
Other minor oxides (%) 1.28 1.17 0.21 4.32 4.69 9.09 2.31
Loss on ignition (%) 2.70 2.16 0.21 15.9 14.0 15.7 2.60
Specific gravity 3.14 3.05 2.69 2.39 2.37 2.14 2.72

24
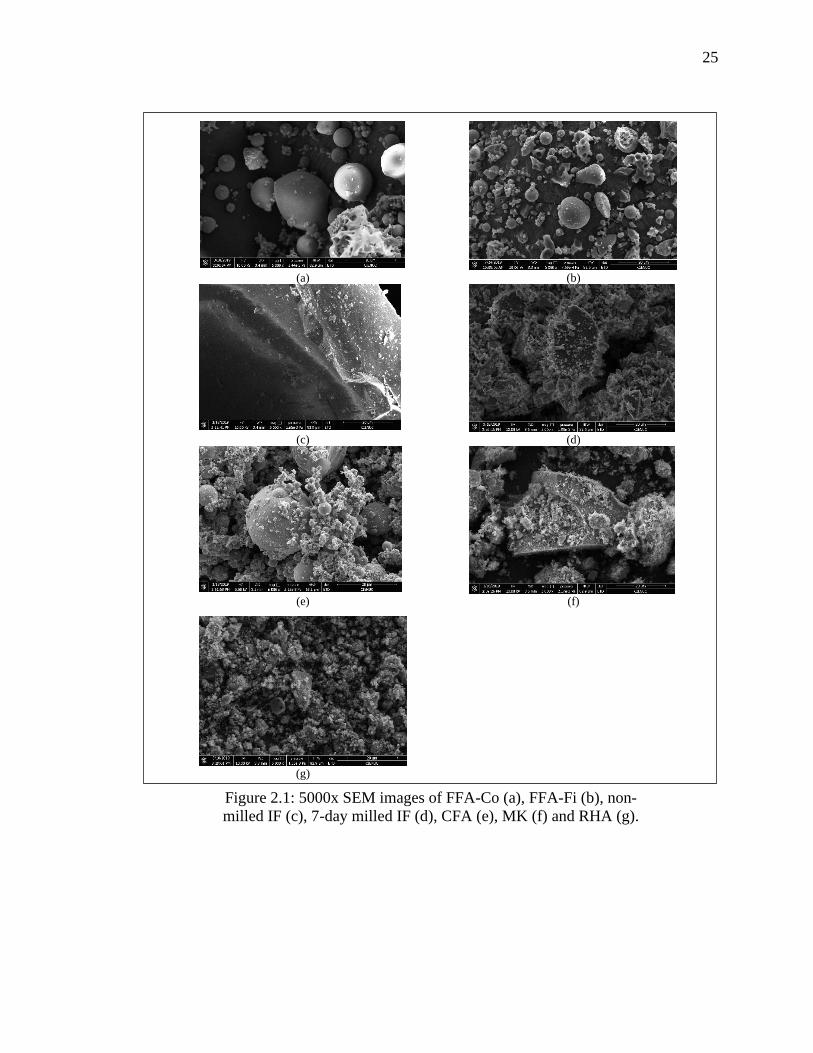
A scanning electron microscope (SEM) was used to observe the micro-structure of
the SCMs and obtain surface information. The samples were oven dried and coated with
gold, and images were taken using a Quanta FEG 250 device with magnifications between
300x and 1,000,000x and an accelerating voltage of 15 kV. Figure 2.1 shows SEM images
for the different SCMs with a magnification of 5000x.
25
(a) (b)
(c) (d)
(e) (f)
(g)
Figure 2.1: 5000x SEM images of FFA-Co (a), FFA-Fi (b), non-
milled IF (c), 7-day milled IF (d), CFA (e), MK (f) and RHA (g).
26
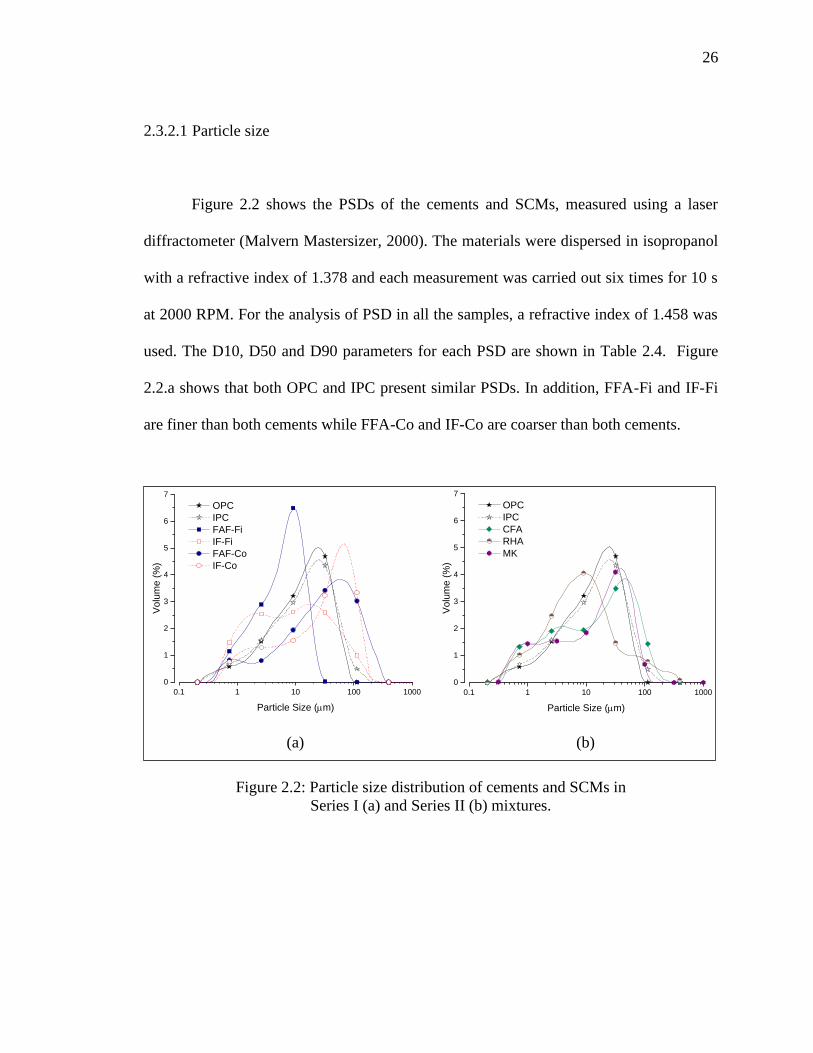
2.3.2.1 Particle size
Figure 2.2 shows the PSDs of the cements and SCMs, measured using a laser
diffractometer (Malvern Mastersizer, 2000). The materials were dispersed in isopropanol
with a refractive index of 1.378 and each measurement was carried out six times for 10 s
at 2000 RPM. For the analysis of PSD in all the samples, a refractive index of 1.458 was
used. The D10, D50 and D90 parameters for each PSD are shown in Table 2.4. Figure
2.2.a shows that both OPC and IPC present similar PSDs. In addition, FFA-Fi and IF-Fi
are finer than both cements while FFA-Co and IF-Co are coarser than both cements.
(a) (b)
Figure 2.2: Particle size distribution of cements and SCMs in
Series I (a) and Series II (b) mixtures.
0.1 1 10 100 1000
0
1
2
3
4
5
6
7
Vo
lum
e (
%)
Particle Size (mm)
OPC
IPC
FAF-Fi
IF-Fi
FAF-Co
IF-Co
0.1 1 10 100 1000
0
1
2
3
4
5
6
7
Volu
me (
%)
Particle Size (mm)
OPC
IPC
CFA
RHA
MK
27
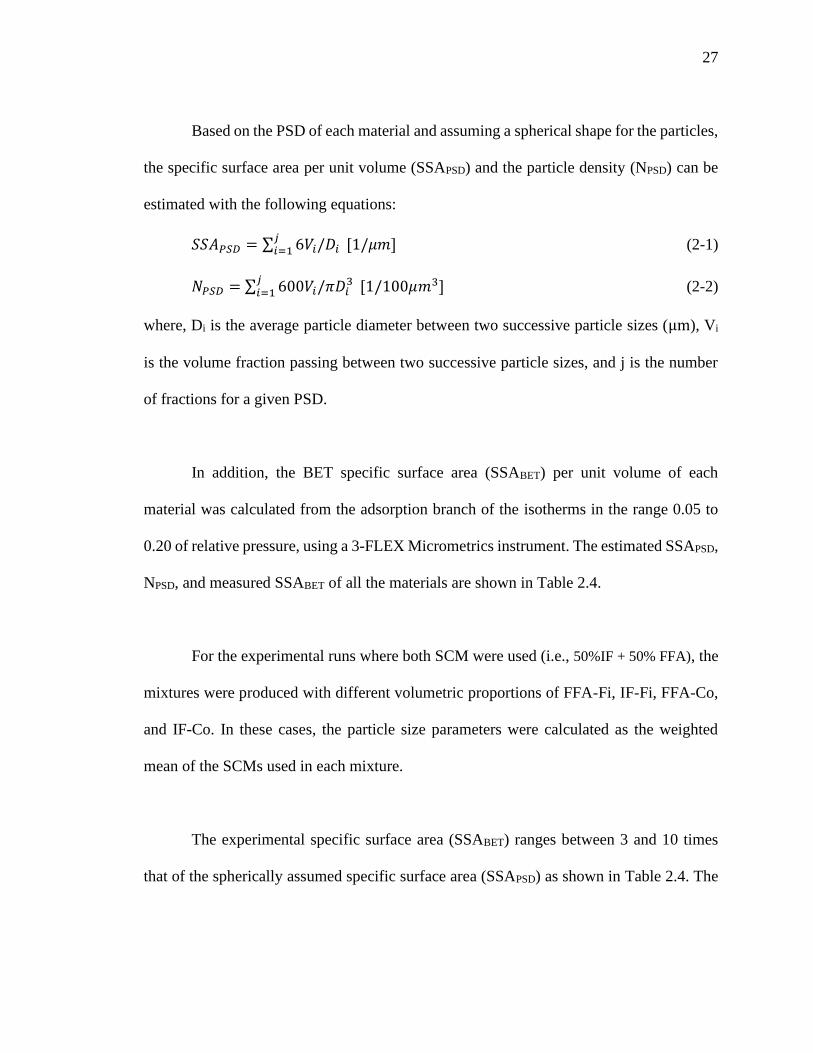
Based on the PSD of each material and assuming a spherical shape for the particles,
the specific surface area per unit volume (SSAPSD) and the particle density (NPSD) can be
estimated with the following equations:
𝑆𝑆𝐴𝑃𝑆𝐷 = ∑ 6𝑉𝑖/𝐷𝑖𝑗𝑖=1 [1/𝜇𝑚] (2-1)
𝑁𝑃𝑆𝐷 = ∑ 600𝑉𝑖/𝜋𝐷𝑖3𝑗
𝑖=1 [1/100𝜇𝑚3] (2-2)
where, Di is the average particle diameter between two successive particle sizes (μm), Vi
is the volume fraction passing between two successive particle sizes, and j is the number
of fractions for a given PSD.
In addition, the BET specific surface area (SSABET) per unit volume of each
material was calculated from the adsorption branch of the isotherms in the range 0.05 to
0.20 of relative pressure, using a 3-FLEX Micrometrics instrument. The estimated SSAPSD,
NPSD, and measured SSABET of all the materials are shown in Table 2.4.
For the experimental runs where both SCM were used (i.e., 50%IF + 50% FFA), the
mixtures were produced with different volumetric proportions of FFA-Fi, IF-Fi, FFA-Co,
and IF-Co. In these cases, the particle size parameters were calculated as the weighted
mean of the SCMs used in each mixture.
The experimental specific surface area (SSABET) ranges between 3 and 10 times
that of the spherically assumed specific surface area (SSAPSD) as shown in Table 2.4. The
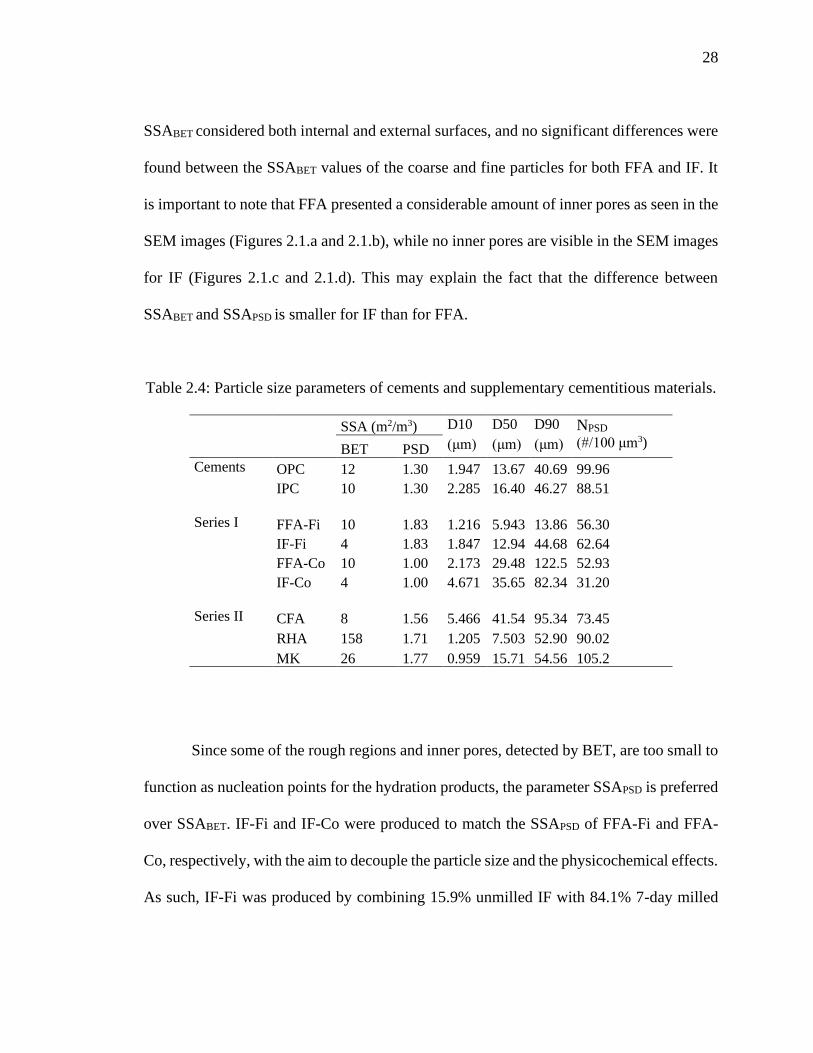
28
SSABET considered both internal and external surfaces, and no significant differences were
found between the SSABET values of the coarse and fine particles for both FFA and IF. It
is important to note that FFA presented a considerable amount of inner pores as seen in the
SEM images (Figures 2.1.a and 2.1.b), while no inner pores are visible in the SEM images
for IF (Figures 2.1.c and 2.1.d). This may explain the fact that the difference between
SSABET and SSAPSD is smaller for IF than for FFA.
Table 2.4: Particle size parameters of cements and supplementary cementitious materials.
SSA (m2/m3) D10 D50 D90 NPSD
(#/100 μm3) BET PSD (μm) (μm) (μm)
Cements OPC 12 1.30 1.947 13.67 40.69 99.96
IPC 10 1.30 2.285 16.40 46.27 88.51
Series I FFA-Fi 10 1.83 1.216 5.943 13.86 56.30
IF-Fi 4 1.83 1.847 12.94 44.68 62.64
FFA-Co 10 1.00 2.173 29.48 122.5 52.93
IF-Co 4 1.00 4.671 35.65 82.34 31.20
Series II CFA 8 1.56 5.466 41.54 95.34 73.45
RHA 158 1.71 1.205 7.503 52.90 90.02
MK 26 1.77 0.959 15.71 54.56 105.2
Since some of the rough regions and inner pores, detected by BET, are too small to
function as nucleation points for the hydration products, the parameter SSAPSD is preferred
over SSABET. IF-Fi and IF-Co were produced to match the SSAPSD of FFA-Fi and FFA-
Co, respectively, with the aim to decouple the particle size and the physicochemical effects.
As such, IF-Fi was produced by combining 15.9% unmilled IF with 84.1% 7-day milled
29
IF, while IF-Co was produced by combining 67.3% unmilled IF and 32.7% 7-day milled
IF.
2.3.2.2 Physicochemical behavior
According to Felekoglu et al. (Felekoǧlu et al. 2006), the physicochemical behavior
of cements and SCMs is mainly determined by their time-dependent hydration reactions
(i.e., cement chemical reactivity (CR) and SCM chemical reactivity (SCMR)) and surface
potential. Therefore, both properties were selected to characterize the physicochemical
behavior of these materials.
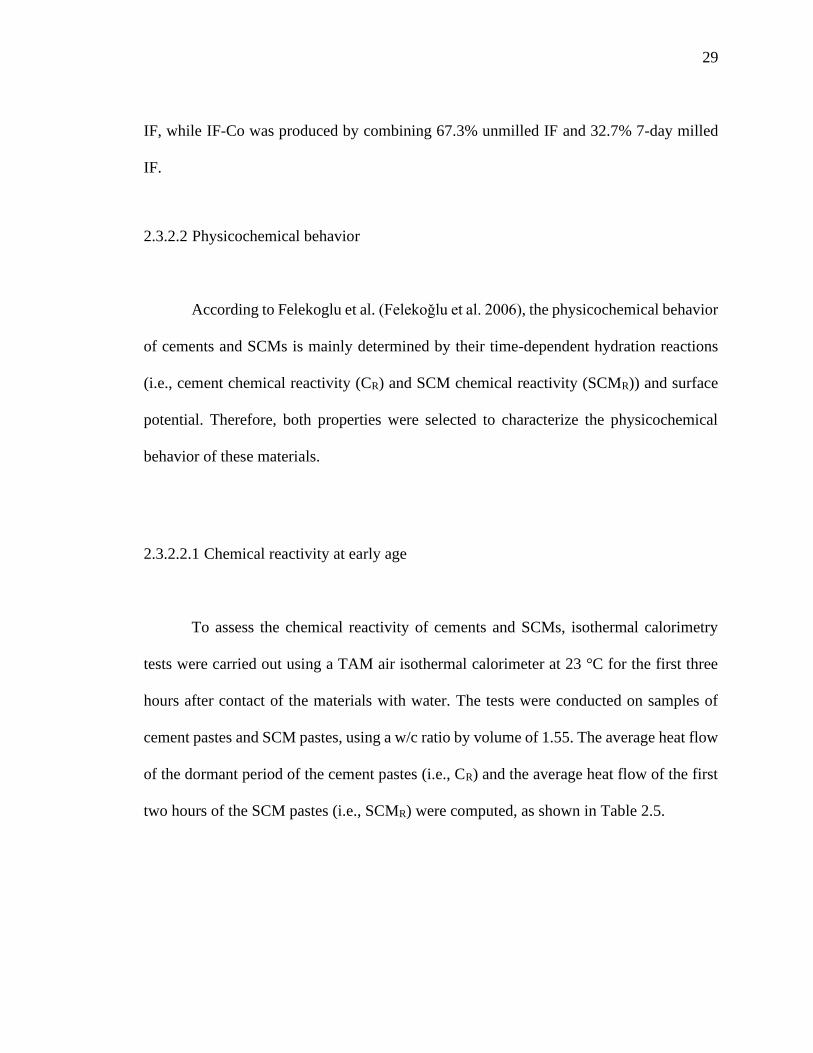
2.3.2.2.1 Chemical reactivity at early age
To assess the chemical reactivity of cements and SCMs, isothermal calorimetry
tests were carried out using a TAM air isothermal calorimeter at 23 °C for the first three
hours after contact of the materials with water. The tests were conducted on samples of
cement pastes and SCM pastes, using a w/c ratio by volume of 1.55. The average heat flow
of the dormant period of the cement pastes (i.e., CR) and the average heat flow of the first
two hours of the SCM pastes (i.e., SCMR) were computed, as shown in Table 2.5.

30
2.3.2.2.2 Surface potential
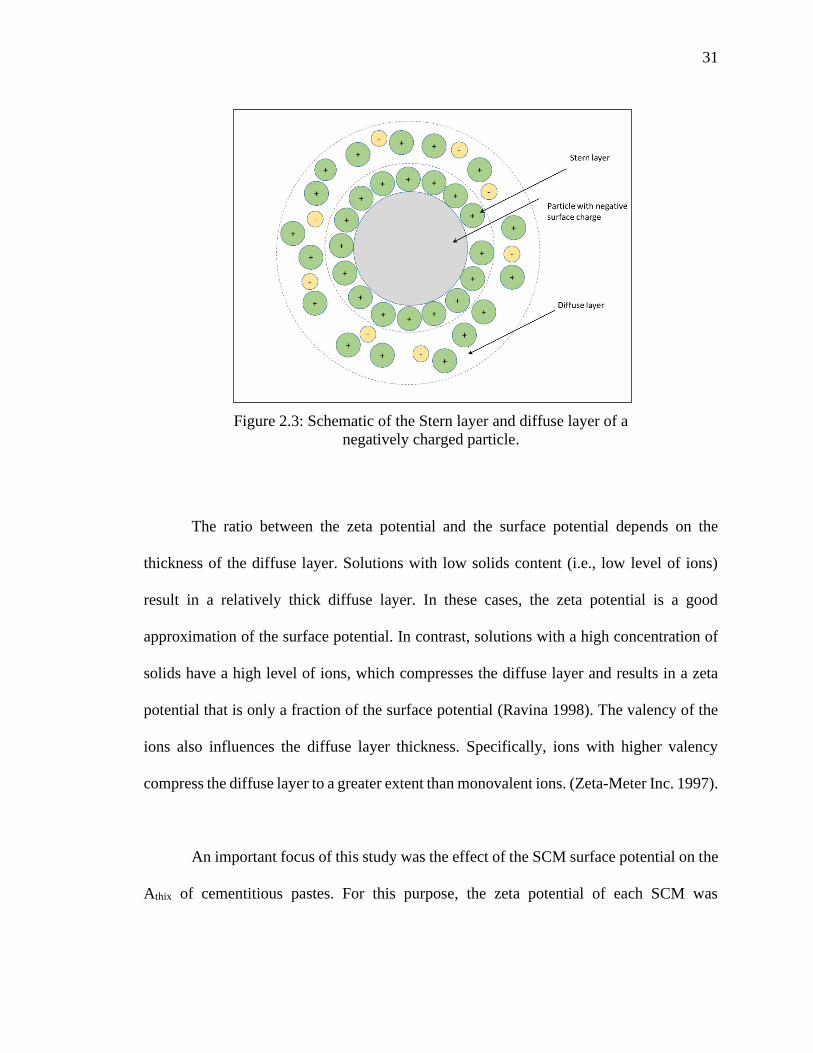
When colloid particles, such as cementitious materials, contact with an aqueous
solution, a firmly attached layer of counter-ions (i.e., ions with an opposite charge than that
of the particle surface) is formed around the particle surface. This layer of counter-ions is
known as the Stern layer. Around the Stern layer, a diffuse layer of counter-ions is
produced, which has a gradually decreasing concentration with distance until reaching
equilibrium with the normal counter-ion concentration in the solution (Stern 1924). A
schematic representation of the stern and diffuse layers of a negatively charged particle is
showed in Figure 2.3.
The surface potential cannot be measured in a simple manner; however, the
potential at the junction of the Stern layer and the diffuse layer, which is known as the zeta
potential, can be measured in a fairly simple manner (Ravina 1998).
31
Figure 2.3: Schematic of the Stern layer and diffuse layer of a
negatively charged particle.
The ratio between the zeta potential and the surface potential depends on the
thickness of the diffuse layer. Solutions with low solids content (i.e., low level of ions)
result in a relatively thick diffuse layer. In these cases, the zeta potential is a good
approximation of the surface potential. In contrast, solutions with a high concentration of
solids have a high level of ions, which compresses the diffuse layer and results in a zeta
potential that is only a fraction of the surface potential (Ravina 1998). The valency of the
ions also influences the diffuse layer thickness. Specifically, ions with higher valency
compress the diffuse layer to a greater extent than monovalent ions. (Zeta-Meter Inc. 1997).
An important focus of this study was the effect of the SCM surface potential on the
Athix of cementitious pastes. For this purpose, the zeta potential of each SCM was
32
determined on the basis of the electrophoresis principle, which is measured in suspensions
with low solids concentration, instead of the electroacoustic principle, which enables
measurements at high solid concentrations (Lowke and Gehlen 2017).
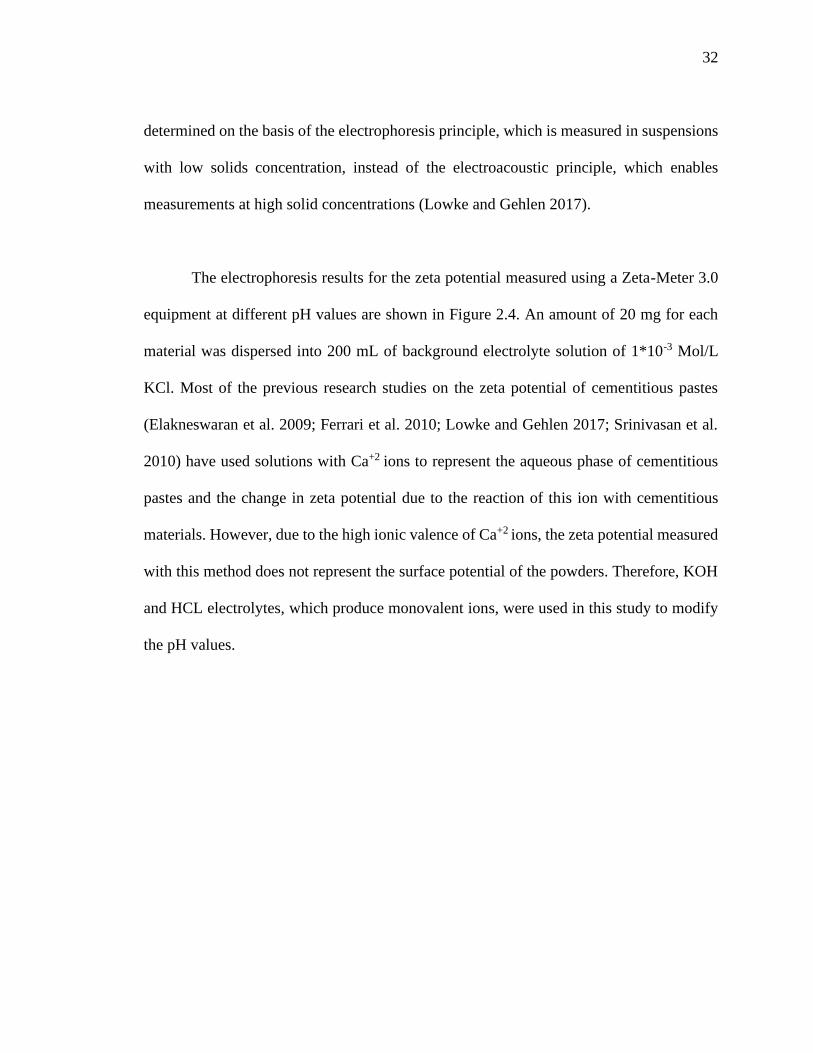
The electrophoresis results for the zeta potential measured using a Zeta-Meter 3.0
equipment at different pH values are shown in Figure 2.4. An amount of 20 mg for each
material was dispersed into 200 mL of background electrolyte solution of 1*10-3 Mol/L
KCl. Most of the previous research studies on the zeta potential of cementitious pastes
(Elakneswaran et al. 2009; Ferrari et al. 2010; Lowke and Gehlen 2017; Srinivasan et al.
2010) have used solutions with Ca+2 ions to represent the aqueous phase of cementitious
pastes and the change in zeta potential due to the reaction of this ion with cementitious
materials. However, due to the high ionic valence of Ca+2 ions, the zeta potential measured
with this method does not represent the surface potential of the powders. Therefore, KOH
and HCL electrolytes, which produce monovalent ions, were used in this study to modify
the pH values.
33
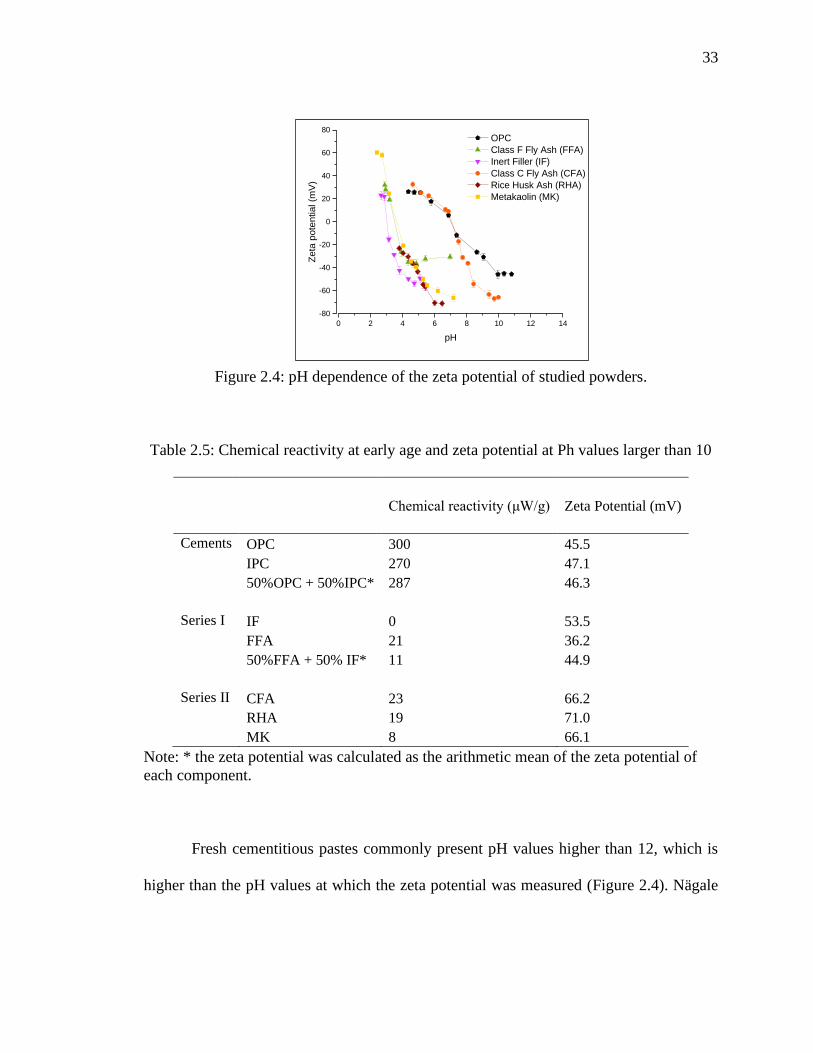
Figure 2.4: pH dependence of the zeta potential of studied powders.
Table 2.5: Chemical reactivity at early age and zeta potential at Ph values larger than 10
Chemical reactivity (μW/g) Zeta Potential (mV)
Cements OPC 300 45.5
IPC 270 47.1
50%OPC + 50%IPC* 287 46.3
Series I IF 0 53.5
FFA 21 36.2
50%FFA + 50% IF* 11 44.9
Series II CFA 23 66.2
RHA 19 71.0
MK 8 66.1
Note: * the zeta potential was calculated as the arithmetic mean of the zeta potential of
each component.
Fresh cementitious pastes commonly present pH values higher than 12, which is
higher than the pH values at which the zeta potential was measured (Figure 2.4). Nägale
0 2 4 6 8 10 12 14
-80
-60
-40
-20
0
20
40
60
80
Zeta
pote
ntia
l (m
V)
pH
OPC
Class F Fly Ash (FFA)
Inert Filler (IF)
Class C Fly Ash (CFA)
Rice Husk Ash (RHA)
Metakaolin (MK)
34
(Nägele 1986) measured the zeta potential of cementitious suspensions at different pH
values, which were obtained by adding KOH. It was found that when the zeta potential
values reach a plateau, further increases in pH result in relatively small changes in the zeta
potential. These results are similar to those for non-cementitious colloidal particles (Zhao
et al. 2005); therefore, it can be expected that the zeta potential at higher pH values than
those experimentally measured would be similar to the plateau values reached for each
material, presented in Table 2.5.
2.3.3 Mixture proportions and mixing sequence
Cementitious pastes were mixed and characterized with respect to the evolution of
𝜏0𝑆 and some of them were also characterized using isothermal calorimetry. The designs of
the Series I mixtures were determined according to the FFCCD described in Tables 2.1 and
2.2. For these mixtures, the w/c ratio by volume ranged between 1.24 and 1.55, which is
equivalent to a w/c ratio by mass between 0.40 and 0.50. In addition, between 20 and 40%
of the cement volume was replaced by SCMs, which is equivalent to mass replacements
between 16 and 37%.
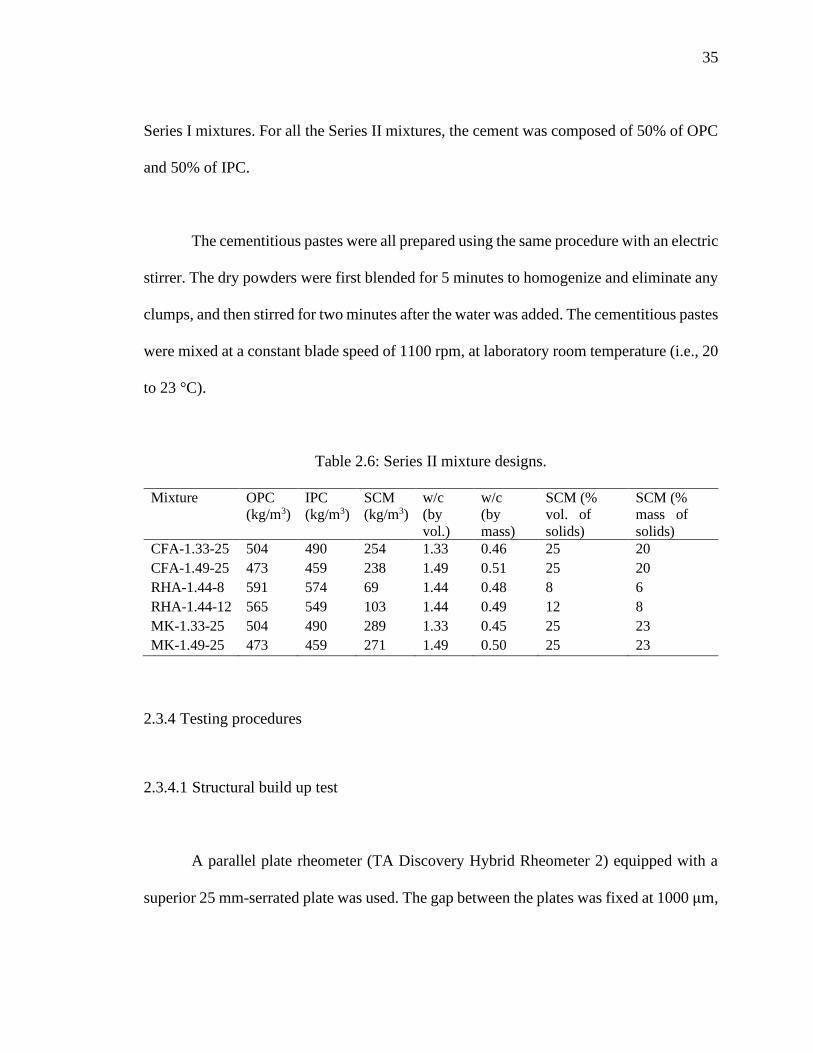
The Series II mixture designs are presented in Table 2.6. Six mixtures were
produced with different SCMs, w/c ratios, and SCM replacements than those used for the
35
Series I mixtures. For all the Series II mixtures, the cement was composed of 50% of OPC
and 50% of IPC.
The cementitious pastes were all prepared using the same procedure with an electric
stirrer. The dry powders were first blended for 5 minutes to homogenize and eliminate any
clumps, and then stirred for two minutes after the water was added. The cementitious pastes
were mixed at a constant blade speed of 1100 rpm, at laboratory room temperature (i.e., 20
to 23 °C).
Table 2.6: Series II mixture designs.
Mixture OPC
(kg/m3)
IPC
(kg/m3)
SCM
(kg/m3)
w/c
(by
vol.)
w/c
(by
mass)
SCM (%
vol. of
solids)
SCM (%
mass of
solids)
CFA-1.33-25 504 490 254 1.33 0.46 25 20
CFA-1.49-25 473 459 238 1.49 0.51 25 20
RHA-1.44-8 591 574 69 1.44 0.48 8 6
RHA-1.44-12 565 549 103 1.44 0.49 12 8
MK-1.33-25 504 490 289 1.33 0.45 25 23
MK-1.49-25 473 459 271 1.49 0.50 25 23
2.3.4 Testing procedures
2.3.4.1 Structural build up test
A parallel plate rheometer (TA Discovery Hybrid Rheometer 2) equipped with a
superior 25 mm-serrated plate was used. The gap between the plates was fixed at 1000 μm,
36
as shown to be adequate by Ferraris (Ferraris et al. 2001b; a) to compare the rheological
behavior of different cementitious pastes. As seen in the experiments carried out by Sant
et al. (Sant et al. 2008), each specimen was protected from excess evaporation using a
chamber with an absorbent sponge soaked with water around it.
The test protocol included the following steps, consistent with procedures used by
previous researchers (Sant et al. 2008; Yuan et al. 2017, 2018). At 13 min after the addition
of water, the cementitious paste was pre-sheared at 100 s-1 for 60 s to attain a reference
state. At 15 min, the static yield stress test was performed and repeated every 15 min until
120 min. Each static yield stress test consisted of applying a constant shear rate of 0.015 s-
1 for 60 s. The peak stress from each test was recorded as the respective 𝜏0𝑆. Note that this
methodology involving repeated measurements using the same sample may distress the
structure of the sample. Thus, 𝐴𝑡ℎ𝑖𝑥 could have been underestimated when using a single
sample for all the measurements of 𝜏0𝑆. This methodology, instead of multiple samples
tested at different ages, was chosen because the variability between multiple samples could
be large and overshadow the results. Furthermore, according to the results of Yuan et al.
(Yuan et al. 2017), the effect of each 𝜏0𝑆 measurement on the following measurement using
the same sample is small.
37
2.3.4.2 Calorimetric test and boundary nucleation and growth (BNG) model
Isothermal calorimetry tests were conducted to assess the effects of the studied
properties on the formation and growth of C-S-H bridges between cementitious particles.
The measurements were made using a TAM Air isothermal calorimeter. Heat of hydration
was recorded per gram of cement over a period of 12 h at 23°C, beginning approximately
45 minutes after the addition of water.
The heat flow resulting from cement hydration involves several parallel and/or
series processes, such as dissolution, growth, nucleation, and complexation (Bullard et al.
2011). The BNG model has been used to describe of hydration kinetics of cement (Honorio
et al. 2016; Huang et al. 2019; Oey et al. 2013; Scherer et al. 2012; Thomas 2007; Zhang
et al. 2010). This model assumes that: 1) the nucleation and growth rates are constant
during the hydration process, 2) the nucleation of C-S-H bridges happens randomly on the
surfaces of the cement particles, and 3) the nucleation and growth start at the time of
addition of water and continue during the induction period.
According to the BNG model, the volume fraction of hydrates, (X(t)) can be
obtained from Eq. (2-3) (Huang et al. 2019; Scherer et al. 2012).
38
X(t) = 1 − exp {−2KGt ∫ [1 − exp(−KNt3(1 − μ)2(1 + 2μ)] dμ1
0} (2-3)
where, t is the age of cement paste in hours, KN and KG are two independent rate
constants that describe the kinetics of a boundary-nucleated process, and μ is a dummy
variable.
The BNG model fits the calorimetric data well, and the heat flow can be defined as
A(dx/dt), where A is a scaling parameter (Honorio et al. 2016; Huang et al. 2019; Oey et
al. 2013; Scherer et al. 2012; Thomas 2007; Zhang et al. 2010). In this study, the measured
heat flow, mainly the data between the minimum point in the induction period and the peak
of the acceleration period, were used to determine KN and KG.
2.4 Results and discussions
2.4.1 Growth of static yield stress in time
Figure 2.5 shows the 𝜏0𝑆 measurements up to a maximum value of 1000 Pa. Even
though some of the mixtures reached 𝜏0𝑆 values above 1000 Pa, those results are not
included in Figure 2.5 so as to show the earlier measurements in better detail. All of the
mixtures presented two stages: first a stage showing a linear increase in 𝜏0𝑆 and then a stage
showing an accelerated increase in 𝜏0𝑆. This trend follows the behavior reported by previous
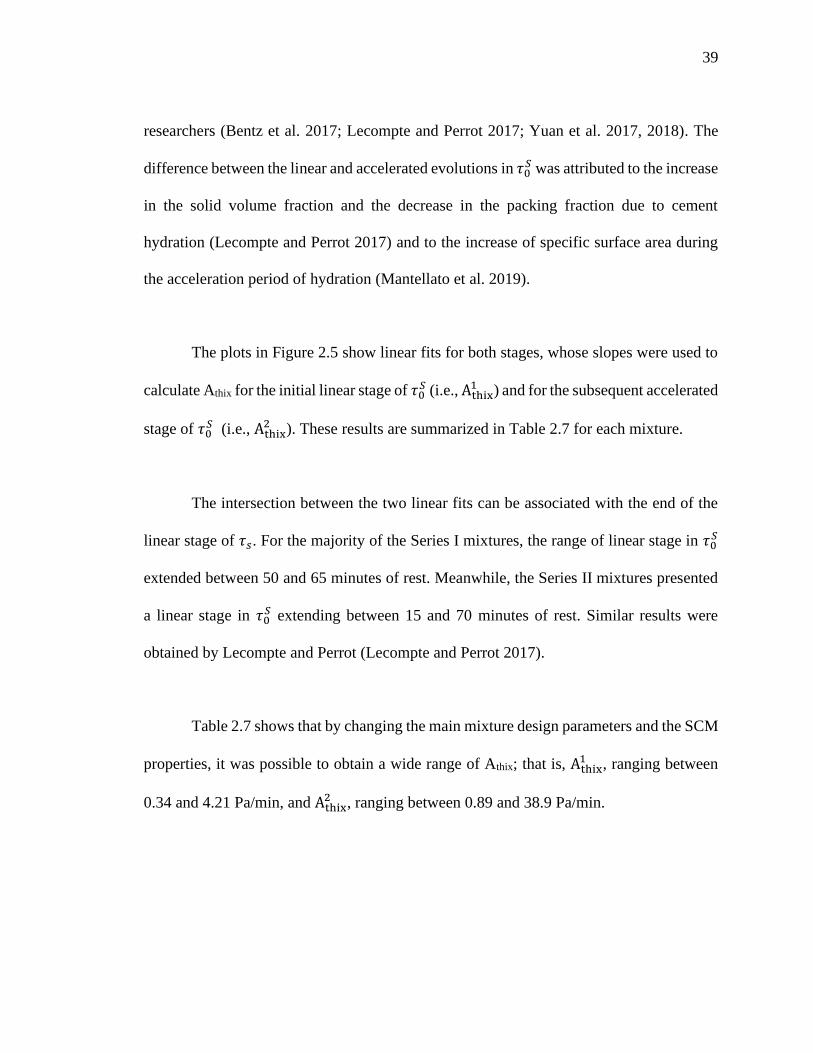
39
researchers (Bentz et al. 2017; Lecompte and Perrot 2017; Yuan et al. 2017, 2018). The
difference between the linear and accelerated evolutions in 𝜏0𝑆 was attributed to the increase
in the solid volume fraction and the decrease in the packing fraction due to cement
hydration (Lecompte and Perrot 2017) and to the increase of specific surface area during
the acceleration period of hydration (Mantellato et al. 2019).
The plots in Figure 2.5 show linear fits for both stages, whose slopes were used to
calculate Athix for the initial linear stage of 𝜏0𝑆 (i.e., Athix
1 ) and for the subsequent accelerated
stage of 𝜏0𝑆 (i.e., Athix
2 ). These results are summarized in Table 2.7 for each mixture.
The intersection between the two linear fits can be associated with the end of the
linear stage of 𝜏𝑠. For the majority of the Series I mixtures, the range of linear stage in 𝜏0𝑆
extended between 50 and 65 minutes of rest. Meanwhile, the Series II mixtures presented
a linear stage in 𝜏0𝑆 extending between 15 and 70 minutes of rest. Similar results were
obtained by Lecompte and Perrot (Lecompte and Perrot 2017).
Table 2.7 shows that by changing the main mixture design parameters and the SCM
properties, it was possible to obtain a wide range of Athix; that is, Athix1 , ranging between
0.34 and 4.21 Pa/min, and Athix2 , ranging between 0.89 and 38.9 Pa/min.

40
In addition, the results in Table 2.7 indicate a strong correlation between Athix1 and
Athix2 . An ANOVA showed that 82% of the observed variability in Athix
2 can be explained
with Athix1 . Both Athix
2 and Athix1 are governed by cement nucleation, but Athix
2 is also
affected by the solid volume fraction (Lecompte and Perrot 2017), which is out of the scope
of this research. In addition, for the concrete technologies of interest in this chapter, such
as 3D printing and SCC, the increase of 𝜏0𝑆 within the first hour is more relevant than the
changes produced in later times. Thus, the analysis of the following sections is focused on
the Athix1 results.
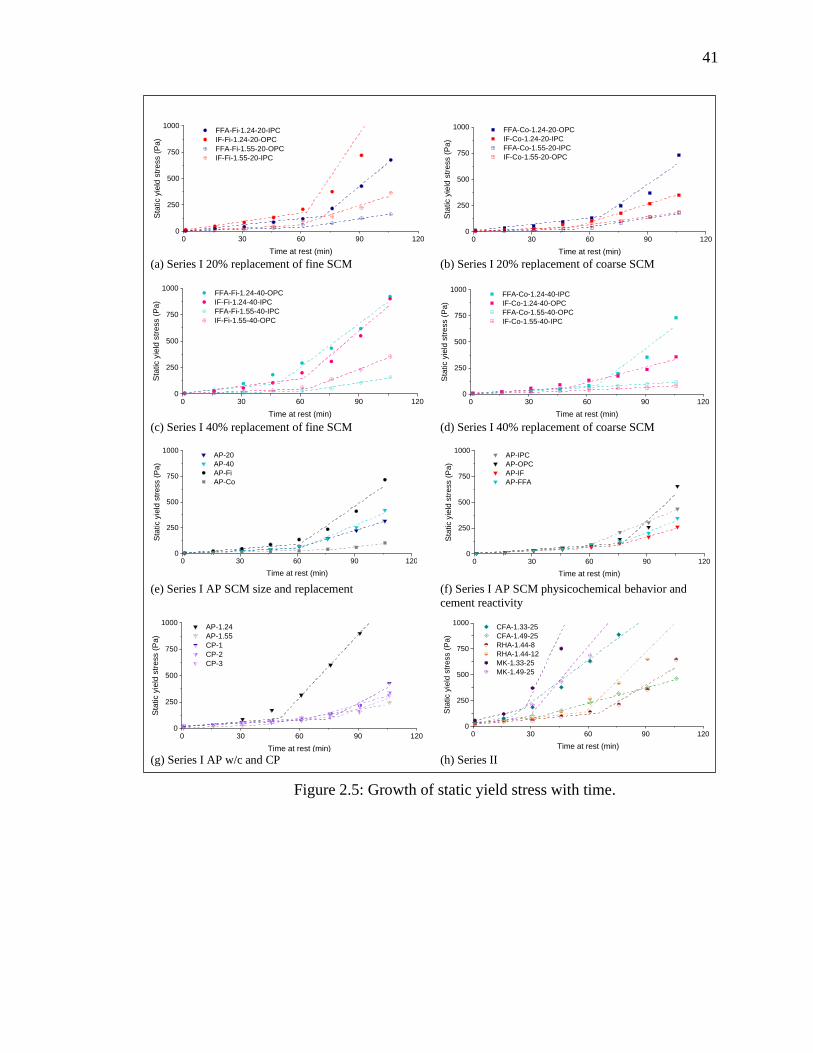
41
(a) Series I 20% replacement of fine SCM (b) Series I 20% replacement of coarse SCM
(c) Series I 40% replacement of fine SCM (d) Series I 40% replacement of coarse SCM
(e) Series I AP SCM size and replacement (f) Series I AP SCM physicochemical behavior and
cement reactivity
(g) Series I AP w/c and CP
(h) Series II
Figure 2.5: Growth of static yield stress with time.
0 30 60 90 1200
250
500
750
1000 FFA-Fi-1.24-20-IPC
IF-Fi-1.24-20-OPC
FFA-Fi-1.55-20-OPC
IF-Fi-1.55-20-IPCS
tatic y
ield
str
ess (
Pa)
Time at rest (min)
0 30 60 90 1200
250
500
750
1000 FFA-Co-1.24-20-OPC
IF-Co-1.24-20-IPC
FFA-Co-1.55-20-IPC
IF-Co-1.55-20-OPC
Sta
tic y
ield
str
ess (
Pa)
Time at rest (min)
0 30 60 90 1200
250
500
750
1000 FFA-Fi-1.24-40-OPC
IF-Fi-1.24-40-IPC
FFA-Fi-1.55-40-IPC
IF-Fi-1.55-40-OPC
Sta
tic y
ield
str
ess (
Pa)
Time at rest (min)
0 30 60 90 1200
250
500
750
1000 FFA-Co-1.24-40-IPC
IF-Co-1.24-40-OPC
FFA-Co-1.55-40-OPC
IF-Co-1.55-40-IPC
Sta
tic y
ield
str
ess (
Pa)
Time at rest (min)
0 30 60 90 1200
250
500
750
1000 AP-20
AP-40
AP-Fi
AP-Co
Sta
tic y
ield
str
ess (
Pa)
Time at rest (min)
0 30 60 90 1200
250
500
750
1000 AP-IPC
AP-OPC
AP-IF
AP-FFA
Sta
tic y
ield
str
ess (
Pa)
Time at rest (min)
0 30 60 90 1200
250
500
750
1000 AP-1.24
AP-1.55
CP-1
CP-2
CP-3
Sta
tic y
ield
str
ess (
Pa)
Time at rest (min)
0 30 60 90 1200
250
500
750
1000 CFA-1.33-25
CFA-1.49-25
RHA-1.44-8
RHA-1.44-12
MK-1.33-25
MK-1.49-25
Sta
tic y
ield
str
ess (
Pa)
Time at rest (min)
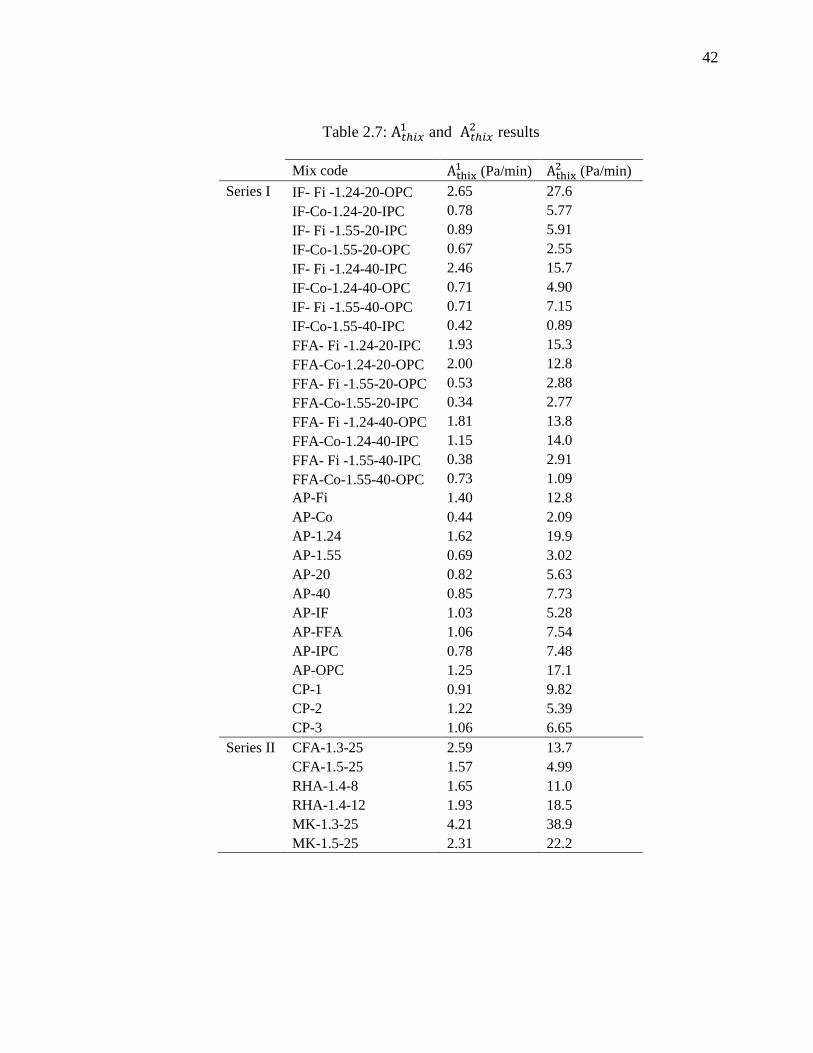
42
Table 2.7: A𝑡ℎ𝑖𝑥1 and A𝑡ℎ𝑖𝑥
2 results
Mix code Athix1 (Pa/min) Athix
2 (Pa/min)
Series I IF- Fi -1.24-20-OPC 2.65 27.6
IF-Co-1.24-20-IPC 0.78 5.77
IF- Fi -1.55-20-IPC 0.89 5.91
IF-Co-1.55-20-OPC 0.67 2.55
IF- Fi -1.24-40-IPC 2.46 15.7
IF-Co-1.24-40-OPC 0.71 4.90
IF- Fi -1.55-40-OPC 0.71 7.15
IF-Co-1.55-40-IPC 0.42 0.89
FFA- Fi -1.24-20-IPC 1.93 15.3
FFA-Co-1.24-20-OPC 2.00 12.8
FFA- Fi -1.55-20-OPC 0.53 2.88
FFA-Co-1.55-20-IPC 0.34 2.77
FFA- Fi -1.24-40-OPC 1.81 13.8
FFA-Co-1.24-40-IPC 1.15 14.0
FFA- Fi -1.55-40-IPC 0.38 2.91
FFA-Co-1.55-40-OPC 0.73 1.09
AP-Fi 1.40 12.8
AP-Co 0.44 2.09
AP-1.24 1.62 19.9
AP-1.55 0.69 3.02
AP-20 0.82 5.63
AP-40 0.85 7.73
AP-IF 1.03 5.28
AP-FFA 1.06 7.54
AP-IPC 0.78 7.48
AP-OPC 1.25 17.1
CP-1 0.91 9.82
CP-2 1.22 5.39
CP-3 1.06 6.65
Series II CFA-1.3-25 2.59 13.7
CFA-1.5-25 1.57 4.99
RHA-1.4-8 1.65 11.0
RHA-1.4-12 1.93 18.5
MK-1.3-25 4.21 38.9
MK-1.5-25 2.31 22.2
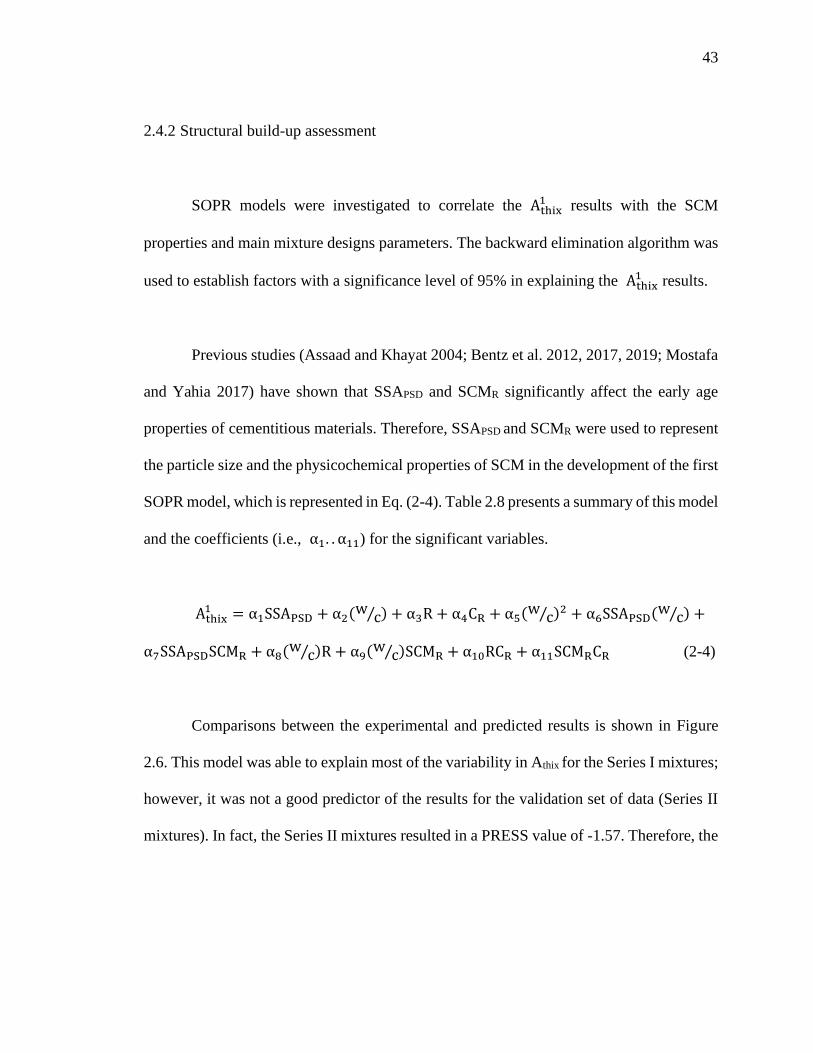
43
2.4.2 Structural build-up assessment
SOPR models were investigated to correlate the Athix1 results with the SCM
properties and main mixture designs parameters. The backward elimination algorithm was
used to establish factors with a significance level of 95% in explaining the Athix1 results.
Previous studies (Assaad and Khayat 2004; Bentz et al. 2012, 2017, 2019; Mostafa
and Yahia 2017) have shown that SSAPSD and SCMR significantly affect the early age
properties of cementitious materials. Therefore, SSAPSD and SCMR were used to represent
the particle size and the physicochemical properties of SCM in the development of the first
SOPR model, which is represented in Eq. (2-4). Table 2.8 presents a summary of this model
and the coefficients (i.e., α1. . α11) for the significant variables.
Athix1 = α1SSAPSD + α2(w
c⁄ ) + α3R + α4CR + α5(wc⁄ )2 + α6SSAPSD(w
c⁄ ) +
α7SSAPSDSCMR + α8(wc⁄ )R + α9(w
c⁄ )SCMR + α10RCR + α11SCMRCR (2-4)
Comparisons between the experimental and predicted results is shown in Figure
2.6. This model was able to explain most of the variability in Athix for the Series I mixtures;
however, it was not a good predictor of the results for the validation set of data (Series II
mixtures). In fact, the Series II mixtures resulted in a PRESS value of -1.57. Therefore, the
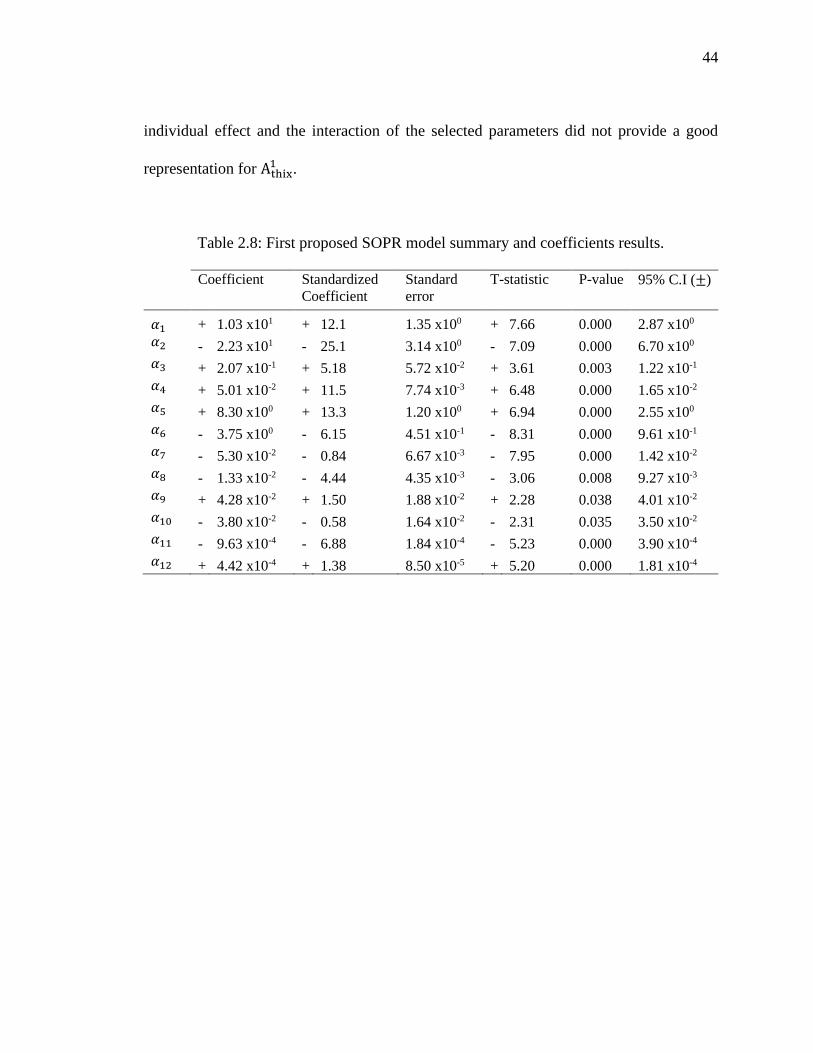
44
individual effect and the interaction of the selected parameters did not provide a good
representation for Athix1 .
Table 2.8: First proposed SOPR model summary and coefficients results.
Coefficient Standardized
Coefficient
Standard
error
T-statistic P-value 95% C.I (±)
𝛼1 + 1.03 x101 + 12.1 1.35 x100 + 7.66 0.000 2.87 x100
𝛼2 - 2.23 x101 - 25.1 3.14 x100 - 7.09 0.000 6.70 x100
𝛼3 + 2.07 x10⁻¹ + 5.18 5.72 x10⁻² + 3.61 0.003 1.22 x10⁻¹
𝛼4 + 5.01 x10⁻² + 11.5 7.74 x10⁻³ + 6.48 0.000 1.65 x10⁻²
𝛼5 + 8.30 x100 + 13.3 1.20 x100 + 6.94 0.000 2.55 x100
𝛼6 - 3.75 x100 - 6.15 4.51 x10⁻¹ - 8.31 0.000 9.61 x10⁻¹
𝛼7 - 5.30 x10⁻² - 0.84 6.67 x10⁻³ - 7.95 0.000 1.42 x10⁻²
𝛼8 - 1.33 x10⁻² - 4.44 4.35 x10⁻³ - 3.06 0.008 9.27 x10⁻³
𝛼9 + 4.28 x10⁻² + 1.50 1.88 x10⁻² + 2.28 0.038 4.01 x10⁻²
𝛼10 - 3.80 x10⁻² - 0.58 1.64 x10⁻² - 2.31 0.035 3.50 x10⁻²
𝛼11 - 9.63 x10⁻⁴ - 6.88 1.84 x10⁻⁴ - 5.23 0.000 3.90 x10⁻⁴
𝛼12 + 4.42 x10⁻⁴ + 1.38 8.50 x10⁻⁵ + 5.20 0.000 1.81 x10⁻⁴
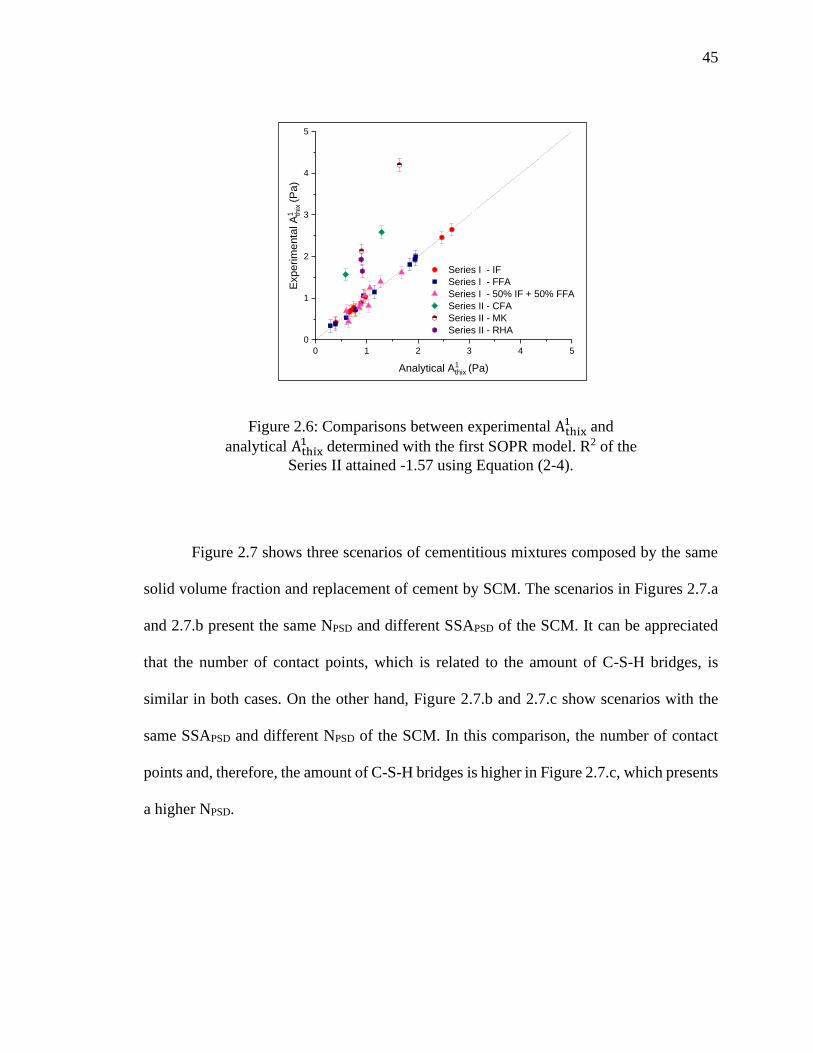
45
0 1 2 3 4 5
0
1
2
3
4
5
Series I - IF
Series I - FFA
Series I - 50% IF + 50% FFA
Series II - CFA
Series II - MK
Series II - RHA
Experim
enta
l A
1 thix
(P
a)
Analytical A1thix (Pa)
Figure 2.6: Comparisons between experimental Athix1
and
analytical Athix1
determined with the first SOPR model. R2 of the
Series II attained -1.57 using Equation (2-4).
Figure 2.7 shows three scenarios of cementitious mixtures composed by the same
solid volume fraction and replacement of cement by SCM. The scenarios in Figures 2.7.a
and 2.7.b present the same NPSD and different SSAPSD of the SCM. It can be appreciated
that the number of contact points, which is related to the amount of C-S-H bridges, is
similar in both cases. On the other hand, Figure 2.7.b and 2.7.c show scenarios with the
same SSAPSD and different NPSD of the SCM. In this comparison, the number of contact
points and, therefore, the amount of C-S-H bridges is higher in Figure 2.7.c, which presents
a higher NPSD.
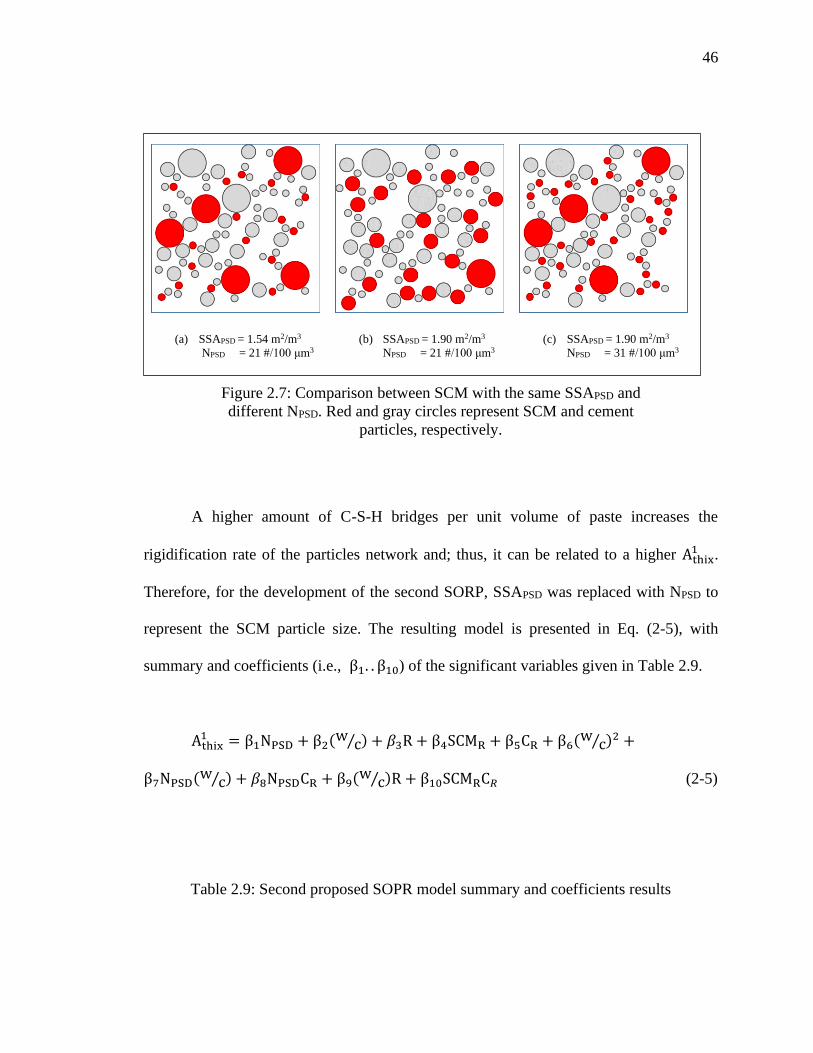
46
Figure 2.7: Comparison between SCM with the same SSAPSD and
different NPSD. Red and gray circles represent SCM and cement
particles, respectively.
A higher amount of C-S-H bridges per unit volume of paste increases the
rigidification rate of the particles network and; thus, it can be related to a higher Athix1 .
Therefore, for the development of the second SORP, SSAPSD was replaced with NPSD to
represent the SCM particle size. The resulting model is presented in Eq. (2-5), with
summary and coefficients (i.e., β1. . β10) of the significant variables given in Table 2.9.
Athix1 = β1NPSD + β2(w
c⁄ ) + 𝛽3R + β4SCMR + β5CR + β6(wc⁄ )2 +
β7NPSD(wc⁄ ) + 𝛽8NPSDCR + β9(w
c⁄ )R + β10SCMRC𝑅 (2-5)
Table 2.9: Second proposed SOPR model summary and coefficients results
(a) SSAPSD = 1.54 m2/m3
NPSD = 21 #/100 μm3
(b) SSAPSD = 1.90 m2/m3
NPSD = 21 #/100 μm3
(c) SSAPSD = 1.90 m2/m3
NPSD = 31 #/100 μm3
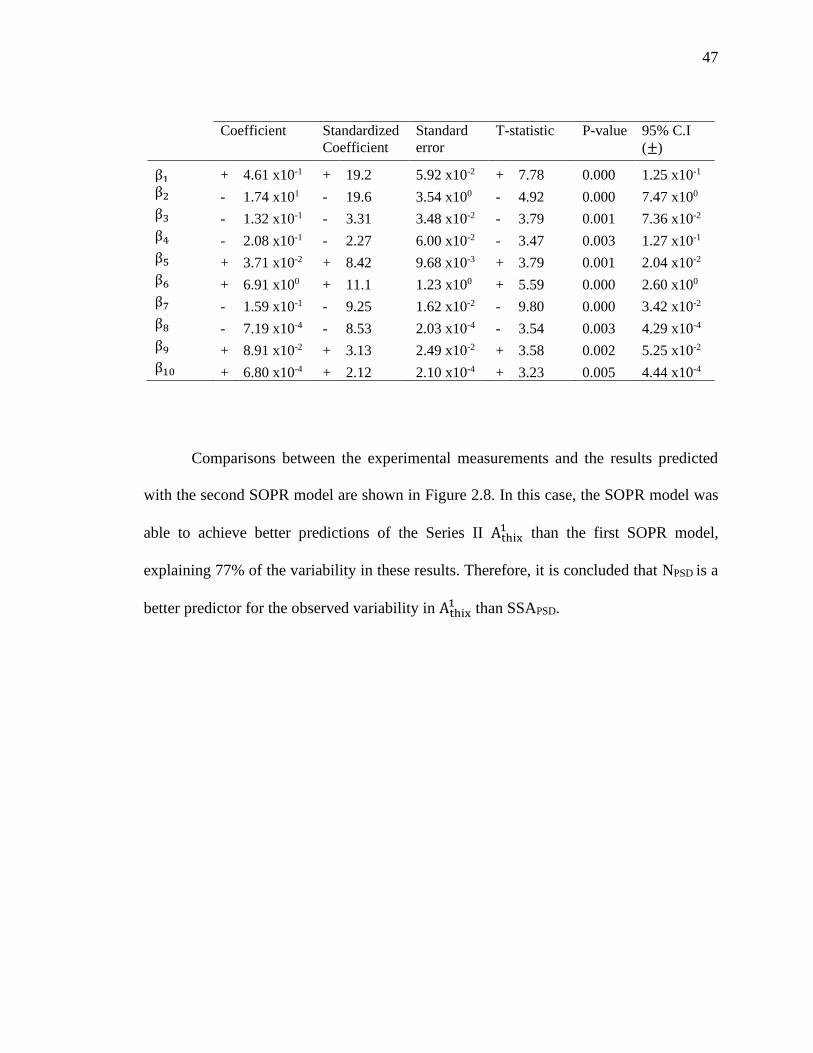
47
Coefficient Standardized
Coefficient
Standard
error
T-statistic P-value 95% C.I
(±)
β1 + 4.61 x10⁻¹ + 19.2 5.92 x10⁻² + 7.78 0.000 1.25 x10⁻¹
β2 - 1.74 x101 - 19.6 3.54 x100 - 4.92 0.000 7.47 x100
β3 - 1.32 x10⁻¹ - 3.31 3.48 x10⁻² - 3.79 0.001 7.36 x10⁻²
β4 - 2.08 x10⁻¹ - 2.27 6.00 x10⁻² - 3.47 0.003 1.27 x10⁻¹
β5 + 3.71 x10⁻² + 8.42 9.68 x10⁻³ + 3.79 0.001 2.04 x10⁻²
β6 + 6.91 x100 + 11.1 1.23 x100 + 5.59 0.000 2.60 x100
β7 - 1.59 x10⁻¹ - 9.25 1.62 x10⁻² - 9.80 0.000 3.42 x10⁻²
β8 - 7.19 x10⁻⁴ - 8.53 2.03 x10⁻⁴ - 3.54 0.003 4.29 x10⁻⁴
β9 + 8.91 x10⁻² + 3.13 2.49 x10⁻² + 3.58 0.002 5.25 x10⁻²
β10 + 6.80 x10⁻⁴ + 2.12 2.10 x10⁻⁴ + 3.23 0.005 4.44 x10⁻⁴
Comparisons between the experimental measurements and the results predicted
with the second SOPR model are shown in Figure 2.8. In this case, the SOPR model was
able to achieve better predictions of the Series II Athix1 than the first SOPR model,
explaining 77% of the variability in these results. Therefore, it is concluded that NPSD is a
better predictor for the observed variability in Athix1 than SSAPSD.
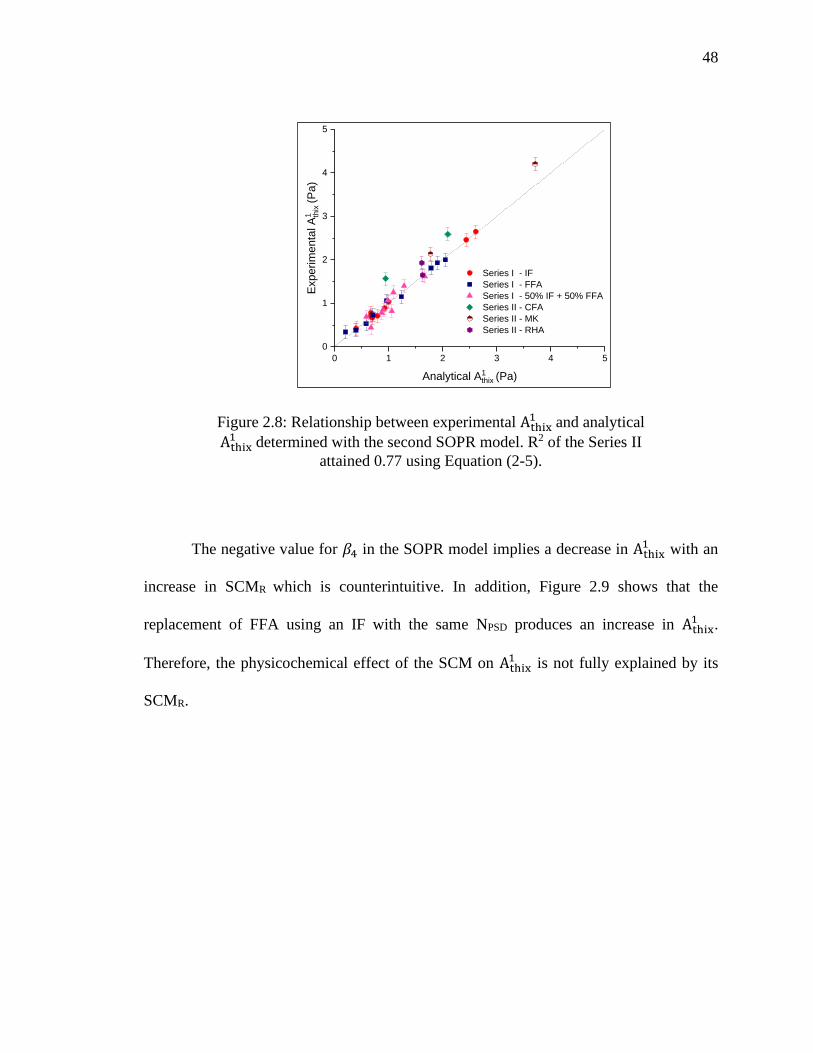
48
Figure 2.8: Relationship between experimental Athix1
and analytical
Athix1
determined with the second SOPR model. R2 of the Series II
attained 0.77 using Equation (2-5).
The negative value for 𝛽4 in the SOPR model implies a decrease in Athix1 with an
increase in SCMR which is counterintuitive. In addition, Figure 2.9 shows that the
replacement of FFA using an IF with the same NPSD produces an increase in Athix1 .
Therefore, the physicochemical effect of the SCM on Athix1 is not fully explained by its
SCMR.
0 1 2 3 4 5
0
1
2
3
4
5
Series I - IF
Series I - FFA
Series I - 50% IF + 50% FFA
Series II - CFA
Series II - MK
Series II - RHA
Exp
erim
enta
l A
1 thix
(P
a)
Analytical A1thix (Pa)

49
Figure 2.9: Comparison between experimental Athix1 obtained with
IF and FFA replacements. Each point represents the average of the
Athix1 of the mixtures produced with the corresponding NPSD and
type of SCM (i.e., IF or FFA).
In previous studies of colloidal suspensions, it has been stablished that particles
with lower surface potential attract less ions, reducing the electrostatic repulsion energy.
This produces particle flocculation and, therefore, higher 𝜏0𝑆 (Larson 1999). However, in
the case of cementitious pastes, the particles hydrate in time and this process is affected by
the ions diluted in the pore solution. One of the main ions of the pore solution is Ca+2
(Lowke and Gehlen 2017). Thus, it is expected that particles with higher surface potential
attract larger amounts of Ca+2, which increases the concentration of this ion in the pseudo-
contact points (i.e., zone where the C-S-H bridges are formed). In addition, Chen et al.
(Chen et al. 2004) showed that slight increases of the Ca+2 concentration in the pore
solution produces considerable increases in the cement hydration. Therefore, it can be
30 35 40 45 50 55 60 65
0.0
0.5
1.0
1.5
2.0
A1 th
ix (P
a/m
in)
Particle density (#/100 mm3)
IF
FFA
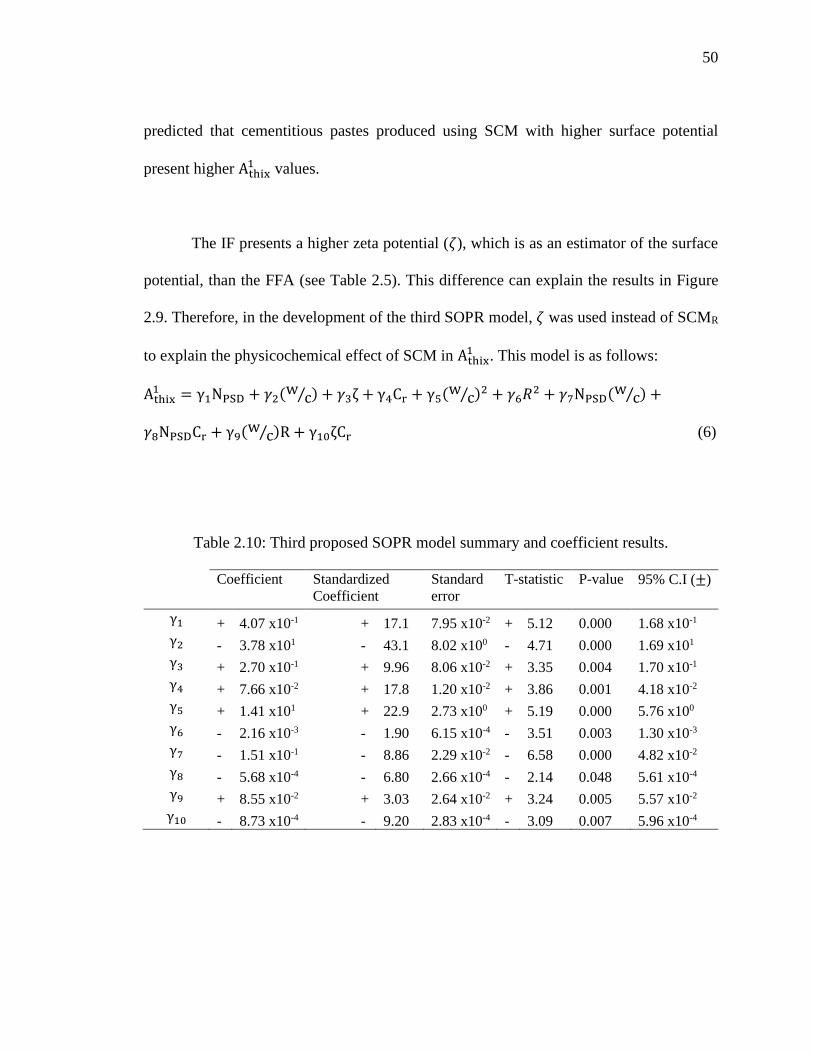
50
predicted that cementitious pastes produced using SCM with higher surface potential
present higher Athix1 values.
The IF presents a higher zeta potential (𝜁), which is as an estimator of the surface
potential, than the FFA (see Table 2.5). This difference can explain the results in Figure
2.9. Therefore, in the development of the third SOPR model, 𝜁 was used instead of SCMR
to explain the physicochemical effect of SCM in Athix1 . This model is as follows:
Athix1 = γ1NPSD + 𝛾2(w
c⁄ ) + 𝛾3ζ + γ4Cr + γ5(wc⁄ )2 + 𝛾6𝑅2 + 𝛾7NPSD(w
c⁄ ) +
𝛾8NPSDCr + γ9(wc⁄ )R + γ10ζCr (6)
Table 2.10: Third proposed SOPR model summary and coefficient results.
Coefficient Standardized
Coefficient
Standard
error
T-statistic P-value 95% C.I (±)
γ1 + 4.07 x10⁻¹ + 17.1 7.95 x10⁻² + 5.12 0.000 1.68 x10⁻¹
γ2 - 3.78 x101 - 43.1 8.02 x100 - 4.71 0.000 1.69 x101
γ3 + 2.70 x10⁻¹ + 9.96 8.06 x10⁻² + 3.35 0.004 1.70 x10⁻¹
γ4 + 7.66 x10⁻² + 17.8 1.20 x10⁻² + 3.86 0.001 4.18 x10⁻²
γ5 + 1.41 x101 + 22.9 2.73 x100 + 5.19 0.000 5.76 x100
γ6 - 2.16 x10⁻³ - 1.90 6.15 x10⁻⁴ - 3.51 0.003 1.30 x10⁻³
γ7 - 1.51 x10⁻¹ - 8.86 2.29 x10⁻² - 6.58 0.000 4.82 x10⁻²
γ8 - 5.68 x10⁻⁴ - 6.80 2.66 x10⁻⁴ - 2.14 0.048 5.61 x10⁻⁴
γ9 + 8.55 x10⁻² + 3.03 2.64 x10⁻² + 3.24 0.005 5.57 x10⁻²
γ10 - 8.73 x10⁻⁴ - 9.20 2.83 x10⁻⁴ - 3.09 0.007 5.96 x10⁻⁴

51
The fact that 𝛾1 and 𝛾3 are positive means that the use of SCMs with higher NPSD
and higher 𝜁 produces cementitious pastes with higher Athix1 .
The coefficients (i.e., γ1… γ10) for Eq. (2-6) are shown in Table 2.10. Comparisons
between the experimental measurements and the results predicted with the third SOPR
model are shown in Figure 2.10. This model can explain 98% of the variability in Athix1
for the series II mixtures, which is significantly better than the second SOPR model.
Comparing the results of both models, it can be stated that 𝜁 is more significant than SCMR
in the explanation of the Athix1 results.
Figure 2.10: Relationship between experimental Athix1
and
analytical Athix1
determined with the third SOPR model. R2 of the
Series II attained 0.98 using Equation (2-6).
0 1 2 3 4 5
0
1
2
3
4
5
Series I - IF
Series I - FFA
Series I - 50% IF + 50% FFA
Series II - CFA
Series II - MK
Series II - RHA
Exp
erim
enta
l A
1 thix
(P
a)
Analytical A1thix (Pa)
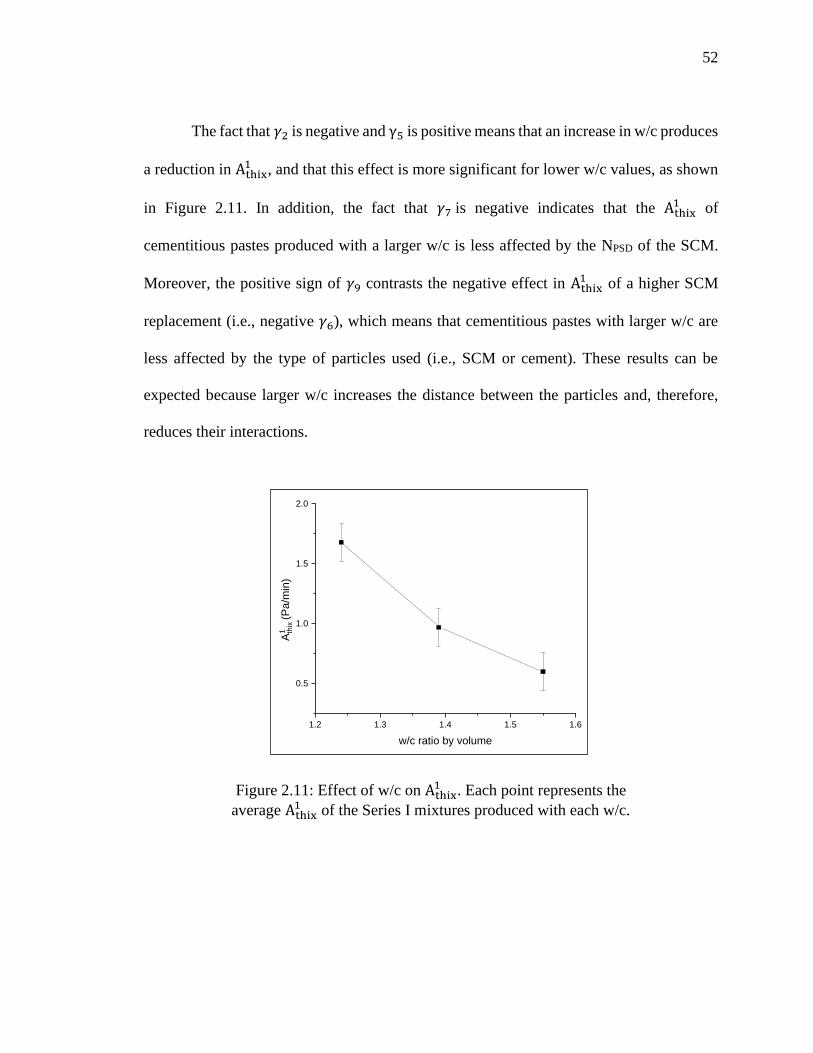
52
The fact that 𝛾2 is negative and γ5 is positive means that an increase in w/c produces
a reduction in Athix1 , and that this effect is more significant for lower w/c values, as shown
in Figure 2.11. In addition, the fact that 𝛾7 is negative indicates that the Athix1 of
cementitious pastes produced with a larger w/c is less affected by the NPSD of the SCM.
Moreover, the positive sign of 𝛾9 contrasts the negative effect in Athix1 of a higher SCM
replacement (i.e., negative 𝛾6), which means that cementitious pastes with larger w/c are
less affected by the type of particles used (i.e., SCM or cement). These results can be
expected because larger w/c increases the distance between the particles and, therefore,
reduces their interactions.
Figure 2.11: Effect of w/c on Athix1 . Each point represents the
average Athix1 of the Series I mixtures produced with each w/c.
1.2 1.3 1.4 1.5 1.6
0.5
1.0
1.5
2.0
A1 th
ix (P
a/m
in)
w/c ratio by volume
53
The interaction between w/c and R (i.e., 𝛾9) has a positive effect on Athix1 . In
contrast, the square of R (i.e., 𝛾6) has a negative effect on Athix1 . The interaction between
these two effects means that an increase in R increases Athix1 until a threshold amount of
replacement, which, according to the SOPR model, is near 30%. Further increases of R
produce reductions in Athix1 . The replacement of cement by SCM produces a dilution of the
cement particles, increasing w/c, and improving its hydration (De la Varga et al. 2018). In
addition, the SCM provides new nucleation sites, which increase the number of C-S-H
bridges. As a result of these effects, the replacement of SCM by cement increases Athix1 .
However, C-S-H bridges are not produced between the SCM particles. Thus, beyond a
certain threshold (i.e., R larger than 30%), further increases in SCM replacement reduce
the pseudo-contact points between the cement particles or between the cement and the
SCM particles, which reduces Athix1 .
The fact that 𝛾4 is positive implies that cements with higher reactivity during the
dormant period (i.e., higher CR) produce cementitious pastes with higher Athix1 . In contrast,
𝛾8 and 𝛾10 are negative, which means that the Athix1 of mixtures produced with cements
with higher reactivity is less affected by the NPSD or 𝜁 of the SCM.
Athix1 values estimated with the SOPR model for different combinations of SCM
properties (i.e., zeta potential and particle density) are analyzed. Specifically, Figure 2.12.a
shows the results for w/c and R of 1.55 and 40%, respectively, while Figure 2.12.b shows
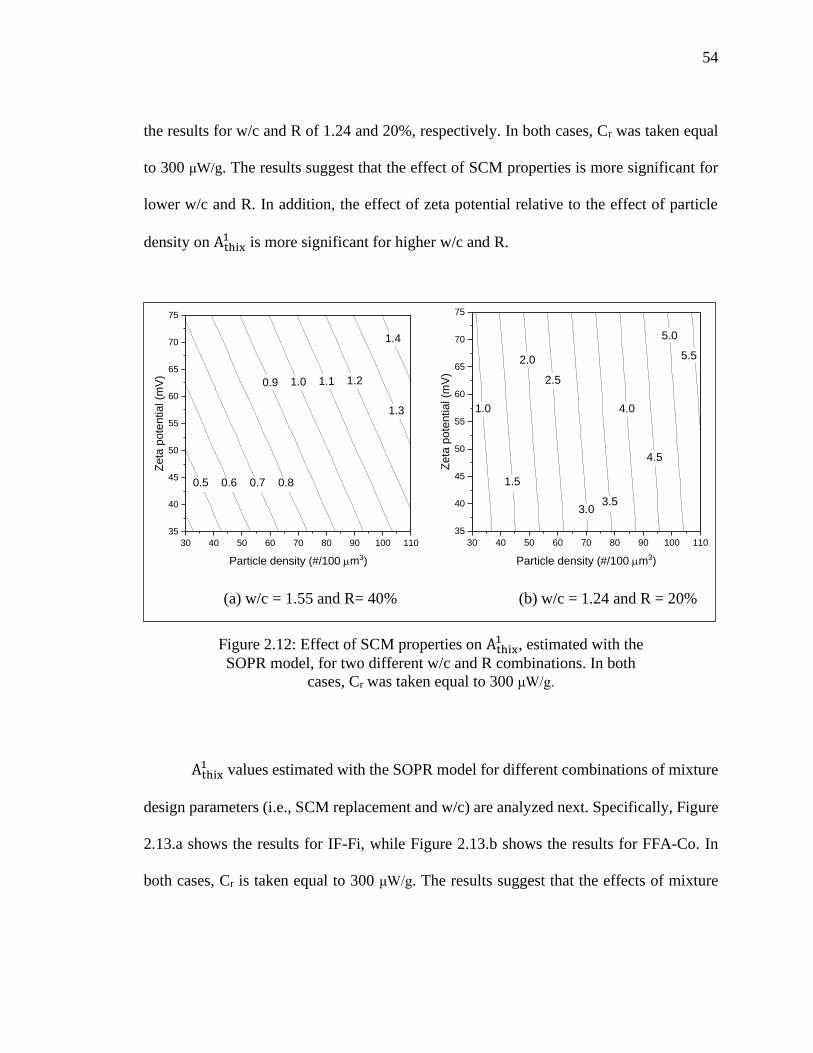
54
the results for w/c and R of 1.24 and 20%, respectively. In both cases, Cr was taken equal
to 300 μW/g. The results suggest that the effect of SCM properties is more significant for
lower w/c and R. In addition, the effect of zeta potential relative to the effect of particle
density on Athix1 is more significant for higher w/c and R.
(a) w/c = 1.55 and R= 40% (b) w/c = 1.24 and R = 20%
Figure 2.12: Effect of SCM properties on Athix1 , estimated with the
SOPR model, for two different w/c and R combinations. In both
cases, Cr was taken equal to 300 μW/g.
Athix1 values estimated with the SOPR model for different combinations of mixture
design parameters (i.e., SCM replacement and w/c) are analyzed next. Specifically, Figure
2.13.a shows the results for IF-Fi, while Figure 2.13.b shows the results for FFA-Co. In
both cases, Cr is taken equal to 300 μW/g. The results suggest that the effects of mixture
1.4
1.3
1.21.11.00.9
0.80.70.60.5
30 40 50 60 70 80 90 100 110
35
40
45
50
55
60
65
70
75
Zeta
pote
ntia
l (m
V)
Particle density (#/100 mm3)
5.5
5.0
4.5
4.0
3.53.0
2.5
2.0
1.5
1.0
30 40 50 60 70 80 90 100 110
35
40
45
50
55
60
65
70
75
Zeta
pote
ntial (m
V)
Particle density (#/100 mm3)
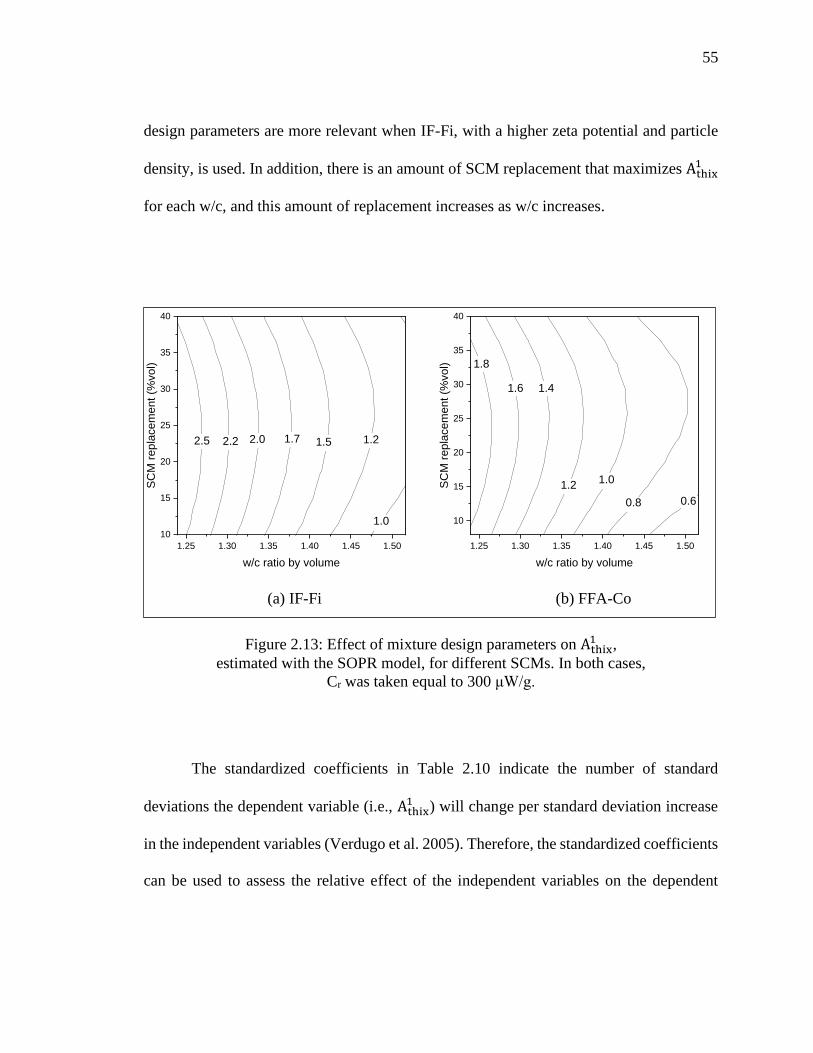
55
design parameters are more relevant when IF-Fi, with a higher zeta potential and particle
density, is used. In addition, there is an amount of SCM replacement that maximizes Athix1
for each w/c, and this amount of replacement increases as w/c increases.
(a) IF-Fi (b) FFA-Co
Figure 2.13: Effect of mixture design parameters on Athix1 ,
estimated with the SOPR model, for different SCMs. In both cases,
Cr was taken equal to 300 μW/g.
The standardized coefficients in Table 2.10 indicate the number of standard
deviations the dependent variable (i.e., Athix1 ) will change per standard deviation increase
in the independent variables (Verdugo et al. 2005). Therefore, the standardized coefficients
can be used to assess the relative effect of the independent variables on the dependent
1.0
1.21.51.72.02.22.5
1.25 1.30 1.35 1.40 1.45 1.50
10
15
20
25
30
35
40
SC
M r
epla
cem
ent (%
vol)
w/c ratio by volume
0.6
1.8
0.8
1.01.2
1.41.6
1.25 1.30 1.35 1.40 1.45 1.50
10
15
20
25
30
35
40
SC
M r
ep
lacem
en
t (%
vo
l)
w/c ratio by volume
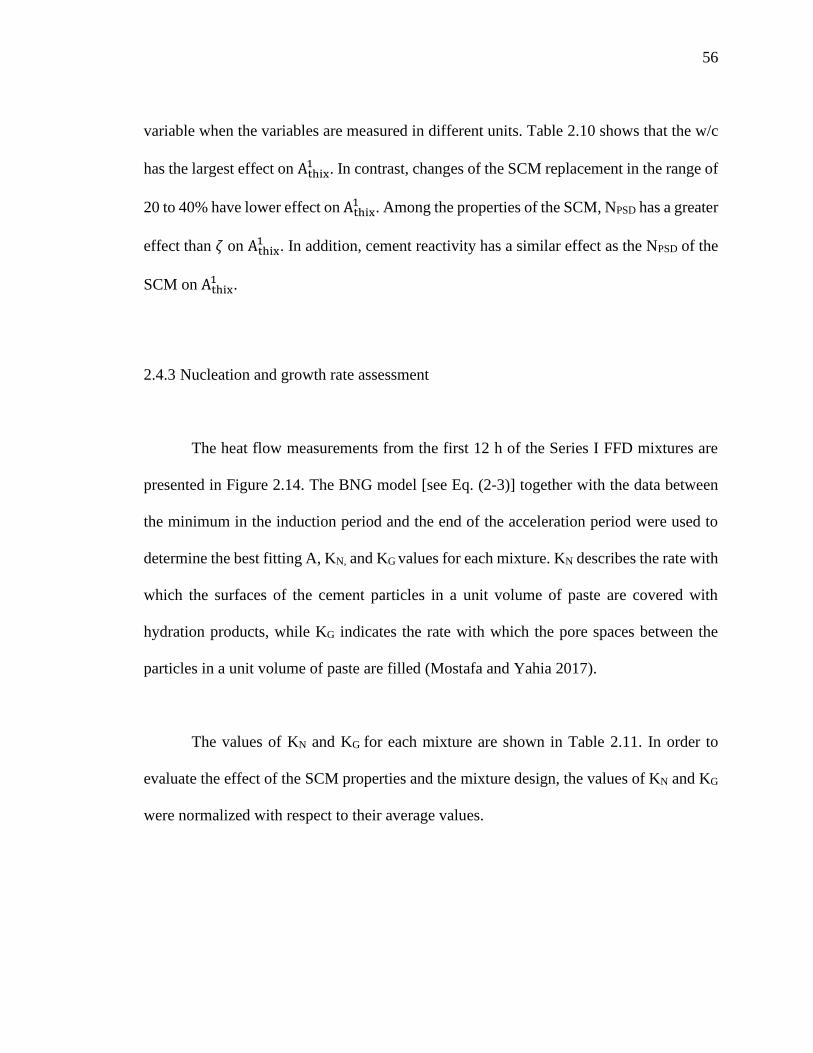
56
variable when the variables are measured in different units. Table 2.10 shows that the w/c
has the largest effect on Athix1 . In contrast, changes of the SCM replacement in the range of
20 to 40% have lower effect on Athix1 . Among the properties of the SCM, NPSD has a greater
effect than 𝜁 on Athix1 . In addition, cement reactivity has a similar effect as the NPSD of the
SCM on Athix1 .
2.4.3 Nucleation and growth rate assessment
The heat flow measurements from the first 12 h of the Series I FFD mixtures are
presented in Figure 2.14. The BNG model [see Eq. (2-3)] together with the data between
the minimum in the induction period and the end of the acceleration period were used to
determine the best fitting A, KN, and KG values for each mixture. KN describes the rate with
which the surfaces of the cement particles in a unit volume of paste are covered with
hydration products, while KG indicates the rate with which the pore spaces between the
particles in a unit volume of paste are filled (Mostafa and Yahia 2017).
The values of KN and KG for each mixture are shown in Table 2.11. In order to
evaluate the effect of the SCM properties and the mixture design, the values of KN and KG
were normalized with respect to their average values.
57
(a) Series I 20% replacement of fine SCM (b) Series I 20% replacement of coarse SCM
(c) Series I 40% replacement of fine SCM (d) Series I 40% replacement of coarse SCM
Figure 2.14: Heat flow during the first 12 hours of the Series I FFD
mixtures.
0 3 6 9 12
0
1
2
3
4
5
heat flow
(m
W/g
cem
ent)
Time (h)
FFA-Co-1.24-40-IPC
IF-Co-1.24-40-OPC
FFA-Co-1.55-40-OPC
IF-Co-1.55-40-IPC
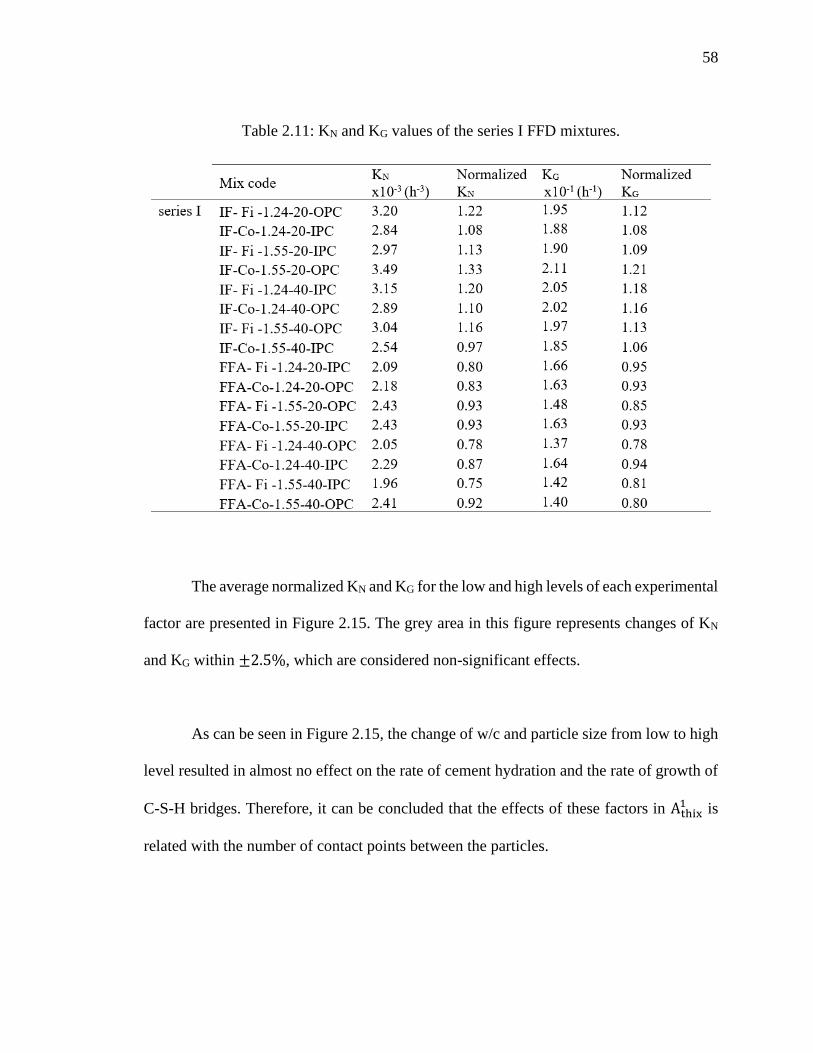
58
Table 2.11: KN and KG values of the series I FFD mixtures.
The average normalized KN and KG for the low and high levels of each experimental
factor are presented in Figure 2.15. The grey area in this figure represents changes of KN
and KG within ±2.5%, which are considered non-significant effects.
As can be seen in Figure 2.15, the change of w/c and particle size from low to high
level resulted in almost no effect on the rate of cement hydration and the rate of growth of
C-S-H bridges. Therefore, it can be concluded that the effects of these factors in Athix1 is
related with the number of contact points between the particles.

59
(a) (b)
Figure 2.15: Average normalized KN (a) and KG (b) for low (-) and
high (+) levels of each experimental factor.
The increase of SCM replacement from 20% to 40% resulted in decreased
nucleation rate of the cement (i.e., KN) and non-significant variations in the growth rate
(i.e., KG). This finding suggests that the growth rate of C-S-H bridges is not affected by the
amount of cement replaced by SCM, and a 20% replacement promotes better hydration of
the cement particles than a 40% replacement.
Figure 2.15 shows that major changes in both KN and KG are related with the type
of SCM used. The fact that the mixtures produced with IF present higher KN and KG than
the mixtures produced with FFA supports the hypothesis that the physicochemical effect
of the SCMs is governed by their surface potential rather than their chemical reactivity at
early ages.
- +0.80
0.85
0.90
0.95
1.00
1.05
1.10
1.15
1.20
Norm
aliz
ed K
G (
h-1
/h-1
)
Experimental factor level
Particle Size
w/c
MA replacement
MA physicochemical behavior
Cement reactivity
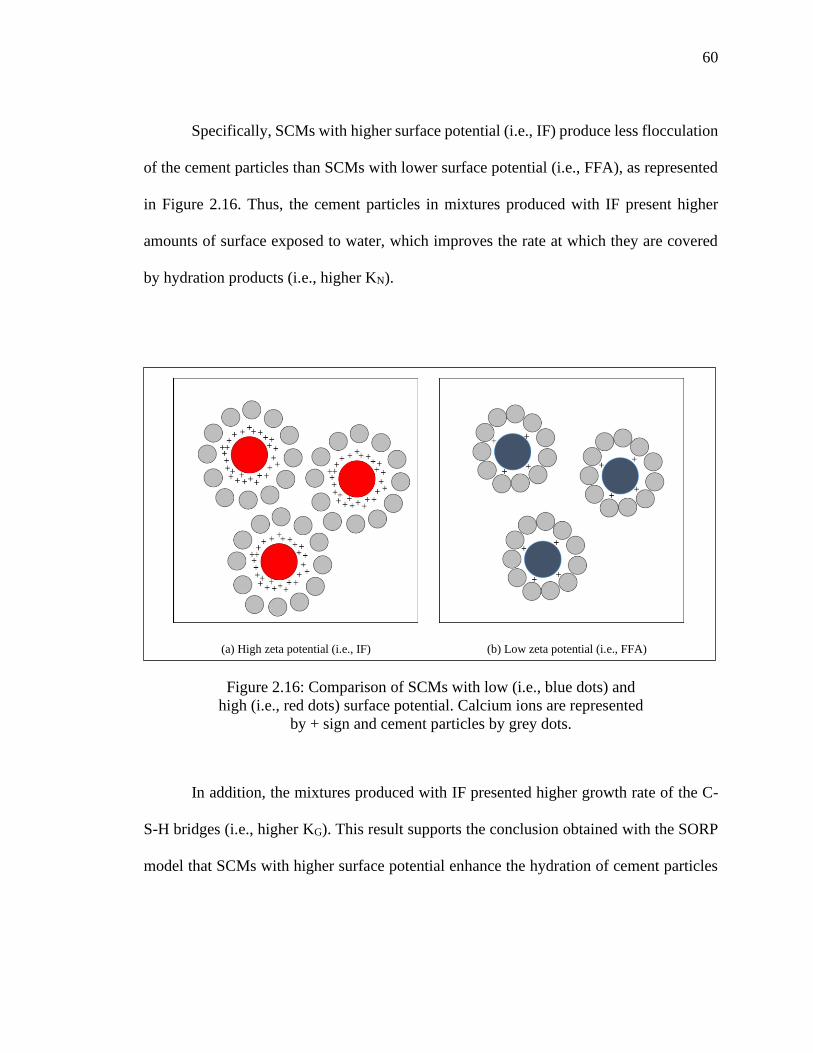
60
Specifically, SCMs with higher surface potential (i.e., IF) produce less flocculation
of the cement particles than SCMs with lower surface potential (i.e., FFA), as represented
in Figure 2.16. Thus, the cement particles in mixtures produced with IF present higher
amounts of surface exposed to water, which improves the rate at which they are covered
by hydration products (i.e., higher KN).
(a) High zeta potential (i.e., IF) (b) Low zeta potential (i.e., FFA)
Figure 2.16: Comparison of SCMs with low (i.e., blue dots) and
high (i.e., red dots) surface potential. Calcium ions are represented
by + sign and cement particles by grey dots.
In addition, the mixtures produced with IF presented higher growth rate of the C-
S-H bridges (i.e., higher KG). This result supports the conclusion obtained with the SORP
model that SCMs with higher surface potential enhance the hydration of cement particles
61
at the pseudo-contact points, due to a higher presence of Ca+2 ions (represented in Figure
2-16), which increases Athix1 .
As expected, the use of a more reactive cement (i.e., OPC) instead of a less reactive
cement (i.e., IPC) resulted in larger KN. However, the use of a more reactive cement does
not have a significant effect on KG.
2.5 Conclusions
This study investigated the effects of particle size and physicochemical properties
of supplementary cementitious materials (SCMs) and their interactions with primary
mixture parameters on the structural build up of cementitious paste. Five different SCMs
were used in the study: two of them were used to develop the model and the other three to
validate it. The study focused on SCMs with similar particle size distribution to cement
and in the earlier structural build up of cementitious pastes (below 60 minutes after water
addition). Based on the results, the main conclusions are as follows:
1. A second order polynomial regression model to predict the structural build up of
cementitious paste as a function of SCM properties and primary mixture parameters
was developed and validated. The model shows good accuracy to predict the
structural build up of mixtures prepared with various SCMs, SCM replacement
amounts, water to cement ratios, and cement with different reactivities.
62
2. The effect of particle size of SCM on the structural build up of cementitious paste
is governed by the particle density which determines the number of contact points
instead of the specific surface area.
3. The effect of physicochemical properties of SCM on the structural build up of
cementitious paste is governed by the surface potential instead of the chemical
reactivity at early age.
4. The structural build up of cementitious paste is affected mostly by the water to
cementitious ratio. In contrast, the replacement level of SCM is the least significant
parameter affecting structural build up. Among the SCM properties, the particle
density has a greater effect than the surface potential. In addition, reactivity of
cement has a similar effect as the particle density of SCM.
5. The structural build up of mixtures with more reactive cement is less affected by
the SCM properties. In addition, the structural build up of mixtures with a higher
water to cement ratio is less affected by the particle density of SCM and by the
level of replacement of SCM.
6. Changes in the particle density of SCM and water to cement ratio result in slight
variations in the nucleation and growth rates of the cement particles. This means
that the effects of these parameters on the structural build up of cementitious paste
are produced by a reduction in the distance between the particles rather than
improved cement hydration.
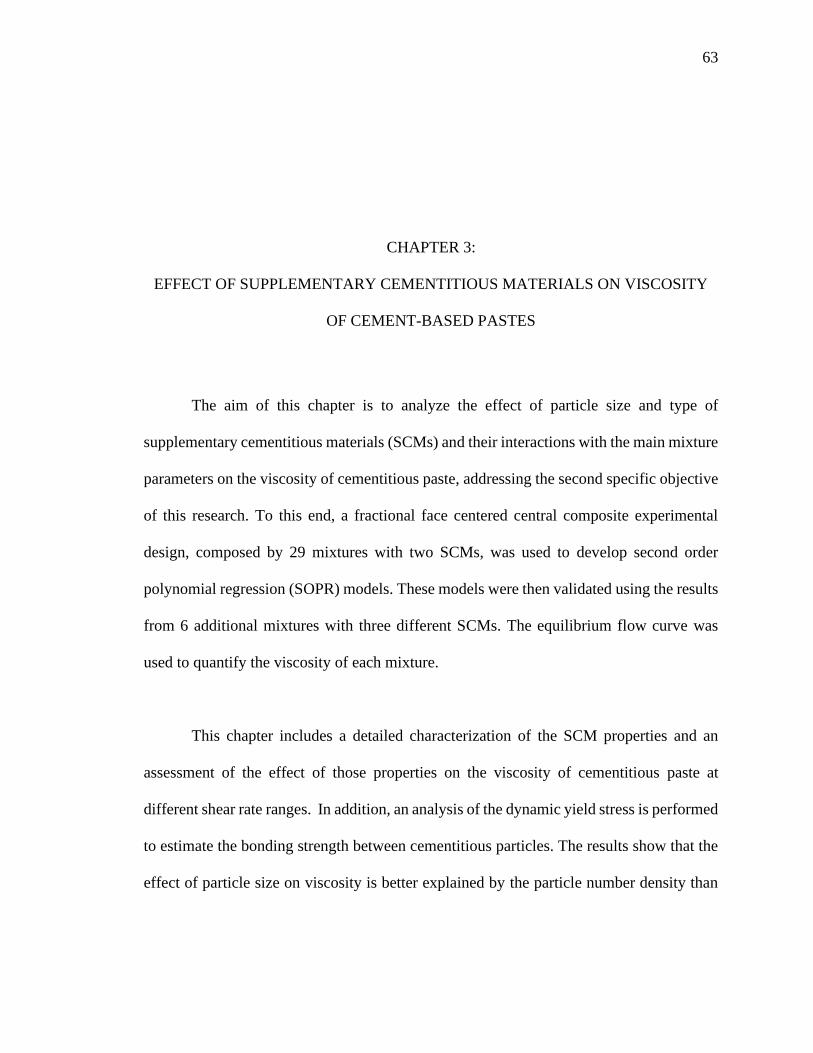
63
CHAPTER 3:
EFFECT OF SUPPLEMENTARY CEMENTITIOUS MATERIALS ON VISCOSITY
OF CEMENT-BASED PASTES
The aim of this chapter is to analyze the effect of particle size and type of
supplementary cementitious materials (SCMs) and their interactions with the main mixture
parameters on the viscosity of cementitious paste, addressing the second specific objective
of this research. To this end, a fractional face centered central composite experimental
design, composed by 29 mixtures with two SCMs, was used to develop second order
polynomial regression (SOPR) models. These models were then validated using the results
from 6 additional mixtures with three different SCMs. The equilibrium flow curve was
used to quantify the viscosity of each mixture.
This chapter includes a detailed characterization of the SCM properties and an
assessment of the effect of those properties on the viscosity of cementitious paste at
different shear rate ranges. In addition, an analysis of the dynamic yield stress is performed
to estimate the bonding strength between cementitious particles. The results show that the
effect of particle size on viscosity is better explained by the particle number density than
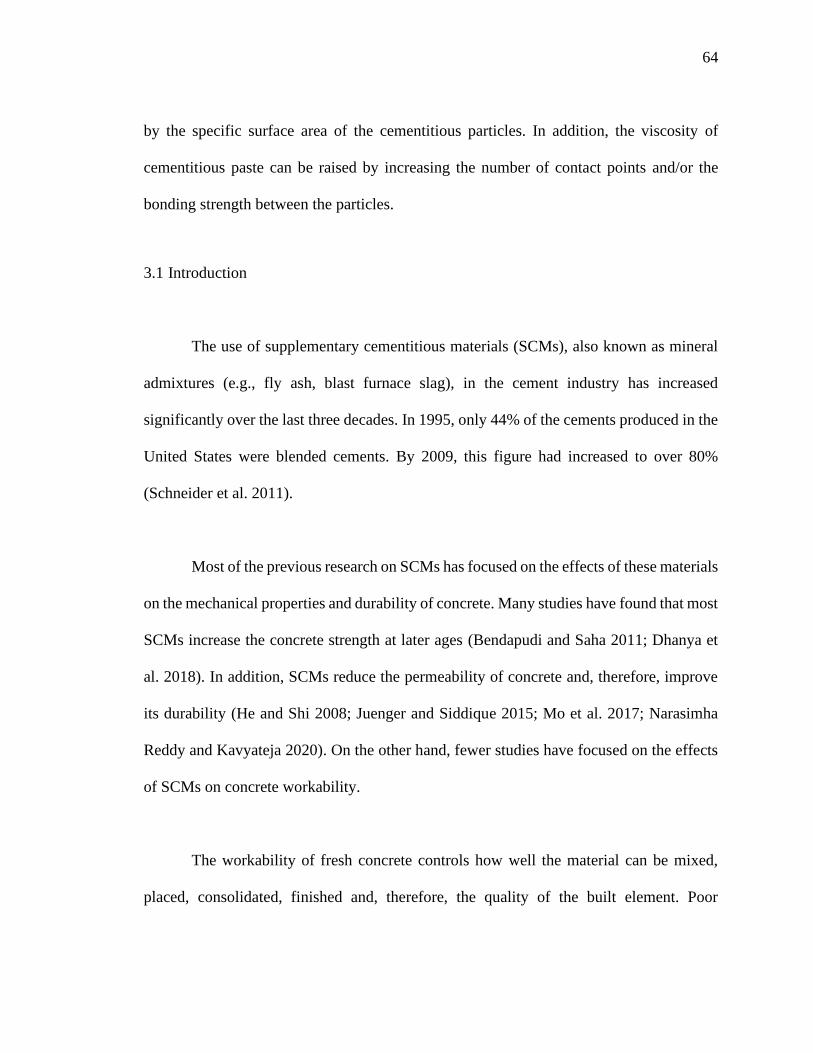
64
by the specific surface area of the cementitious particles. In addition, the viscosity of
cementitious paste can be raised by increasing the number of contact points and/or the
bonding strength between the particles.
3.1 Introduction
The use of supplementary cementitious materials (SCMs), also known as mineral
admixtures (e.g., fly ash, blast furnace slag), in the cement industry has increased
significantly over the last three decades. In 1995, only 44% of the cements produced in the
United States were blended cements. By 2009, this figure had increased to over 80%
(Schneider et al. 2011).
Most of the previous research on SCMs has focused on the effects of these materials
on the mechanical properties and durability of concrete. Many studies have found that most
SCMs increase the concrete strength at later ages (Bendapudi and Saha 2011; Dhanya et
al. 2018). In addition, SCMs reduce the permeability of concrete and, therefore, improve
its durability (He and Shi 2008; Juenger and Siddique 2015; Mo et al. 2017; Narasimha
Reddy and Kavyateja 2020). On the other hand, fewer studies have focused on the effects
of SCMs on concrete workability.
The workability of fresh concrete controls how well the material can be mixed,
placed, consolidated, finished and, therefore, the quality of the built element. Poor
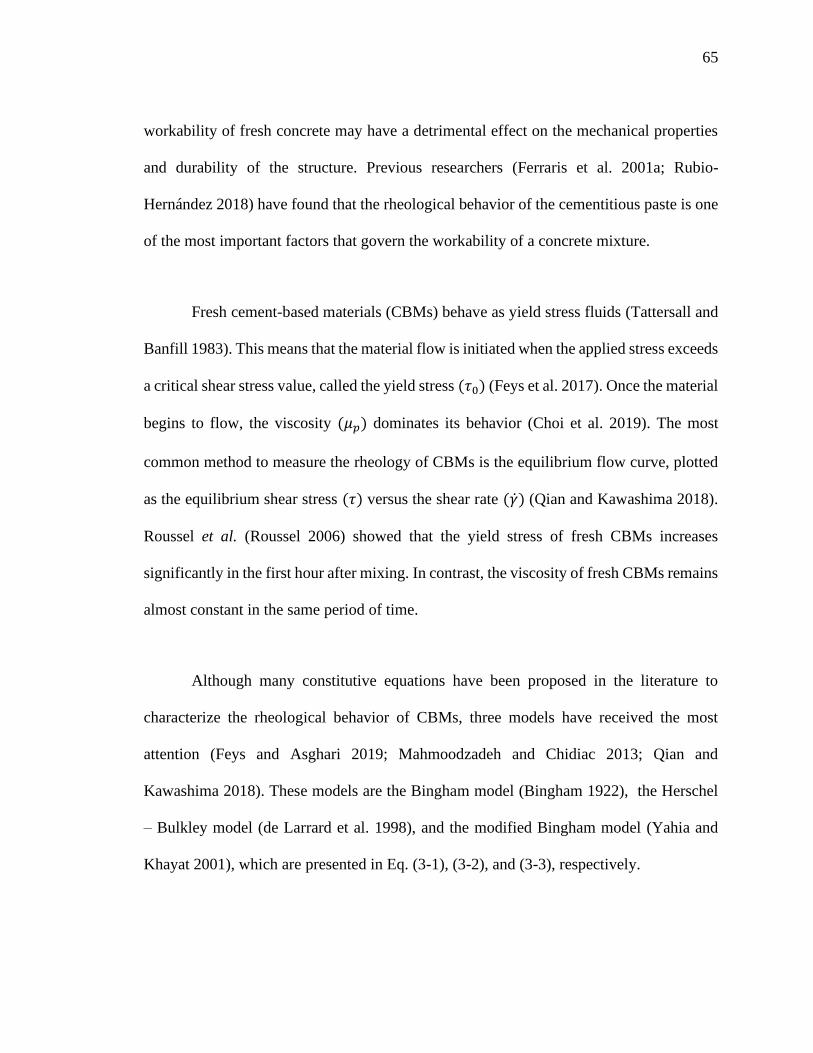
65
workability of fresh concrete may have a detrimental effect on the mechanical properties
and durability of the structure. Previous researchers (Ferraris et al. 2001a; Rubio-
Hernández 2018) have found that the rheological behavior of the cementitious paste is one
of the most important factors that govern the workability of a concrete mixture.
Fresh cement-based materials (CBMs) behave as yield stress fluids (Tattersall and
Banfill 1983). This means that the material flow is initiated when the applied stress exceeds
a critical shear stress value, called the yield stress (𝜏0) (Feys et al. 2017). Once the material
begins to flow, the viscosity (𝜇𝑝) dominates its behavior (Choi et al. 2019). The most
common method to measure the rheology of CBMs is the equilibrium flow curve, plotted
as the equilibrium shear stress (𝜏) versus the shear rate (�̇�) (Qian and Kawashima 2018).
Roussel et al. (Roussel 2006) showed that the yield stress of fresh CBMs increases
significantly in the first hour after mixing. In contrast, the viscosity of fresh CBMs remains
almost constant in the same period of time.
Although many constitutive equations have been proposed in the literature to
characterize the rheological behavior of CBMs, three models have received the most
attention (Feys and Asghari 2019; Mahmoodzadeh and Chidiac 2013; Qian and
Kawashima 2018). These models are the Bingham model (Bingham 1922), the Herschel
– Bulkley model (de Larrard et al. 1998), and the modified Bingham model (Yahia and
Khayat 2001), which are presented in Eq. (3-1), (3-2), and (3-3), respectively.
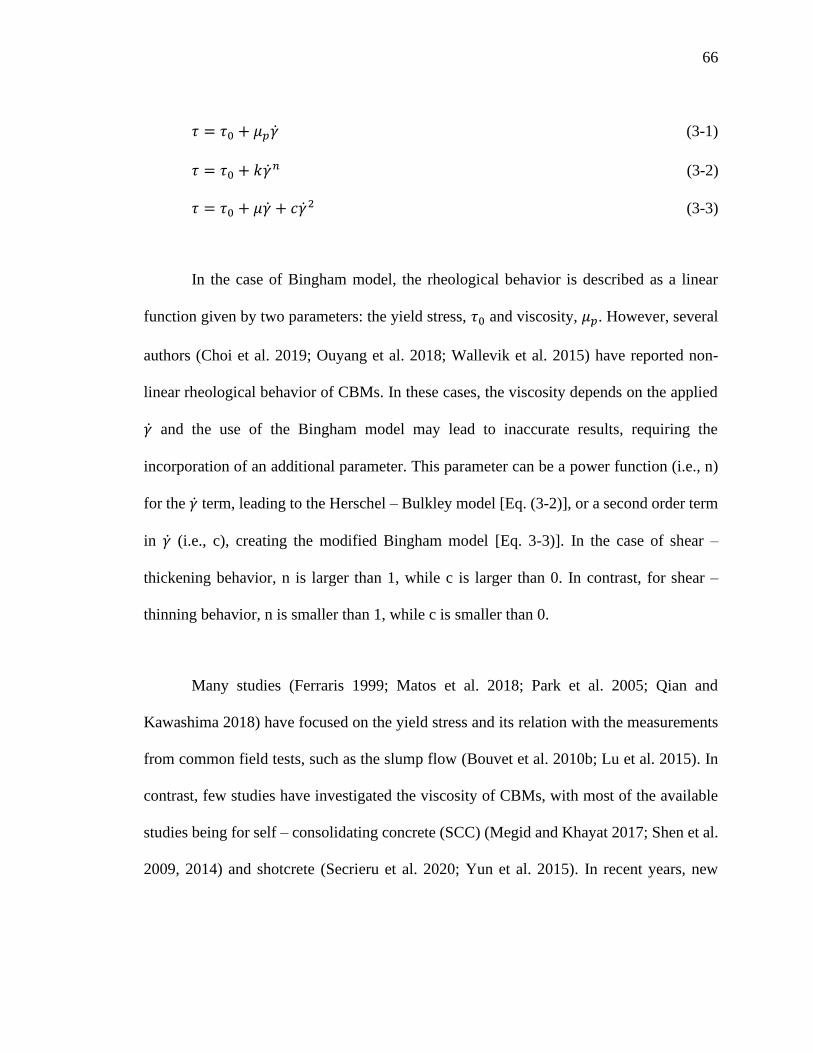
66
𝜏 = 𝜏0 + 𝜇𝑝�̇� (3-1)
𝜏 = 𝜏0 + 𝑘�̇�𝑛 (3-2)
𝜏 = 𝜏0 + 𝜇�̇� + 𝑐�̇�2 (3-3)
In the case of Bingham model, the rheological behavior is described as a linear
function given by two parameters: the yield stress, 𝜏0 and viscosity, 𝜇𝑝. However, several
authors (Choi et al. 2019; Ouyang et al. 2018; Wallevik et al. 2015) have reported non-
linear rheological behavior of CBMs. In these cases, the viscosity depends on the applied
�̇� and the use of the Bingham model may lead to inaccurate results, requiring the
incorporation of an additional parameter. This parameter can be a power function (i.e., n)
for the �̇� term, leading to the Herschel – Bulkley model [Eq. (3-2)], or a second order term
in �̇� (i.e., c), creating the modified Bingham model [Eq. 3-3)]. In the case of shear –
thickening behavior, n is larger than 1, while c is larger than 0. In contrast, for shear –
thinning behavior, n is smaller than 1, while c is smaller than 0.
Many studies (Ferraris 1999; Matos et al. 2018; Park et al. 2005; Qian and
Kawashima 2018) have focused on the yield stress and its relation with the measurements
from common field tests, such as the slump flow (Bouvet et al. 2010b; Lu et al. 2015). In
contrast, few studies have investigated the viscosity of CBMs, with most of the available
studies being for self – consolidating concrete (SCC) (Megid and Khayat 2017; Shen et al.
2009, 2014) and shotcrete (Secrieru et al. 2020; Yun et al. 2015). In recent years, new
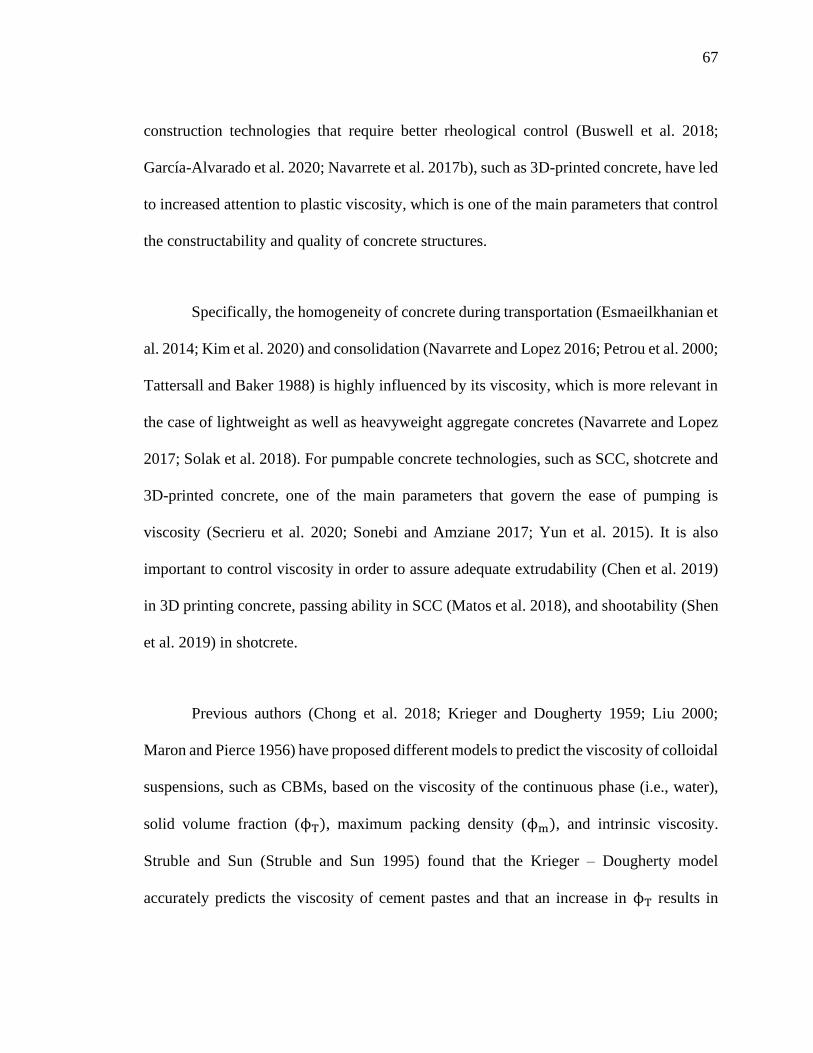
67
construction technologies that require better rheological control (Buswell et al. 2018;
García-Alvarado et al. 2020; Navarrete et al. 2017b), such as 3D-printed concrete, have led
to increased attention to plastic viscosity, which is one of the main parameters that control
the constructability and quality of concrete structures.
Specifically, the homogeneity of concrete during transportation (Esmaeilkhanian et
al. 2014; Kim et al. 2020) and consolidation (Navarrete and Lopez 2016; Petrou et al. 2000;
Tattersall and Baker 1988) is highly influenced by its viscosity, which is more relevant in
the case of lightweight as well as heavyweight aggregate concretes (Navarrete and Lopez
2017; Solak et al. 2018). For pumpable concrete technologies, such as SCC, shotcrete and
3D-printed concrete, one of the main parameters that govern the ease of pumping is
viscosity (Secrieru et al. 2020; Sonebi and Amziane 2017; Yun et al. 2015). It is also
important to control viscosity in order to assure adequate extrudability (Chen et al. 2019)
in 3D printing concrete, passing ability in SCC (Matos et al. 2018), and shootability (Shen
et al. 2019) in shotcrete.
Previous authors (Chong et al. 2018; Krieger and Dougherty 1959; Liu 2000;
Maron and Pierce 1956) have proposed different models to predict the viscosity of colloidal
suspensions, such as CBMs, based on the viscosity of the continuous phase (i.e., water),
solid volume fraction (ϕT), maximum packing density (ϕm), and intrinsic viscosity.
Struble and Sun (Struble and Sun 1995) found that the Krieger – Dougherty model
accurately predicts the viscosity of cement pastes and that an increase in ϕT results in
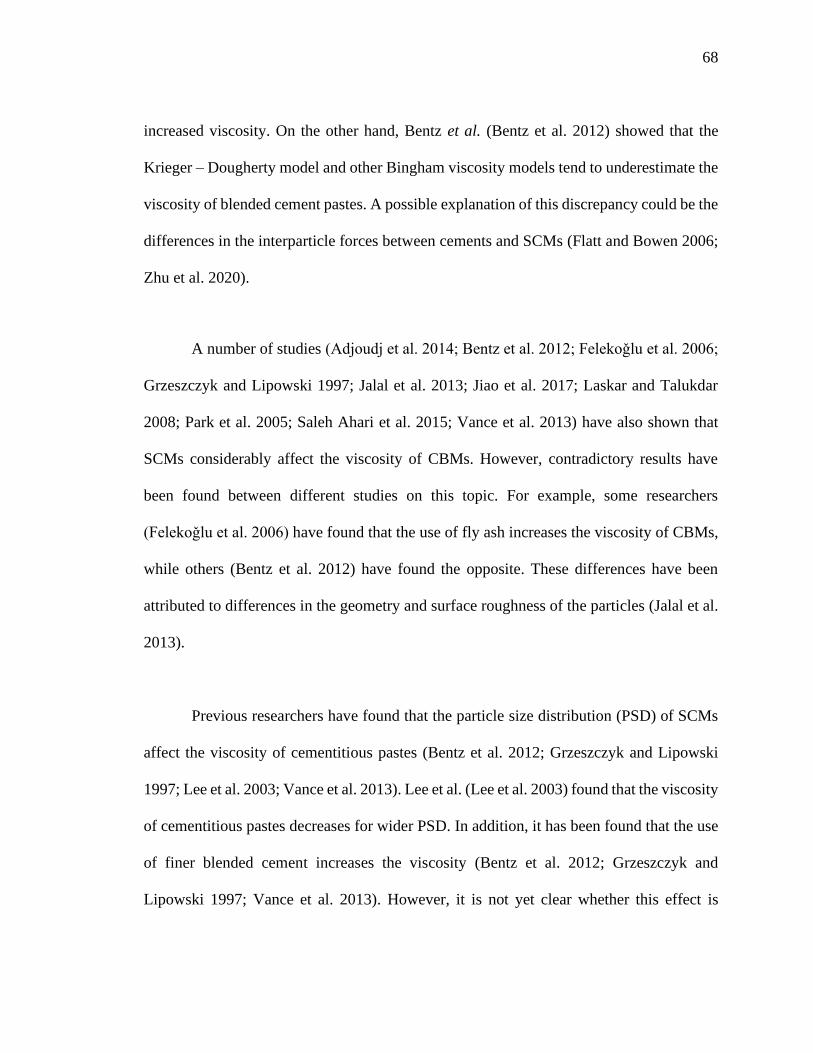
68
increased viscosity. On the other hand, Bentz et al. (Bentz et al. 2012) showed that the
Krieger – Dougherty model and other Bingham viscosity models tend to underestimate the
viscosity of blended cement pastes. A possible explanation of this discrepancy could be the
differences in the interparticle forces between cements and SCMs (Flatt and Bowen 2006;
Zhu et al. 2020).
A number of studies (Adjoudj et al. 2014; Bentz et al. 2012; Felekoǧlu et al. 2006;
Grzeszczyk and Lipowski 1997; Jalal et al. 2013; Jiao et al. 2017; Laskar and Talukdar
2008; Park et al. 2005; Saleh Ahari et al. 2015; Vance et al. 2013) have also shown that
SCMs considerably affect the viscosity of CBMs. However, contradictory results have
been found between different studies on this topic. For example, some researchers
(Felekoǧlu et al. 2006) have found that the use of fly ash increases the viscosity of CBMs,
while others (Bentz et al. 2012) have found the opposite. These differences have been
attributed to differences in the geometry and surface roughness of the particles (Jalal et al.
2013).
Previous researchers have found that the particle size distribution (PSD) of SCMs
affect the viscosity of cementitious pastes (Bentz et al. 2012; Grzeszczyk and Lipowski
1997; Lee et al. 2003; Vance et al. 2013). Lee et al. (Lee et al. 2003) found that the viscosity
of cementitious pastes decreases for wider PSD. In addition, it has been found that the use
of finer blended cement increases the viscosity (Bentz et al. 2012; Grzeszczyk and
Lipowski 1997; Vance et al. 2013). However, it is not yet clear whether this effect is
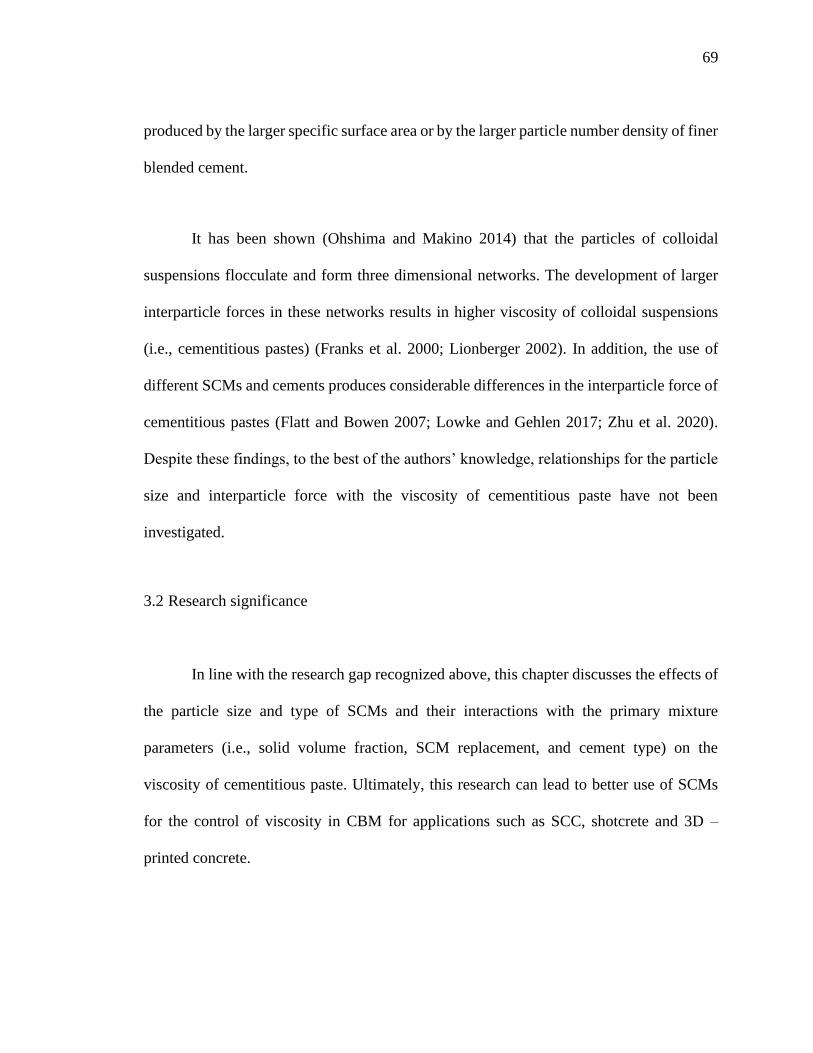
69
produced by the larger specific surface area or by the larger particle number density of finer
blended cement.
It has been shown (Ohshima and Makino 2014) that the particles of colloidal
suspensions flocculate and form three dimensional networks. The development of larger
interparticle forces in these networks results in higher viscosity of colloidal suspensions
(i.e., cementitious pastes) (Franks et al. 2000; Lionberger 2002). In addition, the use of
different SCMs and cements produces considerable differences in the interparticle force of
cementitious pastes (Flatt and Bowen 2007; Lowke and Gehlen 2017; Zhu et al. 2020).
Despite these findings, to the best of the authors’ knowledge, relationships for the particle
size and interparticle force with the viscosity of cementitious paste have not been
investigated.
3.2 Research significance
In line with the research gap recognized above, this chapter discusses the effects of
the particle size and type of SCMs and their interactions with the primary mixture
parameters (i.e., solid volume fraction, SCM replacement, and cement type) on the
viscosity of cementitious paste. Ultimately, this research can lead to better use of SCMs
for the control of viscosity in CBM for applications such as SCC, shotcrete and 3D –
printed concrete.
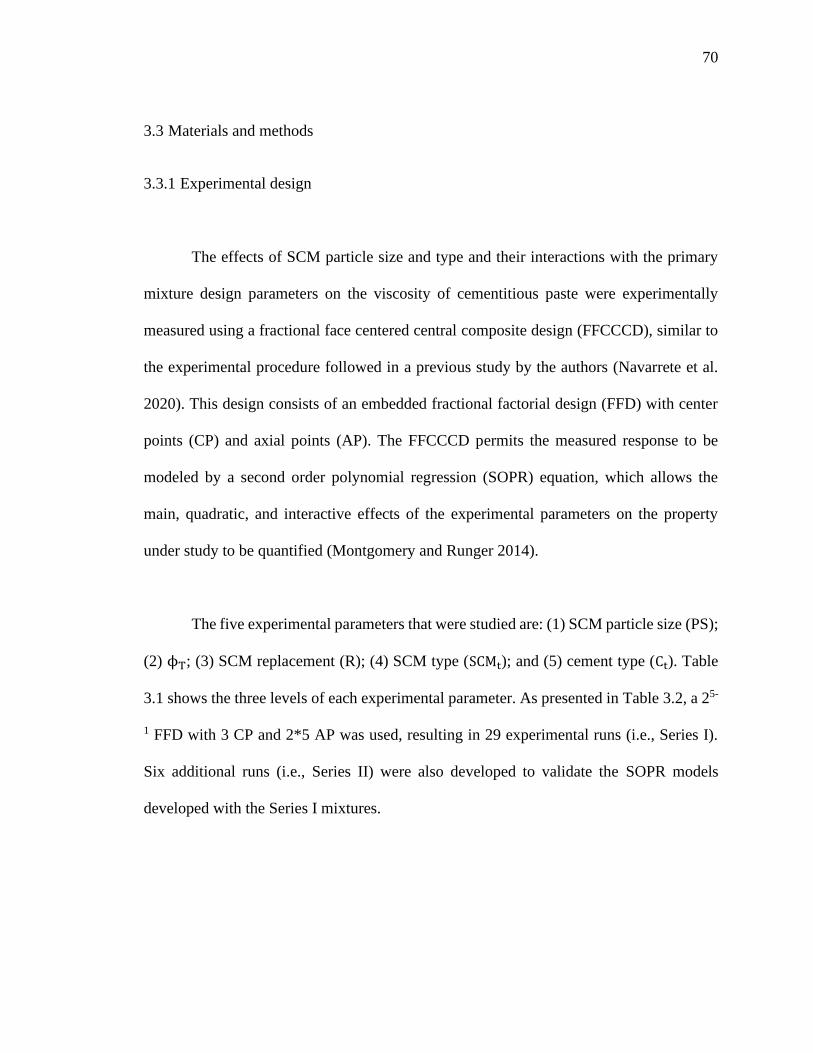
70
3.3 Materials and methods
3.3.1 Experimental design
The effects of SCM particle size and type and their interactions with the primary
mixture design parameters on the viscosity of cementitious paste were experimentally
measured using a fractional face centered central composite design (FFCCCD), similar to
the experimental procedure followed in a previous study by the authors (Navarrete et al.
2020). This design consists of an embedded fractional factorial design (FFD) with center
points (CP) and axial points (AP). The FFCCCD permits the measured response to be
modeled by a second order polynomial regression (SOPR) equation, which allows the
main, quadratic, and interactive effects of the experimental parameters on the property
under study to be quantified (Montgomery and Runger 2014).
The five experimental parameters that were studied are: (1) SCM particle size (PS);
(2) ϕT; (3) SCM replacement (R); (4) SCM type (SCMt); and (5) cement type (Ct). Table
3.1 shows the three levels of each experimental parameter. As presented in Table 3.2, a 25-
1 FFD with 3 CP and 2*5 AP was used, resulting in 29 experimental runs (i.e., Series I).
Six additional runs (i.e., Series II) were also developed to validate the SOPR models
developed with the Series I mixtures.
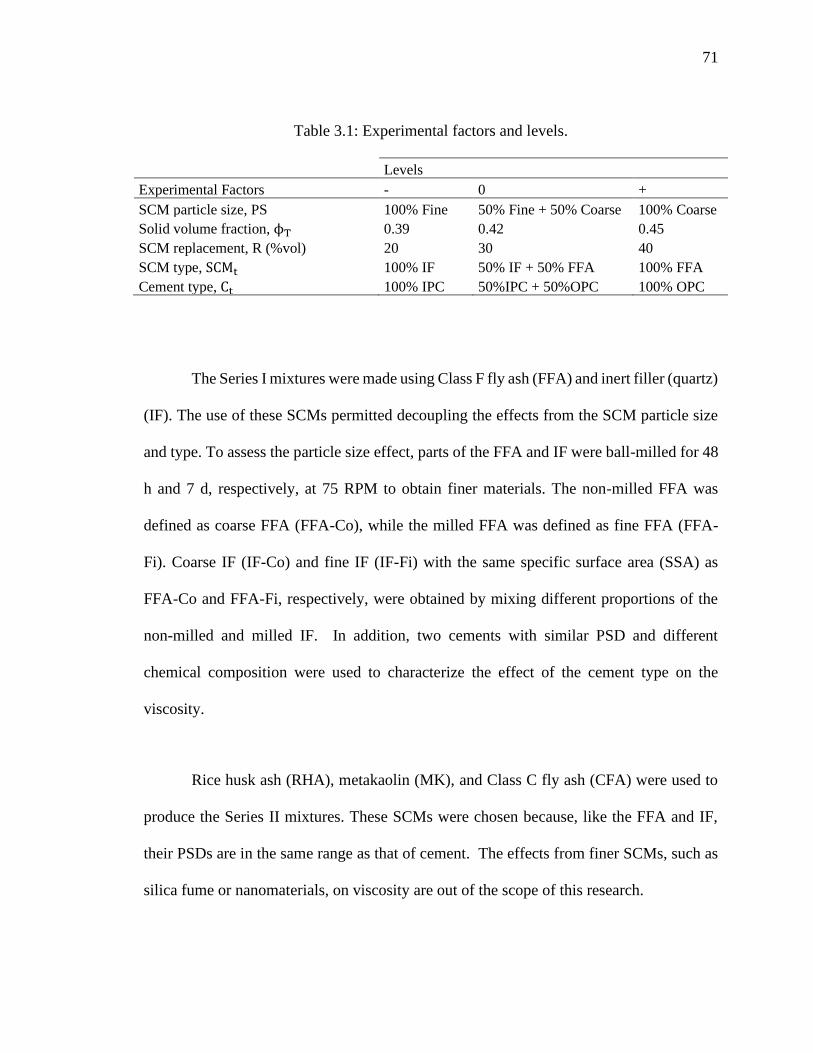
71
Table 3.1: Experimental factors and levels.
Levels
Experimental Factors - 0 +
SCM particle size, PS 100% Fine 50% Fine + 50% Coarse 100% Coarse
Solid volume fraction, ϕT 0.39 0.42 0.45
SCM replacement, R (%vol) 20 30 40
SCM type, SCMt 100% IF 50% IF + 50% FFA 100% FFA
Cement type, Ct 100% IPC 50%IPC + 50%OPC 100% OPC
The Series I mixtures were made using Class F fly ash (FFA) and inert filler (quartz)
(IF). The use of these SCMs permitted decoupling the effects from the SCM particle size
and type. To assess the particle size effect, parts of the FFA and IF were ball-milled for 48
h and 7 d, respectively, at 75 RPM to obtain finer materials. The non-milled FFA was
defined as coarse FFA (FFA-Co), while the milled FFA was defined as fine FFA (FFA-
Fi). Coarse IF (IF-Co) and fine IF (IF-Fi) with the same specific surface area (SSA) as
FFA-Co and FFA-Fi, respectively, were obtained by mixing different proportions of the
non-milled and milled IF. In addition, two cements with similar PSD and different
chemical composition were used to characterize the effect of the cement type on the
viscosity.
Rice husk ash (RHA), metakaolin (MK), and Class C fly ash (CFA) were used to
produce the Series II mixtures. These SCMs were chosen because, like the FFA and IF,
their PSDs are in the same range as that of cement. The effects from finer SCMs, such as
silica fume or nanomaterials, on viscosity are out of the scope of this research.
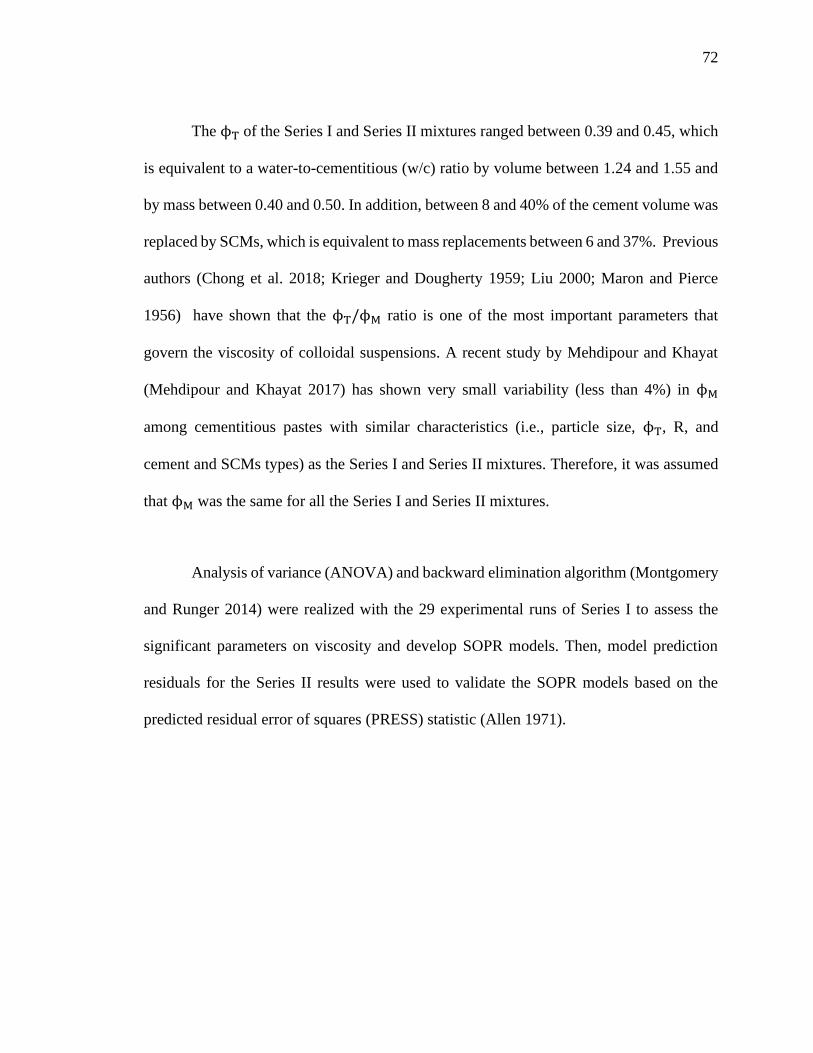
72
The ϕT of the Series I and Series II mixtures ranged between 0.39 and 0.45, which
is equivalent to a water-to-cementitious (w/c) ratio by volume between 1.24 and 1.55 and
by mass between 0.40 and 0.50. In addition, between 8 and 40% of the cement volume was
replaced by SCMs, which is equivalent to mass replacements between 6 and 37%. Previous
authors (Chong et al. 2018; Krieger and Dougherty 1959; Liu 2000; Maron and Pierce
1956) have shown that the ϕT/ϕM ratio is one of the most important parameters that
govern the viscosity of colloidal suspensions. A recent study by Mehdipour and Khayat
(Mehdipour and Khayat 2017) has shown very small variability (less than 4%) in ϕM
among cementitious pastes with similar characteristics (i.e., particle size, ϕT, R, and
cement and SCMs types) as the Series I and Series II mixtures. Therefore, it was assumed
that ϕM was the same for all the Series I and Series II mixtures.
Analysis of variance (ANOVA) and backward elimination algorithm (Montgomery
and Runger 2014) were realized with the 29 experimental runs of Series I to assess the
significant parameters on viscosity and develop SOPR models. Then, model prediction
residuals for the Series II results were used to validate the SOPR models based on the
predicted residual error of squares (PRESS) statistic (Allen 1971).
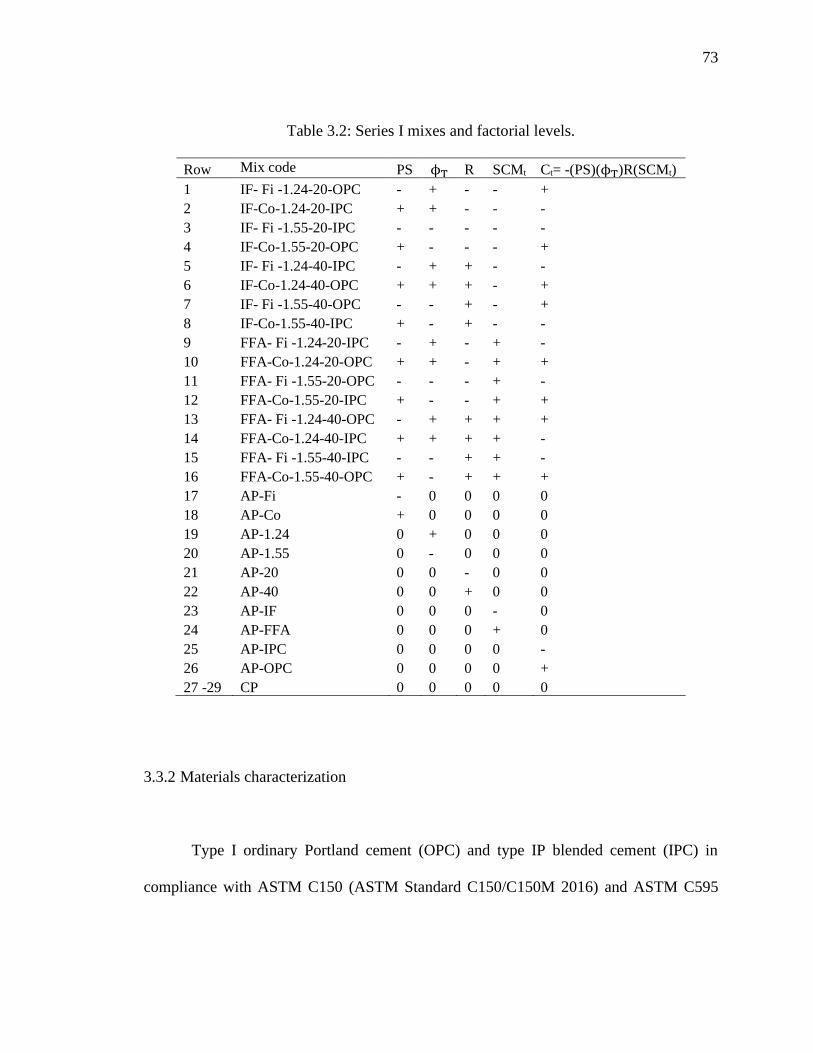
73
Table 3.2: Series I mixes and factorial levels.
Row Mix code PS ϕT R SCMt Ct= -(PS)(ϕT)R(SCMt)
1 IF- Fi -1.24-20-OPC - + - - +
2 IF-Co-1.24-20-IPC + + - - -
3 IF- Fi -1.55-20-IPC - - - - -
4 IF-Co-1.55-20-OPC + - - - +
5 IF- Fi -1.24-40-IPC - + + - -
6 IF-Co-1.24-40-OPC + + + - +
7 IF- Fi -1.55-40-OPC - - + - +
8 IF-Co-1.55-40-IPC + - + - -
9 FFA- Fi -1.24-20-IPC - + - + -
10 FFA-Co-1.24-20-OPC + + - + +
11 FFA- Fi -1.55-20-OPC - - - + -
12 FFA-Co-1.55-20-IPC + - - + +
13 FFA- Fi -1.24-40-OPC - + + + +
14 FFA-Co-1.24-40-IPC + + + + -
15 FFA- Fi -1.55-40-IPC - - + + -
16 FFA-Co-1.55-40-OPC + - + + +
17 AP-Fi - 0 0 0 0
18 AP-Co + 0 0 0 0
19 AP-1.24 0 + 0 0 0
20 AP-1.55 0 - 0 0 0
21 AP-20 0 0 - 0 0
22 AP-40 0 0 + 0 0
23 AP-IF 0 0 0 - 0
24 AP-FFA 0 0 0 + 0
25 AP-IPC 0 0 0 0 -
26 AP-OPC 0 0 0 0 +
27 -29 CP 0 0 0 0 0
3.3.2 Materials characterization
Type I ordinary Portland cement (OPC) and type IP blended cement (IPC) in
compliance with ASTM C150 (ASTM Standard C150/C150M 2016) and ASTM C595
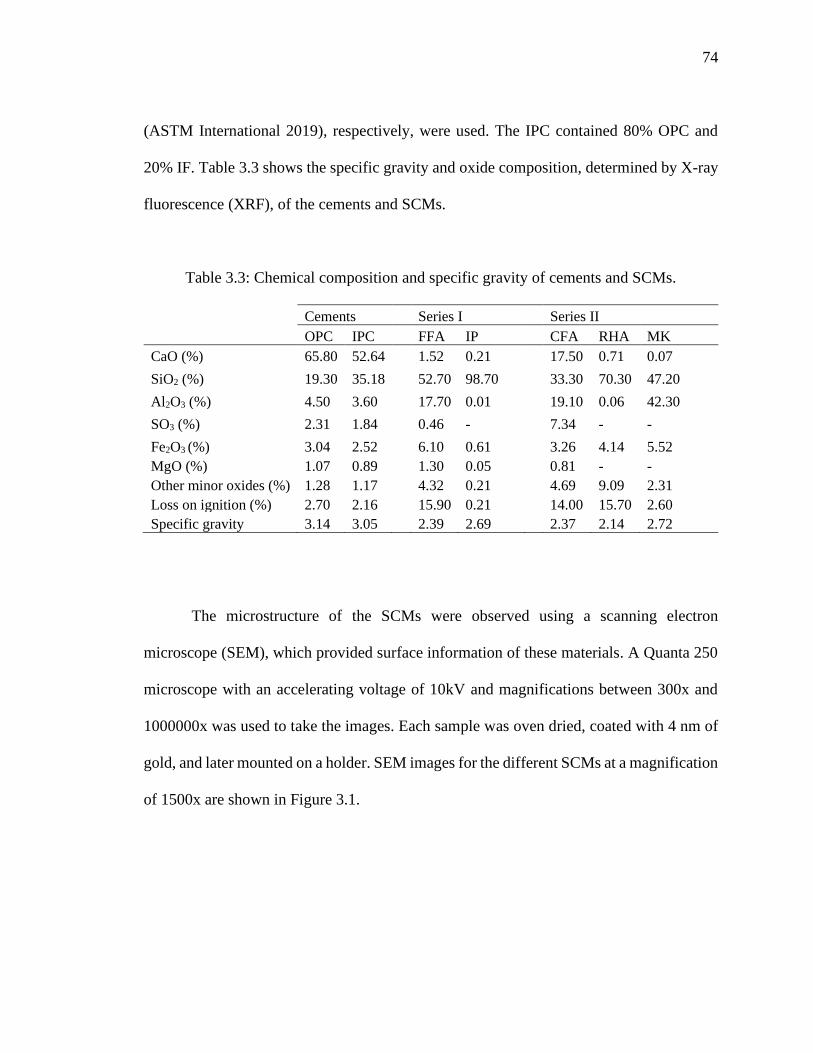
74
(ASTM International 2019), respectively, were used. The IPC contained 80% OPC and
20% IF. Table 3.3 shows the specific gravity and oxide composition, determined by X-ray
fluorescence (XRF), of the cements and SCMs.
Table 3.3: Chemical composition and specific gravity of cements and SCMs.
Cements Series I Series II
OPC IPC FFA IP CFA RHA MK
CaO (%) 65.80 52.64 1.52 0.21 17.50 0.71 0.07
SiO2 (%) 19.30 35.18 52.70 98.70 33.30 70.30 47.20
Al2O3 (%) 4.50 3.60 17.70 0.01 19.10 0.06 42.30
SO3 (%) 2.31 1.84 0.46 - 7.34 - -
Fe2O3 (%) 3.04 2.52 6.10 0.61 3.26 4.14 5.52
MgO (%) 1.07 0.89 1.30 0.05 0.81 - -
Other minor oxides (%) 1.28 1.17 4.32 0.21 4.69 9.09 2.31
Loss on ignition (%) 2.70 2.16 15.90 0.21 14.00 15.70 2.60
Specific gravity 3.14 3.05 2.39 2.69 2.37 2.14 2.72
The microstructure of the SCMs were observed using a scanning electron
microscope (SEM), which provided surface information of these materials. A Quanta 250
microscope with an accelerating voltage of 10kV and magnifications between 300x and
1000000x was used to take the images. Each sample was oven dried, coated with 4 nm of
gold, and later mounted on a holder. SEM images for the different SCMs at a magnification
of 1500x are shown in Figure 3.1.
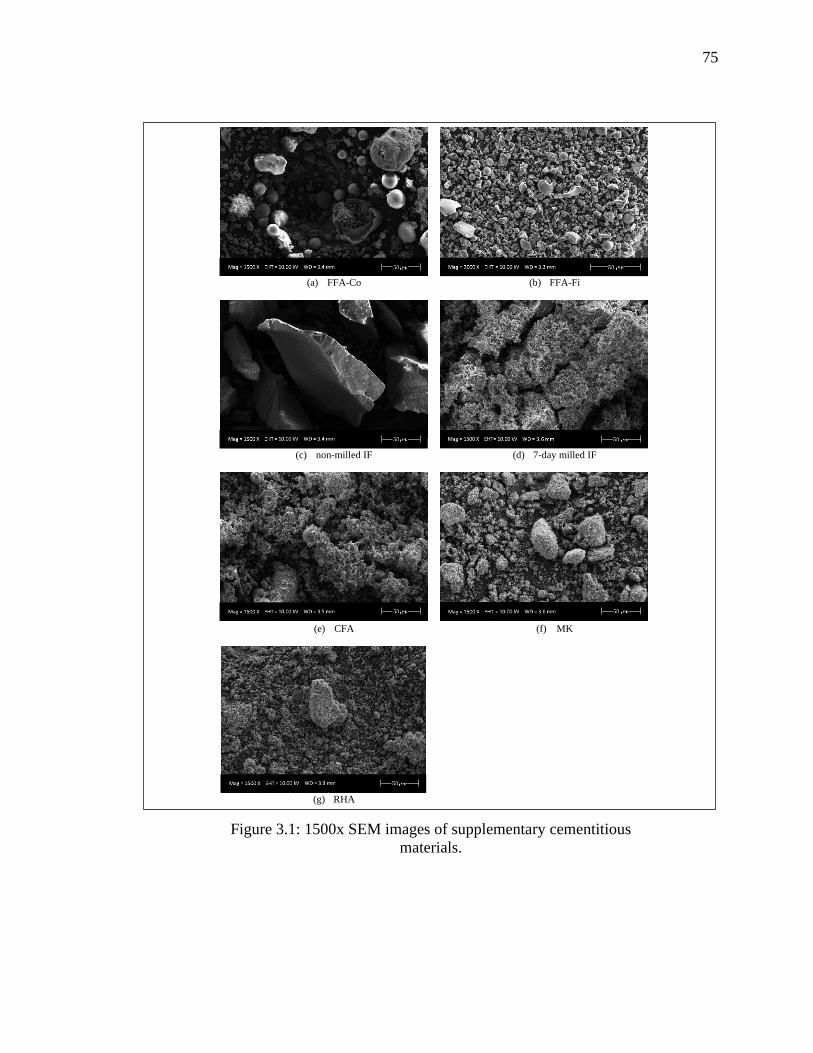
75
Figure 3.1: 1500x SEM images of supplementary cementitious
materials.
(a) FFA-Co
(b) FFA-Fi
(c) non-milled IF
(d) 7-day milled IF
(e) CFA
(f) MK
(g) RHA
1
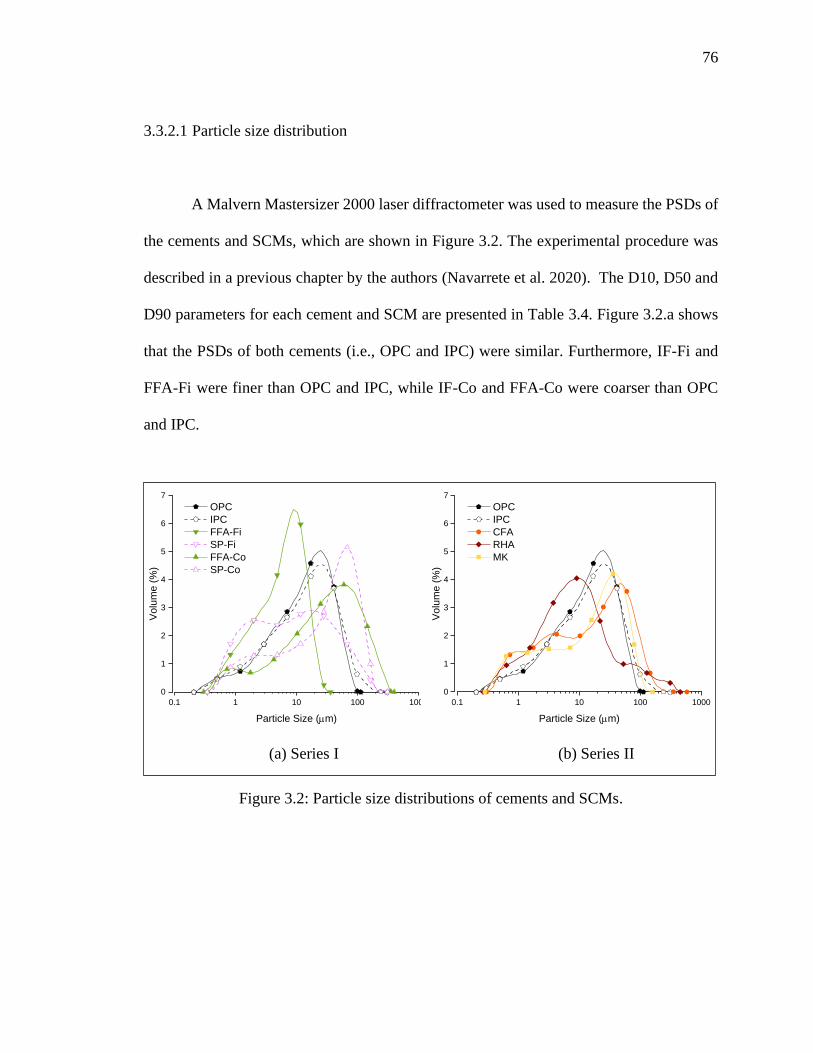
76
3.3.2.1 Particle size distribution
A Malvern Mastersizer 2000 laser diffractometer was used to measure the PSDs of
the cements and SCMs, which are shown in Figure 3.2. The experimental procedure was
described in a previous chapter by the authors (Navarrete et al. 2020). The D10, D50 and
D90 parameters for each cement and SCM are presented in Table 3.4. Figure 3.2.a shows
that the PSDs of both cements (i.e., OPC and IPC) were similar. Furthermore, IF-Fi and
FFA-Fi were finer than OPC and IPC, while IF-Co and FFA-Co were coarser than OPC
and IPC.
(a) Series I (b) Series II
Figure 3.2: Particle size distributions of cements and SCMs.
0.1 1 10 100 1000
0
1
2
3
4
5
6
7
Volu
me (
%)
Particle Size (mm)
OPC
IPC
FFA-Fi
SP-Fi
FFA-Co
SP-Co
0.1 1 10 100 1000
0
1
2
3
4
5
6
7
Volu
me (
%)
Particle Size (mm)
OPC
IPC
CFA
RHA
MK
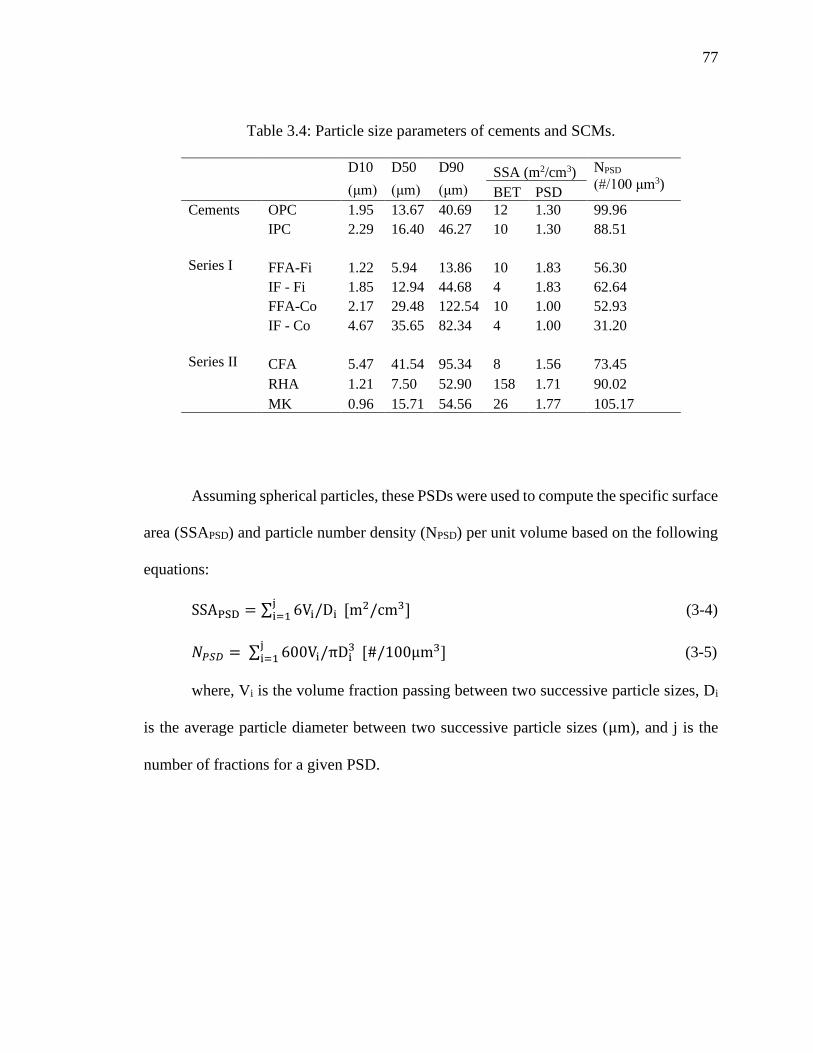
77
Table 3.4: Particle size parameters of cements and SCMs.
D10 D50 D90 SSA (m2/cm3) NPSD
(#/100 μm3) (μm) (μm) (μm) BET PSD
Cements OPC 1.95 13.67 40.69 12 1.30 99.96
IPC 2.29 16.40 46.27 10 1.30 88.51
Series I FFA-Fi 1.22 5.94 13.86 10 1.83 56.30
IF - Fi 1.85 12.94 44.68 4 1.83 62.64
FFA-Co 2.17 29.48 122.54 10 1.00 52.93
IF - Co 4.67 35.65 82.34 4 1.00 31.20
Series II CFA 5.47 41.54 95.34 8 1.56 73.45
RHA 1.21 7.50 52.90 158 1.71 90.02
MK 0.96 15.71 54.56 26 1.77 105.17
Assuming spherical particles, these PSDs were used to compute the specific surface
area (SSAPSD) and particle number density (NPSD) per unit volume based on the following
equations:
SSAPSD = ∑ 6Vi/Diji=1 [m2/cm3] (3-4)
𝑁𝑃𝑆𝐷 = ∑ 600Vi/πDi3j
i=1 [#/100μm3] (3-5)
where, Vi is the volume fraction passing between two successive particle sizes, Di
is the average particle diameter between two successive particle sizes (μm), and j is the
number of fractions for a given PSD.
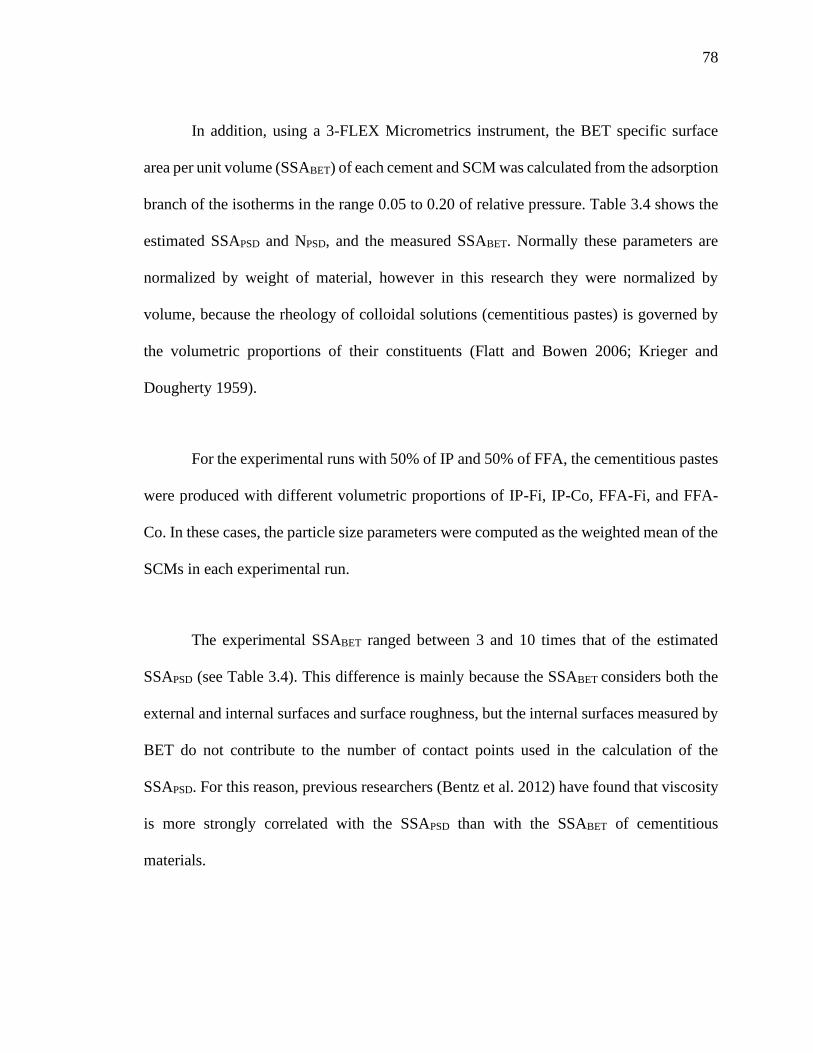
78
In addition, using a 3-FLEX Micrometrics instrument, the BET specific surface
area per unit volume (SSABET) of each cement and SCM was calculated from the adsorption
branch of the isotherms in the range 0.05 to 0.20 of relative pressure. Table 3.4 shows the
estimated SSAPSD and NPSD, and the measured SSABET. Normally these parameters are
normalized by weight of material, however in this research they were normalized by
volume, because the rheology of colloidal solutions (cementitious pastes) is governed by
the volumetric proportions of their constituents (Flatt and Bowen 2006; Krieger and
Dougherty 1959).
For the experimental runs with 50% of IP and 50% of FFA, the cementitious pastes
were produced with different volumetric proportions of IP-Fi, IP-Co, FFA-Fi, and FFA-
Co. In these cases, the particle size parameters were computed as the weighted mean of the
SCMs in each experimental run.
The experimental SSABET ranged between 3 and 10 times that of the estimated
SSAPSD (see Table 3.4). This difference is mainly because the SSABET considers both the
external and internal surfaces and surface roughness, but the internal surfaces measured by
BET do not contribute to the number of contact points used in the calculation of the
SSAPSD. For this reason, previous researchers (Bentz et al. 2012) have found that viscosity
is more strongly correlated with the SSAPSD than with the SSABET of cementitious
materials.
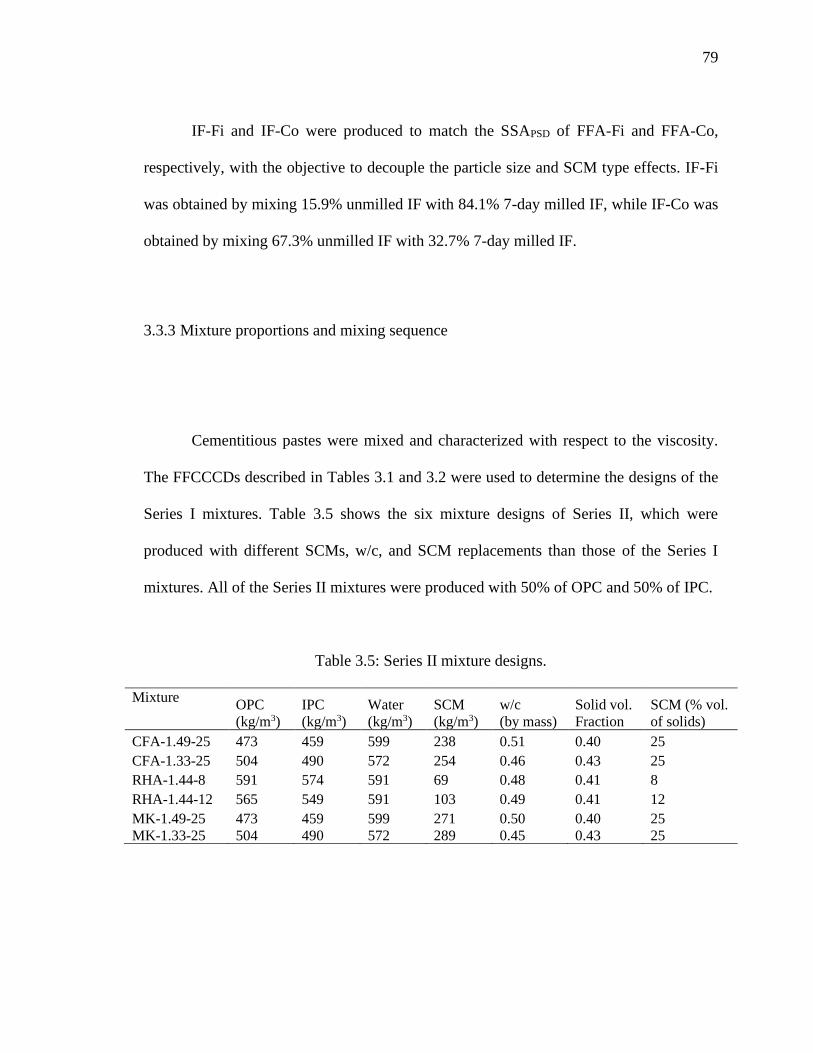
79
IF-Fi and IF-Co were produced to match the SSAPSD of FFA-Fi and FFA-Co,
respectively, with the objective to decouple the particle size and SCM type effects. IF-Fi
was obtained by mixing 15.9% unmilled IF with 84.1% 7-day milled IF, while IF-Co was
obtained by mixing 67.3% unmilled IF with 32.7% 7-day milled IF.
3.3.3 Mixture proportions and mixing sequence
Cementitious pastes were mixed and characterized with respect to the viscosity.
The FFCCCDs described in Tables 3.1 and 3.2 were used to determine the designs of the
Series I mixtures. Table 3.5 shows the six mixture designs of Series II, which were
produced with different SCMs, w/c, and SCM replacements than those of the Series I
mixtures. All of the Series II mixtures were produced with 50% of OPC and 50% of IPC.
Table 3.5: Series II mixture designs.
Mixture OPC
(kg/m3)
IPC
(kg/m3)
Water
(kg/m3)
SCM
(kg/m3)
w/c
(by mass)
Solid vol.
Fraction
SCM (% vol.
of solids)
CFA-1.49-25 473 459 599 238 0.51 0.40 25
CFA-1.33-25 504 490 572 254 0.46 0.43 25
RHA-1.44-8 591 574 591 69 0.48 0.41 8
RHA-1.44-12 565 549 591 103 0.49 0.41 12
MK-1.49-25 473 459 599 271 0.50 0.40 25
MK-1.33-25 504 490 572 289 0.45 0.43 25
80
The cementitious pastes were prepared with an electric stirrer. The same procedure
was used for all of the mixtures at a constant blade speed (i.e., 1100 rpm) and temperature
(i.e., 20 to 23 °C). The dry powders were blended for 5 min to homogenize and eliminate
any clumps, and then mixed for 2 min after the water was added.
3.3.4 Equilibrium flow curve measurement
The measurements were conducted with a TA Discovery Hybrid Rheometer 2. A
parallel-plate configuration, with a diameter of 25 mm, a smooth stationary base plate and
a serrated superior plate was used. The gap between the plates was fixed at 1000 𝜇m, as
shown to be adequate by previous researchers (Ferraris et al. 2001b; a; Navarrete et al.
2020), to compare the rheological behavior of the different cementitious pastes.
The equilibrium flow curve measurement was started at 8 min after the contact of
cement with water. The test protocol was consistent with the procedures used by previous
researchers (Feys and Asghari 2019; Wallevik et al. 2015; Yuan et al. 2018). To achieve a
reference state, a pre-sheared period of 60 s at a �̇� of 100 s-1 was executed. This was
followed by a linearly decreasing �̇� ramp from 100 to 0 s-1 within 120 s, registering data
every 0.8 s. During the entire test, the temperature of the sample was maintained at 23 °C.
81
Particle migration and wall slip are common problems when testing highly
concentrated suspensions (i.e., cementitious pastes) on a parallel plate rheometer (Chen
2020; Feys et al. 2017). Either one of these problems can invalidate the measurements.
Particularly, low viscosities can lead into particle migration and high viscosities into wall
slip. Previous authors (Malvern Instruments Limited 2015) have shown that in the cases
where particle migration and/or wall slip is presented, the measurements are affected by
the gap size used. Therefore, the equilibrium flow curve of the experimental runs with the
smallest (i.e., IF-Co-1.55-40-IPC) and largest viscosity (i.e., FFA-Co-1.24-20-OPC) were
measured using three different gap sizes (i.e., 700, 850 and 1000 𝜇m) to make sure that the
chosen gap of 1000 𝜇m will not present neither particle migration nor wall slip. For each
mixture design and gap size, three repetitions were performed, which allowed the
variability of each measurement to be estimated. Figure 3.3 shows the average flow curve
and the variability of the results. Since the differences in equilibrium flow measurements
of the three gaps are not statistically significant, it can be concluded no particle migration
and/or wall slip is present on the measured flow curve of the mixtures of maximum and
minimum viscosity. Thus, the chosen experimental setup used in this study will provide
valid and valuable results.
82
(a) IF-Co-1.55-40-IPC (b) FFA-Co-1.24-20-OPC
Figure 3.3: Effect of gap size on viscosity of cementitious paste.
The shadow areas represent the 95% confidence interval limits for
each measurement.
3.4 Results and discussion
3.4.1 Equilibrium flow curves
Figure 3.4 shows the equilibrium flow curves measured on the Series I and Series
II mixtures. Romero et al. (Romero et al. 2018) have shown that, in colloidal suspensions,
the particles form three dimensional networks with resistance to shear forces, and that the
resistance of these networks is increasingly weakened as the shear rate increases. This
factor explains the shear – thinning (i.e., viscosity decrease under increased �̇�) behavior
observed in all of the tested samples, which is similar to the results in previous studies
(Choi et al. 2019; Feys and Asghari 2019; Struble and Sun 1995; Vance et al. 2013; Yahia
and Khayat 2001; Yim et al. 2013).
0 25 50 75 1000
25
50
75
100
125
150
175 700 mm
850 mm
1000 mm
She
ar
str
ess (
Pa)
Shear rate (s-1)
0 25 50 75 1000
25
50
75
100
125
150
175 700 mm
850 mm
1000 mmS
he
ar
str
ess (
Pa
)
Shear rate (s-1)
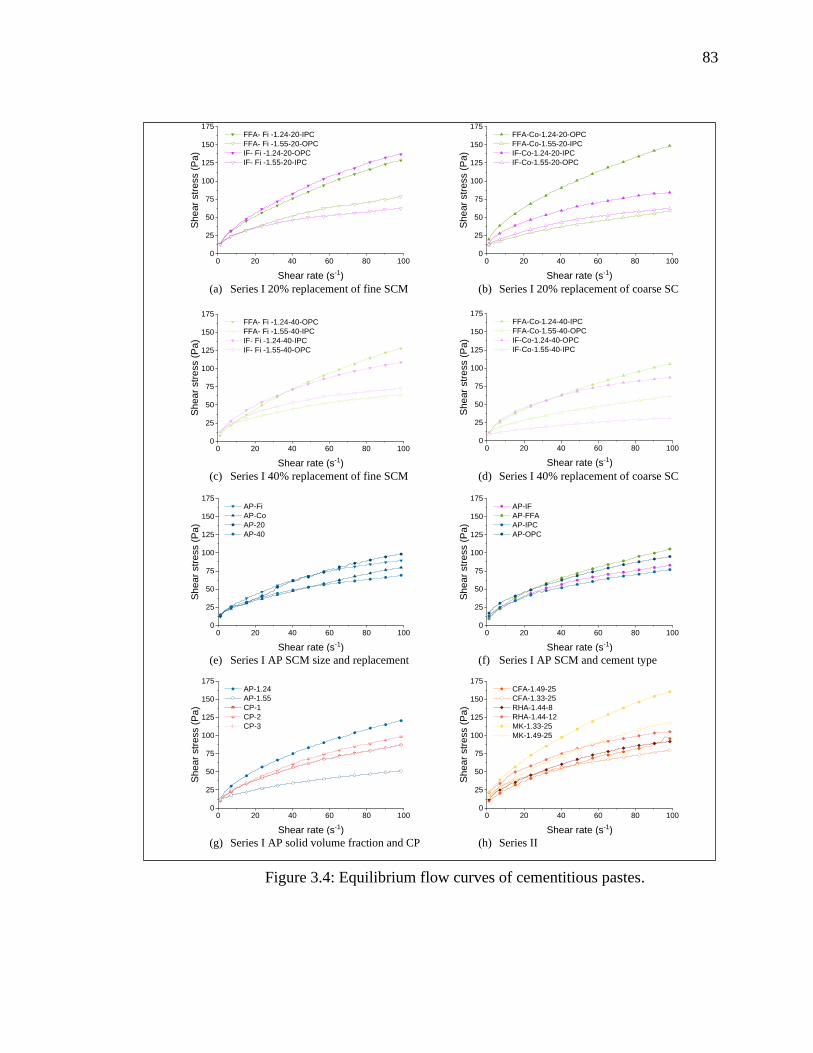
83
Figure 3.4: Equilibrium flow curves of cementitious pastes.
(a) Series I 20% replacement of fine SCM
(b) Series I 20% replacement of coarse SCM
(c) Series I 40% replacement of fine SCM (d) Series I 40% replacement of coarse SCM
(e) Series I AP SCM size and replacement (f) Series I AP SCM and cement type
(g) Series I AP solid volume fraction and CP (h) Series II
1
0 20 40 60 80 1000
25
50
75
100
125
150
175
Shear
str
ess (
Pa)
Shear rate (s-1)
FFA- Fi -1.24-20-IPC
FFA- Fi -1.55-20-OPC
IF- Fi -1.24-20-OPC
IF- Fi -1.55-20-IPC
0 20 40 60 80 1000
25
50
75
100
125
150
175
Shear
str
ess (
Pa)
Shear rate (s-1)
FFA-Co-1.24-20-OPC
FFA-Co-1.55-20-IPC
IF-Co-1.24-20-IPC
IF-Co-1.55-20-OPC
0 20 40 60 80 1000
25
50
75
100
125
150
175
Shear
str
ess (
Pa)
Shear rate (s-1)
FFA- Fi -1.24-40-OPC
FFA- Fi -1.55-40-IPC
IF- Fi -1.24-40-IPC
IF- Fi -1.55-40-OPC
0 20 40 60 80 1000
25
50
75
100
125
150
175
Shear
str
ess (
Pa)
Shear rate (s-1)
FFA-Co-1.24-40-IPC
FFA-Co-1.55-40-OPC
IF-Co-1.24-40-OPC
IF-Co-1.55-40-IPC
0 20 40 60 80 1000
25
50
75
100
125
150
175
Shear
str
ess (
Pa)
Shear rate (s-1)
AP-Fi
AP-Co
AP-20
AP-40
0 20 40 60 80 1000
25
50
75
100
125
150
175
Shear
str
ess (
Pa)
Shear rate (s-1)
AP-IF
AP-FFA
AP-IPC
AP-OPC
0 20 40 60 80 1000
25
50
75
100
125
150
175
Shear
str
ess (
Pa)
Shear rate (s-1)
AP-1.24
AP-1.55
CP-1
CP-2
CP-3
0 20 40 60 80 1000
25
50
75
100
125
150
175
Shear
str
ess (
Pa)
Shear rate (s-1)
CFA-1.49-25
CFA-1.33-25
RHA-1.44-8
RHA-1.44-12
MK-1.33-25
MK-1.49-25

84
Non-linear rheological models, such as Herschel – Bulkley and modified Bingham
models, fit well to the measured rheological behavior of all the mixtures. However, the
added (third) term in these models increases the sensitivity of all parameters to small
measurement errors (Wallevik et al. 2015), producing unstable values of the yield stress
and viscosity predictions and making the analysis of the results more complicated.
Feys and Asghari (Feys and Asghari 2019) have shown that yield stress values
extrapolated from flow curves are dependent on the shear rate range and the number of
data points in the curve and, therefore, may not be sufficiently accurate to provide a good
analysis. These authors proposed to use the shear stress at 5 s-1 as a value that can represent
the yield stress (𝜏5/𝑠). Even though an overestimation of the yield stress results from this
approach, this error should be similar for all the mixtures. Therefore, the 𝜏5/𝑠 parameter
can be used to compare the τ0 of different mixtures. Table 3.6 shows the 𝜏5/𝑠 values
calculated for each mixture.
Since different concrete applications result in different �̇� (Choi et al. 2019; Feys et
al. 2013, 2016; Feys and Asghari 2019; Kim et al. 2015), it is important to analyze the
viscosity of the cementitious pastes in different �̇� ranges. As a representative example,
Figure 3.5 shows the measured equilibrium flow curve of IF-Fi-1.24-20-OPC. It can be
seen that the slopes of the curve in the shear rate ranges of 10 to 40 s-1, which is critical for
gravity induced flow (Kim et al. 2015), and 60 to 90 s-1, which is critical for SCC during
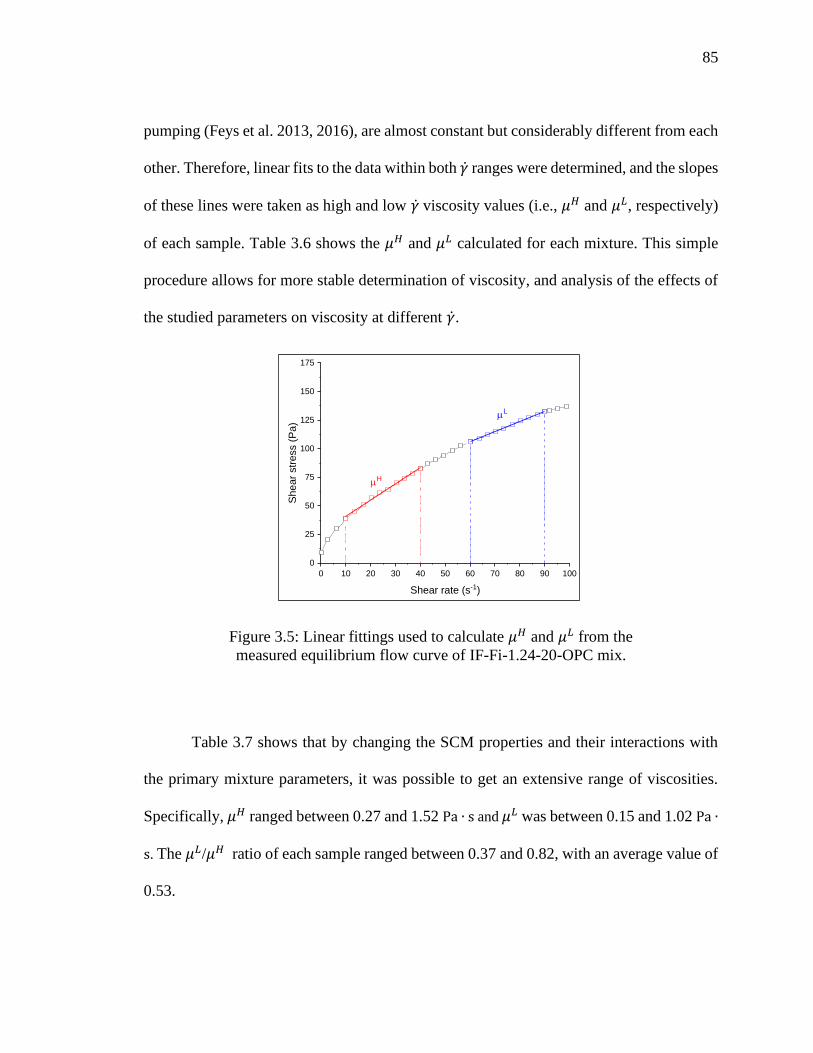
85
pumping (Feys et al. 2013, 2016), are almost constant but considerably different from each
other. Therefore, linear fits to the data within both �̇� ranges were determined, and the slopes
of these lines were taken as high and low �̇� viscosity values (i.e., 𝜇𝐻 and 𝜇𝐿, respectively)
of each sample. Table 3.6 shows the 𝜇𝐻 and 𝜇𝐿 calculated for each mixture. This simple
procedure allows for more stable determination of viscosity, and analysis of the effects of
the studied parameters on viscosity at different �̇�.
Figure 3.5: Linear fittings used to calculate 𝜇𝐻 and 𝜇𝐿 from the
measured equilibrium flow curve of IF-Fi-1.24-20-OPC mix.
Table 3.7 shows that by changing the SCM properties and their interactions with
the primary mixture parameters, it was possible to get an extensive range of viscosities.
Specifically, 𝜇𝐻 ranged between 0.27 and 1.52 Pa ∙ s and 𝜇𝐿 was between 0.15 and 1.02 Pa ∙
s. The 𝜇𝐿/𝜇𝐻 ratio of each sample ranged between 0.37 and 0.82, with an average value of
0.53.
0 10 20 30 40 50 60 70 80 90 100
0
25
50
75
100
125
150
175
Sh
ear
str
ess (
Pa)
Shear rate (s-1)
mH
mL
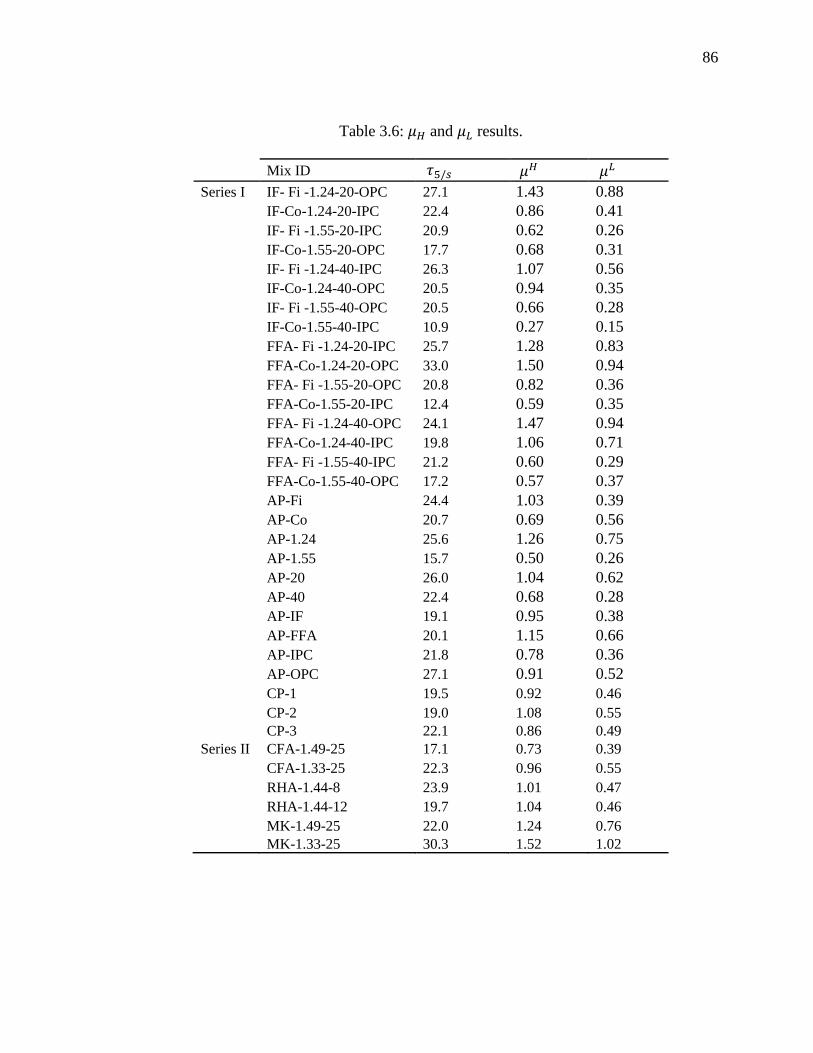
86
Table 3.6: 𝜇𝐻 and 𝜇𝐿 results.
Mix ID 𝜏5/𝑠 𝜇𝐻 𝜇𝐿
Series I IF- Fi -1.24-20-OPC 27.1 1.43 0.88
IF-Co-1.24-20-IPC 22.4 0.86 0.41
IF- Fi -1.55-20-IPC 20.9 0.62 0.26
IF-Co-1.55-20-OPC 17.7 0.68 0.31
IF- Fi -1.24-40-IPC 26.3 1.07 0.56
IF-Co-1.24-40-OPC 20.5 0.94 0.35
IF- Fi -1.55-40-OPC 20.5 0.66 0.28
IF-Co-1.55-40-IPC 10.9 0.27 0.15
FFA- Fi -1.24-20-IPC 25.7 1.28 0.83
FFA-Co-1.24-20-OPC 33.0 1.50 0.94
FFA- Fi -1.55-20-OPC 20.8 0.82 0.36
FFA-Co-1.55-20-IPC 12.4 0.59 0.35
FFA- Fi -1.24-40-OPC 24.1 1.47 0.94
FFA-Co-1.24-40-IPC 19.8 1.06 0.71
FFA- Fi -1.55-40-IPC 21.2 0.60 0.29
FFA-Co-1.55-40-OPC 17.2 0.57 0.37
AP-Fi 24.4 1.03 0.39
AP-Co 20.7 0.69 0.56
AP-1.24 25.6 1.26 0.75
AP-1.55 15.7 0.50 0.26
AP-20 26.0 1.04 0.62
AP-40 22.4 0.68 0.28
AP-IF 19.1 0.95 0.38
AP-FFA 20.1 1.15 0.66
AP-IPC 21.8 0.78 0.36
AP-OPC 27.1 0.91 0.52
CP-1 19.5 0.92 0.46
CP-2 19.0 1.08 0.55
CP-3 22.1 0.86 0.49
Series II CFA-1.49-25 17.1 0.73 0.39
CFA-1.33-25 22.3 0.96 0.55
RHA-1.44-8 23.9 1.01 0.47
RHA-1.44-12 19.7 1.04 0.46
MK-1.49-25 22.0 1.24 0.76
MK-1.33-25 30.3 1.52 1.02
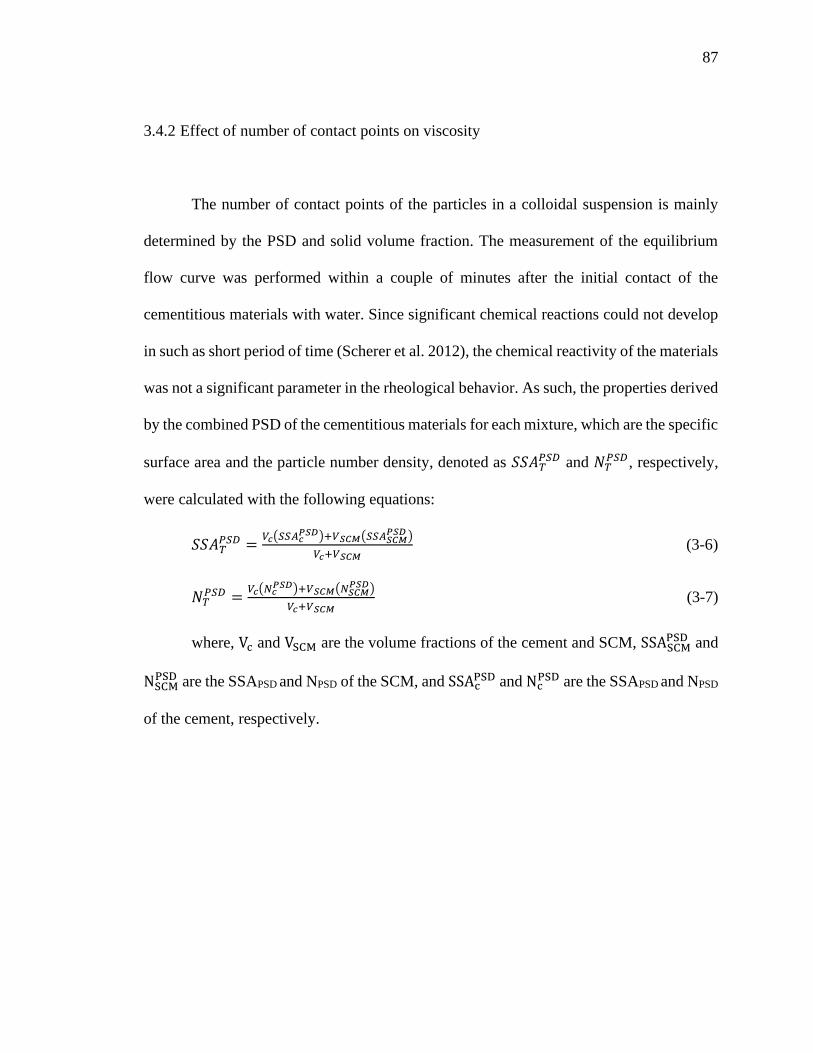
87
3.4.2 Effect of number of contact points on viscosity
The number of contact points of the particles in a colloidal suspension is mainly
determined by the PSD and solid volume fraction. The measurement of the equilibrium
flow curve was performed within a couple of minutes after the initial contact of the
cementitious materials with water. Since significant chemical reactions could not develop
in such as short period of time (Scherer et al. 2012), the chemical reactivity of the materials
was not a significant parameter in the rheological behavior. As such, the properties derived
by the combined PSD of the cementitious materials for each mixture, which are the specific
surface area and the particle number density, denoted as 𝑆𝑆𝐴𝑇𝑃𝑆𝐷 and 𝑁𝑇
𝑃𝑆𝐷, respectively,
were calculated with the following equations:
𝑆𝑆𝐴𝑇𝑃𝑆𝐷 =
𝑉𝑐(𝑆𝑆𝐴𝑐𝑃𝑆𝐷)+𝑉𝑆𝐶𝑀(𝑆𝑆𝐴𝑆𝐶𝑀
𝑃𝑆𝐷 )
𝑉𝑐+𝑉𝑆𝐶𝑀 (3-6)
𝑁𝑇𝑃𝑆𝐷 =
𝑉𝑐(𝑁𝑐𝑃𝑆𝐷)+𝑉𝑆𝐶𝑀(𝑁𝑆𝐶𝑀
𝑃𝑆𝐷)
𝑉𝑐+𝑉𝑆𝐶𝑀 (3-7)
where, Vc and VSCM are the volume fractions of the cement and SCM, SSASCMPSD and
NSCMPSD are the SSAPSD and NPSD of the SCM, and SSAc
PSD and NcPSD are the SSAPSD and NPSD
of the cement, respectively.

88
Table 3.7: Particle size properties calculated for blended power of each mixture.
Mix ID 𝑆𝑆𝐴𝑇𝑃𝑆𝐷 𝑁𝑇
𝑃𝑆𝐷
Series I IF- Fi -1.24-20-OPC 1.42 91.6
IF-Co-1.24-20-IPC 1.25 80.8
IF- Fi -1.55-20-IPC 1.42 83.5
IF-Co-1.55-20-OPC 1.25 88.9
IF- Fi -1.24-40-IPC 1.54 77.1
IF-Co-1.24-40-OPC 1.19 77.8
IF- Fi -1.55-40-OPC 1.54 83.2
IF-Co-1.55-40-IPC 1.20 71.7
FFA- Fi -1.24-20-IPC 1.41 83.1
FFA-Co-1.24-20-OPC 1.24 90.6
FFA- Fi -1.55-20-OPC 1.41 91.2
FFA-Co-1.55-20-IPC 1.25 82.5
FFA- Fi -1.24-40-OPC 1.51 82.5
FFA-Co-1.24-40-IPC 1.19 75.1
FFA- Fi -1.55-40-IPC 1.52 76.4
FFA-Co-1.55-40-OPC 1.18 81.1
AP-Fi 1.47 83.5
AP-Co 1.21 81.0
AP-1.24 1.34 82.3
AP-1.55 1.34 82.3
AP-20 1.33 86.5
AP-40 1.35 78.1
AP-IF 1.35 81.8
AP-FFA 1.33 82.8
AP-IPC 1.34 78.7
AP-OPC 1.34 85.9
CP 1.34 82.3
Series II CFA-1.49-25 1.37 89.5
CFA-1.33-25 1.37 89.5
RHA-1.44-8 1.33 94.5
RHA-1.44-12 1.35 94.3
MK-1.49-25 1.42 98.0 MK-1.33-25 1.42 98.0
Table 3.7 provides the calculated properties for the cementitious particles of each
mixture. Note that it is unknown if the particle size effect is more accurately represented
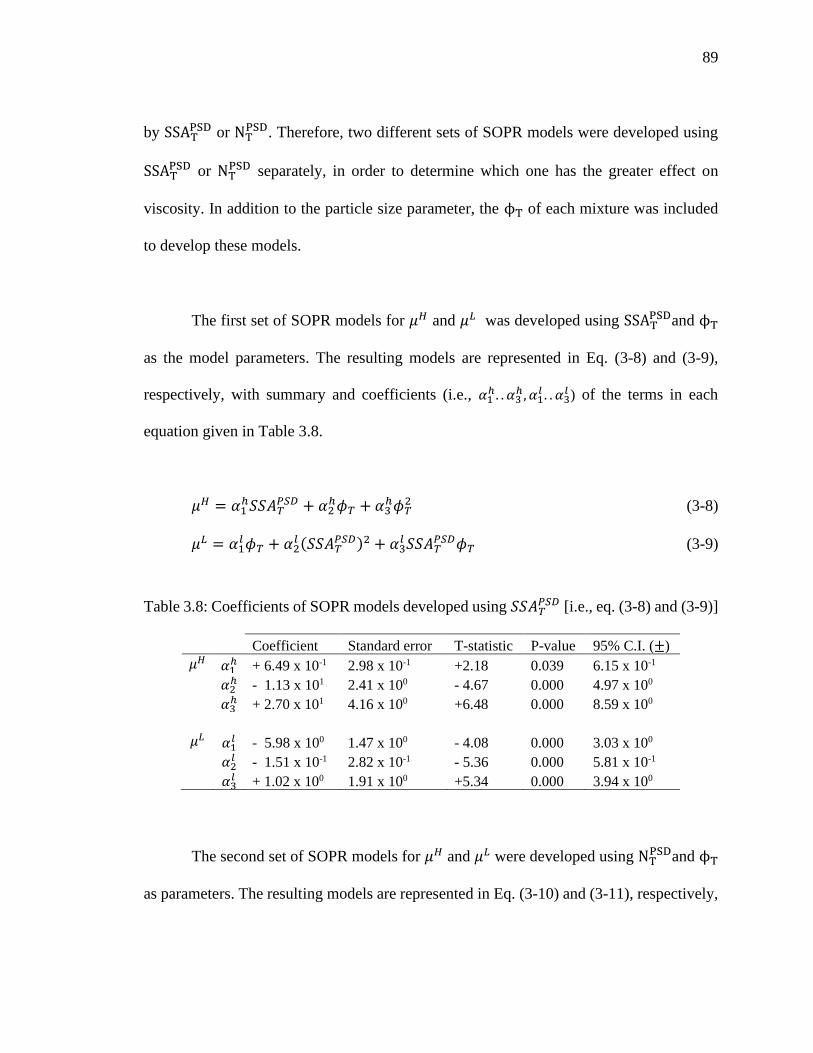
89
by SSATPSD or NT
PSD. Therefore, two different sets of SOPR models were developed using
SSATPSD or NT
PSD separately, in order to determine which one has the greater effect on
viscosity. In addition to the particle size parameter, the ϕT of each mixture was included
to develop these models.
The first set of SOPR models for 𝜇𝐻 and 𝜇𝐿 was developed using SSATPSDand ϕT
as the model parameters. The resulting models are represented in Eq. (3-8) and (3-9),
respectively, with summary and coefficients (i.e., 𝛼1ℎ . . 𝛼3
ℎ, 𝛼1𝑙 . . 𝛼3
𝑙 ) of the terms in each
equation given in Table 3.8.
𝜇𝐻 = 𝛼1ℎ𝑆𝑆𝐴𝑇
𝑃𝑆𝐷 + 𝛼2ℎ𝜙𝑇 + 𝛼3
ℎ𝜙𝑇2 (3-8)
𝜇𝐿 = 𝛼1𝑙 𝜙𝑇 + 𝛼2
𝑙 (𝑆𝑆𝐴𝑇𝑃𝑆𝐷)2 + 𝛼3
𝑙 𝑆𝑆𝐴𝑇𝑃𝑆𝐷𝜙𝑇 (3-9)
Table 3.8: Coefficients of SOPR models developed using 𝑆𝑆𝐴𝑇𝑃𝑆𝐷 [i.e., eq. (3-8) and (3-9)]
Coefficient Standard error T-statistic P-value 95% C.I. (±)
𝜇𝐻 𝛼1ℎ + 6.49 x 10⁻¹ 2.98 x 10⁻¹ +2.18 0.039 6.15 x 10⁻¹
𝛼2ℎ - 1.13 x 101 2.41 x 100 - 4.67 0.000 4.97 x 100
𝛼3ℎ + 2.70 x 101 4.16 x 100 +6.48 0.000 8.59 x 100
𝜇𝐿 𝛼1𝑙 - 5.98 x 100 1.47 x 100 - 4.08 0.000 3.03 x 100
𝛼2𝑙 - 1.51 x 10⁻¹ 2.82 x 10⁻¹ - 5.36 0.000 5.81 x 10⁻¹
𝛼3𝑙 + 1.02 x 100 1.91 x 100 +5.34 0.000 3.94 x 100
The second set of SOPR models for 𝜇𝐻 and 𝜇𝐿 were developed using NTPSDand ϕT
as parameters. The resulting models are represented in Eq. (3-10) and (3-11), respectively,
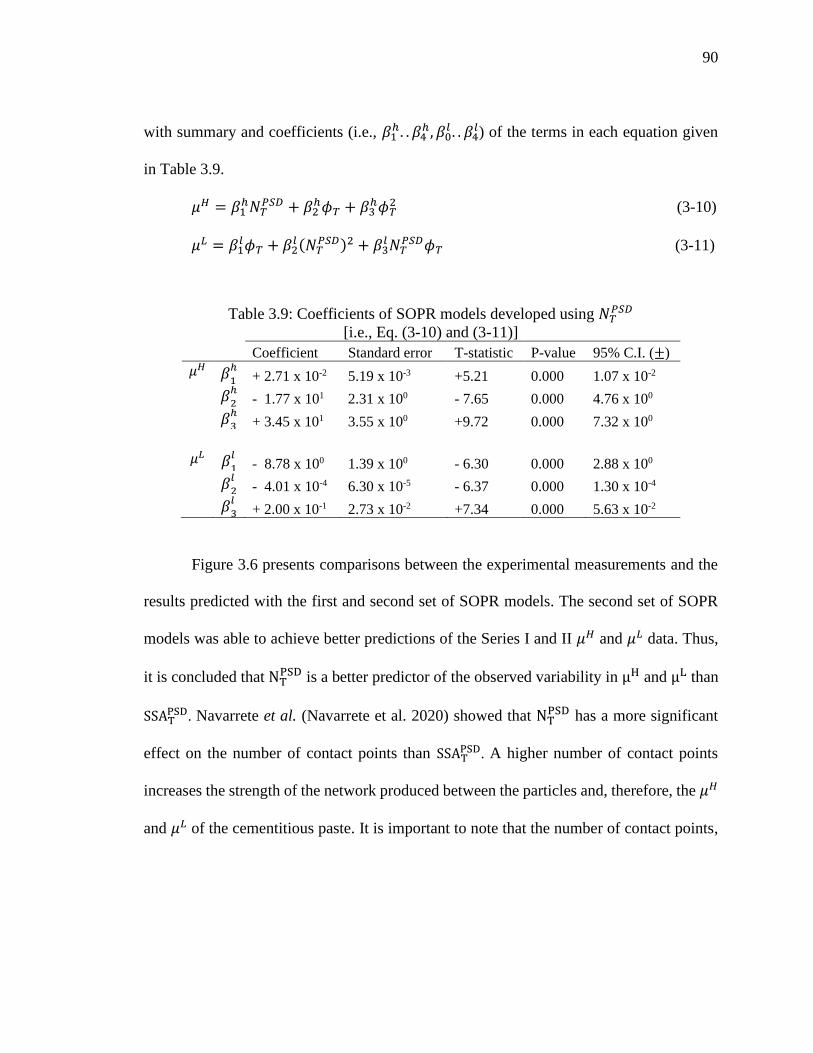
90
with summary and coefficients (i.e., 𝛽1ℎ. . 𝛽4
ℎ, 𝛽0𝑙 . . 𝛽4
𝑙) of the terms in each equation given
in Table 3.9.
𝜇𝐻 = 𝛽1ℎ𝑁𝑇
𝑃𝑆𝐷 + 𝛽2ℎ𝜙𝑇 + 𝛽3
ℎ𝜙𝑇2 (3-10)
𝜇𝐿 = 𝛽1𝑙𝜙𝑇 + 𝛽2
𝑙 (𝑁𝑇𝑃𝑆𝐷)2 + 𝛽3
𝑙 𝑁𝑇𝑃𝑆𝐷𝜙𝑇 (3-11)
Table 3.9: Coefficients of SOPR models developed using 𝑁𝑇𝑃𝑆𝐷
[i.e., Eq. (3-10) and (3-11)] Coefficient Standard error T-statistic P-value 95% C.I. (±)
𝜇𝐻 𝛽1
ℎ + 2.71 x 10⁻² 5.19 x 10⁻³ +5.21 0.000 1.07 x 10⁻²
𝛽2
ℎ - 1.77 x 101 2.31 x 100 - 7.65 0.000 4.76 x 100
𝛽3
ℎ + 3.45 x 101 3.55 x 100 +9.72 0.000 7.32 x 100
𝜇𝐿 𝛽1
𝑙 - 8.78 x 100 1.39 x 100 - 6.30 0.000 2.88 x 100
𝛽2
𝑙 - 4.01 x 10⁻⁴ 6.30 x 10⁻⁵ - 6.37 0.000 1.30 x 10⁻⁴
𝛽3
𝑙 + 2.00 x 10⁻¹ 2.73 x 10⁻² +7.34 0.000 5.63 x 10⁻²
Figure 3.6 presents comparisons between the experimental measurements and the
results predicted with the first and second set of SOPR models. The second set of SOPR
models was able to achieve better predictions of the Series I and II 𝜇𝐻 and 𝜇𝐿 data. Thus,
it is concluded that NTPSD is a better predictor of the observed variability in μH and μL than
SSATPSD. Navarrete et al. (Navarrete et al. 2020) showed that NT
PSD has a more significant
effect on the number of contact points than SSATPSD. A higher number of contact points
increases the strength of the network produced between the particles and, therefore, the 𝜇𝐻
and 𝜇𝐿 of the cementitious paste. It is important to note that the number of contact points,
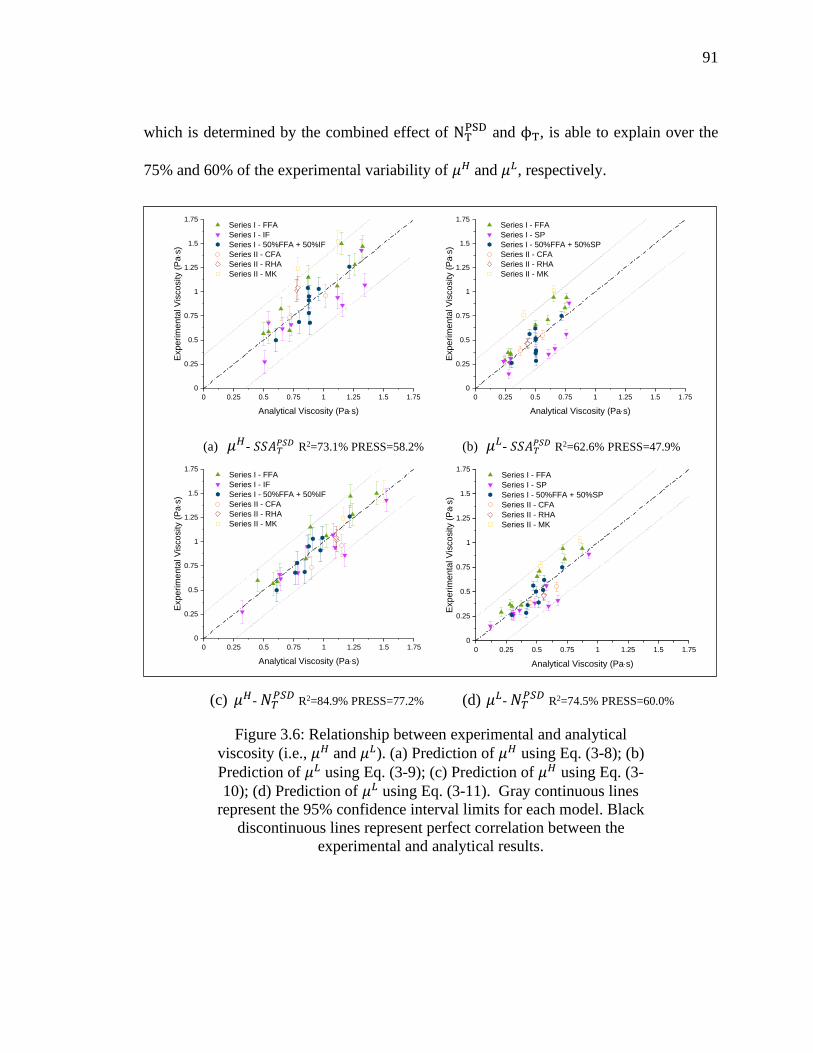
91
which is determined by the combined effect of NTPSD and ϕT, is able to explain over the
75% and 60% of the experimental variability of 𝜇𝐻 and 𝜇𝐿, respectively.
(a) 𝜇𝐻- 𝑆𝑆𝐴𝑇𝑃𝑆𝐷 R2=73.1% PRESS=58.2% (b) 𝜇𝐿- 𝑆𝑆𝐴𝑇
𝑃𝑆𝐷 R2=62.6% PRESS=47.9%
(c) 𝜇𝐻- 𝑁𝑇𝑃𝑆𝐷
R2=84.9% PRESS=77.2% (d) 𝜇𝐿- 𝑁𝑇𝑃𝑆𝐷
R2=74.5% PRESS=60.0%
Figure 3.6: Relationship between experimental and analytical
viscosity (i.e., 𝜇𝐻 and 𝜇𝐿). (a) Prediction of 𝜇𝐻 using Eq. (3-8); (b)
Prediction of 𝜇𝐿 using Eq. (3-9); (c) Prediction of 𝜇𝐻 using Eq. (3-
10); (d) Prediction of 𝜇𝐿 using Eq. (3-11). Gray continuous lines
represent the 95% confidence interval limits for each model. Black
discontinuous lines represent perfect correlation between the
experimental and analytical results.
0 0.25 0.5 0.75 1 1.25 1.5 1.75
0
0.25
0.5
0.75
1
1.25
1.5
1.75 Series I - FFA
Series I - IF
Series I - 50%FFA + 50%IF
Series II - CFA
Series II - RHA
Series II - MK
Experim
enta
l V
iscosity (
Pas
)
Analytical Viscosity (Pas)
0 0.25 0.5 0.75 1 1.25 1.5 1.75
0
0.25
0.5
0.75
1
1.25
1.5
1.75 Series I - FFA
Series I - SP
Series I - 50%FFA + 50%SP
Series II - CFA
Series II - RHA
Series II - MK
Experim
enta
l V
iscosity (
Pas
)
Analytical Viscosity (Pas)
0 0.25 0.5 0.75 1 1.25 1.5 1.75
0
0.25
0.5
0.75
1
1.25
1.5
1.75 Series I - FFA
Series I - IF
Series I - 50%FFA + 50%IF
Series II - CFA
Series II - RHA
Series II - MK
Exp
erim
enta
l V
isco
sity (
Pas
)
Analytical Viscosity (Pas)
0 0.25 0.5 0.75 1 1.25 1.5 1.75
0
0.25
0.5
0.75
1
1.25
1.5
1.75 Series I - FFA
Series I - SP
Series I - 50%FFA + 50%SP
Series II - CFA
Series II - RHA
Series II - MK
Experim
enta
l V
iscosity (
Pas
)
Analytical Viscosity (Pas)
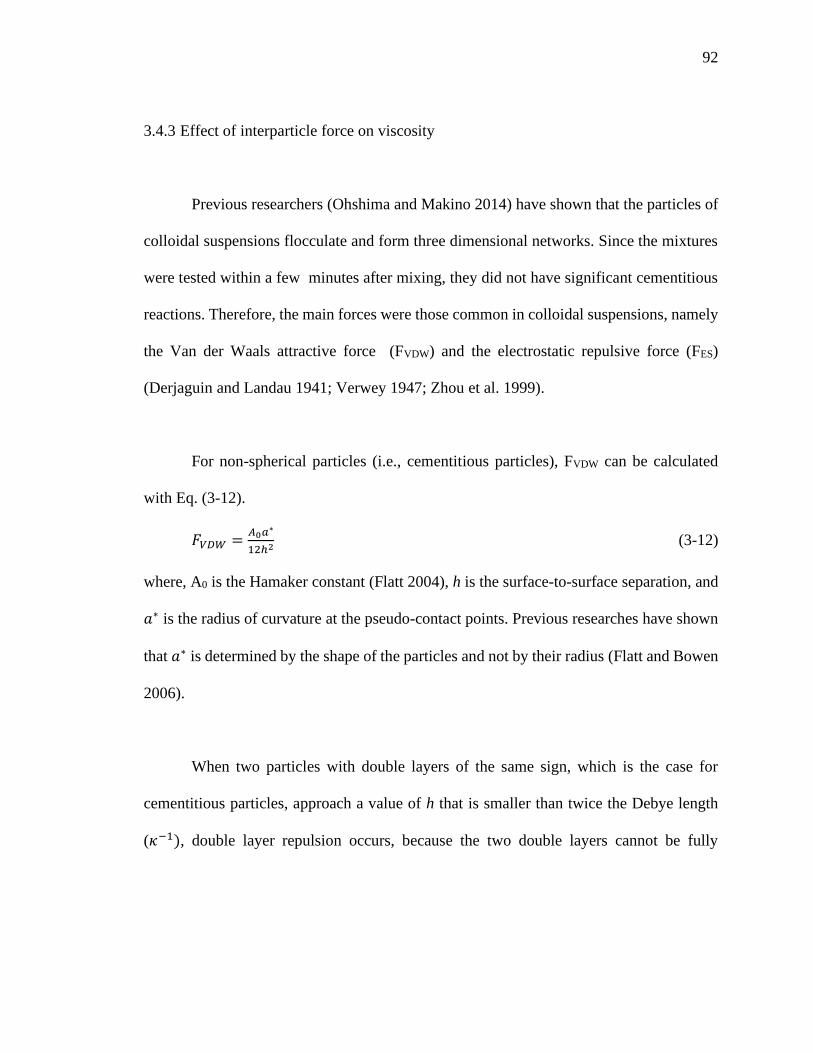
92
3.4.3 Effect of interparticle force on viscosity
Previous researchers (Ohshima and Makino 2014) have shown that the particles of
colloidal suspensions flocculate and form three dimensional networks. Since the mixtures
were tested within a few minutes after mixing, they did not have significant cementitious
reactions. Therefore, the main forces were those common in colloidal suspensions, namely
the Van der Waals attractive force (FVDW) and the electrostatic repulsive force (FES)
(Derjaguin and Landau 1941; Verwey 1947; Zhou et al. 1999).
For non-spherical particles (i.e., cementitious particles), FVDW can be calculated
with Eq. (3-12).
𝐹𝑉𝐷𝑊 =𝐴0𝑎∗
12ℎ2 (3-12)
where, A0 is the Hamaker constant (Flatt 2004), h is the surface-to-surface separation, and
𝑎∗ is the radius of curvature at the pseudo-contact points. Previous researches have shown
that 𝑎∗ is determined by the shape of the particles and not by their radius (Flatt and Bowen
2006).
When two particles with double layers of the same sign, which is the case for
cementitious particles, approach a value of h that is smaller than twice the Debye length
(𝜅−1), double layer repulsion occurs, because the two double layers cannot be fully
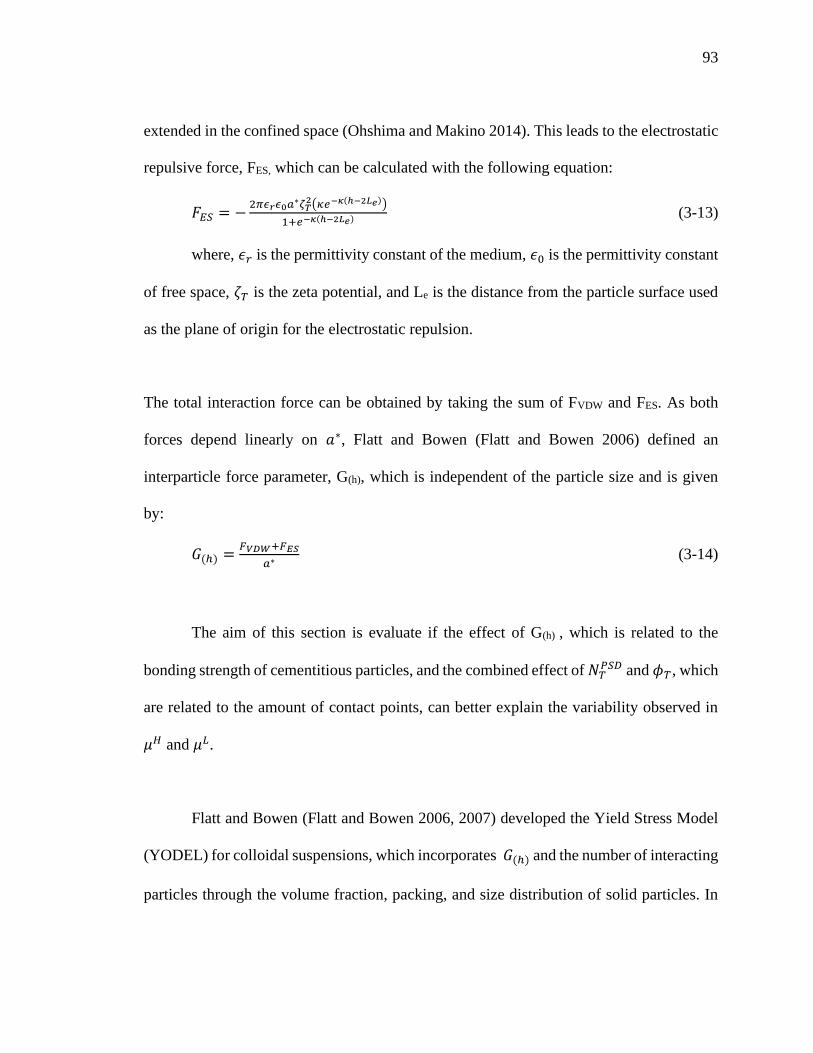
93
extended in the confined space (Ohshima and Makino 2014). This leads to the electrostatic
repulsive force, FES, which can be calculated with the following equation:
𝐹𝐸𝑆 = −2𝜋𝜖𝑟𝜖0𝑎∗𝜁𝑇
2(𝜅𝑒−𝜅(ℎ−2𝐿𝑒))
1+𝑒−𝜅(ℎ−2𝐿𝑒) (3-13)
where, 𝜖𝑟 is the permittivity constant of the medium, 𝜖0 is the permittivity constant
of free space, 𝜁𝑇 is the zeta potential, and Le is the distance from the particle surface used
as the plane of origin for the electrostatic repulsion.
The total interaction force can be obtained by taking the sum of FVDW and FES. As both
forces depend linearly on 𝑎∗, Flatt and Bowen (Flatt and Bowen 2006) defined an
interparticle force parameter, G(h), which is independent of the particle size and is given
by:
𝐺(ℎ) =𝐹𝑉𝐷𝑊+𝐹𝐸𝑆
𝑎∗ (3-14)
The aim of this section is evaluate if the effect of G(h) , which is related to the
bonding strength of cementitious particles, and the combined effect of 𝑁𝑇𝑃𝑆𝐷 and 𝜙𝑇, which
are related to the amount of contact points, can better explain the variability observed in
𝜇𝐻 and 𝜇𝐿.
Flatt and Bowen (Flatt and Bowen 2006, 2007) developed the Yield Stress Model
(YODEL) for colloidal suspensions, which incorporates 𝐺(ℎ) and the number of interacting
particles through the volume fraction, packing, and size distribution of solid particles. In
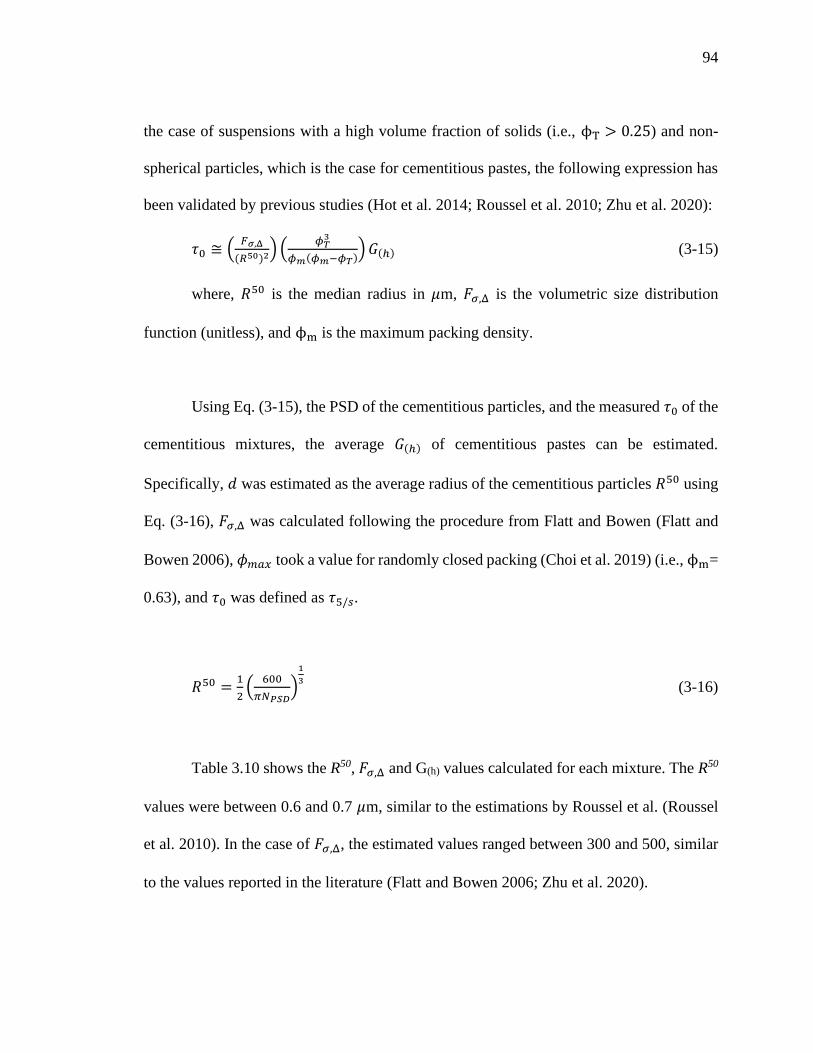
94
the case of suspensions with a high volume fraction of solids (i.e., ϕT > 0.25) and non-
spherical particles, which is the case for cementitious pastes, the following expression has
been validated by previous studies (Hot et al. 2014; Roussel et al. 2010; Zhu et al. 2020):
𝜏0 ≅ (𝐹𝜎,Δ
(𝑅50)2) (𝜙𝑇
3
𝜙𝑚(𝜙𝑚−𝜙𝑇)) 𝐺(ℎ) (3-15)
where, 𝑅50 is the median radius in 𝜇m, 𝐹𝜎,Δ is the volumetric size distribution
function (unitless), and ϕm is the maximum packing density.
Using Eq. (3-15), the PSD of the cementitious particles, and the measured 𝜏0 of the
cementitious mixtures, the average 𝐺(ℎ) of cementitious pastes can be estimated.
Specifically, 𝑑 was estimated as the average radius of the cementitious particles 𝑅50 using
Eq. (3-16), 𝐹𝜎,Δ was calculated following the procedure from Flatt and Bowen (Flatt and
Bowen 2006), 𝜙𝑚𝑎𝑥 took a value for randomly closed packing (Choi et al. 2019) (i.e., ϕm=
0.63), and 𝜏0 was defined as 𝜏5/𝑠.
𝑅50 =1
2(
600
𝜋𝑁𝑃𝑆𝐷)
1
3 (3-16)
Table 3.10 shows the R50, 𝐹𝜎,Δ and G(h) values calculated for each mixture. The R50
values were between 0.6 and 0.7 𝜇m, similar to the estimations by Roussel et al. (Roussel
et al. 2010). In the case of 𝐹𝜎,Δ, the estimated values ranged between 300 and 500, similar
to the values reported in the literature (Flatt and Bowen 2006; Zhu et al. 2020).
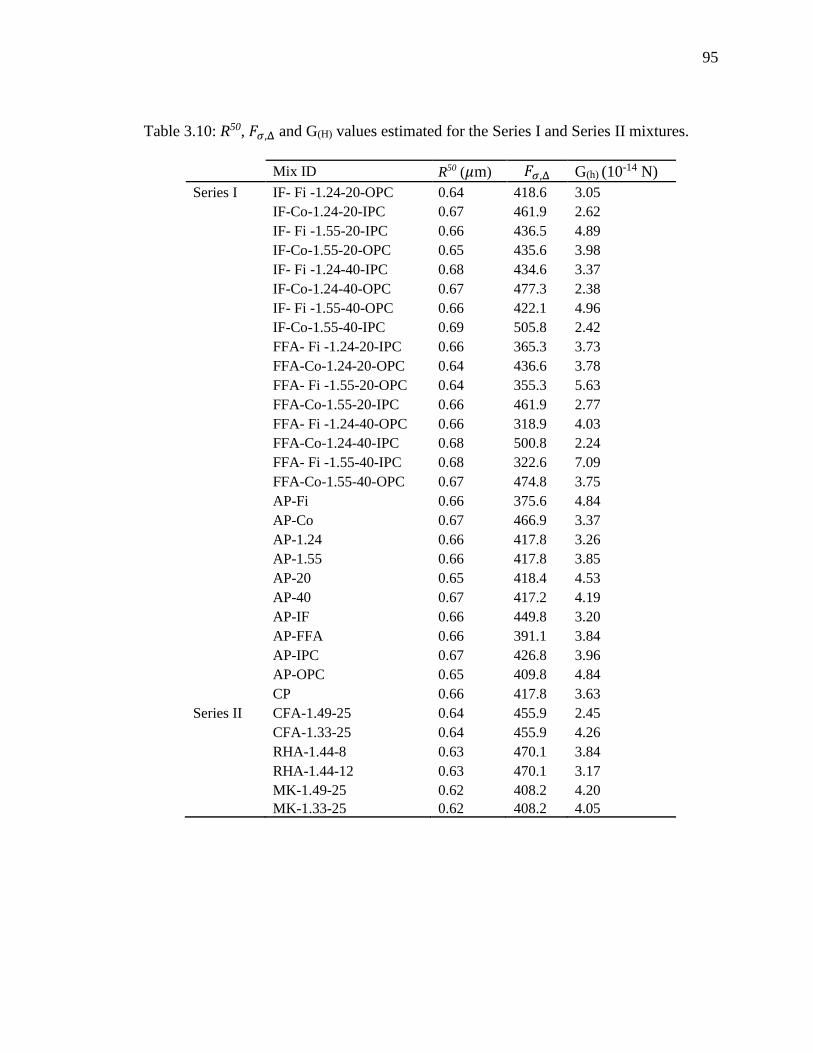
95
Table 3.10: R50, 𝐹𝜎,Δ and G(H) values estimated for the Series I and Series II mixtures.
Mix ID R50 (𝜇m) 𝐹𝜎,Δ G(h) (10-14 N)
Series I IF- Fi -1.24-20-OPC 0.64 418.6 3.05
IF-Co-1.24-20-IPC 0.67 461.9 2.62
IF- Fi -1.55-20-IPC 0.66 436.5 4.89
IF-Co-1.55-20-OPC 0.65 435.6 3.98
IF- Fi -1.24-40-IPC 0.68 434.6 3.37
IF-Co-1.24-40-OPC 0.67 477.3 2.38
IF- Fi -1.55-40-OPC 0.66 422.1 4.96
IF-Co-1.55-40-IPC 0.69 505.8 2.42
FFA- Fi -1.24-20-IPC 0.66 365.3 3.73
FFA-Co-1.24-20-OPC 0.64 436.6 3.78
FFA- Fi -1.55-20-OPC 0.64 355.3 5.63
FFA-Co-1.55-20-IPC 0.66 461.9 2.77
FFA- Fi -1.24-40-OPC 0.66 318.9 4.03
FFA-Co-1.24-40-IPC 0.68 500.8 2.24
FFA- Fi -1.55-40-IPC 0.68 322.6 7.09
FFA-Co-1.55-40-OPC 0.67 474.8 3.75
AP-Fi 0.66 375.6 4.84
AP-Co 0.67 466.9 3.37
AP-1.24 0.66 417.8 3.26
AP-1.55 0.66 417.8 3.85
AP-20 0.65 418.4 4.53
AP-40 0.67 417.2 4.19
AP-IF 0.66 449.8 3.20
AP-FFA 0.66 391.1 3.84
AP-IPC 0.67 426.8 3.96
AP-OPC 0.65 409.8 4.84
CP 0.66 417.8 3.63
Series II CFA-1.49-25 0.64 455.9 2.45
CFA-1.33-25 0.64 455.9 4.26
RHA-1.44-8 0.63 470.1 3.84
RHA-1.44-12 0.63 470.1 3.17
MK-1.49-25 0.62 408.2 4.20
MK-1.33-25 0.62 408.2 4.05
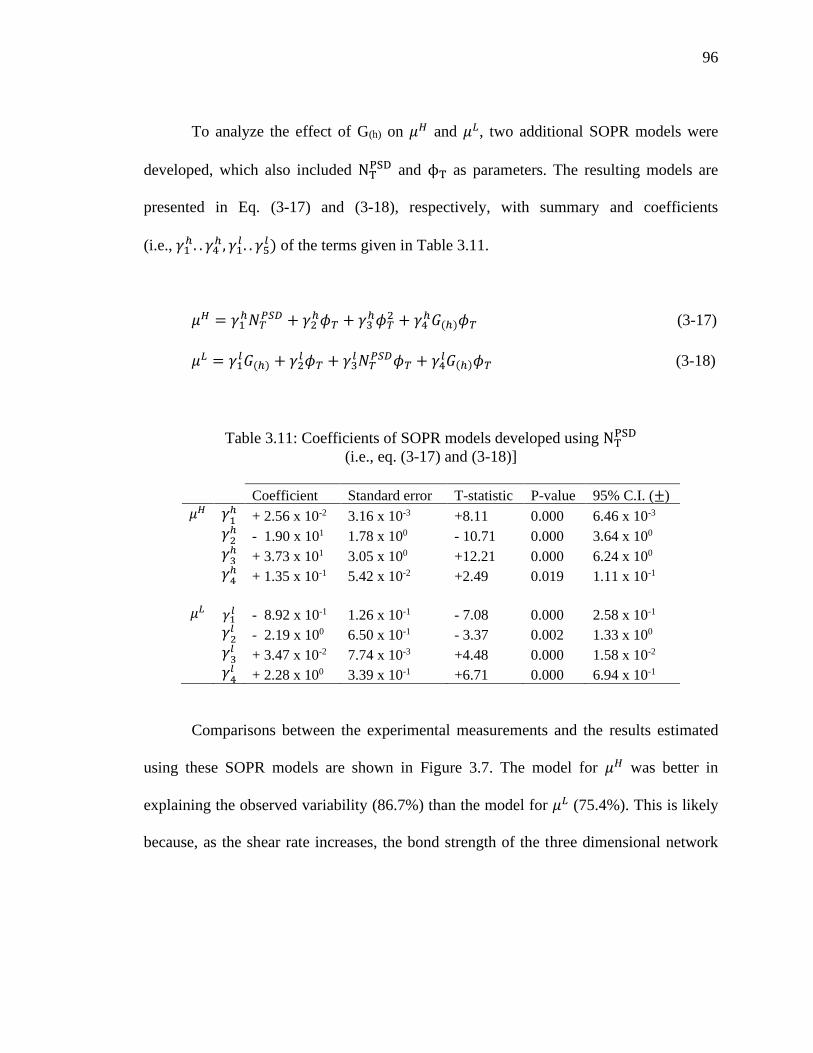
96
To analyze the effect of G(h) on 𝜇𝐻 and 𝜇𝐿, two additional SOPR models were
developed, which also included NTPSD and ϕT as parameters. The resulting models are
presented in Eq. (3-17) and (3-18), respectively, with summary and coefficients
(i.e., 𝛾1ℎ. . 𝛾4
ℎ, 𝛾1𝑙 . . 𝛾5
𝑙 ) of the terms given in Table 3.11.
𝜇𝐻 = 𝛾1ℎ𝑁𝑇
𝑃𝑆𝐷 + 𝛾2ℎ𝜙𝑇 + 𝛾3
ℎ𝜙𝑇2 + 𝛾4
ℎ𝐺(ℎ)𝜙𝑇 (3-17)
𝜇𝐿 = 𝛾1𝑙𝐺(ℎ) + 𝛾2
𝑙 𝜙𝑇 + 𝛾3𝑙 𝑁𝑇
𝑃𝑆𝐷𝜙𝑇 + 𝛾4𝑙𝐺(ℎ)𝜙𝑇 (3-18)
Table 3.11: Coefficients of SOPR models developed using NTPSD
(i.e., eq. (3-17) and (3-18)]
Coefficient Standard error T-statistic P-value 95% C.I. (±)
𝜇𝐻 𝛾1ℎ + 2.56 x 10⁻² 3.16 x 10⁻³ +8.11 0.000 6.46 x 10⁻³
𝛾2ℎ - 1.90 x 101 1.78 x 100 - 10.71 0.000 3.64 x 100
𝛾3ℎ + 3.73 x 101 3.05 x 100 +12.21 0.000 6.24 x 100
𝛾4ℎ + 1.35 x 10⁻¹ 5.42 x 10⁻² +2.49 0.019 1.11 x 10⁻¹
𝜇𝐿 𝛾1𝑙 - 8.92 x 10⁻¹ 1.26 x 10⁻¹ - 7.08 0.000 2.58 x 10⁻¹
𝛾2𝑙 - 2.19 x 100 6.50 x 10⁻¹ - 3.37 0.002 1.33 x 100
𝛾3𝑙 + 3.47 x 10⁻² 7.74 x 10⁻³ +4.48 0.000 1.58 x 10⁻²
𝛾4𝑙 + 2.28 x 100 3.39 x 10⁻¹ +6.71 0.000 6.94 x 10⁻¹
Comparisons between the experimental measurements and the results estimated
using these SOPR models are shown in Figure 3.7. The model for 𝜇𝐻 was better in
explaining the observed variability (86.7%) than the model for 𝜇𝐿 (75.4%). This is likely
because, as the shear rate increases, the bond strength of the three dimensional network
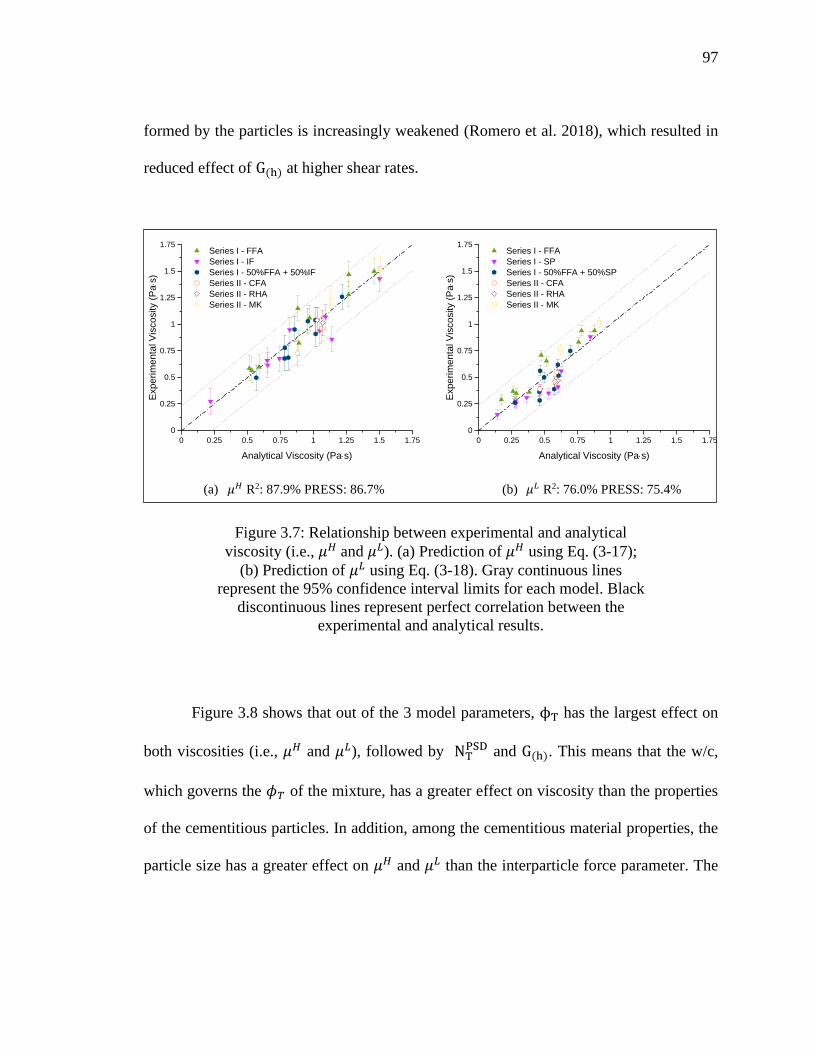
97
formed by the particles is increasingly weakened (Romero et al. 2018), which resulted in
reduced effect of G(h) at higher shear rates.
(a) 𝜇𝐻 R2: 87.9% PRESS: 86.7% (b) 𝜇𝐿 R2: 76.0% PRESS: 75.4%
Figure 3.7: Relationship between experimental and analytical
viscosity (i.e., 𝜇𝐻 and 𝜇𝐿). (a) Prediction of 𝜇𝐻 using Eq. (3-17);
(b) Prediction of 𝜇𝐿 using Eq. (3-18). Gray continuous lines
represent the 95% confidence interval limits for each model. Black
discontinuous lines represent perfect correlation between the
experimental and analytical results.
Figure 3.8 shows that out of the 3 model parameters, ϕT has the largest effect on
both viscosities (i.e., 𝜇𝐻 and 𝜇𝐿), followed by NTPSD and G(h). This means that the w/c,
which governs the 𝜙𝑇 of the mixture, has a greater effect on viscosity than the properties
of the cementitious particles. In addition, among the cementitious material properties, the
particle size has a greater effect on 𝜇𝐻 and 𝜇𝐿 than the interparticle force parameter. The
0 0.25 0.5 0.75 1 1.25 1.5 1.75
0
0.25
0.5
0.75
1
1.25
1.5
1.75 Series I - FFA
Series I - IF
Series I - 50%FFA + 50%IF
Series II - CFA
Series II - RHA
Series II - MK
Experim
enta
l V
iscosity (
Pas
)
Analytical Viscosity (Pas)
0 0.25 0.5 0.75 1 1.25 1.5 1.75
0
0.25
0.5
0.75
1
1.25
1.5
1.75 Series I - FFA
Series I - SP
Series I - 50%FFA + 50%SP
Series II - CFA
Series II - RHA
Series II - MK
Experim
enta
l V
iscosity (
Pas
)Analytical Viscosity (Pas)
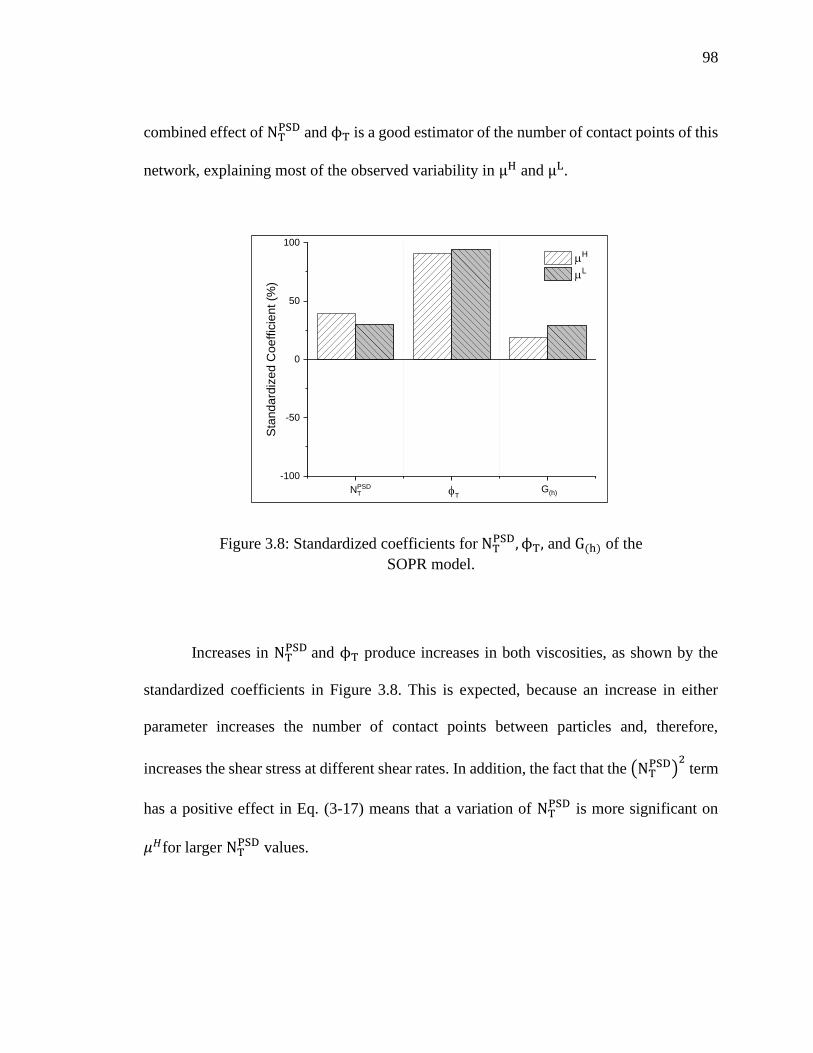
98
combined effect of NTPSD and ϕT is a good estimator of the number of contact points of this
network, explaining most of the observed variability in μH and μL.
Figure 3.8: Standardized coefficients for NTPSD, ϕT, and G(h) of the
SOPR model.
Increases in NTPSD
and ϕT produce increases in both viscosities, as shown by the
standardized coefficients in Figure 3.8. This is expected, because an increase in either
parameter increases the number of contact points between particles and, therefore,
increases the shear stress at different shear rates. In addition, the fact that the (NTPSD)
2 term
has a positive effect in Eq. (3-17) means that a variation of NTPSD is more significant on
𝜇𝐻for larger NTPSD values.
-100
-50
0
50
100
Sta
ndard
ized C
oeffic
ient (%
) mH
mL
NPSDT f
TG(h)
99
Increases in G(h) result in increases in 𝜇𝐻 and 𝜇𝐿 (see Figure 3.8). This effect is
produced because an increase in G(h) increases the interparticle force and, therefore,
increases the shear stress at different shear rates.
Eq. (3-17) and (3-18) show that the interaction between G(h) and ϕT has a positive
effect on 𝜇𝐻 and 𝜇𝐿, which means that cementitious pastes with larger ϕT are more affected
by G(h). In addition, Eq. (3-18) shows that the interaction between NTPSD and ϕT produces
a positive effect on 𝜇𝐿, which means that 𝜇𝐿 is more affected by NTPSD in cementitious
pastes with larger ϕT. These results can be expected because larger ϕT means that there
are more solid particles in the mixture and, therefore, the interaction among those particles
increases.
The validated SOPR models [i.e., Eq. (3-17) and (3-18)] were used to map the
combined effects of the cementitious particle properties (i.e., G(h) and NTPSD) on 𝜇𝐻 and
𝜇𝐿, for selected values of 𝜙𝑇. These response surfaces allow for a better understanding of
the interactions of the cementitious particle properties. The selected values of ϕT were
0.42, which is the ϕT value of the CP in Series I mixtures (see Table 3.1), and 0.45, which
is the maximum ϕT value of the Series I mixtures. Figures 3.9.a and 3.9.b present the
results for 𝜇𝐻 and 𝜇𝐿, respectively, for ϕT of 0.42, while Figures 3.9.c and 3.9.d present
the results of 𝜇𝐻 and 𝜇𝐿, respectively, for ϕT of 0.45. The experimental values for Series I
are included in Figure 3.9 to show the combinations of ϕT, NTPSD, and G(h) that were tested.
100
The results suggest that in the case of 𝜇𝐻, the combined effect of G(h) and NTPSD is
not dependent of ϕT since the relative distances between the iso-response curves in Figures
3.9.a and 3.9.c are similar. In the case of μL, the combined effect of G(h) and NTPSD increases
for increased ϕT since the relative distances between the iso-response curves in Figure
3.9.b are greater than those in Figure 3.9.d. In addition, the effect of G(h) relative to the
effect of NTPSD is more significant on 𝜇𝐿 than on 𝜇𝐻, since the slopes of the iso-response
curves are higher in Figure 3.9.b and Figure 3.9.d than those in Figure 3.9.a and Figure
3.9.c. Furthermore, in the case of 𝜇𝐻, NTPSD has a larger effect than G(h) for all the
combinations studied and both ϕT values, since the slopes of all of the iso-response curves
are below 45 degrees to the horizontal axis. In the case of 𝜇𝐿, NTPSD has a larger effect than
G(h) for the lower ϕT (i.e., 0.42), but the opposite trend is observed for the larger ϕT (i.e.,
0.45).
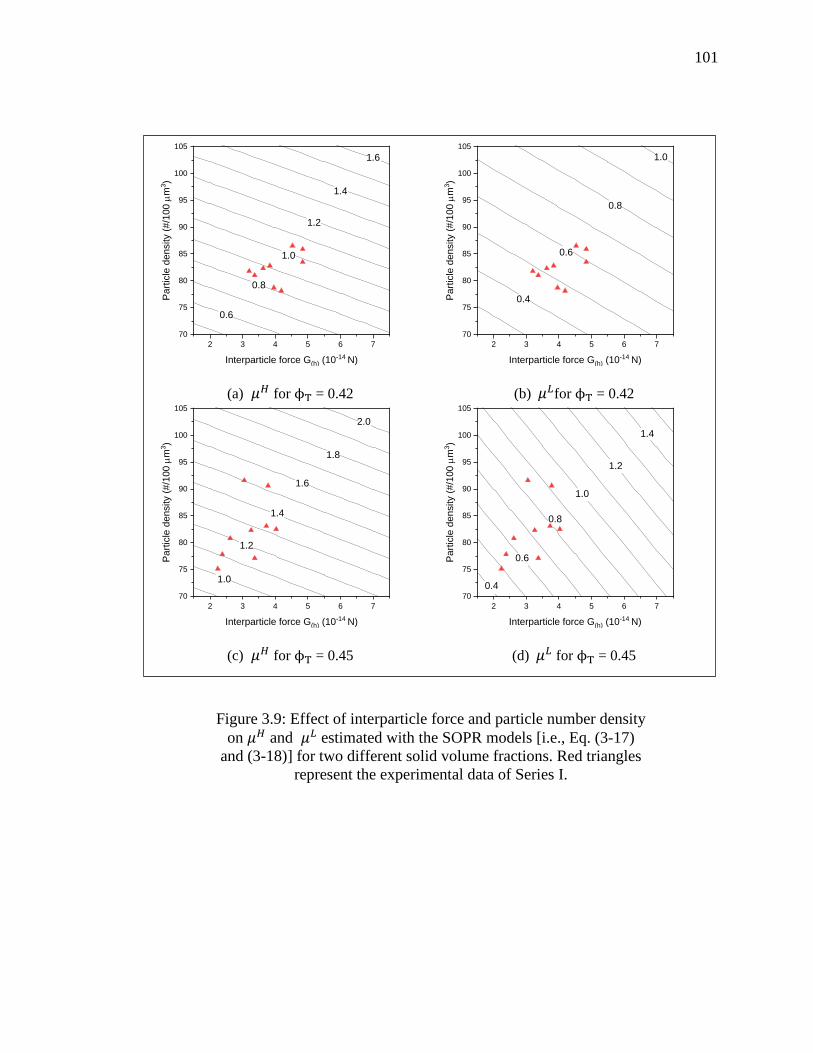
101
Figure 3.9: Effect of interparticle force and particle number density
on 𝜇𝐻 and 𝜇𝐿 estimated with the SOPR models [i.e., Eq. (3-17)
and (3-18)] for two different solid volume fractions. Red triangles
represent the experimental data of Series I.
(a) 𝜇𝐻 for ϕT = 0.42 (b) 𝜇𝐿for ϕT = 0.42
(c) 𝜇𝐻 for ϕT = 0.45 (d) 𝜇𝐿 for ϕT = 0.45
1.6
1.4
1.2
1.0
0.8
0.6
2 3 4 5 6 7
70
75
80
85
90
95
100
105
Pa
rtic
le d
en
sity (
#/1
00
mm
3)
Interparticle force G(h) (10-14 N)
1.0
0.8
0.6
0.4
2 3 4 5 6 7
70
75
80
85
90
95
100
105
Pa
rtic
le d
en
sity (
#/1
00
mm
3)
Interparticle force G(h) (10-14 N)
2.0
1.8
1.6
1.4
1.2
1.0
2 3 4 5 6 7
70
75
80
85
90
95
100
105
Pa
rtic
le d
en
sity (
#/1
00
mm
3)
Interparticle force G(h) (10-14 N)
1.4
1.2
1.0
0.8
0.6
0.4
2 3 4 5 6 7
70
75
80
85
90
95
100
105
Pa
rtic
le d
en
sity (
#/1
00
mm
3)
Interparticle force G(h) (10-14 N)
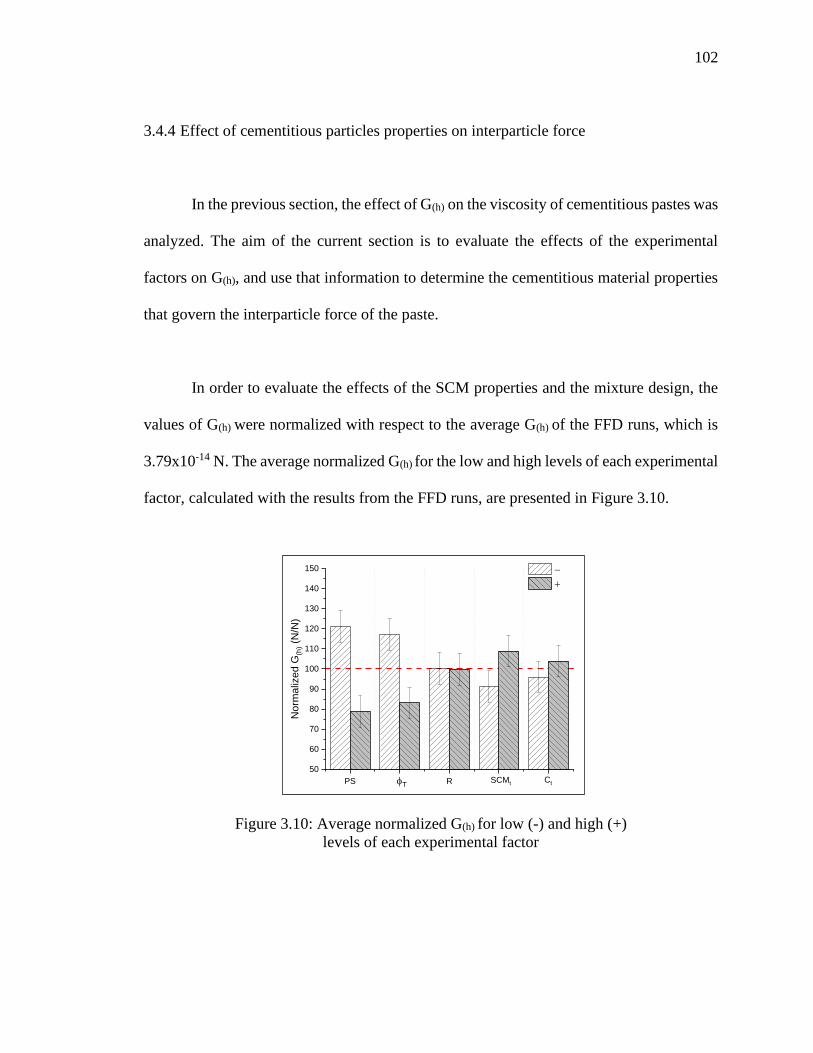
102
3.4.4 Effect of cementitious particles properties on interparticle force
In the previous section, the effect of G(h) on the viscosity of cementitious pastes was
analyzed. The aim of the current section is to evaluate the effects of the experimental
factors on G(h), and use that information to determine the cementitious material properties
that govern the interparticle force of the paste.
In order to evaluate the effects of the SCM properties and the mixture design, the
values of G(h) were normalized with respect to the average G(h) of the FFD runs, which is
3.79x10⁻¹⁴ N. The average normalized G(h) for the low and high levels of each experimental
factor, calculated with the results from the FFD runs, are presented in Figure 3.10.
Figure 3.10: Average normalized G(h) for low (-) and high (+)
levels of each experimental factor
50
60
70
80
90
100
110
120
130
140
150
Norm
aliz
ed G
(h) (N
/N)
-
+
PS fT R SCMt Ct
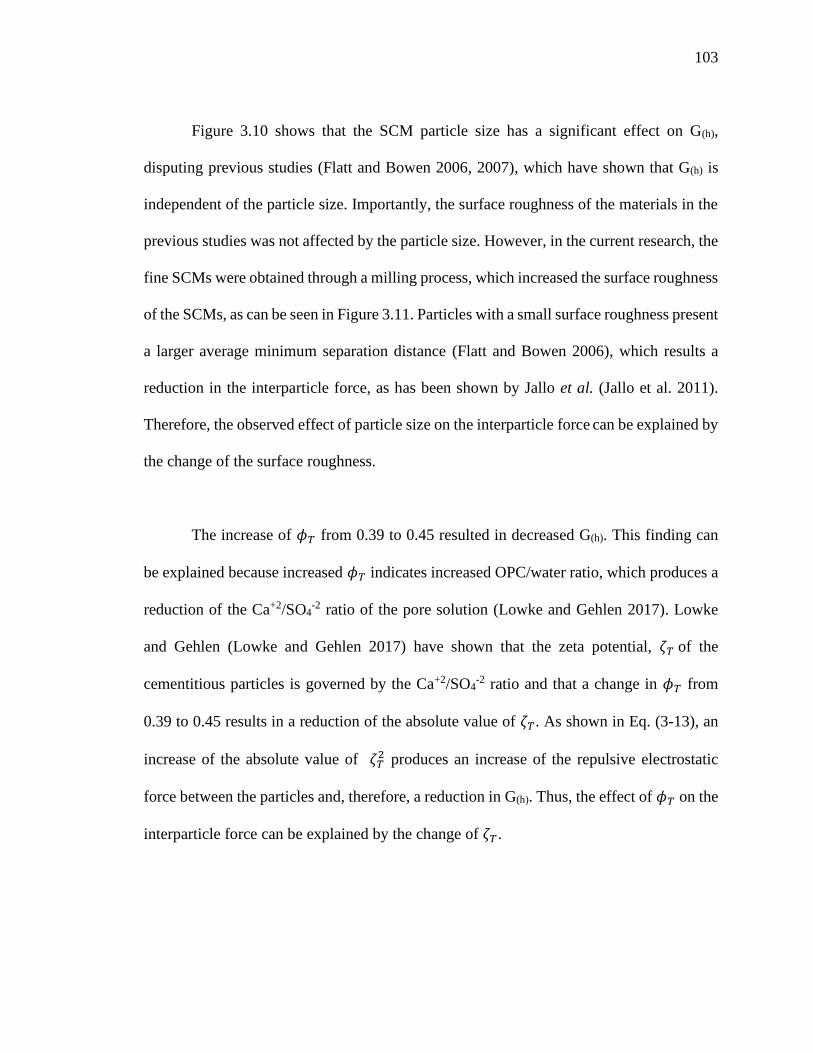
103
Figure 3.10 shows that the SCM particle size has a significant effect on G(h),
disputing previous studies (Flatt and Bowen 2006, 2007), which have shown that G(h) is
independent of the particle size. Importantly, the surface roughness of the materials in the
previous studies was not affected by the particle size. However, in the current research, the
fine SCMs were obtained through a milling process, which increased the surface roughness
of the SCMs, as can be seen in Figure 3.11. Particles with a small surface roughness present
a larger average minimum separation distance (Flatt and Bowen 2006), which results a
reduction in the interparticle force, as has been shown by Jallo et al. (Jallo et al. 2011).
Therefore, the observed effect of particle size on the interparticle force can be explained by
the change of the surface roughness.
The increase of 𝜙𝑇 from 0.39 to 0.45 resulted in decreased G(h). This finding can
be explained because increased 𝜙𝑇 indicates increased OPC/water ratio, which produces a
reduction of the Ca+2/SO4-2 ratio of the pore solution (Lowke and Gehlen 2017). Lowke
and Gehlen (Lowke and Gehlen 2017) have shown that the zeta potential, 𝜁𝑇 of the
cementitious particles is governed by the Ca+2/SO4-2 ratio and that a change in 𝜙𝑇 from
0.39 to 0.45 results in a reduction of the absolute value of 𝜁𝑇. As shown in Eq. (3-13), an
increase of the absolute value of 𝜁𝑇2 produces an increase of the repulsive electrostatic
force between the particles and, therefore, a reduction in G(h). Thus, the effect of 𝜙𝑇 on the
interparticle force can be explained by the change of 𝜁𝑇.
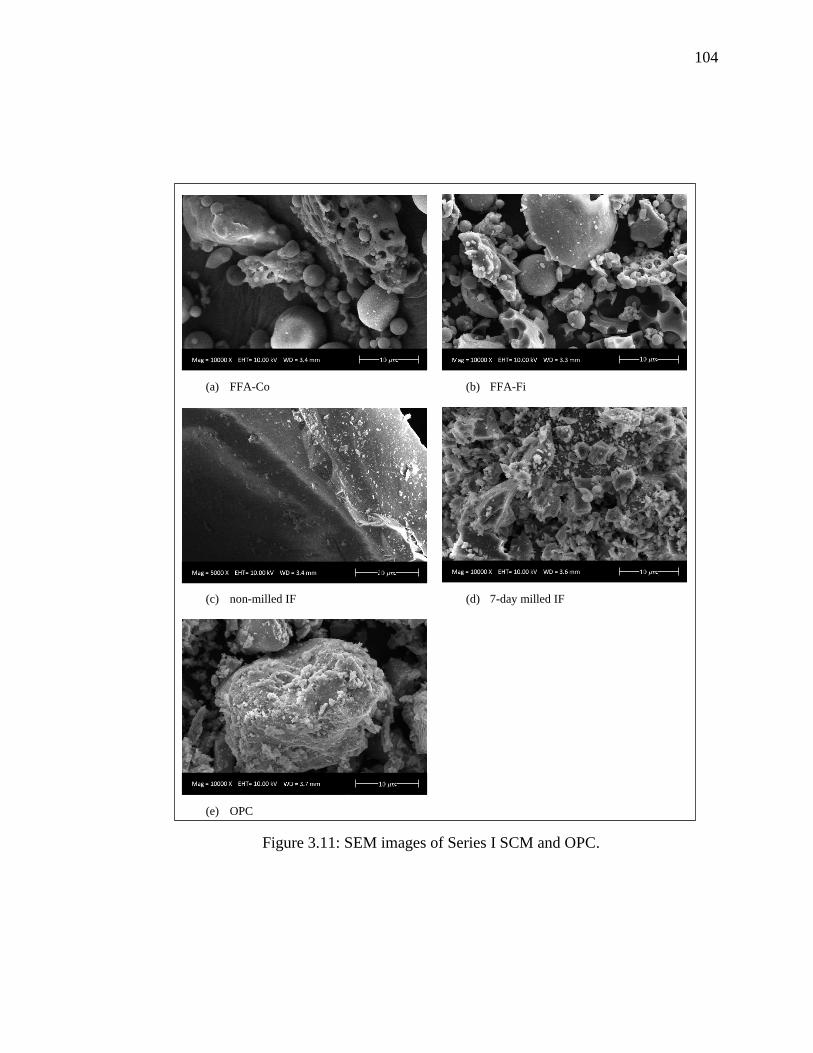
104
Figure 3.11: SEM images of Series I SCM and OPC.
(a) FFA-Co
(b) FFA-Fi
(c) non-milled IF
(d) 7-day milled IF
(e) OPC
1

105
The use of FFA instead of IF produces an increase on the average G(h). As can be
seen in Figure 3.11, the coarse IF and FFA had generally smooth surfaces and
homogeneous shapes. On the other hand, the fine IF had more irregular shapes with smooth
surfaces while the fine FFA had irregular shapes and surfaces. Figure 3.12 shows the
average normalized G(h) for the different SCMs and sizes. It can be seen that the coarse IF
and FFA had similar interparticle forces, while in contrast, the average interparticle force
of the fine FFA was considerably larger than that of the fine IF. Therefore, the effect of the
SCM type on the interparticle force can be explained by the surface roughness.
Figure 3.12: Effect of fine and coarse IF and FFA on normalized
G(h).
50
60
70
80
90
100
110
120
130
140
150
Norm
aliz
ed G
(h) (N
/N)
Fine
Coarse
IF FFA
106
Figure 3.10 shows that neither the amount of replacement nor the type of cement
used in this research had a significant effect on G(h). This can be explained because in both
cases, OPC was replaced by an SCM (i.e., FFA or IF) with a lower surface roughness (see
Figure 3.11), which resulted in two opposing effects that canceled each other out.
Specifically, on the one hand, the use of materials with lower surface roughness produced
a negative effect on G(h). While on the other hand, a higher replacement or the use of IPC
(i.e., 80% OPC + 20% IF) produced a reduction in the water/OPC ratio, which resulted in
a reduction of 𝜁𝑇, and thus, a positive effect on G(h).
In summary, based on the results presented in this study, it can be concluded that
the interparticle force of cementitious paste is governed by the surface roughness of the
cementitious materials and their w/c, which affects the zeta potential in the cementitious
paste.
3.5 Conclusions
This research investigated the effects of particle size and type of supplementary
cementitious materials (SCMs) and their interactions with the main mixture parameters on
the viscosity of cementitious paste. A fractional face centered central composite
experimental design, composed by 29 mixtures and developed with two SCMs, was used
to develop second order polynomial regression (SOPR) equation models, which were
validated with an additional 6 mixtures using three different SCMs. The study focused on
107
SCMs with similar particle size as cement. Important conclusions from the research are
listed below:
1. The effect of the particle size on the viscosity of cementitious paste is better
explained by the particle number density than by the specific surface area.
2. The SOPR models were able to predict the viscosity of cementitious pastes at
different shear rate ranges. The parameters that governed these models are the solid
volume fraction, the interparticle force, and particle number density of the
cementitious particles. The models showed good accuracy to estimate the viscosity
of mixtures produced with different SCMs, SCM-cement proportions, solid volume
fractions, and different cement types.
3. The viscosity of the cementitious paste is more affected by the solid volume
fraction, which is determined by the water-to-cementitious materials ratio, than by
the properties of the cementitious particles.
4. The interparticle force is a good predictor of the bonding strength of cementitious
particles, and the combined effect of particle number density and solid volume
fraction is a good estimator of the amount of contact points of this network, which
explains most of the observed variability in the viscosity of cementitious paste.
5. The viscosity of cementitious paste is more affected by the number of contact points
between the cementitious particles than the interparticle force between them.
6. The interparticle force is governed by the surface roughness of the cementitious
materials and the w/c, which affects the zeta potential of the cementitious paste.
108
CHAPTER 4:
MULTI-LAYER CASTING OF SELF-CONSOLIDATING CONCRETE: INFLUENCE
OF CEMENTITIOUS PASTE RHEOLOGY AND CASTING PARAMETERS ON THE
INTER-LAYER BOND STRENGTH
This chapter focuses on the effect of cementitious paste volume, structural build-
up of mortar, and their interactions with casting parameters (i.e., free fall height and delay
time) on the inter-layer bond strength of multi-layer self-consolidating concrete (SCC),
which is the third specific objective of this research. To this end, a face centered central
composite experimental design, composed of 15 experimental runs was conducted. The
measurements from these mixtures were then used to develop second order polynomial
regression (SOPR) models, which were validated based on the results from 3 additional
mixtures. The residual bond shear strength and the residual bond flexural strength were
used to characterize the inter-layer bond strength of SCC.
109
4.1 Introduction
According to a report by the Mckinsey Global Institute (McKinsey Global Institute
2017), the global labor-productivity growth in construction lags far behind that of other
manufacturing fields or the total economy. The main reason of the relatively low
productivity in the construction industry is the continued dependency on traditional
construction systems, which are highly labor demanding (Finger et al. 2015; Proverbs et
al. 1999). In the last several decades, new technologies that can improve the productivity
of concrete construction through better workability (i.e., rheology) control (Khayat and
Feys 2010; Navarrete et al. 2017a; Wangler et al. 2016), such as self-consolidating concrete
(SCC) and 3D concrete printing, have been developed.
The rheological behavior of yield stress fluids, such as cement-based materials
(CBMs) (Jiao et al. 2017), can be defined by two parameters: yield stress and viscosity
(Balmforth et al. 2013). CBMs show static (𝜏0𝑠) and dynamic (𝜏0
𝑑) yield stress (Malvern
Instruments 2012), which are the shear stress required to initiate flow and the minimum
shear stress required for maintaining the flow once initiated, respectively.
Within a few minutes at rest after mixing with water, the cementitious particles
form a three-dimensional network due to Van der Walls attractive forces and dielectric
repulsive forces (Ferron et al. 2013; Yim et al. 2013). In addition, C-S-H bridges form and
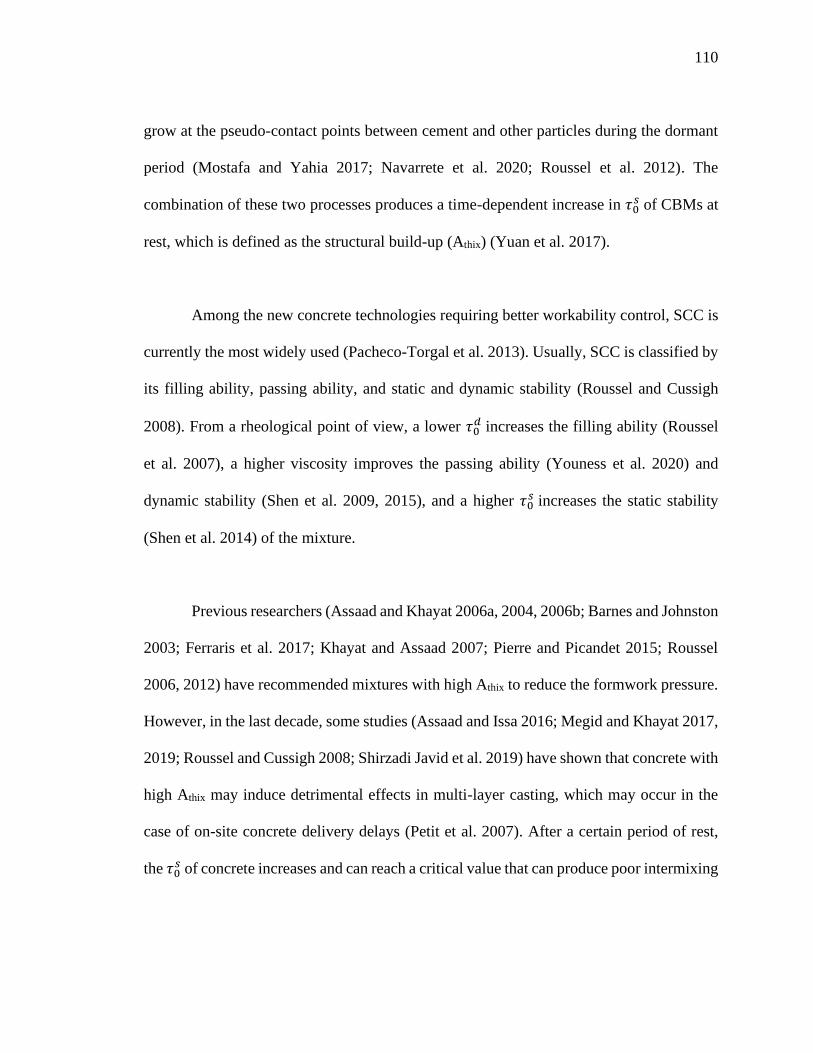
110
grow at the pseudo-contact points between cement and other particles during the dormant
period (Mostafa and Yahia 2017; Navarrete et al. 2020; Roussel et al. 2012). The
combination of these two processes produces a time-dependent increase in 𝜏0𝑠 of CBMs at
rest, which is defined as the structural build-up (Athix) (Yuan et al. 2017).
Among the new concrete technologies requiring better workability control, SCC is
currently the most widely used (Pacheco-Torgal et al. 2013). Usually, SCC is classified by
its filling ability, passing ability, and static and dynamic stability (Roussel and Cussigh
2008). From a rheological point of view, a lower 𝜏0𝑑 increases the filling ability (Roussel
et al. 2007), a higher viscosity improves the passing ability (Youness et al. 2020) and
dynamic stability (Shen et al. 2009, 2015), and a higher 𝜏0𝑠 increases the static stability
(Shen et al. 2014) of the mixture.
Previous researchers (Assaad and Khayat 2006a, 2004, 2006b; Barnes and Johnston
2003; Ferraris et al. 2017; Khayat and Assaad 2007; Pierre and Picandet 2015; Roussel
2006, 2012) have recommended mixtures with high Athix to reduce the formwork pressure.
However, in the last decade, some studies (Assaad and Issa 2016; Megid and Khayat 2017,
2019; Roussel and Cussigh 2008; Shirzadi Javid et al. 2019) have shown that concrete with
high Athix may induce detrimental effects in multi-layer casting, which may occur in the
case of on-site concrete delivery delays (Petit et al. 2007). After a certain period of rest,
the 𝜏0𝑠 of concrete increases and can reach a critical value that can produce poor intermixing
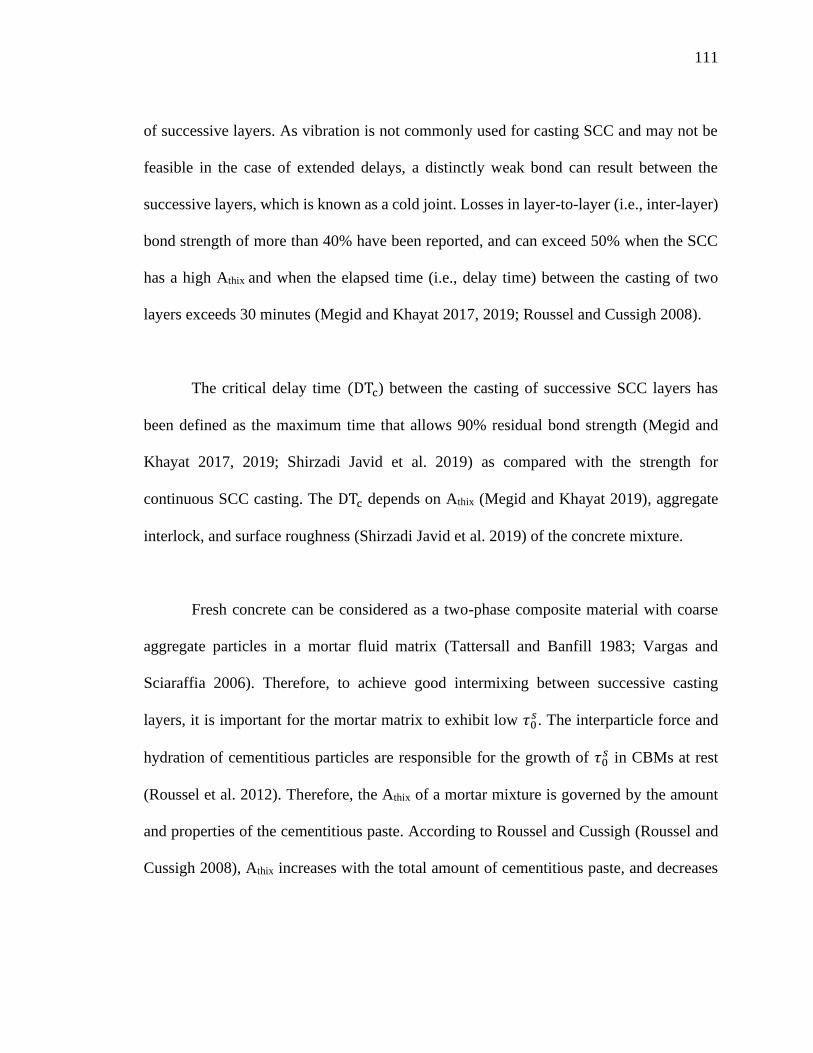
111
of successive layers. As vibration is not commonly used for casting SCC and may not be
feasible in the case of extended delays, a distinctly weak bond can result between the
successive layers, which is known as a cold joint. Losses in layer-to-layer (i.e., inter-layer)
bond strength of more than 40% have been reported, and can exceed 50% when the SCC
has a high Athix and when the elapsed time (i.e., delay time) between the casting of two
layers exceeds 30 minutes (Megid and Khayat 2017, 2019; Roussel and Cussigh 2008).
The critical delay time (DTc) between the casting of successive SCC layers has
been defined as the maximum time that allows 90% residual bond strength (Megid and
Khayat 2017, 2019; Shirzadi Javid et al. 2019) as compared with the strength for
continuous SCC casting. The DTc depends on Athix (Megid and Khayat 2019), aggregate
interlock, and surface roughness (Shirzadi Javid et al. 2019) of the concrete mixture.
Fresh concrete can be considered as a two-phase composite material with coarse
aggregate particles in a mortar fluid matrix (Tattersall and Banfill 1983; Vargas and
Sciaraffia 2006). Therefore, to achieve good intermixing between successive casting
layers, it is important for the mortar matrix to exhibit low 𝜏0𝑠. The interparticle force and
hydration of cementitious particles are responsible for the growth of 𝜏0𝑠 in CBMs at rest
(Roussel et al. 2012). Therefore, the Athix of a mortar mixture is governed by the amount
and properties of the cementitious paste. According to Roussel and Cussigh (Roussel and
Cussigh 2008), Athix increases with the total amount of cementitious paste, and decreases
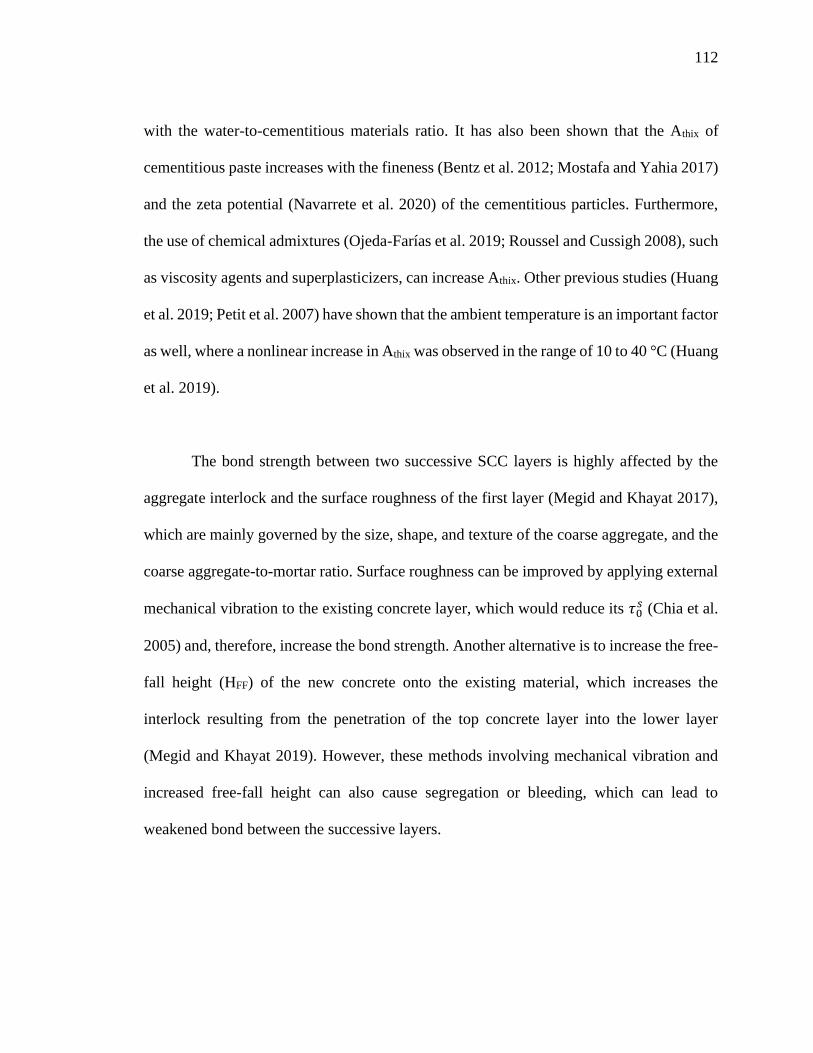
112
with the water-to-cementitious materials ratio. It has also been shown that the Athix of
cementitious paste increases with the fineness (Bentz et al. 2012; Mostafa and Yahia 2017)
and the zeta potential (Navarrete et al. 2020) of the cementitious particles. Furthermore,
the use of chemical admixtures (Ojeda-Farías et al. 2019; Roussel and Cussigh 2008), such
as viscosity agents and superplasticizers, can increase Athix. Other previous studies (Huang
et al. 2019; Petit et al. 2007) have shown that the ambient temperature is an important factor
as well, where a nonlinear increase in Athix was observed in the range of 10 to 40 °C (Huang
et al. 2019).
The bond strength between two successive SCC layers is highly affected by the
aggregate interlock and the surface roughness of the first layer (Megid and Khayat 2017),
which are mainly governed by the size, shape, and texture of the coarse aggregate, and the
coarse aggregate-to-mortar ratio. Surface roughness can be improved by applying external
mechanical vibration to the existing concrete layer, which would reduce its 𝜏0𝑠 (Chia et al.
2005) and, therefore, increase the bond strength. Another alternative is to increase the free-
fall height (HFF) of the new concrete onto the existing material, which increases the
interlock resulting from the penetration of the top concrete layer into the lower layer
(Megid and Khayat 2019). However, these methods involving mechanical vibration and
increased free-fall height can also cause segregation or bleeding, which can lead to
weakened bond between the successive layers.
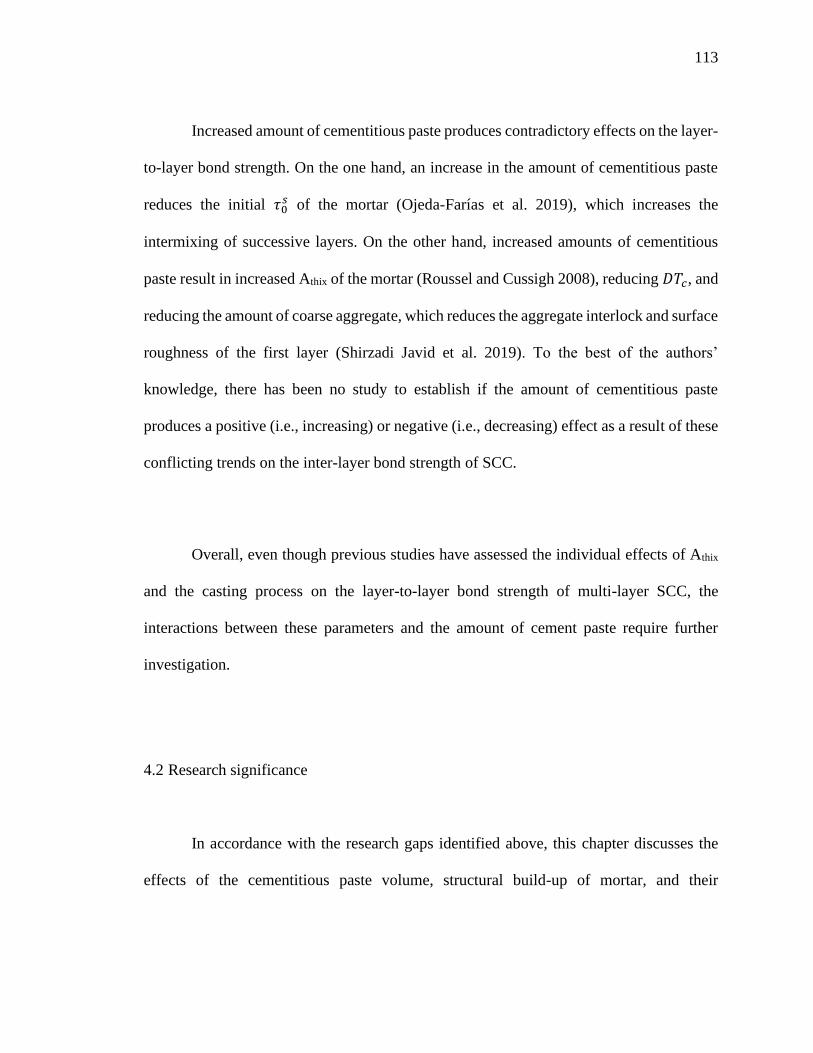
113
Increased amount of cementitious paste produces contradictory effects on the layer-
to-layer bond strength. On the one hand, an increase in the amount of cementitious paste
reduces the initial 𝜏0𝑠 of the mortar (Ojeda-Farías et al. 2019), which increases the
intermixing of successive layers. On the other hand, increased amounts of cementitious
paste result in increased Athix of the mortar (Roussel and Cussigh 2008), reducing 𝐷𝑇𝑐, and
reducing the amount of coarse aggregate, which reduces the aggregate interlock and surface
roughness of the first layer (Shirzadi Javid et al. 2019). To the best of the authors’
knowledge, there has been no study to establish if the amount of cementitious paste
produces a positive (i.e., increasing) or negative (i.e., decreasing) effect as a result of these
conflicting trends on the inter-layer bond strength of SCC.
Overall, even though previous studies have assessed the individual effects of Athix
and the casting process on the layer-to-layer bond strength of multi-layer SCC, the
interactions between these parameters and the amount of cement paste require further
investigation.
4.2 Research significance
In accordance with the research gaps identified above, this chapter discusses the
effects of the cementitious paste volume, structural build-up of mortar, and their
114
interactions with the casting process (i.e., free fall height and delay time) on the residual
bond strength of multi-layer SCC under shear and flexural stresses. In addition, the effect
of cementitious paste volume, structural build-up of mortar, and their interaction with the
free fall height on the critical delay time is analyzed. The results presented in the chapter
can contribute to enhance the mix design and construction of SCC.
4.3 Materials and methods
4.3.1 Experimental design
The effects of cementitious paste volume, structural build-up of mortar, and their
interactions with the main casting process parameters on the residual inter-layer bond
strength of SCC were experimentally determined using a face-centered central composite
design (FCCCD). The FCCCD is based on an embedded factorial design for the controlled
variation of the experimental factors; with a center point augmented by a group of axial
points, which allow quantification of curvature in the measured trends (NIST/SEMATECH
2012). The axial points are at the center of each face of the factorial space and, therefore,
three levels (i.e., -, 0, +) are required in selecting the values for each experimental factor
(parameter), as shown in Figure 4.1. The FCCCD permits modeling of the measured
response by a second order polynomial regression (SOPR) equation, and therefore,

115
estimation of the main, quadratic, and interactive effects of the experimental factors on the
property under study (Montgomery and Runger 2014).
Figure 4.1: Face-centered central composite design. The experimental runs of the
factorial design, axial points and center point are represented by black, grey, and white
dots, respectively.
Table 4.1 shows the three selected levels for the following experimental factors
investigated in this study: (1) structural build-up of mortar (Athixm ); (2) cementitious paste
volume fraction (CP%vol); and (3) free fall height (HFF). Considering these experimental
factors, a FCCCD composed by a 23 factorial design with a center point, and 2*3 axial
points was developed, resulting in 15 experimental runs (i.e., Series I) as shown in Table
2. Three additional runs (i.e., Series II) were also produced to independently validate the
SOPR models developed using the measured data from Series I.
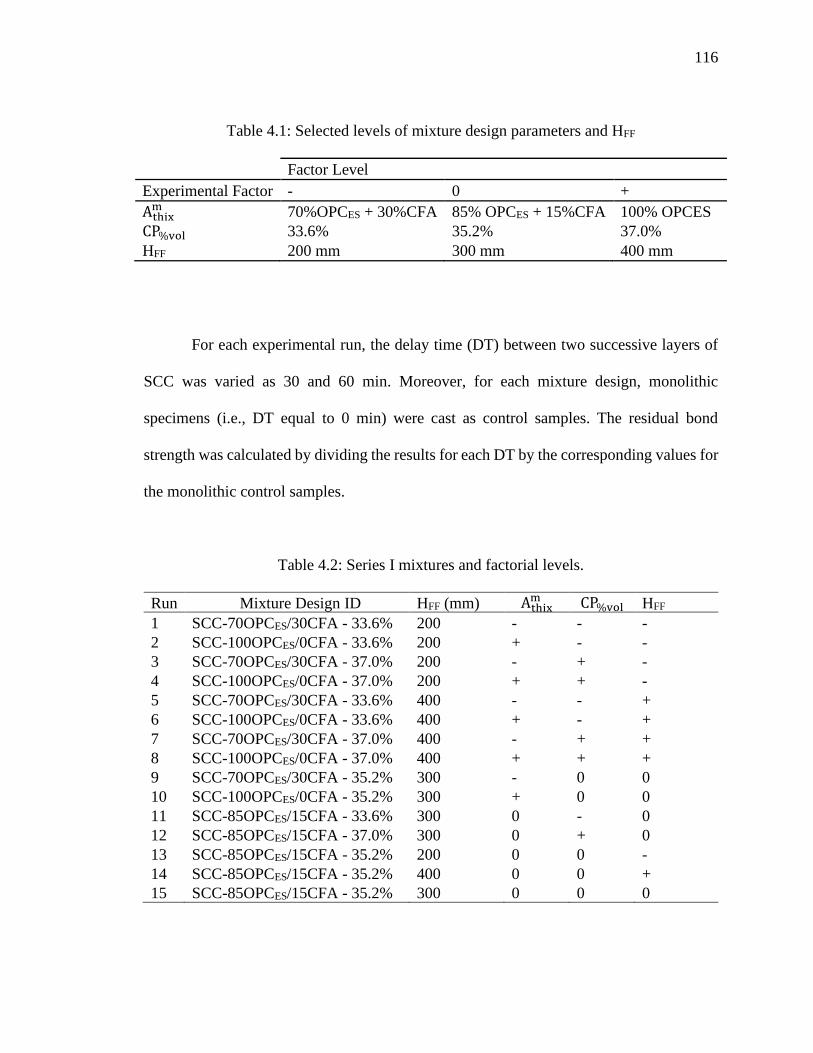
116
Table 4.1: Selected levels of mixture design parameters and HFF
Factor Level
Experimental Factor - 0 +
Athixm 70%OPCES + 30%CFA 85% OPCES + 15%CFA 100% OPCES
CP%vol 33.6% 35.2% 37.0%
HFF 200 mm 300 mm 400 mm
For each experimental run, the delay time (DT) between two successive layers of
SCC was varied as 30 and 60 min. Moreover, for each mixture design, monolithic
specimens (i.e., DT equal to 0 min) were cast as control samples. The residual bond
strength was calculated by dividing the results for each DT by the corresponding values for
the monolithic control samples.
Table 4.2: Series I mixtures and factorial levels.
Run Mixture Design ID HFF (mm) Athixm CP%vol HFF
1 SCC-70OPCES/30CFA - 33.6% 200 - - -
2 SCC-100OPCES/0CFA - 33.6% 200 + - -
3 SCC-70OPCES/30CFA - 37.0% 200 - + -
4 SCC-100OPCES/0CFA - 37.0% 200 + + -
5 SCC-70OPCES/30CFA - 33.6% 400 - - +
6 SCC-100OPCES/0CFA - 33.6% 400 + - +
7 SCC-70OPCES/30CFA - 37.0% 400 - + +
8 SCC-100OPCES/0CFA - 37.0% 400 + + +
9 SCC-70OPCES/30CFA - 35.2% 300 - 0 0
10 SCC-100OPCES/0CFA - 35.2% 300 + 0 0
11 SCC-85OPCES/15CFA - 33.6% 300 0 - 0
12 SCC-85OPCES/15CFA - 37.0% 300 0 + 0
13 SCC-85OPCES/15CFA - 35.2% 200 0 0 -
14 SCC-85OPCES/15CFA - 35.2% 400 0 0 +
15 SCC-85OPCES/15CFA - 35.2% 300 0 0 0
117
A type III high-early-strength Portland cement (OPCES), with 90% of the particles
below 25 μm, was used to develop the Series I and Series II mixtures, because finer cements
(i.e., OPCES) produce mixtures with higher Athixm (Mostafa and Yahia 2017). In addition,
class C fly ash (CFA) and blast furnace slag (BFS) were used as supplementary
cementitious materials (SCMs) in the development of the Series I and Series II mixtures,
respectively. The use of different amounts of CFA and BFS to replace OPCES allowed the
study to vary Athixm and decouple its effect from that of CP%vol.
SOPR models and backward elimination algorithm (Montgomery and Runger
2014) were conducted with the 15 runs of Series I to establish the effects of each
experimental parameter on the residual bond strength of multi-layer SCC and develop
SOPR models. These models were then validated using the results from the Series II
mixtures and the methodology proposed by Snee (Snee 1977), by comparing the deviation
between the experimental and predicted results of the Series II runs with the confidence
interval of each SOPR model.
4.3.2 Mixture proportions and mixing sequences
Cementitious pastes, mortars, and SCC mixtures were mixed and characterized
with respect to their fresh properties, as shown in Figure 4.2. The design of the cementitious
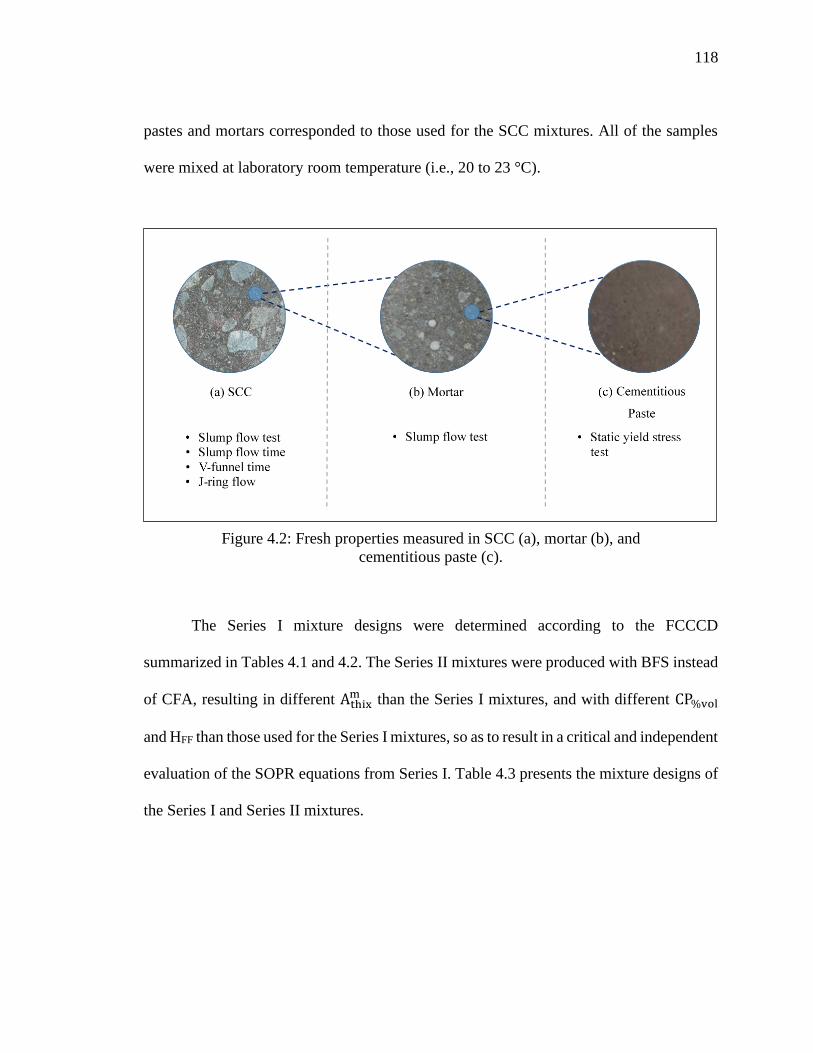
118
pastes and mortars corresponded to those used for the SCC mixtures. All of the samples
were mixed at laboratory room temperature (i.e., 20 to 23 °C).
Figure 4.2: Fresh properties measured in SCC (a), mortar (b), and
cementitious paste (c).
The Series I mixture designs were determined according to the FCCCD
summarized in Tables 4.1 and 4.2. The Series II mixtures were produced with BFS instead
of CFA, resulting in different Athixm than the Series I mixtures, and with different CP%vol
and HFF than those used for the Series I mixtures, so as to result in a critical and independent
evaluation of the SOPR equations from Series I. Table 4.3 presents the mixture designs of
the Series I and Series II mixtures.
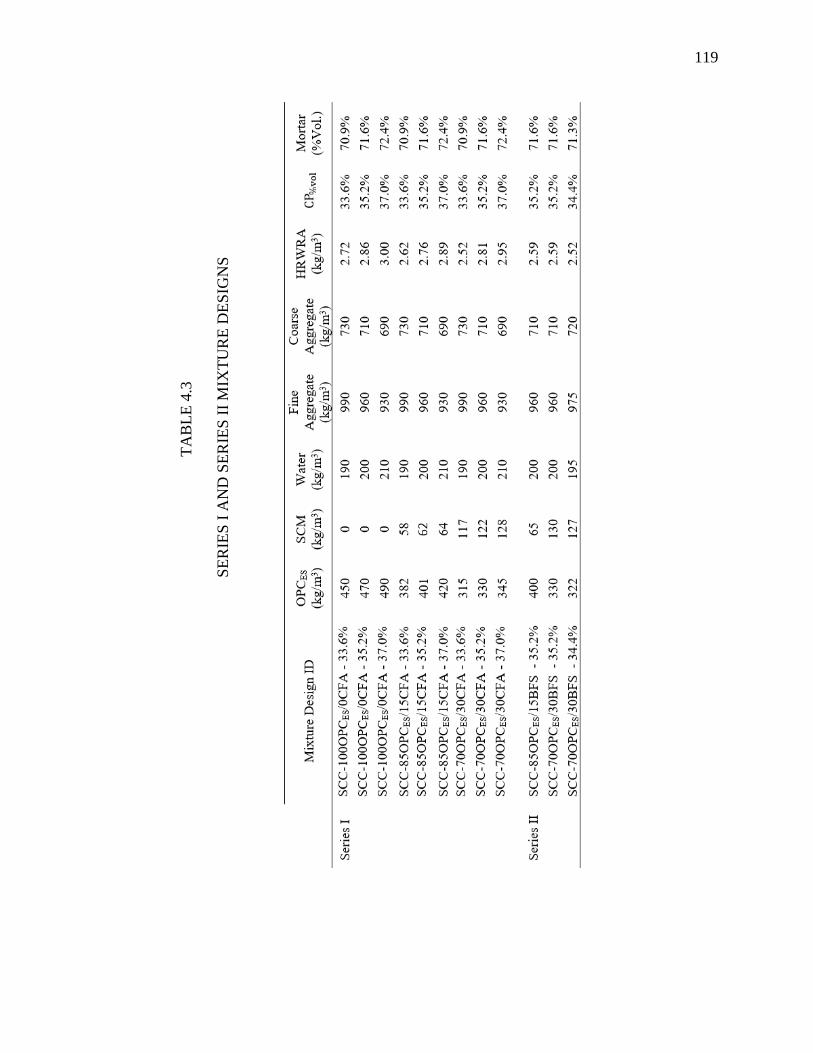
119
TA
BL
E 4
.3
SE
RIE
S I
AN
D S
ER
IES
II
MIX
TU
RE
DE
SIG
NS
120
The coarse-to-fine aggregate ratio and the water-to-cementitious materials ratio by
mass were kept constant at 0.72 and 0.40, respectively, in all of the SCC mixtures. In
addition, between 33% and 38% of cementitious paste was used in all mixtures, which is a
common range for SCC (ACI Committee 238 2008; Saleh Ahari et al. 2015).
A high-range water reducer admixture (HRWRA) with a specific gravity of 1.08
was used in a dosage of 0.60% by cement weight for the mixtures without SCMs (i.e.,
SCC-100OPCES/0CFA-33.0%, SCC-100OPCES/0CFA-35.5%, and SCC-OPCES/0CFA-
38.0%). In the mixtures with SCM as partial replacement of OPCES, the HRWRA dosage
was adjusted to obtain the same initial slump flow (S. flow0) as the mixtures without SCMs
for the different values of CP%vol.
A crushed limestone aggregate with nominal maximum size of 12.7 mm and a
natural river sand were used as coarse and fine aggregates, respectively. The particle size
distributions (PSD) of both aggregates were within ASTM C33/C33M - 18
recommendations. The coarse and fine aggregates had fineness modulus of 6.0 and 2.5,
specific gravities of 2.69 and 2.64 at the saturated surface dry condition, and water
absorption of 2.11% and 1.35%, respectively.
The SCC mixtures were all prepared using the same procedure with a pan mixer.
The fine and coarse aggregates were first mixed for 2 minutes, then the cementitious
121
materials were added and mixed for 3 minutes, and finally water and HRWRA were added
and mixed for 5 more minutes.
The mortar samples were all prepared using a planetary mixer. The cementitious
materials and fine aggregate were first mixed for 3 minutes, and then mixed for 5 more
minutes after water and HRWRA were added.
The cementitious pastes were all prepared using an electric stirrer at a constant
blade speed of 1100 rpm. The cementitious materials were first blended for 5 minutes to
homogenize and eliminate any clumps, and then stirred for 2 more minutes after water was
added.
4.3.3 Characterization of cementitious materials
The OPCES used in all the mixtures was in compliance with ASTM C150/C150M
– 19a. Table 4.4 shows the specific gravity and oxide composition, determined by X-ray
fluorescence (XRF), of the cementitious materials.
The microstructure of the cementitious materials was detected using a scanning
electron microscope (SEM), which provided surface information of the studied materials.
The images were taken using a Quanta 250 microscope with an accelerating voltage of
20kV and magnifications between 300x and 1,000,000x. All of the samples were oven
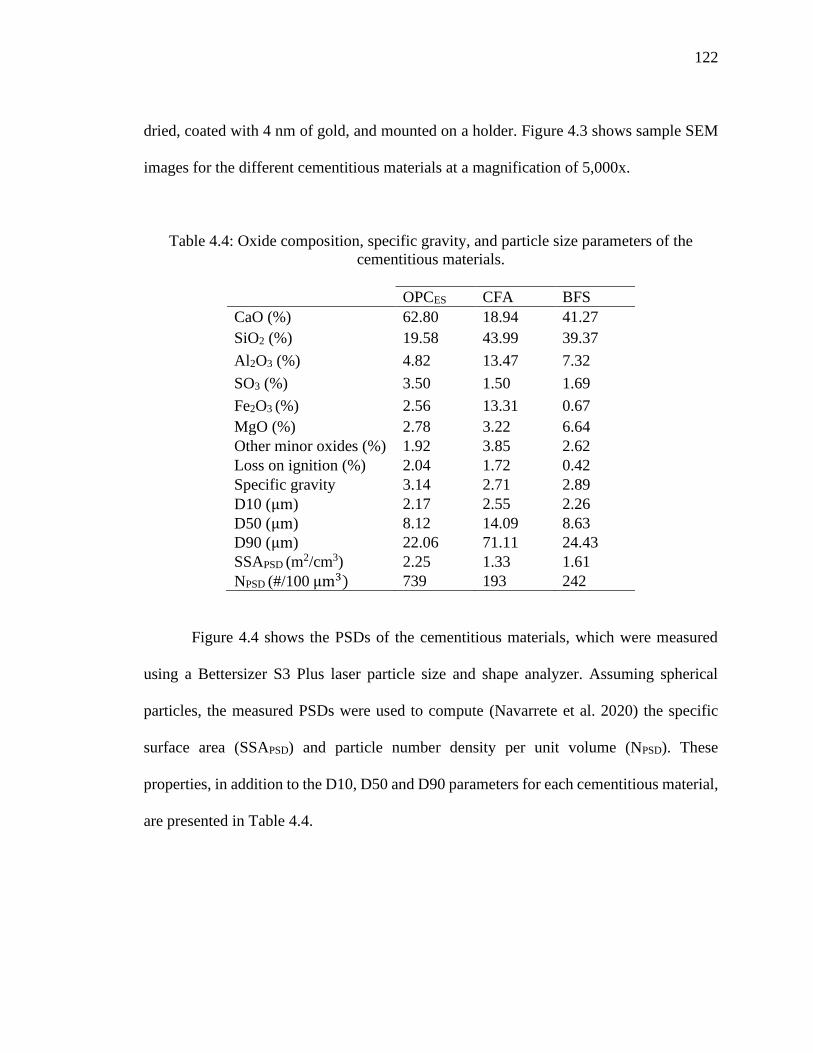
122
dried, coated with 4 nm of gold, and mounted on a holder. Figure 4.3 shows sample SEM
images for the different cementitious materials at a magnification of 5,000x.
Table 4.4: Oxide composition, specific gravity, and particle size parameters of the
cementitious materials.
OPCES CFA BFS
CaO (%) 62.80 18.94 41.27
SiO2 (%) 19.58 43.99 39.37
Al2O3 (%) 4.82 13.47 7.32
SO3 (%) 3.50 1.50 1.69
Fe2O3 (%) 2.56 13.31 0.67
MgO (%) 2.78 3.22 6.64
Other minor oxides (%) 1.92 3.85 2.62
Loss on ignition (%) 2.04 1.72 0.42
Specific gravity 3.14 2.71 2.89
D10 (μm) 2.17 2.55 2.26
D50 (μm) 8.12 14.09 8.63
D90 (μm) 22.06 71.11 24.43
SSAPSD (m2/cm3) 2.25 1.33 1.61
NPSD (#/100 μm3) 739 193 242
Figure 4.4 shows the PSDs of the cementitious materials, which were measured
using a Bettersizer S3 Plus laser particle size and shape analyzer. Assuming spherical
particles, the measured PSDs were used to compute (Navarrete et al. 2020) the specific
surface area (SSAPSD) and particle number density per unit volume (NPSD). These
properties, in addition to the D10, D50 and D90 parameters for each cementitious material,
are presented in Table 4.4.
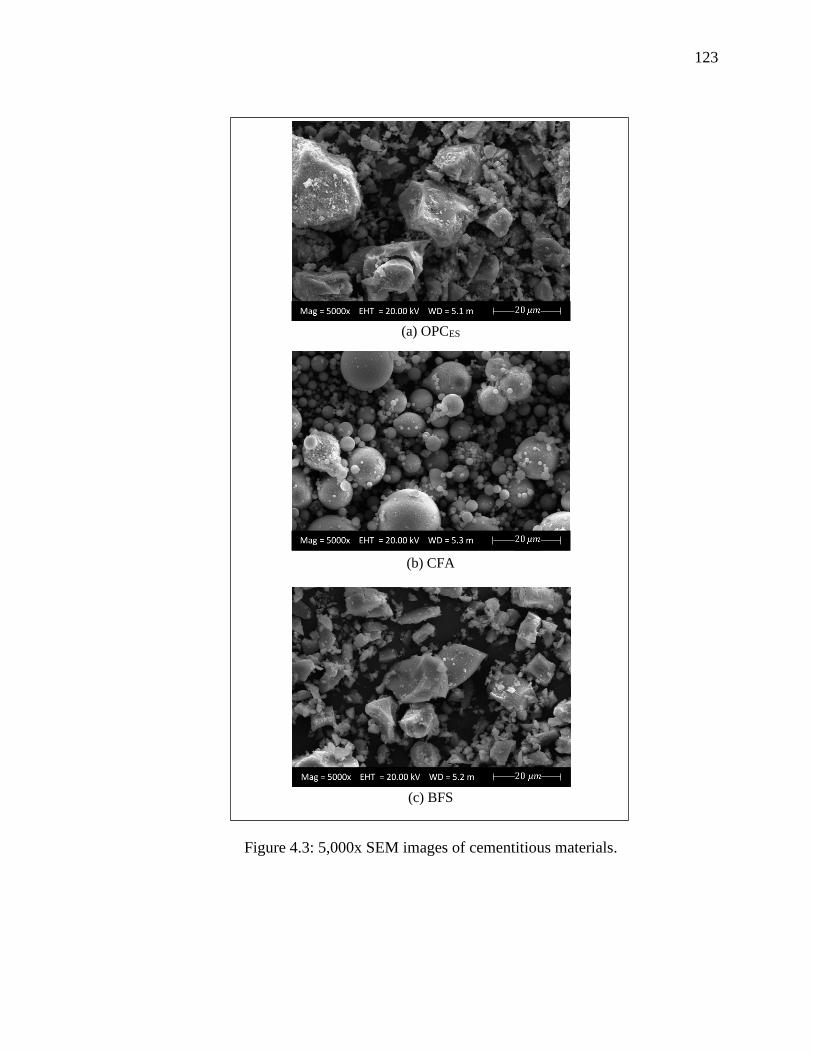
123
Figure 4.3: 5,000x SEM images of cementitious materials.
(a) OPCES
(b) CFA
(c) BFS
1
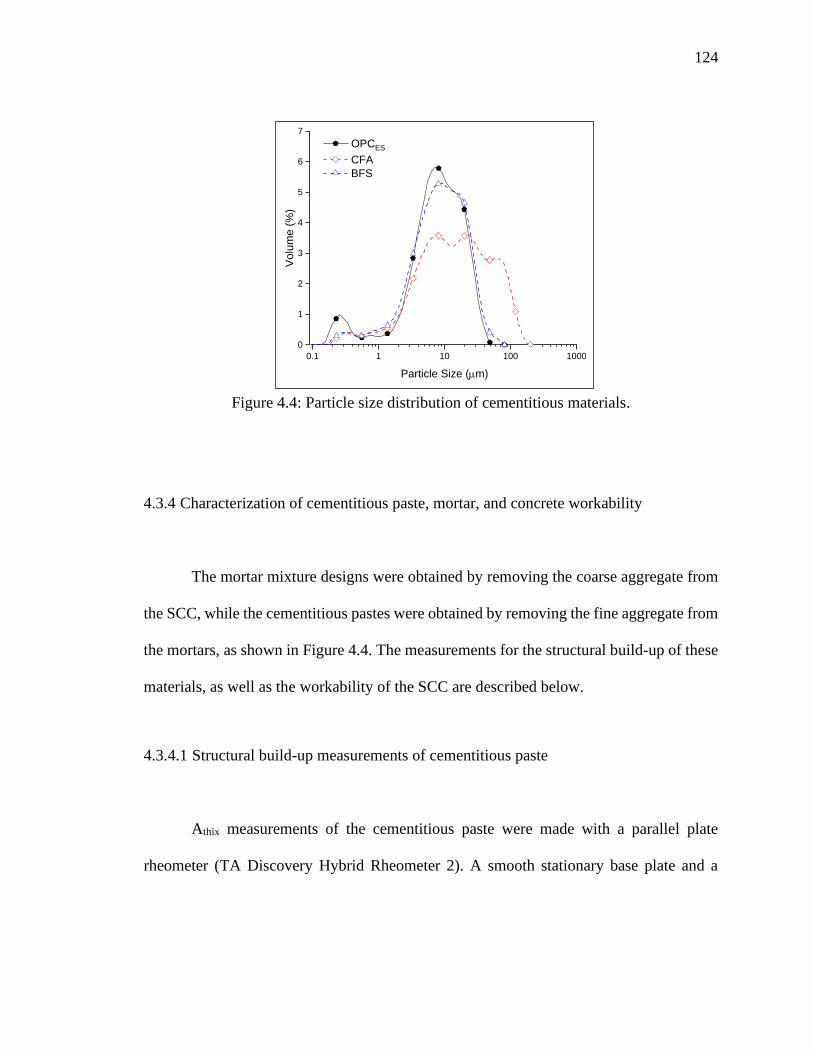
124
Figure 4.4: Particle size distribution of cementitious materials.
4.3.4 Characterization of cementitious paste, mortar, and concrete workability
The mortar mixture designs were obtained by removing the coarse aggregate from
the SCC, while the cementitious pastes were obtained by removing the fine aggregate from
the mortars, as shown in Figure 4.4. The measurements for the structural build-up of these
materials, as well as the workability of the SCC are described below.
4.3.4.1 Structural build-up measurements of cementitious paste
Athix measurements of the cementitious paste were made with a parallel plate
rheometer (TA Discovery Hybrid Rheometer 2). A smooth stationary base plate and a
0.1 1 10 100 1000
0
1
2
3
4
5
6
7
Vo
lum
e (
%)
Particle Size (mm)
OPCES
CFA
BFS
125
cross-hatched superior plate with a diameter of 25 mm were used. The gap between the
plates was fixed at 1000 𝜇m, as shown to be adequate by previous researchers (Ferraris et
al. 2001b; a; Navarrete et al. 2020), to compare the different cementitious pastes. Each
sample was protected from excess evaporation using a chamber with an absorbent sponge
soaked with water around it (Navarrete et al. 2020; Sant et al. 2008). At 13 min after the
addition of water, the cementitious paste was pre-sheared for 60 s. At 15 min, the static
yield stress, 𝜏0𝑠 was measured and the measurements were repeated every 15 min until 75
min to determine the Athix of each cementitious paste. More information on the test protocol
can be found in a previous chapter by the authors (Navarrete et al. 2020).
4.3.4.2 Structural build-up measurements of mortar
The growth of 𝜏0𝑠 for mortar (i.e., Athix
m ) can be evaluated using rheometric
measurements as described above for the cement paste, or by standard workability tests
(Bouvet et al. 2010b; Khayat et al. 2012; Megid and Khayat 2019). In this research, the
Athixm of mortar was characterized through the change in slump flow of undisturbed samples
with time of rest (Rs,flow). This method was preferred as a workability test commonly used
in the field, instead of rheological testing methods.
126
The mortar slump flow tests were performed using a mini slump cone, at ½ length
scale of the standard slump cone (ASTM C1611/C1611M - 18). The initial slump flow
(S.flow0) was measured 15 min after the contact of cement and water (i.e., 0 min of rest).
The test was repeated after 30 and 60 min of rest (45 and 75 min of age), and the results
were used to determine the filling ability index of each mortar mixture (FAIm) based on
Eq. (4-1). Previous researchers (Megid and Khayat 2017, 2019) have shown that the layer-
to-layer bond strength is strongly correlated with the filling ability index of SCC.
FAIm = S. flow0 ∗ Rs,flow (4-1)
4.3.4.3 Workability measurements of SCC
The initial workability of each SCC mixture was characterized using common field
workability tests so as to establish their characteristics within the ranges of workability
reported in the literature. The standard slump flow test (ASTM C1611/C1611M - 18) was
used to characterize the filling ability, the slump flow time, T50 (ASTM C1611/C1611M
- 18) and v-funnel time (EN12350-9) were measured to estimate the viscosity, and the J-
ring flow (ASTM C1621/C1621M - 17) was measured to quantify the passing ability. All
these measurements were performed 15 min (0 min of rest) after the initial contact of
cement and water.
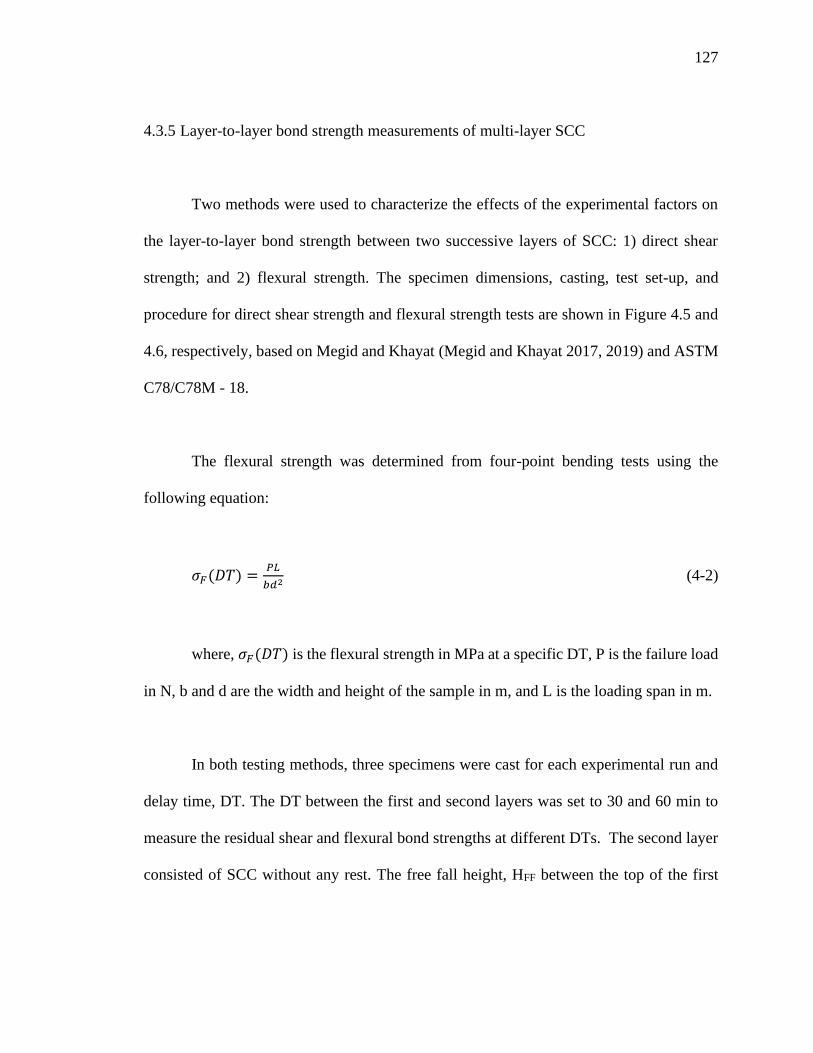
127
4.3.5 Layer-to-layer bond strength measurements of multi-layer SCC
Two methods were used to characterize the effects of the experimental factors on
the layer-to-layer bond strength between two successive layers of SCC: 1) direct shear
strength; and 2) flexural strength. The specimen dimensions, casting, test set-up, and
procedure for direct shear strength and flexural strength tests are shown in Figure 4.5 and
4.6, respectively, based on Megid and Khayat (Megid and Khayat 2017, 2019) and ASTM
C78/C78M - 18.
The flexural strength was determined from four-point bending tests using the
following equation:
𝜎𝐹(𝐷𝑇) =𝑃𝐿
𝑏𝑑2 (4-2)
where, 𝜎𝐹(𝐷𝑇) is the flexural strength in MPa at a specific DT, P is the failure load
in N, b and d are the width and height of the sample in m, and L is the loading span in m.
In both testing methods, three specimens were cast for each experimental run and
delay time, DT. The DT between the first and second layers was set to 30 and 60 min to
measure the residual shear and flexural bond strengths at different DTs. The second layer
consisted of SCC without any rest. The free fall height, HFF between the top of the first

128
layer and the release point of the second layer SCC was varied between 200 and 400 mm.
Another three specimens per testing condition were cast monolithically (i.e., single layer
casting) to provide reference control samples for the residual shear and flexural bond
strengths, RBDSh and RBF, respectively. The reduction in these residual bond strengths with
time was used to determine the critical delay time, DTc of each experimental run.
All of the specimens were demolded at the age of 1 day, wrapped in plastic sheeting
to prevent moisture loss, and stored for 28 days prior to the direct shear and flexural tests.
In each test, the load was continuously applied at a loading rate of 0.15 MPa/s without
shock until failure using a hydraulically operated testing machine.
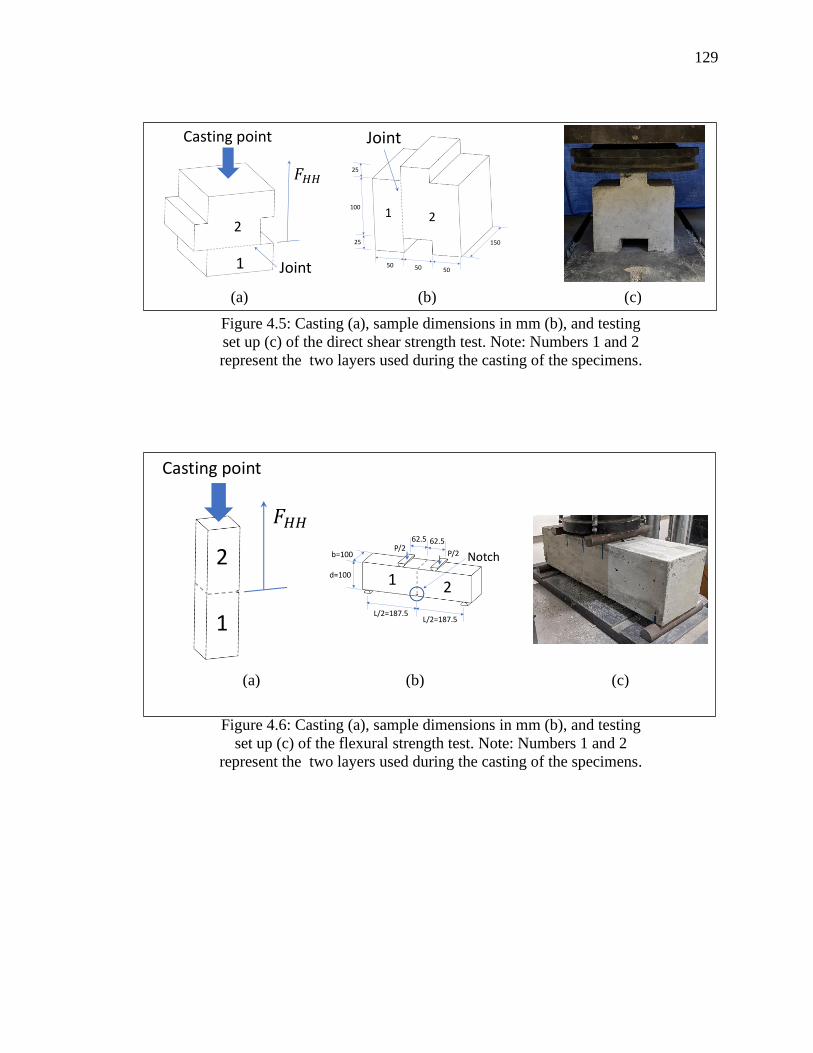
129
(a) (b) (c)
Figure 4.5: Casting (a), sample dimensions in mm (b), and testing
set up (c) of the direct shear strength test. Note: Numbers 1 and 2
represent the two layers used during the casting of the specimens.
(a) (b) (c)
Figure 4.6: Casting (a), sample dimensions in mm (b), and testing
set up (c) of the flexural strength test. Note: Numbers 1 and 2
represent the two layers used during the casting of the specimens.
1
2
Casting point
Joint
25
25
100
50 50 50
150
1 2
Joint
1
2
Casting point
L/2=187.5
62.5 62.5
1 2d=100
b=100 NotchP/2
P/2
L/2=187.5
130
4.4 Results and discussion
4.4.1 Fresh properties of SCC
Table 4.5 summarizes the common field initial workability test results for the Series
I and Series II SCC mixtures immediately after mixing. The slump flow ranged between
660 and 810 mm, which is within the range of initial slump flow to achieve the required
filling ability of SCC (ACI Committee 238 2008; EFNARC 2005). According to European
guidelines (EFNARC 2005), SCC mixtures with a slump flow in this range are suitable for
many normal construction applications, such as walls and columns.
The slump flow time, T50 of all the mixtures ranged between 1.2 and 2.0 s. In
addition, the v-funnel time ranged between 4.2 and 7.0 s. Considering these results and the
European guidelines for SCC (EFNARC 2005), the tested mixtures would provide good
filling ability even when used in the construction of structural members with congested
reinforcement.
The difference between the slump flow and J-ring flow of each mixture was below
50 mm, with most of the differences below 25 mm. According to ASTM C1621/C1621M-
17, these results indicate that minimal or no visible blocking of the mixture would occur,
again demonstrating that the tested materials have good passing ability.
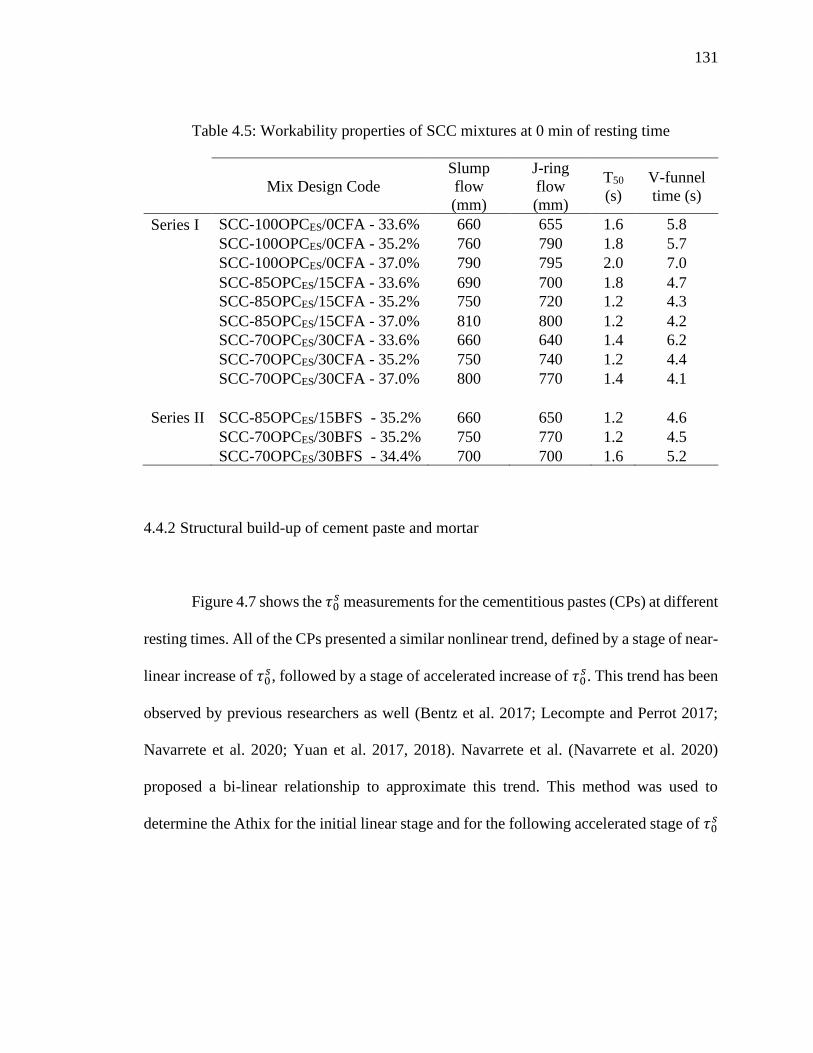
131
Table 4.5: Workability properties of SCC mixtures at 0 min of resting time
Mix Design Code
Slump
flow
(mm)
J-ring
flow
(mm)
T50
(s)
V-funnel
time (s)
Series I SCC-100OPCES/0CFA - 33.6% 660 655 1.6 5.8
SCC-100OPCES/0CFA - 35.2% 760 790 1.8 5.7
SCC-100OPCES/0CFA - 37.0% 790 795 2.0 7.0
SCC-85OPCES/15CFA - 33.6% 690 700 1.8 4.7
SCC-85OPCES/15CFA - 35.2% 750 720 1.2 4.3
SCC-85OPCES/15CFA - 37.0% 810 800 1.2 4.2
SCC-70OPCES/30CFA - 33.6% 660 640 1.4 6.2
SCC-70OPCES/30CFA - 35.2% 750 740 1.2 4.4
SCC-70OPCES/30CFA - 37.0% 800 770 1.4 4.1
Series II SCC-85OPCES/15BFS - 35.2% 660 650 1.2 4.6
SCC-70OPCES/30BFS - 35.2% 750 770 1.2 4.5
SCC-70OPCES/30BFS - 34.4% 700 700 1.6 5.2
4.4.2 Structural build-up of cement paste and mortar
Figure 4.7 shows the 𝜏0𝑠 measurements for the cementitious pastes (CPs) at different
resting times. All of the CPs presented a similar nonlinear trend, defined by a stage of near-
linear increase of 𝜏0𝑠, followed by a stage of accelerated increase of 𝜏0
𝑠. This trend has been
observed by previous researchers as well (Bentz et al. 2017; Lecompte and Perrot 2017;
Navarrete et al. 2020; Yuan et al. 2017, 2018). Navarrete et al. (Navarrete et al. 2020)
proposed a bi-linear relationship to approximate this trend. This method was used to
determine the Athix for the initial linear stage and for the following accelerated stage of 𝜏0𝑠

132
(i.e., Athix1 and Athix
2 , respectively). The resulting Athix1 and Athix
2 for each CP are listed in
Table 4.6.
Table 4.6 shows that the replacement of OPCES by SCMs produces a significant
change in the Athix of both stages. Specifically, the replacement of OPCES by CFA in the
Series I mixtures resulted in reductions of Athix1 and Athix
2 by up to 34 and 60%,
respectively. Similarly, the use of BFS in the Series II mixtures produced reductions of
54% and 22% in Athix1 and Athix
2 , respectively. The negative (i.e., decreasing) effect of SCM
replacement on Athix can be explained by the smaller NPSD of CFA and BFS with respect
to the NPSD of OPCES (Mostafa and Yahia 2017; Navarrete et al. 2020).
Figure 4.8 shows the reduction in mini slump flow with time of the Series I and
Series II mortar mixtures, where a linear trend can be seen for each mortar mixture. The
slope of this trend line was used to calculate Rs,flow as an indirect measurement of 𝐴𝑡ℎ𝑖𝑥𝑚 .
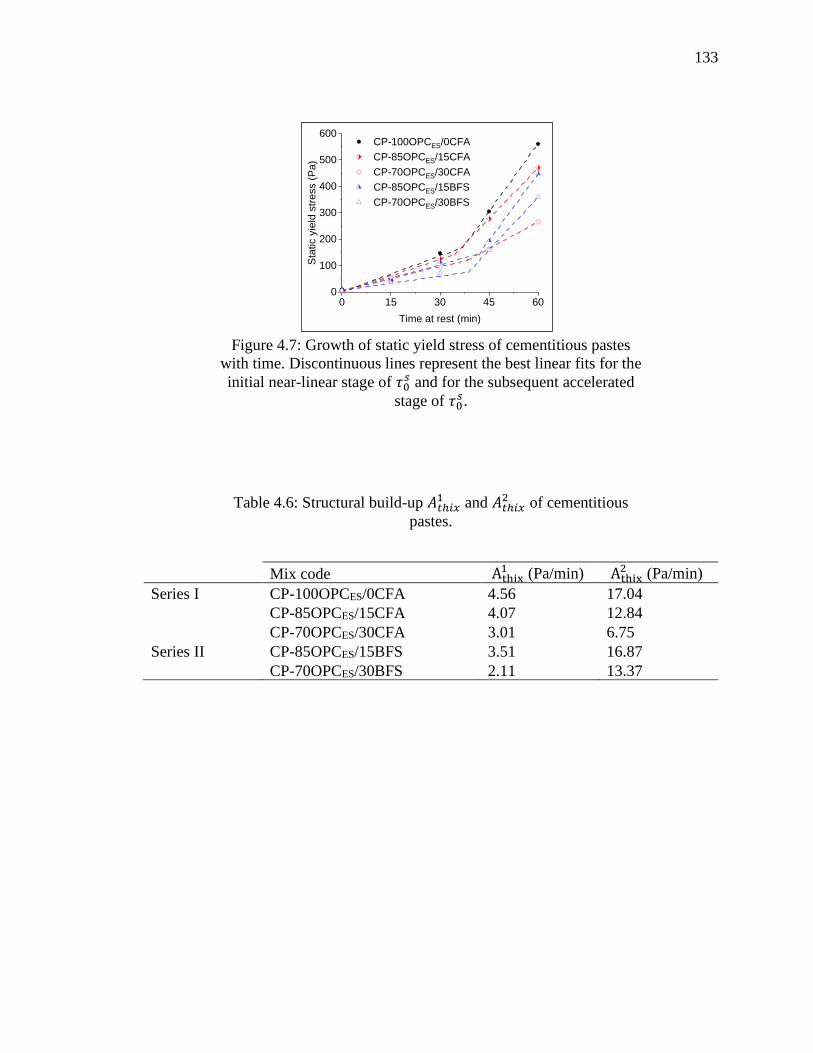
133
Figure 4.7: Growth of static yield stress of cementitious pastes
with time. Discontinuous lines represent the best linear fits for the
initial near-linear stage of 𝜏0𝑠 and for the subsequent accelerated
stage of 𝜏0𝑠.
Table 4.6: Structural build-up 𝐴𝑡ℎ𝑖𝑥1 and 𝐴𝑡ℎ𝑖𝑥
2 of cementitious
pastes.
Mix code Athix1 (Pa/min) Athix
2 (Pa/min)
Series I CP-100OPCES/0CFA 4.56 17.04
CP-85OPCES/15CFA 4.07 12.84
CP-70OPCES/30CFA 3.01 6.75
Series II CP-85OPCES/15BFS 3.51 16.87
CP-70OPCES/30BFS 2.11 13.37
0 15 30 45 600
100
200
300
400
500
600 CP-100OPCES/0CFA
CP-85OPCES/15CFA
CP-70OPCES/30CFA
CP-85OPCES/15BFS
CP-70OPCES/30BFS
Sta
tic y
ield
str
ess (
Pa)
Time at rest (min)
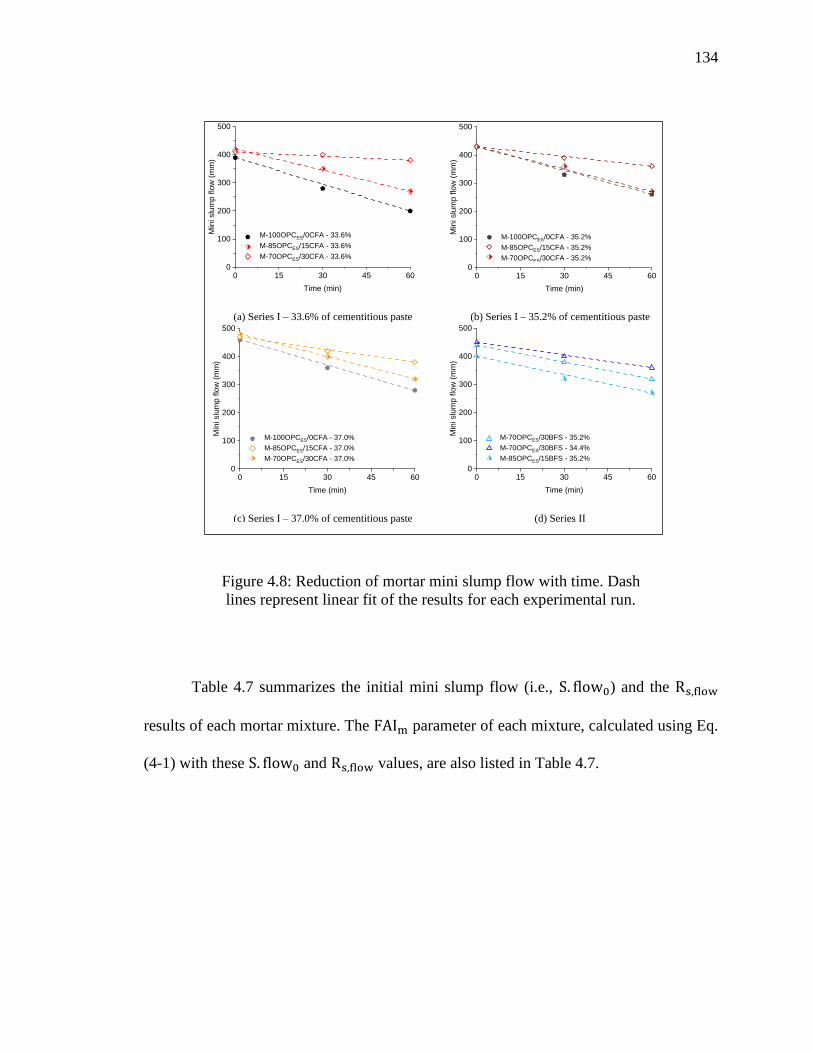
134
Figure 4.8: Reduction of mortar mini slump flow with time. Dash
lines represent linear fit of the results for each experimental run.
Table 4.7 summarizes the initial mini slump flow (i.e., S. flow0) and the Rs,flow
results of each mortar mixture. The FAIm parameter of each mixture, calculated using Eq.
(4-1) with these S. flow0 and Rs,flow values, are also listed in Table 4.7.
(a) Series I – 33.6% of cementitious paste (b) Series I – 35.2% of cementitious paste
(c) Series I – 37.0% of cementitious paste (d) Series II
1
0 15 30 45 600
100
200
300
400
500
M-100HPC/0CFA - 33.6%
M-85HPC/15CFA - 33.6%
M-70HPC/30CFA - 33.6%
Min
i slu
mp f
low
(m
m)
Time (min)
0 15 30 45 60
50
60
70
80
90
100
M-100OPCES/0CFA - 33.6%
M-85OPCES/15CFA - 33.6%
M-70OPCES/30CFA - 33.6%
RB
DS
h (%
)
DT (min)
Critical RB
0 15 30 45 600
100
200
300
400
500
M-100HPC/0CFA - 35.2%
M-70HPC/30CFA - 35.2%
M-85HPC/15CFA - 35.2%
Min
i slu
mp
flo
w (
mm
)
Time (min)
0 15 30 45 60
50
60
70
80
90
100
M-100OPCES/0CFA - 35.2%
M-85OPCES/15CFA - 35.2%
M-70OPCES/30CFA - 35.2%
RB
DS
h (%
)
DT (min)
Critical RB
0 15 30 45 600
100
200
300
400
500
M-100HPC/0CFA - 37.0%
M-70HPC/30CFA - 37.0%
M-85HPC/15CFA - 37.0%
Min
i slu
mp
flo
w (
mm
)
Time (min)
0 15 30 45 60
50
60
70
80
90
100
M-100OPCES/0CFA - 37.0%
M-85OPCES/15CFA - 37.0%
M-70OPCES/30CFA - 37.0%
RB
DS
h (%
)
DT (min)
Critical RB
0 15 30 45 600
100
200
300
400
500
M-70HPC/30BFS - 35.2%
M-70HPC/30BFS - 34.4%
M-85HPC/15BFS - 35.2%M
ini slu
mp f
low
(m
m)
Time (min)
0 15 30 45 60
50
60
70
80
90
100
M-70OPCES/30BFS - 35.2%
M-70OPCES/30BFS - 34.4%
M-85OPCES/15BFS - 35.2%R
BD
Sh
(%
)
DT (min)
Critical RB

135
Table 4.7: Slump flow, S. flow0, change in slump flow with time of rest Rs,flow and filing
ability index FAIm of mortar mixtures.
Mix Design Code
S. flow0
(mm)
Rs,flow
(mm/min)
FAIm
(mm2/min)
Series I M-100OPCES/0CFA - 33.6% 390 3.16 1232.4
M-100OPCES/0CFA - 35.2% 430 2.83 1216.9
M-100OPCES /0CFA - 37.0% 460 3.00 1380.0
M-85OPCES/15CFA - 33.6% 420 2.50 1050.0
M-85OPCES/15CFA - 35.2% 430 2.67 1148.1
M-85OPCES/15CFA - 37.0% 480 2.66 1276.8
M-70OPCES /30CFA - 33.6% 410 0.50 205.0
M-70OPCES/30CFA - 35.2% 430 1.16 498.8
M-70OPCES/30CFA - 37.0% 470 1.50 705.0
Series II M-85OPCES/15BFS - 35.2% 400 2.17 868.0
M-70OPCES/30BFS - 35.2% 440 2.00 880.0
M-70OPCES/30BFS - 34.4% 450 1.50 675.0
The mixtures with a larger CP%vol presented a larger S. flow0 and a larger Rs,flow
in all of the cases, except for the mixtures with no SCMs (i.e., 100OPCES/0CFA). In
addition, the use of CPs with smaller Athix (i.e., mixtures with SCMs) resulted in smaller
Rs,flow. As such, changing the CP%vol and Athix of CP, it was possible to obtain a wide
range of FAIm, between 205.0 and 1380 mm2/min. In addition, the mortar mixtures with
larger CP%vol and/or produced with CPs with larger Athix had larger FAIm.
4.4.3 Residual bond strength of SCC
Figure 4.9 and Figure 4.10 show the residual shear and flexural bond strengths,
RBDSh and RBF, respectively, of the Series I and Series II layered SCC mixtures measured
136
at delay times of 30 and 60 min. The results have been normalized with respect to the
measured shear strength and flexural strength of the monolithic control specimens, 𝜎𝐷𝑆ℎ(0)
and 𝜎𝐹(0), respectively, listed in Table 4.8. Reductions of up to 37% with increasing delay
time can be seen in RBDSh, while the RBF results had smaller reductions of up to 21%.
Therefore, the delay time had a greater effect on the inter-layer residual strength from the
direct shear test than the flexural test.
Through second order polynomial regression (SOPR) models, it was found that
84% and 70% of the observed variability in RBDSh and RBF, respectively, can be explained
with the mixture design (i.e., FAIm and CP%vol) and casting process (i.e., HFF and DT)
parameters. Figure 4.11 shows the standardized coefficient of each parameter, which
indicates the number of standard deviations the dependent variables (i.e. RBDSh and RBF)
will change per standard deviation increase in the independent variables (Verdugo et al.
2005). These standardized coefficients are used below to evaluate the relative effects of the
independent variables on the dependent variables.
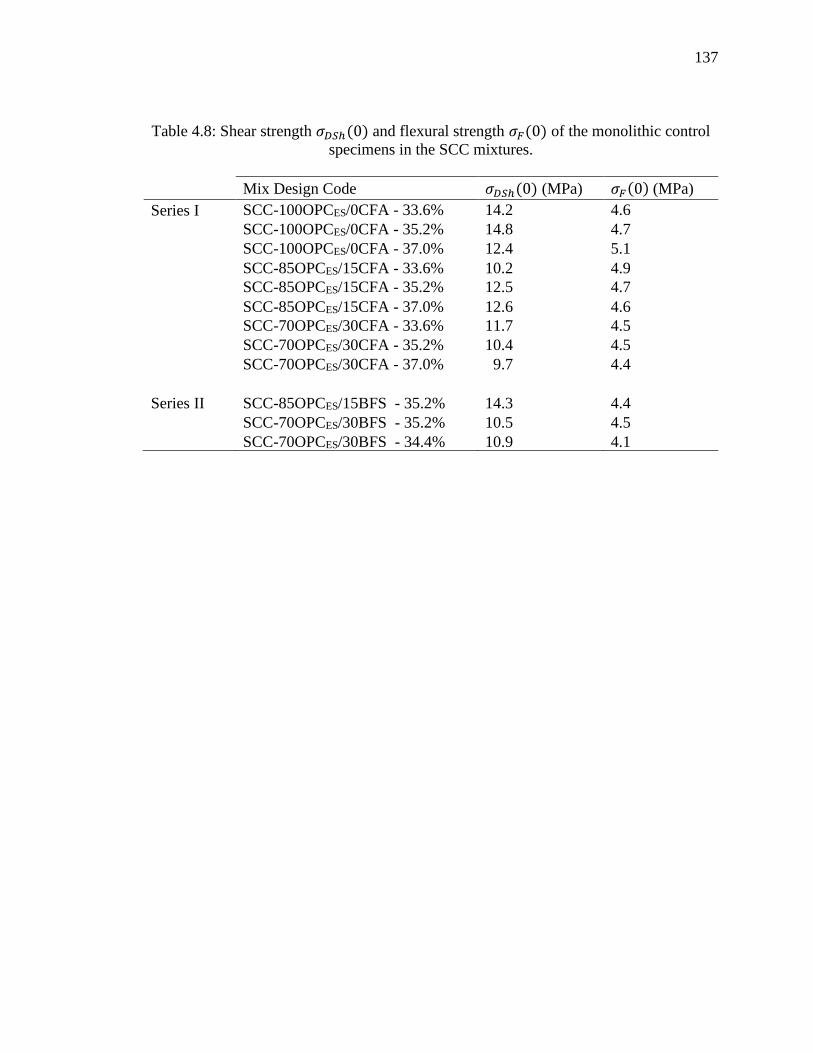
137
Table 4.8: Shear strength 𝜎𝐷𝑆ℎ(0) and flexural strength 𝜎𝐹(0) of the monolithic control
specimens in the SCC mixtures.
Mix Design Code 𝜎𝐷𝑆ℎ(0) (MPa) 𝜎𝐹(0) (MPa)
Series I SCC-100OPCES/0CFA - 33.6% 14.2 4.6
SCC-100OPCES/0CFA - 35.2% 14.8 4.7
SCC-100OPCES/0CFA - 37.0% 12.4 5.1
SCC-85OPCES/15CFA - 33.6% 10.2 4.9
SCC-85OPCES/15CFA - 35.2% 12.5 4.7
SCC-85OPCES/15CFA - 37.0% 12.6 4.6
SCC-70OPCES/30CFA - 33.6% 11.7 4.5
SCC-70OPCES/30CFA - 35.2% 10.4 4.5
SCC-70OPCES/30CFA - 37.0% 9.7 4.4
Series II SCC-85OPCES/15BFS - 35.2% 14.3 4.4
SCC-70OPCES/30BFS - 35.2% 10.5 4.5
SCC-70OPCES/30BFS - 34.4% 10.9 4.1
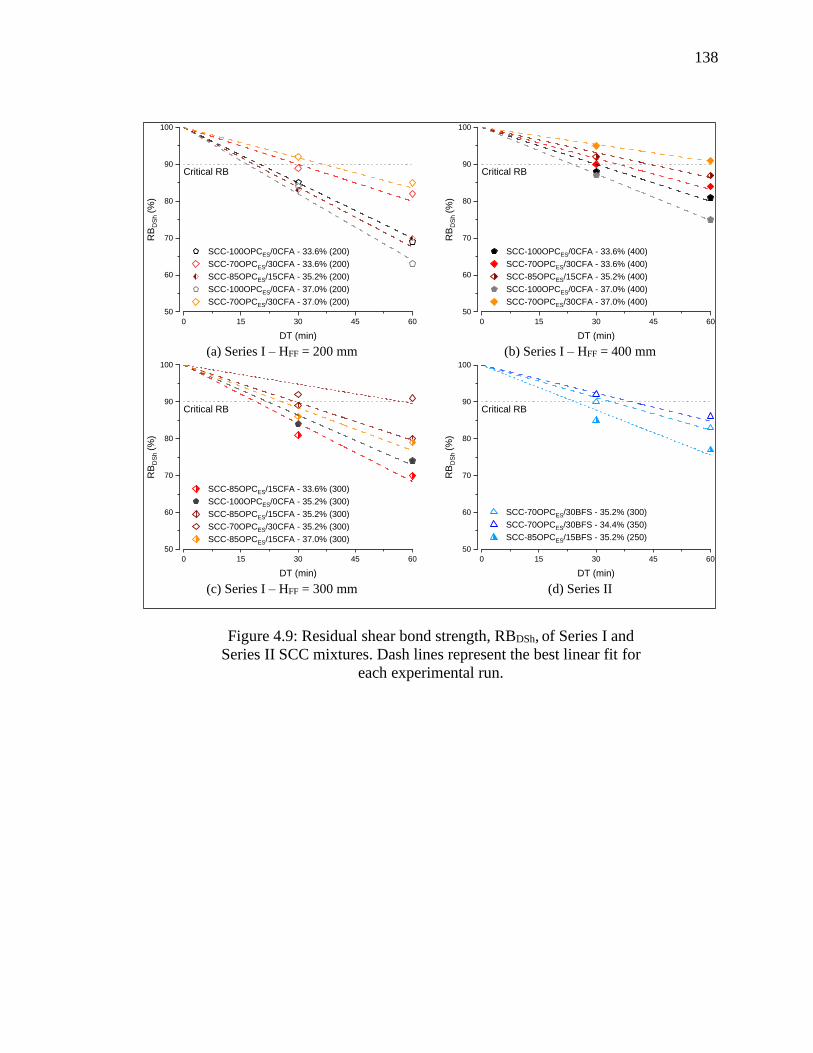
138
Figure 4.9: Residual shear bond strength, RBDSh, of Series I and
Series II SCC mixtures. Dash lines represent the best linear fit for
each experimental run.
(a) Series I – HFF = 200 mm (b) Series I – HFF = 400 mm
(c) Series I – HFF = 300 mm (d) Series II
1
0 15 30 45 60
50
60
70
80
90
100
SCC-100OPCES/0CFA - 33.6% (200)
SCC-70OPCES/30CFA - 33.6% (200)
SCC-85OPCES/15CFA - 35.2% (200)
SCC-100OPCES/0CFA - 37.0% (200)
SCC-70OPCES/30CFA - 37.0% (200)
RB
DS
h (%
)
DT (min)
Critical RB
0 15 30 45 60
50
60
70
80
90
100
SCC-100OPCES/0CFA - 33.6% (400)
SCC-70OPCES/30CFA - 33.6% (400)
SCC-85OPCES/15CFA - 35.2% (400)
SCC-100OPCES/0CFA - 37.0% (400)
SCC-70OPCES/30CFA - 37.0% (400)
RB
DS
h (%
)
DT (min)
Critical RB
0 15 30 45 60
50
60
70
80
90
100
SCC-85OPCES/15CFA - 33.6% (300)
SCC-100OPCES/0CFA - 35.2% (300)
SCC-85OPCES/15CFA - 35.2% (300)
SCC-70OPCES/30CFA - 35.2% (300)
SCC-85OPCES/15CFA - 37.0% (300)
RB
DS
h (%
)
DT (min)
Critical RB
0 15 30 45 60
50
60
70
80
90
100
SCC-70OPCES/30BFS - 35.2% (300)
SCC-70OPCES/30BFS - 34.4% (350)
SCC-85OPCES/15BFS - 35.2% (250)
RB
DS
h (%
)
DT (min)
Critical RB

139
Figure 4.10: RBF of Series I and Series II SCC mixtures. Dash
lines represent the best linear fit for each experimental run.
Looking at the results for FAIm, the standardized coefficients indicate negative
effects on the residual shear and flexural bond strengths, which means that SCCs produced
with mortars with larger Athixm are prone to larger bond strength reductions. This is
expected, because mixtures with larger FAIm present larger increase of 𝜏0𝑠 with time, thus
resulting in higher reductions in the intermixing of successive layers with time. In addition,
(a) Series I – HFF = 200 mm (b) Series I – HFF = 400 mm
(c) Series I – HFF = 300 mm (d) Series II
1
0 15 30 45 60
50
60
70
80
90
100
SCC-100OPCES/0CFA - 33.6% (200)
SCC-70OPCES/30CFA - 33.6% (200)
SCC-85OPCES/15CFA - 35.2% (200)
SCC-100OPCES/0CFA - 37.0% (200)
SCC-70OPCES/30CFA - 37.0% (200)
RB
F (%
)
DT (min)
Critical RB
0 15 30 45 60
50
60
70
80
90
100
SCC-100OPCES/0CFA - 33.6% (400)
SCC-70OPCES/30CFA - 33.6% (400)
SCC-85OPCES/15CFA - 35.2% (400)
SCC-100OPCES/0CFA - 37.0% (400)
SCC-70OPCES/30CFA - 37.0% (400)
RB
F (%
)
DT (min)
Critical RB
0 15 30 45 60
50
60
70
80
90
100
SCC-85OPCES/15CFA - 33.6% (300)
SCC-100OPCES/0CFA - 35.2% (300)
SCC-85OPCES/15CFA - 35.2% (300)
SCC-70OPCES/30CFA - 35.2% (300)
SCC-85OPCES/15CFA - 37.0% (300)
RB
F (%
)
DT (min)
Critical RB
0 15 30 45 60
50
60
70
80
90
100
SCC-70OPCES/30BFS - 35.2% (300)
SCC-70OPCES/30BFS - 34.4% (350)
SCC-85OPCES/15BFS - 35.2% (250)
RB
F (%
)
DT (min)
Critical RB
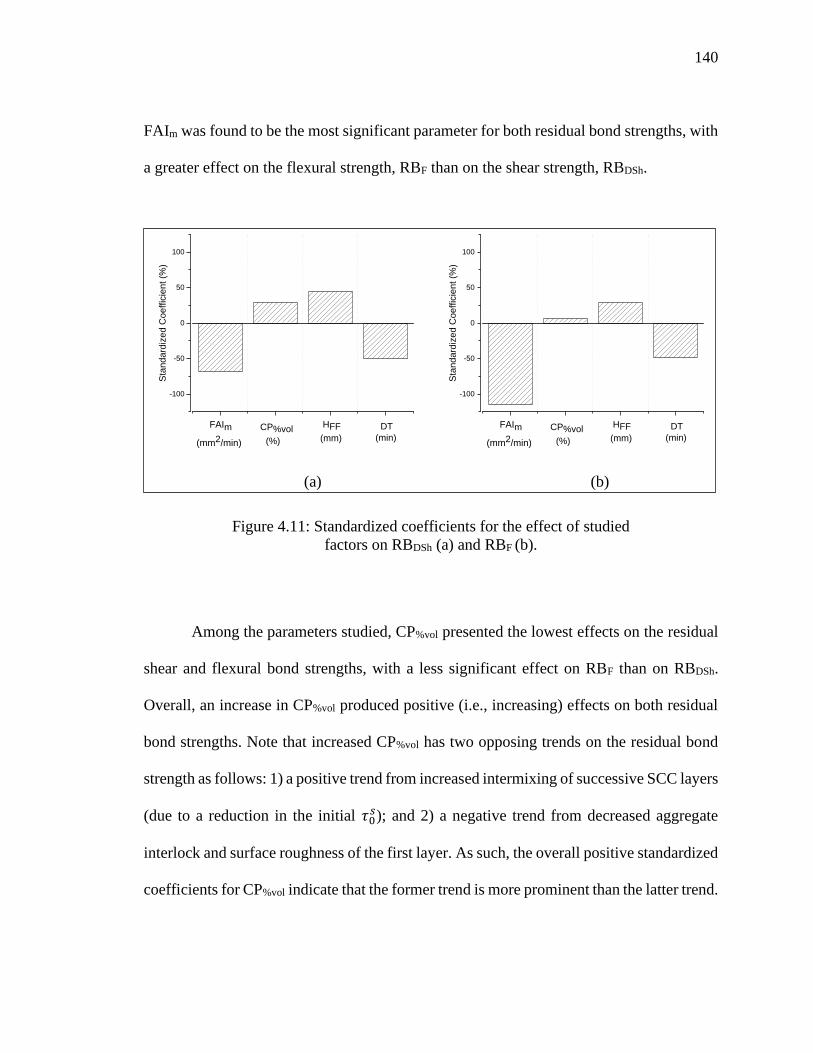
140
FAIm was found to be the most significant parameter for both residual bond strengths, with
a greater effect on the flexural strength, RBF than on the shear strength, RBDSh.
(a) (b)
Figure 4.11: Standardized coefficients for the effect of studied
factors on RBDSh (a) and RBF (b).
Among the parameters studied, CP%vol presented the lowest effects on the residual
shear and flexural bond strengths, with a less significant effect on RBF than on RBDSh.
Overall, an increase in CP%vol produced positive (i.e., increasing) effects on both residual
bond strengths. Note that increased CP%vol has two opposing trends on the residual bond
strength as follows: 1) a positive trend from increased intermixing of successive SCC layers
(due to a reduction in the initial 𝜏0𝑠); and 2) a negative trend from decreased aggregate
interlock and surface roughness of the first layer. As such, the overall positive standardized
coefficients for CP%vol indicate that the former trend is more prominent than the latter trend.
-100
-50
0
50
100
Sta
ndard
ized C
oeffic
ient (%
)
FAIm
(mm2/min)
CP%vol
(%)
HFF
(mm)
DT
(min)
-100
-50
0
50
100
Sta
ndard
ized C
oeffic
ient (%
)
FAIm
(mm2/min)
CP%vol
(%)
HFF
(mm)
DT
(min)
141
Increases in HFF also resulted in increases in both residual bond strengths. This is
expected, because an increase in HFF increases the interlock resulting from the penetration
of the top SCC layer into the lower layer (Megid and Khayat 2019). The effect of HFF was
more significant on RBDSh than on RBF.
In comparison, increases in DT resulted in decreases in both residual bond
strengths, with similar effects in both cases. This was also expected, because an increase
in DT increases the 𝜏0𝑠, thus reducing the intermixing of the successive SCC layers.
Overall, the tested mixture design and casting process parameters had greater
effects on RBDSh than on RBF. Therefore, it is concluded that RBDSh is a better measure to
control the mixture design and casting process for inter-layer bond strength, as investigated
further in the analysis of the RBDSh results below.
The SOPR model for RBDSh was developed using FAIm, CP%vol, HFF, and DT as the
independent parameters. The resulting model is presented in Eq. (4-3), with summary and
coefficients (i.e., 𝛼0. . 𝛼5) of the terms given in Table 4.9.
RBDSh = α0 + α1FAIm + α2CP%vol + α3(FAIm ∙ DT) + α4(FAIm ∙ CP%vol) +
α5(FAIm ∙ HFF) (4-3)
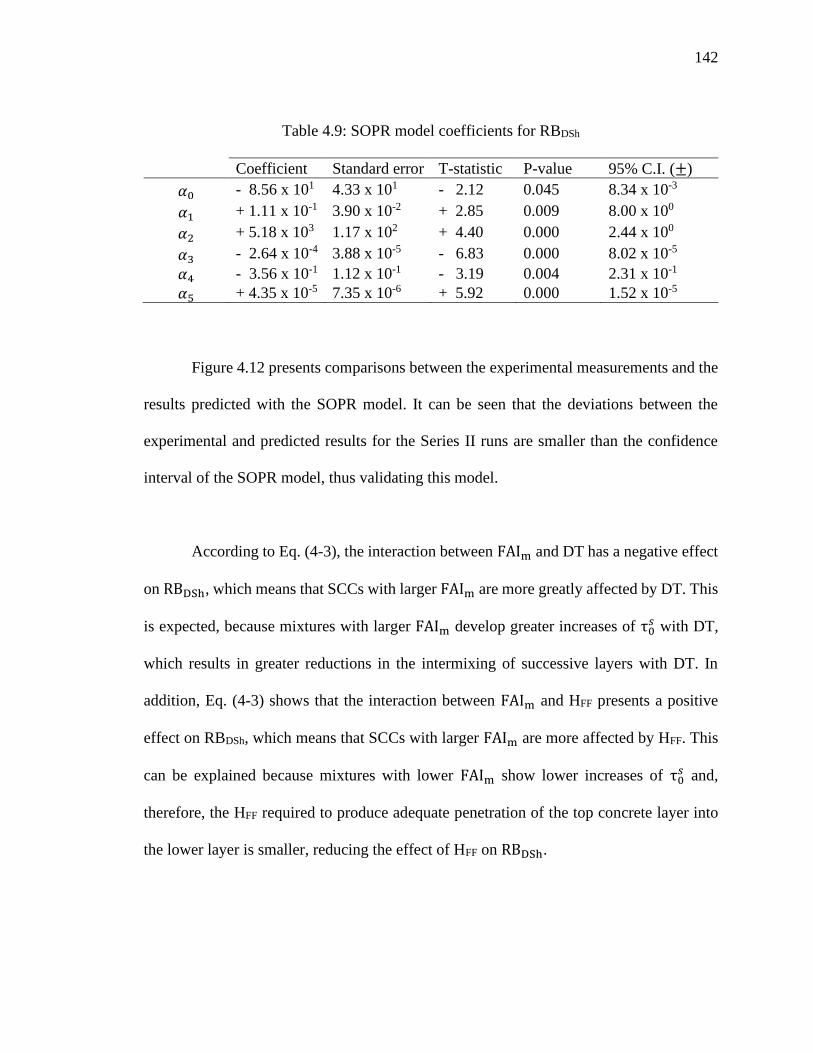
142
Table 4.9: SOPR model coefficients for RBDSh
Coefficient Standard error T-statistic P-value 95% C.I. (±)
𝛼0 - 8.56 x 101 4.33 x 101 - 2.12 0.045 8.34 x 10⁻³
𝛼1 + 1.11 x 10⁻¹ 3.90 x 10⁻² + 2.85 0.009 8.00 x 100
𝛼2 + 5.18 x 10³ 1.17 x 10² + 4.40 0.000 2.44 x 100
𝛼3 - 2.64 x 10⁻⁴ 3.88 x 10⁻⁵ - 6.83 0.000 8.02 x 10⁻⁵
𝛼4 - 3.56 x 10⁻¹ 1.12 x 10⁻¹ - 3.19 0.004 2.31 x 10⁻¹
𝛼5 + 4.35 x 10⁻⁵ 7.35 x 10⁻⁶ + 5.92 0.000 1.52 x 10⁻⁵
Figure 4.12 presents comparisons between the experimental measurements and the
results predicted with the SOPR model. It can be seen that the deviations between the
experimental and predicted results for the Series II runs are smaller than the confidence
interval of the SOPR model, thus validating this model.
According to Eq. (4-3), the interaction between FAIm and DT has a negative effect
on RBDSh, which means that SCCs with larger FAIm are more greatly affected by DT. This
is expected, because mixtures with larger FAIm develop greater increases of τ0𝑠 with DT,
which results in greater reductions in the intermixing of successive layers with DT. In
addition, Eq. (4-3) shows that the interaction between FAIm and HFF presents a positive
effect on RBDSh, which means that SCCs with larger FAIm are more affected by HFF. This
can be explained because mixtures with lower FAIm show lower increases of τ0𝑠 and,
therefore, the HFF required to produce adequate penetration of the top concrete layer into
the lower layer is smaller, reducing the effect of HFF on RBDSh.
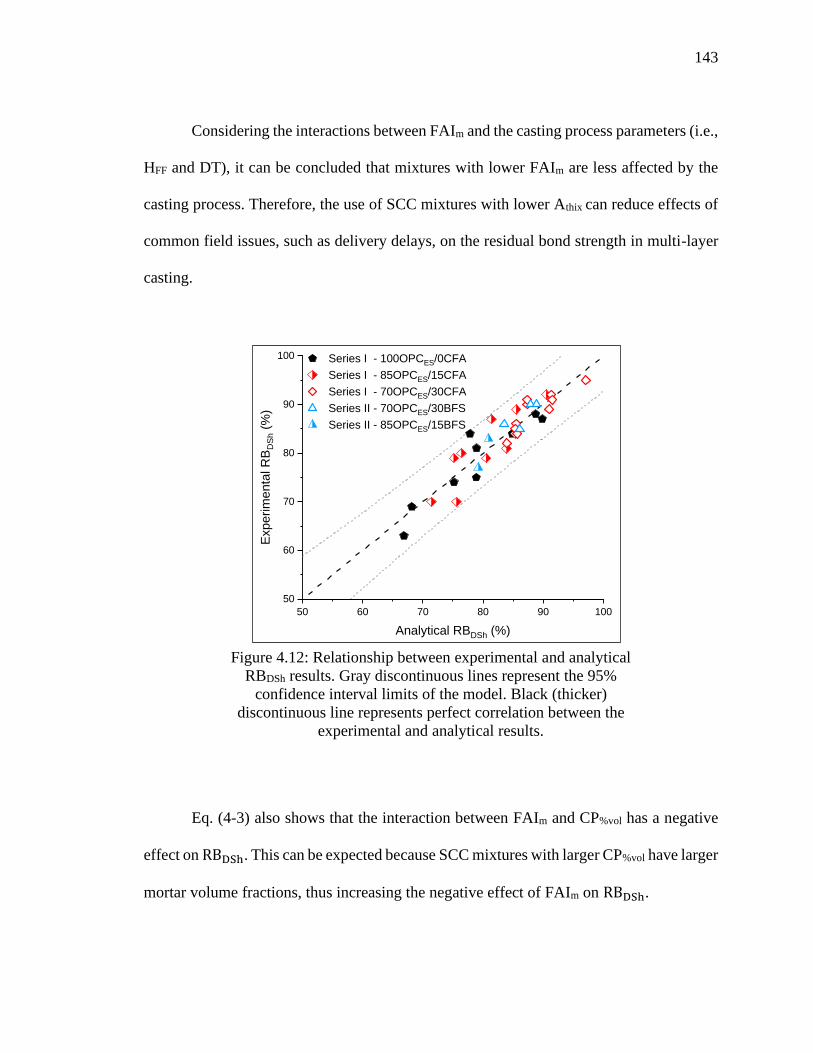
143
Considering the interactions between FAIm and the casting process parameters (i.e.,
HFF and DT), it can be concluded that mixtures with lower FAIm are less affected by the
casting process. Therefore, the use of SCC mixtures with lower Athix can reduce effects of
common field issues, such as delivery delays, on the residual bond strength in multi-layer
casting.
Figure 4.12: Relationship between experimental and analytical
RBDSh results. Gray discontinuous lines represent the 95%
confidence interval limits of the model. Black (thicker)
discontinuous line represents perfect correlation between the
experimental and analytical results.
Eq. (4-3) also shows that the interaction between FAIm and CP%vol has a negative
effect on RBDSh. This can be expected because SCC mixtures with larger CP%vol have larger
mortar volume fractions, thus increasing the negative effect of FAIm on RBDSh.
50 60 70 80 90 100
50
60
70
80
90
100 Series I - 100OPCES/0CFA
Series I - 85OPCES/15CFA
Series I - 70OPCES/30CFA
Series II - 70OPCES/30BFS
Series II - 85OPCES/15BFS
Experim
enta
l R
BD
Sh (
%)
Analytical RBDSh (%)
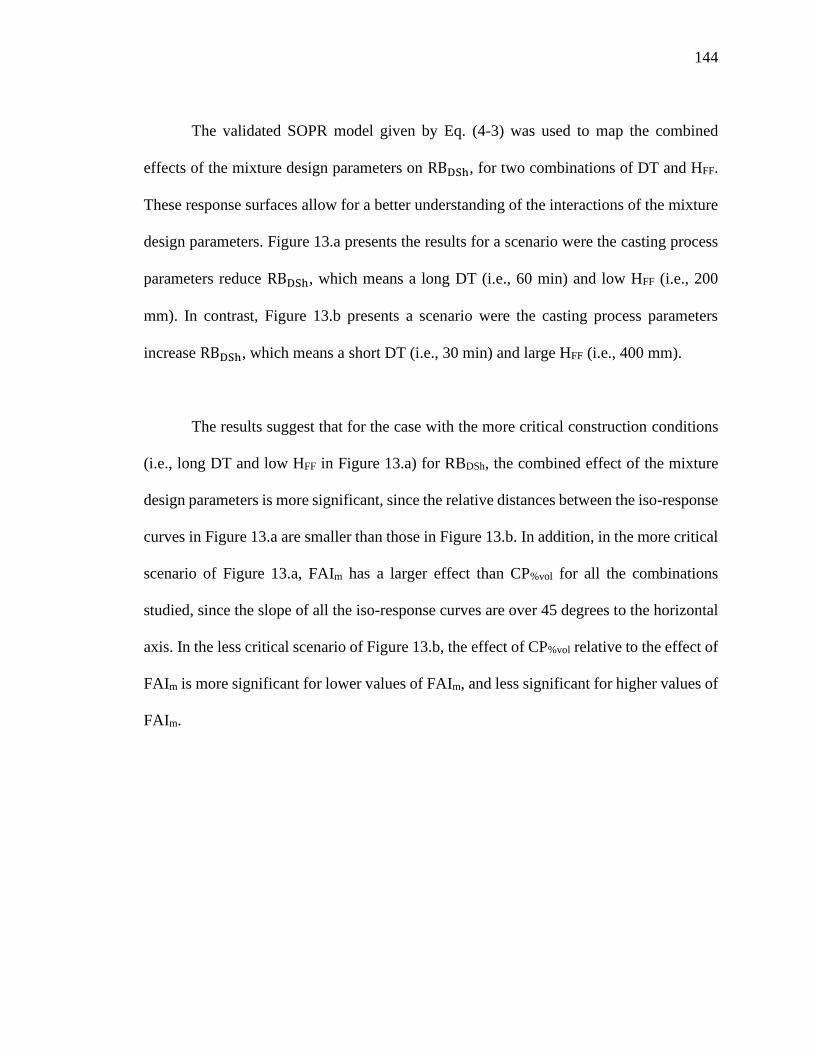
144
The validated SOPR model given by Eq. (4-3) was used to map the combined
effects of the mixture design parameters on RBDSh, for two combinations of DT and HFF.
These response surfaces allow for a better understanding of the interactions of the mixture
design parameters. Figure 13.a presents the results for a scenario were the casting process
parameters reduce RBDSh, which means a long DT (i.e., 60 min) and low HFF (i.e., 200
mm). In contrast, Figure 13.b presents a scenario were the casting process parameters
increase RBDSh, which means a short DT (i.e., 30 min) and large HFF (i.e., 400 mm).
The results suggest that for the case with the more critical construction conditions
(i.e., long DT and low HFF in Figure 13.a) for RBDSh, the combined effect of the mixture
design parameters is more significant, since the relative distances between the iso-response
curves in Figure 13.a are smaller than those in Figure 13.b. In addition, in the more critical
scenario of Figure 13.a, FAIm has a larger effect than CP%vol for all the combinations
studied, since the slope of all the iso-response curves are over 45 degrees to the horizontal
axis. In the less critical scenario of Figure 13.b, the effect of CP%vol relative to the effect of
FAIm is more significant for lower values of FAIm, and less significant for higher values of
FAIm.
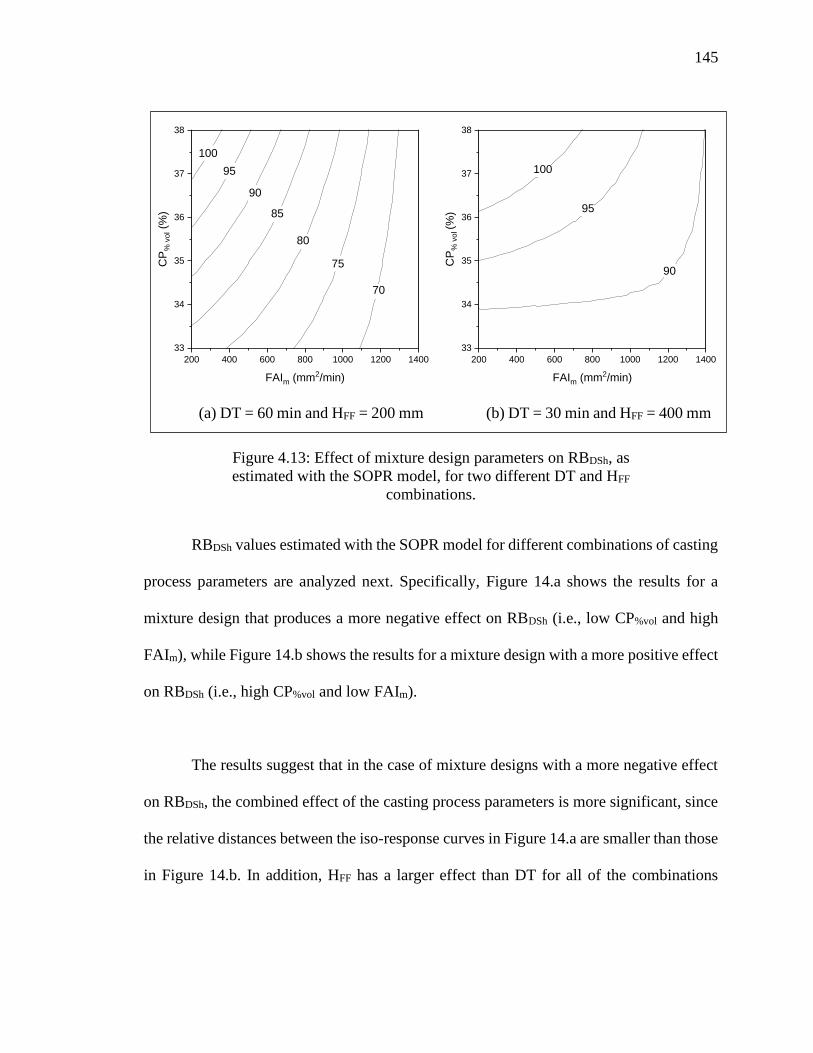
145
(a) DT = 60 min and HFF = 200 mm (b) DT = 30 min and HFF = 400 mm
Figure 4.13: Effect of mixture design parameters on RBDSh, as
estimated with the SOPR model, for two different DT and HFF
combinations.
RBDSh values estimated with the SOPR model for different combinations of casting
process parameters are analyzed next. Specifically, Figure 14.a shows the results for a
mixture design that produces a more negative effect on RBDSh (i.e., low CP%vol and high
FAIm), while Figure 14.b shows the results for a mixture design with a more positive effect
on RBDSh (i.e., high CP%vol and low FAIm).
The results suggest that in the case of mixture designs with a more negative effect
on RBDSh, the combined effect of the casting process parameters is more significant, since
the relative distances between the iso-response curves in Figure 14.a are smaller than those
in Figure 14.b. In addition, HFF has a larger effect than DT for all of the combinations
100
95
90
85
80
70
200 400 600 800 1000 1200 1400
33
34
35
36
37
38
CP
% v
ol (
%)
FAIm (mm2/min)
100
75
100
95
90
200 400 600 800 1000 1200 1400
33
34
35
36
37
38
CP
% v
ol (%
)
FAIm (mm2/min)
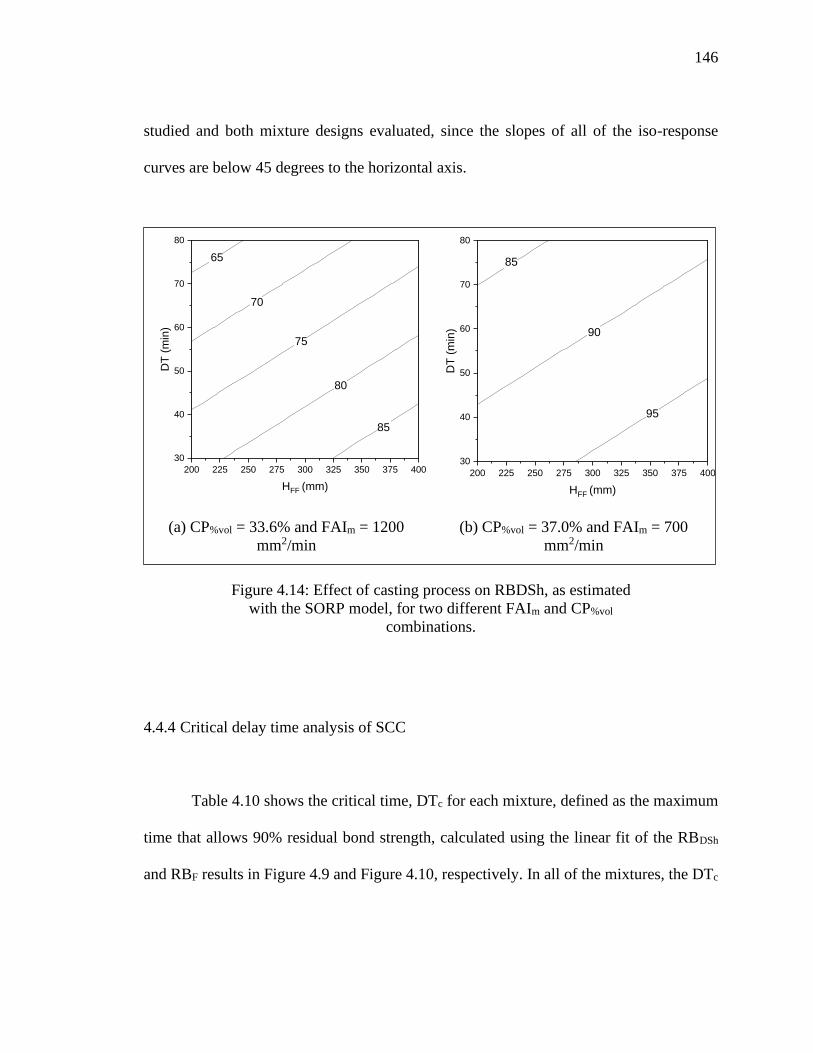
146
studied and both mixture designs evaluated, since the slopes of all of the iso-response
curves are below 45 degrees to the horizontal axis.
(a) CP%vol = 33.6% and FAIm = 1200
mm2/min
(b) CP%vol = 37.0% and FAIm = 700
mm2/min
Figure 4.14: Effect of casting process on RBDSh, as estimated
with the SORP model, for two different FAIm and CP%vol
combinations.
4.4.4 Critical delay time analysis of SCC
Table 4.10 shows the critical time, DTc for each mixture, defined as the maximum
time that allows 90% residual bond strength, calculated using the linear fit of the RBDSh
and RBF results in Figure 4.9 and Figure 4.10, respectively. In all of the mixtures, the DTc
65
85
70
80
75
200 225 250 275 300 325 350 375 400
30
40
50
60
70
80
DT
(m
in)
HFF (mm)
85
95
90
200 225 250 275 300 325 350 375 400
30
40
50
60
70
80
DT
(m
in)
HFF (mm)
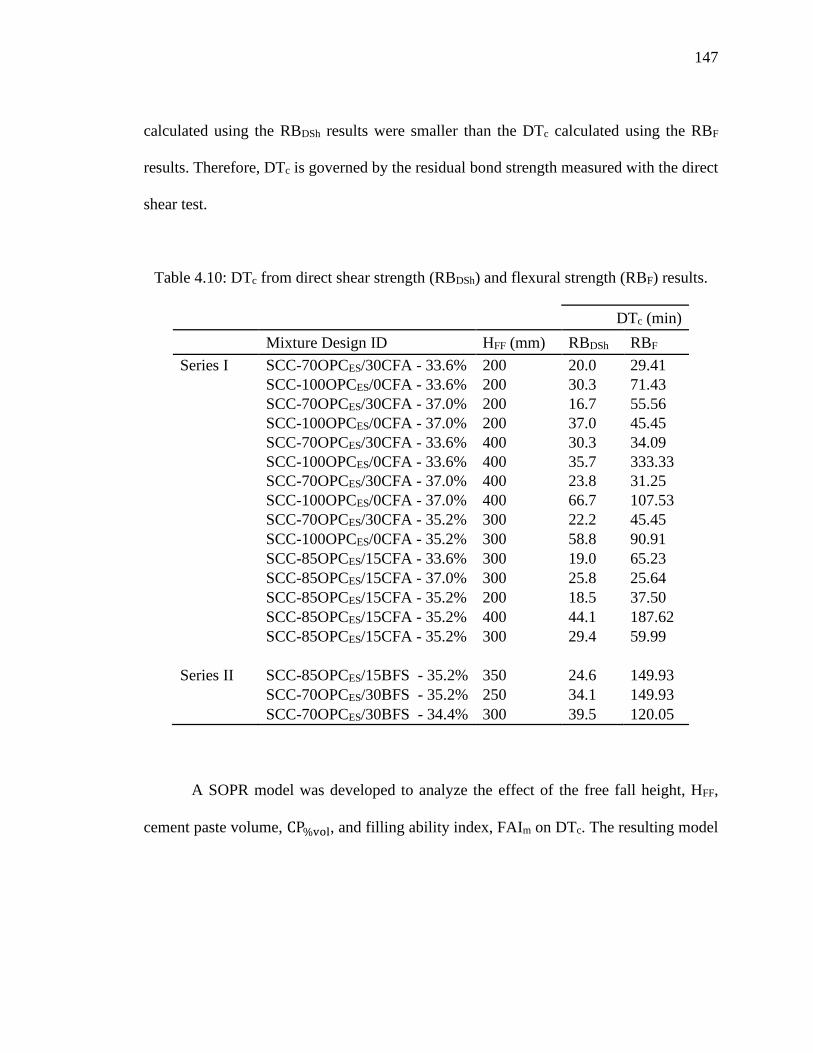
147
calculated using the RBDSh results were smaller than the DTc calculated using the RBF
results. Therefore, DTc is governed by the residual bond strength measured with the direct
shear test.
Table 4.10: DTc from direct shear strength (RBDSh) and flexural strength (RBF) results.
DTc (min)
Mixture Design ID HFF (mm) RBDSh RBF
Series I SCC-70OPCES/30CFA - 33.6% 200 20.0 29.41
SCC-100OPCES/0CFA - 33.6% 200 30.3 71.43
SCC-70OPCES/30CFA - 37.0% 200 16.7 55.56
SCC-100OPCES/0CFA - 37.0% 200 37.0 45.45
SCC-70OPCES/30CFA - 33.6% 400 30.3 34.09
SCC-100OPCES/0CFA - 33.6% 400 35.7 333.33
SCC-70OPCES/30CFA - 37.0% 400 23.8 31.25
SCC-100OPCES/0CFA - 37.0% 400 66.7 107.53
SCC-70OPCES/30CFA - 35.2% 300 22.2 45.45
SCC-100OPCES/0CFA - 35.2% 300 58.8 90.91
SCC-85OPCES/15CFA - 33.6% 300 19.0 65.23
SCC-85OPCES/15CFA - 37.0% 300 25.8 25.64
SCC-85OPCES/15CFA - 35.2% 200 18.5 37.50
SCC-85OPCES/15CFA - 35.2% 400 44.1 187.62
SCC-85OPCES/15CFA - 35.2% 300 29.4 59.99
Series II SCC-85OPCES/15BFS - 35.2% 350 24.6 149.93
SCC-70OPCES/30BFS - 35.2% 250 34.1 149.93
SCC-70OPCES/30BFS - 34.4% 300 39.5 120.05
A SOPR model was developed to analyze the effect of the free fall height, HFF,
cement paste volume, CP%vol, and filling ability index, FAIm on DTc. The resulting model
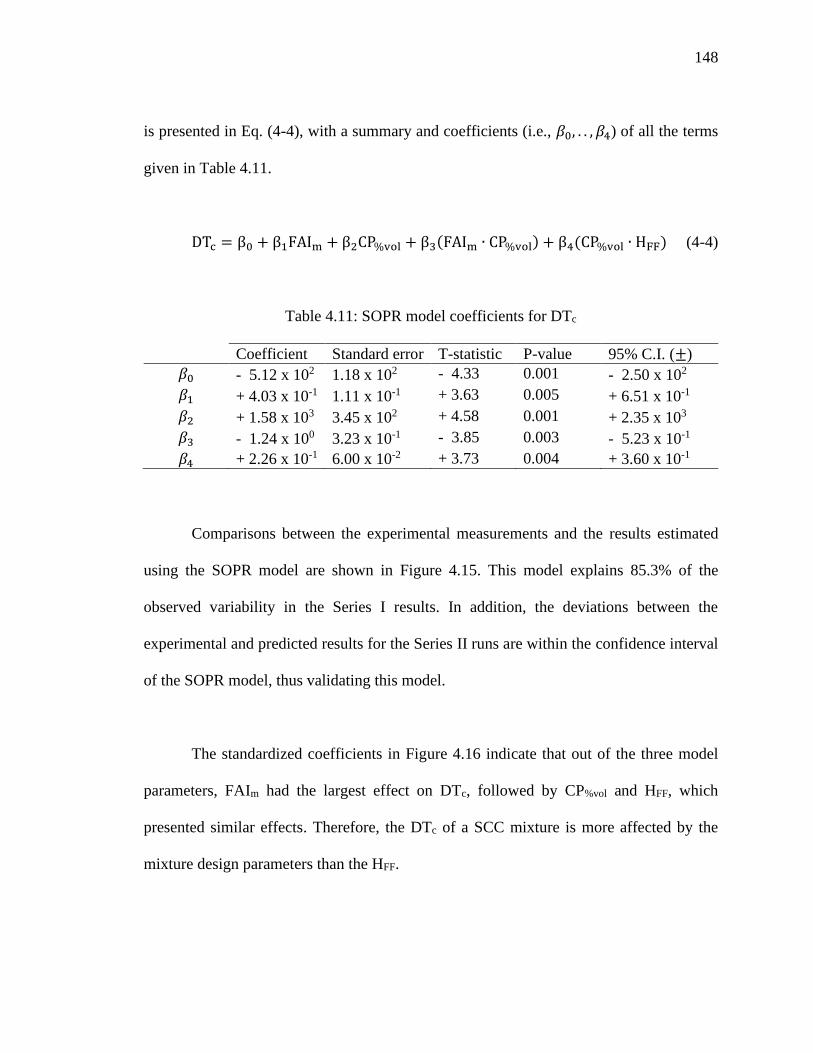
148
is presented in Eq. (4-4), with a summary and coefficients (i.e., 𝛽0, . . , 𝛽4) of all the terms
given in Table 4.11.
DTc = β0 + β1FAIm + β2CP%vol + β3(FAIm ∙ CP%vol) + β4(CP%vol ∙ HFF) (4-4)
Table 4.11: SOPR model coefficients for DTc
Coefficient Standard error T-statistic P-value 95% C.I. (±)
𝛽0 - 5.12 x 10² 1.18 x 10² - 4.33 0.001 - 2.50 x 10²
𝛽1 + 4.03 x 10⁻¹ 1.11 x 10⁻¹ + 3.63 0.005 + 6.51 x 10⁻¹
𝛽2 + 1.58 x 10³ 3.45 x 10² + 4.58 0.001 + 2.35 x 10³
𝛽3 - 1.24 x 100 3.23 x 10⁻¹ - 3.85 0.003 - 5.23 x 10⁻¹
𝛽4 + 2.26 x 10⁻¹ 6.00 x 10⁻² + 3.73 0.004 + 3.60 x 10⁻¹
Comparisons between the experimental measurements and the results estimated
using the SOPR model are shown in Figure 4.15. This model explains 85.3% of the
observed variability in the Series I results. In addition, the deviations between the
experimental and predicted results for the Series II runs are within the confidence interval
of the SOPR model, thus validating this model.
The standardized coefficients in Figure 4.16 indicate that out of the three model
parameters, FAIm had the largest effect on DTc, followed by CP%vol and HFF, which
presented similar effects. Therefore, the DTc of a SCC mixture is more affected by the
mixture design parameters than the HFF.
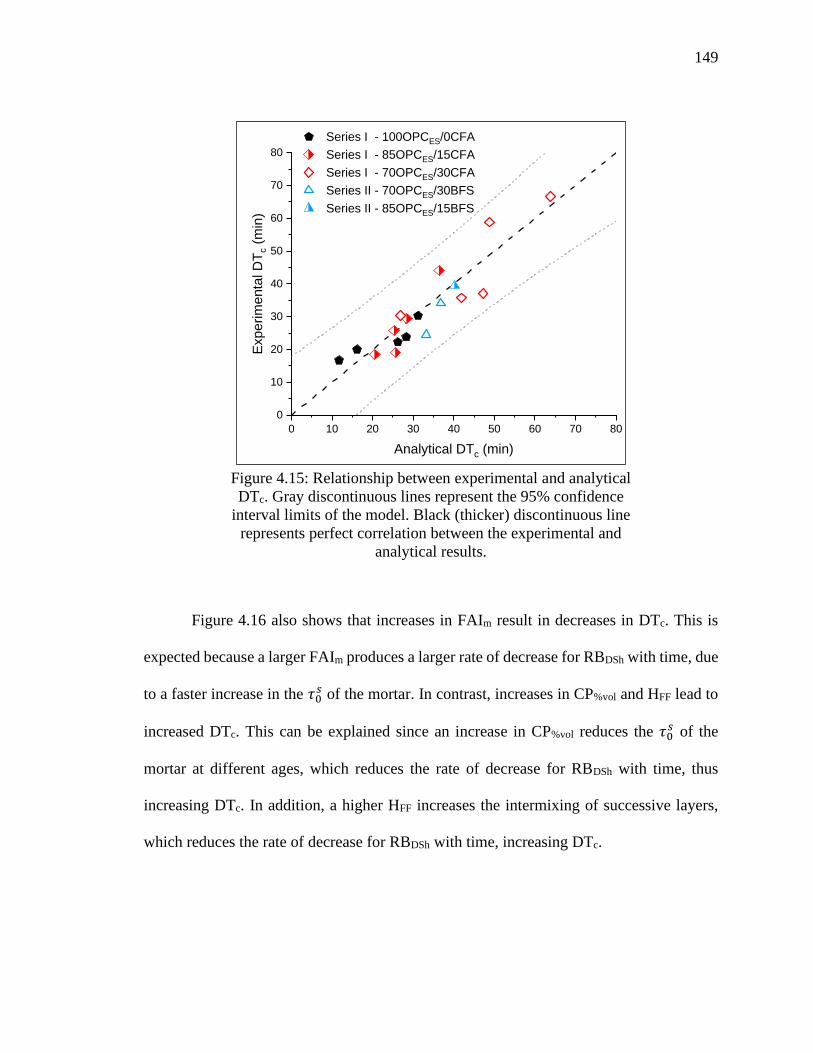
149
Figure 4.15: Relationship between experimental and analytical
DTc. Gray discontinuous lines represent the 95% confidence
interval limits of the model. Black (thicker) discontinuous line
represents perfect correlation between the experimental and
analytical results.
Figure 4.16 also shows that increases in FAIm result in decreases in DTc. This is
expected because a larger FAIm produces a larger rate of decrease for RBDSh with time, due
to a faster increase in the 𝜏0𝑠 of the mortar. In contrast, increases in CP%vol and HFF lead to
increased DTc. This can be explained since an increase in CP%vol reduces the 𝜏0𝑠 of the
mortar at different ages, which reduces the rate of decrease for RBDSh with time, thus
increasing DTc. In addition, a higher HFF increases the intermixing of successive layers,
which reduces the rate of decrease for RBDSh with time, increasing DTc.
0 10 20 30 40 50 60 70 80
0
10
20
30
40
50
60
70
80
Series I - 100OPCES/0CFA
Series I - 85OPCES/15CFA
Series I - 70OPCES/30CFA
Series II - 70OPCES/30BFS
Series II - 85OPCES/15BFS
Exp
erim
enta
l D
Tc (
min
)
Analytical DTc (min)
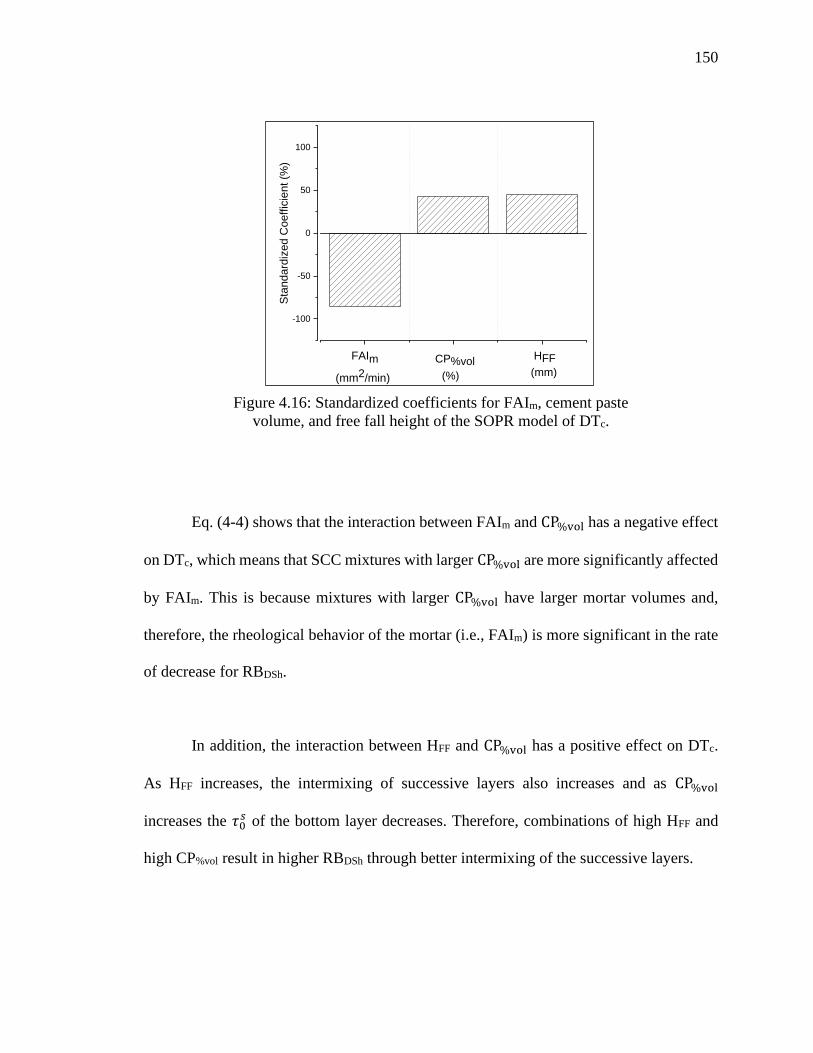
150
Figure 4.16: Standardized coefficients for FAIm, cement paste
volume, and free fall height of the SOPR model of DTc.
Eq. (4-4) shows that the interaction between FAIm and CP%vol has a negative effect
on DTc, which means that SCC mixtures with larger CP%vol are more significantly affected
by FAIm. This is because mixtures with larger CP%vol have larger mortar volumes and,
therefore, the rheological behavior of the mortar (i.e., FAIm) is more significant in the rate
of decrease for RBDSh.
In addition, the interaction between HFF and CP%vol has a positive effect on DTc.
As HFF increases, the intermixing of successive layers also increases and as CP%vol
increases the 𝜏0𝑠 of the bottom layer decreases. Therefore, combinations of high HFF and
high CP%vol result in higher RBDSh through better intermixing of the successive layers.
-100
-50
0
50
100
Sta
nd
ard
ize
d C
oe
ffic
ient
(%)
FAIm
(mm2/min)
CP%vol
(%)
HFF
(mm)
151
4.5 Conclusions
This research investigated the effects of the cementitious paste volume, CP%vol,
structural build-up of mortar, Athixm , and their interactions with casting process parameters
(i.e., free fall height, HFF, and delay time, DT) on the residual shear and flexural bond
strengths of multi-layer SCC. In addition, the effect of cementitious paste volume,
structural build-up of mortar, and their interaction with the free fall height on the critical
delay time is analyzed. The measured results from a face centered central composite
experimental design, composed of 15 mixtures, were used to conduct analysis of variance
and develop second order polynomial regression (SOPR) models, which were validated
with three additional experimental runs. Important conclusions from this study are listed
below:
1. The residual shear and flexural bond strengths of multi-layer SCC (RBDSh and RBF,
respectively) are affected mostly by the structural build-up of mortar. In contrast,
the cementitious paste volume is the parameter with the lowest effect on RBDSh and
RBF.
2. An SOPR model to predict RBDSh provided good correlations with the experimental
results of self-consolidating concrete (SCC) mixtures with different structural
build-up of mortar, cementitious paste volume, free fall height, and delay time.
3. Multi-layer casting of SCC results in a greater reduction in RBDSh than RBF,
negatively affecting the structural performance of SCC structural elements.
152
4. SCC mixtures with greater cementitious paste volume show lower reductions in
RBDSh and RBF making them more resilient to the casting conditions.
5. SCC mixtures with lower structural build-up of mortar can mitigate the effects of
common field issues on RBDSh and RBF, such as on-site concrete delivery delays.
6. The critical delay time, defined as the maximum time that allows 90% residual bond
strength in multi-layer casting of SCC, is governed more by RBDSh than by RBF.
7. An SOPR model to predict DTc provided good correlations with the experimental
results of SCC mixtures with different structural build-up of mortar, cementitious
paste volume, and free fall height.
8. The critical delay time is affected mostly by the structural build-up of mortar,
followed by the cementitious paste volume and the free fall height, which have
similar effects.
153
CHAPTER 5: CONCLUSIONS AND FUTURE DIRECTIONS
This chapter repeats (for the convenience of the reader) the conclusions listed at the
ends of Chapters 2-4 regarding each specific objective and discusses future directions.
5.1 Conclusions
1. A second order polynomial regression (SOPR) model to predict the structural build
up of cementitious paste as a function of supplementary cementitious material
(SCM) properties and primary mixture parameters was developed and validated.
The model shows good accuracy to predict the structural build up of mixtures
prepared with various SCMs, SCM replacement amounts, water to cement ratios,
and cement with different reactivities.
2. The effect of particle size of SCM on the structural build up of cementitious paste
is governed by the particle density which determines the number of contact points
instead of the specific surface area.
154
3. The effect of physicochemical properties of SCM on the structural build up of
cementitious paste is governed by the surface potential instead of the chemical
reactivity at early age.
4. The structural build up of cementitious paste is affected mostly by the water to
cementitious ratio. In contrast, the replacement level of SCM is the least significant
parameter affecting structural build up. Among the SCM properties, the particle
density has a greater effect than the surface potential. In addition, reactivity of
cement has a similar effect as the particle density of SCM.
5. The structural build up of mixtures with more reactive cement is less affected by
the SCM properties. In addition, the structural build up of mixtures with a higher
water to cement ratio is less affected by the particle density of SCM and by the
level of replacement of SCM.
6. Changes in the particle number density of SCM and water to cement ratio result in
slight variations in the nucleation and growth rates of the cement particles. This
means that the effects of these parameters on the structural build up of cementitious
paste are produced by a reduction in the distance between the particles rather than
improved cement hydration.
7. The effect of the particle size on the viscosity of cementitious paste is better
explained by the particle number density than by the specific surface area.
8. The SOPR models were able to predict the viscosity of cementitious pastes at
different shear rate ranges. The parameters that governed these models are the solid
155
volume fraction, the interparticle force, and particle number density of the
cementitious particles. The models showed good accuracy to estimate the viscosity
of mixtures produced with different SCMs, SCM-cement proportions, solid volume
fractions, and different cement types.
9. The viscosity of the cementitious paste is more affected by the solid volume
fraction, which is determined by the water-to-cementitious materials ratio, than by
the properties of the cementitious particles.
10. The interparticle force is a good predictor of the bonding strength of cementitious
particles, and the combined effect of particle number density and solid volume
fraction is a good estimator of the amount of contact points of this network, which
explains most of the observed variability in the viscosity of cementitious paste.
11. The viscosity of cementitious paste is more affected by the number of contact points
between the cementitious particles than the interparticle force between them.
12. The interparticle force is governed by the surface roughness of the cementitious
materials and the water-to-cementitious materials ratio, which affects the zeta
potential of the cementitious paste.
13. The residual shear and flexural bond strengths of multi-layer SCC (RBDSh and RBF,
respectively) are affected mostly by the structural build-up of mortar. In contrast,
the cementitious paste volume is the parameter with the lowest effect on RBDSh and
RBF.
156
14. An SOPR model to predict RBDSh provided good correlations with the experimental
results of self-consolidating concrete (SCC) mixtures with different structural
build-up of mortar, cementitious paste volume, free fall height, and delay time.
15. Multi-layer casting of SCC results in a greater reduction in RBDSh than RBF,
negatively affecting the structural performance of SCC structural elements.
16. SCC mixtures with greater cementitious paste volume show lower reductions in
RBDSh and RBF making them more resilient to the casting conditions.
17. SCC mixtures with lower structural build-up of mortar can mitigate the effects of
common field issues on RBDSh and RBF, such as on-site concrete delivery delays.
18. The critical delay time, defined as the maximum time that allows 90% residual bond
strength in multi-layer casting of SCC, is governed more by RBDSh than by RBF.
19. An SOPR model to predict DTc provided good correlations with the experimental
results of SCC mixtures with different structural build-up of mortar, cementitious
paste volume, and free fall height.
20. The critical delay time is affected mostly by the structural build-up of mortar,
followed by the cementitious paste volume and the free fall height, which have
similar effects.
5.2 Future Directions
The main focus of this research is on the use of SCMs to improve the rheology of
cementitious paste, and one specific application of the results to multi-layer SCC. Future
157
work related to this research includes: 1) interactions of chemical admixtures (e.g., water
reducers) with SCMs and primary mixture design parameters influencing the rheology of
cementitious paste; 2) layer-to-layer residual bond strength in larger-scale and reinforced
SCC structures; 3) improvement of the structural-build up of 3D concrete printing through
the use of SCMs; 4) residual layer-to-layer bond strength of 3D concrete printing
structures; and 5) segregation control of stratified concrete mixtures through the use of
SCMs.
158
BIBLIOGRAPHY
ACI Committee 238. (2008). Report on Measurements of Workability and Rheology of
Fresh Concrete. Farmington Hills.
Adjoudj, M., Ezziane, K., Hadj, E., Ngo, T., and Kaci, A. (2014). “Evaluation of
rheological parameters of mortar containing various amounts of mineral addition with
polycarboxylate superplasticizer.” Construction and Building Materials, Elsevier Ltd,
70, 549–559.
Allen, D. M. (1971). “Mean Square Error of Prediction as a Criterion for Selecting
Variables.” Technometrics, 13(3), 469–475.
Assaad, J. J., and Issa, C. A. (2016). “Preliminary study on interfacial bond strength due to
successive casting lifts of self-consolidating concrete – Effect of thixotropy.”
Construction and Building Materials, Elsevier Ltd, 126, 351–360.
Assaad, J. J., and Khayat, K. H. (2006a). “Effect of Mixture Consistency on Formwork
Pressure Exerted by Highly Flowable Concrete.” Journal of Materials in Civil
Engineering, 18(6), 786–791.
Assaad, J., and Khayat, K. H. (2004). “Assessment of Thixotropy of Self-Consolidating
Concrete and Concrete-Equivalent-Mortar - Effect of Binder Composition and
159
Content.” ACI Materials Journal, 101(5), 400–408.
Assaad, J., and Khayat, K. H. (2006b). “Formwork Pressure of Self-Consolidating
Concrete Made with Various Binder Types and Contents.” ACI Materials Journal,
23(102), 215–224.
Assaad, J., Khayat, K. H., and Mesbah, H. (2004). “Assessment of Thixotropy of Flowable
and Self-Consolidating Concrete.” ACI Materials Journal, (100).
ASTM International. (2019). ASTM C595/C595M-19, Standard Specification for Blended
Hydraulic Cements. West Conshohocken, PA.
ASTM Standard C150/C150M. (2016). “Standard Specification for Portland Cement.”
Annual Book of ASTM Standards, ASTM International, West Conshohocken, PA.
Balmforth, N. J., Frigaard, I. A., and Ovarlez, G. (2013). “Yielding to Stress: Recent
Developments in Viscoplastic Fluid Mechanics.” Annual Review of Fluid Mechanics,
46(1), 121–146.
Barnes, J. M., and Johnston, D. W. (2003). “Fresh Concrete Lateral Pressure On
Formwork.” Construction Research Congress, American Society of Civil Engineers,
Reston, VA, 1–8.
Bellotto, M. (2013). “Cement paste prior to setting: A rheological approach.” Cement and
Concrete Research, Elsevier Ltd, 52, 161–168.
Bendapudi, S., and Saha, P. (2011). “Contribution of fly ash to the properties of mortar and
concrete.” Int J Earth Sci Eng, 04(06), 1017–1023.
Bentz, D. P., Ferraris, C. F., Galler, M. A., Hansen, A. S., and Guynn, J. M. (2012).
160
“Influence of particle size distributions on yield stress and viscosity of cement – fl y
ash pastes.” Cement and Concrete Research, Elsevier B.V., 42(2), 404–409.
Bentz, D. P., Ferraris, C. F., Jones, S. Z., Lootens, D., and Zunino, F. (2017). “Limestone
and silica powder replacements for cement: Early-age performance.” Cement and
Concrete Composites, Elsevier Ltd, 78, 43–56.
Bentz, D. P., Jones, S. Z., Bentz, I. R., and Peltz, M. A. (2018). “Towards the formulation
of robust and sustainable cementitious binders for 3-D additive construction by
extrusion.” Construction and Building Materials, Elsevier Inc., 175, 215–224.
Bentz, D. P., Jones, S. Z., Bentz, I. R., and Peltz, M. A. (2019). Towards the Formulation
of Robust and Sustainable Cementitious Binders for 3D Additive Construction by
Extrusion. 3D Concrete Printing Technology, Elsevier Inc.
Bingham, E. C. (1922). Fluidity and plasticity. McGraw-Hill, New York.
Bouvet, A., Ghorbel, E., and Bennacer, R. (2010a). “The mini-conical slump fl ow test :
Analysis and numerical study.” Cement and Concrete Research, Elsevier Ltd, 40(10),
1517–1523.
Bouvet, A., Ghorbel, E., and Bennacer, R. (2010b). “The mini-conical slump flow test:
Analysis and numerical study.” Cement and Concrete Research, Elsevier Ltd, 40(10),
1517–1523.
Bullard, J. W., Jennings, H. M., Livingston, R. A., Nonat, A., Scherer, G. W., Schweitzer,
J. S., Scrivener, K. L., and Thomas, J. J. (2011). “Mechanisms of cement hydration.”
Cement and Concrete Research, Elsevier B.V., 41(12), 1208–1223.
161
Burgos, D. M., Cardona, L. M., and Delvasto, S. (2014). “Estudio de dos materiales
volcánicos y efecto del tipo de molienda en su reactividad.” Revista Ingenieria de
Construccion, 29(2), 159–174.
Buswell, R. A., Leal de Silva, W. R., Jones, S. Z., and Dirrenberger, J. (2018). “3D printing
using concrete extrusion: A roadmap for research.” Cement and Concrete Research,
Elsevier, 112(October 2017), 37–49.
Chen, J. J., Thomas, J. J., Taylor, H. F. W., and Jennings, H. M. (2004). “Solubility and
structure of calcium silicate hydrate.” Cement and Concrete Research, 34(9), 1499–
1519.
Chen, T. (2020). “Preventing Wall Slip in Rheology Experiments.” TA Instruments.
Chen, Y., Figueiredo, S. C., Yalçinkaya, Ç., Çopuroğlu, O., Veer, F., and Schlangen, E.
(2019). “The effect of viscosity-modifying admixture on the extrudability of
limestone and calcined clay-based cementitious material for extrusion-based 3D
concrete printing.” Materials, 12(9), 9–12.
Cheng, D. C. H. (1986). “Yield stress: A time-dependent property and how to measure it.”
Rheologica Acta, 25(5), 542–554.
Chia, K., Kho, C., and Zhang, M. (2005). “Stability of fresh lightweight aggregate concrete
under vibration.” ACI materials journal, 102(5), 347–354.
Choi, B. Il, Kim, J. H., and Shin, T. Y. (2019). “Rheological model selection and a general
model for evaluating the viscosity and microstructure of a highly-concentrated cement
suspension.” Cement and Concrete Research, Elsevier, 123(May), 105775.
162
Chong, J. S., Christiansen, E. B., and Baer, A. D. (2018). “Rheology of concentrated
suspensions.” Journal of Applied Polymer Science, Wiley-Blackwell, 15(8), 2007–
2021.
Derjaguin, B., and Landau, L. (1941). “Theory of the stability of strongly charged
lyophobic sols and of the adhesion of strongly charged particles in solutions of
electrolytes.” Acta Physicochimica U.R.S.S., 14, 633–662.
Dhanya, B. S., Santhanam, M., Gettu, R., and Pillai, R. G. (2018). “Performance evaluation
of concretes having different supplementary cementitious material dosages belonging
to different strength ranges.” Construction and Building Materials, Elsevier Ltd, 187,
984–995.
EFNARC. (2005). The European Guidelines for Self-Compacting Concrete. The European
Guidelines for Self Compacting Concrete.
Elakneswaran, Y., Nawa, T., and Kurumisawa, K. (2009). “Zeta potential study of paste
blends with slag.” Cement and Concrete Composites, Elsevier Ltd, 31(1), 72–76.
Ersoy, B., Evcin, A., Uygunoglu, T., Akdemir, Z. B., Brostow, W., and Wahrmund, J.
(2014). “Zeta Potential-Viscosity Relationship in Kaolinite Slurry in the Presence of
Dispersants.” Arabian Journal for Science and Engineering, 39(7), 5451–5457.
Esmaeilkhanian, B., Khayat, K. H., Yahia, a., and Feys, D. (2014). “Effects of mix design
parameters and rheological properties on dynamic stability of self-consolidating
concrete.” Cement and Concrete Composites, Elsevier Ltd, 54, 21–28.
Felekoǧlu, B., Tosun, K., Baradan, B., Altun, A., and Uyulgan, B. (2006). “The effect of
163
fly ash and limestone fillers on the viscosity and compressive strength of self-
compacting repair mortars.” Cement and Concrete Research, 36(9), 1719–1726.
Ferrari, L., Kaufmann, J., Winnefeld, F., and Plank, J. (2010). “Interaction of cement model
systems with superplasticizers investigated by atomic force microscopy, zeta
potential, and adsorption measurements.” Journal of Colloid and Interface Science,
Elsevier Inc., 347(1), 15–24.
Ferraris, C., Billberg, P., Ferron, R., Feys, D., Hu, J., Kawashima, S., Koehler, E., Sonebi,
M., Tanesi, J., and Tregger, N. (2017). “Role of Rheology in Achieving Successful
Concrete Performance.” Concrete International, 39(6), 43–51.
Ferraris, C. F. (1999). “Measurement of the rheological properties of high performance
concrete: State of the art report.” Journal of Research of the National Institute of
Standards and Technology, 104(5), 461.
Ferraris, C. F., Obla, K. H., and Hill, R. (2001a). “The influence of mineral admixtures on
the rheology of cement paste and concrete.” Cement and Concrete Research, 31(2),
245–255.
Ferraris, C., Larrard, F., and Martys, N. (2001b). “Fresh concrete rheology: recent
developments.” Materials Science of Concrete, VI, 215–241.
Ferron, R. D., Shah, S., Fuente, E., and Negro, C. (2013). “Aggregation and breakage
kinetics of fresh cement paste.” Cement and Concrete Research, Elsevier B.V., 50, 1–
10.
Feys, D., and Asghari, A. (2019). “Influence of maximum applied shear rate on the
164
measured rheological properties of flowable cement pastes.” Cement and Concrete
Research, Elsevier, 117(January 2018), 69–81.
Feys, D., Cepuritis, R., Jacobsen, S., Lesage, K., Secrieru, E., and Yahia, A. (2017).
“Measuring Rheological Properties of Cement Pastes: Most common Techniques,
Procedures and Challenges.” RILEM Technical Letters, 2(June 2018), 129–135.
Feys, D., De Schutter, G., Khayat, K. H., and Verhoeven, R. (2016). “Changes in rheology
of self-consolidating concrete induced by pumping.” Materials and
Structures/Materiaux et Constructions, Springer Netherlands, 49(11), 4657–4677.
Feys, D., De Schutter, G., and Verhoeven, R. (2013). “Parameters influencing pressure
during pumping of self-compacting concrete.” Materials and Structures/Materiaux et
Constructions, 46(4), 533–555.
Finger, F. B., González, M. S., and Kern, A. P. (2015). “Control of finished work - Final
quality inspection in a social housing project.” Revista Ingenieria de Construccion,
30(2), 147–153.
Flatt, R. J. (2004). “Dispersion forces in cement suspensions.” Cement and Concrete
Research, 34(3), 399–408.
Flatt, R. J., and Bowen, P. (2006). “Yodel: A yield stress model for suspensions.” Journal
of the American Ceramic Society, 89(4), 1244–1256.
Flatt, R. J., and Bowen, P. (2007). “Yield stress of multimodal powder suspensions: An
extension of the YODEL (yield stress mODEL).” Journal of the American Ceramic
Society, 90(4), 1038–1044.
165
Franks, G. V., Zhou, Z., Duin, N. J., and Boger, D. V. (2000). “Effect of interparticle forces
on shear thickening of oxide suspensions.” Journal of Rheology, 44(4), 759–779.
Fuentes, M., Zúñiga, A., Díaz, M., Rocha, E., and Díaz, S. (2014). “Molienda mecánica
por alta energía de minerales mexicanos para producir concreto de alto desempeño
(CAD).” Revista Ingenieria de Construccion, 29(3), 256–269.
García-Alvarado, R., Martínez, A., González, L., and Auat, F. (2020). “Projections of 3D-
printed construction in Chile.” Revista ingeniería de construcción, 35(1), 60–72.
Grzeszczyk, S., and Lipowski, G. (1997). “Effect of Content and Particle Size Distribution
of High-Calcium Fly Ash on the Rheological Properties of Cement Pastes.” Cement
and Concrete Research, 27(6), 907–916.
He, X., and Shi, X. (2008). “Chloride Permeability and Microstructure of Portland Cement
Mortars Incorporating Nanomaterials.” Transportation Research Record: Journal of
the Transportation Research Board, 2070(1), 13–21.
Honorio, T., Bary, B., Benboudjema, F., and Poyet, S. (2016). “Modeling hydration
kinetics based on boundary nucleation and space-filling growth in a fixed confined
zone.” Cement and Concrete Research, 83(March 2018), 31–44.
Hot, J., Bessaies-Bey, H., Brumaud, C., Duc, M., Castella, C., and Roussel, N. (2014).
“Adsorbing polymers and viscosity of cement pastes.” Cement and Concrete
Research, Elsevier Ltd, 63(October 2012), 12–19.
Huang, H., Huang, T., Yuan, Q., Zhou, D., Deng, D., and Zhang, L. (2019). “Temperature
dependence of structural build-up and its relation with hydration kinetics of cement
166
paste.” Construction and Building Materials, Elsevier Ltd, 201, 553–562.
Jalal, M., Fathi, M., and Farzad, M. (2013). “Mechanics of Materia ls Effects of fly ash and
TiO 2 nanoparticles on rheological , mechanical , microstructural and thermal
properties of high strength self compacting concrete.” INTERNATIONAL JOURNAL
OF MECHANICS AND MATERIALS, Elsevier Ltd, 61, 11–27.
Jallo, L. J., Chen, Y., Bowen, J., Etzler, F., and Dave, R. (2011). “Prediction of inter-
particle adhesion force from surface energy and surface roughness.” Journal of
Adhesion Science and Technology, 25(4–5), 367–384.
Jiao, D., Shi, C., Yuan, Q., An, X., Liu, Y., and Li, H. (2017). “Effect of constituents on
rheological properties of fresh concrete-A review.” Cement and Concrete
Composites, Elsevier Ltd, 83, 146–159.
Juenger, M. C. G., and Siddique, R. (2015). “Recent advances in understanding the role of
supplementary cementitious materials in concrete.” Cement and Concrete Research,
Elsevier Ltd, 78, 71–80.
Kashani, A., San, R., Qiao, G. G., Deventer, J. S. J. Van, and Provis, J. L. (2014).
“Modelling the yield stress of ternary cement – slag – fl y ash pastes based on particle
size distribution.” Powder Technology, Elsevier B.V., 266, 203–209.
Khan, S. U., Nuruddin, M. F., Ayub, T., and Shafiq, N. (2014). “Effects of different mineral
admixtures on the properties of fresh concrete.” The Scientific World Journal,
Hindawi Publishing Corporation, 2014(February).
Khayat, K. H., and Assaad, J. J. (2007). “Effect of w/cm and High-Range Water-Reducing
167
Admixture on Formwork Pressure and Thixotropy of Self-Consolidating Concrete.”
ACI Materials Journal, 21(103).
Khayat, K. H., and Feys, D. (2010). Design, Production and Placement of Self-
Consolidating Concrete. Springer, Montreal, Canada.
Khayat, K. H., Omran, A. F., Naji, S., Billberg, P., and Yahia, A. (2012). “Field-oriented
test methods to evaluate structural build-up at rest of flowable mortar and concrete.”
Materials and Structures/Materiaux et Constructions, 45(10), 1547–1564.
Kim, J. H., Han, S. H., and Choi, B. Il. (2020). “Influence of pumping pressure on the
viscosity curve and rheological stability of mortar incorporating polycarboxylate.”
Cement and Concrete Composites, Elsevier Ltd, 105(February 2019), 103419.
Kim, J. H., Jang, H. R., and Yim, H. J. (2015). “Sensitivity and accuracy for rheological
simulation of cement-based materials.” Computers and Concrete, 15(6), 903–919.
Krieger, I. M., and Dougherty, T. J. (1959). “A Mechanism for Non‐Newtonian Flow in
Suspensions of Rigid Spheres.” Transactions of the Society of Rheology, 3(1), 137–
152.
De la Varga, I., Castro, J., Bentz, D. P., Zunino, F., and Weiss, J. (2018). “Evaluating the
hydration of high volume fly ash mixtures using chemically inert fillers.”
Construction and Building Materials, Elsevier Ltd, 161, 221–228.
de Larrard, F., Ferraris, C. F., and Sedran, T. (1998). “Fresh concrete: A Herschel-Bulkley
material.” Materials and Structures, 31(7), 494–498.
Larson, R. G. (1999). The Structure and Rheology of Complex Fluids. Oxford University
168
Press Inc, New York.
Laskar, A. I., and Talukdar, S. (2008). “Rheological behavior of high performance concrete
with mineral admixtures and their blending.” Construction and Building Materials,
22(12), 2345–2354.
Le, T. T., Austin, S. A., Lim, S., Buswell, R. A., Gibb, A. G. F., and Thorpe, T. (2012).
“Mix design and fresh properties for high-performance printing concrete.” Materials
and Structures/Materiaux et Constructions, 45(8), 1221–1232.
Lecompte, T., and Perrot, A. (2017). “Non-linear modeling of yield stress increase due to
SCC structural build-up at rest.” Cement and Concrete Research, Elsevier Ltd, 92,
92–97.
Lee, S. H., Kim, H. J., Sakai, E., and Daimon, M. (2003). “Effect of particle size
distribution of fly ash-cement system on the fluidity of cement pastes.” Cement and
Concrete Research, 33(5), 763–768.
Lionberger, R. A. (2002). “Viscosity of bimodal and polydisperse colloidal suspensions.”
Physical Review E, 65(6), 11.
Liu, D. M. (2000). “Particle packing and rheological property of highly-concentrated
ceramic suspensions: φm determination and viscosity prediction.” Journal of
Materials Science, 35(21), 5503–5507.
Lowke, D., and Gehlen, C. (2017). “The zeta potential of cement and additions in
cementitious suspensions with high solid fraction.” Cement and Concrete Research,
Elsevier Ltd, 95, 195–204.
169
Lu, C., Yang, H., and Mei, G. (2015). “Relationship between slump flow and rheological
properties of self compacting concrete with silica fume and its permeability.”
Construction and Building Materials, Elsevier Ltd, 75, 157–162.
Ma, G., and Wang, L. (2018). “A critical review of preparation design and workability
measurement of concrete material for largescale 3D printing.” Frontiers of Structural
and Civil Engineering, 12(3), 382–400.
Ma, S., Qian, Y., and Kawashima, S. (2018). “Experimental and modeling study on the
non-linear structural build-up of fresh cement pastes incorporating viscosity
modifying admixtures.” Cement and Concrete Research, Elsevier, 108(March), 1–9.
Mahmoodzadeh, F., and Chidiac, S. E. (2013). “Rheological models for predicting plastic
viscosity and yield stress of fresh concrete.” Cement and Concrete Research, Elsevier
Ltd, 49, 1–9.
Malaeb, Z., Hachem, H., Tourbah, A., Maalouf, T., El Zarwi, N., and Hamzeh, F. (2015).
“3D Concrete Printing: Machine and Mix Design.” International Journal of Civil
Engineering and Technology, 6(April), 14–22.
Malvern Instruments. (2012). Understanding Yield Stress Measurements.
Malvern Instruments Limited. (2015). Overcoming and quantifying “Wall Slip” in
measurements made on a rotational rheometer.
Mantellato, S., Palacios, M., and Flatt, R. J. (2019). “Relating early hydration , specific
surface and flow loss of cement pastes.” Materials and Structures, Springer
Netherlands, 52(1), 1–17.
170
Mardani-Aghabaglou, A., Tuyan, M., Yilmaz, G., Ariöz, Ö., and Ramyar, K. (2013).
“Effect of different types of superplasticizer on fresh, rheological and strength
properties of self-consolidating concrete.” Construction and Building Materials,
Elsevier Ltd, 47, 1020–1025.
Maron, S. H., and Pierce, P. E. (1956). “Application of ree-eyring generalized flow theory
to suspensions of spherical particles.” Journal of Colloid Science, 11(1), 80–95.
Matos, P. R. de, Oliveira, A. L. de, Pelisser, F., and Prudêncio, L. R. (2018). “Rheological
behavior of Portland cement pastes and self-compacting concretes containing
porcelain polishing residue.” Construction and Building Materials, Elsevier Ltd, 175,
508–518.
McKinsey Global Institute. (2017). “Reinventing Construction: A Route To Higher
Productivity.” McKinsey & Company, (February), 20.
Megid, W. A., and Khayat, K. H. (2017). “Bond strength in multilayer casting of self-
consolidating concrete.” ACI Structural Journal, 114(3), 467–476.
Megid, W. A., and Khayat, K. H. (2019). “Effect of structural buildup at rest of self-
consolidating concrete on mechanical and transport properties of multilayer casting.”
Construction and Building Materials, Elsevier Ltd, 196, 626–636.
Mehdipour, I., and Khayat, K. H. (2017). “Effect of particle-size distribution and specific
surface area of different binder systems on packing density and flow characteristics
of cement paste.” Cement and Concrete Composites, Elsevier Ltd, 78, 120–131.
Mo, K. H., Ling, T.-C., Alengaram, U. J., Yap, S. P., and Yuen, C. W. (2017). “Overview

171
of supplementary cementitious materials usage in lightweight aggregate concrete.”
Construction and Building Materials, Elsevier Ltd, 139, 403–418.
Montgomery, D., and Runger, G. (2014). Applied Statistics and Probability for Engineers.
Wiley and Sons, Hoboken, NJ.
Montgomery, D., and Runger, G. C. (2003). Applied Statistics and Probability for
Engineers. Wiley, Phoenix.
Mostafa, A. M., and Yahia, A. (2016). “New approach to assess build-up of cement-based
suspensions.” Cement and Concrete Research, Elsevier Ltd, 85, 174–182.
Mostafa, A. M., and Yahia, A. (2017). “Physico-chemical kinetics of structural build-up of
neat cement-based suspensions.” Cement and Concrete Research, Elsevier Ltd, 97,
11–27.
Nägele, E. (1986). “The Zeta-potential of cement part II: Effect of ph-value.” Cement and
Concrete Mineral Admixtures, 16(c), 853–863.
Narasimha Reddy, P., and Kavyateja, B. V. (2020). “Durability performance of high
strength concrete incorporating supplementary cementitious materials.” Materials
Today: Proceedings, Elsevier Ltd, (xxxx).
Navarrete, I., Hube, M. A., Kurama, Y., and Lopez, M. (2017a). “Flexural behavior of
stratified reinforced concrete: construction, testing, analysis, and design.” Materials
and Structures/Materiaux et Constructions, 50(4).
Navarrete, I., Hube, M. A. M. A., Kurama, Y., and Lopez, M. (2017b). “Flexural behavior
of stratified reinforced concrete: construction, testing, analysis, and design.”
172
Materials and Structures/Materiaux et Constructions, 50(4).
Navarrete, I., Kurama, Y., Escalona, N., and Lopez, M. (2020). “Impact of physical and
physicochemical properties of supplementary cementitious materials on structural
build-up of cement-based pastes.” Cement and Concrete Research, Elsevier,
130(January), 105994.
Navarrete, I., and Lopez, M. (2016). “Estimating the segregation of concrete based on
mixture design and vibratory energy.” Construction and Building Materials, Elsevier
Ltd, 122, 384–390.
Navarrete, I., and Lopez, M. (2017). “Understanding the relationship between the
segregation of concrete and coarse aggregate density and size.” Construction and
Building Materials, 149.
NIST/SEMATECH. (2012). “e-Handbook of Statistical Methods.”
<https://www.itl.nist.gov/div898/handbook/index.htm> (Aug. 6, 2019).
Oey, T., Kumar, A., Bullard, J. W., Neithalath, N., and Sant, G. (2013). “The filler effect:
The influence of filler content and surface area on cementitious reaction rates.”
Journal of the American Ceramic Society, 96(6), 1978–1990.
Ohshima, H., and Makino, K. (2014). Colloid and Interface Science in Pharmaceutical
Research and Development. Elsevier.
Ojeda-Farías, O., Hebraud, P., Lootens, D., Liard, M., and Mendoza-Rangel, J. M. (2019).
“Thixotropy of reactive suspensions: The case of cementitious materials.”
Construction and Building Materials, 212, 121–129.
173
Ouyang, J., Han, B., Cheng, G., Zhao, L., and Ou, J. (2018). “A viscosity prediction model
for cement paste with nano-SiO2 particles.” Construction and Building Materials,
185, 293–301.
Pacheco-Torgal, F., Jalali, S., Labrincha, J., and John, V. M. (2013). Eco-Efficient
Concrete. Woodhead Publishing, Cambridge, UK.
Panda, B., Wei Tay, Y., Chandra Paul, S., Fai Leong, K., Jen, T. M., and Gibson, I. (2016).
“Current Challenges and Future Perspectives of 3D Concrete Printing.” 2nd
International Conference on Progress in Additive Manufacturing, (May), 16–19.
Park, C. K., Noh, M. H., and Park, T. H. (2005). “Rheological properties of cementitious
materials containing mineral admixtures.” Cement and Concrete Research, 35(5),
842–849.
PCA. (2018). “Chemical admixtures.” <https://www.cement.org/cement-concrete-
applications/concrete-materials/chemical-admixtures>.
Perrot, A., Rangeard, D., and Pierre, A. (2016). “Structural built-up of cement-based
materials used for 3D-printing extrusion techniques.” Materials and Structures,
Springer Netherlands, 1213–1220.
Petit, J., Khayat, K. H., and Wirquin, E. (2006). “Coupled effect of time and temperature
on variations of yield value of highly flowable mortar.” 36, 832–841.
Petit, J. Y., Wirquin, E., Vanhove, Y., and Khayat, K. (2007). “Yield stress and viscosity
equations for mortars and self-consolidating concrete.” Cement and Concrete
Research, 37(5), 655–670.
174
Petrou, M. F., Harries, K. A., Gadala-Maria, F., and Kolli, V. G. (2000). “A unique
experimental method for monitoring aggregate settlement in concrete.” Cement and
Concrete Research, 30(5), 809–816.
Pierre, A. P. A., and Picandet, S. V. V. (2015). “Prediction of lateral form pressure exerted
by concrete at low casting rates.” Materials and Structures, Springer Netherlands,
2315–2322.
Proverbs, D. G., Holt, G. D., and Olomolaiye, P. O. (1999). “Productivity rates and
construction methods for high rise concrete construction: A comparative evaluation
of UK, German and French contractors.” Construction Management and Economics,
17(1), 45–52.
Qian, Y., and Kawashima, S. (2018). “Distinguishing dynamic and static yield stress of
fresh cement mortars through thixotropy.” Cement and Concrete Composites,
Elsevier Ltd, 86, 288–296.
Ravina, L. (1998). Everything you want to know about Coagulation & Flocculation ....
Zeta-Meter, Inc., Staunton, Virginia.
Romero, C. P., Jeldres, R. I., Quezada, G. R., Concha, F., and Toledo, P. G. (2018). “Zeta
potential and viscosity of colloidal silica suspensions: Effect of seawater salts, pH,
flocculant, and shear rate.” Colloids and Surfaces A: Physicochemical and
Engineering Aspects, Elsevier, 538(August 2017), 210–218.
Roussel, N. (2006). “A thixotropy model for fresh fluid concretes: Theory, validation and
applications.” Cement and Concrete Research, 36(10), 1797–1806.
175
Roussel, N. (2012). Understanding the rheology of concrete. Understanding the Rheology
of Concrete, (N. Roussel, ed.), Woodhead Publishing, Philadelphia.
Roussel, N., and Cussigh, F. (2008). “Distinct-layer casting of SCC: The mechanical
consequences of thixotropy.” Cement and Concrete Research, 38(5), 624–632.
Roussel, N., Lemaître, A., Flatt, R. J., and Coussot, P. (2010). “Steady state flow of cement
suspensions: A micromechanical state of the art.” Cement and Concrete Research,
Elsevier Ltd, 40(1), 77–84.
Roussel, N., Ovarlez, G., Garrault, S., and Brumaud, C. (2012). “The origins of thixotropy
of fresh cement pastes.” Cement and Concrete Research, Elsevier Ltd, 42(1), 148–
157.
Roussel, N., Staquet, S., Schwarzentruber, L. D. A., Le Roy, R., and Toutlemonde, F.
(2007). “SCC casting prediction for the realization of prototype VHPC-precambered
composite beams.” Materials and Structures/Materiaux et Constructions, 40(9), 877–
887.
Rubio-Hernández, F. J. (2018). “Rheological behavior of fresh cement pastes.” Fluids,
3(4).
Saleh Ahari, R., Kemal Erdem, T., and Ramyar, K. (2015). “Effect of various
supplementary cementitious materials on rheological properties of self-consolidating
concrete.” Construction and Building Materials, Elsevier Ltd, 75, 89–98.
Saleh, R., Kemal, T., and Ramyar, K. (2015). “Thixotropy and structural breakdown
properties of self consolidating concrete containing various supplementary
176
cementitious materials.” CEMENT AND CONCRETE COMPOSITES, Elsevier Ltd,
59, 26–37.
Sant, G., Ferraris, C. F., and Weiss, J. (2008). “Rheological properties of cement pastes :
A discussion of structure formation and mechanical property development.” Cement
and Concrete Research, Elsevier Ltd, 38(11), 1286–1296.
Scherer, G. W., Zhang, J., and Thomas, J. J. (2012). “Nucleation and growth models for
hydration of cement.” Cement and Concrete Research, Elsevier Ltd, 42(7), 982–993.
Schneider, M., Romer, M., Tschudin, M., and Bolio, H. (2011). “Sustainable cement
production—present and future.” Cement and Concrete Research, 41(7), 642–650.
Secrieru, E., Mohamed, W., Fataei, S., and Mechtcherine, V. (2020). “Assessment and
prediction of concrete flow and pumping pressure in pipeline.” Cement and Concrete
Composites, Elsevier Ltd, 107(November 2019), 103495.
Shen, L., Bahrami Jovein, H., Sun, Z., Wang, Q., and Li, W. (2015). “Testing dynamic
segregation of self-consolidating concrete.” Construction and Building Materials,
Elsevier Ltd, 75, 465–471.
Shen, L., Jovein, H. B., and Li, M. (2014). “Measuring static stability and robustness of
self-consolidating concrete using modified Segregation Probe.” Construction and
Building Materials, 70, 210–216.
Shen, L., Struble, L., and Lange, D. (2009). “Modeling dynamic segregation of self-
consolidating concrete.” ACI Materials Journal, 106(4), 375–380.
Shen, Y., Wang, Y., Yang, Y., Sun, Q., Luo, T., and Zhang, H. (2019). “Influence of
177
surface roughness and hydrophilicity on bonding strength of concrete-rock interface.”
Construction and Building Materials, Elsevier Ltd, 213, 156–166.
Shirzadi Javid, A. A., Ghoddousi, P., Ghodrati Amiri, G., and Donyadideh, K. (2019). “A
new photogrammetry method to study the relationship between thixotropy and bond
strength of multi-layers casting of self-consolidating concrete.” Construction and
Building Materials, Elsevier Ltd, 204, 530–540.
Snee, R. D. (1977). “Validation of Regression Models: Methods and Examples.”
Technometrics, 19(4), 415–428.
Solak, A. M., Tenza-Abril, A. J., and Baeza-Brotons, F. (2018). “Image analysis
applications for the study of segregation in lightweight concretes.” International
Journal of Computational Methods and Experimental Measurements, 6(4), 835–846.
Sonebi, M., and Amziane, S. (2017). “3D Printing of Fibre Cement-Based Materials: Fresh
and Rheological Performances.” 2nd International Conference On bio-Based
Building Materials.
Srinivasan, S., Barbhuiya, S. A., Charan, D., and Pandey, S. P. (2010). “Characterising
cement-superplasticiser interaction using zeta potential measurements.” Construction
and Building Materials, Elsevier Ltd, 24(12), 2517–2521.
Stern, O. (1924). “Zur Theorie der Elektrolytischen Doppelschicht.” Zeitschrift für
Elektrochemie, 30(508), 508–516.
Struble, L., and Sun, G. K. (1995). “Viscosity of Portland cement paste as a function of
concentration.” Advanced Cement Based Materials, 2(2), 62–69.
178
Sun, A., and Gunasekaran, S. (2009). Yield stress in foods: Measurements and
applications. International Journal of Food Properties.
Tattersall, G. H., and Baker, P. H. (1988). “The effect of vibration on the rheological
properties of fresh concrete.” Magazine of Concrete Research, 40(143), 79–89.
Tattersall, G. H., and Banfill, P. F. G. (1983). The Rheology of Fresh Concrete. Pitman
Books Limited, London, England.
Thomas, J. J. (2007). “A new approach to modeling the nucleation and growth kinetics of
tricalcium silicate hydration.” Journal of the American Ceramic Society, 90(10),
3282–3288.
Vance, K., Kumar, A., Sant, G., and Neithalath, N. (2013). “The rheological properties of
ternary binders containing Portland cement, limestone, and metakaolin or fly ash.”
Cement and Concrete Research, Elsevier Ltd, 52, 196–207.
Vanhove, Y., Helnan-Moussa, B., and Wirquin, E. (2013). “Effect of temperature on the
thixotropic behaviour of self-consolidating concrete.” Magazine of Concrete
Research, 65(1), 52–62.
Vargas, R., and Sciaraffia, R. (2006). “Diseño y evaluación de hormigones
autocompactantes (HAC).” Ingeniería de Construcción, 21(1), 57–70.
Verdugo, M., Cal, M., and Fernández, C. (2005). Análisis Econométrico: Una
Aproximación Práctica con Shazam. DELTA.
Verwey, E. J. W. (1947). “Theory of the stability of lyophobic colloids.” Journal of
Physical and Colloid Chemistry, 51(3), 631–636.
179
Wallevik, O. H., Feys, D., Wallevik, J. E., and Khayat, K. H. (2015). “Avoiding inaccurate
interpretations of rheological measurements for cement-based materials.” Cement and
Concrete Research, Elsevier Ltd.
Wangler, T., Lloret, E., Reiter, L., Hack, N., Gramazio, F., Kohler, M., Bernhard, M.,
Dillenburger, B., Buchli, J., Roussel, N., and Flatt, R. (2016). “Digital Concrete:
Opportunities and Challenges.” RILEM Technical Letters, 1, 67.
Yahia, A., and Khayat, K. H. (2001). “Analytical models for estimating yield stress of high-
performance pseudoplastic grout.” Cement and Concrete Research, 31(5), 731–738.
Yim, H. J., Kim, J. H., and Shah, S. P. (2013). “Cement particle flocculation and breakage
monitoring under Couette flow.” Cement and Concrete Research, Elsevier Ltd, 53,
36–43.
Youness, D., Mechaymech, A., and Al Wardany, R. (2020). “Flow assessment and
development towards sustainable self-consolidating concrete using blended basalt and
limestone-cement systems.” Journal of Cleaner Production, Elsevier Ltd.
Yuan, Q., Zhou, D., Khayat, K. H., Feys, D., and Shi, C. (2017). “On the measurement of
evolution of structural build-up of cement paste with time by static yield stress test vs.
small amplitude oscillatory shear test.” Cement and Concrete Research, Elsevier,
99(September 2016), 183–189.
Yuan, Q., Zhou, D., Li, B., Huang, H., and Shi, C. (2018). “Effect of mineral admixtures
on the structural build-up of cement paste.” Construction and Building Materials,
Elsevier Ltd, 160, 117–126.
180
Yun, K., Choi, S., and Heum, J. (2015). “Effects of admixtures on the rheological
properties of high-performance wet-mix shotcrete mixtures.” Construction and
Building Materials, Elsevier Ltd, 78, 194–202.
Zeta-Meter Inc. (1997). The Interaction of Colloids. Technial Note.
Zhang, J., Weissinger, E. A., Peethamparan, S., and Scherer, G. W. (2010). “Early
hydration and setting of oil well cement.” Cement and Concrete Research, Elsevier
Ltd, 40(7), 1023–1033.
Zhao, Y., Xing, W., Xu, N., and Wong, F. (2005). “Effects of inorganic electrolytes on zeta
potentials of ceramic microfiltration membranes.” 42(71), 117–121.
Zhou, Z., Solomon, M. J., Scales, P. J., and Boger, D. V. (1999). “The yield stress of
concentrated flocculated suspensions of size distributed particles.” Journal of
Rheology, 43(3), 651–671.
Zhu, J., Shu, X., Tang, J., Li, T., Ran, Q., and Liu, J. (2020). “Effect of microfines from
manufactured sand on yield stress of cement paste.” Construction and Building
Materials, Elsevier Ltd, 120987.