Genetic Admixture and Population Substructure in Guanacaste Costa Rica
10
Genetic Admixture and Population Substructure in Guanacaste Costa Rica Zhaoming Wang 1,2 , Allan Hildesheim 1 , Sophia S. Wang 1,3 , Rolando Herrero 4 , Paula Gonzalez 4 , Laurie Burdette 1,2 , Amy Hutchinson 1,2 , Gilles Thomas 5 , Stephen J. Chanock 1 , Kai Yu 1 * 1 Division of Cancer Epidemiology and Genetics, National Cancer Institute, Rockville, Maryland, United States of America, 2 Core Genotyping Facility, SAIC Frederick, Inc., National Cancer Institute - Frederick, Frederick, Maryland, United States of America, 3 Division of Etiology, Department of Population Sciences, Beckman Research Institute and the City of Hope, Duarte, California, United States of America, 4 Proyecto Epidemiologico Guanacaste, San Jose, Costa Rica, 5 Synergie-Lyon-Cancer, Universite Lyon 1, Lyon, France Abstract The population of Costa Rica (CR) represents an admixture of major continental populations. An investigation of the CR population structure would provide an important foundation for mapping genetic variants underlying common diseases and traits. We conducted an analysis of 1,301 women from the Guanacaste region of CR using 27,904 single nucleotide polymorphisms (SNPs) genotyped on a custom Illumina InfiniumII iSelect chip. The program STRUCTURE was used to compare the CR Guanacaste sample with four continental reference samples, including HapMap Europeans (CEU), East Asians (JPT+CHB), West African Yoruba (YRI), as well as Native Americans (NA) from the Illumina iControl database. Our results show that the CR Guanacaste sample comprises a three-way admixture estimated to be 43% European, 38% Native American and 15% West African. An estimated 4% residual Asian ancestry may be within the error range. Results from principal components analysis reveal a correlation between genetic and geographic distance. The magnitude of linkage disequilibrium (LD) measured by the number of tagging SNPs required to cover the same region in the genome in the CR Guanacaste sample appeared to be weaker than that observed in CEU, JPT+CHB and NA reference samples but stronger than that of the HapMap YRI sample. Based on the clustering pattern observed in both STRUCTURE and principal components analysis, two subpopulations were identified that differ by approximately 20% in LD block size averaged over all LD blocks identified by Haploview. We also show in a simulated association study conducted within the two subpopulations, that the failure to account for population stratification (PS) could lead to a noticeable inflation in the false positive rate. However, we further demonstrate that existing PS adjustment approaches can reduce the inflation to an acceptable level for gene discovery. Citation: Wang Z, Hildesheim A, Wang SS, Herrero R, Gonzalez P, et al. (2010) Genetic Admixture and Population Substructure in Guanacaste Costa Rica. PLoS ONE 5(10): e13336. doi:10.1371/journal.pone.0013336 Editor: Dennis O’Rourke, University of Utah, United States of America Received June 24, 2010; Accepted August 23, 2010; Published October 13, 2010 This is an open-access article distributed under the terms of the Creative Commons Public Domain declaration which stipulates that, once placed in the public domain, this work may be freely reproduced, distributed, transmitted, modified, built upon, or otherwise used by anyone for any lawful purpose. Funding: This project has been funded in whole or in part with federal funds from the National Cancer Institute, National Institutes of Health, under Contract No. HHSN261200800001E. The content of this publication does not necessarily reflect the views or policies of the Department of Health and Human Services, nor does mention of trade names, commercial products, or organizations imply endorsement by the U.S. Government. The funders had no role in study design, data collection and analysis, decision to publish, or preparation of the manuscript. Competing Interests: Some authors are affilated with the SAIC Frederick, Inc, with federal funds from the National Cancer Institute, National Institutes of Health, under Contract No. HHSN261200800001E. The SAIC-Frederick is specifically and solely a government contractor for the NCI. There is no competing interest. * E-mail: [email protected] Introduction Costa Rica (CR) has a population of about 4 million people mainly comprising two self–described ethnic groups, known as Whites and Mestizos. The recent history of CR suggests that its present population originates from all three major continental populations, namely, Native American, European and African. Such gene flow and admixing scenario provides with a unique resource and a great potential for detecting genes underlying susceptibility to common diseases and traits [1]. The beauty of admixture mapping has been shown in many successful disease mapping projects [2–4]. Charac- terization and analysis of genetic composition of the CR population is critical for future genetic association studies, including genome-wide association studies, based on CR or similar admixed population. A detailed analysis of the underlying population substructure can also yield additional clues regarding the history and geographic distribution of the CR population. It was reported that the CR population is admixed with 61% European, 30% Native American and 9% African populations on average with variations among different regions in CR [5]. In the Chorotega region, which encompasses Guanacaste, the admixture proportions become 51% European, 35% Native American and 14% African. Most CR studies focused on the Central Valley population and its use in complex diseases mapping investigation [6]. Here we report our detailed population structure analyses based on the data set of 1,301 women from the Guanacaste region of CR genotyped on Illumina InfiniumII iSelect panel containing 27,904 tag SNPs [7]. Results Heterozygosity comparison We evaluated the mean heterozygosity among the four continental reference populations and the CR rural samples over PLoS ONE | www.plosone.org 1 October 2010 | Volume 5 | Issue 10 | e13336
-
Upload
independent -
Category
Documents
-
view
1 -
download
0
Transcript of Genetic Admixture and Population Substructure in Guanacaste Costa Rica
Genetic Admixture and Population Substructure inGuanacaste Costa RicaZhaoming Wang1,2, Allan Hildesheim1, Sophia S. Wang1,3, Rolando Herrero4, Paula Gonzalez4, Laurie
Burdette1,2, Amy Hutchinson1,2, Gilles Thomas5, Stephen J. Chanock1, Kai Yu1*
1 Division of Cancer Epidemiology and Genetics, National Cancer Institute, Rockville, Maryland, United States of America, 2 Core Genotyping Facility, SAIC Frederick, Inc.,
National Cancer Institute - Frederick, Frederick, Maryland, United States of America, 3 Division of Etiology, Department of Population Sciences, Beckman Research Institute
and the City of Hope, Duarte, California, United States of America, 4 Proyecto Epidemiologico Guanacaste, San Jose, Costa Rica, 5 Synergie-Lyon-Cancer, Universite Lyon 1,
Lyon, France
Abstract
The population of Costa Rica (CR) represents an admixture of major continental populations. An investigation of the CRpopulation structure would provide an important foundation for mapping genetic variants underlying common diseasesand traits. We conducted an analysis of 1,301 women from the Guanacaste region of CR using 27,904 single nucleotidepolymorphisms (SNPs) genotyped on a custom Illumina InfiniumII iSelect chip. The program STRUCTURE was used tocompare the CR Guanacaste sample with four continental reference samples, including HapMap Europeans (CEU), EastAsians (JPT+CHB), West African Yoruba (YRI), as well as Native Americans (NA) from the Illumina iControl database. Ourresults show that the CR Guanacaste sample comprises a three-way admixture estimated to be 43% European, 38% NativeAmerican and 15% West African. An estimated 4% residual Asian ancestry may be within the error range. Results fromprincipal components analysis reveal a correlation between genetic and geographic distance. The magnitude of linkagedisequilibrium (LD) measured by the number of tagging SNPs required to cover the same region in the genome in the CRGuanacaste sample appeared to be weaker than that observed in CEU, JPT+CHB and NA reference samples but strongerthan that of the HapMap YRI sample. Based on the clustering pattern observed in both STRUCTURE and principalcomponents analysis, two subpopulations were identified that differ by approximately 20% in LD block size averaged overall LD blocks identified by Haploview. We also show in a simulated association study conducted within the twosubpopulations, that the failure to account for population stratification (PS) could lead to a noticeable inflation in the falsepositive rate. However, we further demonstrate that existing PS adjustment approaches can reduce the inflation to anacceptable level for gene discovery.
Citation: Wang Z, Hildesheim A, Wang SS, Herrero R, Gonzalez P, et al. (2010) Genetic Admixture and Population Substructure in Guanacaste Costa Rica. PLoSONE 5(10): e13336. doi:10.1371/journal.pone.0013336
Editor: Dennis O’Rourke, University of Utah, United States of America
Received June 24, 2010; Accepted August 23, 2010; Published October 13, 2010
This is an open-access article distributed under the terms of the Creative Commons Public Domain declaration which stipulates that, once placed in the publicdomain, this work may be freely reproduced, distributed, transmitted, modified, built upon, or otherwise used by anyone for any lawful purpose.
Funding: This project has been funded in whole or in part with federal funds from the National Cancer Institute, National Institutes of Health, under Contract No.HHSN261200800001E. The content of this publication does not necessarily reflect the views or policies of the Department of Health and Human Services, nor doesmention of trade names, commercial products, or organizations imply endorsement by the U.S. Government. The funders had no role in study design, datacollection and analysis, decision to publish, or preparation of the manuscript.
Competing Interests: Some authors are affilated with the SAIC Frederick, Inc, with federal funds from the National Cancer Institute, National Institutes of Health,under Contract No. HHSN261200800001E. The SAIC-Frederick is specifically and solely a government contractor for the NCI. There is no competing interest.
* E-mail: [email protected]
Introduction
Costa Rica (CR) has a population of about 4 million people mainly
comprising two self–described ethnic groups, known as Whites and
Mestizos. The recent history of CR suggests that its present
population originates from all three major continental populations,
namely, Native American, European and African. Such gene flow
and admixing scenario provides with a unique resource and a great
potential for detecting genes underlying susceptibility to common
diseases and traits [1]. The beauty of admixture mapping has been
shown in many successful disease mapping projects [2–4]. Charac-
terization and analysis of genetic composition of the CR population is
critical for future genetic association studies, including genome-wide
association studies, based on CR or similar admixed population. A
detailed analysis of the underlying population substructure can
also yield additional clues regarding the history and geographic
distribution of the CR population.
It was reported that the CR population is admixed with 61%
European, 30% Native American and 9% African populations on
average with variations among different regions in CR [5]. In the
Chorotega region, which encompasses Guanacaste, the admixture
proportions become 51% European, 35% Native American and
14% African. Most CR studies focused on the Central Valley
population and its use in complex diseases mapping investigation
[6]. Here we report our detailed population structure analyses
based on the data set of 1,301 women from the Guanacaste region
of CR genotyped on Illumina InfiniumII iSelect panel containing
27,904 tag SNPs [7].
Results
Heterozygosity comparisonWe evaluated the mean heterozygosity among the four
continental reference populations and the CR rural samples over
PLoS ONE | www.plosone.org 1 October 2010 | Volume 5 | Issue 10 | e13336

the set of 2,663 structure inference SNPs (Figure 1). It is evident
that the pattern of heterozygosity differs among the four reference
populations and the CR rural samples. It is notable that the SNPs
from the Illumina 550 K were based on a tagging strategy that
targeted the SNPs with minor allele frequencies (MAFs) greater
than 5% in CEU. Consequently, heterozygosity for the CEU
samples is probably overestimated, compared with that expected
from a set of randomly selected SNPs. This explains why the mean
heterozygosity is the highest for CEU rather than what would have
been expected, i.e. for YRI which may not have undergone the
population bottlenecks experienced by the ‘‘out of Africa’’
populations [8] and is believed to have the highest genetic
diversity. However we did observe that the mean heterozygosity of
the CR rural samples is indeed different from that for the CEU,
NA, YRI and ASIAN populations. The large variance in the
estimated heterozygosity observed in the NA samples could be due
to the fact that the NA samples were pooled from three different
Native American subpopulations (Figure 1).
STRUCTURE and principal components analysisTo infer the population structure in the CR population, we
applied the STRUCTURE program to the pooled dataset,
including the four reference population sets (CEU, YRI, ASIAN
and NA) without informing the program which sample was the
reference sample. We allowed the program in such an unsuper-
vised mode to infer the underlying ancestral populations as well as
the ancestral proportion for each subject, with the number of
ancestral populations K fixed at 3, 4, 5, 6, 7, and 8. For a given K,
we ran STRUCTURE 10 times with different random seeds
(10000 iterations for burn-in phase and 10000 iterations for
Markov chain optimization) and recorded L(K), the log likelihood
of the data given K, from each run. We used the metric DK
proposed by Evanno et al. [9] to find the optimal K, which is
selected to have the largest DK value. As shown in Figure S1, the
inferred number of ancestral populations for the pooled data is 4.
Figure 2 plotted average coefficients over 10 independent
STRUCTURE runs at K = 4. It indicates that the CR rural
samples are derived mainly from a three-way admixture and that
the three inferred underlying ancestral populations resemble
closely the European, Native American and African reference
populations supplied. The overall admixture proportions for our
CR rural samples are 42.5%, 38.3% and 15.2% for Europeans,
Native Indians and Africans, respectively. The overall Asian
component is estimated to be approximately 4%. Except for a few
samples with strong Asian origin, we believe that most of the
samples have minimal Asian admixture proportion. Overall, our
results are consistent with the conclusions of historians that CR
Figure 1. Mean sample heterozygosity by population. Mean sample heterozygosity for each sample was calculated as the number ofheterozygote genotypes divided by the total number of non-missing genotypes for the set of 2,663 structure inference SNPs. The sample sizes are 89ASIAN, 59 YRI, 56 NA, 60 CEU and 1301 CR, respectively.doi:10.1371/journal.pone.0013336.g001
Genetic Admixtures
PLoS ONE | www.plosone.org 2 October 2010 | Volume 5 | Issue 10 | e13336
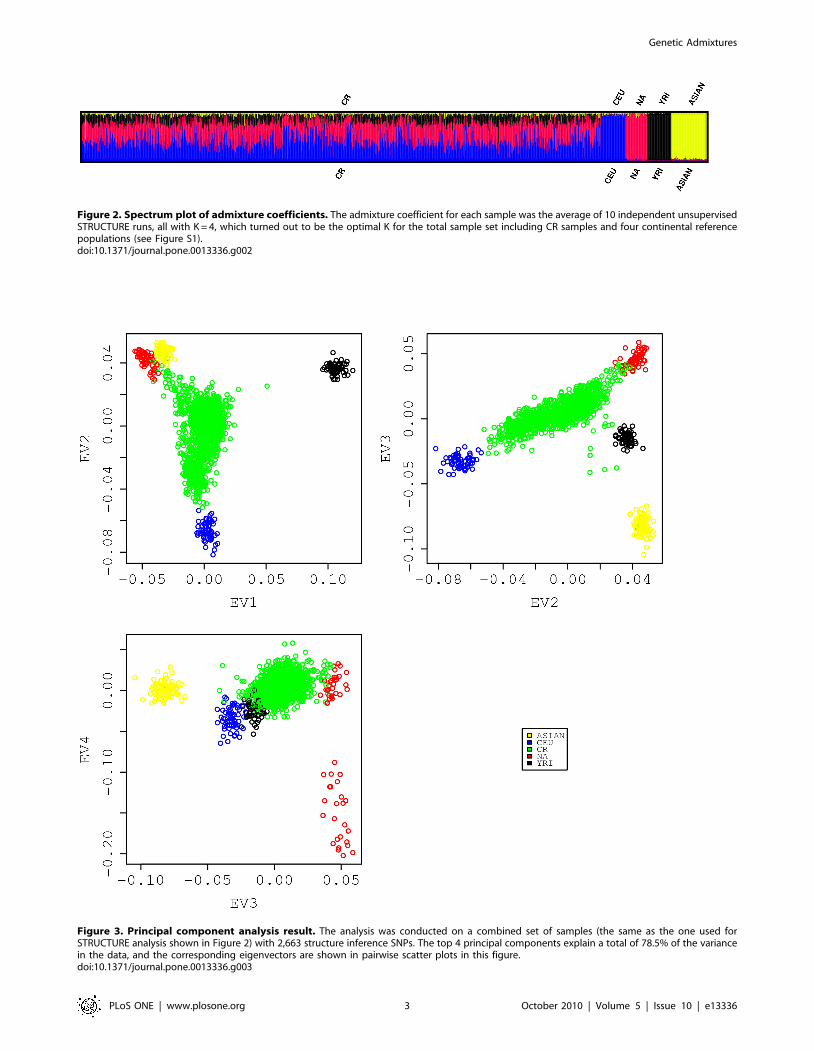
Figure 2. Spectrum plot of admixture coefficients. The admixture coefficient for each sample was the average of 10 independent unsupervisedSTRUCTURE runs, all with K = 4, which turned out to be the optimal K for the total sample set including CR samples and four continental referencepopulations (see Figure S1).doi:10.1371/journal.pone.0013336.g002
Figure 3. Principal component analysis result. The analysis was conducted on a combined set of samples (the same as the one used forSTRUCTURE analysis shown in Figure 2) with 2,663 structure inference SNPs. The top 4 principal components explain a total of 78.5% of the variancein the data, and the corresponding eigenvectors are shown in pairwise scatter plots in this figure.doi:10.1371/journal.pone.0013336.g003
Genetic Admixtures
PLoS ONE | www.plosone.org 3 October 2010 | Volume 5 | Issue 10 | e13336

was settled mainly by local Native Americans and the influx of
both European and West African populations [10].
Principal components analysis was applied to reveal a finer
population substructure in the same pooled data used in the
STRUCTURE analysis above. Pairwise eigenvector (EV)
comparisons are shown in Figure 3. The results again suggest
that the CR rural sample is an admixture [11]. In that figure, the
dispersed CR rural samples sit in the middle of a plane enclosed
by reference populations. It lies mainly along a line joining the
two parental populations (CEU and NA), and the line gets pulled
and becomes skewed toward YRI (EV2 versus EV1). The Asian
population contributes very little to the CR genetic pool other
than one obvious Asian sample and six other obvious Asian
admixed samples lying between the gravity center of the green
CR cluster and the yellow Asian cluster (EV3 versus EV2). The
fourth eigenvector separates the Pima Indians from the
Colombians and Mayans. The latter would appear to resemble
ancestors for CR more closely, since the geographical location of
their habitat was closer to Costa Rica whereas the Pima Indians
lived mostly in the southern Arizona of the United States (EV4
versus EV3).
In view of the relatively minor genetic contribution of Asians
(,5%) to the CR rural samples, we refined our analysis by
removing the 56 samples with Asian admixture proportion greater
than 10% and conducted the STRUCTURE analysis on this
modified CR rural samples by supplying the program with three
reference populations: CEU, YRI and NA. We excluded the Pima
Indians but kept the Columbians and Mayans, as suggested by the
PCA results shown in Figure 3. The main differences from the
initial STRUCTURE run described above are the use of a priori
information to fix each reference population and letting the
program estimate only three admixture coefficients for the CR
rural samples. A triangular plot of the admixture fractions for each
subject is shown in Figure 4. The PCA was also performed on the
refined CR rural samples together with three reference popula-
tions. It is remarkable that the projected values of the CR rural
samples on the EV1 and EV2 axes correlated extremely well with
their corresponding admixture coefficients estimated by STRUC-
Figure 4. Triangular plot of the admixture coefficients. The supervised STRUCTURE analysis was performed on a refined CR sample settogether with three continental reference population sample sets. Coordinates on each axis indicate the admixture proportions from European (CEU),African (YRI) and Native American (Colombian and Mayan) ancestral populations. Each green circle inside the triangle corresponds to a CR sample,and the coordinates on three axes for each sample always add up to 1. The reference samples are at each vortex of the triangle (not shown) becausewe fixed those as the ancestral populations and inferred three proportion numbers for each CR sample in this analysis.doi:10.1371/journal.pone.0013336.g004
Genetic Admixtures
PLoS ONE | www.plosone.org 4 October 2010 | Volume 5 | Issue 10 | e13336

TURE (Figure 5). Values on the EV1 and EV2 axes correlated
well with the YRI and NA admixture coefficients, respectively.
Overall, the model-based STRUCTURE and model-free PCA
analyses provided consistent results on the degree of admixture of
three populations, namely, the CEU, YRI and NA (Colombian
and Mayan groups).
The variability measured by the standard deviation of the
African admixture coefficient in the CR rural samples was 0.07,
which is smaller than the 0.13 observed for the European
admixture coefficient. The low variability in the African admixture
coefficients observed in the CR rural samples indicates that the
major admixing of the African population happened during a
relatively early and brief period of time. In this respect, the
admixing of African ancestry in the CR rural samples fits the
Hybrid-Isolation model [12]. In contrast, it is likely that the larger
variablility observed in the European admixture coefficient is due
to the admixing pattern of European ancestry in the CR rural
samples, which continued for a longer period of time, with the
constant influx of new European immigrants. This admixture
pattern is consistent with the Constant Gene Flow (CGF) model
[12]. The histogram comparing the European and African
admixture coefficients is shown in Figure S2. The observed
bimodality suggests that there are substructures in the CR rural
samples.
The relationship between population substructure andgeographic location
It is also interesting to note that the local geographic regions
(known as cantones) of the CR rural samples are correlated with
their projected positions on the EV1-EV2 plane. We color-coded
the subjects in the EV1-EV2 plane according to the cantons from
which they were sampled (Figure 6). Two coastal regions (Santa
Cruz and Nicoya) and one inland region (Tilaran) are
highlighted, using dark green, brown and purple, respectively,
in the figure. All other cantons in Guanacaste are included as
grey circles in the background, as samples from each of the
regions are more or less randomly distributed on the EV1-EV2
plane. Santa Cruz samples (dark green) have larger EV1 values,
corresponding to a larger proportion of African ancestry. Some
Nicoya samples (brown) co-localized with Santa Cruz, and some
samples have larger EV2 values, corresponding to a larger
proportion of Native Americans ancestry. Most Tilaran samples
(purple) have low EV2 and large EV1 values resembling the CEU
samples closely. We found subjects in these three cantons (Santa
Cruz, Nicoya, and Tilaran) have significantly different European
(or African, or Native American) admixture coefficients (the
Kruskal-Wallis rank sum test P-value less than 10215). These
results are consistent with demographic data indicating that
Nicoya was among the indigenous provinces and was inhabited
Figure 5. Correlation between STRUCTURE admixture coefficients and PCA eigenvectors for CR samples. Both STRUCTURE analysis andPCA are based on the same data set as detailed in the legend of Figure 4. Pearson correlation coefficients are 20.99 for CEU admixture proportionversus EV1 (left panel) and 0.96 for NA admixture proportion versus EV2 (right panel).doi:10.1371/journal.pone.0013336.g005
Genetic Admixtures
PLoS ONE | www.plosone.org 5 October 2010 | Volume 5 | Issue 10 | e13336

by several native tribes whereas Tilaran is known to be a more
affluent region with a fair number of more recent European
immigrants.
Subpopulation characterization and potential effect ofpopulation stratification
Two CR subpopulations could be observed (Figure 4). One
group centers around 40% CEU, 40% NA and 20% YRI and the
other group centers around 60% CEU, 30% NA and 10% YRI.
To evaluate the two subpopulations (characterized as low-CEU or
high-CEU admixture) further, we sampled 200 subjects from each
subpopulation to form a data set with a total of 400 samples. We
used genotypes at the 25,450 SNPs after quality control filtering
for the further subpopulation analyses.
To identify SNPs that have different genotype distribution
between these two subpopulations, we ran a logistic regression
with additive genotype effect between the two subpopulations.
The top 10 most differentiated loci are listed in Table S1.
Interestingly, the top two loci were in the neighborhood of
pigmentation-related genes, such as the rs1426654 SNP within
SLC24A5, which is an ancestry-informative marker (AIM) with a
wide variance in allele frequencies among different populations
according to skin pigmentation [13]. Both the SLC24A5 and
SLC45A2 genes were found in a genome-wide association study to
be significantly associated with skin-reflectance measurements
[14]. This evolutionarily conserved ancestral allele predominates
in African and East Asian populations, whereas the variant allele
is nearly fixed due to natural selection in European populations
[15]. For the set of 400 samples, we have 137 samples with
genotype AA, 81 samples with genotype GG and 182 with
genotype AG for rs1426654. The overall frequency for allele A is
57%, which is close to the overall European ancestry for our CR
rural samples.
To assess the potential effect of population stratification on
association analyses using the CR rural population, we simulated a
scenario in which individuals with AA genotypes at rs1426654
were selected as cases and individuals with the other two genotypes
were selected as controls. This resulted in 137 cases, out of which
119 (86%) were from the high-CEU subpopulation and 18 from
the low-CEU subpopulation, and 263 controls, out of which 81
were from the high-CEU subpopulation and 245 (93%) from the
low-CEU subpopulation. We conducted the association test based
on a logistic regression model with the additive genotype effect,
and observed an inflation factor of 1.76. The inflation factor
dropped to 1.014 after the adjustment for the top two eigenvectors
(see Figure S3 for Q-Q plot comparison). Although the simulated
case represents an extreme scenario, the strong PS effect can still
be corrected for adequately by the adjustment for eigenvectors.
Figure 7 compares the average LD block size for each
chromosome between the two subpopulations based on Haplotype
analysis [16]. The group with the high-CEU admixture had
average block sizes that were larger than those observed for the
Figure 6. Substructure mirrors geographic location. The principal components analysis was performed on the refined CR samples (excluding56 with greater than 10% Asian ancestry) together with three reference populations (CEU, NA and YRI). Three cantones (Nicoya, Santa Cruz andTilaran) in Guanacaste are shown to have distinct distributions in the EV1versus EV2 scatter plot.doi:10.1371/journal.pone.0013336.g006
Genetic Admixtures
PLoS ONE | www.plosone.org 6 October 2010 | Volume 5 | Issue 10 | e13336
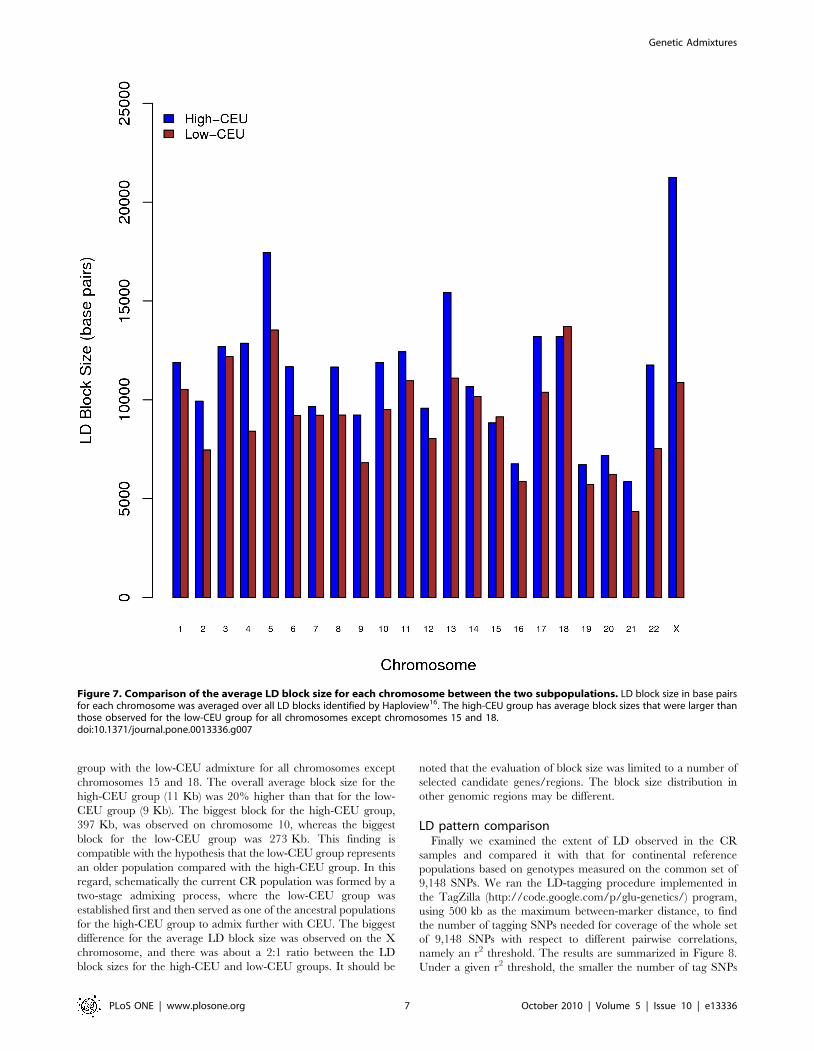
group with the low-CEU admixture for all chromosomes except
chromosomes 15 and 18. The overall average block size for the
high-CEU group (11 Kb) was 20% higher than that for the low-
CEU group (9 Kb). The biggest block for the high-CEU group,
397 Kb, was observed on chromosome 10, whereas the biggest
block for the low-CEU group was 273 Kb. This finding is
compatible with the hypothesis that the low-CEU group represents
an older population compared with the high-CEU group. In this
regard, schematically the current CR population was formed by a
two-stage admixing process, where the low-CEU group was
established first and then served as one of the ancestral populations
for the high-CEU group to admix further with CEU. The biggest
difference for the average LD block size was observed on the X
chromosome, and there was about a 2:1 ratio between the LD
block sizes for the high-CEU and low-CEU groups. It should be
noted that the evaluation of block size was limited to a number of
selected candidate genes/regions. The block size distribution in
other genomic regions may be different.
LD pattern comparisonFinally we examined the extent of LD observed in the CR
samples and compared it with that for continental reference
populations based on genotypes measured on the common set of
9,148 SNPs. We ran the LD-tagging procedure implemented in
the TagZilla (http://code.google.com/p/glu-genetics/) program,
using 500 kb as the maximum between-marker distance, to find
the number of tagging SNPs needed for coverage of the whole set
of 9,148 SNPs with respect to different pairwise correlations,
namely an r2 threshold. The results are summarized in Figure 8.
Under a given r2 threshold, the smaller the number of tag SNPs
Figure 7. Comparison of the average LD block size for each chromosome between the two subpopulations. LD block size in base pairsfor each chromosome was averaged over all LD blocks identified by Haploview16. The high-CEU group has average block sizes that were larger thanthose observed for the low-CEU group for all chromosomes except chromosomes 15 and 18.doi:10.1371/journal.pone.0013336.g007
Genetic Admixtures
PLoS ONE | www.plosone.org 7 October 2010 | Volume 5 | Issue 10 | e13336

required, the stronger the LD in that population. Among each of
the continental reference populations, it appeared that YRI
required the largest number of tag SNPs (i.e., had the smallest LD)
and NA required the lowest number of tag SNPs (i.e., had the
highest LD) to cover the same genomic region, with CEU and
ASIAN falling in between. The magnitude of LD observed in the
CR rural samples was stronger than that in YRI but weaker than
the ones in the NA, CEU and ASIAN populations. It should be
noted that the magnitude of LD observed in the YRI, CEU and
ASIAN populations based on the set of 9,148 SNPs may have been
underestimated, since this set of SNPs was selected based on a
multiethnic tagging strategy targeting these three continental
populations.
Discussion
A thorough understanding of the population substructure of the
CR population can provide valuable information for study design,
analytical strategies and interpretation of gene mapping projects.
Our results show that the Guanacaste region of CR is a heavily
admixed population, composed mainly of European (42.5%) and
Native American (38.3%) ancestries, with considerable African
influence (15.2%). We can not exclude a small influence from
Asians (4%). Geographic patterns of the genome admixture in
Latin American Mestizos were recently investigated [17] with
similar admixture proportions being observed across the board for
Latinos.
Recent studies have shown the sex-biased admixture in Latino
populations including CR, using mitochondrial DNA (mtDNA)
to trace the maternal contribution and Y-chromosome markers
to trace the patrilineal input to these highly admixed popu-
lations [18,19]. Genetic variation on X chromosome could also
be used as a resource for inferring the sex bias in the admixture
[20,21]. However, we couldn’t confirm possible sex-biased
admixture in the CR rural sample due to the limited number of
independent SNPs on the X chromosome in our genotype data
set.
Based on the observed LD comparison with other reference
populations, it appears that more SNPs are required to cover the
genome for a GWAS study using this CR rural population
compared to European or European American population.
However this population may be more useful in the follow-up
investigation to conduct fine-mapping studies to select the optimal
candidate variants for subsequent functional analyses. A more
detailed knowledge of the underlying genetic structure in the CR
population will require additional genotyping before we can assess
the population genetics history even more precisely as well as
design and conduct proper gene-mapping studies in CR or a
comparable highly admixed population.
Materials and Methods
Ethics statementWe have obtained informed written consent from all partici-
pants involved in this study. We have obtained ethics approval for
this study from the Institutional Review Board at NCI and all
involved institutions/hospitals in Costa Rica.
Figure 8. LD comparison among the CR rural population and its ancestral populations. Number of tag SNPs needed to cover the samegene regions was used as a measurement for the strength of LD. Populations with stronger LD would need less number of SNPs tagging the regionsgiven certain r2 threshold compared to populations with weaker LD.doi:10.1371/journal.pone.0013336.g008
Genetic Admixtures
PLoS ONE | www.plosone.org 8 October 2010 | Volume 5 | Issue 10 | e13336
Study populationWe analyzed a total of 1,301 women from Guanacaste, CR, a
region located on the Northern Pacific region of CR, with 27,904
SNPs genotyped on a custom Illumina InfiniumII iSelect chip.
Those SNPs were selected based on a multiethnic tagging strategy
targeting over 1,000 candidate genes/regions in three HapMap
reference populations: European (CEU), African (YRI) and Asian
(JPT+CHB). The 1,000 candidate genes/regions were selected to
investigate a range of cancers, and the data was generated as part
of a study by Wang et al. [7], in which they evaluated the
association between common genetic variants and risk for human
papillomavirus (HPV) persistence and progression to cervical
cancer based on a sample of subjects collected from a population-
based cohort study of women in Guanacaste, CR [22,23]. Among
those 1,301 subjects, there are 416 cervical intraepithelial
neoplasia 3 (CIN3)/cancer cases, 356 HPV persistent cases, 425
random controls, and 104 subjects with histological diagnosis of
CIN2. Although these 1,301 subjects were not a random sample
from Guanacaste region, the genetic characteristics observed in
this large sample should nevertheless give us a relatively
comprehensive picture on the genetic landscape of the Guanacaste
region population. In the following discussion, we will call this
sample set the CR rural samples.
For the continental reference population, we used HapMap
(build 23) genotypes including unrelated subjects only (i.e., 60
CEU, 59 YRI and 89 JPT+CHB). We also obtained genotypes
from the Illumina iControl database for 56 Native Americans
(NAs), including 18 Mayans, 25 Pima Indians and 13 Colombians.
All of the 56 NAs were verified by the PREST program [24] to be
unrelated individuals.
SNP selectionAfter standard quality-control (QC) filtering [7], a stable data
set with 25,450 SNPs was generated and made available for
further analysis. Subsequently we identified a set of 9,148 SNPs
that were common among the iSelect panel for the CR rural
samples, Illumina 550 K (used for NA samples) and HapMap
SNPs.
To select SNPs with low background LD for the purpose of
population substructure inference, we applied a SNP filtering
algorithm [25] sequentially on each of the YRI, ASIAN, CEU, NA
and CR rural samples and identified a total of 2,663 (29%)
population structure inference SNPs, each with an r2,0.1
(measured in each of the five sample sets) for any pair of SNPs
within a distance of 500 Kb.
Data analysisFor the population structure analysis, we applied the model
based STRUCTURE program [26–28] to estimate the admixture
proportion for the CR rural samples. The CLUMPP program [29]
was used to resolve the label switching and compute the average
admixture coefficients. Subsequently the DISTRUCT program
[30] was used to plot the spectrum of resulting admixture
coefficients for all samples. Complementary to the STRUCTURE
analysis, principal components analysis (PCA) [31,32] was applied
to reveal a finer population substructure. Haplotype analyses were
performed using Haploview [16] to estimate the average LD block
size.
Supporting Information
Figure S1 Inference of the best K for CR using STRUCTURE.
DK was calculated as m|L‘‘(K)|/s[L(K)], where m|L’’(K)| is the
mean of the absolute values of L‘‘(K) averaged over 10 runs and
s[L(K)] is the standard deviation of L(K).
Found at: doi:10.1371/journal.pone.0013336.s001 (0.12 MB TIF)
Figure S2 Histograms of YRI (left) and CEU (right) admixture
proportions for CR samples. The standard deviation for YRI
admixture coefficients is 0.07 compared with 0.13 for CEU
admixture coefficients. The bi-modality indicates there are
substructures in the CR samples.
Found at: doi:10.1371/journal.pone.0013336.s002 (0.59 MB TIF)
Figure S3 Q-Q plot of association tests. We observed that
adjustment by the top 2 eigenvector could effectively reduce the
inflation factor in our simulated test.
Found at: doi:10.1371/journal.pone.0013336.s003 (0.39 MB TIF)
Table S1 Loci with different genotype frequencies between the
two subpopulations.
Found at: doi:10.1371/journal.pone.0013336.s004 (0.03 MB
DOC)
Author Contributions
Conceived and designed the experiments: ZW GT SJC KY. Performed the
experiments: ZW KY. Analyzed the data: ZW KY. Contributed reagents/
materials/analysis tools: ZW AH SW RH PG LB AH KY. Wrote the
paper: ZW AH SW RH PG LB AH GT SJC KY.
References
1. Patterson N, Petersen DC, Ross RE, Sudoyo H, Glashoff RH, et al. (2010)
Genetic structure of a unique admixed population: implications for medical
research. Hum Mol Genet 19(3): 411–9.
2. Parra EJ, Hoggart CJ, Bonilla C, Dios S, Norris JM, et al. (2004) Relation of
type 2 diabetes to individual admixture and candidate gene polymorphisms in
the HispanicAmerican population of San Luis Valley, Colorado. J Med Genet
41: e116.
3. Zhu X, Luke A, Copper RS, Quertermous T, Hanis C, et al. (2005) Admixture
mapping for hypertension loci with genome-scan markers. Nat Genet 37:
177–181.
4. Freedman ML, Haiman CA, Patterson N, McDonald GJ, Tandon A, et al.
(2006) Admixture mapping identifies 8q24 as a prostate cancer risk locus in
African-American men. Proc Natl Acad Sci USA 103: 14068–14073.
5. Morera B, Barrantes R, Marin-Rojas R (2003) Gene admixture in the Costa
Rican population. Ann of Hum Genet 67(1): 71–80.
6. Morera B, Barrantes R (2004) Is the Central Valley of Costa Rica a genetic
isolate? Rev Biol Trop 52(3): 629–644.
7. Wang SS, Gonzalez P, Yu K, Porras C, Li Q, et al. (2010) Common genetic
variants and risk for HPV persistence and progression to cervical cancer. PLoS
One 5(1): e8667.
8. Reed FA, Tishkoff SA (2006) African human diversity, origins and migrations.
Curr Opin Genet Dev 16: 597–605.
9. Evanno G, Regnaut S, Goudet J (2005) Detecting the number of clusters of individuals
using the software STRUCTURE: a simulation study. Mol Ecol 14: 2611–2620.
10. Olien M (1980) Black and part-Black populations in colonial Costa Rica:
Ethnohistorical resources and problems. Ethnohistory 27: 13–29.
11. McVean G (2009) A Genealogical Interpretation of Principal ComponentsAnalysis. PLoS Genet 5(10): e1000686.
12. Pfaff CL, Parra EJ, Bonilla C, Hiester K, McKeigue PM, et al. (2001) Population
structure in admixed populations: effect of admixture dynamics on the pattern oflinkage disequilibrium. Am J Hum Genet 68: 198–207.
13. Giardina E, Pietrangeli I, Martı́nez-Labarga C, Martone C, de Angelis F, et al.
(2008) Haplotypes in SLC24A5 gene as ancestry informative markers in differentpopulations. Curr Genomics 9(2): 110–114.
14. Stokowski RP, Pant PV, Dadd T, Fereday A, Hinds DA, et al. (2007) A
genomewide association study of skin pigmentation in a South Asian population.
Am J Hum Genet 81(6): 1119–1132.
15. Lamason RL, Mohideen MA, Mest JR, Wong AC, Norton HL, et al. (2005)SLC24A5, a putative cation exchanger, affects pigmentation in zebrafish and
humans. Science 310(5755): 1782–1786.
16. Barrett JC, Fry B, Maller J, Daly MJ (2005) Haploview: analysis andvisualization of LD and haplotype maps. Bioinformatics 21(2): 263–265.
17. Wang S, Ray N, Rojas W, Parra MV, Bedoya G, et al. (2008) Geographic
patterns of genome admixture in Latin American Mestizos. PLoS Genet 4(3):
e1000037.
Genetic Admixtures
PLoS ONE | www.plosone.org 9 October 2010 | Volume 5 | Issue 10 | e13336
18. Martı́nez Cruzado JC (2002) The use of mitochondrial DNA to discover pre-
Columbian migrations to the Caribbean: results for Puerto Rico andexpectations for the Dominican Republic. KACIKE: The Journal of Caribbean
Amerindian History and Anthropology [On-line Journal], Special Issue, Lynne
Guitar, Ed.19. Carvajal-Carmona LG, Ophoff R, Service S, Hartiala J, Molina J, et al. (2003)
Genetic demography of Antioquia (Colombia) and the Central Valley of CostaRica. Hum Genet 112: 534–541.
20. Schaffner SF (2004) The X chromosome in population genetics. Nat Rev Genet
5: 43–51.21. Lambert CA, Connelly CF, Madeoy J, Qiu R, Olson MV, et al. (2010) Highly
punctuated patterns of population structure on the X chromosome andimplications for African evolutionary history. Am J Hum Genet 86(1): 34–44.
22. Herrero R, Hildesheim A, Bratti C, Sherman ME, Hutchinson M, et al. (2000)Population-based study of human papillomavirus infection and cervical
neoplasia in rural Costa Rica. J Natl Cancer Inst 92: 464–474.
23. Herrero R, Schiffman MH, Bratti C, Hildesheim A, Balmaceda I, et al. (1997)Design and methods of a population-based natural history study of cervical
neoplasia in a rural province of Costa Rica: the Guanacaste Project. Rev PanamSalud Publica 1: 362–375.
24. McPeek MS, Sun L (2000) Statistical tests for detection of misspecified
relationships by use of genome-screen data. Am J Hum Genet 66: 1076–1094.
25. Yu K, Wang Z, Li Q, Wacholder S, Hunter DJ, et al. (2008) Population
substructure and control selection in genome-wide association studies. PLoS
One 3(7): e2551.
26. Falush D, Stephens M, Pritchard JK (2003) Inference of population structure
using multilocus genotype data: linked loci and correlated allele frequencies.
Genetics 164: 1567–1587.
27. Pritchard JK, Stephens M, Donnelly P (2000) Inference of population structure
using multilocus genotype data. Genetics 155: 945–959.
28. Pritchard JK, Wen X, Falush D (2007) Documentation for structure software:
Version 2.2 (accessed 2010) http://pritch.bsd.uchicago.edu/software/
structure22/readme.pdf.
29. Jakobsson M, Rosenberg NA (2007) CLUMPP: a cluster matching and
permutation program dealing with label switching and multimodality in analysis
of population structure. Bioinformatics 23(14): 1801–1806.
30. Rosenberg NA (2004) Distruct: a program for the graphical display of
population structure. Mol Ecol Notes 4: 137–138.
31. Patterson N, Price AL, Reich D (2006) Population structure and eigenanalysis.
PLoS Genet 2(12): e190.
32. Price AL, Patterson NJ, Plenge RM, Weinblatt ME, Shadick NA, et al. (2006)
Principal components analysis corrects for stratification in genome-wide
association studies. Nat Genet 38: 904–909.
Genetic Admixtures
PLoS ONE | www.plosone.org 10 October 2010 | Volume 5 | Issue 10 | e13336