European Population Substructure: Clustering of Northern and Southern Populations
Upload
independentCategory
view
0download
0
Chemical Physics Letters 378 (2003) 281–288
www.elsevier.com/locate/cplett
Vibrational substructure in the OH stretching band of water
Zhaohui Wang, Andrei Pakoulev, Yoonsoo Pang, Dana D. Dlott *
School of Chemical Sciences, University of Illinois at Urbana-Champaign, Box 01-6 CLSL, 600 S. Mathews Avenue,
Urbana, IL 61801, USA
Received 10 June 2003; in final form 2 July 2003
Published online:
Abstract
Spectral diffusion in the OH stretching (mOH) band of water is studied by ultrafast IR-Raman spectroscopy. The mOH
transition consists of two overlapping inhomogeneously broadened subbands, a broader (�500 cm�1) redshifted band
and a smaller, narrower (�200 cm�1) blueshifted band. The blueshifted band, which shows less spectral diffusion, has a
longer lifetime (0.75 vs 0.55 ps) and a smaller vibrational frequency blueshift from the ground state (65 vs 90 cm�1), is
tentatively assigned to water molecules where one hydrogen atom has a broken hydrogen bond.
� 2003 Elsevier B.V. All rights reserved.
1. Introduction
In this work, we use ultrafast IR-Raman spec-
troscopy [1], a type of 3D vibrational spectroscopy
[2], to investigate subband structures in the OHstretching band (mOH) of water. In the past few
years, ultrafast mid-IR hole-burning spectroscop-
ies have been used to study spectral diffusion
within mOH (�3000–3600 cm�1) of the HOD solute
in D2O solvent [3–9]. A combination of experiment
and related theoretical work [10–17] has now
demonstrated that spectral diffusion on the >50 fs
time scale probed by experiments so far, is causedby the forming and breaking of hydrogen bonds.
Only recently has ultrafast vibrational spec-
troscopy been applied to mOH of water [9,18–22].
* Corresponding author. Fax: +1-217-244-3186.
E-mail address: [email protected] (D.D. Dlott).
0009-2614/$ - see front matter � 2003 Elsevier B.V. All rights reserv
doi:10.1016/S0009-2614(03)01267-3
There are similarities and differences between
HOD/D2O and water. The hydrogen-bonding dy-
namics of the two are presumably quite similar
[12]. The vibrational spectra are quite different. In
HOD there are three separate bands, mOH, the ODstretch mOD, and the bend overtone 2dHOD. In water
there is a single band, a mixture of symmetric mOH,
antisymmetric mOH and 2dH2O. The vibrational
relaxation (VR) pathways are also quite different,
as a consequence of this different level structure
[9,10,23,24]. Ultrafast mid-IR experiments in
HOD probe an excitation localized mainly on
the OH group [12], whereas water experimentsprobe a mOH that is delocalized over the entire
molecule. Due to its high absorption coefficient
[25], pump–probe experiments in water necessarily
involve a bulk temperature jump (DT ¼ 30 K
is typical [19,20] but the boiling point 373 K is
easily reached), which is not a factor in dilute
HOD/D2O.
ed.
282 Z. Wang et al. / Chemical Physics Letters 378 (2003) 281–288
The large widths (FWHM �400–500 cm�1) of
the mOH bands of HOD and water are caused by a
distribution of hydrogen bond strengths. The
weaker hydrogen-bonded sites absorb near
the blue edge, and the stronger sites absorb near
the red edge. A widespread notion (see, e.g.[6,12,16]) has been the idea of a linear 1:1 rela-
tionship between hydrogen bond strength and mOH
transition frequency. Recently two independent
calculations using mixed classical and quantum
simulation techniques, by Lawrence and Skinner
[11,12] and by Rey and Hynes [16], have shown
there is indeed a reasonable correspondence be-
tween the mOH frequency and the hydrogen bondstrength. However, this correspondence is not 1:1
and there is considerable dispersion, so that the
mOH transitions for different hydrogen-bonded
configurations are broad and overlapping.
An important question not convincingly an-
swered by either experiment or theory is whether
ultrafast vibrational spectroscopy can resolve dif-
ferent hydrogen-bonded configurations within thebroad mOH band. In 1998, Laenen et al. [3,4] in-
terpreted their two-color mid-IR pump–probe
measurements on HOD/D2O in terms of three
distinct Gaussian subbands, termed (I)–(III),
which were believed to arise from distinctly dif-
ferent hydrogen-bonded configurations. On the
basis of comparisons to Rahman and Stillinger�s1971 simulations [26], these bands were assigned to(I) �ice-like�, (II) �bridged�, and (III) �bifurcated�hydrogen-bonded sites.
In HOD/D2O experiments by other groups, this
subband picture was ignored in favor of a con-
tinuous distribution picture, where mOH dynamics
were explained in terms of spectral diffusion plus a
wavenumber-dependent VR lifetime. The spectral
diffusion [5,6] involved hydrogen bond dynamicsplus what Woutersen and Bakker [5] in 1999
termed a time-dependent �vibrational Stokes shift�.The vibrational Stokes shift is formally the energy
difference between the v ¼ 0 ! 1 transition and
the v ¼ 1 ! 0 transition [13], and it is expected to
be a redshift due to stronger hydrogen bonding in
the v ¼ 1 state. The measured redshift was 70 cm�1
[5], and subsequently Lawrence and Skinner cal-culated 57 cm�1 [13]. A weakly wavenumber-de-
pendent lifetime was reported by Bakker�s group
in 1997 [27]. Laenen et al. [3] criticized this inter-
pretation, pointing out that transients at different
probe wavenumbers actually see an effective time
constant s which includes T1 and spectral diffusion.
Gale et al. [28] reported that T1 increased from 0.5
to 1.0 ps moving from the red edge to the blue edgeof the mOH band using two different methods of
analysis, the single-frequency pump–probe tech-
nique or the total area of the induced absorption.
Spectral diffusion of water was first studied by
the Dlott group in 2000 [9]. We reported that
T1 � 1 ps, and observed that VR of mOH produced
between one and two quanta of dOH. The spectral
diffusion of water on the >500 fs time scale in-volved primarily �uphill� spectral diffusion from the
red to the blue [9,22]. This net movement to the
blue raises the possibility that the energy shift be-
tween the ground and excited states might be a
blueshift in water. Bakker�s group in 2001 and
2002 [19,20] proposed a different interpretation of
water VR. Their mid-IR transients displayed two
time constants, 0.26 and 0.55 ps. The 0.26 ps timeconstant was attributed to T1 and the 0.55 ps time
constant to ground state recovery from an inter-
mediate state, possibly dH2O. Subsequently our
group used anti-Stokes probing methods to show
that the faster time constant was really due to
uphill spectral diffusion, and the slower time con-
stant was really T 1 [22].
In our view, the question of whether vibrationalsubbands corresponding to different hydrogen-
bonded configurations can be resolved within the
mOH transition of HOD/D2O has not been an-
swered convincingly. We believe that different
configurations in water should have even more
dispersion than in HOD. The mOH transition fre-
quency in water should be affected by the config-
urational disorder at both H atoms, while the mOH
transition in HOD is not strongly affected by
configurational disorder at the D atom [12]. Since
mOH transitions corresponding to different config-
urations are broad and overlapping, ordinary vi-
brational spectroscopy clearly cannot distinguish
subband structure. However, three-dimensional
techniques such as two-color IR and IR-Raman
used here provide more information. Tuning thepump pulse could affect the relative intensities of
different subbands [3], and different subbands

Z. Wang et al. / Chemical Physics Letters 378 (2003) 281–288 283
might evidence different spectral diffusion, differ-
ent VR lifetimes, and different vibrational Stokes
shifts. It is this question, the existence of vibra-
tional subbands, that is the main issue addressed
by the present work. Along the way, we have also
made the most precise measurements so far of thewater vibrational lifetime and the vibrational
Stokes shift.
Fig. 1. (a) Stokes Raman spectrum of water at ambient tem-
perature. (b–d) Anti-Stokes transient spectra at 1 ps delay time,
pumped on the red edge, band center, and blue edge. The sharp
feature is the NLS artifact. The data are fit by the sum of two
overlapping Gaussian subbands, a broader red and a narrower
blue subband mROH and mBOH, plus one Gaussian for the NLS
artifact.
2. Experimental
The experimental arrangement for IR-Raman
studies of water has been described previously[9,18]. A tunable mid-IR pulse (25 cm�1 band-
width, 370 lm diameter, �0.7 ps) pumps a selected
region of mOH. A 532 nm visible Raman probe
pulse (15 cm�1 bandwidth, 400 lm diameter, �0.7
ps, 20 lJ) generates an anti-Stokes spectrum de-
tected by a multichannel spectrograph [18]. The
anti-Stokes signal is proportional to the Raman
cross-section multiplied by the excited state pop-ulation [1]. Differences between the anti-Stokes
Raman and IR probe methods have been dis-
cussed in detail in a previous Letter [22]. Recently
we have developed a new laser [22] that has re-
sulted in a considerable improvement in sensitivity
over previous [9] work. Since our most recent
study of water [22], we have also improved our
pulse compression, leading to an �60% improve-ment in time resolution.
In the IR-Raman technique, a coherent artifact
may be generated by non-linear light scattering
(NLS) [9,18,29] at frequency xIR þ xvis. In our
anti-Stokes spectra, this artifact appears at the
same wavenumber as the pump pulse. The time
dependence of the NLS artifact, which arises from
a coherent interaction of the pump and probepulses, is used to characterize the apparatus time
response [22].
Of particular concern in water experiments is
the bulk temperature jump DT . We can accurately
calculate DT knowing the pump pulse fluence Jand the water absorption coefficient a [22]. The
pump pulse intensity was adjusted to give
DT ¼ 30� 2 K (i.e., 293 K! 323 K) at each pumpwavenumber unless otherwise indicated. For ex-
ample with 3115 cm�1 pumping where a ¼ 4640
cm�1 [25], the mid-IR energy was 25 lJ with a
beam diameter of 370 lm. More pump pulse en-
ergy is needed to produce the same DT on the
absorption edge, so at constant DT we obtain a
better signal-to-noise ratio with absorption edge
pumping.
3. Results
Fig. 1 shows the Stokes Raman spectrum of mOH
plus three representative anti-Stokes transient
spectra at t ¼ 1 ps, with pumping near the red edge
(xIR ¼ 3115 cm�1), the line center (xIR ¼ 3315cm�1) or the blue edge (xIR ¼ 3500 cm�1). The
sharper peak that appears at the pump wave-
number is the NLS artifact. Its spectral width of 35
cm�1 is the convolution of the pump and probe
pulse widths. The fitted curves in each panel are
the sum of two Gaussian subbands plus one
Gaussian for the NLS artifact. Fig. 1 shows that
the population distribution of v ¼ 1 excitationscan be shifted quite a bit to the red or to the blue
by tuning the pump pulse.
A complete time-sequence of spectra was ob-
tained with red edge 3115 cm�1 pumping, where
our signal-to-noise ratio is optimal. Fig. 2 shows a
few of these time-dependent spectra. A particularly
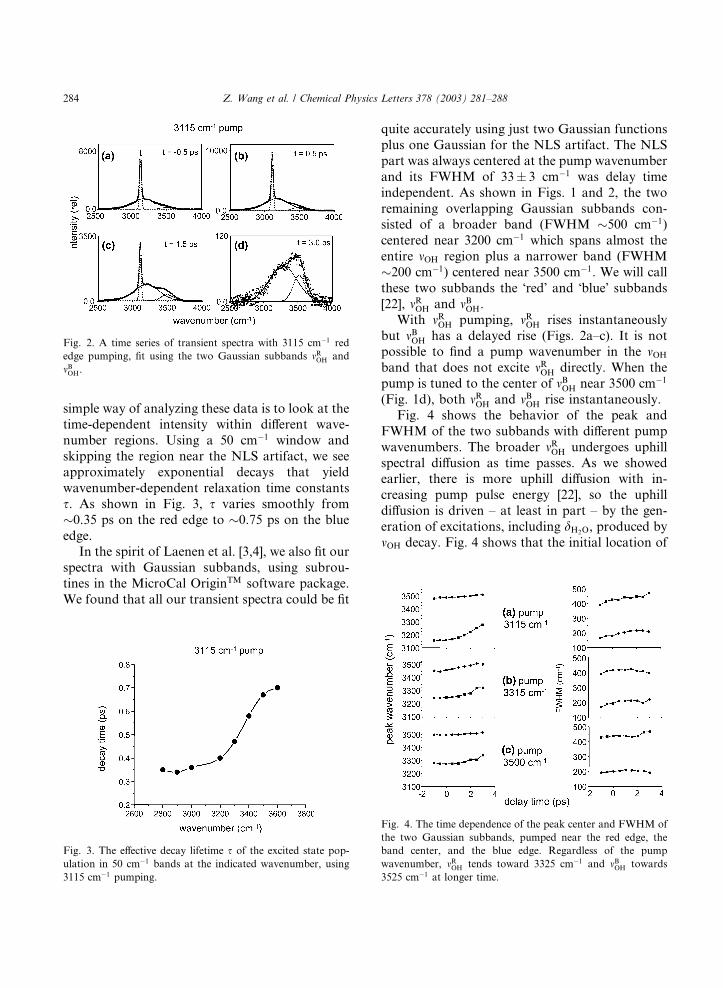
Fig. 2. A time series of transient spectra with 3115 cm�1 red
edge pumping, fit using the two Gaussian subbands mROH and
mBOH.
284 Z. Wang et al. / Chemical Physics Letters 378 (2003) 281–288
simple way of analyzing these data is to look at thetime-dependent intensity within different wave-
number regions. Using a 50 cm�1 window and
skipping the region near the NLS artifact, we see
approximately exponential decays that yield
wavenumber-dependent relaxation time constants
s. As shown in Fig. 3, s varies smoothly from
�0.35 ps on the red edge to �0.75 ps on the blue
edge.In the spirit of Laenen et al. [3,4], we also fit our
spectra with Gaussian subbands, using subrou-
tines in the MicroCal OriginTM software package.
We found that all our transient spectra could be fit
Fig. 3. The effective decay lifetime s of the excited state pop-
ulation in 50 cm�1 bands at the indicated wavenumber, using
3115 cm�1 pumping.
quite accurately using just two Gaussian functions
plus one Gaussian for the NLS artifact. The NLS
part was always centered at the pump wavenumber
and its FWHM of 33� 3 cm�1 was delay time
independent. As shown in Figs. 1 and 2, the two
remaining overlapping Gaussian subbands con-sisted of a broader band (FWHM �500 cm�1)
centered near 3200 cm�1 which spans almost the
entire mOH region plus a narrower band (FWHM
�200 cm�1) centered near 3500 cm�1. We will call
these two subbands the �red� and �blue� subbands[22], mROH and mBOH.
With mROH pumping, mROH rises instantaneously
but mBOH has a delayed rise (Figs. 2a–c). It is notpossible to find a pump wavenumber in the mOH
band that does not excite mROH directly. When the
pump is tuned to the center of mBOH near 3500 cm�1
(Fig. 1d), both mROH and mBOH rise instantaneously.
Fig. 4 shows the behavior of the peak and
FWHM of the two subbands with different pump
wavenumbers. The broader mROH undergoes uphill
spectral diffusion as time passes. As we showedearlier, there is more uphill diffusion with in-
creasing pump pulse energy [22], so the uphill
diffusion is driven – at least in part – by the gen-
eration of excitations, including dH2O, produced by
mOH decay. Fig. 4 shows that the initial location of
Fig. 4. The time dependence of the peak center and FWHM of
the two Gaussian subbands, pumped near the red edge, the
band center, and the blue edge. Regardless of the pump
wavenumber, mROH tends toward 3325 cm�1 and mBOH towards
3525 cm�1 at longer time.
Z. Wang et al. / Chemical Physics Letters 378 (2003) 281–288 285
the mROH peak can be shifted from 3150 to 3300
cm�1 by tuning the pump pulse from the red edge
to the blue edge. However, as time passes, the mROH
peak always ends up near 3325 cm�1. Whether mROH
is pumped on its red or blue edges, it broadens as it
shifts, but when mROH is pumped near its peak, ithardly broadens at all. The time-dependent uphill
spectral shift of mBOH is much smaller. The mBOH
starting location can be varied only from 3450 to
3500 cm�1. Regardless of the pump wavenumber,
the mBOH peak always ends up near 3525 cm�1. The
mBOH FWHM can be varied only in a narrow range
between 175 and 200 cm�1.
In the past, there has been some discussionwhether narrow peaks such as the one we attribute
to an NLS artifact might actually be narrow holes
burnt into the mOH band by the pump pulse
[3,4,9,30]. Our present results appear conclusive on
this point. If there were a narrow hole with for
instance 3115 cm�1 pumping, it ought to move to
the red and broaden like the rest of the mROH sub-
band. However, the narrow peak does not move orbroaden substantially, so there is no narrow hole
burnt into the mOH band.
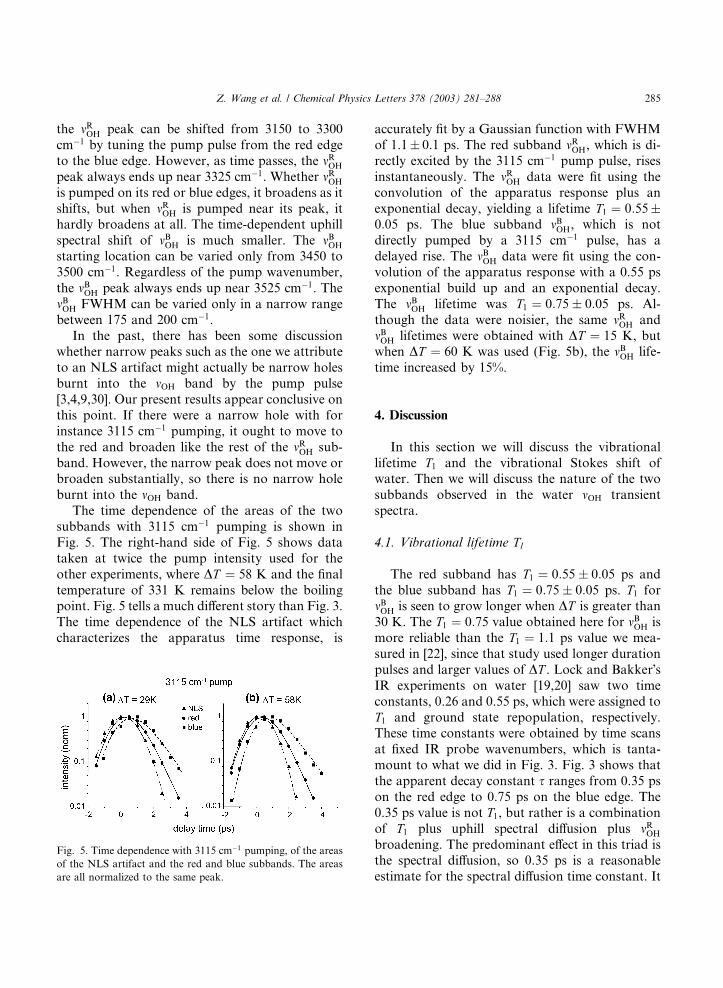
The time dependence of the areas of the two
subbands with 3115 cm�1 pumping is shown in
Fig. 5. The right-hand side of Fig. 5 shows data
taken at twice the pump intensity used for the
other experiments, where DT ¼ 58 K and the final
temperature of 331 K remains below the boilingpoint. Fig. 5 tells a much different story than Fig. 3.
The time dependence of the NLS artifact which
characterizes the apparatus time response, is
Fig. 5. Time dependence with 3115 cm�1 pumping, of the areas
of the NLS artifact and the red and blue subbands. The areas
are all normalized to the same peak.
accurately fit by a Gaussian function with FWHM
of 1.1� 0.1 ps. The red subband mROH, which is di-
rectly excited by the 3115 cm�1 pump pulse, rises
instantaneously. The mROH data were fit using the
convolution of the apparatus response plus an
exponential decay, yielding a lifetime T1 ¼ 0:55�0:05 ps. The blue subband mBOH, which is not
directly pumped by a 3115 cm�1 pulse, has a
delayed rise. The mBOH data were fit using the con-
volution of the apparatus response with a 0.55 ps
exponential build up and an exponential decay.
The mBOH lifetime was T1 ¼ 0:75� 0:05 ps. Al-
though the data were noisier, the same mROH and
mBOH lifetimes were obtained with DT ¼ 15 K, butwhen DT ¼ 60 K was used (Fig. 5b), the mBOH life-
time increased by 15%.
4. Discussion
In this section we will discuss the vibrational
lifetime T1 and the vibrational Stokes shift ofwater. Then we will discuss the nature of the two
subbands observed in the water mOH transient
spectra.
4.1. Vibrational lifetime T1
The red subband has T1 ¼ 0:55� 0:05 ps and
the blue subband has T1 ¼ 0:75� 0:05 ps. T1 formBOH is seen to grow longer when DT is greater than
30 K. The T1 ¼ 0:75 value obtained here for mBOH is
more reliable than the T1 ¼ 1:1 ps value we mea-
sured in [22], since that study used longer duration
pulses and larger values of DT . Lock and Bakker�sIR experiments on water [19,20] saw two time
constants, 0.26 and 0.55 ps, which were assigned to
T1 and ground state repopulation, respectively.These time constants were obtained by time scans
at fixed IR probe wavenumbers, which is tanta-
mount to what we did in Fig. 3. Fig. 3 shows that
the apparent decay constant s ranges from 0.35 ps
on the red edge to 0.75 ps on the blue edge. The
0.35 ps value is not T1, but rather is a combination
of T1 plus uphill spectral diffusion plus mROH
broadening. The predominant effect in this triad isthe spectral diffusion, so 0.35 ps is a reasonable
estimate for the spectral diffusion time constant. It

286 Z. Wang et al. / Chemical Physics Letters 378 (2003) 281–288
is clear that the time constants obtained by Lock
and Bakker are effective time constants that com-
bine the effects of population relaxation and
spectral diffusion. The subband analysis technique
looks only at the decay of the subband area re-
gardless of its peak shift or broadening, whichallows us to entirely separate the lifetime T1 from
spectral diffusion.
4.2. Vibrational Stokes shift
With Raman probing, the vibrational Stokes
shift should be the energy difference between the
Stokes Raman spectrum (v ¼ 0 ! 1) and the anti-Stokes spectrum (v ¼ 1 ! 0) transition [9]. It is
not immediately obvious how to reconcile the
subband picture of Laenen et al. [3,4] with the
Stokes shift picture, since different subbands could
have different shifts, and meanwhile the excited
state subband peak frequencies depend on pump
wavenumber and are moving targets due to spec-
tral diffusion. However, now we can clearly seehow to do this for water. We see two major sub-
bands in both the Stokes and the anti-Stokes
spectra and we have fully characterized the time-
dependent spectral diffusion of each subband. By
fitting the two major subbands in the Stokes
spectrum in Fig. 1a, we obtained peak values of
3235 and 3460 cm�1. The anti-Stokes data in Fig. 4
show that the red subband tends toward 3325cm�1 and the blue subband tends toward 3525
cm�1, regardless of the pump wavenumber. Since
these extrapolations are only approximate, we will
estimate an error of �10 cm�1 for the anti-Stokes
data. Thus the vibrational Stokes shift for both
bands is a blueshift in water. For mROH, Dmst ¼�90� 10 cm�1 and for mBOH, Dmst ¼ �65� 10 cm�1.
These results for the two subbands appear to beclearly different.
4.3. Vibrational substructure
The Stokes Raman spectrum of water is usually
fit by four Gaussian subbands [31], two larger
bands for the two major peaks in Fig. 1a, and
much smaller bands at the red and blue edges.However, only two subbands were needed to fit
our anti-Stokes transient data at all times and all
pump wavenumbers. This could result from more
dispersion in the spectrum of different hydrogen-
bonded configurations in the v ¼ 1 state compared
to the v ¼ 0 state of mOH, or alternatively we never
tuned the pump pulses far enough to the extreme
edges of the mOH absorption to produce muchpopulation in the edge bands. The inhomogeneous
nature of the mROH and mBOH subbands is clearly re-
vealed by Fig. 4, which shows that the peak loca-
tions and widths can be changed by tuning the
pump wavenumber. So our data compel us to
believe in two inhomogeneously broadened sub-
bands in water, but do not rule out the possibility
of other much smaller subbands. Laenen�s threesubbands in HOD [3] are quite a bit narrower than
our water subbands, which have FWHM of 500
and 200 cm�1. Laenen�s subbands, centered at
3330 cm�1 (�ice-like�), 3400 cm�1 (�bridged�) and
3500 cm�1 (�bifurcated�), had FWHM of 40, 80,
and 80 cm�1.
The recent calculations of HOD [12,16] show
that it is dangerous to infer too much about thewater structure from the vibrational spectrum.
Nevertheless we will now do so. There is some-
thing obviously special about mBOH, that distin-
guishes it from the rest of the vibrational
spectrum. It has a smaller Stokes shift and little
spectral diffusion. Increasing DT generates more of
mBOH from mROH [22]. The spectrum of mBOH looks a
great deal like the mOH frequency distribution ofnon-hydrogen-bonded HOD from Lawrence and
Skinner�s calculations shown in Fig. 6 of [12]. In
fact the similarity is truly striking. Thus the blue
subband mBOH is proposed to represent water with a
single H atom that is not hydrogen bonded. The
width of mBOH is due to dispersion in the other hy-
drogen bond lengths, angles, etc.
The average number of hydrogen bonds inwater is 3.58, meaning �58% of water molecules
have four hydrogen bonds and �40% have three
hydrogen bonds. Of the �40% with one broken
bond, �20% have one H atom with a broken hy-
drogen bond. It would be nice to look at the fits in
Figs. 1 and 2 to see if mBOH comprised 21% of the
total area; however, the ratio of mBOH to mROH areas is
not in equilibrium and depends on the pumpwavenumber. Nevertheless our data are not in-
consistent with 21%. If our interpretation of mBOH is
Z. Wang et al. / Chemical Physics Letters 378 (2003) 281–288 287
correct, its decay rate should be the sum of the VR
rate plus the rate for spontaneously reforming the
broken hydrogen bond. With an incoherent anti-
Stokes probe, it does not matter if the hydrogen
bond remains continuously broken, so the relevant
rate would be the �intermittent� rate for sponta-neously reformation [32,33]. A quite recent calcu-
lation of the lifetime (the inverse of the constant
denoted k0 [32]) from Berne�s group [34] using
several different water potential energy surfaces
gives values ranging from 1.0 to 1.5 ps, which in-
dicates that hydrogen bond reformation and VR
are both significant mBOH decay mechanisms. The
equilibrium shifts toward more broken hydrogenbonds at higher temperature, which would account
for the lifetime increase of mBOH with increasing DT .It might be possible to extract the rate for spon-
taneous hydrogen bond reformation by watching
the blue subband decay into the red subband, but
this will be difficult since we cannot pump only mBOH
without also pumping mROH.
The broader mROH, which has amplitudethroughout the mOH band, would in this picture
represent all configurations for which both H at-
oms are hydrogen bonded, including configura-
tions where O atoms have a broken hydrogen
bond. The much greater width of this dominant
subband than anything that has been proposed for
HOD [3,4], indicates that the vibrational transi-
tions of all these different configurations in wateroverlap a great deal. As explained in Section 1, this
appears to be a consequence of the sensitivity of
water stretching vibrations to configurational dis-
order at both H atoms. Although dilute solutions
are more difficult for the insensitive Raman probe
method, we hope to soon use the anti-Stokes probe
technique to reexamine the question of subbands
in HOD/D2O.
5. Concluding remarks
Our data clearly show that the water mOH
Raman spectrum can be explained by two over-
lapping subbands with different spectral diffusion,
different Stokes shifts, and different lifetimes. Wehave reconciled the Stokes shift picture with
Laenen�s subband picture by showing how to
determine the Stokes shifts of individual subbands
and found that different subbands have different
Stokes shifts. The peculiar properties of the smal-
ler blue subband suggest that it represents water
molecules with a broken hydrogen bond to one H
atom, although this tentative structural interpre-tation needs to be confirmed by simulations.
Acknowledgements
This material is based on work supported by the
National Science Foundation under Award No.
DMR-0096466, by Army Research Office Con-tract DAAD19-00-1-0036 and by Air Force Office
of Scientific Research Contract F49620-03-1-0032.
References
[1] A. Laubereau, W. Kaiser, Rev. Mod. Phys. 50 (1978) 607.
[2] D.D. Dlott, Chem. Phys. 266 (2001) 149.
[3] R. Laenen, C. Rauscher, A. Laubereau, J. Phys. Chem. B
102 (1998) 9304.
[4] R. Laenen, C. Rauscher, A. Laubereau, Phys. Rev. Lett. 80
(1998) 2622.
[5] S. Woutersen, H.J. Bakker, Phys. Rev. Lett. 83 (1999)
2077.
[6] G.M. Gale, G. Gallot, F. Hache, N. Lascoux, S. Bratos,
J.-C. Leicknam, Phys. Rev. Lett. 82 (1999) 1068.
[7] S. Bratos, G.M. Gale, G. Gallot, F. Hache, N.N. Lascoux,
J.-C. Leicknam, Phys. Rev. E 61 (2000) 5211.
[8] G. Gallot, N. Lascoux, G.M. Gale, J.-C. Leicknam,
S. Bratos, S. Pommeret, Chem. Phys. Lett. 341 (2001) 535.
[9] J.C. De�aak, L.K. Iwaki, D.D. Dlott, J. Phys. Chem. 104
(2000) 4866.
[10] C.P. Lawrence, J.L. Skinner, J. Chem. Phys. 117 (2002)
5827.
[11] C.P. Lawrence, J.L. Skinner, Chem. Phys. Lett. 369 (2003)
472.
[12] C.P. Lawrence, J.L. Skinner, J. Chem. Phys. 118 (2003)
264.
[13] C.P. Lawrence, J.L. Skinner, J. Chem. Phys. 117 (2002)
8847.
[14] A. Piryatinski, C.P. Lawrence, J.L. Skinner, J. Chem. Phys.
118 (2003) 9664.
[15] A. Piryatinski, C.P. Lawrence, J.L. Skinner, J. Chem. Phys.
118 (2003) 9672.
[16] R. Rey, K.B. Møller, J.T. Hynes, J. Phys. Chem. A 106
(2002) 11993.
[17] M. Diraison, Y. Guissani, J.-C. Leicknam, S. Bratos,
Chem. Phys. Lett. 258 (1996) 348.
[18] J.C. De�aak, L.K. Iwaki, S.T. Rhea, D.D. Dlott, J. Raman
Spectrosc. 31 (2000) 263.
288 Z. Wang et al. / Chemical Physics Letters 378 (2003) 281–288
[19] A.J. Lock, H.J. Bakker, J. Chem. Phys. 117 (2002) 1708.
[20] A.J. Lock, S. Woutersen, H.J. Bakker, J. Phys. Chem. A
105 (2001) 1238.
[21] S. Woutersen, H.J. Bakker, Nature 402 (1999) 507.
[22] A. Pakoulev, Z. Wang, D.D. Dlott, Chem. Phys. Lett. 371
(2003) 594.
[23] A. Pakoulev, Z. Wang, Y. Pang, D.D. Dlott, 2003,
unpublished.
[24] R. Rey, J.T. Hynes, J. Chem. Phys. 104 (1996) 2356.
[25] J.E. Bertie, Z. Lan, Appl. Spectrosc. 50 (1996) 1047.
[26] A. Rahman, F.H. Stillinger, J. Chem. Phys. 55 (1971) 3336.
[27] S. Woutersen, U. Emmerichs, H.J. Bakker, Science 278
(1997) 658.
[28] G.M. Gale, G. Gallot, N. Lascoux, Chem. Phys. Lett. 311
(1999) 123.
[29] R.W. Terhune, P.D. Maker, C.M. Savage, Phys. Rev. Lett.
14 (1965) 681.
[30] S. Woutersen, H.J. Bakker, J. Opt. Soc. Am. B 17 (2000)
827.
[31] S.A. Rice, in: P. Schuster et al. (Eds.), Topics in Current
Chemistry, vol. 60, Springer, New York, 1975, p. 109.
[32] A. Luzar, J. Chem. Phys. 113 (2000) 10663.
[33] F.H. Stillinger, in: I. Prigogine, S.A. Rice (Eds.), Adv.
Chem. Phys., vol. 31, Wiley, New York, 1975, p. 1.
[34] H. Xu, H.A. Stern, B.J. Berne, J. Phys. Chem. B 106 (2002)
2054.
Copyright © 2022 FDOKUMEN