European Population Substructure: Clustering of Northern and Southern Populations
13
European Population Substructure: Clustering of Northern and Southern Populations Michael F. Seldin 1* , Russell Shigeta 1 , Pablo Villoslada 2 , Carlo Selmi 3,4 , Jaakko Tuomilehto 5,6 , Gabriel Silva 7 , John W. Belmont 8 , Lars Klareskog 9 , Peter K. Gregersen 10 1 Rowe Program in Human Genetics, Departments of Biological Chemistry and Medicine, University of California Davis, Davis, California, United States of America, 2 Center for Applied Medical Research, University of Navarra, Pamplona, Spain, 3 Department of Medicine, Surgery, and Dentistry, San Paolo School of Medicine, University of Milan, Milan, Italy, 4 Department of Medicine, University of California Davis, Davis, California, United States of America, 5 Department of Epidemiology and Health Promotion, National Public Health Institute, Helsinki, Finland, 6 South Ostrobothnia Central Hospital, Seinajoki, Finland, 7 Obras Sociales del Hermano Pedro, Antigua, Guatemala, 8 Department of Molecular and Human Genetics, Baylor College of Medicine, Houston, Texas, United States of America, 9 Karolinska University Hospital, Stockholm, Sweden, 10 The Robert S. Boas Center for Genomics and Human Genetics, Feinstein Institute for Medical Research, North Shore Long Island Jewish Health System, Manhasset, New York, United States of America Using a genome-wide single nucleotide polymorphism (SNP) panel, we observed population structure in a diverse group of Europeans and European Americans. Under a variety of conditions and tests, there is a consistent and reproducible distinction between ‘‘northern’’ and ‘‘southern’’ European population groups: most individual participants with southern European ancestry (Italian, Spanish, Portuguese, and Greek) have .85% membership in the ‘‘southern’’ population; and most northern, western, eastern, and central Europeans have .90% in the ‘‘northern’’ population group. Ashkenazi Jewish as well as Sephardic Jewish origin also showed .85% membership in the ‘‘southern’’ population, consistent with a later Mediterranean origin of these ethnic groups. Based on this work, we have developed a core set of informative SNP markers that can control for this partition in European population structure in a variety of clinical and genetic studies. Citation: Seldin MF, Shigeta R, Villoslada P, Selmi C, Tuomilehto J, et al. (2006) European population substructure: Clustering of northern and southern populations. PLoS Genet 2(9): e143. DOI: 10.1371/journal.pgen.0020143 Introduction The recent development of methodologies for defining population structure has provided the ability to identify the major ethnic contributions in individual participants in diverse populations [1–7]. These statistical approaches utilize non-hierarchical clustering algorithms in which Markov chain Monte Carlo methods are used to infer ancestry, based solely on genotyping information. Furthermore, related algorithms provide methods for controlling for population stratification in genetic studies [8–10]. These methods are important in assessing the results of case-control and other non–family-based association tests. In addition, defining population structure is potentially useful both in clinical outcome studies and in the examination of pharmacologic response and toxicity. Previous studies of human population structure have primarily considered different continental populations or admixed populations between two or more different con- tinental populations [3–7]. However, some of these studies have also suggested that sub-continental differences in population structure can be discerned [4,11]. The examina- tion of population differences within Europe using mitochon- drial [12–15] or Y chromosome [16–18] haplogroups has been particularly useful in tracing part of the routes of migration and populating of Europe, but these haplogroups do not provide strong inferences on population genetic structure. Autosomal studies using small numbers of classical genetic markers (nuclear protein polymorphisms) have suggested broad genetic gradients across Europe, leading to the proposal of demic diffusion models [19–22]. These include a principal component analysis of small numbers of classic genetic markers that suggested three clines accounting for a proportion of the genetic variation in the continent [22]. Together with subsequent studies including a recent analysis of microsatellite data, these studies have provided additional support for a large Neolithic component of the European genome and a strong element of demic diffusion originating from the Near East [23,24]. However, it must be noted that the issue of Paleolithic versus Neolithic origin of Europeans is still controversial, and other recent studies examining ancient mitochondrial DNA have suggested virtually no Neolithic contribution to European populations [25]. In this report we expand on the autosomal DNA observations by examining a large number of single nucleo- tide polymorphisms (SNP) genotypes, using statistical meth- ods to directly examine population genetic structure. The results show clear evidence of large differences in population structure between southern and northern European popula- tions. In addition, we present data that extend recent studies suggesting that population structure can create false-positive Editor: Jonathan Pritchard, University of Chicago, United States of America Received May 8, 2006; Accepted July 25, 2006; Published September 15, 2006 A previous version of this article appeared as an Early Online Release on July 25, 2006 (DOI: 10.1371/journal.pgen.0020143.eor). DOI: 10.1371/journal.pgen.0020143 Copyright: Ó 2006 Seldin et al. This is an open-access article distributed under the terms of the Creative Commons Attribution License, which permits unrestricted use, distribution, and reproduction in any medium, provided the original author and source are credited. Abbreviations: CI, confidence interval; kb, kilobases; LD, linkage disequilibrium; OR, odds ratio; RA, rheumatoid arthritis; SNP, single nucleotide polymorphism * To whom correspondence should be addressed. E-mail: [email protected] PLoS Genetics | www.plosgenetics.org September 2006 | Volume 2 | Issue 9 | e143 1339
-
Upload
independent -
Category
Documents
-
view
2 -
download
0
Transcript of European Population Substructure: Clustering of Northern and Southern Populations

European Population Substructure: Clusteringof Northern and Southern PopulationsMichael F. Seldin
1*, Russell Shigeta
1, Pablo Villoslada
2, Carlo Selmi
3,4, Jaakko Tuomilehto
5,6, Gabriel Silva
7,
John W. Belmont8
, Lars Klareskog9
, Peter K. Gregersen10
1 Rowe Program in Human Genetics, Departments of Biological Chemistry and Medicine, University of California Davis, Davis, California, United States of America, 2 Center
for Applied Medical Research, University of Navarra, Pamplona, Spain, 3 Department of Medicine, Surgery, and Dentistry, San Paolo School of Medicine, University of Milan,
Milan, Italy, 4 Department of Medicine, University of California Davis, Davis, California, United States of America, 5 Department of Epidemiology and Health Promotion,
National Public Health Institute, Helsinki, Finland, 6 South Ostrobothnia Central Hospital, Seinajoki, Finland, 7 Obras Sociales del Hermano Pedro, Antigua, Guatemala,
8 Department of Molecular and Human Genetics, Baylor College of Medicine, Houston, Texas, United States of America, 9 Karolinska University Hospital, Stockholm,
Sweden, 10 The Robert S. Boas Center for Genomics and Human Genetics, Feinstein Institute for Medical Research, North Shore Long Island Jewish Health System,
Manhasset, New York, United States of America
Using a genome-wide single nucleotide polymorphism (SNP) panel, we observed population structure in a diversegroup of Europeans and European Americans. Under a variety of conditions and tests, there is a consistent andreproducible distinction between ‘‘northern’’ and ‘‘southern’’ European population groups: most individualparticipants with southern European ancestry (Italian, Spanish, Portuguese, and Greek) have .85% membership inthe ‘‘southern’’ population; and most northern, western, eastern, and central Europeans have .90% in the ‘‘northern’’population group. Ashkenazi Jewish as well as Sephardic Jewish origin also showed .85% membership in the‘‘southern’’ population, consistent with a later Mediterranean origin of these ethnic groups. Based on this work, wehave developed a core set of informative SNP markers that can control for this partition in European populationstructure in a variety of clinical and genetic studies.
Citation: Seldin MF, Shigeta R, Villoslada P, Selmi C, Tuomilehto J, et al. (2006) European population substructure: Clustering of northern and southern populations. PLoSGenet 2(9): e143. DOI: 10.1371/journal.pgen.0020143
Introduction
The recent development of methodologies for definingpopulation structure has provided the ability to identify themajor ethnic contributions in individual participants indiverse populations [1–7]. These statistical approaches utilizenon-hierarchical clustering algorithms in which Markovchain Monte Carlo methods are used to infer ancestry, basedsolely on genotyping information. Furthermore, relatedalgorithms provide methods for controlling for populationstratification in genetic studies [8–10]. These methods areimportant in assessing the results of case-control and othernon–family-based association tests. In addition, definingpopulation structure is potentially useful both in clinicaloutcome studies and in the examination of pharmacologicresponse and toxicity.
Previous studies of human population structure haveprimarily considered different continental populations oradmixed populations between two or more different con-tinental populations [3–7]. However, some of these studieshave also suggested that sub-continental differences inpopulation structure can be discerned [4,11]. The examina-tion of population differences within Europe using mitochon-drial [12–15] or Y chromosome [16–18] haplogroups has beenparticularly useful in tracing part of the routes of migrationand populating of Europe, but these haplogroups do notprovide strong inferences on population genetic structure.Autosomal studies using small numbers of classical geneticmarkers (nuclear protein polymorphisms) have suggestedbroad genetic gradients across Europe, leading to theproposal of demic diffusion models [19–22]. These include aprincipal component analysis of small numbers of classic
genetic markers that suggested three clines accounting for aproportion of the genetic variation in the continent [22].Together with subsequent studies including a recent analysisof microsatellite data, these studies have provided additionalsupport for a large Neolithic component of the Europeangenome and a strong element of demic diffusion originatingfrom the Near East [23,24]. However, it must be noted that theissue of Paleolithic versus Neolithic origin of Europeans is stillcontroversial, and other recent studies examining ancientmitochondrial DNA have suggested virtually no Neolithiccontribution to European populations [25].In this report we expand on the autosomal DNA
observations by examining a large number of single nucleo-tide polymorphisms (SNP) genotypes, using statistical meth-ods to directly examine population genetic structure. Theresults show clear evidence of large differences in populationstructure between southern and northern European popula-tions. In addition, we present data that extend recent studiessuggesting that population structure can create false-positive
Editor: Jonathan Pritchard, University of Chicago, United States of America
Received May 8, 2006; Accepted July 25, 2006; Published September 15, 2006
A previous version of this article appeared as an Early Online Release on July 25,2006 (DOI: 10.1371/journal.pgen.0020143.eor).
DOI: 10.1371/journal.pgen.0020143
Copyright: � 2006 Seldin et al. This is an open-access article distributed under theterms of the Creative Commons Attribution License, which permits unrestricteduse, distribution, and reproduction in any medium, provided the original authorand source are credited.
Abbreviations: CI, confidence interval; kb, kilobases; LD, linkage disequilibrium;OR, odds ratio; RA, rheumatoid arthritis; SNP, single nucleotide polymorphism
* To whom correspondence should be addressed. E-mail: [email protected]
PLoS Genetics | www.plosgenetics.org September 2006 | Volume 2 | Issue 9 | e1431339

association tests in European Americans [26]. Moreover, thecurrent results suggest practical applications of defining thispopulation’s genetic substructure in genetic studies.
Results
Allele Frequency Differences and Fst between DifferentEuropean Populations Are Small
A total of 1,094 participants were genotyped with morethan 5,700 SNPs distributed over the entire genome. Afterexcluding participants with . 10% estimated non-Europeanancestry (see Methods), 928 participants were selected forfurther analysis. The allele frequency differences and Fstvalues were determined for the following subgroups withEuropean heritage: 162 western European Americans (seeMethods for description of populations), 41 central EuropeanAmericans, 27 eastern European Americans, 86 Italianparticipants, 74 Spanish participants, and 90 Swedishparticipants (Table 1). Although the Fst values are small(mean intra-European group Fst ¼ 0.0029), the distancebetween the Italian and Spanish participants (Fst ¼ 0.0021)was smaller and showed no overlap with the 95% confidenceintervals between either of these groups and the other groups
of European populations including those containing westernEuropean, central European, eastern European, and Swedishparticipants (mean Fst ¼ 0.0042). As a comparison, the Fstbetween each of the European participant groups andAmerindian (Mayan) participants was .0.12 (0.12–0.13).
Evidence for Major Difference in Population Structure of‘‘Northern’’ and ‘‘Southern’’ EuropeFor the analysis of population genetic structure, we first
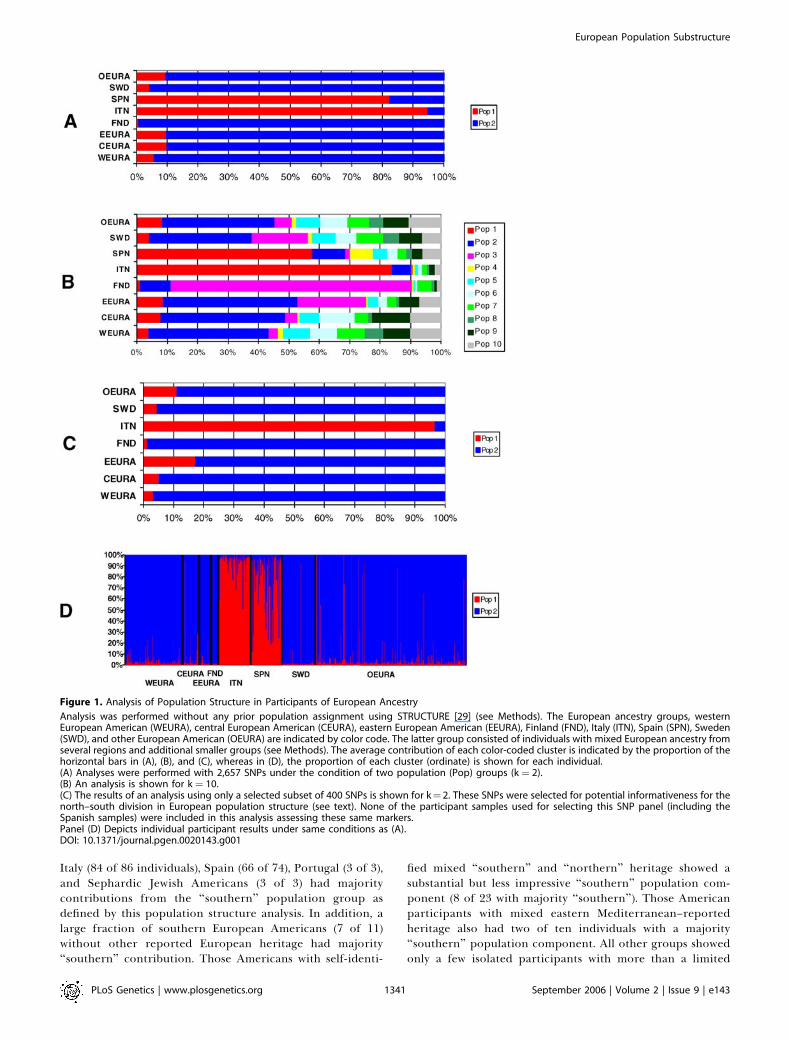
examined the 928 participants of European ancestry using aset of 2,657 SNPs in which the interval between each SNP wasa minimum of 500 kilobases (kb) (Figure 1). Since stronglinkage disequilibrium (LD) is rarely observed at chromoso-mal distances greater than 50 kb in European populations[27,28], this criterion served to reduce or eliminate LDbetween markers (see Methods). Using the program STRUC-TURE [29], the participants were examined under differentassumptions of the number of population groups (clusters),ranging from one to ten (k ¼ 1, k ¼ 2. . .k ¼ 10) without anypre-assignment of population affiliation. The estimation ofloge probability of the data using the F model modestly butsignificantly favored the assumption of k ¼ 2 (k ¼ 1,�3,174,551; k ¼ 2, �3,172,646; k ¼ 3 ¼ �3,173,661; k ¼ 4,�3,173,350; k ¼ 5–10, all , �3,173,500, using mean from fivereplicates for each measurement). More impressively, theanalyses all showed consistent clustering of the Italian andSpanish participant sets from the participant sets of otherEuropean ancestry including those of western, central,eastern, and Scandinavian European ancestry (Figure 1A,for k¼ 2, and Figure 1B, for k¼ 10). (Hereafter these clustersare referred to as ‘‘northern’’ and ‘‘southern’’ populations).The only additional clear separation of the majority ofindividuals in any of the self-identified populations was forthe Finnish participants that grouped separately from theother ‘‘northern’’ groups when k was greater than 7. Whenthe results for each individual participant are examined(Figure 1D), most of the members of each self-reportedancestry group showed similar results; however, someindividuals differed markedly relative to other members oftheir self-assigned regional ancestry group.Grouping of individuals with different north–south con-
tributions from the k ¼ 2 analysis further illustrates thisdivision of individual participants from different Europeanpopulation sets and some of the variability observed (Figure 2).
Table 1. Allele Frequency Differences and Fst Values between Selected Participants of European Ancestry
Fst Allele Frequency Differencea
WEURA CEURA EEURA ITN SPN SWD
WEURAb — 0.049 0.059 0.048 0.046 0.039
CEURA 0.0001 (0.0000 – 0.0003) — 0.071 0.060 0.060 0.054
EEURA 0.0020 (0.0013 – 0.0028) 0.0017 (0.0011 – 0.0023) — 0.068 0.068 0.062
ITN 0.0042 (0.0036 – 0.0049) 0.0032 (0.0028 – 0.0037) 0.0049 (0.0039 – 0.0058) — 0.047 0.056
SPN 0.0029 (0.0025 – 0.0034) 0.0029 (0.0027 – 0.0032) 0.0044 (0.0036 – 0.0056) 0.0021 (0.0017 – 0.0025) — 0.055
SWD 0.0011 (0.0008 – 0.0014) 0.0008 (0.0004 – 0.0012) 0.0017 (0.0009 – 0.0025) 0.0060 (0.0053 – 0.0067) 0.0048 (0.0042 – 0.0054) —
aAllele frequency differences are shown above diagonal and Fst values determined using the Weir and Cockerham method [56] are shown below diagonal. The 95% CI determined using1,000 bootstraps for each locus in the Fst calculation are shown within parentheses.bThe participant sets included 162 western European Americans (WEURA), 41 central European Americans (CEURA), 27 eastern European Americans (EEURA), 86 Italian participants (ITN),74 Spanish participants (SPN), and 90 Swedish (SWD) participantsDOI: 10.1371/journal.pgen.0020143.t001
PLoS Genetics | www.plosgenetics.org September 2006 | Volume 2 | Issue 9 | e1431340
European Population Substructure
Synopsis
Two unrelated persons in the human population have hundreds ofthousands of base pair differences between them in DNA sequence.Previous studies have shown that a small proportion of thesesequence differences correlate with a person’s continental ancestry:broadly, Asia, Africa Oceana, America, or continental Europe. In thecurrent study, DNA differences within a particular continental group,Europe, were examined. Overall, the analysis of sequence variationallowed the authors to distinguish individuals with northernEuropean ancestry (Swedish, English, Irish, German, and Ukrainian)from individuals with southern European ancestry (Italian, Spanish,Portuguese, and Greek). Interestingly, Ashkenazi Jewish individualstend to group together with individuals from southern Europeancountries. This study is important because it provides a method oftaking into account these differences when searching for geneticvariations that are associated with particular human traits, such asdisease susceptibility, response to drug treatment, or side effectsfrom therapy. Specifically, these methods may allow scientists touncover disease-associated genetic variations that might be hiddenunless differences related to European ancestry are considered.
Italy (84 of 86 individuals), Spain (66 of 74), Portugal (3 of 3),and Sephardic Jewish Americans (3 of 3) had majoritycontributions from the ‘‘southern’’ population group asdefined by this population structure analysis. In addition, alarge fraction of southern European Americans (7 of 11)without other reported European heritage had majority‘‘southern’’ contribution. Those Americans with self-identi-
fied mixed ‘‘southern’’ and ‘‘northern’’ heritage showed asubstantial but less impressive ‘‘southern’’ population com-ponent (8 of 23 with majority ‘‘southern’’). Those Americanparticipants with mixed eastern Mediterranean–reportedheritage also had two of ten individuals with a majority‘‘southern’’ population component. All other groups showedonly a few isolated participants with more than a limited
Figure 1. Analysis of Population Structure in Participants of European Ancestry
Analysis was performed without any prior population assignment using STRUCTURE [29] (see Methods). The European ancestry groups, westernEuropean American (WEURA), central European American (CEURA), eastern European American (EEURA), Finland (FND), Italy (ITN), Spain (SPN), Sweden(SWD), and other European American (OEURA) are indicated by color code. The latter group consisted of individuals with mixed European ancestry fromseveral regions and additional smaller groups (see Methods). The average contribution of each color-coded cluster is indicated by the proportion of thehorizontal bars in (A), (B), and (C), whereas in (D), the proportion of each cluster (ordinate) is shown for each individual.(A) Analyses were performed with 2,657 SNPs under the condition of two population (Pop) groups (k ¼ 2).(B) An analysis is shown for k ¼ 10.(C) The results of an analysis using only a selected subset of 400 SNPs is shown for k¼ 2. These SNPs were selected for potential informativeness for thenorth–south division in European population structure (see text). None of the participant samples used for selecting this SNP panel (including theSpanish samples) were included in this analysis assessing these same markers.Panel (D) Depicts individual participant results under same conditions as (A).DOI: 10.1371/journal.pgen.0020143.g001
PLoS Genetics | www.plosgenetics.org September 2006 | Volume 2 | Issue 9 | e1431341
European Population Substructure
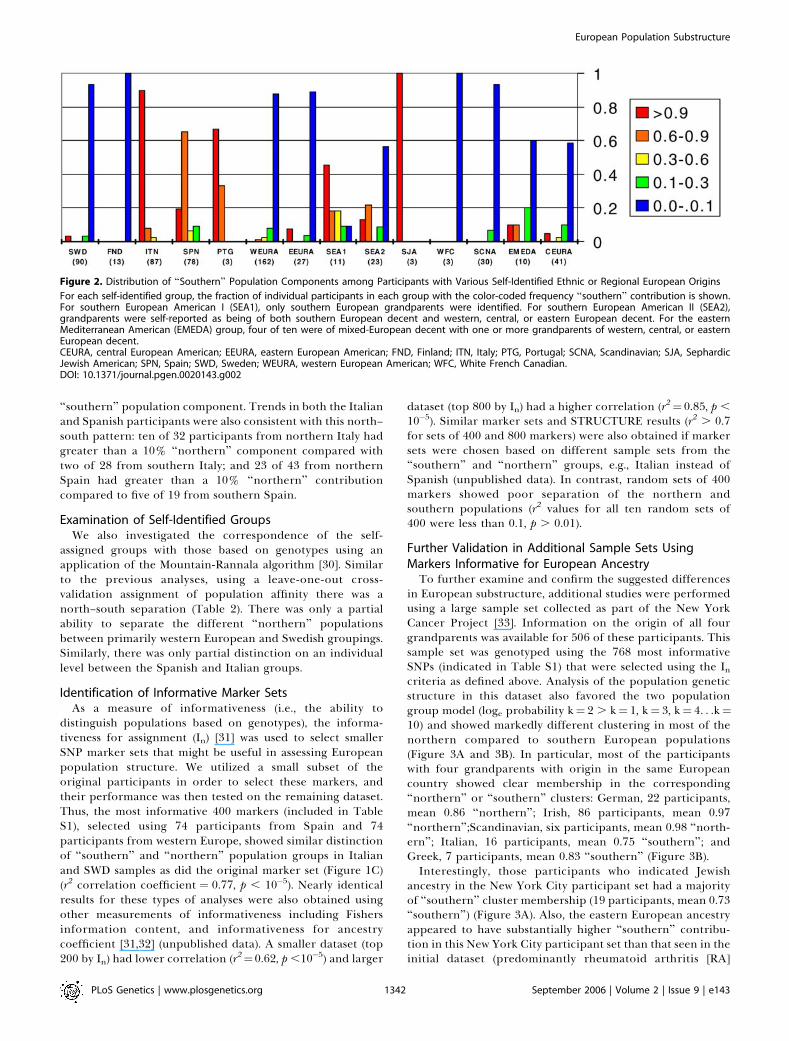
‘‘southern’’ population component. Trends in both the Italianand Spanish participants were also consistent with this north–south pattern: ten of 32 participants from northern Italy hadgreater than a 10% ‘‘northern’’ component compared withtwo of 28 from southern Italy; and 23 of 43 from northernSpain had greater than a 10% ‘‘northern’’ contributioncompared to five of 19 from southern Spain.
Examination of Self-Identified GroupsWe also investigated the correspondence of the self-
assigned groups with those based on genotypes using anapplication of the Mountain-Rannala algorithm [30]. Similarto the previous analyses, using a leave-one-out cross-validation assignment of population affinity there was anorth–south separation (Table 2). There was only a partialability to separate the different ‘‘northern’’ populationsbetween primarily western European and Swedish groupings.Similarly, there was only partial distinction on an individuallevel between the Spanish and Italian groups.
Identification of Informative Marker SetsAs a measure of informativeness (i.e., the ability to
distinguish populations based on genotypes), the informa-tiveness for assignment (In) [31] was used to select smallerSNP marker sets that might be useful in assessing Europeanpopulation structure. We utilized a small subset of theoriginal participants in order to select these markers, andtheir performance was then tested on the remaining dataset.Thus, the most informative 400 markers (included in TableS1), selected using 74 participants from Spain and 74participants from western Europe, showed similar distinctionof ‘‘southern’’ and ‘‘northern’’ population groups in Italianand SWD samples as did the original marker set (Figure 1C)(r2 correlation coefficient ¼ 0.77, p , 10�5). Nearly identicalresults for these types of analyses were also obtained usingother measurements of informativeness including Fishersinformation content, and informativeness for ancestrycoefficient [31,32] (unpublished data). A smaller dataset (top200 by In) had lower correlation (r2¼0.62, p ,10�5) and larger
dataset (top 800 by In) had a higher correlation (r2¼ 0.85, p ,
10�5). Similar marker sets and STRUCTURE results (r2 . 0.7for sets of 400 and 800 markers) were also obtained if markersets were chosen based on different sample sets from the‘‘southern’’ and ‘‘northern’’ groups, e.g., Italian instead ofSpanish (unpublished data). In contrast, random sets of 400markers showed poor separation of the northern andsouthern populations (r2 values for all ten random sets of400 were less than 0.1, p . 0.01).
Further Validation in Additional Sample Sets UsingMarkers Informative for European AncestryTo further examine and confirm the suggested differences
in European substructure, additional studies were performedusing a large sample set collected as part of the New YorkCancer Project [33]. Information on the origin of all fourgrandparents was available for 506 of these participants. Thissample set was genotyped using the 768 most informativeSNPs (indicated in Table S1) that were selected using the Incriteria as defined above. Analysis of the population geneticstructure in this dataset also favored the two populationgroup model (loge probability k¼ 2 . k¼ 1, k¼ 3, k¼ 4. . .k¼10) and showed markedly different clustering in most of thenorthern compared to southern European populations(Figure 3A and 3B). In particular, most of the participantswith four grandparents with origin in the same Europeancountry showed clear membership in the corresponding‘‘northern’’ or ‘‘southern’’ clusters: German, 22 participants,mean 0.86 ‘‘northern’’; Irish, 86 participants, mean 0.97‘‘northern’’;Scandinavian, six participants, mean 0.98 ‘‘north-ern’’; Italian, 16 participants, mean 0.75 ‘‘southern’’; andGreek, 7 participants, mean 0.83 ‘‘southern’’ (Figure 3B).Interestingly, those participants who indicated Jewish
ancestry in the New York City participant set had a majorityof ‘‘southern’’ cluster membership (19 participants, mean 0.73‘‘southern’’) (Figure 3A). Also, the eastern European ancestryappeared to have substantially higher ‘‘southern’’ contribu-tion in this New York City participant set than that seen in theinitial dataset (predominantly rheumatoid arthritis [RA]
Figure 2. Distribution of ‘‘Southern’’ Population Components among Participants with Various Self-Identified Ethnic or Regional European Origins
For each self-identified group, the fraction of individual participants in each group with the color-coded frequency ‘‘southern’’ contribution is shown.For southern European American I (SEA1), only southern European grandparents were identified. For southern European American II (SEA2),grandparents were self-reported as being of both southern European decent and western, central, or eastern European decent. For the easternMediterranean American (EMEDA) group, four of ten were of mixed-European decent with one or more grandparents of western, central, or easternEuropean decent.CEURA, central European American; EEURA, eastern European American; FND, Finland; ITN, Italy; PTG, Portugal; SCNA, Scandinavian; SJA, SephardicJewish American; SPN, Spain; SWD, Sweden; WEURA, western European American; WFC, White French Canadian.DOI: 10.1371/journal.pgen.0020143.g002
PLoS Genetics | www.plosgenetics.org September 2006 | Volume 2 | Issue 9 | e1431342
European Population Substructure

participants from disparate US locations). When four-grand-parent data is examined, this relationship was still unclearsince those participants with four grandparents from theUkraine (without reported Jewish ancestry) showed disparatemembership in the ‘‘northern’’ and ‘‘southern’’ clusters, andsome of these participants had .80% south membership(Figure 3B). This was in contrast to the ‘‘northern’’-onlycluster membership of each of the five Polish participantswithout reported Jewish ancestry. This raised the question ofwhether there might be differences among different Slavicpopulations (eastern versus western), reflecting differenthistoric migrations or an incomplete reporting of Jewishancestry. These results also suggested the value in furtherexamining Jewish ancestry and country of origin informationin participants with four-grandparent ethnicity information.
Participants with Ashkenazi Jewish Heritage Group withSouthern European Populations
To further clarify the eastern European and Jewishrelationships, we examined a final set of participants forwhich clear information on both Jewish ancestry and easternEuropean ancestry was available. As shown in Figure 3C, eachof 38 participants with four grandparents of Ashkenazi JewishEuropean ancestry showed .60% ‘‘southern’’ group mem-bership (mean¼0.86 6 0.08 [standard deviation] ‘‘southern’’).In contrast, each of 19 pairs of non-Ashkenazi easternEuropean (west Slavic membership) including 16 withexclusively Ukrainian non-Jewish ancestry showed more than65% ‘‘northern’’ group membership (mean ¼ 0.88 6 0.11‘‘northern’’). Consistent with our initial observations (Figure2), the two Sephardic Jewish participants also showed‘‘southern’’ cluster membership (Figure 3C).
Factor AnalysisTo further explore the genetic relationship among the
populations of European descent, a factor analysis of
correspondence was applied using the Genetix softwarepackage [34] (see Methods). There was little overlap betweenthe southern European–derived participants (Italian andSpanish) with that of the northern European participants(western European, central European, eastern European, andSwedish) when the initial population samples, genotyped withthe unselected panel of 2,657 SNP, were examined (Figure4A). Similar results were observed with or without inclusionof an out-group (Amerindian). In addition, this analysis wasperformed for the participant sample set having four grand-parents with the same country of origin that were genotypedusing the SNP panel selected for European substructureinformation. The first factor accounting for the largestinertia component (analogous to variance) showed a similarnorth–south distinction among the different participantgroups (Figure 4B). This analysis also showed additionalputative relationships among the various European popula-tions that can be discerned by additional factors.
Structured Association TestingIn order to provide some insight into the potential effect of
this European population structure, we examined whetherdifferent sets of SNPs could control for population strat-ification in association tests. We examined three differentunlinked loci that had differences in allele frequencies inItalian participants compared with those of western Euro-pean, and Scandinavian heritage. When 92 Italian partic-ipants were used as cases and 255 ‘‘northern’’ Europeans ascontrols, the three selected loci (rs1375131, rs115749, andrs986642) showed the following odds ratios (OR): 5.4 (95%confidence interval [CI]¼4.0–7.4, p¼5310�28); 2.9 (95% CI¼2.0–4.1, p¼ 4 3 10�9); and 2.5 (95%CI¼ 1.7–3.8, p¼ 3 3 10�6)(Figure 5). When a structured association test (see Methods)was performed using the genotyping results of the entire setof 2,657 SNPs for these participants, no association wasobserved (p-values . 0.05).
Table 2. Assignment of Regional European Population Membership for Individual Participants
Self-Identified Best Assignment Based on Genotype
WEURA SWD ITN SPN EEURA CEURA SCNA
WEURA 153 7 0 1 0 1 0
SWD 46 41 3 0 0 0 0
ITN 8 0 69 9 0 1 0
SPN 17 0 21 35 0 1 0
EEURA 16 8 2 0 1 0 0
CEURA 30 4 3 1 0 1 2
SCNA 21 7 0 0 0 1 1
FND 0 13 0 0 0 0 0
PTG 1 0 0 2 0 0 0
SJA 0 0 2 1 0 0 0
EMEDA 7 0 2 0 0 0 0
SEA1 7 0 2 0 0 1 1
SEA2 20 1 2 0 0 0 0
WFC 2 1 0 0 0 0 0
The assignments (columns) were determined using GeneClass2 [57] applying the Rannala-Mountain algorithm [30]. The possible group assignments are determined from the initial self-identified (SI) population groups using a leave-one-out cross validation method. The probability for most assignments (426/580) was .0.95%. Where the probability for assignment was,0.95%, nearly all had division within the ‘‘northern’’ populations or within the ‘‘southern’’ populations. The initial population groups are as defined in Figure 3.CEURA, central European American; EEURA. eastern European American; EMEDA, eastern Mediterranean American; FND, Finland; ITN, Italy; PTG, Portugal; SCNA, Scandinavian; SEA1,southern European American I; SEA2, southern European American II; SJA, Sephardic Jewish American; SPN, Spain; SWD, Sweden; WEURA, western European American; WFC, White FrenchCanadian.DOI: 10.1371/journal.pgen.0020143.t002
PLoS Genetics | www.plosgenetics.org September 2006 | Volume 2 | Issue 9 | e1431343
European Population Substructure

Figure 3. Population Genetic Structure Analysis of the New York City Self-Identified European Americans and a Selected Group of Participants of Jewish
and Eastern European Descent
Analysis was performed using 749 SNPs informative for European substructure using STRUCTURE. These summary results show the percentage ofindividual participants in each group with the color-coded percentage ‘‘southern’’ contribution. (A) and (B) show results from participants recruited inNew York City as part of the New York Cancer Project.For (A), the individuals were grouped by regional location based on available grandparental data from one or more grandparents.(B) A subset of the same participants as in (A), those with four grandparents from the same country of origin, is shown.(C) shows the results of a different set of participants chosen or recruited specifically on the basis of additional ethnic information (Jewish and easternEuropean descent). Each of the Ukrainian participants did not have known Jewish ancestry. Similarly, the two participants of mixed Ukrainian andRussian ethnic ancestry (two grandparents Ukrainian, and two grandparents without known Jewish ancestry. For the Ashkenazi Jewish participants, theeastern European group had varying countries of origin, including Ukrainian, Polish, Lithuanian, Russian, and Romanian. For the mixed central andwestern European Ashkenazi, the participants included those with one to three grandparents from Germany, Austria, or Hungry (central), or England orBelgium (west), and other grandparents from eastern European countries. Each of these Ashkenazi Jewish participants self-reported four grandparentsof Ashkenazi Jewish ancestry.CEURA, central European American; EEURA, eastern European American; EMEDA, eastern Mediterranean American; JEA, Jewish ancestry; MEA,Mediterranean European American; SCNA, Scandinavian; SEURA, southern European American; WEURA, western European American.DOI: 10.1371/journal.pgen.0020143.g003
Figure 4. Factor Correspondence Analysis Comparing Different Individuals from European Ancestry Groups with an Amerindian Ethnic Group
The individual participants are represented by rectangular shapes distributed by the strength of their separation in three dimensions: along the firstfactor (abscissa), second factor (ordinate), and third factor (depth). This factor analysis is based on vectors fitted to the individual allele frequencies ofeach SNP. The percentage of inertia for each factor is provided on each of the axes and correspond to the eigenvalue vectors.(A) The analysis utilized the set of 2,657 random SNPs. In the upper panel, the European ancestry groups, Italy (ITN), Spain (SPN), eastern EuropeanAmerican (EEURA), western European American (WEURA), Sweden (SWD), and Amerindian (AMI) are indicated by color code, and show that the ITN andSPN participants are mostly distinct from the other European populations examined. The eigenvalue vectors for factors 1–3 were 0.0234, 0.0024, and0.0019, respectively. In the bottom panel, the same groups are shown without the AMI participants. The eigenvalue vectors for factors 1–3 were 0.0033,0.0022, and 0.0014, respectively.
PLoS Genetics | www.plosgenetics.org September 2006 | Volume 2 | Issue 9 | e1431344
European Population Substructure

(B) The analysis was performed using 749 SNPs chosen for European substructure information. The country of origin is shown by the color codingindicated in the upper panel. Except for the Spanish, Italian (1), and Swedish groups, the participants in (B) do not overlap with those in (A), and wereEuropean Americans self-reported as having four grandparents with the same country of origin. The Italian (2) group were Italian Americans. Thebottom right of (B) shows a different three-dimensional view (factor 3 as ordinate), and the bottom left of (B) shows factor 4. The vector eigenvalues forfactors 1–4 were 0.0059, 0.0026, 0.0017, and 0.0016, respectively.DOI: 10.1371/journal.pgen.0020143.g004
PLoS Genetics | www.plosgenetics.org September 2006 | Volume 2 | Issue 9 | e1431345
European Population Substructure

In order to further explore the requirements for control-ling for European population stratification, several sets ofgenotyping results using 400 SNPs were examined. Theseincluded ten random sets, and the 400 SNPs selected for Inusing a subset of Spanish and western European participants.Although the set of SNPs selected for north–south Europeanstructure information adequately controlled for associationfor all three modeled susceptibility alleles (nominal p-valuesabove 0.05), the random sets of 400 markers showedsubstantial variation, and for the most significant model, p-values , 10�8 were observed (Figure 5). Thus, these datasuggest that 400 markers can only adequately control forstratification if selected for informativeness.
We also examined the effect of controlling for populationstructure in analysis of putative RA susceptibility loci. As partof the North American Rheumatoid Arthritis Consortium(NARAC), SNPs from candidate chromosomal regions wereexamined using NARAC probands and New York CancerProject samples as controls. Evidence for association wasexamined using (1) standard v2 methods; (2) applyingpopulation structure information using STRUCTURE [29]and STRAT [8]; and (3) examining only the subset of‘‘northern’’ participants determined from our STRUCTUREanalysis. For the STRUCTURE analysis, we used the 768informative SNP set described above. As illustrated in Table3, some candidate SNPs survive our controlling for popula-tion stratification by this method (e.g., rs2476601 andrs1291490), whereas others lose significance (e.g.,rs10838316 and rs2288774). In the case of rs2476601, theSNP (a variant for PTPN22) has been shown by multiplestudies to be associated with RA susceptibility [35–38]. Ofinterest is finding a SNP that is more significant in a subset ofthe participants as is shown for the ‘‘northern’’ subset forrs1291490. This latter situation is observed only in a couple ofSNPs (out of over 2,000 candidates). This suggests that theseSNPs are in LD with a susceptibility gene that has a largergenetic effect in one subpopulation (in this case, ‘‘northern’’)as might be expected in a complex genetic disease when amore homogeneous population is examined. Of course, theseresults remain to be confirmed in a separate dataset.
Finally, to further examine the effects of populationstratification, we used the SNP (rs1375131) that is withinthe large genomic region that shows positive selection innorthern Europeans for lactose tolerance within Europeanpopulations [39]. Homozygosity of the minor allele is thus agood surrogate for the lactose intolerance phenotype inEuropeans, allowing a model to test for the effect ofpopulation stratification when studying the genetics of adisease phenotype. First, using the Swedish, Italian, Spanish,and four-grandparent–defined European American geno-types, we examined whether unlinked SNPs showed evidencefor association with the putative lactose intolerance pheno-type. Of 749 SNPs (selected from the initial 5,000 SNPs), 17unlinked SNPs and two linked SNPs showed positive allelicassociation (p , 0.001) (Table 4). The strongest allelicassociation for unlinked SNPs was found for rs905290 (p ¼1.1 3 10�7) and rs233722 (p ¼ 6.4 3 10�6) on differentchromosomes. The association was similar to that of thelinked SNPs rs891821 (p¼ 1.2 3 10�6) and rs113906 (p¼ 4.2 3
10�6) that are located 1.6-Mb proximal and distal to thelactase gene, respectively. When structured association test-ing was performed (using the structure information provided
by the selected informative SNP panel), each of these SNPswas either no longer associated with the surrogate phenotypeor showed only marginal association (p . 0.01). For thers1375131, the p-value remained significant (p , 5 3 10�8).One of the linked SNPs (rs891821) had a suggestiveassociation (p , 0.005). Next we considered the same model,excluding those individuals with southern European coun-tries of origin. The Ashkenazi population, known to have ahigh frequency of lactose intolerance, was not excluded sinceeach had four grandparents originating from western Euro-pean, central European, or eastern European countries.Similar to those results obtained without exclusion ofparticipants of southern European birth or country of origin,we also observed false-positive associations in this participantset unless structured association methods were applied (Table4). In this latter example, a very high percentage of theputative lactose intolerance phenotype was, as expected,associated with Ashkenazi ethnicity [82.5% (33/40) comparedwith 16.7% (38/227 in the non-Ashkenazi participants fromnorthern European countries]. When the Ashkenazi partic-ipants were exclude from this sample only the rs1375131 (p¼1 3 10�41) showed nominal association at the p , 0.001 level.Thus these data further illustrate the importance of matchingor controlling for such ethnic differences in association tests.
DiscussionUsing a variety of approaches and algorithms, we have
demonstrated that a major aspect of European population
Figure 5. Structured Association Testing Using Unselected SNPs and
SNPs Selected for European Structure Information
The model examined the real genotypes of Italian participants comparedwith western and northern European participants, for three differentSNPs indicated on the abscissa. The log of 1 divided by probability isshown on the ordinate with the nominal p-values (association testwithout controlling for population structure) indicated by the opendiamonds, and the results of the structured association with the entireset of 2,657 SNPs depicted with the gray triangles. The results of thestructured association tests are shown for ten random sets of 400 SNPs(filled circles) and for the set of 400 SNPs chosen for north–southpopulation structure (see text) (gray squares).DOI: 10.1371/journal.pgen.0020143.g005
PLoS Genetics | www.plosgenetics.org September 2006 | Volume 2 | Issue 9 | e1431346
European Population Substructure

genetic structure follows a north–south distribution. Despitethe use of over 5,000 SNPs in the initial dataset, theSTRUCTURE analyses showed only a modest ability todistinguish other differences in European populations. TheFinnish participants were a notable exception in that 11 of 12individuals showed predominant affiliation with a uniquepopulation group (cluster) when the number of groups (k) setin the STRUCTURE analysis was greater than 7. There weresome differences in the population group distribution amongthe different self-identified participants (e.g., see Figure 1B),but it is unclear whether the proportions of these groups haveany correspondence to differences in contributions (admix-ture) of founding populations. A leave-one-out cross-valida-tion study using a different algorithm similarly showed alimited ability to distinguish within the ‘‘northern’’ or‘‘southern’’ population groups.
Factor analysis of correspondence also showed that thelargest component (Factor 1) also aligned with this north andsouth clustering. This analysis also suggested that individualpopulation groups could be at least partially distinguishedwhen additional smaller factors (lower eigenvalues) wereconsidered. These studies suggest the possibility that addi-tional population structure may be discernable within
Europe when larger SNP sets and additional ‘‘ethnic’’ orhistorical population subsets are examined.The current study has potential limitations in participant
selection including the inclusion of large numbers of RAprobands that might bias allele frequencies and the lack of acomprehensive sampling strategy. However, the clear cluster-ing of participants of northern compared to southernEuropean ancestry was consistently observed in this diverseset of participants, including a wide distribution of EuropeanAmericans and participants from Italy, Spain, and Sweden. Inaddition, this population genetic structure was observed inten random sets of 25 individuals selected from the differentlarge population groups (western European Americans,Swedish, central European Americans, European Americans,Italian, and Spanish) providing further evidence that theseresults cannot be attributed to sample selection bias(unpublished data). The patterns of ancestry in thoseAmerican participants of multiple diverse European originalso strongly support the current results as does the ability toidentify a much smaller set of SNPs that distinguish betweenthe ‘‘northern’’ and ‘‘southern’’ European populations (usinga subset of Spanish and western European participants).Finally, the reproduction of these results using a panel of themost informative markers in additional sample sets provides
Table 4. Analysis of Association for a Model of Lactase Deficiency in Participants of European Descent
SNP Chromosome Megabase Participants of European Descent
Regardless of Region of BirthaParticipants of European Descent Excluding
Southern Countries of Originb
ORc CI p-Value STRAT p-Value OR CI p-Value STRAT p-Value
rs518027 1 119.62 1.94 1.4–2.6 2.00E�05 1.90E�01 1.93 1.2–3.0 2.97E�03 4.75E�01
rs891821 2 134.54 1.91 1.47–2.49 1.18E�06 1.73E�03 1.84 1.3–2.7 1.48E�03 3.19E�03
rs1375131d 2 136.17 2023 126–32594 ,1.0E�50 ,5.0E�8 994 61–16106 ,1.0E�50 ,5.0E�8
rs113906 2 137.87 1.85 1.4–2.4 4.18E�06 2.52E�02 1.88 1.3–2.8 1.09E�03 2.20E�01
rs2063749 4 71.30 1.57 1.2–2.0 7.10E�04 7.58E�01 2.4 1.6–3.4 9.05E�06 8.36E�01
rs905290 11 8.72 2.13 1.6–2.8 1.08E�07 5.55E�02 2 1.3–2.9 8.60E�04 5.95E�01
rs1843910 12 36.96 2.01 1.5–2.8 2.00E�05 3.36E�01 1.6 1.0–2.5 3.97E�02 3.09E�01
rs233722 12 111.44 1.83 1.4–2.4 6.44E�06 6.18E�02 2.7 1.8–3.9 3.85E�07 4.98E�01
aParticipants include Swedish, Italian, Spanish Europeans, and European Americans with four grandparents of European descent. There were 178 putative cases (based on homozygosityfor the rs1375131 allele in the lactase deficiency haplotype) and 319 controls.bThis sample set included only those participants either born in or with grandparent origin in western Europe, central Europe, eastern European American, or Sweden. There were 71 casesand 234 controls in this set.cOdds ratio and p-value determined by allele frequency difference in cases compared to controls (allele 1) using v2 calculations (see Methods) and STRAT p-value was determined usingstructured association (see Methods).dModel was based on this SNP (see text).DOI: 10.1371/journal.pgen.0020143.t004
Table 3. RA Candidate SNP Analysis and European Substructure
SNP European American Only ‘‘Northern’’ European Americana
Cont Case ORb p-Value STRATc Cont Case OR p-Value
rs2476601 1164 527 2.25 3.2E�13 ,5E�08 615 361 2.2 1.66E�08
rs10838316 1164 526 0.74 5.3E�03 7.9E�02 615 360 0.826 1.48E�01
rs2288774 1120 623 1.25 1.4E�03 1.3E�01 588 415 1.12 5.30E�02
rs1291490 1164 526 1.43 5.9E�04 6.5E�04 588 361 1.733 8.74E�06
aSubset of European American participants with .0.95 membership in the ‘‘northern’’ cluster group based on STRUCTURE analysis.bOdds ratio and p-value determined by allele frequency difference in cases compared to controls (allele 1) using v2 calculations (see Methods).cp-Value based on structured association methods using STRAT analysis (see Methods).DOI: 10.1371/journal.pgen.0020143.t003
PLoS Genetics | www.plosgenetics.org September 2006 | Volume 2 | Issue 9 | e1431347
European Population Substructure
additional support for our findings of a north–south Euro-pean distinction.
What is the importance of the current observations? First,the potential for false-positive results in association studiesbased on unrecognized population stratification is ofsubstantial concern for any candidate gene study using acase control design. The potential for false-positive associa-tions in studies of European Americans have recently beenemphasized [26]. The use of either structured association testsor genomic control strategies has been suggested by severalinvestigators [8,10,40–42]. In the current study we selectedthree loci that show allele frequency differences in Italianscompared with western, eastern, and central Europeanpopulations. These three selected loci effectively function assurrogates for test alleles in a case control analysis in whichwe examined whether these differences could be correctlycontrolled for by structured association testing. Both theentire set of 2,657 SNPs and a set of 400 SNPs enriched forthe north–south informativeness controlled each of the loci.In contrast, 400 randomly selected SNPs showed substantialvariation in the ability to account for the Europeanpopulation structure in this study. These results suggestpotential problems when limited numbers of SNPs are usedto control for European population stratification unless a setof more informative SNPs is utilized.
Second, genetic heterogeneity may be an important factorin decreasing the power of genetic studies. Performingseparate analyses on European participants stratified bypopulation genetic structure is worthy of exploration.Although allele frequency differences are generally smallbetween these European populations (Table S1), a compar-ison of Italian and western European participants showedthat 10.0% of SNPs had an allele frequency difference .10%,and 1.9% of the SNPs had an allele frequency difference .
15%. Such differences may be important when examiningnon-Mendelian traits where low and modest relative risks arethe general expectation.
A third issue is the explicit consideration of whetherancestry differences are associated with differences inphenotypic expression. Although controversial [43,44], somehave advocated considering the importance of the ethnicitydefined by DNA typing in clinical studies [45,46]. Ethnic orregional geographic differences in disease frequency havebeen noted for both Mendelian diseases and more complexgenetic disease. A north/south gradient in the incidence ofautoimmune diseases has been noted for several continents,and there is some evidence for increased incidence ofmultiple sclerosis, type 1 diabetes, and Crohn’s disease innorthern European compared with southern Europeancountries [47]. Do differences in European populationstructure underlie phenotypic differences with respect todisease, response to therapy, or adverse reaction to particularenvironmental agents? The answer is unknown, but this studysuggests that the ability to discern European populationstructure may enable testing such possibilities.
The identification of a subset of SNPs informative forEuropean substructure also raises the question of whetherthese informative SNPs may also be in LD with physiologicallyimportant functions that were subject to selection events.Therefore, we compared the location of these SNPs withthose identified by recent studies examining signals forpositive selection using the HapMap data [48]. Although the
most informative SNP was in fact closely associated with aknown positive selection event within European populations(rs1375131within 600 kb of the lactase gene), overall we didnot find support for the overrepresentation of the mostinformative SNPs in the chromosomal positions recentlyshown as having signals for positive selection in the HapMapEuropean participants (no difference in SNP frequency in the100-kb regions flanking the 250 strongest selection signalscomparing the most informative SNPs and random SNP sets).However, it is possible that signals may be present in eitherparticular subgroups of European participants (e.g. ‘‘south-ern’’ Europeans not included within the CEPH [Utahresidents with ancestry from northern and western Europe;CEU] samples). Ongoing studies will examine this possibilityas well as the distribution of European substructure‘‘informative’’ SNPs when these are chosen from much largerinitial genome-wide SNP screens.The finding in the current study that individuals of
Ashkenazi Jewish descent are predominantly ‘‘southern’’European further suggests the later migration of this ethnicgroup from the Mediterranean region. Regardless of theEuropean country of origin, each of those participants withfour grandparents of Ashkenazi Jewish heritage showed thispredominant ‘‘southern’’ cluster membership. This findingsuggests the importance of ascertaining this aspect of ethnicorigin in the design of association studies in Europeanpopulations. As an example of this potential issue, we showedthat inclusion of Ashkenazi samples with other participants ofnorthern European origin (based on country of grand-parental birth) did in fact cause a type 2 error whenpopulation stratification was not considered.It is interesting to speculate how the ability to distinguish
northern and southern European populations relates toancient as well as more modern differences in migrationand admixture patterns. Archeological and skeletal evidenceas well as studies of mitochondrial and Y chromosomehaplogroups have provided evidence of upper Paleolithic,Neolithic, and more recent settlement and migrations ascontributing to the origin of current European populations[12–18,22,49–52]. Phylogenetic analyses of Y haplotypicgroups are interpreted to support both separate migrationsfrom the Middle East 4,000 to 7,000 y ago as well as a morerecent ‘‘Greek’’ expansion into Italy and the Iberian peninsulaoccurring closer to 2,500 y ago [16,18]. The earlier migrationswould be consistent with waves spreading agriculturaltechniques from the Middle East and are supported by somemitochondrial DNA studies [13]. However, there is littleconsensus concerning the association of any of these migra-tions with agricultural techniques or trading routes [50,51], orfor that matter with the spread of Indo-European languages[22,51,53]. Some studies of specific mitochondrial and Yhaplogroups [53] are consistent with the demic diffusionhypothesis suggested by Cavali-Sforza et al. [22], and the workof Sokal et al. [54] and others have provided evidence ofdifferent patterns of repopulation from glacial refuges orhave suggested a later influence from North Africa in bothItaly and Spain [14,15,18]. As recently discussed by Barbujaniand Chikhi, the origin(s) of modern European ancestorsremains a controversial issue [55]. Other major populationevents, including the multiple epidemics during the MiddleAges, may also have resulted in genetic bottlenecks contribu-ting to current differences in European population structure.
PLoS Genetics | www.plosgenetics.org September 2006 | Volume 2 | Issue 9 | e1431348
European Population Substructure

Regardless of the historical explanations for the north–south genetic differences we have described, our resultsemphasize the importance of considering population struc-ture in both genetic and epidemiological studies in Europeanpopulations. Future examination of population structureusing larger numbers of SNPs in additional populationsamples may enable a better definition of the differencesbetween European population groups, and similar studiesmay provide analogous information in other continentalpopulations.
Materials and Methods
Statistical analyses. Fst was determined using Genetix software [34]that applies the Weir and Cockerham [56] algorithm, and d wascalculated by determining the absolute value of the allele frequencydifference between two populations. The 95% confidence limits forFst were determined by permutation testing (set at 50,000). Themeasures of informativeness of each SNP (In, Ia, ORCA, and FIC) weredetermined using the algorithms previously described [31,32]. (Wethank Dr. Noah Rosenberg for providing the Perl script used for In, Ia,and ORCA). LD was examined using the Genetix software [34]. Forthe set of 2,657 SNPs, there was no evidence for LD among adjacentmarkers in each self-identified ethnic set (r2 , 0.2).
Population structure was examined using STRUCTURE v2.1 [1,29].Each STRUCTURE analysis was performed without any priorpopulation assignment and was performed at least five times withsimilar results (see Results) using more than 10,000 replicates andburn-in cycles under the admixture model applying the infer aoption with a separate a estimated for each population under the Fmodel (where a is the Dirichlet parameter for degree of admixture).Most runs were performed under the k ¼ 1 option where kparameterizes the allele frequency prior and is based on the Dirichletdistribution of allele frequencies. When k ¼ 1 a uniform priordistribution of allele frequencies over all loci is used. Runs using theinfer k option or setting k ¼ 1 showed similar results for a limitednumber of selected analyses. The leave-one-out cross-validationanalysis of ethnic group affiliation was performed using theGeneClass 2 software [57,58] applying the Rannala and Mountainalgorithm [30]. Structured association was performed using theSTRAT software [8] that performs association tests with and withoutpopulation structure information that is provided by a prior analysiswith STRUCTURE.
Factor analysis of correspondence was performed using the Genetixsoftware [34] that utilizes a strategy similar to that discussed anddescribed by Guinand [59]. This methodology can be considered aspecial case of principal component analysis in which the correspond-ence analysis is applied to contingency tables to develop a corre-spondence matrix. The groups of individuals are viewed as a group ofpositions in hyperspace that has as many dimensions as alleles for eachdifferent loci. The algorithm determines the independent directionsin hyperspace where the size of the vector is proportional to the inertia(number of individuals in a point of the hyperspace) multiplied by thesquare of the distance to the center of the co-ordinates. The objectiveof the method is to decompose the overall inertia to a small number ofdimensions in which the deviations from expected values can berepresented within given constraints. A description of the mathemat-ical principles is available (http://www.unesco.org/webworld/idams/advguide/Chapt6_5.htm) [60].
Hardy-Weinberg equilibrium was examined using an exact testimplemented in the FINETTI software that can be accessedinteractively at the Internet address: http://ihg.gsf.de/cgi-bin/hw/hwa1.pl. This program was also used for v2 statistic calculations forthe association tests.
Populations studied: First sample set. European Americans ofdifferent regional European origins (681 participants), East AsianAmericans (13), African Americans (22), South Asian Americans (48),Amerindians (48), and Swedish (92), Finnish (13), Italian (91),Portuguese (3), southern France (1), and Spanish participants (82)were included in this study. None of the individuals were first-degree relatives of other participants in the study. These popula-tions were based on self-identified ethnic affiliation. The EuropeanAmericans, African Americans, and East Asian Americans wererecruited from across the United States, and the majority of theparticipants, including all of the European Americans, were RAprobands identified as part of the North American Rheumatoid
Arthritis Consortium (NARAC) as previously described [61]. TheSouth Asian American participants were recruited from Houston,Texas, and Amerindian participants were self-identified as Mayan(Kachiquel language group) and were recruited in Chimaltenango,Guatemala, as previously described [11]. The Italian participantswere normal healthy volunteers recruited from throughout Italy: 38from northern Italy, 23 from central Italy, and 30 from southernItaly. The Swedish and Finnish participants were healthy normalcontrols collected in these countries. The other participantsrecruited in southwestern Europe included 86 from Spain, threefrom Portugal, and one from southern France. Of the Spanishparticipants, there were 43 from northern Spain, 12 from centralSpain, and 19 from southern Spain. Of these participants fromSpain and Portugal, 61 were probands for a multiple sclerosis study.Blood cell samples were obtained from all individuals, according toprotocols and informed-consent procedures approved by institu-tional review boards, and were labeled with an anonymous codenumber linked only to demographic information.
For the European Americans, grandparental information wasavailable for the majority of the participants. These included thefollowing self-identifier classifications of grandparents: westernEuropean (United Kingdom, northern France, Holland, Belgium,and Switzerland), eastern European (Russia, Poland, Romania,Ukraine, Lithuania, Latvia, Estonia, and Czech Republic), centralEuropean (Germany, Austria, and Hungary), southern European(Spain, Portugal, Italy, and southern France), Scandinavian (Den-mark, Norway, Sweden, and Finland), and eastern Mediterranean(Greece, Turkey, Croatia, Bosnia, Yugoslavia, and Albania), Sephar-dic Jewish American, and White French Canadian. All participantswith any reported mixed-continental origins (e.g., African) wereexcluded.
Populations studied: Second sample set. This sample set included1,164 self-identified European American participants that wererecruited as part of the New York Cancer Project, a prospectivelongitudinal study [33]. For a substantial portion of this set,European country of origin was available as was a record of thefour-grandparental country of origin. Jewish ancestry was indicatedfor a subset of these participants, but specific information for eachgrandparent was not available for this aspect of the study.
Populations studied: Third sample set. This sample set included 40participants of Jewish ancestry who are part of a larger AshkenaziJewish control population recruited by Dr. Ann E. Pulver (JohnsHopkins University School of Medicine). Both the country of originand the Jewish ethnic information for each grandparent wereavailable for each participant. The participants included 38 individ-uals with four grandparents identified as Ashkenazi Jewish and twowith Sephardic Jewish grandparents. In addition, 19 non-Jewishparticipants of eastern European ancestry were specifically recruitedfor the current study, based on self-reported information on theorigin and ethnicity of all four grandparents.
Exclusion of individuals with evidence of non-European ancestry.To simplify the analysis of European population structure, initialstudies were used to identify individuals in the first sample set thatwere likely to have substantial non-European admixture. STRUC-TURE [29] analyses were performed using four different sets of 150SNPs selected for informativeness (In) for European ancestry whencompared with African, East Asian (Chinese, Japanese, and Filipino),South Asian (Indian subcontinent), and Amerindian (see Table S1,for specific SNPs utilized). This set of SNPs provides world-wideinformation with respect to continental population admixture. Forself-identified European Americans (681), this initial study using theSTRUCTURE algorithms identified 11 participants with evidence of.10% non-European ancestry. Similarly, two of 92 Swedish, four of82 Spanish, and five of 91 Italian participants were excluded fromthe additional studies.
For the second sample set (New York Cancer Project), a similarexclusion was performed using a set of 140 world-wide ancestryinformative markers [11].
(It should be noted that without exclusion of individuals withevidence of continental admixture, the analyses of populationsubstructure showed inconsistent results in these participant sets).
Genotyping. The initial genotyping was performed using theIllumina Linkage IV Panel using the Illumina bead array method aspreviously described for the Linkage III panel (Illumina, San Diego,California, United States) [62]. For each European ethnic group,very few SNPs showed deviation from Hardy-Weinberg expectations(,4% at p ¼ 0.05 and ,1% at p ¼ 0.01). A second SNP typing set of768 SNPs chosen for informativeness (see Results) from the initialgenotyping results was used for typing sample set 2 and 3 using thesame methods. The results for 19 of the 768 SNPs were not included
PLoS Genetics | www.plosgenetics.org September 2006 | Volume 2 | Issue 9 | e1431349
European Population Substructure

in the analyses based on evaluation of the quality of the typingresults.
Supporting Information
Table S1. SNP Frequencies and Information
Found at DOI: 10.1371/journal.pgen.0020143.st001 (796 KB PDF).
Acknowledgments
We wish to thank Dr. Ann Pulver for providing well-characterizedDNA samples from Askenazi Jewish participants. We thank StephenJohnson and Robert Lundsten for informatics support on the New
York Cancer Project samples. We also thank Annette Lee, MarlenaKern, and Gila Klein for assistance with many aspects of samplemanagement and recruitment, and Halynka Mudryj for assistance inrecruitment of Ukrainian participants.
Author contributions. The study was conceived by MFS anddesigned by MFS and PKG. MFS, RS, PV, CS, JT, GS, JWB, LK, andPKG recruited participants, and obtained and prepared DNAsamples used in these studies. Analyses were performed by MFS andPKG. The manuscript was written by MFS and PKG with contribu-tions from PV, CS, JT, GS, JWB, and LK.
Funding. This work was supported by National Institutes of Healthgrants AR44422 and DK071185.
Competing interests. The authors have declared that no competinginterests exist.
References1. Pritchard JK, Stephens M, Donnelly P (2000) Inference of population
structure using multilocus genotype data. Genetics 155: 945–959.2. Dawson KJ, Belkhir K (2001) A Bayesian approach to the identification of
panmictic populations and the assignment of individuals. Genet Res 78: 59–77.
3. Collins-Schramm HE, Kittles RA, Operario DJ, Weber JL, Criswell LA, et al.(2002) Markers that discriminate between European and African ancestryshow limited variation within Africa. Hum Genet 111: 566–569.
4. Rosenberg NA, Pritchard JK, Weber JL, Cann HM, Kidd KK, et al. (2002)Genetic structure of human populations. Science 298: 2381–2385.
5. Shriver MD, Parra EJ, Dios S, Bonilla C, Norton H, et al. (2003) Skinpigmentation, biogeographical ancestry and admixture mapping. HumGenet 112: 387–399.
6. Collins-Schramm HE, Chima B, Morii T, Wah K, Figueroa Y, et al. (2004)Mexican American ancestry-informative markers: Examination of popula-tion structure and marker characteristics in European Americans, MexicanAmericans, Amerindians and Asians. Hum Genet 114: 263–271.
7. Bonilla C, Shriver MD, Parra EJ, Jones A, Fernandez JR (2004) Ancestralproportions and their association with skin pigmentation and bonemineral density in Puerto Rican women from New York city. Hum Genet115: 57–68.
8. Pritchard JK, Stephens M, Rosenberg NA, Donnelly P (2000) Associationmapping in structured populations. Am J Hum Genet 67: 170–181.
9. Hoggart CJ, Parra EJ, Shriver MD, Bonilla C, Kittles RA, et al. (2003)Control of confounding of genetic associations in stratified populations.Am J Hum Genet 72: 1492–1504.
10. Satten GA, Flanders WD, Yang Q (2001) Accounting for unmeasuredpopulation substructure in case-control studies of genetic association usinga novel latent-class model. Am J Hum Genet 68: 466–477.
11. Yang N, Li H, Criswell LA, Gregersen PK, Alarcon-Riquelme ME, et al.(2005) Examination of ancestry and ethnic affiliation using highlyinformative diallelic DNA markers: Application to diverse and admixedpopulations and implications for clinical epidemiology and forensicmedicine. Hum Genet 118: 382–392.
12. Richards M, Corte-Real H, Forster P, Macaulay V, Wilkinson-Herbots H, etal. (1996) Paleolithic and Neolithic lineages in the European mitochondrialgene pool. Am J Hum Genet 59: 185–203.
13. Richards MB, Macaulay VA, Bandelt HJ, Sykes BC (1998) Phylogeography ofmitochondrial DNA in western Europe. Ann Hum Genet 62 (Pt 3): 241–260.
14. Achilli A, Rengo C, Magri C, Battaglia V, Olivieri A, et al. (2004) Themolecular dissection of mtDNA haplogroup H confirms that the Franco-Cantabrian glacial refuge was a major source for the European gene pool.Am J Hum Genet 75: 910–918.
15. Pereira L, Richards M, Goios A, Alonso A, Albarran C, et al. (2005) High-resolution mtDNA evidence for the late-glacial resettlement of Europefrom an Iberian refugium. Genome Res 15: 19–24.
16. Di Giacomo F, Luca F, Popa LO, Akar N, Anagnou N, et al. (2004) Ychromosomal haplogroup J as a signature of the post-Neolithic coloniza-tion of Europe. Hum Genet 115: 357–371.
17. Rootsi S, Magri C, Kivisild T, Benuzzi G, Help H, et al. (2004)Phylogeography of Y-chromosome haplogroup I reveals distinct domainsof prehistoric gene flow in europe. Am J Hum Genet 75: 128–137.
18. Semino O, Magri C, Benuzzi G, Lin AA, Al-Zahery N, et al. (2004) Origin,diffusion, and differentiation of Y-chromosome haplogroups E and J:Inferences on the neolithization of Europe and later migratory events inthe Mediterranean area. Am J Hum Genet 74: 1023–1034.
19. Menozzi P, Piazza A, Cavalli-Sforza L (1978) Synthetic maps of human genefrequencies in Europeans. Science 201: 786–792.
20. Sokal RR, Oden NL, Wilson C (1991) Genetic evidence for the spread ofagriculture in Europe by demic diffusion. Nature 351: 143–145.
21. Cavalli-Sforza LL, Menozzi P, Piazza A (1993) Demic expansions and humanevolution. Science 259: 639–646.
22. Cavalli-Sforza LL, Menozzi P, Piazza A (1996) The history and geography ofhuman genes. Princeton (New Jersey): Princeton University Press. 413 p.
23. Barbujani G, Bertorelle G (2001) Genetics and the population history ofEurope. Proc Natl Acad Sci U S A 98: 22–25.
24. Belle EM, Landry PA, Barbujani G (2006) Origins and evolution of theEuropeans’ genome: Evidence from multiple microsatellite loci. Proc BiolSci 273: 1595–1602.
25. Haak W, Forster P, Bramanti B, Matsumura S, Brandt G, et al. (2005)Ancient DNA from the first European farmers in 7500-year-old Neolithicsites. Science 310: 1016–1018.
26. Campbell CD, Ogburn EL, Lunetta KL, Lyon HN, Freedman ML, et al.(2005) Demonstrating stratification in a European American population.Nat Genet 37: 868–872.
27. Reich DE, Cargill M, Bolk S, Ireland J, Sabeti PC, et al. (2001) Linkagedisequilibrium in the human genome. Nature 411: 199–204.
28. Gabriel SB, Schaffner SF, Nguyen H, Moore JM, Roy J, et al. (2002) Thestructure of haplotype blocks in the human genome. Science 296: 2225–2229.
29. Falush D, Stephens M, Pritchard JK (2003) Inference of populationstructure using multilocus genotype data: linked loci and correlated allelefrequencies. Genetics 164: 1567–1587.
30. Rannala B, Mountain JL (1997) Detecting immigration by using multilocusgenotypes. Proc Natl Acad Sci U S A 94: 9197–9201.
31. Rosenberg NA, Li LM, Ward R, Pritchard JK (2003) Informativeness ofgenetic markers for inference of ancestry. Am J Hum Genet 73: 1402–1422.
32. Pfaff CL, Barnholtz-Sloan J, Wagner JK, Long JC (2004) Information onancestry from genetic markers. Genet Epidemiol 26: 305–315.
33. Mitchell MK, Gregersen PK, Johnson S, Parsons R, Vlahov D (2004) TheNew York Cancer Project: Rationale, organization, design, and baselinecharacteristics. J Urban Health 81: 301–310.
34. Belkhir K, Borsa P, Chikhi L, Raufaste N, Bonhomme F (2001) GENETIX,software under Windows TM for the genetic of populations. 4.02 ed.Montpellier (France): Laboratory Genome, Populations, Interactions CNRSUMR 5000, University of Montpellier II.
35. Begovich AB, Carlton VE, Honigberg LA, Schrodi SJ, Chokkalingam AP, etal. (2004) A missense single-nucleotide polymorphism in a gene encoding aprotein tyrosine phosphatase (PTPN22) is associated with rheumatoidarthritis. Am J Hum Genet 75: 330–337.
36. Gregersen PK, Batliwalla F (2005) PTPN22 and rheumatoid arthritis:Gratifying replication. Arthritis Rheum 52: 1952–1955.
37. Seldin MF, Shigeta R, Laiho K, Li H, Saila H, et al. (2005) Finnish case-control and family studies support PTPN22 R620W polymorphism as a riskfactor in rheumatoid arthritis, but suggest only minimal or no effect injuvenile idiopathic arthritis. Genes Immun 6: 720–722.
38. Lee AT, Li W, Liew A, Bombardier C, Weisman M, et al. (2005) The PTPN22R620W polymorphism associates with RF positive rheumatoid arthritis in adose-dependent manner but not with HLA-SE status. Genes Immun 6: 129–133.
39. Bersaglieri T, Sabeti PC, Patterson N, Vanderploeg T, Schaffner SF, et al.(2004) Genetic signatures of strong recent positive selection at the lactasegene. Am J Hum Genet 74: 1111–1120.
40. Hinds DA, Stokowski RP, Patil N, Konvicka K, Kershenobich D, et al. (2004)Matching strategies for genetic association studies in structured popula-tions. Am J Hum Genet 74: 317–325.
41. Devlin B, Roeder K (1999) Genomic control for association studies.Biometrics 55: 997–1004.
42. Rabinowitz D, Laird N (2000) A unified approach to adjusting associationtests for population admixture with arbitrary pedigree structure andarbitrary missing marker information. Hum Hered 50: 211–223.
43. Jones CP (2001) Invited commentary: ‘‘Race,’’ racism, and the practice ofepidemiology. Am J Epidemiol 154: 299–304.
44. Cooper RS, Kaufman JS, Ward R (2003) Race and genomics. N Engl J Med348: 1166–1170.
45. Burchard EG, Ziv E, Coyle N, Gomez SL, Tang H, et al. (2003) Theimportance of race and ethnic background in biomedical research andclinical practice. N Engl J Med 348: 1170–1175.
46. Mountain JL, Risch N (2004) Assessing genetic contributions to phenotypicdifferences among ‘racial’ and ‘ethnic’ groups. Nat Genet 36: S48–53.
47. Bach JF (2002) The effect of infections on susceptibility to autoimmune andallergic diseases. N Engl J Med 347: 911–920.
PLoS Genetics | www.plosgenetics.org September 2006 | Volume 2 | Issue 9 | e1431350
European Population Substructure

48. Voight BF, Kudaravalli S, Wen X, Pritchard JK (2006) A map of recentpositive selection in the human genome. PLoS Biol 4: e72. DOI: 10.1371/journal.pbio.0040072
49. Scarre C (1998) Exploring prehistoric Europe. New York: OxfordUniversity Press. 228 p.
50. Cunliffe BWeditor (1994) The Oxford illustrated prehistory of Europe.Oxford: Oxford University Press. 532 p.
51. Milisauskas S (2002) European prehistory : A survey. New York: KluwerAcademic/Plenum Publishers. 445 p.
52. Renfrew C (1987) Archaeology and language: The puzzle of Indo-Europeanorigins. London: Johathan Cape. 346 p.
53. Rosser ZH, Zerjal T, Hurles ME, Adojaan M, Alavantic D, et al. (2000) Y-chromosomal diversity in Europe is clinal and influenced primarily bygeography, rather than by language. Am J Hum Genet 67: 1526–1543.
54. Sokal RR, Oden NL, Walker J, Di Giovanni D, Thomson BA (1996)Historical population movements in Europe influence genetic relation-ships in modern samples. Hum Biol 68: 873–898.
55. Barbujani G, Chikhi L (2006) Population genetics: DNAs from theEuropean Neolithic. Heredity 97: 84–85.
56. Weir B, Cockerham C (1984) Estimating F-statistics for the analysis ofpopulation structure. Evolution 38: 1358–1370.
57. Piry S, Alapetite A, Cornuet JM, Paetkau D, Baudouin L, et al. (2004)GENECLASS2: A software for genetic assignment and first-generationmigrant detection. J Hered 95: 536–539.
58. Baudouin L, Piry S, Cornuet JM (2004) Analytical Bayesian approach forassigning individuals to populations. J Hered 95: 217–224.
59. Guinand B (1996) Use of a multivariate model using allele frequencydistributions to analyse patterns of genetic differentiation amongpopulations. Biol J Linn Soc Lond 58: 173–195.
60. Nagpaul P (2001) Guide to advanced data analysis using IDAMS software.Paris: UNESCO. Available: http://www.unesco.org/webworld/idams/advguide/TOC.htm. Accessed 10 August 2006.
61. Jawaheer D, Seldin MF, Amos CI, Chen WV, Shigeta R, et al. (2003)Screening the genome for rheumatoid arthritis susceptibility genes: Areplication study and combined analysis of 512 multicase families. ArthritisRheum 48: 906–916.
62. Sawcer SJ, Maranian M, Singlehurst S, Yeo T, Compston A, et al. (2004)Enhancing linkage analysis of complex disorders: An evaluation of high-density genotyping. Hum Mol Genet 13: 1943–1949.
PLoS Genetics | www.plosgenetics.org September 2006 | Volume 2 | Issue 9 | e1431351
European Population Substructure