Clustering Ensemble for Spam Filtering
10
+ + + *
-
Upload
independent -
Category
Documents
-
view
2 -
download
0
Transcript of Clustering Ensemble for Spam Filtering

Clustering Ensemble for Spam Filtering
Santiago Porras+, Bruno Baruque+, Belén Vaquerizo+, Emilio Corchado∗
+ Civil Engineering Department. University of Burgos.* Departamento de Informática y Automática. Universidad de Salamanca.
Abstract. One of the main problems that modern e-mail systems faceis the management of the high degree of spam or junk mail they recieve.Those systems are expected to be able to distinguish between legitimatemail and spam; in order to present the �nal user as much interestinginformation as possible. This study presents a novel hybrid intelligentsystem using both unsupervised and supervised learning that can beeasily adapted to be used in an individual or collaborative system. Thesystem divides the spam �ltering problem into two stages: �rstly it di-vides the input data space into di�erent similar parts. Then it generatesseveral simple classi�ers that are used to classify correctly messages thatare contained in one of the parts previously determined. That way thee�ciency of each classi�er increases, as they can specialize in separatethe spam from certain types of related messages. The hybrid system pre-sented has been tested with a real e-mail data base and a comparison ofits results with those obtained from other common classi�cation methodsis also included. This novel hybrid technique proves to be e�ective in theproblem under study.
1 Introduction
One of the main problem that e-mail systems face nowadays is the managementof spam. By this term we refer to the action of sending of indiscriminate unwantede-mails, usually done in order to attract potential clients to use e-commercesystems to purchase articles or services or even to fraudulent services in order toobtain personal information that will be used afterwards for criminal activities.
To help users to cope with this �ow of unwanted e-mails, almost every mod-ern e-mail service includes a spam �ltering service. This kind of �ltering is ide-ally intended to automatically distinguish between spam and normal e-mails topresent the �nal user only the wanted e-mail messages, freeing them of the taskof classifying and eliminating those unwanted messages by themselves. The taskof discerning which kind of messages are of interest to the �nal user is a complextask to perform in advance; so these systems must rely on a prede�ned con�g-uration and try to adjust it to the preferences that each user provides to thesystem through his/her normal daily use. This kind of situation is clearly a taskwhere automated learning can be of much use, as an automatic algorithm canbe trained to perform this classi�cation in a transparent way for the �nal user,by adapting its behaviour as it is used.

Many approaches exist to tackle this very common problem. According towhat parts of the e-mail the �ltering system analyzes, the solutions can be di-vided into header or meta-information based or content based. According to thearchitecture of the system a rough division could be between individual andcollaborative systems. Usually, a modern spam �ltering system would try tocombine all of these techniques to bene�t from the straights of each.
This study presents a novel hybrid intelligent system using both unsupervisedand supervised learning that can be easily adapted to be used in an individualor collaborative system. It makes use of the Self-Organizing Map for a initialpartitioning of data and the Naive Bayes for the �nal e-mail classi�cation.
The rest of this work is organized as follows: Section 2 presents a briefoverview of the concept of ensemble learning, Section 3 includes a very sim-pli�ed description of the SOM algorithm and more detailed explanations aboutits use a clustering algorithm. Section 4 introduces the hybrid model used forspam classi�cation while Section 5 details the experiments performed with thealgorithm and their results, compared with similar models. Finally conclusionsand future work are described in Section 6.
2 Ensemble Learning
At its inception, the ensemble meta-algorithm [1] was created to improve thecapabilities of existing models for data classi�cation. The main concept behindensemble learning model is the simple intuitive idea of a committee of expertsworking together to solve a problem.
The strength of the ensemble meta-algorithm is its potential to achieve acompromise between the desired result of both a small variance and a smallbias; as a trade-o� between �tting the data too closely (high variance) andnot taking data into account at all (high bias). An important element is thee�ective combination of the classi�ers, which relies in part on the presence of acertain variance in the components of the ensemble that is generally referred as`diversity'. There is considerable evidence to suggest that the use of ensemblescan lead to an improvement in the performance of single models in classi�cationor regression tasks [2,3,4]. The underlying reason for increased reliability throughthe use of ensembles is that di�erent classi�cation algorithms will show di�erentpatterns of generalization. More formal explanations of the way ensembles canimprove performance may be found in [5,6].
There are generally two ways to combine the decisions of classi�ers in ensem-bles: classi�er selection [7] and classi�er fusion [6,8]. Classi�er selection assumesthat each classi�er is an �expert� for some part of the feature space. In contrast,classi�er fusion assumes that all classi�ers are trained over the entire featurespace. In the case of this work, the �rst approach is the one used.

3 Topology Preserving Maps
3.1 The SOM Algorithm
Topology preserving mapping comprises a family of techniques with a commontarget: to produce a low-dimensional representation of the training samples thatpreserves the topological properties of the input space. From among the varioustechniques, the best known is the Self-Organizing Map (SOM) algorithm [9].SOM aims to provide a low-dimensional representation of multi-dimensional datasets while preserving the topological properties of the input space. The SOMalgorithm is based on competitive unsupervised learning; an adaptive process inwhich the neurons in a neural network gradually become sensitive to di�erentinput categories, which are sets of samples in a speci�c domain of the input space. The update of neighbourhood neurons in SOM is expressed as:
wk(t+ 1) = wk(t) + α(t)η(v, k, t)(x(t)− wk(t)) (1)
where, x denotes the network input, wk the characteristics vector of eachneuron; α, is the learning rate of the algorithm; and η(v, k, t) is the neighbour-hood function, in which v represents the position of the winning neuron (BestMatching Unit or BMU) in the lattice, and k the positions of the neurons in itsneighbourhood.
3.2 Data Clustering Capabilities
The clustering capabilities of the SOM algorithm have been extensively used inmany works [10,11]. Mainly intended as a visual aid for data clusters exploration,several calculations over the �nal map have been proposed. After the calculationis performed, it can be represented over the �nal resulting map as a colourscheme. In the case of this study the three measures presented in [12,13] areused.
U-Matrix: This matrix represents for each unit of the map, the sum of the eu-clidean distances between its corresponding weights vector and all the data sam-ples that are recognized by it. It permits to get a visual idea of how concentratedor disperse is the data set in the manifold represented by the map. Obviously,it is a valuable tool to detect and determine clusters and cluster borders in thedata set.
P-Matrix: In this case, the values represented in the matrix are calculated asthe density measured in the data space at a speci�c point, where that pointis the weight vector associated with each unit of the SOM. As with previousmatrix, the measure of the concentration of data serves as a very good measurefor �nding clusters in data.

U*-Matrix: This �nal matrix combines the distance based U-Matrix and thedensity based P-Matrix. It consists in using the U-Matrix as a basis for the �nalmatrix, and the P-Matrix. Again, this matrix is used to obtain data clusters,especially in thin populated regions of the data space; where distances are moreimportant that density to determine the similarity of data.
As the results obtained by all these three matrix calculations consist basicallyin numerical values for each of the units composing the maps, they can be used asan automatic way of determining the number of clusters in a data set but moreimportantly in this case, can inform about things like the boundary of thoseclusters or the density of data included in them. That information is used in thepresented model to decide the structure that the ensemble of base classi�ers willhave.
4 Proposed Model
The intelligent hybrid model proposed in this research tries to take further theidea initially expressed in [14]. This previous work uses the well known k-nearestneighbours algorithm [15] as a way to initially explore the data set input spaceto latter construct an ensemble of classi�ers that use that previously gatherinformation to split data into the di�erent components in a more informed waythat other ensemble methods that use random or probability based distributions[16,17]. That way, an ensemble is constructed, ensuring that the base classi�erscomposing it will be expert in di�erent regions of the data space.
In this case the SOM algorithm will be used to perform automatically thisprevious analysis and division of the data space. The use of this algorithm hasseveral advantages over using other, simpler algorithms, such as the k-nearestneighbours.
In �rst place, the SOM is a complete grid extending over the data input space.That implies that is easy to observe and take into account not only similaritybetween samples, but to determine an ordered impression of that similarity, justusing the distance between units on the map. Using the measures described inSection 3.2 several options for data clustering can be used, in a very straightfor-ward way, to decide which con�guration or architecture could be better for theconstruction of the ensemble and the data set partitions to train the model.
In the case of this study the SOM enables to split data between clusters,but also it is easy to �nd cluster frontiers were more detail and precision isrequired; therefore, data in those areas can be used to train several classi�ers toenhance accuracy in those regions. For example, data situated in the borders oftwo clusters could be assigned to two di�erent classi�ers to try to obtain severaldi�erent classi�ers for those regions. Also, clusters that are either too extensiveor that contain a high density of data can have more classi�ers to back theclassi�cations of others.
Other advantage that comes from the use of the SOM is that there is noneed to use the number of clusters as a parameter to the algorithm, instead a

threshold can be used to control how sensitive the algorithm is to changes invalues for neighbouring units.
(a) U-Matrix (b) Data clusters obtained with U-Matrix
(c) U*-Matrix (d) Data clusters obtained with U*-Matrix
Fig. 1: Two of the mentioned matrix calculated on a 15x10 units SOM trainedover the Iris data set
Figure 1 shows the values obtained for two of the matrix mentioned on Section3.2 (Figs. 1a and 1c) and the corresponding clusters found with thresholds 0.0012and 0.002 respectively (Figs. 1b and 1d) in the well-known case of the Iris dataset [18]. Figs. 1a and 1c represent the values of the matrix in a color scale. Itis easy to observe a gap with very low values that divides the data in two maingroups. Figs. 1b and 1d depict the di�erent clusters or divisions the algorithmhas found in the data space. Each colour represents a di�erent cluster.
The processing devised can be therefore summarized as in Algorithm 1.
Algorithm 1 SOM Clustering and Selecting Ensemble
Input: A data set to be classi�ed DεRn, a clustering threshold θc, a inclusion threshold
θmOutput: A model able to classify novel entries C1...Cn
1: procedure Construct Ensemble(C1...Cn)2: Train a Self-Organizing Map over the input data set.3: Label the units of the map with the entries for which it has been considered as
the BMU.4: Calculate the requested matrix values for each map unit (U -Matrix, P -Matrix,U∗-Matrix).
5: Perform a clustering of units depending in the di�erence in the value calculatedin step 3 for each unit and its neighbours, using θc.
6: Include each data sample in each of the clusters found in step 4, accordingto which cluster its corresponding BMU belongs to. Eliminate the clusters with anumber of samples lower than θm.
7: Train a base classi�er with the data entries that form part of each of the clusters.8: end procedure9: procedure Classify Sample(s)10: Present sample to the Self-Organizing Map and �nd the BMU11: Present sample to the classi�er(s) corresponding to the BMU12: Output the majority vote of classi�cations obtained in the previous step13: end procedure
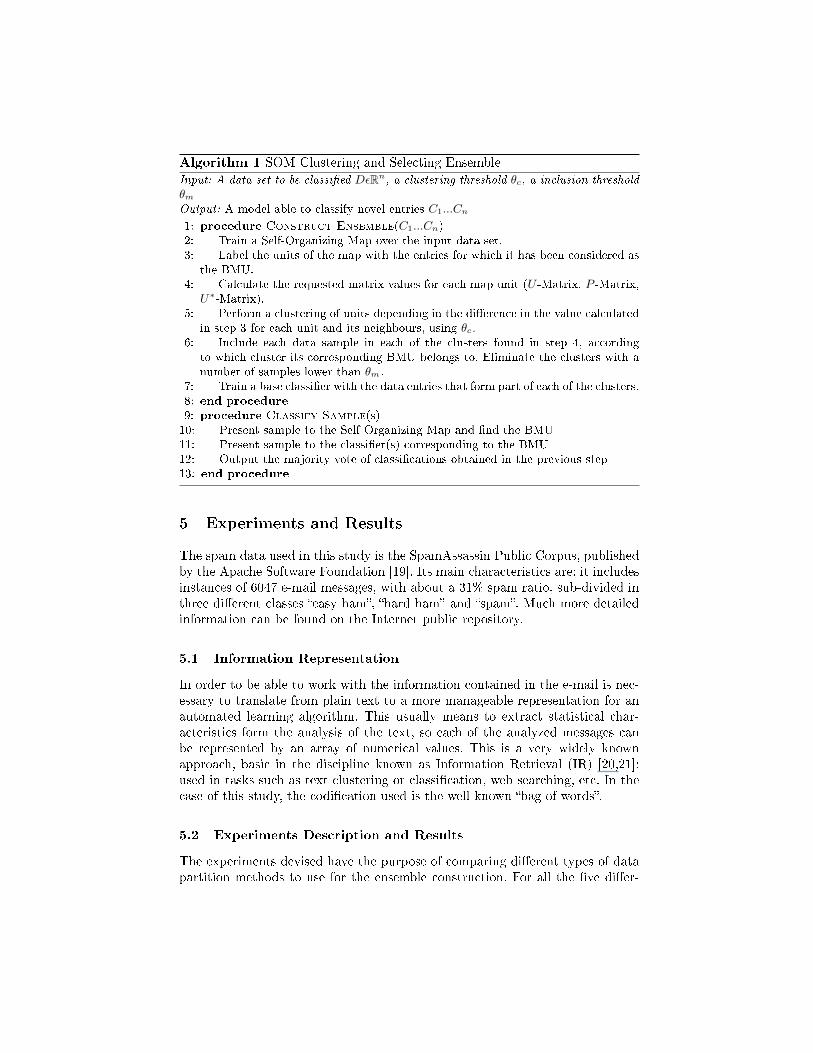
5 Experiments and Results
The spam data used in this study is the SpamAssassin Public Corpus, publishedby the Apache Software Foundation [19]. Its main characteristics are: it includesinstances of 6047 e-mail messages, with about a 31% spam ratio, sub-divided inthree di�erent classes �easy ham�, �hard ham� and �spam�. Much more detailedinformation can be found on the Internet public repository.
5.1 Information Representation
In order to be able to work with the information contained in the e-mail is nec-essary to translate from plain text to a more manageable representation for anautomated learning algorithm. This usually means to extract statistical char-acteristics form the analysis of the text, so each of the analyzed messages canbe represented by an array of numerical values. This is a very widely knownapproach, basic in the discipline known as Information Retrieval (IR) [20,21];used in tasks such as text clustering or classi�cation, web searching, etc. In thecase of this study, the codi�cation used is the well-known �bag of words�.
5.2 Experiments Description and Results
The experiments devised have the purpose of comparing di�erent types of datapartition methods to use for the ensemble construction. For all the �ve di�er-

ent partition schemes compared, the results are obtained from a 5-fold cross-validation process.
The �ve schemes are: the standard Bagging algorithm [16], which generatesoverlapping data sub-sets; and the k-means clustering algorithm and three vari-ants of the presented model (U -Matrix, P -Matrix and U∗-Matrix), which gen-erate disjoint sub-sets. The k-means clustering algorithm was previously used in[14] and is included here for the great parallelism with the presented model.
The tests have the same structure independently of the models chosen: �rstthe data set is split between training and test sets. The training set is split intoseveral sub-sets and a base classi�er is trained over the data of each sub-set.All models used the classic Naive-Bayes classi�er as their base classi�er. Then,the test set is presented again to each model. The split model used to includetraining data in di�erent sub-sets is used again to separate the test set and eachsub-set is used as the inputs for their corresponding classi�er.
Data set Size (units) Learning Rate Epochs Neighbourhood
Iris 8x8 0.1 1200 4
SPAM (25%) 15x15 0.1 10000 7
SPAM (complete) 30x30 0.1 15000 15
Table 1: Parameters used for the SOM training in each case
Table 1 presents the parameters used for the SOM training in each of thedata sets of the comparative.
SOM
Data set Bagging k-means U -Matrix P -Matrix U∗-Matrix
Iris 5 5 13 4 1
SPAM (25%) 5 5 26 7 7
SPAM (complete) 5 5 58 27 15
Table 2: Number of divisions used for each model and data set
It is interesting to note that the bagging and k-means methods require asinputs the number of folds/clusters in which the data set will be divided. Thisassumes that the user will have a relative knowledge about the data set. Asexplained before, the proposed algorithm does not need a so hard restriction overthe algorithm, but only a di�erence threshold parameter; that lets the processto calculate the most adequate number of clusters. Table 2 shows the di�erenceof the models in this regard.
Table 3 shows the results obtained with the data set under analysis in thiswork. The Iris data set is one of the widely used for automatic learning test

SOM
Data set Bagging k-means U -Matrix P -Matrix U∗-Matrix
Iris 4.66% 5.33% 3.42% 4.66% 4.66%
SPAM (25%) 19.1% 11.1% 10.17% 10.51% 9.62%
SPAM (complete) 50% 44.03% 39.54% 39.42% 37.3%
Table 3: Percentage of classi�cation error obtained using di�erent techniques
and is included for comparative purposes. Finally, the two data sets object ofthe study are a fraction of the original Spam data set, used to try to avoid thecomputational complexity of training the model with the complete data set; andthe complete one.
As results show, the use of hybrid system consisting on the SOM to clusterthe data as a previous step to construct the ensemble can be generally regardedas an improvement over the other compared techniques. As hinted before, thissituation comes from the fact that the SOM can provide a more detailed man-ifold to cluster the data, as opposed to the k-means, which is a much simplertechnique.
When dealing with a very simple data set, as it is the case of the Iris dataset, the extra complexity of calculating the SOM might not be so rewarding (theimprovement is of less than a 2%). On the contrary, when working with biggerand more complex data sets (as the complete Spam, studied in this work) wherethere are large parts of the data set with overlapping classes, the more detaileddivisions of the SOM can be of more clear use. In this study, the SOM obtainsan error more than 5% lower than that of the k-means (see Table 3).
Regarding the di�erent variants of the measures that can be calculated overthe SOM, results seem to be better for the U-Matrix for the simpler data setsand for the U∗-Matrix for the more complex ones. This is result that will needfurther study.
6 Conclusions and Future Work
This study presents a model for the detection and �ltering of spam based data ona hybrid intelligent system including both unsupervised and supervised learn-ing. The model is variant of the idea of the clustering and selection concept,previously proposed by using a SOM as the clustering algorithm.
This novel hybrid model can be considered interesting for this task for severalreasons. As explained in this work, one interesting topic on spam-�ltering is thecollaborative approaches, where several �ltering systems work together to detectspam. The cluster and selection scheme studied here can be very easily adaptedto work in these cases to distribute the classi�cation among more specializedsystems. This provides a heterogeneous framework where many models couldbe included. An additional reason is that the model can be used to provide thetop-level mailing system administrator with complementary information, as the

SOM included in the model has multi-dimensional data visualization as one ofits main characteristics. Also, having an auto-adaptive model such as the SOM,which functioning can vary with the continuous training; could serve to softenthe e�ect of concept drifts or modi�cations in the behaviour of spammers.
Regarding future work, it is interesting to mention that the meta-model pre-sented here can be extended and improved in many ways, as it can be used asa framework for more complex schemes. As an example, in the test showed onlya base classi�er was trained for each of the clusters calculated. But due to themore detailed capabilities of the SOM for clustering, it could be adapted to trainclassi�ers for the data samples near the borders of clusters or to train severaldi�erent classi�ers to strengthen classi�cation in clusters where classes overlapin a high degree.
Acknowledgments. This research has been partially supported through project ofthe Spanish Ministry of Science and Innovation TIN2010-21272-C02-01 (fundedby the European Regional Development Fund). The authors would also like tothank the vehicle interior manufacturer, Grupo Antolin Ingenieria S.A., withinthe framework of the MAGNO2008 - 1028.- CENIT Project also funded by theMICINN.
References
1. D. Ruta and B. Gabrys, �An overview of classi�er fusion methods,� Computing andInformation Systems Vol. 7, No. 1(ISSN 1352-9404), pp. pp. 1�10, 2000.
2. R. E. Schapire, �The strength of weak learnability,� Machine Learning vol. 5, no.2, pp. 197�227, 1990.
3. B. Baruque and E. Corchado, �A weighted voting summarization of SOMensembles,� Data Mining and Knowledge Discovery 21, pp. 398�426, 2010.10.1007/s10618-009-0160-3.
4. E. Corchado and B. Baruque, �Wevos-visom: An ensemble summarization algo-rithm for enhanced data visualization,� Neurocomputing in press, 2011.
5. A. Sharkey and N. Sharkey, �Combining diverse neural nets,� Knowledge Engineer-ing Review 12, 3, pp. 1�17, 1997.
6. L. I. Kuncheva, Combining Pattern Classi�ers: Methods and Algorithms, Wiley-Interscience, 2004.
7. R. Jacobs, M. I. Jordan, N. S. J., and G. E. Hinton, �Adaptive mixtures of localexperts,� Neural Computation 3, pp. 79�87, 1991.
8. R. Polikar, �Ensemble based systems in decision making,� IEEE Circuits and Sys-
tems Magazine 6(3), pp. 21�45, 2006.9. T. Kohonen, Self-Organizing Maps, vol. 30, Springer, Berlin, Germany, 1995.10. J. Lampinen and E. Oja, �Clustering properties of hierarchical self-organizing
maps,� Journal of Mathematical Imaging and Vision 2, pp. 261�272, 1992.11. R. Dara, S. C. Kremer, and D. A. Stacey, �Clustering unlabelled data with SOMs
improves classi�cation of labelled real-world data,� in Proc. IEEE World Congress
on Computational Intelligence, pp. 2237�2242, May 2002.12. A. Ultsch, �Self-organizing neural networks for visualization and classi�cation,� in
Proc. Conf. Soc. for Information and Classi�cation, 1992.

13. A. Ultsch, �U*-matrix: A tool to visualize clusters in high dimensional data,� tech.rep., Department of Computer Science, University of Marburg, 2003.
14. L. I. Kuncheva, �Clustering-and-selection model for classi�er combination,� in KES,pp. 185�188, 2000.
15. K. Beyer, J. Goldstein, R. Ramakrishnan, and U. Shaft, �When is nearest neighbormeaningful?,� in Computer Science Database Theory ICDT'99, Lecture Notes in
Computer Science Volume 1540/1999, pp. 217�235, Springer, 1999.16. L. Breiman, �Bagging predictors,� Machine Learning 24(2), pp. 123�140, 1996.17. Y. Freund and R. E. Schapire, �Experiments with a new boosting algorithm,� in
International Conference on Machine Learning, pp. 148�156, 1996.18. A. Asuncion and D. J. Newman, �UCI machine learning repository,� 2007.19. Apache Software Foundation, �Spamassasin public corpus,� 2006.20. A. Singhal, �Modern information retrieval: A brief overview,� Bulletin of the IEEE
Computer Society Technical Committee on Data Engineering 24 (4), pp. 35�43,2001.
21. M. E. Maron, �An historical note on the origins of probabilistic indexing,� Infor-mation Processing and Management 44, pp. 971�972, 2008.