Shift in the Raman symmetric stretching band of N2, CO2, and ...
14
RESEARCH ARTICLE Shift in the Raman symmetric stretching band of N 2 , CO 2 , and CH 4 as a function of temperature, pressure, and density D. Matthew Sublett Jr. 1 | Eszter Sendula 1 | Hector Lamadrid 2 | Matthew Steele-MacInnis 3 | Georg Spiekermann 4 | Robert C. Burruss 5 | Robert J. Bodnar 1 1 Department of Geosciences, Virginia Tech, Blacksburg, Virginia, USA 2 Department of Geological Sciences, University of Missouri, Columbia, Missouri, USA 3 Department of Earth & Atmospheric Sciences, University of Alberta, Edmonton, Alberta, Canada 4 Institut für Geowissenschaften, Universität Potsdam, Potsdam, Germany 5 United States Geological Survey, Reston, Virginia, USA Correspondence D. Matthew Sublett Jr., Department of Geosciences, Virginia Tech, 4044 Derring Hall, 926 West Campus Drive, Blacksburg 24061, VA. Email: [email protected] Funding information National Science Foundation, Grant/ Award Numbers: EAR-1624589, OCE- 1459433 Abstract The Raman spectra of pure N 2 , CO 2 , and CH 4 were analyzed over the range 10 to 500 bars and from −160 C to 200 C (N 2 ), 22 C to 350 C (CO 2 ), and −100 C to 450 C (CH 4 ). At constant temperature, Raman peak position, including the more intense CO 2 peak (ν+), decreases (shifts to lower wave number) with increasing pressure for all three gases over the entire pressure and temperature (PT) range studied. At constant pressure, the peak position for CO 2 and CH 4 increases (shifts to higher wave number) with increasing temperature over the entire PT range studied. In contrast, N 2 first shows an increase in peak position with increasing temperature at constant pressure, followed by a decrease in peak position with increasing temperature. The inflection temperature at which the trend reverses for N 2 is located between 0 C and 50 C at pressures above ~50 bars and is pressure dependent. Below ~50 bars, the inflection temperature was observed as low as −120 C. The shifts in Raman peak positions with PT are related to relative density changes, which reflect changes in intermolecular attraction and repulsion. A conceptual model relating the Raman spectral properties of N 2 , CO 2 , and CH 4 to relative density (volume) changes and attractive and repulsive forces is presented here. Addi- tionally, reduced temperature-dependent densimeters and barometers are pres- ented for each pure component over the respective PT ranges. The Raman spectral behavior of the pure gases as a function of temperature and pressure is assessed to provide a framework for understanding the behavior of each component in multicomponent N 2 -CO 2 -CH 4 gas systems in a future study. KEYWORDS fluids, wave number, attraction, repulsion 1 | INTRODUCTION Natural fluids in which N 2 , CO 2 , and CH 4 are major con- stituents are common in metamorphic environments, [1–5] sedimentary basins, [6,7] and in some ore-forming environments. [8,9] They have also been identified in the atmosphere and at the surface of some celestial bodies such as Titan, an icy moon of Saturn. [10,11] Furthermore, gas mixtures with similar compositions are commonly part of industrial processes, as well as in agricultural and Received: 14 August 2019 Revised: 15 November 2019 Accepted: 15 November 2019 DOI: 10.1002/jrs.5805 J Raman Spectrosc. 2020;51:555–568. wileyonlinelibrary.com/journal/jrs © 2019 John Wiley & Sons, Ltd. 555
-
Upload
khangminh22 -
Category
Documents
-
view
3 -
download
0
Transcript of Shift in the Raman symmetric stretching band of N2, CO2, and ...

R E S E A R CH AR T I C L E
Shift in the Raman symmetric stretching band of N2, CO2,and CH4 as a function of temperature, pressure, and density
D. Matthew Sublett Jr.1 | Eszter Sendula1 | Hector Lamadrid2 |
Matthew Steele-MacInnis3 | Georg Spiekermann4 | Robert C. Burruss5 |
Robert J. Bodnar1
1Department of Geosciences, VirginiaTech, Blacksburg, Virginia, USA2Department of Geological Sciences,University of Missouri, Columbia,Missouri, USA3Department of Earth & AtmosphericSciences, University of Alberta,Edmonton, Alberta, Canada4Institut für Geowissenschaften,Universität Potsdam, Potsdam, Germany5United States Geological Survey, Reston,Virginia, USA
CorrespondenceD. Matthew Sublett Jr., Department ofGeosciences, Virginia Tech, 4044 DerringHall, 926 West Campus Drive, Blacksburg24061, VA.Email: [email protected]
Funding informationNational Science Foundation, Grant/Award Numbers: EAR-1624589, OCE-1459433
Abstract
The Raman spectra of pure N2, CO2, and CH4 were analyzed over the range
10 to 500 bars and from −160�C to 200�C (N2), 22�C to 350�C (CO2), and
−100�C to 450�C (CH4). At constant temperature, Raman peak position,
including the more intense CO2 peak (ν+), decreases (shifts to lower wave
number) with increasing pressure for all three gases over the entire pressure
and temperature (PT) range studied. At constant pressure, the peak position
for CO2 and CH4 increases (shifts to higher wave number) with increasing
temperature over the entire PT range studied. In contrast, N2 first shows an
increase in peak position with increasing temperature at constant pressure,
followed by a decrease in peak position with increasing temperature. The
inflection temperature at which the trend reverses for N2 is located between
0�C and 50�C at pressures above ~50 bars and is pressure dependent. Below
~50 bars, the inflection temperature was observed as low as −120�C. The shiftsin Raman peak positions with PT are related to relative density changes, which
reflect changes in intermolecular attraction and repulsion. A conceptual model
relating the Raman spectral properties of N2, CO2, and CH4 to relative density
(volume) changes and attractive and repulsive forces is presented here. Addi-
tionally, reduced temperature-dependent densimeters and barometers are pres-
ented for each pure component over the respective PT ranges. The Raman
spectral behavior of the pure gases as a function of temperature and pressure
is assessed to provide a framework for understanding the behavior of each
component in multicomponent N2-CO2-CH4 gas systems in a future study.
KEYWORD S
fluids, wave number, attraction, repulsion
1 | INTRODUCTION
Natural fluids in which N2, CO2, and CH4 are major con-stituents are common in metamorphic environments,[1–5]
sedimentary basins,[6,7] and in some ore-forming
environments.[8,9] They have also been identified in theatmosphere and at the surface of some celestial bodiessuch as Titan, an icy moon of Saturn.[10,11] Furthermore,gas mixtures with similar compositions are commonlypart of industrial processes, as well as in agricultural and
Received: 14 August 2019 Revised: 15 November 2019 Accepted: 15 November 2019
DOI: 10.1002/jrs.5805
J Raman Spectrosc. 2020;51:555–568. wileyonlinelibrary.com/journal/jrs © 2019 John Wiley & Sons, Ltd. 555

municipal waste management, for example, in the pro-duction of biofuels that are increasingly used for generat-ing heat and electricity.[12,13] Thus, methods to analyzethe physical and chemical properties of these gases andgas mixtures are needed for a variety of applications.
Raman spectroscopy offers a nondestructive methodto characterize the properties of a wide variety of naturaland synthetic materials. The intensity, width, and wavenumber (hereafter, referred to as “peak position”) of aRaman peak provide information on the bonding envi-ronment of the molecules in the material of interest.[14]
Raman peak positions of fluids have been shown to varyas functions of pressure, temperature, and density.[4,15–37]
Shifts in the Raman peak position of fluids with changingconditions have been related to the attractive and repul-sive forces between molecules: attractive forces causeRaman peak position to shift to lower wave number,whereas repulsive forces cause Raman peak position toshift to higher wave number, and the overall direction ofpeak shift with changing conditions implies dominanceof either attractive or repulsive forces.[21,27,38–40]
The N2 molecule has only one fundamental vibra-tional mode, the symmetric stretching of the N≡N bond,which is Raman active at approximately 2,330 cm−1 at1 bar.[41] Several studies have investigated the change inthe Raman spectral properties of N2 over a range of pres-sures at room temperature,[19,23,24] at low temperaturesnear or below the critical point,[25,27] at elevatedtemperatures,[28,30,42] and in gas mixtures.[13,15,19,31]
The CH4 molecule exhibits four fundamental vibra-tional modes that are Raman active, at approximately3,019, 2,917, 1,534, and 1,309 cm−1 at 1 bar, but only the2,917-cm−1 mode (ν1), which represents the symmetricstretching of the C─H bond, is commonly observed inRaman spectra.[4] The shift in Raman peak position ofthe symmetric stretching mode of CH4 with pressure hasbeen studied at room temperature,[16,17,22,32–34] at lowertemperatures down to −150�C,[16,17,34] at elevatedtemperatures,[34] and in mixtures.[13,15,19,31,35–37]
Due to its linear geometry, CO2 should show only onefundamental vibrational mode that is Raman active (sym-metric stretching of the C═O bond) at approximately1,333 cm−1. However, this mode exhibits nearly the sameenergy as the first overtone of the infrared-active bendingmode.[43] The interaction between these two modesresults in a splitting of the 1,333 cm−1 vibrational bandinto two bands, nominally located at 1,388 and1,285 cm−1 at 1 bar, in a process known as Fermi reso-nance.[4,44] These two peaks are referred to as the Fermidiad, and the distance between the two peaks has beenused to estimate the density of CO2.
[18–20,44–47]
In this study, we explore the vibrational properties ofpure N2, CH4, and CO2 over broad pressure and
temperature (PT) ranges to investigate the relationshipsbetween Raman spectral features, pressure, and tempera-ture. We interpret the results in terms of relative volu-metric (density) changes, attractive and repulsive forcesbetween molecules, and proximity to the critical point.This study thus expands the available Raman peak shiftdata on N2, CH4, and CO2 to a larger PT range and pro-vides a starting point for examining variations in Ramanspectral properties of these gases in higher order systemsin future studies.
2 | METHODS
Raman spectra for N2, CH4, and CO2 were collected from10 to 500 bars over temperature ranges of −160�C to200�C (N2), −100�C to 450�C (CH4), and 22�C to 350�C(CO2) using a JY Horiba LabRam HR (800-mm spectrom-eter) Raman microprobe equipped with a high-pressureoptical capillary system (similar to that described byChou et al.[48]) and a Linkam CAP500 capillary heatingand cooling stage. The Raman microprobe is equippedwith an 1,800-grooves per millimeter grating, a slit widthof 150 μm, a confocal aperture of 400 μm, and a 40×microscope objective (numerical aperture = 0.55). Excita-tion was provided by a 514-nm Laser Physics 100S-514Ar+ laser with an output power at the source of 50 mW.The lower temperature limit at which data were obtainedfor each gas corresponds to the intersection of the liquid–vapor (L–V) curve for that gas along the isobar of inter-est, whereas the higher temperature limits reflect thedecrease in signal strength with increasing temperaturethat precluded determination of Raman peak positions.The lower pressure limit is defined by the lowest pressureat which peaks with sufficient intensity above back-ground to be quantified could be recorded, and the upperpressure limit was arbitrarily chosen to be 500 bars.Gases were commercially prepared by Airgas, Inc(99.999% pure).
The Linkam CAP500 capillary heating and coolingstage was connected to two manual pressure generators(HiP Model 37-6-30) that allow the pressure inside thecapillary tube to be controlled and varied. Generally,measurements along an isotherm began at low pressure,with the piston positioned such that it is mostly ret-racted from the sample cell, thus maximizing the sam-ple volume. Starting at 10 bars, the pressure is increasedincrementally, and the Raman peak position for the gasof interest was determined at each pressure along theisotherm until the maximum pressure (500 bars) wasreached. Then the temperature was changed, and theprocess was repeated along that new isotherm. Addi-tional details of the pressure system have been
556 SUBLETT ET AL.

published elsewhere.[16–20] Pressure was monitoredusing a precise instruments pressure transducer (Model645). The error in the pressure measurements was±0.1% of the total output pressure reading. Temperaturewas monitored using the internal thermocouple of theCAP500 stage with an error in the temperature mea-surements of no more than ±0.4% of the total outputtemperature reading.
Raman analyses were conducted through a transpar-ent 20-cm long square flexible fused silica capillary tubewith an outer diameter of ~363 μm and an inner diameterof ~100 μm, prepared by Polymicro Technologies, LLC.Raman measurements were collected from the center ofa 5-cm long portion of the capillary that washeated/cooled within the stage. The thermal gradientalong this 5-cm portion is reported by Linkam to be±0.2% of the total output temperature at the edges rela-tive to the center. Spectra were collected only after the
temperature and pressure stabilized and remained con-stant, with equilibration periods of at least 1 min afterthe pressure was changed and 10 min following a changein temperature. Collection times were selected to ensurethat the Raman peaks of interest consisted of at least fourdata points above the background noise, with CO2 andN2 requiring the longest collection times (~180 s at10 bars) and CH4 requiring the shortest (~40 s at 10 bars).The collection times required to satisfy our threshold ofat least four points above background noise decreasedwith increasing pressure and decreasing temperature.Certain low-pressure, high-temperature conditions wereexcluded from this study because spectra at these condi-tions, especially for N2 and CO2, did not show at leastfour data points above background noise. Additionally,the peak intensity to full width at half maximum(FWHM) ratio for each peak was never less than500 counts/cm−1 and in most cases was greater than1,000 counts/cm−1. Both selection criteria, the peakintensity to FWHM ratio and at least four data pointsabove the noise, are applied to all peaks collected in thisstudy, including both the more and less intense peaksthat make up the Fermi diad. Three accumulations werecollected for each gas, and this was repeated three timesat each PT condition to produce three data points at eachPT point and to assess the precision in the
measurements. The average variation in the Raman peakpositions of N2, CO2, and CH4 was ±0.01, ±0.02, and ±0.01 cm−1, respectively, and the average variation in theFermi diad measurements was ±0.02 cm−1. The Ramanpeak positions calculated from each of the three collec-tions were averaged and used in all subsequent data ana-lyses discussed below.
The peaks recorded in this study include the symmet-ric stretching modes of N2 (N≡N) and CH4 (C─H), nomi-nally located at 2,331 and 2,917 cm−1 at 1 bar,respectively; and the two peaks that comprise the Fermidiad of CO2, nominally located at 1,388 and 1285 cm−1 at1 bar. Ne lines bounding the peaks of interest (N2,2,253.58 and 2,433.93 cm−1; CO2, 1,031.42 and1,458.58 cm−1; and CH4, 2,851.49 and 2,972.55 cm−1)were collected simultaneously with each gas analysis tocorrect for spectrometer drift, following the correctionmethod of Lin et al.[17]
where Ne± are the Ne emission lines that occur at higher(+) and lower (−) wave numbers compared with the peakfor the gas, real is the known position of the Ne emissionline, and measured is the measured position of the Neemission line. All spectra were fit using LabSpec 5 soft-ware first using a linear baseline correction and then aGaussian–Lorentzian peak fitting function.
Several recent studies have shown that although theabsolute peak position at a given PT condition showsslight variation from one study to another owing to labo-ratory and instrument specific factors, all studies showsimilar parallel trends in the variation in peak positionwith pressure.[20,35] As such, to allow comparisonbetween our new data and other published data, ourresults at 22�C were corrected to be consistent with datafrom Fall et al.[18] for CO2 and Lin et al.[16] for CH4.These studies chosen for inclusion were selected becausethey were conducted using the same Raman microprobe,and the same data collection and analysis procedure, thatwas used in this study. That is, if at 22�C and some pres-sure our measured peak position was, for example,0.04 cm−1 higher than that reported in the studiesreferred to above for the same gas at the same PT condi-tion, we systematically subtracted 0.04 cm−1 from ourdetermined peak position to bring the results from thetwo studies into agreement. We also note, as has been
νicorr =12
νimeasured + νNe,−real −νNe,−measured
� �� �+ νimeasured + νNe,+real −νNe,+measured
� �� �� �, ð1Þ
SUBLETT ET AL. 557

described by Lamdarid et al.[20] and Lu, Chou, Burruss,and Song,[35] that the magnitude of the difference variedslightly from day to day; as such, the correction factorwas determined before each analytical session andapplied to the data collected during that session. Becausethere were no data for N2 at 22�C in the literature thatwere collected using the same Raman system and collec-tion protocol as used here, we determined our own cali-bration curve at this temperature and then used theseresults to correct the N2 peak positions in all subsequentanalyses. The only Raman spectral feature of interest inthis study was peak position; accordingly, the FWHM,peak areas, and intensities of the peaks are not reportedhere. However, Figure S1 shows the relative change inpeak intensity and width under changing PT conditionsfor each gas. All Raman peak positions and Fermi diadsplitting measurements collected in this study, as well asthe error in the Raman measurements determined, calcu-lated densities, and compressibility factors, are presentedin Appendix A.
3 | RESULTS
3.1 | Isothermal peak shift withchanging pressure
The relationship between pressure and Raman peak posi-tion over the temperature range of interest for each
species is shown in Figure 1. The critical point for CH4
(Figure 1a) is located at −83�C and 46 bars. For all iso-therms that are above the critical temperature (−83�C),the L–V curve is not intersected as the pressure isincreased and there is a smooth and continuous variationin peak position as a function of pressure. However, theL–V curve is intersected at ~23 bars along the −100�Cisotherm. That is, during the experiment, as the pressurewas increased from 10 bars at −100�C, the L–V curve forCH4 is intersected at ~23 bars and liquid begins to con-dense from the vapor. At this point, the pressure remainsconstant until all of the vapor phase has condensed intoliquid as the sample cell volume is decreased. This phasetransition leads to a discontinuity in peak position versuspressure along the −100�C isotherm in Figure 1a repre-sented by the dashed portion of the isotherm. At this con-dition, if one were to focus the laser in the vapor phase, apeak position corresponding to the density of the vaporphase on the L–V curve would be obtained; similarly, ifthe laser were focused on the liquid phase, a peak posi-tion corresponding to the density of the liquid phase onthe L–V curve would be obtained.
For CH4, the peak position decreases with increasingpressure at constant temperature over the entire tempera-ture range studied (Figure 1a), and the CH4 peak positionincreases with increasing temperature at constant pres-sure over the entire pressure range studied. Also shownon Figure 1a is the critical point and the projection of thecritical isochore for CH4. Note that conditions to the left
(a) (b)
(c)
FIGURE 1 Plots of the peak
position of (a) CH4, (b) N2, (c) and CO2
versus pressure over the temperature
ranges studied. The green star
represents the critical point for each
species, whereas the black dashed line
represents the critical isochore. The
dashed portion of the lowest
temperature isotherm for each species
represents the discontinuity in peak
position as the liquid–vapor curve is
intersected by the isotherm [Colour
figure can be viewed at
wileyonlinelibrary.com]
558 SUBLETT ET AL.

of the critical isochore correspond to fluids with densitiesgreater than the critical density and are more liquid-like,whereas conditions to the right of the critical isochorecorrespond to fluids with densities less than the criticaldensity and are more vapor-like.
The critical point of N2 (Figure 1b) is located at−147�C and 34 bars, and the −160�C isotherm intersectsthe L–V curve at ~12 bars, as shown by the discontinuityalong the −160�C isotherm represented by the dashedportion of the isotherm. As with CH4, the peak positionof N2 decreases at constant temperature with increasingpressure over the entire temperature range studied. How-ever, unlike CH4, there is a reversal in the direction ofthe peak shift at pressures above 50 bars and tempera-tures between 0�C and 50�C (depending on pressure). Atpressures above the transition pressure, the peak positionincreases with increasing temperature at constant pres-sure rather than decreasing with increasing temperatureat constant pressure. At temperatures <100�C and a pres-sure of ~50 bars, the projections of the isotherms inpressure-peak position space intersect. Below ~50 bars,the temperature at which the peak position begins todecrease along an isobar is much lower than the temper-ature at which the peak position begins to decrease forpressures above 50 bars. For example, at 300 bars, thepeak position decreases with increasing temperatureabove 35�C, whereas at 20 bars, the peak positiondecreases with increasing temperature above −120�C. A
possible explanation for this reversal in peak shift is pro-vided below.
The critical point of CO2 is located at 31�C and74 bars, and the 22�C isotherm intersects the L–V curveat ~60 bars (Figure 1c), as evidenced by the discontinuityalong this isotherm represented by the dashed portion ofthe isotherm. Similar to both CH4 and N2, the peak posi-tion of CO2 decreases with increasing pressure along anisotherm over the PT range studied. Also, similar to CH4,at a constant pressure, the peak position increases withincreasing temperature over the pressure range studied.
3.2 | Isothermal peak shift withchanging density
The relationship between density and peak position foreach gas along select isotherms is shown in Figure 2.Densities were calculated using the National Institute ofStandards and Technology Reference Fluid Thermody-namic and Transport Properties Version 10.0 program[49]
and the Setzman and Wagner,[50] Span et al.,[51] and Spanand Wagner[52] equations of state for CH4, N2, and CO2,respectively. All three gases show a decrease in peak posi-tion with increasing density. Both CH4 (Figure 2a) andCO2 (Figure 2c) show an increase in peak position withincreasing temperature at a constant density, with theexception of the temperature range 350–450�C for CH4
(a) (b)
(c)
FIGURE 2 Plots of the peak
position of (a) CH4, (b) N2, (c) and CO2
versus density over the temperature
ranges studied. Densities were
calculated using the National Institute
of Standards and Technology Reference
Fluid Thermodynamic and Transport
Properties Version 10.0 program[49] and
the Setzman and Wagner,[50] Span
et al,[51] and Span and Wagner,[52]
equations of state for CH4, N2, and CO2,
respectively. The dashed portion of the
lowest temperature isotherm for each
species represents the discontinuity in
peak position as the liquid–vapor curve
is intersected by the isotherm [Colour
figure can be viewed at
wileyonlinelibrary.com]
SUBLETT ET AL. 559

(discussed further below). N2 (Figure 2b) shows adecrease in peak position with increasing temperature atconstant density over the studied region. The density-peakposition relationship for CH4 shown in Figure 2a is simi-lar to that reported by Lin et al.[17] and Shang et al.[34]
The density-peak position relationship for CO2 shown inFigure 2c is similar to that reported by Wang et al.[47]
3.3 | Isobaric Peak shift with changingtemperature
Figure 3 shows the relationship between temperatureand peak position (solid lines) and temperature and den-sity (dashed lines) at 40–500 bars for each species. CH4
(Figure 3a) and CO2 (Figure 3c) both show an initialsharp increase in peak position with increasing tempera-ture at a constant pressure above the critical temperature,followed by a more gradual increase in peak position athigher temperatures. Note that a discontinuity occursalong the 40-bar isobar for CH4 as the L–V curve iscrossed. N2 (Figure 3b) also shows an initial sharpincrease in peak position with increasing temperature,followed by a more gradual increase at higher tempera-tures; however, at temperatures above ~0�C to 50�C,depending on pressure, the peak position decreases withincreasing temperature. The variations in peak positionwith temperature broadly mirror the changes in densitywith temperature along the same isobar. For example, at
40 and 100 bars, both the peak position and the densityshow significant variation as the temperature is increasedfrom the lowest values plotted for all three gases and amuch less pronounced change in both peak position anddensity at higher temperature.
3.4 | Compressibility factor and peakposition in PT space
Pressure–volume–temperature (PVT) data for gases maybe examined using the unitless compressibility factor, Z,described by the following:
Z=PVm
RT, ð2Þ
where Vm is molar volume and R is the gas constant. Forcompressibility factors used in this study, Vm is deter-mined using the calculated densities described above. Bydefinition, Z = 1 for an ideal gas. A gas with a compress-ibility factor less than unity has a density greater thanthe density of an ideal gas at the same PT conditions,whereas a gas with a compressibility factor greater thanunity has a density that is less than the density of an idealgas at the same PT conditions. Additionally, values ofZ less than unity indicate an environment dominated byattractive interactions between molecules, whereasvalues of Z greater than unity indicate an environmentdominated by repulsive interactions between molecules.
(a)
(b) (c)
FIGURE 3 Plot of the
peak position (solid lines) and
the density (dashed lines) of
(a) CH4, (b) N2, (c) and CO2
versus temperature for several
isobars. The dotted portion of
the 40-bar isobars in
(a) indicate the discontinuity in
peak position and density as the
liquid–vapor curve was
intersected by the isobars
between −100�C and −80�C.Densities were calculated using
the National Institute of
Standards and Technology
Reference Fluid
Thermodynamic and Transport
Properties Version 10.0
program[49] and the Setzman
and Wagner,[50] Span et al,[51]
and Span and Wagner[52]
equations of state for CH4, N2,
and CO2, respectively [Colour
figure can be viewed at
wileyonlinelibrary.com]
560 SUBLETT ET AL.
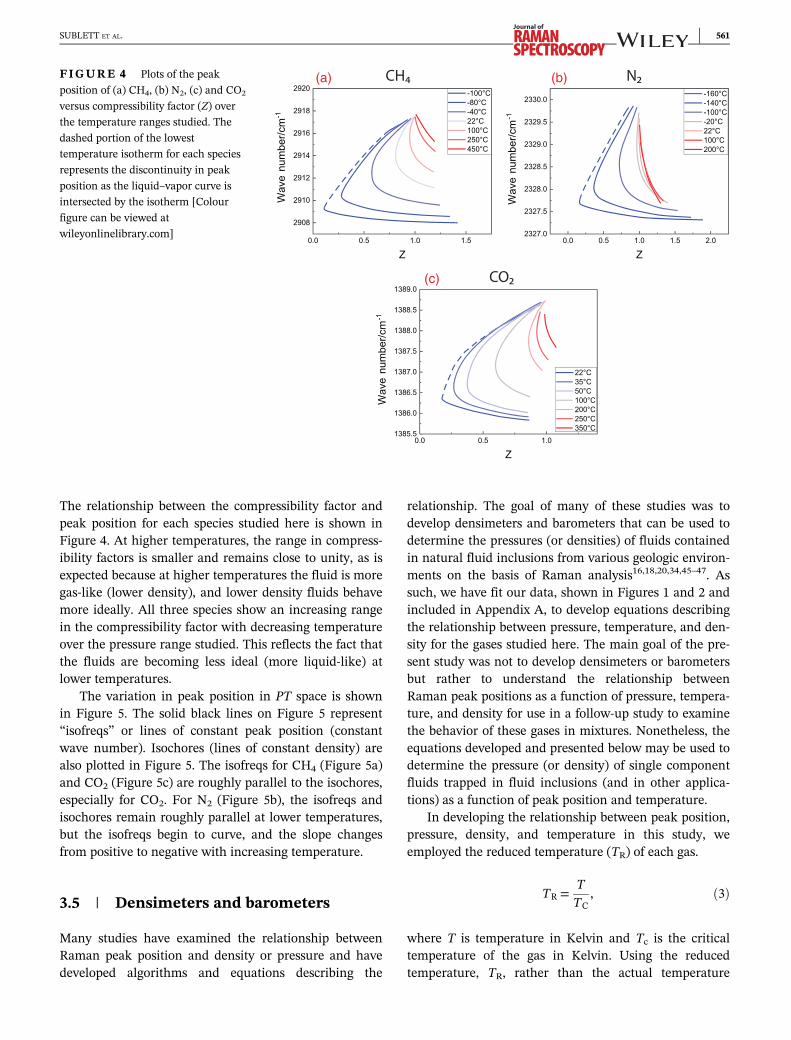
The relationship between the compressibility factor andpeak position for each species studied here is shown inFigure 4. At higher temperatures, the range in compress-ibility factors is smaller and remains close to unity, as isexpected because at higher temperatures the fluid is moregas-like (lower density), and lower density fluids behavemore ideally. All three species show an increasing rangein the compressibility factor with decreasing temperatureover the pressure range studied. This reflects the fact thatthe fluids are becoming less ideal (more liquid-like) atlower temperatures.
The variation in peak position in PT space is shownin Figure 5. The solid black lines on Figure 5 represent“isofreqs” or lines of constant peak position (constantwave number). Isochores (lines of constant density) arealso plotted in Figure 5. The isofreqs for CH4 (Figure 5a)and CO2 (Figure 5c) are roughly parallel to the isochores,especially for CO2. For N2 (Figure 5b), the isofreqs andisochores remain roughly parallel at lower temperatures,but the isofreqs begin to curve, and the slope changesfrom positive to negative with increasing temperature.
3.5 | Densimeters and barometers
Many studies have examined the relationship betweenRaman peak position and density or pressure and havedeveloped algorithms and equations describing the
relationship. The goal of many of these studies was todevelop densimeters and barometers that can be used todetermine the pressures (or densities) of fluids containedin natural fluid inclusions from various geologic environ-ments on the basis of Raman analysis16,18,20,34,45–47. Assuch, we have fit our data, shown in Figures 1 and 2 andincluded in Appendix A, to develop equations describingthe relationship between pressure, temperature, and den-sity for the gases studied here. The main goal of the pre-sent study was not to develop densimeters or barometersbut rather to understand the relationship betweenRaman peak positions as a function of pressure, tempera-ture, and density for use in a follow-up study to examinethe behavior of these gases in mixtures. Nonetheless, theequations developed and presented below may be used todetermine the pressure (or density) of single componentfluids trapped in fluid inclusions (and in other applica-tions) as a function of peak position and temperature.
In developing the relationship between peak position,pressure, density, and temperature in this study, weemployed the reduced temperature (TR) of each gas.
TR =TTC
, ð3Þ
where T is temperature in Kelvin and Tc is the criticaltemperature of the gas in Kelvin. Using the reducedtemperature, TR, rather than the actual temperature
(a) (b)
(c)
FIGURE 4 Plots of the peak
position of (a) CH4, (b) N2, (c) and CO2
versus compressibility factor (Z) over
the temperature ranges studied. The
dashed portion of the lowest
temperature isotherm for each species
represents the discontinuity in peak
position as the liquid–vapor curve is
intersected by the isotherm [Colour
figure can be viewed at
wileyonlinelibrary.com]
SUBLETT ET AL. 561

offers no advantages when evaluating data for the puregases, but it does offer significant advantages whenconsidering gas mixtures at temperatures at which thegas mixture does not undergo a phase change(i.e., consist of liquid and vapor or two immisciblefluid phases) whereas one of the components of themixture would undergo a phase change at those samePT conditions. For example, pure CO2 undergoes aphase transition at 22�C when the L–V curve is inter-sected (see Figure 1c). However, for a gas mixture con-taining CO2, CH4, and N2 with a critical pointsufficiently less than 22�C such that the max-condentherm of the dew point curve is at a tempera-ture lower than 22�C, a phase change will not occuras pressure is changed at 22�C. Thus, the peak posi-tions and Fermi diad splitting measured for CO2 inthe gas mixture change continuously as pressure isincreased at 22�C whereas a discontinuity occurs inthe peak positions and Fermi diad splitting in pureCO2 at the same conditions when the L–V curve iscrossed. Using the reduced temperature for this exam-ple mixture would circumvent the phase transition and
the accompanying discontinuity in pressure-peak posi-tion space experienced by pure CO2. As such, thereduced temperature, TR, is used in the densimetersand barometers presented here to facilitate incorpora-tion of these algorithms into those being developed forgas mixtures.
The densimeter for CH4 is valid from 10 to 500 barsand −100�C to 450�C and is given by
ρCH4=X2
i=0
X2
j=2Ai, j TRð Þi ν−2;917ð Þj, ð4Þ
where ρ is density in grams per cubic centimeter and ν isthe Raman peak position in per centimeter. The fittingcoefficients and associated errors are given in Table 1.Equation (4) has an R2 of 0.998 and a standard error of±0.003 g/cm3. The barometer for CH4, which is validfrom 10 to 500 bars and −80�C to 350�C, is given by
PCH4 =
P2i=0
P2j=0Ai, j ν−2917ð Þi TRð Þj
1+P2
k=0
P2l=0Bk, l ν−2917ð Þk TRð Þl , ð5Þ
(a)
(b) (c)
FIGURE 5 Plot of
pressure versus temperature for
(a) CH4, (b) N2, and (c) CO2.
Solid black lines are lines of
constant peak position
(isofreqs). Red dashed lines are
lines of constant density
(isochores). The bolded red
dashed line in each figure
represents the critical isochore.
The star symbol represents the
critical point of each system,
and the solid blue line
represents the liquid–vapor
curve [Colour figure can be
viewed at
wileyonlinelibrary.com]
562 SUBLETT ET AL.

where P is in bars. The fitting coefficients and associatederrors are given in Table 2. Equation (5) has an R2 of0.997 and a standard error of ±9.8 bars. Because the datafrom Lin et al.17 at 22�C were used to develop the CH4
barometer and densimeter, Equations (4) and (5) agreewith Lin et al.17 within analytical error.
The densimeter for N2 is valid from 10 to 500 barsand −160�C to 200�C and is given by the following:
ρN2=X2
i=0
X2
j=2Ai, j TRð Þi ln
ν �10002330
� −998
�� j
:
ð6Þ
The ν term in Equation (6) is presented in this man-ner to accentuate the small changes in the Raman peakposition of N2 with changing pressure over the PT rangestudied. The fitting coefficients and associated errors aregiven in Table 3. Equation (6) has an R2 of 0.999 and astandard error of ±0.008 g/cm3. The barometer for N2 isvalid from 10 to 500 bars and −140�C to 200�C and isgiven by the following:
PN2 =
P2i=0
P2j=0Ai, j ln ν�1000
2330
� �−998
� �� �iTRð Þ j
1+P2
k=0
P2l=0Bk,l ln ν�1000
2330
� �−998
� �� �kTRð Þl
: ð7Þ
The fitting coefficients and associated errors are givenin Table 4. Equation (7) has an R2 of 0.996 and a standarderror of ±12.4 bars.
For CO2, the splitting of the Fermi diad is more com-monly used than a single peak position to correlateRaman spectral features with pressure or density becausethe distance between the two peaks that make up theFermi diad remains relatively constant and independentof instrument drift. As such, the densimeter and barome-ter for CO2 were developed using the Fermi diad split-ting. The densimeter for CO2 is valid from 10 to 500 barsand 22�C to 350�C and is given by the following:
ρCO2=X1
i=0
X2
j=2Ai, j TRð Þi Δ−100ð Þj, ð8Þ
where Δ is the Fermi diad splitting in per centimeter. Thefitting coefficients and associated errors are given inTable 5. Equation (8) has an R2 of 0.999 and a standard
TABLE 2 Fitting coefficients for the CH4 barometer
(Equation (5))
Ai,j Value Error (±)
0,0 41.24 9.04
1,0 77.11 2.29
0,1 −47.09 9.04
0,2 25.00 1.96
1,1 −82.47 2.19
Bk,l Value Error (±)
1,0 −0.31255 0.00539
2,0 −0.03746 7.04 × 10⁻⁴
0,1 −0.1796 0.0272
0,2 0.07054 0.00607
1,1 0.08383 0.00265
TABLE 3 Fitting coefficients for the N2 densimeter
(Equation (6))
Ai,j Value Error (±)
0,0 2.0719 0.0136
1,0 −0.25827 0.00494
2,0 0.00638 8.39 × 10⁻⁴
0,1 −1.6203 0.0221
0,2 0.30296 0.00779
1,1 0.10800 0.00254
TABLE 4 Fitting coefficients for the N2 barometer
(Equation (7))
Ai,j Value Error (±)
0,0 −5.930 0.404
1,0 6.042 0.871
0,1 8.749 0.406
0,2 −0.9672 0.0769
1,1 −8.429 0.760
Bk,l Value Error (±)
1,0 6.037 0.106
2,0 3.989 0.363
0,2 0.1307 0.0198
1,1 −1.5546 0.0380
TABLE 1 Fitting coefficients for the CH4 densimeter
(Equation (4))
Ai,j Value Error (±)
0,0 −0.01317 0.00435
1,0 0.03021 0.00389
2,0 −0.0046 7.78 × 10⁻⁴
0,1 −0.01897 0.00140
0,2 0.00161 1.03 × 10⁻⁴
1,1 −0.00867 5.60 × 10⁻⁴
SUBLETT ET AL. 563

error of ±0.006 g/cm3. The barometer for CO2 is validfrom 10 to 500 bars and 35�C to 350�C and is given bythe following:
PCO2 =
P2i=0
P2j=0Ai, j Δ−100ð Þi TRð Þj
1+P2
k=0
P2l=0Bk, l Δ−100ð Þk TRð Þl : ð9Þ
The fitting coefficients and associated errors are givenin Table 6. Equation (9) has an R2 of 0.995 and a standarderror of ±6.2 bars. Because the data from Fall et al.18
at 22�C were used to develop the CO2 densimeter,Equation (8) agrees with Fall et al.18 within analyticalerror.
4 | DISCUSSION
4.1 | Peak position and criticality
The variation in peak position with PT is related to therelative density (volume) changes that occur during achange in PT conditions. This is exemplified in Figure 3,as the isobars in temperature-peak position and
temperature–density space show complementary trends.The largest changes in both density and peak positionwith temperature occur at the lowest temperaturesshown, that is, near the critical point, and the relativechange in peak position and density as a function of tem-perature is muted at higher temperatures. However, asnoted above, the isofreqs for N2 reach a maximum pres-sure at some temperature and then decrease in pressureas temperature increases further. This reversal in thepeak position trend with increasing pressure may berelated to changes in the attractive and repulsive forcesand is discussed further below. The largest relative den-sity (volume) changes coincide with the largest relativepeak position changes for each gas and occur in the vicin-ity of the critical point for that gas. This is expectedbecause thermodynamic properties of fluids, such as heatcapacity, isobaric thermal expansivity, and isothermalcompressibility,[53] show large (infinite) changes withchanging P or T near the critical point.[54]
The shape of the isotherms of each gas and magni-tude of the peak shift along an isotherm in pressure-peakposition space shown in Figure 1 is systematically relatedto the proximity of the isotherm to the critical point.Reduced temperature (Equation (3)) serves as a conve-nient proxy for nearness to the critical temperature, witha reduced temperature of unity (Tr = 1) corresponding toa temperature equal to the critical temperature. The lowtemperature isotherms show a larger shift in peak posi-tion with increasing pressure over the PT range studied,compared with the higher temperature isotherms, andhave a more sigmoidal shape compared with the morelinear high temperature isotherms (see Figure 1). Notethat the isotherms in Figure 1 that are below the criticaltemperature are discontinuous where the isothermcrosses the L–V curve and are thus not considered sig-moidal. The degree to which the isotherm is sigmoidal inpressure-peak position space depends on the reducedtemperature of the gas, as small changes in pressure inthe vicinity of the critical point result in large relativechanges in density (volume). This can be seen clearlyusing the 35�C isotherms (solid black lines in Figure 1a,b,c) for CH4, N2, and CO2. At 35�C, the TR for CO2, CH4,and N2 is 1.1, 1.6, and 2.4, respectively. The 35�C iso-therm for CO2 shows the most pronounced relative peakshift of the three gases at 35�C because it is closest to itscritical temperature at 35�C and experiences the largestrelative density (volume) change along the 35�C isothermwith increasing pressure. In contrast, N2 shows the leastpronounced relative peak shift of the three gases, partlydue to the fact that at 35�C, the gas is well above the criti-cal temperature of N2 (−147�C) and the relative density(volume) change with pressure is smaller than that ofCO2 at 35�C. CH4 shows a behavior that is intermediate
TABLE 5 Fitting coefficients for the CO2 densimeter
(Equation (8))
Ai,j Value Error (±)
0,0 −1.1429 0.0940
1,0 −0.3144 0.0436
0,1 0.4461 0.0425
0,2 −0.02296 0.00392
1,1 0.1529 0.0144
TABLE 6 Fitting coefficients for the CO2 barometer
(Equation (9))
Ai,j Value Error (±)
0,0 3090 1250
1,0 −1019 420
0,1 −3420 1380
0,2 161.7 70.3
1,1 1108 456
Bk,l Value Error (±)
1,0 2.685 0.941
2,0 −0.430 0.144
0,1 −3.683 0.882
0,2 0.909 0.217
564 SUBLETT ET AL.

between that shown for CO2 and N2, consistent with thefact that the critical temperature of CH4 (−83�C) isbetween those for CO2 (31�C) and N2 (−147�C).
4.2 | Interpretation of Raman spectrausing intermolecular attraction andrepulsion
The variation in Raman peak position with PT reflectsinteractions between molecules. As noted above, domi-nance of attractive forces leads to a shift in the Ramanpeak position to lower wave numbers whereas domi-nance of repulsive forces leads to a shift in the Ramanpeak position to higher wave numbers.[21,38,39] The rea-son for this is that dominance of repulsive forces con-tracts the bond length slightly whereas dominance ofattractive forces expands the bond length slightly.[55]
Contraction of the bond strengthens the bond, requiringmore energy to cause a vibration, whereas expansion ofthe bond weakens the bond, requiring less energy tocause a vibration.[17] The strength of the repulsive andattractive forces between molecules is dependent on thedistance between molecules, with repulsive forcesbetween molecules being most intense when the mole-cules are in close proximity to one another and attractiveforces being experienced between molecules at longerintermolecular distances.[40]
4.2.1 | Isothermal inflection pressure
Pressure and temperature have opposing effects on thevolume of the gas and the distance between molecules:increasing pressure decreases volume and increasing tem-perature increases volume. Attractive forces between mol-ecules dominate at greater intermolecular distances thanrepulsive forces, so at low pressures and high tempera-tures where the molecules are spaced sufficiently far apartsuch that the repulsive forces between molecules areinsignificant, a small decrease in volume is expected toyield an overall negative shift in Raman peak position.This overall negative shift in peak position can be seen inFigures 1 and 2. As volume decreases further and repul-sive forces between molecules increase, attractive andrepulsive forces produce competing effects on the wavenumber shift. Additionally, the relative increase in themagnitude of the attractive forces decreases as the mole-cules are forced closer together, whereas the magnitudeof the repulsive forces increases.[40] This implies that at aconstant temperature and sufficiently high pressure(higher than the pressure range studied here for N2, CO2,and CH4), the repulsive forces become dominant, and the
peak position increases with increasing pressure alongthe isotherm. This phenomenon, in which the isothermalpressure dependence of peak position shows an inflectionwith increasing pressure, has been observed for N2, CH4,and H2
15,21. The pressure of this inflection point at 22�Cis ~1,000 bars for CH4 and ~1,500 bars for N2
15. Note thatthese pressure inflection points are likely temperaturedependent.
4.2.2 | Isobaric inflection temperature
If the peak position increases along an isobar as tempera-ture increases (see Figures 1 and 3), repulsive forcesbetween molecules are dominant. This behavior is poten-tially related to the increasing frequency of collisionsbrought about by increasing the kinetic energy of themolecules. However, increasing temperature at constantpressure will also increase the volume and thus inter-molecular distance, which will weaken the effect of therepulsive forces whereas the attractive forces, which areexperienced between molecules at larger intermoleculardistance than repulsive forces, will not change muchuntil the intermolecular distances are sufficiently largethat the molecules do not interact at all and behave likean ideal gas. This implies that at a constant pressure andrelatively high temperature, the repulsive forces would besufficiently weakened such that attractive forces domi-nate and the peak position will shift to lower wave num-bers. Thus, in a manner similar to the isothermalpressure dependence of peak position, the isobaric tem-perature dependence of peak position also shows aninflection and change in trend with increasing tempera-ture. This can be seen for N2 in Figures 1b and 3b, wherethe inflection occurs between 0�C and 50�C (dependingon the pressure) above ~50 bars and at much lower tem-peratures below ~50 bars. A potential explanation for theinflection occurring at much lower temperatures at pres-sures less than ~50 bars is that the molecules are spacedsufficiently far apart that only a small temperatureincrease is needed to reduce the repulsive interactionsbeyond the inflection point, resulting in the much lowerinflection temperatures found for N2 at pressures lessthan ~50 bars. Although the inflection temperature wasnot reached for CH4 and CO2, the decreasing differencein peak position between isotherms separated by thesame temperature increment in Figure 1a,c indicates thatthe inflection temperature is being approached, with CH4
appearing to be closer to the inflection temperature thanCO2 at 350�C. This relative order of inflection tempera-tures in pressure-wave number space is further supportedby the 450�C isotherm shown in Figure 2a (black line)for CH4. The peak positions of CH4 at densities above
SUBLETT ET AL. 565

~0.06 g/cm3 at 450�C are at lower wave numbers thanthe peak position of CH4 at densities above ~0.06 g/cm3
at 350�C. As can be seen from Figure 2b relative toFigure 1b, the inflection temperature for N2 is located ata lower temperature in density-wave number space(isochoric inflection temperature) than pressure-wavenumber space (isobaric inflection temperature). BecauseCH4 has reached the isochoric inflection temperatureover the PT range studied and CO2 has not, it is likelythat CH4 will also reach the isobaric inflection tempera-ture before CO2. The order in which the species reachthis inflection temperature can be related to the Boyletemperature of the molecules, which is the temperatureat which the attractive and repulsive forces are equivalentand of opposite sign such that they cancel out. The Boyletemperature defined at 0 pressure for N2, CH4, and CO2
is ~50�C, ~240�C, and ~450�C, respectively.[56] The inflec-tion temperatures do not occur exactly at the Boyle tem-peratures, however, from the Boyle temperatures, itwould be expected that N2, which has the lowest Boyletemperature, would have an inflection temperature lowerthan that of CH4, which, in turn, would be located at alower temperature than CO2. The results shown inFigure 1 are in good agreement with this interpretation.
4.3 | Relationship between isochoresand isofreqs for N2, CH4, and CO2
Initially, starting from low pressures and temperatures,the effect of increasing PT on the shift in peak positionreflects competing effects of intermolecular interactions,similar to the manner in which increasing temperatureand pressure have competing effects on the density. How-ever, depending on the PT conditions at which the inflec-tion points are reached, the effects of increasingtemperature and pressure may no longer act against eachother with regard to the shift in the peak position butinstead may act in the same direction, leading to the cur-vature of the isofreqs in Figure 5. Note that the isofreqsin Figure 5c are nearly linear due to the fact that CO2 iswell below both the isobaric inflection temperature andthe isothermal inflection pressure in the PT range stud-ied. Using the 0.35 g/cm3 isochore in Figure 5b (N2) as anexample, as temperature is increased along the isochore,the pressure must also increase to maintain a constantvolume (density) because of the opposing effects of com-pressibility and thermal expansivity. The isochore by defi-nition represents the locus of P and T along which theseopposing effects are equal and thus cancel out to main-tain constant density. The same PT relationship can beinvoked for the 2,328.2 cm−1 isofreq in Figure 5b over thePT range up to approximately −80�C and ~180 bars,
where the isofreq remains roughly parallel to the 0.35g/cm3 isochore. As temperature is increased along theisofreq, pressure must also increase to maintain a con-stant peak position (wave number) because increasingtemperature alone at conditions below the isobaric tem-perature inflection point results in an increase in thepeak position (Figure 3). Below the isothermal pressureinflection point, increasing pressure leads to a decreasein the peak position (Figure 1b). Thus, similar to the caseof density along the isochore, along the isofreq (belowthe inflection point of one of the variables), increasingP and T have equal and opposite effects on the peak posi-tion and cancel each other. However, unlike theisochores, the isofreqs must curve as the inflection pointof one variable, either P or T, is reached such that thetwo effects become complementary instead of opposing.This results in the change in slope of the 2,328.2 cm−1
isofreq in Figure 5b from positive to negative at ~22�C, atwhich point the isofreq reaches the T inflection. Thus, tomaintain the constant peak position as T increases above~22�C, pressure must now decrease instead of increase.
5 | SUMMARY
Raman spectra were collected for the symmetricstretching peak of N2, CO2, and CH4 from 10 to 500 barsand from temperatures slightly below the L–V curve toelevated temperatures. Volumetric changes and theresulting changes in intermolecular forces affect the mag-nitude and direction of Raman peak shifts of N2, CH4,and CO2 over the PT range studied. The competingeffects of attraction and repulsion between molecules arerevealed through changes in peak position. Moreover, thevolumetric changes and intermolecular interactions asso-ciated with these volumetric changes are correlated toproximity of the analytical conditions to the critical tem-perature that in turn gives rise to a systematic relation-ship between Raman peak positions of these fluids andcriticality. The information gathered on the pure gasescan be expanded in future work to gas mixtures con-taining N2, CO2, and CH4.
ACKNOWLEDGEMENTS
The authors thank Charles Farley for assistance in thelaboratory and Yury Klyukin and Lowell Moore for manyhelpful conversations on intermolecular forces and KyleAshley for helpful discussions of pressure and tempera-ture dependence of Raman peaks and drift during Ramanmeasurements. This material is based in part on worksupported by the National Science Foundation underGrants EAR-1624589 and OCE-1459433 to R. J. B. H.
566 SUBLETT ET AL.

M. L was supported by the PFF fellowship at theUniversity of Missouri. M. S-M was supported by aDiscovery Grant from NSERC. G. S. was supported by theKoUP Cooperation Funding program of the University ofPotsdam. R. C. B was supported by the Energy ResourcesProgram of the U.S. Geological Survey. Use of trade,product, or firm names is for descriptive purposes onlyand does not imply endorsement by the U.S. government.
REFERENCES[1] H. E. C. Swanenberg, Geologica Ultraiectina 1980, 25, 1.[2] J. Touret, in Short course in fluid inclusions: Application to
petrology, (Eds: L. S. Hollister, M. L. Crawford), Mineral asso-ciation of Canada, Markham 1981 182.
[3] R. Kreulen, R. D. Schuiling, Geochim. Cosmochim. Acta 1982,46, 193.
[4] A. M. Van den Kerkhof, Ph. D. thesis, Univ. Amsterdam, 1988.[5] C. J. S. DeAlvarenga, M. Cathelineau, J. Dubessy, Mineral.
Mag. 1990, 54, 245.[6] P. D. Jenden, I. R. Kaplan, R. Poreda, H. Craig, Geochim.
Cosmochim. Acta 1988, 52, 851.[7] L. Palcsu, I. Vető, I. Futó, G. Vodila, L. Papp, Z. Major, Marine
Petrol. Geol. 2014, 54, 216.[8] E. L. Klein, C. Harris, C. Renac, A. Giret, C. A. V. Moura,
K. Fuzikawa, Miner. Depositia 2006, 41, 160.[9] E. Chicharro, M. Boiron, J. A. López-García, D. N. Bardfod,
C. Villaseca, Ore Geol. Rev. 2016, 72, 896.[10] H. B. Niemann, S. K. Atreya, S. J. Bauer, G. R. Carignan,
J. E. Demick, R. L. Frost, D. Gautier, J. A. Haberman,D. N. Harpold, D. M. Hunten, G. Israel, J. I. Lunine,W. T. Kasprzak, T. C. Owen, M. Paulkovich, F. Raulin,E. Raaen, S. H. Way, Nature 2005, 438, 779.
[11] H. B. Niemann, S. K. Atreya, J. E. Demick, D. Gautier,J. A. Haberman, D. N. Harpold, W. T. Kasprzak, J. I. Lunine,T. C. Owen, F. Raulin, J. Geophys. Res. E Planets 2010, 115, 1.
[12] X. Zang, D. Liang, J. Chem. Eng. Data 2018, 63, 197.[13] D. V. Petrov, Spectrochim. Acta A 2018, 191, 576.[14] D. A. Long, The Raman effect: A unified treatment of the theory
of Raman scattering by molecules, John Wiley & Sons, Chiches-ter 2002.
[15] D. Fabre, B. Oksengorn, Appl. Spectrosc. 1992, 46, 468.[16] F. Lin, R. J. Bodnar, S. P. Becker, Geochim. Cosmochim. Acta
2007, 71, 3746.[17] F. Lin, A. K. Sum, R. J. Bodnar, J. Raman. Spectrosc. 2007, 38,
1510.[18] A. Fall, B. Tattitch, R. J. Bodnar, Geochim. Cosmochim. Acta
2011, 75, 951.[19] H. M. Lamadrid, M. Steele-MacInnis, R. J. Bodnar, J. Raman.
Spectrosc. 2018, 49, 581.[20] H. M. Lamadrid, L. R. Moore, D. Moncada, J. D. Rimstidt,
R. C. Burruss, R. J. Bodnar, Chem. Geol. 2017, 450, 210.[21] A. D. May, V. Degen, J. C. Stryland, H. L. Welsh, Can. J. Phys.
1961, 39, 1769.[22] D. Fabre, R. Couty, Comptes Rendus L Acad Des Sci Ser II
1986, 303, 1305.[23] R. Kroon, M. Baggen, A. Lagendijk, J. Chem. Phys. 1989,
97, 74.
[24] B. Lavorel, B. Oksengorn, D. Fabre, R. Saint-Loup, H. Berger,Mol. Phys. 1992, 75, 397.
[25] M. J. Clouter, H. Kiefte, J. Chem. Phys. 1977, 66, 1736.[26] M. J. Clouter, H. Kiefte, R. K. Jain, J. Chem. Phys. 1980,
73, 673.[27] B. Oksengorn, D. Fabre, B. Lavorel, R. Saint-Loup, H. Berger,
J. Chem. Phys. 1991, 94, 1774.[28] R. D. Etters, J. Belak, R. LeSar, Phys. Rev. B 1986, 34, 4221.[29] T. Dreier, G. Schiff, A. A. Suvernev, J. Chem. Phys. 1994, 100,
6275.[30] G. S. Devendorf, D. Ben-Amotz, J. Phys. Chem. 1993, 97, 2307.[31] J. C. Seitz, J. D. Pasteris, I.-M. Chou, Amer. J. Sci. 1993,
293, 297.[32] I.-M. Chou, J. D. Pasteris, J. C. Seitz, Geochim. Cosmochim.
Acta 1990, 54, 535.[33] V. Thieu, S. Subramanian, S. O. Colgate, E. D. Sloan Jr., Ann.
N. Y. Acad. Sci. 2000, 912, 983.[34] L. Shang, I.-M. Chou, R. C. Burruss, R. Hu, X. Bi, J. Raman
Spectrosc. 2014, 45, 696.[35] W. Lu, I.-M. Chou, R. C. Burruss, Y. Song, Geochim.
Cosmochim. Acta 2007, 71, 3969.[36] J. C. Seitz, J. D. Pasteris, I.-M. Chou, Amer. J. Sci. 1996,
296, 577.[37] S. Brunsgaard Hansen, R. W. Berg, E. H. Stenby, Appl.
Spectrosc. 2001, 55, 745.[38] W. Schindler, J. Jonas, J. Chem. Phys. 1980, 73, 3547.[39] W. Schindler, P. T. Sharko, J. Jonas, J. Chem. Phys. 1982, 76,
3493.[40] K. S. Schweizer, D. Chandler, J. Chem. Phys. 1982, 76, 2296.[41] B. Lavorel, R. Chaux, R. Saint-Loup, H. Berger, Opt. Commun.
1987, 62, 25.[42] S. C. Schmidt, D. S. Moore, M. S. Shaw, Phys. Rev. B 1987,
35, 493.[43] E. Fermi, Z. Phys. 1931, 71, 250.[44] K. M. Rosso, R. J. Bodnar, Geochim. Cosmochim. Acta 1995,
59, 3961.[45] Y. Kawakami, J. Yamamoto, H. Kagi, Appl. Spectrosc. 2003, 57,
1333.[46] J. Yamamoto, H. Kagi, Chem. Lett. 2006, 35, 610.[47] X. Wang, I.-M. Chou, W. Hu, R. C. Burruss, Q. Sun, Y. Song,
Geochim. Cosmochim. Acta 2011, 75, 4080.[48] I.-M. Chou, R. C. Burruss, W. Lu, in Advancesin high-pressure
technology for geophysics applications, (Eds: J. Chen, Y. Wang,T. S. Duffy, G. Shen, L. F. Dobrzhinetskaya), Elsevier B. V.,Amsterdam 2005 475.
[49] E.W. Lemmon, I. H. Bell, M.L. Huber, M.O. McLinden, NISTstandard reference database 23: Reference fluid thermodynamicand transport properties-REFPROP, Version 10.0, NationalInstitute of Standards and Technology, Standard ReferenceData Program, Gaithersburg, 2018.
[50] U. Setzmann, W. Wagner, J. Phys. Chem. 1991, 20, 1061.[51] R. Span, E. W. Lemmon, R. T. Jacobsen, W. Wagner,
A. Yokozeki, J. Phys. Chem. 2000, 29, 1361.[52] R. Span, W. Wagner, J. Phys. Chem. Ref. Data Monogr. 1996,
25, 1509.[53] J. V. Sengers, J. M. H. Levelt Sengers, Annu. Rev. Phys. Chem.
1986, 37, 189.[54] J. W. Johnson, D. Norton, Am. J. Sci. 1991, 291, 541.[55] M. R. Zakin, D. R. Herschbach, J. Chem. Phys. 1986, 85, 2376.
SUBLETT ET AL. 567

[56] R. Estrada-Torres, G. A. Iglesias-Silva, M. Ramos-Estrada,K. R. Hall, Fluid Phase Equilibria 2007, 258, 148.
SUPPORTING INFORMATIONAdditional supporting information may be found onlinein the Supporting Information section at the end of thisarticle.
How to cite this article: Sublett Jr. DM,Sendula E, Lamadrid H, et al. Shift in the Ramansymmetric stretching band of N2, CO2, and CH4 asa function of temperature, pressure, and density.J Raman Spectrosc. 2020;51:555–568. https://doi.org/10.1002/jrs.5805
568 SUBLETT ET AL.