Substructure RNP Report R1
27
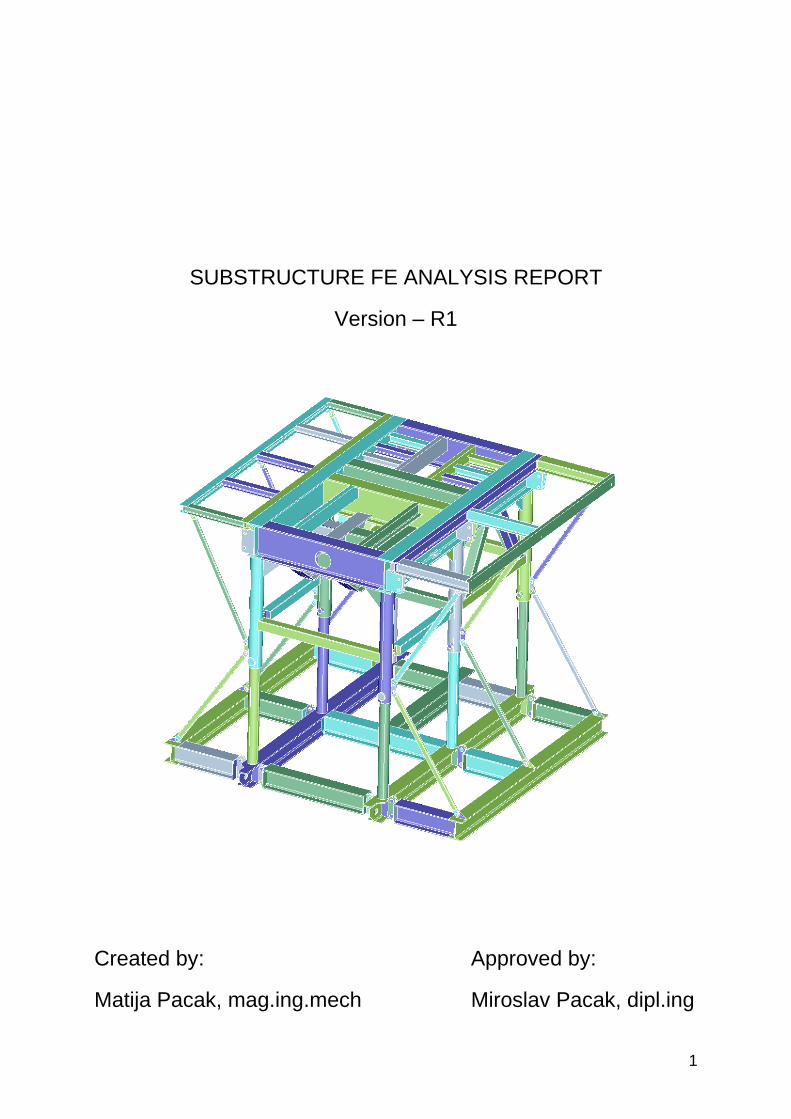
1 SUBSTRUCTURE FE ANALYSIS REPORT Version – R1 Created by: Approved by: Matija Pacak, mag.ing.mech Miroslav Pacak, dipl.ing
-
Upload
independent -
Category
Documents
-
view
1 -
download
0
Transcript of Substructure RNP Report R1
1
SUBSTRUCTURE FE ANALYSIS REPORT
Version – R1
Created by: Approved by:
Matija Pacak, mag.ing.mech Miroslav Pacak, dipl.ing
2
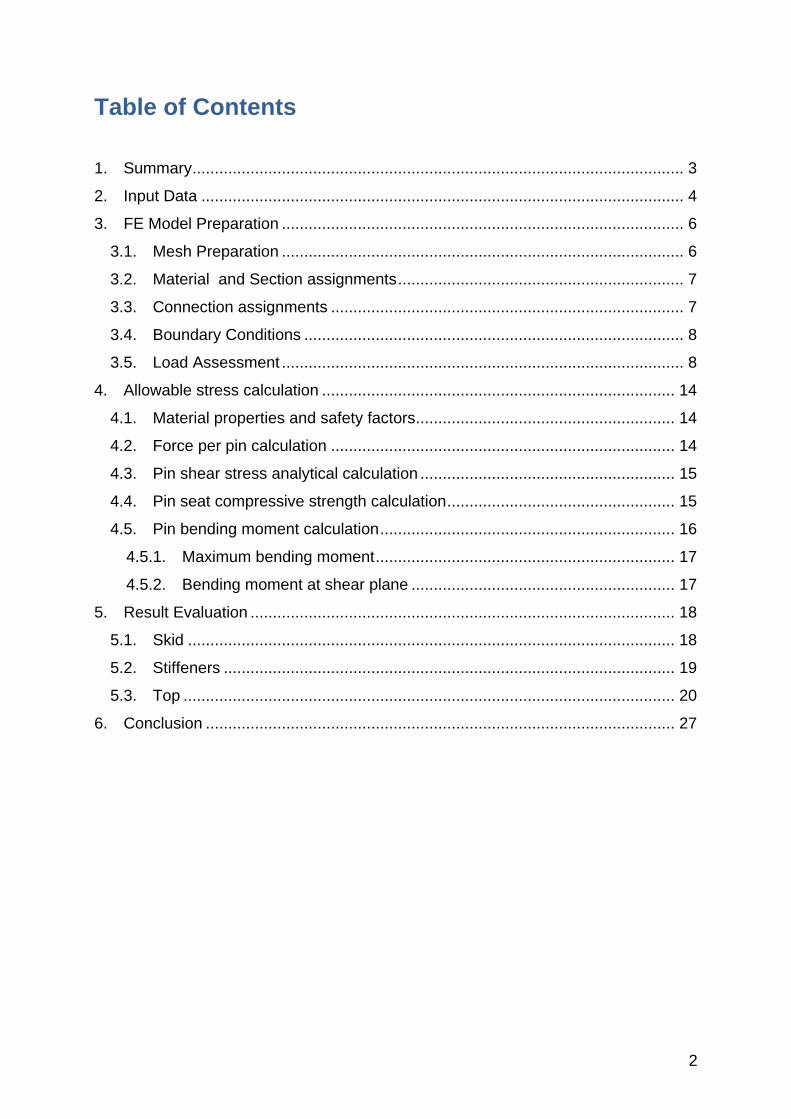
Table of Contents
1. Summary .............................................................................................................. 3
2. Input Data ............................................................................................................ 4
3. FE Model Preparation .......................................................................................... 6
3.1. Mesh Preparation .......................................................................................... 6
3.2. Material and Section assignments ................................................................ 7
3.3. Connection assignments ............................................................................... 7
3.4. Boundary Conditions ..................................................................................... 8
3.5. Load Assessment .......................................................................................... 8
4. Allowable stress calculation ............................................................................... 14
4.1. Material properties and safety factors .......................................................... 14
4.2. Force per pin calculation ............................................................................. 14
4.3. Pin shear stress analytical calculation ......................................................... 15
4.4. Pin seat compressive strength calculation ................................................... 15
4.5. Pin bending moment calculation .................................................................. 16
4.5.1. Maximum bending moment ................................................................... 17
4.5.2. Bending moment at shear plane ........................................................... 17
5. Result Evaluation ............................................................................................... 18
5.1. Skid ............................................................................................................. 18
5.2. Stiffeners ..................................................................................................... 19
5.3. Top .............................................................................................................. 20
6. Conclusion ......................................................................................................... 27
3
1. Summary
Based on the preliminary analysis (Substructure_Preliminary_Report.pdf) of the
substructure designed by RNP d.o.o. modifications were made to address the raised
concerns. This version of the report contains FE analysis of the modified
substructure.
4
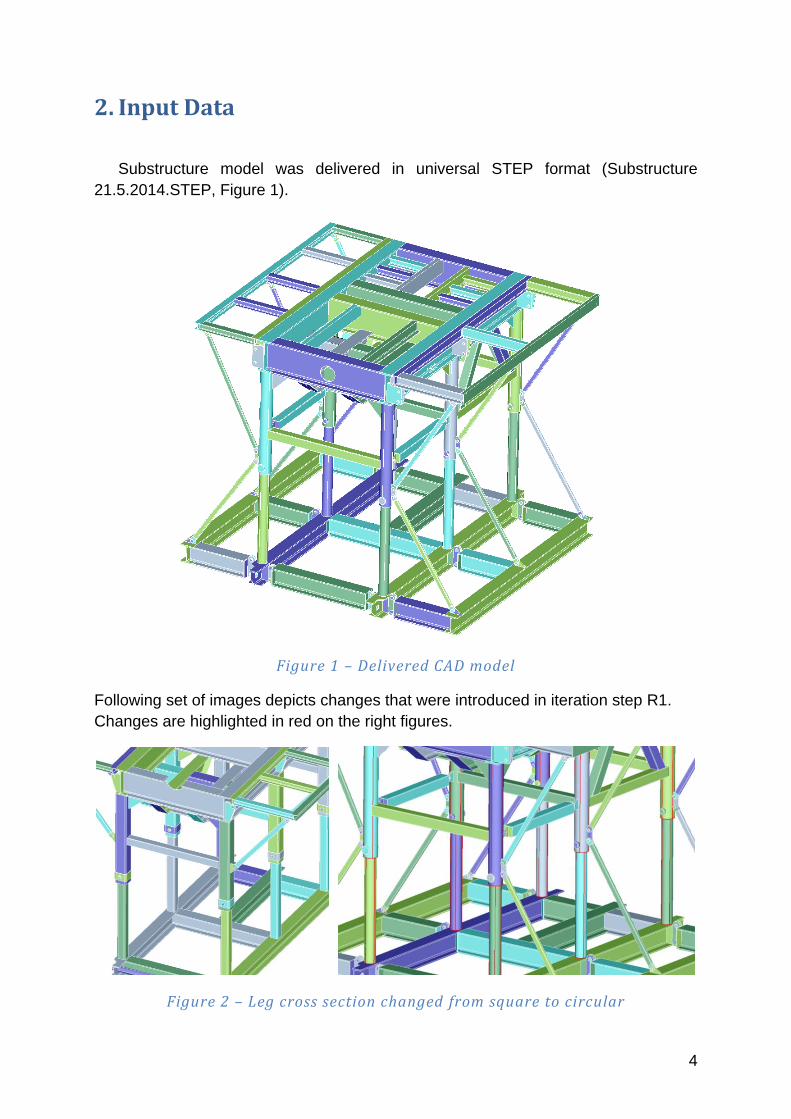
2. Input Data
Substructure model was delivered in universal STEP format (Substructure
21.5.2014.STEP, Figure 1).
Figure 1 – Delivered CAD model
Following set of images depicts changes that were introduced in iteration step R1.
Changes are highlighted in red on the right figures.
Figure 2 – Leg cross section changed from square to circular
5
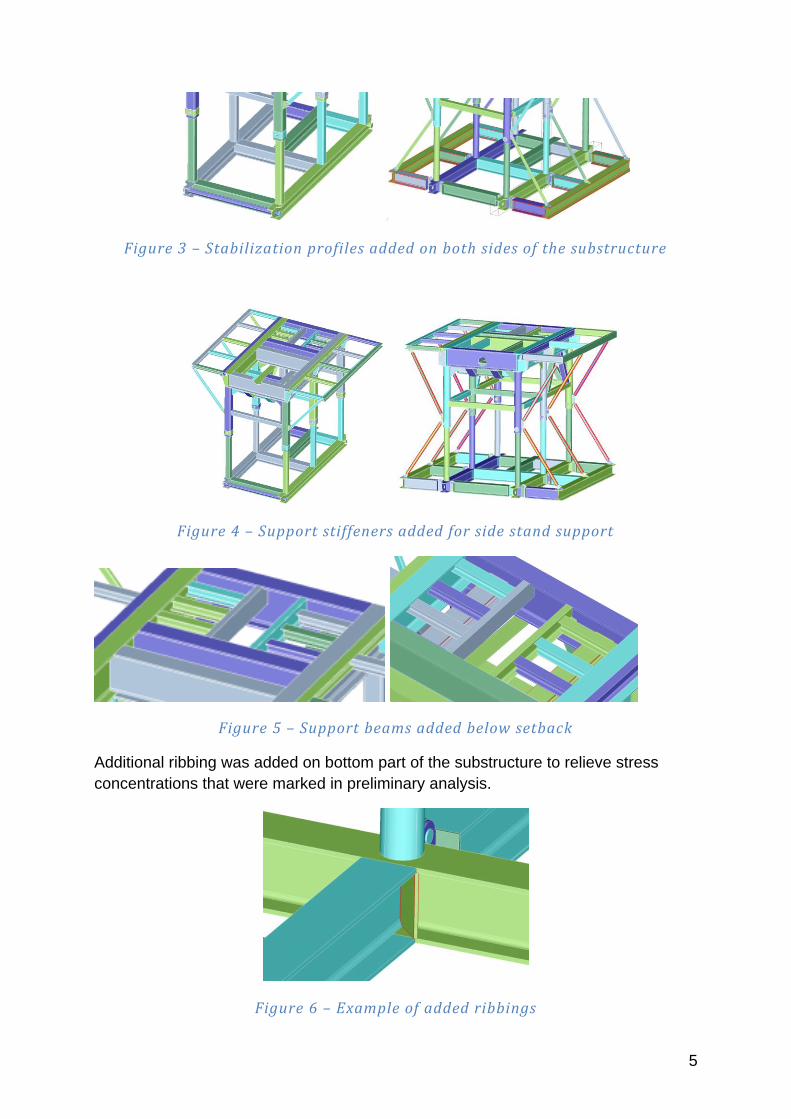
Figure 3 – Stabilization profiles added on both sides of the substructure
Figure 4 – Support stiffeners added for side stand support
Figure 5 – Support beams added below setback
Additional ribbing was added on bottom part of the substructure to relieve stress
concentrations that were marked in preliminary analysis.
Figure 6 – Example of added ribbings
6
3. FE Model Preparation
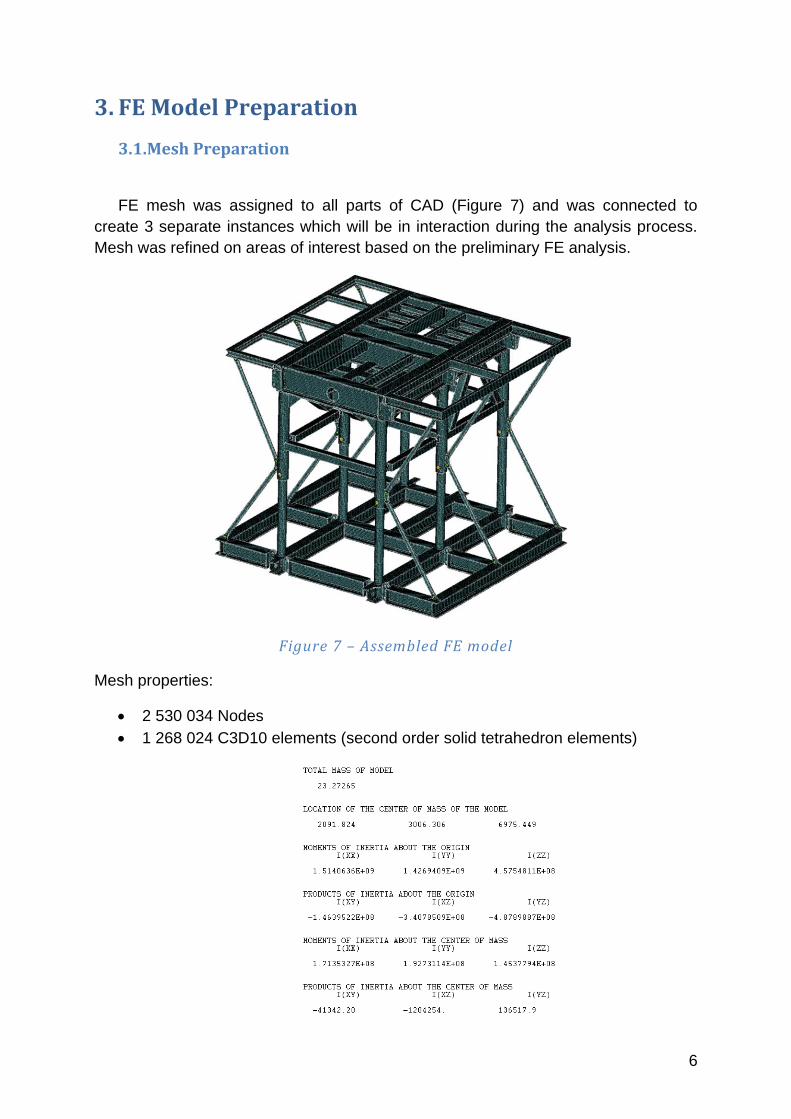
3.1. Mesh Preparation
FE mesh was assigned to all parts of CAD (Figure 7) and was connected to
create 3 separate instances which will be in interaction during the analysis process.
Mesh was refined on areas of interest based on the preliminary FE analysis.
Figure 7 – Assembled FE model
Mesh properties:
2 530 034 Nodes
1 268 024 C3D10 elements (second order solid tetrahedron elements)
7
3.2. Material and Section assignments
Steel was used as material for all instances.
Steel properties:
Solid homogenous section with steel material was assigned to all solid elements.
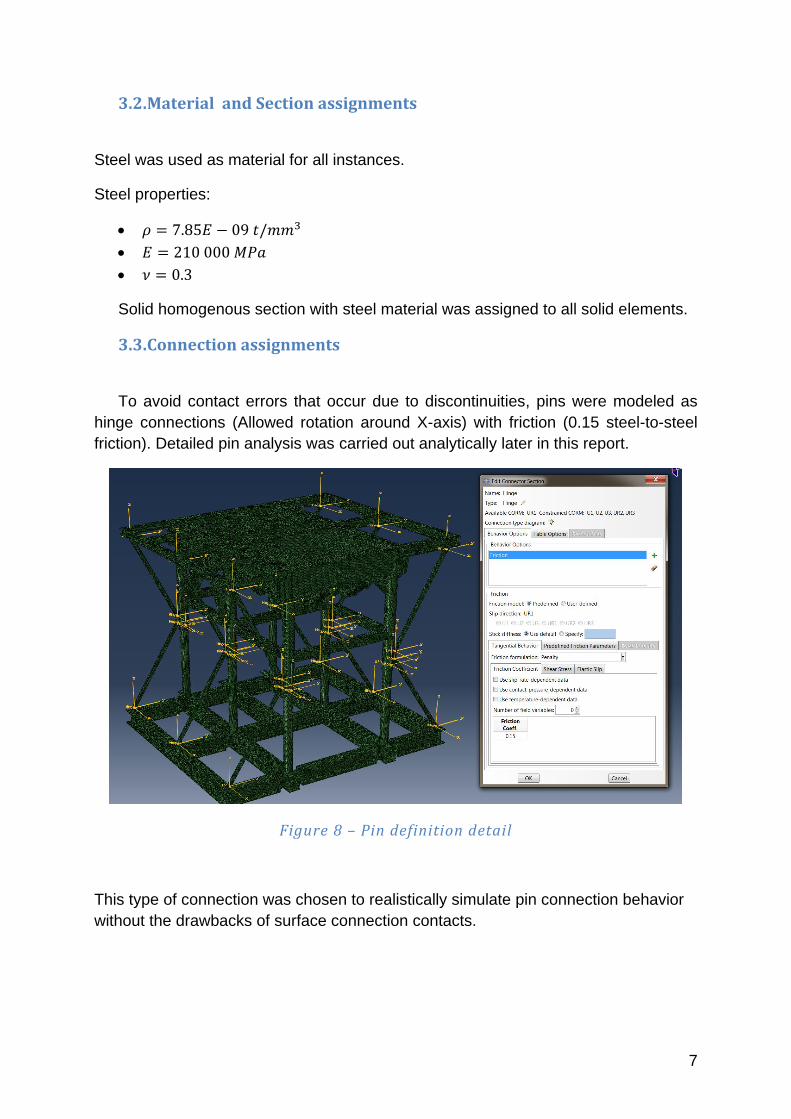
3.3. Connection assignments
To avoid contact errors that occur due to discontinuities, pins were modeled as
hinge connections (Allowed rotation around X-axis) with friction (0.15 steel-to-steel
friction). Detailed pin analysis was carried out analytically later in this report.
Figure 8 – Pin definition detail
This type of connection was chosen to realistically simulate pin connection behavior
without the drawbacks of surface connection contacts.
8
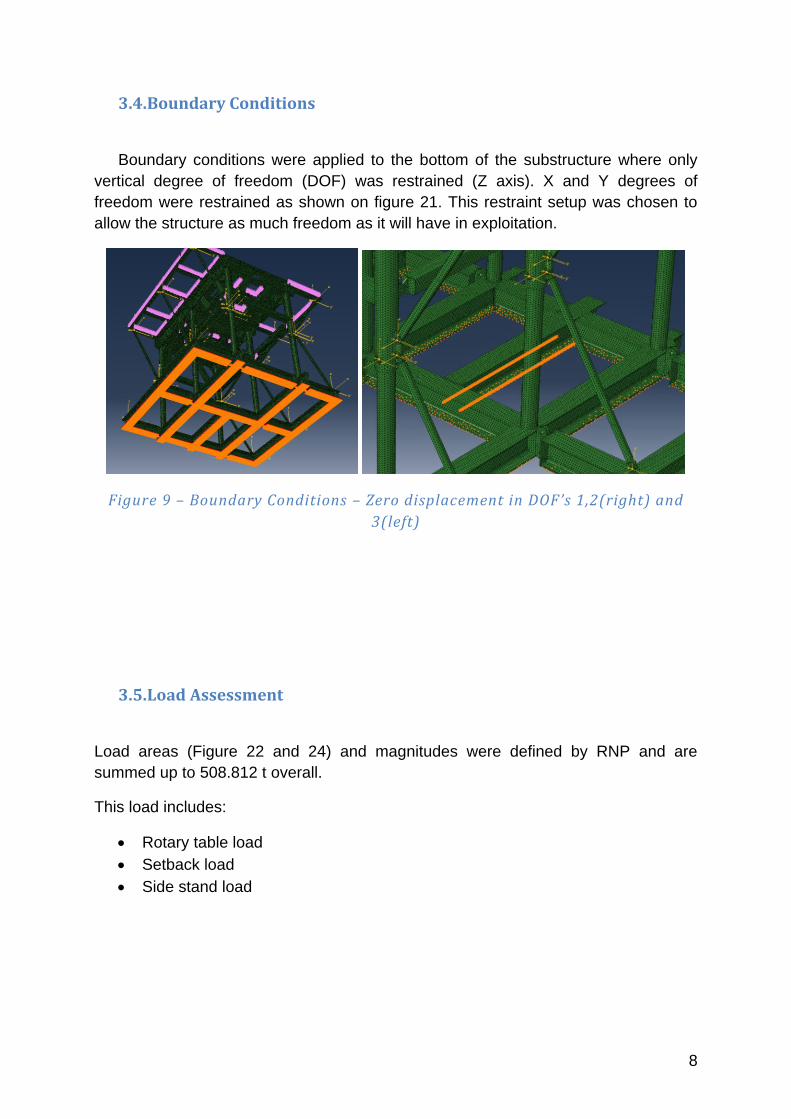
3.4. Boundary Conditions
Boundary conditions were applied to the bottom of the substructure where only
vertical degree of freedom (DOF) was restrained (Z axis). X and Y degrees of
freedom were restrained as shown on figure 21. This restraint setup was chosen to
allow the structure as much freedom as it will have in exploitation.
Figure 9 – Boundary Conditions – Zero displacement in DOF ’s 1,2(right) and
3(left)
3.5. Load Assessment
Load areas (Figure 22 and 24) and magnitudes were defined by RNP and are
summed up to 508.812 t overall.
This load includes:
Rotary table load
Setback load
Side stand load
9
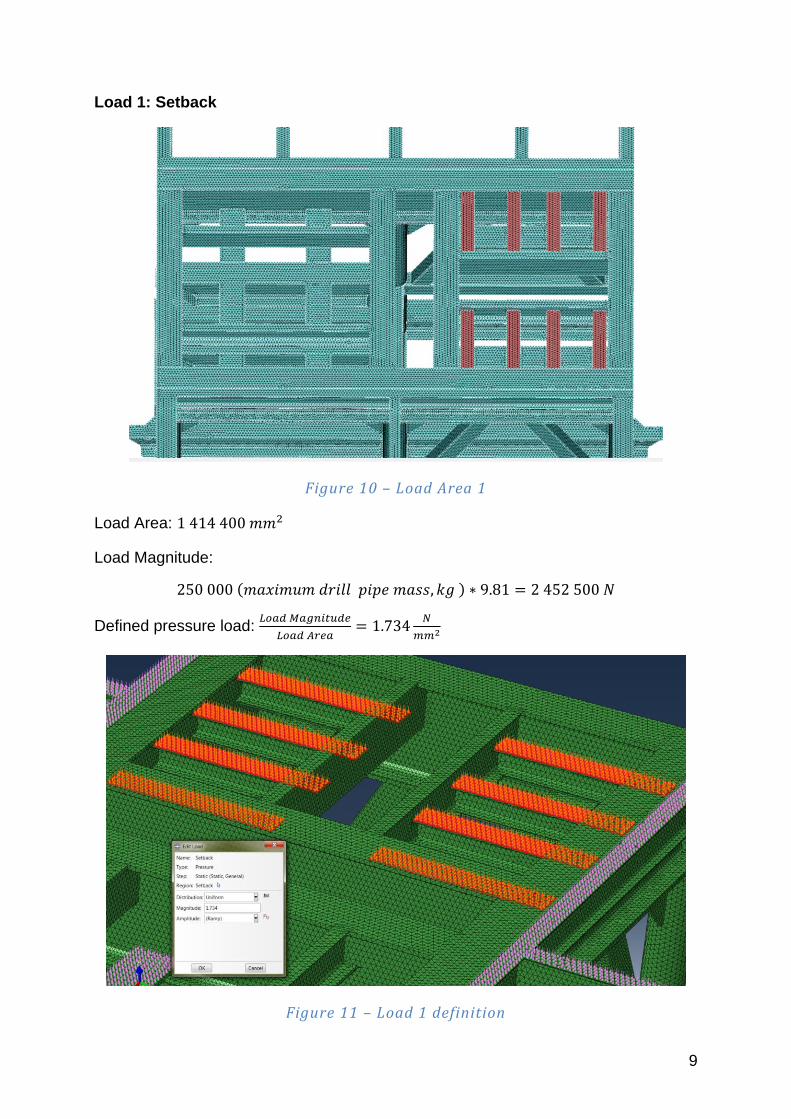
Load 1: Setback
Figure 10 – Load Area 1
Load Area:
Load Magnitude:
( )
Defined pressure load:
Figure 11 – Load 1 definition
10
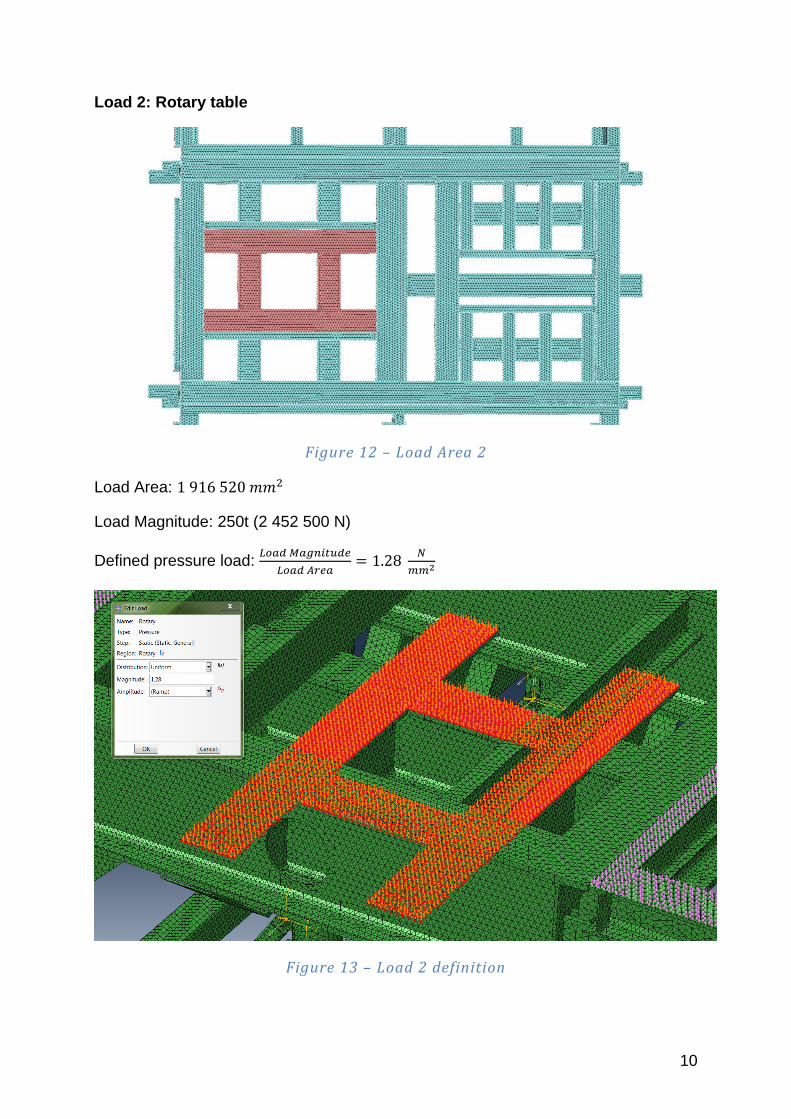
Load 2: Rotary table
Figure 12 – Load Area 2
Load Area:
Load Magnitude: 250t (2 452 500 N)
Defined pressure load:
Figure 13 – Load 2 definition
11
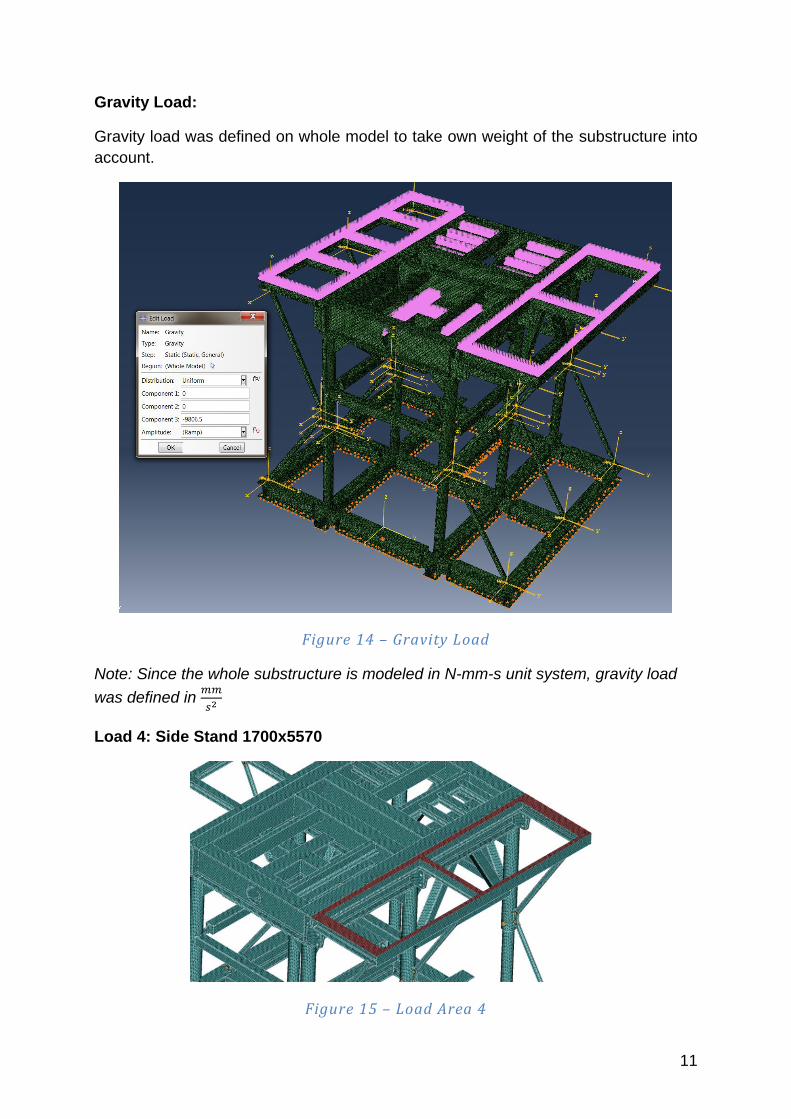
Gravity Load:
Gravity load was defined on whole model to take own weight of the substructure into
account.
Figure 14 – Gravity Load
Note: Since the whole substructure is modeled in N-mm-s unit system, gravity load
was defined in
Load 4: Side Stand 1700x5570
Figure 15 – Load Area 4
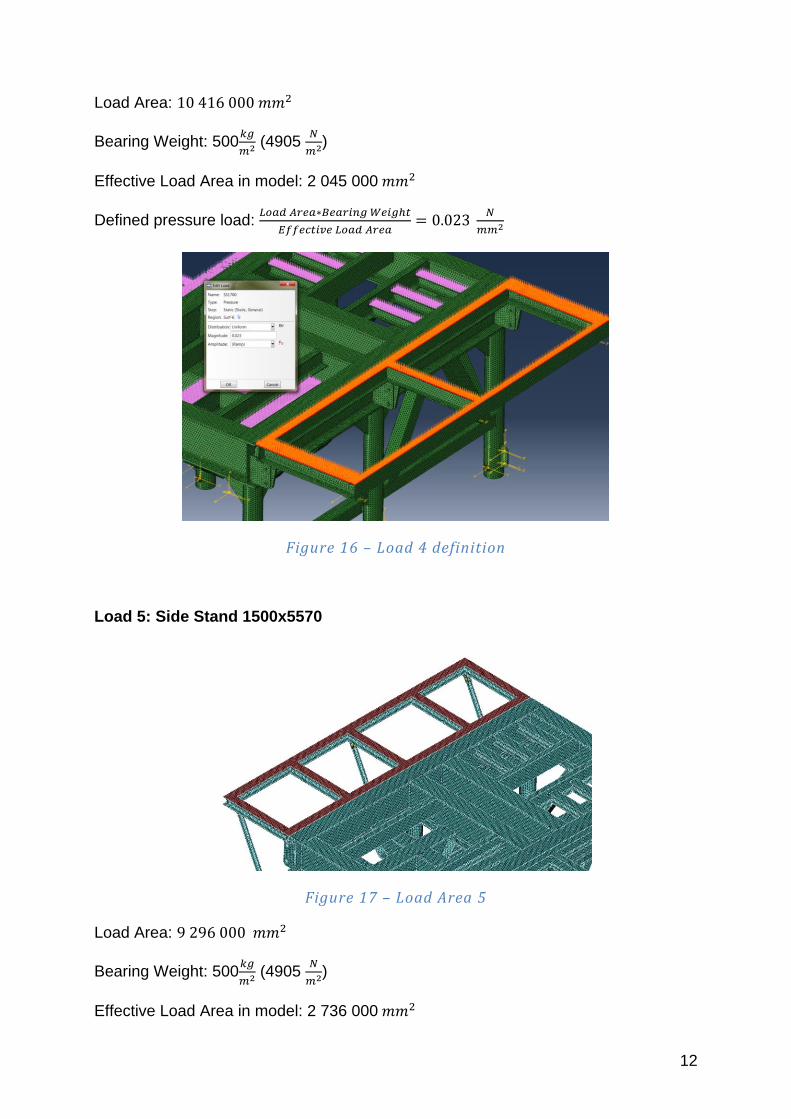
12
Load Area:
Bearing Weight: 500
(4905
)
Effective Load Area in model: 2 045 000
Defined pressure load:
Figure 16 – Load 4 definition
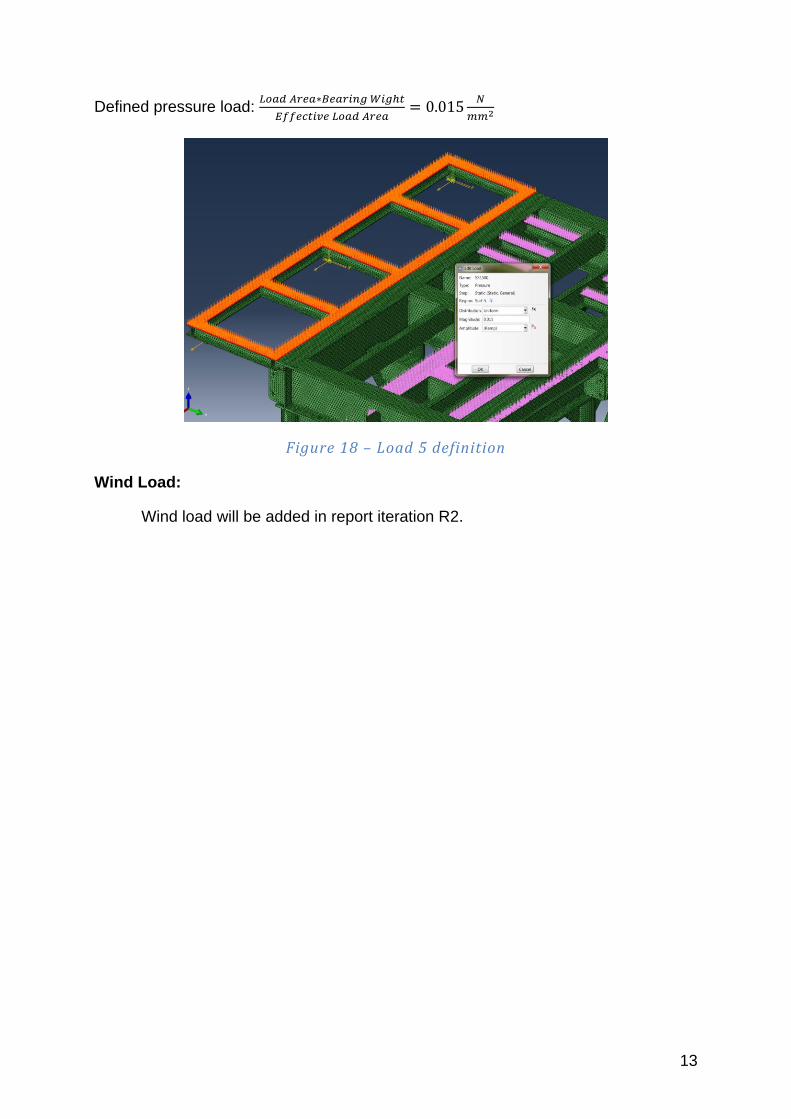
Load 5: Side Stand 1500x5570
Figure 17 – Load Area 5
Load Area:
Bearing Weight: 500
(4905
)
Effective Load Area in model: 2 736 000
13
Defined pressure load:
Figure 18 – Load 5 definition
Wind Load:
Wind load will be added in report iteration R2.
14
4. Allowable stress calculation
4.1. Material properties and safety factors
Yield strength of used materials:
Pins: 650
(Č4732)
Rest of the substructure: 355
(St355J2N)
Safety factor used: 1.67
Yield strength to shear strength conversion factor: 0.577
Allowable stress:
Pins yield:
Pins shear:
Substructure:
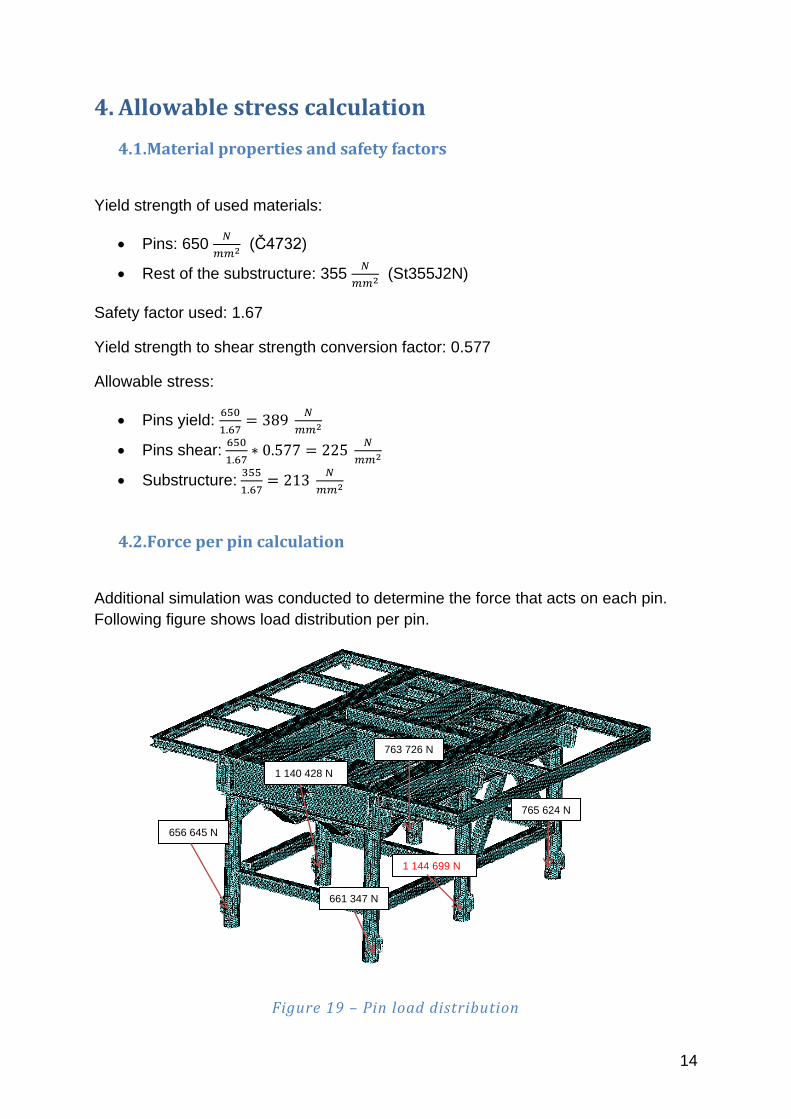
4.2. Force per pin calculation
Additional simulation was conducted to determine the force that acts on each pin.
Following figure shows load distribution per pin.
Figure 19 – Pin load distribution
763 726 N
1 140 428 N
656 645 N
661 347 N
1 144 699 N
765 624 N
15
4.3. Pin shear stress analytical calculation
Since no conclusion can be drawn from surface Von Mises stress about the shear
load of the pins, analytical calculation of pin shear stress was conducted. Bottom pins
were chosen for this calculation because they bear more load than upper pins.
Load assesment:
Top mass: 14.14 t (138 713 N)
Substructure load: 4 992 430 N (Load 1 + Load 2 + Load 3 + Load 4)
Overall: 5 132 469 N (Vertical load)
Maximum pin force: 1 144 699 N (Contact force direction load)
Pin crossection area: 5026.55
Type of connection: Double shear
Shear stress per pin:
( )
4.4. Pin seat compressive strength calculation
As it was shown in report version R0, there were high stress concentrations on
pin seats that were the result of unrealistic contact behavior due to discontinuities in
the contact. Following analytical assessment will provide proof that those high
pressure areas indeed were the result of FE simulations inability to properly describe
stress in areas with discontinuities.
Top section leg pin seat:
Maximum pin force: 1 144 699 N
Pin seat effective bearing area:
Compressive stress on pin seat:
( )
Compressive strength of pin seats is below the allowed values.
Skid section leg pin seat:
Maximum pin force: 1 144 699 N
16
Pin seat effective bearing area:
Compressive stress on pin seat:
( )
Compressive strength of pin seats is below the allowed values.
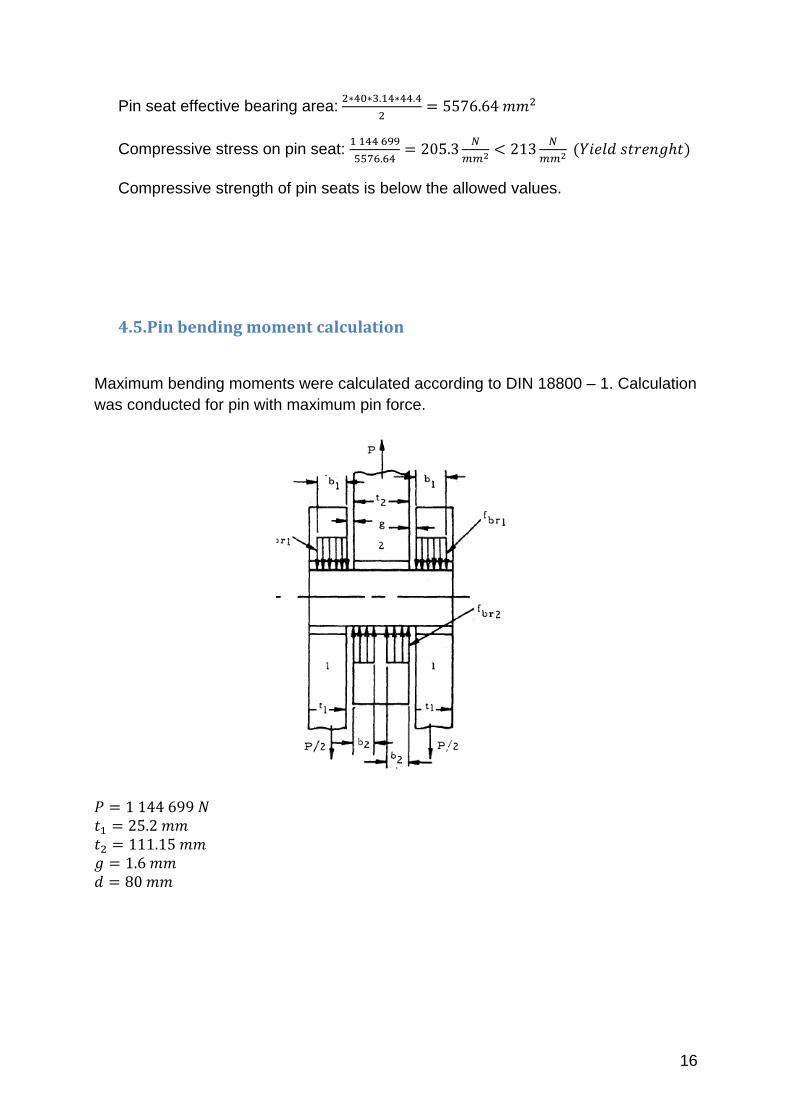
4.5. Pin bending moment calculation
Maximum bending moments were calculated according to DIN 18800 – 1. Calculation
was conducted for pin with maximum pin force.
17
4.5.1. Maximum bending moment
Maximum moment in pin equals:
(
)
Maximum allowed moment according to DIN 18800-1
4.5.2. Bending moment at shear plane
Moment at shear plane:
(
)
Stress at shear plane:
Combinatory load at shear plane according to DIN 18800-1 (Coexistent bending and
shear)
(
) (
)
(
)
(
)
All bending moment conditions according to DIN 18800-1 were satisfied.
18
5. Result Evaluation
Note: Allowable stress calculated in section 4 of this report was used as the scale top
value. Every value above that is shown in grey color.
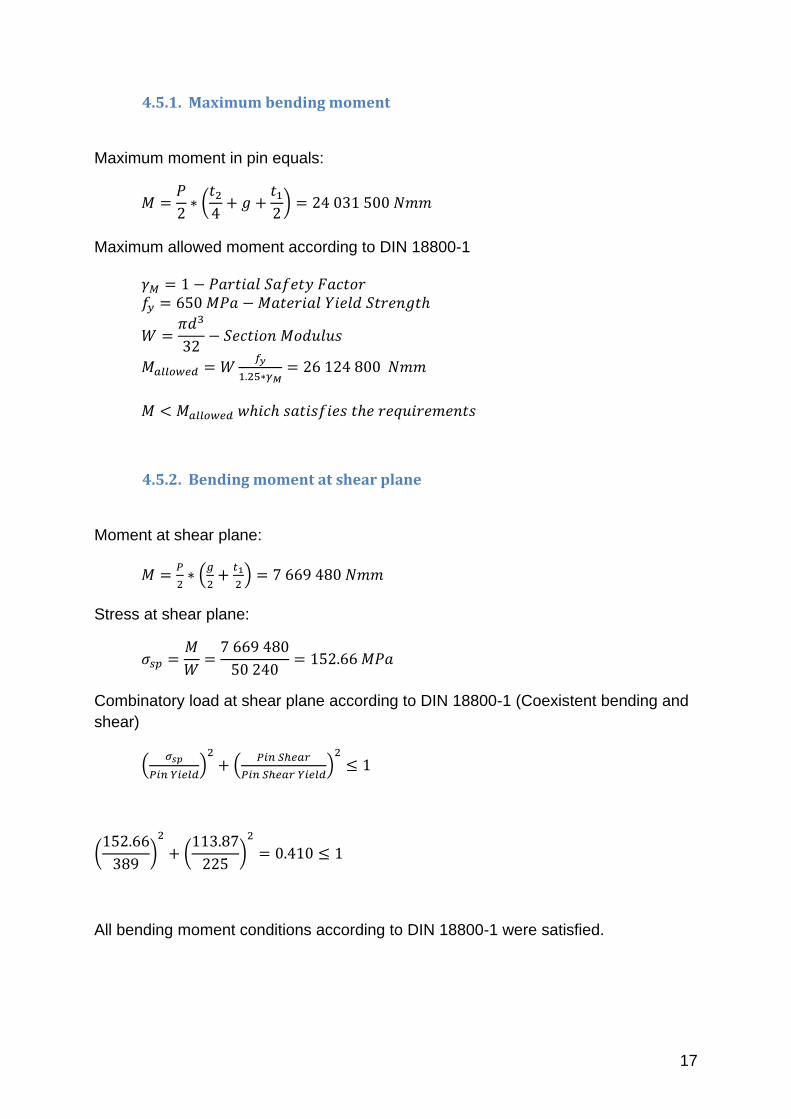
5.1. Skid
Figure 20 – Skid displacements (mm)
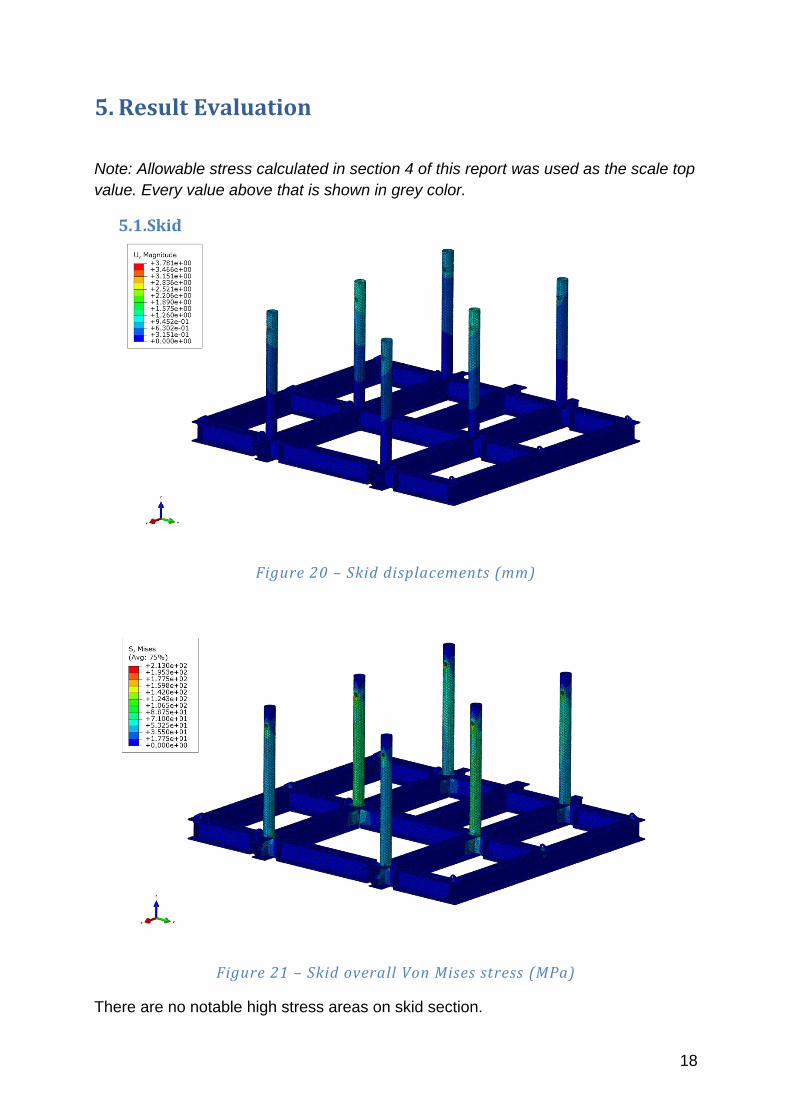
Figure 21 – Skid overall Von Mises stress (MPa)
There are no notable high stress areas on skid section.
19
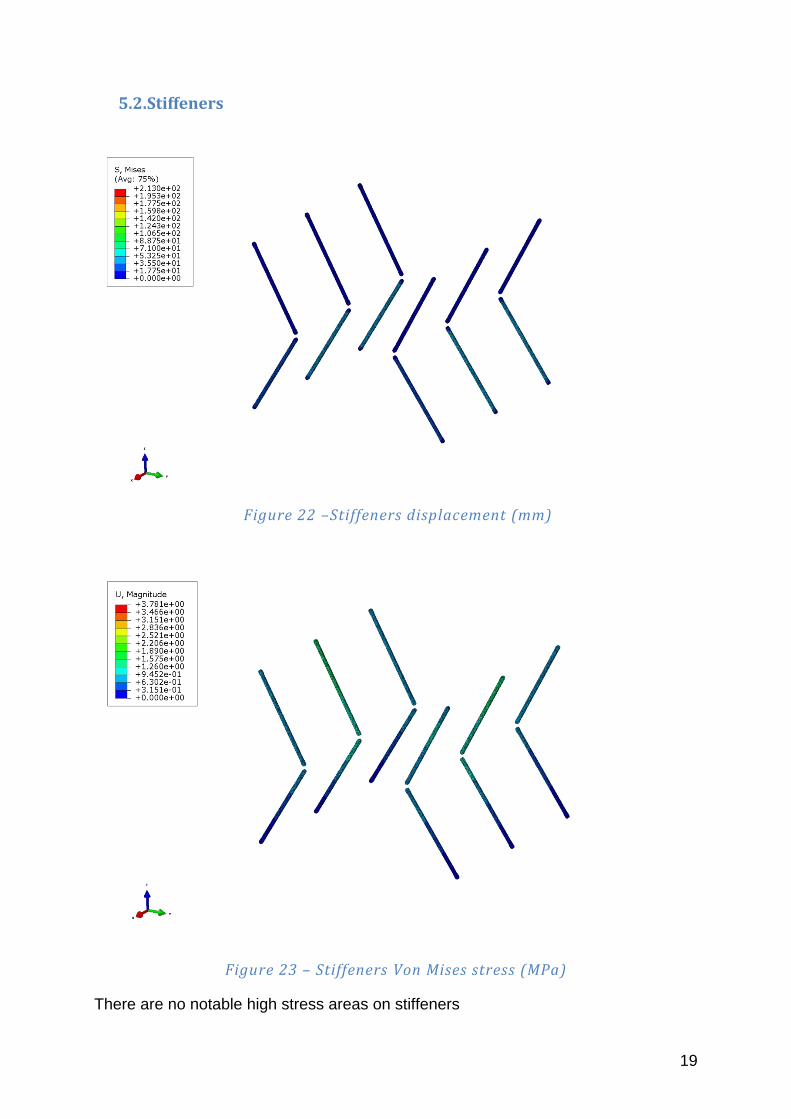
5.2. Stiffeners
Figure 22 –Stiffeners displacement (mm)
Figure 23 – Stiffeners Von Mises stress (MPa)
There are no notable high stress areas on stiffeners
20
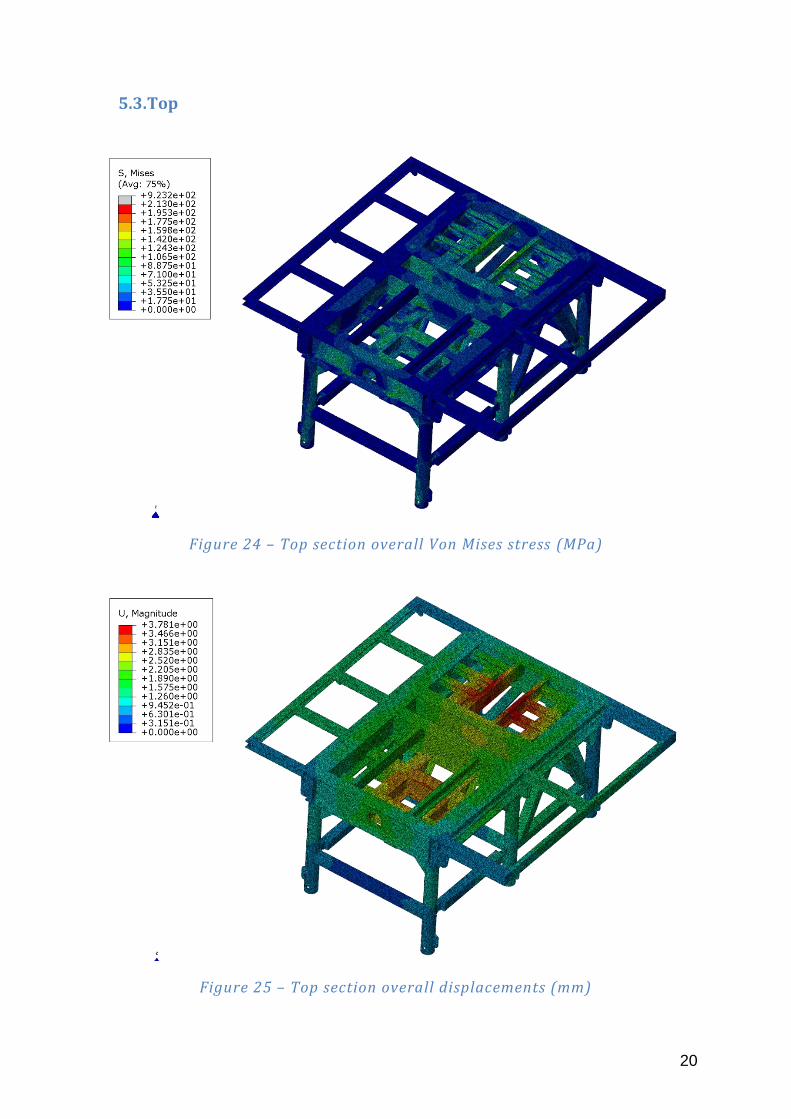
5.3. Top
Figure 24 – Top section overall Von Mises stress (MPa)
Figure 25 – Top section overall displacements (mm)
21
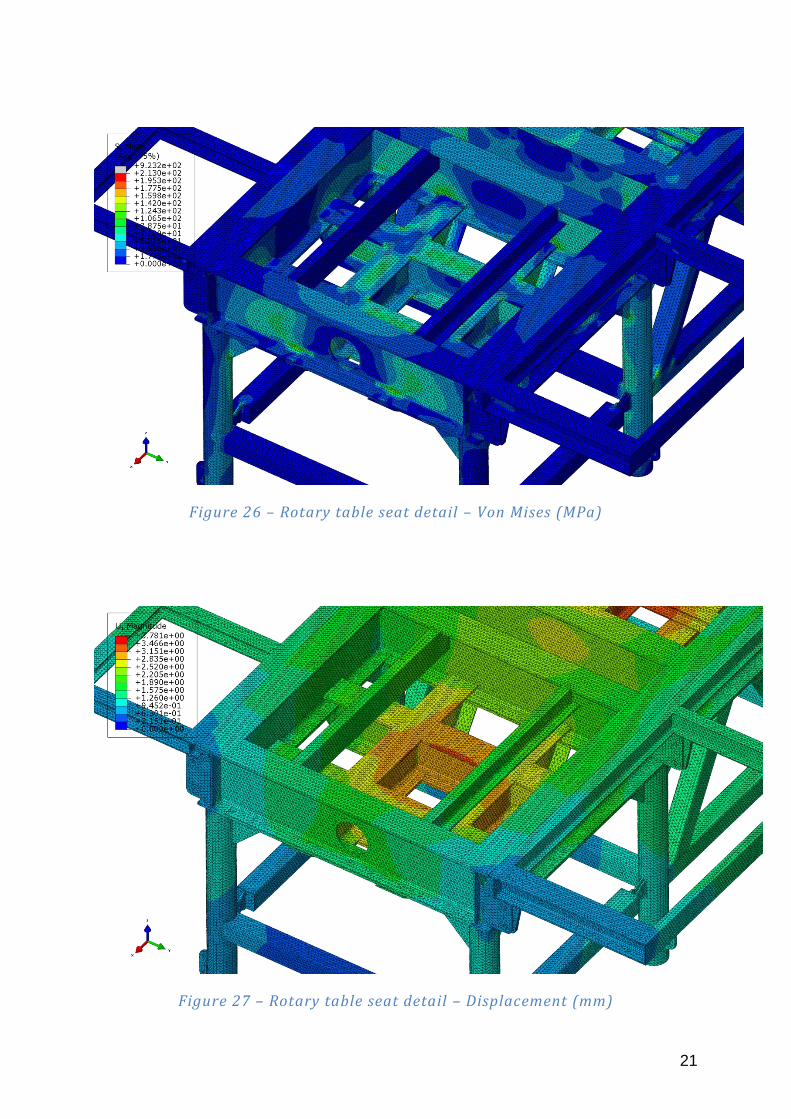
Figure 26 – Rotary table seat detail – Von Mises (MPa)
Figure 27 – Rotary table seat detail – Displacement (mm)
22
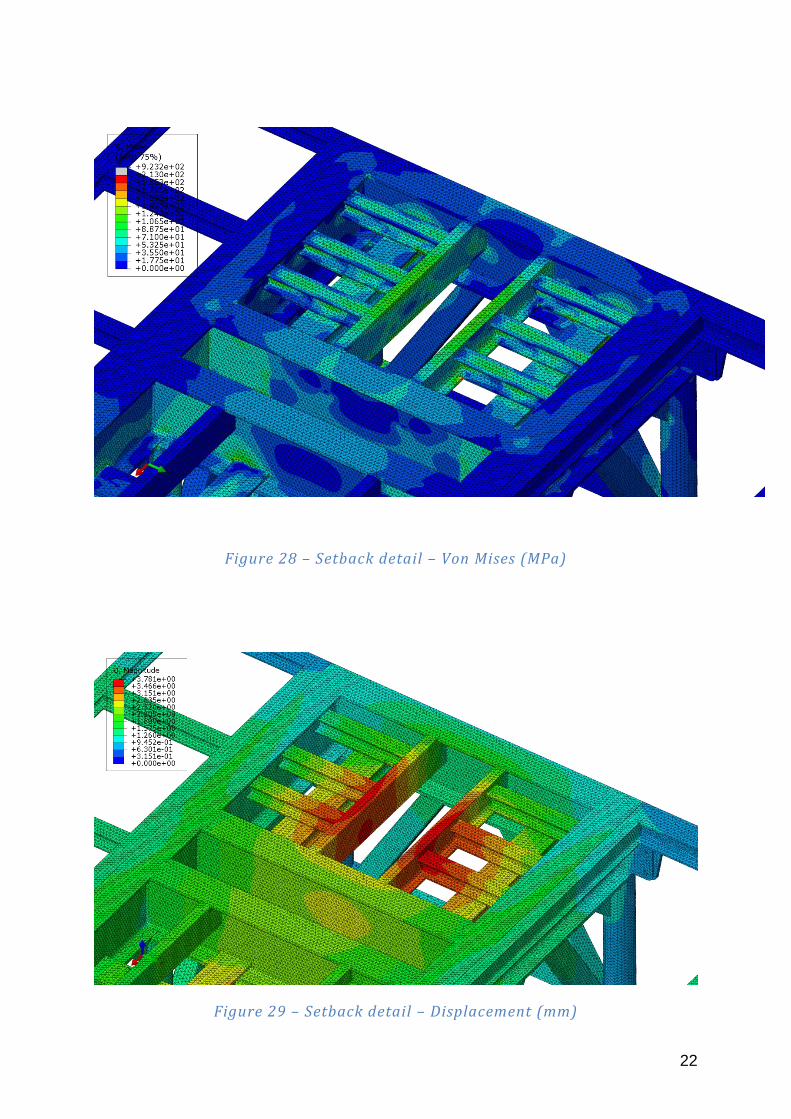
Figure 28 – Setback detail – Von Mises (MPa)
Figure 29 – Setback detail – Displacement (mm)
23
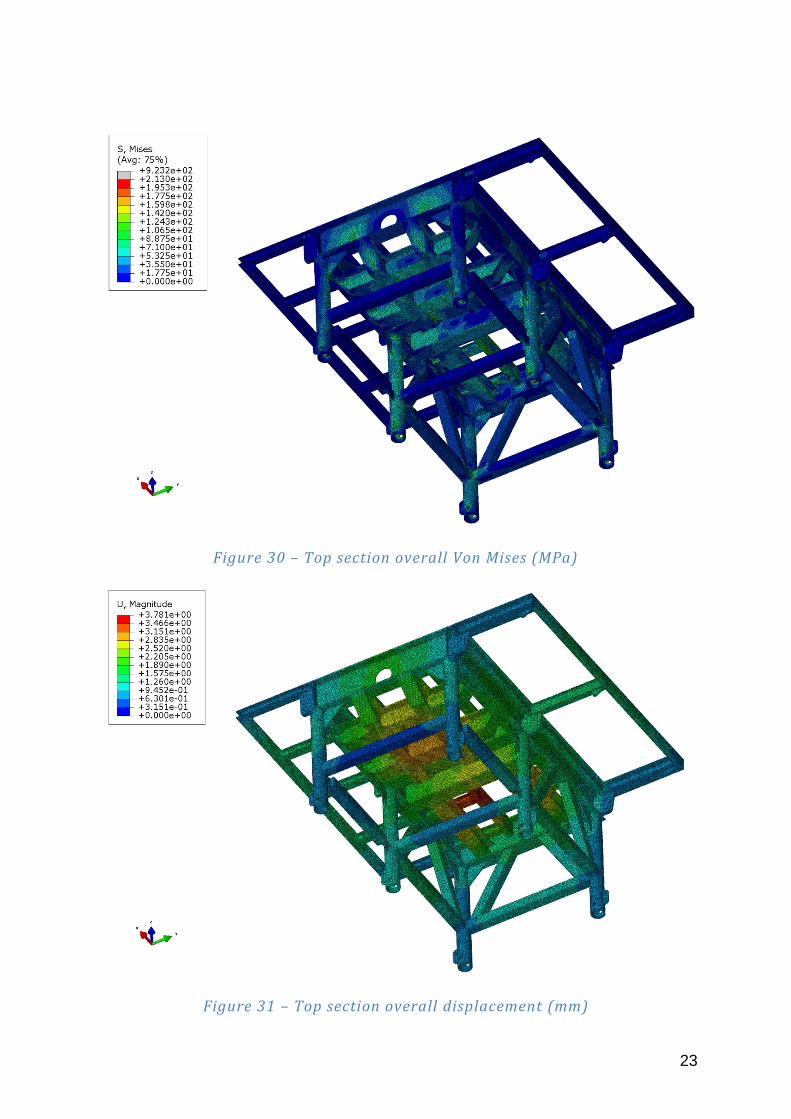
Figure 30 – Top section overall Von Mises (MPa)
Figure 31 – Top section overall displacement (mm)
24
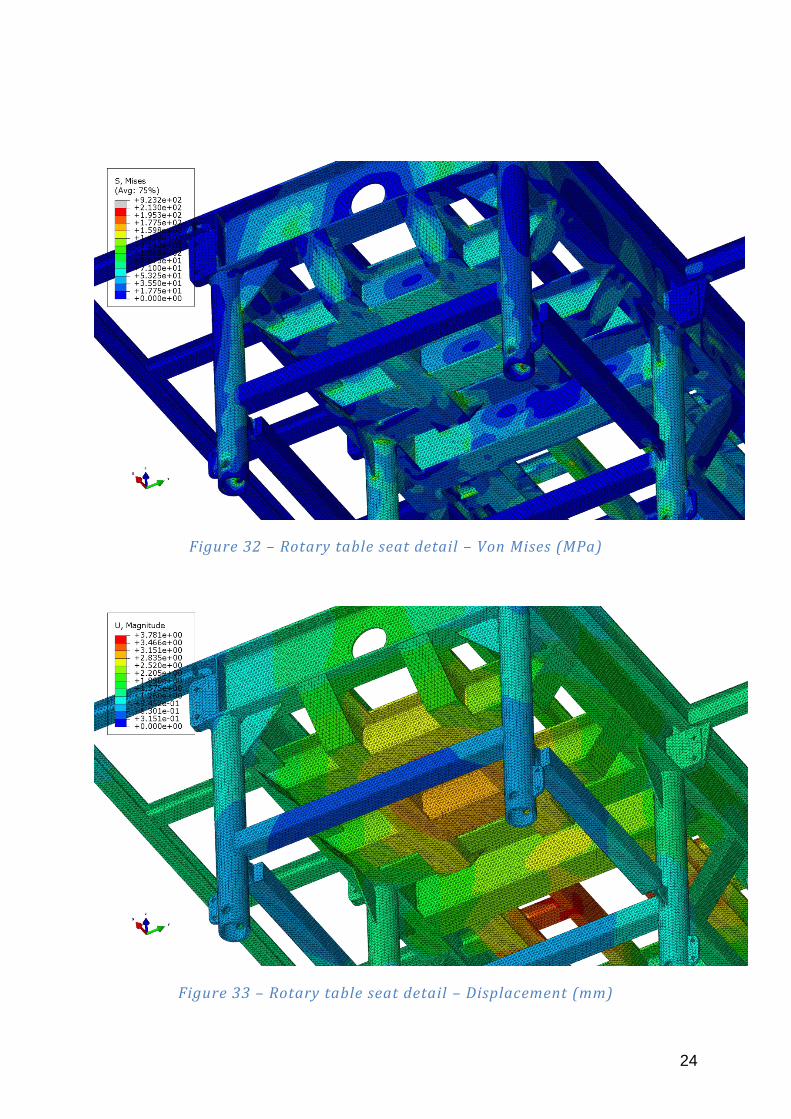
Figure 32 – Rotary table seat detail – Von Mises (MPa)
Figure 33 – Rotary table seat detail – Displacement (mm)
25
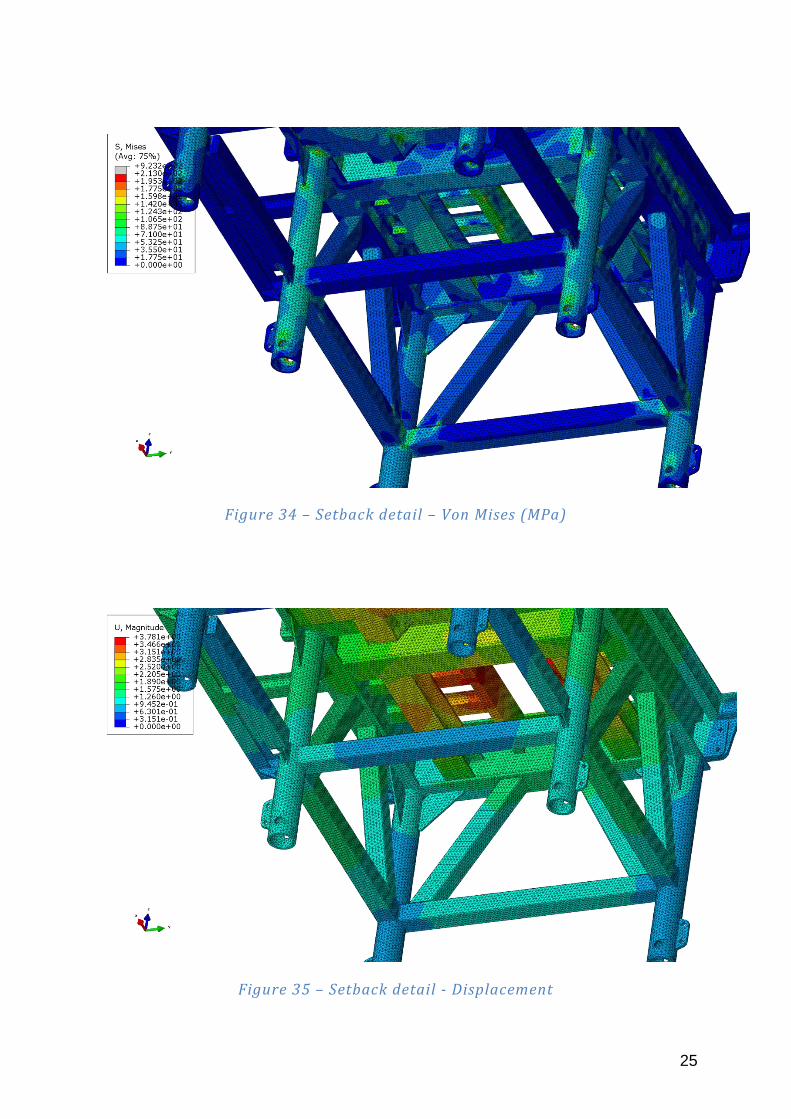
Figure 34 – Setback detail – Von Mises (MPa)
Figure 35 – Setback detail - Displacement
26
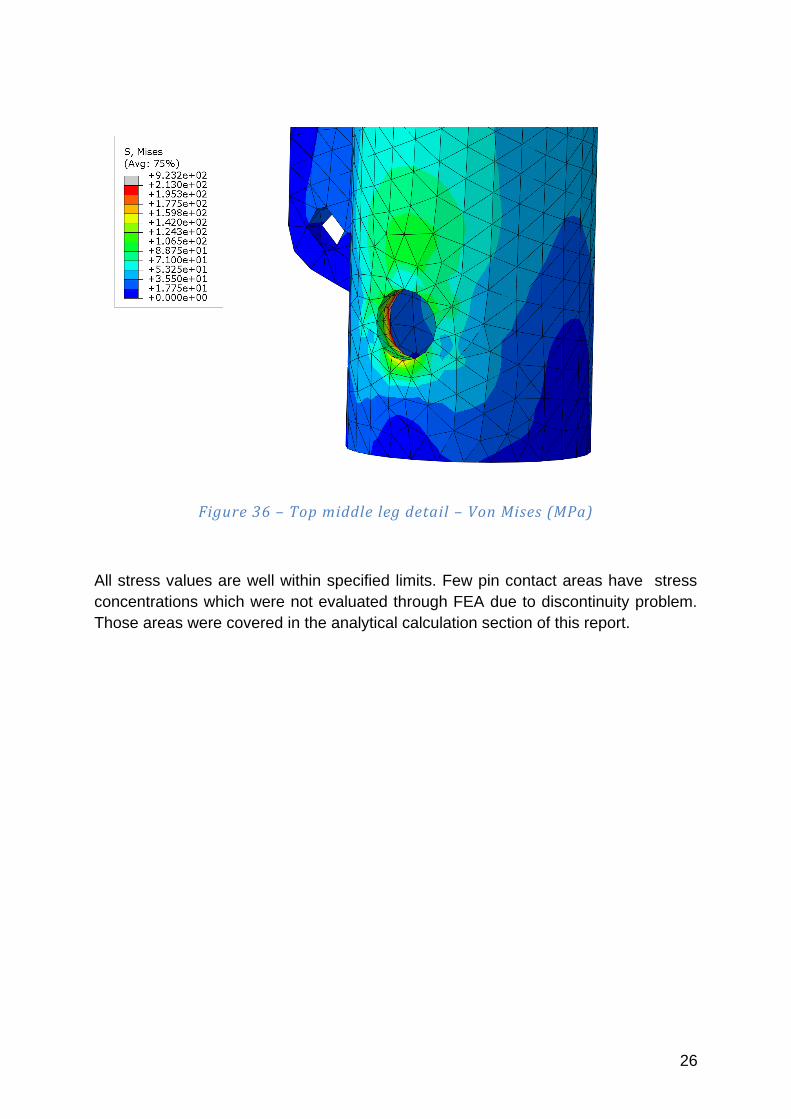
Figure 36 – Top middle leg detail – Von Mises (MPa)
All stress values are well within specified limits. Few pin contact areas have stress
concentrations which were not evaluated through FEA due to discontinuity problem.
Those areas were covered in the analytical calculation section of this report.
27
6. Conclusion
Modifications that were made in version R0 improved the substructure on critical
areas that were presented in preliminary report. Whole substructure satisfies design
limits set by allowable stress design.
Wind load assessment will be added in version R2.
Compressive strength assessment shows that the high contact pressure areas
were indeed a numerical error that arose due to discontinuities in the contact
surfaces. Analytical calculation proves that the analyzed contacts are within limits of
allowable stress design.
Pin bending analytical calculation according to DIN 18800-1 shows that the pin
satisfies set requirements.
Substructure model (provided by RNP) FE analysis results and analytical
calculation results provided in this report prove that the substructure satisfies all
requirements dictated by API 4F Fourth Edition (Loading conditions determined by
Table 1 of Section 7 with minimum safety factor of 1.67) and DIN 18800-1 (for
specific areas where this calculation was required).