Calculation RNP-I/INST-1041, Rev 3, "Feedwater Flow Loop ...
100
SYSTEM FILE NO. 3020,3050 CALC. TYPE ID IE PRIORITY 0 CAROLINA POWER & LIGHT COMPANY CALCULATION # RNP-IfINST-1041 FOR Feedwater Flow Loop Uncertainty and Scaling Calculation FOR H. B. ROBINSON UNIT 2 YES NO SAFETY RELATED : 0 [1 AUGMENTED QUALITY: L N NON SAFETY: [0 El APPROVAL REV. PREPARD IbY REVIEWED BY CROSS DISCIPLINE SUPERVISOR NO. DATE'. DATE REVIEW BY DATE . DISCIPLINE / DATE 1 Signature on File Signature on File REASON FOR CHANGE: 2 Signature on File Signature on File f REASON FOR CHANGE: 3 |W. Roert Smith 1 g we UwtT J5 W REAiSzONFO /28/02 IC Qua B - -d -L REASONFORCHANGE: 5e,se 6/ M 1.Ay--er
-
Upload
khangminh22 -
Category
Documents
-
view
2 -
download
0
Transcript of Calculation RNP-I/INST-1041, Rev 3, "Feedwater Flow Loop ...
SYSTEM FILE NO. 3020,3050CALC. TYPE ID IEPRIORITY 0
CAROLINA POWER & LIGHT COMPANY
CALCULATION # RNP-IfINST-1041
FOR
Feedwater Flow Loop Uncertainty and Scaling Calculation
FOR
H. B. ROBINSON UNIT 2
YES NOSAFETY RELATED : 0 [1AUGMENTED QUALITY: L NNON SAFETY: [0 El
APPROVAL
REV. PREPARD IbY REVIEWED BY CROSS DISCIPLINE SUPERVISORNO. DATE'. DATE REVIEW BY DATE
. DISCIPLINE / DATE1 Signature on File Signature on File
REASON FOR CHANGE:
2 Signature on File Signature on File fREASON FOR CHANGE:
3 |W. Roert Smith 1 g we UwtT J5 WREAiSzONFO /28/02 IC Qua B - -d -L
REASONFORCHANGE: 5e,se 6/ M 1.Ay--er

Computed By: Date: CAROLINA POWER & LIGHTCOMPANY Calculation ID:W. Robert Smith 08128 / 02 RNIItVINST-1041I
Checked By: Date- CALCULATION SHEET Pg. I of 93 Rev: 3Bob Hunter 08 /28/ 02Project No.: N/A File:
Project Title: N/A
CalculationTitle: Feedwater Flow Loop Uncertainty and Scaling Calculation
Tshle nr ContenttSE.C DFqrRT(TION PACYF
REVISION HISTORY ................................... 41.0 OBJECTIVE .............. 52.0 FUNCTIONAL DESCRIPTION...............................................................................................6
2.1 NORMAL FUNCTION .......................................... 62.2 ACCIDENT MITIGATING FUNCTION.......................................................................................................62.3 POST ACCIDENT MONITORING FUNCTION .......................................... 62.4 POST SEISMIC FUNCTION ............................... .. 7
3.0 LOOP DIAGRAM .......................... 74.0 REFERENCES .......................... 9
4.1 DRAWINGS ............................... 94.2 CALCULATIONS ................................. 94.3 REGULATORY DOCUMENTS .......................... .. .. 94.4 TECHNICAL MANUALS ,,. ... 94.5 CALIBRATION AND MAINTENANCE PROCEDURES .................................................. 104.6 PROCEDURES .................................................. 104.7 OTHER REF ERENCES.:10
5.0 INPUTS AND ASSUMPTIONS..................................................... I6.0 CALCULATION OF UNCERTAINTY CONTRIBUTORS . ............................... 23
6.1 ACCIDENT EFFECTS (AE) ...................................................... 236.2 SEISMIC EFFECT (SE).............................................2...................................................................................6236.3 INSULATION RESISTANCE ERROR (IR) ..................................... 246.4 PROCESS MEASUREMENT ERROR (PME) ..................................... 24
6.4.1 Process Measurement Error - Normal Environment .................................................... 246.4.2 Process Measurement Error - Accident Environment .................................................... 26
6.5 PRIMARY ELEMENT ERROR (PE) ............................. 266.6 TRANSMITTER (FT-497. ROSEMOUNT I 153HA5) ................................................ 28
6.6.1 Transmitter's Unverified Attributes of Reference Accuracy (RAxmir) .................................................. 286.6.2 Transmitter Calibration Tolerance (CAL,,,,) ....................................................... 296.6.3 Transmitter Drift (DR.m,,) ....................................................... 296.6.4 Transmitter M&TE Effect (MTEamtr) ....................................................... 296.6.5 Transmitter Temperature Effect (TEh,,,t,) ....................................................... 306.6.6 Transmitter Static Pressure Effect (SPEmt,).......................................................................................306.6.7 Transmitter Power Supply Effect (PSE,, 1) .................................. 316.6.8 Transmitter Total Device Uncertainty (TDUm,,) ........................................................ 3 16.6.9 Transmitter As Found Tolerance (AFT,,my) ....................................................... 316.6.610 Transmitter As Left Tolerance (ALT . ...) ....................................................... 32
6.7 TRANSMITTER (FT-477 AND Fr-487. ROSEMOUNT 1153DA5) ..................................... 336.7.1 Transmiuer's Unverified Attributes of Reference Accuracy (RAir,,) .................................................. 336.7.2 Transmitter Calibration Tolerance (CAL mir) ....................................................... 33
Computed By: 0 a212 CAROLNA POWER & LIaH(ToC PANY Calculation ID:W. RobertSnmih 08/281 02 OARNP-I/NST-1041
Checked By: Date: CALCULATON SHEFr P.2 of 93 cv:3Bob Hunter 08 1281 02Project No.: NIA File:
Project Tihc NIA
Calculation Title: Feedwater Flow Loop Uncertainty and Scaling Calculation
6.7.3 Transmitter Drift (DRi,,,,) ............................................................... 336.7.4 Transmitter M&TE Effect (MTEX,,) ............................................................... 346.7.5 Transmitter Temperature Effect (TE, ,) ................................................................ 346.7.6 Transmitter Static Pressure Effect (SPEx,,T) ............................................................... 356.7.7 Transmitter Power Supply Effect (PSE1,,,) ............................................................... 356.7.8 Transmitter Total Device Uncertainty (TDUtmt) ............................................................... 356.7.9 Transmitter As Found Tolerance ................................................................A....... 366.7.10 Transmitter As Left Tolerance (ALT.mtT). . ............................................................... 36
6.8 TRANSMITTER (FT-476. FT-486 AND 1r-496, ROSEMOUNT 1151 DP5) ............................................ 376.8.1 Transmitter's Unverified Attributes of Reference Accuracy (RAlm,,) .................................................. 376.8.2 Transmitter Calibration Tolerance (CALm,) ............................................................... 376.8.3 Transmitter Drift (DR,,3)7.....................................................................................................................6376.8.4 Transmitter M&TE Effect (MTE,,,,,) ................................................................ 386.8.5 Transmitter Temperature Effect (TE...)................................................................. 386.8.6 Transmitter Static Pressure Effect (SPE2 mW,).........................................................................................396.8.7 Transmitter Power Supply Effect (PSEx.ir) ................................. 39.-----------....................------... 396.8.8 Transmitter Total Device Uncertainty (TDUxmu) ..................................... 406.8.9 Transmitt er As Fou nd Tolerance (AFTimtr).40 * -.............................................. 406.8.10 Transmitter As Let Tolerance (ALTtXm,,) ....................................... 41
6.9 COMPARATOR MODULE ....................................... 426.9.1 Comparator's Unverified Attributes of Reference Accuracy (RA.omp) ................................................. 426.9.2 Comparator Calibration Tolerance (CALco.p) .................................................... 426.9.3 Comparator Drift (DRo.p) .................................................... 426.9.4 Comparator M&TE Effect (MTEcomp) .................................................... 436.9.5 Comparator Temperature Effect (TEcop) ............................................. 436.9.6 Comparator Power Supply Effect (PSEW.v) ... 436.9.7 Comparator Total Device Uncertainty (TDUCoP) .46.9.8 Comparator As Found Tolerance (AFrCOp)....................................................................................446.9.9 Comparator As Left Tolerance (ALTcWWp) . 45
6.10 ISOLATOR MODULE .. 466.10.1 Isolator's Unverified Attributes of Reference Accuracy (RA 3,s) .466.10.2 Isolator Calibration Tolerance (CALtso) .466.10.3 Isolator Drift (DRite) .466.10.4 Isolator M&TE Effect (MTEiso).........................................................................................................476.10.5 Isolator Temperature Effect (TEijw)....................................................................................................476.10.6 Isolator Power Supply Effect (PSE1. 1)................................................................................................486.10.7 Isolator Total Device Uncertainty (TDU,,,) .486.10.8 Isolator As Found Tolerance (AFTiR1 ) .486.10.9 Isolator As Left Tolerance (ALT 1o) .49
6.11 SQUARE ROOT MODULE .. 506.11.1 Square Root Module's Unverified Attributes of Reference Accuracy (RAv) .506.11.2 Square Root Module Calibration Tolerance (CAL~q) ............................................ SO.....................506.11.3 Square Root Module Drift (DRqn) .506.11.4 Square Root Module M&TE Effect (MTEq,)...................................................................................51

Computed By: Date: CAROLINA POWER & LIGHT COMPANY alculation ID:W. Robea Smith 08/28/ 02 CAOiAPWR lHc~AYRNP-VINST.1041
Checked By: Date: CALCULATION SIEET Pg.3 Of 9 3 Rev: 3Bob Hunter 08128/02 .Prject No.: N/A File:
Project nitk: N/A
ICalculation Title: Feedwater Flow Loop Uncertainty and Scaling Calculation
6.11.5 Square Root Module Temperature Effect (TEsqr) .................................................... 516.11.6 Square Root Module Power Supply Effect (PSESqn)...........................................................................5 16.11.7 Square Root Module Total Device Uncertainty (TDUw0 ) .................................................... 526.11.8 Square Root Module As Found Tolerance (AFT14' ) ..................................................... 526.11.9 Square Root Module As Left Tolerance (ALTM0 )..............................................................................53
6.12 INDICATOR ..................................................... 546.12.1 Indicator's Unverified Attributes of Reference Accuracy (RA.,,) ..................................................... 546.12.2 Indicator Calibration Tolerance (CAIid) ........................................................................................... 546.12.3 Indicator Drift (DRMm,,) ..........................................-... 546.12.4 Indicator M&TE Effect (MTEind) ................................... 556.12.5 Indicator Temperature Effect (TEi,,d) ................................... 556.12.6 Indicator Power Supply Effect (PSEimj) ................................... 556.12.7 Indicator Readability (RD,,,1) ................................... 566.12.8 Indicator Total Device Uncertainty (TDUW,) ................................... 566.12.9 Indicator As Found Tolerance (AFTr.d) .................................... 566.12.10 Indicator As Left Tolerance (ALTi,) .................................... : 57
6.13 RECORDER .................................... 586.13.1 Recorder's Unverified Attributes of Reference Accuracy (RA.) .................................................. 586.13.2 Recorder Calibration Tolerance (CAL.,,) ................................. 586.13.3 Recorder Drift (DREW) ................................. 586.13.4 Recorder M&TE Effect (MTE,.) ................................. 596.13.5 Recorder Temperature Effect (TE,,,)..................................................................................................596.13.6 Recorder Power Supply Effect (PSEwc) ................................. 606.13.7 Recorder Readability (RD,,,) ................................. 606.13.8 Recorder Total Device Uncertainty (TDUC) .................................................................. 606.13.9 Recorder As-Found Tolerance (Ar1T,,) .................................................................. 616.13.10 Recorder As Left Tolerance (ALTC)...............................................................................................61
7.0 TOTAL LOOP UNCERTAINTY (TLU) ........................................................ 627.1 TOTAL LOOP UNCERTAINTY - PLANT NORMAL .................................................................. 62
7.1.1 Total Loop Uncertainty - Input to ERFIS .................................................................. 627.1.2 Total Loop Uncertainty - Indicator FI-476.477.486.487,496, AND 497 ......................................... 637.1.3 Total Loop Uncertainty - Recorder FR-478,488. AND 498 ................................................................ 647.1.4 Total Loop Uncertainty - Comparators .................................................................. 65
7.2 TOTAL LOOP UNCERTAINTY - ACCIDENT .................................................................. 657.3 TOTAL LOOP UNCERTAINTY - POST SEISMIC .................................................................. 657.4 LOOP AS FOUND TOLERANCE .................................................................. 68
7.4.1 Loop As Found Tolerance - Indicator FP-476,477,486.487,496 AND 497 ...................................... 687.4.2 Loop As Found Tolerance - Recorder FR-478,488 AND 498 ............................................................. 697.4.3 Loop As Found Tolerance - Input to ERFIS .................................................................. 697.4.4 Loop As Found Tolerance - Comparators .................................................................. 70
7.5 GROUP AS FOUND TOLERANCE .................................................................. 7 17.5.1 Group As Found Tolerance - Indicator FP-476,477.486.487.496 AND 497 .................................... 7 17.5.2 Group As Found Tolerance - Recorder FR-478,488 AND 498 ........................................................... 717.5.3 Group As Found Tolerance - Input to ERFIS .................................................................. 71

W. Rotxm t Smith 0 t CAROLINA POWER & LIGHT (COMPANY Cakubtion 11):W~br~ih08128 / 02 RNP-VINST. D14
Checked By: Date: CALCULATION SHEET Pg. 4 of 93 Rcv 3Bob Hunter 08/ 28 / 02
Poject No.: N/A File:
Project Title: N/A
Calculation Title: Feedwater Flow Loop Uncertainty and Scaling Calculation
7.5.4 Group As Found Tolerance - Comparators...........................................................................................728.0 DISCUSSION OF RESULTS .................................................................... 73
8.1 IMPACT ON IMPROVED TECHNICAL SPECIFICATIONS .................................................................... 788.2 IMPACT ON UFSAR ................................................................................. 788.3 IMPACT ON DESIGN BASIS DOCUMENTS ................................................................................. 788.4 IMPACT ON OTHER CALCULATIONS....................................................................................................788.5 IMPACT ON PLANT PROCEDURES ................................................................................. 79
9.0 SCALING CALCULATIONS .................................................................... 809.1 FLOW TRANSMITTER (F-476,477.486.487.496 AND 496) ................................................................. 809.2 ISOLATOR MODULE (FM-476A. 476B. 477A. 47713. 486A. 48613. 487A, 487B, 496A, 496B. 497A.AND 497B) ................................................................................. 889.3 COMPARATOR MODULE (FC-478A, 478B, 488A. 488B,498A. AND 498B) ......................................... 899.4 COMPARATOR MODULE (FC478C. 478D. 488C. 488D. 498C. AND 498D) ......................................... 909.5 SQUARE ROOT MODULE (FM-476,477,486,487,496. AND 497) ........................................................ 919.6 INDICATOR (FI-476,477,486.487,496. AND 497) ................................................................................. 929.7 RECORDER (FR-478,488, AND 498) ............................. 93
TXRT OF ATTACHMFNTS PLACES
Attachment A - Calculation Matrix IAttachment B - Comparator Drift IAttachment C - International Instruments Indicator Data IAttachment D - Rosemount Transmitter Drift I
REVIRION HIIST)ORY
REVlJ5JlON D)F(SCRIPTION OF CHANCE
I Revised calculation to consider seismic uncertainties. The fonnat of thecalculation was revised to follow the calculation methodology presented in EGR-NGGC-0 153.
2 Revised calculation to account for the change in feedwater flow as a result of thepower uprate. Changed recorder to a Yokogawa VR204 to rcflcct changes madeby EC 47208. This calculation provides input to EC 47152 & EC 47162.
3 Corrected errors in Section 7.3 (Feedwater Flow / Steam Flow Mismatch setpointTotal Loop Uncertainty) and revised Section 8.0 as needed.
Computed By: Date: CAROLINA POWER & UGHTCOMPANY Calculation ID:W. Robert Smith 08/28/ 02 C O RNP-VINST-1041
Checked By: Date: CALCULATION SHE pg. 5 or 93 Rev: 3{ob Hunter 08 /28/ 02Project No.: N/A AF
Project Title: N/A
Calculation Title: Feedwater Flow Loop Uncertainty and Scaling Calculation
1.0 ORM IFCTIVF
This calculation computes the loop uncertainties associated with the indication, recording,alarm, and trip functions provided by the Feedwater Flow instrumentation loops. The loopsaddressed in this calculation also provide input to the Emergency Response FacilityInformation System (ERFIS). Uncertainties at the input to the ERFRS are calculated.Uncertainties are calculated for normal and post-seismic event conditions only. Thiscalculation develops the Reactor Protection System (RPS) setpoint associated with eachinstrument loop. This calculation also calculates the Allowable Value for the RPS setpointaddressed in this calculation. Uncertainties associated with the control functions provided bythe Feedwater Flow loops are not calculated.
The instrument loops containing the following components are addressed in this calculation:
Fr-476, 477, 486, 487, 496,497FQ476, 477,486FQ487, 496,497FM-476A/R, 476B1/RFM-477A/R, 477B/RFM486A/R, 486B/RFM-496A/R, 496B1/RFM-476,477, 486FM-487, 496, 497FC-478A, 478B, 478CFC-478D, 488A, 488BFC-488C, 488D, 498A FC-498B, 498C, 498DFI-476,477, 486F1487, 496,497F-476,477, 486F-487, 496, 497FR478,488,498FM-476A, 476B, 477AFM477B, 486A, 486BFM-487A, 487B, 496AFM-496B, 497A, 497B

Computed By- Date- AOIAPWR&:AMMPN Calculation la.W.Robed Smith 081281 02 CAROLINA POWER& LICwrTcom['ANY RNP-V/INST-1041
Checked By: Date: CALCULATION SHEET Pgi6 of 93 Rev: 3Bob Hunter 08 128/ 02 l
Project No.: NIA IiMc:
Project Tite: NIA
cucactionTlak Feedwater Flow Loop Uncertainty and Scaling Calculation
2.0 FITNCTIONAT. DESCRIPTION
The Feedwater Flow channels are used for protection, feedwater control, recording, andindication. The feedwater control function is not considered in this calculation.
The instrument loops, which are the subject of this calculation, provide the followingprotective function:
* Steam Flow I Feedwater Flow Mismatch Reactor Trip
21 NORMAL. FITNMTION
The Feedwater Flow loops provide indications of Feedwater Flow on indicators Fl -476, 477,486, 487, 496, and 497 in the main Control Room during normal operation. Feedwater flowis recorded by FR478, 488, and 498. These loops provide input to ERFIS and feedwatercontrol. These loops provide input for the alarms associated with feedwater flow > steamflow and steam flow > feedwater flow.
2.2 AcrilnENT MITTGATING FITNCTION
The instrument loops addressed by this calculation produce a Steam Flow I Feedwater FlowMismatch Reactor Trip signal which is interlocked with the Steam Generator Low LevelReactor Trip function.
2-3 POST ACCIDIRNT MONITORING FITNCTION
Per Reference 4.6.2, the feedwater flow loops are designated as RG 1.97 Category D3variable.

CV. Robert Smith Date8 CAROLINA POWER & LIGHT COMPANY CRalulition ID:
Checked By: Date: CALCULATIONSHEET Pg 7 of 93 Rcv: 3
Bob Hunter 08128/ 02 1
Precst No.: N/A File:
Project Title: N/A
Calcubtion Title: Feedwater Flow Loop Uncertainty and Scaling Calculation
24 POST SIFIMW FVIINCITON
Per Reference 4.7.12, the steam flow I feedwater flow mismatch function is required tooperate following a seismic event. Therefore, seismic uncertainties are computed for thisfunction.
30 TLOOP DIAGRAM
IN J
FT.476 FQ476 F1476B/R FM-476 | . -478D Feedwatcr FIlaw> Sicam Flow
= OM P Alatrm
Feedwatcr Flow I Stcam I'lowFC478A Mismatch (RTS)COMP ' _Feedwater Flow / Steam Flow
Mismatch Alarm
FM476A VFIN476DV/1 Oisolator) IND
* Also receives an input from steam flow loop F474. See Reference 4.2.3.Note: Similar for F-477, 486,487, 496, and 497
comptedBy:Dat: CROLNA PWER& LGHTCOMANYCalculation ID:W Robert Smith 08128/ 02 CAROLINA WER & LIGHT COMPANY RNP.1/INST-104 I
C'bcked By- Date: CALCULATION SHEET P& 8 of 93 Rev- 313oh Hunter 08 1 29 / 02
ject No.: NIA - II File:
Project Title: N/A
Calculation Titke: Feedwatcr Flow Loop Unccrtainty and Scaling Calculation
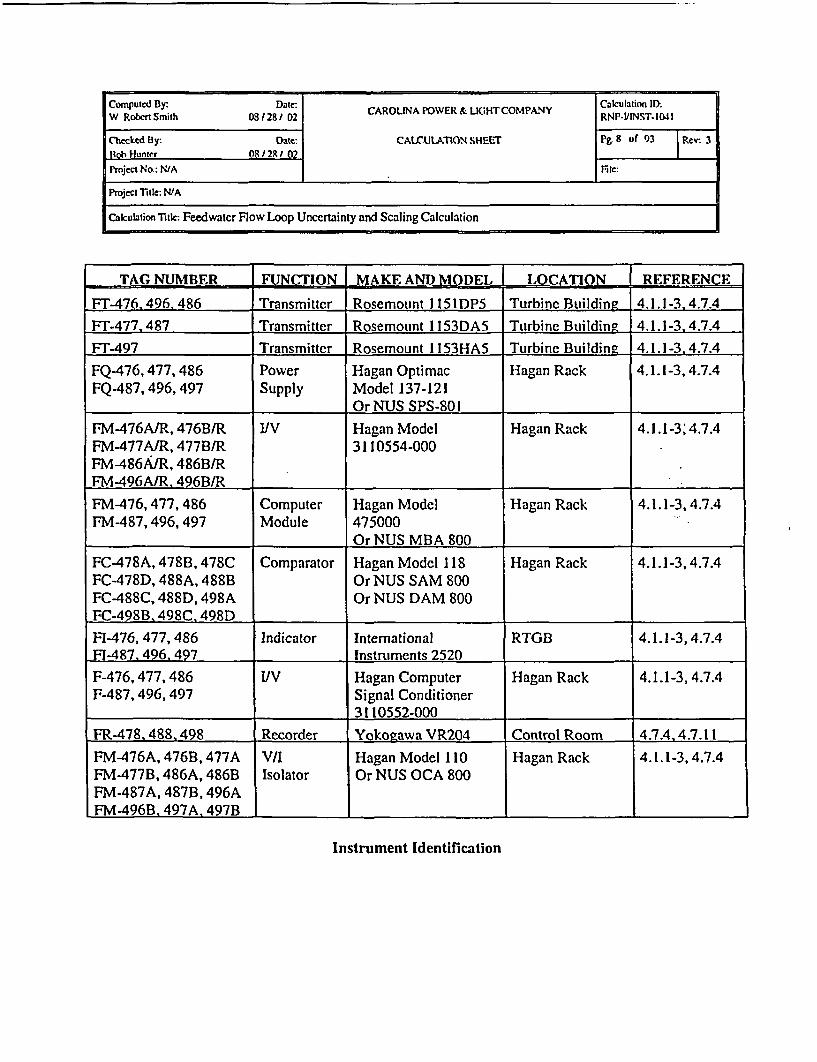
TAG NUMBER N MAKE AND MODEL I LOCATION REFERENCE
Fr-476,496, 486 Transmittcr Rosemount 1151 DP5 Turbinc Building 4.1.1 -3.4.7.4
FT-477.487 Transmitter Rosemount 1153DA5 Turbine Building 4.1.1-3.4.7.4FT-497 Transmitter Rosemount 1153HA5 Turbine Buildinn 4.1.1-3.4.7.4FQ-476, 477,486 Power Hagan Optimac Hagan Rack 4.1.1-3, 4.7.4FQ-487,496,497 Supply Model 137-121
Or NUS SPS-801
FM-476A/R, 476B1R 1/V Hagan Model Hagan Rack 4.1.1 -3 4.7.4FM-477A/R, 477B/R 3110554-000FM-486A/R, 486BIRFM-496A/R. 496B/R _
FM476,477,486 Computer Hagan Model Hagan Rack 4.1.1-3, 4.7.4FM-487, 496, 497 Module 475000
Or NUS MBA 800
FC478A, 478B, 478C Comparator Hagan Model 118 Hagan Rack 4.1.1-3,4.7.4FC-478D, 488A, 488B Or NUS SAM 800FC-488C, 488D, 498A Or NUS DAM 800FC-498B1 498C. 498D
F1476, 477,486 Indicator International RTGB 4.1.1-3,4.7.4Fl-487. 496. 497 Instruments 2520 _
F-476,477,486 IV Hagan Computer Hagan Rack 4.1.1-3,4.7.4F-487,496,497 Signal Conditioner
3110552-000FR-478.488.498 Recorder Yokogawa VR204 Control Room 4.7.4.4.7.1 l
FM476A, 476B, 477A V/I Hagan Model 110 Hagan Rack 4.1.1-3,4.7.4FM477B, 486A, 486B Isolator Or NUS OCA 800FM-487A, 487B, 496AFM-496B. 497A, 497B
Instrument Identification
Computed By Da8zC: CAROLINA PWoER & LGtHT COMPANY) Caku- tio 1W. RobertStrz~h OttOUAIO2R 1 CZCMPNYRNP.VINST.1041
Checkcd By Date: CALCULATION SHEET Pg.9 of 9F Rev: 3Bob Hunter 08 128 / 02Project No.: N/A fik-:
Project Title: W/A
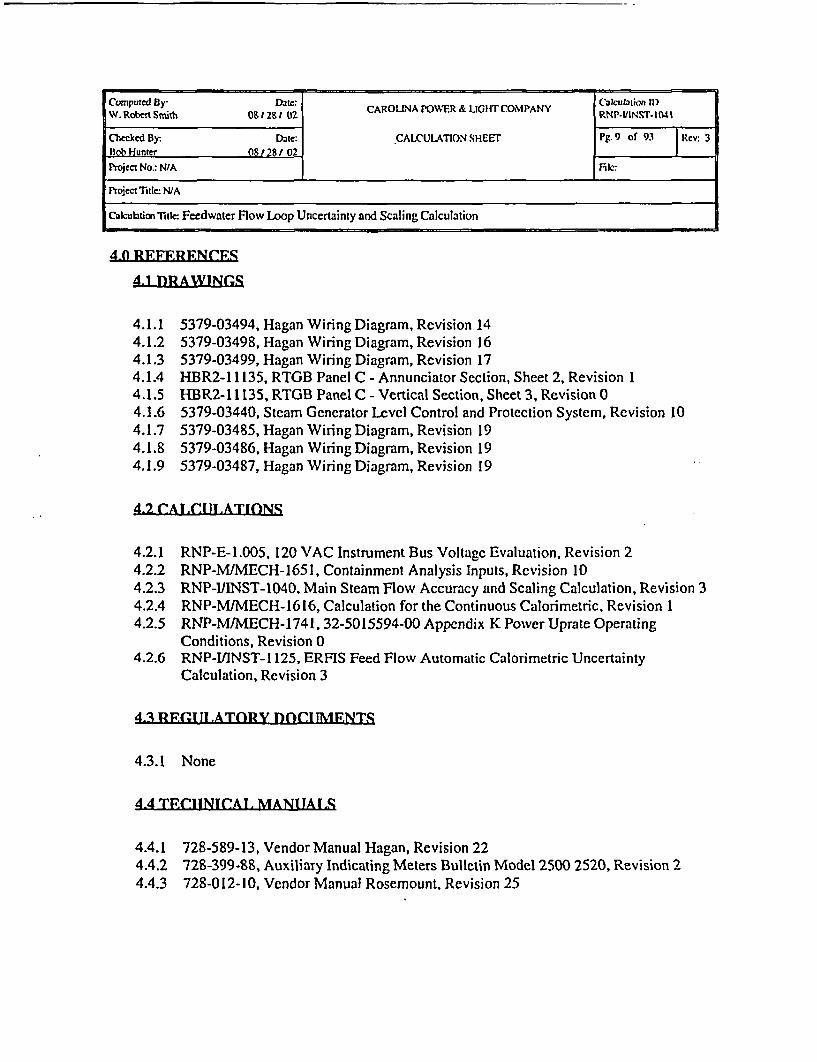
Clkukztion Taitle Feedwater Flow Loop Uncertainty and Scaling Calculation I4-0 RFFERFNCES
4.1 DRAWINGq
4.1.1 5379-03494, Hagan Wiring Diagram, Revision 144.1.2 5379-03498, Hagan Wiring Diagram, Revision 164.1.3 5379-03499, Hagan Wiring Diagram, Revision 174.1.4 HBR2-11135, RTGB Panel C - Annunciator Section, Sheet 2, Revision I4.1.5 HBR2-1 [135, RTGB Panel C - Vertical Section, Sheet 3, Revision 04.1.6 5379-03440, Steam Generator Level Control and Protection System, Revision 104.1.7 5379-03485, Hagan Wiring Diagram, Revision 194.1.8 5379-03486, Hagan Wiring Diagram, Revision 194.1.9 5379-03487, Hagan Wiring Diagram, Revision 19
4.2 CALCUILTATIONS
4.2.1 RNP-E-1.005, 120 VAC Instrument Bus Voltage Evaluation, Revision 24.2.2 RNP-M/MECH-1651, Containment Analysis Inputs, Revision 104.2.3 RNP-IJINST-1040, Main Steam Flow Accuracy and Scaling Calculation, Revision 34.2.4 RNP-M/MECH-1616, Calculation for the Continuous Calorimetric, Revision 14.2.5 RNP-MIMECH-1741, 32-5015594-00 Appendix K Power Uprate Operating
Conditions, Revision 04.2.6 RNP-I/lNST-1 125, ERFIS Feed Flow Automatic Calorimetric Uncertainty
Calculation, Revision 3
4.3 REGu ILATORY DOCI ENTIS
4.3.1 None
4.4 TECHNICAL. MANUALS
4.4.1 728-589-13, Vendor Manual Hagan, Revision 224.4.2 728-399-88, AuxiliaTy Indicating Meters Bulletin Model 2500 2520, Revision 24.4.3 728-012-10, Vendor Manual Rosemount, Revision 25
Computed By: Date: CAROLINA POWER & LIGHT COMPANYCalculation ID:WV. Poben Smith 08 / 28 / 02 AOUAWE&LI OPNYRNI'-VIN.T-1C041
Checked By: Date: CALCULATON SHEET Pg.1I of 93 RCV: 3
Bob Hunter 08128 / 02
Project No.: N/A File:
Project Tritl N/A
Calculation Title: Feedwater Ilow Loop Uncertainty and Scaling Calculation
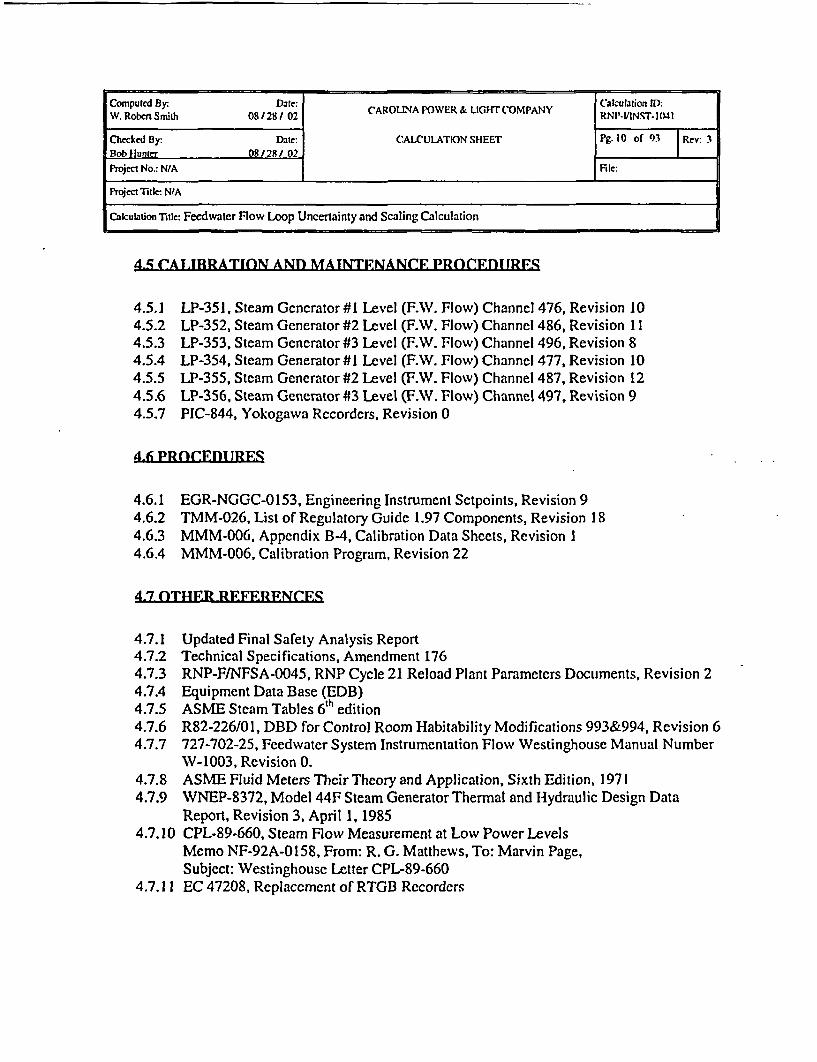
4-5 CATIRRATION AND MATNTFNANCF PROCEnlTRFS
4.5.1 LP-351, Steam Generator#1 Level (F.W. Flow) Channel 476, Revision 104.5.2 LP-352, Steam Generator #2 Level (F.W. Flow) Channel 486, Revision 114.5.3 LP-353, Steam Generator #3 Level (F.W. Flow) Channel 496, Revision 84.5.4 LP-354, Steam Generator #1 Level (F.W. Flow) Channel 477, Revision 104.5.5 LP-355, Steam Generator #2 Level (F.W. Flow) Channel 487, Revision 124.5.6 LP-356, Steam Generator #3 Level (F.W. Flow) Channel 497, Revision 94.5.7 PIC-844, Yokogawa Recorders, Revision 0
4.6 PROCDFD IRES
4.6.1 EGR-NGGC-0153, Engineering Instrument Setpoints, Revision 94.6.2 TMM-026, List of Regulatory Guide 1.97 Components, Revision I 84.6.3 MMM-006, Appendix B4, Calibration Data Sheets, Revision 14.6.4 MMM-006, Calibration Program, Revision 22
4.7 OTHFR RE RERFNCES
4.7.1 Updated Final Safety Analysis Report4.7.2 Technical Specifications, Amendment 1764.7.3 RNP-F/NFSA-0045, RNP Cycle 21 Reload Plant Parameters Documents, Revision 24.7.4 Equipment Data Base (EDB)4.7.5 ASME Steam Tables 6'h edition4.7.6 R82-226/01, DBD for Control Room Habitability Modifications 993&994, Revision 64.7.7 727-702-25, Feedwater System Instrumentation Flow Westinghouse Manual Number
W-1003, Revision 0.4.7.8 ASME Fluid Meters Their Theory and Application, Sixth Edition, 19714.7.9 WNEP-8372, Model 44F Steam Generator Thermal and Hydraulic Design Data
Report, Revision 3, April 1, 19854.7.10 CPL-89-660, Steam Flow Measurement at Low Power Levels
Memo NF-92A-0158, From: R. G. Matthews, To: Marvin Page,Subject: Westinghouse Letter CPL-89-660
4.7.11 EC 47208, Replacement of RTGB Recorders

Computed By: Date: CAON OE IHCMAYCalculation ID-IW. Roben Smith 08 28/ 02 CAROUINA POWER & LIGHT COMPANY RNP.VINST 041
Checked By Date: CALCULATION SHEET Pg. II Of 93 Rev: 3Bob Hunter 08/ 28/ 02
Project No.: NIA File:
Project Title: N/A
Ccui Title rtdwater Flow Loop Uncertainty and Scaling Calculation
4.7.12 DBD/R87038/SDO6, Design Basis Document, Reactor Safeguards and ProtectionSystem, Revision 5
4.7.13 EC 47152, Ultrasonic Feedwater Flow Measurement4.7.14 EC 47162, Set-points, Uncertainty Calc. Changes For Appendix K Uprate4.7.15 EC 47160, NSSS AND BOP ANALYSIS TO SUPPORT APPENDIX K UPRATE,
Design Section, Para. F.5.7.p
5Q INPN ITS AND ASCT TMPTIONS
5.1 The accuracy of a typical test resistor is on the order of ± 0.01%. Therefore, the testresistors used during calibration are assumed to have a negligible impact on the overalluncertainty calculation.
5.2 Per Reference 4.7.6, the ambient temperature in the Control Room varies from 70 0F to77 0F during operation. The calibration temperature for the indicator and recorder isassumed to be 60 0F. Therefore, a change in temperature of 170F (9.4 0C) is used tocompute the indicator and recorder temperature effects.
5.3 Per Reference 4.7.4, the pressure transmitters are located in the Turbine Building. TheTurbine Building is an open structure. The minimum temperature used to compute thetransmitter temperature effect is assumed to be 330Ev, because the transmitters are locatedin thermostatically controlled enclosures. Per Reference 4.7.1, the maximum temperaturein the Turbine Building is 107 0F.
5.4 Per Reference 4.6.1, reference accuracy typically includes the effects of linearity,hysteresis, and repeatability. The indicator reference accuracy given in Reference 4.4.2 isassumed to include the effects of linearity, hysteresis, and repeatability. The recorderreference accuracy is also assumed to include the effects of linearity, hysteresis, andrepeatability.
5.5 Per References 4.5.1 through 4.5.6, the I/V module is calibrated as part of a string. PerReference 4.4.1, the I/V module is a resistor. Resistors typically experience negligibledrift. Therefore, any resistor drift throughout the fuel cycle is negligible and is accountedfor during the string calibration.
Computed By: Date: CAROLINA POWER & LIGHT COM PANYCalculation D.W. Robert Smiih 08 /28 /02 COLAPWR&IGTOPNYRNP-VINST-1041
Checked By: Date: CALCULATION SHEET Pg 12 Of 93 Rcv7 3
Bob Hunter 08/28/ 02 IProect No.: N/A IIFe:
Prect Title: N/A
Calculation Title: Feedwater Flow Loop Uncertainty and Scaling Calculation
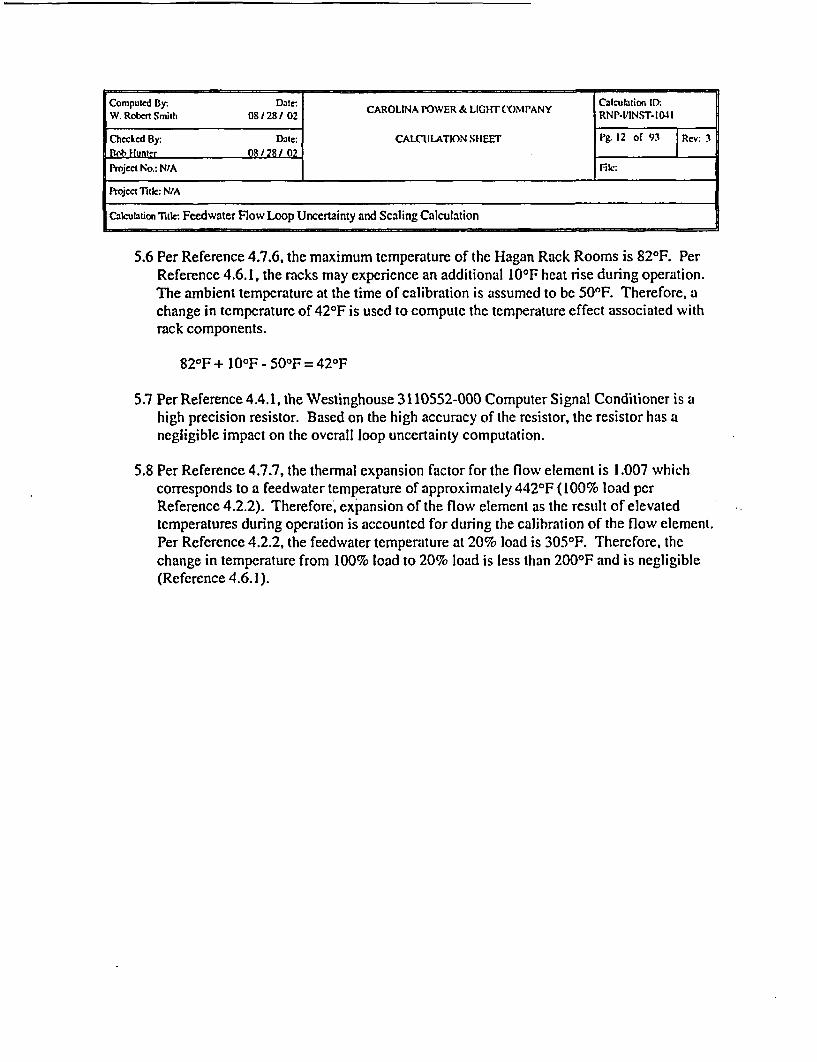
5.6 Per Reference 4.7.6, the maximum temperature of the Hagan Rack Rooms is 82 0F. PerReference 4.6.1, the racks may experience an additional 10F heat rise during operation.The ambient temperature at the time of calibration is assumed to be 50WF. Therefore, achange in temperature of 42 0F is used to compute the temperature effect associated withrack components.
82 0F + 10F - 50F = 42 0F
5.7 Per Reference 4.4.1, the Westinghouse 3110552-000 Computer Signal Conditioner is ahigh precision resistor. Based on the high accuracy of the resistor, the resistor has anegligible impact on the overall loop uncertainty computation.
5.8 Per Reference 4.7.7, the thermal expansion factor for the flow element is 1.007 whichcorresponds to a feedwater temperature of approximately 442 0F (100% load perReference 4.2.2). Therefore, expansion of the flow element as the result of elevatedtemperatures during operation is accounted for during the calibration of the flow element.Per Reference 4.2.2, the feedwater temperature at 20% load is 3050F. Therefore, thechange in temperature from 100% load to 20% load is less than 200OF and is negligible(Reference 4.6. 1).

Computed By- Date: CAROLINA POWER & LIGHTCONIPANY Calculation ID).W.Robert Smith 081281 02 RNP-VINSTI1I04
Checked By. Date: CALCULATION SHEET P. 13 Of 93 Rev: 3Bob tHunter 08 128 1 02 1
Project No.: N/A File:
Project riic: N/A
Calculation Title: Feedwater Flow Loop Uncerainty and Scaling Calculation
5.9 Per Reference 4.7.8, the following equation is used to compute the theoretical flowthrough a nozzle venturi:
m = 3 5 8 .9{CYd2F. e
where,
m =
C =Y =d =Fa =D =
* e =P =AP =
mass flow rate (lbm I hr)discharge coefficient (unit less)expansion factor (I for water)bore diameter (in)thermal expansion factor (unit less)pipe diameter (in)beta ratio (unit less ratio d / 1))fluid density (Ibm / ft3)differential pressure (inwc)
If all variables are treated as constants except density (p) and differential pressure (AP),the flow equation is simplified as follows:
m = Kp/
For calibration conditions, the flow equation is as follows:
mC= Kpp
For operating conditions, the flow equation is as follows:
mN = Kjp APN
Assuming a constant mass flow rate for calibration and operating conditions, thefollowing equation is written:
mN = mc

Computed By: Dale: CAROLINA POWER & LIGHT COMPANY Cakulalitm In:W. Robert Smith 081/281 02 RNP.VINS`17-1041
Checked By: Date: CALCULATIONSHEET ig 14 Or 93 F ReCv:Bob tlunter 08 /28 / 02Project No.: N/A Fi Ie
Project Title: N/A
CalculGtion Title: Feedwater Flow Loop Uncertainty and Scaling Calculation
Therefore,
KS for Ap yed the fpoowneqaon
Solving for ASPN yields the following equation:
pN =( PcVpPN)
The process measurement effect, expressed in terms of % AP Span, due to changes in -feedwater density from those assumed for calibration is obtained with the followingequation:
PMIEDENSrrY (% AP Span) = Ap( AP, I100%APSpan = PN J 100%APSpanAP Span ) AP Span
Therefore,
C -1 PC S 00 pPMEDENSrrY (% AP Span) = Pspa J00vA~a
The uncertainty equation may be simplified by using the following relationship betweendifferential pressure and flow:
00 AP = 100( Flow(% Flow Span)YAP Span 100%

Computed By: Ditc: Calculition ID:W.Rober Syith 08/28 1 02 CAROLINA POWER & LIGHT COMPANY RNPaVINST1041
Checked By: Date: CALCULATION SHEET rg. IS .f (3 Rcv: 3Rob Hunter 08 /28/ 02Project No.: N/A File:
Promjctltie: N/A
Calculation Title. Feedwater Flow Loop Uncertainty and Scaling Calculation
Therefore,
( pc YFo( lw Span)<PMEDENSrrY (% AP Span) = 100%fLIY Flow(% Flow
ViqNk 100%J
5.10 Per Reference 4.6.1, the normalized relationship between flow and differentialpressure is given by the following equation:
F = /i1A-P
The equation used to convert bias uncertainties from % AP Span to % Flow Span isderived using perturbation methods. The flow equation with uncertainties in thedifferential pressure and flow terms is,
F + f= P+dpwhere,
F = actual flow (% Flow Span)f = flow uncertainty (% Flow Span)AP = differential pressure (% AP Span)dp = differential pressure uncertainty (% AP Span)
Taking the difference between the two equations given above yields the following,
F + f - F = AP+dp- f =A - f AP.
The equation given above is simplified by using the normalized relationship betweenflow and differential pressure as follows,
*f = j 7+dp-F
* - Multiply by a factor of 100 to obtain % Flow Span
Computed By: Date: CAROLINA POWER & LlGHTCOMPANY Calculation ID):Wi. Robent Smith 0 / 28 1 02 ARLNPOE&LCITOMAYRNP-1IINST.1041I
Checked By: Date: CALCULATION SHEET Pg. 16 of 93 Rev: 3Bob furntic 08128/ 02 l
Project No.: N/A IIi
Project Title: N/A
Calculation Title: Feedwater Flow Loop Uncertainty and Scaling Calculation
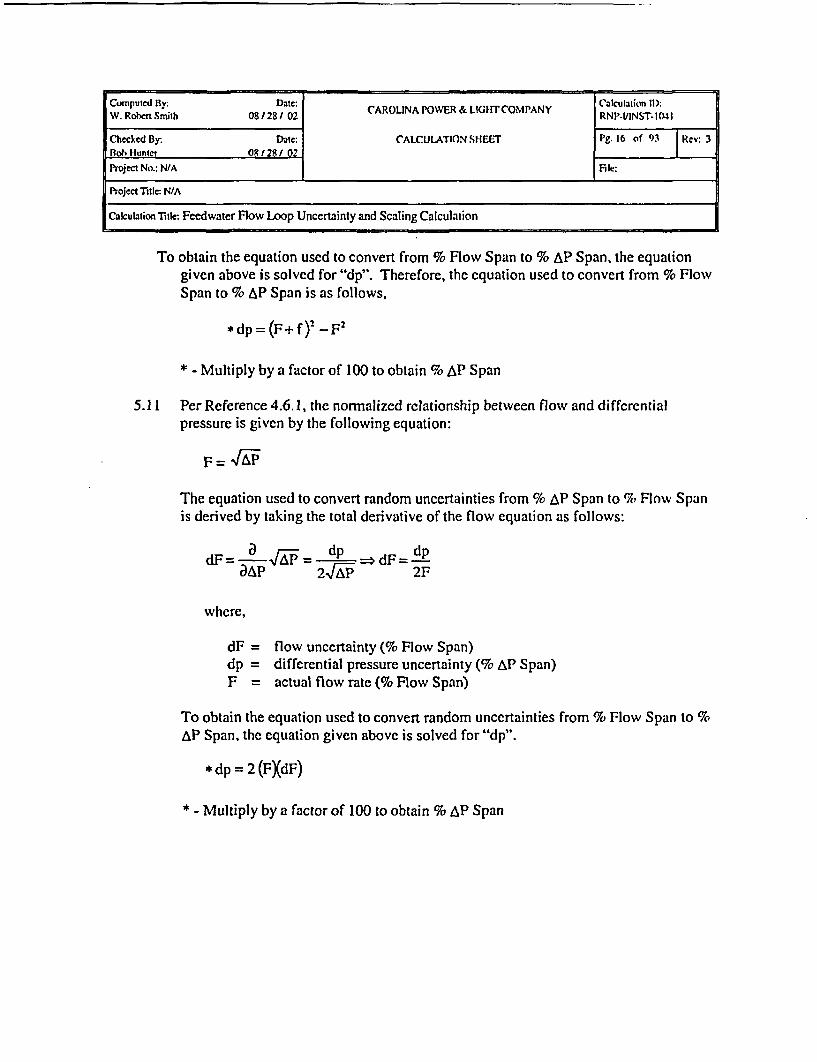
To obtain the equation used to convert from % Flow Span to % AP Span, the equationgiven above is solved for "dp". Therefore, the equation used to convert from % FlowSpan to % AP Span is as follows,
* dp = (F+ f)2 - F2
* - Multiply by a factor of 100 to obtain % AP Span
5.11 Per Reference 4.6.1, the normalized relationship between flow and differentialpressure is given by the following equation:
F =A
The equation used to convert random uncertainties from % AP Span to %, Flow Spanis derived by taking the total derivative of the flow equation as follows:
dF= i= -Pp =dF= dpaAP 2 2F
where,
dF = flow uncertainty (% Flow Span)dp = differential pressure uncertainty (% AP Span)F = actual flow rate (% Flow Span)
To obtain the equation used to convert random uncertainties from % Flow Span to %AP Span, the equation given above is solved for "dp".
* dp = 2 (FXdF)
* - Multiply by a factor of 100 to obtain % AP Span

Computed By: Date: CAROLINA P)WER & LIGHT COMPANY Cakulation ID:W. Robert Smith 08 /281 02 RNP4VINST-1041I
Cbccked By: Date: CALCULATION SHEEFT Pg. 17 of 93 Rev: 3Bob Hunter 0 8281 021Project Na: N/A I File:
Projectl Thk: N/A
Cakulation Title: Feedwater Flow Loop Uncertainty and Scaling Calculation
5.12 Per Reference 4.7.8. the following equation is used to compute the theoretical flowthrough a nozzle venturi:
m = 358.9 CYd 2 F
where,
m = mass flow rate (Ibm / hr)C = discharge coefficient (unit less)Y = expansion factor (I for water)d = bore diameter (in)F,= thermal expansion factor (unit less)D = pipe diameter (in)13 = beta ratio (unit less ratio d / D)p = fluid density (lbm / ft3 )AP = differential pressure (inwc)
If all variables are treated as constants except differential pressure (AP) and the flowcoefficient (K), the flow equation is simplified as follows:
m = KjIp
For calibration conditions, the flow equation is as follows:
mc= Kc
For operating conditions, the flow equation is as follows:
mN = KN4OW
Assuming a constant mass flow rate for calibration and operating conditions, thefollowing equation is written:
MN= mc
Comnputed By- Daite: Calculation IL).W. Roe Smith 08/28/02 C(AROLINAPOWER& LIiIrTCOMPANY RNC-'INST.1043
Checked By: Date: CALCULATION SHEET Pg. Is of 93 Rev: 3Elob Hunter 08 /32 / 02Project No.: N/A File:
Project Title: N/A
Calculation Title: Peedwater Flow Loop Uncertainty and Scaling Calculation
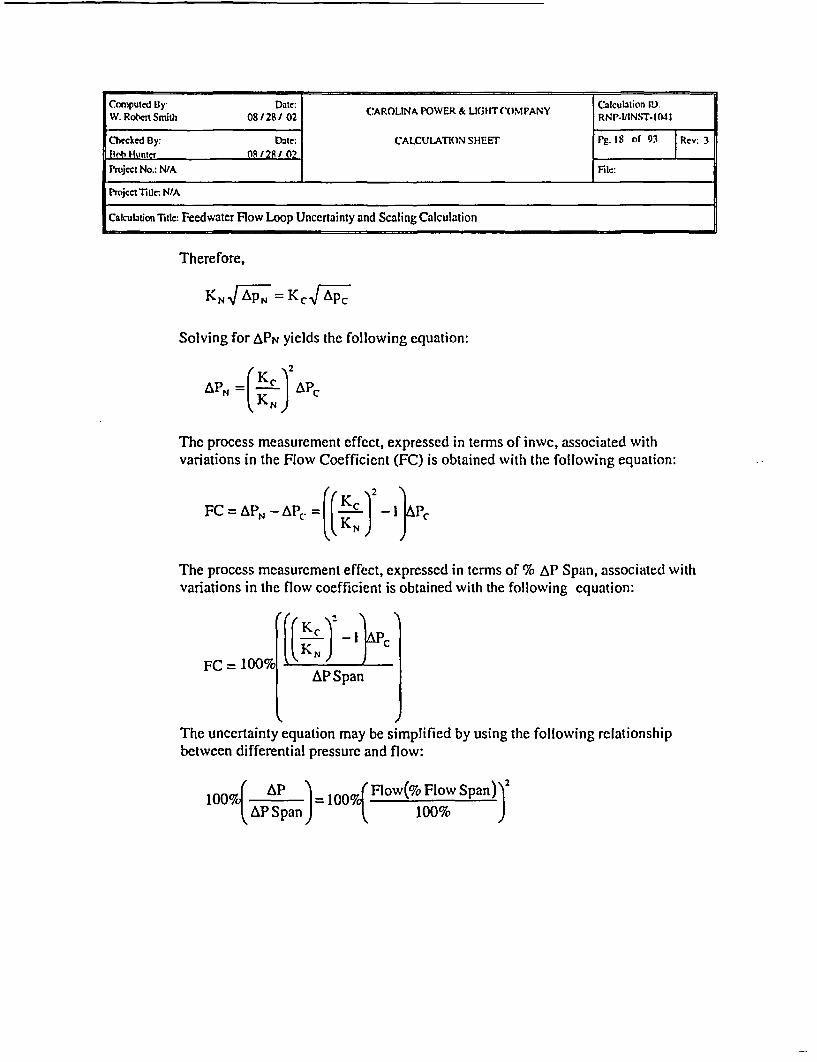
Therefore,
KNW-= KC-p
Solving for APN yields the following equation:
APN = Le- APCKN
The process measurement effect, expressed in terms of inwc, associated withvariations in the Flow Coefficient (FC) is obtained with the following equation:
FC =AP ((K 2 _
The process measurement effect, expressed in terms of % AP Span, associated withvariations in the flow coefficient is obtained with the following equation:
FC = 100%
F YI
KN)
AP Span
The uncertainty equation may be simplified by using the following relationshipbetween differential pressure and flow:
100%( AP Flow(% Flow Span) 2
AP Span) 0 100% )
Computed By: Date: CRLNPOE LGITOMAYCalculation ID:W.Ro Smith 0828/ CAROLINAWER&L-IITCMPANY NPINST-1041
IChecked By: Dalc: CALCULATION SHEET Pg 19 of 93 Rev 3Bob Hunter 08/28/ 02 l
Project No.: N/A File
Poccl Title: N/A
Calculation Title: Feedwater Flow Loop Uncertainty and Scaling Calculation
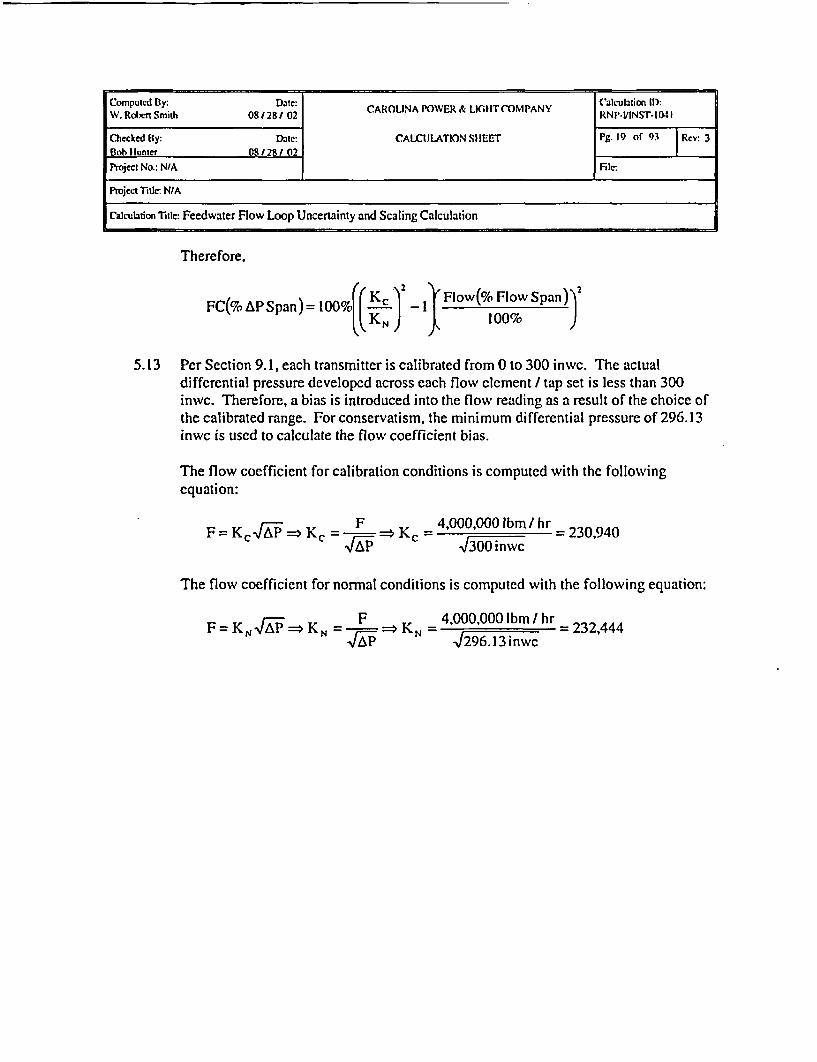
Therefore,
Kc '_ Flow(% Flow Span )FC(%7,K AP Span) = tO0%( -K 3 100%
5.13 Per Section 9. 1, each transmitter is calibrated from 0 to 300 inwc. The actualdifferential pressure developed across each flow element I tap set is less than 300inwc. Therefore, a bias is introduced into the flow reading as a result of the choice ofthe calibrated range. For conservatism, the minimum differential pressure of 296.13inwc is used to calculate the flow coefficient bias.
The flow coefficient for calibration conditions is computed with the followingequation:
F=K,.rA=>Kc- F =*Kc =4,000,000 Ibm / hr = 230,940
I300 inwc
The flow coefficient for normal conditions is computed with the following equation:
F=KNlw =* KN =F 4,000,000 Ibm/ hr -232,444.,rA-p 429 6. 13 i-nw c
Compued By: Date: /: CAROLINA POWER & UGT COMPANY Calcultion ID:W. Robert Smith 03 /281 02 CAOIAI(~~ t~CMAYRNP-IIINST- 1041
Checked By: Date: CALCULATIONSHEET Pg. 20 of 93 Rev: 3Bob Hunter 08 128 1 02Project No.: N/A File:
Project Title: N/A
CIculation Title: Feedwater Flow Loop Uncertainty and Scaling Calculation
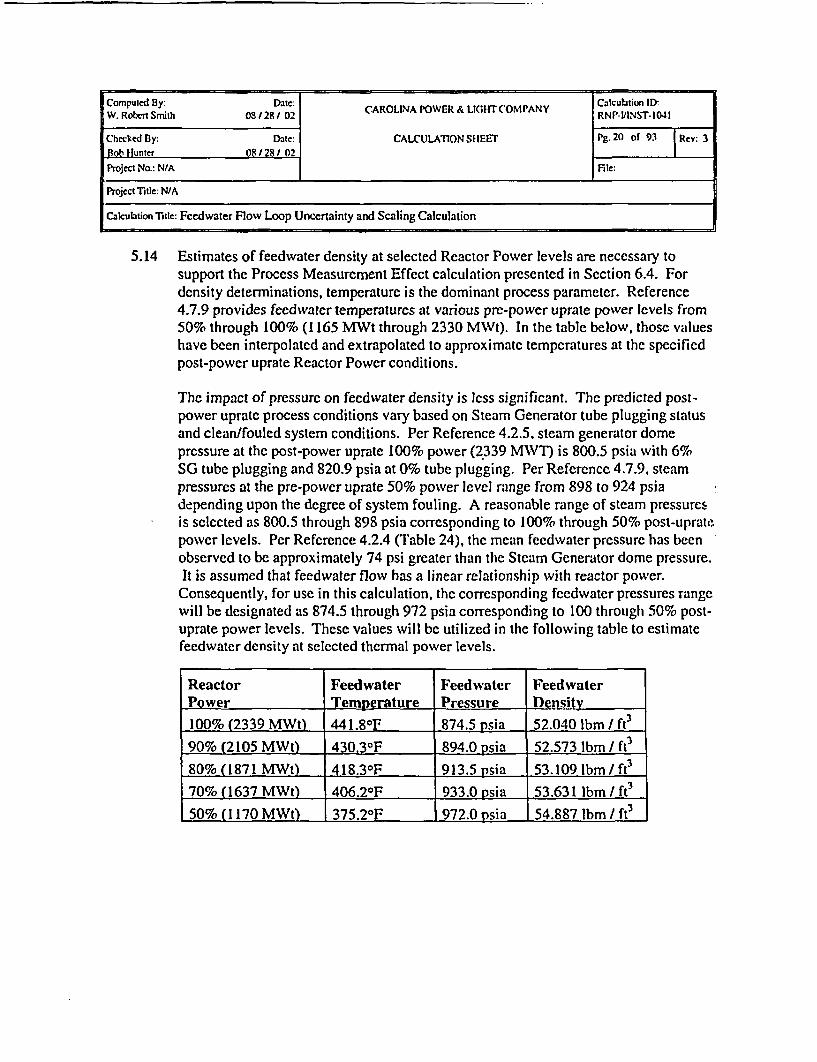
5.14 Estimates of feedwater density at selected Reactor Power levels are necessary tosupport the Process Measurement Effect calculation presented in Section 6.4. Fordensity determinations, temperature is the dominant process parameter. Reference4.7.9 provides feedwater temperatures at various pre-power uprate power levels from50% through 100% (1165 MWt through 2330 MWt). In the table below, those valueshave been interpolated and extrapolated to approximate temperatures at the specifiedpost-power uprate Reactor Power conditions.
The impact of pressure on feedwater density is less significant. The predicted post-power uprate process conditions vary based on Steam Generator tube plugging statusand clean/fouled system conditions. Per Reference 4.2.5, steam generator domepressure at the post-power uprate 100% power (2339 MWT) is 800.5 psia with 6%SG tube plugging and 820.9 psia at 0% tube plugging. Per Reference 4.7.9, steampressures at the pre-power uprate 50% power level range from 898 to 924 psiadepending upon the degree of system fouling. A reasonable range of steam pressuresis selected as 800.5 through 898 psia corresponding to 100% through 50% post-upratCpower levels. Per Reference 4.2.4 (Table 24), the mean feedwater pressure has beenobserved to be approximately 74 psi greater than the Steam Generator dome pressure.It is assumed that feedwater flow has a linear relationship with reactor power.
Consequently, for use in this calculation, the corresponding feedwater pressures rangewill be designated as 874.5 through 972 psia corresponding to 100 through 50% post-uprate power levels. These values will be utilized in the following table to estimatefeedwater density at selected thermal power levels.
Reactor Feedwater Feedwater FeedwaterPower Temperature Pressure Densiy100% (2339 MWt) 441.8oF 874.5 psia 52.040 Ibm / ft3
90% (2105 MWt) 430.30F 894.0 psia 52.573 ibm / fW80% (1871 MWt) 418.30F 913.5 psia 53.109 Ibm / ft3
70% (1637 MWt 406.20F 933.0 psia 53.631 Ibm / ft3
50% (1170 MWt) 375.20F 972.0 psia 54.887 Ibm/ ft3

Comnputed By: Date- Cak-u1ation ID:W. Robert Smi:h 08128/ 02 CAROLINA POWER & LIGI1T COMPANY RNP-'INST-104m
Checked By. Date: CALCULATION SHEET Pg 21 of 93cBob Hunter 08 12R1 02Proj; t No.: N/A Ftdc:
Project Title: N/A
Calculationritle: Feedwater Flow Loop Uncertainty and Scaling Calculation
5.15 Per Reference 4.7.9, the maximum steam pressure over the operating range of interest(>50%)occurs at 50% power (924 psia). Adjusting this by the 74 psi steam/feedwaterpressure difference discussed in Design Input 5.14 yields a maximum feedwaterpressure of 998 psia (983.3 psig). For conservatism, a maximum static pressure of1010 psig will be used to compute the transmitter static pressure effect.
5.16 Per Reference 4.7.10, the current Technical Specification setpoint analytical limit isassumed to be 40% of full steam flow (mismatch). Per Reference 4.2.3, nominalsteam flow at 100% power is 3.43x10⁶ Ibm / hr. Therefore, the TechnicalSpecification setpoint analytical limit is 1.372x10⁶ Ibm / hr (40% of 3.43x10⁶ Ibm /hr). Per Section 9.1, the calibrated flow span is 4x10 Ibm / hr. Therefore, theTechnical Specification setpoint analytical limit for the steam flow / feedwater flowmismatch reactor trip setpoint is 34.3% Flow Span (also see Reference 4.7.15).
The steam flow greater than feedwater flow alarm associated with these instrumentloops serves to alert the operator that a steam flow / fcedwatcr flow mismatch isapproaching the steam flow / feedwater flow mismatch reactor trip setpoint.Therefore, the limit for the alarm is the calibrated feedwater flow / steam flow tripsetpoint of 16% Flow Span (0.64 Vdc /4Vdc * 100) (References 4.5.1 through 4.5.6).
The feedwater flow greater than steam now alarm associated with these instrumentloops serves to alert the operator that feedwater flow has exceeded steam flow. Thereis no specific requirement for this setpoint. Therefore, the limit for this alarm setpointis assumed to be equal to the analytical limit for the steam flow / feedwater flowmismatch reactor trip setpoint of 34.3% Flow Span.
5.17 The digital recorder scale is programmable and variable. It is assumed that theresolution is no less than 0.Olxl6 Ibm/hr.
Computed By: Date: CAROLINA POWER & LIGHT COMPANY Calculation ID:W. Robert Smith 0 / 28 / 02 RNP.L'1NST-1041
Checked By: Datc: CALCULATION SHEET PS 22 of 93 Rev: 3Bob Hunter 08 /28 / 02 l
Projec No.: NIA File:
Project Title: N/A
Calculation Titlc- Feedwater Flow Loop Uncertainty and Scaling Calculalion
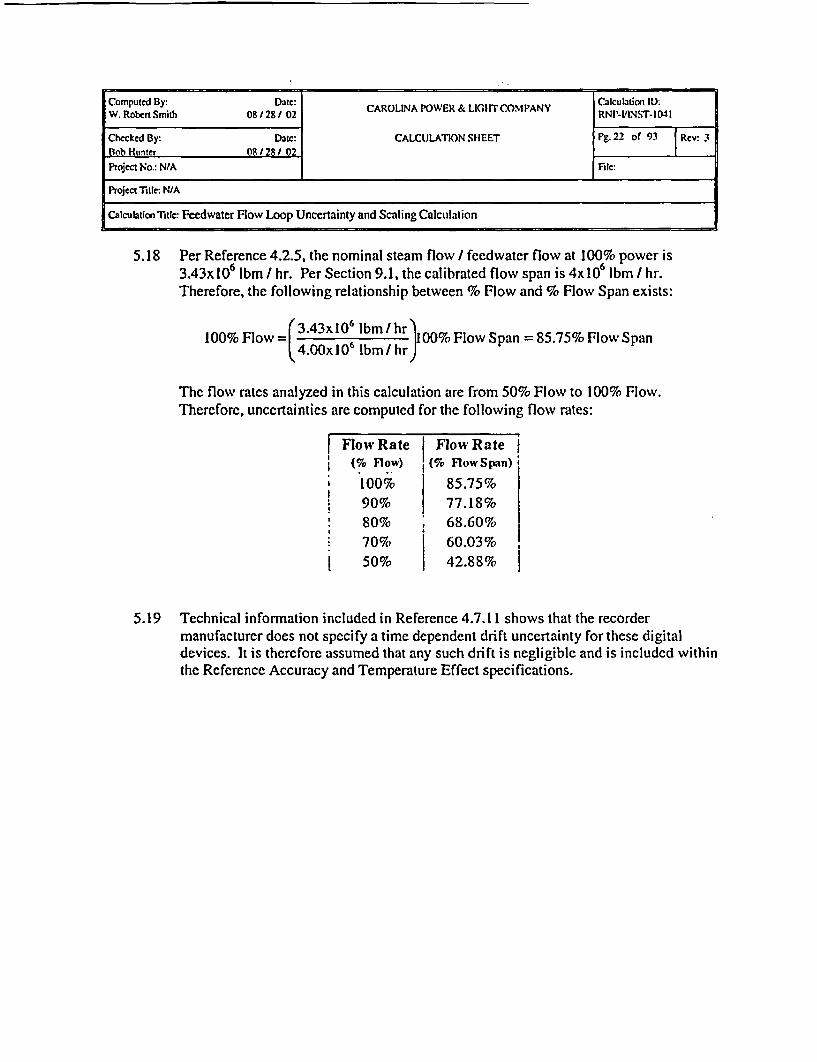
5.18 Per Reference 4.2.5, the nominal steam flow / fecdwater flow at 100% power is3.43x10 ibm I hr. Per Section 9.1, the calibrated flow span is 4x10 Ibm / hr.Therefore, the following relationship between % Flow and % Flow Span exists:
100%Flow= 3.43x10⁶ Ibm /hr 00% Flow Span = 85.75% Flow Span4.00x 106 Ibm / hr)
The flow rates analyzed in this calculation are from 50% Flow to 100% Flow.Therefore, uncertainties are computed for the following flow rates:
I Flow Rate( (% Flow)
i 100%
90%80%70%50%
| Flow Rate(% FlowSpan)
85.75%77.18%68.60%60.03%42.88%
5.19 Technical information included in Reference 4.7.11 shows that the recordermanufacturer does not specify a time dependent drift uncertainty for these digitaldevices. It is therefore assumed that any such drift is negligible and is included withinthe Reference Accuracy and Temperature Effect specifications.

Computed By: Date: CAROLINA POWER & LIGIarCOMPANY ' alculation 11):W. Robert Smith 08128 / 02 CAOIAPWR&LGICMAYRNP-VINST.1041
Checked By: Date: CALCULATION SHEET Pg. 23 of 93 Rev: 3Bob lunter 08128/ 02 l
Project No.: N/A File:
Project Title: N/A
Calculaion Title: Feedwater Flow Loop Uncertainty and Scaling Calculation
6-0 CALCULATION OF 1NCERTAINTY CONTRIBUITORS
6i1 ACCIDENT FEFFECTS (AF)
Per Reference 4.6.2, the indication I recording functions provided by each loop are notrequired post accident. Therefore, accident effects are not computed for the indication /recording functions.
The transmitters in each loop are located in the Turbine Building and are not exposed toadverse environmental conditions during an accident. Therefore, loop uncertainties arecomputed for normal environmental conditions only.
6.1 SEISMIC EFFECT (UF)
The steam flow I feedwater flow mismatch function is required to operate following a seismicevent. Therefore, seismic uncertainties are computed for this function.
The ERRIS, indication, and recorder uncertainties do not include seismic effects.
Per References 4.7.4, FT-476, FT-486, and 496 are Rosemount Model 115 1DP5 transmitters.Per Reference 4.4.3, the transmitter seismic effect (SExmtr) is ± 0.25% URL.
Per References 4.7.4, FT-477, and 487 are Rosemount Model 1153DA5 transmitters. PerReference 4.4.3, the transmitter seismic effect (SExmtr) is ± 0.50% URL.
Per References 4.7.4, FI497 is a Rosemount Model 1153HA5 transmitter. Per Reference4.4.3, the transmitter seismic effect (SExmtr) is ± 0.50% URL.
For conservatism, a seismic effect of ± 0.50% URL is used for all transmitters. Per Section9.1, the calibrated span of each loop is 300 inwc. Therefore,
0 750inwc 100%SpanSExmr = ± 0100%URL 300inwc J
SEmir = ± 1.25% AP Span

Computed By. Date: CARUAME IGThMAYCIculation ID:W. Robert Smith 08/28/ 02 C ER & L COM YRNP-VINST-1041
Checked By Date: CALClULAION SHEEr Pg.24 of 93 Rev: 3Bobh Hunter 08/28 / 02 l
Project No.: N/A File:
Project Title: N/A
Calcultion Title: Feedwater Flow Loop Uncertainty and Scaling Calculation
6-3 JNSIT. ATION RF1SSTANCE ERROR (THR
These loops are not required to mitigate any event which results in degraded signal cabling.Therefore, Insulation Resistance (IR) effects are not applicable.
6-4 PROCESS MEASI REMENT FRROR (PME)
6.4.1 PrnceqC MPenmir-Pment Frrnr - Nnrmnl Environment
Denseity Ffer
Per Design Input 5.9. the following equation is used to compute process measurement effectsassociated with changes in feedwater density:
Flow(% Flow Span) 2PMEDENsnr (% tAP Span) = I 00% - K( 100%
Per Design Input 5.10, the following equation is used to convert the process measurementeffect from % AP Span to % Flow Span:
PMEDENSrrY (% Flow Span) = 100(F 2+ PME DENSITY (% AP Span) - F)
Note: The decimal fraction for the flow rate and uncertainty is used in the equation.
Per Reference 4.7.7, the following fluid density is assumed for calibration:
PC = 52.0502 Ibm I ft3 (855 psia, 4421F)

Computed By Dute. (' Mculatinn II):W. Robcrt Snith 08/281 02 CAROLINA l'ER& LIO~CON1PANY RNP-VINST-1(41
Checked By. Date: CALCULATION SHEET Pg. 25 of 93 Rcv: 3ob Huniter 08 /28 / 02 1
Projcct No.: N/A I File:
Project Title: N/A
Calculationi Title. Feedwater Flow Loop Uncertainty and Scaling Calculation
Per Design Input 5.14 and 5.18, the following fluid densities and flow rates are used tocompute process measurement effects:
pl00%
p90%p80%p70%
p5O%
= 52.040 Ibm / ft3
= 52.573 Ibm ( ft3
= 53.109 lbm / ft3
= 53.631 Ibm / ft3
= 54.887 Ibm ( ft3
Flow Rate PMEDENSrY PMEDENSIrY(% FlowSpan) (% AP Span) (% Flow Span)
85.75% 0.01% 0.01%77.18% -0.59% -0.38%,68.60% -0.94% -0.69%60.03% -1.06% 9 -0.89%42.88% -0.95% - -1.12%
Piping Etffe
If the minimum upstream and downstream piping requirements are met, an installation effectbias of ± 0.50% Flow Reading should be included in the loop uncertainty calculation(Reference 4.6.1). If the minimum upstream and downstream piping requirements are notmet, an additional bias ± 0.50% Flow Reading should be applied. For conservatism, it isassumed that the minimum upstream and downstream piping requirements are not met.Therefore,
PMEi'IPI'N (% Flow Span) = +1.00% Flow Reading -1.00% Flow Reading
Per Design Input 5.10, the following equation is used to convert bias uncertainties from %Flow Span to % AP Span:
PMEPIPING (% AP Span) = l00((F+ PN'EPIPING (% Flow Span)) - F2)
Note: The decimal fraction for the flow rate and uncertainty is used in the equation.

Computed By: Date: CAROLINA POWER & LIGHT COMPANY Calculititn IDW. Robert Smith 08128/ 02 RNPIVINST-1041
Checked By: Date: CALCUJLATK)N SHEET P. 26 of 93RevBob Hunter 08/281 02Projcct No.: N/A File:
Project Title: N/A
Calculation Title: Feedwater Flow Loop Uncertainty and Scaling Calculation
Therefore, the process measurement effect due to the piping configuration is as follows:
Flow Rate PMEPIPING PMEpIPING PMErIpLNG PMEPIPING(% FlowSpan) (% FlowSpan) (% FlowSpan) (% APSpan) (% AP Span)
85.75% 0.86% -0.86% 1.48% -1.46%77.18% 0.77% -0.77% 1.20% -1.19%68.60% 0.69% -0.69% 0.95% -0.94%60.03% 0.60% -0.60% 1 0.72% -0.72%42.88% 0.43% -0.43% 0.37% -0.37%
Therrnml Fxpnnsinn Effects
Per Design Input 5.8, thermal expansion effects are negligible.
f-4.22 Prnrepc Mnetcirempnt Errnr - Aecidlent Envirrnmrnt
Per Section 6.1, accident effects are not considered for these loops.
6ha PRIMARY ELEFMENT FRRORJ (PF)
Primory Flement AenirircLy
Per Reference 4.7.7, rigorous testing was performed on the flow elements, and special designcriteria were used to minimize measurement errors. Calibration parameters and flow elementuncertainties were determined through detailed testing and analysis. Per Reference 4.7.7, theflow element has an accuracy of ± 0.25% Flow Reading. Therefore,
PE (% Flow Span) = ± 0.25% Flow Reading
Computed By: Date: CAROLINA POWER & LIGHT COMclPANY RNI'uIt.Nm II):WV. Robcnt Smith 031/ 281 02 CRLA OVE&LII1cPAY jRNP-LtINST- 1041
Checked By- Date: CALCULATION SHEET Pg 27 of 93
Bob Hunter 08/28 / 02Project No.: N/A I Flc:
Prjecct Title: N/A
Cakulation Tttle. Feedwater Flow Loop Uncertainty and Scaling Calculation
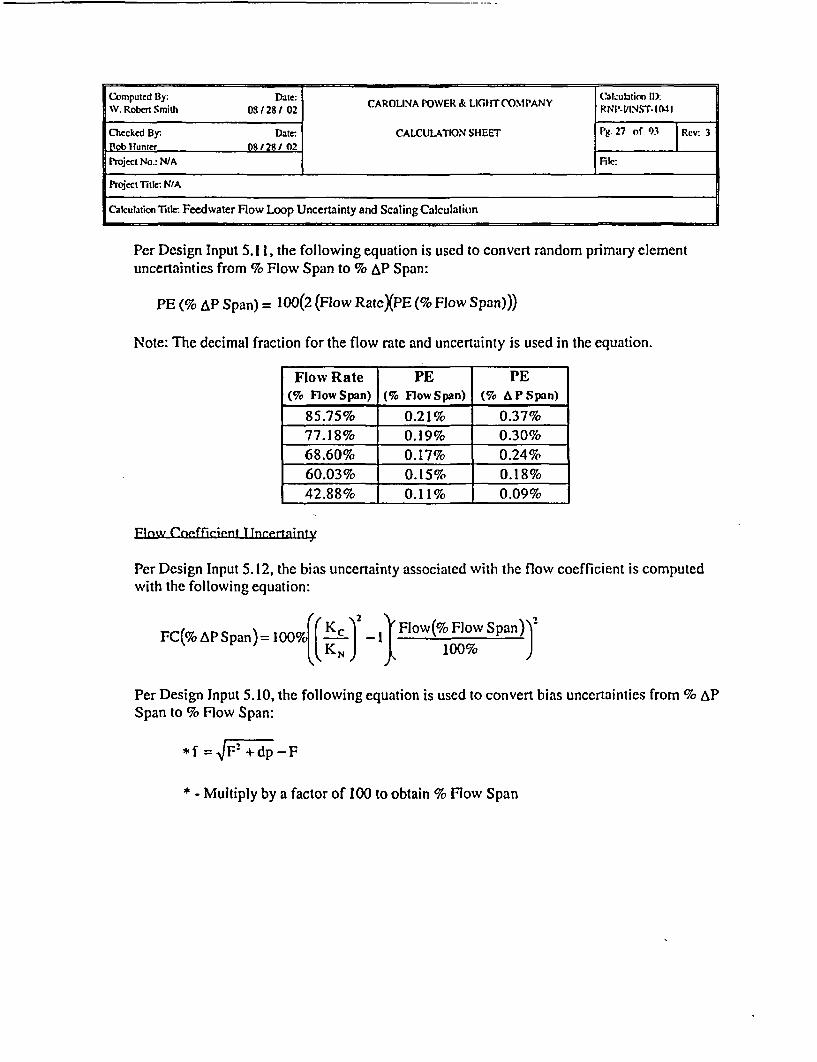
Per Design Input 5.1 1, the following equation is used to convert random primary elementuncertainties from % Flow Span to % AP Span:
PE (% AP Span) = 100(2 (Flow RateXPE (% Flow Span)))
Note: The decimal fraction for the flow rate and uncertainty is used in the equation.
Flow Rate PE PE(% FlowSpan) (% FlowSpan) (% APSpan)
85.75% 0.21% 0.37%77.18% 0.19% 0.30%68.60% 0.17% 0.24%60.03% 0.15% 0.18%42.88% 0.11% 0.09%
Flow (Cevxfficient I Incertainty
Per Design Input 5.12, the bias uncertainty associated with the flow coefficient is computedwith the following equation:
FC(% ALP Span) = l"o(Kc) _ Flow(% F low Span))
Per Design Input 5.10, the following equation is used to convert bias uncertainties from % APSpan to % Flow Span:
*f = | dp - F
* - Multiply by a factor of 100 to obtain % Flow Span

Computed By: Date: CAROLIA POWER & LIGHTCOMPANY Ltiun IDW. Robert Smith 08128 / 02 CAOIAPWR&LGTCMAYRNP-VINST- 1041I
Checked By* Date: CALCULATIONSHEET Pg 28 of 93 Rev: 3Bob Hunter 08 /28 /02ProjCct No.: N/A File:
Project Tite. N/A
Calculation ri- Feedwater Flow Loop Uncertainty and Scaling Calculation
Per Design Input 5.13, the flow coefficient for calibration (Kc) is 230,940, and the flowcoefficient for normal operation (KN) is 232,444. Therefore,
Flow Rate FC FC(% FlowSpan) (% APSpan) (% FlowSpan)
85.75% -0.95% -0.55%77.18% -0.77% -0.50%
68.60% -0.61% -0.44%60.03% -0.46% -0.39%42.88% _ -0.24% -0.28%
6-6 TRANSMI1TTER (FT.497. ROSEMOINIT 1153HA . 51
6.6-1 Transmitter's Invprifipd Attribpitpgs nf Refirenre Acu-itrawy (RA.,m,)
Per Reference 4.4.3, the reference accuracy of the transmitter is + 0.25% Span and includesthe effects of linearity, hysteresis, and repeatability. Per References 4.6.3 and 4.6.4, thetransmitter is calibrated to + 0.50% Span at nine points (5 up and 4 down). Therefore, thecalibration procedure verifies the attributes of linearity and hysteresis but not repeatability.Per Reference 4.6.1, the following equation is utilized to compute the repeatability portion ofthe transmitter reference accuracy:
RA ~ 0.25% SpaniRepeatability = = ± + 0.214p% Span
Therefore,
RAxmtr = ± 0.14% AP Span
Comnputed Biy: E6te: .Calculation fly.W. Roben Snmilh 08/28/ 02 CAROLINA POWER & LUG1rCOMPANY RNP-fNSTl1041
Checked By Date: CALCULATK)N SHEET P. 29 of 93 Rev: 3BIoh Hunter 08/28 / 02Project No.: NIA File:
Project Title: NIA
Calculation Title: Feedwater Flow Loop Uncertainty and Scaling Calculation
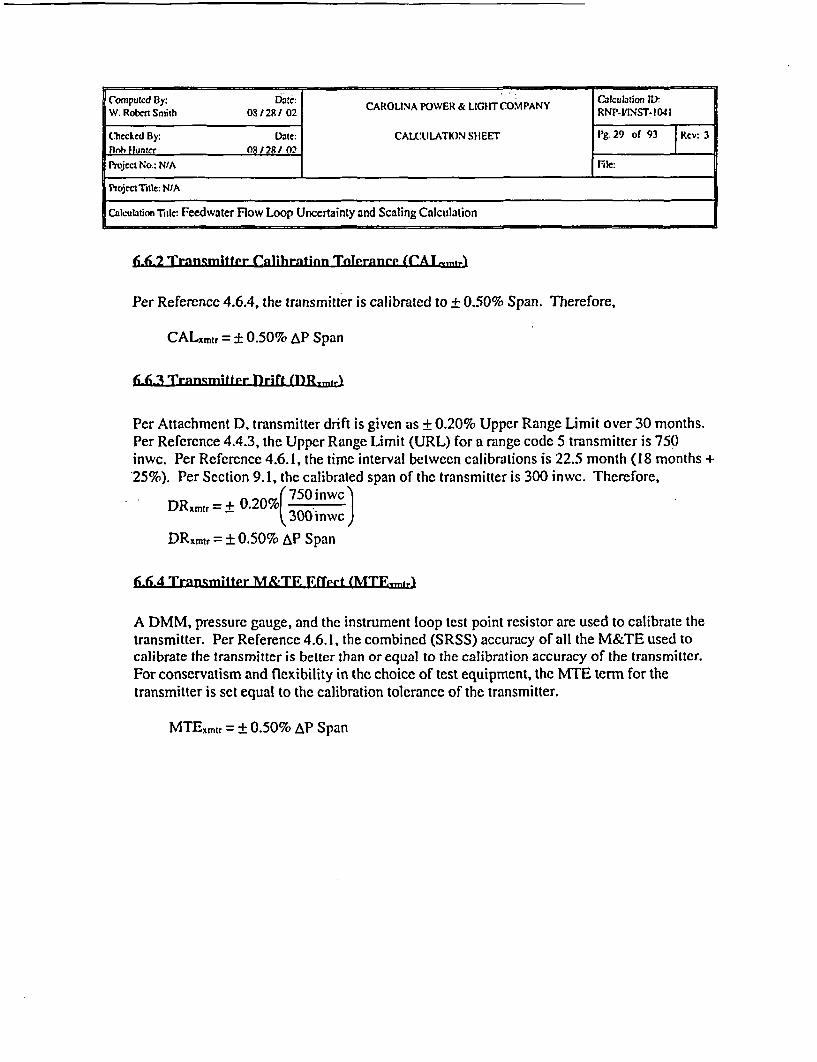
6-662 Trnngmittpr Crilihritinn Tn1eranr-e (CA!.,
Per Reference 4.6.4, the transmitter is calibrated to ± 0.50% Span. Therefore,
CALxmtr = ± 0.50% AP Span
6i6fi.3 Transmitter Drift (DR.tJ
Per Attachment D, transmitter drift is given as + 0.20% Upper Range Limit over 30 months.Per Reference 4.4.3, the Upper Range Limit (URL) for a range code 5 transmitter is 750inwc. Per Reference 4.6.1, the time interval between calibrations is 22.5 month (18 months +25%). Per Section 9. 1, the calibrated span of the transmitter is 300 inwc. Therefore,
_ (750 inwcDRxmtr = + 0.20%( 300 inwc JDRxmtr = + 0.50% AP Span
6.6.4 Trnrnsmitter M&TE ffeclt (MTF m
A DMM, pressure gauge, and the instrument loop test point resistor are used to calibrate thetransmitter. Per Reference 4.6.1, the combined (SRSS) accuracy of all the M&TE used tocalibrate the transmitter is better than or equal to the calibration accuracy of the transmitter.For conservatism and flexibility in the choice of test equipment, the MTE term for thetransmitter is set equal to the calibration tolerance of the transmitter.
MTExmtr = ± 0.50% AP Span

Computed By: Date: |CAROLINA POWER & LCGrcoMPANY Calculation ID:W. Robert Smith 08 /28 / 02 CRLNPOE& I.TNPAYRNP-VINST-1041
Checked By: Date: CALCLATION SHEET Pg 30 of 93 |Rcv 3Bob Hunter 08128 1 02 l
Project No: NIA File:
Project Title: N/A
aculation itle: Feedwater Flow Loop Unwertainty and Scaling Calculation
6-6.5 Trgrnsmitter Timperaitire Tlffset (T&,#,1
Per Reference 4.4.3, the transmitter temperature effect is given as + 0.75% Upper RangeLimit + 0.50% Span for a change in temperature of I 00 0F from the temperature at which thetransmitter was calibrated. Per Reference 4.4.3, the Upper Range Limit (URL) for a rangecode 5 transmitter is 750 inwc. Per Section 9. 1, the span of the transmitter is 300 inwc. PerReference 4.6.3, the transmitters are located in the Turbine Building, and the minimum andmaximum Turbine Building temperatures are 33 0F and 107 0F respectively (Design Input5.3). Therefore, a maximum change in temperature of 74 0F (107OF - 33 0F) is used tocalculate the transmitter temperature effect. Therefore,
(750 inwc 74cFTEx mt -+0.75%j I +0.50%Span Imr _ 300inwc) 1000F
TExmtr = _ 1.76% AP Span
6-6.6 Trnnsmitter .Sfttie PrPq,,rP lflprt (FPIfmpA
Per Reference 4.4.3, a static pressure span effect of -1.0% Upper Range Limit per 1000 psi isspecified for the transmitter. Per Section 9. 1, the static pressure span effect is systematic andcan be calibrated out. Therefore, the static pressure span effect is equal to the span shiftuncertainty of ± 0.25% Upper Range Limit per I000 psi.
Per Reference 4.4.3, the static pressure zero effect is specified as + 2.0% Upper Range Limitper 4500 psi. Per Design Input 5.15, the maximum static pressure across the transmitter is1010 psi. Per Reference 4.4.3, the Upper Range Limit (URL) of a range code 5 transmitter is750 inwc. The span of the transmitter is 300 inwc (Section 9.1). Therefore, the total StaticPressure Effect (SPE) is computed as follows:
SPEx +t[O.25 750inw l 1l1psi H+ I2.00~ 750inwc '1 l1lpsi300 inwc 1000 psi 300 inwc L 4500 psi
SPExmtr = ± 1.29% AP Span

Computed By: Dati: Cafcubition ID:W.Robdn Smith 08128102 CAROLINA POWER & LIGHTCOMIPANY RNP-VINST-1041
Checked By: Date: CALCULATION SHEET Pg.31 of)93 Rev: 3Bob Hunter 08128102
Project No.: N/A Filc:
Pfject Title: N/A
Cilcubtion Title: Feedwater Flow Loop Uncertainty and Scaling Calculation
6-6-7 Transmitter Ppwer. 5ipply FfTect (PSF .t,
Per Reference 4.4.3, the power supply effect associated with the transmitters is given as ±0.005% Span per volt variation in power supplied to the transmitter from the power suppliedat the time of calibration. Per Reference 4.4.1, each instrument loop is powered by a Model137-121 45 Vdc supply or an NUS SPS-801 power supply. The power supply is powered byregulated instrument buses per Reference 4.2.1. Therefore, the power supply effect isnegligible.
PSExmtr = N/A
66S Transmitfpr Total Dpvieo I Ineprtainty (Tfl1 1,,
Total Device Uncertainty for normal environmental conditions is computed using thefollowing equation:
TDUxmtr= ± I(CAL.rn, + MTE-,,,t,) 2 + RA a DR nbu2 + TE xtn 2 + SPExnil2
TDUxmtr = ± 2.46% AP Span
6. 49 Transmitter As Fnitndl Tnlierinee (AFTa.r)
Per Reference 4.6.1, the As Found Tolerance (AFT) is computed using the followingequation:
AFTxmtr = ± VCALXQ +DR r 2 + MTEQVW2
AFTxmtr = ± 0.87% AP Span

Computed By Date: Calculation 11).W. Robert Smith 08128/ 02 RNP-41INST1041
Chccked By: Date: CALCULAMON SHEET Pg. 32 of 93 Rev: 3BOh Hunter 0812S/ 02 IProject No.: N/A File:
Project Title N/A
Calcutation Title: Feedwater Flow Loop Uncertainty and Scaling Calculation
fi-.610 Tranrmitfer Ac left Tn1Prnnce (A1.T mt4L
Per Reference 4.6.1, the As Left Tolerance (ALT) is computed using the following equation:
ALTxmtr = CALxmtrALTxmtr = ± 0.50% AP Span
Error Contributor Value Tvye Section
RA + 0.14% AP Span Random 6.6.1
CAL + 0.50% AP Span Random 6.6.2
DR + 0.50% AP Span Random 6.6.3
SPE +1.29% AP Span Random 6.6.6
MTE + 0.50% AP Span Random 6.6.4
TE + 1.76% AP Span Random 6.6.5
As Left Tolerance (ALT) + 0.50% AP Span Random 6.6.10
As Found Tolerance (AFTF) + 0.87% AP Span Random 6.6.9
Total Device Uncertainty ± 2.46% AP Span Random 6.6.8(non-accident)_
Transmitter Uncertainty Summary

Computed By: Da/2 : CAROLINA POWER & CK1il1COMPANY Calculation 11).W. Roben Smith 081281 02 CAOIAPWR 1HCMAYRNP-1/INST.1041
Checked By. Date: CALCULATION SHEET Pg. 33 of 93 |Rev 3Bob Hunter 08 /28/ 02 1Project No.: NIA File:
Project itle: N/A
Calculation T _tle- Feedwater now Loop Uncertainty and Scaling Calculation
6.7 TRANSMTTTFR (1T-477 AND F-497, ROSFMOT INT 1153flAS)
6i7.1 TrnsImitter's Tnverifiedr Attrihijtpq nf Reference Aeerllracy (RAm"t,.
Per Reference 4.4.3, the reference accuracy of the transmitter is ± 0.25% Span and includesthe effects of linearity, hysteresis, and repeatability. Per References 4.6.3 and 4.6.4, thetransmitter is calibrated to + 0.50% Span at nine points (5 up and 4 down). Therefore, thecalibration procedure verifies the attributes of linearity and hysteresis but not repeatability.Per Reference 4.6. 1, the following equation is utilized to compute the repeatability portion ofthe transmitter reference accuracy:
Repeatability =R t= 0.25 Span 0.14%Span
Therefore,
RAxmtr = ± 0. 14% AP Span
6-7.2 Trnngmittpr Cnlihrntinn Tolpranep (CAl.,ntrs
Per Reference 4.6.4, the transmitter is calibrated to + 0.50% Span. Therefore,
CALmtr = ± 0.50% AP Span
6.73 rrninsmittpr Drift (DR,,,,
Per Attachment D, transmitter drift is given as ± 0.20% Upper Range Limit over 30 months.Per Reference 4.4.3, the Upper Range Limit (URL) for a range code 5 transmitter is 750inwc. Per Reference 4.6.1, the time interval between calibrations is 22.5 month (18 months +25%). Per Section 9.1, the calibrated span of the transmitter is 300 inwc. Therefore,
DRxmtr = + 0.20%( 750 inwc300 inwc=
DRxmtr = ±0.50% AP Span

Computed By: 0/8 CAROLINA POWER& LIGHCOMPANY Calcutation 1l):W. Robcrt Smith 08 / 281/ 02 COLN WR&LIITOPAYRNI'.t(INST.1041
Checked Bly: Date: CALCULATION SHEET Pg. 34 Of 93 Rcv: 3Bob Hunter 08 /2/ 02 -(
PrNcct No.: N/A Fic:
Project Title: N/A
Calculation Taki: Feedwater Flow Loop Uncertainty and Scaling Calculation
6-7.4 Trnnsmitter M&TF FMfet (MTF,,mtr
A DMM, pressure gauge, and the instrument loop test point resistor are used to calibrate thetransmitter. Per Reference 4.6.1, the combined (SRSS) accuracy of all the M&TE used tocalibrate the transmitter is better than or equal to the calibration accuracy of the transmitter.For conservatism and flexibility in the choice of test equipment, the MTE term for thetransmitter is set equal to the calibration tolerance of the transmitter.
MTExmtr = ± 0.50% AP Span
6 .7-i TrnnrmittPr Tempprzituire F1ftett (TF,,,rtd
Per Reference 4.4.3, the transmitter temperature effect is given as + 0.75% Upper RangeLimit + 0.50% Span for a change in temperature of 1000F from the temperature at which thetransmitter was calibrated. Per Reference 4.4.3, the Upper Range Limit (URL) for a rangecode 5transmitter is 750 inwc. Per Section 9.1, the span of the transmitter is 300 inwc. PerReference 4.6.3, the transmitters are located in the Turbine Building, and the minimum andmaximum Turbine Building temperatures are 33WF and 107WF respectively (Design Input5.3). Therefore, a maximum change in temperature of 74WF (107 0F - 330W) is used tocalculate the transmitter temperature effect. Therefore,
TExmtr = 075%(5iw + 0.50% Span 7400F300 inwc 100eF
TExmr = ± 1.76% AP Span

Computwd By: Datc - CAROLiNA POWER i LlcilfnCOMPANY RNv Uin II:W. Robert Smith 08128 / 02 ARUA)E&L(ITOPAYRNPVI4/WINS-141
Checked By: Date: CALCULATION SHEET g- 35 of 9.R v 3Bob Hunter 08/281 02 l
Projcct No.: NtA File:
Project Title: NIA
Cakeutation Titl Feedwater Flow Loop Uncertainty and Scaling Calculation
6.7.6 TranqLnmitter Stntic Preqiirr Ffert (.PF.,.)
Per Reference 4.4.3, a static pressure span effect of -1.0% Upper Range Limit per 1000 psi isspecified for the transmitter. Per Section 9. 1, the static pressure span effect is systematic andcan be calibrated out. Therefore, the static pressure span effect is equal to the span shiftuncertainty of ± 0.25% Upper Range Limit per 1000 psi.
Per Reference 4.4.3, the static pressure zero effect is specified as ± 0.25% Upper Range Limitper 2000 psi. Per Design Input 5.15, the maximum static pressure across the transmitter is1010 psi. Per Reference 4.4.3, the Upper Range Limit (URL) of a range code 5 transmitter is750 inwc. The span of each transmitter is 300 inwc (Section 9. 1). Therefore, the total StaticPressure Effect (SPE) is computed as follows:
SPE,-+ 25%75°inwc 1010psi 0+ [0.25%(750inwc( 1010psi Hxm r-_ 1 300 inwc - 1000lpsi L 300inwc 2000psi
SPExmtr = 0.7 1% AP Span
6.7.7 Transmitter Pnwer Stlirly ffPct (P.F-xmi
Per Reference 4.4.3, the power supply effect associated with the transmitters is given as +0.005% Span per volt variation in power supplied to the transmitter from the power suppliedat the time of calibration. Per Reference 4.4.1, each instrument loop is powered by a Model137-121 45 Vdc supply or an NUS SPS-801 power supply. The power supply is powered byregulated instrument buses per Reference 4.2.1. Therefore, the power supply effect isnegligible.
PSExmtr = N/A
6.7-% TrnnsnmittPr Totnl lpvirp I JnrPrt-inty (TD1J ,,mr
Total Device Uncertainty for normal environmental conditions is computed using thefollowing equation:
TDUxmjr = ± V(CAL±,V,, + MTE,,tr )z + RA xlntr + DR xn~r2 + TEmug2 + SPEi.n..
TDUxmtr = ± 2.21% AP Span
Computed By: Date: Calculation ID:W Robit Smith 081 281 02 CAROLINA PO~WER & LIGHTCOMPANY RNP-VINST-1041
Checked lBy: Date: CALCULATION SHEET Pg. 36 Of 9i Rev: 3l3oh Hunter 081281 02
Project No.: N/A FIle:
Project Title: NIA
Calculation Tidle: Feedwalcr Flow Loop Uncertainty and Scaling Calculation
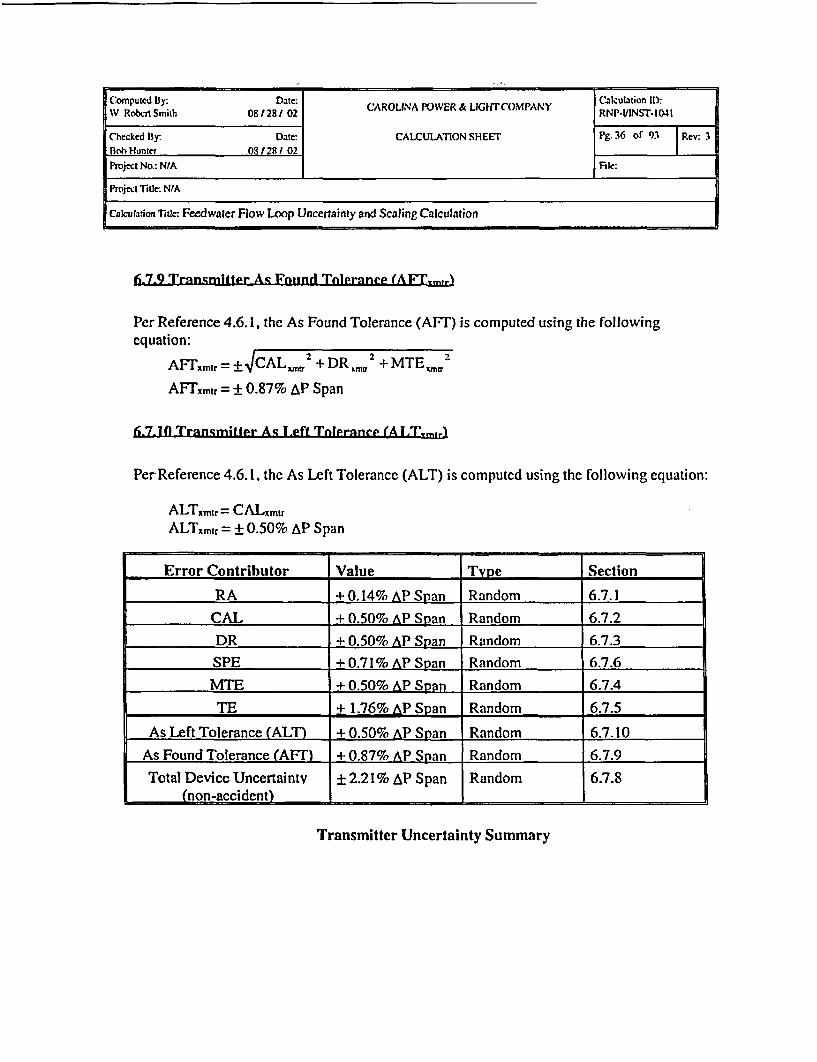
6.7.9 Trnnsmittpr As Fmind Toleranneg (AFTm
Per Reference 4.6.1, the As Found Tolerance (AFT') is computed using the followingequation:
AFrIxmr = ± VCALY 2 + DR xm¢2 + MTE 2
AFTxmtr = ± 0.87% AP Span
.7.1I Trannmitfpr As pleff Tnlersrne (ALTLM,.
Per-Reference 4.6.1, the As Left Tolerance (ALT) is computed using the following equation:
ALTxmtr = CALxmtrALTxmtr = ± 0.50% AP Span
Error Contributor Value Type Section
RA + 0.14% AP Span Random 6.7.1CAL + 0.50% AP Span Random 6.7.2DR + 0.50% AP Span Random 6.7.3SPE + 0.71% AP Span Random 6.7.6ME + 0.50% AP Span Random 6.7.4
TE + 1.76% AP Span Random 6.7.5
As Left Tolerance (ALT) + 0.50% AP Span Random 6.7.10
As Found Tolerance (AFT) + 0.87% AP Span Random 6.7.9
Total Device Uncertainty i 2.2 1% AP Span Random 6.7.8(no-acidnt
Transmitter Uncertainty Summary
Computed By- Date: CAROUNA POWER & Ll(IM1717!8MPANY C'alculation ID:W. Robert Smith 08/ 28/ 02 RNP-YINST.1041
(heckcd By: Date: CALCULATIoN SIEET Pg 37 of 93 Rev: 3Bob Hunter 08 / 28 / 02 .Project No.: N/A, Fil:
Project Title: N/A
Calclubtion Ttle Feedwater Flow Loop Uncertainty and Scaling Calculation
6 X TRAN5SMITTFR (FlT-476. hT-486 AND FT-496, ROISIM(IJNT Il 1 DPS1
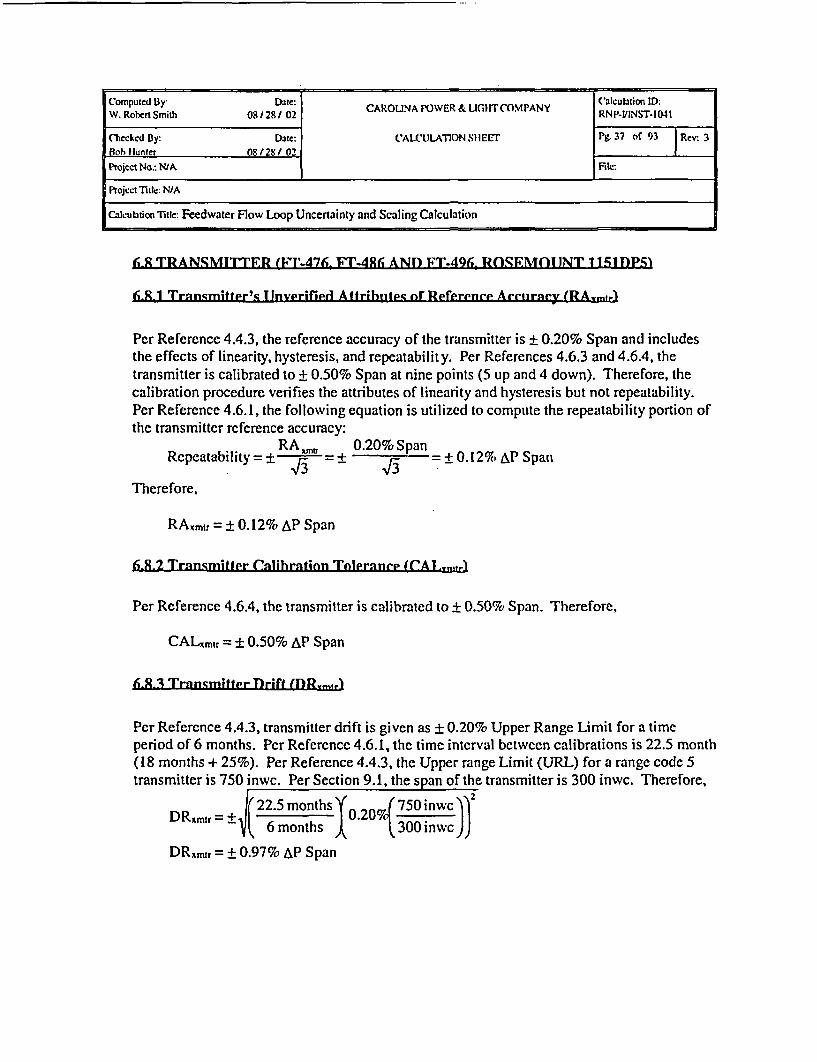
6lR-1 Transmittpr's I Inverified Attrihitep of Reference Acutlrnry (RAymtri
Per Reference 4.4.3, the reference accuracy of the transmitter is ± 0.20% Span and includesthe effects of linearity, hysteresis, and repeatability. Per References 4.6.3 and 4.6.4, thetransmitter is calibrated to + 0.50% Span at nine points (5 up and 4 down). Therefore, thecalibration procedure verifies the attributes of linearity and hysteresis but not repeatability.Per Reference 4.6.1, the following equation is utilized to compute the repeatability portion ofthe transmitter reference accuracy:
RA 0.20% SpanRepeatability=± "'=+-+0.1% PSa
Therefore,
RAxmtr = + 0.12% AP Span
6 .X2 Transmitipr Catlibrzation Talerance p(AL. ur)
Per Reference 4.6.4, the transmitter is calibrated to ± 0.50% Span. Therefore,
CALxmtr = ± 0.50% AP Span
68 R3 Transmitier Drift DR.r)
Per Reference 4.4.3, transmitter drift is given as ± 0.20% Upper Range Limit for a timeperiod of 6 months. Per Reference 4.6.1, the time interval between calibrations is 22.5 month(18 months + 25%). Per Reference 4.4.3, the Upper range Limit (URL) for a range code 5transmitter is 750 inwc. Per Section 9.1, the span of the transmitter is 300 inwc. Therefore,
DRxmtr = 22.5 months 0.20 750 inwct 6 months 300 inwc))
DRxmtr = ±0.97% AP Span

Computed By: CAROLINA POWER & LIGTrr( MPANY Calculation ID.W. Robert Smith 08/ 28 / 02 RNP-IIINS.W1041
Checked By: Date: C'ALCULAJON SHEET Pg1 38 of 93 Rev: 3Bob Hunter 08/ 28/ 02Project No.: N/A Fic:
ProjectTite: N/A
calculation rthc: Feedwater Flow Loop Uncertainty and Scaling Calculation
6 - 4 Transmitter M&TE FfhMet (MTF....r)
A DMM, pressure gauge, and the instrument loop test point resistor are used to calibrate thetransmitter. Per Reference 4.6.1, the combined (SRSS) accuracy of all the M&TE used tocalibrate the transmitter is better than or equal to the calibration accuracy of the transmitter.For conservatism and flexibility in the choice of test equipment, the MTE term for thetransmitter is set equal to the calibration tolerance of the transmitter.
MTExmtr = ± 0.50% AP Span
6 X 8 Trnnsmittpr Temperhtwrp Effer t (T&.tri)
Per Reference 4.4.3, the transmitter temperature effect is given as ± 1.00% Span at maximumspan (750 inwc) and ±3.50% Span (150 inwc) at minimum span for a change in temperatureof 1000F from the temperature at which the transmitter was calibrated. The temperatureeffect for the span of 300 inwc is obtained through linear interpolation to be + 2.88% Spanper 1000F. Per Reference 4.6.3, the transmitters are located in the Turbine Building, and theminimum and maximum Turbine building temperatures are 330 F and 107WF respectively(Design Input 5.3). Therefore, a maximum change in temperature of 741F (1070 F - 330F) isused to calculate the transmitter temperature effect. Therefore,
TExmtr = ± 2.88% Span AT)
TExmtr = ± 2-88% Span( 740 F + 2.13% AP SpanT~xmr+I 000F )
Compuited ay-. Date: AOIA OE .MTOPN Chh-uflaion U.W. Robert S-iih 08 / 2B/ 02 CAROLINA POWER Llrr(oMPANY I-_INST- 1041
Checked By: Date CALCUILATON SHEETr Pg. 39 of 93 Rev: 3Bob funter OR /28/ 02lProject No: N/AI File:
ProjectTitle: N/A
Calculation TitLe: Feedwater Flow Loop Uncertainty and Scaling Calculation
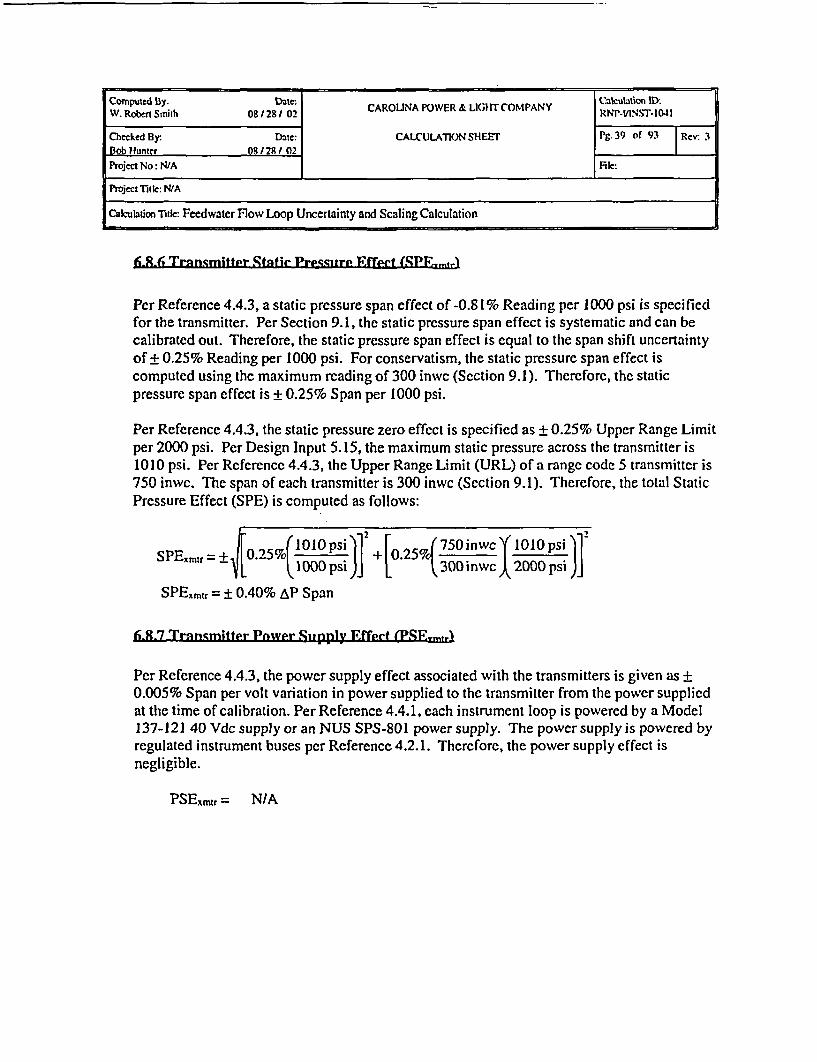
6-8-6 Trinnmittar Stiaic Prepcitre Effect f
Per Reference 4.4.3, a static pressure span effect of -0.8 1% Reading per 1000 psi is specifiedfor the transmitter. Per Section 9. 1, the static pressure span effect is systematic and can becalibrated out. Therefore, the static pressure span effect is equal to the span shift uncertaintyof + 0.25% Reading per 1000 psi. For conservatism, the static pressure span effect iscomputed using the maximum reading of 300 inwc (Section 9.1). Therefore, the staticpressure span effect is ± 0.25% Span per 1000 psi.
Per Reference 4.4.3, the static pressure zero effect is specified as ± 0.25% Upper Range Limitper 2000 psi. Per Design Input 5.15, the maximum static pressure across the transmitter is1010 psi. Per Reference 4.4.3, the Upper Range Limit (URL) of a range code 5 transmitter is750 inwc. The span of each transmitter is 300 inwc (Section 9.1). Therefore, the total StaticPressure Effect (SPE) is computed as follows:
.25 C 0lpsi [ 750inwc l01l psiSPExmtr .25 +o .25% I 1010 psi]
I OO psi l 300inwc 2000psiSPExmtr = ± 0.40% AP Span
6--.7 Trnnsmitter Pnwer Supply EffTrt (P.Fymtr'i
Per Reference 4.4.3, the power supply effect associated with the transmitters is given as +0.005% Span per volt variation in power supplied to the transmitter from the power suppliedat the time of calibration. Per Reference 4.4.1, each instrument loop is powered by a Model137-121 40 Vdc supply or an NUS SPS-801 power supply. The power supply is powered byregulated instrument buses per Reference 4.2.1. Therefore, the power supply effect isnegligible.
PSExmtr = NIA
Wnbputcd By. Deatc CAROLINA r()WER & LIGHT COMPANY Calculation IDW. Robert Smith 08 /28/ 02 RNP4IINS.WJ041
Checked By: Date: CALCULATION SHEET Pg. 40 Of 93 |RCev 3Bob Hunier 08128 1 02
Prtcct No.: NSA File:
Project Title: NtA
Caklcubtion title: Feedwater Flow Loop Uncertainty and Scaling Calculation
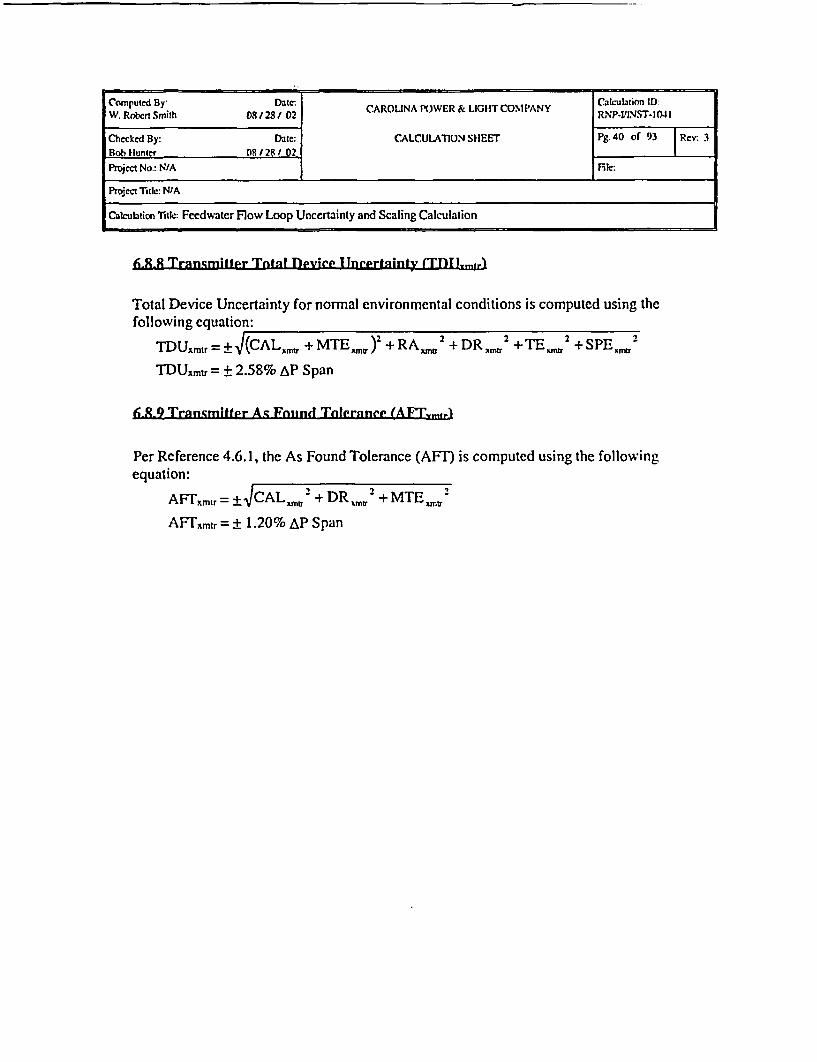
6- 8 TrnqnmittPr Tntnl Ipvyre I Tnrtertninty (TDTJlmf,)
Total Device Uncertainty for normal environmental conditions is computed using thefollowing equation:
TDUxmtr = +±V(CAL. + MTE .,) 2 + RA.,,, 2 + DR xintr 2 +TExrM 2 + SPE 2,T 2
TDUamut = ± 2.58% AP Span
6 - 9 Transmitftpr Ac Fmnind Tntpr.ancip (AMy,,,,ir
Per Reference 4.6.1, the As Found Tolerance (AFT) is computed using the followingequation:
AFTxmtr = ±VCALxnnr + DR xmnt + MTE xrctr
AFrxmtr = ± 1.20% AP Span
CoWRputcd By: Date: CAROLINA POWER & LIGHT COMPANY Calculationi ID.W. Robcrt Smith 08 /281 02 RNP-L/INS'I-041
Checked By. Date: CALCULATION SHEET Pg.41 Of 93 |RCV 3
Bob Hunter 08 /281 02Project No.: N/A Iile:
Project Titlc: N/A
Calculation Title: 1Feedwatcr Flow Loop Uncertainty and Scaling Calculat ion
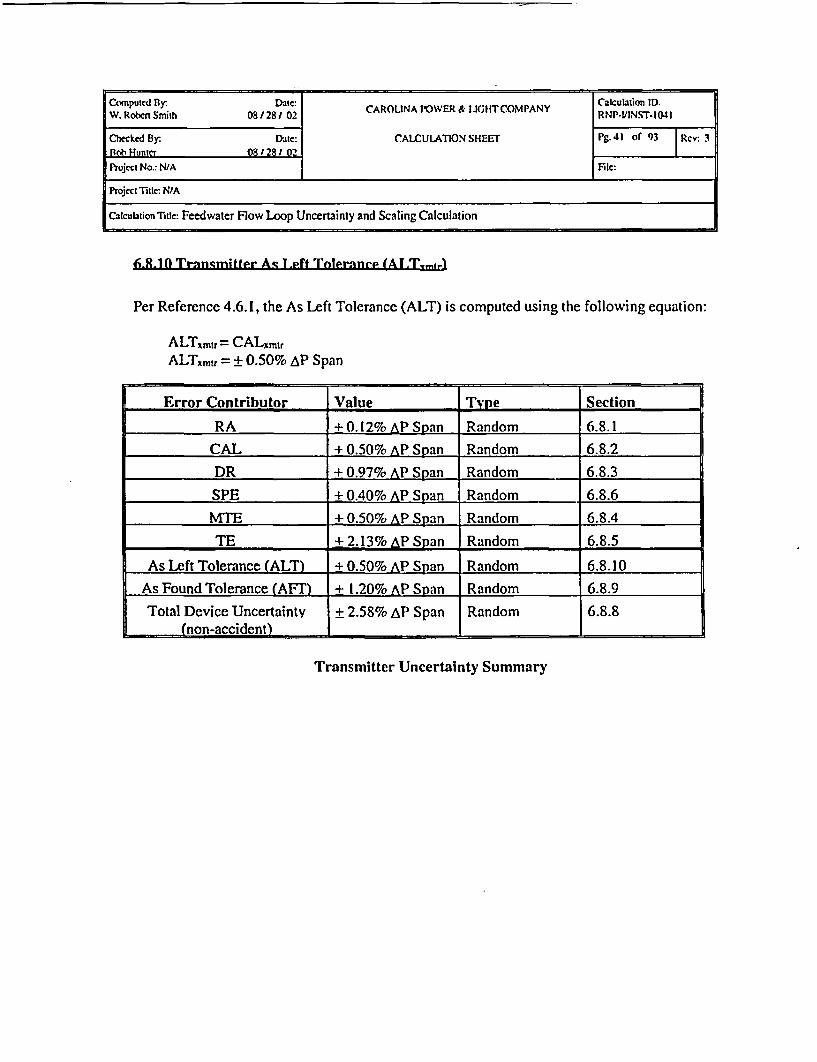
6-8-10 Transmitter As left Talgranep (AT MsJ
Per Reference 4.6.1, the As Left Tolerance (ALT) is computed using the following equation:
ALTxmtr = CALxmtrALTmtr = ± 0.50% AP Span
Error Contributor Value Tvpe Section
RA + 0. 12% AP Span Random 6.8.1
CAL + 0.50% AP Span Random 6.8.2
DR + 0.97% AP Span Random 6.8.3SPE + 0.40% AP Span Random 6.8.6
STE + 0.50% AP Span Random 6.8.4
TE + 2.13% AP Span Random 6.8.5
As Left Tolerance (ALT) + 0.50% AP Span Random 6.8.10
As Found Tolerance (AFT) + 1.20% AP Span Random 6.8.9
Total D vice Uncertaint + 2.58% AP Span Random 6.8.8(non-accident) _ P S Random 6.8.8
Transmitter Uncertainty Summary

Computed By: Da0e: CAROLLNA POWERC& LIGHTCaMPANY alculation ID:W. Robert Smith 08/28 / 02 ARLAPOE&LI;TC PNYRNP-VIN.ST.1041
Checked By: Date: CALCULATION SHEET Pg. 42 of 93 Rev: 3Bob Hunter 08/28 / 02 l
Project No.: N/A File:
Project Title: N/A
Calculation Title: Feedwater Flow Loop Uncertainty and Scaling Calculation
6.9 COMPARATOlR MODl TL E
6.9-1 Cnmparatnr's UInverified Attrihtites of Reference Acemirnry (RA ,
Per Reference 4.4.1, the comparator reference accuracy is ± 0.50% Span. Per Reference4.6.4, the comparator is calibrated to ± 0.50% Span, and the calibration procedure verifies theattributes of linearity and hysteresis but not repeatability. Per Reference 4.6.1, the followingequation is utilized to compute the repeatability portion of the comparator reference accuracy:
Repeatability = ± RAcoln = ± 0=50% Span = 0.29% Span
Therefore,
RAcomp = ± 0.29% Span
6-9.2 Compgrator C(nlihration Tnleranir (('Al...
Per Reference 4.6.4, the comparator is calibrated to + 0.50% Span. Therefore,
CALcomp = ± 0.50% Span
6-9(3 Cnmparntor Drift (DR,,nmp,
Per Reference 4.4.1, no drift is specified for the Hagan or NUS comparator. Per Reference4.6.1, if no drift is specified for a device, a default value of ± 1.00% Span may be used.Based on historical data, Hagan comparator drift is + 0.25% Span (Attachment B). If thedefault value bounds the value obtained through a review of the historical data, the defaultvalue of ± 1.00% Span may be used for comparator drift (Reference 4.6.1). Therefore, thedefault value of + 1.00% Span is used for comparator drift for the NUS and Hagancomparators.
DRcomp = ± 1.00% Span

C_.uw B: . ~ e . . ' ki.__ ._. IComputed By: Dae28 : 02 CAROLINA POWER & LKiHT COMPANY R lcutation 11):
Checkld By. Date: CALCULATION SHEET Pg. 43 of 93 Rcv: 3Bob Hunter 08 /289 02 .Pnrcci No.: NIA filEc
Projclt Tik: NWA
C2lculation itle: Feedwater Flow Loop Uncertainty and Scaling Calculation
6-9.4 Cnmpnrqfnr M&TF Effert (MTF..nmp')
Per Refcrences 4.5.1 through 4.5.6, one DMM with an accuracy of ± 0.25% Reading is usedto calibrate the comparator. For conservatism, a maximum reading of 5 Vdc is used tocompute the accuracy of the DMM as follows:
MTEcomp = (0.25% Readingt 4Vdc = + 0.31%1 Span
6-9-5 Conmparatnr Tempernhtire Effect (TF,,,Ep;
Per Reference 4.4.1, the NUS comparator temperature effect is given as + 0.04% Span per10C change in temperature from the temperature at the time of calibration, and notemperature effect is specified for the Hagan comparator. Per Reference 4.6.1, if notemperature effect is specified for a device, a default value of + 0.50% Span may be used forthe temperature effect. Per Design Input 5.6, a change in temperature of 42WF (23.330C) isused to compute the comparator temperature effect. Therefore,
TEcomp= + 0.04% Span (23.330C)
TEcomp ± 0.93% Span
Since either Westinghouse Ilagan or NUS comparator may be used, the most restrictivetemperature effect (NUS comparator) is used in this calculation.
6 -96 Compartoir Power Supply Effect (P.SFm..j
Per Reference 4.4.1, no uncertainty for the comparator power supply effect is specified.Since the comparators are powered by regulated instrument buses, the comparator powersupply effect is considered to be negligible. Therefore,
PSEcomp = NIA
omputed fly 0828/ 02 CAROLINA POWER & LIGHT COMPANY Calcultion TI)-1
Checked By Date: CALCULATION SHEET IPg.44 oF 93 Re.: 3Dob Hunter 08/28/02 _
Project No.: N/A Fulc:
Project Title: N/A
Calculation Titk: Feedwater Flow Loop Uncertainty and Scaling Calculation
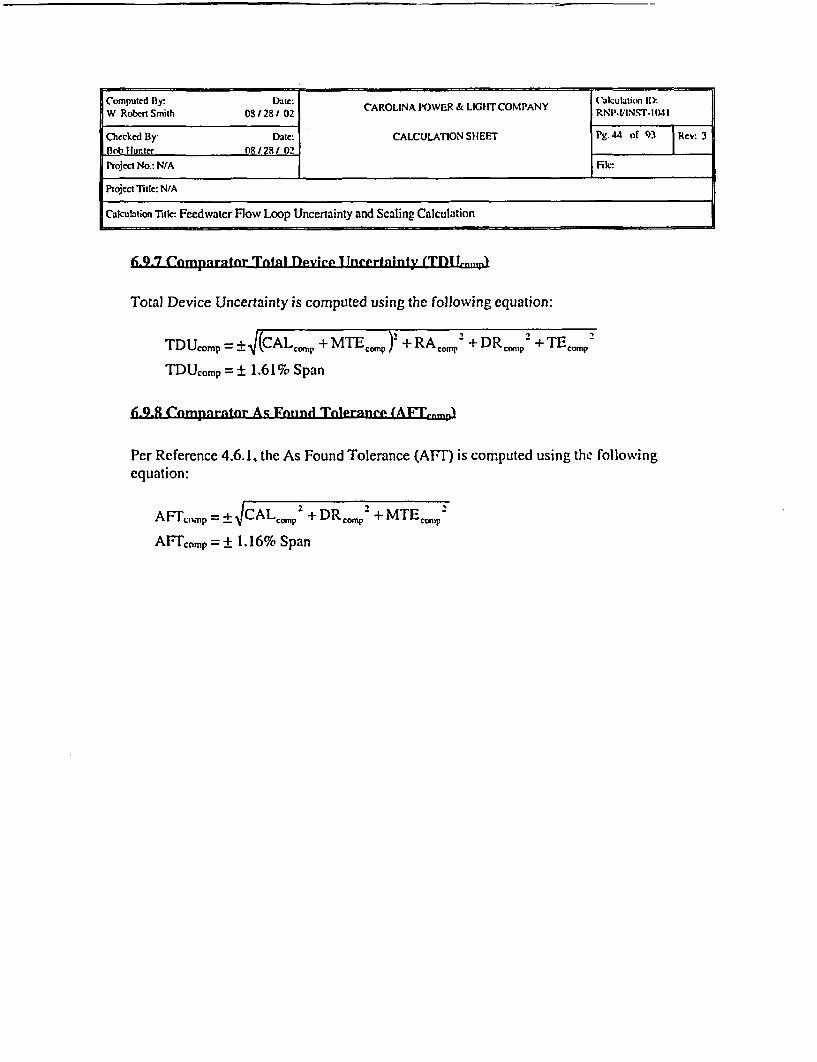
6.Q97 C-nmpir.rnr Total Dpvieyp IJncertainty (TnlM ..rn4a
Total Device Uncertainty is computed using the following equation:
TDUcomp = +_(CALcom, + MTEcmp )2+ RA,2 + DRco ' + TE 2
TDUcomp = ± 1.61% Span
6fi-8 Complaratnr As Fininnd Tnleraine, (AET4nmpl
Per Reference 4.6.1, the As Found Tolerance (AFT) is computed using the followingequation:
AF.=mp= ±VCAL ,mp2 +DR 2 + MTE 2Ali mp- =p _.nS
AF7c ...I,=± 1. 16% Span
Copue By: Dae Caclto IDCompute By:e 08/281 02 CAROLINA POWER & LIGHT COMPANY RNP.L'INSUT1041
Checked By: Date: CALCULATIONSIIEET Pg 45 of 9:3 Revr.3Bcb Huntert 0 281 02Project No.: N/A File:
Pwoject Title: N/A
Calculation Ttle: Feedwater Flow Loop Uncertainty and Scaling Calculation
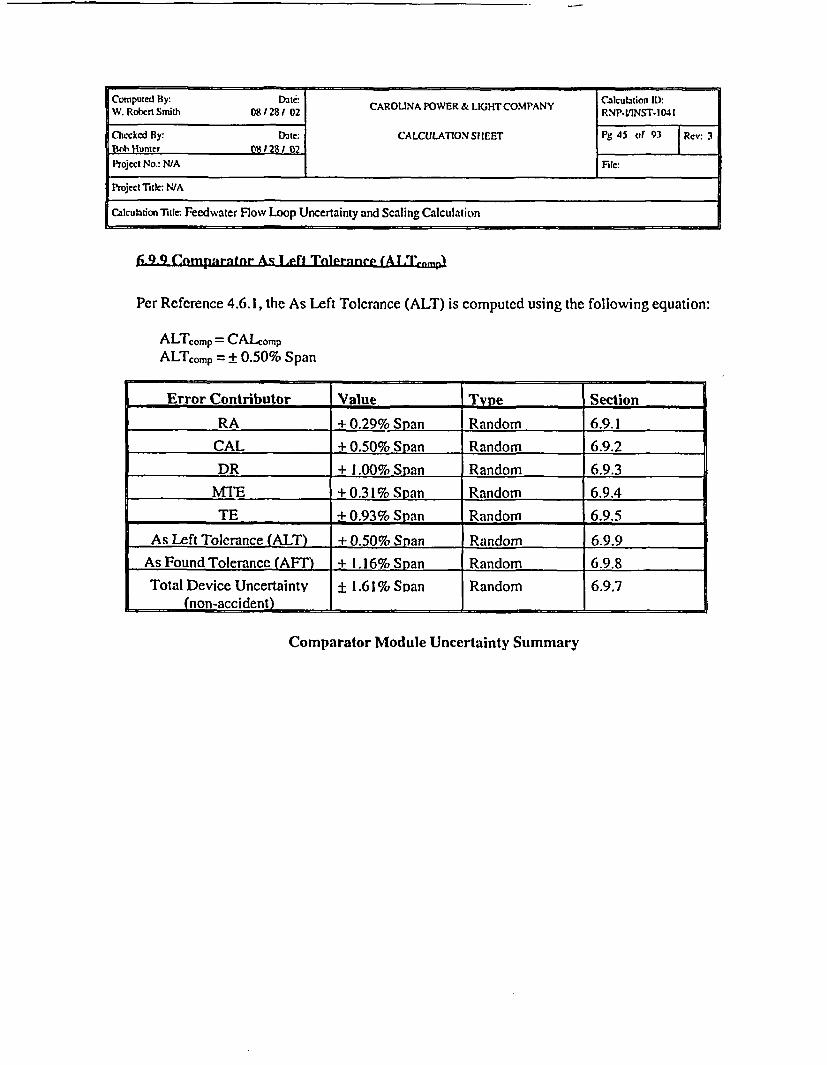
fi-9-9 Cormpsalrtor As Left Tnlersnn TA1.TrnQ)
Per Reference 4.6.1, the As Left Tolerance (ALT) is computed using the following equation:
ALTcomp = CALcompALTcomp = ± 0.50% Span
Error Contrbutor Value Type Section
RA + 0.29% Span Random 6.9.1
CAL + 0.50% Span Random 6.9.2
DR + 1.00% Span Random 6.9.3
MTIF + 0.31% Span Random 6.9.4
TE + 0.93% Span Random 6.9.5
As Left Tolerance (ALT) + 0.50% Sgan Random 6.9.9
As Found Tolerance (AFT) + 1. 16% Span Random 6.9.8
Total Device Uncertainty _ 1.61% Span Random 6.9.7(non-accident) ., . ..
Comparator Module Uncertainty Summary

Computed By: Date: CAROLINA POWER & LIG.TCOMPANY Calulation ID:W. Roben Smith 081281 02 RNP-VIN.W1041
Checked By. Date: CALCULATION SHEET PS. 46 of 93 Rev: 3Bob Hunter 081281 02Projct No: N/A File:
Project Title: N/A
Calculation Tile: Feedwater Flow Loop Uncertainty and Scaling Calculation
6-10 ISOTATOR MODUTILE
6-10.1 1Elznltnr'g lTnvylrified Attrihidtec of Rpeerence Are'irney (RA,,,,A
Per Reference 4.4.1, the reference accuracy of the NUS isolator is + 0.10% Full Scale, andthe reference accuracy of the Hagan isolator is not spccified. Per Reference 4.6.1, if thereference accuracy of a device is not specified, the reference accuracy term is set equal to thecalibration tolerance of the isolator. Per Reference 4.6.4, the isolator is calibrated to + 0.50%Span, and the calibration procedure verifies the attribute of linearity but not hysteresis orrepeatability. Per Reference 4.6.1, the following equation is utilized to compute therepeatability and hysteresis portions of the isolator reference accuracy:
RA. 1 0.50% SpanRepeatability = ±+ >/= ± .Al = + 0.29% Span
RA 0.50%SpanHysteresis = + = Sp = ± 0.29% Span
Therefore,
RAi5o = ± 0.41% Span
6-10-2 cnisotor Cnlihrafinn Tnlerance ((CAL E)
Per Reference 4.6.4, the isolator is calibrated to - 0.50% Span. Therefore,
CALi~so = + 0.50% Span
61 -10 T'anltnr Drife)t (DRis
Per Reference 4.4.1, no uncertainty for isolator drift is specified. The default value of ±1.00% Span is used to represent isolator drift (Reference 4.6.1) Therefore,
DRisoi = ± 1.00% Span
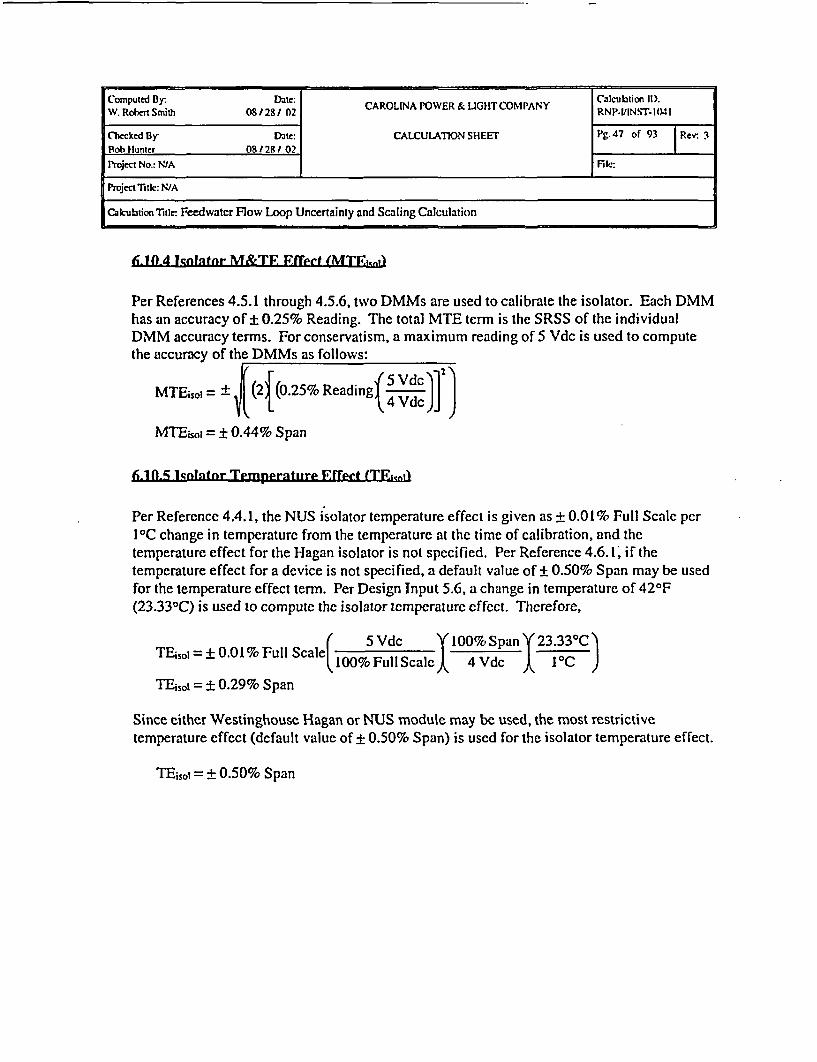
Computed By: Date: CAROLINA POWER& LIGHTCOMPANY Calculation 11).W. Robert Smith 08 / 28/ 02 CAOIAPWR&LGTCMAYRNP-IIINST- 1041
Checked By Date: CALCULATION SHEEr Pg. 47 of 93 Rev: 3Bob Hunter 08128 / 02Project No.: NIAIIEkc:
Project Title: N/A
CalculationTitle- Feedwater Flow Loop Uncertainty and Scaling Calculation
6-10 4 Isolatnr M&TE Effect (MMt,&g)
Per References 4.5.1 through 4.5.6, two DMMs are used to calibrate the isolator. Each DMMhas an accuracy of ± 0.25% Reading. The total MTE term is the SRSS of the individualDMM accuracy terms. For conservatism, a maximum reading of 5 Vdc is used to computethe accuracy of the DMMs as follows:
MTEiso= + ± (2 (0.25% Reading { VdcMTE1 0 , -- g 4 Vdc
MTEi,.i = ± 0.44% Span
6-10.' 1sn'a1tnr Temperatitre iffect (TF&,l
Per Reference 4.4.1, the NUS isolator temperature effect is given as ± 0.0 1% Full Scale perI'C change in temperature from the temperature at the time of calibration, and thetemperature effect for the Hagan isolator is not specified. Per Reference 4.6.1, if thetemperature effect for a device is not specified, a default value of ± 0.50% Span may be usedfor the temperature effect term. Per Design Input 5.6, a change in temperature of 420 F(23.330C) is used to compute the isolator temperature effect. Therefore,
{ 5 Vdc Y100% Span Y23.33°CTEiol=±+0.01% Full Scale( 100%FulScalc 10 S 23.33
TEisot = ± 0.29% Span
Since either Westinghouse Rlagan or NUS module may be used, the most restrictivetemperature effect (default value of ± 0.50% Span) is used for the isolator temperature effect.
TEiot = ± 0.50% Span

Computed By: Date: Calculation ID:W Robort Smith 0 /28/ 02 CAROLINA POWER & LIGHTCOMPANY RNP-VINS W-1041
Checked By: Date: CALCULATION SHEET Ig.4S Of 93 Rev: 3IBob Hunter 08 /28 / 02Project No.: NIA File:
P'rojct Title N/A
Calculation Title: Feedwater Flow Loop Uncertainty and Scaling Calculation
6f10-6 Icnlatnir Pnwer Sjillly FWffect t ,,)
Per Reference 4.4.1, no uncertainty for the isolator power supply effect is specified. Sincethe isolators are powered by regulated instrument buses, the isolator power supply effect isconsidered to be negligible. Therefore,
PSEisoi = N/A
6h110.7 Isolvitor Total Dlevioe I Tncprtanty (TI)EMI5Jk
Total Device Uncertainty is computed using the following equation:
TDU 5ol = +ij(CAL3 5 0 l + MTE.Sol )2+ RA iso2 + DR isiq+TE5isol2
TDUi,50 = ± 1.52% Span
6 10-X 1qlnaltnr As Found Tolerante (AFT 5,n't
Per Reference 4.6.1, the As Found Tolerance (AT;T) is computed using the followingequation:
AFTil = VCALiso 2 + DR 2sol + MTE I 2
AFITisoi = ± 1.20% Span

ComSputed B Date2 CAROLINA POWER C LIGHT COMPANY Calculation ID:W. Robert Smith 08/28/ 02 C OLA WE& UTOPNYRNP-VINS7-1041
Checked By: ace: CALCULATION SIEET Pg.t9 of 93 Rey: 3Bob Hunter 08 / 2g' 02Project No.: N/A File:
Project Title: N/A
Calculation Title: Feedwater Flow Loop Uncertainty and Scaling Calculation
6.10.9 Isolator A's left TnlPruneP (AITi,,n
Per Reference 4.6.1, the As Left Tolerance (ALT) is computed using the following equation:
ALTisot= CALisoIALTisot = ± 0.50% Span
Error Contributor Value Te Section
RA + 0.41% Span Random 6.10.1
CAL + 0.50% Span Random 6.10.2
DR + 1.00% Span Random 6.10.3
MTE + 0.44% Span Random 6.10.4
TE + 0.50%7J Span Random 6.10.5
As Left Tolerance (ALT) + 0.50% Span Random 6.10.9
As Found Tolerance (ATT) + 1.20% Span Random 6.10.8
Total Device Uncertainty _ 1.52% Span Random 6.10.7(non-accident)
Isolator Module Uncertainty Summary

Computled By: Date: CAROLINA POWER & LIGHTCD:PANY Calcuin IDlW. Rcbert Smith 08 /281/ 02 CAOIA~E IfTCMAYRNP-INST-1041I
Checked By: Date: CALCULATION SIIEEr PS.50 of 93 e3Bob Hunter 08/281 02
Prect No.: NIA File:
Proec Title: N/A
Calculation Title: Feedwater Flow Loop Uncertainty and Scaling Calculation
6-11 S(TJARFROOTMODTIT.E
61 11.1 Sqiiare Rnot Mndidile's I Inverified AttrihitEs of Reference Accuracy (RA,'t)
Per Reference 4.4.1, the reference accuracy of the NUS square root module is + 0.50% Span,and the reference accuracy of the Hagan square root module is not specified. Per Reference4.6.1, if the reference accuracy of a device is not specified, the reference accuracy term is setequal to the calibration tolerance of the square root module. Per Reference 4.6.4, the squareroot module is calibrated to + 0.50% Span, and the calibration procedure verifies the attributeof linearity but not hysteresis or repeatability. Per Refcrcncc 4.6.1, the following equation isutilized to compute the repeatability and hysteresis portions of the square root modulereference accuracy:
Repeatability = +RA ±0.50% Span 0.29% Span
RAsqn 0-50% SpanHysteresis = + Ail 0 S 0.29% Span
Therefore,
RAsqn = + 0.41% Span
6 11.2 Sgqiire Ront Mnditle Canlihrrtinn Tnlerannre (CAI .va
Per Reference 4.6.4, the square root module is calibrated to + 0.50% Span. Therefore,
CALsqn = ± 0.50% Span
6, 11.3 .qUiare Rant ModtIfe Drift (I)Rg5r,
Per Reference 4.4.1, no uncertainty for drift is specified for the NUS or Hagan square rootmodule. Per Reference 4.6.1, a default value of + 1.00% Span may be used to represent theexpected drift for the total rack. The comparators already include the default drift value of +
1.00% Span. Therefore, no additional drift is included for the square root module.
DRsqrt = NIA

Computed By: Date: CAROLINA POWER & U(LHT COMPANY Calculation ID:W. Robert Smith 081281 02 RN P-11INIST- 1041
Checked By: Datne VALCULATION SHEETr 'g. I of 93 | ReV 3
Bob Huntri 081281 02Project No.: N/A I File
Project Tilk: N/A
Calculation Title: Feedwater Flow Loop Uncertainty and Scaling Calculation
6i,11.4 SrjIntre Rnnt Modnvit M&TF Effect (MTE,,ri',
Per References 4.5.1 through 4.5.6, two DMMs are used to calibrate the square root module.Each DMM has an accuracy of ± 0.25% Reading. The total MTE term is the SRSS of theindividual DMM accuracy terms. For conservatism, a maximum reading of 5 Vdc is used tocompute the accuracy of the DMMs as follows:
(5 VdcMT~sqr= ++j2A[(0.25% Reading:(4 Vdc)]j
MTEsqit = ± 0.44% Span
iil 1.5 .Squitare Rant MnunilP Temilerntire Effert T
Per Reference 4.4.1, the NUS square root module temperature effect is given as ± 0.03% FullScale per 1 0C change in temperature from the temperature at the time of calibration, and thetemperature effect for the Hagan square root module is + 0.01% Span per 1 0C. Forconservatism, the temperature effect associated with the NUS module is used. Per DesignInput 5.6, a change in temperature of 42 0F (23.33CC) is used to compute the square rootmodule temperature effect. Therefore,
5 Vdc Y 100% Span Y 23.33°C\TEsqn = ± 0.03% Full Scale( 100% FulScal 4 Vdc F C )
TEsqrt = ± 0.87% Span
6f- 1.6 Sqiulrp Rloot Mounle Power Siurply Effaet (PSF'4q,!
Per Reference 4.4.1, the power supply effect for the NUS square root module is given as +
0.01% Reading for a variation of ± 10% in supply voltage, and no uncertainty for the Hagansquare root module power supply effect is specified. Since the square root module ispowered by regulated instrument buses, the square root module power supply effect isconsidered to be negligible. Therefore,
PSEqrt = N/A

Computed By: 08/28/ 02 CAROLINA POWER & LIGUrTCOMPANY CIalcltin ID:
Checkcd By: Date. CALCULATION SHEET PS. 52 f r93 Rev: 3
Bob lunter 08 /28t 02
Project No.: N/A Eil:
Project Tit-. N/A
Calculation Tidle: Feedwaltte How Loop Uncertainty and Scaling Calculation
6h11.7 Sqgiuare Rent Modifle Total Deviep I Incertainfy (Tfl h re'd
Total Device Uncertainty is computed using the following equation:
TDUsqr1 = _ I(CALsqn + MTESqn + RA 2 + TEs
TDUsqri = ± 1.34% Span
6h1l.XR Sguunre RUnt Modile Ac Foind Taler-ince (AET,4ta
Per Reference 4.6.1, the As Found Tolerance (AFT) is computed using the followingequation:
AFTsqn=+ CAL± 2 +MTE 2
Arrsq, = ± 0.67% Span
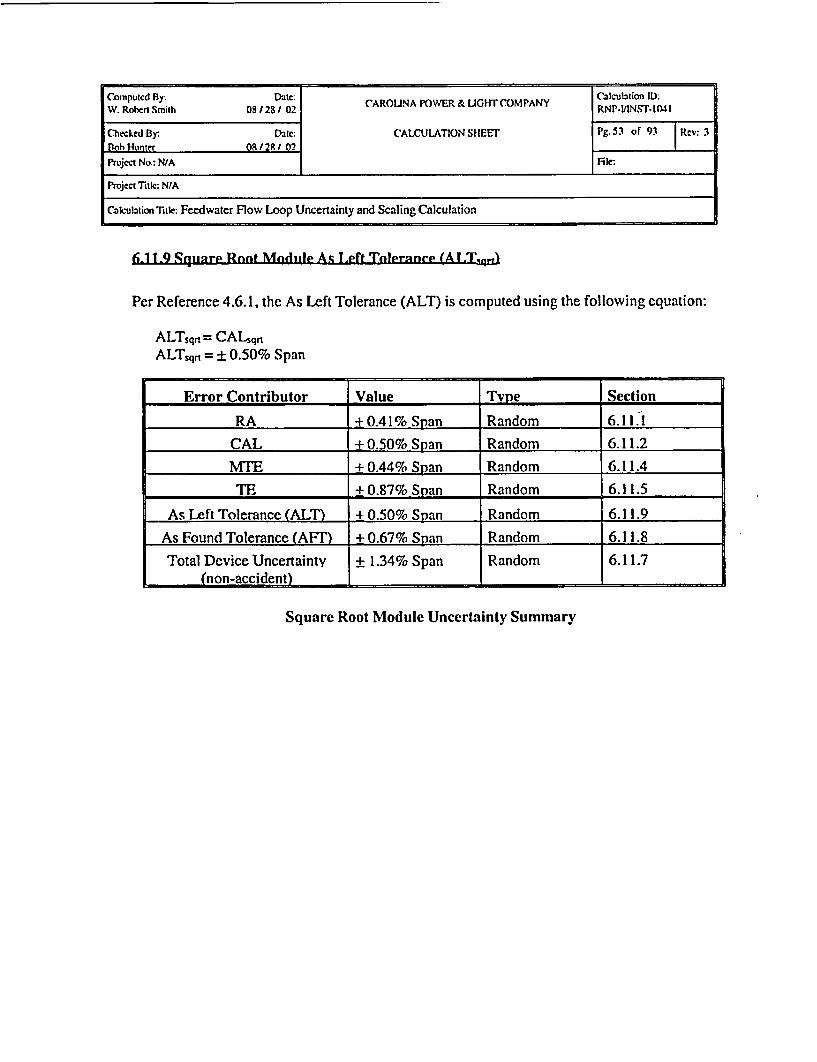
Computcd By: Ditc: CAROLINA POWER & LIGHT rCOMPANY Calcubtion ID:W. Roben Smith 08 /28 / 02 RNP-tIN.VWN1041
Checked By: Datc: CALCULATION SHEET Pg 53 of 93 | Rv: 3Bob Hunter 08 / 25 / 02
Prujcct No.: N/A Ile
Project Title: N/A
Calculation Title: Feedwater Flow Loop Uncertainty and Scaling Calculation
6-11-9 Sqlmitre Root Mnorule A-, Teft Toleranie (AI.T.qrt)
Per Reference 4.6.1, the As Left Tolerance (ALT) is computed using the following equation:
ALTsqrt = CALiqnALTsqrt = ± 0.50% Span
Error Contributor Value Type Section
RA + 0.41% Span Random 6.11.1
CAL + 0.50% Span Random 6.11.2
MTE + 0.44% Span Random 6.11.4
TE + 0.87% Span Random 6.11.5
As Left Tolerance (ALT) + 0.50% Span Random 6.11.9
As Found Tolerance (AFT) + 0.67% Span Random 6.11.8
Total Device Uncertainty ± 1.34% Span Random 6.11.7(non-accident)
Square Root Module Uncertainty Summary
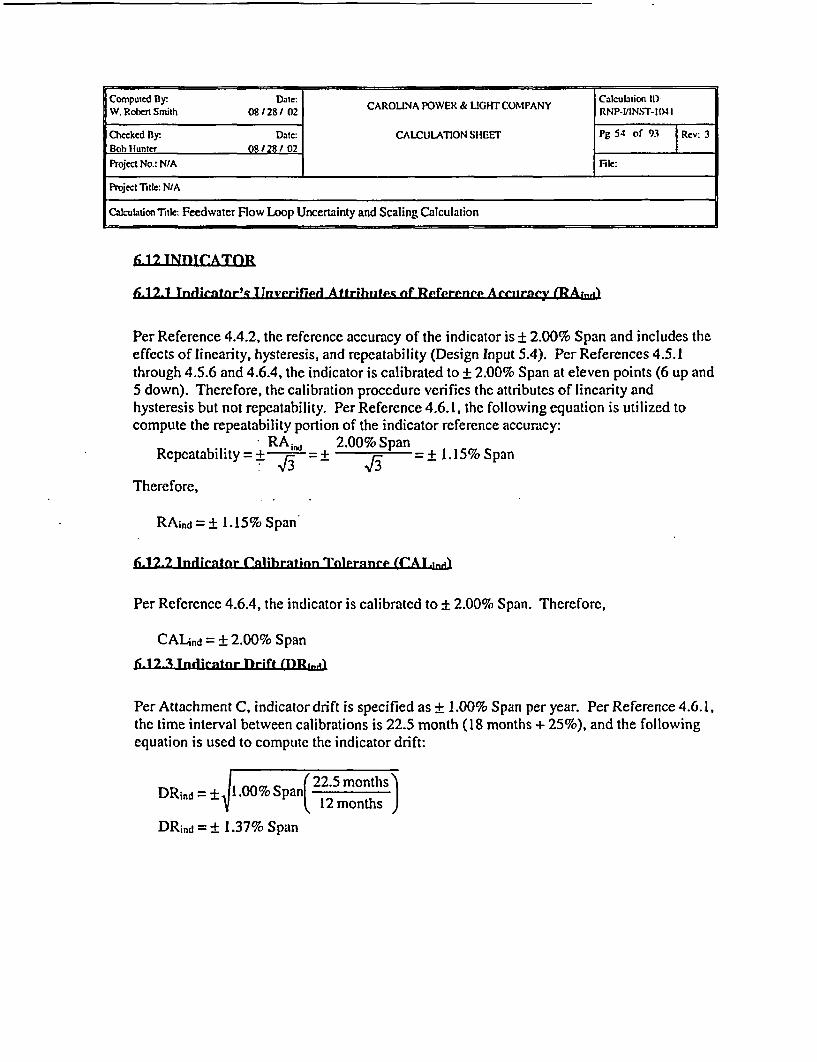
Computed By: Date: CAROLINA POWER & LIGHT COMPANY Calculotion ID)W. Robert Smith 08 /28/ 02 RNP.1/IN.ST-041I
Checked By: Date: CALCULATION SHEET Pg 54 of 93 Rev: 3Bob Hunter 08/28 / 02 1
Project No.: N/A File:
Project Title: N/A
Calculation Title-t Feedwater Flow Loop Uncertainty and Scaling Calculation
ha12 INDOICATOR
6 12.1 Tndientnr'i. TUnverified Attrhulate nf Rpferenre Arelxrary (RAinAt
Per Reference 4.4.2, the reference accuracy of the indicator is ± 2.00% Span and includes theeffects of linearity, hysteresis, and repeatability (Design Input 5.4). Per References 4.5.1through 4.5.6 and 4.6.4, the indicator is calibrated to ± 2.00% Span at eleven points (6 up and5 down). Therefore, the calibration procedure verifies the attributes of linearity andhysteresis but not repeatability. Per Reference 4.6.1, the following equation is utilized tocompute the repeatability portion of the indicator reference accuracy:
* RA .,, 2.00% SpanRepeatability= + ." == = 1. 15% Span
Therefore,
RAind =+ 1.15% Span
6f12.2 Indlortnr (Calibration TolpranCp (C(AT&I.;j
Per Reference 4.6.4, the indicator is calibrated to ± 2.00% Span. Therefore,
CALind = ± 2.00% Span
6-1l2-3 Inffleictor Drift (l}R,,,)
Per Attachment C, indicator drift is specified as + 1.00% Span per year. PerReference4.6.1,the time interval between calibrations is 22.5 month (18 months + 25%), and the followingequation is used to compute the indicator drift:
DR d =+ 1.00% Span( 22.5 months 'DRnd = 1.712 monthsa
DRind =±1.37% Span

Computed By: bate: CAROLINA POWER & UGHIT COMPANY Calculation ID.W. RobertSmith 03128) 02 RNI.IIVINST-1041
Checked By: Date: CALCULATION SHEET Pg.55 of 93 Rev: 3Bob Hunter 08 / 28/ 02
Project No: N/A File:
Project TItle: N/A
Calculation Title: Feedwater Flow Loop Uncertainty and Scaling Calculation
6-12.4 Jndiratnr M&TF Fffpert (MT~ind
Per References 4.5.1 through 4.5.6, one DMM with an accuracy of ± 0.25% Reading is usedto calibrate the indicator. The calibration points are cardinal points on the indicator scale perReferences 4.5.1 through 4.5.6. Therefore, the indicator resolution is not included in theMTE term. For conservatism, a maximum reading of 5 Vdc is used to compute the accuracyof the DMM as follows:
MTEind ± (0.25% Reading( Vdc = + 0.31% Span4 Vdc)
6-1'231; Indientor Temprraftirt Effect (T&.a]
Per Attachment C, the indicator temperature effect is specified as + 0.10% Span per 1I'Cchange from the temperature at the time of calibration. Per Design Input 5.2, a change intemperature of 9.40C is used to compute the indicator temperature effect.
TEind =4.010%Span( .4CC)
Ein= ± 0.94% Span
6.12-6 Indientnr Pnwer StiRpply FfftNf (PS;F::,
Per References 4.1.1 through 4.1.3, the indicators are not powered by an external source.Therefore, there is no indicator power supply effect.
PSEind = N/A

Computed By: D1r: CAROLINA POWER & Ll(iHT(X)MPANY RNcul-Vion If):W. Robca Smith 051281/ 02 CRLAP E&U(TOPNYRNP-VINST-1041
Cecked By: Date: CALCULATION SHEET ig56 of 93 |ReV: 3
Bob Hunter 08/281 02
Projcct No.: N/A File:
Projcct Title: N/A
Calculation Title Feedwater Flow Loop Uncertainty and Scaling Calculation
6-12-7 Indocntnr Rt-dnbhility (RDind.'
Per Reference 4.6.1, the indicator readability term is '/z of the smallest indicator scaledemarcation. Per References 4.1.4 and 4.1.5, the indicator has a scale of 0 to 4x 10⁶ Ibm I hrwith minor demarcations of 0.2x 10⁶ Ibm / hr. Thereforc,
0O.2x 106 Ibm /hr^ I100% SpanRD10dl = ± O 2x O6 b / r 1 4 06 I m h = + 2.50% Span
R~n=t 2 14x 10 lbrn/hr -
6-1 2.8 Indorstor Tnttnl lDPvire I Jnrprtninty (TflhlT1n
Total Device Uncertainty is computed using the following equation:
TDU, = ± CALind +MTEi )2+ RA i 2 + DR i2+ TE 2 + RD1 2
TDUind = ± 3.96% Span
6f12.9 tndlicntnr As Fnuind Tolprnne_ (AiT1~A
Per Reference 4.6.1, the As Found Tolerance (AFT) is computed using the followingequation:
AFTiCd = ± VCAL fd 2+ DR ind2 +MTEnd 2
AFTind = ± 2.44% Span
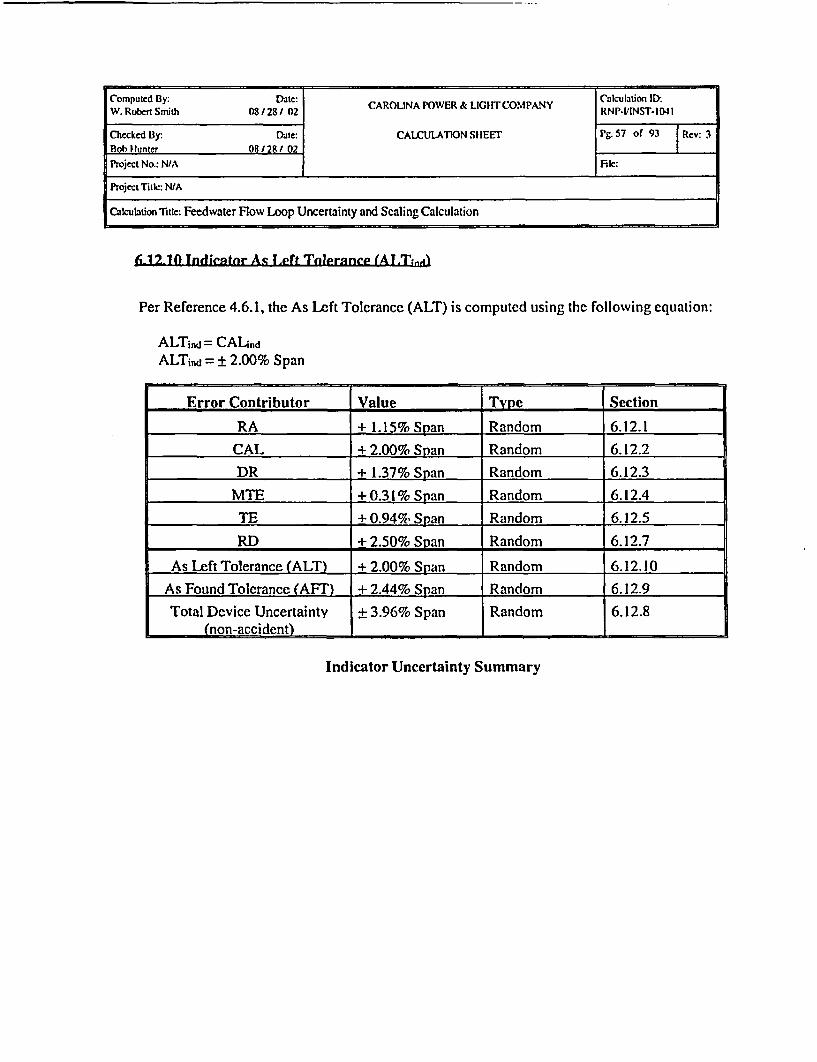
Computert Bly: at/ CAROLINA POWER & LDGDTCOM:PANY Calculation ID:W. Robert Smiih 08/128 / 02 CRLAPOE&LGTCMPNYRN P4/INST. 1041
Checked By: Date: CALCULATI1ON SIIEET rs7 Of 93 Rev: 3Bob Hunter 08/28/ 02
Project No.: NIA file:
Project Title: N/A
Calculation Title: Feedwater Flow Loop Uncertainty and Scaling Calculation
6-121) Tndlieator As L eft Tolerancep (ALTMd
Per Reference 4.6.1, the As Left Tolerance (ALT) is computed using the following equation:
ALTind = CALimdALTind = ± 2.00% Span
Error Contributor Value TvneSection
RA + 1.15% Span Random 6.12.1
CAL + 2.00% Span Random 6.12.2DR + 1.37% Span Random 6.12.3
MTE + 0.31% Span Random 6.12.4
TE + 0.94% Span Random 6.12.5
RD + 2.50% Span Random 6.12.7
As Left Tolerance (ALT) + 2.00% Span Random 6.12.10
As Found Tolerance (AFT) + 2.44% Span Random 6.12.9
Total Device Uncertainty ± 3.96% Span Random 6.12.8(non-accident) . . .
Indicator Uncertainty Summary

Computed By. Wae: CAOIAPWR&LGTCN AYCalculation It.)W. Robeen Smith 08 / 28/ 02 CAROLINA POWER & LGHT COMPANY CNa-lcatnINs.04
Checked By: Date: CALCULATION SHEEr Pg.58 Of 93 |Rev: 3Bob Hunter 08/28/ 02
Project No.: N/A File:
Project Title: N/A
Cculation Title. Feedwater Flow Loop Uncertainty and Scaling Calculation
6f13 RECORIDFER
6f13-1 Rprarder's Tlnverifierl Attrihttec nf Rererence Acruracy JRA...I
Per References 4.1.7 through 4.1.9, the recorder input span is I to 5 Vdc. Therefore, thespecifications for a 6 Vdc input range are used to compute the recorder Reference Accuracy.Per Reference 4.7.11, for a 6 Vdc input range, the maximum resolution of the input is ImVdc (0.001 Vdc) and the Measurement Accuracy for the recorder is given as ± (0.3% ofreading + 3 digits). Therefore, the recorder Reference Accuracy (RArec) is calculated asfollows:
RArc = ± (0.3% Reading + 3 digits)
RArec = _ (0.3%7o x 5 Vdc + 3 digits)
RArec = ± (0.015 Vdc + 0.003 Vdc) = ± 0.0 18 Vdc
RArec =±0.018 Vdd 00% Span4 Vdc)
RArec =± 0.45% Span
6.13.2 Rpenrder Calihraltinn Tn1eprnep (CASTS
Per Reference 4.6.4, the recorder is calibrated to + 0.50% Span. Therefore,
CAL. = ± 0.50% Span
6f13-3 Rernprder Drift (DlR,1.
Per Section 5.19, no recorder drift is specified and recorder drift is assumed to be included inthe Reference Accuracy and Temperature Effect specifications. Therefore,
DRrec = N/A
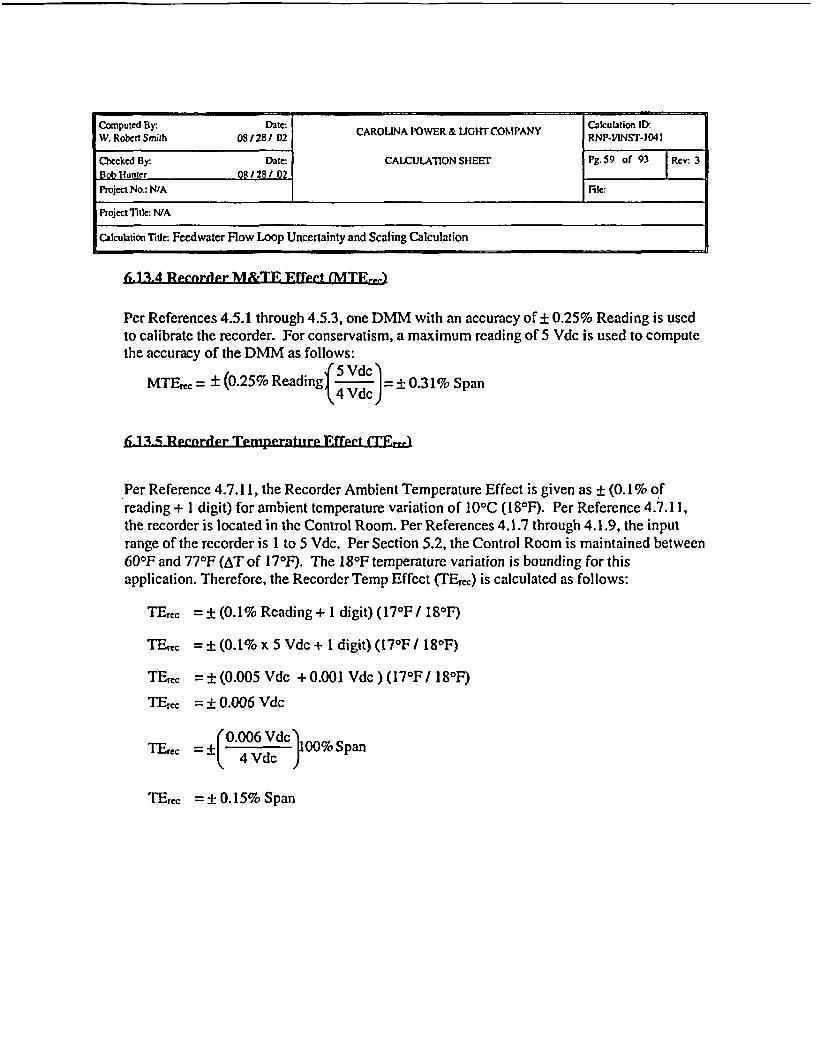
Computed By- Date- CAROLNA POWER & LIGHT COMPANY Cakulation ID:W. Robert Smr~th 08/ 28 / 02 RNP4IINST-1041
Checked By: Date: CALCULATION SHEET g.59 of 93 |Rcv. 3Bob Hlunter 08128/ 02
Project No.: N/A Fik:
Project Title N/A
Calculation Title: Feedwater Flow Loop Uncertainty and Scaling Calculation
6,13.4 Rfeirrer M&TE Effeet (MTFxw)
Per References 4.5.1 through 4.5.3, one DMM with an accuracy of ± 0.25% Reading is usedto calibrate the recorder. For conservatism, a maximum reading of 5 Vdc is used to computethe accuracy of the DMM as follows:
MITErc = (0.25% Reading Vd= 0.31% Span4 Vdc)
i6 13 5 Reenrder Tempernatfrp Efflet ClF.)
Per Reference 4.7.11, the Recorder Ambient Temperature Effect is given as ± (0.1% ofreading + I digit) for ambient temperature variation of 10C (181F). Per Reference 4.7.1 1,the recorder is located in the Control Room. Per References 4.1.7 through 4.1.9, the inputrange of the recorder is 1 to 5 Vdc. Per Section 5.2, the Control Room is maintained between600F and 770 F (AT of 170F). The 180F temperature variation is bounding for thisapplication. Therefore, the Recorder Temp Effect (TEiec) is calculated as follows:
TErec = ± (0.1% Rcading + 1 digit) (170 F I 180F)
TE,,,c = ± (0.1% x 5 Vdc + 1 digit) (170 F I 180F)
TErec = ± (0.005 Vdc + 0.001 Vdc ) (170F / 1 80F)
Tre = ± 0.006 Vdc
ThErec = 0-c( 0000 Span
TErec =±0.15%Span

W. RCote Smith 08/281 02 CAROLINA POWER & LIGHT COMPANY Calulation ID.
Checked By: Date: CALCULATION SHEET P 60 of 93 Rev 3Bob Huntcr 081281 02Project No.: NMA File:
Project Title: N/A
Calculation rhie: Feedwater Flow Loop Uncertainty and Scaling Calculation
6.13.6 Reenrder Power Siipply Fffet (PSE.,
Per Reference 4.7.11, the power supply effect for a variation within 90 to 132 Vac is less thanI digit. Per Reference 4.2.1, power variations will remain within this band. Per Reference4.6.1, uncertainties less than or equal to ± 0.05% of Span have a negligible effect oncalculation results and may be omitted from the calculation. Therefore,
PSErec= N/A
6,13-7 Reranrder RPnlhbility (RDr,.
Per Reference 4.7.1 1, for a 6 Vdc Volt Range recorder, minimum recorder resolution is 0.001VDC. The recorders have an input span of 4 Vdc (I to 5 Vdc). Therefore,
0.OOlVdcRDrcc+ ~ =±00%Sa
- 4.00OVdc - 0.3% Sp
Per Reference 4.6.1, uncertainties less than or equal to ± 0.05% of Span have a negligibleeffect on calculation results and may be omitted from the calculation. Therefore,
RDrec= N/A
6.13:8 Reenrrler Tonl Devoke I 1neprfgsinty (TDTre 1,
Total Device Uncertainty is computed using the following equation:
TDUrec = +/(CALrec + MTEe )2 +RArx2 +mTErc2
TDUrec = ± 0.94% Span
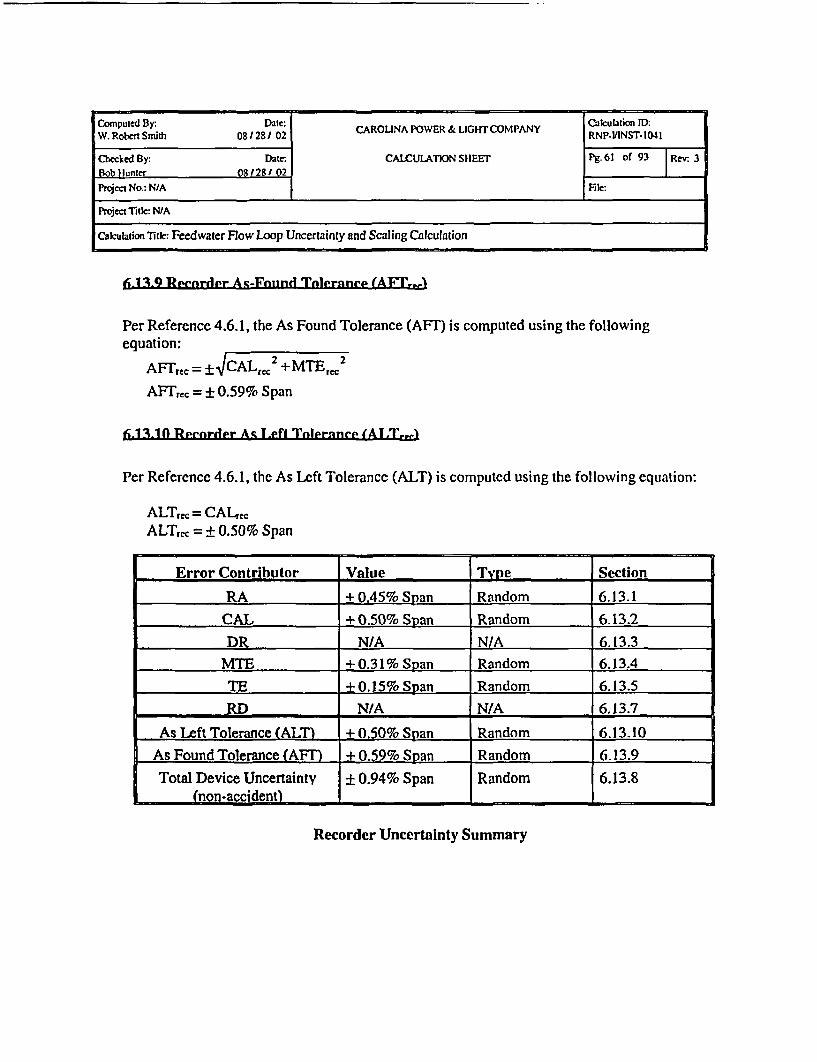
Computed By: Date: CROUINA POWER & LIGHT COMPANY ICalcultbon 1ID-W. Robert Smith 0_128) 02 RNP-VINST-1041
Checked By: Date: CALCULATION SHEET Pg 61 of 93 Rev 3Bob Hunter 08128 /02Prect No.: N/A File:
Projec Title: N/A
calculation tk- Feedwater Flaw Loop Uncertainty and Scaling Calculation
61i3.<9 Rpnrder Ag-Fnound Tolernnre (AETL-
Per Reference 4.6.1, the As Found Tolerance (AFT) is computed using the followingequation:
22AFrrec = ± CAL c2 +MTE r2
AFTrec = ± 0.59% Span
613-10 RFenrdrler A.- T.Pft Tnlerner. (ALT...A
Per Reference 4.6.1, the As Left Tolerance (ALT) is computed using the following equation:
ALTrec = CALrecALTcc = ± 0.50% Span
Error Contributor Value TyPe Section
RA + 0.45% Span Random 6.13.1
CAL +0.50% Span Random 6.13.2
DR N/A N/A 6.13.3MTE + 0.31% Span Random 6.13.4
TE +0. 15% Span Random 6.13.5
RD N/A N/A 6.13.7
As Left Tolerance (ALT) + 0.50% Span Random 6.13.10
As Found Tolerance (AFT) + 0.59% Span Random 6.13.9
Total Device Uncertainty + 0.94% Span Random 6.13.8(non-accident) I _
Recorder Uncertainty Summary
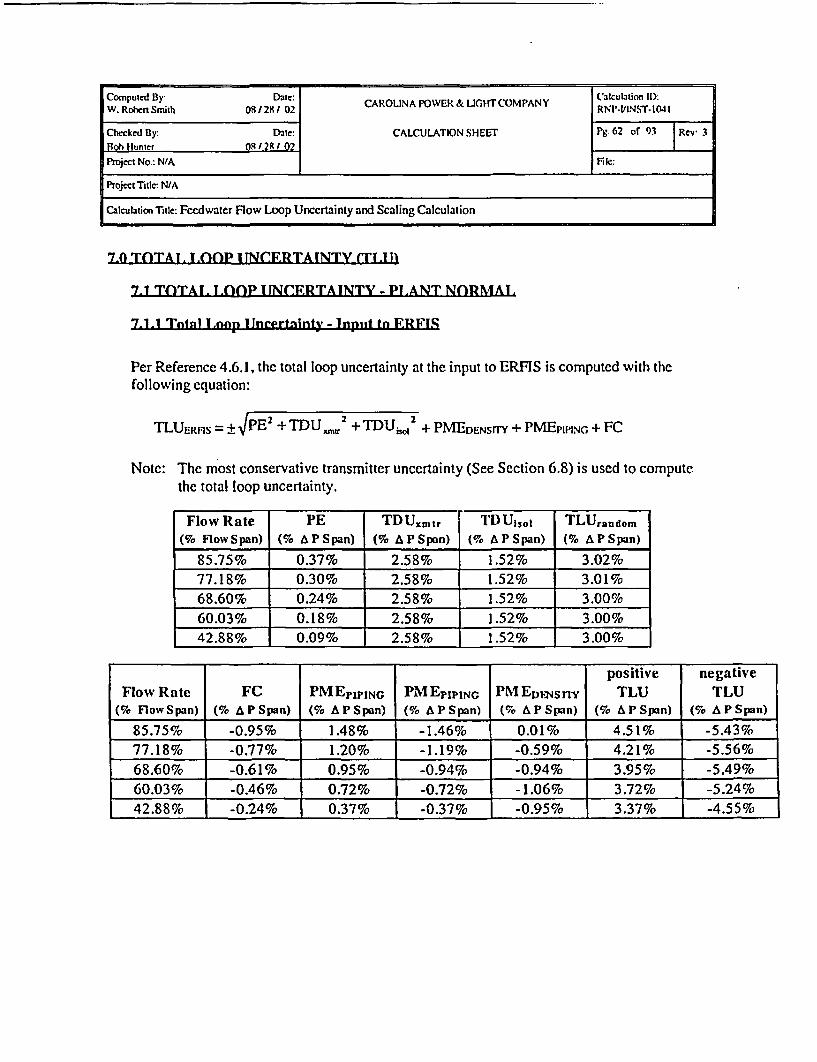
Computed By OR C: CAROLINA pOWER & LGHTCOMPANY Calculation ID):W. Rotxn Smitih 051/2K/ 02 CRIAPOE&UCrOM NYRNP'.,'LNS.W1041
Checked By: DMe: CALCULATION SHEET Pg.62 Of 93 | Rew 3Plob Ifunier ORI 2R 1 02 I
Prqject No.: NtA File:
Project Title: NIA
Calculation i rle: Feedwater Flow Loop Uncertainty and Scaling Calculation
7-O TOTA1. 1,01P uINCERTAINTY CTT.I1)
7.1 TOTAI. 1.00E I NC'FRTAINTY -1P1 .ANT NORMAL
7.1.1 Tntnl loolp Ulnertsinty - Inpit to FRFI5
Per Reference 4.6.1, the total loop uncertainty at the input to ERFIS is computed with thefollowing equation:
TLUERFIS = I+PE +TDU., 2+TDUij50, +U PMEDENSITY + PMEPIPING + FC
Notc: The most conservative transmitter uncertainty (See Section 6.8) is used to computethe total loop uncertainty.
Flow Rate PE TDUxmtr r T'DUjsj1 TLUrandom(% Fow Span) (% A P Span) (% A P Span) (% A P Span) (% AP Spatn)
85.75% 0.37% 2.58% 1.52% 3.02%77.18% 0.30% 2.58% 1.52% 3.01%68.60% 0.24% 2.58% 1.52% 3.00%60.03% 0.18% 2.58% 1.52% 3.00%42.88% 0.09% 2.58% 1.52% 3.00%
positive negativeFlow Rate FC PMEpIPING PMI[EPIPING PMEjFvsn-Y TLU TLU
(% FlowSpan) (% APSpan) (% A P Spn) (% A P Span) M & P Span) (% A P Spn) (% A P Span)
85.75% -0.95% 1.48% -1.46% 0.01% 4.51% -5.43%77.18% -0.77% 1.20% -1.19% -0.59% 4.21% -5.56%68.60% -0.61% 0.95% -0.94% -0.94% 3.95% -5.49%60.03% -0.46% 0.72% -0.72% -1.06% 3.72% -5.24%42.88% -0.24% 0.37% -0.37% -0.95% 3.37% -4.55%

Computed By: Date: Calculation ID):W. Robert Smith 08 / 28/ 02 CAROLINA POWER & LIGHT COM PANY RNPVIIN.S- I041
Checked By: Date: CALCULATION SHEET Pg 63 of 93 Rev 3Bob Hunter 08 / 281 02Project No.: NIA Filk
Project Title: NIA
Calculation Title: Feedwater now Loop Uncertainty and Scaling Calculation
7.1.2 Tntal 1 nr I nMertninty - Tnrideator FT-476, 477, 486, 487, 4926 ANI) 497
Per Reference 4.6.1, the total loop uncertainty associated with the indicator is computed withthe following equation:
TLUind± = ± VPE' + TDU,,,,, + TDUqt 2 + TD U 1j,0 +TDUlJnF + PIMEDENSrry + PMEPrPINU + FC
Per Design Input 5.1 1, the transmitter uncertainties are converted from % AP Span to % FlowSpan with the following equation:
TDUxmt, (% Flow Span) = IA4TDU.m, (% APSpan) )2(Flow Rate) )where TDUmtr (% AP Span) = ±2.58% AP Span
Note: The most conservative transmitter uncertainty (See Section 6.8) is used to computethe total loot unceraintv.
Flow Rate PE TDUxmtr TDUsqrt TDUi,,i TDUInd TLUrandom(% FlowSpan) (% FlowSpan) (% FlowSpan) (% FlowSpan) (% nlowSpan) (% FlowSpan) (% FlowSpan)
85.75% 0.21% 1.50% 1.34% 1.52% 3.96% 4.70%77.18% 0.19% 1.67% 1.34% 1.52% 3.96% 4.76%68.60% 0.17% 1.88% 1.34% 1.52% 3.96% 4.83%60.03% 0.15% 2.15% 1.34% 1.52% 3.96% 4.94%42.88% 0.11% 3.01% 1.34% 1.52% 3.96% 5.37%
positive negativeFlow Rate FC PMEPIPING PMEpIPING PMEDENSITY TLU TLU
(% FlowSpan) (% FlowSpan) (% FlowSpan) (% FlowSpan) (% FlowSpan) (% FlowSpan) (% FlowSpan)
85.75% -0.55% 0.86% -0.86% 0.01% 5.57% -6.11%77.18% -0.50% 0.77% -0.77% -0.38% 5.53% -6.41%68.60% -0.44% 0.69% -0.69% -0.69% 5.52% -6.65%60.03% -0.39% 0.60% -0.60% -0.89% 5.54% -6.82%42.88% -0.28% 0.43% -0.43% -1.12% 5.80% -7.20%
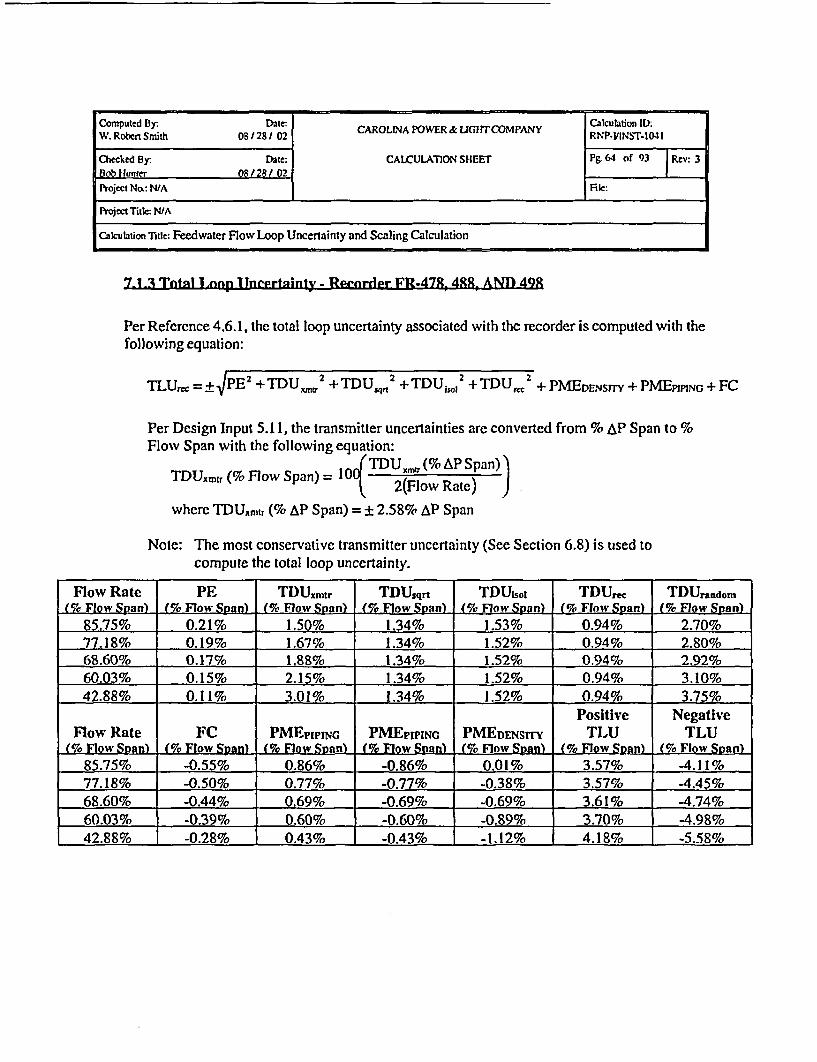
Computed By: Date: CAROL POWER & LlG11COhPANY Calculation ID:W. Robert Smith 0 / 281 02 CRLNPO R&L1TOPAYRNP-4/INST-1041
Checked By: Date: CALCULATION SHEET Pg. 64 of 93 Rev: 3Bob Hunter 08 28/ 02Project No.: NIA File:
PNegit itle: N/A
Calculation Title: Feedwater Flow Loop Uncertainly and Scaling Calculation
7_1.3 Totnt 1o Ip TTneprtninty - Reeorder FR-478. 488, AND 498
Per Reference 4.6.1, the total loop uncertainty associated with thc recorder is computed with thefollowing equation:
TLU,.c = +I PE2+ TDU 2utZ + TDUjq2 +TDU; 3 12 + TDU Me2+ PMEDENS"IY + PMEPJPING + FC
Per Design Input 5.11 , the transmitter uncertainties are converted from % AP Span to %Flow Span with the following equation:
TDUxm,,tr (% flow Span) = IO1TDUxm. (% AP Span)( 1 S )2(Flow Rate)
where TDU,,fn (% AP Span) = ±2.58% AP Span
Note: The most conservative transmitter uncertainty (See Section 6.8) is used tocompute the total loop uncertainty.
Flow Rate PE TDUxmtr TDUsqrt TDUlsol TDUrec TDUrandomn(% Flow Span) (% Flow Span) (% Flow Span) (% Flow Span) (% Flow Span) (% Fow aw Span)
85.75% 0.21% 1.50% 1.34% 1.53% 0.94% 2.70%77.18% 0.19% 1.67% 1.34% 1.52% 0.94% 2.80%68.60% 0.17% 1.88% 1.34% 1.52% 0.94% 2.92%60.03% 0.15% 2.15% 1.34% 1.52% 0.94% 3.10%42.88% 0.11% 3.01% 1.34% 1.52% 0.94% 3.75%
Positive NegativeFlow Rate FC PMEPIPING PMEPfPING PMEDENsrFy TLU TLU
(% Flow Span) (% Flow Soan) (% Flow Span) (% Flow Span) (% Flow Span) (% Flow Snan) % Flow Span)85.75% -0.55% 0.86% -0.86% 0.01% 3.57% -4.11%77.18% -0.50% 0.77% -0.77% -0.38% 3.57% -4.45%68.60% -0.44% 0.69% -0.69% -0.69% 3.61% -4.74%60.03% -0.39% 0.60% -0.60% -0.89% 3.70% -4.98%42.88% -0.28% 0.43% -0.43%_ -1.12% 4.1-8% -5.58%

Computcd By. Date- CAROLINA POWER & LIGHT COMNPANY Calcubtion ID:W. RobetSmith 08 28 / 02 ,RNP-LIINST-1041
Checked By- Date: CALCUILATION SIIEET Pg. 65 of 9'3 Rev: 3llob Hlunter 08 t281t 02
Projt No.: N/A IIFile:
Project TitLk: WIA
Calcuion Title: Fecdwater Flow Loop Uncertainty and Scaling Calculation
7.1.4 Totrl rnop llIniertninty - Compnrntnrc
The comparator uncertainty is computed in Section 7.3.
7.2 TOTAL .l.lP ITNCPRTAINTY - A CMDUNT
Per Section 6.1, accident effects are not considered for these loops.
7.3 TOTAL. lOOP IINCERTATNTY - POST SFISMIC
FC-47RA 47RR 479C 47RD) 4RRA 4RR 4RRC' 4RRD 49RA 494R 4c9C 4QR4)
The comparators in each loop provide an alarm on feedwater flow greater than steam flow, analarm on feedwater flow less than steam flow, and a steam flow / feedwvater flow mismatchreactor trip signal. Per Scection 7.3.2 of Reference 4.2.3, the random and bias steam flowuncertainties are as follows:
FCRANDOMFlow Flow PE Uncertainty TDUxmtr TDUsqrt SExmtr
(% Flow) 1% Flow Span) (% Flow Span) (% Flow Span) (% Flow Span) (% Flow Spn (%17wSan).100% 85.75% 0.64% 0.56% 1.69% 1.42% 0.81%90% 77.18% 0.58% 0.54% 1.87% 1.42% 0.90%80% 68.60% 0.51% 0.51% 2.11% 1.42% 1.01%70% 60.03% 0.45% 0.47% 2.41% 1.42% 1.16%50% 42.88% 0.32% 0.36% 3.37% 1.42% 1.62%
Flow Flow SI;random pOS PME neg PME% Flow) (% Flow SPAn %YFlowSpAn) (% Flow Spa AFlo pan)
100% 85.75% 2.51% 0.98% -0.86%90% 77.18% 2.64% 0.83% -1.1 1%80% 68.60% 2.83% 0.77% -1.33%70% _-60.03% 3.08% 0.70% -1.41%50% 42.88% 4.03% 0.53% -1.28%
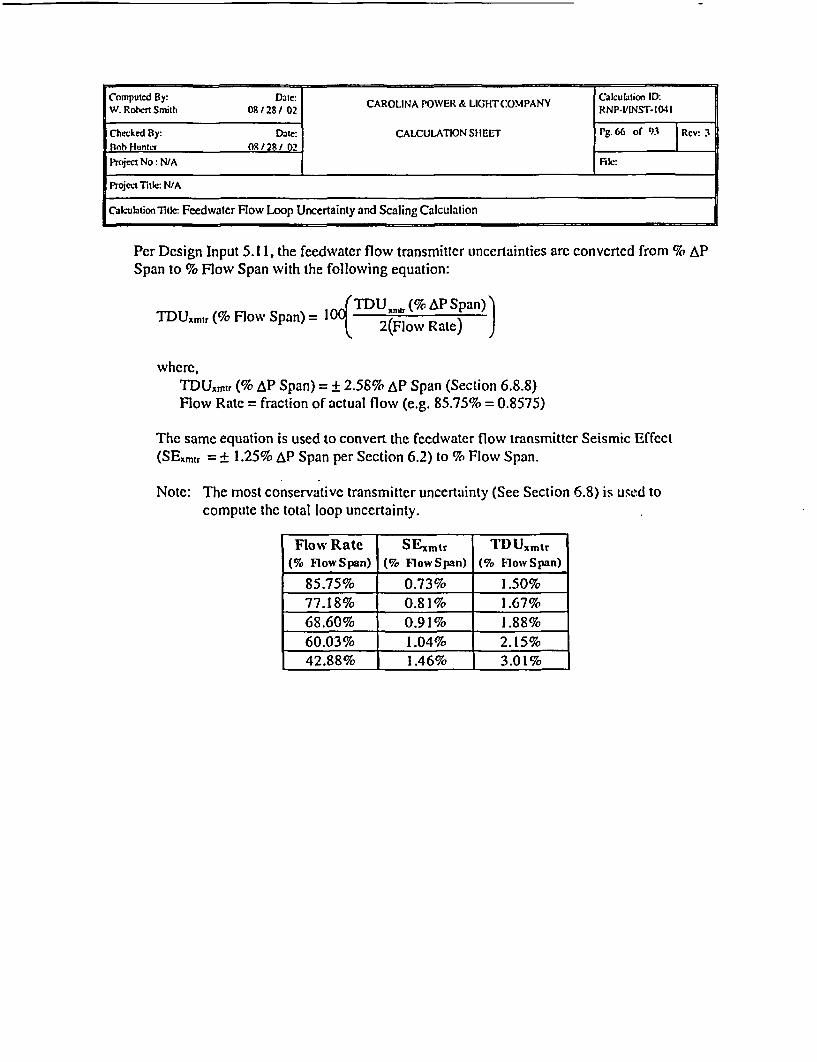
Computed By: Date: CAROLINA POWER & LCGHTC'MPANY Calcutilion ID:W. Robert Smith 08128 / 02 CAOIA~E IH(OIAYRNP-VIN.W-1041
Checked By: Date: CALCULATION SHEET Pg 66 of 93 Re 7
Bob Huntl _ 09128/ 02 -
Project No: NMA File:
Project Tite: N/A
CalkubtionTItlc: Feedwaler Flow Loop Uncertainty and Scaling Calculation
Per Design Input 5.11, the feedwater flow transmitter uncertainties are converted from % APSpan to % Flow Span with the following equation:
TDU. (%Flow Span)= Io(TDUn (% AP Span) '
TD~ x tr ( Flo Spa ) = OL~ 2(Flow R ate) Jwhere,
TDUxmtr (% AP Span) = 4 2.58% AP Span (Section 6.8.8)Flow Rate = fraction of actual flow (e.g. 85.75% = 0.8575)
The same equation is used to convert the feedwater flow transmitter Seismic Effect(SExmtr = + 1.25% AP Span per Section 6.2) to % Flow Span.
Note: The most conservative transmitter uncertainty (See Section 6.8) is used tocompute the total loop uncertainty.
Flow Rate SExmtr TDU.mtr(% FlowSpan) (% FlowSpan) (% FlowSpan)
85.75% 0.73% 1.50%77.18% 0.81% 1.67%68.60% 0.91% 1.88%60.03% 1.04% 2.15%42.88% 1.46% 3.01%
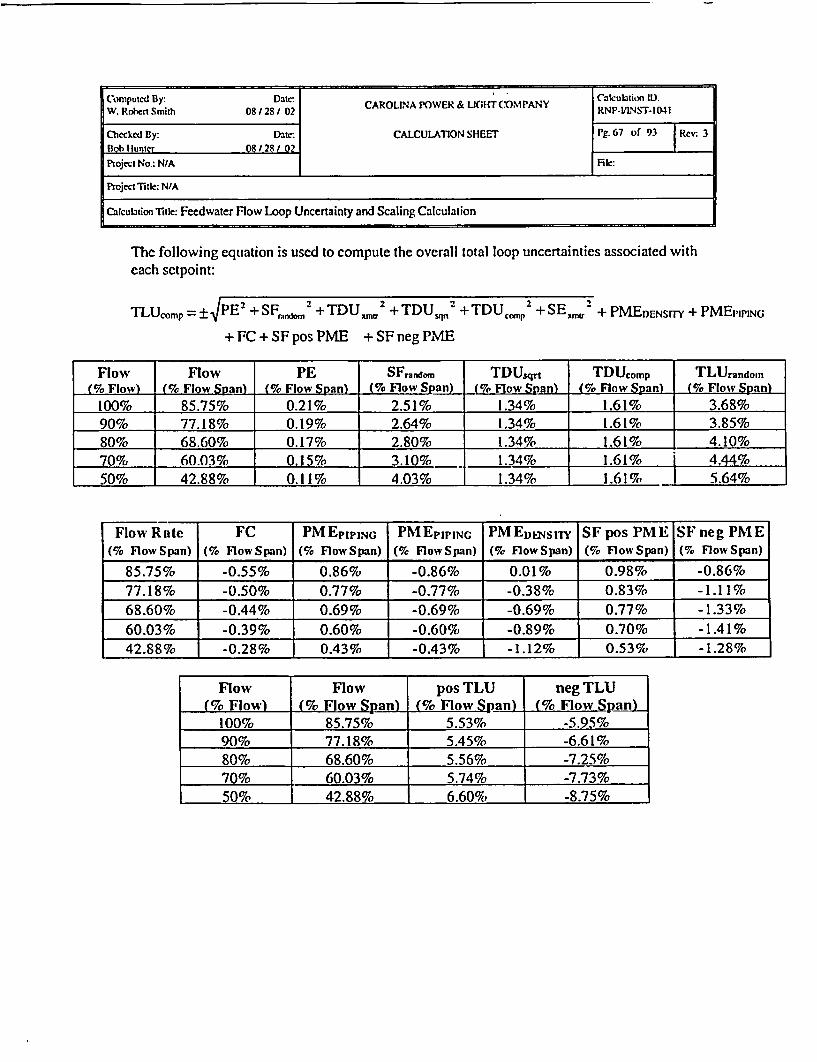
Copue _y- Da. I . .aulo [D.Computed By 08/28/ 02 CAROLINA POWER & UOHTCOMPANY (Rku NTi 104 ID.
Checked By: Date: CALCULATION SHEET Pg.67 of 93 Rcv: 3Rob Huntcr 08 28 / 02Projec No.: N/A Fie:
Project Titk: N/A
Calculation Title: Feedwater Flow Loop Uncertainty and Scaling Calculation
Thc following equation is used to compute the overall total loop uncertainties associated witheach setpoint:
TLUcomp = ± VPE2 + SF,,,oaQ + TDU tr + TDUsqn2 + TDUCCM 2 + SE,, rn2 + PMENENSrrY + PMEI'IPINO
+ FC + SF pos PME + SF neg PME
Flow Flow PE SFrundo. TDUsqrt TDUcomp TLUrandoin(% Flow) (_%e Flow Span) (% Flow Span) (% Flow Span) 1% Flow Span) (% Flow SRan) (% Flow Span)
100% 85.75% 0.21% 2.51% 1.34% 1.61% 3.68%90% 77.18% 0.19% 2.64% 1.34% 1.61% 3.85%80% 68.60% 0.17% 2.80% 1.34% 1.61 % 4.10%70% 60.03% 0.15% 3.10% 1.34% 1.61% 4.44%50% 42.88% 0.11% 4.03% 1.34% 1.61% 1 5.64%
Flow Rate FC PMEPIPING PMEpIPING PMEEDstty SFpos PME SFneg PME(% FlowSpan) (% FlowSpan) (% FlowSpan) (% FlowSpan) (% FlowSpan) (% FlowSpan) (% FlowSpan)
85.75% -0.55% 0.86% -0.86% 0.01% 0.98% -0.86%77.18% -0.50% 0.77% -0.77% -0.38% 0.83% -1.1 1%68.60% -0.44% 0.69% -0.69% -0.69% 0.77% -1.33%
60.03% -0.39% 0.60% -0.60% -0.89% 0.70% -1.41%42.88% -0.28% 0.43% -0.43% -1.12% 0.53% -1.28%
Flow Flow pos TLU neg TLU(% Flow) (% Flow Span) (% Flow SranL t% Flow Span)
100% 85.75% 5.53% -5.95%90% 77.18% 5.45% -6.61%80% 68.60% 5.56% -7.25%70% 60.03% 5.74% -7.73%50% 42.88% 6.60%/s -8.75%

Comiputed By- Date: CAOIAPWR&LGTCMAYCalculation II).W. Robet Smith 08 28 / 02CAROL DAPOWER&LIGHTCOMPANY RN-NINSIN-1041
Checked By Date: CALCULATK)N SHEET Pg.6S of 97t Rev: 3Bob Huntcr 08 / 28 / 02
Project No.: N/A File:
Project Title: N/A
Calculation Titlc: Feedwater Flow Loop Uncenainty and Scaling Calculation
7.4 LOOP AS FOINl) TOLERAN(-F
7.4.1 LAnp AR Fmtindl TnlPrlnce - Indicator FT-476 477. 46, 47 496 AND 497
Per Reference 4.6.1, the following equation is used to calculate the indicator Loop As FoundTolerance (LAFTind):
LArrrind = ± 4AFTrr + AFTn' + AFI',,2 + AFTQ,, 2
Per Design Input 5.1 , the transmitter as found tolerance is converted from % AP Span to %Flow Span with the following equation:
AI-xmtr (% Flow Span) = 10A( AFT (%APSpan)
where AFTxmt, (% AP Span) = ± 1.20% AP Span (Section 6.8.9)
For conservatism, the LAFTind is computed for a flow rate of 100% which yields the mostrestrictive tolerance.
LAFI'ind = ± 2.86% Flow Span

......
Computcd By: 08128t02 CAROLINA POWER& LIGHTCOMPANY RNrCalcNSTionI
Checked By: Date: CALCULATION SHEET Pg. 69 I1 93 Rcv 3
Bob Huntcr 08128 / 02
Pmjcvt No.: N/A File
Project Title: N/A
Calculation Title: Fccdwater Flow Loop Uncertainty and Scaling Calculation
7.412 lVop As Found Tolerance - Ri-crder FR-478. 488 AN) 49R
Per Reference 4.6.1, the following equation is used to calculate the recorder Loop As FoundTolerance (LAFTrec):
LAFTnx = AFTn,U,,, + AFTn 2 + AFE s, 2 + AFT,,
Per Design Input 5.1 1, the transmitter as found tolerance is converted from % AP Span to% Flow Span with the following equation:
F AFITm, (% AP Span)AFTitmir (%t Flow Span) = 1OL~ 2(Flow Rate)
where AFTFnt, (% AP Span) = ± 1.20% AP Span (Section 6.8.9)
For conservatism, the LAFtTcc is computed for a flow rate of 100%} which yields the mostrestrictive tolerance.
LAFTrhc = ± 1.6 1% Flow Span
7.4.3 loop As Found Tolerance - Input to ERFIS
Per Reference 4.6.1, the following equation is used to calculate the ERFIS Loop As FoundTolerance (LAFTERrIS):
LAFTERF1S = i AFTJ 1 2 + AFT,...
LAFTERFIS = ± 1.70% AP Span
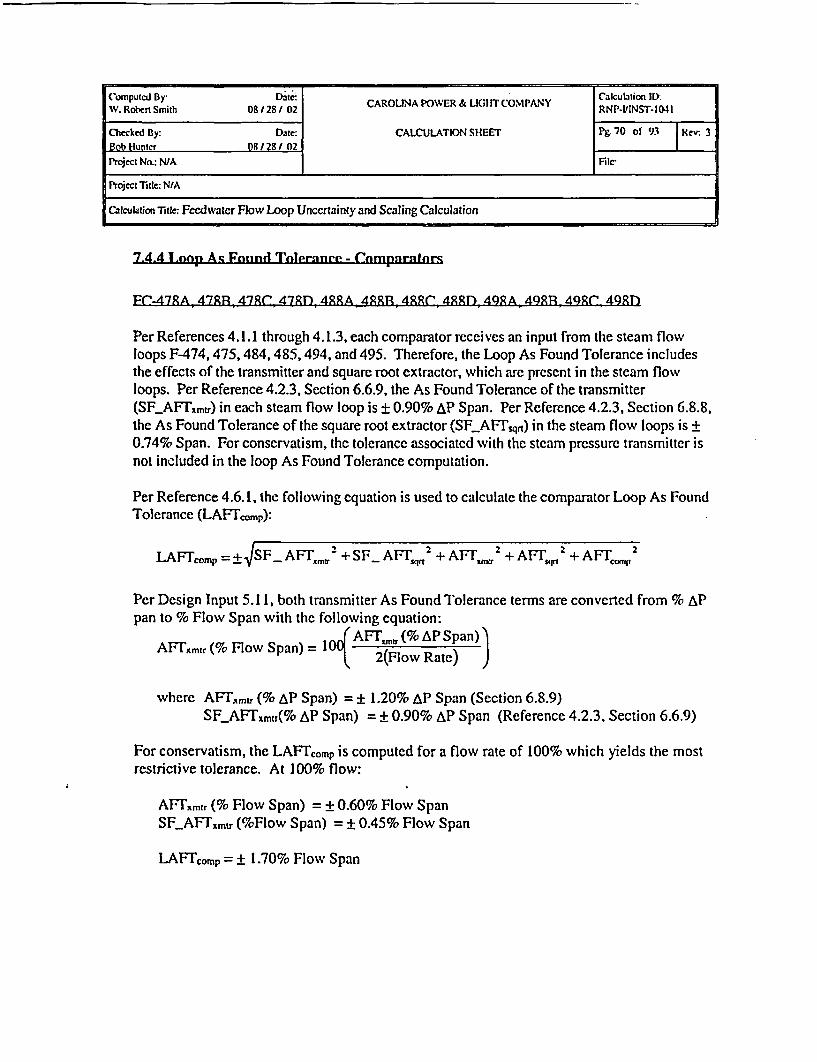
C'omputed By- E~te' Calculation ll):W. Ro*bcn Smr~ith 08 102 CAROLINA POWER & LI;IIT COMPANY RNkuNt-ID.
Checked By: Date: CALCULATION SHEET Pg 70 of 9 | Kev: 3Bob Hunter 08 / 28 / 02 l
Project No.: N/A Filc
Project Title: N/A
Calculation Title: Feedwater Flow Loop Uncertaintly and Scaling Calculation
7-4-4 Loop A: Found Tharnnre - Cnmpnlr.-tjrn
Fl-47RA 47RR 47RC, 47Rfl 4RRA 49R1 4RRt- 4P91l 4)RA. 49RnR 4Q(R 49R1)
Per References 4.1.1 through 4.1.3, each comparator receives an input from the steam flowloops F-474, 475,484,485,494, and 495. Therefore, the Loop As Found Tolerance includesthe effects of the transmitter and square root extractor, which are present in the steam flowloops. Per Reference 4.2.3, Section 6.6.9. the As Found Tolerance of the transmitter(SF_.AF`7xmtr) in each steam flow loop is ± 0.90% AP Span. Per Reference 4.2.3, Section 6.8.8,the As Found Tolerance of the square root extractor (SF._AFTqn) in the steam flow loops is ±0.74% Span. For conservatism, the tolerance associated with the steam pressure transmitter isnot included in the loop As round Tolerance computation.
Per Reference 4.6.1, the following equation is used to calculate the comparator Loop As FoundTolerance (LAFTcamp):
LAFTcomp = +VSF_ AFT,,,, 2 +SF AFTr, + AFIm, 2 + AFTIt 2 + AFT,,f 2
Per Design Input 5.1 1, both transmitter As Found Tolerance terms are converted from % APpan to % Flow Span with the following equation:
AFTt, % Flw San) F~n (%AP Span)'A (% Fo Sn) 2(Flow Rate) )
where A}Txmj (% AP Span) = ± 1.20% AP Span (Section 6.8.9)SF_AFrxmtr(% AP Span) = ± 0.90% AP Span (Reference 4.2.3, Section 6.6.9)
For conservatism, the LAFrcomp is computed for a flow rate of 100% which yields the mostrestrictive tolerance. At 100% flow:
AFTxcmtr (% Flow Span) = ± 0.60% Flow SpanSFAFI ,mtr (%Flow Span) = ± 0.45% Flow Span
LAFTcomp = ± 1.70% Flow Span

ComptedBy:Dut: CROLNA PWER& LGHTCOMANY Calcukition ID:W. Robert Smith 08/28/ 02Oi ~ LN WR IH O~PN RNP-VfINST-1 041
CheckedBy DteCALCULATION SHEET Pg.71 of 93 Rev: 3Bob Hunter 08 / 28 / 02Project No.: NA File:
Projcct Tille: N/A
Calculation Tikf Feedwater Flow Loop Uncertainty and Scaling Calculation
7.; GzROT TP A S FO UND TOLFRA NCJ
7.5 1 Grnmip As Fnund Tnlerirnnce_ ln-dientor F1-476- 477, 486, 487, 496 ANT) 497
Per Reference 4.6.1, the following equation is used to calculate the indicator Group As FoundTolerance (GAFTind):
GAFITid = +VAFTr,, + AFvjr, 1 + AFr,,,1,
GAFI'ind = ± 2.80% Span
7 -5-2 Groulp As Fonind Tnlermine - Rp-corrlr FR-478. 4%% AND 498
Per Reference 4.6.1, the following equation is used to calculate the recorder Group As FoundTolerance (GATfec):
GAFT., = ±VAjq 2 + AFTi,,1 2 + AFTj2
GAFTS, = ± 1.50% Span
7-5-3 Grojilp As Found Tolernnce - Tnpidt tb FRFIS
Per Reference 4.6.1, the following equation is used to calculate the ERFRS Group As FoundTolerance (GAFTERFls):
GAFTERFIS = ± AFTiso1GAFTERs = + 1.20% Span

Ro'mputed By:Dt 0828 02 CAROLINA POWER & LIGHT COMPANY RNPClcINST-i1n41
Checked By: Date: CALCULATION SHEET Pg.72 Of 93 |Rev: 3Bob Hunter 08 /28 / 02
Project No.: N/A File:
Projct litk: N/A
Calculation Title: Feedwater Flow Loop Uncertainty and Scaling Calculation
7-5-4 Grnitp Aq F&itnd Tolernnep - Comparatarc
FC-478A 47R1R 47C, 47RD 488A 481, 488C 49D 49RA 49Rf, 498C' 4qRD
Per References 4.1.1 through 4.1.3, each comparator receives an input from the steam flowloops F-474, 475,484,485,494, and 495. Therefore, the Group As Found Tolerance includesthe effects of the square root extractor, which is present in the steam flow loops. Per Reference4.2.3, Section 6.8.8, the As Found Tolerance of the square root extractor (SFAFrqr) in thesteam flow loops is + 0.74% Span. Per Reference 4.6.1, the following equation is used tocalculate the comparator Group As Found Tolerance (GAFrcomp):
GAFrcomp = ± IISF - AF'sqn2 + AFTIq 0 2 + AFrTc., -
GAFrcomp = ± 1.53% Span
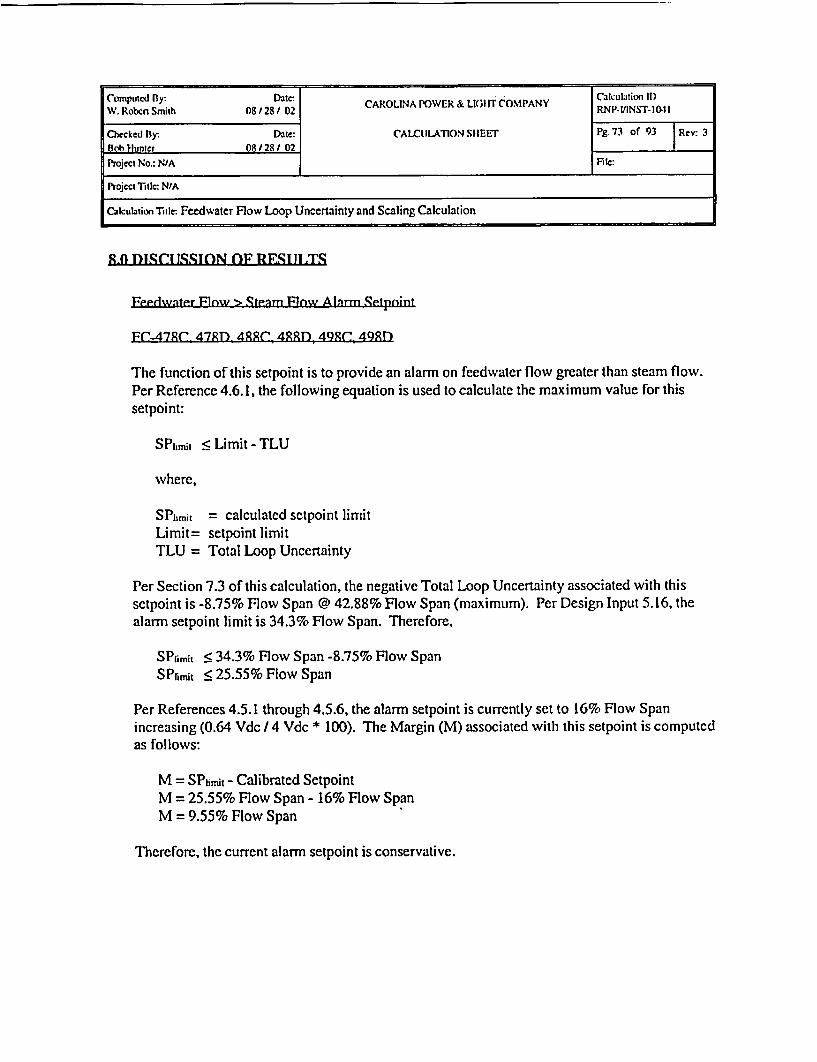
Computd By: Date:2 CAROLINA POWER & LlGIIT COMPANY Calculation IDWV. Robcn Smnith 08 /28/ 02 RNP.VINST-10411
Checked By: Date: CALCULATONSHEEIr Pg. 73 of 93 |Rev: 3Boh Hunter 08/ 28 / 02 .
Project No.: N/A Fite:
Projcct Title: N/A
Calculation Title-. Feedwater Flow Loop Uncertainty and Scaling Calculation
X0 DISC! TS..ION OF RES1 TIMS
Feedwnter Flow > . tcam Flow Alnrm Setpnint
F(-47R(-. 47PRD, 488C 4RRn 49XC' 49R)
The function of this setpoint is to provide an alarm on feedwater flow greater than steam flow.Per Reference 4.6.1, the following equation is used to calculate the maximum value for thissetpoint:
SP1 riti <5Limit - TLU
where,
SPlimit = calculatedsetpointlimitLimit= setpoint limitTLU = Total Loop Uncertainty
Per Section 7.3 of this calculation, the negative Total Loop Uncertainty associated with thissetpoint is -8.75% Flow Span @ 42.88% Flow Span (maximum). Per Design Input 5.16, thealarm setpoint limit is 34.3% Flow Span. Therefore,
SPiimit < 34.3% Flow Span -8.75% Flow SpanSP 1imit < 25.55% Flow Span
Per References 4.5.1 through 4.5.6, the alarm setpoint is currently set to 16% Flow Spanincreasing (0.64 Vdc /4 Vdc * 100). The Margin (M) associated with this setpoint is computedas follows:
M = SPlinit - Calibrated SetpointM = 25.55% Flow Span - 16% Flow SpanM = 9.55% Flow Span
Therefore, the current alarm setpoint is conservative.

Computed By Date:C CAROCNA POWER & U T COMPANY RaIcula1ion ID:W. Rotxrt Sniith 081/281 02 CAOIAPWR&LGTCMAYRNP-t/INST-1D41
Checked By: Date: CALCULATION SHEET Pg. 74 Or 93 Rev: 3Bob FHunter 08 e2lt1 2 l
Project No.- N/A File:
Project Title: N/A
Calculation Title: Feedwater Flow Loop Uncertainty and Scaling Calculation
- Flaw . Ffeflwnfer Flow Alarm .S'tpnint
PF(47RA 478R1 4RXA, 4RtR, 49RA 49RR (switch 9)
The function of this setpoint is to provide an alarm on steam flow greater than feedwater flowbefore a Reactor trip signal is generated on a steam flow I feedwater flow mismatch. PerReference 4.6.1, the following equation is used to calculate the maximum value for thissetpoint:
SPtimmt < Limit - TLU
where,
SPcrit = calculated setpoint limitLimit= setpoint limitTLU = Total Loop Uncertainty
The function of this alarm is to warn the operator before a reactor trip is generated on a steamflow I feedwater flow mismatch, and this alarm is provided by the same dual bistable modulethat provides the reactor trip signal. Any uncertainty at the input of thebistable module willoffset both the reactor trip and alarm setpoints in the same direction. Therefore, the onlyuncertainties which need to be considered for this setpoint are those associated with the bistablewhich provides the reactor trip and the bistable which provides the alarm. Therefore, the totaluncertainty associated with this setpoint is the square root sum of squares of two bistableuncertainty terms. Per Section 6.9.7, the uncertainty associated with one bistable is + 1.6 1%Span. Therefore, the total uncertainty associated with this setpoint is -2.28% Span (negativeportion of the SRSS of two ± 1.61% Span terms). PerDesign Input 5.16, the alarm setpointlimit is 16% Flow Span. Therefore,
SPcntit < 16% Flow Span -2.28% Flow SpanSPtimit < 13.72% Flow Span

Computed By: Date: CAROLINA OWER & LK;HT COMPANY Dckulation ID:W. RobertSmith 081/281/02 RNP-t'INST-1041
Checked By: Date: CALCULATION SHEET Pg. 75 of 93 Rev 3
Bob Hunter 08/28X 02 lPject No.: NIA Filc:
project Title: NIA
Calculation Title: Feedwater Flow Loop Uncertainty and Scaling Calculation
Per References 4.5.1 through 4.5.6, the alarm setpoint is currently set to 12.5% Flow Spanincreasing (0.50 Vdc /4 Vdc * 100). The Margin (M) associated with this setpoint is computedas follows:
M = SPimit - Calibrated SctpointM = 13.72% Flow Span - 12.50% Flow SpanM = 1.22% Flow Span
Therefore, the current alarm setpoint is conservative.
Sten -Rnw / FEct-dwVter low MkMnmtch Setpoint
FC-47RA 47RR 488A 48RR 49RA 4QRR (sVwtch 1)
The function of this setpoint is to provide a Reactor trip signal on a steam flow / feedwater flowmismatch. Per Reference 4.6.1, the following equation is used to calculate the maximum valuefor this setpoint:
SPfrit • AL- TLU
where,
SPiit = calculated setpoint limitAL = Analytical LimitTLU = Total Loop Uncertainty
Per Section 7.3 of this calculation, the negative Total Loop Uncertainty associated with thissetpoint is -8.75% Flow Span @ 42.88% Flow Span (maximum uncertainties for both steamand feedwater flow). Per Design Input 5.16, the setpoint Analytical Limit is34.3% Flow Span.Therefore,
SPiimit < 34.3% Flow Span -8.75% Flow SpanSPlimit • 25.55% Flow Span

Computed By: Duile: CalcultLion ID:W. Robrtx Smith 08 / 28 / 02 CAROUNA POWER & LIGHT COM1PANY RNP.VINST-i041 I
Checked By: Date: CALCULATION SHEET Pg. 76 or 93 Rev: 3llbh Hunter 08/28/ 02
F'rocct No.: N/A File:
Project Title: N/A
Calculuion Title: Feedwater Flow LAop Uncertainty and Scaling Calculation
Per References 4.5.1 through 4.5.6, the setpoint is currently set to 16% Flow Span increasing(0.64 Vdc /4 Vdc * 100). The Margin (M) associated with this setpoint is computed asfollows:
M = SPrimit - Calibrated SetpointM = 25.55% Flow Span - 16% Flow SpanM = 9.55% Flow Span
Per Section 7.5.4 of this calculation, the Group As Found Tolerance (GAFF) is ± 1.53% FlowSpan. Per Reference 4.6.1, the Allowable Value (AV) associated with this setpoint is computedas follows: I
AV < SP + GAFT, where SP = calibrated setpointAV < 16% Flow Span + 1.53% Flow SpanAV < 17.53% Flow Span
The Loop As Found Tolerance (LAFr) of 1.70% Span is computed in Section 7.4.4. PerReference 4.6.1, the Channel Operability Limit (COL) is computed with the following equation:
COL = SP + LAFS, where SP = calibrated setpointCOL = 16% Flow Span + 1.70% Flow SpanCOL = 17.70% Flow Span

Computcd By: Date: CAOIAPWR&LGT0MAYCalculation 1I):W. Robert Smith 08 / 28 / 02 CAROLINA POWER & LI(hT OMPANY RNI I/"NST 1041
Checked By: Date: CALCULATION SHEET Pg. 77 of 93
Bob Huinter 08128 /02
Projeo No.: N/A File:
Project ritle: N/A
Calulation Title: Feedwater Flow Loop Uncertainty and Scaling Calculation
I Additional Margin (9.55% Flow Span)
'Analytical Limit (34.3% Flow Span)
Total Loop Uncertainty (8.75% Flow Span)
Group As Found Tolerance (1.53% Flow Span)
- Channel Operability Limit (17.70% Flow Span
Allowable Value (• 17.53% Flow Span)
Loop As Found Tolerance (1.70% Flow Span)
Setpoint (1 6% Flow Span increasing)
Operating Margin (16% Flow Span)
Normal (0% Flow Span)
Figure I
Steam Flow I Feed water Flow Mismatch Reactor Trip Setpoint Diagram
Per Reference 4.7.2, the current Technical Specification Allowable Value is < 17.65% FlowSpan and the current Technical Specification setpoint is 16% Flow Span increasing. Thecurrent Technical Specification setpoint is conservative. The current Allowable Value is non-conservative and should be revised to a value within the limit computed in thiscalculation. This action has been initiated and is being tracked per LDCR #01-0007.

Computed By: Dite: CAON OE LG2OPN alculation ID:W. Roben Smith 08/28/ 02 R ICAROLINA POWER & LIHT COMPANY NP-aINSk1-04 I
Checked By: Date: CALCILATIONSHEET Pg. 7 of 93 Rev 3Bob Hunter 08/28/ 02
Project No.: N/A File:
Project Title: N/A
Calculation Title: Fcedwater Flow Loop Uncertainty and Scaling Calculation
X.1 IMPACT ON IMPROVED TECHNICAl. SPECIFICATIONS
Based on the results of this calculation, the Technical Specification Allowable Value forthe Steam Flow / Feedwater Flow Mismatch Reactor Trip setpoint should be revised to avalue within the limit computed in this calculation. This action has been initiated and isbeing tracked per LDCR #01-0007.
X.2 IMPACT ON ITFSAR
This calculation results in no changes to the UFSAR.
8.3 iMPACT ONDFIRSIGN BASIS DOCIlMENTS
This calculation impacts no design basis documents.
R4 IMPACT ON OTHER CAL.CIllATTONS
1. RNP-IINST-1120, Uncertainty of Manual Feed Flow Calorimetric Calculation Per OST-0 122. RNP-LJINST-1125, ERFIS Feed Flow Automatic Calorimetric Uncertainty Calculation3. RNP-I/INST-1 121, Uncertainty of ERFIS Feed Flow Calorimetric Calculation4. RNP-IAINST-1040, Steam Flow Loop Uncertainty and Scaling Calculation

Comnputed By: Date: CAROLINA POWER & LIGHT COMPANY Calculation ID):W. Robert Smith OR /28/ 02 RNP-l/INST-1t41
Checked By: Date: CALCULATION SHEET pg 79 OfBobI lunter 08/28/ 02
Project No.: N/A File:
Project Title: N/A
Calculation Title: Fecdwater Flow Loop Uncertainty and Scaling Calculat ion
9-1 IMPACT ON PLANT PROCENDRES
This calculation impacts the following procedures:
1. LP-35 1, Steam Generator #I Level (F.W. Flow) Channel 4762. LP-352, Steam Generator #2 Level (F.W. Flow) Channel 4863. LP-353, Steam Gencrator #3 Level (F.W. Flow) Channel 4964. LP-354, Steam Generator #I Level (F.W. Flow) Channel 4775. LP-355, Steam Generator #2 Level (F.W. Flow) Channel 4876. LP-356, Steam Generator #3 Level (F.W. Flow) Channel 4977. MMM-006, Appendix B-4 Calibration Data Sheets8. MST-0 14, Steam Generator Pressure Protection Channel Testing9. PIC-609, Hagan Analog Computer10. PIC-844, Yokogawa Recorders
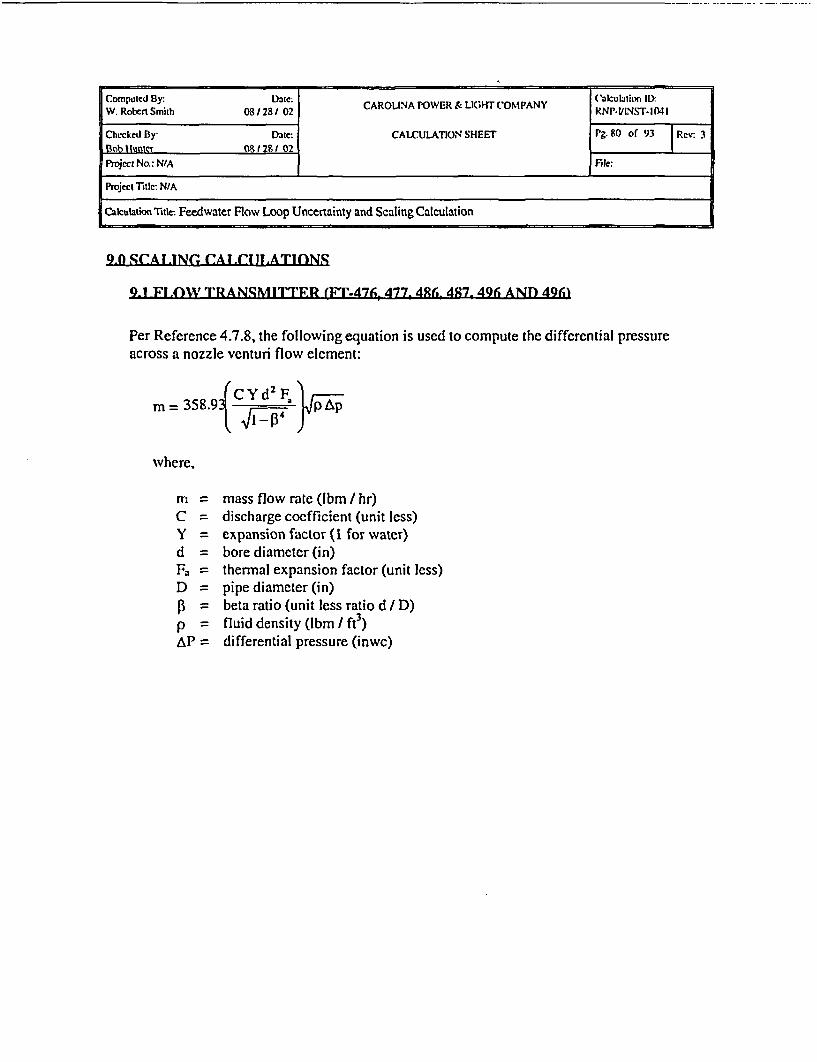
Computed By: Date; C'alculation ID:W. Robert Smith 081 28/ 02 CAROLINA POWER & LIGHT COMPANY RNP-lIINST.41 I
ChMcked By: Date: CALCULATION SHEET r9.8o of 93 Rcv: 3Bob Hlunter n6t 29 02
Project No.: N/A File:
Project Title: N/A
Calculation Title: Feedwater Flow Loop Uncertainty and Scaling Calculation
940 SA I ING ( A 1.C IJI ATIONS
9-1 Fl .OW TRANSMITTFR (Fr-47h. 477, 486 4X7. 496 AND 496fi
Per Reference 4.7.8, the following equation is used to compute the differential pressureacross a nozzle venturi flow element:
m = 3 58 9 {C Yd2F-- AP
where,
C =Y =
d =Fa =D =P =P =
AP=
mass flow rate (Ibm / hr)discharge coefficient (unit less)expansion factor (I for water)bore diameter (in)thermal expansion factor (unit less)pipe diameter (in)beta ratio (unit less ratio d / D)fluid density (Ibm / ft3)differential pressure (inwc)
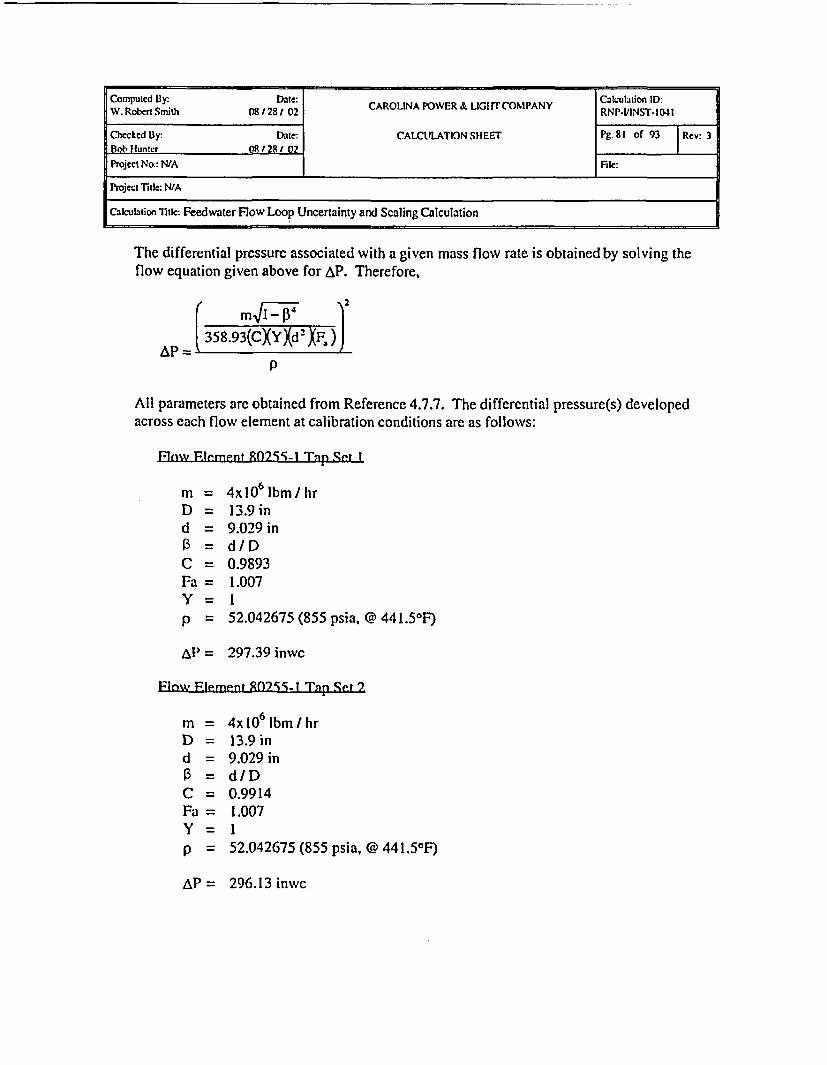
Computed By: Date0 CAROLINA POWER & LIGHT COMPANY Calculation ID:W. Robctt Smith 081/281 02 CRLA W &IGT1AYRNP-V'INST-1041
Checked By- Date:- CALCULATION SHEET Pg 81 of 93 |ReV: 3
Bot, Huntcr 08/28 !02
Project No.: N/A File:
Project Title: N/A
Calcubtion Title: Feedwater Flow Loop Uncertainty and Scaling Calculation
The differential pressure associated with a given mass flow rate is obtained by solving theflow equation given above for AP. Therefore,
358.93(CXYXd2 XAF )AP = --
p
All parameters are obtained from Reference 4.7.7. The differential pressure(s) developedacross each flow element at calibration conditions are as follows:
Flow Flement Pf0255-1 Tnp 9t-t I
m = 4x 10 Ibm / hrD = 13.9ind = 9.029 in
= d/DC = 0.9893Fa = 1.007Y =Ip 52.042675 (855 psia, @ 441.5°F)
P= 297.39 inwc
Flnw Flement 80259-1 Tap .et 2
m = 4x 10 Ibm I hrD = 13.9 ind = 9.029 inf = d/DC = 0.9914Fa = 1.007Y = Ip = 52.042675 (855 psia, @ 441.5°F)
AP = 296.13 inwc
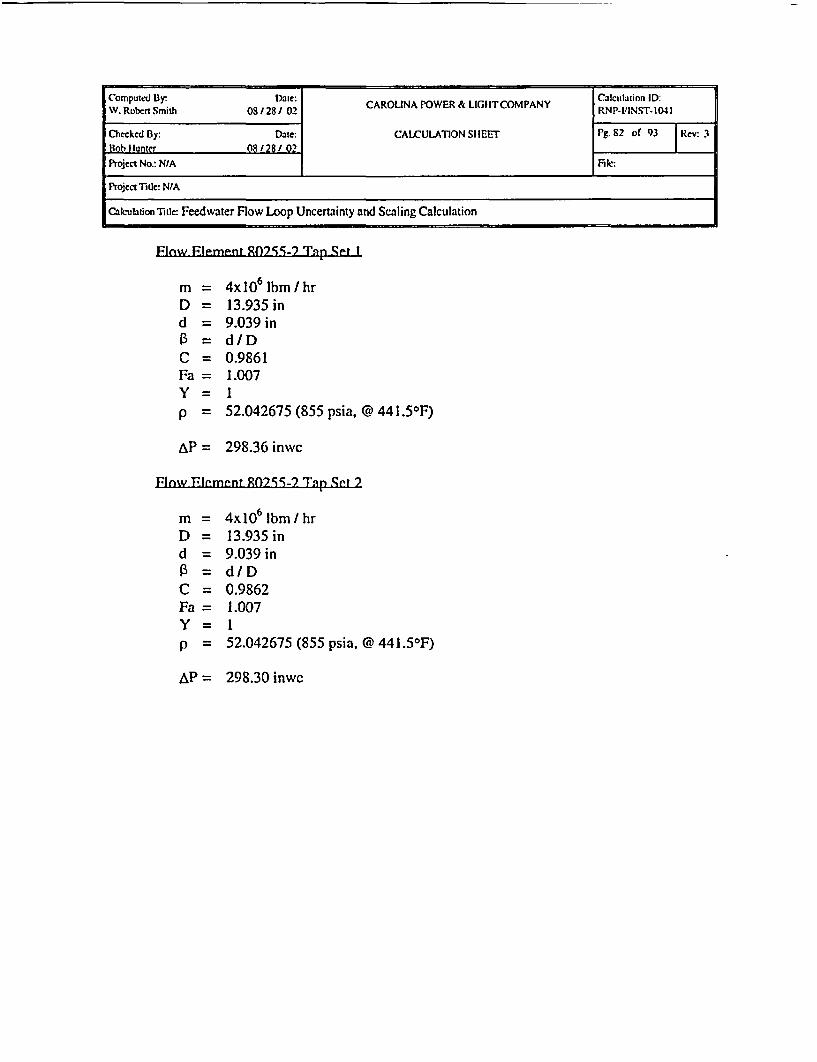
Computed By: Date: CRUAPWR&LGTOM NYCalculation ID:W. Robet Smith 081281 02 CAROUNA POWER & LIGFITCOMPANY RNP-VINST.W104
Checked By: Date: CALCULATION SHEI Pg. 82 of 93 |Rev:Hob Hunter 08/28/ 02Project No.: N/A fie:
Project Title: N/A
Calculation Trtl- Feedwater Flow Loop Uncertainty and Scaling Calculation
Flow Flement 90?25-2 Tap Set I
m = 4x10⁶ Ibm / hrD = 13.935 ind = 9.039 in13 = dIDC = 0.9861Fa = 1.007Y =1p = 52.042675 (855 psia, @ 441.5 0F)
AP= 298.36 inwc
Flow Flemfmnt Rfl255- Tnp .Set 9
m = 4x10⁶ Ibm / hrD = 13.935 ind = 9.039 in13 = d/DC = 0.9862Fa = 1.007Y =1p = 52.042675 (855 psia, @ 441.50F)
AP = 298.30 inwc

Computed By: Chte: CAROLIA POWER & LIG1TCOMPANY Calcultion ID.W. Rcbcn Smihb 08 / 28/ 02 RNP-I/INST-1041
Checked By: Date: CALCULATION SHEET Pg.83 of 93 Rev: 3BIo tlunler 08/28/ 02 1
Project No.: N/A I File:
P'roject Title N/A
Calculation Title: Feedwater Flow Loop Uncertainty and Scaling Calculation
Flow Flement Rfl955 3 Tar Cet I
m = 4x10⁶ Ibm / hrD = 13.93 ind = 9.026 in13 = d/DC = 0.9919Fa = 1.007Y = 1p = 52.042675 (855 psia, @ 441.5°F)
AP = 296.86 inwc
Flow Flerment 8075 T anp Set 2
m = 4x10⁶ Ibm / hrD = 13.93 ind = 9.026 in1 = d/DC = 0.9910Fa = 1.007Y =1p = 52.042675 (855 psia, @ 441.5°F)
AP = 297.40 inwc
The average diffcrential pressure for all flow elements I tap sets is 297.41 inwc. Forconvenience, the transmitters are calibrated from 0 to 300 inwc.
Per Reference 4.7.4, FT-476, 486, 496 are Rosemount model I 151DP5 differential pressuretransmitters. Per Reference 4.7.4, FT477 and 487 are Rosemount model I 153DA5differential pressure transmitters. Per Reference 4.7.4, FT-497 is a Rosemount model1 153HA5 differential pressure transmitter. Per Reference 4.4.3, each range code 5transmitter may be calibrated to a span within the range of 0- 125 to 0-750 inwc.

Computed Ily- CAODNaOWR& IHeOIPN Cakutiiton ID:W. Robert Smith 08128 / 02 CAROLIN vNR _ L_ CO LINST1I41
Checked By: Date: CALCULATION SHEET Pg. 84 of 93 Rev: 3Bob Hunter 08/28/ 02
Project No.: N/A FlIc
Project Title: N/A
Calculation Title; Feedwater Flow Loop Uncertainty and Scaling Calculation
Fr-476 4R6 sqnrl 496
Per Refcrcnce 4.4.3, a static pressure span effect of 0.81% of input per 1000 psi is specifiedfor a Rosemount 115 IDP5 transmitter. The static pressure correction is performed for anominal feedwater pressure of 840 psig. This effect is calibrated out by adjusting thecalibrated range of the transmitter as follows:
0.81%of input 840p = 0.680% of input1 I000 psi)
For 100 percent span,
0.680% (300 inwc / 100%) = 2.04 inwc2.04 inwc (100% Span / 300 inwc) = 0.68% Span0.68% Span (16 mA / 100% Span) = 0.109 mA20.000 mA + 0.109 mA = 20.109 mA20.109 mA (250 Q) = 5.027 Vdc
Therefore, the transmitters are calibrated from 1.000 Vdc (0 inwc) to 5.027 Vdc (300 inwc).
The following equation is used to compute the required transmitter output for a givendifferential pressure input:
E = (4.027 Vdc AP inwc + 1.000 Vdc300inwc)
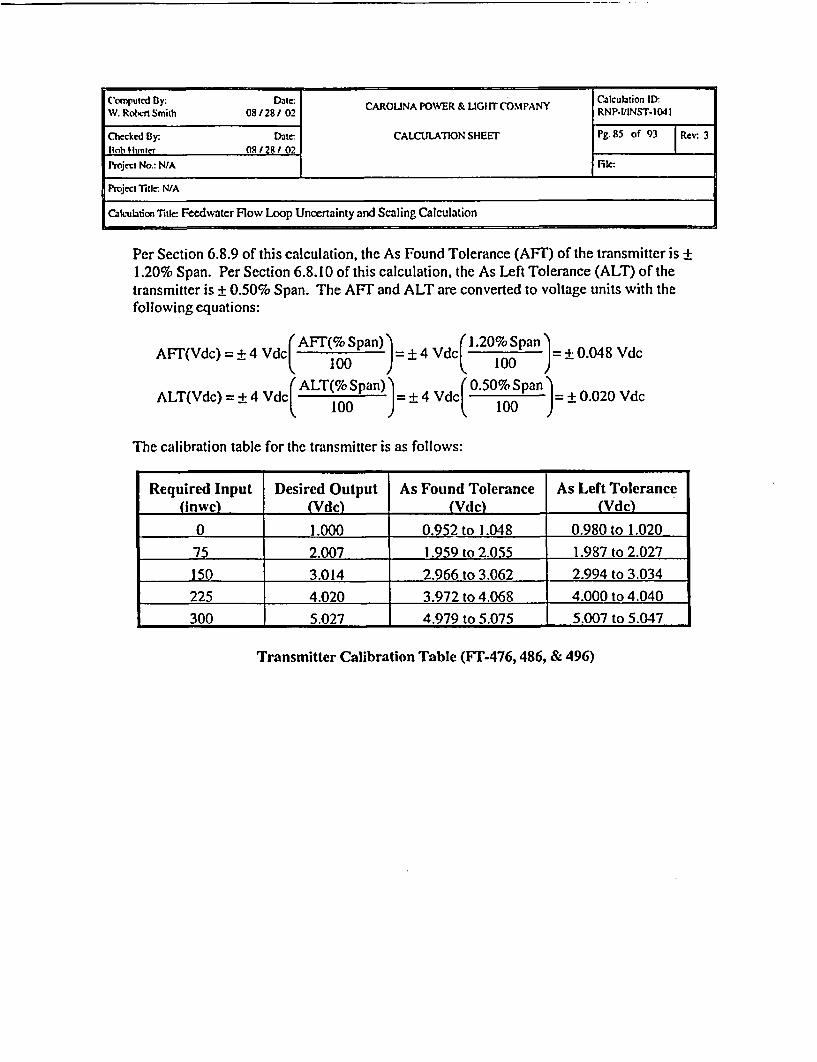
Computed By: Date: CAROLINA POWER & LIGHT COMPANY Calculation ID:W. Rotert Smith 08 128 / 02 COLN ~'R&IGTCOPAYRNP-IIINST-1041I
Checked By: Date: CALCUILATION SHEET Pg. B5 of 93 Rev: 3lob Huntcr OR8 28 / 0I
Project No.: N/A IIAk:
ProjectlTi l N/A
Calculation Titk: Feedwater Flow Loop Uncertainty and Scaling Calculation
Per Section 6.8.9 of this calculation, the As Found Tolerance (AFT) of the transmitter is +1.20% Span. Per Section 6.8.10 of this calculation, the As Left Tolerance (ALT) of thetransmitter is ± 0.50% Span. The AFT and ALT are converted to voltage units with thefollowing equations:
AFI(Vdc) = ± 4 Vdc 1SVdca 0 Spa 0.048 VdcL 0 100)ALT(% Span) . 0.50% Span
ALT(Vdc) = ± 4 Vdc 100 =+4 Vdc 0 = ±0.020 Vdc
The calibration table for the transmitter is as follows:
Required Input Desired Output As Found Tolerance As Left Tolerance(inwc) (Vdc) (Vdc) (Vdc)
0 1.000 0.952 to 1.048 0.980 to 1.020
75 2.007 1.959 to 2.055 1.987 to 2.027
150 3.014 2.966 to 3.062 2.994 to 3.034
225 4.020 3.972 to 4.068 4.000 to 4.040
300 5.027 4.979 to 5.075 5.007 to 5.047
Transmitter Calibration Table (FT-476,486, & 496)

Computed By: Date: AOIAPWR IH OPN C2tcula on ID:W. Robert Smith 08/281 02 CAROLINA POWER & LIGHT COMPANY RNI'-IIINST.1041
Lhecked By: DIae: CALCULATION SHEEI Pg.8G of 93 |Rcv: 3HLob Hunter 08128/ 02 1Project No.: N/A Fale:
ProjectTitl: NI A
Cacuation Tte : Feedwater Flow Loop Uncertainty and Scaling Calculation
FT-477 4R7 alnd 497
Per Reference 4.4.3, a static pressure span effect of 1.00% of input per 1000 psi is specifiedfor the Rosemount 1 153DA5 and 1 153HA5 transmitter. The static pressure correction isperformed for a nominal feedwater pressure of 840 psig. This effect is calibrated out byadjusting the calibrated range of the transmitter as follows:
1.00% of inputd 840 psi J= 0.840% of input
For 100 percent span,
0.840% (300 inwc / 100%) = 2.52 inwc2.52 inwc (100% Span / 300 inwc) = 0.84% Spar.0.84% Span (16 mA / 100% Span) = 0.134 mA20.000 mA + 0.134 mA = 20.134 mA20.134 mA (250 LŽ) = 5.034 Vdc
Therefore, the transmitters are calibrated from 1.000 Vdc (0 inwc) to 5.034 Vdc (300 inwc).
The following equation is used to compute the required transmitter output for a givendifferential pressure input:
( 4.034 Vdc AP inwc + 1.000 Vdct 300inwc )

Computled By: D2at: CAROLINA POWEa & LIGHT COMPANY Clculation 11);W. Rotert Smith 081/281/ 02 CRLN W &lr OMAYRNP.VINST. 1041
Checked By: Date: CALCULATION SHEEr Pg. 87 of 93 Rc v 3Bob tfunte 08/28 / 02 lProject No.: N/A File:
Project itle. N/A
Calculation Title: Feedwater Flow Loop Uncertainty and Scaling Calculation
Per Section 6.6.9 and 6.7.9 of this calculation, the As Found Tolerance (AFT) of thetransmitter is + 0.87% Span. Per Section 6.6.10 and 6.7.10 of this calculation, the As LeftTolerance (ALT) of the transmitter is ± 0.50% Span. The AFT and ALT are converted tovoltage units with the following equations:
AFT'(Vdc)=±4 Vdc AFT(% Span) 4 V 0.87% Span 0.035 Vdc100 100 )
ALT(% Span) 0.50% SpanALT(Vdc) = ± 4 Vdc 100 =+4 Vdc (00 = + 0.020 Vdc
f anmttsans0 100
The calibration table for the transmitter is as follows:
Required Input Desired Output As Found Tolerance As Left Tolerance(inwc) (Vdc) (Vdc) (Vdc)
0 1.000 0.965 to 1.035 0.980 to 1.020
75 2.009 1.974 to 2.044 1.989 to 2.029
150 3.017 2.982 to 3.052 2.997 to 3.037
225 4.026 3.991 to 4.061 4.006 to 4.046
300 5.034 4.999 to 5.069 5.014 to 5.054
Transmitter Calibration Table (FT-477, 487, & 497)

Computed By: Date: CAROLLNA POWER & LIGH'fCOMPANY Calculation ID:W.Robert Smith 08/28/ 02 RNP-I/INST-1041
('hecked By: Date: CALCULATON SHEET Pg. 88 of 93 Rcva 3Bob Hunter X/28/ 02 1
Pject No.: N/A Me
Project 'fite: N/A
Calculation Tilte Feedwater Flow Loop Uncertainty and Scaling Calculation
9.2 V.ROT.ATOR MODT IM.E (FM-476A. 476R, 477A, 477H. 4R6A. 486R, 4R7A, 487R,496A. 496i1, 497A, AND 497H)
The isolator transfer function is as follows:
Eo =E
Per Section 6.10.8 of this calculation, the As Found Tolerance (AFT) of the isolator is ±1.20% Span. Per Section 6.10.9 of this calculation, the As Left Tolerance (ALT) of theisolator is ± 0.50% Span. The AST and ALT are converted to voltage units with thefollowing equations:
(AFT(% Span) = 4 1.20% Span VVdc 100 =+ 4 Vdc 0.048 Vdc
ALT(% Span) 0.50% Span = 0ALT(Vdc) = +4 Vdc= +4 Vdc( 100 = ±0.020 Vdc
The calibration table for the isolator is as follows:
Required Input Desired Output As Found Tolerance As Left Tolerance(Vdc) (Vdc) (Vdc) (Vdc)1.000 1.000 0.952 to 1.048 0.980 to 1.0202.000 2.000 1.952 to 2.048 1.980 to 2.0203.000 3.000 2.952 to 3.048 2.980 to 3.0204.000 4.000 3.952 to 4.048 3.980 to 4.0205.000 5.000 4.952 to 5.048 4.980 to 5.020
Isolator Calibration Table

Computed By. Date; AOIAPWR IH OPN C2lculation ID:W. Robert Smith 08/28/ 02 C _ & m COMPANY RNP.YINST-1041
Checked By Date: CALCULATION SHEET Pg89 of 93 | Recv: 3Bob Hunter 08/ 29/ 02Project No.: N/A I Ic:
Project Title: N/A
Calculation Tuile: Feedwater Flow Loop Uncertainty and Scaling Calculation
9-' COMPARATOR MODULFE (FC-47RA, 47Rr, 4SRA. 48RR, 498A, AND 498B)
Each comparator provides a Feedwater Flow / Steam Flow mismatch Reactor trip signal(switch 1), and a Feedwater Flow / Steam Flow mismatch alarm (switch 2). The followingequation is used to compute the voltage representation of the comparator setpoints:
Setpoint(Vdc) = 4 Vd Setpoint(%)V 4100%
Per Reference 4.7.2, the Feedwater Flow I Steam Flow mismatch Reactor trip setpoint is6.4x 105 Ibm / hr which equates to 16% Flow Span or 0.64 Vdc. The alarm selpoint is set to12.5% Flow Span which equates to 0.50 Vdc.
Per Section 6.9.8 of this calculation, the As Found Tolerance (AFT') of the comparator is +1.16% Span. Per Section 6.9.9 of this calculation, the As Left Tolerance (ALT) of thecomparator is ± 0.50% Span. The AFT and ALT are converted to voltage units with thefollowing equations:
AFT(Vdc) = ±4 Span) 1. 16% Span 0.046 Vdc
Vdc(dc A % +) = 4 d100c 100 )
ALT(Vdc) = ± 4 Vdc ( p) = + 4 Vdc 050 0S p = ± 0.020 Vdc
The following table provides calibration values for the comparators:
Setpoint Setpoint As Found Tolerance As Left Tolerance(%) Vdel (Vdc) (Vdc)
16 0.640 0.594 to 0.686 0.620 to 0.660
12.5 0.500 0.454 to 0.546 0.480 to 0.520
Comparator Calibration Table
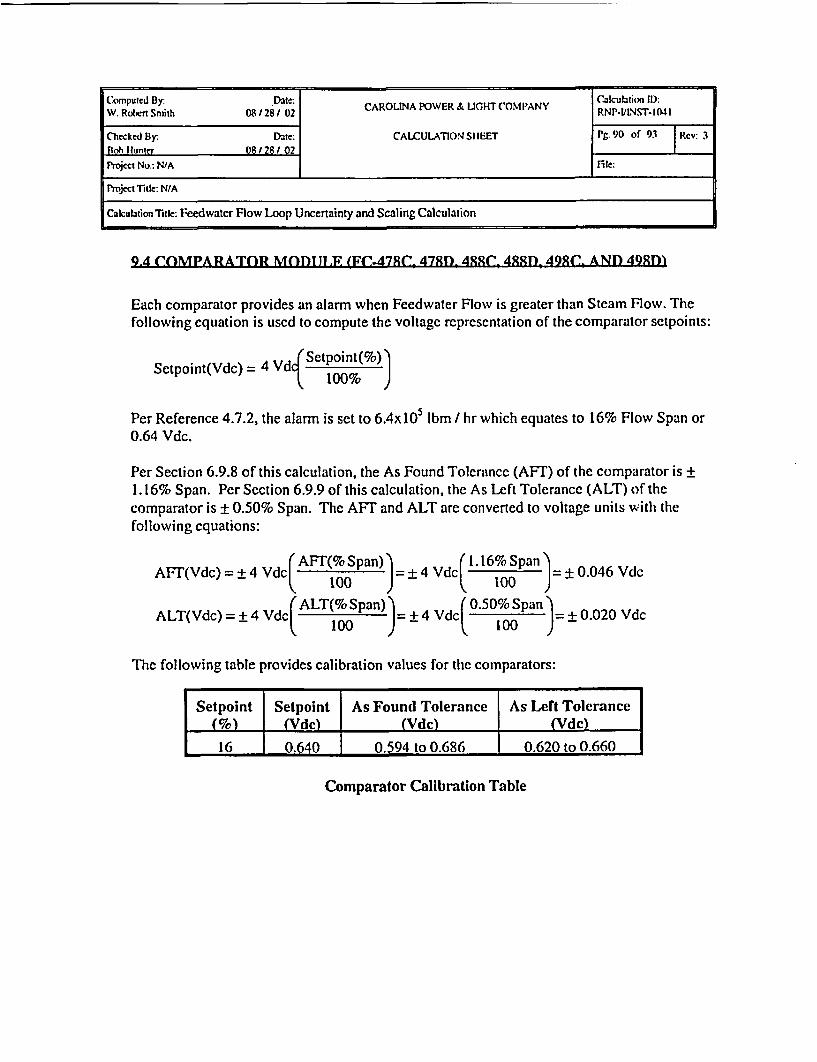
Computed By: 'Date: AOIAPWR& IH O IN Calculation 11):W. Romt Smth : 08 /281 02 CAROLINA POWER& UCHTCOMI'ANYRNP-VINST-I(tI
Checked By Date: CALCULATIONSHEET Pr. 90 of 93 |Kcv 3noh Hunter 08/28/ 02Projcct No: N/A File:
Project Title: N/A
Calculation Title: Feedwater Flow Loop Uncertainty and Scaling Calculation
9.4 COMPARATOR MOM JL.F (FC-478C 47RD 488SC 49R1) 49RC(: AND 49RD)
Each comparator provides an alarm when Feedwater Flow is greater than Steam Flow. Thefollowing equation is used to compute the voltage representation of the comparator setpoints:
Setpoint(Vdc) = 4 Vdf Setpoint(%)100%)
Per Reference 4.7.2, the alarm is set to 6.4x I Ibm / hr which equates to 16% Flow Span or0.64 Vdc.
Per Section 6.9.8 of this calculation, the As Found Tolerance (AFT) of the comparator is +1.16% Span. Per Section 6.9.9 of this calculation, the As Left Tolerance (ALT) of thecomparator is ± 0.50% Span. The AFT and ALT are converted to voltage units with thefollowing equations:
AFT(Vdc) = ± 4 Vdc AF( S = + 4 Vdc 1.16%Span + 0.046 Vdc100 to
(ALT(% Span) (0.50% Span'ALT(Vdc) = ± 4 Vdc 10 ) = +4 Vdc 1090 = + 0.020 Vdc
The following table provides calibration values for the comparators:
Setpoint Setpoint As Found Tolerance As Left Tolerance_ (%) (Vdc) (Vdc) (Vdc)
16 0.640 0.594 to 0.686 0.620 to 0.660
Comparator Calibration Table

Computed By: Date: CAROLINA POWER & LIGHT COMPANY Calculation ID:W. Robert Smith 081281 02 RNP-VINS'r 1041
Checked By: Date: CALCULATION SHEET 18 91 Of 93 Re 3
Bob Huntcr 08 121 / 02
Project No.: NIA Rie:
Project Title: NlA
Calculation Tatk: Feedwater Flow Loop Uncertainty and Scaling Calculation
9 S Q(IJARF ROOT MODULTF, (h.M-476 477 4R6- 487 49f6 AND 497,
Each square root module has the following transfer function:
Eo = 2 Vdc4 i + 1.000 Vdc
Per Section 6.11.8 of this calculation, the As Found Tolerance (AFT) of the square rootmodule is + 0.67% Span. Per Section 6.11.9 of this calculation, the As Left Tolerance (ALT)of the square root module is ± 0.50% Span. The AFI and ALT are converted to voltage unitswith the following equations:
(AFr(% Span) (0.67% SpanAFT(Vdc)=4Vd 100 = + 4 Vdct 1 = +0.027 Vdc
ALT(% Span) (0.50% SpanALT(Vdc) = ± 4 Vdc( 100 =+4 Vdc 100 +0.020 Vdc
The calibration table for the square root module is as follows:
Required Input Desired Output As Found Tolerance As Left Tolerance(Vdc) (Vdc) (Vdc) (Vdc)
1.000 1.000 0.973 to 1.027 0.980 to 1.020
1.040 1.400 1.373 to 1.427 1.380 to 1.4201.250 2.000 1.973 to 2.027 1.980 to 2.0202.000 3.000 2.973 to 3.027 2.980 to 3.0203.250 4.000 3.973 to 4.027 3.980 to 4.020
5.000 5.000 4.973 to 5.027 4.980 to 5.020
Square Root Module Calibration Table

Computed By; Date: CAROLINA POWER & LIGHT COMPANY (alculation ID:W. RobertSmith 08128/ 02 RNP-I/INT.I r-041I
Checked By: Date: CALCULATION SHEET .92 of 93 | Rev: 3Bob Hunter 0R / 281 02 .
Project No.: N/A File:
Project Title: N/A
Calculation Title: Fcedwatcr Flow Loop Uncertainty and Scaling Calculation
9.6 INDICATOR (Ff-476, 477, 4R6, 487, 496, AND 497!
The indicators are scaled to provide an output of 0 to 4x 10⁶ Ibm I hr for a 1 to 5 Vdc input.Therefore, the transfer function for the indicator is as follows:
1 = 4 x 10 bm / hr (E-1.000 Vdc)
Per Section 6.12.9 of this calculation, the As Found Tolerance (AFT) of the indicator is +2.44% Span. Per Section 6.12.10 of this calculation, the As Left Tolerance (ALT) of theindicator is ± 2.00% Span. The AFT and ALT are converted to pressure units with thefollowing equations:
( AFT(% Span) ( ± 2.44% Span A8
AFT(Vdc) = +4 Vdc 1=±4Vdc 1 0 J= ±0.098 Vdc(ALT(% Span) (2.00% Span '
ALT(Vdc) = ± 4 Vdc 100 ) = + 4 Vdc 200%0 S = + 0.080 Vdc
The following table provides calibration values for the indicators:
Desired Input Required Output As Found Tolerance As Left Tolerance(Vdc) (106 Ibm / r) (Vdc) (Vdc)
1.000 0 0.902 to 1.098 0.920 to 1.0801.400 0.4 1.302 to 1.498 1.320 to 1.4802.000 1 1.902 to 2.098 1.920 to 2.080
3.000 2 2.902 to 3.098 2.920 to 3.0804.000 3 3.902 to 4.098 3.920 to 4.080
5.000 4 4.902 to 5.098 4.920 to 5.080
Indicator Calibration Table

Computed By: Datc: CAROLINA POWER & LIGHT COMPANY Calculation D):W. Robtvt Smith 08 128 / 02 RNP-V/IN.T-1041
Checked By: Date: CALCULATION SHEET Pg.93 of 93 Rev: 3Bob Huntcr 08 / 28 1 02 _
Project No.: NIA Fik:
Project Talc: N/A
Calculation Title: Fecdwater Flow Loop Uncertainty and Scaling Calculation
9-7 RFCORDER (FR.47R, 48g. ANY) 498X
The recorders are scaled to provide an output of 0 to 4x0I ibm / hr for a 1 to 5 Vdc input.Therefore, the transfer function for the recorder is as follows:
Ro = 4 x 10' lbm/ hr (E - 10 0 0 Vdc)Ro 4 Vdc )
Per Section 6.13.9 of this calculation, the As Found Tolerance (AFT) of the recorder is ±0.59% Span. Per Section 6.13.10 of this calculation, the As Left Tolerance (ALT) of therecorder is ± 0.50% Span. The AFT and ALT are converted to pressure units with thefollowing equations:
AFf(Vdc) = ± 4 (c AFT (% Span) 4Vd( 0.59% Span = 0.024 Vdc
ALT(Vdc) = ± 4 Vdc" 10 S = ± 4 Vdc 0.50% Span ± 0.020 VdcALT(% Span) 0.100AL(dc 4Vc 100 = ) d 0 .2 d
The following table provides calibration values for the recorders:
Desired Input Required Output As Found Tolerance As Left Tolerance(Vdc) (106 Ibm / hr) (Vdc) (Vdc)
1.000 0.00 0.976 to 1.024 0.980 to 1.0201.400 0.40 1.376 to 1.424 1.380 to 1.4202.000 1.00 1.976 to 2.024 1.980 to 2.020
3.000 2.00 2.976 to 3.024 2.980 to 3.020
4.000 3.00 3.976 to 4.024 3.980 to 4.020
5.000 4.00 4.976 to 5.024 4.980 to 5.020
Recorder Calibration Table
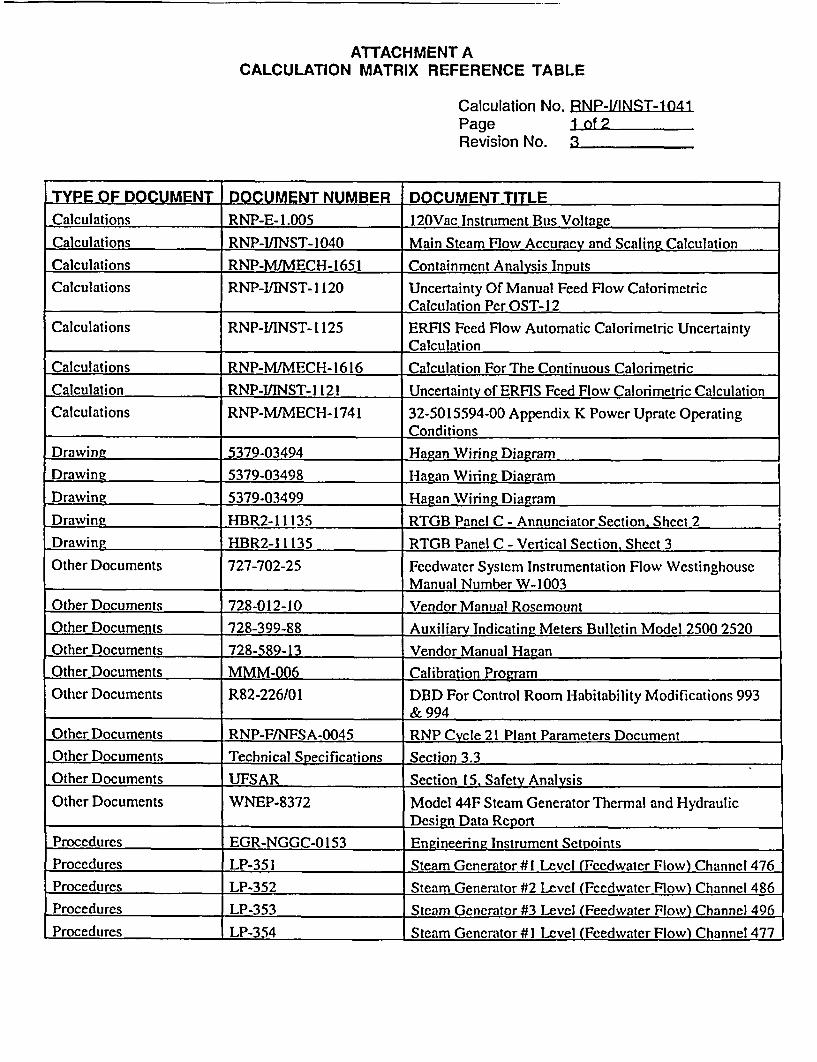
ATTACHMENT ACALCULATION MATRIX REFERENCE TABLE
Calculation No. RNP-I/INST-1041Page 1 of 2Revision No. 3
TYPE OF DOCUMENT DOCUMENT NUMBER DOCUMENT TITLECalculations RNP-E-1.005 12OVac Instrument Bus Voltage
Calculations RNP-IIINST-1040 Main Steam Flow Accuracy and Scaling CalculationCalculations RNP-M/MECH- 1651 Containment Analysis InputsCalculations RNP-IIINST-1 120 Uncertainty Of Manual Feed Flow Calorimetric
Calculation Per OST- 12
Calculations RNP-LIINST-1125 ERFIS Feed Flow Automatic Calorimetric UncertaintyCalculation
Calculations RNP-M/MECH-1616 Calculation For The Continuous CalorimetricCalculation RNP-IIINST-1 121 Uncertainty of ERFIS Feed Flow Calorimetric Calculation
Calculations RNP-M/MECH-1741 32-5015594-00 Appendix K Power Uprate OperatingConditions
Drawing 5379-03494 Hagan Wiring DiagramDrawing 5379-03498 Hagan Wiring DiagramDrawing 5379-03499 Haean Wiring Diagram
Drawing HBR2-11135 RTGB Panel C - Annunciator Section. Sheet 2Drawing HBR2-1 1135 RTGB Panel C - Vertical Section, Sheet 3Other Documents 727-702-25 Feedwater System Instrumentation Flow Westinghouse
Manual Number W-1003
Other Documents 728-012-10 Vendor Manual Rosemount
Other Documents 728-399-88 Auxiliary Indicating Meters Bulletin Model 2500 2520Other Documents 728-589-13 Vendor Manual HaganOther Documents MMM-006 Calibration ProgamOther Documents R82-226/01 DBD For Control Room Habitability Modifications 993
& 994
Other Documents RNP-F/NFSA-0045 RNP Cycle 21 Plant Parameters DocumentOther Documents Technical Specifications Section 3.3Other Documents UFSAR Section 15. Safety Analysis
Other Documents WNEP-8372 Model 44F Steam Generator Thermal and HydraulicDesign Data Report
Procedures EGR-NGGC-0153 Engineering Instrument Setnoints
Procedures LP-351 Steam Generator # I Level (Feedwater Flow) Channel 476Procedures LP-352 Steam Generator #2 Level (Feedwater Flow) Channel 486
Procedures LP-353 Steam Generator #3 Level (Feedwater Flow) Channel 496
Procedures LP-354 Steam Generator #I Level (Feedwater Flow) Channel 477

ATTACHMENT ACALCULATION MATRIX REFERENCE TABLE
Calculation No. RNP-I/INST-1041Page 2 of 2Revision No. 3
TYPE OF DOCUMENT DOCUMENT NUMBER DOCUMENT TITLEProcedures LP-355 Steam Generator #2 Level (Feedwater Flow) Channel 487
Procedures LP-356 Steam Generator #3 Level (Feedwater Flow) Channel 497
Procedures TMM-026 List Of Regulatorv Guide 1.97 Components
Procedures MMM-006 Calibration Data Sheets
Appendix B-4
Procedures PIC-844 Yokoeawa Recorders
Other Documents DBD1R87038/SDO6 DBD Reactor Protection and Safeguards System
Drawings 5379-03485 Hagan Wiring Diagram
Drawings 5379-03486 Hagan Wiring Diagrams
Drawin-s 5379-03487 Hapan Wiring Diagrams
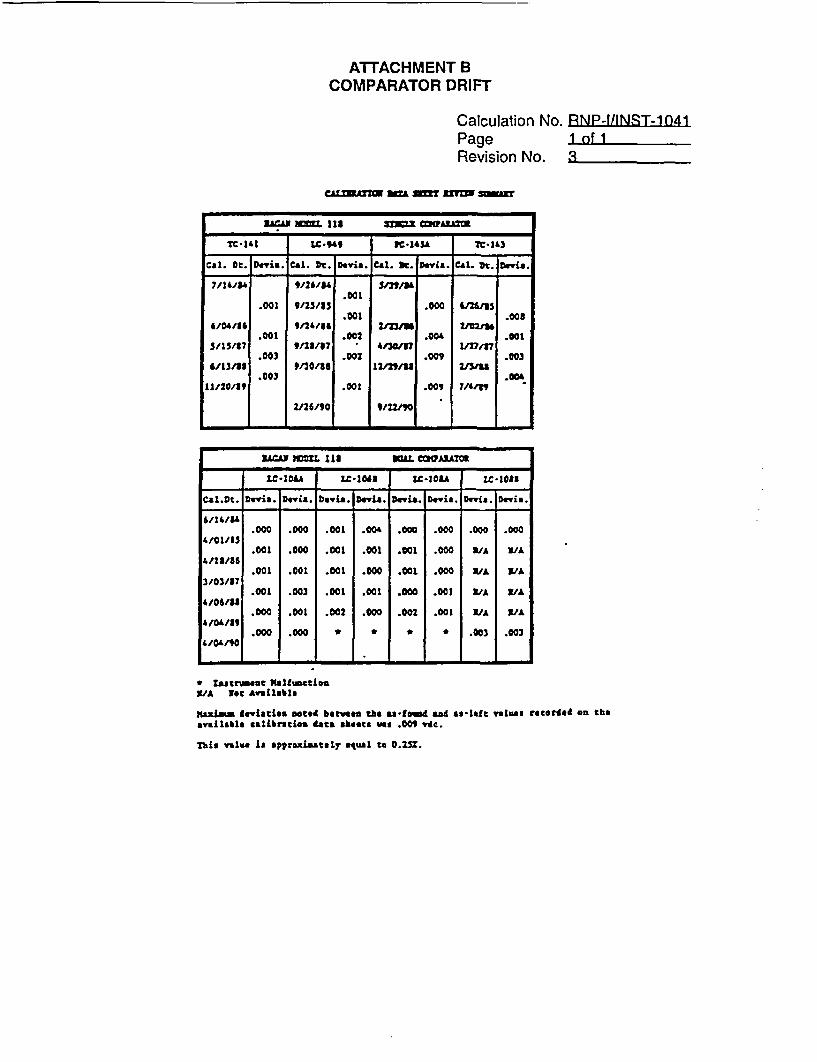
ATTACHMENT BCOMPARATOR DRIFT
Calculation No. RNP-I/INST-1041Page I of 1Revision No. 3
cAL=o am T nirm s-
UANA N= M113 S C
.00
STC-14 | LC-"§4 | PC-145A Z C-143
Cal. Ot. Davi. Cal. Vt. Zlevi&. Cal. ft. fVS al t eis.p -
.001 9/25/55 .000 4/24Js.001 .008
0/04/30 9/24/35 2q/NlU 2i012jl.001 .002 .00 .001
5/15/87 9/23/37 4.30/ 2/2/57.003 .002 .009 .003
6/13/13 9/20/36 12/29/U 2/5/Ia.003 .004
11/20/89 .001 .009 7/0n
2/26/90 9_/.
- - - - - - - -O
2.C.106. LC'3041 W-108A I.C-lO*5
Ca1.0c. Dc . Dvis &. Dev;s. bivia . Devi v. "vii. e .is. W . Devi*.
4/14/84.000 .000 .001 .004 .A .000 .00 .000
4/01/35.001 .000 .001 .001 .001 .000 3VA VA
4/183/6.001 .001 .001 .000 .001 .000 3/A ]VA
3/03/37.001 .003 .001 .001 .000 .001 V/A I/A
.000 .001 .002 .000 .00 .001 V/A X/A
.000 .000 _ _ _ .003 .0034/04/90
q Iaatvwest aLmtaX/A Not Avuilble
Maximsm deviatios acted between the s-f sd sad as-left values recorded an theavailabl eslibration data sheets ws .00 vdc.
This value Is approx"ta*ly *<ul to 0.2SZ.

ATTACHMENT CINTERNATIONAL INSTRUMENTS INDICATOR DATA
Calculation No. RNP-1IiNST-1n41Page 1 of IRevision No. 3
-- 21a
aw_ _ £ 3eww__M
Kl 6.s.
_.c--, Lu f'0 Sw _S. Cr Yd. II 401.5
TWPL 710OA0234
June 24, l19Y
CAROLINA POSER & LIGHTP.o. son 1=11Raleigh, NC 27402-15511
Attn: Robert ?ann OHS 6th Floor
Dear Robert,
Per our conversattan the drtit and T.C. 4or InternationalInstruments *od-l 2520 are IX of span per year and .1X of spanper degree C respectively. The accwacy following a seismicevent are per till Standards for shock and vibration and arequoted as SX of span. Understand that the assumption Is madethat the se*soic event reflects both shock and vibration.
Should you)'ave any further information, please do not hesi-tat')to conttag e. ,
731
o60
Vice President
cc: Keith Mcdowall
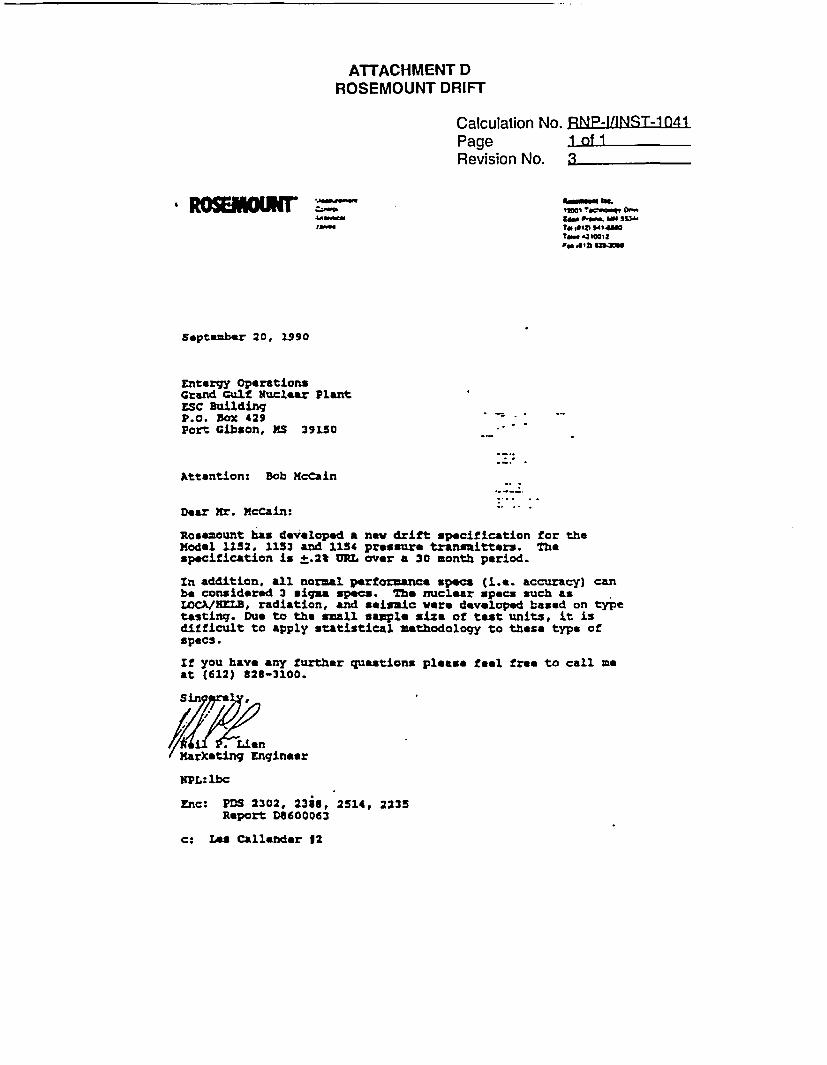
ATTACHMENT DROSEMOUNT DRIFT
Calculation No.PageRevision No.
RNP-I/INST-1 041I nf 1
-
I -"MTIC "Og ,Ida *. m 513"
a._ 410012Als043 226'"
Sept-mber 20, 1990
Entergy OperationsGrand Culf Ruclear PlantESC BuildinqP.O. Box 429Port Gibson, MS 39150
Attention: Bob McCain
Dear Mr. McCain:
Rosaeount has developed a naw drift specification for theModel 1152. 1153 and 1154 pressure transmitters. Thespecification is +.2% URL over a 30 month period.
in addition, all normal performanca specs (i.e. accuracy) canbe considered 3 *igua specs. The nuclear specs such asLOCHZLB, radiation, and seismic were developed based on typetesting. Due to the small sample size of test units, it isdifficult to apply statistical methodology to thes- type of
specs.
If you have any further questions please feel free to call meat (612) 828-3100.
// onMarketing Enqinaer
PL: lbc
Enc: PDS 2302, 2366,Report DW600063
c: Les Callender 12
2514, 2235
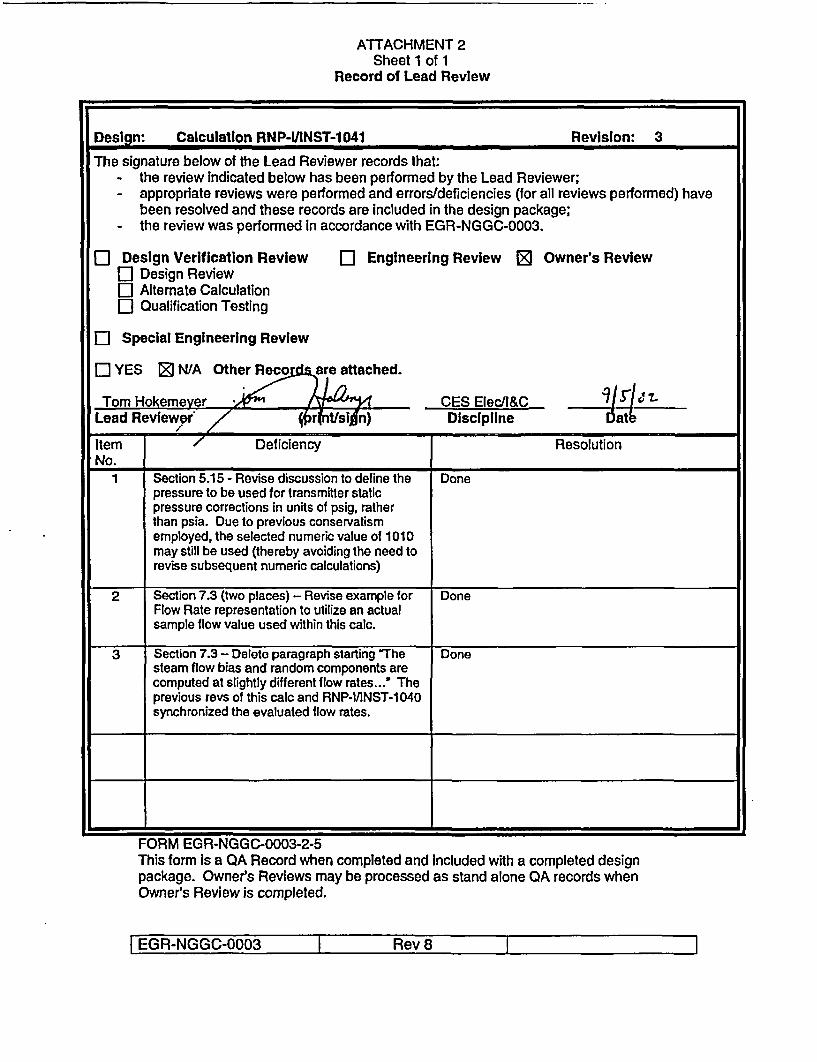
ATTACHMENT 2Sheet 1 of 1
Record of Lead Review
Design: Calculation RNP-VINST-1041 Revision: 3
The signature below of the Lead Reviewer records that:- the review indicated below has been performed by the Lead Reviewer;- appropriate reviews were performed and errors/deficiencies (for all reviews performed) have
been resolved and these records are included in the design package;- the review was performed in accordance with EGR-NGGC-0003.
[] Design Verification Reviewa Design Review[U Alternate CalculationIU Qualification Testing
a Engineering Review 3 Owner's Review
a] Special Engineering Review
El YES Z N/A Other Recos are attached.
Tom HokemeverLead Reviewef/ rintisifln)
CES Elec/l&CDiscipline datb
Item Deficiency ResolutionNo.
1 Section 5.15 - Revise discussion to define the Donepressure to be used for transmitter staticpressure corrections in units of psig, ratherthan psia. Due to previous conservatismemployed, the selected numeric value of 1010may still be used (thereby avoiding the need torevise subsequent numeric calculations)
2 Section 7.3 (two places) - Revise example for DoneFlow Rate representation to utilize an actualsample flow value used within this calc.
3 Section 7.3 - Delete paragraph starting 'The Donesteam flow bias and random components arecomputed at slightly different flow rates...' Theprevious revs of this calc and RNP.I/INST-1040synchronized the evaluated flow rates.
4. 4
- *
FORM EGR-NGGC-0003-2-5This form is a QA Record when completed and included with a completed designpackage. Owner's Reviews may be processed as stand alone QA records whenOwner's Review is completed.
I EGR-NGGC-0003 I Rev 8 I