
INST 241 (Temperature and Flow Measurement), section 2
165
INST 241 (Temperature and Flow Measurement), section 2 Lab Temperature measurement loop: Questions 91 and 92, completed objectives due by the end of day 5 Exam Day 5 – only a simple calculator may be used! Complete mastery of these objectives due by the next exam date Specific objectives for the “mastery” exam: • Electricity Review: Calculate voltages and currents in an ideal AC transformer circuit • Sketch proper wire connections showing how to simulate an RTD or thermocouple input to a temperature transmitter using simple electronic components • Calculate temperatures or voltages in thermocouple and RTD circuits given access to thermocouple and RTD tables • Calculate instrument input and output values given calibrated ranges • Solve for a specified variable in an algebraic formula • Determine the possibility of suggested faults in a Wheatstone bridge circuit given measured values (voltage, current), a schematic diagram, and reported symptoms • Motor/relay/3phase/PLC Review: Calculate either the full-load current or the horsepower of an electric motor (either single- or three-phase) given the line voltage and one of the other parameters • INST250 Review: Calculate C v rating of control valve for liquid (non-cavitating) service • INST263 Review: Determine effect of a fault in a selector or override control system Recommended daily schedule Day 1 Theory session topic: Thermocouples (continued) Questions 1 through 20; answer questions 1-9 in preparation for discussion (remainder for practice) Day 2 Theory session topic: Thermocouple and RTD applications Questions 21 through 40; answer questions 21-29 in preparation for discussion (remainder for practice) Day 3 Theory session topic: Non-contact pyrometers, temperature switches, calibration standards, and accessories Questions 41 through 60; answer questions 41-48 in preparation for discussion (remainder for practice) Day 4 Theory session topic: Review for exam Questions 61 through 80; answer questions 61-65 in preparation for discussion (remainder for practice) Feedback questions (81 through 90) are optional and may be submitted for review at the end of the day Day 5 Exam 1
-
Upload
khangminh22 -
Category
Documents
-
view
0 -
download
0
Transcript of INST 241 (Temperature and Flow Measurement), section 2

INST 241 (Temperature and Flow Measurement), section 2
Lab
Temperature measurement loop: Questions 91 and 92, completed objectives due by the end of day 5
Exam
Day 5 – only a simple calculator may be used! Complete mastery of these objectives due by thenext exam date
Specific objectives for the “mastery” exam:• Electricity Review: Calculate voltages and currents in an ideal AC transformer circuit• Sketch proper wire connections showing how to simulate an RTD or thermocouple input to a temperature
transmitter using simple electronic components• Calculate temperatures or voltages in thermocouple and RTD circuits given access to thermocouple and
RTD tables• Calculate instrument input and output values given calibrated ranges• Solve for a specified variable in an algebraic formula• Determine the possibility of suggested faults in a Wheatstone bridge circuit given measured values
(voltage, current), a schematic diagram, and reported symptoms• Motor/relay/3phase/PLC Review: Calculate either the full-load current or the horsepower of an electric
motor (either single- or three-phase) given the line voltage and one of the other parameters• INST250 Review: Calculate Cv rating of control valve for liquid (non-cavitating) service• INST263 Review: Determine effect of a fault in a selector or override control system
Recommended daily schedule
Day 1
Theory session topic: Thermocouples (continued)
Questions 1 through 20; answer questions 1-9 in preparation for discussion (remainder for practice)
Day 2
Theory session topic: Thermocouple and RTD applications
Questions 21 through 40; answer questions 21-29 in preparation for discussion (remainder for practice)
Day 3
Theory session topic: Non-contact pyrometers, temperature switches, calibration standards, andaccessories
Questions 41 through 60; answer questions 41-48 in preparation for discussion (remainder for practice)
Day 4
Theory session topic: Review for exam
Questions 61 through 80; answer questions 61-65 in preparation for discussion (remainder for practice)
Feedback questions (81 through 90) are optional and may be submitted for review at the end of the day
Day 5
Exam
1

How To . . .
Access the worksheets and textbook: go to the Socratic Instrumentation website located athttp://www.ibiblio.org/kuphaldt/socratic/sinst to find worksheets for every 2nd-year course sectionorganized by quarter, as well as both the latest “stable” and “development” versions of the Lessons InIndustrial Instrumentation textbook. Download and save these documents to your computer.
Maximize your learning: complete all homework before class starts, ready to be assessed as describedin the “Inverted Session Formats” pages. Use every minute of class and lab time productively. Follow allthe tips outlined in “Question 0” as well as your instructor’s advice. Do not take constructive criticismpersonally. Make every reasonable effort to solve problems on your own before seeking help.
Identify upcoming assignments and deadlines: read the first page of each course worksheet.
Relate course days to calendar dates: reference the calendar spreadsheet file (calendar.xlsx), foundon the BTC campus Y: network drive. A printed copy is posted in the Instrumentation classroom.
Locate industry documents assigned for reading: use the Instrumentation Reference provided byyour instructor (on CD-ROM and on the BTC campus Y: network drive). There you will find a file named00 index OPEN THIS FILE.html readable with any internet browser. Click on the “Quick-Start Links” toaccess assigned reading documents, organized per course, in the order they are assigned.
Study for the exams: Mastery exams assess specific skills critically important to your success, listed nearthe top of the front page of each course worksheet for your review. Familiarize yourself with this list and payclose attention when those topics appear in homework and practice problems. Proportional exams featureproblems you haven’t seen before that are solvable using general principles learned throughout the current andprevious courses, for which the only adequate preparation is independent problem-solving practice every day.Answer the “feedback questions” (practice exams) in each course section to hone your problem-solving skills,as these are similar in scope and complexity to proportional exams. Answer these feedback independently(i.e. no help from classmates) in order to most accurately assess your readiness.
Calculate course grades: download the “Course Grading Spreadsheet” (grades template.xlsx) fromthe Socratic Instrumentation website, or from the BTC campus Y: network drive. Enter your quiz scores,test scores, lab scores, and attendance data into this Excel spreadsheet and it will calculate your coursegrade. You may compare your calculated grades against your instructors’ records at any time.
Identify courses to register for: read the “Sequence” page found in each worksheet.
Receive extra instructor help: ask during lab time, or during class time, or by appointment. Tony maybe reached by email at [email protected] or by telephone at 360-752-8477.
Identify job openings: regularly monitor job-search websites. Set up informational interviews atworkplaces you are interested in. Participate in jobshadows and internships. Apply to jobs long beforegraduation, as some employers take months to respond! Check your BTC email account daily for alerts.
Impress employers: sign the FERPA release form granting your instructors permission to share academicrecords, then make sure your performance is worth sharing. Document your project and problem-solvingexperiences for reference during interviews. Honor all your commitments.
Begin your career: participate in jobshadows and internships while in school to gain experience andreferences. Take the first Instrumentation job that pays the bills, and give that employer at least two yearsof good work to pay them back for the investment they have made in you. Employers look at delayedemployment, as well as short employment spans, very negatively. Failure to pass a drug test is an immediatedisqualifier, as is falsifying any information. Criminal records may also be a problem.
file howto
2

General Values, Expectations, and Standards
Success in this career requires professional integrity, resourcefulness, persistence, close attention to detail,and intellectual curiosity. If you are ever in doubt as to the values you should embody, just ask yourselfwhat kind of a person you would prefer to hire for your own enterprise. Those same values will be upheldwithin this program.
Learning is the purpose of any educational program, and a worthy priority in life. Every circumstance, everyincident, every day here will be treated as a learning opportunity, every mistake as a “teachable moment”.Every form of positive growth, not just academic ability, will be regarded as real learning.
Responsibility means ensuring the desired outcome, not just trying to achieve the outcome. To be aresponsible person means you own the outcome of your decisions and actions.
Integrity means being honest and forthright in all your words and actions, doing your very best every timeand never taking credit for the achievement of another.
Safety means doing every job correctly and ensuring others are not endangered. Lab safety standards includewearing closed-toed shoes and safety glasses in the lab room during lab hours, wearing ear protection aroundloud sounds, using ladders to reach high places, using proper lock-out/tag-out procedures, no energizedelectrical work above 30 volts without an instructor present in the lab room, and no power tool use withoutan instructor present in the lab room.
Diligence in study means exercising self-discipline and persistence, realizing that hard work is a necessarycondition for success. This means, among other things, investing the necessary time and effort in studying,reading instructions, paying attention to details, utilizing the skills and tools you already possess, andavoiding shortcuts. Diligence in work means the job is not done until it is done correctly: all objectivesachieved, all problems solved, all documentation complete, and no errors remaining.
Self-management means allocating your resources (time, equipment, labor) wisely, and not just focusingon the closest deadline.
Communication means clearly conveying your thoughts and paying attention to what others convey, acrossall forms of communication (e.g. oral, written, nonverbal).
Teamwork means working constructively with your classmates to complete the job at hand. Rememberthat here the first job is learning, and so teamwork means working to maximize everyone’s learning (not justyour own). The goal of learning is more important than the completion of any project or assignment.
Initiative means recognizing needs and taking action to meet those needs without encouragement ordirection from others.
Representation means your actions reflect this program and not just yourself. Doors of opportunity forall BTC graduates may be opened or closed by your own conduct. Unprofessional behavior during tours,jobshadows, internships, and/or jobs reflects poorly on the program and will negatively bias employers.
Trustworthiness is the result of consistently exercising these values: people will recognize you as someonethey can rely on to get the job done, and therefore someone they would want to employ.
Respect means acknowledging the intrinsic value, capabilities, and responsibilities of those around you.Respect is gained by consistent demonstration of valued behaviors, and it is lost through betrayal of trust.
3

General Values, Expectations, and Standards (continued)
Punctuality and Attendance: late arrivals are penalized at a rate of 1% grade deduction per incident.Absence is penalized at a rate of 1% per hour (rounded to the nearest hour) except when employment-related,school-related, weather-related, or required by law (e.g. court summons). Absences may be made up bydirecting the instructor to apply “sick hours” (12 hours of sick time available per quarter). Classmates maydonate their unused sick hours. Sick hours may not be applied to unannounced absences, so be sure to alertyour instructor and teammates as soon as you know you will be absent or late. Absence on an exam daywill result in a zero score for that exam, unless due to a documented emergency.
Mastery: any assignment or objective labeled as “mastery” must be completed with 100% competence(with multiple opportunities to re-try). Failure to complete by the deadline date caps your grade at a C−.Failure to complete by the end of the next school day results in a failing (F) grade for that course.
Time Management: Use all available time wisely and productively. Work on other useful tasks (e.g.homework, feedback questions, job searching) while waiting for other activities or assessments to begin.Trips to the cafeteria for food or coffee, smoke breaks, etc. must not interfere with team participation.
Orderliness: Keep your work area clean and orderly, discarding trash, returning tools at the end of everylab session, and participating in all scheduled lab clean-up sessions. Project wiring, especially in shared areassuch as junction boxes, must not be left in disarray at the end of a lab shift. Label any failed equipmentwith a detailed description of its symptoms.
Independent Study: the “inverted” instructional model used in this program requires independent readingand problem-solving, where every student must demonstrate their learning at the start of the class session.Question 0 of every worksheet lists practical study tips. The “Inverted Session Formats” pages found inevery worksheet outline the format and grading standards for inverted class sessions.
Independent Problem-Solving: make an honest effort to solve every problem before seeking help. Whenworking in the lab, help will not be given unless and until you run your own diagnostic tests.
Teamwork: inform your teammates if you need to leave the work area for any reason. Any student regularlycompromising team performance through absence, tardiness, disrespect, or other disruptive behavior(s) willbe removed from the team and required to complete all labwork individually. The same is true for studentsfound inappropriately relying on teammates.
Communication: check your email daily for important messages. Ask the instructor to clarify anyassignment or exam question you find confusing, and express your work clearly.
Academic Progress: your instructor will record your academic achievement, as well as comments on anynegative behavior, and will share all these records with employers if you sign the FERPA release form.You may see these records at any time, and you should track your own academic progress using the gradespreadsheet template. Extra-credit projects will be tailored to your learning needs.
Office Hours: your instructor’s office hours are by appointment, except in cases of emergency. Email is thepreferred method for setting up an appointment with your instructor to discuss something in private.
Grounds for Failure: a failing (F) grade will be earned in any course if any mastery objectives are pastdeadline by more than one school day, or for any of the following behaviors: false testimony (lying), cheatingon any assignment or assessment, plagiarism (presenting another’s work as your own), willful violation ofa safety policy, theft, harassment, sabotage, destruction of property, or intoxication. These behaviors aregrounds for immediate termination in this career, and as such will not be tolerated here.
file expectations
4

Program Outcomes for Instrumentation and Control Technology (BTC)
#1 Communication
Communicate and express concepts and ideas across a variety of media (verbal, written, graphical) usingindustry-standard terms.
#2 Time management
Arrives on time and prepared to work; Budgets time and meets deadlines when performing tasks andprojects.
#3 Safety
Complies with national, state, local, and college safety regulations when designing and performing workon systems.
#4 Analysis and Diagnosis
Analyze, evaluate, and diagnose systems related to instrumentation and control including electricaland electronic circuits, fluid power and signaling systems, computer networks, and mechanisms; Select andapply correct mathematical techniques to these analytical and diagnostic problems; Select and correctly useappropriate test equipment to collect data.
#5 Design and Commissioning
Select, design, construct, configure, and install components necessary for the proper function of systemsrelated to instrumentation and control, applying industry standards and verifying correct system operationwhen complete.
#6 System optimization
Improve technical system functions by collecting data and evaluating performance; Implement strategiesto optimize the function of these systems.
#7 Calibration
Assess instrument accuracy and correct inaccuracies using appropriate calibration procedures and testequipment; Select and apply correct mathematical techniques to these calibration tasks.
#8 Documentation
Interpret and create technical documents (e.g. electronic schematics, loop diagrams, functionaldiagrams, P&IDs, graphs, narratives) according to industry standards.
#9 Independent learning
Select and research information sources to learn new principles, technologies, and techniques.
#10 Job searching
Develop a professional resume and research job openings in the field of industrial instrumentation.
file outcomes program
5

INST 241 Course Outcomes
Each and every outcome in this course is assessed at a mastery level (i.e. 100% competence)
• Calculate voltages and currents in an ideal AC transformer circuit. [Ref: Program Learning Outcome#4]
• Calculate voltages, currents, and phase shifts in an AC reactive circuit. [Ref: Program LearningOutcome #4]
• Sketch proper wire connections showing how to simulate an RTD or thermocouple input to a temperaturetransmitter using simple electronic components. [Ref: Program Learning Outcome #5]
• Calculate temperatures or voltages in thermocouple and RTD circuits given access to thermocouple andRTD tables. [Ref: Program Learning Outcome #7]
• Calculate flow rate and pressure drop for a nonlinear flow element given maximum flow specifications.[Ref: Program Learning Outcome #7]
• Determine suitability of different flow-measuring technologies for a given process fluid type. [Ref:Program Learning Outcome #4]
• Calculate instrument input and output values given calibrated ranges. [Ref: Program Learning Outcome#7]
• Solve for specified variables in algebraic formulae. [Ref: Program Learning Outcome #4]
• Identify specific instrument calibration errors (zero, span, linearity, hysteresis) from data in an “As-Found” table. [Ref: Program Learning Outcome #7]
• Determine the possibility of suggested faults in simple circuits and Wheatstone bridge circuits givenmeasured values (voltage, current), schematic diagrams, and reported symptoms. [Ref: ProgramLearning Outcome #4]
• Demonstrate proper use of safety equipment and application of safe procedures while using power tools,and working on live systems. [Ref: Program Learning Outcome #3]
• Communicate effectively with teammates to plan work, arrange for absences, and share responsibilitiesin completing all labwork. [Ref: Program Learning Outcomes #1 and #2]
• Construct and commission a working temperature-measurement loop consisting of an electronictemperature transmitter, signal wiring, and SCADA RTU programmed in a text-based programminglanguage. [Ref: Program Learning Outcome #5]
• Construct and commission a working flow-measurement loop consisting of an electronic flow transmitter,signal wiring, and flow computer programmed in a text-based programming language. [Ref: ProgramLearning Outcome #5]
• Generate accurate loop diagrams compliant with ISA standards documenting your team’s systems. [Ref:Program Learning Outcome #8]
• Research equipment manuals to sketch a complete circuit connecting a loop controller to either a 4-20 mA transmitter or a 4-20 mA final control element, with all DC voltages and currents correctlyannotated, all electrical sources and loads properly identified, given components randomly selected bythe instructor. [Ref: Program Learning Outcomes #5 and #9]
6

• Calibrate an electronic RTD temperature transmitter to specified accuracy using industry-standardcalibration equipment. [Ref: Program Learning Outcome #7]
• Calibrate an electronic thermocouple temperature transmitter to specified accuracy using industry-standard calibration equipment. [Ref: Program Learning Outcome #7]
• Accurately simulate a thermocouple signal using a millivoltage source. [Ref: Program Learning Outcome#7]
• Accurately simulate an RTD signal using a potentiometer. [Ref: Program Learning Outcome #7]
• Calculate flow rate and pressure drop for a nonlinear flow element given maximum flow specifications.[Ref: Program Learning Outcome #7]
• Edit text-based programming code for a flow computer. [Ref: Program Learning Outcome #5]
• Diagnose a random fault simulated by computer in a 4-wire RTD circuit, logically justifying your stepsbefore an instructor. [Ref: Program Learning Outcome #4]
• Diagnose a random fault simulated by computer in a 4-20 transmitter circuit, logically justifying yoursteps before an instructor. [Ref: Program Learning Outcome #4]
file outcomes INST241
7

Sequence of second-year Instrumentation courses
INST 240 -- 6 crPressure/Level Measurement
INST 241 -- 6 crTemp./Flow Measurement
INST 242 -- 5 crAnalytical Measurement
INST 250 -- 5 cr
INST 251 -- 5 crPID Control
Final Control Elements
Loop TuningINST 252 -- 4 cr
Data Acquisition Systems
INST 262 -- 5 cr
INST 263 -- 5 crControl Strategies
Fall quarter Winter quarter Spring quarterSummer quarter
Offered 1st week ofINST 200 -- 1 wkIntro. to Instrumentation
Job Prep I
Job Prep II
INST 205 -- 1 cr
INST 206 -- 1 cr
INST25x, and INST26x coursesPrerequisite for all INST24x, Fall, Winter, and
Spring quarters
Offered 1st week ofFall, Winter, andSpring quarters
INST 260 -- 4 cr
CAD 1: Basics
including MATH 141 (Precalculus 1)Core Electronics -- 3 qtrs
Prerequisite for INST206
(Only if 4th quarter was Summer: INST23x)
All coursescompleted? No
Yes
Graduate!!!
Protective Relays (elective)
ENGT 134 -- 5 cr
recommended
INST 233 -- 4 cr
Jobshadow and/orInternship strongly
Digital Control Systems
8

The particular sequence of courses you take during the second year depends on when you complete allfirst-year courses and enter the second year. Since students enter the second year of Instrumentation at fourdifferent times (beginnings of Summer, Fall, Winter, and Spring quarters), the particular course sequencefor any student will likely be different from the course sequence of classmates.
Some second-year courses are only offered in particular quarters with those quarters not having to bein sequence, while others are offered three out of the four quarters and must be taken in sequence. Thefollowing layout shows four typical course sequences for second-year Instrumentation students, depending onwhen they first enter the second year of the program:
INST 240 -- 6 crPressure/Level Measurement
INST 241 -- 6 crTemp./Flow Measurement
INST 242 -- 5 crAnalytical Measurement
Fall quarter
INST 200 -- 1 wkIntro. to Instrumentation
Winter quarter
Job Prep IINST 205 -- 1 cr
INST 250 -- 5 crFinal Control Elements
INST 251 -- 5 crPID Control
Loop TuningINST 252 -- 4 cr
Job Prep IIINST 206 -- 1 cr
Spring quarter
Data Acquisition SystemsINST 260 -- 4 cr
INST 262 -- 5 cr
INST 263 -- 5 crControl Strategies
CAD 1: Basics
Graduation!
Possible course schedules depending on date of entry into 2nd year
INST 240 -- 6 crPressure/Level Measurement
INST 241 -- 6 crTemp./Flow Measurement
INST 242 -- 5 crAnalytical Measurement
Fall quarter
INST 200 -- 1 wkIntro. to Instrumentation
Winter quarter
Job Prep IINST 205 -- 1 cr
INST 250 -- 5 crFinal Control Elements
INST 251 -- 5 crPID Control
Loop TuningINST 252 -- 4 cr
Job Prep IIINST 206 -- 1 cr
Spring quarter
Data Acquisition SystemsINST 260 -- 4 cr
INST 262 -- 5 cr
INST 263 -- 5 crControl Strategies
CAD 1: Basics
Graduation!
INST 240 -- 6 crPressure/Level Measurement
INST 241 -- 6 crTemp./Flow Measurement
INST 242 -- 5 crAnalytical Measurement
Fall quarter
Winter quarter
INST 250 -- 5 crFinal Control Elements
INST 251 -- 5 crPID Control
Loop TuningINST 252 -- 4 cr
Spring quarter
Data Acquisition SystemsINST 260 -- 4 cr
INST 262 -- 5 cr
INST 263 -- 5 crControl Strategies
CAD 1: Basics
Graduation!
INST 200 -- 1 wkIntro. to Instrumentation
Job Prep IINST 205 -- 1 cr
Job Prep IIINST 206 -- 1 cr
INST 200 -- 1 wkIntro. to Instrumentation
Job Prep IINST 205 -- 1 cr
Job Prep IIINST 206 -- 1 cr
Sept.
Dec.
Jan.
Mar.
April
June
Sept.
Dec.
Jan.
Mar.
April
June
Jan.
Mar.
April
June
Sept.
Dec.
April
June
Sept.
Dec.
Jan.
Mar.
Beginning in Summer Beginning in Fall Beginning in Winter Beginning in Spring
July
Aug.
July
July
Summer quarterJuly
Protective Relays (elective)
Aug.
Aug.
Aug.
ENGT 134 -- 5 cr
ENGT 134 -- 5 cr
ENGT 134 -- 5 cr
ENGT 134 -- 5 cr
INST 233 -- 4 cr
Jobshadow and/orInternship strongly
recommended
Summer quarter
Protective Relays (elective)
INST 233 -- 4 cr
Jobshadow and/orInternship strongly
recommended
Summer quarter
Protective Relays (elective)
INST 233 -- 4 cr
Jobshadow and/orInternship strongly
recommended
Summer quarter
Protective Relays (elective)
INST 233 -- 4 cr
Jobshadow and/orInternship strongly
recommended
Digital Control Systems
Digital Control Systems
Digital Control Systems
Digital Control Systems
file sequence
9

General tool and supply list
Wrenches• Combination (box- and open-end) wrench set, 1/4” to 3/4” – the most important wrench sizes are 7/16”,
1/2”, 9/16”, and 5/8”; get these immediately!• Adjustable wrench, 6” handle (sometimes called “Crescent” wrench)• Hex wrench (“Allen” wrench) set, fractional – 1/16” to 3/8”• Optional: Hex wrench (“Allen” wrench) set, metric – 1.5 mm to 10 mm• Optional: Miniature combination wrench set, 3/32” to 1/4” (sometimes called an “ignition wrench” set)
Note: always maximize surface engagement on a fastener’s head to reduce stress on that fastener. (e.g.Using box-end wrenches instead of adjustable wrenches; using the proper size and type of screwdriver; neverusing any tool that mars the fastener such as pliers or vise-grips unless absolutely necessary.)
Pliers• Needle-nose pliers• Diagonal wire cutters (sometimes called “dikes”)
Screwdrivers• Slotted, 1/8” and 1/4” shaft• Phillips, #1 and #2• Jeweler’s screwdriver set• Optional: Magnetic multi-bit screwdriver (e.g. Klein Tools model 70035)
Electrical• Multimeter, Fluke model 87-IV or better• Assortment of alligator-clip style jumper wires• Soldering iron (10 to 40 watt) and rosin-core solder• Resistor, potentiometer, diode assortments (from first-year lab kits)• Package of insulated compression-style fork terminals (14 to 18 AWG wire size, #10 stud size)• Wire strippers/terminal crimpers for 10 AWG to 18 AWG wire and insulated terminals• Optional: ratcheting terminal crimp tool (e.g. Paladin 1305, Ferrules Direct FDT10011, or equivalent)
Safety• Safety glasses or goggles (available at BTC bookstore)• Earplugs (available at BTC bookstore)
Miscellaneous• Simple scientific calculator (non-programmable, non-graphing, no conversions), TI-30Xa or TI-30XIIS
recommended. Required for some exams!• Portable personal computer capable of wired Ethernet connectivity, Wi-Fi connectivity, displaying PDF
documents, creating text documents, creating and viewing spreadsheets, running PLC programmingsoftware (MS Windows only), and executing command-line utilities such as ping.
• Masking tape (for making temporary labels)• Permanent marker pen• Teflon pipe tape• Utility knife• Tape measure, 12 feet minimum• Flashlight
file tools
10

Methods of instruction
This course develops self-instructional and diagnostic skills by placing students in situations where theyare required to research and think independently. In all portions of the curriculum, the goal is to avoid apassive learning environment, favoring instead active engagement of the learner through reading, reflection,problem-solving, and experimental activities. The curriculum may be roughly divided into two portions:theory and practical. All “theory” sessions follow the inverted format and contain virtually no lecture.
Inverted theory sessionsThe basic concept of an “inverted” learning environment is that the traditional allocations of student
time are reversed: instead of students attending an instructor-led session to receive new information and thenpracticing the application of that information outside of the classroom in the form of homework, studentsin an inverted class encounter new information outside of the classroom via homework and apply thatinformation in the classroom session under the instructor’s tutelage.
A natural question for instructors, then, is what their precise role is in an inverted classroom and howto organize that time well. Here I will list alternate formats suitable for an inverted classroom session, eachof them tested and proven to work.
Small sessions
Students meet with instructors in small groups for short time periods. Groups of 4 students meeting for30 minutes works very well, but groups as large as 8 students apiece may be used if time is limited. Each ofthese sessions begins with a 5 to 10 minute graded inspection of homework with individual questioning, tokeep students accountable for doing the homework. The remainder of the session is a dialogue focusing onthe topics of the day, the instructor challenging each student on the subject matter in Socratic fashion, andalso answering students’ questions. A second grade measures each student’s comprehension of the subjectmatter by the end of the session.
This format also works via teleconferencing, for students unable to attend a face-to-face session oncampus.
Large sessions
Students meet with instructors in a standard classroom (normal class size and period length). Eachof these sessions begins with a 10 minute graded quiz (closed-book) on the homework topic(s), to keepstudents accountable for doing the homework. Students may leave the session as soon as they “check off”with the instructor in a Socratic dialogue as described above (instructor challenging each student to assesstheir comprehension, answering questions, and grading the responses). Students sign up for check-off on thewhiteboard when they are ready, typically in groups of no more than 4. Alternatively, the bulk of the classsession may be spent answering student questions in small groups, followed by another graded quiz at theend.
Correspondence
This format works for students unable to attend a “face-to-face” session, and who must correspond withthe instructor via email or other asynchronous medium. Each student submits a thorough presentation oftheir completed homework, which the instructor grades for completeness and accuracy. The instructor thenreplies back to the student with challenge questions, and also answers questions the student may have. Aswith the previous formats, the student receives another grade assessing their comprehension of the subjectmatter by the close of the correspondence dialogue.
11

Methods of instruction (continued)
In all formats, students are held accountable for completion of their homework, “completion” beingdefined as successfully interpreting the given information from source material (e.g. accurate outlines ofreading or video assignments) and constructive effort to solve given problems. It must be understood in aninverted learning environment that students will have legitimate questions following a homework assignment,and that it is therefore unreasonable to expect mastery of the assigned subject matter. What is reasonable toexpect from each and every student is a basic outline of the source material (reading or video assignments)complete with major terms defined and major concepts identified, plus a good-faith effort to solve everyproblem. Question 0 (contained in every worksheet) lists multiple strategies for effective study and problem-solving.
Sample rubric for pre-assessments
• No credit = Any homework question unattempted (i.e. no effort shown on one or more questions);incomprehensible writing; failure to follow clear instruction(s)
• Half credit = Misconception(s) on any major topic explained in the assigned reading; answers shownwith no supporting work; verbatim copying of text rather than written in student’s own words; outlinemissing important topic(s); unable to explain the outline or solution methods represented in writtenwork
• Full credit = Every homework question answered, with any points of confusion clearly articulated; allimportant concepts from reading assignments accurately expressed in the outline and clearly articulatedwhen called upon by the instructor to explain
The minimum expectation at the start of every student-instructor session is that all students have madea good-faith effort to complete 100% of their assigned homework. This does not necessarily mean all answerswill be correct, or that all concepts are fully understood, because one of the purposes of the meeting betweenstudents and instructor is to correct remaining misconceptions and answer students’ questions. However,experience has shown that without accountability for the homework, a substantial number of students willnot put forth their best effort and that this compromises the whole learning process. Full credit is reservedfor good-faith effort, where each student thoughtfully applies the study and problem-solving recommendationsgiven to them (see Question 0).
Sample rubric for post-assessments
• No credit = Failure to comprehend one or more key concepts; failure to apply logical reasoning to thesolution of problem(s); no contribution to the dialogue
• Half credit = Some misconceptions persist by the close of the session; problem-solving is inconsistent;limited contribution to the dialogue
• Full credit = Socratic queries answered thoughtfully; effective reasoning applied to problems; ideascommunicated clearly and accurately; responds intelligently to questions and statements made by othersin the session; adds new ideas and perspectives
The minimum expectation is that each and every student engages with the instructor and with fellowstudents during the Socratic session: posing intelligent questions of their own, explaining their reasoningwhen challenged, and otherwise positively contributing to the discussion. Passive observation and listeningis not an option here – every student must be an active participant, contributing something original to everydialogue. If a student is confused about any concept or solution, it is their responsibility to ask questions andseek resolution.
12

Methods of instruction (continued)
If a student happens to be absent for a scheduled class session and is therefore unable to be assessedon that day’s study, they may schedule a time with the instructor to demonstrate their comprehension atsome later date (before the end of the quarter when grades must be submitted). These same standards ofperformance apply equally make-up assessments: either inspection of homework or a closed-book quiz forthe pre-assessment, and either a Socratic dialogue with the instructor or another closed-book quiz for thepost-assessment.
Methods of instruction (continued)
Lab sessionsIn the lab portion of each course, students work in teams to install, configure, document, calibrate, and
troubleshoot working instrument loop systems. Each lab exercise focuses on a different type of instrument,with a limited time period typically for completion. An ordinary lab session might look like this:
(1) Start of practical (lab) session: announcements and planning(a) The instructor makes general announcements to all students(b) The instructor works with team to plan that day’s goals, making sure each team member has a
clear idea of what they should accomplish(2) Teams work on lab unit completion according to recommended schedule:
(First day) Select and bench-test instrument(s), complete prototype sketch of project(One day) Connect instrument(s) into a complete loop(One day) Each team member drafts their own loop documentation, inspection done as a team (withinstructor)(One or two days) Each team member calibrates/configures the instrument(s)(Remaining days, up to last) Each team member troubleshoots the instrument loop
(3) End of practical (lab) session: debriefing where each team reports on their work to the whole class
Troubleshooting assessments must meet the following guidelines:
• Troubleshooting must be performed on a system the student did not build themselves. This forcesstudents to rely on another team’s documentation rather than their own memory of how the system wasbuilt.
• Each student must individually demonstrate proper troubleshooting technique.• Simply finding the fault is not good enough. Each student must consistently demonstrate sound
reasoning while troubleshooting.• If a student fails to properly diagnose the system fault, they must attempt (as many times as necessary)
with different scenarios until they do, reviewing any mistakes with the instructor after each failedattempt.
file instructional
13

Distance delivery methods
Sometimes the demands of life prevent students from attending college 6 hours per day. In such cases,there exist alternatives to the normal 8:00 AM to 3:00 PM class/lab schedule, allowing students to completecoursework in non-traditional ways, at a “distance” from the college campus proper.
For such “distance” students, the same worksheets, lab activities, exams, and academic standards stillapply. Instead of working in small groups and in teams to complete theory and lab sections, though, studentsparticipating in an alternative fashion must do all the work themselves. Participation via teleconferencing,video- or audio-recorded small-group sessions, and such is encouraged and supported.
There is no recording of hours attended or tardiness for students participating in this manner. The paceof the course is likewise determined by the “distance” student. Experience has shown that it is a benefit for“distance” students to maintain the same pace as their on-campus classmates whenever possible.
In lieu of small-group activities and class discussions, comprehension of the theory portion of each coursewill be ensured by completing and submitting detailed answers for all worksheet questions, not just passingdaily quizzes as is the standard for conventional students. The instructor will discuss any incomplete and/orincorrect worksheet answers with the student, and ask that those questions be re-answered by the studentto correct any misunderstandings before moving on.
Labwork is perhaps the most difficult portion of the curriculum for a “distance” student to complete,since the equipment used in Instrumentation is typically too large and expensive to leave the school labfacility. “Distance” students must find a way to complete the required lab activities, either by arrangingtime in the school lab facility and/or completing activities on equivalent equipment outside of school (e.g.at their place of employment, if applicable). Labwork completed outside of school must be validated by asupervisor and/or documented via photograph or videorecording.
Conventional students may opt to switch to “distance” mode at any time. This has proven to be abenefit to students whose lives are disrupted by catastrophic events. Likewise, “distance” students mayswitch back to conventional mode if and when their schedules permit. Although the existence of alternativemodes of student participation is a great benefit for students with challenging schedules, it requires a greaterinvestment of time and a greater level of self-discipline than the traditional mode where the student attendsschool for 6 hours every day. No student should consider the “distance” mode of learning a way to havemore free time to themselves, because they will actually spend more time engaged in the coursework thanif they attend school on a regular schedule. It exists merely for the sake of those who cannot attend duringregular school hours, as an alternative to course withdrawal.
file distance
14

Metric prefixes and conversion constants
• Metric prefixes
• Yotta = 1024 Symbol: Y
• Zeta = 1021 Symbol: Z
• Exa = 1018 Symbol: E
• Peta = 1015 Symbol: P
• Tera = 1012 Symbol: T
• Giga = 109 Symbol: G
• Mega = 106 Symbol: M
• Kilo = 103 Symbol: k
• Hecto = 102 Symbol: h
• Deca = 101 Symbol: da
• Deci = 10−1 Symbol: d
• Centi = 10−2 Symbol: c
• Milli = 10−3 Symbol: m
• Micro = 10−6 Symbol: µ
• Nano = 10−9 Symbol: n
• Pico = 10−12 Symbol: p
• Femto = 10−15 Symbol: f
• Atto = 10−18 Symbol: a
• Zepto = 10−21 Symbol: z
• Yocto = 10−24 Symbol: y
1001031061091012 10-3 10-6 10-9 10-12(none)kilomegagigatera milli micro nano pico
kMGT m µ n p
10-210-1101102
deci centidecahectoh da d c
METRIC PREFIX SCALE
• Conversion formulae for temperature
• oF = (oC)(9/5) + 32
• oC = (oF - 32)(5/9)
• oR = oF + 459.67
• K = oC + 273.15
Conversion equivalencies for distance
1 inch (in) = 2.540000 centimeter (cm)
1 foot (ft) = 12 inches (in)
1 yard (yd) = 3 feet (ft)
1 mile (mi) = 5280 feet (ft)
15

Conversion equivalencies for volume
1 gallon (gal) = 231.0 cubic inches (in3) = 4 quarts (qt) = 8 pints (pt) = 128 fluid ounces (fl. oz.)= 3.7854 liters (l)
1 milliliter (ml) = 1 cubic centimeter (cm3)
Conversion equivalencies for velocity
1 mile per hour (mi/h) = 88 feet per minute (ft/m) = 1.46667 feet per second (ft/s) = 1.60934kilometer per hour (km/h) = 0.44704 meter per second (m/s) = 0.868976 knot (knot – international)
Conversion equivalencies for mass
1 pound (lbm) = 0.45359 kilogram (kg) = 0.031081 slugs
Conversion equivalencies for force
1 pound-force (lbf) = 4.44822 newton (N)
Conversion equivalencies for area
1 acre = 43560 square feet (ft2) = 4840 square yards (yd2) = 4046.86 square meters (m2)
Conversion equivalencies for common pressure units (either all gauge or all absolute)
1 pound per square inch (PSI) = 2.03602 inches of mercury (in. Hg) = 27.6799 inches of water (in.W.C.) = 6.894757 kilo-pascals (kPa) = 0.06894757 bar
1 bar = 100 kilo-pascals (kPa) = 14.504 pounds per square inch (PSI)
Conversion equivalencies for absolute pressure units (only)
1 atmosphere (Atm) = 14.7 pounds per square inch absolute (PSIA) = 101.325 kilo-pascals absolute(kPaA) = 1.01325 bar (bar) = 760 millimeters of mercury absolute (mmHgA) = 760 torr (torr)
Conversion equivalencies for energy or work
1 british thermal unit (Btu – “International Table”) = 251.996 calories (cal – “International Table”)= 1055.06 joules (J) = 1055.06 watt-seconds (W-s) = 0.293071 watt-hour (W-hr) = 1.05506 x 10¹⁰
ergs (erg) = 778.169 foot-pound-force (ft-lbf)
Conversion equivalencies for power
1 horsepower (hp – 550 ft-lbf/s) = 745.7 watts (W) = 2544.43 british thermal units per hour(Btu/hr) = 0.0760181 boiler horsepower (hp – boiler)
Acceleration of gravity (free fall), Earth standard
9.806650 meters per second per second (m/s2) = 32.1740 feet per second per second (ft/s2)
16

Physical constants
Speed of light in a vacuum (c) = 2.9979 × 10⁸ meters per second (m/s) = 186,281 miles per second(mi/s)
Avogadro’s number (NA) = 6.022 × 10²³ per mole (mol−1)
Electronic charge (e) = 1.602 × 10⁻¹⁹ Coulomb (C)
Boltzmann’s constant (k) = 1.38 × 10⁻²³ Joules per Kelvin (J/K)
Stefan-Boltzmann constant (σ) = 5.67 × 10⁻⁸ Watts per square meter-Kelvin4 (W/m2·K4)
Molar gas constant (R) = 8.314 Joules per mole-Kelvin (J/mol-K)
Properties of Water
Freezing point at sea level = 32oF = 0oC
Boiling point at sea level = 212oF = 100oC
Density of water at 4oC = 1000 kg/m3 = 1 g/cm3 = 1 kg/liter = 62.428 lb/ft3 = 1.94 slugs/ft3
Specific heat of water at 14oC = 1.00002 calories/g·oC = 1 BTU/lb·oF = 4.1869 Joules/g·oC
Specific heat of ice ≈ 0.5 calories/g·oC
Specific heat of steam ≈ 0.48 calories/g·oC
Absolute viscosity of water at 20oC = 1.0019 centipoise (cp) = 0.0010019 Pascal-seconds (Pa·s)
Surface tension of water (in contact with air) at 18oC = 73.05 dynes/cm
pH of pure water at 25o C = 7.0 (pH scale = 0 to 14)
Properties of Dry Air at sea level
Density of dry air at 20oC and 760 torr = 1.204 mg/cm3 = 1.204 kg/m3 = 0.075 lb/ft3 = 0.00235slugs/ft3
Absolute viscosity of dry air at 20oC and 760 torr = 0.018 centipoise (cp) = 1.8 × 10⁻⁵ Pascal-seconds (Pa·s)
file conversion constants
17

Question 0
How to get the most out of academic reading:• Outline, don’t highlight! Identify every major idea presented in the text, and express these ideas in your
own words. A suggested ratio is one sentence of your own thoughts per paragraph of text read.
• Articulate your thoughts as you read (i.e. “have a conversation” with the author). This will developmetacognition: active supervision of your own thoughts. Note points of agreement, disagreement,confusion, epiphanies, and connections between different concepts or applications.
• Work through all mathematical exercises shown within the text, to ensure you understand all the steps.
• Imagine explaining concepts you’ve just learned to someone else. Teaching forces you to distill conceptsto their essence, thereby clarifying those concepts, revealing assumptions, and exposing misconceptions.Your goal is to create the simplest explanation that is still technically accurate.
• Create your own questions based on what you read, as a teacher would to challenge students.
How to effectively problem-solve and troubleshoot:• Rely on principles, not procedures. Don’t be satisfied with memorizing steps – learn why those steps
work. Each step should make logical sense and have real-world meaning to you.
• Sketch a diagram to help visualize the problem. Sketch a graph showing how variables relate. Whenbuilding a real system, always prototype it on paper and analyze its function before constructing it.
• Identify what it is you need to solve, identify all relevant data, identify all units of measurement, identifyany general principles or formulae linking the given information to the solution, and then identify any“missing pieces” to a solution. Annotate all diagrams with this data.
• Perform “thought experiments” to explore the effects of different conditions for theoretical problems.When troubleshooting, perform diagnostic tests rather than just visually inspect for faults.
• Simplify the problem and solve that simplified problem to identify strategies applicable to the originalproblem (e.g. change quantitative to qualitative, or visa-versa; substitute easier numerical values;eliminate confusing details; add details to eliminate unknowns; consider simple limiting cases; applyan analogy). Remove components from a malfunctioning system to simplify it and better identify thenature and location of the problem.
• Check for exceptions – does your solution work for all conditions and criteria?
• Work “backward” from a hypothetical solution to a new set of given conditions.
How to manage your time:• Avoid procrastination. Work now and play later, every single day.
• Consider the place you’re in when deciding what to do. If there is project work to do and you haveaccess to the lab, do that work and not something that could be done elsewhere (e.g. homework).
• Eliminate distractions. Kill your television and video games. Turn off your mobile phone, or just leaveit at home. Study in places where you can concentrate, like the Library.
• Use your “in between” time productively. Don’t leave campus for lunch. Arrive to school early. If youfinish your assigned work early, begin working on the next assignment.
Above all, cultivate persistence, as this is necessary to master anything non-trivial. The keys topersistence are (1) having the desire to achieve that mastery, and (2) realizing challenges are normal andnot an indication of something gone wrong. A common error is to equate easy with effective: students oftenbelieve learning should be easy if everything is done right. The truth is that mastery never comes easy!
file question0
18

Checklist when reading an instructional text
“Reading maketh a full man; conference a ready man; and writing an exact man” – Francis Bacon
Francis Bacon’s advice is a blueprint for effective education: reading provides the learner with knowledge,writing focuses the learner’s thoughts, and critical dialogue equips the learner to confidently communicateand apply their learning. Independent acquisition and application of knowledge is a powerful skill, well worththe effort to cultivate. To this end, students should read these educational resources closely, write their ownoutline and reflections on the reading, and discuss in detail their findings with classmates and instructor(s).You should be able to do all of the following after reading any instructional text:
√Briefly OUTLINE THE TEXT, as though you were writing a detailed Table of Contents. Feel free
to rearrange the order if it makes more sense that way. Prepare to articulate these points in detail andto answer questions from your classmates and instructor. Outlining is a good self-test of thorough readingbecause you cannot outline what you have not read or do not comprehend.
√Demonstrate ACTIVE READING STRATEGIES, including verbalizing your impressions as you read,
simplifying long passages to convey the same ideas using fewer words, annotating text and illustrationswith your own interpretations, working through mathematical examples shown in the text, cross-referencingpassages with relevant illustrations and/or other passages, identifying problem-solving strategies appliedby the author, etc. Technical reading is a special case of problem-solving, and so these strategies workprecisely because they help solve any problem: paying attention to your own thoughts (metacognition),eliminating unnecessary complexities, identifying what makes sense, paying close attention to details, drawingconnections between separated facts, and noting the successful strategies of others.
√Identify IMPORTANT THEMES, especially GENERAL LAWS and PRINCIPLES, expounded in the
text and express them in the simplest of terms as though you were teaching an intelligent child. Thisemphasizes connections between related topics and develops your ability to communicate complex ideas toanyone.
√Form YOUR OWN QUESTIONS based on the reading, and then pose them to your instructor and
classmates for their consideration. Anticipate both correct and incorrect answers, the incorrect answer(s)assuming one or more plausible misconceptions. This helps you view the subject from different perspectivesto grasp it more fully.
√Devise EXPERIMENTS to test claims presented in the reading, or to disprove misconceptions. Predict
possible outcomes of these experiments, and evaluate their meanings: what result(s) would confirm, and whatwould constitute disproof? Running mental simulations and evaluating results is essential to scientific anddiagnostic reasoning.
√Specifically identify any points you found CONFUSING. The reason for doing this is to help diagnose
misconceptions and overcome barriers to learning.
19

General challenges following a tutorial reading assignment
• Summarize as much of the text as you can in one paragraph of your own words. A helpful strategy isto explain ideas as you would for an intelligent child: as simple as you can without compromising toomuch accuracy.
• Simplify a particular section of the text, for example a paragraph or even a single sentence, so as tocapture the same fundamental idea in fewer words.
• Where did the text make the most sense to you? What was it about the text’s presentation that madeit clear?
• Identify where it might be easy for someone to misunderstand the text, and explain why you think itcould be confusing.
• Identify any new concept(s) presented in the text, and explain in your own words.
• Identify any familiar concept(s) such as physical laws or principles applied or referenced in the text.
• Devise a proof of concept experiment demonstrating an important principle, physical law, or technicalinnovation represented in the text.
• Devise an experiment to disprove a plausible misconception.
• Did the text reveal any misconceptions you might have harbored? If so, describe the misconception(s)and the reason(s) why you now know them to be incorrect.
• Describe any useful problem-solving strategies applied in the text.
• Devise a question of your own to challenge a reader’s comprehension of the text.
General follow-up challenges for assigned problems
• Identify where any fundamental laws or principles apply to the solution of this problem.
• Describe in detail your own strategy for solving this problem. How did you identify and organized thegiven information? Did you sketch any diagrams to help frame the problem?
• Is there more than one way to solve this problem? Which method seems best to you?
• Show the work you did in solving this problem, even if the solution is incomplete or incorrect.
• What would you say was the most challenging part of this problem, and why was it so?
• Was any important information missing from the problem which you had to research or recall?
• Was there any extraneous information presented within this problem? If so, what was it and why didit not matter?
• Examine someone else’s solution to identify where they applied fundamental laws or principles.
• Simplify the problem from its given form and show how to solve this simpler version of it. Examplesinclude eliminating certain variables or conditions, altering values to simpler (usually whole) numbers,applying a limiting case (i.e. altering a variable to some extreme or ultimate value).
• For quantitative problems, identify the real-world meaning of all intermediate calculations: their unitsof measurement, where they fit into the scenario at hand.
• For quantitative problems, try approaching it qualitatively instead, thinking in terms of “increase” and“decrease” rather than definite values.
• For qualitative problems, try approaching it quantitatively instead, proposing simple numerical valuesfor the variables.
• Were there any assumptions you made while solving this problem? Would your solution change if oneof those assumptions were altered?
• Identify where it would be easy for someone to go astray in attempting to solve this problem.
• Formulate your own problem based on what you learned solving this one.
20

Creative Commons License
This worksheet is licensed under the Creative Commons Attribution 4.0 International PublicLicense. To view a copy of this license, visit http://creativecommons.org/licenses/by/4.0/ or send aletter to Creative Commons, 171 Second Street, Suite 300, San Francisco, California 94105, USA. The termsand conditions of this license allow for free copying, distribution, and/or modification of all licensed worksby the general public.
Simple explanation of Attribution License:
The licensor (Tony Kuphaldt) permits others to copy, distribute, display, and otherwise use thiswork. In return, licensees must give the original author(s) credit. For the full license text, please visithttp://creativecommons.org/licenses/by/4.0/ on the internet.
More detailed explanation of Attribution License:
Under the terms and conditions of the Creative Commons Attribution License, you may make freelyuse, make copies, and even modify these worksheets (and the individual “source” files comprising them)without having to ask me (the author and licensor) for permission. The one thing you must do is properlycredit my original authorship. Basically, this protects my efforts against plagiarism without hindering theend-user as would normally be the case under full copyright protection. This gives educators a great dealof freedom in how they might adapt my learning materials to their unique needs, removing all financial andlegal barriers which would normally hinder if not prevent creative use.
Nothing in the License prohibits the sale of original or adapted materials by others. You are free tocopy what I have created, modify them if you please (or not), and then sell them at any price. Once again,the only catch is that you must give proper credit to myself as the original author and licensor. Given thatthese worksheets will be continually made available on the internet for free download, though, few peoplewill pay for what you are selling unless you have somehow added value.
Nothing in the License prohibits the application of a more restrictive license (or no license at all) toderivative works. This means you can add your own content to that which I have made, and then exercisefull copyright restriction over the new (derivative) work, choosing not to release your additions under thesame free and open terms. An example of where you might wish to do this is if you are a teacher who desiresto add a detailed “answer key” for your own benefit but not to make this answer key available to anyoneelse (e.g. students).
Note: the text on this page is not a license. It is simply a handy reference for understanding the LegalCode (the full license) - it is a human-readable expression of some of its key terms. Think of it as theuser-friendly interface to the Legal Code beneath. This simple explanation itself has no legal value, and itscontents do not appear in the actual license.
file license
21

Questions
Question 1
Read and outline the “Reference Junction Compensation” subsection of the “Thermocouples” sectionof the “Continuous Temperature Measurement” chapter in your Lessons In Industrial Instrumentationtextbook.
After closely reading and outlining a text, you should be ready to share the following with your classmatesand instructor:
(1) Your written summary of all major points of the text, expressed as simply as possible in your own words.A “Table of Contents” format works well for this.
(2) Active helpful reading strategies (e.g. verbalizing your thoughts as you read, simplifying longsentences, working through mathematical examples, cross-referencing text with illustrations or othertext, identifying the author’s problem-solving strategies, etc.).
(3) General principles, especially physical laws, referenced in the text.(4) Questions of your own you would pose to another reader, to challenge their understanding.(5) Ideas for experiments that could be used to either demonstrate some concept applied in the text, or
disprove a related misconception.(6) Any points of confusion, and precisely why you found the text confusing.
file i03990
Question 2
Read and outline the “Law of Intermediate Metals” subsection of the “Thermocouples” section of the“Continuous Temperature Measurement” chapter in your Lessons In Industrial Instrumentation textbook.
After closely reading and outlining a text, you should be ready to share the following with your classmatesand instructor:
(1) Your written summary of all major points of the text, expressed as simply as possible in your own words.A “Table of Contents” format works well for this.
(2) Active helpful reading strategies (e.g. verbalizing your thoughts as you read, simplifying longsentences, working through mathematical examples, cross-referencing text with illustrations or othertext, identifying the author’s problem-solving strategies, etc.).
(3) General principles, especially physical laws, referenced in the text.(4) Questions of your own you would pose to another reader, to challenge their understanding.(5) Ideas for experiments that could be used to either demonstrate some concept applied in the text, or
disprove a related misconception.(6) Any points of confusion, and precisely why you found the text confusing.
file i03991
22

Question 3
Read and outline the “Software Compensation” subsection of the “Thermocouples” section of the“Continuous Temperature Measurement” chapter in your Lessons In Industrial Instrumentation textbook.
After closely reading and outlining a text, you should be ready to share the following with your classmatesand instructor:
(1) Your written summary of all major points of the text, expressed as simply as possible in your own words.A “Table of Contents” format works well for this.
(2) Active helpful reading strategies (e.g. verbalizing your thoughts as you read, simplifying longsentences, working through mathematical examples, cross-referencing text with illustrations or othertext, identifying the author’s problem-solving strategies, etc.).
(3) General principles, especially physical laws, referenced in the text.(4) Questions of your own you would pose to another reader, to challenge their understanding.(5) Ideas for experiments that could be used to either demonstrate some concept applied in the text, or
disprove a related misconception.(6) Any points of confusion, and precisely why you found the text confusing.
file i03992
Question 4
Read and outline the “Extension Wire” subsection of the “Thermocouples” section of the “ContinuousTemperature Measurement” chapter in your Lessons In Industrial Instrumentation textbook.
After closely reading and outlining a text, you should be ready to share the following with your classmatesand instructor:
(1) Your written summary of all major points of the text, expressed as simply as possible in your own words.A “Table of Contents” format works well for this.
(2) Active helpful reading strategies (e.g. verbalizing your thoughts as you read, simplifying longsentences, working through mathematical examples, cross-referencing text with illustrations or othertext, identifying the author’s problem-solving strategies, etc.).
(3) General principles, especially physical laws, referenced in the text.(4) Questions of your own you would pose to another reader, to challenge their understanding.(5) Ideas for experiments that could be used to either demonstrate some concept applied in the text, or
disprove a related misconception.(6) Any points of confusion, and precisely why you found the text confusing.
file i03993
23

Question 5
Read and outline the “Side-Effects of Reference Junction Compensation” subsection of the“Thermocouples” section of the “Continuous Temperature Measurement” chapter in your Lessons InIndustrial Instrumentation textbook.
After closely reading and outlining a text, you should be ready to share the following with your classmatesand instructor:
(1) Your written summary of all major points of the text, expressed as simply as possible in your own words.A “Table of Contents” format works well for this.
(2) Active helpful reading strategies (e.g. verbalizing your thoughts as you read, simplifying longsentences, working through mathematical examples, cross-referencing text with illustrations or othertext, identifying the author’s problem-solving strategies, etc.).
(3) General principles, especially physical laws, referenced in the text.(4) Questions of your own you would pose to another reader, to challenge their understanding.(5) Ideas for experiments that could be used to either demonstrate some concept applied in the text, or
disprove a related misconception.(6) Any points of confusion, and precisely why you found the text confusing.
file i03994
Question 6
Read and outline the “Burnout Detection” subsection of the “Thermocouples” section of the“Continuous Temperature Measurement” chapter in your Lessons In Industrial Instrumentation textbook.
After closely reading and outlining a text, you should be ready to share the following with your classmatesand instructor:
(1) Your written summary of all major points of the text, expressed as simply as possible in your own words.A “Table of Contents” format works well for this.
(2) Active helpful reading strategies (e.g. verbalizing your thoughts as you read, simplifying longsentences, working through mathematical examples, cross-referencing text with illustrations or othertext, identifying the author’s problem-solving strategies, etc.).
(3) General principles, especially physical laws, referenced in the text.(4) Questions of your own you would pose to another reader, to challenge their understanding.(5) Ideas for experiments that could be used to either demonstrate some concept applied in the text, or
disprove a related misconception.(6) Any points of confusion, and precisely why you found the text confusing.
file i03995
24

Question 7
The relationship between the amount of voltage produced by a thermocouple’s measurement junction(Emeas), the voltage produced by the reference junction (Eref ), and the voltage received by the measuringinstrument (Emeter) is stated by the following equation:
VoltmeterEmeas
Eref
EmeterThermocouple
Thermocouple wire
Thermocouple wire
Copper wire
Copper wire
Emeter = Emeas − Eref
In a hardware-compensated thermocouple measuring instrument, the reference junction’s voltage iscanceled by the addition of a variable voltage source inside the instrument which we will designate asEcomp. An alternative approach is to connect an external device called an electronic ice-point between thevoltage-measuring instrument and the thermocouple, such that the “ice point” device adds the necessaryvoltage to compensate for the reference junction:
VoltmeterEmeas
Eref
EmeterThermocouple
Thermocouple wire
Thermocouple wire
Copper wire
Copper wire
Compensatingcircuit
Electronic ice-point
Re-write the thermocouple circuit equation to include this “compensating” voltage, and identify boththe magnitude and the polarity this voltage must have in order to successfully cancel Eref .
Suggestions for Socratic discussion
• Why can’t we just somehow build the thermocouple circuit so it doesn’t have a reference junction atall? That way we wouldn’t have to concern ourselves with compensation for this junction!
• Should we use thermocouple extension wire to connect the voltmeter to the ice-point circuit, or is copperwire sufficient?
• Can we get away with using copper extension wire all the way to the thermocouple so long as we’reusing an ice-point circuit? Why or why not?
file i00385
25

Question 8
Thermocouple-based temperature instruments work on the principle of measuring voltage output by athermocouple:
Cu
CuT
+ -
ProcessTemperature instrument
CuCu
Instrument in use
+
-
+
-
Iron
Constantan
(Type J)
If we try to simulate a thermocouple by using a precision potentiometer circuit to send a precise millivoltsignal to a temperature instrument, however, the instrument will not register the way we might expect. Forinstance, thermocouple tables for type J thermocouples tell us that 500 oF corresponds to a voltage signalof 14.110 mV. However, if we were to input this amount of signal voltage to a type J instrument, it wouldprobably not register 500 oF:
Cu
CuT
+ -
Temperature instrument
CuCu
Instrument in calibration
Cu
Cu
Precisionpotentiometer
+
-
+
-
Cu
Cu
Describe what the problem is, and determine the amount of voltage we would have to “dial up” on theprecision potentiometer in order to get the thermocouple instrument to register 500 oF, assuming an ambienttemperature of 72 oF.
Suggestions for Socratic discussion
• Express in general terms how one could solve a problem such as this one. In other words, think of away to express a general step-by-step solution you could give to someone in the form of an instructionlist, to show them how much voltage they would need to input to a temperature instrument to make it“think” it was connected to a thermocouple of any given temperature.
• Should the thermistor in the compensation bridge possess a positive or a negative coefficient of resistance?
file i00386
26

Question 9
Determine the correct potentiometer millivoltage setting to generate the following temperatureindications on the following instruments:
Cu+ -
Temperature instrument
Cu
+
-
+
-T
+ -
Precisionpotentiometer
Cu
Cu
Cu
Cu
(type K thermocouple)
Temp. = 76o F
Temp. = 65o F
• 0o F ; Potentiometer setting = ???
• 300o F ; Potentiometer setting = ???
• 600o F ; Potentiometer setting = ???
Cu+ -
Temperature instrument
Cu
+
-
+
-T
+ -
Precisionpotentiometer
Cu
Cu
Cu
Cu
(type J thermocouple)
Temp. = 68o F
Temp. = 73o F
• 400o F ; Potentiometer setting = ???
• 600o F ; Potentiometer setting = ???
• 800o F ; Potentiometer setting = ???
27

Cu+ -
Temperature instrument
Cu
+
-
+
-T
+ -
Precisionpotentiometer
Cu
Cu
(type J thermocouple)
Temp. = 70o F
Temp. = 50o F
Iron
Constantan
• 250o F ; Potentiometer setting = ???• 500o F ; Potentiometer setting = ???• 750o F ; Potentiometer setting = ???
Suggestions for Socratic discussion
• In each of these example circuits, only one of the ambient temperatures given is relevant. Identify whichone that is, and explain why the other one doesn’t matter.
• What would have to be different in each circuit for the irrelevant temperature to matter?• Explain what you would have to alter in each circuit in order to disable the temperature instrument’s
cold junction compensation (CJC).
file i00388
Question 10
It is important for a thermocouple-based temperature instrument to have a high input impedance. Whatdoes this mean, and why is it important in a thermocouple circuit?
Modern digital voltmeter designs all exhibit high input impedance – high enough for measuringthermocouple junction voltage, at least. Suppose, though, you were asked to measure the output ofa thermocouple without using any digital instruments. You have plenty of analog voltmeter movementsavailable, but they all have input impedances that are too low for this task.
Describe how you could build your own super-high input impedance voltmeter using readily availablecomponents. Extra points for doing so without using an electronic circuit!
file i00394
28

Question 11
Write an equation for each circuit shown, showing how all the voltages in each circuit relate to eachother:
Cu+ -
TC wire
TC wire
ProcessTemperature instrument
Cu
+
-
+
-Einstrument
Ereference
Emeasurement
(primitive)
Equation:
Cu+ -
TC wire
TC wire
ProcessTemperature instrument
Cu
+
-
+
-
Einstrument
Ereference
Emeasurement
Equation:
T
Ecompensation
+ -
29

Cu+ -
Temperature instrument
Cu
+
-
+
-
Einstrument
Equation:
T
Ecompensation
+ -
Precisionpotentiometer
Cu
Cu
Cu
CuEpotentiometer
Cu+ -
Temperature instrument
Cu
+
-
+
-
Einstrument
Equation:
T
Ecompensation
+ -
Precisionpotentiometer
Cu
CuEpotentiometer
TC wire
TC wire
Emeasurement
Ereference
Suggestions for Socratic discussion
• You should notice a definite progression in complexity from the first circuit to the last in this question.Why do you suppose these circuits were arranged in this order? How might this help you figure outthe equation for a realistic calibration circuit (such as the last two) in the future if you do not have areference at hand to remind you how thermocouple circuits work?
file i00387
30

Question 12
The following diagram is a simplified schematic for a 2-wire, loop-powered, 4-20 mA analog temperaturetransmitter:
−
+
Rsense
Rlimit
(ground)
Voltageregulator
InOut
Gnd
Rfeedback
Rbias
Out
Gnd
+V
Thermocouple
Op-amp
+V
Gnd
Amplifyingand scaling
circuitry
Loop-powered 4-20 mA temperature transmitter
The rest of the circuit, of course, looks something like this:
ThermocoupleLoop-powered
transmitter
2-wire cable
+ −
24 VDC
R
Calculate the amount of current through the emitter of the transistor inside the temperature transmittergiven the following conditions:
• Calibrated temperature range = 50 to 250 degrees C• Thermocouple temperature = 100 degrees C• Loop power supply = 24.0 volts• Loop resistance = 250 ohms• Voltage regulator input current = 3.7 mA (constant)
Also, trace the directions of all currents in the temperature transmitter circuit using both conventionaland electron flow notations.
file i00397
31

Question 13
The HART protocol was an early attempt at establishing a digital communications standard for fieldprocess instruments, designed as an extension of the already-popular 4 to 20 mA DC current signal standard.The basic idea of HART is that serial digital data could be encoded as bursts of high-frequency AC voltagesuperimposed on the DC voltage present in a 4-20 mA loop-powered circuit:
Loop-poweredtransmitter
250 Ω 24 VDC
C
DC power source
HART communicator
(HART-compatible)
4-20 mA DC
Indicator(1-5 VDC)
A microprocessor inside the loop-powered transmitter detects the digital data signals from the HARTcommunicator as pulses of low-voltage AC dropped across the transmitter terminals. The transmitter, inturn, has the ability to send digital data out in the same format, being detected by the communicator asAC voltage pulses across its terminals.
Apply the Superposition Theorem to this circuit, showing the circuit as “seen” by the AC signals sentbetween the transmitter and communicator, and showing the circuit as “seen” by the DC signals sent betweenthe transmitter and the indicator.
Also, identify where in the circuit the communicator may be connected and still be able to “talk” withthe smart instrument. What advantage(s) may there be in being able to connect the communicator atdifferent points in the circuit?
file i00400
32

Question 14
Write equations expressing the total voltage sensed by the indicating instrument, as functions of thevoltages shown in the diagrams. Assume that all junctions form the same thermocouple type (e.g. all typeJ, all type K, etc.):
V1
V2
V3
V4
V5
Vref
Vmeter = ???
Series thermocouple junctions
V1
V3
Vref
Vmeter = ???Parallel thermocouple junctions
V2
file i00399
Question 15
Differential thermocouple circuits are used to measure the difference in temperature between two points:
T1 T2
Indicator
Does the indicating instrument require reference junction compensation or not? Explain your answer.file i00401
33

Question 16
When using a thermocouple calibrator (simulator), where you simply set it to simulate a thermocoupleat a specified temperature, is it important to use the correct thermocouple or extension wire to connect thecalibrator with the transmitter, or is the wire type irrelevant?
Z S
4-20 mA cable
COMA
V
V A
AOFF
mA
Power supply
24 V
0
1 2 3
4 5 6
7 8 9
Enter
oF
Calibrator
AmmeterThermocouplewire
transmitter
Loop-poweredtemperature
J K E T S
K
oF
oC
???
Be sure to explain your answer, based on the presence of dissimilar-metal junctions and junction-compensation circuitry in both the calibrator and transmitter.
file i00396
Question 17
Terminal blocks used in thermocouple circuits are designed to be isothermal. For example, the dual-terminal connection block found inside a thermocouple “head” box is a prime example of an isothermalblock.
Explain what this term “isothermal” means, how it is physically designed, and also why it is an importantfeature.
file i00402
34

Question 18
Determine the correct potentiometer millivoltage setting to generate the following temperatureindications on the following instruments:
Cu+ -
Temperature instrument
Cu
+
-
+
-T
+ -
Precisionpotentiometer
Cu
Cu
(type J thermocouple)
Temp. = 80o F
Temp. = 71o F
iron
constantan
• -100o F ; Potentiometer setting = ???
• 150o F ; Potentiometer setting = ???
• 400o F ; Potentiometer setting = ???
Cu+ -
Temperature instrument
Cu
+
-
+
-T
+ -
Precisionpotentiometer
Cu
Cu
Temp. = 45o F
Temp. = 92o F
(type E thermocouple)
chromel
constantan
• 0o F ; Potentiometer setting = ???
• 375o F ; Potentiometer setting = ???
• 750o F ; Potentiometer setting = ???
35

Cu+ -
Temperature instrument
Cu
+
-
+
-T
+ -
Precisionpotentiometer
Cu
Cu
Temp. = 63o F
Temp. = 105o F
(type K thermocouple)
chromel
alumel
• -50o F ; Potentiometer setting = ???• 975o F ; Potentiometer setting = ???• 2000o F ; Potentiometer setting = ???
file i00422
Question 19
Suppose someone were to connect a precision potentiometer to a temperature instrument usingthermocouple wire, except that they chose the wrong type of thermocouple wire:
Cu+ -
Temperature instrument
Cu
+
-
+
-T
+ -
Precisionpotentiometer
Cu
Cu
(type K thermocouple)
Temp. = 94o F
Temp. = 86o F
Pt90%-Rh10%
Pt
The instrument technician performing the calibration sets the potentiometer to an output of 20.871millivolts, hoping to simulate a temperature of 1000o F for the temperature instrument to measure. However,since the wrong type of thermocouple wire is being used (type S instead of type K), the instrument willactually register something else.
Assuming the instrument is already properly calibrated, what temperature will it indicate with apotentiometer output of 20.871 mV and the indicated ambient temperatures?
file i00423
36
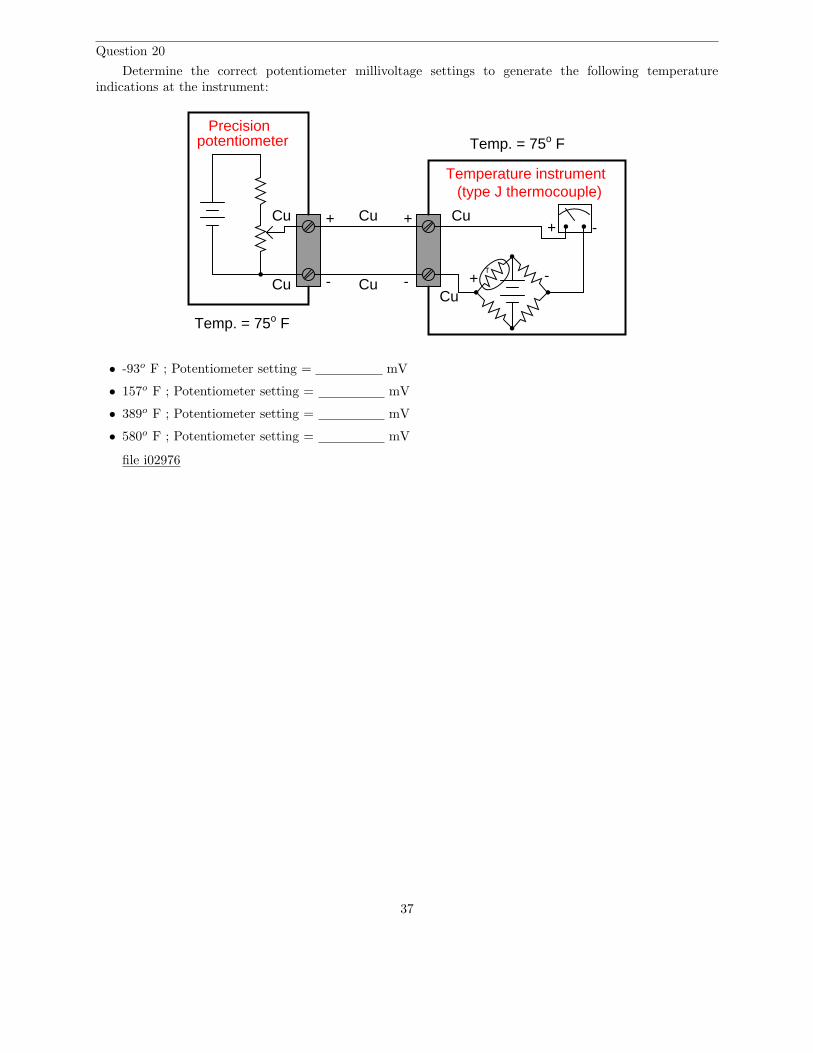
Question 20
Determine the correct potentiometer millivoltage settings to generate the following temperatureindications at the instrument:
Cu+ -
Temperature instrument
Cu
+
-
+
-T
+ -
Precisionpotentiometer
Cu
Cu
Cu
Cu
(type J thermocouple)
Temp. = 75o F
Temp. = 75o F
• -93o F ; Potentiometer setting = mV
• 157o F ; Potentiometer setting = mV
• 389o F ; Potentiometer setting = mV
• 580o F ; Potentiometer setting = mV
file i02976
37

Question 21
Read pages 10-13 of the Nuclear Regulatory Commission’s “Three Mile Island – A Report to theCommissioners and to the Public” for an overview of the nuclear reactor power generating system, andpages 30-31 (Section 5 of the accident narrative) highlighting instrument technicians’ roles on the day of theMarch 28, 1979 accident, then answer the following questions:
The normal operating temperature of water inside the reactor vessel is 575 oF, but yet the water doesnot boil even when the reactor is operating at full power. Explain how boiling is prevented with such a highoperating temperature (see page 10), referencing a steam table and a phase diagram if necessary.
On pages 40-41 of the report, it states that measured reactor steam temperatures in excess of 600 degreesF at a measured pressure of 495 PSI were clues that the heat-generating reactor core was “uncovered” (nolonger fully submerged in water inside the reactor vessel), because these figures imply superheated steam.Explain this reasoning, based on what you know about phase changes in general and steam in particular.Refer to a steam table and a phase diagram if necessary.
At the heart of the accident was a stuck-open pressure relief valve called a PORV. This open valve allowedcooling water to escape from the primary (reactor) coolant loop, eventually leading to a condition whereabout half of the reactor core (normally submerged in cooling water) was uncovered. Instrument technicianswere sent to manually measure reactor core temperatures by taking electrical measurements off the “incore”thermocouple wires (pp. 30-31 of the Report). Based on what you know about thermocouples, explainexactly the steps these instrument technicians would have taken to obtain the temperature measurements.
According to the Report, what subsequent action(s) were taken following the instrument technicians’measurements?
Hint: the Socratic Instrumentation website contains a page where you may download public-domaintextbooks, one of which is a set of steam tables published in 1920.
Suggestions for Socratic discussion
• Some of the millivoltage measurements taken of “incore thermocouples” by the technicians were “toolow to be believable,” and this is one of the reasons the high millivoltage measurements were dismissed.Based on what you know of thermocouples, is there any way a very hot thermocouple could produceunreasonably small millivoltage signals?
• Identify the ways in which heat is transferred from a nuclear reactor core to do useful work.• Identify the point on a phase diagram for water where a pressurized-water reactor such as TMI is
supposed to operate.• An insightful paragraph from this report reads, “Nuclear physics, as all science, is logical, and
those instruments are speaking the truth to anyone logical enough to recognize it. Defeat awaits theindividual who even subconsciously ascribes human qualitites like crankiness to functioning meters andthermocouples simply because they are bringing bad news. The answer in science is never to shoot themessenger.” (page 27). Discuss how you might very well encounter such attitudes on the job, and fromwhom these attitudes might come.
• On pages 42-43 of the report, it documents a “hydrogen burn” inside the concrete containment building,fueled by flammable hydrogen gas released by the overheated reactor through the stuck-open PORV.Explain how people were able to determine this was in fact a real explosion that occurred inside thebuilding, and also identify what they assumed the instruments’ readings meant when it first happened(i.e. not an explosion!).
file i03996
38

Question 22
Determine what type of temperature sensor is shown in this pictorial diagram, and then sketch wiresshowing how to correctly connect the sensor to the temperature transmitter:
Loop power
Sensor
Temperaturetransmitter
24 VDC power supply
Panel-mounted indicator(1-5 VDC input)
Temperature sensor Blue
Red
250 Ω± 0.1%
Note what types of metal each of the connecting wires should be (e.g. copper, chromel, alumel,constantan, iron, platinum, etc.).
Suggestions for Socratic discussion
• A problem-solving technique useful for making proper connections in pictorial circuit diagrams is tofirst identify the directions of all DC currents entering and exiting component terminals, as well as therespective voltage polarity marks (+,−) for those terminals, based on your knowledge of each componentacting either as an electrical source or an electrical load. Discuss and compare how these arrows andpolarity marks simplify the task of properly connecting wires between components.
• Suppose the wire colors on the thermocouple were rubbed off, so you could not visually discern positivefrom negative. A tag on the thermocouple still tells you the type, though. Is there some other way wecould determine thermocouple polarity?
• Suppose all labels and wire colors on the thermocouple were rubbed off, so you could not even tell whatkind of sensor it was: thermocouple, RTD, or thermistor. Devise a simple test by which you couldascertain the identify of the temperature sensor.
file i03997
39
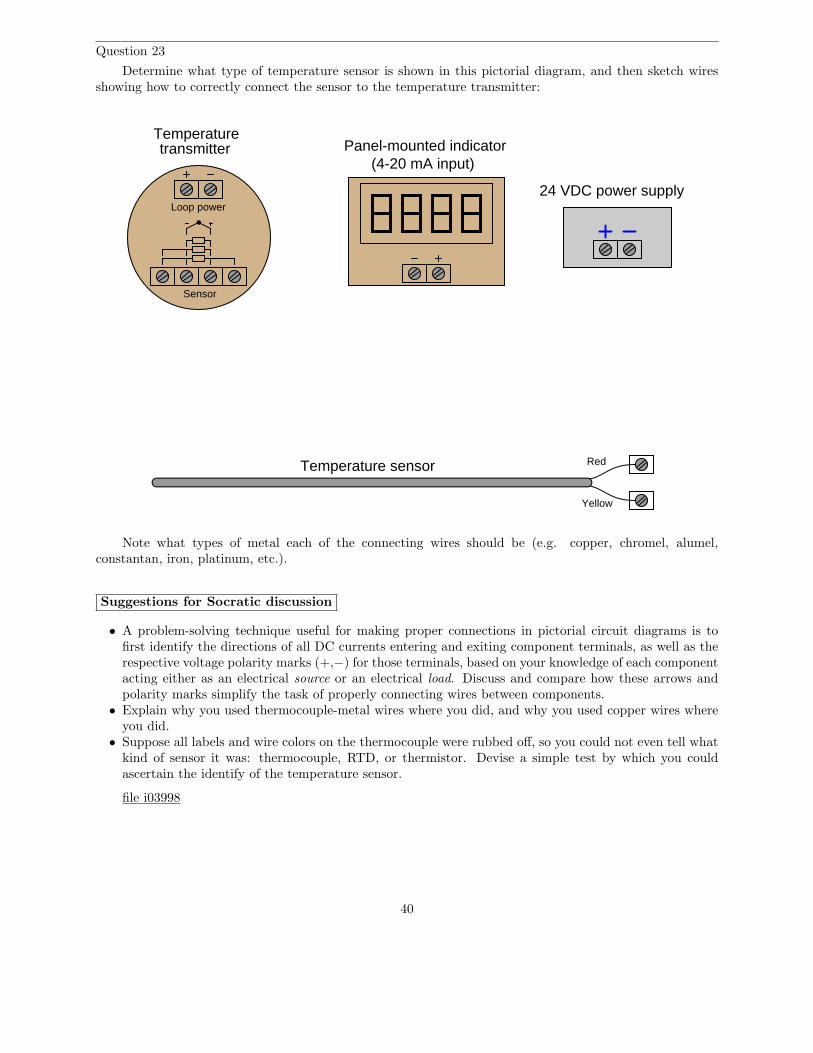
Question 23
Determine what type of temperature sensor is shown in this pictorial diagram, and then sketch wiresshowing how to correctly connect the sensor to the temperature transmitter:
Loop power
Sensor
Temperaturetransmitter
24 VDC power supply
Panel-mounted indicator
Temperature sensor Red
Yellow
(4-20 mA input)
Note what types of metal each of the connecting wires should be (e.g. copper, chromel, alumel,constantan, iron, platinum, etc.).
Suggestions for Socratic discussion
• A problem-solving technique useful for making proper connections in pictorial circuit diagrams is tofirst identify the directions of all DC currents entering and exiting component terminals, as well as therespective voltage polarity marks (+,−) for those terminals, based on your knowledge of each componentacting either as an electrical source or an electrical load. Discuss and compare how these arrows andpolarity marks simplify the task of properly connecting wires between components.
• Explain why you used thermocouple-metal wires where you did, and why you used copper wires whereyou did.
• Suppose all labels and wire colors on the thermocouple were rubbed off, so you could not even tell whatkind of sensor it was: thermocouple, RTD, or thermistor. Devise a simple test by which you couldascertain the identify of the temperature sensor.
file i03998
40

Question 24
Determine what type of temperature sensor is shown in this pictorial diagram, and then sketch wiresshowing how to correctly connect the sensor to the temperature transmitter:
Loop power
Sensor
Temperaturetransmitter
24 VDC power supply
Panel-mounted indicator
Temperature sensor Red
(4-20 mA input)
White
White
Note what types of metal each of the connecting wires should be (e.g. copper, chromel, alumel,constantan, iron, platinum, etc.).
Suggestions for Socratic discussion
• A problem-solving technique useful for making proper connections in pictorial circuit diagrams is tofirst identify the directions of all DC currents entering and exiting component terminals, as well as therespective voltage polarity marks (+,−) for those terminals, based on your knowledge of each componentacting either as an electrical source or an electrical load. Discuss and compare how these arrows andpolarity marks simplify the task of properly connecting wires between components.
• Identify the possible result of connecting the DC loop power supply to the wrong + and − terminals onthe temperature transmitter, explaining how we know this is bad for the circuit.
• Students very commonly mis-interpret the symbols drawn next to the input terminals of an RTDtransmitter, especially the terminals which must be made common to each other at the sensor. One ofthe most popular misconceptions is to think that those terminals shown common to each other by thesymbol are already joined together inside the transmitter. Explain why this interpretation cannot betrue, based on how you know 3-wire and 4-wire RTD circuits are designed to work.
file i03999
41

Question 25
The sensor in this diagram is a platinum RTD. Sketch wires showing how to correctly connect this RTDsensor to the temperature transmitter so that the wire resistance is canceled and will produce absolutely nomeasurement error:
Loop power
Sensor
Temperaturetransmitter
24 VDC power supply
Panel-mounted indicator(4-20 mA input)
Platinum RTD
Note what types of metal each of the connecting wires should be (e.g. copper, chromel, alumel,constantan, iron, platinum, etc.).
Suggestions for Socratic discussion
• A problem-solving technique useful for making proper connections in pictorial circuit diagrams is tofirst identify the directions of all DC currents entering and exiting component terminals, as well as therespective voltage polarity marks (+,−) for those terminals, based on your knowledge of each componentacting either as an electrical source or an electrical load. Discuss and compare how these arrows andpolarity marks simplify the task of properly connecting wires between components.
• Explain how and why the presence of four wires eliminates wire resistance errors.• If we were connecting a “decade box” precision resistance to the transmitter for the purposes of
simulating an RTD at temperature, would we still need to use four wires, or could we get away withusing only two wires?
• Suppose all labels and wire colors on the RTD were rubbed off, so you could not even tell what kindof sensor it was: thermocouple, RTD, or thermistor. Devise a simple test by which you could ascertainthe identify of the temperature sensor.
file i04000
42

Question 26
Suppose a precision voltage source (“precision potentiometer”) is used to simulate a thermocouple signalinto a temperature transmitter as such:
Loop power
Sensor
Temperaturetransmitter
0
1 2 3
4 5 6
7 8 9
Enter
J K E T S
oF
oC
mV
mV
Millivolt source
To 24 VDCloop power
copper-wire cable
Calculate the amount of voltage this precision source would have to output in order to simulate thefollowing thermocouple temperatures:
• Simulate 112 oF ; source voltage =
• Simulate 727 oF ; source voltage =
• Simulate 1380 oF ; source voltage =
Assume an ambient temperature near the transmitter of 75 oF, and a type K configuration with referencejunction compensation active.
Examine the keypad of the calibration instrument being used here, and determine how this three-pointcalibration could be done much easier than looking up millivoltage values in thermocouple tables.
Suggestions for Socratic discussion
• Explain the relevance of compensation being “active” in the transmitter. How would our calibrationdiffer if the compensation were turned off?
• What would happen if one of the wires inside the copper cable broke open during the calibration?• How would the calibration procedure differ if type “KX” extension wires were used to connect the
calibrator to the transmitter rather than copper wires?• Does the burnout mode of a thermocouple transmitter matter during a calibration such as this?
file i04001
43

Question 27
Suppose a decade box resistance unit is used to simulate an RTD signal into a temperature transmitteras such:
Loop power
Sensor
Temperaturetransmitter
To 24 VDCloop power
Decade resistance box
61 0 4 3
ohmstenshundreds tenths hundredths
Calculate the amount of resistance this decade box would have to be set to in order to simulate thefollowing RTD temperatures:
• Simulate 84 oF ; resistance =
• Simulate 195 oF ; resistance =
• Simulate 357 oF ; resistance =
Assume a 100 ohm platinum (α = 0.00385 Ω/ΩoC) RTD configuration for the transmitter.
Suggestions for Socratic discussion
• Explain why four wires are being used here for this RTD transmitter calibration.• If you consult a table for resistance values of a 100 ohm platinum RTD with an alpha value of 0.00385,
you will find the numbers slightly disagree with those predicted by the equation. Explain why.• Students very commonly mis-interpret the symbols drawn next to the input terminals of an RTD
transmitter, especially the terminals which must be made common to each other at the sensor. One ofthe most popular misconceptions is to think that those terminals shown common to each other by thesymbol are already joined together inside the transmitter. Explain why this interpretation cannot betrue, based on how you know 3-wire and 4-wire RTD circuits are designed to work.
file i04002
44

Question 28
Suppose you walk up to this thermocouple, installed to measure the temperature of an enclosed processvessel, and connect a sensitive voltmeter to the terminals at the junction head:
Red
Head Z S
Transmitter
4-20 mA cable
Process vessel
COMA
V
V A
AOFF
mV
(long length of extension cable)
Temp = ???
Ambient temp = 87 oF
Ambient temp = 71 oFVio
First, determine which lead of the voltmeter should contact which lead of the thermocouple (red tored?), then determine the temperature of the process vessel if the measured voltage is 15.830 mV.
Suggestions for Socratic discussion
• Will the transmitter’s measurement of temperature be affected when the voltmeter probes touch thethermocouple leads? In other words, will this influence the temperature measurement for an operator(or an automatic controller) during your test?
• Suppose the technician touches the multimeter probe tips to the thermocouple wires directly, rather thanto the copper terminals inside the junction head. Will this make any difference in the measurement?Explain why or why not.
• Suppose the technician mistakenly sets the multimeter up to measure current instead of voltage. Willthis affect the transmitter’s measurement of temperature when the meter probes touch the thermocoupleleads?
file i04003
45

Question 29
Read the report “Improving Thermocouple Service Life in Slagging Gasifiers” written by James Bennettof the US Department of Energy (DOE) Albany Research Center (document DOE/ARC-2005-043), andanswer the following questions:
What exactly does a gasifier do? What “feedstocks” does it input, and what products does it output?How do these facts make gasification a technology of interest for future energy production?
Identify the typical pressures and temperatures encountered in the interior of a slagging gasifier. Expressthese pressure and temperature ranges in bar and oF, respectively.
What type of thermocouple has traditionally been applied to this service? Explain why this choice ismore appropriate than some other thermocouple types.
How long have thermocouples typically lasted in this type of severe service, and how much does eachone cost to replace?
One of the alternative temperature-measurement technologies cited in this report is the use of sapphireprocess probes with fiber-optic cables to conduct light to a remote location where it may be sensed. Explainhow this novel temperature-measurement technology works, based on the description alone (and/or yourown independent research on the topic).
An interesting style of thermocouple experimented with for gasifier applications is the so-called openthermocouple. Explain how this sensing device is constructed, and how it differs from a regular thermocouple.
Identify some of the specific modes of thermocouple failure (i.e. how exactly is it that they are failing?).
Explain how “bridging” inside a gasifier may lead to incorrect thermocouple EMFs (millivolt signals).
Suggestions for Socratic discussion
• Examine the graph of thermocouple readings over a 3-hour test period as shown in figure 10. Whichslag thermocouple performed better as the sample warmed up? Which slag thermocouple performedbetter after the sample had reached 880 oC?
• Explain how “syngas analysis” may be alternatively used to infer temperatures inside the gasifier, andwhy this technique is not suitable for all phases of gasifier operation.
• Explain chemical interactions between thermocouple wires and compounds inside the gasifier can leadto measurement errors, even before complete failure of the thermocouple.
• Explain what it means to sequester carbon dioxide gas from a process, and why this is important fromthe perspective of environmental impact.
• Under what operating conditions may a gasifier be carbon-neutral (i.e. no net release of carbon dioxidegas to the atmosphere)?
• Under what operating conditions may a gasifier be carbon-negative (i.e. it removes more carbon dioxidegas from the atmosphere than it releases)?
file i02484
46

Question 30
Calculate VBC and VFG in this two-wire RTD circuit:
Rref = 100 Ω ; α = 0.00392
0.45 mA
Cable (Rconductor = 1.8 Ω each)
Temp = 233 oF
A
B
C
D
Voltmeter
E
F
G
H
file i02330
Question 31
Calculate VAC and VBC in this three-wire RTD circuit:
Rref = 100 Ω ; α = 0.00392
Rwire = 2.5 Ω
Rwire = 2.6 Ω
Rwire = 2.3 Ω A
B
C
D
E
0.52 mAT = 133 oC
file i02317
47

Question 32
Given the choice between these two wiring options (keeping the transmitter close to the process versusfar away), which is best, and why?
Yel RedType K
thermocouple(Yellow + Red
wires)
Head
Z S
Transmitter4-20 mA cable
Indicator
Extension wire
(long) (short)
Yel RedType K
thermocouple(Yellow + Red
wires)
Head
Z S
Transmitter
4-20 mA cable
IndicatorExtension wire
(long)(short)
Suggestions for Socratic discussion
• If the longer wire in each case were shielded, how should we ground the shield for best results?• How could we use a loop calibrator to “trick” the indicator into thinking the thermocouple was at some
particular temperature when in fact it was not?
file i00392
48

Question 33
Calculate VBC , VEH , and VFG in this four-wire RTD circuit:
0.7 mA
100 Ω RTD, α = 0.00385
Red
Red
Wht
Wht
Red
A
B
C
D
E
F
H
G
Temp = 473 oF
Tambient = 73 oF
Rwire = 1.34 Ω(each conductor)
Blk
Org
Brn
Blk
Brn
Red
Org
file i02315
49

Question 34
An RTD measures the temperature of saturated steam at the steam drum of a boiler:
Steam drum
"Mud" drum
FuelFlame
Hot gasesHot gases
Exhaust stack
TT
RTD
Feedwater
Saturated steam
The RTD connects to a bridge circuit via three wires, to register temperature at a sensitive voltmetermechanism in the control room:
RTD100 Ω
+−Vexcitation
R1 R3
R2
Suppose the boiler operator decides to increase the pressure of the boiler over a period of time. Identifythe effects this pressure change will have on these voltage drops in the RTD circuit:
• VR1 will increase, decrease, or stay the same?• VR2 will increase, decrease, or stay the same?• VR3 will increase, decrease, or stay the same?• VRTD will increase, decrease, or stay the same?• Explain the relationship between boiler pressure and boiler temperature:
file i04252
50

Question 35
Calculate the following voltage drops in this circuit assuming a thermocouple tip temperature of 718o
F, perfect calibration of all other instruments in the loop (Temp. range = 500 to 1000o F; current range =4 to 20 mA), and a DC power supply voltage of exactly 28 volts:
+
-
250Ω
+
L1
L2
G
ES 120VAC60 Hz
Fieldpanel
Field process area
Tag number Description Manufacturer Model Calibration Notes
Loop Diagram: Revised by: Date:
8
9
TB64 TB27
15
16
250 Ω resistor n/a +/- 0.1 %
1-5 VDC
Control roomP5 Fieldpanel
14
14
CBL 9 CBL 41
P30
CBL 223
4
TB40
TT
10
11
+
-14TI
CBL 10
14a14b
TY-14a,b
TIR-14
TYTY
TI-14
+
-
14TE
TE-14 Type K thermocouple Gordon Ungrounded tip
Local indicator 500 - 1000o F
T. Couple April 1, 2002#3 retort temperature
TT-14 Temperature transmitter Rosemount 444 500 - 1000o F4-20 mA
EurothermPaperless chart recorder
1 - 5 VDC
TIR
ES +28 VDC
ES DC Gnd
250Ω
Downscale burnout
• Voltage between terminals TB64-8 and TB64-9 =
• Voltage between terminals TB64-10 and TB64-11 =
• Voltage between terminals TB27-15 and TB27-16 =
Also, determine where you could connect a loop calibrator device to substitute for the transmitter, andwhat mode the calibrator should be set to in order to control the loop current.
Suggestions for Socratic discussion
• Demonstrate how to estimate numerical answers for this problem without using a calculator.• Discuss the options we have for thermocouple tip styles, and how this particular thermocouple’s tip
characteristics compare with others.• Explain what “downscale burnout” means and why this transmitter configuration might be significant.• What exactly is a “paperless” chart recorder?• What would happen in this system if the local indicator (TI-14) were to electrically fail open?
file i00393
51

Question 36
In this system, an Allen-Bradley SLC 500 PLC acts as a temperature controller, turning a cooling watersolenoid valve on and off to modulate water flow to the heat-exchange jacket of a chemical reactor vessel.A thermocouple monitors the temperature of the fluids within the vessel. This diagram shows only theelectrical connections (no piping, no other components represented) for simplicity:
ProcessorPowersupply
L1
Gnd
L2/N
Thermocouple
Input
0+
0-
1+
1-
2+
2-
3+
3-Com
CJC A+
CJC A-
CJC B+
CJC B-
VAC 1
OUT1
OUT2
OUT3
OUT4
OUT5
OUT6
OUT7
VAC 2
OUT0
Output0123
67
45
Input0123
4567
IN0
IN1
IN2
IN3
IN4
IN5
IN6
IN7
COM
COM
Allen-Bradley SLC 500 PLC
Blu
Red
BrnBlu
Red
BluBlu
Red
Installed in thermowellinside reactor vessel
Blk
Wht
BlkWhtGrn
From CB-5panel P-22
Blk
Wht
1
2
3
4
5
6
7
8
10
11
12
13
14
15
16
17
33
34
35
36
37
38
39
40
Cooling watersolenoid
One day the operator of this reactor contacts you to say the reactor is overheating, based on theindication of a temperature gauge installed in the reactor near the PLC’s thermocouple. The reactortemperature high/low setpoint values programmed in the PLC are 85 deg C and 80 deg C, respectively.The temperature gauge is registering 91 deg C and slowly climbing.
Identify some likely faults that could cause this situation to occur, and also identify what tests youwould begin to conduct in order to diagnose the problem.
file i03112
52

Question 37
In this circuit, a type of temperature sensor called an RTD is used to generate a DC voltage signal thatis read by a Programmable Logic Controller (PLC) – a specialized type of computer built to acquire andprocess information from industrial sensors – to be displayed on a graphic screen called a Human-MachineInterface (HMI):
120 VAC
3.3 kΩRTD
Programmable Logic Controller (PLC)
RS-485
LG
C1
X1
AD1V
AD1I
AD2V
AD2I
ACOM
DA1V
DA1I
DA2V
DA2I
CLICK
X2
X3
X4
C2
Y1
Y2
Y3
Y4
+V
C0-02DD1-D
Koyo
PWR
RUN
ERR
TX1
RX1
TX2
RX2
RUN
STOP
PORT 1
PORT 2
TX3
RX3
PORT 3
0 24V
DC/DC converter5 VDC24 VDC
Temperature =
deg C
Human-Machine Interface (HMI)
Communication/power cable
+−24 VDC
(1000 Ω @ 0o C)
The electrical resistance of this RTD changes with temperature according to the following formula, withR being the RTD’s resistance in ohms and T being the RTD’s temperature in degrees Celsius:
R = 1000(1 + 0.00385T )
The analog input module of the PLC senses the voltage dropped across the 3.3 kΩ resistor, convertingthis signal into a digital number inside the PLC’s memory directly representing volts DC. However, no humanoperator looking at the HMI display will know what “DC volts” is supposed to mean – he or she needs tosee a display in units of degrees Celsius, not volts.
Fortunately, PLCs are programmable. That is, you as a technician can enter a mathematical formulainto the memory of the PLC to convert the voltage value into a temperature value (in degrees C). Your taskis to take the RTD formula shown above, combine it with the voltage divider formula you know from yourstudies of DC circuits, and write a custom formula for this application solving for T in terms of V :
T =
Suggestions for Socratic discussion
• A useful technique for double-checking your answer is to work the problem backwards: begin with youranswer, working the problem in reverse to see if you arrive at the original (given) values. Explain howto apply this technique to double-checking your answer on this particular problem.
• Identify which fundamental principles of science, technology, and/or math apply to each step of yoursolution to this problem. In other words, be prepared to explain the reason(s) “why” for every step ofyour solution, rather than merely describing those steps.
• As the RTD temperature rises, does the voltage signal input to the PLC increase or decrease?
53

file i03402
Question 38
An automotive performance shop is testing an engine they just built for a race car. The engine isremoved from the car, attached to a dynamometer for measuring its horsepower and other performanceparameters. For temperature measurement, a type K thermocouple has been attached to the metal blockof the engine, thermocouple wires run all the way back to the control room where mechanics operate thedynamometer, and and a voltmeter connected to those thermocouple wires inside the control room (whichhappens to be at a temperature of 58 degrees F).
Before the engine is started up, the voltmeter reads 0.0 millivolts. The mechanics start up the engine,run it for several seconds, and then shut it down because they realized they forgot to hook up some othersensor for their main test. In that short run time, the voltmeter’s indication increased to 0.089 millivolts.
How hot did the engine get in that short period of time?
Assuming the engine is made of 300 pounds of iron, and filled with 2.5 gallons of water (in the coolingsystem), how much heat did the engine absorb within its own mass during those few seconds of run time?
file i00971
54

Question 39
DANGER! The following question will probably shatter your fundamental conceptions about howthermocouples work! If you find the topic confusing enough already, please turn the page and skip pastthis question!!
Everything you thought you knew about thermocouples is wrong. Well, maybe not everything, but justthe fundamental principle upon which they operate. In school you probably learned that the Seebeck effectdepends on a junction of dissimilar substances, usually two different metals or metal alloys.
Wrong.
In point of fact, the Seebeck effect exists along the length of any one substance that is differentiallyheated. Take this length of copper wire for example, with one end held at the freezing point of water andthe other end held at the boiling point of water:
Copper wireCold end Hot end
212o F
Seebeck voltage
32 oF
The Seebeck coefficient (σ) is equal to the derivative of voltage (V ) with respect to temperature (T ):
σ = lim∆T→0
∆V
∆T
σ =dV
dT
Different substances have different Seebeck coefficients. The following table shows several commonexamples:
Substance σ @ 0o C σ @ 100o CCopper 1.72 µV / oC 2.23 µV / oCSilver 1.42 µV / oC 1.84 µV / oCGold 2.3 µV / oC 2.0 µV / oC
Tungsten 1.9 µV / oC 6.7 µV / oCNickel -7.0 µV / oC -12.4 µV / oCKovar 0.20 µV / oC 0.19 µV / oCSilicon -408 µV / oC -455 µV / oC
However, it is impossible to measure this voltage by connecting a real voltmeter across the ends ofthis copper wire. Explain why. Furthermore, explain how a junction of dissimilar materials may produce athermal voltage that is easily measured.
file i02977
55

Question 40
Identify the problem(s) with this temperature measurement circuit:
Loop power
Sensor
Temperaturetransmitter
24 VDC power supply
Panel-mounted indicator
Temperature sensor Red
(4-20 mA input)
White
White
file i02895
Question 41
Read and outline the “Non-Contact Temperature Sensors” section of the “Continuous TemperatureMeasurement” chapter in your Lessons In Industrial Instrumentation textbook.
After closely reading and outlining a text, you should be ready to share the following with your classmatesand instructor:
(1) Your written summary of all major points of the text, expressed as simply as possible in your own words.A “Table of Contents” format works well for this.
(2) Active helpful reading strategies (e.g. verbalizing your thoughts as you read, simplifying longsentences, working through mathematical examples, cross-referencing text with illustrations or othertext, identifying the author’s problem-solving strategies, etc.).
(3) General principles, especially physical laws, referenced in the text.(4) Questions of your own you would pose to another reader, to challenge their understanding.(5) Ideas for experiments that could be used to either demonstrate some concept applied in the text, or
disprove a related misconception.(6) Any points of confusion, and precisely why you found the text confusing.
file i04017
56

Question 42
Read and outline the “Temperature Switches” section of the “Discrete Process Measurement” chapterin your Lessons In Industrial Instrumentation textbook.
After closely reading and outlining a text, you should be ready to share the following with your classmatesand instructor:
(1) Your written summary of all major points of the text, expressed as simply as possible in your own words.A “Table of Contents” format works well for this.
(2) Active helpful reading strategies (e.g. verbalizing your thoughts as you read, simplifying longsentences, working through mathematical examples, cross-referencing text with illustrations or othertext, identifying the author’s problem-solving strategies, etc.).
(3) General principles, especially physical laws, referenced in the text.(4) Questions of your own you would pose to another reader, to challenge their understanding.(5) Ideas for experiments that could be used to either demonstrate some concept applied in the text, or
disprove a related misconception.(6) Any points of confusion, and precisely why you found the text confusing.
file i04004
57

Question 43
Explain what the following “ladder-logic” circuit does, and identify the meaning of each symbol in thediagram:
L1 L2
TSH
TSL
Temp. high
Temp. low
TSHH
Cooling watersolenoid
Suggestions for Socratic discussion
• Explain why the TSH uses a normally-open contact instead of a normally-closed contact.• Explain why the TSL uses a normally-closed contact instead of a normally-open contact.• Based on what we see in this diagram, determine whether the electric solenoid valve allows cooling water
to flow when energized, or when de-energized.• What do the designations “L1” and “L2” refer to in ladder-logic electrical diagrams?• Suppose switch TSL has a trip setting of 105 oF (falling) and a deadband value of 2 oF. Explain how
this switch will respond to a rising and falling temperature.• Suppose we wished to have switch TSHH activate two different alarm lights instead of just one. Modify
the circuit diagram accordingly.
file i00364
58

Question 44
The “Site Programmable Transmitter” (model SPT) manufactured by Moore Industries is an electronicdevice capable of receiving input from an RTD or thermocouple, and outputting a discrete switch contactsignal useful as an alarm (in addition to outputting an analog 4-20 mA signal representing temperaturemeasurement):
SPTView
Select
Ready Trip Input
AC power plug
AC light bulbT/C
Yel Red
Based on analysis of this instrument’s datasheet, sketch the necessary wire connections so that the lightbulb will turn on when a certain temperature limit is exceeded. Also, determine what type of thermocoupleis shown in the diagram.
Suggestions for Socratic discussion
• Where is it appropriate to use copper wires in this circuit, and where should we use thermocouple orthermocouple extension wire?
• A cheaper alternative to the “SPT” is a simple temperature switch, such as the type directly actuatedby a bi-metal spring. Justify the extra expense and complexity of an SPT unit, in terms of what it cando that a simple temperature switch cannot.
file i04009
59

Question 45
Read and outline the “Temperature Standards” subsection of the “Practical Calibration Standards”section of the “Instrument Calibration” chapter in your Lessons In Industrial Instrumentation textbook.
After closely reading and outlining a text, you should be ready to share the following with your classmatesand instructor:
(1) Your written summary of all major points of the text, expressed as simply as possible in your own words.A “Table of Contents” format works well for this.
(2) Active helpful reading strategies (e.g. verbalizing your thoughts as you read, simplifying longsentences, working through mathematical examples, cross-referencing text with illustrations or othertext, identifying the author’s problem-solving strategies, etc.).
(3) General principles, especially physical laws, referenced in the text.(4) Questions of your own you would pose to another reader, to challenge their understanding.(5) Ideas for experiments that could be used to either demonstrate some concept applied in the text, or
disprove a related misconception.(6) Any points of confusion, and precisely why you found the text confusing.
file i04006
Question 46
Read and outline the “Temperature Sensor Accessories” section of the “Continuous TemperatureMeasurement” chapter in your Lessons In Industrial Instrumentation textbook.
After closely reading and outlining a text, you should be ready to share the following with your classmatesand instructor:
(1) Your written summary of all major points of the text, expressed as simply as possible in your own words.A “Table of Contents” format works well for this.
(2) Active helpful reading strategies (e.g. verbalizing your thoughts as you read, simplifying longsentences, working through mathematical examples, cross-referencing text with illustrations or othertext, identifying the author’s problem-solving strategies, etc.).
(3) General principles, especially physical laws, referenced in the text.(4) Questions of your own you would pose to another reader, to challenge their understanding.(5) Ideas for experiments that could be used to either demonstrate some concept applied in the text, or
disprove a related misconception.(6) Any points of confusion, and precisely why you found the text confusing.
file i04007
60

Question 47
Read portions of the Rosemount datasheet for high-temperature thermocouple assemblies (document00813-0401-2654) and answer the following questions:
Identify some of the different materials used in the construction of “protective tubes” (thermowells)offered by Rosemount for high-temperature measurement applications.
Ceramic thermowells may be damaged by a phenomenon called thermal shock. Explain what “thermalshock” is, how it may occur during thermocouple installation, and what precaution(s) to take to avoid this.
What are some of the factors to consider when selecting a thermowell material for a particular processapplication?
Explain what a multipoint gradient thermocouple assembly is, and what one might be used for.
Explain what limit tolerance class refers to, according to the DIN EN 60584-2 standard. Which classhas a tighter tolerance, Class 1 or Class 2?
Suggestions for Socratic discussion
• Why should thermowells in high-temperature applications be inserted vertically rather than horizontallywhenever possible?
• A section on page 6 of this document explains why type B thermocouples (where both wires are aplatinum-rhodium alloy) tend to be more stable over time than type S or R thermocouples which bothuse pure platinum for one of their wires. Re-phrase this explanation in your own words, articulatingwhy type B thermocouples are more stable than types R and S.
file i04010
61

Question 48
In this process, steam heat is supposed to maintain the temperature of solvent in the tank at 105 oF:
S-403Solvent storage tank
T
30 PSI steam
Dwg. 11032
LT305
Dwg. 11032
Condensate header
1-1/2"thick
LI305
WirelessHART HSet @10 oz.
TCV105
24"MW
TT304
WirelessHART
TI304
H
L
Solvent unloading
Dwg. 45231
press.
Set @8 oz.vac.
12"
4"
4" 2"
3"
P-25
ET
ET
ET
LSH234
LAH234
Solvent wash
Dwg. 32451
LSL233
IHC
PSL232
2"
1"
2"
2"
PSH231
PSV14
TT109
TI
109
PG367
PG366
PG368
PG365
PG364
PG363
TG209
PG361
TG205
PT271
271PIR H
Suppose the steam pressure indicated by PG-365 is 30 PSIG, and we know that this steam is saturated(i.e. it’s right at the boiling/condensing temperature for that pressure). Condensate (water) exits the heatingloop at 145 oF as indicated by TG-205. PG-361 shows the condensate line to be at atmospheric pressure (0PSIG).
Assuming a steam flow rate of 15 pounds per hour, calculate the approximate amount of time requiredto heat a new batch of solvent from ambient temperature (50 oF) up to 105 oF, if the stored volume ofsolvent is 4300 gallons, and the solvent happens to have a density of 57 lb/ft3 and a specific heat of 0.73.Feel free to neglect details such as heat loss through the insulation of the tank wall, and simply treat this asa heat input / temperature rise thermodynamics problem.
file i00973
62

Question 49
The Stefan-Boltzmann Law of radiated energy tells us that the rate of heat lost by radiant emissionfrom a hot object is proportional to the fourth power of the absolute temperature:
dQ
dt= eσAT 4
Where,dQdt
= Radiant heat loss rate, in watts (W)e = Emissivity factor, unitlessσ = Stefan-Boltzmann constant (5.67 × 10⁻⁸ W / m2 · K4)A = Surface area, in square meters (m2)T = Absolute temperature, Kelvin (K)
Algebraically manipulate this equation to solve for T in terms of all the other variables.file i00421
Question 50
A radiation-style pyrometer measuring the temperature of a piece of glowing-hot steel coming out ofa furnace at a steel mill produces a millivolt signal (at the thermopile sensing element) of 12.69 mV whenthe steel is at a temperature of 1400 oF. Calculate the approximate millivolt output signals at the followingtarget temperatures:
• 1600 oF ; Output = mV
• 800 oC ; Output = mV
• 1000 K ; Output = mV
file i00649
63

Question 51
This electrically-heated oven has a problem: instead of cycling between 340 oF and 350 oF as it isdesigned to, the temperature cycles between 349 oF and 351 oF:
Oven
Electric heatingelement terminals
TC
L1 L2
TC
Control circuit diagram
TSH
TSL
Element
TSL TSHCookies
340o F340o F
350o F
350o F
A
B
C DE
F
GH
TC-1
TC-2
Identify the likelihood of each specified fault for this circuit. Consider each fault one at a time (i.e. nocoincidental faults), determining whether or not each fault could independently account for all measurementsand symptoms in this circuit.
Fault Possible ImpossibleTSL contact failed open
TSL contact failed shortedTSH contact failed open
TSH contact failed shortedTC-1 contact failed open
TC-1 contact failed shortedTC-2 contact failed open
TC-2 contact failed shortedTC relay coil failed open
TC relay coil failed shortedBroken wire between points C and FBroken wire between points A and B
Finally, identify the next diagnostic test or measurement you would make on this system. Explain howthe result(s) of this next test or measurement help further identify the location and/or nature of the fault.
file i00296
64
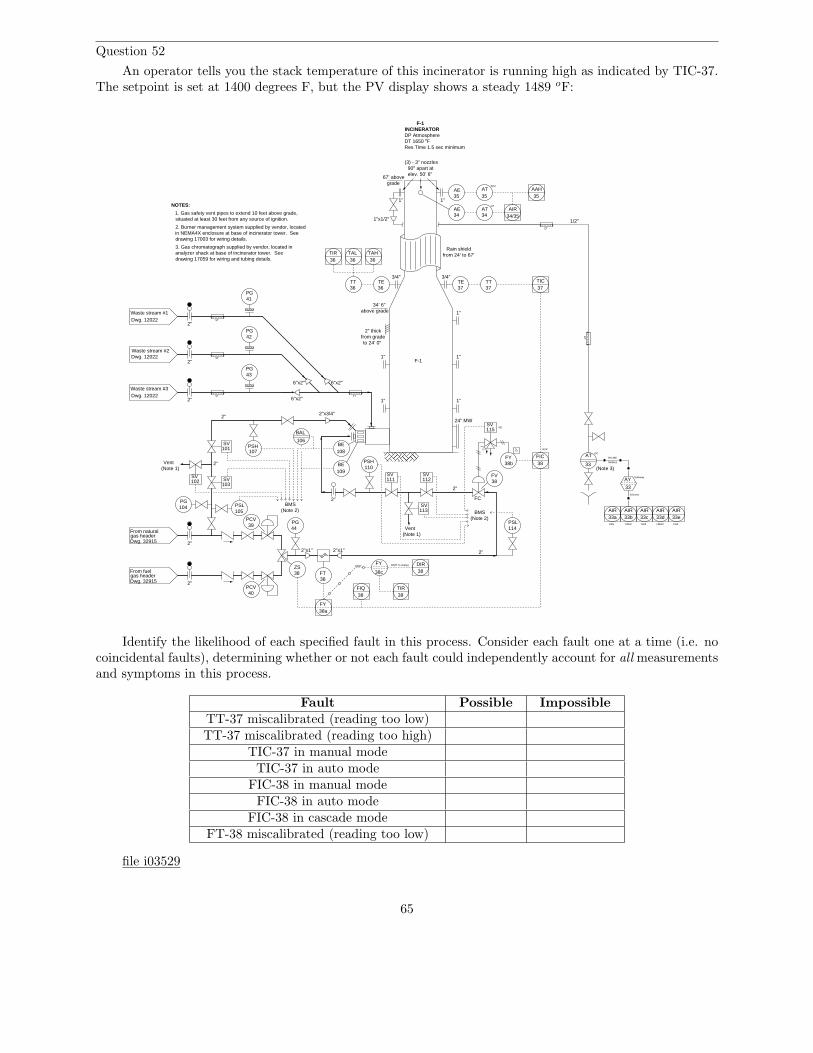
Question 52
An operator tells you the stack temperature of this incinerator is running high as indicated by TIC-37.The setpoint is set at 1400 degrees F, but the PV display shows a steady 1489 oF:
F-1
2" thick
Waste stream #1Dwg. 12022
Dwg. 12022
Dwg. 12022
Waste stream #2
Waste stream #3
Vent(Note 1)
ET
FC
TE37 37
TTTETT3636
TAL TAH36 36
From fuel gas headerDwg. 32915
gas headerDwg. 32915
From natural
Vent(Note 1)
FT
AE35
FV
3838
FY38a
I/P
FY38b
38
FIC38
TIC37
RSP
FIQ38
FY
38c
HART to analog
TIR38
DIRHARTZS38
(Note 2)
PSH
PSL
BMS
NE
D
AE34
90o apart atelev. 50’ 6"
67’ abovegrade
PSH
PSL
BE
BE
BMS
(Note 3)
PG
ST
ST
ST
AT
AT
34
35
AIR34/35
O2
SO2
from gradeto 24’ 0"
34’ 6"above grade
AAH
BAL
PG
PG
PG
2"x1" 2"x1"
6"x2"
6"x2" 6"x2"
Rain shieldfrom 24’ to 67’
F-1
DP AtmosphereDT 1650 oF
INCINERATOR
(3) - 3" nozzles
35
ETE
T
33
AT
AIR
AY
33
Gateway
RS-485
Ethernet
Modbus
AIRAIR AIR33a 33b 33c 33d
HNO3
NOTES:
1. Gas safety vent pipes to extend 10 feet above grade,situated at least 30 feet from any source of ignition.
(Note 2)
drawing 17003 for wiring details.
3. Gas chromatograph supplied by vendor, located inanalyzer shack at base of incinerator tower. See drawing 17059 for wiring and tubing details.
24" MW
GC
AIR33e
2. Burner management system supplied by vendor, locatedin NEMA4X enclosure at base of incinerator tower. See
SV101
SVSV102
103
SV
SV SV
104105
106
107 108
109110
111 112
113
114H2S C2H2 NH3
PCV40
PCV39
41
42
43
PG44
1/2"
2"
2"
SV115
CH4
2"x3/4"2"
2"
2"
2"
2"
2"
2"
2"
3/4"3/4"
1" 1"
1"
1"1"
1"x1/2"
1"1"
TIR36
Res Time 1.5 sec minimum
Identify the likelihood of each specified fault in this process. Consider each fault one at a time (i.e. nocoincidental faults), determining whether or not each fault could independently account for all measurementsand symptoms in this process.
Fault Possible ImpossibleTT-37 miscalibrated (reading too low)TT-37 miscalibrated (reading too high)
TIC-37 in manual modeTIC-37 in auto mode
FIC-38 in manual modeFIC-38 in auto mode
FIC-38 in cascade modeFT-38 miscalibrated (reading too low)
file i03529
65

Question 53
Calculate the pressure of gas inside an enclosed vessel using the Ideal Gas Law, if the vessel volume is1500 liters, the vessel and gas temperature is 125 oF, and the molecular quantity of gas inside the vessel is80 moles. Express this pressure in units of atmospheres and also kPaG (kilopascals, gauge pressure).
Suggestions for Socratic discussion
• The “Ideal Gas Law” is called ideal for a reason – it does not perfectly describe the behavior of realgases. Identify some scenarios where the Ideal Gas Law may yield erroneous results.
file i04014
Question 54
Two temperature switches sense the temperature inside an electrically-heated oven, each one with itsown “trip” value. Examine the schematic diagram for the control circuit, and then explain how it is supposedto function:
L1 L2
CR1
CR1
250 oF 285 oF
Heating element
Suppose relay contact CR1 were to fail open. Identify the effect this fault would have on the operationof the temperature control circuit.
Suggestions for Socratic discussion
• This type of control system is sometimes called differential gap. Explain why this label is appropriatefor describing the system’s operation.
• Sketch a modified version of this circuit whereby the same temperature switches and relay control powerto a three-phase electric heating element powered by 480 VAC.
• Explain the effect(s) of the vertical wire connecting between the two temperature switches were to failopen.
• Explain the effect(s) of the 285 oF temperature switch failing open.• Explain the effect(s) of the 285 oF temperature switch failing shorted.• Explain the effect(s) of the 250 oF temperature switch failing open.• Explain the effect(s) of the 250 oF temperature switch failing shorted.
file i04005
66

Question 55
Suppose two temperature-measuring instruments are measuring the exact same process temperature,providing redundant indications inside a control room:
Processvessel
oF
(voltmeter)
Control room
oF
(bourdon tube gauge)bulb
thermocouple
Operator
Both instruments are rather primitive: the thermocouple indicator is nothing more than an analogmilli-voltmeter movement, and the filled-bulb system is a Class V arrangement with a simple bourdon tubepressure gauge mechanism used as the temperature indicator.
Now, suppose that the operator accidently bumps the thermostat in the control room, causing thecontrol room’s ambient temperature to increase by 20o F. Assuming the process vessel temperature remainsthe same, describe the effect of elevated control room temperature on both temperature indicators, beingsure to explain why for both cases.
Suggestions for Socratic discussion
• Some Class V filled-bulb temperature instruments are compensated to eliminate calibration errorsresulting from changes in ambient temperature. Explain how such a “compensating” mechanism mightfunction – how exactly would it sense and then compensate for room temperature?
file i02969
67

Question 56
A technique to measure average temperature using multiple sensors involves paralleling multiplethermocouples, using “swamping resistors” to join them to a single transmitter:
Rswamp Rswamp Rswamp
Z S
Transmitter
4-20 mA cable
T/C #1
T/C #2
T/C #3
1 2 3 4 5 6 7 8 9 10 11 12 13 14 15
First, explain what the purpose of these swamping resistors is – why not just simply parallel the threethermocouples directly? Second, determine what will happen if one of these swamping resistors were to failopen.
Suggestions for Socratic discussion
• Describe a practical application where we might need to have an average temperature measurement ofthree different locations than a single-point measurement.
• Where should thermocouple wire be used in this circuit, and where is it appropriate to use copper wire?• Will the presence of these swamping resistors impact the reference junction compensation? Why or why
not?
file i02354
68

Question 57
Read the datasheet for “The WORM” flexible temperature sensor marketed by Moore Industries andanswer the following questions:
Explain how this sensor design ensures good thermal contact with the thermowell.
Identify some of the sensor types available in this product line.
Note which specific types of thermocouple sensor offered in this sensor respond fastest to changes inprocess temperature, and explain why.
Note the accuracy specified for RTD sensors, and compare this to the accuracy specifications you’veseen for thermocouples.
file i04008
Question 58
Determine the following test point voltages (all with reference to ground) at the following temperatures,for the following 4-wire RTD circuit:
RTD
−
+European αVout
100 Ω
22 kΩ 22 kΩ
22 kΩ22 kΩ
1.5 mA
1.7 Ω
1.6 Ω
1.8 Ω
1.7 Ω
−
+
−
+
TP1
TP2
TP3
TP4
TP5
• Voltage at TP1 (VTP1), with RTD at 0o C = V
• Voltage at TP2 (VTP2), with RTD at 10o F = V
• Voltage at TP3 (VTP3), with RTD at 12o C = V
• Voltage at TP5 (VTP5), with RTD at -20o C = V
file i00652
Question 59
Question 60
69

Question 61
Describe your recent learning experiences succinctly enough to be included as a line-item in your resume.Identify how this learning has made you more marketable in this career field. Be as specific as you can, andfeel free to include non-technical as well as technical learning in your description (e.g. project management,organization, independent research, troubleshooting, design, software applications, electric circuit analysis,control theory, etc.)!
Identify any knowledge and/or skill areas in which you would like to become stronger, and describepractical steps you can take to achieve that goal. Don’t limit yourself to just technical knowledge and skills,but consider behavioral habits (e.g. patience, attention to detail, time management) and general academicabilities (e.g. reading, writing, mathematics) as well. If you find yourself struggling to achieve a goal, don’tjust say “I’ll work harder” as your plan of action – identify something different you can do to achieve thatgoal.
Note: your responses to these questions will not be shared in Socratic discussion with classmates withoutyour consent. Feel free to maintain these as private notes between yourself and your instructor.
A helpful guide to traits and skills valued by employers are the “General Values, Expectations, andStandards” pages near the beginning of this worksheet. Another is the “So You Want To Be An InstrumentTechnician?” career guide.
file i00999
70

Question 62
A company named GlassPoint designed and built a rather ingenious solar-powered steam generatingsystem for enhanced oilfield recovery cost-competitive to natural gas in regions with plentiful direct sunshine.Their website in 2011 claimed these performance figures:
• Steam pressure = 2500 PSIG• Steam temperature = 750 degrees Fahrenheit• Steam volume = 90 barrels of boiler feedwater consumption per day, per acre of collection area
Based on these performance metrics, answer the following questions:
Is this saturated steam or superheated steam? How can you tell?
Calculate the water flow rate in units of gallons per minute (per acre of collection). Hint: one “barrel” isequal to 42 gallons. Assume the unit operates for 12 hours each day, not 24 hours since the sun does notshine at night.
Calculate the heat output rate in units of BTU per minute per acre of collection, assuming the boilerfeedwater starts at an ambient temperature of 70 degrees Fahrenheit.
Calculate the heat output rate in units of horsepower per acre of collection.
file i02899
Question 63
Read selected portions of the US Chemical Safety and Hazard Investigation Board’s analysis of the 1998chemical manufacturing incident at the Morton International manufacturing facility in Paterson, New Jersey(Report number 1998-06-I-NJ), and answer the following questions:
Based on the incident summary and key findings presented on pages 1 through 5, summarize how theprocess is supposed to work and then describe what went wrong to produce the explosion.
A graph on page 31 of the report contrasts heat production of the chemical reaction versus heat removalof the process cooling system. Identify where the “danger” point is on this graph, and explain why it isdangerous based on your knowledge of specific heat and heat transfer.
The chemical reactions involved in this process were primarily exothermic. Explain what this termmeans, and why it is important to the cause of this accident.
Suggestions for Socratic discussion
• Identify some of the discrepancies found in Morton’s MSDS datasheet for the Yellow 96 dye product (page3) and explain how MSDS datasheets (more commonly known now as SDS datasheets) are generallyuseful.
• Explain why the “heat removal” graph is a linear function, based on your knowledge of heat transferequations.
• Pick any point on the “heat removal” graph and explain how the temperature of the kettle will naturallyproceed from that temperature, based on a comparison of heat generation versus heat removal rates.Identify the two points on this graph where the temperature will settle at an equilibrium value.
• Identify the shape of the “heat removal” graph if the dominant mode of heat transfer were radiationinstead of conduction/convection.
file i04011
71

Question 64
Read selected portions of the US Chemical Safety and Hazard Investigation Board’s analysis of the 1998chemical manufacturing incident at the Morton International manufacturing facility in Paterson, New Jersey(Report number 1998-06-I-NJ), and answer the following questions:
Pages 14 and 16 of the report describe the construction of the “kettle” batch process used by Mortonto produce “Yellow 96” dye. Page 16 in particular shows a simplified P&ID of the batch process. Based onwhat you find in this section of the report, identify and explain all the modes of heat addition to and heatremoval from the process vessel. Also identify all measurement instrumentation for the kettle.
An important factor leading to this event was a failure to heed established Management of Change(MOC) procedures, as described on page 7, on pages 45-46, and also on pages 57-58. Explain what“Management of Change” refers to and why it is important for process safety.
Supposing the kettle was heated by a flow of saturated steam at 15 PSIG boiler pressure at a mass flowrate of 3 pounds per minute and cooling to become condensate (water) at atmospheric pressure and 200degrees F, calculate the amount of heat transferred to the kettle by this steam, in units of BTU per minute.
Hint: the Socratic Instrumentation website contains a page where you may download public-domaintextbooks, one of which is a set of steam tables published in 1920.
Suggestions for Socratic discussion
• An important safety policy at many industrial facilities is something called stop-work authority, whichmeans any employee has the right to stop work they question as unsafe. Explain how stop-work authoritycould have been applied to this particular incident.
• Explain why the transition from a 1000 gallon kettle to a 2000 gallon kettle resulted in diminishedheat-removal capacity, based on what you know about thermodynamics.
• If the pressure of the saturated steam used to heat the kettle increased, would this result in more heatdelivered to the kettle, less heat delivered to the kettle, or the same amount of heat delivered to thekettle?
• Do you suppose most of the heat transferred in the “condenser” took place via specific (sensible) heator via latent heat?
file i04012
72

Question 65
Simulated troubleshooting exercise
During today’s session your instructor will have a computer set up to run an electric circuittroubleshooting simulation program called TROUBLESHOOT, so that you can practice your troubleshootingskills on a simulated 4-wire RTD circuit.
The circuit we will be simulating today features a resistive sensor (e.g. RTD) connected to a DC currentsource, with voltage measured between two additional wires. In other words, it is a 4-wire RTD circuit. Thisis circuit number 003 selectable within the TROUBLESHOOT simulating program:
TP0
TP1
TP2 TP3 TP4
sourceI1
TP5
Circuit #003current100 µA
100%
0%
ResistivesensorTP6
TP7 TP8
TP9TP10TP11
Pot 1
WireWire Wire Wire
Wire Wire
WireWire
Wire Wire
Wire Wire
W1
W2 W3
W4
W5W6
W7 W8
W9W10W11
W12
(output voltagelimited to 30 V)
You may find it convenient to bring a printed copy of this schematic diagram with you to the sessionfor this purpose.
file i02847
73

Question 66
Determine how either of the potentiometers may be connected to the temperature transmitter in orderto simulate a 4-wire RTD:
Loop power
Sensor
Temperaturetransmitter Panel-mounted indicator
(1-5 VDC input)
250 Ω± 0.1%
+-
+-
+-
6 V 6 V 6 V
+-
6 V
Suggestions for Socratic discussion
• Students very commonly mis-interpret the symbols drawn next to the input terminals of an RTDtransmitter, especially the terminals which must be made common to each other at the sensor. One ofthe most popular misconceptions is to think that those terminals shown common to each other by thesymbol are already joined together inside the transmitter. Explain why this interpretation cannot betrue, based on how you know 3-wire and 4-wire RTD circuits are designed to work.
• A problem-solving technique useful for making proper connections in pictorial circuit diagrams is tofirst identify the directions of all DC currents entering and exiting component terminals, as well as therespective voltage polarity marks (+,−) for those terminals, based on your knowledge of each componentacting either as an electrical source or an electrical load. Discuss and compare how these arrows andpolarity marks simplify the task of properly connecting wires between components.
• Perhaps the most difficult part of this problem is deciding how to connect the potentiometer to thetransmitter. One way to help you solve this problem is to apply the technique of simplifying theproblem so that it is easier to solve, then use that solution as a starting point for the final solution ofthe given (complex) problem. Show how you would first simplify the given problem here, and what thatsimple(r) solution would look like.
file i03567
74

Question 67
Connect the necessary wires so that this temperature transmitter sends a 4-20 mA current signal tochannel 1 of the analog input card on the PLC, assuming the temperature transmitter will be configured fora 3-wire RTD sensor:
Processor Input0123
4567
IN0
IN1
IN2
IN3
IN4
IN5
IN6
IN7
COM
COM
Analog
Output
I OUT 0
I OUT 1
I OUT 2
I OUT 3ANL COM
ANL COM
ANL COM
ANL COM
+24 VDC
DC COM
Powersupply
L1
Gnd
L2/N
IN 0+IN 0-
IN 1+IN 1-
IN 2+IN 2-
IN 3+IN 3-
Input
Analog
ANL COM
ANL COM
ANL COM
ANL COM
Allen-Bradley SLC 500 PLC
Loop power
Sensor
Temperaturetransmitter
24 VDC power supply
Platinum RTD
Suggestions for Socratic discussion
• Students very commonly mis-interpret the symbols drawn next to the input terminals of an RTDtransmitter, especially the terminals which must be made common to each other at the sensor. One ofthe most popular misconceptions is to think that those terminals shown common to each other by thesymbol are already joined together inside the transmitter. Explain why this interpretation cannot betrue, based on how you know 3-wire and 4-wire RTD circuits are designed to work.
• What type(s) of wire should be used to connect the RTD to the input terminals on the transmitter?Should platinum wires be used (to match the RTD’s wire type) or may regular copper wires be used?
file i03430
75

Question 68
Suppose you are asked to configure the instruments in this pressure control loop to sense and displayprocess pressure over a range of 0 to 150 kPa, with the loop controller actuating two split-ranged controlvalves in a progressive sequence:
P IAS
Output range:4 to 20 mA
Input range: Output range:
Input range: Stem stroke:
PV
Output
Input LRV:Input URV:
A
P
Input range: Stem stroke:
B
Desired control valve sequencing:0% 100%50%
(open)(shut)
(shut) (open)
PT
PY
PV
PV
PV-A
PV-B
PIC
AI function blockXD_Scale: 0 to 100%L_Type: Indirect
AI function blockOUT_Scale:
Emerson DeltaV DCS
AO function blockPV_Scale: 0 to 100%
PID function blockPV_Scale:
IAS
PY
Input range: Output range:
A
B
?? ? ?
? ?
? ?
? ?
? ?
Write the proper range values inside the boxes near each instrument, showing the proper configurationfor each instrument needed to achieve the desired result.
Suggestions for Socratic discussion
• Suppose the controller displayed a pressure of 80 kPa when the actual process pressure was 87 kPaPSIG. First, identify two possible locations in this loop for a calibration error that would account forthis discrepancy. Then, assuming only one fault, explain how you could positively determine the locationof this calibration error with a single diagnostic test.
• Suppose valve PV-A was 100% open and PV-B was 60% open when the controller output displayed 75%.First, identify three possible locations in this loop for a calibration error that would account for thisdiscrepancy. Then, assuming only one fault, explain how you could positively determine the location ofthis calibration error with no more than two diagnostic tests.
file i02081
76
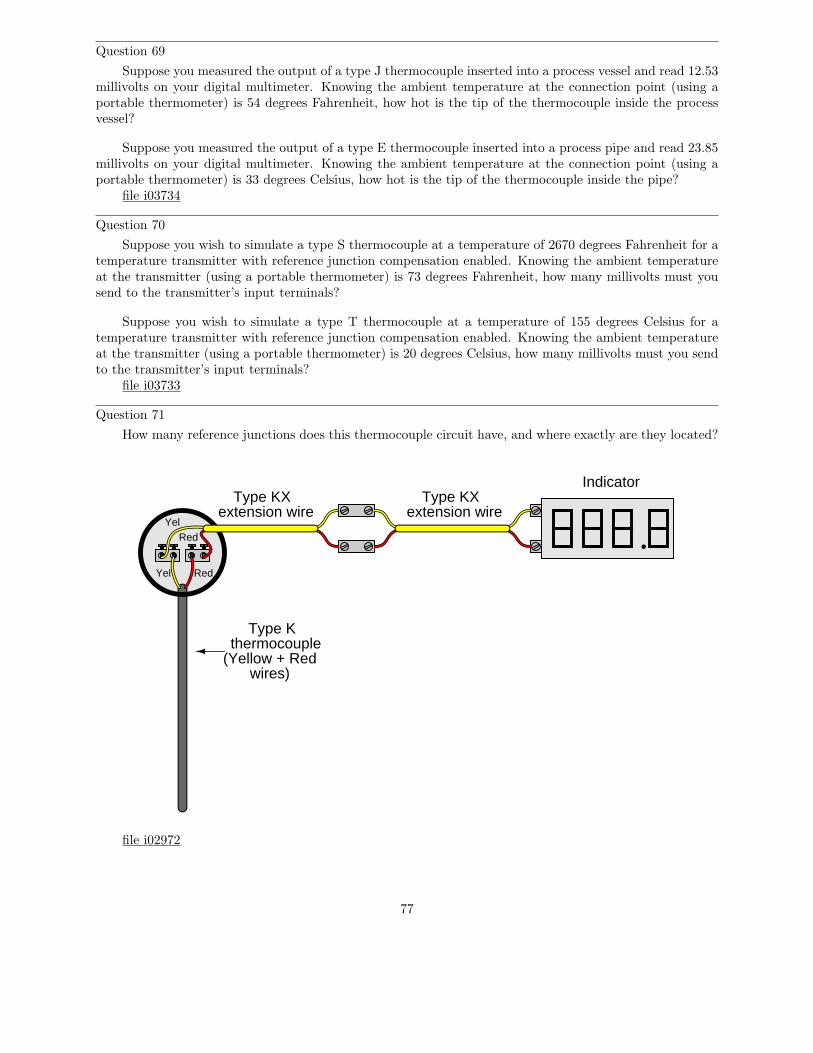
Question 69
Suppose you measured the output of a type J thermocouple inserted into a process vessel and read 12.53millivolts on your digital multimeter. Knowing the ambient temperature at the connection point (using aportable thermometer) is 54 degrees Fahrenheit, how hot is the tip of the thermocouple inside the processvessel?
Suppose you measured the output of a type E thermocouple inserted into a process pipe and read 23.85millivolts on your digital multimeter. Knowing the ambient temperature at the connection point (using aportable thermometer) is 33 degrees Celsius, how hot is the tip of the thermocouple inside the pipe?
file i03734
Question 70
Suppose you wish to simulate a type S thermocouple at a temperature of 2670 degrees Fahrenheit for atemperature transmitter with reference junction compensation enabled. Knowing the ambient temperatureat the transmitter (using a portable thermometer) is 73 degrees Fahrenheit, how many millivolts must yousend to the transmitter’s input terminals?
Suppose you wish to simulate a type T thermocouple at a temperature of 155 degrees Celsius for atemperature transmitter with reference junction compensation enabled. Knowing the ambient temperatureat the transmitter (using a portable thermometer) is 20 degrees Celsius, how many millivolts must you sendto the transmitter’s input terminals?
file i03733
Question 71
How many reference junctions does this thermocouple circuit have, and where exactly are they located?
Yel Red
Type Kthermocouple
(Yellow + Redwires)
YelRed
extension wire extension wire
IndicatorType KX Type KX
file i02972
77

Question 72
Determine the correct potentiometer millivoltage settings to generate the following temperatureindications at the instrument:
Cu+ -
Temperature instrument
Cu
+
-
+
-T
+ -
Precisionpotentiometer
Cu
Cu
Cu
Cu
(type J thermocouple)
Temp. = 70o F
Temp. = 70o F
• 0o F ; Potentiometer setting = mV
• 229o F ; Potentiometer setting = mV
• 454o F ; Potentiometer setting = mV
• 641o F ; Potentiometer setting = mV
file i00651
78

Question 73
An RTD measures the temperature of saturated steam at the steam drum of a boiler:
Steam drum
"Mud" drum
FuelFlame
Hot gasesHot gases
Exhaust stack
TT
RTD
The RTD connects to a bridge circuit via three wires, to register temperature at a sensitive voltmetermechanism in the control room:
RTD100 Ω
+−Vexcitation
R1 R3
R2
Suppose the boiler operator decides to decrease the pressure of the boiler over a period of time. Identifythe effects this pressure change will have on these voltage drops in the RTD circuit:
• VR1 will increase, decrease, or stay the same?• VR2 will increase, decrease, or stay the same?• VR3 will increase, decrease, or stay the same?• VRTD will increase, decrease, or stay the same?• Explain the relationship between boiler pressure and boiler temperature:
file i00653
79

Question 74
Suppose we needed to measure the temperature of a batch “reactor” vessel at a biopharmaceuticalmanufacturing facility. We know the temperature of this particular vessel may range between 20o F and300o F, and we also know we need the temperature measurement to be as precise and accurate as possibleat all points within this range.
Choose the best temperature sensing element for this application from the list below, and then explainwhy it will provide the best accuracy for this application:
• 100 ohm platinum RTD• Type S thermocouple• Type J thermocouple• Class III filled-bulb (with pneumatic transmitter)
file i00650
80

Question 75
Industrial operations using large quantities of steam often distribute it at different pressures, much likean electrical utility system distributing power at several different voltages:
600 PSI header
150 PSI header
30 PSI header
Process
Power turbine
Condensate
Condensate
Turbine
Process Process
Condensate
Heating
Condensate
Heating
It may not always be practical to have a separate boiler (or set of boilers) for each header pressure (e.g.one boiler outputting 600 PSI, one outputting 150 PSI, and one outputting 30 PSI). So, often there is a needto “let down” high-pressure steam to a lower pressure.
Although it is possible to simply use control valves to throttle high-pressure steam into a lower-pressureheaders, this would be a waste of energy. Such a strategy would be analogous to using resistive voltagedividers to step high voltage down to lower values in an electric power system:
600 PSI header
PC PT
PC PT
150 PSI header
30 PSI header
LSP = 150
LSP = 30
600 PSIboiler(s)
A very inefficient way to get different steam pressures!
Let-down valve
Let-down valve
An improvement over the plain let-down strategy is to use special desuperheating valves instead ofnormal throttling valves. Desuperheating is a process whereby water is sprayed into the throttled steam:
81

600 PSI header
PC PT
PC PT
150 PSI header
30 PSI header
LSP = 150
LSP = 30
600 PSIboiler(s)
Water
Water
Desuperheatingvalve
Desuperheatingvalve
A better way to get different steam pressures!
Desuperheaters may be thought of as the steam equivalent of electrical transformers: a much moreefficient means of reducing pressure (voltage) than throttling with a restrictive (resistive) element. Explainhow desuperheating works, and why the electrical transformer analogy is appropriate.
file i01801
82

Question 76
One simple way to build a “reference junction compensation” circuit is to use a bridge with a thermistor(temperature-sensitive resistor) in one arm like this:
VoltmeterCu
Temperature indicatorinstrument
CuT
Cu
C
+ -
As the terminal block warms up and cools down, the resistance of the thermistor will change, alteringthe balance of the bridge to add the appropriate amount of voltage in series with the meter circuit to cancelout the millivoltage generated by the thermocouple wires connecting with copper wires at the terminal block(the “reference junction”).
Given the type of thermocouple shown here (type T, with copper and constantan wires), the voltmeter’spolarity, the orientation of the battery in the bridge circuit, and the thermistor’s location in the bridge circuit,does the thermistor have to have a positive temperature coefficient (resistance increases as temperatureincreases) or a negative temperature coefficient (resistance decreases as temperature increases)?
Hint: begin your solution to the problem by properly identifying the source of the problem itself –determine the polarity of the reference junction voltage, so you will know which way the bridge’s outputvoltage must be oriented to cancel it out.
Suggestions for Socratic discussion
• What type of temperature coefficient does an RTD have?• Suppose the thermistor did not have the right magnitude of temperature coefficient (i.e. it’s “alpha”
value was wrong). Would this affect the system’s zero, span, or both?• If we must use a thermistor to compensate for the reference junction of a thermocouple, then why use a
thermocouple to sense process temperature at all? Why not just use a thermistor located at the processand be done with it?
• If the thermistor fails open, will it drive the voltmeter upscale or downscale?• If the thermistor fails shorted, will it drive the voltmeter upscale or downscale?
file i00384
83

Question 77
Once upon a time, an instrument technician (and BTC graduate!) stumbled upon this temperaturemeasurement circuit at a biopharmaceutical manufacturing facility, used to measure the temperature ofstorage freezers:
Loop
RTD
+sense
-sense
+excit
-excit
RTD
Red
Wht
Wht
Red
4-conductor cable
4-20 mA toindicator. . .
. . .
Identify the type of calibration error introduced by this improper wiring (e.g. zero shift, span shift,linearity, hysteresis), and also explain how the wiring error may be corrected for improved measurementaccuracy.
file i03740
84

Question 78
Read portions of the Moore Products model 33 “Nullmatic” pneumatic temperature transmitter servicemanual and answer the following questions:
Identify the upper operating temperature limit of this instrument, and compare this against commonthermocouples.
Describe a typical calibration procedure for this transmitter.
Determine whether this is a force-balance or a motion-balance instrument, based on an examination ofits cut-away diagram.
Suggestions for Socratic discussion
• Explain how the “zero” adjustment works in this temperature transmitter.• Explain how the span of this temperature transmitter could be altered.• Identify at least one fault that could cause the pneumatic output of this instrument to saturate low
(below 3 PSI)• Identify at least one fault that could cause the pneumatic output of this instrument to saturate high
(above 15 PSI)• If the ambient temperature of this instrument increases, what effect (if any) will it have on the output
signal?• If you were to classify this filled-bulb instrument by number, which one would it be (e.g. Class I, II, III,
V)?
file i04016
85

Question 79
Calculate VBC , VEH , and VFG in this four-wire RTD circuit, assuming the RTD transmitter uses a 0.35mA current source to “excite” the RTD circuit:
Rwire = 2.5 Ω
Rwire = 2.6 Ω
Rwire = 2.3 Ω
A B C D
E
10 Ω copper RTDα = 0.00427 Ω/Ω/oC
Rwire = 2.2 Ω
F
G
H
T = 320 oF
Transmitter
0.35 mA
ADC
Note: reference a table for this RTD to determine its resistance at the specified temperature.
Also, determine which of the four wires should be colored red, and which should be colored white.
Suggestions for Socratic discussion
• Does it matter to the accuracy of this system that the four wires have unequal resistances?• Which of the two requested voltages have the same value, and why?• When you look at the table of resistance values for a 10 ohm copper RTD, you will note it differs from
platinum RTDs in terms of its “10 ohm” reference temperature. What is the reference temperature fora 10 ohm copper RTD?
file i02316
86

Question 80
Read “Case Number 1” (pages 1-4) of the US Chemical Safety and Hazard Investigation Board’s safetybulletin on “Management of Change” (Bulletin number 2001-04-SB) discussing the 1998 coker fire at theEquilon refinery in Anacortes (Washington), and answer the following questions:
Explain in general terms what happened in the Coker unit of the refinery following a power outage, thatled to this accident. Specifically, identify how temperature measurement played a crucial role in the decisionto drain the coke drum.
Identify how the temperature sensors would have had to be built differently in order to provide betterinformation to operations about the status of the coke drum under these abnormal conditions. Explain whytheir existing design was adequate to measure temperature under normal operating conditions.
Page 2 describes how a similar incident (though not lethal) occurred in 1996. Describe the follow-up tothat incident, and how better “Management of Change” (MOC) procedures might have prevented the 1998disaster.
A significant number of industrial accidents may be traced back to insufficient or non-existent MOCpolicies. Identify some of the reasons MOC might not be adequately applied at an industrial facility, andwhat you as a technician might be able to do to increase the likelihood MOC procedures are respected.
Suggestions for Socratic discussion
• An important safety policy at many industrial facilities is something called stop-work authority, whichmeans any employee has the right to stop work they question as unsafe. Explain how stop-work authoritycould have been applied to this particular incident.
• An ironic hazard within many chemical processing operations is that of a power failure. This seemsodd at first, because we typically associate the lack of electrical power with safety (lock-out, tag-out)rather than with danger. However, a chemical processing operation may become very dangerous whenelectrical service is disrupted. Try to generalize why this is, based on this particular case at the Equilonrefinery and/or on any industrial accident examples you may be familiar with.
• The report notes that “heat transfer calculations” would have shown a much longer cooling timenecessary than what operators assumed. Identify which heat transfer equations might apply to thistype of scenario, identifying the important variables dictating rate of cooling for the coke drum.
file i04253
87

Question 81
Calculate the amount of voltage dropped across the RTD element in this circuit, the amount of voltageoutput by the operational amplifier, and the amount of temperature measurement error based on thediscrepancy between those two voltages:
RTD
−
+
R = 104.2 Ω
Rwire = 1.1 Ω
Rwire = 1.2 Ω
VoutBlk
Blk
Red
1 mA
Rwire = 1.0 Ω
1 MΩ 1 MΩ
α = 0.00385
VRTD =
Vout =
Temp. error =
Note: the RTD in this circuit is a “100 ohm” platinum sensor, but its actual resistance at thistemperature is 104.2 Ω.
Note: in order to simplify your analysis, you may assume the current through the 1 MΩ resistors to bezero. The actual current is so small as to be negligible.
file i00041
88

Question 82
Suppose the voltmeter in this bridge circuit is “pegged” in the positive direction. A test using a digitalmultimeter (DMM) shows the voltage between test points B and E to be 7.2 volts:
+ −
R1 R2
R3
1 kΩ
A B
C
D
(0.25 ampscurrent-limited)
R4
1 kΩ
12 volts
1 kΩ 1 kΩ
Voltmeter
R5 1 kΩ
E
Identify the likelihood of each specified fault for this circuit. Consider each fault one at a time (i.e. nocoincidental faults), determining whether or not each fault could independently account for all measurementsand symptoms in this circuit.
Fault Possible ImpossibleR1 failed openR2 failed openR3 failed openR4 failed openR5 failed open
R1 failed shortedR2 failed shortedR3 failed shortedR4 failed shortedR5 failed shorted
Voltage source dead
Finally, identify the next diagnostic test or measurement you would make on this system. Explain howthe result(s) of this next test or measurement help further identify the location and/or nature of the fault.
file i02702
89

Question 83
Suppose an instrument technician connects a multimeter (set to measure millivolts DC) to the ends ofa thermocouple cable, the other end of the cable terminating in a thermocouple junction inserted into a hotprocess.
Assuming the multimeter registers 25.841 millivolts, with an ambient temperature of 53 degreesFahrenheit at the connection point where the technician is at, and type N thermocouple cable throughout,determine the process temperature in degrees Celsius. Be sure to show all your work (including all valuestaken from a thermocouple table)!
file i00016
90
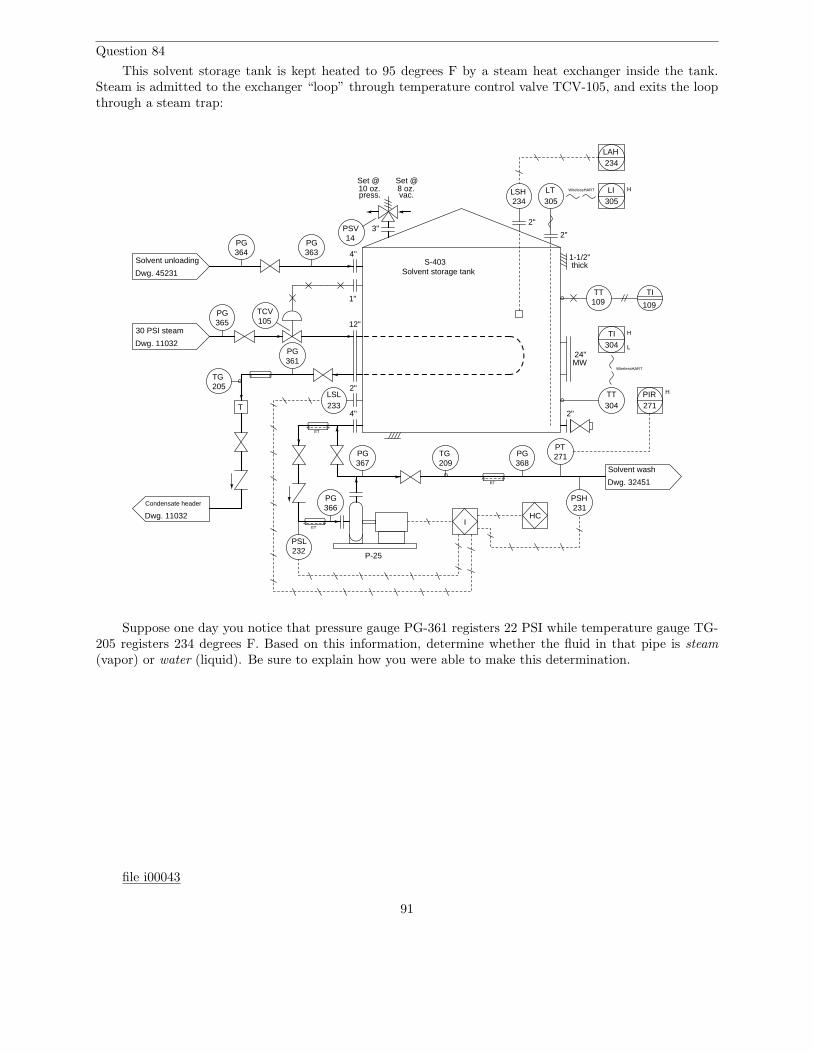
Question 84
This solvent storage tank is kept heated to 95 degrees F by a steam heat exchanger inside the tank.Steam is admitted to the exchanger “loop” through temperature control valve TCV-105, and exits the loopthrough a steam trap:
S-403Solvent storage tank
T
30 PSI steam
Dwg. 11032
LT305
Dwg. 11032
Condensate header
1-1/2"thick
LI305
WirelessHART HSet @10 oz.
TCV105
24"MW
TT304
WirelessHART
TI304
H
L
Solvent unloading
Dwg. 45231
press.
Set @8 oz.vac.
12"
4"
4" 2"
3"
P-25
ET
ET
ET
LSH234
LAH234
Solvent wash
Dwg. 32451
LSL233
IHC
PSL232
2"
1"
2"
2"
PSH231
PSV14
TT109
TI
109
PG367
PG366
PG368
PG365
PG364
PG363
TG209
PG361
TG205
PT271
271PIR H
Suppose one day you notice that pressure gauge PG-361 registers 22 PSI while temperature gauge TG-205 registers 234 degrees F. Based on this information, determine whether the fluid in that pipe is steam(vapor) or water (liquid). Be sure to explain how you were able to make this determination.
file i00043
91

Question 85
Certain types of non-contact pyrometers output a DC voltage proportional to the fourth power of thetarget’s absolute temperature, in accordance with the Stefan-Boltzmann equation. Suppose one of thesepyrometers is rated to output 30.0 mV at a target temperature of 3750 Kelvin.
Calculate the target temperature corresponding to an output voltage of 14.3 millivolts, both in Kelvinand degrees Fahrenheit.
Ttarget = K = oF
file i00044
92

Question 86
A heat exchanger is used to pre-heat a flow of liquid acetone before it enters a process reactor. Theheating medium is steam, entering the exchanger at 160 PSIA and 480 oF, then leaving the exchanger at120 PSIA and 400 oF:
Steam(160 PSIA, 480 oF)
Steam(120 PSIA, 400 oF)
Heat exchanger
10 pounds per minute
FT
FT
Acetone(40 oF)
25 pounds per minute
T = ???
Assuming a steam flow rate of 10 pounds per minute, an acetone flow rate of 25 pounds per minute,and no heat lost to the surrounding environment, calculate:
• The rate of heat exchanged between the steam and the acetone, in BTU/hour (hint: use the enthalpyvalues found in a steam table)
• The exiting temperature of the acetone, assuming c = 0.521
Hint: the Socratic Instrumentation website contains a page where you may download public-domaintextbooks, one of which is a set of steam tables published in 1920.
file i03974
93

Question 87
An instrument technician desires to simulate a thermocouple signal using a precision voltage referenceand a voltage divider network of her own making:
+−2.5000 volts
To thermocouple instrument
R1
R2 27 Ω
Calculate the necessary value for resistor R1 in order to generate a millivoltage signal simulating a type Jthermocouple at 607 degrees Fahrenheit. Assume the instrument receiving this signal has reference junctioncompensation enabled, and is at an ambient temperature of 71 degrees Fahrenheit.
R1 =
file i03738
94

Question 88
An interesting method of electrical heat tracing is to pass a very large electric current through the wallsof the pipe itself, using the metal pipe as a large resistor. The heat dissipated by the “resistor” will maintainthe pipe’s temperature high enough to avoid solidification of the liquid inside it.
In order to achieve such a high current, a step-down power transformer is used to convert industrialline power (typically 240 VAC or 480 VAC) into low-voltage, high-current power used to resistively heat thepipe. Assuming the use of 480 VAC power (single-phase), determine the step-down ratio necessary to deliver1500 watts of heating power to a pipe exhibiting an end-to-end electrical resistance of 0.75 ohms.
file i00856
95

Question 89
In this heat exchanger system, a hot oil (called “Therminol”) is used to heat up a chemical fluid product.The oil is heated in a boiler located somewhere else in the plant, with the cooled oil returned to the boilerfor re-heating.
Suppose an operator decides to close valve B slightly in this heat exchanger process, and that all otherinput variables to this system (e.g. Therminol oil supply pressure, oil supply temperature, etc.) remainunchanged:
Hot product
Valve A
Valve B
Valve C Valve D
Cold feed
Therminol oil supplyfrom boiler unit
Cooled Therminolreturn to boiler
Identify the effects of this one valve position change on all the following variables in the system. Simplyplace a “check” mark in the appropriate box for each variable:
Action Increase Decrease Remains constantProduct flow rate
Product inlet temperatureProduct outlet temperature
Therminol flow rateTherminol return temperature
Heat exchange rate
file i03478
96

Question 90
Suppose a voltmeter registers 0 volts between test points C and B in this series-parallel circuit:
+−
R1 R2
R3
1 kΩ 1 kΩ
1 kΩ
A
B
C
D
E
F
(0.25 ampscurrent-limited)
18 volts
Identify the likelihood of each specified fault for this circuit. Consider each fault one at a time (i.e. nocoincidental faults), determining whether or not each fault could independently account for all measurementsand symptoms in this circuit.
Fault Possible ImpossibleR1 failed openR2 failed openR3 failed open
R1 failed shortedR2 failed shortedR3 failed shorted
Voltage source dead
Finally, identify the next diagnostic test or measurement you would make on this system. Explain howthe result(s) of this next test or measurement help further identify the location and/or nature of the fault.
file i03153
97

Question 91
Lab Exercise – introduction
Your task is to build, calibrate, document, and program a temperature measurement system consistingof an electronic temperature transmitter connected to one of the analog inputs of a data acquisition module(DAQ) for a SCADA RTU (Remote Terminal Unit) node. The particular SCADA system we will be usinghas been designed specifically for BTC Instrumentation students. It is called caSCADA and it is based on asingle-board computer running the Linux operating system. In this lab exercise you will be configuring theRTU node to receive a temperature transmitter’s 4-20 mA analog signal and properly condition that datafor visual display on a remote computer. This will involve editing some of the programming code writtenin the “C” language. Your instructor will assign the temperature to be measured, as well as the specificchannel(s) to use on the caSCADA system for your loop.
The following table of objectives show what you and your team must complete within the scheduledtime for this lab exercise. Note how some of these objectives are individual, while others are for the team asa whole:
Objective completion table:
Performance objective Grading 1 2 3 4 TeamTeam meeting and prototype sketch (do first!) mastery – – – –
Final loop diagram and system inspection mastery – – – –T/C signal simulation (± 1% of span accuracy) mastery – – – –RTD signal simulation (± 1% of span accuracy) mastery – – – –Simulated troubleshooting of 4-wire RTD circuit mastery – – – –
Editing and running caSCADA code mastery – – – –
Safety and professionalism deductionLab percentage score proportional – – – –
Decommission and lab clean-up (ungraded) – – – –
The “proportional” score for this activity is based on the number of attempts require to master eachobjective. Every failed attempt is marked by a 0, and every pass by a 1. The total number of 1 marksdivided by the total number of marks (both 1’s and 0’s) yields a percentage value. Team objectives countas part of every team member’s individual score. The Safety and professionalism deduction is a flat −10%per instance, levied on occasions of unprofessional or unsafe conduct.
It is essential that your team plans ahead what to accomplish each day. A short (10minute) team meeting at the beginning of each lab session is a good way to do this, reviewingwhat’s already been done, what’s left to do, and what assessments you should be ready for.There is a lot of work involved with building, documenting, and troubleshooting these workinginstrument systems!
As you and your team work on this system, you will invariably encounter problems. You should alwaysattempt to solve these problems as a team before requesting instructor assistance. If you still requireinstructor assistance, write your team’s color on the lab whiteboard with a brief description of what youneed help on. The instructor will meet with each team in order they appear on the whiteboard to addressthese problems.
98

Lab Exercise – objectives and expectations
Each objective is assessed at the mastery level, which means it is not complete until it meets allexpectations. Re-tries are allowed, but failed attempts will be recorded and factored into your score forthis lab exercise.
Team meeting and prototype sketch
Read the lab exercise documentation and discuss with your teammates the objectives to beachieved and the time allotted to do so. Formulate a plan to achieve these objectives and draft aprototype design for the system you intend to build. Then, meet with your instructor to presentyour team’s action plan and prototype design. This prototype sketch should be annotated with allexpected physical parameters (e.g. voltage polarities, current directions, fluid pressures, etc.). Beprepared to answer all manner of questions about your team’s goals, planned schedule of work, availableresources, and prototype design, including analysis of the design for specific faults and condition changes.Do not begin construction until your design has been analyzed and approved! Note that multiple meetingsmay be required if the instructor’s assistance is needed to select components influencing your design.
Final loop diagram and system inspection
Create a complete loop diagram of your team’s completed system according to the ISA 5.1 standard, thenshow that the constructed system meets or exceed all standards described in the lab exercise documentation.
T/C signal simulation
Simulate a thermocouple signal to the input of your transmitter for a temperature randomly selected bythe instructor, based on thermocouple tables and measured ambient temperature, demonstrating that thesystem displays within ± 1% of that temperature.
RTD signal simulation
Simulate an RTD signal to the input of your transmitter for a temperature randomly selected by theinstructor, based on RTD tables or formulae, demonstrating that the system displays within ± 1% of thattemperature.
Troubleshooting simulation
Logically diagnose the nature and location of a fault simulated by computer in a 4-wire RTD circuit,using the TROUBLESHOOT simulation program. Successful completion of this objective consists of identifyingthe simulated fault at or below “par” in all measures and logically defending each and every step taken.
Editing and running caSCADA code
Edit your team’s caSCADA source code file and recompile to express your transmitter’s output in aunique range (and/or unit) specified by the instructor.
99

Lab Exercise – objectives and expectations (continued)
Lab percentage score
Successful completion of the lab exercise requires demonstrated mastery of all objectives. A percentagevalue is based on the number of attempts required to achieve mastery on these objectives: the number ofobjectives divided by the number of total attempts equals the percentage. Thus, a perfect lab percentagescore is possible only by completing all objectives on the first attempt. Marks given for team objectives factorinto each individual’s score. If one or more members of a team repeatedly compromise team performance,they may be removed from the team and required to complete remaining lab exercises alone.
Deductions from this percentage value will be levied for instances of unsafe or unprofessional conduct(see below), the final result being the lab percentage score.
Safety and professionalism (deduction)
In addition to completing the specified learning objectives in each lab exercise, each student is responsiblefor abiding by all lab safety standards and generally conducting themselves as working professionals (see theGeneral Values, Expectations, and Standards page near the beginning of every worksheet for more detail).Expectations include maintaining an orderly work environment and returning all tools and test equipment bythe end of every school day (team), as well as following clear instructions (e.g. instructions given in equipmentmanuals, lab documentation, verbally by the instructor), communicating with teammates, formulating aplan to complete the lab project in the allotted time, and productively managing time. As with the otherobjectives, chronic patterns of poor performance in this domain may result in the offending student beingremoved from the team. Deductions to the lab percentage score will not be made for performance alreadygraded such as tardiness and attendance.
General format and philosophy
This lab exercise is project-based: the instructor serves as the project engineer, while each student’srole is to implement the standards set for the project while budgeting time and resources to complete it bythe deadline date. Students perform real work as part of the lab exercise, managing their work day andfunctioning much the same as they will on the job. The tools and equipment and materials used are allindustry-standard, and the problems encountered are realistic. This instructional design is intentional, as itis proven effective in teaching project management skills and independent working habits.
When you require the instructor’s assistance to answer a question or to check off an objective, writeyour name (or your team’s name) on the lab room whiteboard. Questions take priority over checkoffs,so please distinguish questions from other requests (e.g. writing a question-mark symbol “?” after yourname makes this clear). There will be times when you must wait for extended periods while theinstructor is busy elsewhere – instant service is an impossibility. Adequate time does exist to complete thelab exercise if you follow all instructions, communicate well, and work productively. Use all “down time”wisely: filling it with tasks not requiring the instructor’s assistance such as other lab objectives, homework,feedback questions, and job searches.
Remember that the lab facility is available to you at all hours of the school day. Students may performnon-hazardous work (e.g. circuit work at less than 30 volts, documentation, low air pressures, generalconstruction not requiring power tools) at any time during the school day without the instructor’s presenceso long as that work does not disturb the learning environment for other students.
DO NOT TAKE SHORTCUTS when completing tasks! Learning requires focused attention andtime on task, which means that most ‘shortcuts” actually circumvent the learning process. Read the labexercise instructions, follow all instructions documented in equipment manuals, and follow all advice givento you by your instructor. Make a good-faith effort to solve all problems on your own before seeking the helpof others. Always remember that this lab exercise is just a means to an end: no one needs you to build thisproject; it is an activity designed to develop marketable knowledge, skills, and self-discipline. In the end itis your professional development that matters most, not the finished project!
100

Lab Exercise – team meeting, prototype sketch, and planning the system
An important first step in completing this lab exercise is to meet with your instructor as a team todiscuss safety concerns, team performance, achievement expectations, and specific roles for team members.If you would like to emphasize exposure to certain equipment (e.g. use a particular type of control system,certain power tools), techniques (e.g. fabrication), or tasks to improve your skill set, this is the time to makerequests of your team so that your learning during this project will be maximized. This team meeting willalso be an opportunity to clarify expectations on all lab project objectives, so everyone on the team knowsexactly what is being asked of them. Completely read the lab exercise documentation and discuss it withyour teammates prior to meeting with the instructor.
An absolutely essential step in completing this lab exercise is to work together as a team to sketch aprototype diagram showing what you intend to build. This diagram must show all connections betweencomponents. It need not be exhaustive in detail, but it must show enough for the instructor to determineif all components will function properly and safely. Any team found constructing their system without averified plan will be ordered to cease construction and not resume until a prototype plan has been drafted andapproved!
You should practice good problem-solving techniques when creating your prototype sketch, such asconsulting equipment manuals for information on component functions and marking directions of electriccurrent, voltage polarities, and identifying electrical sources/loads. Use this task as an opportunity tostrengthen your analytical skills! Remember that you will be challenged in this program to do all of thison your own (during “capstone” assessments), so do not make the mistake of relying on your teammates tofigure this out for you – instead, treat this as a problem you must solve and compare your results with thoseof your teammates.
Your first step should be selecting proper field instruments from the instrument storage area to use inbuilding your system. In this particular lab, you are looking for an electronic temperature transmitter, either“smart” or analog. The Rosemount model 644/3044/3144/3244 transmitters are good examples of smarttransmitters, while the Rosemount model 444 is a good example of an analog transmitter. Note that analogtransmitters are built either thermocouple or RTD input. Since you will need to calibrate both types in thislab activity, this will require two different analog transmitters! If you choose to use a “smart” transmitter,however, you need only select one because digital temperature transmitters are usually configurable for bothRTD and thermocouple input.
The next step should be finding appropriate documentation for your temperature transmitter. Nearlyevery instrument in the lab is documented electronically at the manufacturer’s website, so your best resourceis the Internet (and/or your Instrumentation Reference where a variety of instrument manuals have beendownloaded for you). Use this documentation to identify how to properly connect and calibrate thetransmitter.
After locating a suitable instrument and its associated documentation, you should qualitatively test itprior to installing it in your system. For an analog thermocouple transmitter, you may simply short (jumper)the thermocouple input terminals to make the transmitter “think” it is measuring ambient temperature. Foran analog RTD transmitter, you may connect a 100 Ω resistor to the RTD input terminals to make it“think” it is measuring the freezing point of water. For a digital (“smart”) transmitter, first use a HARTcommunicator to configure it for either 2-wire RTD or thermocouple input, then proceed with these tests. Ifthe transmitter fails to respond properly, tag it with a label explaining what it does (or what it fails to do).
Planning a functioning system should take no more than an hour if the team is workingefficiently, and will save you hours of frustration (and possible component destruction!).
101

Lab Exercise – loop diagram and system inspection
Each team’s system will undergo an inspection simulaneous with inspection of each team member’s loopdiagram. Team members will exchange diagrams with each other and then verify from those diagrams whatthe instructor sees when inspecting each and every panel and connection. Please note that the “Lessons InIndustrial Instrumentation” textbook describes good practices for construction and documentation.
Construction Standards
• All construction must be safe (i.e. must not pose any unnecessary hazard to students or visitors).This includes electrical, chemical, thermal, pressure, and general safety hazards (e.g. trip hazards, cuthazards). Unsafe construction will be dismantled upon discovery.
• All electrical sources greater than 30 volts must be overcurrent-protected and all related wire connectionsmust be guarded against accidental contact (e.g. use recessed terminals with no exposed metal).
• Proper use of colors for electrical power source wiring (e.g. red and black for DC + and −, black andwhite for AC “hot” and “neutral”, green for earth ground).
• All metallic electrical enclosures must be bonded to earth ground for safety.
• Proper wire types and attachment to terminals (e.g. appropriate wire gauge for the expected current,use of stranded wire wherever possible, correct terminals crimped to ends of wires, no stray wire strandsat any point).
• Attached wires must withstand being lightly pulled with fingers.
• Wire insulation must be intact (i.e. no bare wires anywhere).
• Panel wiring must be neat in appearance (e.g. all cables run directly from terminal block to nearestwire duct, with all excess wire length tucked inside wire duct).
• Wiring outside of panels should be run through conduit wherever possible.
• Correct tools must be used at all times. This includes the use of fixed-size wrenches rather thanadjustable wrenches whenever possible, box-end over open-end wrenches whenever possible, and thecorrect type and size of screwdriver used to turn screw heads.
• All electrical components must be located to avoid exposure to liquids.
• All tube and pipe connections must be properly made (e.g. correct “swaging” of tube ends, no over- orunder-tightened fittings, Teflon tape or pipe sealant used on all NPT threads).
• All manual controls (e.g. buttons, handles, knobs) must be accessible and function without undue effort.
Documentation Standards
• Loop diagrams must be drawn in accordance with ISA standard 5.1.
• Each instrument must have an appropriate ISA-standard tag name, and this tag name must be visibleon the actual instrument (e.g. written on masking tape and attached to the instrument).
• Each signal cable and each signal tube must have an identifying label documented and attached. Longcables must be labeled at each end, as close to the termination points as practical.
• Each team must have its own unique loop number.
• Each instrument’s (final) calibrated range must be shown.
• Each control valve’s fail mode (e.g. fail-open, fail-closed) or action must be shown.
• All writing must be legible (i.e. easy for anyone to read). Hint: large-format paper helps!
• All instrument symbols must be appropriate to the device, function, and location. The large white-colored control panel and the DCS operator stations constitute the main control room. All electricalenclosures in the lab room are auxiliary locations, and everything else is considered a field location.
• Instrument functions shared within a common device must be represented by the “shared” symbol on thediagram (e.g. a controller that is part of a multi-loop control system such as a DCS). Shared controllersmust have their identifying loop noted on the diagram (e.g. DCS South Loop #23).
• Any controller I/O cards must be labeled with slot number and channel number in addition to terminalnumbers.
102

• Each location (e.g. field, junction box, control room) must be clearly delineated with vertical seperationlines on the diagram.
• Each diagram must be sufficiently detailed so that no other student will have difficulty locatingcomponents (e.g. “Where is the controller for this loop?”) or determining important configurationparameters (e.g. range settings).
Sample diagrams are provided in this worksheet (immediately following the lab exercise documentation),and each student is urged to use these sample diagrams as references when drafting their own. The “LessonsIn Industrial Instrumentation” textbook also describes ISA-standard documentation practices.
Common mistakes:
• Incorrect tag name format, using letters that do not conform to the ISA 5.1 standard (e.g. including“PLC” or “DCS” in a controller’s tag name).
• Forgetting that every instrument’s tag name in a loop must begin with the same letter, and that thisfirst letter represents the process variable being measured/controlled.
• Forgetting to label all field instruments with their own tag names (e.g. AT-83).• Failing to label termination points (e.g. terminal block screws) exactly as they are labeled in real life.• Poor use of space on the diagram paper, causing some portions of the diagram to become “crowded”
rather than all components being evenly spaced. Hint: begin your diagram by sketching the fieldinstrument at the far left of the paper and the control room instrument at the far right of the paper, thendraw all other instruments and connections in between!
• Forgetting to label all signal wires (see example loop diagrams).• Forgetting to note all wire colors.• Forgetting to put your name on the loop diagram!• Leaving junction box cables outside of wire duct, looking messy.• Leaving wire duct covers off.• Basing your diagram off of a team-mate’s diagram, rather than closely inspecting the system for yourself.• Not placing loop sheet instruments in the correct orientation (field instruments on the left, control room
instruments on the right).
Creating and inspecting accurate loop diagrams should take no more than one full labsession (3 hours) if the team is working efficiently!
103

Lab Exercise – building the system
Each RTU contains power circuitry and terminal blocks set up to marshal analog signals from fieldinstruments to a data acquisition device. A generic loop diagram (shown in the following question of thisworksheet) shows how any field device may connect to the DAQ. Your final loop diagram will simply be acustomized version of this generic diagram provided to you near the end of this worksheet.
Each loop has a pre-assigned loop number, kept on file by the instructor to ensure each loop is uniquelylabeled. Your transmitter and its signal wiring should be labeled with the loop number to distinguish itfrom other loops.
Common mistakes:
• Neglecting to consult the manufacturer’s documentation for field instruments (e.g. how to wire them,how to calibrate them).
• Mounting the field instrument(s) in awkward positions, making it difficult to reach connection terminalsor to remove covers when installed.
• Failing to tug on each and every wire where it terminates to ensure a mechanically sound connection.• Students working on portions of the system in isolation, not sharing with their teammates what they
did and how. It is important that the whole team learns all aspects of their system!
Building a functioning system should take no more than one full lab session (3 hours) ifall components are readily available and the team is working efficiently!
104

Lab Exercise – instrument calibration
Each team will need to calibrate their transmitter to ensure it interprets temperature accurately andoutputs an accurate current, so that when it is connected to the SCADA system channel it will accuratelyregister temperature. The transmitter’s range should include room temperature, and each student’s rangingof the SCADA channel will need to be compatible with the chosen transmitter range. “Smart” temperaturetransmitters need only to have their calibration (“trim”) checked once, because their range points (LRV andURV) may be set independently set. Analog transmitters must be recalibrated against trusted standardsevery time they are re-ranged.
As in all cases where an instrument must be calibrated, you will need to check the instrument’s responseagainst one or more standards. It is recommended that you calibrate any “smart” temperature transmitter(i.e. one capable of selecting different sensor types, such as different RTD types and different thermocoupletypes) by configuring it to detect raw millivolts (rather than RTD or thermocouple) and applying a precisemillivoltage signal to the input terminals to verify it properly reads that. Both RTD and thermocouplesensing is based on precise measurements of small DC voltages, and so a transmitter accurately calibratedfor millivolts will read RTDs and thermocouples alike with accuracy, without all the complexity of leadresistance (RTD) or reference junction compensation (thermocouple). Use a standard multimeter to measurethe transmitter’s electronic output signal (4-20 mA):
Loop power
Sensor
Temperaturetransmitter
0
1 2 3
4 5 6
7 8 9
Enter
J E T S
oC
mV
K
oF
+ −24 VDCsupply
Loop resistance
OFF
COMA
V A
V A
RTD
Multimeter
mA
Precision mV source
(configuredfor mV)
This calibration may be performed at the calibration bench or other work-table, or in the field. Beextremely careful when using the precision mV source, that you do not apply too much voltageto the transmitter’s input terminals, as electronic temperature transmitters are sensitivedevices and may be easily damaged by excessive input voltage!
105

Document the accuracy of your transmitter’s sensor trim before and after adjustment in this table, atfive different points throughout its sensing range using these two tables:
As-Found calibration table
Applied temperature Output signal (actual) Output signal (ideal) Error (% of span)
As-Left calibration table
Applied temperature Output signal (actual) Output signal (ideal) Error (% of span)
Error as % of span =
(
Actual − Ideal
Span
)
(100%)
When finished calibrating your team’s transmitter, be sure to place a calibration tag on it showing therange and the date it was calibrated. A set of calibration tags are shown here which you may cut out andtape to the transmitter after completing your calibration:
CALIBRATED
By: Date:
Range:
CALIBRATED
By: Date:
Range:
CALIBRATED
By: Date:
Range:
CALIBRATED
By: Date:
Range:
Cut out tag(s) with scissors, then affix to instrument(s) using transparent tape to show calibration:
Common mistakes:
• Applying excessive voltage to the input of a thermocouple or RTD transmitter. Remember thatthermocouples only output small amounts of voltage, in the low millivolt range. I have seen studentsdestroy thermocouple transmitters by applying as little as 1.5 volts to its input terminals, thinkingthat would be a safe amount of voltage for the transmitter!!! To avoid this mistake, set the millivoltsignal of your simulating circuit before connecting it to the input of your transmitter.
• Neglecting to place a calibration tag on the transmitter after calibrating it.
Calibrating your team’s transmitter should take no more than one full lab session (3 hours)if the team is working efficiently!
106

Lab Exercise – RTD and thermocouple signal simulation
After each team calibrates their transmitter and installs it in the working system, each student onthe team must then individually demonstrate their understanding of the electrical signals generated bythermocouples and RTDs by manually simulating appropriate signals at the input of the transmitter tomake it register random temperatures called out by the instructor. The purpose of doing this is to ensureeach student understands how thermocouples and RTDs actually work, and are familiar with the purposeand use of thermocouple and RTD tables.
For example, if a team calibrates and installs a type J thermocouple transmitter with a range of 0 to 150degrees Fahrenheit, the instructor will choose a different temperature value within that range (e.g. 102, 93,77, 128 oF) for each student on the team to simulate using simple electrical equipment (no thermocouple/RTDsimulators allowed here!). Each student passes the “T/C signal simulation” objective when they are ableto successfully simulate a specified temperature using nothing more than a multimeter and a low-voltagesource (e.g. a DC power supply connected to a voltage divider circuit). Each student passes the “RTD signalsimulation” objective when they are able to successfully simulate a specified temperature using nothing morethan a multimeter and a low-range variable resistance (e.g. a potentiometer, or a decade resistance box).The instructor checks to see that the temperature value specified appears on the SCADA system display towithin ± 1% of transmitter span.
The following illustrations show the general scheme of thermocouple (“T/C”) and RTD signal simulation.Resistor values shown in these illustrations are examples only, and may need to be modified for your particularapplication. Invest the necessary time for all team members to thoroughly understand how and why thesepotentiometer networks function as thermocouple and RTD simulators. A convenient way to determinenecessary values for R1 and R2 is to set up a computer spreadsheet or use circuit simulation software toexperiment with different R1 and R2 values to get the desired range of adjustment from your potentiometer.This adjustment range must be reasonable for your temperature transmitter, and be narrow enough thatyour potentiometer will yield sufficiently fine resolution which is especially important if it only has a 3/4turn movement range:
Please note that a thermocouple temperature transmitter is easily damaged by providing itwith excessive signal voltage. These instruments are designed to receive MILLI-VOLT signals,and so your voltage divider circuit must be designed in such a way that it cannot generateany signal exceeding the transmitter’s maximum rating. Be sure to research your transmittermodel’s maximum input signal voltage value before designing the voltage divider circuit!!
Loop power
Sensor
Temperaturetransmitter
Loop power/signal
+−1 kΩ
Thermometer(needed for measuring ambient temperature)
COMA
V
V A
AOFF
mV
Manually simulating thermocouple signals to a transmitter
Loop power
Sensor
Temperaturetransmitter
Loop power/signal
1 kΩ
COMA
V
V A
AOFF
Manually simulating RTD signals to a transmitter
Ω
(4-wire RTD connection)
(Multimeter used to set resistance ofpotentiometer network prior to connecting it to the transmitter)
(Multimeter used to set millivoltage valuebefore and after connecting the dividercircuit to the transmitter)
R1
R2
R1
R2R1 limits low value
R2 limits high value
R1 limits low value
R2 limits high value
In order to eliminate all errors stemming from wire resistance, the RTD signal simulation must be donewith the instrument in “4-wire” mode as shown in the above-right illustration.
A terminal strip must be used instead of a solderless “breadboard” to construct the potentiometernetworks, due to the unstable contact resistance typical of breadboards. Use the “relative” function on your
107

DMM’s resistance scale to “zero out” the electrical resistance of your meter’s test leads when using it toset the resistance of your RTD-simulating network. If your DMM supports a “high resolution” mode formillivoltage measurement, you should use that mode when setting the voltage signal of your thermocouple-simulating network. For RTD and thermocouple simulation alike, adjustments should be made with thesimulation circuit disconnected from the transmitter, to avoid interference between the transmitter and themultimeter.
Students typically find the accurate simulation of thermocouple signals to be more challenging than RTDsignals, since RTDs simply manifest a certain amount of resistance at each temperature, while thermocouplesignals vary with the process (measured) temperature and the ambient temperature at the transmitterterminals. For more information on the simulation of thermocouple signals, refer to the “Thermocouples”section of the “Continuous Temperature Measurement” chapter of Lessons In Industrial Instrumentation.
Common mistakes:
• Applying excessive voltage to the input of a thermocouple or RTD transmitter. Remember thatthermocouples only output small amounts of voltage, in the low millivolt range. I have seen studentsdestroy thermocouple transmitters by applying as little as 1.5 volts to its input terminals, thinkingthat would be a safe amount of voltage for the transmitter!!! To avoid this mistake, set the millivoltsignal of your simulating circuit before connecting it to the input of your transmitter.
• Neglecting to accurately measure the ambient temperature when manually simulating a thermocouplesignal (in order to look up the correct reference junction millivoltage).
• Mis-interpreting rows and columns in the thermocouple/RTD table when looking up millivoltage orresistance values.
• Trying to make potentiometer adjustments while connected to the transmitter’s input terminals. Thisis especially true for RTD simulation, where the transmitter’s excitation current to the RTD interfereswith the multimeter’s resistance measurement.
• Choosing a calibration (“trim”) range that is substantially less than the final range of measurementwhen installed. As a general rule, you should trim the sensor of the transmitter to cover the broadestrange of measurement possible with your calibration equipment.
• Ignoring the mathematical signs (+ or −) of error calculations.
108

Notes on using SSH for remote administration
Each caSCADA RTU is based on single-board computer running Linux operating system software,located inside an electrical enclosure without convenient physical access. Attaching a keyboard and monitoris impractical, therefore you will need to log in to this computer through some other means.
Fortunately, a digital communication protocol has been developed to permit remote access of Unix-basedoperating systems called SSH, which stands for Secure SHell. Any computer running an SSH client programis able to log into any Linux computer running an SSH server program. Any personal computers running aUnix-based operating system (e.g. FreeBSD, Linux, Apple’s OS X) have SSH clients built in.
Microsoft Windows operating systems do not have native SSH client software, but one available for freedownload is Bitvise. Another one is called PuTTY. For the really ambitious there is even a complete Linuxterminal emulation package for Microsoft Windows called Cygwin. Any of these programs will suffice, butthe easiest to download, install, and use is Bitvise. Be sure you download and install the client softwarefor Bitvise, and not the server software (which should already be installed and running on the single-boardLinux computer)!
The following screenshot shows Bitvise running on a Windows XP machine, communicating with amodel of single-board computer called a “Raspberry Pi”:
Three windows appear in this screenshot: the Bitvise client through which the login connection isestablished (you must enter the RTU computer’s IP address and Linux user name, then later enter the Linuxpassword for that user account), the Bitvise SFTP window for file transfer between the two computers,and the xterm terminal window (the one with the black background and colorful prompt) where you mayenter typed commands to the RTU computer. Since Linux is a multi-user operating system, many peoplecan log into the RTU using their own individual Windows PCs, even under the same user name! All youneed is a network connection to the RTU and its IP network address.
109

Lab Exercise – Linux command-line usage
The caSCADA telemetry system is built on the foundation of a single-board computer running the Linuxoperating system. Linux is a very robust alternative to Microsoft Windows, and it happens to be entirelyfree. To use this operating system, you will need to become familiar with typing text-based commands intoa command-line interface and reading the results given back to you by the computer, rather than pointingand clicking with a mouse. Linux does support mouse-based user interfaces, but the text-based interface ismore efficient from the perspective of processing power and memory and so it is what we will use here.
If you have ever used the cmd (“command”) window on a Microsoft operating system to run utilitiessuch as ping or ipconfig for network troubleshooting, you are already familiar with what a command-line interface is. Here is an example of the Linux command ifconfig (similar to the Windows commandipconfig) being run in the command-line interface:
The dark blue text (~ $) is called the prompt, which shows me which directory on the computer’sfilesystem I’m currently viewing and working under. The green text to the left of the prompt tells me I’mlogged into the Linux operating system under the username tony with an undefined domain name. In a fullyconfigured system, the domain might be something like btc.edu or RTU MC1. The white text ifconfig isthe command I typed (pressing the Enter key at the end), and the two “paragraphs” of text following thatline are the results of running the ifconfig command. In this particular example it tells me details aboutthe two network interfaces operational on this computer: one Ethernet interface (eth0) and one called a“loopback” (lo).
There are a great multitude of typed commands available within the command-line environment of theLinux operating system. We will only need to use a few to do our work with the caSCADA system. Thenext several pages showcase those commands you should learn in order of their importance.
110

ls
The ls command lists the contents of a directory, or folder, on the computer’s filesystem. Here isan example of the ls command being issued by myself (tony) while working in my “home” directory(/home/tony which is abbreviated as ~):
The two dark blue listings (caSCADA and Desktop) are both directories within my home directory (called“subdirectories”). Think of these as folders in which we may store files. The white listing (letter.txt) isa file. The light blue listing (pistore.desktop) is a link to a file of the same name located in a completelydifferent directory. In the Microsoft Windows world, a link is called a shortcut.
ls -l
This is the same command, issued with the -l option. Many Linux commands have options you mayspecify, each one preceded by a dash. In this case, the -l option instructs the ls command to provide along (i.e. more detailed) listing of the same files and directories. It should be noted that the l symbol is alower-case letter L, and not the number 1.
Here we see how the “long” listing provides much more detail. The series of 10 characters starting eachline tell us what type of listing each line is and who has permission to use it (d for directory, l for link, adash symbol for regular files, w for write permission, r for read permission, and x for executable permission).We can also tell the owner and group of each listing (tony), the size of the file in bytes, and the last dateand time that listing was changed.
You will use the ls and ls -l commands frequently to see which files and directories are accessible toyou.
111

cd
The cd (“change directory”) command moves you from one directory to another. This is analogous toclicking on folder symbols in a Microsoft Windows environment. Here we see the ls command issued to listall the items in my home directory (~), then the cd command issued to descend into the caSCADA directory,then the ls command issued one more time to list all the files contained in the caSCADA directory:
Note how the dark blue prompt changed from ~ to ~/caSCADA after issuing the cd command. This is areminder to you, the user, of which directory you are currently “in” as you do your work in the command-lineenvironment.
If we wish to go back up one directory level, we invoke the command cd ../ and it will take you there.If you wish to return to your home directory, simply invoke cd without any options or arguments and youwill go back home regardless of your present location.
112

nano
One of the most important applications you will use when using Linux is a text editor, used to createand modify plain-text files. You may think of a text editor as being a kind of simplified word processorbecause it doesn’t offer any means of formatting the text to look nice on paper. However, text editors arepowerful tools for programming because most offer syntax-sensitive coloring to render certain programminginstructions in different colors to make them easier to identify.
nano is a popular text editor found on practically all Linux operating systems. It is fast and easy tolearn, which is why I’m recommending it to you. To start this program, simply type nano at the commandprompt and you will get a mostly blank screen with some key-command reminders at the bottom, like this:
Most of the screen is blank because nano hasn’t been told to open any file, and therefore there is nocontent to view. This is like starting up Microsoft Word (a heinous monstrosity of a program) with a blankpage, before we have typed anything. The inverse-colored symbols at the bottom of the screen show youcommon nano commands, such as viewing a help menu (^G which means holding the “Ctrl” key down whilepressing the “G” key), or writing your edits to a file (^O), or exiting the nano text editor (^X) entirely.
113

If we wish to use nano to edit a particular file within our current directory instead, we would simplytype nano at the prompt followed by the name of the file we wish to edit. Here we see the results of typingnano f channel 00.c at the command-line prompt:
The file named f channel 00.c is one of the files containing programming code to instruct the caSCADAsystem what to do. This particular file controls the information for channel 0 in the caSCADA system. Youwill be editing a source file much like this one when you do your configuration work for the caSCADA system,just for a different channel number. The various colors rendered by nano as it views the contents of this filehave different meanings in the C programming language, and make the code easier to comprehend than if itwere all shown in white.
Once you are viewing the contents of a file, you may use the arrow keys, page up/down keys, Enter key,Delete key, Backspace key, and all the alpha-numeric keys on your keyboard to write and edit text into thisfile. When complete, you use the command Ctrl-X to save and exit from nano.
114

cat
The concatenate command, abbreviated cat, simply reads the contents of a text file and prints it all tothe screen in the command-line environment. In this example we see the cat command used to print thecontents of a file named data.txt residing within the caSCADA directory we have navigated to:
We could have easily viewed the contents of the data.txt file using a text editor program such as nano,but cat is faster and more convenient if all we want to do is look at what the file contains and not edit(change) it. While cat is useful for viewing caSCADA’s data.txt file, it may be used to view the contentsof any plain-text file.
If you choose to learn more about the Linux, you will find that a great many details of the operatingsystem are represented by and controlled by plain-text files. Knowing how to edit those files with a texteditor and view those files using cat are nothing less than survival skills for Linux users.
Using the cat command to display the contents of the data.txt file is something you will undoubtedlyfind yourself doing as you work with the caSCADA system: this file happens to show all the conditioneddata in the caSCADA system. As you can see here, the data.txt file shows us the last-recorded view of allanalog input voltages being read by the data acquisition unit (DAQ), and later when we’ve customized theC programming code for our instrument loops this same file will show us the signals scaled and presented asreal-world measurements.
115

who
Linux is a multi-user operating system, which means multiple people may log into one computer atany given time, either with individual login names or even under the same name! Microsoft Windows, bycontrast, was designed to support only one user at a time. The who command gives a listing of all the userslogged into the Linux operating system:
Here we see two users logged in: one named root and the other named tony. The green text precedingeach command-line prompt tells us who we are (tony). If we had any doubt, we could issue the commandwhoami which will reply back with our user name.
The root user is sometimes called the super-user because of their unlimited privileges. The root usercan delete or edit any file, in any directory, at any time. As far as the Linux operating system is concerned,root is God. Therein lies a lesson: never sign into a Linux system as root unless you are absolutely, onehundred percent sure of what you are doing.
The text tty2 tells us that the root user is logged into the system at a keyboard that is directly pluggedinto the RTU computer. “tty” comes from the old days of teletype machines which were the equivalent ofmodern computer keyboards. The text pts/0 (which stands for “pseudo terminal slave”) tells us that theuser (tony) is logged into the system through a network connection. The four dot-separated numbers shownin parentheses (169.254.15.90) shows the IP network address of the other computer from which tony islogging in.
You will probably do most of your work on the caSCADA system via network connection to yourown personal computer. Free software is available for your download that lets any Microsoft Windows PCremotely log into any Linux computer using the SSH (Secure SHell) protocol. This detail will be discussedlater in this document.
All the work you will be doing on the caSCADA system will be through the user account btc (passwordalso btc). This account will already be set up for you on each RTU’s computer.
116

ps
Linux is also a multi-tasking operating system, like Microsoft Windows. This means it has the abilityto execute multiple programs at once. Single-processor computers manage this feat by switching attentionreally fast between all the running programs, giving the illusion that they’re all running simultaneously.
Each running program is called a process (not to be confused with the term “process” as it applies toindustrial instrumentation). Any user may view running processes on a Linux system by invoking the ps
command, although this command (without any options) doesn’t provide much information.
ps -e
If we run the command ps -e we will see a very long list of every process running in the operatingsystem, including the ps command itself:
The list shown here is so long that it doesn’t even fit the whole screen!
ps -u username
A more useful invocation of the ps command shows us all the processes that have been run under aspecified user name. Here, we will view all the processes running under the user name tony by entering thecommand as ps -u tony (using the -u “user” option):
Each line displayed by the ps command begins with a number, which is the Process ID number, orPID (not to be confused with “PID” control for industrial instrumentation!). This number will become veryuseful to us for the next command.
117

kill
From time to time it may be necessary for a user to halt a running process, especially one that runswithout a live user interface. This is done using the kill command, which works by specifying the processID number (PID) of the process you wish to terminate.
The following illustration shows how to kill a running process called simulate, which happens to be oneof the processes used in the caSCADA telemetry system. First, we see the ps command being used to list allthe processes started by the user tony so we can identify its PID, then the kill command being invoked tohalt that one process, then the ps command used again to prove the simulate process is no longer running:
You will be doing this many times as you work with the caSCADA system, because processes such assimulate run in the “background” (i.e. they don’t prompt the user for any input, nor do they report anyinformation to the command-line display). When you make changes to the caSCADA software, you willneed to “compile” those edits into an executable file that Linux can run, kill the version of that programcurrently running, and start up your newly modified version.
Common mistakes:
• Not practicing the use of these commands.
118

Lab Exercise – troubleshooting
An important aspect of this lab exercise is troubleshooting, where you demonstrate your ability tologically isolate a fault in a simulated circuit. You will use the open-source software called TROUBLESHOOT forthis objective, which natively runs on the Linux operating system and is already installed on the caSCADAnodes in the main lab room (under the /tshoot directory). You may also compile and run this free softwarenatively on an Apple personal computer, or if running Windows you may install the free Cygwin emulatorcomplete with development tools and use that to compile and run TROUBLESHOOT.
The TROUBLESHOOT software offers multiple simulated circuits to select, the particular circuit for this labexercise being specified earlier in this outline. The software tracks every step you take, and the amount oftime taken for each step. Scores are given at the end for such metrics as number of steps taken, total “cost”incurred (with different cost values associated with different actions), and total time taken. The softwarealso provides reasonable “par” scores for each of the randomly-selected faults.
Included with every installation of TROUBLESHOOT is a set of PDF files, each one depicting the schematicdiagram for a simulated circuit. It is advisable for you to print a paper copy of this schematic so that youcan easily annotate measurements you take during the simulation.
In order to successfully pass this objective, you must start up the simulation in the instructor’s presence,document the randomly-selected circuit values on paper (in order to later verify it is the exact same simulationscenario), complete the simulation on your own, and then logically defend each of your steps (recounted bythe software after your declaration of the fault). You must meet or improve upon all of the “par” valuesgiven by the software. Like all mastery objectives, multiple re-tries will be permitted. You are also welcometo practice using this software on your own before committing to a graded demonstration.
Failure to achieve all par scores, or failure to apply logical reasoning to the defense of every step take,or simple failure to identify the random fault will disqualify the effort, in which case you must re-try with adifferent (random) fault.
The instructor will review each troubleshooting effort after completion, highlighting good and bad pointsfor the purpose of learning. Troubleshooting is a skill born of practice and failure, so do not be disappointedin yourself if you must make multiple attempts to pass! One of the important life-lessons embedded in thisactivity is how to deal with failure, because it will eventually happen to you on the job! There is no dishonorin failing to properly diagnose a fault after doing your level best. The only dishonor is in taking shortcutsor in giving up.
Common mistakes:
• Not practicing the use of the TROUBLESHOOT software.• Relying on voltage measurement across a suspected open wire to confirm that it has failed open. This
test only works if there are no other opens (e.g. “off” switch, blown fuse, etc.) in that circuit!
The purpose of every troubleshooting exercise is to foster and assess your ability tointelligently diagnose a complex system. Finding the fault by luck, or by trial-and-errorinspection, is no demonstration of skill. Competence is only revealed by your demonstratedability to logically analyze and isolate the problem, correctly explaining all your steps!
119

Lab Exercise – editing and running caSCADA code
The caSCADA system has been developed for the express purpose of teaching students how to write theirown programming code in the C computer language, while at the same time building a working telemetry(SCADA) system measuring real-world data.
Each student team will be given a different piece of the caSCADA software (called a function) to modifyfor their own purposes. Each team’s function resides in its own file ending with the extension .c whichidentifies it as a source code file written in the C language, just like a filename extension of .txt identifiesthe contents of a file as ASCII text, or a filename ending in .pdf identifies that file as an Adobe PDFdocument. Students will use a text editor to modify their source file, then they will use another programin the Linux operating system called a compiler to translate that source code into instructions that Linuxcan directly execute. After that, they will run their compiled program and monitor how well it performs theintended task.
Like much of the software found on Linux (including all the essential parts of the Linux operating systemitself), caSCADA is an open-source project. This means all the source code files are available for perusaland modification. This is very different from most of the software that Microsoft Windows users are familiarwith, which is generally “closed” and therefore cannot be modified by the end-user.
Most open-source software projects provide a text file called README or README.txt describing detailsabout the project. caSCADA is no exception to this rule: in the caSCADA directory you will find such a filedescribing how the system works, complete with examples of how to modify the function code to performpractical conditioning on real-world data.
Here is a step-by-step summary of your program development cycle:
(1) Use a text editor (one easy-to-use editor is named nano) to modify the source file for the channel you’vebeen assigned. For example, if you are assigned caSCADA channel number 6, then you will need to editthe file named f channel 06.c and then save those changes before exiting the text editor.
(2) Next, re-compile the executable file by issuing a make command followed by the name of the executableyou wish to create. The make command invokes the compiler software for you, handling a bunch oftechnical details along the way, to make this task simpler. You have only two options here: either runmake poll to compile the executable called poll which gathers real data from the LabJack DAQ unit,or run make simulate to compile the executable called simulate which generates random data (usefulin the absence of a LabJack DAQ) for your function to process.
(3) Use the ps command to check for currently-running instances of the executable. If your user name isbtc, for example, you will want to run ps -u btc. If one or more are running, halt them using the killcommand. There should never be more than one of poll or simulate running at any given time, andneither should you have poll and simulate running at once – just one or the other, that’s all!
(4) Start up a new instance of that process by typing the name of the executable (either poll or simulatedepending on what you want to do) preceded by ./ and followed by an ampersand symbol (&). Forexample, if you just compiled the simulate executable file, you would run it by typing ./simulate
& at the command prompt. To run the poll executable, type ./poll & at the command prompt.Remember, you only need one of these running at any given time. Running multiple instances of polland/or simulate will write possibly conflicting data to the data files.
(5) Read the contents of the data.txt file to see how the data is being displayed. I recommend typing cat
data.txt to do this. If a console-based web browser such as lynx is installed in the Linux computer,you may alternatively use it to view the contents of the data.html file which will produce results thatare better-formatted for easier viewing than the plain text file. Both the poll and the simulate processupdates both data files with fresh values once per second. If everything is working as planned, you’redone! If not, go back to step 1 to fix your function and repeat all these steps.
120

You will find the caSCADA channel functions to be fairly easy to understand, even if you have neverdone any computer programming before. Each channel function, one at a time, is “called” by the maincaSCADA program, and the code contained within each function file is read and executed by the computerin the same order that you read text: from left to right, top to bottom. Here is a listing of the default codefor the source file f channel 10.c, as an example:
/**********************************************************
Consult the "README.txt" file for help editing this function!
**********************************************************/
#include <stdio.h>
#include <math.h> // Necessary for any advanced math functions
#include "cascada.h" // Contains all the declarations specific to caSCADA
int
f channel 10 (void)
f channel[10].value = ain[10];
f channel[10].tag = "(none)";
f channel[10].unit = "Volts";
f channel[10].status = 1;
f channel[10].comment = "Analog input AIN10";
return 1;
The only code you’ll have to edit here is the channel function itself: the text lying between the curlybrace characters ( and ). These lines of code assign values to each element of the f channel[10] datastructure, and they will be re-read and re-executed repeatedly by the main caSCADA program to refreshthese values. The first of these lines assigns f channel[10].value to be equal to analog input 10 on theLabJack. If AIN10 on the LabJack happens to measure 4.307 volts, another portion of caSCADA willplace that value into the external variable ain[10], and when the f channel[10] function is called by themain program the first line copies that value 4.307 into the variable f channel[10].value where anotherportion of the caSCADA program will displayed it a file named data.txt (as well as in another file nameddata.html. The lines assigning text (between quotation marks) to the .tag, .unit, and .comment elementsare for free-form text. The .status element is normally set to a value of 1 (which means “good” status),but may be set to other values at your discretion.
As written, this default function doesn’t do much other than directly display channel 10’s value in voltsand applies some text labels. This is where your work becomes important: your task will be to modify thecode for your channel to make it do something more useful, like scale the analog input’s voltage value into areal-world measurement complete with appropriate units. This lab exercise is focused on temperature, and soyour modified channel function will have to scale the received voltage signal into a temperature measurementexpressed in degrees F, C, R, or Kelvin.
121

You are welcome to make your function code as simple or as sophisticated as you desire. Multipleexamples are shown in the README.txt file located with the other source files on the RTU computer. Thefollowing code segment shows a simple version of the f channel 10.c source file written to scale analoginput number 3’s 1-to-5-volt DC signal into a pressure measurement range of 0 to 75 PSI using a y = mx+ b
equation where m = 18.75 and b = −18.75:
int
f channel 10 (void)
f channel[10].value = (ain[3] * 18.75) - 18.75;
f channel[10].tag = "PT-42";
f channel[10].unit = "PSI";
f channel[10].status = 1;
f channel[10].comment = "Receiver tank pressure";
return 1;
A good way for each student on a team to get experience programming a different mathematical functionwithout having to re-range their team’s transmitter each time is to re-program the function for a differentunit of temperature measurement on the exact same calibrated range. For example, one student programscaSCADA to read out in degrees Fahrenheit, another in degrees Celsius, another in degrees Rankine, andanother in Kelvin, but each and every one of these uses the exact same transmitter range. This objective couldeven be checked by the instructor at the same time as the RTD or thermocouple simulation objective, withthe student applying a simulated RTD/thermocouple signal to the transmitter and showing that simulatedtemperature displayed in a unique unit on the caSCADA display (i.e. the contents of the live data.txt ordata.html file.
If you would like to learn more about the mathematical and algorithmic capabilities offered by theC programming language, an excellent resource is the book The C Programming Language written by theinventors of C: Brian W. Kernighan and Dennis M. Ritchie. Many other C programming tutorials andreferences may be found on the internet as well. Suffice it to say, you can program each function to doalmost anything to and with the channel data. You may even program your function to read the values,statuses, and text fields of other channels, since all default channel variables are “global” (also called external)and therefore accessible to all portions of the caSCADA software.
C is a professional-grade programming language, which means that although the caSCADA system waswritten for use as a student learning system, anyone wishing to extend the capabilities of caSCADA beyondits intended use is welcome and able to do so because the C language is sufficiently capable for practically anytask. The fact that caSCADA is an open-source software project means anyone has the freedom to samplethe C programming code and modify it to their heart’s content without the need to request permission fromthe original developer. This is the real beauty of open-source software: it gives you both the right and themeans to learn from the code and extend that code well beyond its original intent.
122

Common mistakes:
• Syntax errors resulting from incorrect characters added to the code, or necessary characters deletedfrom it. Pay close attention to the color highlighting presented by the text editor (nano), as this oftenreveals such errors.
• Failing to follow all steps of the programming development cycle (e.g. neglecting to recompile editedsource code using the make command, failing to kill the old (running) version and re-start the newversion).
• Running multiple instances of poll and/or simulate on the same RTU. This will cause conflicting datato be written and re-written to the data.txt file. The most common cause of this problem is whenmultiple students log in to the same caSCADA RTU and attempt to test their code simultaneously.
• Leaving a HART communicator connected to the transmitter’s 4-20 mA circuit, which will result inthe caSCADA system picking up on bursts of FSK data. This will make the signal appear to “jump”around.
• Not using ISA-standard tag names for each channel.
file i00378
123

Question 92
RTU component layout
An “RTU” is a Remote Terminal Unit in a SCADA system serving as the interface between fieldinstruments and a central control/display unit called the “MTU” (Master Terminal Unit). In our caSCADAsystem, the MTU is just a laptop computer viewing data generated by the single-board Linux computer ineach RTU. Each RTU uses a LabJack data acquisition unit to sense analog signals sent by field transmittersand a single-board computer to condition and present that data in the form of digital data files readable bythe MTU. Communication takes place via a wireless access point (WAP) router:
LabJack T7CB37
GndVS
AIN0AIN1
GndVS
GndVS
GndVS
GndVS
GndVS
GndVS
AIN2AIN3
AIN4AIN5
AIN6AIN7
AIN8AIN9
AIN10AIN11
AIN12AIN13
GndVS
DAC0DAC1
12141
--
Wire duct
(typical per AIN)
0-13
20-33
40-53
53 33 13
40 20 0
To micro-USB plug
(Fuse)
(Fuse)
To 12V battery
(Fuse)
(Fuse)
(Fuse)
(Computer power)
To 24V battery bank
To Linksys wirelessrouter
Linksys wirelessrouter
Raspberry Pisingle-board computer
Ethernet cable
Ethernet cable
7805
GndIn
Out
7820
#1
#2
#3
#4
#5
transformer
H1
H4
X1
X4
To external
line power source12 VAC transformer
120/240 V
DC-DC converter
9-30 VDC5 VDCinputoutput
Each RTU enclosure is weatherproof, and equipped with a set of batteries to maintain DC power to allthe system components in the event of an external AC power failure.
The upper level of terminals on the triple-level blocks should all be jumpered together because this isthe 20 VDC “bus” used to power all field instruments. The lower level of terminals should also be jumperedtogether because they comprise the negative side (“Common” or “GND”) of that same 20 VDC loop powersupply.
124

Sample loop diagrams
GND
LabJack T7
250 Ω
Loop-powered
field instrument
Gnd
Gnd
4-20 mA
Externally-poweredvoltage signal
field instrument
Out
GND
TB1
Field RTU enclosure
+20 VDC
+20 VDC
GND
AIN#
AIN#
DAC#Signal
converter(1-5 VDC
to 4-20 mA)
Final control element
TB1
Note: single-loop PID control uses AIN0 for PV and DAC0 for Output
Generic loop diagram for LabJack T7 based caSCADA RTU
4-20 mA
1-5 V
1-5 V
1-5 V
4-20 mA
1-5 V
Ethernet
A set of triple-height terminal blocks marshall field instrument signals to the DAQ input terminals, withthe three terminals of each block represented in the above diagram. The top-most terminal is the + DCpower supply bus, the middle terminal connects to the LabJack DAQ input channel, and the bottom terminalis the − DC power (GND) supply bus. Both current-based and voltage-based instrument signals may beaccepted by the DAQ. In the case of 4-20 mA loop instruments, a precision 250 Ω resistor is connected insuch a way to provide a 1-5 VDC signal for the DAQ to sense. If the field instrument outputs a voltagesignal instead (which is actually quite common for RTU loops in remote installations relying on solar power)then the resistor is omitted and the LabJack AIN directly reads that instrument’s output voltage.
The LabJack DAQ also provides two analog output channels (DAC0 and DAC1) for analog control ofa final control element. In a caSCADA system these output channels are connected to an external signalconverter, and the resulting 4-20 mA output signal may be used to drive an I/P transducer, electronic valvepositioner, or VFD.
When using a caSCADA system for PID loop control, the Process Variable (PV) input is input channelAIN0 and the Manipulated Variable output is output channel DAC0. The PID control application may beinvoked by entering ./pid at the command line.
125

Electrical power diagram
120 VAC
FuseExternal power source
Power cable
Fuse
5 VDCpower
Computer
power
Loop
12 V
12 V 12 V
Power schematic diagram(LabJack poweredthrough USB cord
to Computer)
Wireless router12 VDCpower
Fuse
LMIn
Gnd
Out
(Heat sink fastened to subpanel)
7820
20 VDC
Fuse #1
Fuse #2
#3
Fuse #4
Fuse #5
1N4001
1.5 kΩ
12 VAC
100 µF
12 VAC
24 VAC
(Actually a 120 VAC to
240 VAC transformer)
10,000+ µF
1N4001
1.5 kΩ
DC-DCconverter
9-36 VDC 5 VDCinput output
Last revised 10 June 2017
Power is sent to each RTU box at 12 volts AC, from a transformer located near a 120 VAC powersource. This keeps the field power cable at a safe, low voltage (similar to outside sprinkler control systemsand walkway lighting).
Internal to each RTU is a dual-voltage DC system: 12 volts (regulated down to 5 VDC) for running theLinux-based computer, LabJack DAQ, and Linksys WRT54GL wireless router; and 20 volts for poweringthe field instruments. Lead-acid batteries provide back-up power for the RTU to continue running in theevent of a power outage. The resistor-diode network limits battery charging current to a bare minimum,while providing full current capacity in the discharge direction (in the event of an AC line power outage).
24 volts is a more customary DC supply voltage for loop-powered field instruments, but the LabJackmodel T7 DAQ has an absolute maximum input voltage of 20 VDC. Thus, the loop supply voltage is limitedto this value to avoid the potential for damage to the LabJack in the event of a shorted instrument cablewhich would apply full power supply voltage to the DAQ input.
126

RTU power system testing procedure
You must follow this procedure when first commissioning a new RTU. When working with an existingRTU, you may follow the same procedure to test the continuing health of the DC power system.
(1) Test the external 12 VAC transformer by itself: when plugged into a 120 volt AC source, does it outputat least 12 volts AC?
(2) Open up all fuses (#1 through #5) to ensure no device will become powered until you intend so.
(3) Connect this external 12 VAC transformer’s output to the RTU as shown in the diagrams and applypower. Check the output of both bridge rectifiers for proper DC voltage magnitude and polarity. Dueto the filter capacitors the DC voltage magnitudes will register greater than the AC voltage magnitudesfeeding each of the bridge rectifiers.
(4) Ensure the batteries are wired to the proper terminal blocks and fuse holders, and measure DC voltagemagnitudes and polarities at the battery-side of each open fuse. This ensures the batteries are properlyconnected.
(5) Close fuses #2 and #4. This connects the two battery banks to their respective charging sources. Re-measure the voltage magnitudes at the battery-side of each closed fuse. You should read slightly highervoltage now than in the previous step, because the batteries are charging.
(6) Ensure all power plugs are removed from the caSCADA electronic devices: the LabJack DAQ unit, theRTU computer, and the Linksys wireless router. Prepare to measure DC voltage at the ends of thosepower plugs.
(7) Close fuse #3 and measure DC voltage magnitude and polarity at the Linksys router’s power plug.Check the router’s documentation for the proper DC polarity of the plug’s shell and tip to see that thepolarity is correct. If all is well, plug the power cable into the router and check to see that it powersup. Re-measure voltage magnitude at fuse #3 to see that the router is receiving adequate voltage whilepowered (i.e. under load).
(8) Close fuse #5 and measure DC voltage magnitude and polarity at the RTU computer’s micro-USB powerplug. Check online for the “pinout” specification of a micro-USB power plug to see that the polarityis correct. If the pins on the micro-USB plug are too small to safely probe using your multimeter, youmay check DC voltage at the stripped end of that cable where it lands at the terminal block, and verifycorrect voltage and polarity according to the colors of that cable’s wires. If all is well, plug the powercable into the RTU computer and check to see that it powers up.
(9) Plug the B-style USB cable into the LabJack. It receives power through the RTU computer and shouldpower up immediately. Re-measure voltage magnitude at fuse #5 to see that both the RTU computerand LabJack units are receiving adequate voltage while powered (i.e. under load).
(10) Close fuse #1 to apply 20 VDC power to the field instrument terminal blocks. Measure DC voltagemagnitude and polarity between terminals 13 and 53 to ensure 20 VDC is supplied all the way to theend of the terminal block section.
(11) At this point in time you may initialize the caSCADA system MTU (a laptop PC) and test the systemfor proper data. A procedure for this is given on the following page.
(12) Unplug the external 12 VAC transformer from its line power source, and re-measure all DC supplyvoltages to ensure all devices are receiving adequate voltage under battery power alone.
(13) Repeat these DC voltage measurements at one-hour intervals to check the health of the batteries.
127

RTU data system testing
You must follow this procedure when first commissioning new devices for an RTU.
(1) Ensure that the proper IP addresses are all written on labels affixed to each of the networked devicesin the RTU: the LabJack DAQ unit, the Linksys wireless router, and the single-board computer.
(2) Set the IP address and subnet mask of your personal computer to appropriate values for the Ethernetdevice you wish to connect to. For each octet of the subnet mask with the value “255” the octet ofyour PC’s IP address must match the IP addresses of all devices in the RTU. For each octet of thesubnet mask with the value of “0” the octet of your PC’s IP address must be different from any devicein the RTU. This will prepare your PC for direct Ethernet cable connection to the device you intend toconfigure.
(3) Plug your computer into the Linksys router using an Ethernet cable, and set the router’s IP addressand subnet mask and name using a web browser. Follow the instructions given in the manual for therouter. The router’s name should make sense to any user of the system. In an area with multiple RTUs,the name should be specific enough to clearly identify which RTU it is.
(4) Plug your computer into the LabJack DAQ using an Ethernet cable, and set the DAQ’s IP address andsubnet mask using the software provided by LabJack for this task. Follow the instructions given in theLabJack manual.
(5) Plug an HDMI monitor and USB keyboard into the single-board computer, and log in directly to setits IP address and subnet mask. To check its current settings, use the ifconfig command (similar tothe ipconfig command in Microsoft Windows). If the settings are not correct, you may change themby editing the file /etc/network/interfaces. This requires “root” privileges. Lines of text in thisinterfaces file follow this pattern:• The line specifying the eth0 interface must read iface eth0 inet static
• Prior to the eth0 line must be a line that reads auto eth0
• The “address” line contains the IP address (e.g. address 169.254.8.3)• The “netmask” line contains the subnet mask (e.g. netmask 255.255.0.0)
(6) Unplug the Ethernet cable from your personal computer and wirelessly connect to the Linksys router.The router will automatically assign an appropriate IP address to your computer’s wireless card, asrouters are designed to do.
(7) Use the ping command in your computer to test network connectivity with each device in the RTU.This command is simply the word “ping” followed by the IP address of the device you wish to ping. Forexample, ping 169.254.8.1 will test to see whether your computer has connectivity with the devicebearing the IP address 169.254.8.1.
(8) Once all devices have been proven to ping successfully, you may use an SSH client program in yourpersonal computer (e.g. Bitvise) to log into the RTU computer. The login account is simply btc withthe password btc.
(9) Once you are logged in to the Linux operating system, you may try compiling the caSCADA code andthen running it (either poll process or the pid process) to test its ability to communicate with theDAQ unit.
128

Preparing the “Raspberry Pi” single-board computer for use in the caSCADA system
To initially configuring a Raspberry Pi to be used in the caSCADA system, there are several thingswhich must be done:
• Log in as the default user (name = pi and password = raspberry)
• Use the sudo and passwd commands to reset the root account’s password to your liking (e.g. sudo
passwd root). There are several tasks for which root privileges are necessary, so it’s convenient to beable to log into the root account and do that work there, rather than have to preface all those commandstyped under the pi login user with the “sudo” qualifier.
• Use the raspi-config utility to set the system’s hostname, configure the keyboard for US mapping (asBritish “UK” mapping is the default!), and also enable the ssh server which will be essential for remotelogin and system administration.
• Add a new user account called btc.
• Feel free to edit the hidden file named .profile in the /home/btc directory with any special instructionsto be executed at login. For example, you may add lines containing the echo shell command to printmessages to the screen for the user once they log in (e.g. echo "Welcome to the fish hatchery
RTU").
• Set the current time and date using the date command. The format is MMDDhhmmCCYY. Forexample, 3:21 PM on November 5, 2016 would be set by issuing the command date 110515212016.
• Navigate to the /etc/network directory and edit the file named interfaces to set all the required IPaddress and netmask information to give the Raspberry Pi a static IP address for use in the caSCADAsystem. Lines of text in this interfaces file follow this pattern:
• The line specifying the eth0 interface must read iface eth0 inet static
• Prior to the eth0 line must be a line that reads auto eth0
• The “address” line contains the IP address (e.g. address 169.254.8.3)• The “netmask” line contains the subnet mask (e.g. netmask 255.255.255.0)
• Install the cascada.tar archive file in the /home/btc directory, and then use the command tar xvf
cascada.tar to unpack that archive file.
• Install the latest libmodbus library archive file in the root directory, then uncompress it (gunziplibmodbus*.gz) and unpack the archive (tar xvf libmodbus*tar) and then descend into the newlibmodbus directory to build it. This library is absolutely necessary for caSCADA to run, as itcontains all the code necessary to read and write Modbus device registers over a TCP/IP network.Build and install the new software using the commands ./configure ; make ; make install ;
ldconfig. Check the general header file repository (located in the directory /usr/include/) to see ifthe installation script successfully copied the file named modbus.h there. In the versions of libmodbusI’ve installed, I have had to copy the modbus.h file to the /usr/include directory manually.
• Install the latest ncurses library archive file in the root directory, then uncompress it (gunzipncurses*.gz) and unpack the archive (tar xvf ncurses*tar) and then descend into the new ncurses
directory to build it. This library is necessary to run the lynx web browser, as well as the graphicinterface for the caSCADA pid controller process. Build and install the new software using thecommands ./configure ; make ; make install ; ldconfig.
• Install the latest lynx text-based web browser software archive file in the root directory, thenuncompress it (gunzip lynx*.gz) and unpack the archive (tar xvf lynx*tar) and then descend intothe new lynx directory to build it. Build and install the new software using the commands ./configure; make ; make install ; ldconfig.
129

• Navigate to the /home/btc directory and edit the file cascada poll.c with the correct IP address toestablish a Modbus/TCP connection with the LabJack DAQ unit in your RTU. The function establishingthe address will be easy to find in this file, as it calls out the IP address in standard four-octet format.Just edit the IP address that’s shown, and the caSCADA poll software will be able to communicatewith that LabJack DAQ.
• Try running make in the /home/btc directory to verify all the caSCADA software componentssuccessfully compile.
file i02566
130

Question
93
Sam
ple
Loop
Dia
gra
m(u
sing
asin
gle
-loop
contro
ller)
Process areaField panel Control room panel
Controller
Resistor
I/P transducer
Control valve
I/P
ES 120 VAC
AS 20 PSI
Loop Diagram: Furnace temperature control
TT205
JB-12
TB-15
TB-15
3
4
1
2
Temperature transmitterTT-205 Rosemount 444
TE205
CP-1
TB-11
TB-11
1
2
7
Vishay 250 ΩTY-205a
TIC-205 Siemens PAC 353
TY-205b
TV-205 Fisher Easy-E 3-15 PSI
Fisher
H
N
3
4
22
21
19
18
TY205b
TY
205a
Breaker #4Panel L2
5
6Cable TY-205b
Cable TT-205 Cable TT-205
Cable TY-205b
TIC205
Revised by: Mason Neilan
TV205
Tube TV-205
Column #8Valve #15
546
0-1500oF 0-1500oF
Fail-closed
Reverse-acting control
TE-205 Thermocouple Omega Type K Ungrounded tip
Red
BlkRed
Yel Red
Blk
Red
Blk
Red
Blk
Wht/Blu
Blu Blu
Wht/Blu
Cable 3, Pr 1
Cable 3, Pr 2
Wht/Org
Org Org
Wht/Org
Blk
Red
Blk
Red
Blk
Wht
Red
Blk
Red
Blk
Upscale burnout
Description Manufacturer Model Notes
Date:
Tag # Input range Output range
0-1500o F 4-20 mA
4-20 mA 3-15 PSI
0-100%
1-5 V 0-1500o F
April 1, 2007
Out
S
131

Sam
ple
Loop
Dia
gra
m(u
sing
DC
Scontro
ller)
Field process area
Description Manufacturer Model Notes
Loop Diagram: Revised by: Date:
DCS cabinet
Red
Blk
Red
Blk
Red
Blk
Fisher
Fisher
Tag # Input range Output range
Blue team pressure loop April 1, 2009
Card 4
Card 6Channel 6
Channel 611
12
29
30
Red
Blk
TB-80
TB-80
Field panel JB-25
TB-52
TB-52
PT-6 Pressure transmitter Rosemount 3051CD 0-50 PSI 4-20 mA
PIC6
PT6
Cable 4, Pr 1
Cable 4, Pr 8
1
2
15
16
Cable PT-6
Red
Blk
Red
Blk
Red
Blk
Red
Blk
Red
Blk
Red
Blk
Red
Blk
Red
Blk
Cable PV-6
11
12
11
12PY6
AS 20 PSI
PV6
0-50 PSI
I/P
0-50 PSI
846
Emerson DeltaV 4-20 mA 4-20 mA HART-enabled inputPIC-6
PY-6
PV-6
I/P transducer
Controller
Control valve Vee-ball
4-20 mA 3-15 PSI
3-15 PSI 0-100% Fail-open
Duncan D.V.
Tube PV-6
Cable PT-6
Cable PV-6
Analog input
Analogoutput
Direct-acting control
H
L
73
73
73 Cable PT-73 Cable PT-73
Cable PV-73Cable PV-73
PT-73
PIC-73
PY-73
PV-73
73
PIC
S
O
Tube PV-73
132

Sam
ple
Loop
Dia
gra
m(u
sing
pneum
atic
contro
ller)
Description Manufacturer Model Notes
Loop Diagram: Revised by: Date:
Tag # Input range Output range
LT24
In
H
LOut
C
D
A.S. 21 PSI
Tube LT-24a Tube LT-24b
A.S. 21 PSI
Process areaBulkhead panel
14
B-104Control panel CP-11
Tube LV-24
LV24
Tube LV-24
Supply
LIC
24
Tube LV-24
(vent)
Sludge tank level control I. Leaky April 1, 2008
LT-24 Level transmitter Foxboro 13A 25-150 "H2O 3-15 PSI
3-15 PSI 3-15 PSIFoxboroLIC-24 130
LV-24 Fisher Easy-E / 667 3-15 PSI 0-100% Fail closedControl valve
Controller
133

Sam
ple
Loop
Dia
gra
m(u
sing
PLC
,w
ithele
ctro
nic
positio
ner
insta
lled
on
valv
e)
Tag number Description Manufacturer Model Calibration Notes
ES 120 VAC
Red
Blk
Red
Process area
From fieldpanel disconnect
1 2 3 4
1A
Blk Wht Grn
21
11
12
1A10 PS-1
120 VAC
24 VDC1 amp
L1 NIN0+
IN1+
IN2+
IN3+
IN0-
IN1-
IN2-
IN3-
Blk Wht Grn
1762-IF4analog input card
L1
L2/N
Allen-Bradley ML11001762-IF4 input 4-20 mA
Rosemount 4-20 mA output
Blu Blu Blu
Blu
Blu
Blu
expansion slot 1
analog input cardexpansion slot 2
PLC
AutomationDirect C-More
Ethernet
Mask = 255.255.0.0
HMI touch-panel
800 mA
22BluBlk
FT
18
18
18
FIR
FC
1762-OF4
Cable FT-18
FT-18
FC-18
FIR-18
Flow transmitter 3051S0-100" WC input
IP = 169.254.10.91762-OF4 output 4-20 mA
P Cable FV-18V out 0
V out 1
V out 2
V out 3
Com
Com
I out 0
I out 1
I out 2
I out 3
Blu
Blu
Blu
Loop Red
Blk
Red
Blk
18FV
FV-18 Flow valve with positioner FisherED / 667DVC6010
IAS 20 PSI
4 mA = fully closed20 mA = fully open Fail-closed
Square-root characterization
H
L
Loop Diagram: Unit feed flow control Revised by: A. Bradley Date: April 1, 2013
Field panel FP-25
Loop
Supply
A
0-75 GPM
(Located in maincontrol room)
analog output card
134

Lab Exercise – loop diagram and system inspection
Each team’s system will undergo an inspection simulaneous with inspection of each team member’s loopdiagram. Team members will exchange diagrams with each other and then verify from those diagrams whatthe instructor sees when inspecting each and every panel and connection. Please note that the “Lessons InIndustrial Instrumentation” textbook describes good practices for construction and documentation.
Construction Standards
• All construction must be safe (i.e. must not pose any unnecessary hazard to students or visitors).This includes electrical, chemical, thermal, pressure, and general safety hazards (e.g. trip hazards, cuthazards). Unsafe construction will be dismantled upon discovery.
• All electrical sources greater than 30 volts must be overcurrent-protected and all related wire connectionsmust be guarded against accidental contact (e.g. use recessed terminals with no exposed metal).
• Proper use of colors for electrical power source wiring (e.g. red and black for DC + and −, black andwhite for AC “hot” and “neutral”, green for earth ground).
• All metallic electrical enclosures must be bonded to earth ground for safety.
• Proper wire types and attachment to terminals (e.g. appropriate wire gauge for the expected current,use of stranded wire wherever possible, correct terminals crimped to ends of wires, no stray wire strandsat any point).
• Attached wires must withstand being lightly pulled with fingers.
• Wire insulation must be intact (i.e. no bare wires anywhere).
• Panel wiring must be neat in appearance (e.g. all cables run directly from terminal block to nearestwire duct, with all excess wire length tucked inside wire duct).
• Wiring outside of panels should be run through conduit wherever possible.
• Correct tools must be used at all times. This includes the use of fixed-size wrenches rather thanadjustable wrenches whenever possible, box-end over open-end wrenches whenever possible, and thecorrect type and size of screwdriver used to turn screw heads.
• All electrical components must be located to avoid exposure to liquids.
• All tube and pipe connections must be properly made (e.g. correct “swaging” of tube ends, no over- orunder-tightened fittings, Teflon tape or pipe sealant used on all NPT threads).
• All manual controls (e.g. buttons, handles, knobs) must be accessible and function without undue effort.
Documentation Standards
• Loop diagrams must be drawn in accordance with ISA standard 5.1.
• Each instrument must have an appropriate ISA-standard tag name, and this tag name must be visibleon the actual instrument (e.g. written on masking tape and attached to the instrument).
• Each signal cable and each signal tube must have an identifying label documented and attached. Longcables must be labeled at each end, as close to the termination points as practical.
• Each team must have its own unique loop number.
• Each instrument’s (final) calibrated range must be shown.
• Each control valve’s fail mode (e.g. fail-open, fail-closed) or action must be shown.
• All writing must be legible (i.e. easy for anyone to read). Hint: large-format paper helps!
• All instrument symbols must be appropriate to the device, function, and location. The large white-colored control panel and the DCS operator stations constitute the main control room. All electricalenclosures in the lab room are auxiliary locations, and everything else is considered a field location.
• Instrument functions shared within a common device must be represented by the “shared” symbol on thediagram (e.g. a controller that is part of a multi-loop control system such as a DCS). Shared controllersmust have their identifying loop noted on the diagram (e.g. DCS South Loop #23).
• Any controller I/O cards must be labeled with slot number and channel number in addition to terminalnumbers.
135

• Each location (e.g. field, junction box, control room) must be clearly delineated with vertical seperationlines on the diagram.
• Each diagram must be sufficiently detailed so that no other student will have difficulty locatingcomponents (e.g. “Where is the controller for this loop?”) or determining important configurationparameters (e.g. range settings).
Sample diagrams are provided in this worksheet (immediately following the lab exercise documentation),and each student is urged to use these sample diagrams as references when drafting their own. The “LessonsIn Industrial Instrumentation” textbook also describes ISA-standard documentation practices.
Common mistakes:
• Incorrect tag name format, using letters that do not conform to the ISA 5.1 standard (e.g. including“PLC” or “DCS” in a controller’s tag name).
• Forgetting that every instrument’s tag name in a loop must begin with the same letter, and that thisfirst letter represents the process variable being measured/controlled.
• Forgetting to label all field instruments with their own tag names (e.g. AT-83).• Failing to label termination points (e.g. terminal block screws) exactly as they are labeled in real life.• Poor use of space on the diagram paper, causing some portions of the diagram to become “crowded”
rather than all components being evenly spaced. Hint: begin your diagram by sketching the fieldinstrument at the far left of the paper and the control room instrument at the far right of the paper, thendraw all other instruments and connections in between!
• Forgetting to label all signal wires (see example loop diagrams).• Forgetting to note all wire colors.• Forgetting to put your name on the loop diagram!• Leaving junction box cables outside of wire duct, looking messy.• Leaving wire duct covers off.• Basing your diagram off of a team-mate’s diagram, rather than closely inspecting the system for yourself.• Not placing loop sheet instruments in the correct orientation (field instruments on the left, control room
instruments on the right).
Creating and inspecting accurate loop diagrams should take no more than one full labsession (3 hours) if the team is working efficiently!
file i00654
136

Answers
Answer 1
Answer 2
Answer 3
Answer 4
Answer 5
Answer 6
Answer 7
Partial answer:
Emeter = Emeas − Eref + Ecomp
Answer 8
In the calibration circuit, there is not a trace of thermocouple wire to be found. Instead, all wires aremade of copper. This presents a problem for us because the temperature instrument has a reference junctioncompensation circuit built in, which at this point is compensating for a reference junction millivoltagethat doesn’t exist. The instrument actually “sees” the series combination of the potentiometer’s outputvoltage (Epotentiometer) and its own internally-generated compensation voltage (Ecompensation), not thepotentiometer voltage by itself. This is why we cannot simply set the potentiometer to the millivoltagecorresponding to our calibration temperature point and adjust the instrument to read the same.
I’ll let you figure out exactly how to work around this problem!
Answer 9
Partial answer:
• Type K• 300o F ; Potentiometer setting = 5.116 mV
• Type J• 400o F ; Potentiometer setting = 10.006 mV
• Type J• 750o F ; Potentiometer setting = 21.280 mV
137

Answer 10
When any electrical instrument is said to have a high input impedance, it means that it draws verylittle current from the source of voltage it is measuring. This is true for any ideal voltmeter: that itmeasure voltage without “loading” the source of voltage by drawing substantial amounts of current from it.It usually means that the instrument has a high DC resistance, but the word “impedance” implies otherforms of opposition to electric current as well (namely capacitive and inductive reactance – specific types ofopposition to alternating current).
It is important for a thermocouple-based temperature instrument not to draw much current from thethermocouple it connects to, because thermocouple wires typically have greater electrical resistance perlength than copper wires of similar gauge. If there is substantial current in the thermocouple circuit, voltagewill be dropped along the wire lengths, resulting in a measurement error:
Furnace
Voltmeterwire resistance
wire resistance
Voltage dropped along wire lengthsdue to current in the circuit
One way would be to build an operational amplifier (“op-amp”) buffer circuit to power an analogvoltmeter movement. Operational amplifiers typically have input impedances in the millions or billions ofohms (the TL082, an inexpensive, general-purpose JFET-input op-amp, has a typical input impedance of1012 Ω , or 1 trillion ohms!). The circuit would look like this:
Voltmeter−
+
+V
-VTothermocouple
The op-amp senses the thermocouple’s voltage signal and duplicates that voltage level at its outputterminal, where it powers the meter movement. The current necessary for powering the meter movementcomes from the DC power supply (+V/-V) powering the op-amp, and not from the thermocouple, so thethermocouple circuit does not become “loaded” by the meter. Another benefit of this strategy is that theop-amp buffer can easily be made into a precision amplifier, permitting the use of a larger-range voltmeter:
138

Voltmeter−
+
+V
-VTothermocouple
99 kΩ1 kΩ
Analog voltmeter registers 1 voltfor every 10 millivolts produced
by the thermocouple
AV = 100 = 40 dB
A non-electronic solution to this problem of building a high-impedance voltmeter is the classic “null-balance” or “potentiometric” voltmeter circuit, whereby an adjustable voltage source is used to balance theincoming signal voltage to be measured, with a highly sensitive “null” meter movement indicating when thetwo voltages are equal. Then, a regular analog voltmeter reads how much voltage the adjustable voltagesource is set for in this condition of balance:
Voltmeter
Tothermocouple
null
When the "null" meter registers precisely zero,then the potentiometer is outputting the same voltage as the thermocouple, and the voltmeterwill register that voltage.
In the balanced condition, the voltmeter movement’s current requirements are supplied by the DCvoltage source (battery), not the thermocouple. In fact this type of circuit (null-balance, or “potentiometric”)is the only type of voltage-measuring instrument hypothetically capable of attaining infinite input impedance.Its simplicity and high theoretical input impedance makes it an elegant solution to the measurement problem.
139

Answer 11
Cu+ -
TC wire
TC wire
ProcessTemperature instrument
Cu
+
-
+
-Einstrument
Ereference
Emeasurement
(primitive)
Equation: Emeasurement - Ereference = Einstrument
Cu+ -
TC wire
TC wire
ProcessTemperature instrument
Cu
+
-
+
-
Einstrument
Ereference
Emeasurement
T
Ecompensation
+ -
Equation: Emeasurement - Ereference + Ecompensation = Einstrument
140

Cu+ -
Temperature instrument
Cu
+
-
+
-
Einstrument
T
Ecompensation
+ -
Precisionpotentiometer
Cu
Cu
Cu
CuEpotentiometer
Equation: Epotentiometer + Ecompensation = Einstrument
Cu+ -
Temperature instrument
Cu
+
-
+
-
Einstrument
T
Ecompensation
+ -
Precisionpotentiometer
Cu
CuEpotentiometer
TC wire
TC wire
Emeasurement
Ereference
Equation: Epotentiometer + Emeasurement - Ereference + Ecompensation = Einstrument
To make this really simple: if you desire to know the proper potentiometer setting for generating anindication on any thermocouple-based instrument, just look up the millivoltage for the desired temperature,and subtract the millivoltage corresponding to the temperature at the point where either (A) copper wires jointo a compensated instrument, or (B) where thermocouple wires join to an internally-copper, uncompensated,calibration device (assuming the temperature at the calibration device is the same as the temperature of themeasuring instrument).
141

Answer 12
IE = 4.3 mA
−
+
Rsense
Rlimit
(ground)
Voltageregulator
InOut
Gnd
Rfeedback
Rbias
Out
Gnd
+V
Thermocouple
Op-amp
+V
Gnd
Amplifyingand scaling
circuitry
All arrows drawn in the direction of conventional flow
Follow-up question: how would the transmitter circuit respond to an increase in temperature sensed bythe thermocouple? How about a decrease in loop power supply voltage (24 volts → 20 volts)?
Challenge question: it is important for instrument accuracy that we make Rbias and Rfeedback resistorsrather large in value. Explain why.
142

Answer 13
Circuit as it appears to AC (HART) signals sent by the communicator:
250 Ω
HART communicator
Indicator(1-5 VDC)
Loop-poweredtransmitter
(HART-compatible)
(open)
Circuit as it appears to DC (4-20 mA) signals:
Loop-poweredtransmitter
250 Ω
HART communicator
(HART-compatible)
4-20 mA DC
Indicator(1-5 VDC)
(open)
The communicator may be connected anywhere that places it in parallel with the transmitter terminals,from the transmitter itself all the way back to the control panel where the indicator is located!
Challenge question: a HART communicator will be able to communicate with the smart field instrumentif it is connected directly in parallel with the 250 Ω loop resistor, even though this is technically not in parallelwith the transmitter terminals. Explain why this works!
143

Answer 14
Series:
Vmeter = (V1 + V3 + V5) − (V2 + V4 + Vref )
Parallel:
Vmeter =V1 + V2 + V3
3− Vref
Follow-up question: explain why swamping resistors are often added to paralleled thermocouples toimprove the accuracy of their temperature averaging:
V1
V3
Vref
Parallel thermocouple junctions
V2
with "swamping" resistorsVmeter
Answer 15
No reference junction compensation is needed at the indicator, because no reference junction existsthere. In effect, the thermocouple at T2 serves as a “reference” junction to the thermocouple at T1.
A practical application for a differential thermocouple is in a solar heating system for a house. Duringthe day time, solar energy will ensure that the collector is at a greater temperature than the house whichit warms. At night, however, when the sun is not shining, the collector will be colder than the house. Inthis state, you do not want the circulating pump (or blower) to run, for that would transfer heat out of thewarm house and dissipate it through the cold collector. A differential thermocouple could tell you (by thepolarity of its voltage) which was warmer: the collector or the house. Then, an op-amp comparator circuitcould disable the circulating pump to prevent heat loss through the collector at night.
Answer 16
Ideally, we may use any type of connection wire we wish so long as both the calibrator and the transmitterare at the exact same temperature! If the temperatures are not the same, we must be sure to use the correcttype of thermocouple wire (or extension wire) to connect the calibrator to the instrument.
Answer 17
The metal blocks into which thermocouple wires go to connect are usually made of heavy brass, and theyare physically secured to a thick ceramic (electrically insulating) base. This helps ensure the two connectionpoints are held to the same temperature.
144

Answer 18
Cu+ -
Temperature instrument
Cu
+
-
+
-T
+ -
Precisionpotentiometer
Cu
Cu
(type J thermocouple)
Temp. = 80o F
Temp. = 71o F
iron
constantan
• -100o F ; Potentiometer setting = -4.598 mV (or, 4.598 mV connected in reverse polarity)
• 150o F ; Potentiometer setting = 2.307 mV
• 400o F ; Potentiometer setting = 9.920 mV
Cu+ -
Temperature instrument
Cu
+
-
+
-T
+ -
Precisionpotentiometer
Cu
Cu
Temp. = 45o F
Temp. = 92o F
(type E thermocouple)
chromel
constantan
• 0o F ; Potentiometer setting = -1.452 mV (or, 1.452 mV connected in reverse polarity)
• 375o F ; Potentiometer setting = 12.298 mV
• 750o F ; Potentiometer setting = 28.431 mV
145

Cu+ -
Temperature instrument
Cu
+
-
+
-T
+ -
Precisionpotentiometer
Cu
Cu
Temp. = 63o F
Temp. = 105o F
(type K thermocouple)
chromel
alumel
• -50o F ; Potentiometer setting = -3.364 mV (or 3.364 mV connected in reverse polarity)• 975o F ; Potentiometer setting = 20.028 mV• 2000o F ; Potentiometer setting = 43.231 mV
Answer 19
The instrument will register 993.5o F.
Answer 20
• -93o F ; Potentiometer setting = -4.540 mV• 157o F ; Potentiometer setting = 2.400 mV• 389o F ; Potentiometer setting = 9.466 mV• 580o F ; Potentiometer setting = 15.353 mV
Answer 21
Hint: according to a saturated steam table, the vapor pressure of water near 575 oF is approximately1280 PSIG.
Answer 22
Partial answer:
The sensor is a type T thermocouple.
Answer 23
Partial answer:
The sensor is a type K thermocouple.
Answer 24
Partial answer:
The sensor is a three-wire RTD.
146
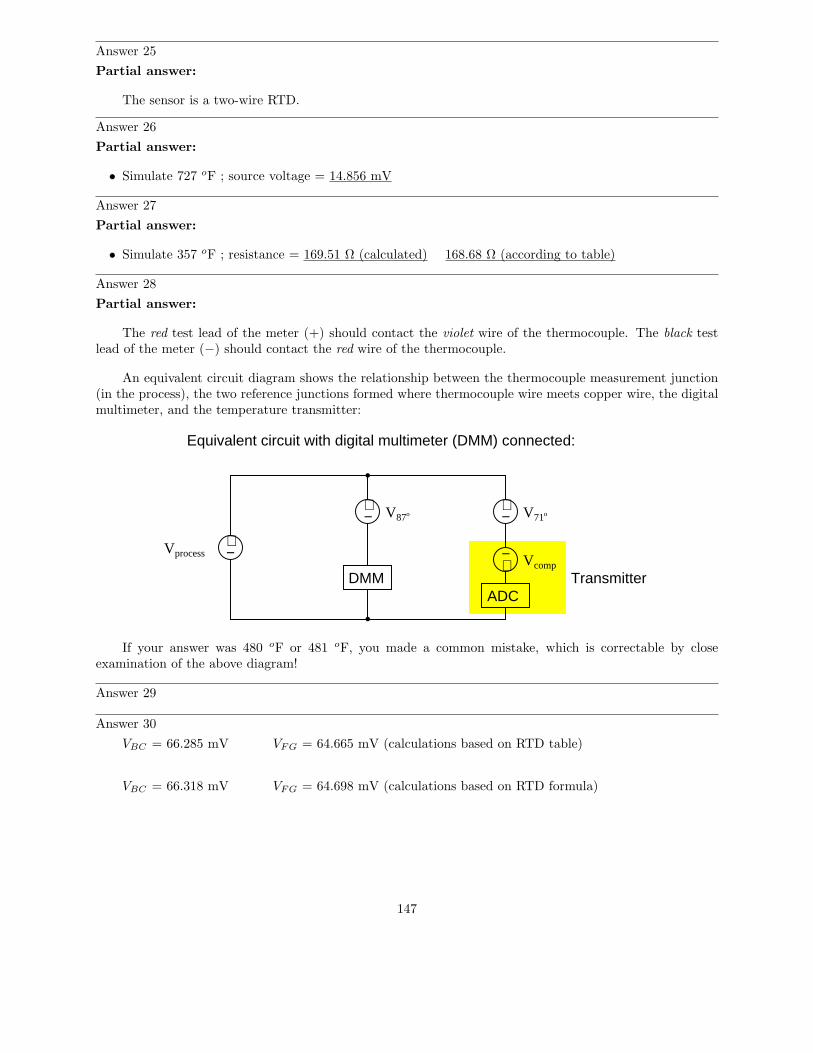
Answer 25
Partial answer:
The sensor is a two-wire RTD.
Answer 26
Partial answer:
• Simulate 727 oF ; source voltage = 14.856 mV
Answer 27
Partial answer:
• Simulate 357 oF ; resistance = 169.51 Ω (calculated) 168.68 Ω (according to table)
Answer 28
Partial answer:
The red test lead of the meter (+) should contact the violet wire of the thermocouple. The black testlead of the meter (−) should contact the red wire of the thermocouple.
An equivalent circuit diagram shows the relationship between the thermocouple measurement junction(in the process), the two reference junctions formed where thermocouple wire meets copper wire, the digitalmultimeter, and the temperature transmitter:
Equivalent circuit with digital multimeter (DMM) connected:
+−Vprocess
DMM
+− V87o
+− V71o
+−
Vcomp
ADCTransmitter
If your answer was 480 oF or 481 oF, you made a common mistake, which is correctable by closeexamination of the above diagram!
Answer 29
Answer 30
VBC = 66.285 mV VFG = 64.665 mV (calculations based on RTD table)
VBC = 66.318 mV VFG = 64.698 mV (calculations based on RTD formula)
147

Answer 31
VAC = 81.526 mV VBC = 80.330 mV (calculations based on RTD table)
VAC = 81.659 mV VBC = 80.463 mV (calculations based on RTD formula)
Answer 32
Thermocouple signals are very small, and the input impedance of a thermocouple transmitter is typicallylarge, making it susceptible to electrical interference. Given this fact, it is better to minimize the lengthof the noise-gathering signal path (the thermocouple wire). Also, thermocouple wire (even extension-gradewire) is more expensive than similar-gauge copper, which makes long lengths of copper cheaper than longlengths of thermocouple wire.
Answer 33
VBC = 136.479 mV VEH = 134.603 mV VFG = 134.603 mV (calculations based on RTD table)
VBC = 137.904 mV VEH = 136.028 mV VFG = 136.028 mV (calculations based on RTDformula)
Answer 34
• VR1 will stay the same• VR2 will stay the same• VR3 will decrease• VRTD will increase• Explain the relationship between boiler pressure and boiler temperature:
Boiler pressure and boiler temperature are directly related: as pressure increases, temperature alsoincreases.
Answer 35
• Voltage between terminals TB64-8 and TB64-9 = 22.512 volts
• Voltage between terminals TB64-10 and TB64-11 = 2.744 volts
• Voltage between terminals TB27-15 and TB27-16 = 25.256 volts
Hint: if you are having difficulty analyzing this circuit, try re-drawing it in schematic form (all current-carrying components in a straight line to show their series connections).
Answer 36
Possible faults include (but are not limited to):
• PLC program halted (with output O:3/3 stuck in the “off” state)• Discrete output O:3/3 channel bad (open TRIAC)• Short-circuit in thermocouple cable, causing it to register ambient temperature (low)• Failed thermocouple input I:2.1 channel, registering low temperature• 120 VAC power to PLC failed (e.g. breaker CB-5 tripped)• Cooling water supply failed• Solenoid valve stuck shut• Open wire fault between solenoid valve and PLC output card
148
Answer 37
Here are the two formulae you need to begin with:
R = 1000(1 + 0.00385T )
V = Vsource
(
R
Rtotal
)
In this particular application, we can “flesh out” the voltage divider formula a bit more with numericalvalues:
V = 5
(
3300
3300 + R
)
After combining and manipulating these two formulae, your final formula should look something likethis:
T =4300V − 5000
19.25 − 3.85V
Answer 38
The voltmeter’s indication of 0.089 millivolts is the difference between the measurement junction’stemperature and the ambient temperature of the control room (58 oF). Since the millivoltage for a type Kthermocouple at 58 degrees F is 0.575 mV, and the thermocouple’s temperature is 0.089 mV greater thanthat, the thermocouple must be outputting 0.664 mV, which equates to 62 degrees F.
As for the amount of heat required to raise the engine to this new temperature, it is a matter of specificheat calculations: one incorporating the iron engine block’s mass and the water’s mass.
Q = mc∆T
Q = mironciron∆T + mwatercwater∆T
2.5 gallons of water is equivalent to 20.85 pounds of water. The temperature rise from 58 oF to 62 oFis 4 oF. Therefore:
Q = (300)(0.108)(4) + (20.85)(1)(4) = 213.0 BTU
149

Answer 39
In connecting a room-temperature voltmeter to the ends of the copper wire, we form two moretemperature gradients: one from freezing to room temperature, and the other from boiling to roomtemperature. Those gradients produce Seebeck voltages directly opposed to the Seebeck voltage across thelength of the copper wire, resulting in a complete cancellation and zero voltage registered by the voltmeter.
Copper wireCold end Hot end
0o F 212o F
Seebeck voltage
Warm end70o F
Warm end70o F
V
Voltmeter
Seebeck voltage Seebeck voltage
No voltage!
In other words, from one voltmeter lead to the other, we see a net temperature gradient of zero (fromroom temperature to room temperature) along the same material (copper), resulting in a net Seebeck voltageof zero.
A junction of two different metals, on the other hand, produces two unequal Seebeck voltages given thesame temperature gradient from end to end along each wire:
Copper wireHot end
Silver wire
Seebeck voltage (copper)
Seebeck voltage (silver)
Warm end
Warm end
We can measure the net Seebeck voltage between the two cold wire ends because they are both at thesame temperature as our meter leads. No temperature gradient exists at the connection point between thethermocouple leads and the meter leads, so no Seebeck voltage is generated here to add to the circuit’s netvoltage.
150

Answer 40
The indicator is wired backwards, and the RTD is connected to the wrong three terminals on thetransmitter. A corrected diagram is shown here:
Loop power
Sensor
Temperaturetransmitter
24 VDC power supply
Panel-mounted indicator
Temperature sensor Red
(4-20 mA input)
White
White
Answer 41
Answer 42
Answer 43
This is an automatic cooling system with high and low temperature alarms.
Answer 44
Answer 45
Answer 46
Answer 47
151

Answer 48
I won’t reveal the solution in its entirety here, but this problem essentially breaks down into a few simpleparts:
• Figuring out how much heat will be required to raise the solvent’s temperature• Figuing out how fast heat is delivered by the steam at the given mass flow rate• Dividing required heat (BTU) by heat rate (BTU/hr) to solve for time (hr)
Determining heat rate delivered by the steam is most easily done using a steam table.
Answer 49
T =4
√
√
√
√
(
dQdt
)
eσA
Answer 50
• 1600 oF ; Output = 19.09 mV
• 800 oC ; Output = 14.77 mV
• 1000 K ; Output = 11.14 mV
Answer 51
Fault Possible ImpossibleTSL contact failed open
√
TSL contact failed shorted√
TSH contact failed open√
TSH contact failed shorted√
TC-1 contact failed open√
TC-1 contact failed shorted√
TC-2 contact failed open√
TC-2 contact failed shorted√
TC relay coil failed open√
TC relay coil failed shorted√
Broken wire between points C and F√
Broken wire between points A and B√
A good test would be to disconnect the wire between points C and F to see if the cycling changes atall.
152

Answer 52
Fault Possible ImpossibleTT-37 miscalibrated (reading too low)
√
TT-37 miscalibrated (reading too high)√
TIC-37 in manual mode√
TIC-37 in auto mode√
FIC-38 in manual mode√
FIC-38 in auto mode√
FIC-38 in cascade mode√
FT-38 miscalibrated (reading too low)√
Answer 53
P = 1.422 atmospheres = 42.8 kPaG
Answer 54
The temperature should cycle between 250 and 285 degrees F, with the relay “latching” the heatingelement on even after the lower-temp switch contacts open. This is sometimes called a differential gap controlsystem because the process variable bounces back and forth within a “gap” established by two setpoint values.
If contact CR1 fails open, the relay cannot latch. Thus, the heater will turn off any time the lower-temperature switch trips. The result of this will be a much more rapid cycling, with the temperature centeredsomewhere around 250 degrees.
Answer 55
The thermocouple-based instrument’s indication will decrease by approximately 20o F, while the ClassV filled system’s indication will increase slightly.
153

Answer 56
A circuit to jog your memory on this concept is the noninverting summer, designed to sum (add) threeanalog voltage signals:
+−
+−
+−
−
+
R R R
R 2R
V1 V2 V3
Vout = V1 + V2 + V3
V1 + V2 + V3
3
At the noninverting input of the opamp is a set of three resistors functioning as a passive averager, toinput the average of the three sources’ voltage values to the opamp’s noninverting input. It is this “averaging”resistor network which has relevance to the thermocouple circuit shown in the question. Swamping resistorsare necessary to “even out” the otherwise disparate thermocouple wire resistances, so that the voltage signalreceived is a more fairly-weighted average that it would be otherwise.
If a swamping resistor happens to fail open, that thermocouple no longer has any effect on the average.In other words, the output voltage signal becomes the average of the remaining two thermocouples.
Answer 57
The WORM uses a long coil spring to maintain positive pressure contact between the sensor and thebottom of the thermowell.
Available sensor types include type J and K thermocouples, as well as 100 ohm and 1000 ohm platinumRTDs (both having α values of 0.00385) – shown on page 4.
Fastest thermocouple is the grounded-tip style, with a time constant of 2 seconds (page 4). By contrast,ungrounded thermocouples exhibit a typical time constant of 4.5 seconds.
RTD accuracy is stated as ± 0.12% at 0 oC (page 4). Typical thermocouple accuracies range plus orminus a couple of degrees Celsius.
154

Answer 58
Remember these simplifying assumptions of negative feedback opamp circuits:
• Negative feedback will force the output voltage to whatever value is necessary to maintain the differentialinput voltage at zero.
• Input terminals on the opamp(s) draw negligible current.
Voltages at TP1 and TP2 (with reference to ground) may be calculated simply by evaluating voltagedrops in the series RTD circuit. Voltage at TP3 with reference to ground will be identical to that at TP1,since the upper opamp simply functions as a voltage follower. TP5 is the output of this differential amplifiercircuit, representing the difference between potentials sensed at inputs TP1 and TP2 (i.e. the voltage droppedby the RTD). The reason why the output voltage is a negative quantity (with respect to ground) is becausethe differential amplifier’s noninverting input sees a lower voltage than its inverting input.
For each of the voltage calculations, you will need to reference an RTD table to find the proper RTDresistance values. While it is possible to use a formula to approximate RTD resistance based on temperature,a table will give you more accurate answers because a table accounts for all nonlinearities of the RTD, whilethe formula assumes a perfectly linear characteristic.
• Voltage at TP1 (VTP1), with RTD at 0o C (RRTD = 100.0 Ω) = 0.1524 V
• Voltage at TP2 (VTP2), with RTD at 10o F (RRTD = 95.21 Ω) = 0.0024 V (2.4 mV)
• Voltage at TP3 (VTP3), with RTD at 12o C (RRTD = 104.68 Ω) = 0.1594 V
• Voltage at TP5 (VTP5), with RTD at -20o C (RRTD = 92.16 Ω) = -0.1382 V
Answer 59
Answer 60
Answer 61
Answer 62
Partial answer:
This is definitely superheated steam, because its temperature is well above the boiling point for waterat 2500 PSIG (approximately 670 oF, as my steam table shows water at 2526 PSIA to boil at 670 oF).
Your calculated value for water flow rate should be 5.25 gallons per minute, or 43.79 pounds per minute.
Heat output = approximately 1249.9 horsepower per acre of collection area.
Answer 63
Answer 64
Heat transfer rate to kettle (assuming quantities given here in the question, not anywhere in the USCSBreport) is equal to 2987.1 BTU/minute.
155

Answer 65
As of this date (2018), TROUBLESHOOT is a program written in the ANSI ‘C’ language for a Unix-basedoperating system such as Linux. It runs within a “terminal” (text-only) environment which is why a printedcopy of the schematic diagram is necessary for the user to have. The program was written in this legacyformat in order to be extremely compact, executable on the smallest of computers (e.g. Raspberry Pi orBeaglebone single-board PCs).
If you wish to run this circuit troubleshooting software on your own personal computer, you may do soin the following ways:
• Install free Cygwin software on your Windows-based PC, under which you may compile and runTROUBLESHOOT. Cygwin is a Unix emulation program providing a POSIX-compliant environment onany Windows operating system in which Unix software may be installed, compiled, and executed. Thisis perhaps the easiest option for someone who wants to install TROUBLESHOOT on their Windows-basedcomputer but who does not wish to purchase anything or alter the operating system.
• Purchase your own single-board Linux-based PC such as a Raspberry Pi and run it natively on thatplatform.
• Install free SSH remote login software (such as BitVise) on your PC and then log into one of theInstrumentation lab’s Raspberry Pi servers where TROUBLESHOOT is already installed. This option isvery easy, but its major disadvantage is the need to be in or near the Instrumentation lab in order tohave wireless access to the servers – i.e. it’s not an option for you to run this software at home.
• Install and compile and run TROUBLESHOOT natively on an Apple PC with Unix-based operating system.• Install the Linux operating system on your own PC, then install and compile and run TROUBLESHOOT
natively.
TROUBLESHOOT is downloaded as a single “tar” file with a name such as tshoot 1v3.tar. The twonumbers and the “v” represent the version of that software (e.g. tshoot 1v3.tar is version 1.3 of theTROUBLESHOOT software). Obtain the latest version of the software, download it to a directory on yourcomputer accessible via a command-line “terminal” environment, and then enter the following commands tocompile this software:
tar xvf tshoot*tar
make
After running these commands, TROUBLESHOOT should be ready to use. Simply enter the followingcommand to begin execution:
./tshoot
156
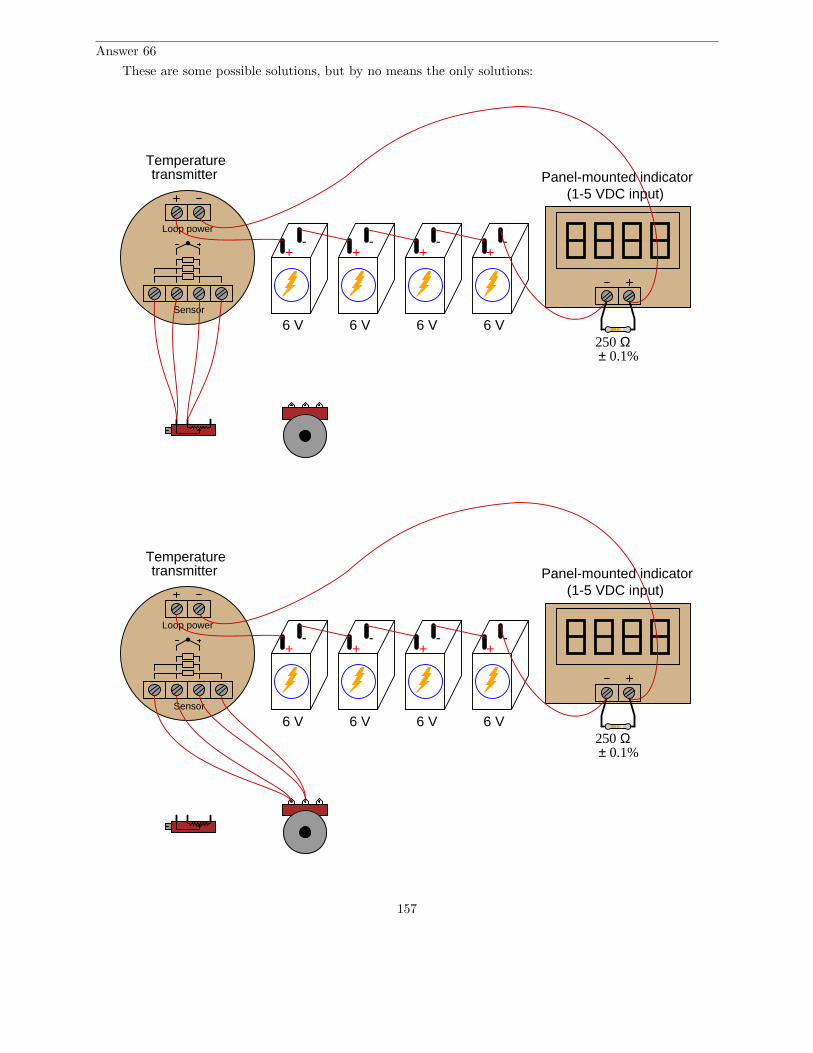
Answer 66
These are some possible solutions, but by no means the only solutions:
Loop power
Sensor
Temperaturetransmitter Panel-mounted indicator
(1-5 VDC input)
250 Ω± 0.1%
+-
+-
+-
6 V 6 V 6 V
+-
6 V
Loop power
Sensor
Temperaturetransmitter Panel-mounted indicator
(1-5 VDC input)
250 Ω± 0.1%
+-
+-
+-
6 V 6 V 6 V
+-
6 V
157
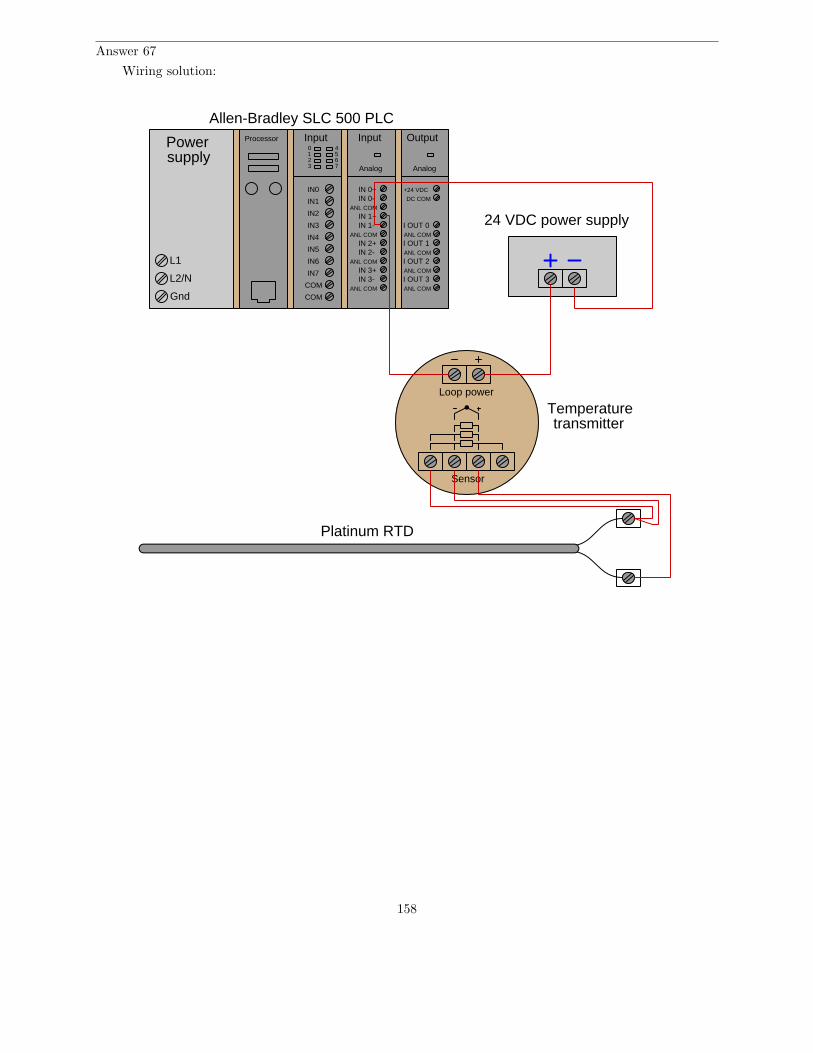
Answer 67
Wiring solution:
Processor Input0123
4567
IN0
IN1
IN2
IN3
IN4
IN5
IN6
IN7
COM
COM
Analog
Output
I OUT 0
I OUT 1
I OUT 2
I OUT 3ANL COM
ANL COM
ANL COM
ANL COM
+24 VDC
DC COM
Powersupply
L1
Gnd
L2/N
IN 0+IN 0-
IN 1+IN 1-
IN 2+IN 2-
IN 3+IN 3-
Input
Analog
ANL COM
ANL COM
ANL COM
ANL COM
Allen-Bradley SLC 500 PLC
Loop power
Sensor
Temperaturetransmitter
24 VDC power supply
Platinum RTD
158

Answer 68
This ranges shown here for split-ranging the two control valves do not constitute the only possible rangevalues that will work!
P IAS
Output range:4 to 20 mA
Input range: Output range:
Input range: Stem stroke:
PV
Output
Input LRV:Input URV:
A
P
Input range: Stem stroke:
B
Desired control valve sequencing:0% 100%50%
(open)(shut)
(shut) (open)
PT
PY
PV
PV
PV-A
PV-B
PIC
AI function blockXD_Scale: 0 to 100%L_Type: Indirect
AI function blockOUT_Scale:
Emerson DeltaV DCS
AO function blockPV_Scale: 0 to 100%
PID function blockPV_Scale:
IAS
PY
Input range: Output range:
0 kPa150 kPa
0 to 150 kPa 0 to 150 kPa
4 to 20 mA
4 to 20 mA
3 to 15 PSI
3 to 15 PSI
3 to 9 PSI 0 to 100% open
0 to 100% open9 to 15 PSI
A
B
Try to identify what other I/P and control valve positioner range values will also yield the desiredsplit-range sequencing.
Answer 69
Type J thermocouple: T = 469 oF
Type E thermocouple: T = 361 oC
Answer 70
Type S thermocouple: V = 15.037 mV
Type T thermocouple: V = 6.166 mV
Answer 71
This circuit only has one reference junction, if you count the two terminal connections at the indicator asa single junction. The junction mid-way between the thermocouple head and the indicator is not a referencejunction because it is not a junction of dissimilar metals.
159

Answer 72
• 0o F ; Potentiometer setting = -1.962 mV• 229o F ; Potentiometer setting = 4.707 mV• 454o F ; Potentiometer setting = 11.615 mV• 641o F ; Potentiometer setting = 17.370 mV
Answer 73
• VR1 will stay the same• VR2 will stay the same• VR3 will increase• VRTD will decrease• Explain the relationship between boiler pressure and boiler temperature:
Boiler pressure and boiler temperature are directly related: as pressure decreases, temperature alsodecreases.
Answer 74
The RTD would be the best choice, due to the superior linearity of this sensing element compared tothe others. Also, RTDs do not suffer the problem of reference junction compensation like thermocouples do,or the various mechanical sources of error like filled bulbs do.
160

Answer 75
The water injected in a desuperheating valve gains heat energy from the superheated let-downsteam, producing a greater volume of steam at a lower pressure (and lower temperature), much like anelectrical transformer steps down voltage with a corresponding increase in current. Desuperheaters exchangetemperature for volume, much like transformers exchange voltage for current (or vice-versa).
Challenge question: explain why turbines make efficient steam pressure let-down devices:
600 PSI header
150 PSI header
30 PSI header
Process
Power turbine
Condensate
Turbine
Process Process
Condensate
Heating
Condensate
Heating
Turbine
Using steam turbines as pressure let-down devices
161

Answer 76
First, let’s determine the polarity of the reference junction’s voltage, caused by a joining of constantan(C) and copper (Cu) wires at the lower terminal. Since we know that copper is the positive wire in a copper-constantan junction, we know that the polarity of the bottom terminal’s millivoltage will be positive on theright and negative on the left. The polarities are shown here both with +/- symbols and also with curvedarrows (the arrow tip being positive):
VoltmeterCu
Temperature indicatorinstrument
CuT
Cu
C
+ -+
- - +C Cu
To counter this millivoltage, the bridge circuit’s output must be positive on the left and negative on theright:
VoltmeterCu
Temperature indicatorinstrument
CuT
Cu
C
+ -+
- - +C Cu
We know that the warmer the reference junction becomes, the more voltage it will produce. Thus,the bridge must also produce more countering voltage as the thermistor increases in temperature. For theleft terminal of the bridge circuit to become more positive (and the right terminal, conversely, to becomemore negative), given a battery orientation that is positive “up” and negative “down,” the thermistor mustdecrease in value. Therefore, we need a thermistor that has a negative temperature coefficient.
Thermocouples still have value as primary sensing elements for temperature because their operatingtemperature range far exceeds that of thermistors, and they tend to be more rugged as well.
162

Answer 77
You will never realize the benefits of a four-wire RTD circuit until you actually use it as a four-wireRTD, not a glorified two-wire RTD as was the case with the original circuit!
Loop
RTD
+sense
-sense
+excit
-excit
RTD
Red
Wht
Wht
Red
(to indicator) This is the proper way to connect a four-wire RTD!
With the original circuit, wire resistance would not have been compensated for, leading to a zero shiftcalibration error. The transmitter would have “thought” the RTD was warmer than it actually was by theamount equivalent to the wires’ added resistance.
Interestingly, after this wiring error was identified, it was determined that it could not be correctedbecause it was part of a designed process at the biopharmaceutical facility and therefore all design details(including the incorrect wiring) were “locked” and could not be altered without an entire re-evaluation ofthe process. This is an example of a strict MOC (Management Of Change) policy where changes possiblyinfluential to the operation of a process must go through an extensive review before being implemented.
Answer 78
This is a direct force-balance instrument.
The upper temperature limit for the model 33 transmitter is only 1400 oF, with a maximum calibrationspan of 1000 oF (for the “A” model). This is on par with type J thermocouples, and hotter than type Tthermocouples. Most other thermocouple types, however, can measure temperatures greater than 1400 oF.
Calibration must be done by placing the sensing bulb inside an actual source of heat (e.g. sand bath,oil bath, dry block) and comparing its response against that of a trusted sensor inside the same heat source.
This is a Class III instrument, with helium being the fill gas of choice.
163

Answer 79
VBC = 5.326 mV VEH = 5.326 mV VFG = 7.111 mV (calculations based on RTD table)
An RTD table gives a resistance value of 15.217 ohms at 320 oF. The voltage VBC is simply the currentsource’s value multiplied by this RTD resistance, equal to 5.326 mV. The voltage VEH will be this exactsame value, because the wires A-E and D-H are merely sensing wires and carry no current (therefore sufferno voltage drop across their lengths).
The voltage drop VFG will be slightly larger, because wire resistance adds to RTD resistance to forma larger total resistance through which the 0.35 mA must flow. The total resistance here is 20.317 ohms,yielding a voltage drop of 7.111 mV.
As for wire colors, it doesn’t matter so long as the colors match for wires that are connected to eachother at the RTD. For example: red wires at terminals A and B, and white wires at terminals C and D.
Answer 80
A 2-hour power outage led to a 10-hour steam outage, causing coking operations to be shut down withone drum only 7% full. 37 hours later, operations attempted to drain the drum, not realizing how hotthe material inside was. Operators assumed that heat losses to ambient air would have provided sufficientcooling to ensure the drum would be safe to open. The hot hydrocarbon compounds ignited upon release,causing a major fire and 6 fatalities.
The temperature probes only measured drum skin temperature, not the temperature inside the drum.This is why they only registered 230 oF while the still-liquid mass inside the drum was in fact much hotter.The outer regions of the mass had cooled and solidified, which is what the probes registered. Operators,feeling the outside of the piping was cool, decided (wrongly) that the contents inside the drum were coolenough to safely drain.
In order for the temperature probes to have accurately measured temperature inside the core of thedrum, they would have had to extend further in. During normal operation, extended depth was not necessarybecause the entirety of the drum’s contents would be at a fairly uniform temperature. Only after an extendedoutage would a situation such as this develop, where the mass cooled and solidified on the outside, leavinga hot core of liquid insulated within.
Extended temperature probes would probably not be practical, because they would become damagedby the violent flow of hot oil into the drum, and also drilling operations removing solidified coke from thedrum. By necessity of longevity, the probes would have to be kept close to the wall of the drum where theywould be safe.
In a previous incident involving the emptying of partially-filled coke drums (in 1996), an internalinvestigation team recommended procedures be written for emptying partially-filled drums. No report waswritten, however, leading to the condition in 1998 where operations had to guess what to do. During the1996 incident, water had been injected into the coking drum prior to opening, with the result being a lotof material spewed out of the drum by steam pressure when the drum was opened. Water injection wasdecided to be too risky to attempt (!) in the 1998 incident, and so no water was injected for cooling effectthat latter time.
MOC procedures slow down the decision-making and upgrade processes at a facility, which translatesinto (potentially) lost production and therefore less profit. As an instrument technician with a knowledge ofphysics and chemistry and measurement technologies relevant to process safety, you stand in a critical rolein your ability to both comprehend and communicate dangers to other people at the facility.
Answer 81
This is a graded question – no answers or hints given!
164

Answer 82
This is a graded question – no answers or hints given!
Answer 83
This is a graded question – no answers or hints given!
Answer 84
This is a graded question – no answers or hints given!
Answer 85
This is a graded question – no answers or hints given!
Answer 86
This is a graded question – no answers or hints given!
Answer 87
This is a graded question – no answers or hints given!
Answer 88
This is a graded question – no answers or hints given!
Answer 89
This is a graded question – no answers or hints given!
Answer 90
This is a graded question – no answers or hints given!
Answer 91
Answer 92
Answer 93
Your loop diagram will be validated when the instructor inspects the loop with you and the rest of yourteam.
165


![100019.ppt [\254\333\256e\274\322\246\241]](https://static.fdokumen.com/doc/165x107/631ce499b8a98572c10d1be1/100019ppt-254333256e274322246241.jpg)


![Betty_Eng.ppt [\254\333\256e\274\322\246\241]](https://static.fdokumen.com/doc/165x107/6320bdd6aaa3e1b19f07a319/bettyengppt-254333256e274322246241.jpg)