INST 200 (Introduction to Instrumentation) - iBiblio
323
INST 200 (Introduction to Instrumentation) Lab Building a simple control loop: Questions 111 and 112, due by the end of day 5 Feedback questions Questions 101 through 110. “Feedback questions” serve as practice problems for upcoming exams and are completely optional. Your instructor will evaluate your answers and return detailed notes to you in response. Please submit them to your instructor at the end of day 5. Circuit Concepts Review Exam Day 1 – Complete mastery of these objectives due by the end of the quarter Specific objectives for the practice “mastery” exam: • Sketch wires connecting components together to form a circuit fulfilling a specified function (series vs. parallel connections, components as sources vs. loads) • Analyze a series-parallel DC resistor circuit (Ohm’s Law, Kirchhoff’s Laws) • Analyze a simple AC circuit (Ohm’s Law, reactance and impedance, Conservation of Energy) • Solve for a specified variable in an algebraic formula • Calculate side lengths and/or angles in a right triangle • Determine the possibility of suggested faults in a simple circuit given measured values (voltage, current), a schematic diagram, and reported symptoms (predicting the effects of shorts vs. opens) • Analyze a digital logic circuit (BJT/MOSFET transistor states, logic gate functions) Question 113 identifies resources for you to review these foundational circuit concepts Recommended daily schedule Day 1 Theory session: Introduction to second-year program objectives, values and expectations Questions 1 through 20; answer questions 1-4 in preparation for discussion which includes a thorough review of the INST standards.pdf document which will be quizzed throughout the INST200 course. Take INST200 mastery exam (first-year electric circuit concept review) Note: Print enough “INST standards.pdf” copies for all new students (double-sided). Note: Print enough INST200 mastery exams for all new students. Note: Print and hand out copies of FERPA forms to students. Note: Burn and distribute INSTREF flash drives and/or CD-ROMs to students. Note: Print and hand out copies of student login information for the campus wireless network. Note: Email all new students, so they will have something to reply to in fulfillment of their email lab objective. Note: Have electronic copy of calendar and grading spreadsheet files ready to show students. Lab session: Review INST200 mastery exam, review question 5 to read lab question 111, begin lab project construction Day 2 Problem-solving intro activity: review the mastery exam given on Day 1, showing students how to approach basic DC/AC/semiconductor circuit analysis. Theory session topic: General introduction to instrumentation and control systems Questions 21 through 40; answer questions 21-28 in preparation for discussion (remainder for practice) 1
-
Upload
khangminh22 -
Category
Documents
-
view
0 -
download
0
Transcript of INST 200 (Introduction to Instrumentation) - iBiblio

INST 200 (Introduction to Instrumentation)
Lab
Building a simple control loop: Questions 111 and 112, due by the end of day 5
Feedback questions
Questions 101 through 110. “Feedback questions” serve as practice problems for upcoming exams and arecompletely optional. Your instructor will evaluate your answers and return detailed notes to you in response.Please submit them to your instructor at the end of day 5.
Circuit Concepts Review Exam
Day 1 – Complete mastery of these objectives due by the end of the quarter
Specific objectives for the practice “mastery” exam:• Sketch wires connecting components together to form a circuit fulfilling a specified function (series vs.
parallel connections, components as sources vs. loads)• Analyze a series-parallel DC resistor circuit (Ohm’s Law, Kirchhoff’s Laws)• Analyze a simple AC circuit (Ohm’s Law, reactance and impedance, Conservation of Energy)• Solve for a specified variable in an algebraic formula• Calculate side lengths and/or angles in a right triangle• Determine the possibility of suggested faults in a simple circuit given measured values (voltage, current),
a schematic diagram, and reported symptoms (predicting the effects of shorts vs. opens)• Analyze a digital logic circuit (BJT/MOSFET transistor states, logic gate functions)
Question 113 identifies resources for you to review these foundational circuit concepts
Recommended daily schedule
Day 1
Theory session: Introduction to second-year program objectives, values and expectations
Questions 1 through 20; answer questions 1-4 in preparation for discussion which includes a thorough reviewof the INST standards.pdf document which will be quizzed throughout the INST200 course.
Take INST200 mastery exam (first-year electric circuit concept review)
Note: Print enough “INST standards.pdf” copies for all new students (double-sided).Note: Print enough INST200 mastery exams for all new students.Note: Print and hand out copies of FERPA forms to students.Note: Burn and distribute INSTREF flash drives and/or CD-ROMs to students.Note: Print and hand out copies of student login information for the campus wireless network.Note: Email all new students, so they will have something to reply to in fulfillment of their email labobjective.Note: Have electronic copy of calendar and grading spreadsheet files ready to show students.
Lab session: Review INST200 mastery exam, review question 5 to read lab question 111, begin lab projectconstruction
Day 2
Problem-solving intro activity: review the mastery exam given on Day 1, showing students how toapproach basic DC/AC/semiconductor circuit analysis.
Theory session topic: General introduction to instrumentation and control systems
Questions 21 through 40; answer questions 21-28 in preparation for discussion (remainder for practice)
1

Day 3
Problem-solving intro activity: practice DC circuit sketching, by solving some of the initial problemsin the Pictorial Circuit Diagrams practice worksheet. Mention to students that practically every exam willcontain a circuit-sketching exercise, because the skill of figuring out necessary wire connections is so vitallyimportant! Identify sources versus loads, then label voltage drops and current directions, then sketch theproper wire connections.
Theory session topic: Analog electronic and HART instruments, signals
Questions 41 through 60; answer questions 41-49 in preparation for discussion (remainder for practice)
Note: Students will need access to loop-building components (4-20 mA differential pressure transmitters,batteries, terminal strips, resistors, diodes, etc.) in order to complete the exercises. Be sure to provide atleast a few “smart” transmitters, HART communicators, and loop calibrators for the exercises as well. Ifpossible, bring some clamp-on milliammeters to show students new ways of measuring loop current.
Day 4
Problem-solving intro activity: review the “Unity Fractions” subsection of the LIII textbook to see howto use dimensional analysis to convert between units of measurement.
Theory session topic: Standard diagrams for instrumentation ; Signal wiring and tube connections
Questions 61 through 80; answer questions 61-69 in preparation for discussion (remainder for practice)
Day 5
Problem-solving intro activity: review the “Limiting Cases” section of the LIII textbook to see how thisproblem-solving strategy applies to such applications as Wheatstone bridge circuits and filter circuits.
Theory session topic: Problem-solving
Questions 81 through 100; answer questions 81-87 in preparation for discussion (remainder for practice)
Feedback questions (101 through 110) are optional and may be submitted for review at the end of the day
2

How To . . .
Access the worksheets and textbook: go to the Socratic Instrumentation website located athttp://www.ibiblio.org/kuphaldt/socratic/sinst to find worksheets for every 2nd-year course sectionorganized by quarter, as well as both the latest “stable” and “development” versions of the Lessons InIndustrial Instrumentation textbook. Download and save these documents to your computer.
Maximize your learning: complete all homework before class starts, ready to be assessed as describedin the “Inverted Session Formats” pages. Use every minute of class and lab time productively. Follow allthe tips outlined in “Question 0” as well as your instructor’s advice. Make every reasonable effort to solveproblems on your own before seeking help.
Identify upcoming assignments and deadlines: read the first page of each course worksheet.
Relate course days to calendar dates: reference the calendar spreadsheet file (calendar.xlsx), foundon the BTC campus Y: network drive. A printed copy is posted in the Instrumentation classroom.
Locate industry documents assigned for reading: use the Instrumentation Reference provided byyour instructor (on CD-ROM and on the BTC campus Y: network drive). There you will find a file named00 index OPEN THIS FILE.html readable with any internet browser. Click on the “Quick-Start Links” toaccess assigned reading documents, organized per course, in the order they are assigned.
Study for the exams: Mastery exams assess specific skills critically important to your success, listed nearthe top of the front page of each course worksheet for your review. Familiarize yourself with this list and payclose attention when those topics appear in homework and practice problems. Proportional exams featureproblems you haven’t seen before that are solvable using general principles learned throughout the current andprevious courses, for which the only adequate preparation is independent problem-solving practice every day.Answer the “feedback questions” (practice exams) in each course section to hone your problem-solving skills,as these are similar in scope and complexity to proportional exams. Answer these feedback independently(i.e. no help from classmates) in order to most accurately assess your readiness.
Calculate course grades: download the “Course Grading Spreadsheet” (grades template.xlsx) fromthe Socratic Instrumentation website, or from the BTC campus Y: network drive. Enter your quiz scores,test scores, lab scores, and attendance data into this Excel spreadsheet and it will calculate your coursegrade. You may compare your calculated grades against your instructors’ records at any time.
Identify courses to register for: read the “Sequence” page found in each worksheet.
Receive extra instructor help: ask during lab time, or during class time, or by appointment.
Identify job openings: regularly monitor job-search websites. Set up informational interviews atworkplaces you are interested in. Participate in jobshadows and internships. Apply to jobs long beforegraduation, as some employers take months to respond! Check your BTC email account daily, because yourinstructor broadcast-emails job postings to all students as employers submit them to BTC.
Impress employers: sign the FERPA release form granting your instructors permission to share academicrecords, then make sure your performance is worth sharing. Document your project and problem-solvingexperiences for reference during interviews. Honor all your commitments.
Begin your career: participate in jobshadows and internships while in school to gain experience andreferences. Take the first Instrumentation job that pays the bills, and give that employer at least two yearsof good work to pay them back for the investment they have made in you. Employers look at delayedemployment, as well as short employment spans, very negatively. Failure to pass a drug test is an immediatedisqualifier, as is falsifying any information. Criminal records may also be a problem.
file howto
3

General Values, Expectations, and Standards
Success in this career requires professional integrity, resourcefulness, persistence, close attention to detail,and intellectual curiosity. If you are ever in doubt as to the values you should embody, just ask yourselfwhat kind of a person you would prefer to hire for your own enterprise. Those same values will be upheldwithin this program.
Learning is the top priority in this program. Every circumstance, every incident, every day will be treatedas a learning opportunity, every mistake as a “teachable moment”. Every form of positive growth, not justacademic ability, will be regarded as real learning.
Responsibility means ensuring the desired outcome, not just trying to achieve the outcome. If your effortsdo not yield the expected results, only you can make it right.
Integrity means being honest and forthright in all your words and actions, doing your very best every timeand never taking credit for the achievement of another.
Safety means doing every job correctly and ensuring others are not endangered.
Diligence means exercising self-discipline and persistence in your studies, realizing that hard work is anecessary condition for success. This means, among other things, investing the necessary time and effort instudying, reading instructions, paying attention to details, utilizing the skills and tools you already possess,and avoiding shortcuts.
Mastery means the job is not done until it is done correctly: all objectives achieved, all problems solved,all documentation complete, and no errors remaining.
Self-management means allocating your resources (time, equipment, labor) wisely, and not just focusingon the nearest deadline.
Communication means clearly conveying your thoughts and paying attention to what others convey.Remember that no one can read your mind, and so it is incumbent upon you to communicate any andall important information.
Teamwork means working constructively with your classmates so as to maximize their learning as well asyour own.
Initiative means recognizing needs and taking action to meet those needs without encouragement ordirection from others.
Representation means your actions are a reflection of this program and not just of yourself. Doors ofopportunity for all BTC graduates may be opened or closed by your own conduct. Unprofessional behaviorduring tours, jobshadows, internships, and/or jobs reflects poorly on the program and will negatively biasemployers.
Trustworthiness is the result of consistently exercising these values: people will recognize you as someonethey can rely on to get the job done, and therefore someone they would want to hire.
Respect means acknowledging the intrinsic value, capabilities, and responsibilities of those around you.Respect may be gained by consistent demonstration of valued behaviors, and it may be lost through betrayalof trust.
4
General Values, Expectations, and Standards (continued)
Punctuality and Attendance: late arrivals are penalized at a rate of 1% grade deduction per incident.Absence is penalized at a rate of 1% per hour (rounded to the nearest hour) except when employment-related,school-related, weather-related, or required by law (e.g. court summons). Absences may be made up bydirecting the instructor to apply “sick hours” (12 hours of sick time available per quarter). Classmates maydonate their unused sick hours. Sick hours may not be applied to unannounced absences, so be sure to alertyour instructor and teammates as soon as you know you will be absent or late. Absence on an exam daywill result in a zero score for that exam, unless due to a documented emergency.
Mastery: any assignment or objective labeled as “mastery” must be completed with 100% competence(with multiple opportunities to re-try). Failure to complete any mastery objective(s) by the deadline datecaps your grade at a C−. Failure to complete by the end of the next school day results in a failing (F) gradefor that course.
Time Management: Frivolous activities (e.g. games, social networking, internet surfing) are unacceptablewhen work is unfinished. Trips to the cafeteria for food or coffee, smoke breaks, etc. must not interfere withteam participation.
Orderliness: Keep your work area clean and orderly, discarding trash, returning tools at the end of everylab session, and participating in all scheduled lab clean-up sessions. Project wiring, especially in shared areassuch as junction boxes, must not be left in disarray at the end of a lab shift. Label any failed equipmentwith a detailed description of its symptoms.
Independent Study: the “inverted” instructional model used in this program requires independent readingand problem-solving, where every student must demonstrate their learning at the start of the class session.Question 0 of every worksheet lists practical study tips. The “Inverted Session Formats” pages found inevery worksheet outline the format and grading standards for inverted class sessions.
Independent Problem-Solving: make an honest effort to solve every problem before seeking help. Whenworking in the lab, help will not be given to you unless and until you run your own diagnostic tests.
Teamwork: inform your teammates if you need to leave the work area for any reason. Any student regularlycompromising team performance through absence, tardiness, disrespect, or other disruptive behavior(s) willbe removed from the team and required to complete all labwork individually. The same is true for studentsfound inappropriately relying on teammates.
Communication: check your email account daily for important messages from your instructor. Ask theinstructor to clarify any assignment or exam question you find confusing, and be sure to do so express yourwork clearly and compellingly.
Academic Progress: your instructor will record your academic achievement, as well as comments on anynegative behavior, and will share all these records with employers provided you have signed the FERPArelease form. You are welcome to see these records at any time, and are encouraged to track your ownacademic progress using the grade spreadsheet template.
Office Hours: your instructor’s office hours are by appointment, except in cases of emergency. Email is thepreferred method for setting up an appointment with your instructor to discuss something in private.
Grounds for Failure: a failing (F) grade will be earned in any course if any mastery objectives are pastdeadline by more than one school day, or if any of the following behaviors are demonstrated: false testimony(lying) to your instructor, cheating on any assignment or assessment, plagiarism (presenting another’s workas your own), willful violation of a safety policy, theft, harassment, intoxication, or destruction of property.Such behaviors are grounds for immediate termination in this career, and as such will not be tolerated here.
file values
5

Inverted session formats
The basic concept of an “inverted” learning environment is that the traditional allocations of studenttime are reversed: instead of students attending an instructor-led session to receive new information and thenpracticing the application of that information outside of the classroom in the form of homework, studentsin an inverted class encounter new information outside of the classroom via homework and apply thatinformation in the classroom session under the instructor’s tutelage.
A natural question for instructors, then, is what their precise role is in an inverted classroom and howto organize that time well. Here I will list alternate formats suitable for an inverted classroom session, eachof them tested and proven to work.
Small sessions
Students meet with instructors in small groups for short time periods. Groups of 4 students meeting for30 minutes works very well, but groups as large as 8 students apiece may be used if time is limited. Each ofthese sessions begins with a 5 to 10 minute graded inspection of homework with individual questioning, tokeep students accountable for doing the homework. The remainder of the session is a dialogue focusing onthe topics of the day, the instructor challenging each student on the subject matter in Socratic fashion, andalso answering students’ questions. A second grade measures each student’s comprehension of the subjectmatter by the end of the session.
This format also works via teleconferencing, for students unable to attend a face-to-face session oncampus.
Large sessions
Students meet with instructors in a standard classroom (normal class size and period length). Eachof these sessions begins with a 10 minute graded quiz (closed-book) on the homework topic(s), to keepstudents accountable for doing the homework. Students may leave the session as soon as they “check off”with the instructor in a Socratic dialogue as described above (instructor challenging each student to assesstheir comprehension, answering questions, and grading the responses). Students sign up for check-off on thewhiteboard when they are ready, typically in groups of no more than 4. Alternatively, the bulk of the classsession may be spent answering student questions in small groups, followed by another graded quiz at theend.
Correspondence
This format works for students unable to attend a “face-to-face” session, and who must correspond withthe instructor via email or other asynchronous medium. Each student submits a thorough presentation oftheir completed homework, which the instructor grades for completeness and accuracy. The instructor thenreplies back to the student with challenge questions, and also answers questions the student may have. Aswith the previous formats, the student receives another grade assessing their comprehension of the subjectmatter by the close of the correspondence dialogue.
In all formats, students are held accountable for completion of their homework, “completion” beingdefined as successfully interpreting the given information from source material (e.g. accurate outlines ofreading or video assignments) and constructive effort to solve given problems. It must be understood in aninverted learning environment that students will have legitimate questions following a homework assignment,and that it is therefore unreasonable to expect mastery of the assigned subject matter. What is reasonable toexpect from each and every student is a basic outline of the source material (reading or video assignments)complete with major terms defined and major concepts identified, plus a good-faith effort to solve everyproblem. Question 0 (contained in every worksheet) lists multiple strategies for effective study and problem-solving.
6

Inverted session formats (continued)
Sample rubric for pre-assessments
• No credit = Any homework question unattempted (i.e. no effort shown on one or more questions)• Half credit = Misconception(s) on any major topic explained in the assigned reading; answers shown
with no supporting work; unable to explain the reading outline or solution methods represented inwritten work; failure to follow clear instruction(s)
• Full credit = Every homework question answered, with any points of confusion clearly articulated; allimportant concepts from reading assignments accurately expressed in the written outline and clearlyarticulated when called upon by the instructor to explain
The minimum expectation at the start of every student-instructor session is that all students have madea good-faith effort to complete 100% of their assigned homework. This does not necessarily mean all answerswill be correct, or that all concepts are fully understood, because one of the purposes of the meeting betweenstudents and instructor is to correct remaining misconceptions and answer students’ questions. However,experience has shown that without accountability for the homework, a substantial number of students willnot put forth their best effort and that this compromises the whole learning process. Full credit is reservedfor good-faith effort, where each student thoughtfully applies the study and problem-solving recommendationsgiven to them (see Question 0).
Sample rubric for post-assessments
• No credit = Failure to comprehend one or more key concepts; failure to apply logical reasoning to thesolution of problem(s)
• Half credit = Some misconceptions persist by the close of the session; problem-solving is inconsistent;limited contribution to the dialogue
• Full credit = Socratic queries answered thoughtfully; effective reasoning applied to problems; ideascommunicated clearly and accurately; responds intelligently to questions and statements made by othersin the session; adds new ideas and perspectives
The minimum expectation is that each and every student engages with the instructor and with fellowstudents during the Socratic session: posing intelligent questions of their own, explaining their reasoningwhen challenged, and otherwise positively contributing to the discussion. Passive observation and listeningis not an option here – every student must be an active participant, contributing something original to everydialogue. If a student is confused about any concept or solution, it is their responsibility to ask questions andseek resolution.
If a student happens to be absent for a scheduled class session and is therefore unable to be assessedon that day’s study, they may schedule a time with the instructor to demonstrate their comprehension atsome later date (before the end of the quarter when grades must be submitted). These same standards ofperformance apply equally make-up assessments: either inspection of homework or a closed-book quiz forthe pre-assessment, and either a Socratic dialogue with the instructor or another closed-book quiz for thepost-assessment.
file format
7
Course Syllabus
INSTRUCTOR CONTACT INFORMATION:Tony Kuphaldt(360)-752-8477 [office phone](360)-752-7277 [fax][email protected]
DEPT/COURSE #: INST 200
CREDITS: 2 Lecture Hours: 11 Lab Hours: 22 Work-based Hours: 0
COURSE TITLE: Introduction to Instrumentation
COURSE DESCRIPTION: This course introduces you to the trade, terminology, and basic principlesof instrumentation. It is a preparatory course for any one of three sections within the second yearof Instrumentation: measurement, control, and systems, enabling you to begin your second year ofInstrumentation at the start of Fall, Winter, or Spring quarter. Prerequisite course: MATH&141(Precalculus 1) with a minimum grade of “C”, or instructor permission
COURSE OUTCOMES: Build and document a functioning control system, using industry-standard testequipment to measure and interpret signals within that system.
COURSE OUTCOME ASSESSMENT: Each student must demonstrate mastery (100% competence)in the construction, documentation, and testing of a functional control loop in the lab. Failure to meet allmastery standards by the next scheduled exam day will result in a failing grade for the course.
STUDENT PERFORMANCE OBJECTIVES:• In a team environment and with full access to references, notes, and instructor assistance, perform the
following objectives with 100% accuracy (mastery). Multiple re-tries are allowed on mastery (100%accuracy) objectives:→ Communicate effectively with teammates to plan work, arrange for absences, and share responsibilitiesin completing all labwork→ Construct and commission a working pressure control “loop” consisting of pressure transmitter, PIDcontroller, and final control element (e.g. control valve)→ Generate an accurate loop diagram compliant with ISA standards documenting your team’s system,personally verified by the instructor→ Demonstrate proper assembly of NPT pipe fittings, personally verified by the instructor→ Demonstrate proper assembly of instrument tube fittings (e.g. Swagelok brand), personally verifiedby the instructor→ Demonstrate proper use of safety equipment and application of safe procedures while using powertools, and working on live systems
8

COURSE OUTLINE: A course calendar in electronic format (Excel spreadsheet) resides on the Y:network drive, and also in printed paper format in classroom DMC130, for convenient student access. Thiscalendar is updated to reflect schedule changes resulting from employer recruiting visits, interviews, andother impromptu events. Course worksheets provide comprehensive lists of all course assignments andactivities, with the first page outlining the schedule and sequencing of topics and assignment due dates.These worksheets are available in PDF format at http://www.ibiblio.org/kuphaldt/socratic/sinst
• INST200 Section 1: 5 days theory and labwork
METHODS OF INSTRUCTION: Course structure and methods are intentionally designed to developcritical-thinking and life-long learning abilities, continually placing the student in an active rather than apassive role.• Independent study: daily worksheet questions specify reading assignments, problems to solve, and
experiments to perform in preparation (before) classroom theory sessions. Open-note quizzes and workinspections ensure accountability for this essential preparatory work. The purpose of this is to conveyinformation and basic concepts, so valuable class time isn’t wasted transmitting bare facts, and also tofoster the independent research ability necessary for self-directed learning in your career.
• Classroom sessions: a combination of Socratic discussion, short lectures, small-group problem-solving,and hands-on demonstrations/experiments review and illuminate concepts covered in the preparatoryquestions. The purpose of this is to develop problem-solving skills, strengthen conceptual understanding,and practice both quantitative and qualitative analysis techniques.
• Lab activities: an emphasis on constructing and documenting working projects (real instrumentationand control systems) to illuminate theoretical knowledge with practical contexts. Special projectsoff-campus or in different areas of campus (e.g. BTC’s Fish Hatchery) are encouraged. Hands-ontroubleshooting exercises build diagnostic skills.
• Feedback questions: sets of practice problems at the end of each course section challenge yourknowledge and problem-solving ability in current as as well as first year (Electronics) subjects. Theseare optional assignments, counting neither for nor against your grade. Their purpose is to provide youand your instructor with direct feedback on what you have learned.
STUDENT ASSIGNMENTS/REQUIREMENTS: All assignments for this course are thoroughlydocumented in the following course worksheets located at:http://www.ibiblio.org/kuphaldt/socratic/sinst/index.html
• INST200 sec1.pdf
9

EVALUATION AND GRADING STANDARDS:• Mastery lab objectives = 50% of course grade• Lab questions = 25%• Daily quizzes = 25%• Tardiness penalty = −1% per incident (1 “free” tardy per course)• Attendance penalty = −1% per hour (12 hours “sick time” per quarter)• Extra credit = +5% per project (assigned by instructor based on individual learning needs)
All grades are criterion-referenced (i.e. no grading on a “curve”)
100% ≥ A ≥ 95% 95% > A- ≥ 90%90% > B+ ≥ 86% 86% > B ≥ 83% 83% > B- ≥ 80%80% > C+ ≥ 76% 76% > C ≥ 73% 73% > C- ≥ 70% (minimum passing course grade)70% > D+ ≥ 66% 66% > D ≥ 63% 63% > D- ≥ 60% 60% > F
If you fail a mastery exam, you must re-take a different version of that mastery exam on a different day.Multiple re-tries are allowed, on a different version of the exam each re-try. There is no penalty levied onyour course grade for re-taking mastery exams, but failure to successfully pass a mastery exam by the duedate will result in a failing grade (F) for the course.
If any other “mastery” objectives are not completed by their specified deadlines, your overall gradefor the course will be capped at 70% (C- grade), and you will have one more school day to complete theunfinished objectives. Failure to complete those mastery objectives by the end of that extra day (except inthe case of documented, unavoidable emergencies) will result in a failing grade (F) for the course.
“Lab questions” are assessed in a written exam format, typically on the last scheduled day of the labproject. Grading is as follows: full credit for thorough, correct answers; half credit for partially correctanswers; and zero credit for major conceptual errors.
Individual preparation for Socratic dialogue sessions is measured by a “prep quiz” and/or personalinspection of your work by the instructor. A second (“summary”) quiz score for every Socratic session marksyour participatory dialogue and ability to give reasoned answers to challenge questions on that session’stopic(s). In the event of absence, these scores may be credited by having your preparatory work anddemonstration of understanding reviewed at any time before the end of the quarter in a one-on-one dialoguewith the instructor.
Extra credit opportunities exist for each course, and may be assigned to students upon request. Thestudent and the instructor will first review the student’s performance on feedback questions, homework,exams, and any other relevant indicators in order to identify areas of conceptual or practical weakness. Then,both will work together to select an appropriate extra credit activity focusing on those identified weaknesses,for the purpose of strengthening the student’s competence. A due date will be assigned (typically two weeksfollowing the request), which must be honored in order for any credit to be earned from the activity. Extracredit may be denied at the instructor’s discretion if the student has not invested the necessary preparatoryeffort to perform well (e.g. lack of preparation for daily class sessions, poor attendance, no feedback questionssubmitted, etc.).
10

REQUIRED STUDENT SUPPLIES AND MATERIALS:• Course worksheets available for download in PDF format• Lessons in Industrial Instrumentation textbook, available for download in PDF format
→ Access worksheets and book at: http://www.ibiblio.org/kuphaldt/socratic/sinst• Spiral-bound notebook for reading annotation, homework documentation, and note-taking.• Instrumentation reference CD-ROM (free, from instructor). This disk contains many tutorials and
datasheets in PDF format to supplement your textbook(s).• Tool kit (see detailed list)• Simple scientific calculator (non-programmable, non-graphing, no unit conversions, no numeration
system conversions), TI-30Xa or TI-30XIIS recommended• Portable personal computer with Ethernet port and wireless. Windows OS strongly preferred, tablets
discouraged.
file INST200syllabus
11

Sequence of second-year Instrumentation courses
INST 240 -- 6 crPressure/Level Measurement
INST 241 -- 6 crTemp./Flow Measurement
INST 242 -- 5 crAnalytical Measurement
INST 250 -- 5 cr
INST 251 -- 5 crPID Control
Final Control Elements
Loop TuningINST 252 -- 4 cr
Data Acquisition Systems
INST 262 -- 5 crDCS and Fieldbus
INST 263 -- 5 crControl Strategies
Fall quarter Winter quarter Spring quarterSummer quarter
Offered 1st week ofINST 200 -- 1 wkIntro. to Instrumentation
Job Prep I
Job Prep II
INST 205 -- 1 cr
INST 206 -- 1 cr
INST25x, and INST26x coursesPrerequisite for all INST24x, Fall, Winter, and
Spring quarters
Offered 1st week ofFall, Winter, andSpring quarters
INST 260 -- 4 cr
CAD 1: Basics
including MATH 141 (Precalculus 1)Core Electronics -- 3 qtrs
Prerequisite for INST206
(Only if 4th quarter was Summer: INST23x)
All coursescompleted? No
Yes
Graduate!!!
Protective Relays (elective)
CHEM&161 -- 5 crChemistry
ENGT 134 -- 5 cr
recommended
INST 233 -- 4 cr
Jobshadow and/orInternship strongly
12

The particular sequence of courses you take during the second year depends on when you complete allfirst-year courses and enter the second year. Since students enter the second year of Instrumentation at fourdifferent times (beginnings of Summer, Fall, Winter, and Spring quarters), the particular course sequencefor any student will likely be different from the course sequence of classmates.
Some second-year courses are only offered in particular quarters with those quarters not having to bein sequence, while others are offered three out of the four quarters and must be taken in sequence. Thefollowing layout shows four typical course sequences for second-year Instrumentation students, depending onwhen they first enter the second year of the program:
INST 240 -- 6 crPressure/Level Measurement
INST 241 -- 6 crTemp./Flow Measurement
INST 242 -- 5 crAnalytical Measurement
Fall quarter
INST 200 -- 1 wkIntro. to Instrumentation
Winter quarter
Job Prep IINST 205 -- 1 cr
INST 250 -- 5 crFinal Control Elements
INST 251 -- 5 crPID Control
Loop TuningINST 252 -- 4 cr
Job Prep IIINST 206 -- 1 cr
Spring quarter
Data Acquisition SystemsINST 260 -- 4 cr
INST 262 -- 5 crDCS and Fieldbus
INST 263 -- 5 crControl Strategies
CAD 1: Basics
Graduation!
Possible course schedules depending on date of entry into 2nd year
INST 240 -- 6 crPressure/Level Measurement
INST 241 -- 6 crTemp./Flow Measurement
INST 242 -- 5 crAnalytical Measurement
Fall quarter
INST 200 -- 1 wkIntro. to Instrumentation
Winter quarter
Job Prep IINST 205 -- 1 cr
INST 250 -- 5 crFinal Control Elements
INST 251 -- 5 crPID Control
Loop TuningINST 252 -- 4 cr
Job Prep IIINST 206 -- 1 cr
Spring quarter
Data Acquisition SystemsINST 260 -- 4 cr
INST 262 -- 5 crDCS and Fieldbus
INST 263 -- 5 crControl Strategies
CAD 1: Basics
Graduation!
INST 240 -- 6 crPressure/Level Measurement
INST 241 -- 6 crTemp./Flow Measurement
INST 242 -- 5 crAnalytical Measurement
Fall quarter
Winter quarter
INST 250 -- 5 crFinal Control Elements
INST 251 -- 5 crPID Control
Loop TuningINST 252 -- 4 cr
Spring quarter
Data Acquisition SystemsINST 260 -- 4 cr
INST 262 -- 5 crDCS and Fieldbus
INST 263 -- 5 crControl Strategies
CAD 1: Basics
Graduation!
INST 200 -- 1 wkIntro. to Instrumentation
Job Prep IINST 205 -- 1 cr
Job Prep IIINST 206 -- 1 cr
INST 200 -- 1 wkIntro. to Instrumentation
Job Prep IINST 205 -- 1 cr
Job Prep IIINST 206 -- 1 cr
Sept.
Dec.
Jan.
Mar.
April
June
Sept.
Dec.
Jan.
Mar.
April
June
Jan.
Mar.
April
June
Sept.
Dec.
April
June
Sept.
Dec.
Jan.
Mar.
Beginning in Summer Beginning in Fall Beginning in Winter Beginning in Spring
CHEM&161 -- 5 crChemistry
CHEM&161 -- 5 crChemistry
CHEM&161 -- 5 crChemistry
CHEM&161 -- 5 crChemistry
July
Aug.
July
July
Summer quarterJuly
Protective Relays (elective)
Aug.
Aug.
Aug.
ENGT 134 -- 5 cr
ENGT 134 -- 5 cr
ENGT 134 -- 5 cr
ENGT 134 -- 5 cr
INST 233 -- 4 cr
Jobshadow and/orInternship strongly
recommended
Summer quarter
Protective Relays (elective)
INST 233 -- 4 cr
Jobshadow and/orInternship strongly
recommended
Summer quarter
Protective Relays (elective)
INST 233 -- 4 cr
Jobshadow and/orInternship strongly
recommended
Summer quarter
Protective Relays (elective)
INST 233 -- 4 cr
Jobshadow and/orInternship strongly
recommended
file sequence
13

General tool and supply list
Wrenches• Combination (box- and open-end) wrench set, 1/4” to 3/4” – the most important wrench sizes are 7/16”,
1/2”, 9/16”, and 5/8”; get these immediately!• Adjustable wrench, 6” handle (sometimes called “Crescent” wrench)• Hex wrench (“Allen” wrench) set, fractional – 1/16” to 3/8”• Optional: Hex wrench (“Allen” wrench) set, metric – 1.5 mm to 10 mm• Optional: Miniature combination wrench set, 3/32” to 1/4” (sometimes called an “ignition wrench” set)
Note: when turning any threaded fastener, one should choose a tool engaging the maximum amount ofsurface area on the fastener’s head in order to reduce stress on that fastener. (e.g. Using box-end wrenchesinstead of adjustable wrenches; using the proper size and type of screwdriver; never using any tool that marsthe fastener such as pliers or vise-grips unless absolutely necessary.)
Pliers• Needle-nose pliers• Tongue-and-groove pliers (sometimes called “Channel-lock” pliers)• Diagonal wire cutters (sometimes called “dikes”)
Screwdrivers• Slotted, 1/8” and 1/4” shaft• Phillips, #1 and #2• Jeweler’s screwdriver set• Optional: Magnetic multi-bit screwdriver (e.g. Klein Tools model 70035)
Electrical• Multimeter, Fluke model 87-IV or better• Alligator-clip jumper wires• Soldering iron (10 to 40 watt) and rosin-core solder• Resistor, potentiometer, diode assortments (from first-year lab kits)• Package of insulated compression-style fork terminals (14 to 18 AWG wire size, #10 stud size)• Wire strippers/terminal crimpers for 10 AWG to 18 AWG wire and insulated terminals• Optional: ratcheting terminal crimp tool (e.g. Paladin 1305, Ferrules Direct FDT10011, or equivalent)
Safety• Safety glasses or goggles (available at BTC bookstore)• Earplugs (available at BTC bookstore)
Miscellaneous• Simple scientific calculator (non-programmable, non-graphing, no conversions), TI-30Xa or TI-30XIIS
recommended. Required for some exams! Demonstrate to each and every student how to usethe memory functions (STO, RCL) on their calculators!
• Portable personal computer with Ethernet port and wireless. Windows OS strongly preferred, tabletsdiscouraged.
• Masking tape (for making temporary labels)• Permanent marker pen• Teflon pipe tape• Utility knife• Tape measure, 12 feet minimum• Flashlight
An inexpensive source of tools is your local pawn shop. Look for tools with unlimited lifetime guarantees(e.g. Sears “Craftsman” brand). Check for BTC student discounts as well!
14

file tools
15

Methods of instruction
This course develops self-instructional and diagnostic skills by placing students in situations where theyare required to research and think independently. In all portions of the curriculum, the goal is to avoid apassive learning environment, favoring instead active engagement of the learner through reading, reflection,problem-solving, and experimental activities. The curriculum may be roughly divided into two portions:theory and practical.
TheoryIn the theory portion of each course, students independently research subjects prior to entering the
classroom for discussion. This means working through all the day’s assigned questions as completely aspossible. This usually requires a fair amount of technical reading, and may also require setting up andrunning simple experiments. At the start of the classroom session, the instructor will check each student’spreparation with a quiz. Students then spend the rest of the classroom time working in groups and directlywith the instructor to thoroughly answer all questions assigned for that day, articulate problem-solvingstrategies, and to approach the questions from multiple perspectives. To put it simply: fact-gatheringhappens outside of class and is the individual responsibility of each student, so that class time may bedevoted to the more complex tasks of critical thinking and problem solving where the instructor’s attentionis best applied.
Classroom theory sessions usually begin with either a brief Q&A discussion or with a “VirtualTroubleshooting” session where the instructor shows one of the day’s diagnostic question diagrams whilestudents propose diagnostic tests and the instructor tells those students what the test results would begiven some imagined (“virtual”) fault scenario, writing the test results on the board where all can see. Thestudents then attempt to identify the nature and location of the fault, based on the test results.
Each student is free to leave the classroom when they have completely worked through all problems andhave answered a “summary” quiz designed to gauge their learning during the theory session. If a studentfinishes ahead of time, they are free to leave, or may help tutor classmates who need extra help.
The express goal of this “inverted classroom” teaching methodology is to help each student cultivatecritical-thinking and problem-solving skills, and to sharpen their abilities as independent learners. Whilethis approach may be very new to you, it is more realistic and beneficial to the type of work done ininstrumentation, where critical thinking, problem-solving, and independent learning are “must-have” skills.
Quizzes are an effective tool for preparation assessment. “Prep” quizzes should be simpleand concept-related (not too many quantitative calculations). The goal is to test whetheror not students have spent significant time researching the material, not necessarily theirmastery of it. Each quiz should be designed so that any hard-working student should be ableto get it right even if they have not yet mastered the concept. Since each student is stronglyencouraged to keep a notebook for reading annotation, answering of assigned questions, andclassroom notes, each student may reference their notebook while taking the quizzes.
Quizzes also work well at the end of each classroom session to assess student engagementduring discussion. I recommend making these “Summary” quizzes more challenging than thehomework preparation quizzes.
16
SOCRATIC DIALOGUE TIPS FOR THE INSTRUCTOR:• Ask students to demonstrate how they applied specific tips listed in Question 0 to the
subject and/or problems at hand.• Ask students to articulate the principles applicable to the subject and/or problems at
hand. Most students exhibit the tendency to focus on procedures rather than principles,which is why they struggle at solving novel problems. One of your main tasks as aninstructor is to get them thinking in terms of general principles, asking “why” questionsinstead of “how” or “what” questions.
• Have students use the whiteboard to post questions they or their group has on specificproblems. This allows other students to see where their classmates need help, encouragingpeer tutoring.
• Pose “thought experiment” problems, asking students to predict what will happen in ascenario if some variable is changed.
• Pose “Virtual Troubleshooting” problems, asking students to specify tests they would doon a faulted system to identify the problem. The instructor’s role during this type ofexercise is to keep a fault scenario in mind while replying to students what the result(s)of each test would be. Ask students what each test result tells them about the natureand location of the fault, and also ask them what it would mean if the test result(s) weredifferent.
• If students get “stuck” during a large-group discussion, have all the students break intoteams of 2 or 3 to share solution ideas to the problem (or to a similar problem posedSocratically by the instructor). This almost never fails to resolve the difficulty and re-start the classroom dialogue.
• Another way to help students get “un-stuck” on a problem is to slowly and silently solvethe problem yourself on the whiteboard (or on paper in a small group), pausing after eachstep to give students time to analyze your steps and explain to you the rationale behindeach one.
• Ask student teams to write their explanation of a concept in their own words or to explainusing their own diagrams, then ask other student teams to critique those explanations.The goal here is to identify ways to improve each explanation, because there is always away to improve something!
17

LabIn the lab portion of each course, students work in teams to install, configure, document, calibrate, and
troubleshoot working instrument loop systems. Each lab exercise focuses on a different type of instrument,with a eight-day period typically allotted for completion. An ordinary lab session might look like this:
(1) Start of practical (lab) session: announcements and planning(a) The instructor makes general announcements to all students(b) The instructor works with team to plan that day’s goals, making sure each team member has a
clear idea of what they should accomplish(2) Teams work on lab unit completion according to recommended schedule:
(First day) Select and bench-test instrument(s)(One day) Connect instrument(s) into a complete loop(One day) Each team member drafts their own loop documentation, inspection done as a team (withinstructor)(One or two days) Each team member calibrates/configures the instrument(s)(Remaining days, up to last) Each team member troubleshoots the instrument loop
(3) End of practical (lab) session: debriefing where each team reports on their work to the whole class
Troubleshooting assessments must meet the following guidelines:
• Troubleshooting must be performed on a system the student did not build themselves. This forcesstudents to rely on another team’s documentation rather than their own memory of how the system wasbuilt.
• Each student must individually demonstrate proper troubleshooting technique.• Simply finding the fault is not good enough. Each student must consistently demonstrate sound
reasoning while troubleshooting.• If a student fails to properly diagnose the system fault, they must attempt (as many times as necessary)
with different scenarios until they do, reviewing any mistakes with the instructor after each failedattempt.
The same structure of having one student perform a task while the other members of theteam observe may also be applied to calibration. One student calibrates the instrument whilethe other members of the team observe the steps, take notes, and check instrument calibrationby calculating and/or sketching error percentages. This way, the observing students get towatch calibration technique(s), see how to operate the calibration equipment multiple times,and practice determining instrument calibration errors (e.g. zero shifts, span shifts, andnonlinearities) based on numerical data.
I strongly recommend having students work as a team to inspect their loop and loopdiagram accuracies. This is a much more time-efficient way to check their construction anddocumentation work than to inspect their loop diagrams individually. When all team membershave their loop diagrams complete, take those diagrams and do a “walk through” of the loop,inspecting quality of assembly and diagram accuracy. If any problems are noted, bring it tothe attention of the whole group and have them correct the problems before doing anotherwalk-through with you.
Lab questions are answered by students individually, and may be asked at any point alongthe lab exercise schedule where appropriate. The point of these questions is not just to measurestudent learning, but also to serve as a guide for students regarding the skills and conceptsthey should be mastering as they progress through the lab exercise.
file instructional
18

Distance delivery methods
Sometimes the demands of life prevent students from attending college 6 hours per day. In such cases,there exist alternatives to the normal 8:00 AM to 3:00 PM class/lab schedule, allowing students to completecoursework in non-traditional ways, at a “distance” from the college campus proper.
For such “distance” students, the same worksheets, lab activities, exams, and academic standards stillapply. Instead of working in small groups and in teams to complete theory and lab sections, though, studentsparticipating in an alternative fashion must do all the work themselves. Participation via teleconferencing,video- or audio-recorded small-group sessions, and such is encouraged and supported.
There is no recording of hours attended or tardiness for students participating in this manner. The paceof the course is likewise determined by the “distance” student. Experience has shown that it is a benefit for“distance” students to maintain the same pace as their on-campus classmates whenever possible.
In lieu of small-group activities and class discussions, comprehension of the theory portion of each coursewill be ensured by completing and submitting detailed answers for all worksheet questions, not just passingdaily quizzes as is the standard for conventional students. The instructor will discuss any incomplete and/orincorrect worksheet answers with the student, and ask that those questions be re-answered by the studentto correct any misunderstandings before moving on.
Labwork is perhaps the most difficult portion of the curriculum for a “distance” student to complete,since the equipment used in Instrumentation is typically too large and expensive to leave the school labfacility. “Distance” students must find a way to complete the required lab activities, either by arrangingtime in the school lab facility and/or completing activities on equivalent equipment outside of school (e.g.at their place of employment, if applicable). Labwork completed outside of school must be validated by asupervisor and/or documented via photograph or videorecording.
Conventional students may opt to switch to “distance” mode at any time. This has proven to be abenefit to students whose lives are disrupted by catastrophic events. Likewise, “distance” students mayswitch back to conventional mode if and when their schedules permit. Although the existence of alternativemodes of student participation is a great benefit for students with challenging schedules, it requires a greaterinvestment of time and a greater level of self-discipline than the traditional mode where the student attendsschool for 6 hours every day. No student should consider the “distance” mode of learning a way to havemore free time to themselves, because they will actually spend more time engaged in the coursework thanif they attend school on a regular schedule. It exists merely for the sake of those who cannot attend duringregular school hours, as an alternative to course withdrawal.
file distance
19

Metric prefixes and conversion constants
• Metric prefixes
• Yotta = 1024 Symbol: Y
• Zeta = 1021 Symbol: Z
• Exa = 1018 Symbol: E
• Peta = 1015 Symbol: P
• Tera = 1012 Symbol: T
• Giga = 109 Symbol: G
• Mega = 106 Symbol: M
• Kilo = 103 Symbol: k
• Hecto = 102 Symbol: h
• Deca = 101 Symbol: da
• Deci = 10−1 Symbol: d
• Centi = 10−2 Symbol: c
• Milli = 10−3 Symbol: m
• Micro = 10−6 Symbol: µ
• Nano = 10−9 Symbol: n
• Pico = 10−12 Symbol: p
• Femto = 10−15 Symbol: f
• Atto = 10−18 Symbol: a
• Zepto = 10−21 Symbol: z
• Yocto = 10−24 Symbol: y
1001031061091012 10-3 10-6 10-9 10-12(none)kilomegagigatera milli micro nano pico
kMGT m µ n p
10-210-1101102
deci centidecahectoh da d c
METRIC PREFIX SCALE
• Conversion formulae for temperature
• oF = (oC)(9/5) + 32
• oC = (oF - 32)(5/9)
• oR = oF + 459.67
• K = oC + 273.15
Conversion equivalencies for distance
1 inch (in) = 2.540000 centimeter (cm)
1 foot (ft) = 12 inches (in)
1 yard (yd) = 3 feet (ft)
1 mile (mi) = 5280 feet (ft)
20

Conversion equivalencies for volume
1 gallon (gal) = 231.0 cubic inches (in3) = 4 quarts (qt) = 8 pints (pt) = 128 fluid ounces (fl. oz.)= 3.7854 liters (l)
1 milliliter (ml) = 1 cubic centimeter (cm3)
Conversion equivalencies for velocity
1 mile per hour (mi/h) = 88 feet per minute (ft/m) = 1.46667 feet per second (ft/s) = 1.60934kilometer per hour (km/h) = 0.44704 meter per second (m/s) = 0.868976 knot (knot – international)
Conversion equivalencies for mass
1 pound (lbm) = 0.45359 kilogram (kg) = 0.031081 slugs
Conversion equivalencies for force
1 pound-force (lbf) = 4.44822 newton (N)
Conversion equivalencies for area
1 acre = 43560 square feet (ft2) = 4840 square yards (yd2) = 4046.86 square meters (m2)
Conversion equivalencies for common pressure units (either all gauge or all absolute)
1 pound per square inch (PSI) = 2.03602 inches of mercury (in. Hg) = 27.6799 inches of water (in.W.C.) = 6.894757 kilo-pascals (kPa) = 0.06894757 bar
1 bar = 100 kilo-pascals (kPa) = 14.504 pounds per square inch (PSI)
Conversion equivalencies for absolute pressure units (only)
1 atmosphere (Atm) = 14.7 pounds per square inch absolute (PSIA) = 101.325 kilo-pascals absolute(kPaA) = 1.01325 bar (bar) = 760 millimeters of mercury absolute (mmHgA) = 760 torr (torr)
Conversion equivalencies for energy or work
1 british thermal unit (Btu – “International Table”) = 251.996 calories (cal – “International Table”)= 1055.06 joules (J) = 1055.06 watt-seconds (W-s) = 0.293071 watt-hour (W-hr) = 1.05506 x 10¹⁰
ergs (erg) = 778.169 foot-pound-force (ft-lbf)
Conversion equivalencies for power
1 horsepower (hp – 550 ft-lbf/s) = 745.7 watts (W) = 2544.43 british thermal units per hour(Btu/hr) = 0.0760181 boiler horsepower (hp – boiler)
Acceleration of gravity (free fall), Earth standard
9.806650 meters per second per second (m/s2) = 32.1740 feet per second per second (ft/s2)
21

Physical constants
Speed of light in a vacuum (c) = 2.9979 × 10⁸ meters per second (m/s) = 186,281 miles per second(mi/s)
Avogadro’s number (NA) = 6.022 × 10²³ per mole (mol−1)
Electronic charge (e) = 1.602 × 10⁻¹⁹ Coulomb (C)
Boltzmann’s constant (k) = 1.38 × 10⁻²³ Joules per Kelvin (J/K)
Stefan-Boltzmann constant (σ) = 5.67 × 10⁻⁸ Watts per square meter-Kelvin4 (W/m2·K4)
Molar gas constant (R) = 8.314 Joules per mole-Kelvin (J/mol-K)
Properties of Water
Freezing point at sea level = 32oF = 0oC
Boiling point at sea level = 212oF = 100oC
Density of water at 4oC = 1000 kg/m3 = 1 g/cm3 = 1 kg/liter = 62.428 lb/ft3 = 1.94 slugs/ft3
Specific heat of water at 14oC = 1.00002 calories/g·oC = 1 BTU/lb·oF = 4.1869 Joules/g·oC
Specific heat of ice ≈ 0.5 calories/g·oC
Specific heat of steam ≈ 0.48 calories/g·oC
Absolute viscosity of water at 20oC = 1.0019 centipoise (cp) = 0.0010019 Pascal-seconds (Pa·s)
Surface tension of water (in contact with air) at 18oC = 73.05 dynes/cm
pH of pure water at 25o C = 7.0 (pH scale = 0 to 14)
Properties of Dry Air at sea level
Density of dry air at 20oC and 760 torr = 1.204 mg/cm3 = 1.204 kg/m3 = 0.075 lb/ft3 = 0.00235slugs/ft3
Absolute viscosity of dry air at 20oC and 760 torr = 0.018 centipoise (cp) = 1.8 × 10⁻⁵ Pascal-seconds (Pa·s)
file conversion constants
22
Question 0
How to get the most out of academic reading:• Articulate your thoughts as you read (i.e. “have a conversation” with the author). This will develop
metacognition: active supervision of your own thoughts. Write your thoughts as you read, notingpoints of agreement, disagreement, confusion, epiphanies, and connections between different conceptsor applications. These notes should also document important math formulae, explaining in your ownwords what each formula means and the proper units of measurement used.
• Outline, don’t highlight! Writing your own summary or outline is a far more effective way to comprehenda text than simply underlining and highlighting key words. A suggested ratio is one sentence of yourown thoughts per paragraph of text read. Note points of disagreement or confusion to explore later.
• Work through all mathematical exercises shown within the text, to ensure you understand all the steps.
• Imagine explaining concepts you’ve just learned to someone else. Teaching forces you to distill conceptsto their essence, thereby clarifying those concepts, revealing assumptions, and exposing misconceptions.Your goal is to create the simplest explanation that is still technically accurate.
• Write your own questions based on what you read, as though you are a teacher preparing to teststudents’ comprehension of the subject matter.
How to effectively problem-solve and troubleshoot:• Rely on principles, not procedures. Don’t be satisfied with memorizing steps – learn why those steps
work. Each one should make logical sense and have real-world meaning to you.
• Sketch a diagram to help visualize the problem. Sketch a graph showing how variables relate. Whenbuilding a real system, always prototype it on paper and analyze its function before constructing it.
• Identify what it is you need to solve, identify all relevant data, identify all units of measurement, identifyany general principles or formulae linking the given information to the solution, and then identify any“missing pieces” to a solution. Annotate all diagrams with this data.
• Perform “thought experiments” to explore the effects of different conditions for theoretical problems.When troubleshooting, perform diagnostic tests rather than just visually inspect for faults.
• Simplify the problem and solve that simplified problem to identify strategies applicable to the originalproblem (e.g. change quantitative to qualitative, or visa-versa; substitute easier numerical values;eliminate confusing details; add details to eliminate unknowns; consider simple limiting cases; apply ananalogy). Often you can add or remove components in a malfunctioning system to simplify it as welland better identify the nature and location of the problem.
• Work “backward” from a hypothetical solution to a new set of given conditions.
How to manage your time:• Avoid procrastination. Work now and play later, or else you will create trouble for yourself. Schedule
your work appropriate to the place you’re in as well: e.g. don’t waste lab time doing things that couldbe done anywhere else, when there is work to be done that requires the lab.
• Eliminate distractions. Kill your television and video games. Study in places where you can concentrate.
• Use your “in between” time productively. Don’t leave campus for lunch. Arrive to school early. If youfinish your assigned work early, begin working on the next assignment.
Above all, cultivate persistence. Persistent effort is necessary to master anything non-trivial. The keysto persistence are (1) having the desire to achieve that mastery, and (2) realizing challenges are normal andnot an indication of something gone wrong. A common error is to equate easy with effective: students oftenbelieve learning should be easy if everything is done right. The truth is that mastery never comes easy!
file question0
23

Suggestions for Socratic discussion following a reading assignment
• Show your outline of today’s reading (i.e. a summary written in your own words of what the text says).(Instructor: probe the students’ understanding in any areas you see under-represented in their outlines.)
• Identify which part(s) of the reading assignment make perfect sense to you.• Identify the most challenging part(s) of the reading assignment, and explain why.• Identify any part(s) of the reading assignment you found surprising, and why you found them so.
• Students and instructor both practice the “Think Aloud” active reading technique on a section ofparticularly challenging text. Instructor: this is where the reader reads out loud, verbalizing theirinterpretation of the text as they go. Model this for your students, demonstrating your own approach.
• Summarize the essence of today’s reading in one succinct paragraph.• Identify concepts in today’s reading that seemed non-intuitive, and explain why that was so.• Identify over-arching themes in today’s reading, especially where you see connections between what
you’ve learned today and what you’ve learned previously (e.g. concepts and facts from previous courses).• Sketch a qualitative graph illuminating a quantitative or qualitative principle in today’s reading.• Explain what you have learned today as if speaking to a precocious child (i.e. a person sufficiently
mature in their thinking but lacking the background knowledge you possess).
• Formulate your own question based on the reading, where the answer is found verbatim in the text.Explain what makes this question a good one for students to ponder.
• Formulate your own question based on the reading, where the answer requires you to combine multiplestatements or concepts found in different portions of today’s reading. Explain what makes this questiona good one for students to ponder (i.e. why it prompts critical thinking).
• Formulate your own question based on the reading, where the answer requires you to combine facts orconcepts found in today’s reading with information learned at some other time. Explain what makesthis question a good one for students to ponder (i.e. why it prompts critical thinking).
• Formulate your own question based on the reading, where the answer is open-ended (i.e. where theremay be multiple different yet correct answers).
• Devise a scientific experiment to test a principle articulated in today’s reading. Challenge students toidentify what result(s) would constitute disproof of the principle.
Suggestions for Socratic discussion following a problem-solving assignment
• Apply any one of the problem-solving strategies listed in Question 0 to one of today’s assigned problems.• Identify any first principles applicable to this problem, such as Conservation Laws of physics, general
principles of electric circuits, principles of algebra or calculus, etc. (Instructor note: every chapter inthe LIII textbook ends with a section listing some of the fundamental principles applied in that section.)
• Explain how you were able to identify relevant data to solve the problem, and show how to annotateany illustrations or schematics provided in the problem with this relevant data.
• Identify the most challenging aspect of the problem, and then remove that challenging aspect from theproblem so that it becomes simpler to solve. Instructor: this is often a very useful technique whensomeone is “stuck” on a problem and doesn’t know how to tackle it.
• Devise your own “thought experiment” useful for understanding this problem.• Identify any “limiting cases” (i.e. altering conditions to extremes) that simplify the problem.• Identify any misconceptions you discovered while solving this problem, and explain how you were able
to identify them as such.• Sketch a diagram that makes the problem easier to grasp.• Show how different mathematical formulae link together to give answers to this problem.• Identify the meaning of all intermediate calculations in your mathematical solution. Each and every
such calculated result should be identifiable in terms of both units of measurement and application tothe problem at hand.
• Instructor: suggest a “thought experiment” for students to perform on the problem at hand.
24

Question 1
We will begin our introduction to the second year of the Instrumentation program by brainstormingresponses to a few questions:
(1) What are your goals in this program? Why did you enroll in it and what do you expectto get out of it?
(2) What career options exist within the field of instrumentation and control?
(3) What knowledge and skills are most important for your success in this career? Or, to stateit differently, what benefit do employers get in return for the wages they pay you?
file i00001
25

Answer 1
Here is a collection of typical answers from previous students addressing question #1 (goals of enrolling inInstrumentation):
• To achieve job security• To gain a sense of doing something important in life• To have respect on the job• To be financially stable• To provide for family• To use your mind instead of doing menial work
Here is a collection of employer data addressing question #3 (important knowledge/skills):
In 2009, the Industrial Instrumentation and Control Technology Alliance (IICTA) conducted a surveyof 23 industrial instrumentation experts from across the United States to rank the relative importance ofknowledge and skill areas listed on the Texas Skill Standards Board (TSSB) skill standard for “IndustrialInstrumentation and Controls Technician.” The following is a list of knowledge/skill areas from this skillstandard where “critically important” (the absolute highest importance) was the most popular vote of theexperts surveyed, along with the percentage of experts voting the knowledge/skill area as “critical”, and alsomy own qualitative judgment of how difficult it is for someone to first acquire that knowledge or skill:
Knowledge / Skill area % vote DifficultyAbility to learn new technology 65% Hard
Interpret and use instrument loop diagrams 65% ModerateConfigure and calibrate instruments 65% Moderate
Knowledge of test equipment 61% HardInterpret and use process and instrument diagrams 57% ModerateInterpret and use instrument specification sheets 52% Easy
Knowledge of basic AC/DC electrical theory 52% HardKnowledge of basic mathematics 48% Moderate
Interpret and use electrical diagrams 48% ModerateInterpret and use motor control logic diagrams 43% Moderate
Knowledge of system interactions (e.g. interlocks & trips) 43% HardKnowledge of permits and area classifications 43% Easy
Understanding consequences of changes 43% HardProper use of hand tools 43% Moderate
Knowledge of control schemes (e.g. ratio, cascade) 39% HardProper tubing and wiring installation 35% Moderate
Motor control circuit knowledge 30% ModerateElectrical wiring knowledge 30% Moderate
Which of these knowledge/skill areas would you consider yourself proficient in right now?
26

On January 24, 2013 the Washington State Workforce Training and Education Coordinating Boardpresented results of a survey gathering input from over 2800 employers state-wide. One of the questions onthis survey asked employers if they had experienced difficulty with entry-level employees demonstrating thefollowing skills. A partial listing of results is shown here:
Knowledge / Skill area Percentage experiencing difficultySolve problems and make decisions 50%
Take responsibility for learning 43%Listen actively 40%
Observe critically 38%Read with understanding 32%
Use math to solve problems and communicate 31%
In July and August of 2011, the Manufacturing Institute and Deloitte Development LLC collaboratedto adminster a “Skills Gap study” across a range of manufacturing industries in the United States. Surveyresults were collected from 1123 respondents, with one of the survey questions asking “What are the mostserious skill deficiencies in your current employees?”. The responses to this question are tabulated here:
Knowledge / Skill area Percentage experiencing difficultyInadequate problem-solving skills 52%Lack of basic technical training 43%
Inadequate “soft skills” (attendance, work ethic) 40%Inadequate computer skills 36%
Inadequate math skills 30%Inadequate reading/writing/communication skills 29%
In December of 2001, the question “What qualities should an Instrumentation graduate possessin order to excel in their profession?” was posed to representatives on the Advisory Committee forBTC’s Instrumentation program. In addition to a firm knowledge of fundamentals (electronics, physics,mathematics, process control), one advisor in particular noted that “self-direction and the ability to learnon your own” was even more important than these.
Do you see a pattern emerging from a comparison of these feedback results? As any economist cantell you, the highest-valued commodity is one with the greatest demand and the least supply. Whichknowledge/skill area do you see in these survey results meeting both criteria? Are there other (lesser-valued)knowledge/skill areas of high value as defined by the same criteria of low supply and high demand?
27

Here is a collection of images addressing question #2 (career options):
Electric power generation:
Photos taken at the Satsop nuclear generating station in Washington.
Combined-cycle (gas turbine plus steam turbine) power plant, fueled by natural gas, in Ferndale, Washington.
28
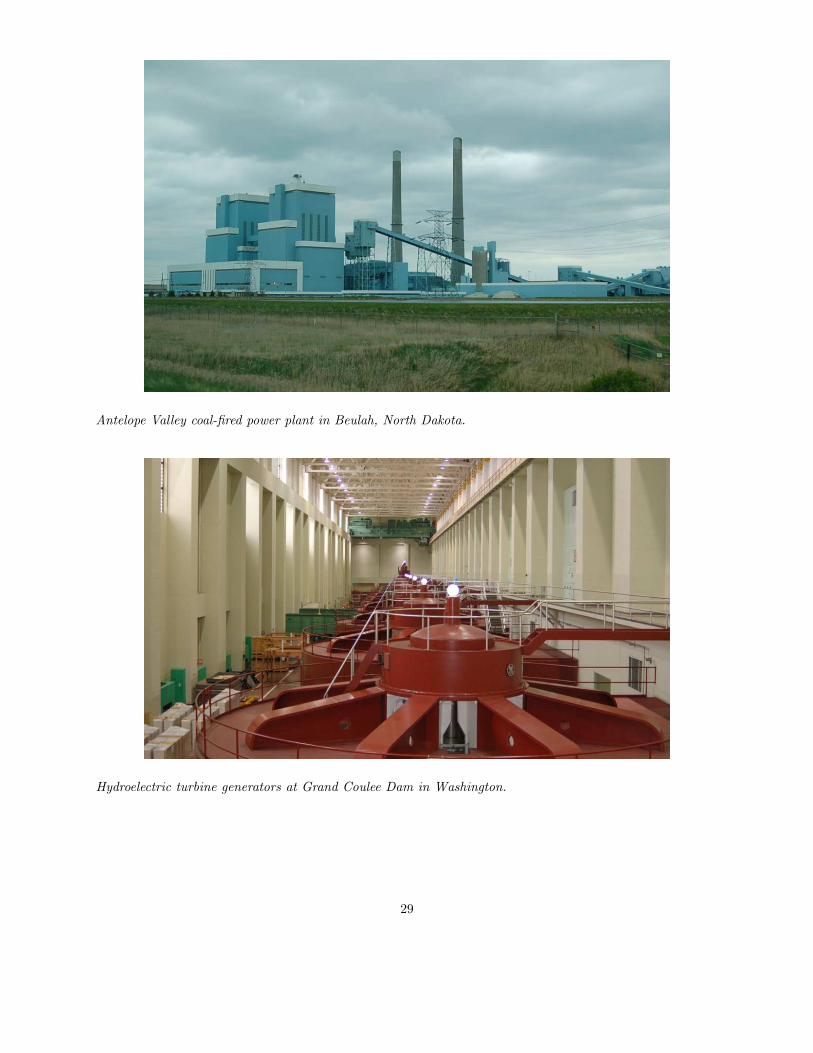
Antelope Valley coal-fired power plant in Beulah, North Dakota.
Hydroelectric turbine generators at Grand Coulee Dam in Washington.
29

Oil and natural gas exploration/production:
BP Exploration’s “Atlantis” offshore rig while under construction.
BTC Instrumentation grad Paige repairing flare ignitors on an offshore rig in the Gulf of Mexico.
30

Oil well drilling rig in the Bakken oil play (Stanley, North Dakota). These rigs drill approximately 2 milesdown, then drill horizontally and fracture the shale rock to allow oil to seep out and be collected.
Oil wellhead and pump in Stanley, North Dakota.
31

Oil refining:
The Phillips66 refinery in Ferndale, Washington.
Coal gasification:
Dakota Gasification plant in Beulah, North Dakota. Produces synthetic natural gas, ammonia, and a varietyof other high-value chemical products from coal. A majority of the carbon dioxide produced in this processis captured and piped to oil fields in Canada for enhanced recovery operations, where the CO2 gas ends upsequestered in underground wells.
32

Chemical processing:
Chemtrade Solutions sulfuric acid reprocessing plant in Anacortes, Washington. This plant receives “spent”sulfuric acid from two oil refineries (alkylation units, where sulfuric acid is used as a liquid catalyst) andreprocesses this contaminated acid into nearly pure acid for re-sale and re-use in the refineries.
33

Wood pulping and paper production:
This is the “blend chest” at a small pulping operation, where different grades of wood pulp are mixed togetherto achieve the correct blend for paper production.
34
Pharmaceutical manufacturing:
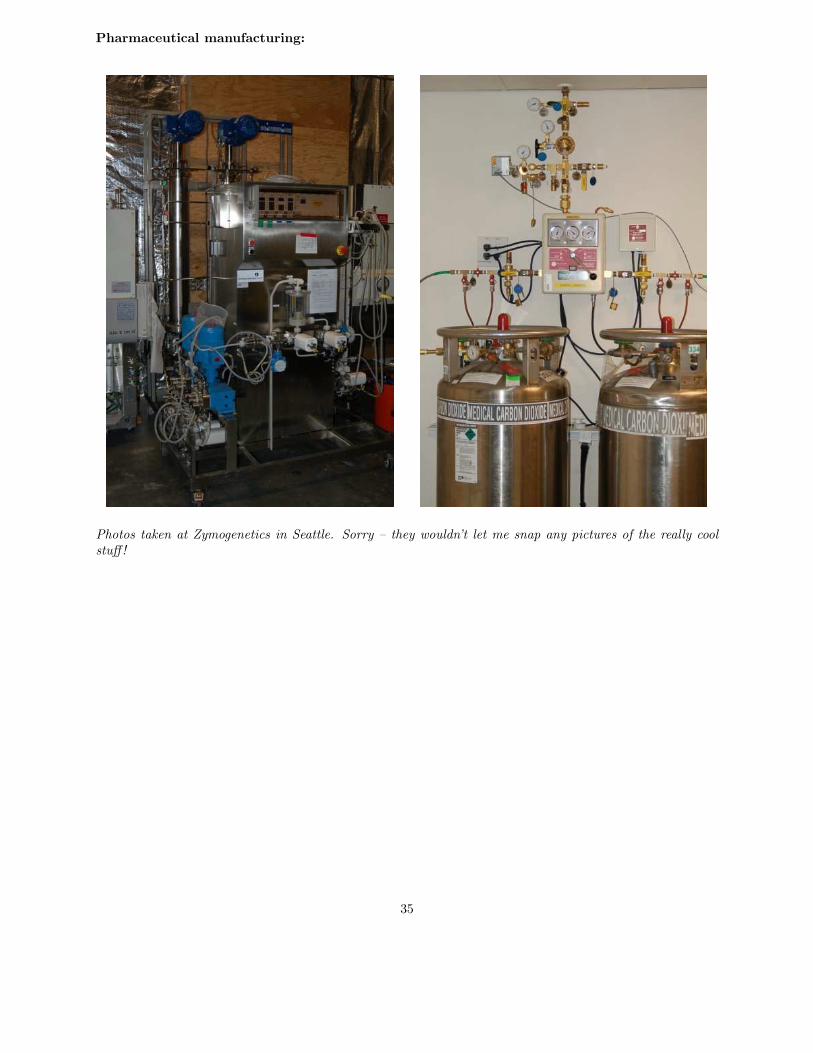
Photos taken at Zymogenetics in Seattle. Sorry – they wouldn’t let me snap any pictures of the really coolstuff!
35

Natural gas compression and distribution:
Williams Northwest Pipeline’s gas compression facility in Sumas, Washington.
Large reciprocating (piston) engine used to compress natural gas.
36
Food processing and packaging:
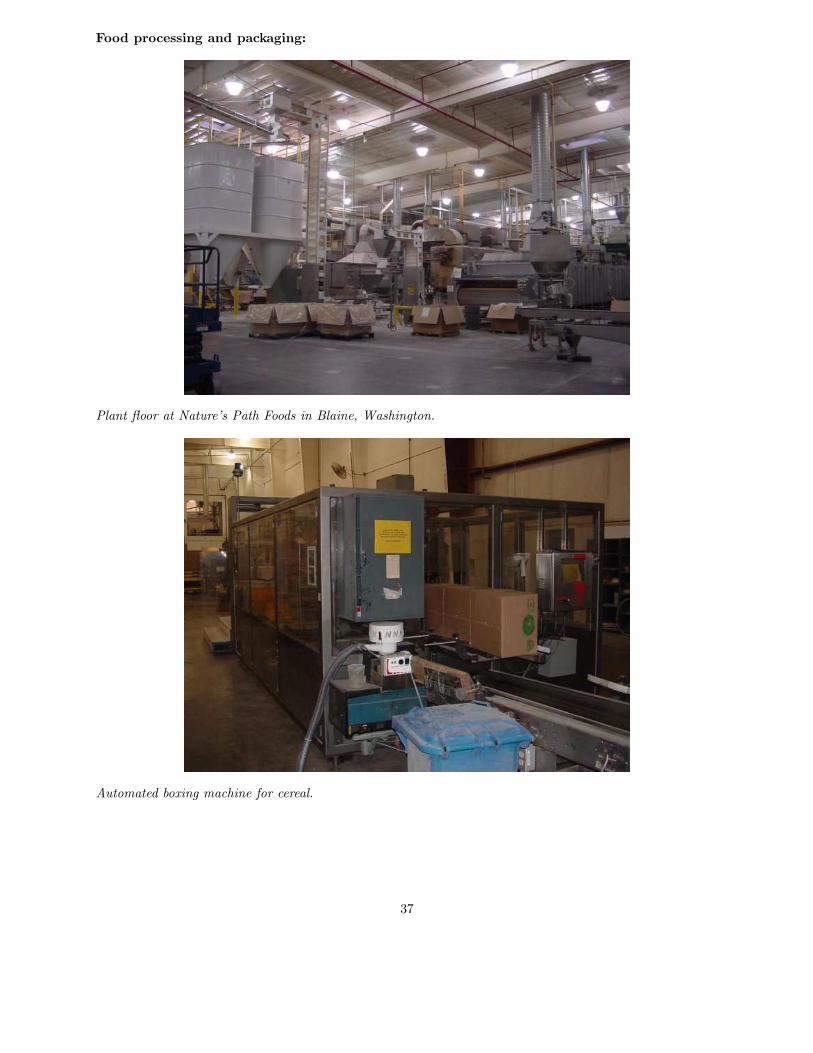
Plant floor at Nature’s Path Foods in Blaine, Washington.
Automated boxing machine for cereal.
37

Alcohol production and bottling:
Mash tuns and bottling line at RedHook Brewery in Woodinville, Washington.
38

Municipal water and wastewater treatment:
Potable water filtering at the city of Arlington, Washington.
Wastewater clarification at West Point treatment facility in King County (Seattle), Washington.
39
Electrical power distribution:
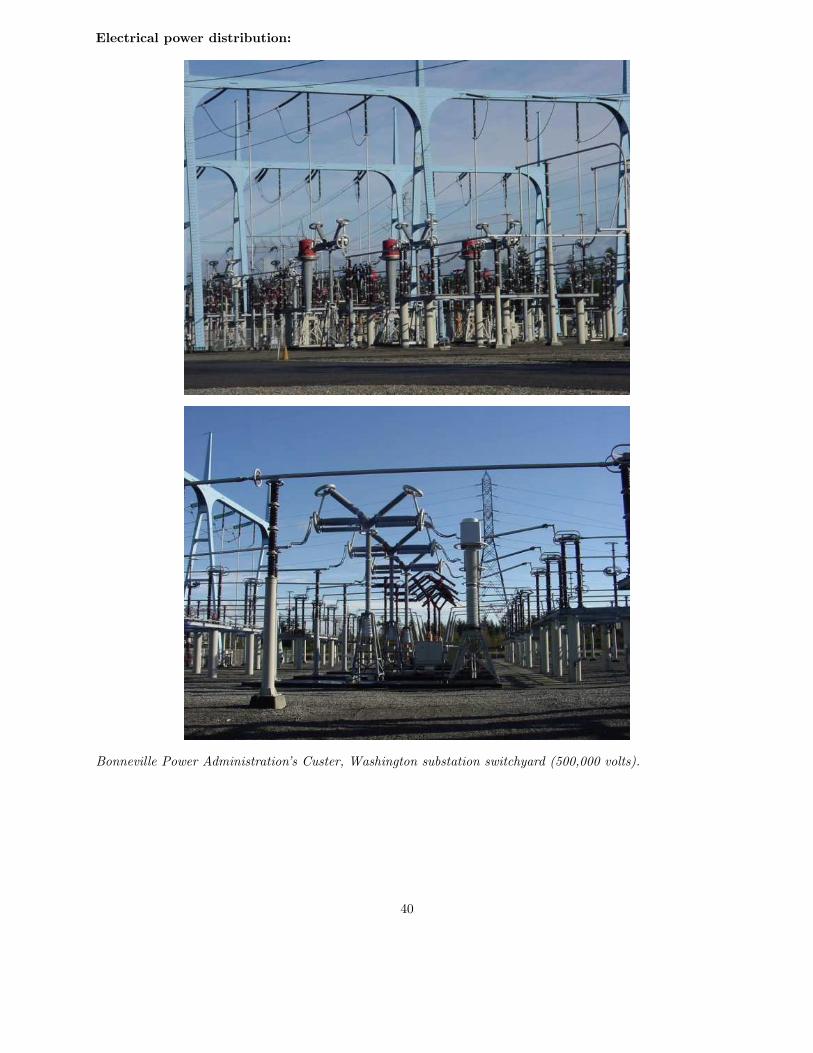
Bonneville Power Administration’s Custer, Washington substation switchyard (500,000 volts).
40

Lumber milling and treatment:
A computer-controlled drilling machine places holes into a wooden power line crossarm.
A retort used to pressure-treat lumber.
41

Aerospace:
Photos taken at NASA’s rocket engine test facility in Stennis, Mississippi.
42

Instrument control circuit layout and design:
A typical screenshot of AutoCAD being used to draft a P&ID for an oil refinery unit.
“Potline” buildings at the Alcoa/Intalco aluminum smelter in Ferndale, Washington.
43

PLC programming (control system design engineering):
0
run_time
3600000
in_start_switch in_stop_switch run_enable
run_enable
run_enable
out_comp_motor
out_comp_motorin_psl in_psh
out_comp_motor
EN
DN
RTORetentive Timer On
Timer
Time Base
Preset
Accum
0.001
RES
run_time.dn run_time
run_time.dn
0
hours
250
out_warning_lighthours.dn
RES
in_reset_switch
in_reset_switch hours
DN
CTUCount Up
Counter
Preset
Accum
CU
A typical PLC “ladder logic” program for an air compressor controlled by a Rockwell ControlLogix 5000 PLCis shown here.
44
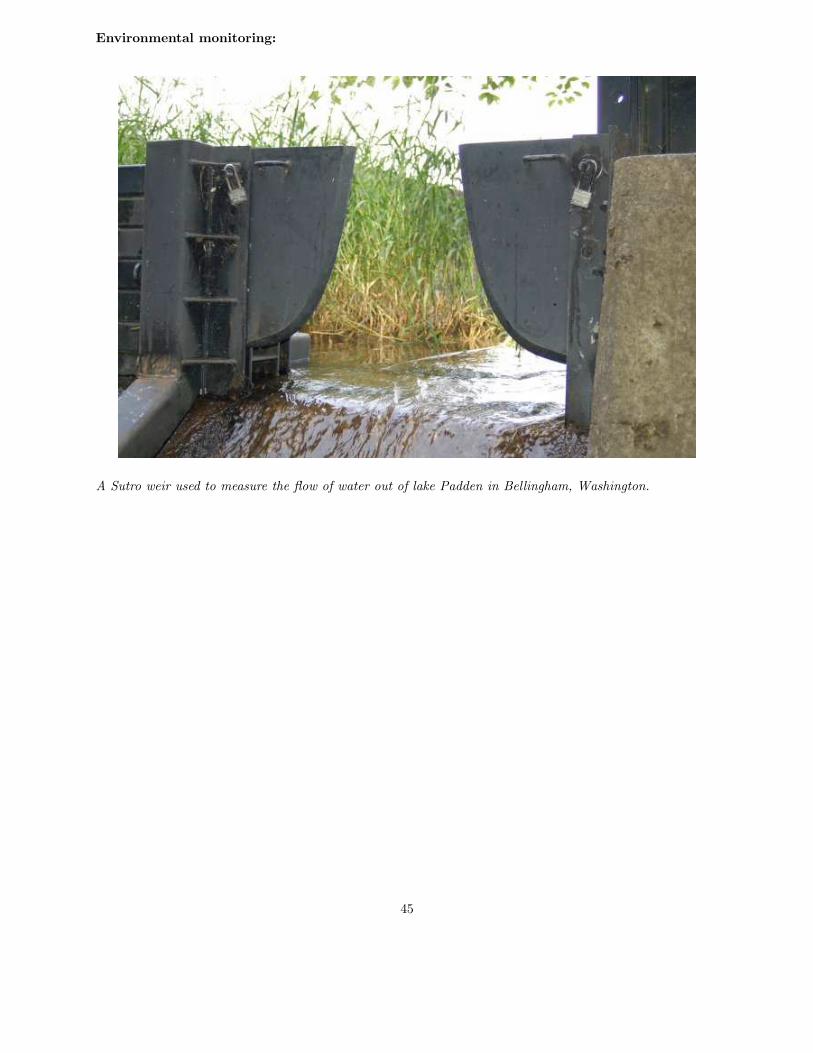
Environmental monitoring:
A Sutro weir used to measure the flow of water out of lake Padden in Bellingham, Washington.
45

Energy research and development:
Sandia National Laboratory’s pulsed power device used to conduct experiments in nuclear fusion, and also totest the effects of electromagnetic pulse energy on military hardware. Photo courtesy Department of Energy.
The control room of Pacific Northwest National Laboratory’s Fast Flux Test facility, used to conductresearch on nuclear fission “breeder” reactor technology. Photo courtesy Department of Energy.
46

Renewable energy:
Pacific Northwest National Laboratory’s experimental algae ponds for solar-to-biomass conversion. Photocourtesy Department of Energy.
Wind turbines at the Wild Horse wind farm near Ellensburg, Washington, operated by Puget Sound Energy.
47

Photovoltaic array at the Wild Horse wind farm near Ellensburg, Washington, operated by Puget SoundEnergy.
48

Mining:
BTC Instrumentation grads Micah and Mark working on a control valve near an ore crushing mill in Alaska.
49

Control valve service:
Typical “As-Found” and “As-Left” page of a control valve rebuild report.
50

Contract instrumentation work:
BTC Instrumentation grad Corey services a control valve at a Wyoming oil refinery during a winter shutdown.
Other career sectors not shown in this photo collection include (but are not limited to):
• Manufacturing assembly lines• Automotive research and development• Weight scale and weighfeeder service• Calibration standard laboratories• University campus utility work• Geological monitoring (volcano monitoring)• Robotics• CNC machine tool maintenance• Remotely piloted vehicles• Instrumentation sales
51

Notes 1
The same Washington state board survey also provided a sobering statistic regarding on-the-job training.The survey question read, “Did you firm provide at least 4 hours of on-the-job training under a written planfor any employees in the last 12 months?” The responses were only 31% yes and 69% no.
If you plan to review the various industries depicted in the answer section (in photographic form), agood focal point of discussion is to point out some of the continuing education you will likely face workingin each industry. For example:
• Electric power generation: learning how the specialized control systems for electrical generatorswork, adapting to changes in the industry such as decentralized power production (e.g. wind farms,solar generators, energy storage facilities).→ Example: specialized processes (e.g. nuclear reactors, geothermal wells, wind turbines)→ Example: protective relays→ Example: “smart grid” instrumentation→ Example: control network encyption and security
• Oil and natural gas exploration/production: learning how to monitor and control state-of-theart resource extraction technologies such as horizontal drilling and deep-sea production, learning thecharacteristics of production processes in order to optimize control and safety shutdown systems.→ Example: deep-sea wellhead instrumentation→ Example: horizontal drilling→ Example: maximizing wellbore yield→ Example: custody transfer instrumentation
• Oil refining: few types of manufacturing facilities offer as much technological complexity in one siteas an oil refinery – you can spend an entire career learning about the processes and technologies usedin a typical refinery without ever reaching the end!→ Example: steam generation, power generation, water treatment→ Example: catalytic chemical reaction processes→ Example: hazardous materials extraction (e.g. anhydrous ammonia, hydrogen sulfide)→ Example: new processes for refining challenging feedstocks such as “light tight oil” from the Bakken
shale and other plays• Coal gasification: learning how to measure and control relatively new technologies such as slagging
gasifiers.→ Example: optical interferometric temperature sensors→ Example: hazardous materials extraction (e.g. anhydrous ammonia, hydrogen sulfide)
• Chemical processing: typically these facilities are very diverse, and harbor a number of high-levelhazards.→ Example: catalytic chemical reaction processes→ Example: hazardous materials extraction (e.g. anhydrous ammonia, hydrogen sulfide)
• Wood pulping and paper production: a pulp & paper mill is nearly as diverse as an oil refinerywith respect to instrumentation. An added technical challenge with legacy paper mills is that they tendto employ everything from old pneumatic instrumentation to the latest state-of-the-art systems – inother words, old technology doesn’t seem to get updated as often as it would at an oil refinery.→ Example: pulp consistency control, which is unique to this industry→ Example: “hog fuel” boiler controls, challenging due to the inconsist nature of wood waste (“hog”)
fuel→ Example: recovery boiler operations (very dangerous processes, known for their history of explosive
failure)• Pharmaceutical manufacturing: learning the production requirements of new product lines, learning
how to calibrate and maintain the latest in biological instrumentation.→ Example: specialized analytical instrumentation for measuring drug quality
• Food processing and packaging: learning how to apply automation to reduce the cost and increaseavailability of food.
52

→ Example: most food processing facilities are not big enough to sustain a large maintenance staff,and so the “instrument tech” must do many other technical duties (e.g. electrical, mechanical)
• Alcohol production and bottling: learning how to apply automation to small-scale craftbrewery/distillery operations.→ Example: most small breweries and distilleries are not big enough to sustain a large maintenance
staff, and so the “instrument tech” must do many other technical duties (e.g. electrical, mechanical)• Municipal water and wastewater treatment: learning how to maintain the specialized instruments
used to measure the quality of water, and how to control new processes for cleaning the water.→ Example: analyzers for detecting contaminants such as cryptosporidium and biological agents such
as anthrax→ Example: new processes for treating water contaminated with medical waste
• Electric power generation: learning how the specialized control systems for electrical generatorswork, adapting to changes in the industry such as decentralized power production (e.g. wind farms,solar generators, energy storage facilities).→ Example: protective relays→ Example: “smart grid” instrumentation→ Example: control network encyption and security
• Instrument control circuit layout and design: learning new software packages such as InTools
for documenting instrumentation systems.• PLC programming (control system design engineering): learning new brands and models of
PLCs, as well as new programming languages.• Renewable energy: all the challenges of a regular power generation facility, plus the complexities of
an energy source that varies uncontrollably!• Mining: learning about the specialized instrumentation used to assay ores in real time, plus the
challenges of controlling machinery and processes in extremely harsh conditions.• Control valve service: learning how to apply state-of-the-art “smart” instrumentation to the control
of bulky valve mechanisms, learning about metallurgy and process fluid reactions in order to diagnoseearly valve failures.
• Contract instrumentation work: every day brings a new challenge as the nature and location of thework constantly changes!
In the interest of leaving enough time to do the mastery exam, your review of these different industriesshould be brief.
53

Question 2
Use a computer to navigate to the “Socratic Instrumentation” website:
http://www.ibiblio.org/kuphaldt/socratic/sinst
When you get there, click on the link for the quarter (Summer, Fall, Winter, or Spring) you are enrolledin, and download the INST200 “Introduction to Instrumentation” course worksheet. Today’s classroomsession will cover Day 1 of this worksheet.
Near the very beginning of this document, as is the case for all the 200-level Instrumentation courseworksheets, you will find a page titled “How To . . .”. Locate this page and read it thoroughly, as you willbe quizzed on its contents throughout the INST200 course. The “How to . . .” tips make reference to a“Question 0” which is another page found in every course worksheet. Read the points listed in Question 0as well.
Your instructor will also hand out copies of a release form (“FERPA form”) which you may sign to grantpermission to share your academic performance records with employers. This is voluntary, not mandatory.Without signed consent from student, federal law prohibits any instructor from sharing academic recordswith anyone but the student and appropriate college employees.
Your instructor will also have electronic copies (e.g. flash drive and/or CD-ROM) of the“Instrumentation Reference” on hand for you to copy to your personal computer. This is a collection of files,mostly obtained from various manufacturers’ websites with their permission, of tutorials and reports andtechnical manuals which you will be assigned to read throughout the second-year courses. The purpose of thisReference is to provide you with fast, off-line access so that you need not search the internet for these assigneddocuments. There is a file in the root directory of this Reference named “00 index OPEN THIS FILE.html”you should open using a web browser. The hyperlinks within this HTML index file make it much easier tofind the document(s) you’re looking for than it would be scanning the various directories within the Referenceto peruse filenames.
Suggestions for Socratic discussion
• One of the purposes of this exercise is to practice active reading strategies, where you interact with thetext to identify and explore important principles. An effective strategy is to write any thoughts thatcome to mind as you are reading the text. Describe how this active reading strategy might be useful indaily homework assignments.
• For each and every one of the points listed in the “How To . . .” and “Question 0” pages, identify whythese points are important to your ultimate goal of becoming an instrument technician.
• Identify how the INST200-level course design and expectations differ from what you have experiencedin the past as students, and explain why these differences exist.
file i00002
Answer 2
54

Notes 2
You, the instructor, should print copies of the “How To” and “Question 0” pages (on one double-sidedsheet of paper) and the “General Values and Responsibilities” (double-sided) on another sheet of paper andthe “Inverted Session Formats” (double-sided) on another sheet of paper for each and every student to haveat their desk, in case they don’t have a personal computer with them this day.
The “Real examples” showcase actual questions and scenarios posed to instructors in theInstrumentation program, which may serve as starting points for whole-class discussions on how to applyprinciples listed on the “How To” page. While many of these statements are actually amalgams of variousstatements made by different students at different times, the general theme and tone of each is faithful tothe original.
Be prepared to augment these examples with live demonstrations on the lectern computer (e.g. havethe grades spreadsheet ready to present, have the INSTREF ready to share, etc.). Also, be sure to point outthat historically we see students failing to properly navigate the Instrumentation Reference (i.e. browsingthrough directory file lists instead of using the webpage-based links), and failing assessments because of this.
55

Real example:The day before the exam, a student approaches the instructor and asks, “What’s going to be on
tomorrow’s exam?”
56

Real example:A student calls the instructor over for help. They are trying to locate one of the instruction manuals for
a particular instrument, that’s been assigned for reading. The instructor finds the student trying to navigatethrough the different file folders of the Instrumentation Reference, looking for a filename that is anythingclose to the brand and model of instrument cited in the homework. “It’s so hard to find anything in thisInstrumentation Reference,” the student says. “Isn’t there an easier way?”
57

Real example:At the start of a new quarter, one of the continuing second-year students is found by the instructor to
have registered for a couple of incorrect courses. When the instructor approaches this student to suggestthey drop the incorrect courses, the student says “The person at Registration told me these were the coursesoffered this quarter, so I signed up for all of them.”
58

Real example:A student approaches the instructor mid-way through the academic quarter. “I wish you would post
grades to all the students electronically like my other instructors, showing us exactly where we stand. Ihave no idea what my GPA is right now, and I’m worried about being able to qualify for an upcomingscholarship.”
59

Real example:A graduate who has been out of school for 6 months emails the instructor to ask about jobs. “I’m looking
for some contract work preferably in southern California, and don’t know where to begin my search.” Whenasked by the instructor what jobs they have applied to so far, the response is “None – I’m just starting.”
60

Real example:During an interview a graduate is asked to describe a situation where they had to solve a set of complex
problems to achieve a certain goal. The graduate is caught off guard, not knowing what the interviewerwants to hear, and also feels a bit intimidated by the question because as of yet they have no industrial workexperience. Should he fabricate a story that sounds good? Should he think of a hypothetical scenario wherehe can explain what he would do if that situation presented itself? Should he relate an experience he hadwhile working on a project in school, even though that wasn’t an actual job?
61

Real example:A student comes to class one day having prepared for the wrong set of homework questions. When they
realize this, they tell the instructor about it. “I asked my lab teammates what questions we had to do inpreparation for today and they gave me the wrong information!”
62

Real example:A student approaches the instructor with a question: “My parents have a vacation scheduled the last
week in October, and I was planning to go along with them. Will I miss anything important if I’m gone forthat week?”
63

Question 3
Near the beginning of every course worksheet there are some pages titled “General Values, Expectations,and Standards”. Your instructor will read these with you and answer any questions you have about them.Feel free to read this document in advance and bring questions with you to class for answering. Theseexpectations reference “Question 0” and the “Inverted Session Formats” pages which are also found in everycourse worksheet, and which you will want to read through as well.
Suggestions for Socratic discussion
• For each and every one of the points listed in the “General Responsibilities” pages, identify why thesepoints are important to your ultimate goal of becoming an instrument technician.
• Identify how the INST200-level course design and expectations differ from what you have experiencedin the past as students, and explain why these differences exist.
• One of the purposes of this exercise is to practice active reading strategies, where you interact with thetext to identify and explore important principles. An effective strategy is to write any thoughts thatcome to mind as you are reading the text. Describe how this active reading strategy might be useful indaily homework assignments.
file i00003
Answer 3
Notes 3
You, the instructor, should print copies of the “How To” and “Question 0” pages (on one double-sidedsheet of paper) and the “General Values and Responsibilities” (double-sided) on another sheet of paper andthe “Inverted Session Formats” (double-sided) on another sheet of paper for each and every student to haveat their desk, in case they don’t have a personal computer with them this day.
Begin the discussion of how to summarize paragraphs of text in your own words, by modeling this foryour students on at least one paragraph from the “General Values and Responsibilities” pages. Only afteryou do this with students, and there is time left, should you go on to posing “real examples” for them toapply the Responsibilities to.
The “Real examples” showcase actual questions and scenarios posed to instructors in theInstrumentation program, which may serve as starting points for whole-class discussions on how to applyprinciples listed on the “General Values and Responsibilities” pages. While many of these statements areactually amalgams of various statements made by different students at different times, the general themeand tone of each is faithful to the original.
It is a good idea to share with your students some of the Socratic Questions in the instructor versionof Question 0 which you will be regularly asking students to answer following their reading assignmentsthroughout the program.
64

Real example:A student approaches the instructor, worried about the homework load. “My time for study outside of
school is really limited. What can I do to make more study time?”
65

Real example:A student approaches the instructor, concerned about the daily homework. “It’s not often that I’m able
to completely answer all of the questions assigned for the day. I want to finish all the homework in order tobe prepared for class, but what should I do if I get completely stuck on a homework problem?”
66

Real examples:A recent graduate of the program emails his instructor with a suggestion. “At my job I’ve had to rebuild
over a half-dozen different brands of control valve, not just the Fisher brand we learned in school. You reallyneed to teach more control valve brands than this in order to prepare us for the job.”
A guest speaker is invited to lead the class through some hands-on exercises with a particular pieceof instrumentation equipment. To ensure the exercise goes smoothly, this guest brings sets of printedinstructions for each student to follow, guiding the students step-by-step through all the procedures. At theend of this 3-hour session, a couple of students approach the instructor and say “This is how all of the labsshould be organized! Everything was so easy to understand! It wasn’t as frustrating as building projectslike we usually do.”
67

Real examples:A student arrives 5 minutes late, with a speeding ticket in his hand. “I got here as fast as I could, but
there was construction on Bakerview road and when I tried to make up lost time a cop pulled me over andgave me this ticket. Am I still tardy?”
A student arrives 2 minutes late to class. “According to my watch, I’m still on time!”
A student exhibits a pattern of showing up late for class or not showing up at all, with no contactwhatsoever with his lab teammates or the instructor. When asked about this the next day by the instructor,his reply is “I had important business to take care of.”
A student has a habit of immediately going to the cafeteria to get breakfast and coffee after the instructorconcludes the morning introduction to lab at 8:15 AM. The student’s teammates must wait until he returnsto progress on labwork together.
68

Question 4
One of the unique features of this program is the inclusion of mastery exams, where students mustanswer questions with 100% accuracy in order to pass. Conventional “proportional” exams allow studentsto pass if a certain minimum score is achieved. The problem with this testing strategy is that students maynot actually learn all the concepts they’re supposed to, but may still pass the exam if they are strong enoughin the other concepts covered in that assessment. The purpose of mastery exams is to guarantee proficiencyin all critical concepts and not just some.
Your instructor will hand out copies of the mastery exam for the INST200 “Introduction toInstrumentation” course, covering several critical concepts of circuit analysis taught in the first year ofthe Instrumentation program. Do your best to answer all the questions correctly. If you get any incorrecton the first attempt, the instructor will mark which sections (not which questions) you missed and return itto you for one more attempt. If a mastery exam is not passed by the second attempt, it counts as a failedexam.
Mastery exams may be re-taken any number of times with no grade penalty. The purpose is to givestudents the constructive feedback and practice that they need in order to master all the concepts representedon the exam. Every mastery exam must be passed before the next scheduled exam is given in order to receivea passing grade for that course, a period of approximately 2 weeks. If any student is not able to pass a masteryexam with 100% accuracy by the deadline date, they will receive an “F” grade for that course, and mustre-take the course again during some future quarter.
The INST200 mastery exam is given for the purpose of exposing students to this unique type ofassessment. Failing to pass the INST200 mastery exam will not result in a failing grade for the INST200course, but students should be warned that poor performance on this exam often marks trouble in futureInstrumentation courses, since so much of the second year’s material builds on what was taught during thefirst year.
file i01230
Answer 4
Notes 4
69

Question 5
Locate the question in your worksheet outlining the lab project for this course section. Whatinformation is given to you here to help you construct the lab project? Which objectives must be completedindividually, versus as a team? How does a “mastery” objective differ from a “proportional” objective?
file i03856
Answer 5
Notes 5
This question is best addressed during lab time, not during the classroom policy introduction time onthe first day.
70

Question 6
Read the “Teaching Technical Theory” section of Appendix D (“How to Use This Book – Some Advicefor Teachers”) in your Lessons In Industrial Instrumentation textbook. This will serve as the basis for adiscussion on why the second-year Instrumentation courses are not lecture-based.
Imagine a child wishing to learn how to ride a bicycle. Seeking knowledge on the subject, the childapproaches an adult asking for that adult to explain how to ride a bike. The adult responds with a detailedand thorough explanation of bicycle riding, including all the relevant safety rules. After this explanationconcludes, will the child be able to ride a bicycle? Now imagine that same child reading a book on bicycleriding. The book is well-written and filled with clear illustrations to aid understanding. After finishing thisbook, will the child be able to ride a bicycle? Now imagine that same child watching a demonstration videoon bicycle riding. The video is professionally shot, with very clear views on technique. The actor in thevideo does a great job explaining all the important aspects of bicycle riding. After watching the video in itsentirety, will the child be able to ride a bicycle?
It should be obvious at this point that there is more to learning how to ride a bicycle than merely beingshown how to do so. Bike riding is a skill born of practice. Instruction may be necessary to learn how toride a bicycle safely, but instruction in itself is not sufficient to learn how to ride a bicycle safely – you mustactively attempt riding a bicycle before all the pieces of information come together such that you will beproficient. What is it about bicycle riding that necessitates practice in order to learn?
Now imagine someone wishing to learn how to write poetry. Seeking knowledge on the subject, thisperson consults poets for advice, reads books of poetry and books about writing poetry, and even listens toaudio recordings of poets presenting their work in public. After all this instruction and research, will theperson be a proficient poet?
Here we have the same problem we had with learning to ride a bicycle: instruction may be a necessarypart of learning to write poems, but instruction in itself is not sufficient to become a poet. One must activelywrite their own poems to become good at it. What is it about poetry that necessitates practice in order tolearn how to write it?
The fundamental principle here is that we master that which we practice, because the brain strengthensneural pathways through repeated use. There is nothing unique about bicycle riding or poetry in this regard:if you wish to master any skill you must repeatedly do that skill. The problem with learning about bicycle-riding or poetry from other people is that you aren’t doing any bicycle riding or poetry yourself. The mostvaluable assistance any learner can receive is prompt and constructive feedback during the learner’s practice.Think of a child attempting to ride a bicycle with an adult present to observe and give practical advice;or of a person learning poetry, submitting their poems to an audience for review and then considering thatfeedback before writing their next poem.
When we research which skills are most valuable to instrument technicians, we find self-directed learningand general problem-solving top the list. These skills, like any other, require intensive practice to master.Furthermore, that practice will be optimized with prompt and expert feedback. In order to optimally preparestudents to become instrument technicians, then, those students must be challenged to learn on their ownand to individually solve problems, with the instructor coaching them on both activities.
Here is where schools tend to cheat students: the majority of class time is spent presenting informationto students, rather than giving students opportunity to practice their problem-solving skills. This is primarilythe consequence of lecture being the dominant mode of teaching, where a live instructor must spend hourupon hour verbally presenting information to students, leaving little or no time for those students to solveproblems and sharpen their critical thinking skills. Assigned homework does a poor job of providing practicebecause the student doesn’t receive detailed feedback on their problem-solving strategies, and also becausemany students cheat themselves by receiving inappropriate help from their classmates. Furthermore, lectureis the antithesis of self-directed learning, being entirely directed by a subject matter expert. The skillspracticed by students during a lecture (e.g. taking dictation on lengthy presentations) have little value inthe career of an instrument technician. More time in school could be spent practicing more relevant skills,but only if some other mode of instruction replaces lecture.
71

Not only does lecture displace more valuable activities in the classroom, but lecture isn’t even that good ofan instructional technique. Among the serious shortcomings of lecture are the following:
• Students’ attentions tend to drift over the span of any lecture of significant length.
• Lecture works well to communicate facts and procedures but fails at getting students to think forthemselves, because the focus and pace of any lecture is set by the lecturer and not the students.
• Lecture instills a false sense of confidence in students, because complex tasks always look easier thanthey are when you watch an expert do it without trying it yourself. (An oft-heard quote from studentsin lecture-based classes: “I understand things perfectly during lecture, but for some reason I just can’tseem to do the homework on my own!”)
• A lecturer cannot customize (“differentiate”) instruction for individual students. Rather, everyone getsthe exact same presentation (e.g. the same examples, the same pace) regardless of their diverse needs.The pace of lecture is perhaps the most obvious example of this problem: since the lecturer can onlypresent at one pace, he or she is guaranteed to bore some students by going to slow for them and/orlose others by going too fast for them.
• Students cannot “rewind” a portion of lecture they would like to have repeated without asking the entireclass to repeat as well.
• Students’ must simultaneously dictate notes while trying to watch and listen and think along with theinstructor, a difficult task at best. Multitasking is possible only for simple tasks, none of them requiringintense focus.
• If the instructor commits some form of verbal error and doesn’t realize it (which is very common becauseit’s difficult to simultaneously present and self-evaluate), it is incumbent upon the students to identifythe error and ask for clarification.
• The instructor cannot accurately perceive how each and every student is understanding the presentation,because the instructor is too busy presenting. Body language during the lecture isn’t a reliable enoughindicator of student understanding, and the time taken by lecture precludes the instructor visiting everystudent to inspect their work.
• Lecture instills an attitude of dependence on students by reinforcing the notion they need to personallyconsult an expert in order to learn anything new. This discourages students from even trying to learncomplex things on their own.
For these reasons – the fact that lecture displaces class time better spent coaching students to solveproblems, as well as the many problems of lecture as an instructional mode – there is almost no lecture inany of the 200-level Instrumentation courses at BTC. Instead, students learn the basic facts and proceduresof the subject matter through reading assignments prior to class, then spend class time solving problems anddemonstrating their understanding of each day’s major topic(s) before leaving. This is called an invertedclassroom because the classroom and homework roles are swapped: what is traditionally lectured on inclass is instead done on the students’ time outside of class, while the problem-solving traditionally done ashomework is instead completed during class time while the instructor is available to coach. This format ishighly effective not only for learning the basic concepts of instrumentation, but also for improving technicalreading and critical thinking skills, simply because it requires students to practice the precise skills they mustmaster.
The primary reason reading was chosen as the preferred mode of instruction is feedback from employersas well as observations of student behavior, both sources revealing an aversion to technical reading. Someemployers (most notably the BP oil refinery in Carson, California) noted reading comprehension as being theweakest area when testing BTC students during past recruiting trips. Also, a failure to reference equipmentmanuals when working on real systems is a chronic problem both for novice technicians in a wide rangeof industries as well as students learning in a lab environment. Given the fact that far more high-qualitytechnical information is available for continued learning in this career than high-quality videos, readingcomprehension is a vital skill for technicians to keep their knowledge up to date as technology advances.
72

Prior to 2006 all 200-level Instrumentation courses were strictly taught by lecture. Making mattersworse, many of the courses had no textbook, and homework was seldom assigned. All 200-level examsprioritized rote memorization and execution of procedural problem-solving over creative problem-solvingand synthesis of multiple concepts. It was common for second-year students to flounder when presented witha new piece of equipment or a new type of problem, because no instructor can teach procedures to cover anyand all possible challenges.
Since 2006 the 200-level Instrumentation courses have gradually morphed from lecture to “inverted”format, with measurable gains in learning. Proportional exam scores from the Fall quarter courses (INST240,INST241, and INST242 – those courses where the content has remained most stable over this time span)demonstrate this, each histogram showing the number of students (vertical axis) achieving a certain examscore (horizontal axis):
90-1
00
80-8
9
70-7
9
60-6
9
50-5
9
40-4
9
30-3
9
20-2
9
10-1
9
0-9
0
1
2
3
4
5
6
7
INST240 pressure examFall 2006
Average score = 83.56%
Standard deviation = 8.19%
90-1
00
80-8
9
70-7
9
60-6
9
50-5
9
40-4
9
30-3
9
20-2
9
10-1
9
0-9
0
1
2
3
4
5
6
7
Fall 2006INST240 level exam
Average score = 72.05%
Standard deviation = 17.03%90
-100
80-8
9
70-7
9
60-6
9
50-5
9
40-4
9
30-3
9
20-2
9
10-1
9
0-9
0
1
2
3
4
5
6
7
Fall 2006INST241 temp. exam
Average score = 70.63%
Standard deviation = 19.54%
90-1
00
80-8
9
70-7
9
60-6
9
50-5
9
40-4
9
30-3
9
20-2
9
10-1
9
0-9
0
1
2
3
4
5
6
7
Fall 2006INST241 flow exam
90-1
00
80-8
9
70-7
9
60-6
9
50-5
9
40-4
9
30-3
9
20-2
9
10-1
9
0-9
0
1
2
3
4
5
6
7
Fall 2006INST242 exam
Average score = 55.53%
Standard deviation = 18.25%
Average score = 68.60%
Standard deviation = 21.48%
Fall 2006: limited text resources for students (no standard textbook for the curriculum), classroom format a mixture of lecture and group discussion
Cumulative exam score average for Fall quarter 2006 = 70.07%Cumulative exam score standard deviation for Fall 2006 = 19.27%
90-1
00
80-8
9
70-7
9
60-6
9
50-5
9
40-4
9
30-3
9
20-2
9
10-1
9
0-9
0
2
4
6
INST240 pressure exam
90-1
00
80-8
9
70-7
9
60-6
9
50-5
9
40-4
9
30-3
9
20-2
9
10-1
9
0-9
INST240 level exam
90-1
00
80-8
9
70-7
9
60-6
9
50-5
9
40-4
9
30-3
9
20-2
9
10-1
9
0-9
INST241 temp. exam90
-100
80-8
9
70-7
9
60-6
9
50-5
9
40-4
9
30-3
9
20-2
9
10-1
9
0-9
INST241 flow exam
90-1
00
80-8
9
70-7
9
60-6
9
50-5
9
40-4
9
30-3
9
20-2
9
10-1
9
0-9
INST242 exam
8
10
12
14
0
2
4
6
8
10
12
14
0
2
4
6
8
10
12
14
0
2
4
6
8
10
12
14
0
2
4
6
8
10
12
14
Fall 2009 Fall 2009 Fall 2009 Fall 2009 Fall 2009
Fall 2009: Lessons In Industrial Instrumentation textbook available to students, classroom format still a mixture of lecture and group discussion
Average score = 74.15%
Standard deviation = 23.90%
Average score = 71.79%
Standard deviation = 24.71%
Average score = 76.61%
Standard deviation = 23.25%
Average score = 69.39%
Standard deviation = 20.65%
Average score = 78.97%
Standard deviation = 15.64%
Exam complexity increased significantly since the introduction of the new textbook in 2008
Cumulative exam score average for Fall quarter 2009 = 74.18%Cumulative exam score standard deviation for Fall 2009 = 21.88%
90-1
00
80-8
9
70-7
9
60-6
9
50-5
9
40-4
9
30-3
9
20-2
9
10-1
9
0-9
0
2
4
6
INST240 pressure exam
90-1
00
80-8
9
70-7
9
60-6
9
50-5
9
40-4
9
30-3
9
20-2
9
10-1
9
0-9
INST240 level exam
90-1
00
80-8
9
70-7
9
60-6
9
50-5
9
40-4
9
30-3
9
20-2
9
10-1
9
0-9
INST241 temp. exam
90-1
00
80-8
9
70-7
9
60-6
9
50-5
9
40-4
9
30-3
9
20-2
9
10-1
9
0-9
INST241 flow exam
90-1
00
80-8
9
70-7
9
60-6
9
50-5
9
40-4
9
30-3
9
20-2
9
10-1
9
0-9
INST242 exam
8
10
12
14
0
2
4
6
8
10
12
14
0
2
4
6
8
10
12
14
0
2
4
6
8
10
12
14
0
2
4
6
8
10
12
14
Fall 2013 Fall 2013 Fall 2013 Fall 2013 Fall 2013
Fall 2013: Lessons in Industrial Instrumentation textbook greatly expanded, classroom format fully inverted (i.e. no lecture)
Average score = 82.35%
Standard deviation = 12.17%
Average score = 73.16%
Standard deviation = 16.78%
Average score = 71.03%
Standard deviation = 13.88%
Average score = 80.24%
Standard deviation = 12.71%
(18)
Average score = 82.44%
Standard deviation = 8.98%
Cumulative exam score average for Fall quarter 2013 = 77.85%Cumulative exam score standard deviation for Fall 2013 = 13.89%
Mastery exam complexity increased significantly since 2009, requiring broader competence and leaving less time to complete proportional exams
Note the general improvement in average exam scores (2009) toward the end of the quarter, despitethe exams being more complex than they were in 2006. Students were held accountable for the assigned
73

textbook reading with graded “prep quizzes” at the beginning of each class session. Note also how thestandard deviations increased, representing a greater degree of “spread” between student performance onthese exams. The increased standard deviation shows some students falling behind their peers, since lecturewas not providing for their needs with a more challenging curriculum.
In the third set of histograms (2013) we see general increases in average scores as well as markedimprovements in standard deviation across the board (showing fewer students “left behind” their peers).The inverted classroom format allows the instructor to spend one-on-one time with each and every studentto probe for misconceptions and offer assistance when needed. This kind of differentiated instruction isimpossible in a lecture format. Even more remarkable is the fact that the exam complexity increasedsince 2009, with longer mastery exams (reviewing concepts from previous courses including first-year circuitprinciples) and more complex proportional exams. In 2013 the exams so fully exhausted the 3-hour testingperiod that graded results could no longer be given before the end of the day, and instead had to wait untilthe following day. Yet, despite this increased rigor exam scores increased and standard deviation narrowed.
One of the most striking improvements realized since abandoning lecture is the ease of which studentsgrasp some of the more complex concepts throughout the year. These concepts used to be difficult to conveyin a lecture format (mostly due to pacing problems, since different students would get “stuck” at differentpoints in the presentation), and so long as some lecture existed in the classroom students would tend togive up when they encountered difficult concepts in the assigned reading (knowing they could rely on theinstructor to lecture on these tough concepts in class):
• INST230 course: Three-phase electric power system calculations• INST230 course: Normally-open versus normally-closed contact status• INST240 course: Interface liquid level measurement (hydrostatic and displacer)• INST240/250 courses: Force-balance versus motion-balance pneumatic mechanisms• INST241 course: Coriolis mass flowmeters• INST242 course: Gas chromatograph operation
→ Not only are students able to fully grasp basic GC operation in only one day, but they are also ableto tackle multi-column GCs as well!
• INST242 course: Non-dispersive optical analyzers (NDIR, Luft detectors, etc.)→ Comprehension of this topic used to be a real struggle, with a good percentage of students failing
to grasp filter cells and Luft detectors by the end of the first day. Now this concept comes easilyto all in one day.
• INST250 course: Fluid power system analysis (hydraulic and pneumatic diagrams)• INST250 course: Split-ranged control valve sequencing• INST250 course: Control valve characterization
→ Comprehension of this topic is so much better now that I’ve had to modify that day’s learningactivities to provide more challenge than in past years.
• INST252/263 courses: Feedforward control strategies→ Dynamic compensation in particular used to be such a struggle to teach that most students really
didn’t seem to “get” the concept after repeated explanations. Now it’s no more challenging thanany other control concept we tackle in the program.
• INST252 course: Loop stability analysis (based on trend recordings)• INST260 course: Data acquisition hardware connections (e.g. differential vs. single-ended connections)• INST262 course: FOUNDATION Fieldbus and wireless (radio) digital communications
→ The first year I taught FOUNDATION Fieldbus using an inverted classroom, my students knewthe topic better than our guest lecturer who I invited to present on the subject! The students’only exposure to FOUNDATION Fieldbus at that point was one night’s study prior to the guest’sappearance.
• INST263 course: Selector and override controls
This improvement in student learning has been verified by industry representatives, when they areinvited to come to BTC to review certain complex topics such as Fieldbus, WirelessHART, and controlvalves. The general feedback they give is that BTC students are unusually well-prepared on these subjects.The “secret” of course is that students learning in an inverted classroom format spend more time immersed
74

in the subject matter, and the feedback they receive from their instructors in class is better tailored to theirindividual learning needs.
Another significant gain realized since abandoning lecture is the immediate placement of inexperiencedBTC Instrumentation graduates in jobs typically reserved for engineers with 4-year degrees. This simply didnot happen when BTC’s Instrumentation program was lecture-based, and it is due to the fact that studentsexplicitly learn higher-order thinking skills when they must gather information on their own outside of classand then demonstrate critical thinking before an instructor every day. This has happened once in December2011, again in December 2012, again in March 2013, and again in August 2013.
Yet, despite the gains realized by abandoning lecture in favor of an “inverted” teaching format, somestudents are highly resistant to the concept. Some of the critical comments routinely heard from studentsagainst the inverted format are as follows:
(1) “I learn better in a lecture format.”
(2) “My learning style is visual, which means I need to see someone solve the problems for me.”
(3) “When I arrive to class after doing the assigned reading and trying to solve the homework problems, I’mcompletely lost.”
Discuss each of these comments in detail. Here are some starting points for conversation:
(1) What does it mean to learn something better? How may a student measure how well they’ve learnedsomething new? What, exactly, is it that is learned better in lecture? Is there anything significant thatstudents don’t learn in a lecture?
(2) Would someone with an auditory or kinesthetic learning style fare any better in an inverted classroom?Does a visual learning style preclude effective reading, or independent learning? Are learning styles realor merely perceived? Are learning styles immutable (i.e. permanent), or is it possible for people tocultivate new learning styles?
(3) What does it mean if a student is lost after completing the homework for an inverted class, assuming asignificant number of their classmates are not lost? What would be an appropriate course of action totake in response to this condition?
file i00004
Answer 6
75

Notes 6
Here is a timeline for the transition away from lecture and toward an inverted classroom in the second-year (200-level) Instrumentation courses:
• October 1998: Hired to teach first year of Instrumentation at BTC. Surveying student comments, Iheard a lot of things like “High school was more challenging than this!” Some students flatly rejectedby employers (“Don’t ever send us anyone like that again” was one comment heard by a supervisor atthe BP Cherry Point refinery following a jobshadow). No lesson plans existed for anything taught inthe first or second years of the program.
• 1998-1999: My first year of teaching, like every teacher’s first year of teaching, was very rough. Attimes I felt like I was barely discharging the duties of my job, all the required tasks were so overwhelming.
• 1999-2000: Developed lessons plans for each day of teaching, including live demonstrations of conceptsfor most every day.
• 1998-2001: Most common student complaint: “I understand things perfectly when you explain them tome, but for some reason I just can’t seem to do it on my own!” Many students exhibiting poor recall ofimportant concepts, even students who were clearly paying attention and doing the homework. I wasbeginning to feel frustrated and even burnt out trying my best to get students to really understandelectronics while seeing mediocre results.
• 2000-2001: Overheard a conversation between two students: “This class is great – Tony presentseverything so well, you don’t even have to read the book!” This revelation was key to cracking theproblem: all the work I had put in to making polished presentations for my students was actuallyhurting their development as learners. Students were coming to class expecting “The Tony Show”rather than preparing on their own, and this explained much of their poor retention and mastery ofconcepts. The bottom line is this: student learning is directly proportional to student effort, all otherfactors being equal.
• December 2001: Instrumentation advisory committee meeting, where Sam Bryant contributedhis thoughts that the most important things for success in this field were self-direction and theability to independently learn. These things are more important than subject-matter knowledge andskill, because they enable continuous learning and advancement throughout one’s career.
• January 2002-June 2002: Met with Ed Fournier and other BTC Nursing program instructors to learnhow their small-group teaching method worked. Nursing students were assigned lists of objectives andreading assignments; they met in small groups to discuss what they learned and get clarification frominstructor. I observed several Nursing class sessions where I was astounded by the depth of engagementand understanding demonstrated by the students: it was everything I wanted to have happen in myclass, but wasn’t happening. Nursing faculty warned me, however, that this was not well-received byall students – in fact, some of them absolutely hated the process. I encountered one of these frustratedstudents working as a cashier at Fred Meyer, who told me in no uncertain terms, “I learn better inlecture!”
• 2002-2003: Taught second year of program for the first time, in parallel with another instructor. Thiswas my first time implementing “research-discussion” rather than lecture-based teaching. Studentsinitially revolted: “If I’d wanted to study, I would have gone to a real college!” but I pushed back andthey eventually came around to liking the format. In the end, it worked phenomenally well, with mystudent group out-performing the lecture-taught group in every metric (handling more advanced testquestions and more advanced lab projects, and using less time in class). Used Bela Liptak’s InstrumentEngineers Handbook series as our text, because I couldn’t find anything else suitable.
• 2003-2004: First year of program taught by another instructor (Larry), who tried applying the research-
76

discussion method. Half of his class revolted as well, even involving a counselor in the fight. Duringa whole-class discussion moderated by the counselor, one of the harder-working students (who wasUkrainian) stood up and angrily denounced those opposing students as “Lazy Americans” (“In Ukraine,we write notes in margins of newspaper, we were so poor! Here you have everything you need to learn,but you don’t do the work!!”). In the end this instructor capitulated to the complaints and returned tolecture, but regretted doing so.
• 2004-2005: Moved to DMC building, implemented new first-year curriculum based on research anddiscussion.
• 2005-2006: Continued teaching with inverted classroom structure. Problems noted in studentpreparation: no matter how often I encouraged students to do their homework, many of them onlyinvested a cursory effort. This was also noted by the harder-working students, who complained aboutpeers not coming to class prepared.
• June 2006: The 2nd-year instructor left BTC to take position in industry.
• 2006-2007: Taught 2nd year of program, using a completely rewritten curriculum based on lessonslearned. Student preparation still judged via inspection of homework notes, although this was provingto be problematic. One class discussion highlighted this problem, with the harder-working studentscomplaining that many of their peers didn’t even bother to do their homework ahead of class. Whenone of those ill-prepared students countered with a complaint about having to read too much, anotherstudent replied that anyone who couldn’t learn by reading “. . . is profoundly disadvantaged in aninformation-based society!”
• 2007-2008: Incorporated daily quizzes into grading, rather than homework inspection.
• Summer 2008: Began writing Lessons In Industrial Instrumentation due to a total lack of suitableinstrumentation textbooks on the market.
• 2008-2009: Marked improvements in student comprehension with the new textbook available as alearning resource.
• April-June 2009: Some students still arriving in class wholly unprepared (didn’t do homework), withno change in behavior after repeated counsel. Announcement made regarding change to quiz gradingprior to summer break.
• September 2009: Prep/summary quiz grading changed to -1% per failed quiz.
• November 2009: One student (who was notorious in his lack of preparation) filed a grievance againstme regarding the new quiz policy. Met with Dean in January of 2010, and emerged from that meetingwith the new quiz policy still intact. One of the lines of evidence used to uphold the new quiz gradingpolicy is that the mastery exam failure rate was cut in half immediately following the change!
• 2009: Added circuit fault analysis question (i.e. choosing “Possible” or “Impossible” for proposed faultsin a malfunctioning circuit) to all mastery exams.
• 2010-2011: Whole-class Socratic discussions abandoned in favor of small-group interactions. One ofthe major motivations for this was the increase in class size (40 students total), which made it difficultfor students to hear each other in an auditorium-style classroom.
• 2010-2011: Tried holding question & answer sessions at the very beginning of class, to address studentcomplaints about having to pass quizzes after only having studied the material on their own. Whatresulted from this experiment was sobering: only two students ever asked questions during these sessions.The rest of them either had no need for the Q&A session or they had cut back on their preparation
77

because they knew I would be explaining the more challenging concepts at the start of class.
• August 2011: Received a telephone call from an employer about a graduate who was doing verypoorly at his job. This particular job required that the graduate learn how to use a specific softwareapplication. He was having trouble learning the features of this program. The employer told me she hadrecommended this grad take notes on how to use this software, documenting each new thing he learned,as a way to teach himself, but that the grad refused to do this and so was floundering in his job. Notsurprisingly, this grad exhibited a severe deficit in self-motivation in class, barely passing many of thesecond-year courses. On a side note, he was really personable and easy to work with, but clearly didnot take responsibility for his learning.
• September 2011: Abandoned Q&A at the start of class, due to abuse. The same few students werethe only people who ever asked questions, with many others neglecting to do their homework becausethey figured they could just learn the day’s topics from these Q&A sessions.
• 2014: Added third review question to all mastery exams, such that every mastery exam now reviewsimportant concepts from every previous quarter in the second year of the program.
• April 2014: Added DC/AC circuit analysis review question (i.e. applying fundamental analysisprinciples such as Kirchhoff’s Laws and transformer ratios to simple circuits) to all mastery exams.
• May 2015: Upon learning that our traditional 3-hour classroom block schedules would likely disappearin favor of shorter class sessions campus-wide (1 hour, 20 minutes each) for room-scheduling efficiency,Bobby and I experimented with a new theory session format. Small groups of students (no more thanfour to a group) would sign up for half-hour timeslots to check off their homework with either Bobbyor myself in our lab room rather than the classroom. This took place between Noon and 3 PM (still athree-hour block) but we no longer needed to use the classroom and students had more freedom in howthey spent their time. This also makes it possible to teach other courses to small groups of studentsduring unallocated half-hour timeslots (e.g. elective courses for non-Instrumentation students). Directinspection of homework replaced the customary “prep quiz” while the rest of the check-off processcontinued as usual, answering student questions and challenging students to answer new questions. Anystudents not strong on any concept at the end of the half-hour session were given half-credit if theycould come back later that day demonstrating a strong understanding of the concept(s). Test scorescomparable with previous years, less stress during checkoffs due to lower noise levels, seemingly greaterdetail in student note-taking (outlines of reading). Mastery exam re-takes done in the afternoon (ratherthan during lab time), outside of each student’s designated time slot.
• LESSONS LEARNED: Student achievement is a direct function of student effort. The biggestimpediment to student learning by far is students’ own reluctance to study independently. The biggestchallenge for me as an instructor is how to overcome the cultural bias created by years of compulsoryeducation where shallow, lecture-based instruction is the norm; where teachers spoon-feed informationto students; where exams may be passed by doing nothing more than recalling definitions and executingmemorized procedures. General reluctance to study hard is not a mark of individual laziness. If it were,only a minority of students would exhibit this behavior.
78

Question 7
You may find the course structure and format of the INST courses to be quite different from what youhave experienced elsewhere in your education. For each of the following examples, discuss and explain therationale. What do you think is the greater purpose for each of these course standards and policies?
• Homework consists of studying new subjects prior to arriving to class for the theory sessions. Students’primary source of new information is in the form of written materials: textbooks, reports, andmanufacturer’s literature. Daily quizzes at the start of each class session hold students accountable forthis preparatory learning. Why study new subjects outside of class, instead of doing normal homeworkthat reviews subjects previously covered in class? Why the strong emphasis on reading as a mode oflearning?
• Classroom sessions are not lecture-oriented. Rather, classroom sessions place students in an active rolediscussing, questioning, and investigating what they’re learned from their independent studies. Learningnew facts (knowledge) and how to interpret them (comprehension) is the students’ responsibility, and ithappens before class rather than during class. Class time is devoted to higher-level thinking (application,analysis, synthesis, and evaluation). What’s wrong with lecture, especially when the overwhelmingmajority of classes in the world are taught this way?
• Students are expected to track their own academic progress using a computer spreadsheet to calculatetheir own course grades as they progress through each school quarter. Why not simply present the gradesto students?
• Students must explicitly apply “sick hours” to their absences (this is not automatically done by theinstructor!), and seek donations from classmates if they exceed their allotment for a quarter. Why notsimply allow a fixed number of permitted absence for each student, or let the instructor judge the meritsof each student’s absence on a case-by-case basis?
• Mastery exams, where students must answer all questions with 100% accuracy. What’s wrong withregular exams, where a certain minimum percentage of correct answers is all that’s necessary to pass?
• Students may submit optional, ungraded assignments called “feedback questions” to the instructor at theend of most course sections in order to check their preparedness for the higher-level thinking challengesof the upcoming exam. Why in the world would anyone do work that doesn’t contribute to their grade?
• Troubleshooting exercises in lab and diagnostic questions in homework, where students mustdemonstrate sound reasoning in addition to properly identifying the problem(s). Isn’t it enough that thestudent simply finds the fault?
• Extra credit is offered for students wishing to improve their grades, but this extra credit is always in theform of practical and realistic work relevant to the specific course in which the extra credit is desired.Why doesn’t unrelated work count?
file i03484
79

Answer 7
The general philosophy of education in these courses may be summed up in a proverb:
“Give a man a fish and you feed him for a day. Give a man a fishing pole and you feedhim for life.”
Instrumentation is a highly complex, fast-changing career field. You will not survive, much less thrive,in this field if all you can ever learn is what someone directly teaches you. In order to stay up-to-date withnew technology, figure out solutions to novel problems, and adapt to a changing profession, you absolutelymust possess independent learning ability. You must be able to “fish” for new knowledge and understandingon your own. These courses are designed to foster this higher-level skill.
Notes 7
80

Question 8
Explain the difference between a mastery assessment and a proportional-graded assessment. Givenexamples of each in the course(s) you are taking.
file i00113
Answer 8
A mastery assessment is one that must be passed with a 100% score (no errors). Mastery assessmentsare usually given with multiple opportunities to pass. The basic idea is, you try and try until you get itperfect. This ensures mastery of the concept, hence the name.
By contrast, a proportional-graded assessment is one where you do not have to achieve perfection to pass.Most of the tests and assignments you have completed in your life are of this type. A grade (percentage,ranking, and/or letter) is given based on how well you answer the question(s).
In all the Instrumentation courses, all exams have both mastery and proportional sections. Lab exerciseslikewise have both mastery and proportional sections as well. Preparation and feedback grades are strictlyproportional, with no mastery component.
Follow-up question: what happens if you fail to fulfill a mastery assessment within the allotted time?
Notes 8
It should be noted that passing only the mastery assessments in these courses is not enough to achievethe 70% minimum (C- grade) score necessary to pass each course itself, and that failing to pass any masteryassessment within the allotted time or maximum number of attempts will result in a failing grade for thecourse.
81

Question 9
Participation is always an important factor in student success, both in being able to learn enough topass the assessments given in a course, and also to fulfill certain policy expectations. It is vital that studentslearn to manage their time and life outside of school so that their time in school is well-spent. This carriesover to work ethic and the ability to contribute fully on the job. Your instructor’s duty is to prepare youfor the rigors of the workplace as instrument technicians, and the policies of the courses are set up to reflectthis reality.
Explain the attendance policy in these courses, according to the syllabi.file i00115
Answer 9
Each student is allowed a certain number of hours absence time per quarter (refer to the syllabus forthe exact number!), to be used for absences of any reason. Absences exceeding this number of hours willresult in grade deductions (refer to the syllabus to see how severe!). Unused absence hours may be donatedby students to their classmates at the end of each quarter to help out fellow students in need.
Notes 9
82

Question 10
If and when you are unable to attend school for any reason, you need to contact both your instructorand your team-mates. Explain why.
file i00116
Answer 10
Contacting your instructor and team-mates allows you to keep abreast of any new developments, andfind out how you can participate (if possible) during your absence. For instance, there may be somethingyour lab team could have you research while you’re out, to bring back to school the next day.
Notes 10
83

Question 11
You are required to prepare for the classroom (theory) session by completing any reading assignmentsand/or attempting to answer worksheet questions assigned for each day, before arriving to class. Thisnecessarily involves substantial independent research and problem-solving on your part.
What should you do if you encounter a question that completely mystifies you, and you have no ideahow to answer it? By the same token, what should you do if you encounter a section of the required readingthat you just can’t seem to understand?
file i00122
Answer 11
If you find yourself completely lost on a question or on a portion of the assigned reading despite havingexhausted all available study time before class, you should highlight these specific points in your notes andseek help immediately at the beginning of class time. Chances are, you won’t be the only person with thatsame question, and your query at the beginning of class will help others too!
Notes 11
84

Question 12
Watch the US Chemical Safety Board video on the 2005 Texas City oil refinery explosion (availableon such Internet video sites as YouTube, and at the USCSB website directly), and answer the followingquestions:
• What factors caused the explosion to occur?
• How was instrumentation involved in this accident?
• What precautions could have prevented the accident?
Now, shift your focus to this program of study you are engaged in here. Given the context of what youhave just seen (dangerous environments, complex systems), identify some of the skills and traits you willneed at the workplace as an instrument technician, and identify how you may gain these skills and traitswhile in school.
file i03852
Answer 12
Notes 12
85

Question 13
Read and discuss the bullet-point suggestions given in “Question 0” of this worksheet on how to maximizeyour reading effectiveness. Then, apply these tips to an actual document: pages 81 through 89 of the Reportof the President’s Commission on The Accident at Three Mile Island, where the prologue to the “Accountof the Accident” chapter explains the basic workings of a nuclear power plant.
After taking about half an hour in class to actively read these nine pages – either individually or ingroups – discuss what you were able to learn about nuclear power plant operation from the text, and alsohow active reading helps you maximize the learning experience.
file i03861
Answer 13
An anecdote to relate regarding active reading on challenging subjects is when I had to study policystatements at BTC in preparation for an accreditation audit. The texts were long, boring, and I had littleinterest in their particulars. I found myself nodding off as I tried to read the policy statements, and unableto explain the meaning of what I had just read. Finally, I forced myself to outline each section of these policypapers in my own words, paragraph by paragraph, until I could articulate their meaning. To be sure, thistechnique took longer than simply reading the text, but it was far more effective than plain reading (evenwith underlining and highlighting!).
I’ve successfully applied similar strategies studying labor contracts for my work with the union at BTC.Several times I’ve been called upon to research policies in other college contracts, and I have done so (again)by summarizing their statements in my own words to ensure I am comprehending them as I read.
Notes 13
Here are my own active-reading notes from this exercise, typed over a period of 17 minutes activelyreading the text:
Nuclear reactors produce heat to turn water into steam. This heat comes from fission – the splittingof uranium nuclei by free neutrons in a chain reaction. Impacting neutrons cause uranium nuclei to split,releasing heat and more neutrons to split other uranium nuclei.
Uranium fuel encased in “Zircalloy” tubes (fuel rods) to allow heat to transfer to water whilebeing transparent to neutrons. Reactor 2 contains over 36,000 fuel rods, with 69 control rods and 52instrumentation rods.
Control rods absorb neutrons, damping or quenching chain-reaction. Inserting rods stops reaction,withdrawing rods speeds it up. Power output of reactor controlled by number and depth of control rodinsertion. Magnetic release of control rods (gravity-drop) is called a “scram” to shut down the reactorimmediately.
Reactors cannot explode like bombs, but they have potential to release dangerous radioactive materials.Three barriers to release: fuel rods, reactor vessel and piping, and finally the concrete containment building.
Reactor water pressurized (2155 PSI) to prevent boiling. Pressure generated by a unit called the“pressurizer” nearly half-full of water and half-full of steam. If boiling occurs in the reactor, water level maydrop and expose fuel rods. This may lead to overheating, and this to hydrogen production and potentialrelease of radioactive materials into the cooling water.
“Primary” water coolant loop transfers heat from the reactor core to the steam generator (heatexchanger), where “secondary” water boils and becomes steam to turn the steam turbine to make electricity.Four 9000 HP pumps circulate the primary coolant. Steam exiting turbine gets re-condensed into waterin another heat exchanger (the condenser) by another water loop sent to the large cooling towers. Onlythe primary water is radioactive during normal operation. All equipment circulating this primary water ishoused inside the containment building. The secondary loop equipment is outside the containment.
In a Loss-Of-Cooling-Accident (LOCA), an emergency coolant system exists to maintain reactor corewater coverage. Operators did not keep the High Pressure Injection (HPI) emergency coolant pumps runningas they should have!
86

Question 14
Suppose an ammeter inserted between test point C and the nearest lead of resistor R2 registers 10 mAin this series-parallel circuit:
R1
R2
R3
1 kΩ
1 kΩ
1 kΩ
A
B
C
D
E
F
(24 voltsvoltage-limited)
10 mA
Identify the likelihood of each specified fault for this circuit. Consider each fault one at a time (i.e. nocoincidental faults), determining whether or not each fault could independently account for all measurementsand symptoms in this circuit.
Fault Possible ImpossibleR1 failed openR2 failed openR3 failed open
R1 failed shortedR2 failed shortedR3 failed shorted
Current source dead
Suggestions for Socratic discussion
• Identify which fundamental principles of electric circuits apply to each step of your analysis of thiscircuit. In other words, be prepared to explain the reason(s) “why” for every step of your analysis,rather than merely describing those steps.
• This type of problem-solving question is common throughout the Instrumentation course worksheets.What specific skills will you build answering questions such as this? How might these skills be practicalin your chosen career?
• An assumption implicit in this activity is that it is more likely a single fault occurred than multiple,coincidental faults. Identify realistic circumstances where you think this would be a valid assumption.Hint: research the philosophical proverb called Occam’s Razor for more information! Are there anyrealistic circumstances where the assumption of only one fault would not be wise?
This question is typical of those in the “Fault Analysis of Simple Circuits” worksheet found in theSocratic Instrumentation practice worksheet collection (online), except that all answers are provided forthose questions. Feel free to use this practice worksheet to supplement your studies on this very importanttopic.
file i04489
87
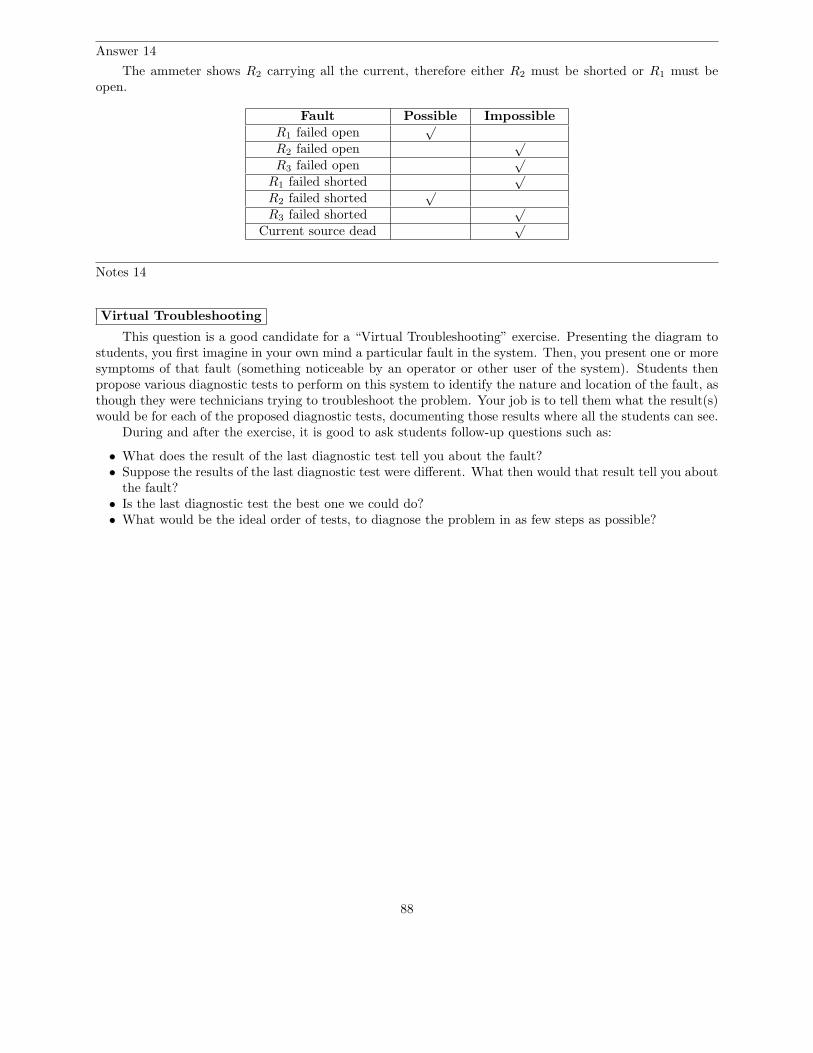
Answer 14
The ammeter shows R2 carrying all the current, therefore either R2 must be shorted or R1 must beopen.
Fault Possible ImpossibleR1 failed open
√
R2 failed open√
R3 failed open√
R1 failed shorted√
R2 failed shorted√
R3 failed shorted√
Current source dead√
Notes 14
Virtual Troubleshooting
This question is a good candidate for a “Virtual Troubleshooting” exercise. Presenting the diagram tostudents, you first imagine in your own mind a particular fault in the system. Then, you present one or moresymptoms of that fault (something noticeable by an operator or other user of the system). Students thenpropose various diagnostic tests to perform on this system to identify the nature and location of the fault, asthough they were technicians trying to troubleshoot the problem. Your job is to tell them what the result(s)would be for each of the proposed diagnostic tests, documenting those results where all the students can see.
During and after the exercise, it is good to ask students follow-up questions such as:
• What does the result of the last diagnostic test tell you about the fault?• Suppose the results of the last diagnostic test were different. What then would that result tell you about
the fault?• Is the last diagnostic test the best one we could do?• What would be the ideal order of tests, to diagnose the problem in as few steps as possible?
88

Question 15
Answer 15
Notes 15
89

Question 16
Answer 16
Notes 16
90

Question 17
Answer 17
Notes 17
91

Question 18
Answer 18
Notes 18
92

Question 19
Answer 19
Notes 19
93

Question 20
Answer 20
Notes 20
94

Question 21
Read and outline the introduction to the “Introduction to Industrial Instrumentation” chapter in yourLessons In Industrial Instrumentation textbook. Note the page numbers where important illustrations,photographs, equations, tables, and other relevant details are found. Prepare to thoughtfully discuss withyour instructor and classmates the concepts and examples explored in this reading, including the followingdefinitions:
• Process
• Process Variable (PV)
• Setpoint (SP)
• Primary Sensing Element (PSE)
• Transducer
• Lower Range Value (LRV)
• Upper Range Value (URV)
• Zero
• Span
• Controller
• Final Control Element (FCE)
• Manipulated Variable (MV) or Output
Suggestions for Socratic discussion
• As a student in an “inverted” classroom, your role as a learner is substantially different from that of astudent in a lecture-based classroom. Rather than receive information from the instructor via lecture,you are tasked with gathering this information on your own outside of class. What, then, will youdo during class time with the instructor? If there is no lecture, how is class time spent and for whatpurpose?
• What should you do if you arrive to class having not understood parts of what you studied inpreparation?
• If you are new to an inverted classroom format, describe how this shift will affect your approach tolearning.
file i03862
Answer 21
95

Notes 21
Instrumentation is the science of measurement and control.
Measuring device → Controller → Final control element → Process → (loop)
Home heating/cooling system:• Thermostat acts as measuring device and control device• Heater/AC acts as final control element• “Setpoint” = desired temperature
• Process = what it is we’re trying to measure and/or control• PV = specific variable being measured/controlled• SP = desired value of PV• PSE = sensor doing the measurement• Transducer = converts between standard signals, or processes that signal• LRV = 0% point of a transmitter’s calibrated range• URV = 100% point of a transmitter’s calibrated range• Zero = LRV• Span = URV - LRV• Controller = the decision-making part of a control system• FCE = “muscle” of the control system• MV = controller output signal
Suggestions for Socratic discussion
• Feedback control systems are often referred to as control loops. Explain why the word “loop” isappropriate to the description of a control system.
• If a pressure transmitter has a calibrated range of 100 to 1000 PSI, what is its LRV and URV? What isits zero and span?
• If a pressure transmitter has a calibrated range of −10 to +10 PSI, what is its LRV and URV? What isits zero and span?
• If a pressure transmitter has a calibrated range of −25 kPa to −70 kPa, what is its LRV and URV?What is its zero and span?
• If a temperature transmitter has a calibrated range of 500 to 1200 degrees C, what is its LRV and URV?What is its zero and span?
• If a temperature transmitter has a calibrated range of −250 to +300 degrees F, what is its LRV andURV? What is its zero and span?
• If a flow transmitter has a calibrated range of 0 to 40 liters per minute, what is its LRV and URV?What is its zero and span?
• If a level transmitter has a calibrated range of 10 to 50 inches, what is its LRV and URV? What is itszero and span?
• If a pH transmitter has a calibrated range of 4 to 12 pH, what is its LRV and URV? What is its zeroand span?
• If an oxygen transmitter has a calibrated range of 0 to 90%, what is its LRV and URV? What is its zeroand span?
96

Question 22
Read and outline the “Example: Boiler Water Level Control System” section of the “Introduction toIndustrial Instrumentation” chapter in your Lessons In Industrial Instrumentation textbook. Note the pagenumbers where important illustrations, photographs, equations, tables, and other relevant details are found.Prepare to thoughtfully discuss with your instructor and classmates the concepts and examples explored inthis reading.
Active reading tip
In order to read a text actively, your mind needs to be fully attentive to the words on the page. This iswhy you are asked to write an outline of the text you’ve been assigned to read. This means much more thanjust highlighting and underlining words, but actually expressing what you have learned in your own words.Your instructor will check your outline for this level of engagement when you come to the “inverted” classsession to present what you have learned.
If you discover a section of the text that you just can’t seem to summarize in your own words, it is anindication to you that you’re not comprehending that section of text. This is one of the benefits of writingan outline: it serves as a self-check for understanding, whereas highlighting and underlining does not.
file i03863
Answer 22
97

Notes 22
Control system needed to maintain a steady level of water in the upper drum of a steam boiler.
LT senses drum water level, reports as a pneumatic (air pressure) signal. LIC receives LT’s signal,compares against SP, then sends MV signal to valve. LV moved by controller’s air pressure signal, returnedby spring action, throttles make-up water flow into drum.
A controller in automatic mode moves the valve to whatever position is needed to keep PV = SP. Thismeans the valve will be moved by the controller in response not only to SP changes but also steam demandchanges. In other words, the valve’s position is not just a function of the SP value – valve position is also afunction of “how hard” the control system is trying in order to maintain PV = SP.
A controller placed in manual mode moves the valve to whatever position deemed by human operator.It will still display the PV, but a controller in manual mode takes no action to regulate the PV. In otherwords, its output signal will be unresponsive to changes in PV or SP while in manual mode. Manual modeis a useful diagnostic tool, for de-coupling the PV from the Output, allowing you to diagnose (for instance)the cause behind an erratic PV signal. If placing the controller in manual mode stabilizes the PV, then thecontroller is at fault; if placing the controller in manual mode results in an even wilder PV, then a processload is at fault.
This particular control system uses compressed air as the signaling medium. 3 to 15 PSI represents 0%to 100% of signal range:
• 3 PSI = 0%
• 9 PSI = 50%
• 15 PSI = 100%
• 0% and 100% of measurement range need not be absolute limits of process!
Even though the PV and MV signals in a control loop typically use the same range (e.g. 3-15 PSI or4-20 mA), we have no reason to expect that PV = MV except by chance. PV and MV represent two entirelydifferent variables in the process, despite using the same type and range of representative signal.
Suggestions for Socratic discussion
• This is a good opportuity to emphasize active reading strategies as you check students’comprehension of today’s homework, because it will set the pace for your students’homework completion from here on out. I strongly recommend challenging students toapply the “Active Reading Tips” given in this and other questions in today’s assignment,making this the primary focus and the instrumentation concepts the secondary focus.
• Explain how manual mode differs from automatic mode in a controller, using a practical example toillustrate.
• Explain why a process transmitter might not be ranged to indicate the full physical limits of the processvariable (e.g. a steam drum level transmitter outputting 0% at 40% full and outputting 100% at 60%full).
• How will the steam drum control loop respond to an increase in steam demand with the controller inautomatic mode?
• How will the steam drum control loop respond to an increase in steam demand with the controller inmanual mode?
• What would happen in this process if the LT failed with a low signal, with the controller in automaticmode?
• What would happen in this process if the LT failed with a high signal, with the controller in automaticmode?
98

• What would happen in this process if the LT failed with a low signal, with the controller in manualmode?
• What would happen in this process if the LT failed with a high signal, with the controller in manualmode?
• What would happen in this process if the air tube connecting the LIC to the valve sprung a leak, withthe controller in automatic mode?
• What would happen in this process if the air tube connecting the LIC to the valve sprung a leak, withthe controller in manual mode?
• Why might we calibrate the range of a transmitter to be something other than the extreme limits ofthe process? For example, in this steam drum level control system, the LT might be calibrated so thatit registered 0% level when the drum was actually 30% full, and register 100% level when the drum wasactually 70% full.
99

Prep Quiz:
Part A – multiple-choice If the person responsible for operating a steam boiler in a power plant places thesteam drum water level controller into “manual” mode, it means:
• Any alarm indications or warning buzzers will be “mute” and unable to alert anyone
• The controller’s setpoint value will now be fixed at a constant value of 50%
• Additional automatic safety measures will now be in effect to guard against overflowing
• That feedwater control valve will strictly do only what the human operator tells it to
• The controller will now be hyper-responsive to any changes in steam drum water level
• The controller’s action will be switched from direct to reverse, or vice-versa
Part B – written response Explain how you can identify the specific topics covered on any upcoming“mastery” exam.
Part C – written response Explain in your own words how the content of a “proportional” exam differsfrom that of a “mastery” exam. In other words, what kinds of challenge(s) will you find on a proportionalexam that you will not find on a mastery exam?
Note: your explanations need to be complete and clearly written. Expressing your ideas clearly andcompletely is every bit as important as having those ideas correct in your own mind!
100

Prep Quiz:
Part A – multiple-choice A common misconception among students first learning about instrumentationand control systems is that the signal output by a controller must have the same value at all times as thesignal input to the controller from the transmitter. The reason this is not true is because:
• As the transmitter signal increases, the controller’s output signal must decrease
• These two signals represent entirely different aspects of the process being controlled
• These two signals are always of a different type (e.g. 3-15 PSI versus 4-20 mA)
• In manual mode the output of a controller is fixed by the human operator
• In automatic mode the output of a controller always follows the PV signal
• Tony says so
Part B – written response Explain how you can identify the specific topics covered on any upcoming“mastery” exam.
Part C – written response Explain in your own words how the content of a “proportional” exam differsfrom that of a “mastery” exam. In other words, what kinds of challenge(s) will you find on a proportionalexam that you will not find on a mastery exam?
Note: your explanations need to be complete and clearly written. Expressing your ideas clearly andcompletely is every bit as important as having those ideas correct in your own mind!
101

Question 23
Read and outline the “Example: Wastewater Disinfection” section of the “Introduction to IndustrialInstrumentation” chapter in your Lessons In Industrial Instrumentation textbook. Note the page numberswhere important illustrations, photographs, equations, tables, and other relevant details are found. Prepareto thoughtfully discuss with your instructor and classmates the concepts and examples explored in thisreading.
Active reading tip
One of the distinctive differences between technical reading and the reading of other document typesis the degree to which the reader needs to jump back and forth between the words of the text and theillustrations. Identify portions of this reading assignment where it would be wise to stop reading the wordsand switch your attention to one or more illustrations, in order to put context to those words.
file i03864
Answer 23
102
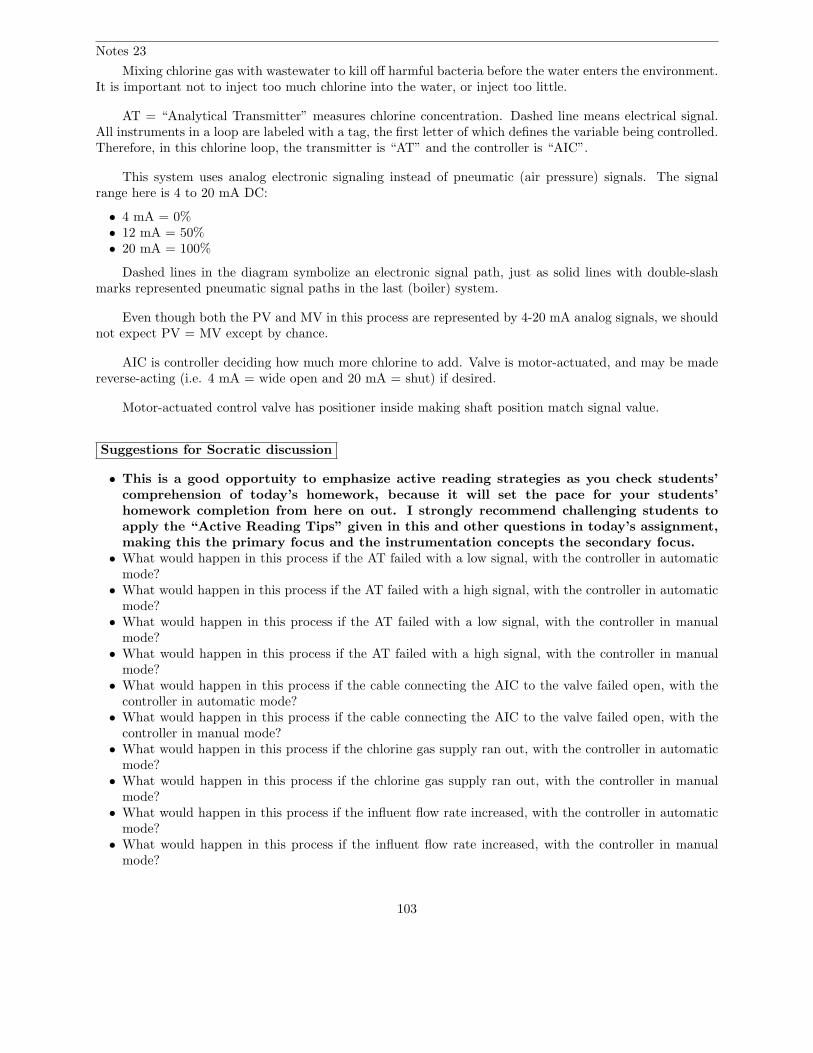
Notes 23
Mixing chlorine gas with wastewater to kill off harmful bacteria before the water enters the environment.It is important not to inject too much chlorine into the water, or inject too little.
AT = “Analytical Transmitter” measures chlorine concentration. Dashed line means electrical signal.All instruments in a loop are labeled with a tag, the first letter of which defines the variable being controlled.Therefore, in this chlorine loop, the transmitter is “AT” and the controller is “AIC”.
This system uses analog electronic signaling instead of pneumatic (air pressure) signals. The signalrange here is 4 to 20 mA DC:
• 4 mA = 0%• 12 mA = 50%• 20 mA = 100%
Dashed lines in the diagram symbolize an electronic signal path, just as solid lines with double-slashmarks represented pneumatic signal paths in the last (boiler) system.
Even though both the PV and MV in this process are represented by 4-20 mA analog signals, we shouldnot expect PV = MV except by chance.
AIC is controller deciding how much more chlorine to add. Valve is motor-actuated, and may be madereverse-acting (i.e. 4 mA = wide open and 20 mA = shut) if desired.
Motor-actuated control valve has positioner inside making shaft position match signal value.
Suggestions for Socratic discussion
• This is a good opportuity to emphasize active reading strategies as you check students’comprehension of today’s homework, because it will set the pace for your students’homework completion from here on out. I strongly recommend challenging students toapply the “Active Reading Tips” given in this and other questions in today’s assignment,making this the primary focus and the instrumentation concepts the secondary focus.
• What would happen in this process if the AT failed with a low signal, with the controller in automaticmode?
• What would happen in this process if the AT failed with a high signal, with the controller in automaticmode?
• What would happen in this process if the AT failed with a low signal, with the controller in manualmode?
• What would happen in this process if the AT failed with a high signal, with the controller in manualmode?
• What would happen in this process if the cable connecting the AIC to the valve failed open, with thecontroller in automatic mode?
• What would happen in this process if the cable connecting the AIC to the valve failed open, with thecontroller in manual mode?
• What would happen in this process if the chlorine gas supply ran out, with the controller in automaticmode?
• What would happen in this process if the chlorine gas supply ran out, with the controller in manualmode?
• What would happen in this process if the influent flow rate increased, with the controller in automaticmode?
• What would happen in this process if the influent flow rate increased, with the controller in manualmode?
103

Question 24
Read and outline the “Example: Chemical Reactor Temperature Control” section of the “Introductionto Industrial Instrumentation” chapter in your Lessons In Industrial Instrumentation textbook. Note thepage numbers where important illustrations, photographs, equations, tables, and other relevant details arefound. Prepare to thoughtfully discuss with your instructor and classmates the concepts and examplesexplored in this reading.
Active reading tip
Well-written technical texts always model problem-solving strategies for the reader. In this particularsection of text, a problem-solving technique called a thought experiment was applied to a particular point.Explain what a “thought experiment” is, and how this technique was applied in the problem at hand inthe text. Furthermore, identify ways you might be able to apply “thought experiments” of your own whenreading technical texts in the future.
file i03865
Answer 24
104

Notes 24
Heat added to reactor by introducing steam to a “jacket” surrounding the vessel.
TT is digital (fieldbus) instead of analog (4-20 mA). Temperature represented by electrical pulsesconveying binary number data. Fieldbus transmitters can also report other data, like self-diagnostics.
TIC output goes to TY, converting 4-20 mA into 3-15 PSI (transducer). TV is a pneumatically actuatedvalve, air-to-open (ATO).
The controller in this process must be configured for reverse action, so that when temperature risesabove setpoint, the controller will output a decreasing signal to the control valve which will cause that valveto close more and reduce steam to the reactor. A direct-acting controller in the steam-heating system wouldmove the valve the wrong way (further open) if the temperature became too hot. However, direct actionis perfect for the glycol-chilled beer fermenting system shown later. Controller action is a user-configurableparameter.
This section of the book introduces the concept of a thought experiment to the reader: imagining theresponse of a control system to a change in its process variable. By considering which direction the automaticcontroller’s output signal must vary to stabilize the process as a result of the PV’s change, we may determinethe necessary direction of control action.
PT is a digital wireless (radio) unit. Like fieldbus, only no copper wires! At this writing (2011),wireless not recommended for mission-critical control applications, but mostly monitoring. Battery powerand potential blockage of radio signal pathways makes wireless a less reliable technology than wiredinstrumentation.
Suggestions for Socratic discussion
• This is a good opportuity to emphasize active reading strategies as you check students’comprehension of today’s homework, because it will set the pace for your students’homework completion from here on out. I strongly recommend challenging students toapply the “Active Reading Tips” given in this and other questions in today’s assignment,making this the primary focus and the instrumentation concepts the secondary focus.
• A powerful problem-solving technique is performing a thought experiment where you mentally simulatethe response of a system to some imagined set of conditions. Explain how such a “thought experiment”was used in the text to explore the operation of the chemical reactor temperature control system.
• What dictates the correct action (either direct or reverse) for a loop controller? How do we determinethe correct action for any given process? What might happen if a controller is configured for the wrongdirection of action?
• What would happen in this process if the TT failed with a low signal, with the controller in automaticmode?
• What would happen in this process if the TT failed with a high signal, with the controller in automaticmode?
• What would happen in this process if the TT failed with a low signal, with the controller in manualmode?
• What would happen in this process if the TT failed with a high signal, with the controller in manualmode?
• What would happen in this process if the air tube connecting the TY to the valve sprung a leak, withthe controller in automatic mode?
• What would happen in this process if the air tube connecting the TY to the valve sprung a leak, withthe controller in manual mode?
• What would happen in this process if the boiler supplying steam shut down, with the controller inautomatic mode?
105

• What would happen in this process if the boiler supplying steam shut down, with the controller inmanual mode?
• What would happen in this process if the PT failed with a low signal, with the controller in automaticmode?
• What would happen in this process if the PT failed with a high signal, with the controller in automaticmode?
• What dictates the proper direction of action (e.g. direct or reverse) for a loop controller?
106

Question 25
Read and outline the “Process Switches and Alarms” subsection of the “Other Types of Instruments”section of the “Introduction to Industrial Instrumentation” chapter in your Lessons In IndustrialInstrumentation textbook. Note the page numbers where important illustrations, photographs, equations,tables, and other relevant details are found. Prepare to thoughtfully discuss with your instructor andclassmates the concepts and examples explored in this reading.
Active reading tip
In an “inverted” learning environment where assignments such as this substitute for instructor-drivenlecture, there is more opportunity for students to share what they have learned with each other. When youmeet with your instructor today to review the material, share the points you found in today’s reading thatwere clear to you, as well as the points you found confusing. This will stimulate valuable conversation overthe text, and prompt everyone to think deeper about it.
file i03868
Answer 25
107
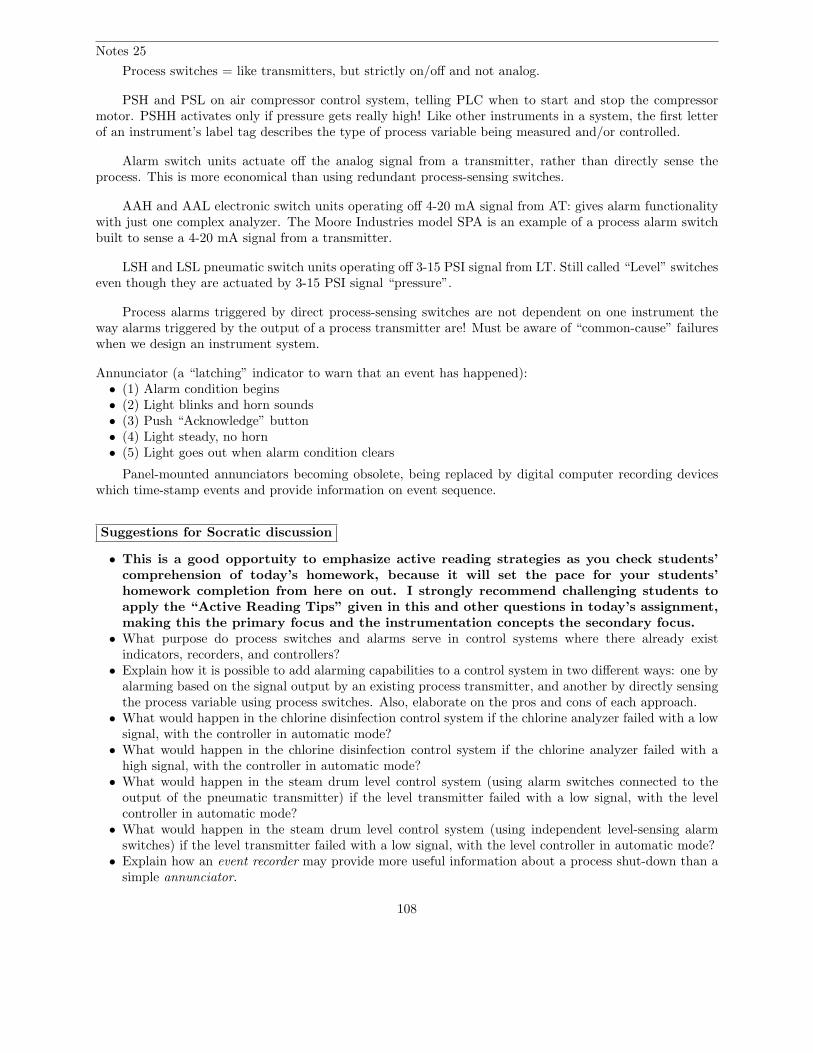
Notes 25
Process switches = like transmitters, but strictly on/off and not analog.
PSH and PSL on air compressor control system, telling PLC when to start and stop the compressormotor. PSHH activates only if pressure gets really high! Like other instruments in a system, the first letterof an instrument’s label tag describes the type of process variable being measured and/or controlled.
Alarm switch units actuate off the analog signal from a transmitter, rather than directly sense theprocess. This is more economical than using redundant process-sensing switches.
AAH and AAL electronic switch units operating off 4-20 mA signal from AT: gives alarm functionalitywith just one complex analyzer. The Moore Industries model SPA is an example of a process alarm switchbuilt to sense a 4-20 mA signal from a transmitter.
LSH and LSL pneumatic switch units operating off 3-15 PSI signal from LT. Still called “Level” switcheseven though they are actuated by 3-15 PSI signal “pressure”.
Process alarms triggered by direct process-sensing switches are not dependent on one instrument theway alarms triggered by the output of a process transmitter are! Must be aware of “common-cause” failureswhen we design an instrument system.
Annunciator (a “latching” indicator to warn that an event has happened):• (1) Alarm condition begins• (2) Light blinks and horn sounds• (3) Push “Acknowledge” button• (4) Light steady, no horn• (5) Light goes out when alarm condition clears
Panel-mounted annunciators becoming obsolete, being replaced by digital computer recording deviceswhich time-stamp events and provide information on event sequence.
Suggestions for Socratic discussion
• This is a good opportuity to emphasize active reading strategies as you check students’comprehension of today’s homework, because it will set the pace for your students’homework completion from here on out. I strongly recommend challenging students toapply the “Active Reading Tips” given in this and other questions in today’s assignment,making this the primary focus and the instrumentation concepts the secondary focus.
• What purpose do process switches and alarms serve in control systems where there already existindicators, recorders, and controllers?
• Explain how it is possible to add alarming capabilities to a control system in two different ways: one byalarming based on the signal output by an existing process transmitter, and another by directly sensingthe process variable using process switches. Also, elaborate on the pros and cons of each approach.
• What would happen in the chlorine disinfection control system if the chlorine analyzer failed with a lowsignal, with the controller in automatic mode?
• What would happen in the chlorine disinfection control system if the chlorine analyzer failed with ahigh signal, with the controller in automatic mode?
• What would happen in the steam drum level control system (using alarm switches connected to theoutput of the pneumatic transmitter) if the level transmitter failed with a low signal, with the levelcontroller in automatic mode?
• What would happen in the steam drum level control system (using independent level-sensing alarmswitches) if the level transmitter failed with a low signal, with the level controller in automatic mode?
• Explain how an event recorder may provide more useful information about a process shut-down than asimple annunciator.
108

Question 26
A tachogenerator is a small DC generator designed to output a voltage directly proportional to thespeed of a rotating shaft. These instruments are used to generate an analog electrical signal representingthe rotary speed of a mechanism. An indicator is an instrument used to display a measured variable toa human. A recorder is a similar instrument used to display a measured variable as a “trend” graph overtime. A Data Acquisition Unit (abbreviated DAQ) inputs one or more analog electrical signal and outputsa digital number representing those signals, essentially a set of analog-to-digital converters combined withdigital networking circuitry. DAQ units are often used in telemetry systems where various measurementsmust be taken and reported over long distances via a digital network such as Ethernet or radio.
With these definitions in mind, examine the following pictorial diagram and explain the purpose of eachcomponent within the system:
Tachogenerator(coupled to the shaft
of a diesel engine)
0 to 2000 RPM0 to 10 VDC
Terminalblock Ch1
Ch3
Ch4
Com
DAQ
range
- +
Indicator
±2 VDCCh210 kΩ10 kΩ5 kΩ
0-10 VDCrange
RPM
0 20001000
21
22
23
24
Ethernetnetworkcable
Computer monitor
Engine speed
Suppose the diesel engine happens to be running at full speed (2000 revolutions per minute, or 2000RPM). Identify the amount of voltage we would expect to measure between the following pairs of points inthe circuit at this engine speed:
• V21−24 = volts
• V22−COM = volts
• V24−COM = volts
file i03867
109

Answer 26
Notes 26
The indicator is simply a DC voltmeter with a scale that reads 0 to 2000 RPM, driven directly by the0-10 volt signal produced by the tachogenerator.
The three resistors on the terminal block comprise a voltage divider to take the tachogenerator’s 0-10volt signal and reduce it to 0-2 volts DC for the DAQ to measure.
The DAQ is a multi-channel voltage-sensing analog-to-digital converter. In this system we are onlyusing channel 2 of the DAQ to sense engine speed.
The computer monitor communicates with the DAQ via an Ethernet network, displaying engine speed(represented by the DAQ’s sensed voltage signal on channel 2) as a trend graph over time.
• V21−24 = 10 volts
• V22−COM = 6 volts
• V24−COM = 0 volts (these are equipotential points)
110

Question 27
Examine these two pneumatic control “loops” (transmitter-controller-valve systems) for an industrialboiler, controlling both water level and steam pressure:
PVSP
A.S.
A.S.
LT
Risertubes
Downcomertubes
Steam
Steam drum
Mud drum
Exhaust stack
Feedwater
LIC
water
PT A.S.
PVSP
A.S.
PIC
Burne
r
Fuel gas
Boiler
ATO(air to open)
(air to open)ATO
If the PIC setpoint is 225 PSI and the measured pressure begins to fall below that value, how shouldthe PIC respond, and how will this response bring the steam pressure back up to setpoint?
If the pump supplying feedwater to the boiler begins to wear down over time, becoming less and lesseffective at providing water pressure to the level control valve, how do you suspect the LIC will respond overtime as it works to maintain steam drum water level at setpoint?
Describe a situation where manual mode might be useful to either the boiler operator, or to an instrumenttechnician tasked with maintaining either of these control loops.
Suppose the level transmitter’s calibration was 12 to 22 inches of water level while the level indicatingcontroller’s calibration was 10 to 20 inches of water level. How many inches of water level would the LICindicate when the actual steam drum water level was 17 inches?
file i00478
111

Answer 27
If pressure falls, PIC should increase fuel to burner.
As feedwater pump wears, LIC should open valve more.
The operator could use manual mode to gradually heat boiler during start-up, or to shut it down.
I’ll let you figure out what the LIC would indicate!
Notes 27
If steam pressure begins to fall below setpoint, the PIC should send an increasing signal to the fuel gasvalve, causing the burner to output more heat and thereby raising the steam pressure to setpoint again. Ifwell-tuned, a loop controller will drive its output signal to whatever value is necessary to achieve PV = SP.
As the feedwater pump wears, the level control valve will have to open up over time to achieve the samewater flow rate into the boiler, all other factors being equal. Thus, the LIC outputs a signal that is slightlygreater as time goes on, in order to compensate for the mechanical changes happening in the feedwaterpump.
Manual mode would be useful for the following scenarios:
• Briefly “stroke-testing” either control valve to check for proper stem motion• Holding either control valve in a set position while the transmitter was disconnected from the controller
for maintenance purposes• Introducing a “step-change” disturbance into the boiler by placing the controller in manual and then
“bumping” the output signal either up or down just a bit, observing the process variable response overtime to learn how the boiler naturally responds to such a change.
When the actual water level was 17 inches (signal pressure = 9 PSI = 50%), the LIC would register 15inches (50% of range).
Suggestions for Socratic discussion
• If the LT outputs a 9 PSI (50%) signal, what position will the feedwater control valve be in? If wecannot tell, identify the missing information.
• What would happen in this system if the PT failed with a high signal, with the PIC in automatic mode?• What would happen in this system if the fuel gas supply line got shut off, with the PIC in automatic
mode?• What would happen in this system if the feedwater pump suddenly stopped, with the LIC in automatic
mode?• What would happen in this system if the feedwater pump suddenly stopped, with the LIC in manual
mode?
112

Virtual Troubleshooting
Predicting the effect of a given fault: present each of the following faults to the students, one at a time,having them comment on all the effects each fault would produce.
• Air supply pressure to LIC fails (0 PSI)• Air supply pressure to PIC fails (0 PSI)• Air tube between LT and LIC leaks (fails vented)• Air tube between PT and PIC leaks (fails vented)• Fuel gas supply pressure falls well below normal
Determining the utility of given diagnostic tests: imagine the pressure transmitter fails with a highsignal (> 15 PSI output) in this system (but don’t tell this to students!). Present the operator’s observation(s)to the students, have them consider possible faults and diagnostic strategies, and then propose the followingdiagnostic tests one by one. Have students rate the value of each test, determining whether or not each testwould give us useful information (i.e. tell us something we don’t already know). Also have students describewhat re
• PT failed high, PIC sends 0% signal to fuel gas valve• Place PIC in manual mode and raise output signal while watching PV display – No• Place PIC in manual mode and change output signal while watching control valve – Yes• Check reading of flow transmitter somewhere upstream in the fuel gas line – Yes• Place LIC in manual mode and change output signal while watching PIC reading – No
Diagnosing a fault based on given symptoms: imagine the air supply to the LIC fails (0 PSI) in thissystem (but don’t tell this to students!). Present the operator’s observation(s) to the students, have themconsider possible faults and diagnostic strategies, and then tell them the results of tests they propose basedon the following symptoms, until they have properly identified the nature and location of the fault:
• Operator sees the LIC’s PV begin to fall below SP, as the control valve shuts off and the boiler runs outof water
113

Question 28
Suppose the electric motor refuses to run when the “Run” pushbutton switch is pressed. A technicianbegins diagnosing the circuit, following the steps shown (in order):
+−
12 volts
A
B
C
D
E
F
current-limited)Motor(1.8 amps
Run
• Test 1: Measured 12 volts DC between points C and D, with “Run” switch pressed.
• Test 2: Measured 0 volts DC between points A and C, with “Run” switch unpressed.
• Test 3: Measured 12 volts DC between points A and B, with “Run” switch pressed.
• Test 4: Measured 12 volts DC between points E and F, with “Run” switch pressed.
• Test 5: Measured infinite ohms between points E and F, with “Run” switch unpressed.
Identify any useful information about the nature or location of the fault derived from the results of eachtest, in order of the tests performed. If the test is not useful (i.e. provides no new information), mark it assuch. Assuming there is only one fault in the circuit, identify the location and nature of the fault as preciselyas you can from the test results shown above.
file i00975
Answer 28
The fault is an “open,” between points E and F.
114

Notes 28
• Test 1: Measured 12 volts DC between points C and D, with “Run” switch pressed. Proves that theproblem is to the right of these test points (toward the motor). The 12 VDC source is good, and the“Run” switch is not faulted open. It also proves that the fault is not a short, but must be an open.
• Test 2: Measured 0 volts DC between points A and C, with “Run” switch unpressed. This isn’t a stictlynecessary test, as we already know the fault is an open somewhere in the C-E-F-D pathway. However,it certainly does confirm the diagnosis of an “open” (versus “shorted”) fault.
• Test 3: Measured 12 volts DC between points A and B, with “Run” switch pressed. This is anunnecessary test, as we already know the source is not dead from Test 1.
• Test 4: Measured 12 volts DC between points E and F, with “Run” switch pressed. Proves the problemis an “open” fault between these test points, most likely inside the motor.
• Test 5: Measured infinite ohms between points E and F, with “Run” switch unpressed. This test isnot really necessary, as we already know there’s an “open” fault between points E and F.
Virtual Troubleshooting
This question is a good candidate for a “Virtual Troubleshooting” exercise. Presenting the diagram tostudents, you first imagine in your own mind a particular fault in the system. Then, you present one or moresymptoms of that fault (something noticeable by an operator or other user of the system). Students thenpropose various diagnostic tests to perform on this system to identify the nature and location of the fault, asthough they were technicians trying to troubleshoot the problem. Your job is to tell them what the result(s)would be for each of the proposed diagnostic tests, documenting those results where all the students can see.
During and after the exercise, it is good to ask students follow-up questions such as:
• What does the result of the last diagnostic test tell you about the fault?• Suppose the results of the last diagnostic test were different. What then would that result tell you about
the fault?• Is the last diagnostic test the best one we could do?• What would be the ideal order of tests, to diagnose the problem in as few steps as possible?
115
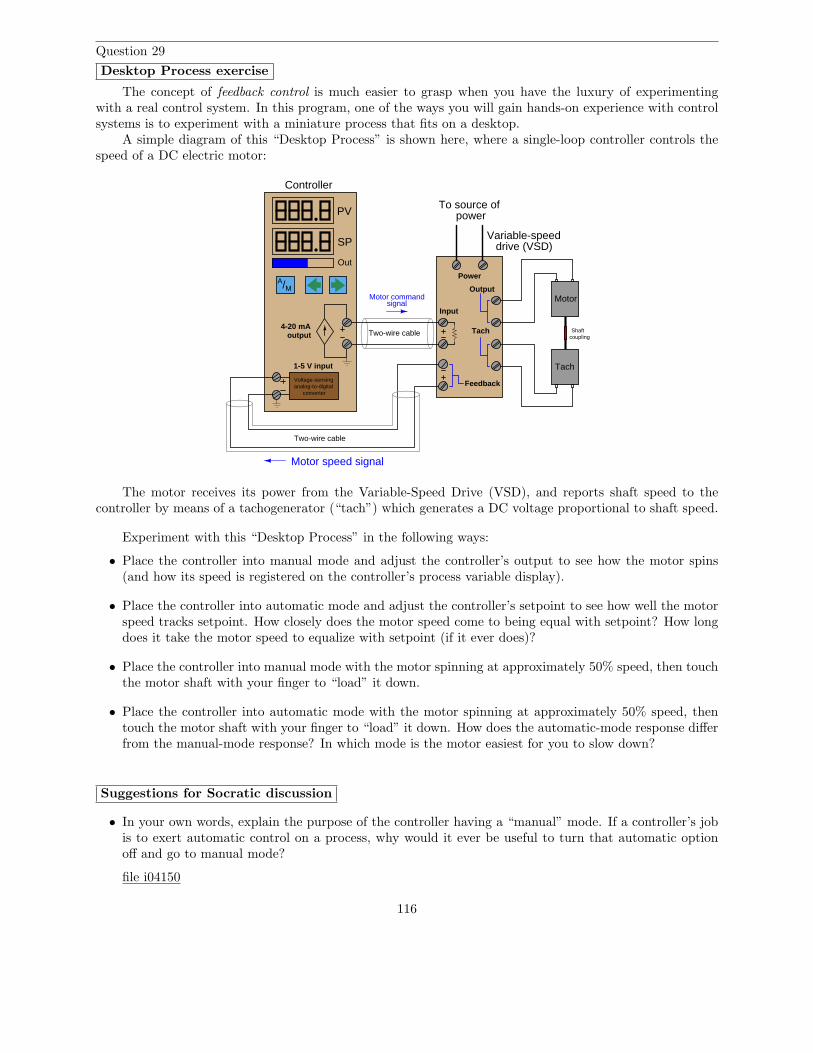
Question 29
Desktop Process exercise
The concept of feedback control is much easier to grasp when you have the luxury of experimentingwith a real control system. In this program, one of the ways you will gain hands-on experience with controlsystems is to experiment with a miniature process that fits on a desktop.
A simple diagram of this “Desktop Process” is shown here, where a single-loop controller controls thespeed of a DC electric motor:
To source of
Two-wire cable
power
Input
Output
Tach
Feedback
Two-wire cable
Power
Controller
Variable-speeddrive (VSD)
Motor speed signal
Voltage-sensinganalog-to-digital
converter
A/M
PV
SP
Out
4-20 mAoutput
1-5 V input
Motor
Tach
Motor commandsignal
Shaftcoupling
The motor receives its power from the Variable-Speed Drive (VSD), and reports shaft speed to thecontroller by means of a tachogenerator (“tach”) which generates a DC voltage proportional to shaft speed.
Experiment with this “Desktop Process” in the following ways:
• Place the controller into manual mode and adjust the controller’s output to see how the motor spins(and how its speed is registered on the controller’s process variable display).
• Place the controller into automatic mode and adjust the controller’s setpoint to see how well the motorspeed tracks setpoint. How closely does the motor speed come to being equal with setpoint? How longdoes it take the motor speed to equalize with setpoint (if it ever does)?
• Place the controller into manual mode with the motor spinning at approximately 50% speed, then touchthe motor shaft with your finger to “load” it down.
• Place the controller into automatic mode with the motor spinning at approximately 50% speed, thentouch the motor shaft with your finger to “load” it down. How does the automatic-mode response differfrom the manual-mode response? In which mode is the motor easiest for you to slow down?
Suggestions for Socratic discussion
• In your own words, explain the purpose of the controller having a “manual” mode. If a controller’s jobis to exert automatic control on a process, why would it ever be useful to turn that automatic optionoff and go to manual mode?
file i04150
116

Answer 29
Notes 29
Virtual Troubleshooting
This question is a good candidate for a “Virtual Troubleshooting” exercise. Presenting the diagram tostudents, you first imagine in your own mind a particular fault in the system. Then, you present one or moresymptoms of that fault (something noticeable by an operator or other user of the system). Students thenpropose various diagnostic tests to perform on this system to identify the nature and location of the fault, asthough they were technicians trying to troubleshoot the problem. Your job is to tell them what the result(s)would be for each of the proposed diagnostic tests, documenting those results where all the students can see.
During and after the exercise, it is good to ask students follow-up questions such as:
• What does the result of the last diagnostic test tell you about the fault?• Suppose the results of the last diagnostic test were different. What then would that result tell you about
the fault?• Is the last diagnostic test the best one we could do?• What would be the ideal order of tests, to diagnose the problem in as few steps as possible?
117

Question 30
A water reservoir located high on a hill stores fresh water for a town’s drinking needs. A float connectedto a lever provides visual indication of the water level inside the reservoir. Nearby this reservoir, a personhas the most boring job in the world: to turn the pump on when the water level gets too low, and to turnthe pump off when the water level gets too high. Note that the float mechanism showing water level in thereservoir cannot show the entire capacity of the reservoir, but only the top ten feet (from 20 feet to 30 feetof level):
float
stationarypivot, or fulcrum
scale
cablelever
pointer
Water30 ft
30 ft
Water to town
Well
Pump
Boredperson
Reservoir
20 ft
25 ft
As crude as it is, this system contains instrumentation, and we may apply standard instrumentationterms to its components. Apply the following terms to this water-supply system, as best as you can:
• Process• Primary sensing element• Final control element• Measurement range• Lower-Range Value (LRV)• Upper-Range Value (URV)• Measurement span• Indicator• Transmitter• Controller• Measured Variable (or Process Variable)• Controlled Variable (or Manipulated Variable)
file i00080
118

Answer 30
• Process: the water and all associated vessels, pipes, and pump• Primary sensing element: float• Final control element: pump• Measurement range: 20 ft to 30 ft• Lower-Range Value (LRV): 20 ft• Upper-Range Value (URV): 30 ft• Measurement span: 10 ft• Indicator: pointer and scale• Transmitter: lever, fulcrum, and cables• Controller: bored person• Measured Variable (or Process Variable): water level• Controlled Variable (or Manipulated Variable): pump speed (on/off status)
The distinction between measurement range, LRV, URV, and span is important. What we are measuringhere is water level in the tank between the 20 and 30 foot marks. The difference in level between these marksis what we call the span. So in this case we have a span of 10 feet (30 feet − 20 feet). The LRV is the lowerend of the measurement range: 20 feet. The URV is the upper end of the measurement range: 30 feet. Therange of measurement encompasses both LRV and URV, and is stated “20 to 30 feet”.
By the same token, if you had a pressure transmitter in an air separation process ranged from 200 to500 PSI, 200 PSI would be the LRV, 500 PSI would be the URV, and 300 PSI would be the span.
In any instrument system, the controller is the thing making control decisions. In this particular case, itwould be the bored person. All the other hardware between the float and indicating pointer simply transmitsinformation from the reservoir to that bored person (controller).
For the record, I really despise the term “controlled variable”. I find it misleading and confusing, butunfortunately it is often used when discussing process controls. While the “measured” or “process” variableis the thing we are measuring (and trying to hold to setpoint), the “controlled” or “manipulated” variable isthe thing we are adjusting to effect the process variable. In this case, the process variable is the water levelin the reservoir, and the controlled (or manipulated) variable is the pump speed. We are measuring waterlevel, and controlling it by turning the pump on and off.
By analogy, imagine a cruise-control system in a car. The measured (process) variable there is car speed,while the accelerator pedal position is the controlled or manipulated variable, because pedal position is thevariable adjusted by the cruise control system in order to maintain the car’s speed at setpoint.
Here are some generalized definitions:
• Measured Variable (or Process Variable): The variable we are measuring, usually with intent to hold toa constant setpoint value
• Controlled Variable (or Manipulated Variable): The variable directly manipulated by the controller,which effects the process variable
Notes 30
119

Question 31
An instrument technician working for a pharmaceutical processing company is given the task ofcalibrating a temperature recording device used to display and log the temperature of a critical batchvessel used to grow cultures of bacteria. After removing the instrument from the vessel and bringing it to aworkbench in the calibration lab, the technician connects it to a calibration standard which has the abilityto simulate a wide range of temperatures. This way, she will be able to test how the device responds todifferent temperatures and make adjustments if necessary.
Before making any adjustments, though, the technician first inputs the full range of temperatures to thisinstrument to see how it responds in its present condition. Then, the instrument indications are recordedas As-Found data. Only after this step is taken does the technician make corrections to the instrument’scalibration. Then, the instrument is put through one more full-range test and the indications recorded asAs-Left data.
Explain why it is important that the technician make note of both “As-Found” and “As-Left” data?Why not just immediately make adjustments as soon as an error is detected? Why record any of this dataat all? Try to think of a practical scenario where this might matter.
file i00082
Answer 31
I’ll answer the question with a scenario of my own: suppose it is discovered that some patients sufferedcomplications after taking drugs manufactured by this company, and that the particular batch of suspectdrugs were processed in this very same vessel about 6 months ago? Now imagine that this temperaturerecording instrument gets routinely calibrated once a month. See the problem?
Notes 31
Doing both As-Found and As-Left calibration tests is important for long-term monitoring of themeasurement device (usually the process transmitter tasked with measuring the process variable). This“paper trail” created by As-Found and As-Left calibration tests allows us to measure how far the transmitterdrifts over time.
If we never took “As-Found” readings, we would not know how far the transmitter drifted from its lastcalibration. In other words, if all we ever saw in the documentation was the calibration data left after thetechnician calibrated the instrument to specifications, we would be led to think that all our transmitters wereholding their calibrations perfectly well, whether or not they actually were. Comparing the present “As-Found” data with the last “As-Left” data tells us how far the measuring device drifted over the calibrationinterval.
I know of one pharmaceuticals corporation which used this calibration data to judge the suitability ofnew transmitter models it was evaluating. If the transmitter calibration drifted out of range (as evidencedby a significant difference between the last “As-Left” data and the present “As-Found” data), they wouldreview the calibration tolerance and try it one more time over another maintenance interval. If it failed thetest once again, they got rid of the instrument and replaced it with another brand or model.
120

Question 32
Define the following terms as they apply to the level controller shown in this P&ID (LIC 135), controllingthe level of liquid in the horizontal receiver vessel:
LT135
radar
AS100 PSI
LY135
AS20 PSI
LI135
LIC
135SP
MV
PV
LG
LAHLAL
LV135
I/P
• Process Variable (PV)• Setpoint (SP)• Manipulated Variable (MV)• Process alarm
file i00135
Answer 32
• Process Variable (PV) = The signal representing liquid level in the horizontal vessel• Setpoint (SP) = The point at which the controller tries to maintain the liquid level inside the vessel• Manipulated Variable (MV) = The controller’s output signal, which tells the control valve how far to
open or close, thus influencing the amount of liquid exiting the vessel at the bottom.• Process alarm = level indicator (LI) does double-duty as a high- and low-alarm unit in addition to being
an indicator for the operators. We know this from the “LAL” and “LAH” labels near the bubble.
Incidentally, the “LG” instrument on the left-hand side of the receiver vessel is a level gauge, also knownas a sightglass. It is used for manual inspection of vessel level.
121

Notes 32
Virtual Troubleshooting
This question is a good candidate for a “Virtual Troubleshooting” exercise. Presenting the diagram tostudents, you first imagine in your own mind a particular fault in the system. Then, you present one or moresymptoms of that fault (something noticeable by an operator or other user of the system). Students thenpropose various diagnostic tests to perform on this system to identify the nature and location of the fault, asthough they were technicians trying to troubleshoot the problem. Your job is to tell them what the result(s)would be for each of the proposed diagnostic tests, documenting those results where all the students can see.
During and after the exercise, it is good to ask students follow-up questions such as:
• What does the result of the last diagnostic test tell you about the fault?• Suppose the results of the last diagnostic test were different. What then would that result tell you about
the fault?• Is the last diagnostic test the best one we could do?• What would be the ideal order of tests, to diagnose the problem in as few steps as possible?
122

Question 33
Identify the meanings of the following instruments in this P&ID:
FSLLSL
LSLL
LSHH
LSH
PSHH
PSH
PAH
Pump shutdown
LAH
PIT PIT
∆
PDIRPDAH
file i02247
Answer 33
FSLLSL
LSLL
LSHH
LSH
PSHH
PSH
PAHLAH
PIT PIT
∆
PDIRPDAH
Level switch high-highPump shutdown logic
Level switch high
Level switch low
Level switch low-low
Flow switch low
Pressure indicating transmitter
Pressure indicating transmitter
Subtractor
Pressure alarm highPressure switch high-high
Pressure switch high
Pressure differential indicating recorderw/ high alarm
123

Notes 33
Virtual Troubleshooting
This question is a good candidate for a “Virtual Troubleshooting” exercise. Presenting the diagram tostudents, you first imagine in your own mind a particular fault in the system. Then, you present one or moresymptoms of that fault (something noticeable by an operator or other user of the system). Students thenpropose various diagnostic tests to perform on this system to identify the nature and location of the fault, asthough they were technicians trying to troubleshoot the problem. Your job is to tell them what the result(s)would be for each of the proposed diagnostic tests, documenting those results where all the students can see.
During and after the exercise, it is good to ask students follow-up questions such as:
• What does the result of the last diagnostic test tell you about the fault?• Suppose the results of the last diagnostic test were different. What then would that result tell you about
the fault?• Is the last diagnostic test the best one we could do?• What would be the ideal order of tests, to diagnose the problem in as few steps as possible?
124
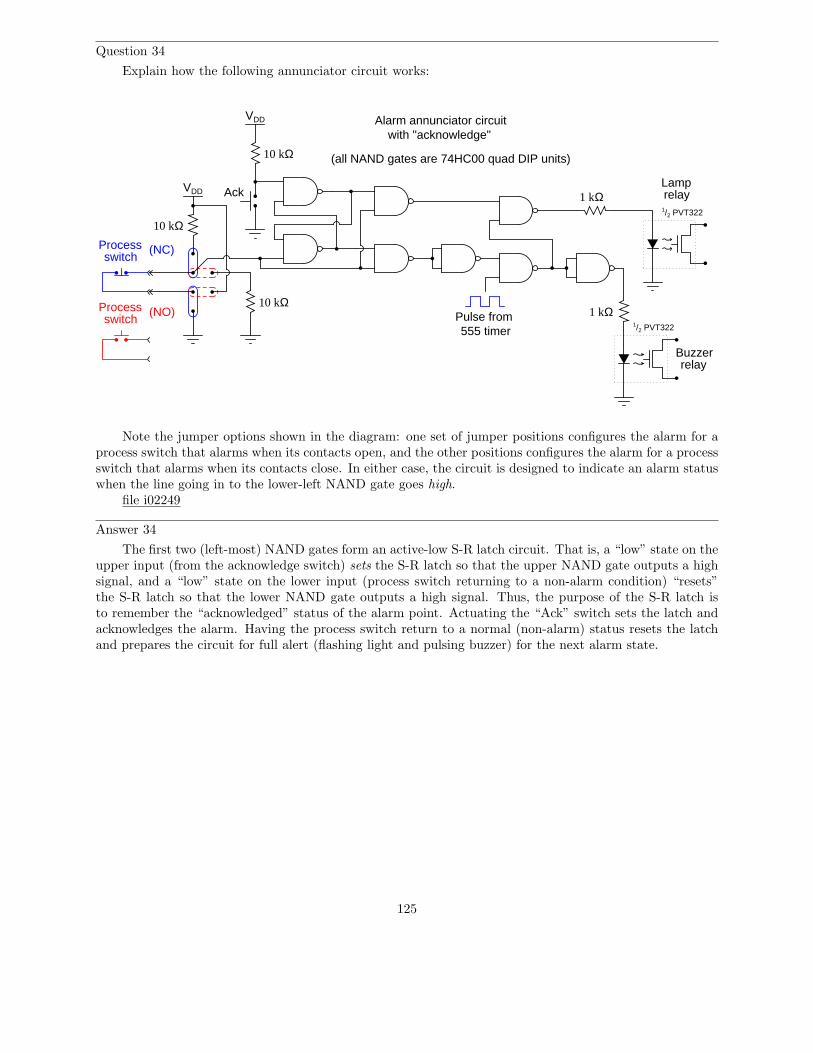
Question 34
Explain how the following annunciator circuit works:
VDD
AckVDD
Processswitch
Pulse from555 timer
Lamp
Buzzer
Processswitch
(NC)
(NO)10 kΩ
10 kΩ
10 kΩ
1 kΩ
1 kΩ1/2 PVT322
1/2 PVT322
Alarm annunciator circuitwith "acknowledge"
(all NAND gates are 74HC00 quad DIP units)
relay
relay
Note the jumper options shown in the diagram: one set of jumper positions configures the alarm for aprocess switch that alarms when its contacts open, and the other positions configures the alarm for a processswitch that alarms when its contacts close. In either case, the circuit is designed to indicate an alarm statuswhen the line going in to the lower-left NAND gate goes high.
file i02249
Answer 34
The first two (left-most) NAND gates form an active-low S-R latch circuit. That is, a “low” state on theupper input (from the acknowledge switch) sets the S-R latch so that the upper NAND gate outputs a highsignal, and a “low” state on the lower input (process switch returning to a non-alarm condition) “resets”the S-R latch so that the lower NAND gate outputs a high signal. Thus, the purpose of the S-R latch isto remember the “acknowledged” status of the alarm point. Actuating the “Ack” switch sets the latch andacknowledges the alarm. Having the process switch return to a normal (non-alarm) status resets the latchand prepares the circuit for full alert (flashing light and pulsing buzzer) for the next alarm state.
125

Notes 34
This makes a great student project, for refreshing their understanding of logic gate operation!
Virtual Troubleshooting
This question is a good candidate for a “Virtual Troubleshooting” exercise. Presenting the diagram tostudents, you first imagine in your own mind a particular fault in the system. Then, you present one or moresymptoms of that fault (something noticeable by an operator or other user of the system). Students thenpropose various diagnostic tests to perform on this system to identify the nature and location of the fault, asthough they were technicians trying to troubleshoot the problem. Your job is to tell them what the result(s)would be for each of the proposed diagnostic tests, documenting those results where all the students can see.
During and after the exercise, it is good to ask students follow-up questions such as:
• What does the result of the last diagnostic test tell you about the fault?• Suppose the results of the last diagnostic test were different. What then would that result tell you about
the fault?• Is the last diagnostic test the best one we could do?• What would be the ideal order of tests, to diagnose the problem in as few steps as possible?
126

Question 35
Answer 35
Notes 35
127

Question 36
Answer 36
Notes 36
128

Question 37
Answer 37
Notes 37
129

Question 38
Answer 38
Notes 38
130

Question 39
Answer 39
Notes 39
131

Question 40
Answer 40
Notes 40
132

Question 41
Read and outline the “4 to 20 mA Analog Current Signals” section of the “Analog ElectronicInstrumentation” chapter in your Lessons In Industrial Instrumentation textbook. Note the page numberswhere important illustrations, photographs, equations, tables, and other relevant details are found. Prepareto thoughtfully discuss with your instructor and classmates the concepts and examples explored in thisreading.
Active reading tip
A practical strategy for reading any text is to imagine yourself in the position of a teacher who mustexplain the content of the text to a group of students. Write your outline in such a way that it would makesense to students encountering this subject for the first time if your outline were used as notes for a teacher’slecture. Compare your written outline to that of classmates, to see how they chose to explain this sameconcept.
file i03872
Answer 41
133

Notes 41
4 to 20 mA is a common analog signal standard: milliamp value proportionately represents a real-worldvariable (pressure, temperature, etc.). Control systems usually utilize two 4-20 mA signals: one for PV, onefor MV.
Current value % of scale4 mA 0%8 mA 25%12 mA 50%16 mA 75%20 mA 100%
Both 3-15 PSI and 4-20 mA are live zero standards, because 0% 6= 0 PSI or 0 mA.
In an analog instrumentation system, all components must be compatibly ranged in order to maintainthe proper representation of measurement all the way through the system. For example, in the temperaturemeasurement system shown, the millivolt signal range output by the thermocouple needs to generate a 4-20mA current signal representing the temperature range of 50 to 250 oC. This requires that the temperaturetransmitter be “ranged” by an instrument technician to output the right amount of current for any givenmillivoltage signal input by the thermocouple. Each instrument in loop must output a range compatiblewith the next instrument in the loop (i.e. the output range of one instrument becomes the input range ofthe next).
PV and MV signals are not identical, but are related to each other when the controller is in automaticmode. In manual mode, the MV is arbitrarily set by the human operator.
Suggestions for Socratic discussion
• This is a good opportuity to emphasize active reading strategies as you check students’comprehension of today’s homework, because it will set the pace for your students’homework completion from here on out. I strongly recommend challenging students toapply the “Active Reading Tips” given in this and other questions in today’s assignment,making this the primary focus and the instrumentation concepts the secondary focus.
• Explain what a live zero signal range is in an instrumentation system.
• Explain the importance of ranging in an analog instrumentation system such as the temperaturemeasurement system shown in this section of the book.
• Suppose the TT in this system was properly calibrated for a 50 to 250 oC range. How many milliampswould be in this circuit at a sensed temperature of 100 oC? Answer = 8 mA
• Suppose the TT in this system was properly calibrated for a 50 to 250 oC range. How many milliampswould be in this circuit at a sensed temperature of 200 oC? Answer = 16 mA
• Suppose the TT in this system was properly calibrated for a 50 to 250 oC range. How much voltagewould be dropped across the 250 ohm resistor at a sensed temperature of 50 oC? Answer = 1 volt
• Suppose the TT in this system was properly calibrated for a 50 to 250 oC range. How much voltagewould be dropped across the 250 ohm resistor at a sensed temperature of 100 oC? Answer = 2 volts
• Suppose the TT in this system was properly calibrated for a 50 to 250 oC range. How much voltagewould be dropped across the 250 ohm resistor at a sensed temperature of 150 oC? Answer = 3 volts
• Suppose the TT in this system was properly calibrated for a 50 to 250 oC range. How much voltagewould be dropped across the 250 ohm resistor at a sensed temperature of 200 oC? Answer = 4 volts
• Suppose the TT in this system was properly calibrated for a 50 to 250 oC range, but that the indicatingmeter (TI) had the wrong range on its scale: 100 to 300 oC. What temperature value would the TIindicate when the real temperature was 150 oC? Answer = 200 oC
134

• Suppose the TT in this system was properly calibrated for a 50 to 250 oC range, but that the indicatingmeter (TI) had the wrong range on its scale: 0 to 200 oC. What temperature value would the TI indicatewhen the real temperature was 150 oC? Answer = 100 oC
135

Question 42
Read and outline the introduction to the “Relating 4 to 20 mA Current Signals to Instrument Variables”section of the “Analog Electronic Instrumentation” chapter in your Lessons In Industrial Instrumentationtextbook, then work through at least two of the calculation examples shown in the subsections that followthe introduction.
Many students find the subsections entitled “Graphical Interpretation of Signal Ranges” and “Thinkingin Terms of Per Unit Quantities” helpful as alternative approaches to relating signals to instrument variables.
Active reading tip
One of the distinctive differences between technical reading and the reading of other document typesis the amount of mathematical content contained in the text. In the interest of reading actively (i.e. witha fully engaged mind) it is strongly recommended that you pick up your calculator and actually run thecalculations shown to you in examples such as those found in this reading assignment. Do not be contentwith simply perusing the calculations shown to you in the text, but actually do them yourself. The same istrue for any algebraic manipulations presented in a text: take advantage of this as a learning opportunityby challenging yourself to do the same manipulations on paper, comparing your results with the text’s.
file i03874
Answer 42
136

Notes 42
y = mx + b
Percentage =x − LRV
URV − LRV=
x − LRV
Span
When x is signal % and y is current (mA), y = 16
100x + 4
When x is GPM (0 to 350) and y is current (mA), y = 16
350x + 4
When x is temp (50 to 140 deg) and y is current (mA), y = 16
90x − 4.89
When x is current (mA) and y is pH (4pH to 10pH), y = 6
16x + 2.5
Reverse action is when an instrument’s direction of output response is opposite that of its input (i.e. whenthe input gets larger, the output gets smaller). Such instruments have a negative slope value (m) in theiry = mx + b characteristic equations:
When x is pressure (3-15 PSI) and y is reverse current (20-4 mA), y = − 16
12x + 24
When x is ADC counts (3277 to 16384) and y is flow (0 to 700 GPM), y = 700
13107x − 175
Use a number line to convert input quantity into %, and then that % into the output quantity.Subtracting 4 mA from the given mA value yields the “length” of the bar on the number line (i.e. howfar “into the span” this signal is) which when divided by the whole span yields the equivalent percentage.Multiplying this percentage by the output span tells you how long the bar is on the output number line, andthen this value added to the live zero of the output yields the final result.
Use two linear equations to convert input quantity into per unit values (between 0 and 1 inclusive), andthen that per unit value into the scaled output quantity:
Input = (Spaninput)(Per unit) + LRVinput
Output = (Spanoutput)(Per unit) + LRVoutput
For a 4-20 mA range:
mA = 16(%) + 4
Suggestions for Socratic discussion
• This is a good opportuity to emphasize active reading strategies as you check students’comprehension of today’s homework, because it will set the pace for your students’homework completion from here on out. I strongly recommend challenging students toapply the “Active Reading Tips” given in this and other questions in today’s assignment,making this the primary focus and the instrumentation concepts the secondary focus.
• Give a step-by-step procedure for determining the m and b values for any linear function with a givengraph.
• What does “per unit” mean, and how is this concept similar to “per cent”?• Explain what the “rate” and “offset” parameters of the Allen-Bradley SCL instruction mean and how
they relate to the general slope-intercept linear formula.
137

• Demonstrate how to perform any of the example scaling problems using per unit calculations ratherthan developing a custom y = mx + b formula for each application.
• A common misconception is that b in the slope-intercept linear formula must always be equal to theLRV of the output range. Explain why this is not true, citing a contrary example to prove your point.
138

Prep Quiz:
Part A – calculation Calculate the amount of DC current equivalent to a 25% signal value in a 4 to 20 mAanalog signal range.
Part B – written response Explain the general attendance policy within this program. In other words, howare absences managed?
Part C – written response You will be doing a lot of studying in this program. Identify one practical wayyou can maximize study time outside of the classroom and lab.
Note: your explanations need to be complete and clearly written. Expressing your ideas clearly andcompletely is every bit as important as having those ideas correct in your own mind!
139

Summary Quiz:Calculate the equivalent percentage value of a 9 mA DC electrical signal (in a 4 to 20 mA range):
• 9.0%
• 46.15%
• 37.5%
• 31.25%
• 18.0%
• 41.67%
• 35.0%
140

Question 43
A pneumatic level transmitter has a calibrated range of 0 to 5 feet, and its output signal range is 3 to15 PSI. Complete the following table of values for this transmitter, assuming perfect calibration (no error).Be sure to show your work!
Measured level Percent of span Output signal(feet) (%) (PSI)3.2
450
2.411.3
18
file i00097
Answer 43
Measured level Percent of span Output signal(feet) (%) (PSI)3.2 64 10.68
0.4167 8.333 42.5 50 92.4 48 8.76
3.458 69.17 11.30.9 18 5.16
Notes 43
A good exercise to test students’ comprehension of this concept is to invent new values for this particularinstrument (0-5 ft level ; 3-15 PSI signal) and have them demonstrate all calculations. Having (presumably)done the calculations to obtain these answers, they should already have formulae ready to go for any newvalue(s) you can throw at them.
141

Question 44
Read and outline the “Controller Output Current Loops” section of the “Analog ElectronicInstrumentation” chapter in your Lessons In Industrial Instrumentation textbook. Note the page numberswhere important illustrations, photographs, equations, tables, and other relevant details are found. Prepareto thoughtfully discuss with your instructor and classmates the concepts and examples explored in thisreading.
Active reading tip
A practical and fun way to actively engage with a text is to imagine yourself in the role of a teacher,who will quiz students on what they learned from reading that same text. As you write your outline of thattext, include some questions of your own that you would ask a student. This prompts you to think aboutthe text in a different way: to identify the portions you think are most important, to identify concepts thatmight be more challenging to comprehend, and to visualize what a good understanding of that text wouldlook like embodied in the responses of other students.
file i03873
Answer 44
142

Notes 44
Controller supplies both electrical power and information to the FCE. The controller’s dependent currentsource is a true electrical source, while the final control element or transducer or motor drive connected tothe controller functions as an electrical load.
Dependent current source controls output current according to value of output (MV) inside controller.Current source “fights” to maintain constant current regardless of other circuit changes.
In applications where the FCE is reverse-acting (i.e. 4 mA = 100% action and 20 mA = 0% action)we need to configure the controller to have a reverse-indicating output display. This is unrelated to reversecontrol action, which has to do with the controller’s algorithm and the need for negative feedback in closed-loop control.
Suggestions for Socratic discussion
• This is a good opportuity to emphasize active reading strategies as you check students’comprehension of today’s homework, because it will set the pace for your students’homework completion from here on out. I strongly recommend challenging students toapply the “Active Reading Tips” given in this and other questions in today’s assignment,making this the primary focus and the instrumentation concepts the secondary focus.
• Explain how the identify of an electrical component as either a source or a load relates to the voltagedrop polarity and direction of current.
• Explain the difference between reverse action in a controller and reverse indication on that controller’soutput display. What factor(s) dictate direct vs. reverse control action, and what factor(s) dictatedirect vs. reverse output indication?
• Suppose the two-wire cable connecting the controller to the I/P converter fails open. Identify all theconsequences of this fault (explaining both valve action and electrical properties such as voltage andcurrent at different points in the failed circuit).
• Suppose the two-wire cable connecting the controller to the I/P converter fails shorted. Identify all theconsequences of this fault (explaining both valve action and electrical properties such as voltage andcurrent at different points in the failed circuit).
• Suppose the resistor inside of the motor drive fails open. Identify all the consequences of this fault(explaining both motor action and electrical properties such as voltage and current at different pointsin the failed circuit).
• Suppose the resistor inside of the motor drive fails shorted. Identify all the consequences of this fault(explaining both motor action and electrical properties such as voltage and current at different pointsin the failed circuit).
143

Question 45
Read and outline the “4-Wire (‘Self-Powered’) Transmitter Current Loops” section of the “AnalogElectronic Instrumentation” chapter in your Lessons In Industrial Instrumentation textbook. Note the pagenumbers where important illustrations, photographs, equations, tables, and other relevant details are found.Prepare to thoughtfully discuss with your instructor and classmates the concepts and examples explored inthis reading.
Active reading tip
A great way to engage with a text is to mark it up with your own notes and annotations as you read.Of course, writing an outline of the text in your own words is the ultimate expression of this principle, sinceoutlining is essentially re-creating the author’s thoughts rather than just commenting on them. However,it might not be as apparent that this can be done with diagrams and illustrations as well. Identify anygraphics within today’s assigned reading that you can “mark up” with comments and/or symbols of yourown for clarity. Examples include writing notes and labels on mathematical graphs to make them moreunderstandable, and adding current arrows and voltage polarity marks to electrical schematics to clearlyshow the circuit’s operation.
file i03875
Answer 45
144

Notes 45
4-wire transmitter: two wires for DC power to the transmitter, two wires for 4-20 mA signal. Transmitteracts as dependent current source, controller resistor/input acts as a load. Transmitter requires a separatesource of electrical power to be connected to it.
250 Ω resistor normally used to convert 4-20 mA current into 1-5 VDC signal for controller to read.
Suggestions for Socratic discussion
• This is a good opportuity to emphasize active reading strategies as you check students’comprehension of today’s homework, because it will set the pace for your students’homework completion from here on out. I strongly recommend challenging students toapply the “Active Reading Tips” given in this and other questions in today’s assignment,making this the primary focus and the instrumentation concepts the secondary focus.
• Explain how the identify of an electrical component as either a source or a load relates to the voltagedrop polarity and direction of current.
• Suppose the two-wire cable connecting the transmitter to the controller input terminals fails open.Identify all the consequences of this fault (explaining both the controller’s PV indication and electricalproperties such as voltage and current at different points in the failed circuit).
• Suppose the two-wire cable connecting the transmitter to the controller input terminals fails shorted.Identify all the consequences of this fault (explaining both the controller’s PV indication and electricalproperties such as voltage and current at different points in the failed circuit).
• Suppose the resistance of the two-wire cable connecting the transmitter to the controller input terminalsincreases by a factor of 10%. Identify all the consequences of this fault (explaining both the controller’sPV indication and electrical properties such as voltage and current at different points in the failedcircuit).
• Suppose the resistance of the two-wire cable connecting the transmitter to the controller input terminalsdecreases by a factor of 10%. Identify all the consequences of this fault (explaining both the controller’sPV indication and electrical properties such as voltage and current at different points in the failedcircuit).
• Suppose the resistor at the controller input terminals fails open. Identify all the consequences of thisfault (explaining both the controller’s PV indication and electrical properties such as voltage and currentat different points in the failed circuit).
• Suppose the DC power source to the transmitter fails with a 0 VDC output. Identify all the consequencesof this fault (explaining both the controller’s PV indication and electrical properties such as voltage andcurrent at different points in the failed circuit).
145

Question 46
Read and outline the “2-Wire (‘Loop-Powered’) Transmitter Current Loops” section of the “AnalogElectronic Instrumentation” chapter in your Lessons In Industrial Instrumentation textbook. Note the pagenumbers where important illustrations, photographs, equations, tables, and other relevant details are found.Prepare to thoughtfully discuss with your instructor and classmates the concepts and examples explored inthis reading.
Active reading tip
Well-written technical texts don’t just describe what and how, but also why. These “why” explanationsare important for you to grasp, and as such they should always be a part of your written outline. Identifyplaces within today’s reading where the rationale for some concept or technique is explained, and show howyour outline reflects this.
file i03881
Answer 46
146

Notes 46
Two wires used to convey both DC power to field instrument and 4-20 mA signal back to the controller.Transmitter (field device) acts as a dependent current regulator (an electrical load), while the controllerinput also acts as an electrical load. This type of transmitter circuit requires a series-connected DC voltagesource to work (usually 24 volts), because no other component in the circuit is a real source of electricalpower.
Internal circuitry of 2-wire transmitter uses opamp(s) and bypass transistor to shunt enough current tomake the total current be what it ought to be. Internal circuitry must be able to function on less than 4mA! Older 10-50 mA standard used to allow more power to be dissipated inside transmitter.
Loop-powered (2-wire) transmitters are necessarily limited in their power consumption, because theymust be able to function on a mere 4 mA (minimum) of current and a mere 19 volts (minimum) terminalvoltage. Some power-intensive applications such as chromatographs simply cannot be made loop-powered,because they require more electrical power than this to operate.
Suggestions for Socratic discussion
• This is a good opportuity to emphasize active reading strategies as you check students’comprehension of today’s homework, because it will set the pace for your students’homework completion from here on out. I strongly recommend challenging students toapply the “Active Reading Tips” given in this and other questions in today’s assignment,making this the primary focus and the instrumentation concepts the secondary focus.
• Explain how the identify of an electrical component as either a source or a load relates to the voltagedrop polarity and direction of current.
• Explain why there once was a 10-50 mA current signal standard.• Suppose the two-wire cable connecting the transmitter to the controller input terminals fails open.
Identify all the consequences of this fault (explaining both the controller’s PV indication and electricalproperties such as voltage and current at different points in the failed circuit).
• Suppose the two-wire cable connecting the transmitter to the controller input terminals fails shorted.Identify all the consequences of this fault (explaining both the controller’s PV indication and electricalproperties such as voltage and current at different points in the failed circuit).
• Suppose the resistance of the two-wire cable connecting the transmitter to the controller input terminalsincreases by a factor of 10%. Identify all the consequences of this fault (explaining both the controller’sPV indication and electrical properties such as voltage and current at different points in the failedcircuit).
• Suppose the resistance of the two-wire cable connecting the transmitter to the controller input terminalsdecreases by a factor of 10%. Identify all the consequences of this fault (explaining both the controller’sPV indication and electrical properties such as voltage and current at different points in the failedcircuit).
• Suppose the resistor at the controller input terminals fails open. Identify all the consequences of thisfault (explaining both the controller’s PV indication and electrical properties such as voltage and currentat different points in the failed circuit).
• Suppose the DC power source to the transmitter fails with a 0 VDC output. Identify all the consequencesof this fault (explaining both the controller’s PV indication and electrical properties such as voltage andcurrent at different points in the failed circuit).
• Suppose transmitter senses either an increasing or a decreasing stimulus. Explain what happens in thesimplified internal schematic diagram of the transmitter in response to this changing stimulus.
• Suppose the bypass transistor inside of a 2-wire transmitter fails open. Identify all the consequences ofthis fault (explaining both the controller’s PV indication and electrical properties such as voltage andcurrent at different points in the failed circuit).
• Suppose the bypass transistor inside of a 2-wire transmitter fails shorted. Identify all the consequences
147

of this fault (explaining both the controller’s PV indication and electrical properties such as voltage andcurrent at different points in the failed circuit).
148

Prep Quiz:
Part A – multiple-choice A “2-wire” field-mounted process transmitter receives its electrical power tooperate from:
• An electrical power source located near the transmitter
• An AC power supply connected in parallel with the transmitter
• A secondary-cell battery installed inside the transmitter
• A DC power supply connected in series with the transmitter
• Magnetic fields from nearby motors and other equipment
• A DC power supply connected in parallel with the transmitter
Part B – written response Explain the general attendance policy within this program. In other words, howare absences managed?
Part C – written response You will be doing a lot of studying in this program. Identify one practical wayyou can maximize study time outside of the classroom and lab.
Note: your explanations need to be complete and clearly written. Expressing your ideas clearly andcompletely is every bit as important as having those ideas correct in your own mind!
149

Question 47
Read and outline the “Using Loop Calibrators” subsection of the “Troubleshooting Current Loops”section of the “Analog Electronic Instrumentation” chapter in your Lessons In Industrial Instrumentationtextbook. Note the page numbers where important illustrations, photographs, equations, tables, and otherrelevant details are found. Prepare to thoughtfully discuss with your instructor and classmates the conceptsand examples explored in this reading.
Active reading tip
Learning new concepts is easier when you can link the new concept(s) to other concepts you alreadyunderstand well. Another active reading strategy is to explicitly make these connections in your outlining ofa text. Examine today’s reading assignments to look for applications of concepts you already comprehend,to help make more sense of one or more new concepts.
file i03879
Answer 47
Notes 47
Loop calibrators can source and measure 4-20 mA.
• In Read mode, acts as ammeter (passive load)• In Source mode, acts as current source (active source) – useful for stroking valves and for sourcing 4-20
mA to controllers designed to connect to 4-wire transmitters• In Simulate mode, acts as current regulator (active load) – useful for simulating transmitter
Suggestions for Socratic discussion
• This is a good opportuity to emphasize active reading strategies as you check students’comprehension of today’s homework, because it will set the pace for your students’homework completion from here on out. I strongly recommend challenging students toapply the “Active Reading Tips” given in this and other questions in today’s assignment,making this the primary focus and the instrumentation concepts the secondary focus.
• What can a loop calibrator do that a multimeter cannot?• Identify all sources and all loads in each of the example circuits where a loop calibrator is used in
conjunction with a 4-20 mA transmitter circuit.• Referencing the student’s loop diagram for their lab, ask where they would connect a loop calibrator to
either measure loop current, source current to an instrument, or simulate a 2-wire transmitter.• Refer to the LIII section on 4-wire transmitters, and identify how to configure and connect a loop
calibrator to simulate the function of the 4-wire transmitter in the example diagram.• Examine the photograph of a Transmation model 1040 loop calibrator and identify how to set it up to
do the following:→ Measure current→ Source current→ Simulate a 2-wire transmitter
• Examine the 2-wire transmitter diagram shown in the “Troubleshooting Current Loops with VoltageMeasurements” section of the textbook (the diagram containing the loop-powered indicator and thepower source internal to the controller) and ask how to connect a loop calibrator to:→ Measure transmitter output current→ Simulate the transmitter
150

Summary Quiz:(A time-saving summary quiz idea is to have students go to the lab and demonstrate loop calibrator
use on the working loops they’ve constructed, which also counts for an objective on the lab assignment.)
151

Question 48
Connect a loop-powered differential pressure transmitter to a DC voltage source, a milliammeter, a 250ohm resistor, and a diode as shown, using parts supplied by the instructor (your instructor may provide youwith a pre-built assembly to save time). You will need to bring your own multimeter for this experiment:
+ - + -
Loop-powered (2-wire)
9 volt 9 volt
250 ΩDiode
H L
Loop DP transmitter Schematic
9 V
9 V
250 Ω
2-wiretransmitter1 2 3 4 5 6 7 8
mA mA
When you have your transmitter powered and functioning, answer the following questions:
• Trace the direction of current through this DC circuit (using conventional flow notation) and identifythe polarity of the voltage across each component in accordance with that component’s function aseither an electrical source or an electrical load.
• Demonstrate how to measure the transmitter’s output signal three different ways:→ Measuring a voltage drop across the 250 Ω resistor (1-5 V signal)→ Breaking the circuit to directly measure current with a milliammeter (4-20 mA signal)→ Connecting a milliammeter in parallel with the diode (4-20 mA signal)
• How does an applied pressure (blowing into the plastic tube) to the “High” pressure port on thetransmitter affect the electrical signal? How about an applied pressure to the “Low” pressure port?
• While measuring current (with the milliammeter shorting across the diode), temporarily short past the250 ohm resistor with a jumper wire. How does this affect the circuit current, and why?
Suggestions for Socratic discussion
• How would the pressure transmitter respond if equal pressures were applied to both “H” and “L” ports?• One of the basic rules electronics students learn when first using their multimeters is never connect an
ammeter in parallel with anything, only in series. Explain why shorting across the diode is okay to do,and whether or not shorting across the resistor would be just as practical.
file i03877
152

Answer 48
To review basic electric circuit theory, a source is a device imparting energy to moving charge carrierswhile a load is a device extracting energy from moving charge carriers.
Notes 48
Virtual Troubleshooting
This question is a good candidate for a “Virtual Troubleshooting” exercise. Presenting the diagram tostudents, you first imagine in your own mind a particular fault in the system. Then, you present one or moresymptoms of that fault (something noticeable by an operator or other user of the system). Students thenpropose various diagnostic tests to perform on this system to identify the nature and location of the fault, asthough they were technicians trying to troubleshoot the problem. Your job is to tell them what the result(s)would be for each of the proposed diagnostic tests, documenting those results where all the students can see.
During and after the exercise, it is good to ask students follow-up questions such as:
• What does the result of the last diagnostic test tell you about the fault?• Suppose the results of the last diagnostic test were different. What then would that result tell you about
the fault?• Is the last diagnostic test the best one we could do?• What would be the ideal order of tests, to diagnose the problem in as few steps as possible?
153

Question 49
A technical innovation in the 1980’s called HART (Highway Addressable Remote Transmitter) gave4-20 mA loop-powered field instruments the ability to communicate digital as well as analog data. Today itremains one of the most popular industrial networking standards for field devices.
Connect a loop-powered differential pressure transmitter (with HART capability along with analog 4-20 mA output) to a DC voltage source, a milliammeter, a 250 ohm resistor, and a diode as shown, usingparts supplied by the instructor (your instructor may provide you with a pre-built assembly to save time).You will need to bring your own multimeter for this experiment, but your instructor will supply the HARTcommunicator:
+ - + -
Loop-powered (2-wire)
9 volt 9 volt
250 ΩDiode
H L
Loop DP transmitter Schematic
9 V
9 V
250 Ω
2-wiretransmitter1 2 3 4 5 6 7 8
mA mA
HART communicator
When you have your transmitter powered and functioning, answer the following questions:
• Use the HART communicator device to access the transmitter’s programmable parameters. Identify theparameters you are able to access, and explain (if you can) what they mean.
• Use a digital oscilloscope (from your team’s tool locker) connected in parallel with the transmitter tocapture one of the HART data communication bursts. What does this data look like on the oscilloscopedisplay?
• Temporarily short past the resistor with a jumper wire and note whether or not this has any affect onthe HART data communications.
file i01284
154

Answer 49
Notes 49
When performing the frequency measurement, you will see a relatively high value (over 1000 Hz)that fluctuates as the HART communicator exchanges information with the transmitter. It is stronglyrecommended for you to place the communicator in a mode where it repeatedly polls the transmitter, or elseyou may only occasionally see any AC voltage on the multimeter.
If your demo circuit happens to use an AC-to-DC power supply instead of batteries for power, you maysee “ripple” voltage frequency when the HART communications cease. This too is a useful demonstrationof how to identify the point of origin of any “noise” in an electrical circuit.
Virtual Troubleshooting
This question is a good candidate for a “Virtual Troubleshooting” exercise. Presenting the diagram tostudents, you first imagine in your own mind a particular fault in the system. Then, you present one or moresymptoms of that fault (something noticeable by an operator or other user of the system). Students thenpropose various diagnostic tests to perform on this system to identify the nature and location of the fault, asthough they were technicians trying to troubleshoot the problem. Your job is to tell them what the result(s)would be for each of the proposed diagnostic tests, documenting those results where all the students can see.
During and after the exercise, it is good to ask students follow-up questions such as:
• What does the result of the last diagnostic test tell you about the fault?• Suppose the results of the last diagnostic test were different. What then would that result tell you about
the fault?• Is the last diagnostic test the best one we could do?• What would be the ideal order of tests, to diagnose the problem in as few steps as possible?
155

Question 50
This pictorial diagram shows the wiring connections for a simple pressure control loop, where a loop-powered 4-20 mA pressure transmitter sends a signal to a Honeywell controller, which in turn sends another4-20 mA signal to a control valve:
Honeywell UDC2000 controllerH L
L1
L2
4
5
6
7
8 9
10
11
12
13
14
15
16
120 VACpower
24 VDC power supply
L1
L2 120 VACpower
PV input1-5 volt
MV output4-20 mA
Instrumentair supply
I/P transducer
4-20 mA loop-poweredpressure transmitter
Air-to-open control valve
(20 PSI)
A
B
C
D
E
F
G
H
Cable
• Sketch all directions of current, using conventional flow notation.
• Identify which electrical devices in this system act as sources and which act as loads.
• If an operator informs you that the pressure indicated by the Honeywell controller is below range(“pegged” full downscale, reading −25%), what types and locations of electrical faults might you suspect?Are there any non-electrical faults which might also cause this to happen?
• If an operator informs you that the control valve remains fully shut no matter the output value of thecontroller (even in “manual” mode), what types and locations of electrical faults might you suspect?Are there any non-electrical faults which might also cause this to happen?
• Suppose that a short-circuit developed between the transmitter wires in the four-conductor cable.Explain what effect this would have on the operation of the system, as well as how you could determinethat this fault was in the cable (and not in the transmitter) with your only piece of test equipmentbeing a voltmeter.
Suggestions for Socratic discussion
• Review the problem-solving tips listed in Question 0 and apply them to this problem.
file i00974
156

Answer 50
Honeywell UDC2000 controllerH L
L1
L2
4
5
6
7
8 9
10
11
12
13
14
15
16
120 VACpower
24 VDC power supply
L1
L2 120 VACpower
PV input1-5 volt
MV output4-20 mA
Instrumentair supply
I/P transducer
4-20 mA loop-poweredpressure transmitter
Air-to-open control valve
(20 PSI)
A
B
C
D
E
F
G
H
Cable
Load
Load
Source
Source
Load
Even though the loop-powered transmitter does exert control over the amount of current sent to thecontroller’s input, the transmitter acts as a load rather than a source. In other words, it functions as acurrent regulator while relying on the 24 VDC power supply to be the source of motive power in the circuit.
A full-downscale (−25%) reading at the controller suggests an open fault in the transmitter wiringsomewhere, because this correlates with a zero current signal. The fault must be electrical in nature, as noother kind of problem will cause the current in the 4-20 mA loop circuit to simply cease.
An unresponsive control valve suggests a lack of air pressure reaching its diaphragm. This may becaused by any kind of electrical fault in the output circuit (open or short) preventing current from reachingthe I/P transducer. It might also be the consequence of an air supply failure, or perhaps a mechanical failureinside the I/P.
A short-circuit fault in the transmitter wiring will cause full current (> 20 mA) to be sent to thecontroller, making it “peg” full upscale. Normally, an ammeter would be a helpful tool to isolate thelocation of this fault, but here we only have access to a voltmeter. In order to locate shorted faults usinga voltmeter, we must break the circuit and then measure voltage “upstream” (toward the source) to seewhether or not the shorted fault is “downstream” (toward the load).
157

Notes 50
Virtual Troubleshooting
This question is a good candidate for a “Virtual Troubleshooting” exercise. Presenting the diagram tostudents, you first imagine in your own mind a particular fault in the system. Then, you present one or moresymptoms of that fault (something noticeable by an operator or other user of the system). Students thenpropose various diagnostic tests to perform on this system to identify the nature and location of the fault, asthough they were technicians trying to troubleshoot the problem. Your job is to tell them what the result(s)would be for each of the proposed diagnostic tests, documenting those results where all the students can see.
During and after the exercise, it is good to ask students follow-up questions such as:
• What does the result of the last diagnostic test tell you about the fault?• Suppose the results of the last diagnostic test were different. What then would that result tell you about
the fault?• Is the last diagnostic test the best one we could do?• What would be the ideal order of tests, to diagnose the problem in as few steps as possible?
158

Question 51
A newly-installed pH measurement system does not seem to be measuring the pH of the process liquidaccurately. The indicating controller’s display does not match the display of the hand-held pH meter usedby an operator:
Controller
A/M
PV
SP
Out
Voltage-sensinganalog-to-digital
converter250 Ω
Pwr Out
28 VDC
pH transmitter
pH sensing probe
A
B
C
D
E
F
G
H
Process liquid
Hand-heldpH meter
mA
mAREAD VDC
OFF% 4 to 20 mA
LOOP CALIBRATOR
SOURCE
2-WIRE
READ
100%20 mA
0%4 mA
ADJUST
TRANSMITTERSIMULATOR
POWER 2-WIRETRANSMITTERS
The calibrated range of the 4-wire pH transmitter is supposed to be 2 to 12 pH, with a 4 to 20 mAsignal output range. An instrument technician begins to diagnose the problem by taking a loop calibratorand measuring the current signal being sent to the indicating controller. The loop calibrator registers 15.43milliamps.
Based on this information, determine where the problem is in this system. Also, show how the loopcalibrator could be connected to the wiring to measure the loop current (specifying the proper calibratormode as well).
Suggestions for Socratic discussion
• Review the problem-solving tips listed in Question 0 and apply them to this problem.
• A problem-solving technique useful for making proper connections in pictorial circuit diagrams is tofirst identify the directions of all DC currents entering and exiting component terminals, as well as therespective voltage polarity marks (+,−) for those terminals, based on your knowledge of each componentacting either as an electrical source or an electrical load. Discuss and compare how these arrows andpolarity marks simplify the task of properly connecting wires between components.
• If the technician had no test equipment except for a voltmeter, could a good diagnostic test still bemade in this system?
159

• Identify where you could install a rectifying diode in this circuit to allow convenient measurement ofloop current.
file i00976
Answer 51
15.43 milliamps of current equates to a percentage value of 71.44%:
15.43 − 4
16× 100% = 71.44%
This, in turn, represents a pH value of:
0.7144 × (12 − 2) + 2 = 9.144 pH
This largely agrees with the controller’s display, which tells us there is a slight calibration error on eitherthe part of the controller or the resistor. The huge discrepancy between this calculated pH value and whatthe hand-held pH meter registers, however, tells us there is either a problem with the pH transmitter, thepH probe, or the hand-held meter. We may further conclude there is no problem with the 250 Ω resistor orthe indicating controller.
The proper setup of the loop calibrator is to place it into the “READ” (measure) mode so that itfunctions as a simple ammeter, then connect it in series with the output of the 4-wire transmitter. This maybe done either with the indicating controller still in the circuit, or removed from the circuit.
Notes 51
160

Virtual Troubleshooting
Controller
A/M
PV
SP
Out
Voltage-sensinganalog-to-digital
converter250 Ω
Pwr Out
28 VDC
pH transmitter
pH sensing probe
A
B
C
D
E
F
G
H
Process liquid
Hand-heldpH meter
mA
mAREAD VDC
OFF% 4 to 20 mA
LOOP CALIBRATOR
SOURCE
2-WIRE
READ
100%20 mA
0%4 mA
ADJUST
TRANSMITTERSIMULATOR
POWER 2-WIRETRANSMITTERS
Range = 2 to 12 pH
Predicting the effect of a given fault: present each of the following faults to the students, one at a time,having them comment on all the effects each fault would produce.
• Wire E-A failing open• Wire F-B failing open• Wire G-C failing open• Wire H-D failing open• Resistor failing open• 28 VDC power supply dying
Determining the utility of given diagnostic tests: imagine the resistor fails open in this circuit (butdon’t tell this to students!). Present the operator’s observation(s) to the students, have them considerpossible faults and diagnostic strategies, and then propose the following diagnostic tests one by one. Havestudents rate the value of each test, determining whether or not each test would give us useful information(i.e. tell us something we don’t already know). Also have students describe what result in particular mightbe the most informative for any of these tests, because the same test might yield conclusive or inconclusiveresults depending on the fault:
• Operator sees the controller PV display registering 105% (12.5 pH)• Measure VAD
• Measure VEH
• Measure current at terminal B• Measure voltage at input terminals of controller• Measure solution pH with a hand-held meter• Place controller in manual mode and change the output value
161

Diagnosing a fault based on given symptoms: imagine the wire connecting terminals F and B breaksopen in this circuit (but don’t tell this to students!). Present the operator’s observation(s) to the students,have them consider possible faults and diagnostic strategies, and then tell them the results of tests theypropose based on the following symptoms, until they have properly identified the nature and location of thefault:
• Operator sees the controller PV display registering -25% (-0.5 pH)• VAD = 28 VDC• VEH = 28 VDC• VFG = 28 VDC• VBC = 0 VDC
162

Question 52
Suppose you wish to calibrate a current-to-pressure (“I/P”) transducer to an output range of 3 to 15PSI, with an input range of 4 to 20 mA. Complete the following calibration table showing the proper testpressures and the ideal input signal levels at those pressures:
Input signal Percent of span Output pressureapplied (mA) (%) (PSI)
358095
file i01625
Answer 52
Input signal Percent of span Output pressureapplied (mA) (%) (PSI)
9.6 35 7.216.8 80 12.619.2 95 14.4
Notes 52
163

Question 53
During the 1980’s the Rosemount corporation developed a means for 4-20 mA analog signaling circuitsto carry digital signals as well, so that 4-20 mA process transmitters could be equipped with microprocessorsand communicate data in both analog and digital form. Rosemount’s so-called HART standard (“Highway-Addressable Remote Transducer”) used audio-frequency AC signals to represent binary “1” and “0” states,superimposing these AC signals on the same two wires as the DC 4-20 mA analog signal. Processtransmitters so equipped were dubbed smart transmitters because their internal microprocessors gave themextra capabilities such as self-diagnostics, easy-to-change ranging, and advanced linearization for greateraccuracy. HART eventually became an “open” standard with many manufacturers producing compliantfield devices.
The following schematic diagram shows a simplified HART transmitter connected to a DC loop powersupply as well as a HART “communicator” device allowing a human technician to communicate with thetransmitter. The transistor states shown in this diagram reflect the master (“communicator”) device sendingdata while the slave (smart transmitter) device listens:
"Smart" (HART) transmitter
+− 24 VDC
250 ΩIndicator(1-5 VDC range)
Micro-processor
Process-sensingcircuitry
HARTFSK signal
(1.2/2.2 kHz)
4-20 mAanalog signal
HART communicator
OFF
ON
HARTFSK signal
(1.2/2.2 kHz)
(HART slave)
(HART master)
Since this is a multi-source circuit, with four sources (one AC current source and one DC current sourceinside the smart transmitter, one AC voltage source in the HART communicator, and one DC voltage sourceproviding loop power), we may apply the Superposition Theorem to determine the combined effect of thesesources together in one circuit.
Use the Superposition Theorem to determine the voltage present between the indicator’s terminals,assuming the transmitter happens to be outputting a 50% (12 mA) analog signal, and the HARTcommunicator happens to be outputting a 400 mV AC signal at 2200 Hz at the moment of our analysis.
file i03876
164

Answer 53
Recall that the Superposition Theorem works by considering one source at a time, with all other sources“disabled” and replaced by their respective internal impedances. With four sources, this means we mustanalyze the circuit four times over (once for each active source), and then superimpose the results of all fouranalyses.
Analysis #1: (DC loop power source only)
"Smart" (HART) transmitter
+− 24 VDC
250 ΩIndicator(1-5 VDC range)
Micro-processor
Process-sensingcircuitry
HARTFSK signal
(1.2/2.2 kHz)
4-20 mAanalog signal
HART communicator
HARTFSK signal
(1.2/2.2 kHz)
0 VDC
Here, we see what the loop power supply does on its own, with all current sources opened (infiniteinternal impedance) and all other voltage sources shorted (zero internal impedance). The result is an opencircuit, with nothing dropped across the 250 ohm resistor.
165

Analysis #2: (HART communicator source only)
"Smart" (HART) transmitter
250 ΩIndicator(1-5 VDC range)
Micro-processor
Process-sensingcircuitry
HARTFSK signal
(1.2/2.2 kHz)
4-20 mAanalog signal
HART communicator
HARTFSK signal
(1.2/2.2 kHz)
400 mVAC
Here, we see what the HART communicator’s AC voltage source does on its own, with all current sourcesopened (infinite internal impedance) and all other voltage sources shorted (zero internal impedance). Theresult is the communicator’s AC voltage dropped entirely across the resistor (and also across the terminals ofthe smart transmitter where the microprocessor will be able to read it). We are assuming that the couplingcapacitor’s impedance is negligible.
166

Analysis #3: (transmitter analog source only)
"Smart" (HART) transmitter
250 ΩIndicator(1-5 VDC range)
Micro-processor
Process-sensingcircuitry
HARTFSK signal
(1.2/2.2 kHz)
4-20 mAanalog signal
HART communicator
HARTFSK signal
(1.2/2.2 kHz)
3 VDC
Here, we see what the smart transmitter’s DC current source does on its own, with all other currentsources opened (infinite internal impedance) and all voltage sources shorted (zero internal impedance). Theresult is a 3 volt drop across the resistor based on Ohm’s Law (V = IR = 12 mA × 250 Ω = 3 volts).
167

Analysis #4: (transmitter HART source only)
"Smart" (HART) transmitter
250 ΩIndicator(1-5 VDC range)
Micro-processor
Process-sensingcircuitry
HARTFSK signal
(1.2/2.2 kHz)
4-20 mAanalog signal
HART communicator
HARTFSK signal
(1.2/2.2 kHz)
0 VAC
Here, we see what the smart transmitter’s AC current source does on its own, with all other currentsources opened (infinite internal impedance) and all voltage sources shorted (zero internal impedance). Theresult is nothing, since the MOSFET in series with this source is turned off.
Superimposing all these results together, we see that the indicator experiences a composite DC+ACsignal of 3 volts DC and 400 mV AC at 2200 Hz.
Notes 53
168

Question 54
Suppose an electronic pressure transmitter has an input range of 0 to 100 PSI and an output range of4 to 20 mA. When subjected to a 5-step up-and-down “As-Found” calibration test, it responds as such:
Applied pressure Output signal(PSI) (mA)
0 3.525 7.550 11.575 15.5100 19.575 15.550 11.525 7.50 3.5
Sketch this instrument’s ideal transfer function on the graph below, along with its actual transfer functiongraph based on the measured values recorded above. Then, determine what kind of calibration error it has(zero shift, span shift, hysteresis, and/or linearity):
Input
Output
0
0
4
12
20
8
16
(mA)
(PSI)
100755025
Finally, identify how this calibration error might be corrected. What steps or procedures would youfollow to rectify this problem?
Suggestions for Socratic discussion
• How might the other three calibration errors appear when graphed?• What purpose is served by doing an up-and-down test? Why not just check the instrument’s response
in one direction only?• Which constant in the y = mx + b linear equation represents zero, and which represents span?• Describe how a computer spreadsheet program (e.g. Microsoft Excel) might be a useful tool in graphing
this instrument’s response.
file i00081
169

Answer 54
This instrument has a zero shift error, but not a span shift or linearity error.
Ideal transfer function:
Input
Output
0
0
4
12
20
8
16
(mA)
(PSI)
100755025
Actual transfer function: (zero error)
Input
Output
0
0
4
12
20
8
16
(mA)
(PSI)
100755025
ideal
actual
170

A span error would look something like this (wrong slope):
Input
Output
0
0
4
12
20
8
16
(mA)
(PSI)
100755025
ideal
actual
A linearity error would look something like this (not a straight line):
Input
Output
0
0
4
12
20
8
16
(mA)
(PSI)
100755025
ideal
actual
A zero error is usually correctable by simply adjusting the “zero” screw on an analog instrument, withoutmaking any other adjustments. Span errors, by contrast, usually require multiple adjustments of the “zero”and “span” screws while alternately applying 0% and 100% input range values to check for correspondenceat both ends of the linear function.
Notes 54
171

Prep Quiz:Suppose an electronic pressure transmitter has an input range of 0 to 100 PSI and an output range of
4 to 20 mA. When subjected to a series of known pressures to obtain an “As-Found” calibration table, itresponds as such:
Applied pressure Output signal(PSI) (mA)
0 4.125 8.150 12.175 16.1100 20.175 16.150 12.125 8.10 4.1
Identify the type of calibration error this transmitter suffers from:
• Zero shift
• Span shift
• Linearity
• Hysteresis
172

Prep Quiz:Suppose an electronic pressure transmitter has an input range of 0 to 100 PSI and an output range of
4 to 20 mA. When subjected to a series of known pressures to obtain an “As-Found” calibration table, itresponds as such:
Applied pressure Output signal(PSI) (mA)
0 4.025 8.150 12.275 16.3100 20.475 16.350 12.225 8.10 4.0
Identify the type of calibration error this transmitter suffers from:
• Zero shift
• Span shift
• Linearity
• Hysteresis
173

Prep Quiz:Suppose an electronic pressure transmitter has an input range of 0 to 100 PSI and an output range of
4 to 20 mA. When subjected to a series of known pressures to obtain an “As-Found” calibration table, itresponds as such:
Applied pressure Output signal(PSI) (mA)
0 4.025 8.150 12.275 16.1100 20.075 16.150 12.225 8.10 4.0
Identify the type of calibration error this transmitter suffers from:
• Zero shift
• Span shift
• Linearity
• Hysteresis
174

Prep Quiz:Suppose an electronic pressure transmitter has an input range of 0 to 100 PSI and an output range of
4 to 20 mA. When subjected to a series of known pressures to obtain an “As-Found” calibration table, itresponds as such:
Applied pressure Output signal(PSI) (mA)
0 4.025 8.050 12.075 16.0100 20.075 16.150 12.125 8.10 4.1
Identify the type of calibration error this transmitter suffers from:
• Zero shift
• Span shift
• Linearity
• Hysteresis
175

Question 55
Determine the nominal resistance values of these resistors, given their band colors, and also express theallowable tolerance in ohms (i.e. what the minimum and maximum acceptable resistance values are for eachresistor given its advertised tolerance).
For example, a 25 kΩ resistor with a 10% tolerance rating would have an allowable tolerance of +/- 2.5kΩ.
• Red, Org, Blu, Gld =• Brn, Blk, Grn, Sil =• Blu, Blk, Brn, Gld =• Yel, Vio, Red, Sil =• Grn, Brn, Yel =• Wht, Blu, Blk, Sil =• Gry, Grn, Org, Gld =• Org, Org, Gld =• Vio, Red, Sil, Gld =• Brn, Red, Blk, Sil =
file i00088
Answer 55
• Red, Org, Blu, Gld = 23 MΩ, +/- 1.15 MΩ• Brn, Blk, Grn, Sil = 1 MΩ, +/- 100 kΩ• Blu, Blk, Brn, Gld = 600 Ω, +/- 30 Ω• Yel, Vio, Red, Sil = 4.7 kΩ, +/- 470 Ω• Grn, Brn, Yel = 510 kΩ, +/- 102 kΩ• Wht, Blu, Blk, Sil = 96 Ω, +/- 9.6 Ω• Gry, Grn, Org, Gld = 85 kΩ, +/- 4.25 kΩ• Org, Org, Gld = 3.3 Ω, +/- 0.66 Ω• Vio, Red, Sil, Gld = 0.72 Ω, +/- 0.036 Ω• Brn, Red, Blk, Sil = 12 Ω, +/- 1.2 Ω
Notes 55
This question serves as a great review for the mathematical concepts of scientific notation andpercentages. Challenge your students to perform all the math without using a calculator, and withoutwriting anything!
176

Question 56
An important part of performing instrument calibration is determining the extent of an instrument’serror. Error is usually measured in percent of span. Calculate the percent of span error for each of thefollowing examples, and be sure to note the sign of the error (positive or negative):
• Pressure gauge• LRV = 0 PSI• URV = 100 PSI• Test pressure = 65 PSI• Instrument indication = 67 PSI• Error = % of span
• Weigh scale• LRV = 0 pounds• URV = 40,000 pounds• Test weight = 10,000 pounds• Instrument indication = 9,995 pounds• Error = % of span
• Thermometer• LRV = -40oF• URV = 250oF• Test temperature = 70oF• Instrument indication = 68oF• Error = % of span
• pH analyzer• LRV = 4 pH• URV = 10 pH• Test buffer solution = 7.04 pH• Instrument indication = 7.13 pH• Error = % of span
Also, show the math you used to calculate each of the error percentages.
Challenge: build a computer spreadsheet that calculates error in percent of span, given the LRV, URV,test value, and actual indicated value for each instrument.
file i00089
177

Answer 56
• Pressure gauge• LRV = 0 PSI• URV = 100 PSI• Test pressure = 65 PSI• Instrument indication = 67 PSI• Error = +2 % of span
• Weigh scale• LRV = 0 pounds• URV = 40,000 pounds• Test weight = 10,000 pounds• Instrument indication = 9,995 pounds• Error = -0.0125 % of span
• Thermometer• LRV = -40oF• URV = 250oF• Test temperature = 70oF• Instrument indication = 68oF• Error = -0.69 % of span
• pH analyzer• LRV = 4 pH• URV = 10 pH• Test buffer solution = 7.04 pH• Instrument indication = 7.13 pH• Error = +1.5 % of span
Notes 56
Here is the equation I used to calculate percentage error in each case:
% error =
(
Actual − Ideal
Span
)
(100%)
Remember that the mathematical sign of the error is very important to note! Both the weigh scale andthe thermometer have negative error values because their indications fell below the test (ideal) values.
A positive error value means the instrument registers too much, while a negative error value means theinstrument registers too little.
178

Question 57
A common form of measurement error in instruments is called hysteresis. A very similar type ofmeasurement error is called deadband. Describe what these errors are, and differentiate between the two.
file i00091
Answer 57
Hysteresis and dead band are not exactly the same type of calibration error, but they are closely related.“Dead band” refers to a range of instrument measurement during reversal of input where the output does notchange at all. A common example of this is a “loose” steering system in an automobile, where the steeringwheel must be turned excessively to take up “backlash” (mechanical slack) in the linkage system.
Hysteresis refers to the situation where a reversal of input causes an immediate, but not proportionate,reversal of output. This is commonly seen in air-actuated valves, where air pressure acts against the action ofa large spring to precisely position a valve mechanism. Ideally, the valve mechanism will move proportionallyto the air pressure signal sent to it, and this positioning will be both repeatable and accurate. Unfortunately,friction in the valve mechanism produces hysteresis: a different air pressure signal may be required to positionthe valve mechanism at the same location opening versus closing, but unlike dead band, any amount of signalreversal (change of direction: increasing vs. decreasing) will cause the valve to move slightly.
Compare the following transfer function graphs to understand the difference between hysteresis anddead band:
Input
Output
Ideal instrument response(no hysteresis or dead band)
Dead band:
Hysteresis:
Output
Input
Output
Input
goingdown
goingup
Deadband
Output
Input
downgoing
goingup
Deadband
Output
Input
goingup
goingdown
goingup
goingdown
Both dead band and hysteresis are characteristically mechanical phenomena. Electronic circuits rarelyexhibit such “artifacts” of measurement or control. Dead band and hysteresis are more often found togetherthan separately in any instrument.
Interestingly, both effects are present in magnetic circuits. The magnetization curves for typicaltransformer core steels and irons are classic examples of hysteresis, whereas the magnetization curve forferrite (in the saturation region) is quite close to being a true representation of deadband.
Notes 57
179

Question 58
Analog electronic process transmitters typically have only two calibration adjustments: one for zero andanother for span. Occasionally you may find an analog electronic transmitter with a third adjustment: onefor linearity.
Modern “smart” process transmitters have more components in need of adjustment. A block diagramof a typical smart pressure transmitter shows this very clearly:
Analog-to-Digital
Converter
Digital-toAnalog
Converter
Micro-processor
Sensor
"Smart" pressure transmitter
4-20 mA
LRV URVTrim adjustments
Low HighTrim adjustments
Low High
(ADC) (DAC)
Range adjustments
The purpose of the analog-to-digital converter (ADC) is to translate the pressure sensor’s electricaloutput signal into a digital number the microprocessor can understand. Likewise, the purpose of the digital-to-analog converter (DAC) is to translate the digital output of the microprocessor into a 4 to 20 mA DCcurrent signal representing measured pressure. The procedure of calibrating the ADC is called a sensor trim,while the process of calibrating the DAC is called an output trim.
Explain the importance of performing both a sensor trim and an output trim whenever calibrating a“smart” transmitter. In other words, explain why it is not enough to simply program LRV and URV valuesinto the microprocessor (e.g. LRV = 0 PSI ; URV = 30 PSI) and declare the job finished.
Furthermore, explain what external calibration equipment must be connected to the transmitter tocomplete a sensor trim procedure, and also what external calibration equipment must be connected in orderto complete an output trim procedure.
file i00090
180

Answer 58
Simply setting the LRV and URV values is not actually calibrating the transmitter to accuratelycorrespond to reality. If this concept is hard to grasp, imagine a transmitter whose LRV and URV valuesare set perfectly, and whose DAC is calibrated just right, but whose ADC suffers from a zero shift. Themicroprocessor will “think” the pressure is something different from what it really is, and it will output anincorrect (zero-shifted) milliamp signal as a result.
In order to perform a sensor trim, you must connect a known pressure source (a standard) to thetransmitter’s input port and correlate that standard pressure to the pressure value registered by themicroprocessor. When trimming the output, you must connect a precise milli-ammeter in series with thetransmitter’s output current to correlate the intended current signal of the microprocessor to the actualcurrent.
Notes 58
While it is possible to compensate for zero and span shifts by skewing the LRV and URV parameters,this is not a good way to calibrate the transmitter. This is especially true if the transmitter is supposed tohave a nonlinear transfer function, as is the case with DP transmitters used to measure flow, or temperaturetransmitters configured to “linearize” the inherently nonlinear signal of a thermocouple. With a nonlineartransfer function, zero and span shifts on the input do not correspond to equivalent zero and span shifts onthe output!
181

Question 59
Sketch a circuit whereby this loop-powered pressure transmitter sends a signal to an analog voltagemeter (acting as a remote pressure gauge). Be sure to route all wiring and attach any necessary componentsto terminals on the terminal strip:
H L
4-20 mA loop-poweredpressure transmitter
1-5 V voltmeter
24 VDCpower supply
Terminalstrip
Note: avoid connecting more than two wires to each screw terminal on the terminal strip, to avoid“overcrowding” any connection points, and avoid crossing wires over each other.
file i03182
182

Answer 59
This is just one possible solution:
H L
4-20 mA loop-poweredpressure transmitter
1-5 V voltmeter
24 VDCpower supply
Terminalstrip
250 Ω
Notes 59
183

Question 60
Connect a loop-powered differential pressure transmitter (4-20 mA output) to a DC voltage source, a250 ohm resistor, and a diode as shown, using parts supplied by the instructor. You will need to bring yourmultimeter as well as a 4-20 mA loop calibrator for this experiment! All electrical connections must be madeusing a terminal strip (no twisted wires, crimp splices, wire nuts, spring clips, or “alligator” clips permitted):
+ - + -
Loop-powered (2-wire)
9 volt 9 volt
250 ΩDiode
H L
Loop DP transmitter Schematic
9 V
9 V
250 Ω
2-wiretransmitter1 2 3 4 5 6 7 8
mA mA
When you have your transmitter powered and functioning, answer the following questions:
• Demonstrate how to measure the transmitter’s signal using a voltmeter connected in parallel with the250 ohm resistor. Leave the voltmeter connected for the duration of the experiment.
• Demonstrate how to use the loop calibrator in the “Measure” (or “Read”) mode to measure the amountof current output by the transmitter. Compare the loop calibrator’s current measurement against thevoltmeter’s voltage measurement.
• Remove the transmitter from the circuit and replace it with the loop calibrator, then demonstrate howto use the loop calibrator in the “Simulate” mode to mimic the operation of the transmitter. Comparethe loop calibrator’s current simulation value against the voltmeter’s voltage measurement.
• Remove the batteries and the transmitter from the circuit and replace both with the loop calibrator,then demonstrate how to use the loop calibrator in the “Source” mode to supply current through theresistor and diode. Compare the loop calibrator’s current source value against the voltmeter’s voltagemeasurement.
file i03880
Answer 60
184

Notes 60
Virtual Troubleshooting
This question is a good candidate for a “Virtual Troubleshooting” exercise. Presenting the diagram tostudents, you first imagine in your own mind a particular fault in the system. Then, you present one or moresymptoms of that fault (something noticeable by an operator or other user of the system). Students thenpropose various diagnostic tests to perform on this system to identify the nature and location of the fault, asthough they were technicians trying to troubleshoot the problem. Your job is to tell them what the result(s)would be for each of the proposed diagnostic tests, documenting those results where all the students can see.
During and after the exercise, it is good to ask students follow-up questions such as:
• What does the result of the last diagnostic test tell you about the fault?• Suppose the results of the last diagnostic test were different. What then would that result tell you about
the fault?• Is the last diagnostic test the best one we could do?• What would be the ideal order of tests, to diagnose the problem in as few steps as possible?
185

Question 61
Read and outline the “Process Flow Diagrams” section of the “Instrumentation Documents” chapter inyour Lessons In Industrial Instrumentation textbook. Note the page numbers where important illustrations,photographs, equations, tables, and other relevant details are found. Prepare to thoughtfully discuss withyour instructor and classmates the concepts and examples explored in this reading.
Suggestions for Socratic discussion
• Review the tips listed in Question 0 and apply them to this reading assignment.
file i03886
Answer 61
Notes 61
Process Flow Diagrams show major pipes and equipment, few instrument details. Sometimes cannottell which instruments control what.
In the book’s example PFD, we see an evaporator system where a compressor is used to draw vaporsoff of an evaporator vessel, then send those compressed vapors to a “knockout drum” vessel where some ofthem will condense back into liquid.
Suggestions for Socratic discussion
• Describe the purpose of a PFD, as contrasted against a P&ID or a loop diagram• Identify features of this process that we can tell from the PFD• Suppose the circuit breaker supplying power to the compressor motor trips. What effects will this have
on variables within this process?• Suppose the level valve on the evaporator vessel fails shut. What effects will this have on variables
within this process?
186

Prep Quiz:
Part A – multiple-choice Choose the appropriate sequence of diagrams, in order of least specific (mostgeneral) to most specific (most detailed):
• P&ID, Loop, PFD
• P&ID, PFD, Loop
• Loop, PFD, P&ID
• PFD, Loop, P&ID
• PFD, P&ID, Loop
Part B – written response Identify where you can locate the Instrumentation program calendar listing allcourse-specific events and dates. Note that there are multiple locations where the calendar resides, but youonly need to identify one of them!
Part C – written response Identify where you can locate the grade spreadsheet file for all second-yearInstrumentation courses. Note that there are multiple locations where the spreadsheet resides, but you onlyneed to identify one of them!
Note: your explanations need to be complete and clearly written. Expressing your ideas clearly andcompletely is every bit as important as having those ideas correct in your own mind!
187

Question 62
Read and outline the “Process and Instrument Diagrams” section of the “Instrumentation Documents”chapter in your Lessons In Industrial Instrumentation textbook. Note the page numbers where importantillustrations, photographs, equations, tables, and other relevant details are found. Prepare to thoughtfullydiscuss with your instructor and classmates the concepts and examples explored in this reading.
Suggestions for Socratic discussion
• Review the tips listed in Question 0 and apply them to this reading assignment.
file i03887
Answer 62
Notes 62
A P&ID is a “zoomed-in” view of particular section of process compared to a PFD, showing generalconnections between instruments. Some instruments appear on a P&ID that would not appear on a PFD.
All instruments in the same loop share the same number (e.g. FT-42, FIC-42, PDT-42, FV-42).
ISA symbols: lines through middle of bubbles denotes location.
• No line = locate in the field• Single line = located in the main control room
→ Solid = front→ Dashed = rear
• Double line = located in an auxiliary location→ Solid = front→ Dashed = rear
Box around instrument bubbles denotes functions located within the same physical instrument.
No wiring details, instrument configuration data, etc. in a P&ID.
Suggestions for Socratic discussion
• Explain how different instrument locations are represented by bubbles in a P&ID. Is there a way foryou to make logical sense of these symbols so as to remember them better?
• Which temperature transmitter do you think will register the higher temperature, and why?• Suppose FV-42 fails wide open. What effect will this fault have on the operation of the compressor?
188

Question 63
Read and outline the “Loop Diagrams” section of the “Instrumentation Documents” chapter in yourLessons In Industrial Instrumentation textbook. Note the page numbers where important illustrations,photographs, equations, tables, and other relevant details are found. Prepare to thoughtfully discuss withyour instructor and classmates the concepts and examples explored in this reading.
Suggestions for Socratic discussion
• Review the tips listed in Question 0 and apply them to this reading assignment.
file i03888
Answer 63
189

Notes 63
Some instruments appear on a loop diagram (a.k.a loop sheet) that would not appear on a P&ID orPFD!
Not quite as detailed as an electronic schematic diagram, but does show all external wiring details(cables, wire colors, terminal blocks, etc.). These details help in troubleshooting! All terminals and fluidconnection ports on instruments are shown as labeled squares.
Field instruments are always drawn on the left-hand side of the loop diagram, and control-roominstruments drawn on the right-hand side.
Instrument input/output ranges helpful in troubleshooting. The input of one instrument is typicallythe output of another, which means these ranges should correlate between instruments.
Arrows near instrument bubbles denote action:
• Up (↑) = direct (output increases as input increases)• Down (↓) = reverse (output decreases as input increases).
Sometimes a “backwards” action is desired for safety reasons. For example, in this system PDT-42 isreverse-acting, which means it outputs 4 mA when it sees a high differential pressure across the compressor.This is intentional, because it means any electrical fault causing a low current condition (e.g. open wire)will be interpreted by the control system as a very high differential pressure, which is considered dangerousfor the compressor and will therefore prompt the controller to take the safest action.
Suggestions for Socratic discussion
• Describe how having input and output ranges specified in a loop diagram is helpful for troubleshootinga control system.
• Explain what “direct” and “reverse” action refer to for an instrument.• Explain why PDT-42 is configured to be reverse-acting instead of direct-acting as is more common for
transmitters.• Is PDT-42 self-powered or loop-powered? Explain how you can tell from the loop diagram.• Where does FT-42 receive its electrical power to operate? If FT-42 is an electrical load, where is its
electrical source?• Suppose an open circuit develops in cable 23. What will the controller “think” has happened to the
compressor?• Suppose a short circuit develops in cable 23. What will the controller “think” has happened to the
compressor?• Suppose an open circuit develops in cable 22. What will happen in this system as a result of this fault?• Suppose a short circuit develops in cable 22. What will happen in this system as a result of this fault?• Suppose an open circuit develops in cable 21. What will the controller “think” has happened to the
compressor?• Suppose a short circuit develops in cable 21. What will the controller “think” has happened to the
compressor?
190

Question 64
Read and outline the “Functional Diagrams” section of the “Instrumentation Documents” chapter inyour Lessons In Industrial Instrumentation textbook. Note the page numbers where important illustrations,photographs, equations, tables, and other relevant details are found. Prepare to thoughtfully discuss withyour instructor and classmates the concepts and examples explored in this reading.
Suggestions for Socratic discussion
• Review the tips listed in Question 0 and apply them to this reading assignment.
file i03889
Answer 64
Notes 64
Functional diagrams show the flow of information in a control system, not the physical layout, withinformation flowing from top to bottom (e.g. FT to FIC to FV, top to bottom). Rectangular blocks areautomatic functions ; diamond blocks are human-actuated functions ; dashed lines are discrete (on/off)signals whereas solid lines are continuous signals.
Level of detail shown in a functional diagram may vary from vague to explicit.
Meanings of typical symbols in a Functional Diagram (note that there is a later section in the book showinga page with all the Function Diagram symbol definitions):
• Circle = transmitter• Square/rectangle = automatic function (e.g. PID algorithm)• Diamond = manual (human-settable) function• Trapezoid = final control element• Solid line = continuous signal• Dashed line = discrete (on/off) signal
Suggestions for Socratic discussion
• Why do functional diagrams exist at all? What do they tell us that we cannot discern from PFDs,P&IDs, or loop sheets?
• Identify the meanings of the various geometric shapes found in a Functional Diagram (e.g. circles,squares, diamonds, trapezoids).
• Identify the meanings of the various line types found in a Functional Diagram (e.g. solid, dashed).• Suppose the flow transmitter shown in the first functional diagram example senses an increased flow.
Assuming a constant controller setpoint value, what action will the controller take as a result? Can wetell for sure in this diagram, or do we need more information?
191

Question 65
Read and outline the “Instrument Identification Tags” section of the “Instrumentation Documents”chapter in your Lessons In Industrial Instrumentation textbook. Note the page numbers where importantillustrations, photographs, equations, tables, and other relevant details are found. Prepare to thoughtfullydiscuss with your instructor and classmates the concepts and examples explored in this reading.
Suggestions for Socratic discussion
• Review the tips listed in Question 0 and apply them to this reading assignment.
file i04312
Answer 65
Notes 65
ISA standard 5.1 defines tags: letters for function, number for loop ID:
• FC-135 (flow controller in loop 135)• 12-FC-135 (flow controller in loop 135, in unit area 12)
First letter of tag for each instrument in a loop must be the same, based on variable measured bytransmitter. Second letter may be a modifier to that first letter (PD.. = differential pressure). Remainingletters describe function of instrument (“PT” = pressure transmitter ; “PI” = pressure indicator). If multipleletters are used for functions, first letter is passive (manual) while second letter is active (automatic).
User-defined letters (e.g. B, C, D, G, M, N, O) are used more than once in the same diagram. Unclassifiedletter (X) used only once (or a very limited number of times) in the same diagram.
Suggestions for Socratic discussion
• Explain how the instrument tag names shown in your lab project loop diagram conform to the ISA 5.1standard.
• What criterion dictates the first letter of any ISA-standard instrument tag in a control loop?• Referencing your own loop diagram, identify some alternative letterings that could be applied to each
instrument (e.g. PC or PRC instead of PIC).• Where might you choose to use an unclassified letter to represent an instrument’s process variable as
opposed to a user-defined letter?
192

Prep Quiz:
Part A – multiple-choice Identify the proper ISA “tag” for a flow controller that also indicates the processvariable to human operators:
• FII
• FCC
• FQC
• FIC
• FKC
Part B – written response Identify where you can locate the Instrumentation program calendar listing allcourse-specific events and dates. Note that there are multiple locations where the calendar resides, but youonly need to identify one of them!
Part C – written response Identify where you can locate the grade spreadsheet file for all second-yearInstrumentation courses. Note that there are multiple locations where the spreadsheet resides, but you onlyneed to identify one of them!
Note: your explanations need to be complete and clearly written. Expressing your ideas clearly andcompletely is every bit as important as having those ideas correct in your own mind!
193
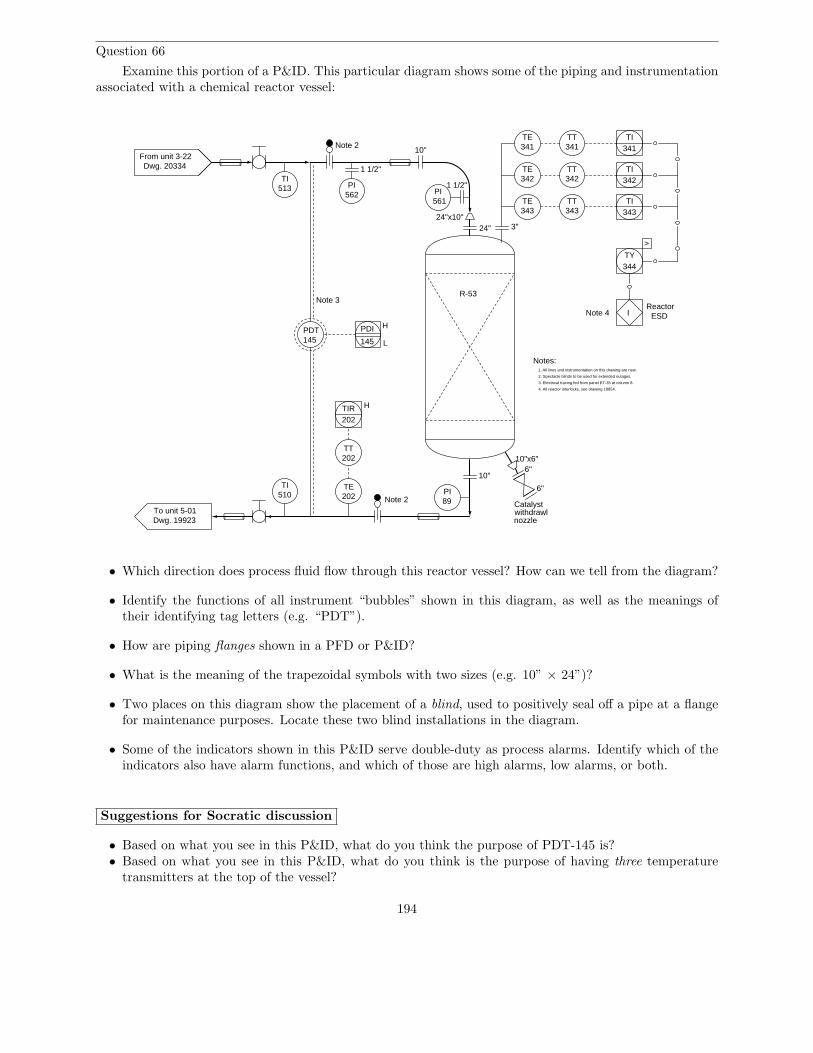
Question 66
Examine this portion of a P&ID. This particular diagram shows some of the piping and instrumentationassociated with a chemical reactor vessel:
PDT145
R-53
10"6"
6"
Catalystwithdrawl nozzle
TE202
202
TIR202
TT
H
PI89
24"
PI562
1 1/2"
1 1/2"
10"
PI561
TE
TE
TE
341
342
343
3"
341
342
343TT
TT
TT
342
343
341TI
TI
TI
>
TY344
I ESDReactor
PDI
145
H
L
From unit 3-22Dwg. 20334
To unit 5-01Dwg. 19923
10"x6"
Note 2
Note 2
Notes:1. All lines and instrumentation on this drawing are new.
2. Spectacle blinds to be used for extended outages.
Note 3
3. Electrical tracing fed from panel ET-35 at column 8.
Note 4
4. All reactor interlocks, see drawing 18854.
TI513
510TI
24"x10"
• Which direction does process fluid flow through this reactor vessel? How can we tell from the diagram?
• Identify the functions of all instrument “bubbles” shown in this diagram, as well as the meanings oftheir identifying tag letters (e.g. “PDT”).
• How are piping flanges shown in a PFD or P&ID?
• What is the meaning of the trapezoidal symbols with two sizes (e.g. 10” × 24”)?
• Two places on this diagram show the placement of a blind, used to positively seal off a pipe at a flangefor maintenance purposes. Locate these two blind installations in the diagram.
• Some of the indicators shown in this P&ID serve double-duty as process alarms. Identify which of theindicators also have alarm functions, and which of those are high alarms, low alarms, or both.
Suggestions for Socratic discussion
• Based on what you see in this P&ID, what do you think the purpose of PDT-145 is?• Based on what you see in this P&ID, what do you think is the purpose of having three temperature
transmitters at the top of the vessel?
194

• How are additional documents cross-referenced within this P&ID?• Are there sections of your textbook that might be helpful to you in understanding this P&ID which
were not explicitly assigned for reading?
file i03890
Answer 66
If a blind or another other safety device needs to be left in its safe state for any specific reason, theperson engaging that safety device must lock it in place and tag it with an informative tag stating the reasonand duration of the lock-out. This is commonly referred to as a lock-out, tag-out procedure.
Notes 66
Process flow is top to bottom (follow the arrows).
PDT = Differential pressure transmitterTE = Temperature element (sensor)PI = Pressure indicatorTY = Temperature relay/converter/computing function
Pipe flanges shown by short parallel lines perpendicular to the pipe.
Trapezoid = pipe reducer/expander, with pipe sizes specified
Blinds have “Note 2” near them.
Process alarms indicated by “H” (high) and “L” (low) letters written next to the instrument bubblesymbols.
Virtual Troubleshooting
This question is a good candidate for a “Virtual Troubleshooting” exercise. Presenting the diagram tostudents, you first imagine in your own mind a particular fault in the system. Then, you present one or moresymptoms of that fault (something noticeable by an operator or other user of the system). Students thenpropose various diagnostic tests to perform on this system to identify the nature and location of the fault, asthough they were technicians trying to troubleshoot the problem. Your job is to tell them what the result(s)would be for each of the proposed diagnostic tests, documenting those results where all the students can see.
During and after the exercise, it is good to ask students follow-up questions such as:
• What does the result of the last diagnostic test tell you about the fault?• Suppose the results of the last diagnostic test were different. What then would that result tell you about
the fault?• Is the last diagnostic test the best one we could do?• What would be the ideal order of tests, to diagnose the problem in as few steps as possible?
195

Question 67
Examine this loop diagram, and answer the following questions:
FT733
23
24
Under C-5
Red
Black
733FI Red
Black
Red
Black
Red
Black
Under C-5733
Fail closed
Red
Black
13
14
15
16
41
42
43
5
6
Isomerization unit instrument shelter
ISOM-FTB-18
ISOM-FTB-18
Note 1
+24VDC10
11
12
19
20
FTA-HLAI
FTA-AO
FI733
FO733
FC733
Cont. on loop #Isom-747
Red
Black
Red
Black
Red
Black
Blue
Red
Black
Red
Black
Red
Black
Tag: FT-733Wire Pair
Wire PairTag: FV-733
FV
Cable: ISOM-18
Cable: ISOM-18
Tag: FV-733
Pair: 4
Pair: 5
Tag: FT-733Wire Pair
Wire PairTag: FV-733
ISOM-M-3
ISOM-M-3
AM14
AM9
Cable: AM9
Cable: AM14
Triad: 8
Pair: 12
Tag: ISOM-M-78
Tag: ISOM-M-51
Redundant AINode 7Module 29Slot 12
Redundant AONode 7Module 12Slot 10
TB2
TB2
25
26
Notes:1. Field junction box circuit as per refinery
SP
PV
Out
Range: 0 to 125 "WCNote 2
2. All square-root characterization intransmitter, not DCS.
Note 33. Field indicators located at ground level,
near manual bypass valve.
Node 7Reg CtlSlot 41
Under C-8
Loop: Isom unit feed flow
standard Equ. S-49 ; R = 10 Ω
Tag: FT-733
Wire PairTag: FI-733
• What type of control loop is represented in this diagram? In other words, what is the process variable,and how is this process variable manipulated?
• What is the calibrated range of the sensing instrument?
• How are physical locations for wire connection points declared in this diagram?
• Assuming the resistor inside the DCS input card is 250 ohms, calculate the amount of voltage betweenterminals 23 and 24 at a transmitter signal value of 50%.
• Identify where wires are part of a larger, multi-conductor cable, and identify how those wires aredistinguished from all the others in that cable.
• Identify the convention used to label wire pairs for each field instrument. In other words, how can aperson tell whether a certain wire pair is going out to the transmitter, the indicator, or the controlvalve?
• Identify at least two different ways you could measure the transmitter’s signal without interrupting the4-20 mA current signal to the flow controller.
Suggestions for Socratic discussion
• A problem-solving technique useful for analyzing circuits is to re-draw the circuit in a form that is easierto follow than what is shown to you on the given diagram. Discuss and compare different renderings ofthis circuit, and how these simplified sketches help you with the analysis.
• Explain why interrupting the loop’s continuity is a bad thing if the control system is operating,controlling a live process.
• What do the letters “FI” and “FO” stand for? Are these labels ISA-standard?• Is FT-733 self-powered or loop-powered? How can you tell?• Sketch arrows showing the direction of electric current in each wire (using conventional flow notation),
identifying each component as being either a source or a load.• Identify all the effects of pair 4 within cable ISOM-18 failing open.
196

• Identify all the effects of pair 4 within cable ISOM-18 failing shorted.• Identify all the effects of pair 5 within cable ISOM-18 failing open.• Identify all the effects of pair 5 within cable ISOM-18 failing shorted.• Identify all the effects of cable FI-733 failing open.
file i03891
Answer 67
At a 50% signal (12 mA in a 4-20 mA range), the voltage dropped between terminals 23 and 24 will be21 volts.
Notes 67
Isomerization unit feed flow control loop! Flow is manipulated by a valve.
FT-733 has a calibrated range of 0 to 125 inches water column (125 ”WC).
Shelter location denoted by dashed-line box. “C-5” referenced as a location for some terminal blocks.
V23−24 = 24 volts − VR = 24 volts − 3 volts = 21 volts
Pair and Triad numbers used to distinguish wire pairs within multi-pair cables.
Each cable labeled according to the field device it terminates at.
Measure signal by measuring voltage drop across either resistor. Also by connectingammeter across diode and then disconnecting indicator.
Virtual Troubleshooting
This question is a good candidate for a “Virtual Troubleshooting” exercise. Presenting the diagram tostudents, you first imagine in your own mind a particular fault in the system. Then, you present one or moresymptoms of that fault (something noticeable by an operator or other user of the system). Students thenpropose various diagnostic tests to perform on this system to identify the nature and location of the fault, asthough they were technicians trying to troubleshoot the problem. Your job is to tell them what the result(s)would be for each of the proposed diagnostic tests, documenting those results where all the students can see.
During and after the exercise, it is good to ask students follow-up questions such as:
• What does the result of the last diagnostic test tell you about the fault?• Suppose the results of the last diagnostic test were different. What then would that result tell you about
the fault?• Is the last diagnostic test the best one we could do?• What would be the ideal order of tests, to diagnose the problem in as few steps as possible?
197

Question 68
Read and outline the “Tube and Tube Fittings” section of the “Instrumentation Connections” chapter inyour Lessons In Industrial Instrumentation textbook. Note the page numbers where important illustrations,photographs, equations, tables, and other relevant details are found. Prepare to thoughtfully discuss withyour instructor and classmates the concepts and examples explored in this reading.
Suggestions for Socratic discussion
• Review the tips listed in Question 0 and apply them to this reading assignment.
file i03893
Answer 68
198

Notes 68
Tubes are never threaded like pipes are. Must use connectors to join together. Walls too thin forthreads. Impulse tube/line is tube used to connect instrument to process.
Compression fittings use cone-shaped ferrule and body to form tight seal. Force of tightened nutcompresses ferrule around tube. Swagelok 1 inch and smaller: tighten 1-1/4 turns. Too loose will leak ; tootight will also leak. Parker fittings have similar rules.
Tubing gauge will fit between nut and body if under-tightened. A properly-tightening nut will not allowthe gauge to fit. Properly made connections are stronger than the tube itself.
FITTINGS:• Pipe to tube = connector• Tube to tube = union• Thru panel = bulkhead• Corner = elbow• Branch tee = pipe in, turn to either tube• Run tee = pipe in, straight to one tube, turn to the other tube• Cross = four ports• Plug = blocks fitting• Cap = blocks tube
Tubes sold in 20 foot sections ; unions used to join together for longer runs. Offset unions from tubecenterlines to make them easier to access.
Vibration loop sometimes made when tube extends between objects vibrating in relation to each other.
Automatic tube-tightening tools:• Zero-gravity use (on International Space Station!)• Perfect tightening every time• Record of each connection stored in memory, time/date stamped!• Hydraulic tools, too
Suggestions for Socratic discussion
• Explain why one might choose tube versus pipe (or vice-versa) for any particular application.• Explain how a “go-no go” gap gauge works to test the integrity of compression-style tube fittings. Is
such a gauge foolproof in its results, or are there problems that might escape detection using this tool?• How tight should you tighten the nut on a compression-type tube fitting when re-making a tube
connection (i.e. one that has been swaged previously)? Explain why.• Describe what an under-tightened ferrule might look like when inspected.• Describe what an over-tightened ferrule might look like when inspected.• Describe some of the professional practices employed when bending and laying out tubing (e.g. offset
unions, vibration loops).• Examine the various tube connector illustrations, and explain the rationale behind their names (e.g.
what does “union” mean with reference to a tube fitting?).• Why would one ever choose to use a special tubing tool such as the Aeroswage SX-1 to assemble
compression-style tube fittings?
199

Question 69
Read and outline the “Connections and Wire Terminations” and “DIN Rail” subsections of the“Electrical Signal and Control Wiring” section of the “Instrument Connections” chapter in your LessonsIn Industrial Instrumentation textbook. Note the page numbers where important illustrations, photographs,equations, tables, and other relevant details are found. Prepare to thoughtfully discuss with your instructorand classmates the concepts and examples explored in this reading.
Suggestions for Socratic discussion
• Review the tips listed in Question 0 and apply them to this reading assignment.
file i03892
Answer 69
200

Notes 69
Electrical wire connections made using soldering, screw terminals, compression lugs, twisting.
Terminal blocks hold wire ends underneath screws or metal spring clips to make connections. Crimp-style lugs may be placed on the ends of the wires to make a more rugged tip. Some terminal block sectionsare multi-level. Some terminal block sections contain switches, fuses, breakers, LEDs, etc. Screw clampmechanism works well on both solid and stranded wire. “Screwless” terminal blocks use spring clips toensure a firm connection between the metal bar inside the block and the wire.
Stranded wire will fray if directly pinched by a rotating screw. Best to crimp a lug (compressionterminal) onto the end of a stranded wire and then clamp that lug underneath the screw. Fork and ringstyle terminals available. Compression-style terminals are NEVER to be used on solid-core wire!
Crimping tools used to compress lugs onto wire ends, configured for different lug sizes.
DIN rail is a standard structure used to fasten terminal blocks and other components to flat surfaces.DIN rail is screwed to a metal panel surface, then terminals and other devices “clip” to the rail. Comes in“top hat” and “G” styles.
Devices made for DIN rail mounting include terminal blocks, power supplies, relays, converters, etc.Some terminal blocks ground themselves to the rail! Terminal labels are also manufactured for DIN railmounted terminal blocks.
Suggestions for Socratic discussion
• A very common misconception for many students is to think they can test for a poor wire-to-terminalconnection by measuring electrical resistance between the two screw heads of a terminal block. Explainwhy such a test tells us absolutely nothing about the electrical integrity of the connections between thewire ends and the block.
• Examine the photograph of a screw-type terminal block and explain how it makes a firm electricalconnection to the wire.
• Examine the photograph of a screwless terminal block and explain how it makes a firm electricalconnection to the wire.
• Examine the photograph of a multi-level terminal block and describe what function it performs.• For which type of wire (solid vs. stranded) should compression-style terminals be applied to the ends?• For which type of wire (solid vs. stranded) should compression-style terminals never be applied to the
ends?• Identify appropriate methods for terminating a solid-core wire.• Identify appropriate methods for terminating a stranded wire.• May a standard pair of pliers be used for crimping compression-style terminals onto the ends of wire,
instead of using a special terminal crimping tool? Explain why or why not.• How may terminal blocks and other DIN-rail-mounted components be removed from a DIN rail without
sliding them down the length of the rail to the very end?
201

Question 70
An important concept in education is something called schema: the body of knowledge, expectations,and assumptions that someone uses to interpret any form of communication they are receiving, whetherthat communication be in the form of speech, text, or even something as abstract as art. One does notapproach an action-adventure novel in the same way or with the same expectations that one would approachinstructions for filing tax returns with the IRS. One does not interpret and appreciate a live jazz band in thesame way they would interpret and appreciate choral music. We have different schema for understanding andappreciating these different forms of communication, even if they occur in the same medium (e.g. printedtext, or audible tones).
Industrial system diagrams also have schema associated with them. One does not interpret a P&IDin the same manner that one interprets an electronic schematic or a block diagram, despite their manysimilarities. This exercise will ask you to identify the meanings of similar symbols used in several types ofdiagrams, in order to expose some of the schema you have (or that you are in the process of building).
Reference the following diagrams, and then answer the comparison/contrast questions that follow:
Schematic diagram of a relay circuit
S
120 VAC
P/S
A
B
C
D
E
F
G
H
1 A
24 VDC
H
N
DE
E
1 A
202

Schematic diagram of a fuel tank level sensor circuit
12 V
Ignitionswitch
R1
Fuel levelsensor
5 Ω = Empty260 Ω = Full
Q1 Q2
TP1
TP2
TP3
TP4
440 Ω
Fuel gauge(voltmeter)
Current mirror circuit
Ladder diagram of a solenoid valve control circuit
S 41
3
5
6
7
8
9
5A
(-) (+)
O H A
10
CR1
CR1-1
CR1-2
Reset
R
IL-71
1 3
75
Remote stop
2
11
203

P&ID of a solvent storage tank
S-403Solvent storage tank
T
30 PSI steam
Dwg. 11032
LT305
Dwg. 11032
Condensate header
1-1/2"thick
LI305
WirelessHART HSet @10 oz.
TCV105
24"MW
TT304
WirelessHART
TI304
H
L
Solvent unloading
Dwg. 45231
press.
Set @8 oz.vac.
12"
4"
4" 2"
3"
P-25
ET
ET
ET
LSH234
LAH234
Solvent wash
Dwg. 32451
LSL233
IHC
PSL232
2"
1"
2"
2"
PSH231
PSV14
TT109
TI
109
PG367
PG366
PG368
PG365
PG364
PG363
TG209
PG361
TG205
PT271
271PIR H
Schematic diagram of a hydraulic valve control system
Line valve
Auto/ManReset Pressure pilotSolenoid trip
Regulator
Accumulator
Hand pump
LP gauge
HP gauge
FC
Relief, LP
Relief, HP
(test)
204

Schematic/pictorial diagram of a pressure transmitter
Appliedpressure
Diaphragm
FlexureLightsource
−
+
N
S
Amplifier
"Force motor"(applies forceproportional
to DC current)
Currentsignaloutput
Closely-spacedphotoresistors
Pictorial diagram of an I/P transducer
Spring
Relay
Compressedair
Pivot
Nozzle
Beam
SS
Coil
Coil
Bellow
s
supply
Vent
NN
Precisiontest gauge
mA
mAREAD VDC
OFF% 4 to 20 mA
LOOP CALIBRATOR
SOURCE
2-WIRE
READ
100%20 mA
0%4 mA
ADJUST
TRANSMITTERSIMULATOR
POWER 2-WIRETRANSMITTERS
Fisher model 546 I/P(schematic diagram)
205

Loop diagram of a compressor surge control system
+
-
L1
L2
G
ES 120VAC60 Hz
Fieldpanel
Field process area
Loop Diagram: Revised by: Date:
8
9
April 1, 2003
PDT
Compressor surge control
+
-
FT
42
42
Compressor+
-
FY42b
10
1112
13
1415
16
JB30
1
2
3
4
5
6
7
8
9
+
-
FY
Panel frontPanel rear
+
- 42a
L1
L2
G
ES 120VAC60 Hz
FIC42
JB1
S
AS 20 PSI
I. Hate Surge
0-200 PSID
4-20 mA
IP
0-1500 SCFM
4-20 mA
4-20 mA
0-1500 SCFM
CBL21
CBL22
CBL23
CBL24 CBL25
CBL26
CBL27
PR1
PR2
PR3
1
2
3
4
5
6
FV 42
Functional diagram of control loops
FT
TA A
P I D
FCV
FT
TA A
FCV
D
P I
TA
P I
FT
T A
FCV
206

FOUNDATION Fieldbus function block diagram
OUT_D
OUTAI
OUT_D
OUTAI
OUT_D
OUTAI
IN_1
IN_2
IN_3
IN_4
ISELDISABLE_1
DISABLE_2
DISABLE_3
DISABLE_4
OP_SELECT
OUT
SELECTED
PID
BKCAL_OUT
OUT
BKCAL_IN
CAS_IN
FF_VAL
IN
TRK_IN_D
TRK_VAL
AO
BKCAL_OUT
OUT
CAS_IN
TT-101a
TT-101b
TT-101c
(TT-101a)
(TV-101)
TV-101
Questions:
• Identify the meaning(s) of all dashed lines in these diagrams• Identify the meaning(s) of all arrows in these diagrams• Identify the meaning(s) of all triangles in these diagrams• Identify the meaning(s) of all boxes in these diagrams• Identify the meaning(s) of all circles in these diagrams• Identify how directions of motion are indicated in each diagram (if at all)• Identify how sources of energy are indicated in each diagram (if at all)
file i02683
Answer 70
Notes 70
207

Question 71
Suppose you had a current-to-pressure (“I/P”) transducer with an output range of 3 to 15 PSI andan input range of 4 to 20 mA. The following calibration table shows several input signal levels and theircorresponding percentages of span and output pressures:
Input signal Percent of span Output pressureapplied (mA) (%) (PSI)
6.88 18 5.165.1 6.88 3.8312.8 55 9.617.44 84 13.086.53 15.83 4.9
While the calculations for obtaining percent and output pressure (PSI) from input current (mA) valuesare not very complex, they can be tedious. A powerful computer-based tool for relieving this tedium is atype of application called a spreadsheet. A very common example of spreadsheet software is Microsoft Excel(although other spreadsheet programs exist, some of them free!).
A spreadsheet program presents a screen full of rectangular cells into which text, numerical values, andmathematical formulae may be entered. Each cell is “addressed” by a system of row and column designators,traditionally numbers for rows and letters for columns (like the classic game of “Battleship” where coordinateson a grid-map are called out by letter and number combination) but a more modern convention designatesboth rows and columns by number.
We may set up a spreadsheet to calculate percentage values for this I/P based on input currents asfollows. The yellow and blue cell shading (color fill) shown in this example is entirely optional, but helpsto distinguish number-entry fields from calculated-value fields (the number in the yellow cell R2C1 is themilliamp value you type in to the spreadsheet, while the number in the blue cell R2C3 is the PSI valuecalculated by the spreadsheet):
1
2
3
4
5
Input (mA) Percent
6.88 18.0
1 2 3 4 5
What follows is a list of cell entries needed to create the spreadsheet display you see above:
• Cell R1C1: Input (mA)
• Cell R2C1: 6.88
• Cell R1C3: Percent
• Cell R2C3: = (R2C1 - 4) / 16 (select “%” display formatting)
The text inside cells R1C1 and R1C3 is not essential for the spreadsheet to function – like the colorshading, they merely serve as labels to help describe what the number values mean. The formula enteredinto cell R2C3 begins with an equals sign (=), which tells the spreadsheet to regard it as a formula ratherthan as text to be displayed verbatim as in R1C1 and R1C3. Note how the formula references the numericalvalue located in the “row 2 column 1” cell by calling it “R2C1”. This allows the user to enter differentvalues into cell R2C1, and the spreadsheet will automatically re-calculate the percentage for each enteredmA value. Thus, if you were to edit the contents of cell R2C1 to hold 12.8 instead of 6.88, the value shownin cell R2C3 would update to display 55.0 instead of 18.0 as it does now.
208
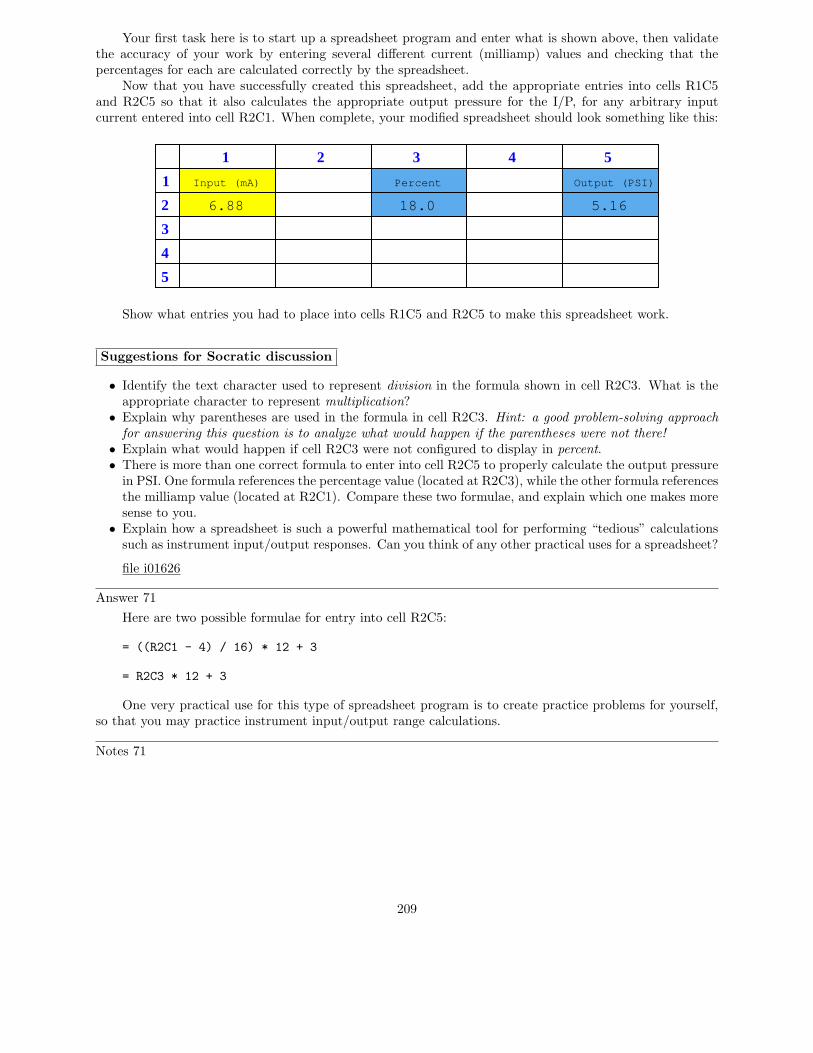
Your first task here is to start up a spreadsheet program and enter what is shown above, then validatethe accuracy of your work by entering several different current (milliamp) values and checking that thepercentages for each are calculated correctly by the spreadsheet.
Now that you have successfully created this spreadsheet, add the appropriate entries into cells R1C5and R2C5 so that it also calculates the appropriate output pressure for the I/P, for any arbitrary inputcurrent entered into cell R2C1. When complete, your modified spreadsheet should look something like this:
1
2
3
4
5
Input (mA) Percent
6.88 18.0 5.16
Output (PSI)
1 2 3 4 5
Show what entries you had to place into cells R1C5 and R2C5 to make this spreadsheet work.
Suggestions for Socratic discussion
• Identify the text character used to represent division in the formula shown in cell R2C3. What is theappropriate character to represent multiplication?
• Explain why parentheses are used in the formula in cell R2C3. Hint: a good problem-solving approachfor answering this question is to analyze what would happen if the parentheses were not there!
• Explain what would happen if cell R2C3 were not configured to display in percent.• There is more than one correct formula to enter into cell R2C5 to properly calculate the output pressure
in PSI. One formula references the percentage value (located at R2C3), while the other formula referencesthe milliamp value (located at R2C1). Compare these two formulae, and explain which one makes moresense to you.
• Explain how a spreadsheet is such a powerful mathematical tool for performing “tedious” calculationssuch as instrument input/output responses. Can you think of any other practical uses for a spreadsheet?
file i01626
Answer 71
Here are two possible formulae for entry into cell R2C5:
= ((R2C1 - 4) / 16) * 12 + 3
= R2C3 * 12 + 3
One very practical use for this type of spreadsheet program is to create practice problems for yourself,so that you may practice instrument input/output range calculations.
Notes 71
209

Summary Quiz:Calculate the output pressure (3-15 PSI range) from an I/P transducer given a 13 mA input signal (4-20
mA range):
• 13.0 PSI
• 12.75 PSI
• 10.8 PSI
• 9.75 PSI
• 13.4 PSI
• 17.33 PSI
210

Question 72
Note the rectangular boxes and arrows near each instrument in the following loop diagram:
Tag number Description Manufacturer Model Calibration Notes
Date:
Process areaField panel Control room panel
Controller
Resistor
I/P transducer
Control valve
I/P
ES 120 VAC
AS 20 PSI
Loop Diagram: Furnace temperature control
TT205
JB-12
TB-15
TB-15
3
4
1
2
Temperature transmitterTT-205 Rosemount 444 0-1500o F 4-20 mA
TE205
April 1, 2002
CP-1
TB-11
TB-11
1
2
7
Vishay 250 ΩTY-205a
TIC-205 Siemens PAC 353 1-5 V 0-1500o F
TY-205b
TV-205 Fisher Easy-E 3-15 PSI
3-15 PSI4-20 mAFisher
H
N
3
4
21
18
TY205b
TY
205a
Breaker #4Panel L2
5
6Cable TY-205b
Cable TT-205 Cable TT-205
Cable TY-205b
TIC205
Revised by: Mason Neilan
TV205
Tube TV-205
Column #8Valve #15
546
0-1500oF 0-1500oF
Fail-closed
Reverse-acting control
TE-205 Thermocouple Omega Type K Ungrounded tip
Red
BlkRed
Yel Red
Blk
Red
Blk
Red
Blk
Wht/Blu
Blu Blu
Wht/Blu
Cable 3, Pr 1
Cable 3, Pr 2
Wht/Org
Org Org
Wht/Org
Blk
Red
Blk
Red
Blk
Wht
Red
Blk
Red
Blk
20
17
Explain what the “up arrows” near the transmitter and transducer bubbles tell us about theseinstruments, and what the “down arrow” near the controller bubbles tells us about that instrument.
file i03607
Answer 72
An “up” arrow indicates a direct-acting instrument, while a “down” arrow represents a reverse-actinginstrument. I’ll let you research what “direct-acting” and “reverse-acting” mean.
211

Notes 72
Direct action: increasing input results in an increasing output.
Reverse action: increasing input results in a decreasing output.
Virtual Troubleshooting
This question is a good candidate for a “Virtual Troubleshooting” exercise. Presenting the diagram tostudents, you first imagine in your own mind a particular fault in the system. Then, you present one or moresymptoms of that fault (something noticeable by an operator or other user of the system). Students thenpropose various diagnostic tests to perform on this system to identify the nature and location of the fault, asthough they were technicians trying to troubleshoot the problem. Your job is to tell them what the result(s)would be for each of the proposed diagnostic tests, documenting those results where all the students can see.
During and after the exercise, it is good to ask students follow-up questions such as:
• What does the result of the last diagnostic test tell you about the fault?• Suppose the results of the last diagnostic test were different. What then would that result tell you about
the fault?• Is the last diagnostic test the best one we could do?• What would be the ideal order of tests, to diagnose the problem in as few steps as possible?
212

Question 73
Suppose you wish to calibrate an electronic pressure transmitter to an input range of 0 to 50 inches ofwater, with an output range of 4 to 20 mA. Complete the following calibration table showing the proper testpressures and the ideal output signal levels at those pressures:
Input pressure Percent of span Output signalapplied (” W.C.) (%) (mA)
53361
file i00462
Answer 73
Input pressure Percent of span Output signalapplied (” W.C.) (%) (mA)
2.5 5 4.816.5 33 9.2830.5 61 13.76
Notes 73
This question is intended for exams only and not worksheets!.
213

Question 74
An electronic pressure transmitter has a calibrated range of 0 to 200 inches of mercury, and its outputsignal range is 4 to 20 mA. Complete the following table of values for this transmitter, assuming perfectcalibration (no error):
Input pressure Percent of span Output signalapplied (” Hg) (%) (mA)
2419
11.7
file i00473
Answer 74
Input pressure Percent of span Output signalapplied (” Hg) (%) (mA)
24 12 5.9238 19 7.04
96.25 48.13 11.7
Notes 74
This question is intended for exams only and not worksheets!.
214

Question 75
An electronic level transmitter has a calibrated range of 0 to 2 feet, and its output signal range is 4 to20 mA. Complete the following table of values for this transmitter, assuming perfect calibration (no error).Be sure to show your work!
Measured level Percent of span Output signal(feet) (%) (mA)1.6
7.140
file i00032
Answer 75
Measured level Percent of span Output signal(feet) (%) (mA)1.6 80 16.8
0.3875 19.375 7.10.8 40 10.4
Notes 75
This question is intended for exams only and not worksheets!.
215

Question 76
A pneumatic differential pressure transmitter has a calibrated range of −100 to +100 inches of watercolumn (” W.C.), and its output signal range is 3 to 15 PSI. Complete the following table of values for thistransmitter, assuming perfect calibration (no error). Be sure to show your work!
Input pressure Percent of span Output signalapplied (”W.C.) (%) (PSI)
0−30
813
6510
Suggestions for Socratic discussion
• Develop a linear equation in the form of y = mx + b that directly relates input pressure (x) to outputpressure (y).
• Demonstrate how to estimate numerical answers for this problem without using a calculator.
file i00096
Answer 76
Input pressure Percent of span Output signalapplied (”W.C.) (%) (PSI)
0 50 9−30 35 7.2
−16.67 41.67 866.67 83.33 1330 65 10.8−80 10 4.2
Notes 76
216

Question 77
Suppose you wish to calibrate an RTD temperature transmitter to an input range of 50 to 200 degreesF, with an output range of 4 to 20 mA. Complete the following calibration table showing the proper testtemperatures and the ideal output signals at those levels:
Input temp Percent of span Output signalapplied (deg F) (%) (mA)
0255075100
file i00644
Answer 77
Input temp Percent of span Output signalapplied (deg F) (%) (mA)
50 0 487.5 25 8125 50 12
162.5 75 16200 100 20
Notes 77
This question is intended for exams only and not worksheets!.
217

Question 78
A temperature transmitter has a calibrated range of -80 to 150 degrees F and its output signal rangeis 4 to 20 mA. Complete the following table of values for this transmitter, assuming perfect calibration (noerror). Be sure to show your work!
Measured temp Percent of span Output signal(oF) (%) (mA)120-45
4225
7.512.9
file i00099
Answer 78
Measured temp Percent of span Output signal(oF) (%) (mA)120 86.96 17.91-45 15.22 6.43516.6 42 10.72-22.5 25 8-29.69 21.88 7.547.94 55.63 12.9
Notes 78
218

Question 79
The ADC0804 is an example of an integrated circuit analog-to-digital converter (ADC), converting ananalog input voltage signal into an 8-bit binary output:
ADC0804
+V
Vin
Digital data output lines
DB0DB7
Clk in
When operated from a 5.0 volt DC power supply in its simplest mode, the ADC0804 converts any DCinput voltage between 0.0 volts and 5.0 volts into an 8-bit number at the command of a clock pulse. A 0.0volt input yields a binary output (or “count”) of 00000000, of course, while a 5.0 volt input yields a countof 11111111.
Complete this table of numbers, relating various DC input voltages with count values (expressed inbinary, hex, and decimal) for an ADC0804 having an input range of 0.0 to 5.0 volts DC:
DC input voltage Binary count Hex count Decimal count0.0 volts 00000000
00110011 512.2 volts 70
B3 17911001100 CC
5.0 volts 11111111
Suggestions for Socratic discussion
• Explain why the “count” value generated by an analog-to-digital converter must be an integer number.For example, explain why a count value of 3275 might be valid, but a count value of 3274.83 is not.
file i03270
Answer 79
Partial answer:
DC input voltage Binary count Hex count Decimal count0.0 volts 000000001.0 volts 00110011 512.2 volts 01110000 70 1123.51 volts 10110011 B3 1794.0 volts 11001100 CC 2045.0 volts 11111111 FF
219

Notes 79
The input voltage range of this ADC is 0.0 to 5.0 volts DC, and the output “count” range is 0 to255 (because it outputs an 8-bit unsigned binary number which has this counting range). Therefore, therelationship between the input voltage and the output count value (in decimal) is a simple proportionality:
Vin
5=
Count
255
Note that all count values are shown rounded down to the nearest integer value:
DC input voltage Binary count Hex count Decimal count0.0 volts 00000000 00 01.0 volts 00110011 33 512.2 volts 01110000 70 1123.51 volts 10110011 B3 1794.0 volts 11001100 CC 2045.0 volts 11111111 FF 255
220

Question 80
Answer 80
Notes 80
221

Question 81
Read and outline the “‘Marking Versus Outlining a Text” subsection of the “Active Reading” sectionof the “Problem-Solving and Diagnostic Strategies” chapter in your Lessons In Industrial Instrumentationtextbook. Note the page numbers where important illustrations, photographs, equations, tables, and otherrelevant details are found. Prepare to thoughtfully discuss with your instructor and classmates the conceptsand examples explored in this reading.
In order to ensure all students are familiar with the concept of “active reading”, you will be required towrite an outline of this section in preparation for today’s classroom session and have it ready to show yourinstructor at the beginning of class. In other words, you must actively read the textbook section on activereading! Any outline failing to meet the level of detail shown in the textbook (i.e. summary statements onall the major points written in your own words, including questions of your own) will result in a deductionto today’s “preparatory” quiz score.
file i01024
Answer 81
Notes 81
Mortimer Adler wrote “How to Mark a Book” which gives tips for actively reading a text. The source textfor this exercise is one page from George Burgess and Henry Louis De Chatelier’s 1912 text on temperaturemeasurement.
Highlighting and underlining words may be an effective to help memorize facts and figures presentedin a text, but it is a poor strategy for understanding. All you are doing is emphasizing certain words orphrases. Adler’s advice is to have a conversation with the author as you read: to mark points of agreementand disagreement. This is what is meant by the phrase active reading.
In the reader’s second approach to the high-temperature text, underlining and highlighting has beenreplaced by underlines and comments on those underlined passages. Here, the reader is asking questionsand formulating hypotheses about what they read. Such points may be raised by the reader once he or shearrives in class with the instructor. Such notes may be taken on a separate piece of paper, or even typed oncomputer, if desired.
In the reader’s third approach to the high-temperature text, a complete outline has been written,expressing the meaning of the text in the reader’s own words. This outline includes sketches as well assentences. Such an outline is a great self-check on understanding, since it will become immediately apparentto the reader if and when they have lost focus on the text (since they won’t be able to outline anymore).Outlining like this takes time, but this is appropriate as deep concepts take time to digest. Outlines are alsogreat study tools, because they document the reader’s impressions of the text for future review where thereader can check to see if their understanding of the subject has changed.
222

Prep Quiz:Have students submit their written outlines of this reading assignment, showing how they were able to
express the major ideas in their own words.
223

Question 82
Read and outline the “‘Normal’ Status of a Switch” section of the “Discrete Process Measurement”chapter in your Lessons In Industrial Instrumentation textbook. Note the page numbers where importantillustrations, photographs, equations, tables, and other relevant details are found. Prepare to thoughtfullydiscuss with your instructor and classmates the concepts and examples explored in this reading.
Note: this is a subject of much confusion for students, especially with regard to process switches such aspressure, level, temperature, and flow switches. A special practice worksheet has been made for students onthis very subject called “Process Switches and Switch Circuits” available on the Socratic Instrumentationwebsite.
Given the importance of this topic as well as the confusing meaning of the word “normal” when describingswitch contacts, this reading exercise is an excellent opportunity for you to practice active reading strategies.In particular, you should write your own outline of this textbook section, expressing all the major thoughtsin your own words so that you will have a firmer grasp of these important concepts. This should be yourgoal for all “Read and outline . . .” assignments, in order to maximize your learning.
file i04501
Answer 82
224

Notes 82
The term “normal” is often misunderstood for switch contacts. A switch in its “normal” status is aswitch that is not being stimulated (i.e. it is at rest). Switch symbols are always shown in schematic diagramsin their normal (resting) states.
Normally-open contacts (NO) are often referred to as form A contacts. Normally-closed contacts (NC)are often referred to as form B contacts.
A normally-closed (NC) low-flow switch will be held open by the typical process operating conditions,and will return to its “normal” (resting) status only when the process conditions become abnormal (no flow).Here is where “normal” gets confusing: for the switch, it’s defined as the resting state; but for the processit may be defined in a completely different way. “Normal” for a switch is defined by the manufacturer, whohas no idea how you are going to use this switch in your process.
“Normal” switch states:
• Pushbutton: not being pressed• Pressure: no pressure applied• Temperature: cold• Flow: no flow• Proximity: target far away
Process switch symbols drawn so that an upward motion of mobile element corresponds to increasingstimulus.
NC contacts will close when stimulus is less than threshold; will open when stimulus exceeds threshold.NO contacts will open when stimulus is less than threshold; will close when stimulus exceeds threshold.Switch status is a function of its “normal” design as well as its present stimulus value. We may examineits present status and compare with its “normal” design to qualitatively determine its stimulus value (e.g.looking at PLC input LEDs and determining process conditions from lit/unlit states).
Suggestions for Socratic discussion
• Explain why there is so much confusion surrounding the term “normal” for process switches.• Identify at least one fault that could prevent the LED from illuminating (regardless of process variable
conditions) in the example circuit shown in the reading.• Think of an example where the “normal” status of a switch is not the same as its typical operating status
in a process, besides the low-flow alarm switch example given in the reading.• Explain how we may determine the stimulus applied to each switch in the PLC example shown in the
reading, based on terminal connections and PLC input LED statuses.• Suppose one of the process switches connected to the PLC in the book did not change state (at the
PLC input) when stimulated and un-stimulated. Identify what type of failure (open vs. shorted) wouldcause this to happen, for each of the switches shown.
225

Prep Quiz:Choose the best sentence describing this circuit’s behavior:
L1 L2
• The lamp will remain energized at all times regardless of the temperature
• The lamp will de-energize when the temperature switch is hot
• The lamp will remain de-energized at all times regardless of the temperature
• The lamp will energize when the temperature switch is cold
• The circuit will burst into flame when the temperature switch is cold
226

Prep Quiz:Choose the best sentence describing this circuit’s behavior:
L1 L2
• The lamp will remain energized at all times regardless of the temperature
• The lamp will de-energize when the temperature switch is hot
• The lamp will remain de-energized at all times regardless of the temperature
• The lamp will energize when the temperature switch is hot
• The circuit will create an arc flash when the temperature switch is hot
227

Prep Quiz:Choose the best sentence describing this circuit’s behavior:
L1 L2
• The lamp will remain de-energized at all times regardless of the flow
• The lamp will energize when the fluid flow rate is low
• The lamp will energize when the fluid flow rate is high
• The lamp will remain energized at all times regardless of the flow
• The circuit will create an arc blast when the flow rate is high
228

Question 83
In each of these process control examples, the transmitter produces an increasing signal for an increasein process measurement (level, pressure, temperature, etc.), and the I/P transducer produces an increasingair pressure signal out for an increasing current signal in.
Your task is to determine the proper action for the process controller, either direct-acting or reverse-acting. Remember, a direct-acting controller produces an increasing output signal with an increasing processvariable input. A reverse-acting controller produces a decreasing output signal for an increasing processvariable input. It is essential for stability that the controller have the correct direction of action!
Example 1:
Liquid
PV SP
Out
I/P
Air supply
Air-to-closevalve
Controller
Leveltransmitter
Transducer
H L
LT
229

Example 2:
H L
PV SP
Out
I/P
Air supply
valve
Controller
transmitter
TransducerFlow
Air-to-open
FT
Example 3:
PV SP
Out
I/P
Air supply
valve
Controller
Transducer
Steam in
Steam out
Heat exchanger
Cold fluidin
Warm fluidout
TT
Thermocouple
transmitterTemperature
Air-to-open
230

Example 4:
PV SP
Out
I/P
Air supply
valve
Controller
Transducer
in
transmitter
Steam
Steamout
ST Speed
Steam turbine Generator
Air-to-open
A concept familiar to students of electronics is the differential amplifier, a device built to compare twoinput signals and generate an output signal proportional to that comparison. The most common form ofdifferential amplifier is the so-called operational amplifier or “opamp”, drawn as a triangle with two inputslabeled “+” and “−” to show the relative influence of each input signal on the output. A process controllermay be thought of as a kind of differential amplifier, sensing the difference between two input signals (theprocess variable and the setpoint) and generating an output signal proportional to the difference betweenPV and SP to drive a final control element.
The following process control examples replace the controller symbol with an amplifier symbol. Yourtask is to figure out appropriate labels for the amplifier’s input terminals (e.g. “+” and “−”). Rememberthat a controller is defined as being “direct-acting” if an increase in PV causes an increase in output and“reverse-acting” if an increase in PV causes a decrease in output. Following opamp labeling, this meansthe PV input of a direct-acting controller should bear a “+” mark while the PV input of a reverse-actingcontroller should bear a “−” mark.
−
+Output
PV
SP
Direct-acting controller
−
+
Output
PV
SP
Reverse-acting controller
Output ∝ (PV-SP) Output ∝ (SP-PV)
231
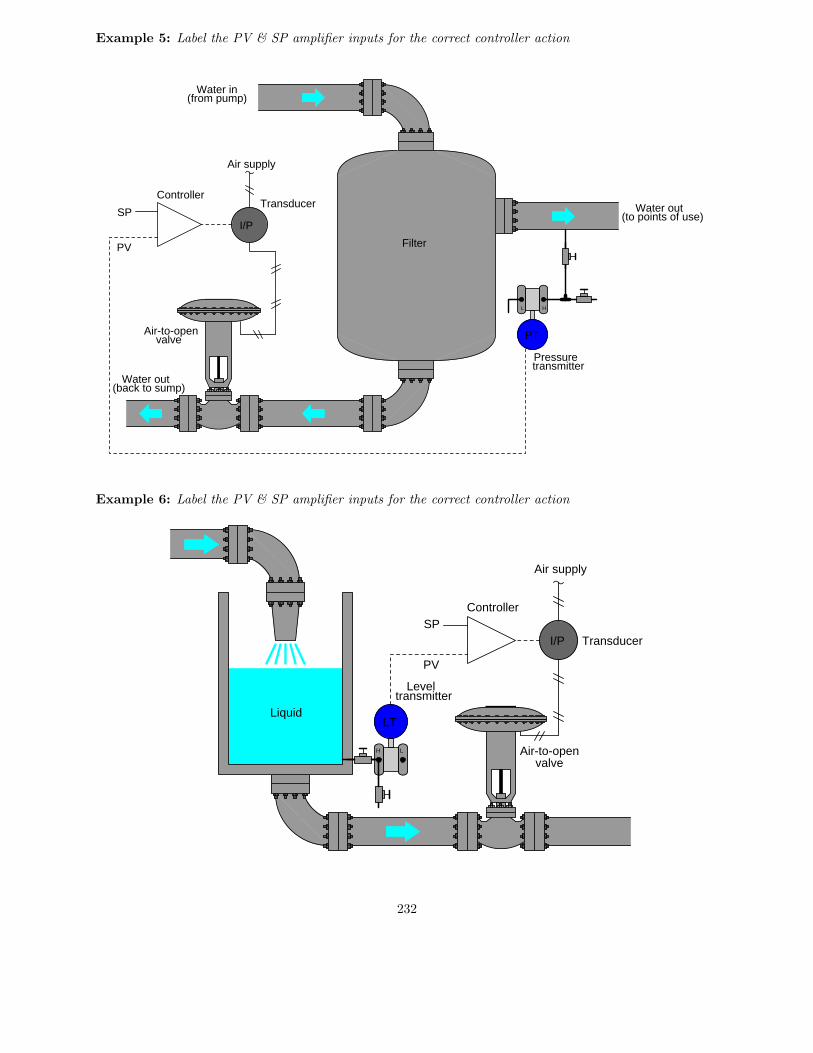
Example 5: Label the PV & SP amplifier inputs for the correct controller action
I/P
Air supply
valve
ControllerTransducer
transmitter
Air-to-open
Water in(from pump)
Water out(to points of use)
Filter
Water out(back to sump)
HL
PT
Pressure
PV
SP
Example 6: Label the PV & SP amplifier inputs for the correct controller action
Liquid
I/P
Air supply
valve
Controller
Leveltransmitter
Transducer
Air-to-openH L
LT
SP
PV
232
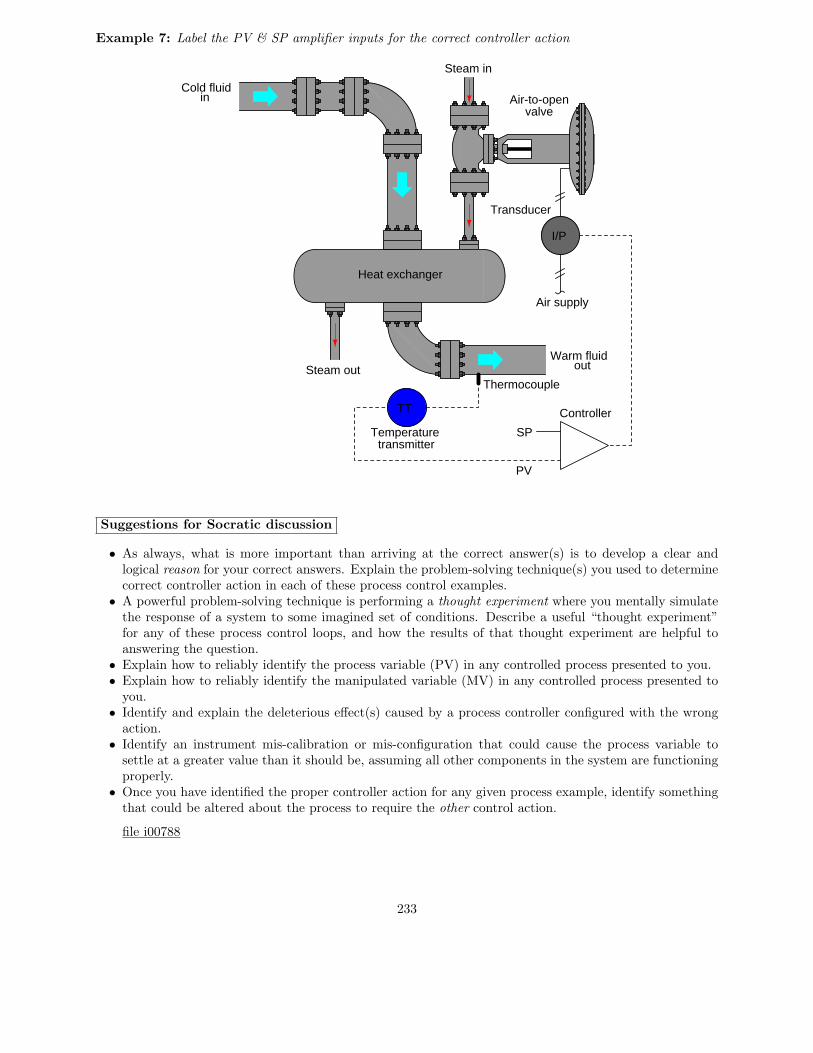
Example 7: Label the PV & SP amplifier inputs for the correct controller action
I/P
Air supply
valve
Controller
Transducer
Steam in
Steam out
Heat exchanger
Cold fluidin
Warm fluidout
TT
Thermocouple
transmitterTemperature
Air-to-open
SP
PV
Suggestions for Socratic discussion
• As always, what is more important than arriving at the correct answer(s) is to develop a clear andlogical reason for your correct answers. Explain the problem-solving technique(s) you used to determinecorrect controller action in each of these process control examples.
• A powerful problem-solving technique is performing a thought experiment where you mentally simulatethe response of a system to some imagined set of conditions. Describe a useful “thought experiment”for any of these process control loops, and how the results of that thought experiment are helpful toanswering the question.
• Explain how to reliably identify the process variable (PV) in any controlled process presented to you.• Explain how to reliably identify the manipulated variable (MV) in any controlled process presented to
you.• Identify and explain the deleterious effect(s) caused by a process controller configured with the wrong
action.• Identify an instrument mis-calibration or mis-configuration that could cause the process variable to
settle at a greater value than it should be, assuming all other components in the system are functioningproperly.
• Once you have identified the proper controller action for any given process example, identify somethingthat could be altered about the process to require the other control action.
file i00788
233

Answer 83
Partial answer:
• Controller #1 needs to be reverse-acting• Controller #3 needs to be direct-acting• Controller #5 needs to be direct-acting (i.e. PV input is “+” and SP input is “−”)• Controller #7 needs to be reverse-acting (i.e. PV input is “−” and SP input is “+”)
Notes 83
• Controller #1 needs to be reverse-acting• Controller #2 needs to be reverse-acting• Controller #3 needs to be direct-acting• Controller #4 needs to be reverse-acting• Controller #5 needs to be direct-acting (i.e. PV input is “+” and SP input is “−”)• Controller #6 needs to be direct-acting (i.e. PV input is “+” and SP input is “−”)• Controller #7 needs to be reverse-acting (i.e. PV input is “−” and SP input is “+”)
A technique I find very helpful in analyzing these types of problems is to draw small “up” and “down”arrows next to each signal line to represent which way the signal will go or ought to go (increase or decrease)for a given process change (usually I assume an increase in process measurement). You may also use thewords “more” and “less” if the arrows become confusing.
A problem-solving technique you can have your students try in class is to perform a “thought experiment”on each scenario, assuming direct controller action. Analyze what the system would do with a direct-actingcontroller and a rising PV signal, then see if the valve action makes sense (i.e. would bring the system backto setpoint) or not. If it makes sense, then we need direct controller action. If it doesn’t make sense, thenwe need reverse controller action.
Virtual Troubleshooting
This question is a good candidate for a “Virtual Troubleshooting” exercise. Presenting the diagram tostudents, you first imagine in your own mind a particular fault in the system. Then, you present one or moresymptoms of that fault (something noticeable by an operator or other user of the system). Students thenpropose various diagnostic tests to perform on this system to identify the nature and location of the fault, asthough they were technicians trying to troubleshoot the problem. Your job is to tell them what the result(s)would be for each of the proposed diagnostic tests, documenting those results where all the students can see.
During and after the exercise, it is good to ask students follow-up questions such as:
• What does the result of the last diagnostic test tell you about the fault?• Suppose the results of the last diagnostic test were different. What then would that result tell you about
the fault?• Is the last diagnostic test the best one we could do?• What would be the ideal order of tests, to diagnose the problem in as few steps as possible?
234

Question 84
A newly commissioned pressure control system has a problem: the controller registers a process fluidpressure of 22 PSI, but two pressure gauges connected to the same vessel both register 35 PSI. A technicianis sent to troubleshoot this problem, and decides to measure current at terminal 2 of TB-52 (located in FieldPanel JB-25). The current signal registers 15.2 milliamps DC:
Field process area
Description Manufacturer Model Notes
Loop Diagram: Revised by: Date:
DCS cabinet
Red
Blk
Red
Blk
Red
Blk
Fisher
Fisher
Tag # Input range Output range
Blue team pressure loop April 1, 2009
Card 4
Card 6Channel 6
Channel 611
12
29
30
Red
Blk
TB-80
TB-80
Field panel JB-25
TB-52
TB-52
PT-6 Pressure transmitter Rosemount 3051CD 0-50 PSI 4-20 mA
PIC6
PT6
Cable 4, Pr 1
Cable 4, Pr 8
1
2
15
16
Cable PT-6
Red
Blk
Red
Blk
Red
Blk
Red
Blk
Red
Blk
Red
Blk
Red
Blk
Red
Blk
Cable PV-6
11
12
11
12PY6
AS 20 PSI
PV6
0-50 PSI
I/P
0-50 PSI
846
Emerson DeltaV 4-20 mA 4-20 mA HART-enabled inputPIC-6
PY-6
PV-6
I/P transducer
Controller
Control valve Vee-ball
4-20 mA 3-15 PSI
3-15 PSI 0-100% Fail-open
Duncan D.V.
Tube PV-6
Cable PT-6
Cable PV-6
Analog input
Analogoutput
Direct-acting control
To receivervessel
BlockBleed
Based on these symptoms and information contained in this loop diagram, answer the followingquestions:
• Where do you think the problem lies, and what sort of problem might it be?• Sketch how the technician’s milliammeter should be connected in order to intercept the loop current at
terminal 2 of TB-52. Include the test lead colors (red, black) in your answer.• Identify what steps the technician (or operator) should have done prior to taking the current
measurement, to ensure nothing bad (e.g. process interruption, alarms) would happen when the circuitwas broken to insert the milliammeter.
• Modify both the transmitter and control valve 4-20 mA loop circuits to include diodes for the purposeof convenient current measurement.
Suggestions for Socratic discussion
• A useful analytical technique for any DC electric circuit is to identify all electrical sources and loads inthe circuit, annotate the diagram with arrowheads showing the directions of all currents, and also with“+” and “−” symbols (and/or curved arrows) showing the polarities of all component voltages. Showhow this helps you analyze the circuit shown in this question.
235

• Identify other diagnostic tests you would perform on this system to further pinpoint the nature andlocation of the fault.
file i02551
Answer 84
Notes 84
15.2 milliamps corresponds to 35 PSI in a 0-50 PSI transmitter range, which tells us the transmitter(PT-6) agrees with the two pressure gauges in saying that the process fluid pressure is 35 PSI. The fault,therefore, lies with the controller’s interpretation of this milliamp signal.
One possibility is that the controller input is mis-configured (e.g. LRV/URV values are set incorrectly).Another possibility is a ground fault (short to ground) in the black wire of cable 4 pair 1 or cable PT-6 atthe controller input, shunting some of the 15.2 mA signal around the controller input so that the controllerdoesn’t see the full signal strength. One way to further diagnose the problem is to take a similar currentmeasurement at terminal 12 of the analog input card.
The technician’s multimeter should be connected as a load: current (conventional flow) entering the redtest lead, and current exiting the black test lead. Since current travels counter-clockwise in the transmitterloop, this means the red test lead will be on the left and the black test lead will be on the right.
The operator should place the controller into manual mode prior to any work being done on thetransmitter circuit. If any PV alarms are configured on the controller, they should be temporarily disabledas well prior to doing the work.
Modified loop diagram containing diodes:
Field process area
Description Manufacturer Model Notes
Loop Diagram: Revised by: Date:
DCS cabinet
Red
Blk
Red
Blk
Red
Blk
Fisher
Fisher
Tag # Input range Output range
Blue team pressure loop April 1, 2009
Card 4
Card 6Channel 6
Channel 611
12
29
30
Red
Blk
TB-80
TB-80
Field panel JB-25
TB-52
TB-52
PT-6 Pressure transmitter Rosemount 3051CD 0-50 PSI 4-20 mA
PIC6
PT6
Cable 4, Pr 1
Cable 4, Pr 8
1
2
15
16
Cable PT-6
Red
Blk
Red
Blk
Red
Blk
Red
Blk
Red
Blk
Red
Blk
Red
Blk
Red
Blk
Cable PV-6
11
12
11
12PY6
AS 20 PSI
PV6
0-50 PSI
I/P
0-50 PSI
846
Emerson DeltaV 4-20 mA 4-20 mA HART-enabled inputPIC-6
PY-6
PV-6
I/P transducer
Controller
Control valve Vee-ball
4-20 mA 3-15 PSI
3-15 PSI 0-100% Fail-open
Duncan D.V.
Tube PV-6
Cable PT-6
Cable PV-6
Analog input
Analogoutput
Direct-acting control
To receivervessel
BlockBleed
236
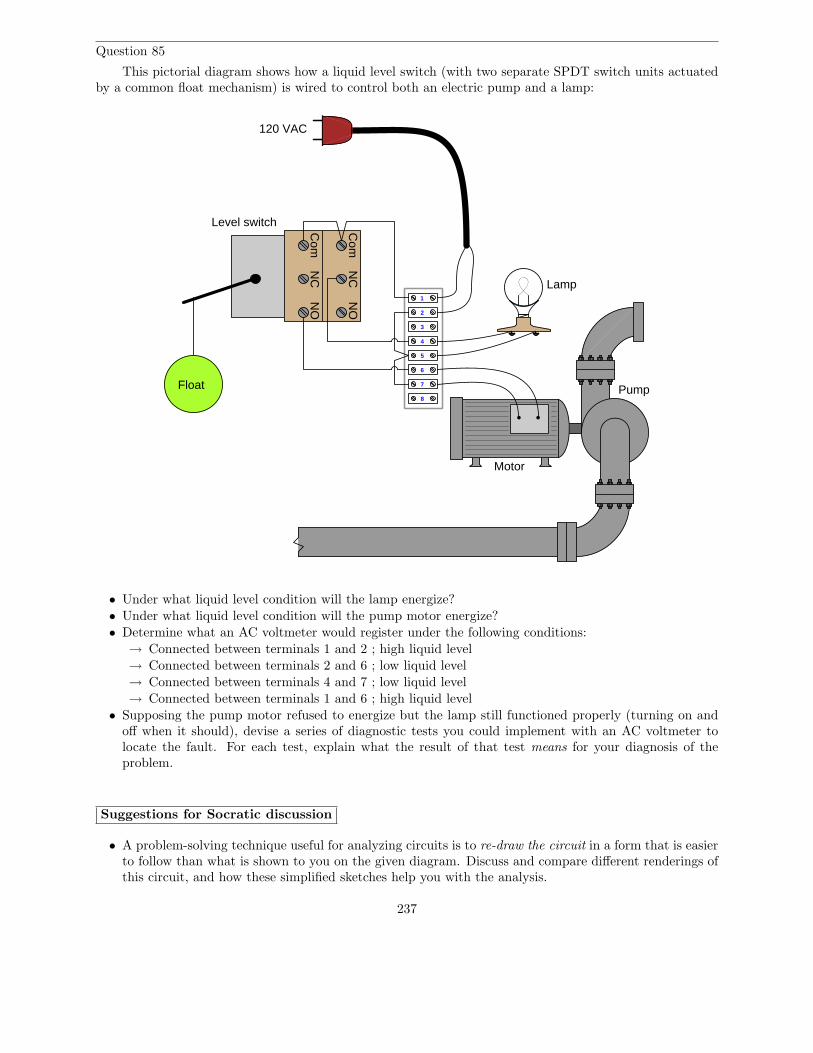
Question 85
This pictorial diagram shows how a liquid level switch (with two separate SPDT switch units actuatedby a common float mechanism) is wired to control both an electric pump and a lamp:
120 VAC
Com
NO
NC
Com
NO
NC
Lamp
Motor
PumpFloat
Level switch
1
2
3
4
5
6
7
8
• Under what liquid level condition will the lamp energize?• Under what liquid level condition will the pump motor energize?• Determine what an AC voltmeter would register under the following conditions:
→ Connected between terminals 1 and 2 ; high liquid level→ Connected between terminals 2 and 6 ; low liquid level→ Connected between terminals 4 and 7 ; low liquid level→ Connected between terminals 1 and 6 ; high liquid level
• Supposing the pump motor refused to energize but the lamp still functioned properly (turning on andoff when it should), devise a series of diagnostic tests you could implement with an AC voltmeter tolocate the fault. For each test, explain what the result of that test means for your diagnosis of theproblem.
Suggestions for Socratic discussion
• A problem-solving technique useful for analyzing circuits is to re-draw the circuit in a form that is easierto follow than what is shown to you on the given diagram. Discuss and compare different renderings ofthis circuit, and how these simplified sketches help you with the analysis.
237

file i02552
Answer 85
Notes 85
The lamp receives power through a NC (normally-closed) switch contact, which means it will be energizedwhen the level switch is in the resting (low level) state.
The pump motor receives power through a NO (normally-open) switch contact, which means it will beenergized when the level switch is in the actuated (high level) state.
• Determine what an AC voltmeter would register under the following conditions:→ Connected between terminals 1 and 2 ; high liquid level – 120 VAC regardless of level→ Connected between terminals 2 and 6 ; low liquid level – 0 VAC→ Connected between terminals 4 and 7 ; low liquid level – 120 VAC→ Connected between terminals 1 and 6 ; high liquid level – 0 VAC
The symptoms tell us the problem must be limited to the pump circuit, and cannot be related toanything common with both the pump and lamp, because the lamp still works as it should. Taking a voltagemeasurement between terminals 6 and 7 while the liquid is at a high level is a good first step: the presenceof 120 VAC between those points would indicate the switch is closing at it should, and that there must be anopen fault between those terminals and the motor (including possibly within the motor itself). The lack ofvoltage between those points during a high liquid level would indicate an open fault between those terminalsthe the source.
Here are some indeterminate tests. For each one, challenge students to explain why the specified testwould not give good diagnostic information:
• Measuring voltage between terminals 1 and 2 (We already know there is supply voltage, since the lampworks)
• Measuring voltage between terminals 6 and 7 while liquid level is low (it is impossible for any faultprohibiting motor function to yield anything but zero volts in a condition of low level, and therefore thistest tells us nothing about the problem)
238

Question 86
Sketch all necessary wires and tubes to form a complete working control loop, using the componentsshown in this diagram:
Honeywell UDC2000 controller
H L
L1
L2
4
5
6
7
8 9
10
11
12
13
14
15
16
120 VACpower 24 VDC power supply
L1
L2120 VACpower
PV input1-5 volt
MV output4-20 mA
Instrumentair supply
I/P transducer
4-20 mA loop-poweredpressure transmitter
Air-to-open control valve
Also, identify each component in the circuit as being either an electrical source or an electrical load, andalso show all directions of electric current in the 4-20 mA circuits using conventional flow notation.
Suggestions for Socratic discussion
• A problem-solving technique useful for making proper connections in pictorial circuit diagrams is tofirst identify the directions of all DC currents entering and exiting component terminals, as well as therespective voltage polarity marks (+,−) for those terminals, based on your knowledge of each componentacting either as an electrical source or an electrical load. Discuss and compare how these arrows andpolarity marks simplify the task of properly connecting wires between components.
file i01175
239

Answer 86
A very common misconception is that a loop-powered transmitter will function when connected to theHoneywell controller as such:
H L
L1
L2
4
5
6
7
8 9
10
11
12
13
14
15
16
PV input1-5 volt
MV output4-20 mA
This is incorrect!
This is an example of how basic DC circuit analysis (identifying sources, loads, and marking voltagepolarities and current directions) is extremely helpful. Terminals 8 and 7 on the controller are marked “1-5volt PV input” which tells us the controller’s input is expecting a DC voltage between 1 and 5 volts, whichthe controller will read as though it were a voltmeter. Thus, the controller (terminals 8 and 7) must beregarded as a load (voltmeter) and not a source of power for the loop-powered transmitter. Since the loop-powered transmitter is also a load, we see immediately that we have a problem: there is no electrical powersource in this circuit!
Somehow, the circuit must include a DC power supply to provide energy to the transmitter so it mayfunction. The circuit must also include some provision for converting the 4-20 mA current signal into a 1-5V voltage signal that the controller can measure through terminals 8 and 7. This means we’ll need a 250 Ωresistor somewhere in the circuit, with the controller connected in parallel with that resistor to measure its1-5 volt drop.
240

Notes 86
Only the 24 VDC power supply and the Honeywell controller output are sources. All other componentsin the 4-20 mA loop circuits are loads:
Honeywell UDC2000 controller
H L
L1
L2
4
5
6
7
8 9
10
11
12
13
14
15
16
120 VACpower 24 VDC power supply
L1
L2120 VACpower
PV input1-5 volt
MV output4-20 mA
Instrumentair supply
I/P transducer
4-20 mA loop-poweredpressure transmitter
Air-to-open control valve
Load
Source
Load
Source
Load
241

Summary Quiz:Sketch the proper wire connections to connect the loop-powered transmitter to the controller PV input:
Honeywell UDC2000 controller
H L
L1
L2
4
5
6
7
8 9
10
11
12
13
14
15
16
120 VACpower
24 VDC power supply
L1
L2 120 VACpowerPV input
1-5 volt
MV output4-20 mA 4-20 mA loop-powered
pressure transmitter
250 Ω
242

Question 87
The grades template spreadsheet provided for you on the Y: network drive allows you to calculateyour grade for any course (by entering exam scores, attendance data, etc.) as well as project to the futurefor courses you have not yet taken. Download the spreadsheet file (if you have not done so yet) and calculatethe grade a student would earn in the INST230 course (Motor Controls) given the following data:
• Lab objectives complete = (all passed)• Lab score = 88%• Mastery exam pass = (passed)• Mastery exam score = 55%• Proportional exam score = 61%• Quizzes failed = 4• # of late arrivals = 3• Hours absent = 5• Sick hours = 0
Also, locate the pages in your course worksheet entitled “Sequence of Second-Year InstrumentationCourses” to identify which courses you will need to register for next quarter.
Suggestions for Socratic discussion
• Why do you suppose this spreadsheet is provided to you, rather than the instructor simply posting yourgrades or notifying you of your progress in the program courses?
• Identify any courses that are elective rather than required for your 2-year AAS degree.
file i04506
Answer 87
You may locate the grades template on the Y: network drive at BTC, provided you log in to thecomputer system using your individual student ID and password (not a generic login such as “btc”). It isalso available for download at the Socratic Instrumentation website.
Notes 87
Have students show you their spreadsheet templates in action, then ask them to modify the entereddata to see the effect each one has on the calculated grade.
243

Question 88
Suppose a voltmeter registers 0 volts between test points F and C in this series-parallel circuit whilethe pressure applied to the pressure switch is 8 PSI:
R1
R2
R3
1 kΩ
1 kΩ
1 kΩ
A
B
C
D
E
F
+−
(0.1 ampscurrent-limited)
12 volts
Setting =11 PSI
Hint: remember that the “normal” status of a switch is defined as the status of minimum stimulus: whenthe switch is exposed to the lowest possible degree of process stimulation (in the case of a pressure-sensingswitch, the condition of minimum stimulus is that of zero pressure applied to the switch).
Identify the likelihood of each specified fault for this circuit. Consider each fault one at a time (i.e. nocoincidental faults), determining whether or not each fault could independently account for all measurementsand symptoms in this circuit.
Fault Possible ImpossibleR1 failed openR2 failed openR3 failed open
Pressure switch contacts failed openR1 failed shortedR2 failed shortedR3 failed shorted
Pressure switch contacts failed shortedVoltage source dead
This question is typical of those in the “Fault Analysis of Simple Circuits” worksheet found in the SocraticInstrumentation practice worksheet collection, except that all answers are provided for those questions. Feelfree to use this practice worksheet to supplement your studies on this very important topic.
Suggestions for Socratic discussion
• Identify which fundamental principles of electric circuits apply to each step of your analysis of thiscircuit. In other words, be prepared to explain the reason(s) “why” for every step of your analysis,rather than merely describing those steps.
file i04491
244

Answer 88
In order to explain the 0 volt reading between points F and C, we must find an open fault that wouldstop power from reaching those points, or a shorted fault that would make those two points electricallycommon:
Fault Possible ImpossibleR1 failed open
√
R2 failed open√
R3 failed open√
Pressure switch contacts failed open√
R1 failed shorted√
R2 failed shorted√
R3 failed shorted√
Pressure switch contacts failed shorted√
Voltage source dead√
Notes 88
245

Question 89
Suppose you were giving instructions to a human operator regarding which way to move a hand-operatedcontrol valve to maintain a process variable at setpoint. In each of these examples, determine which waythe operator should move the valve to counteract an increase in the process variable resulting from someindependent change in the process:
Example 1: Temperature control application
To gasfuel supply
Pot
Valve
Thermometer(TI)
Should the operator move the valvefurther open or further closed?
Temperature is too high
Example 2: Level control application
H L
LT LI
Valve
4-20 mA
Should the operator move the valvefurther open or further closed?
Level is too high
246

Example 3: Flow control application
H L
20 PSIair
Valve
FIFT
Orifice plate
3-15 PSI Flow is too high
Should the operator move the valvefurther open or further closed?
Example 4: Temperature control application
Valve
heated
Heat exchangerSteam in Steam out
TT
TI10-50 mA
each other inside the exchanger; steam flows
Oil to be
Note: the oil and steam never contact each
inside a set of tubes while the oil flows outsidethose same tubes. Heat transfers through thetube walls from the steam to the oil.
Temperature is too high Should the operator move the valvefurther open or further closed?
Suggestions for Socratic discussion
• Follow-up question: in which of these examples is the operator functioning as a direct-action controllerand in which of these examples is the operator functioning as a reverse-action controller?
file i00109
247

Answer 89
• Example 1: increasing temperature, operator should close the valve more• Example 2: increasing level, operator should open the valve more• Example 3: increasing flow, operator should close the valve more• Example 4: increasing temperature, operator should open the valve more
The goal with these questions is to think like an operator, in order to have a clear understanding ofthe process’s needs. Only when one recognizes the required direction of valve operation to correct for anupset (off-setpoint) condition is it possible to properly and confidently configure an automatic controllerto do the same. This is something every instrument professional needs to consider when designing and/orcommissioning a control system: which way does the final control element need to go, in order to stabilizethe process variable if it deviates too high?
In the first example, we would need to move the fuel gas valve further closed (toward the shutoff position)if ever the temperature got too high.
In the second example, we would need to move the drain valve further open to correct for a too-highliquid level in the vessel.
In the third example, we would need to move the flow control valve further closed (toward shutoff) ifever the flow rate measured too high.
In the fourth example, we would need to open the control valve further in order to reduce a too-high oiltemperature exiting the heat exchanger. The rationale for this direction of valve motion is to increase theflow rate of the oil so that each molecule spends less time in the heat exchanger absorbing heat from steamand increasing in temperature.
Notes 89
248

Question 90
A vessel containing a pressurized gas will experience an upward force (F ) exerted on its lid by the gaspressure (P ), equal to the product of gas pressure and lid area (F = PA). The pressure of the gas inside ofany sealed vessel may be predicted by the Ideal Gas Law relating pressure to vessel volume, gas quantity,and gas temperature (PV = nRT ):
Vessel
Lid
F = PA
Force exerted onlid by gas inside
Suppose we wished to have a single formula for calculating force on the lid of a vessel given all theother factors (gas quantity n, lid area A, gas temperature T , vessel volume V , and the gas law constant R).Combine the force-pressure-area formula (F = PA) and the Ideal Gas Law formula (PV = nRT ) in orderto arrive at this new formula solving for F in terms of all the other variables:
F =
file i03035
Answer 90
249

Notes 90
Manipulating the Ideal Gas Law to solve for P :
PV = nRT
P =nRT
V
Substituting this definition for P into the force-pressure-area formula:
F = PA
F =
(
nRT
V
)
A
Simplifying:
F =AnRT
V
250

Question 91
A lift station is an underground reservoir with an automatically-controlled electric pump that collectsand transports sewage from neighborhoods to a centralized wastewater treatment plant (usually locatedmiles away):
Empty
Pump Pump
LSL
LSH LSH
LSL
To WWTP To WWTP
From homes From homes
Pump
To WWTP
From homes
LSH
LSL
Full
ON
The wiring diagram for a simple lift station pump control circuit is shown here:
LSH LSL
M1
M1
OL
motor
OL
To 3-phaseAC power
M1
H1 H2 H3 H4
F1 F2
F3
A B
C
D E
F G
(480 V)
120 VAC
L1
L2
L3
H J
Start
DisconnectContactor
K
L
M
T1
T2
T3
251

An electrician needs to perform some routine “megger” measurements on the electric pump motor.“Megger” is the brand name of a high-voltage ohmmeter used to check the integrity of electrical insulationin electric motors, transformers, and other devices with wire coils subject to faults due to corrosion, vibration,or overheating. Here, the electrician will check resistance between each of the motor’s terminals (T1, T2, T3)and the metal frame of the motor, ensuring there are many millions of ohms (open) as the wire insulationshould provide.
Like all ohmmeter tests, a “megger” check must be performed on a device that is unpowered. For thisreason, and also for personal safety, the electrician must ensure no power will get to the motor during histest.
Before commencing the test, the electrician follows this procedure to ensure the motor is in a zero energystate:
(1) Turn off the disconnect switch(2) Place a padlock and a danger tag on the switch’s handle to ensure it cannot turn on(3) Push the “Start” pushbutton switch to check that the pump does not start up(4) Use an AC voltmeter to verify 0 volts between the following test points:
(a) Voltage between terminals K and L(b) Voltage between terminals K and M(c) Voltage between terminals L and M(d) Voltage between terminals K and earth ground(e) Voltage between terminals L and earth ground(f) Voltage between terminals M and earth ground
(5) Use the same AC voltmeter to verify 480 volts between any two of the L1, L2, and L3 test points
Explain the rationale behind each step in this sequence. Although this many steps may appear to be abit paranoid, there is actually logical justification for each one.
Suppose another electrician looked at this diagram and declared, “We don’t actually have to turn thedisconnect switch off – we can prevent power from getting to the motor’s terminals just by just pulling anyone of the fuses in this circuit! If the M1 coil can’t energize with 120 volts, then the M1 contactor relaycannot close, which effectively locks out 480 volt power from getting to the motor.”
What would be your response to this electrician’s suggestion, and why?
Suggestions for Socratic discussion
• A good logical technique for justifying each step in the lock-out/tag-out sequence is to think of adangerous condition (such as a test equipment fault) that would go undetected if that step were skipped.If you can think of just one possible failure uniquely detected by a step, then that step is justified beyondany doubt!
• What sort of information do you think the electrician should write on the danger tag?• Why do you suppose it is necessary to use high voltage to test the insulation integrity of an electric
motor? Why not just use a regular ohmmeter that only uses a few volts between the test probes?
file i03403
252

Answer 91
Step 1 should ensure zero energy at the motor. Step 2 alerts others not to re-energize the motor. Step 3is a check to see that the correct motor has been locked out. Step 4 checks for voltage at all possible 2-pointcombinations on the power conductors. Step 5 verifies that the voltmeter is properly functioning.
Pulling a fuse on a control circuit forces the motor contactor to be a safety device, which it was neverintended to be. Furthermore, it makes re-energizing the motor as simple as replacing a low-voltage fuse,which is far too easy (and therefore likely) for someone to do.
Notes 91
253

Question 92
In this process, maple syrup is heated as it passes through a steam heat exchanger, then enters anevaporator where the water boils off. The purpose of this is to raise the sugar concentration of the syrup,making it suitable for use as a food topping. A level control system (LT, LIC, and LV) maintains constantsyrup level inside the evaporator, while an analytical control system (AT, AIR, AC, and AV) monitors thesugar concentration of the syrup and adjusts steam flow to the heat exchanger accordingly.
Evaporator
Steamsupply
Condensatereturn to boiler
LT
LIC
LV
Syrup in
Heatexchanger
AC
AT
AIR
AV
Concentrated
FT
Water vapor out
syrup out
Liquid pump
Vapor compressor
Suppose a process operator accidently leaves the manual block valve locked and tagged shut following anoverhaul of the process, so that no steam can enter the heat exchanger. Describe how both control systemswill respond over time to this process condition.
Suggestions for Socratic discussion
• Explain the function of a heat exchanger, describing its construction as well.• Why do you think it is important to monitor and control the level of syrup inside the evaporator?• How realistic do you think it is that a person might accidently leave their lock and tag on a closed valve
following a long period of down-time?
file i02935
Answer 92
254

Notes 92
The analytical controller will drive the steam valve wide open (to no effect, though). The level controllerwill operate normally, maintaining syrup level inside the evaporator at setpoint.
The level control valve may need to open up further than usual, since a greater liquid flow will now exitthe evaporator (no water being driven off the syrup). However, the effluent will be a lot less viscous thanbefore since the water content is greater, and this may very well affect the valve opening (not having to beopen as wide as if the greater flow had the same viscosity as the original flow).
Virtual Troubleshooting
This question is a good candidate for a “Virtual Troubleshooting” exercise. Presenting the diagram tostudents, you first imagine in your own mind a particular fault in the system. Then, you present one or moresymptoms of that fault (something noticeable by an operator or other user of the system). Students thenpropose various diagnostic tests to perform on this system to identify the nature and location of the fault, asthough they were technicians trying to troubleshoot the problem. Your job is to tell them what the result(s)would be for each of the proposed diagnostic tests, documenting those results where all the students can see.
During and after the exercise, it is good to ask students follow-up questions such as:
• What does the result of the last diagnostic test tell you about the fault?• Suppose the results of the last diagnostic test were different. What then would that result tell you about
the fault?• Is the last diagnostic test the best one we could do?• What would be the ideal order of tests, to diagnose the problem in as few steps as possible?
255

Question 93
In this process, maple syrup is heated as it passes through a steam heat exchanger, then enters anevaporator where the water boils off. The purpose of this is to raise the sugar concentration of the syrup,making it suitable for use as a food topping. A level control system (LT, LIC, and LV) maintains constantsyrup level inside the evaporator, while an analytical control system (AT, AIR, AC, and AV) monitors thesugar concentration of the syrup and adjusts steam flow to the heat exchanger accordingly.
Evaporator
Steamsupply
Condensatereturn to boiler
LT
LIC
LV
Syrup in
Heatexchanger
AC
AT
AIR
AV
Concentrated
FT
Water vapor out
syrup out
Liquid pump
Vapor compressor
Suppose the steam tubes inside the heat exchanger become coated with residue from the raw maplesyrup, making it more difficult for heat to transfer from the steam to the syrup. This makes the heatexchanger less efficient, which will undoubtedly affect the process.
Describe in detail the effect this heat exchanger problem will have on the performance of the analyticalcontrol system.
Suggestions for Socratic discussion
• Suppose the operations personnel of this maple syrup processing facility wished to have an automaticmethod for detecting heat exchanger fouling. What variable(s) could be measured in this process toindicate a fouled heat exchanger?
• What economic effect will this fouling have on the process? In other words, does the process becomemore or less profitable as a result of the heat exchanger fouling?
file i02937
256
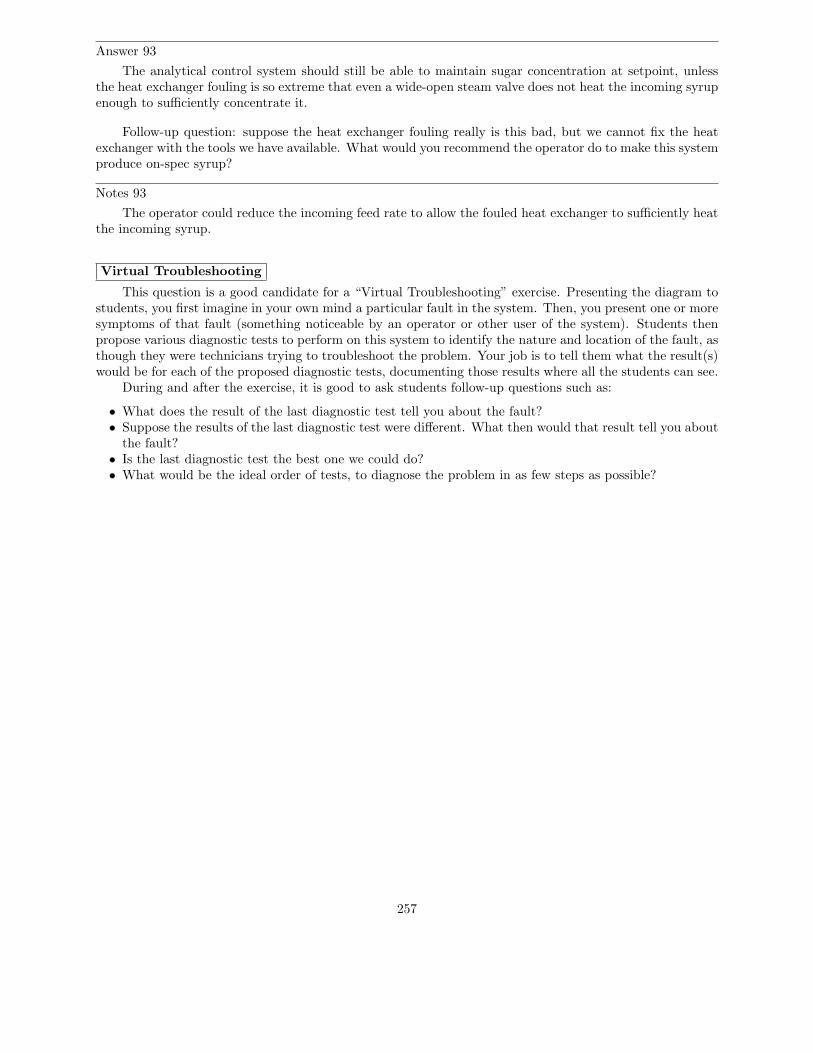
Answer 93
The analytical control system should still be able to maintain sugar concentration at setpoint, unlessthe heat exchanger fouling is so extreme that even a wide-open steam valve does not heat the incoming syrupenough to sufficiently concentrate it.
Follow-up question: suppose the heat exchanger fouling really is this bad, but we cannot fix the heatexchanger with the tools we have available. What would you recommend the operator do to make this systemproduce on-spec syrup?
Notes 93
The operator could reduce the incoming feed rate to allow the fouled heat exchanger to sufficiently heatthe incoming syrup.
Virtual Troubleshooting
This question is a good candidate for a “Virtual Troubleshooting” exercise. Presenting the diagram tostudents, you first imagine in your own mind a particular fault in the system. Then, you present one or moresymptoms of that fault (something noticeable by an operator or other user of the system). Students thenpropose various diagnostic tests to perform on this system to identify the nature and location of the fault, asthough they were technicians trying to troubleshoot the problem. Your job is to tell them what the result(s)would be for each of the proposed diagnostic tests, documenting those results where all the students can see.
During and after the exercise, it is good to ask students follow-up questions such as:
• What does the result of the last diagnostic test tell you about the fault?• Suppose the results of the last diagnostic test were different. What then would that result tell you about
the fault?• Is the last diagnostic test the best one we could do?• What would be the ideal order of tests, to diagnose the problem in as few steps as possible?
257
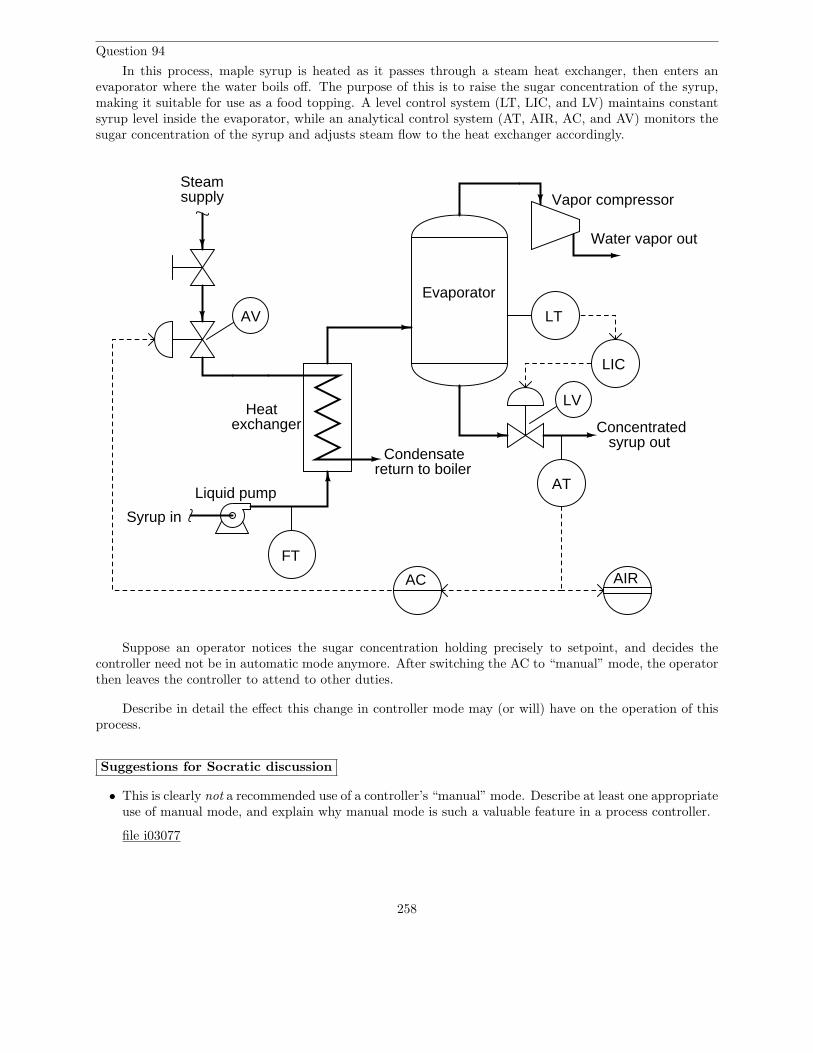
Question 94
In this process, maple syrup is heated as it passes through a steam heat exchanger, then enters anevaporator where the water boils off. The purpose of this is to raise the sugar concentration of the syrup,making it suitable for use as a food topping. A level control system (LT, LIC, and LV) maintains constantsyrup level inside the evaporator, while an analytical control system (AT, AIR, AC, and AV) monitors thesugar concentration of the syrup and adjusts steam flow to the heat exchanger accordingly.
Evaporator
Steamsupply
Condensatereturn to boiler
LT
LIC
LV
Syrup in
Heatexchanger
AC
AT
AIR
AV
Concentrated
FT
Water vapor out
syrup out
Liquid pump
Vapor compressor
Suppose an operator notices the sugar concentration holding precisely to setpoint, and decides thecontroller need not be in automatic mode anymore. After switching the AC to “manual” mode, the operatorthen leaves the controller to attend to other duties.
Describe in detail the effect this change in controller mode may (or will) have on the operation of thisprocess.
Suggestions for Socratic discussion
• This is clearly not a recommended use of a controller’s “manual” mode. Describe at least one appropriateuse of manual mode, and explain why manual mode is such a valuable feature in a process controller.
file i03077
258

Answer 94
Notes 94
The syrup’s sugar concentration will inevitably drift off setpoint as process loads vary.
Virtual Troubleshooting
This question is a good candidate for a “Virtual Troubleshooting” exercise. Presenting the diagram tostudents, you first imagine in your own mind a particular fault in the system. Then, you present one or moresymptoms of that fault (something noticeable by an operator or other user of the system). Students thenpropose various diagnostic tests to perform on this system to identify the nature and location of the fault, asthough they were technicians trying to troubleshoot the problem. Your job is to tell them what the result(s)would be for each of the proposed diagnostic tests, documenting those results where all the students can see.
During and after the exercise, it is good to ask students follow-up questions such as:
• What does the result of the last diagnostic test tell you about the fault?• Suppose the results of the last diagnostic test were different. What then would that result tell you about
the fault?• Is the last diagnostic test the best one we could do?• What would be the ideal order of tests, to diagnose the problem in as few steps as possible?
259

Summary Quiz
Evaporator
Steamsupply
Condensatereturn to boiler
LT
LIC
LV
Syrup in
Heatexchanger
AC
AT
AIR
AV
Concentrated
FT
Water vapor out
syrup out
Liquid pump
Vapor compressor
Suppose the steam tubes inside the heat exchanger gradually become coated (“fouled”) with residuefrom the raw maple syrup over time, making it more difficult (but not impossible) for adequate heat energyto transfer from the steam to the syrup. Identify how this change will affect the process:
• The steam flow to the heat exchanger will be less than it was before the fouling
• The steam valve (AV) will open up more than it was before the fouling
• The level valve (LV) will pinch off (close) more than it was before the fouling
• The syrup entering the evaporator will be warmer than it was before the fouling
• The syrup will exit the evaporator more concentrated than it was before the fouling
• The level valve (LV) will open up more than it was before the fouling
• The syrup will exit the evaporator less concentrated than it was before the fouling
260

Question 95
In this process, maple syrup is heated as it passes through a steam heat exchanger, then enters anevaporator where the water boils off. The purpose of this is to raise the sugar concentration of the syrup,making it suitable for use as a food topping. A level control system (LT, LIR, LIC, and LV) maintainsconstant syrup level inside the evaporator, while an analytical control system (AT, AIR, AIC, and AV)monitors the sugar concentration of the syrup and adjusts steam flow to the heat exchanger accordingly.
PV = 34%SP = 34%
LIR
Out = 22%
PV = 52%SP = 50%
Out = 86%
85% open
24% open
PV = 34%
PV = 52%
at 66% concentration
50% level in evaporator
LG
Level gauge shows
Laboratory tests syrup
Evaporator
Steamsupply
Condensatereturn to boiler
LT
LIC
LV
Syrup in
Heatexchanger
AT
AIR
AV
Concentrated
FT
Water vapor out
syrup out
Liquid pump
Vapor compressor
AIC
Examine the live variable values shown in the above diagram, and then determine where any problemsmay exist in this syrup concentrating system.
Suggestions for Socratic discussion
• A valuable principle to apply in a diagnostic scenario such as this is correspondence: identifying whichvariables correspond at different points within the system, and which do not. Apply this comparativetest to the variables scenario shown in the diagram, and use the results to defend your answer of wherethe problem is located and what type of problem it is.
file i02934
261

Answer 95
The one glaring discrepancy we see here is between the laboratory’s measurement of syrup concentrationand what the AIC and AIR indicate. Given that both the AIC and AIR agree with each other on PV value,we may conclude that the signal to both of these instruments corresponds to a 34% measurement. Theproblem is either the transmitter (AT) mis-measuring the syrup concentration, or else it is sensing theconcentration okay but outputting the wrong 4-20 mA signal nonetheless, or else the laboratory made ameasurement error of their own and incorrectly reported a syrup concentration that is too high.
We also see some minor discrepancies between controller output indications and actual valve stempositions, but these are small enough to ignore. Likewise, the discrepancy between the level gauge (LG)indication and the level controller/recorder indications is small enough that it does not pose a serious problem.
Notes 95
Suggestions for Socratic discussion
• Explain why the AIR cannot be at fault in this scenario.• Explain why the AIC cannot be at fault in this scenario.• Explain why the steam supply cannot be at fault in this scenario.
262

Question 96
Examine the following loop diagram:
+
-
250Ω
+
L1
L2
G
ES 120VAC60 Hz
Fieldpanel
Field process area
Tag number Description Manufacturer Model Calibration Notes
Loop Diagram: Revised by: Date:
8
9
TB64 TB27
15
16
250 Ω resistor n/a +/- 0.1 %
1-5 VDC
Control room
4-20 mA
April 1, 2005Reynolds Navier-Stokes
+24
P5 Fieldpanel
FIR
FY
#2 unit feed flow
FT14
14
14
CBL 9
CBL 41
P30
CBL 223
4
FT-14 Vortex flow transmitter Yokogawa
FY-14
FIR-14 Bristol-BabcockPaper chart recorder
0-250 GPM
TB40
Wht
Blk Blk
Wht
Blk
Wht
Blk
Wht
Blk
Wht
Blk
Wht
Blk
Wht
BlkWht
Grn
Trace the path of current in the signal wiring, then determine the following voltage drops at the respectiveflow rates. Assume a power supply voltage of exactly 24 volts DC:
• Voltage across FY-14 resistor = ; Flow rate = 100 GPM• Voltage between terminals TB40-3 and TB40-4 = ; Flow rate = 200 GPM• Voltage across FT-14 transmitter terminals = ; Flow rate = 175 GPM• Voltage between terminals TB64-8 and TB27-15 = ; Flow rate = 200 GPM
file i00136
263

Answer 96
+
-
250Ω
+
L1
L2
G
ES 120VAC60 Hz
Fieldpanel
Field process area
Tag number Description Manufacturer Model Calibration Notes
Loop Diagram: Revised by: Date:
8
9
TB64 TB27
15
16
250 Ω resistor n/a +/- 0.1 %
1-5 VDC
Control room
4-20 mA
April 1, 2005Reynolds Navier-Stokes
+24
P5 Fieldpanel
FIR
FY
#2 unit feed flow
FT14
14
14
CBL 9 CBL 41
P30
CBL 223
4
FT-14 Vortex flow transmitter Yokogawa
FY-14
FIR-14 Bristol-BabcockPaper chart recorder
0-250 GPM
TB40
All arrows point in the direction of electron flow!
Partial answer:
• Voltage across FY-14 resistor = 2.6 volts ; Flow rate = 100 GPM• Voltage between terminals TB40-3 and TB40-4 = 19.8 volts ; Flow rate = 200 GPM• Voltage across FT-14 transmitter terminals = ; Flow rate = 175 GPM• Voltage between terminals TB64-8 and TB27-15 = ; Flow rate = 200 GPM
264

Notes 96
• Voltage across FY-14 resistor = 2.6 volts ; Flow rate = 100 GPM• Voltage between terminals TB40-3 and TB40-4 = 19.8 volts ; Flow rate = 200 GPM• Voltage across FT-14 transmitter terminals = 20.2 volts ; Flow rate = 175 GPM• Voltage between terminals TB64-8 and TB27-15 = 0 volts ; Flow rate = 200 GPM
Virtual Troubleshooting
This question is a good candidate for a “Virtual Troubleshooting” exercise. Presenting the diagram tostudents, you first imagine in your own mind a particular fault in the system. Then, you present one or moresymptoms of that fault (something noticeable by an operator or other user of the system). Students thenpropose various diagnostic tests to perform on this system to identify the nature and location of the fault, asthough they were technicians trying to troubleshoot the problem. Your job is to tell them what the result(s)would be for each of the proposed diagnostic tests, documenting those results where all the students can see.
During and after the exercise, it is good to ask students follow-up questions such as:
• What does the result of the last diagnostic test tell you about the fault?• Suppose the results of the last diagnostic test were different. What then would that result tell you about
the fault?• Is the last diagnostic test the best one we could do?• What would be the ideal order of tests, to diagnose the problem in as few steps as possible?
265

Question 97
Calculate the voltage drops in this loop-powered 4-20 mA transmitter circuit for the current conditionsshown in the table:
H L
+− 24 VDC
A
B
C
D
E
F
G
250 Ω
50 ΩLoop-powered4-20 mA
transmitter
Percent of range Transmitter current VCD VEF VFG VAB
0 % 4 mA25 % 8 mA50 % 12 mA75 % 16 mA100 % 20 mA
In order for a loop-powered transmitter such as this to function adequately, there must be a minimumDC voltage between its terminals (VAB) at all times. A typical value for this voltage is 12 volts (be awarethat this minimum voltage level varies considerably between different manufacturers and models!). Identifywhat loop condition(s) may jeopardize this minimum supply voltage value, and how you as a technicianwould ensure the transmitter always received enough voltage to function.
Suggestions for Socratic discussion
• If a technician happened to be measuring transmitter terminal voltage while the pressure applied to the“H” port of the transmitter suddenly increased, would the measured voltage increase or decrease?
• This circuit shows two resistors, rather than just one. Identify a practical reason why a 4-20 mA loopcircuit might have multiple resistances in it.
• Demonstrate how to estimate numerical answers for this problem without using a calculator.
file i00129
266

Answer 97
Percent of range Transmitter current VCD VEF VFG VAB
0 % 4 mA 24 V 1 V 0.2 V 22.8 V25 % 8 mA 24 V 2 V 0.4 V 21.6 V50 % 12 mA 24 V 3 V 0.6 V 20.4 V75 % 16 mA 24 V 4 V 0.8 V 19.2 V100 % 20 mA 24 V 5 V 1 V 18 V
The Rosemount 3144 temperature transmitter, for example, requires a minimum of 12 volts at itsterminals to function in the analog mode, and 18.1 volts in order to properly function while communicatingusing the HART digital-over-analog protocol. Note how the operation of such a 3144 transmitter in a loopwith a 24 volt power supply and 300 ohms worth of resistance would be jeopardized near the upper end ofthe signal range.
Notes 97
267

Question 98
In this system a loop controller receives a process variable signal from a 2-wire (loop-powered)transmitter, and sends its own 4-20 mA control signal to operate a control valve. A data acquisition unit(DAQ) performs the auxiliary function of monitoring the process variable signal (voltage dropped across theloop resistor) and reporting it over a digital network where it is recorded on the hard drive of a personalcomputer. If it helps, you may think of a DAQ as being nothing more than a multi-channel voltmeter,sensing voltage between each of its input terminals (In 1, In 2) and its “common” (Com) terminal:
4-20 mA loop-powered transmitter Process controller
Output
ADC
ADC
+ −
4-20 mA I/P converter
Control valveADC
ADC
Com
In_0
In_1
ADC
In_2
DAQ analog input unit
+24 VDC
X
YGnd
Gnd4-20mA
Out
250 Ω
Unfortunately, the DAQ not only registers the DC signal value, but also any HART pulses presentin the transmitter circuit whenever a technician connects a HART communicator to the transmitter to doany maintenance work. The operators are annoyed by the misleading “noise” on the DAQ-recorded signalwhenever a technician does routine work on that transmitter, and so they come to you asking for a solution.
Devise a simple modification to this circuit that will eliminiate (or at least minimize) the “HART noise”seen by the DAQ without impeding its ability to record normal process variable signal values.
Suggestions for Socratic discussion
268

• A useful problem-solving technique is to sketch a simple diagram of the system you are asked to analyze.This is useful even when you already have some graphical representation of the problem given to you, asa simple sketch often reduces the complexity of the problem so that you can solve it more easily. Drawyour own sketch showing how the given information in this problem inter-relates, and use this sketch toexplain your solution.
• A useful analytical technique for any DC electric circuit is to identify all electrical sources and loads inthe circuit, annotate the diagram with arrowheads showing the directions of all currents, and also with“+” and “−” symbols (and/or curved arrows) showing the polarities of all component voltages. Showhow this helps you analyze the circuit shown in this question.
file i02557
269

Answer 98
A simple resistor-capacitor low-pass filter connected between the resistor and the DAQ channel willsuffice:
4-20 mA loop-powered transmitter Process controller
Output
ADC
ADC
+ −
4-20 mA I/P converter
Control valveADC
ADC
Com
In_0
In_1
ADC
In_2
DAQ analog input unit
+24 VDC
X
YGnd
Gnd4-20mA
Out
RC low-passfilter circuit
R
C
250 Ω
The values of R and C should be chosen to create a cutoff frequency lower than the lowest frequencyexpected with HART (1200 Hz), but not so low that relevant changes in the process variable would beexcessively damped.
Beware of any solutions that would shunt HART signals around the 250 ohm loop resistance, such as acapacitor connected in parallel with DAQ input! This would solve the HART interference problem, but atthe cost of impeding all HART communication!
Notes 98
270

Question 99
In this system a variable-frequency drive (VFD) sends AC electrical power to an induction motor tocontrol the speed of that motor. The VFD receives its “command” signal in the form of a 4-20 mA DCcurrent sent from a programmable logic controller (PLC) with an analog output card, 4 mA representing a“zero-speed” signal (no power sent to the motor) and 20 mA representing a “full speed” signal (60 Hz powersent to the motor):
Powersupply
L1
Gnd
L2/N
Processor
Analog
Output
I OUT 0
I OUT 1
I OUT 2
I OUT 3ANL COM
ANL COM
ANL COM
ANL COM
+24 VDC
DC COM
VFDpower cable
power cable
Motor
Pumpsignal cable
4-20 mA
Circuitbreaker
From480 VAC
power source
Touch-screen panel
data cable
(HMI)
Pump start
Pump stop
ProgrammableLogic Controller
(PLC)
Unfortunately, though, there is something wrong with this system. The pump does not run, regardlessof what the operator commands using the touch-screen panel. When you examine the VFD faceplate, yousee a few LED indicators lit, but nothing either confirming or denying that power is reaching the motor.
Supposing the only test equipment available to you is a digital multimeter (DMM), what diagnostictests could you perform to identify the location and nature of the system fault?
Suggestions for Socratic discussion
• Why might one opt to use a VFD to control a pump’s speed, rather than just use a throttling valve tocontrol how much fluid is discharged from a constant-speed pump?
file i02554
Answer 99
Notes 99
The fact that there are lit LEDs on the VFD faceplate tells us the VFD has AC power supplied to it. Agood diagnostic test would be to use the multimeter to measure the 4-20 mA command signal at the VFD’sterminals, to check and see if the VFD is being commanded to run the motor. If not, then the problemis either in the 4-20 mA cable or somewhere in the PLC system. If there is a non-stopped 4-20 mA signalpresent at the VFD terminals, then the problem may lie either with the VFD, the motor, or the power cablesbetween the VFD and motor.
271

Question 100
Answer 100
Notes 100
272

Question 101
Read “The Lecture System In Teaching Science” by Robert T. Morrison, an article from the JournalUndergraduate Education In Chemistry and Physics, October 18-19, 1985, pages 50 through 58. This articleis available in electronic form from the BTC campus library, as well as on the Internet (easily found byperforming a search). In it, Morrison outlines a teaching method referred to as the “Gutenberg Method.”
How is the Gutenberg Method as described by Morrison similar to the classroom structure in theseInstrumentation courses?
Identify in your own words at least two advantages the Gutenberg Method enjoys over standard lectures.
Explain how a person educated in this way might be better prepared for continuing education in theworkplace, compared to those who learned by lecture while in school.
file i00008
273

Answer 101
This is a graded question – no answers or hints given!
Notes 101
274

Question 102
Examine the state of this fluid-heating system:
PV SP
Out
I/P
Air supply
valve
Controller
Transducer
Steam in
Steam out
Heat exchanger
Cold fluidin
Warm fluidout
TT
Thermocouple
transmitterTemperature
Air-to-open
PV = 167 oFSP = 250 oFOut = 7%
Temp = 160 oF
Position = 90% open
(3 PSI = shut)(15 PSI = full open)
The temperature of the exiting fluid is well below setpoint, so we know there is a problem somewherein this system.
Determine the diagnostic value of each of the following tests. Assume only one fault in the system,including any single component or any single wire/cable/tube connecting components together. If a proposedtest could provide new information to help you identify the location and/or nature of the one fault, mark“yes.” Otherwise, if a proposed test would not reveal anything relevant to identifying the fault (alreadydiscernible from the measurements and symptoms given so far), mark “no.”
Diagnostic test Yes NoMeasure millivolt signal output by thermocouple
Measure 4-20 mA signal output by TTMeasure 4-20 mA signal output by controller
Measure instrument air supply pressure to I/PMeasure 3-15 PSI signal output by I/P
Measure temperature of incoming steam and compare with normal
Also, explain the rationale of assuming only one fault when initially diagnosing a system problem. Whynot keep an open mind to include multiple faults when first assessing possibilities? Does the prior history ofthe system matter (i.e. is it relevant whether or not it functioned properly in the past)?
file i00010
275

Answer 102
This is a graded question – no answers or hints given!
Notes 102
Comparing the controller output signal (7%) with the actual valve position (90%), we see a largediscrepancy. Therefore, our problem resides somewhere within the output half of this control system (betweenthe controller and valve, inclusive). The fact that the fault lies in the output half of this control systemallows us to disregard any test limited to the input (measurement) side.
Either the valve is stuck open, or something is awry with the controller or I/P to output too muchpneumatic pressure to the valve. Any test that can help diagnose if the controller might be outputting thewrong milliamp signal, or if the I/P might be outputting the wrong PSI signal, is a valid test.
Diagnostic test Yes NoMeasure millivolt signal output by thermocouple
√
Measure 4-20 mA signal output by TT√
Measure 4-20 mA signal output by controller√
Measure instrument air supply pressure to I/P ?Measure 3-15 PSI signal output by I/P
√
Measure temperature of incoming steam and compare with normal√
The test of measuring supply air pressure is marked with a “?” symbol instead of a check because it isfar less likely to reveal the problem. An excessive supply pressure may damage the I/P in such a way thatit outputs more air pressure than it should, but without knowing more about the I/P’s internal design it isdifficult to say whether or not this possibility is likely enough to warrant serious consideration.
The probability of multiple independent (coincidental) faults is far less likely than that of a single faultfor any system that has functioned properly in the past. The reason for this is grounded in the laws ofprobability: if we take faults to be random and infrequent events, then it is more likely that a single randomevent occurred than multiple (unrelated) random faults occurred. This is why we generally assume just onefault when troubleshooting a system. Only when the single-fault hypothesis is exhausted should you considermultiple faults.
An interesting caveat applies when the system in question has never functioned properly, such as the caseof a brand-new system. Given that sort of system’s history, it is entirely possible that multiple independentfaults exist because. This is why it is important for technicians to get into the habit of inquiring the historyof a system before they begin troubleshooting.
276

Question 103
Suppose a technician wishes to use a loop calibrator to simulate a 4-20 mA signal to a controller, anddecides to connect the loop calibrator to the circuit like this:
mA
mAREAD VDC
OFF% 4 to 20 mA
LOOP CALIBRATOR
SOURCE
2-WIRE
READ
100%20 mA
0%4 mA
ADJUST
TRANSMITTERSIMULATOR
POWER 2-WIRETRANSMITTERS
H L
+−250 Ω
Explain why this is an improper use of the loop calibrator, and what will happen if the technician triesto simulate a 9 mA signal this way. Finally, identify the proper way to use the loop calibrator to simulate atransmitter signal.
file i00011
277

Answer 103
This is a graded question – no answers or hints given!
Notes 103
The problem here is that the transmitter is still in the circuit, passing its own current. The 9 mA passedby the loop calibrator in “simulate” mode will become added to the transmitter’s current to form a largertotal current seen at the 250 ohm resistor.
The proper way to use the loop calibrator is like this:
mA
mAREAD VDC
OFF% 4 to 20 mA
LOOP CALIBRATOR
SOURCE
2-WIRE
READ
100%20 mA
0%4 mA
ADJUST
TRANSMITTERSIMULATOR
POWER 2-WIRETRANSMITTERS
H L
+−250 Ω
Disconnect transmitter from circuit!
278

Question 104
An electronic pressure transmitter has a calibrated range of 100 to 300 PSI, and its output signal rangeis 4 to 20 mA. Complete the following calibration table for a calibration tolerance of ± 0.5% (of span), andbe sure to show the equations used to calculate all the parameters given the percentage of span (x):
Input pressure Percent of span Output signal Output signal Output signalapplied (PSI) (%) ideal (mA) min. (mA) max. (mA)
01025507590100
Equations used:
Input pressure =
Output signal (ideal) =
Output signal (min.) =
Output signal (max.) =
file i00013
279

Answer 104
This is a graded question – no answers or hints given!
Notes 104
A calibration tolerance refers to the degree to which an instrument’s response is allowed to deviate fromideal. In this case we are told the tolerance shall be 0.5% of span, which means 0.5% of 16 milliamps:
0.5% × 16 mA = 0.08 mA
Therefore, the allowable deviance from ideal output current values shall be ± 0.08 mA:
Calculating applied pressure and output current values from given percentages is easy: in either case,simply multiply the given percentage by the span of that range, then add the LRV (or “live zero” value) ofthat range. For example, at 10% we would expect to see a pressure of 120 PSI because 10% of a 200 PSIspan is 20 PSI, which when added to the LRV of 100 PSI yields a result of 120 PSI. Similarly, at 10% wewould expect to see an (ideal) output current of 5.6 mA because 10% of a 16 mA span is 1.6 mA, whichwhen added to the LRV of 4 mA gives us 5.6 mA.
Input pressure Percent of span Output signal Output signal Output signalapplied (PSI) (%) ideal (mA) min. (mA) max. (mA)
100 0 4 3.92 4.08120 10 5.6 5.52 5.68150 25 8 7.92 8.08200 50 12 11.92 12.08250 75 16 15.92 16.08280 90 18.4 18.32 18.48300 100 20 19.92 20.08
280

Question 105
Sketch the necessary wires between instruments in this pictorial diagram so that the controller willreceive a pressure measurement signal (4-20 mADC) from the loop-powered transmitter into its processvariable (PV) input terminals, and the control valve will be actuated by the controller’s 4-20 mA outputsignal coming from the manipulated variable (MV) terminals. Be sure to include any necessary 120 VACpower sources and wires!
Honeywell UDC2000 controller
H L
4-20 mA loop-poweredprocess transmitter
L1
L2
4
5
6
7
8 9
10
11
12
13
14
15
16
24 VDC power supply
L1
L2
Air tube
250 Ωresistor
20 PSI air supply
I/Ptransducer
Sliding-stem control valve
PV input1-5 volt
MV output4-20 mA
This question is typical of those in the “Pictorial Circuit Diagrams” worksheet found in the SocraticInstrumentation practice worksheet collection, except that all answers are provided for those questions. Feelfree to use this practice worksheet to supplement your studies on this very important topic.
file i00009
281

Answer 105
This is a graded question – no answers or hints given!
282

Notes 105
A very helpful strategy when sketching DC circuit wire connections is to identify all sources and allloads, then identify their proper directions of current into and out of all terminals. Knowing which waycurrent must flow through each component is critically important for polarity sensitive devices.
Furthermore, all current-carrying components in a 4-20 mA instrumentation circuit must be connectedin series with each other because it is only in a series circuit that current is guaranteed to be the samethroughout. This allows the transmitter to establish a current value representative of the measured processvariable, and that same exact amount of current will be reported to every other device in the series loop.
Honeywell UDC2000 controller
H L
4-20 mA loop-poweredprocess transmitter
L1
L2
4
5
6
7
8 9
10
11
12
13
14
15
16
120 VACpower
24 VDC power supply
L1
L2 120 VACpower
Air tube
Wires
250 Ωresistor
20 PSI air supply
I/Ptransducer
Sliding-stem control valve
PV input1-5 volt
MV output4-20 mA
283

Question 106
In preparation to disconnect and remove a variable-frequency AC motor drive (VFD) for replacementwith an upgraded model, an electrician shuts off the circuit breaker feeding the VFD, then places a lock andan informational tag on that breaker so that no one turns it back on before he is done with the job.
The next step is to confirm the absence of dangerous voltage on the motor conductors before physicallytouching any of them. This confirmation, of course, is done with a voltmeter, and we all know that voltageis measured between two points. The question now is, how many different combinations of points must theelectrician measure between using his voltmeter to ensure there is no hazardous voltage present?
L1 L2 L3
T1 T2 T3
VFD
Motor
To circuit breaker
List all possible pairs of points the electrician must check for voltage between. Don’t forget to includeearth ground as one of those points, in addition to the screw terminals shown!
Next, write a mathematical formula to calculate the number of point-pair combinations (i.e. the numberof different voltage measurements that must be taken) given N number of connection points in the circuit.
file i04260
284

Answer 106
This is a graded question – no answers or hints given!
285

Notes 106
Recall that voltage is always measured between two points. This means we must find every two-pointcombination for our meter to test. Thus, the electrician should check between these point pairs at the VFD’spower input terminals (six voltage measurements in total):
• L1 to L2• L1 to L3• L2 to L3• L1 to ground• L2 to ground• L3 to ground
Of course, to be perfectly safe the electrician should also perform the same tests on the VFD’s poweroutput terminals too, to make sure the entire system is de-energized. Although the lack of power at theVFD’s input should guarantee no power at the output terminals, a little bit of paranoia is not a bad thingwhen electrical safety is the subject of the day:
• T1 to T2• T1 to T3• T2 to T3• T1 to ground• T2 to ground• T3 to ground
A general formula for calculating the number of voltage measurements to take between N number ofpoints:
1
2(N2 − N)
To be extra-cautious, one should test for both AC voltage and DC voltage, doubling the number ofvoltage tests! Also, checking the voltmeter for proper operation by testing a known source of voltage bothbefore and after your cable tests, is a very good idea.
A good way to approach the problem of deriving a formula is to simplify the problem so that thereare fewer points to test between, then gradually increase the number of test points to see how this increaseaffects the number of necessary tests. After a few trials of doing this with different numbers of test points,you should begin to see a mathematical pattern leading you to a formula.
The following table shows the relationship between number of test points (N) and the number of requiredvoltmeter measurements to cover all possible combinations of two points:
Test points (N) Number of measurements required2 13 34 65 106 157 218 289 3610 45
With each increment of N , we see the number of tests growing by a larger degree. If you look closelyat this sequence, it should be apparent that the number of required measurements grows by N − 1 with
286

each increase in N . Note how with 5 points we require 10 measurements, but with 6 points we require 15measurements: 5 more than before. With 7 points we require 21 measurements: 6 more than before.
Another pattern which should be apparent by looking at this table is how the number of requiredmeasurements are all common multiples of integers: 3 is 3 × 1; 6 is 3 × 2; 10 is 5 × 2; 15 is 5 × 3. This cluesuggests we might be able to calculate the number of required tests by forming a product (multiplication)of numbers based on the value of N .
Let’s take the pair of 6, 15 for example: 6 test points requiring 15 measurements. Is there any way toget 15 out of the number 6 by using multiplication? We know that 15 is 5 × 3, and that 5 is one less than6, while 3 is half of 6. We may then check to see if other rows in this table seem to follow this same pattern.7 test points require 21 measurements: one less than 7 is 6, while half of 7 is 3.5, and the product of these(6 × 3.5) does indeed equal 21. In fact, we may try this with any entry in the table and get the same result:take one away from N , then multiply by one-half of N , to get the number of required voltage measurements.
Codifying this in a formula:
(N − 1)N
2
This of course may also be expressed as 1
2(N2 − N).
287

Question 107
Calculate the amount of voltage between points A and B in this circuit. You must sketch polarity marks(+ , −) on the schematic diagram to show the polarity of VAB , as well as show all of your mathematicalwork!
1k
A
B
20
4k7 250
1k5
690
As you solve this problem, be sure to store all intermediate calculations (i.e. answers given to you byyour calculator which you will use later in the problem) in your calculator’s memory locations, so as to avoidre-entering those values by hand. Re-entering calculated values unnecessarily introduces rounding errorsinto your work, as well as invites keystroke errors. Avoiding the unnecessary introduction of error is a veryimportant concept in Instrumentation!
If your final answers are rounded as a result of not doing this, you will only receive half-credit for yourwork. This is a general policy for all your mathematical work in this program, not just this particularproblem!
Note: the task of analyzing any series-parallel resistor network is greatly simplified by an approachoutlined in the online textbook Lessons In Electric Circuits, in the “Series-Parallel Combination Circuits”chapter. There, a technique is demonstrated by which one may reduce a complex series-parallel networkstep-by-step into a single equivalent resistance. After this reduction, Ohm’s Law and Kirchhoff’s Laws ofvoltage and current are applied while “expanding” the circuit back into its original form. Even though thecurrent notation in this textbook is electron flow rather than conventional flow, the series-parallel analysistechnique works all the same.
file i02528
288

Answer 107
This is a graded question – no answers or hints given!
Notes 107
A very helpful technique for analyzing any series-parallel network is to re-drawn the network with allcomponents in the same orientation (in this case, vertical):
1k
A
B
20
4k7
250
1k5
690
Equivalent schematic
Here, the series-parallel relationships become very clear. The voltage drop we seek to calculate (VAB)will be the sum of the 690 ohm resistor’s voltage and the 250 ohm resistor’s voltage.
VAB = 6.148 volts, A negative and B positive.
289

Question 108
This liquid level sensor circuit uses a plastic-coated metal rod as one “plate” of a capacitor, and themetal vessel as the other “plate” of the capacitor:
Liquid
Probe
Metal vessel
(conductive)
Dielectricsheath
High-frequencyAC voltage source
R
(plastic)
A
Sketch an equivalent circuit showing the level sensing probe as an ideal circuit element, and thendetermine the following if the liquid level in the vessel happens to increase:
• Probe capacitance: (increase, decrease, or remain the same)
• Capacitive reactance: (increase, decrease, or remain the same)
• AC voltage between point A and ground: (increase, decrease, or remain the same)
file i02918
290

Answer 108
This is a graded question – no answers or hints given!
Notes 108
R
Clevel
A
As liquid level increases, the distance between the two capacitor “plates” (the tank wall and the metalrod) is effectively decreased, the conductive liquid acting as a physical extension of the tank wall right up tothe surface of the plastic sheath. This means an increased level increases capacitance and therefore decreasescapacitive reactance. This change will increase current in the AC circuit and decrease the amount of voltagedropped across the capacitive probe.
• Probe capacitance: will increase
• Capacitive reactance: will decrease
• AC voltage between point A and ground will decrease
A vitally important general principle of electric circuits is that voltage is always measured between twopoints, not at one point. Whenever you need to determine a particular voltage, you must identify which twopoints in the circuit that voltage lies between. In the case of “A” and ground, the voltage in question spansthe dielectric sheath around the probe, not across the resistor.
291

Question 109
Small relays often come packaged in clear, rectangular, plastic cases. These so-called “ice cube” relayshave either eight or eleven pins protruding from the bottom, allowing them to be plugged into a specialsocket for connection with wires in a circuit. Note the labels near terminals on the relay socket, showing thelocations of the coil terminals and contact terminals:
Relay
(top views)
socketRelay
coil
coil
Com
#1
Com
#2
N.O
. #1
N.C
. #1
N.C
. #2
N.O
. #2
Draw the necessary connecting wires between terminals in this circuit, so that actuating the normally-open pushbutton switch sends power from the battery to the coil to energize the relay:
Relay(plugged into socket)
+-
Battery
N.O.switch
This question is typical of those in the “Pictorial Circuit Diagrams” worksheet found in the SocraticInstrumentation practice worksheet collection, except that all answers are provided for those questions. Feelfree to use this practice worksheet to supplement your studies on this very important topic.
file i03206
292

Answer 109
This is a graded question – no answers or hints given!
Notes 109
This is by no means the only solution, but it works:
Relay(plugged into socket)
+-
Battery
N.O.switch
“Ice cube” style relays are very common in industry, and it is important that students understand howto interpret the pin diagrams on the cases in order to use them in new circuits and to troubleshoot relaycircuits that are already built.
293

Question 110
Suppose a voltmeter registers 0 volts between test points B and C in this circuit:
+−
24 volts(0.5 amps
current-limited)R1
R2
R3
R41 kΩ
1 kΩ
1 kΩ
1 kΩ
A B C
D E F
Identify the likelihood of each specified fault for this circuit. Consider each fault one at a time (i.e. nocoincidental faults), determining whether or not each fault could independently account for all measurementsand symptoms in this circuit.
Fault Possible ImpossibleR1 failed openR2 failed openR3 failed openR4 failed open
R1 failed shortedR2 failed shortedR3 failed shortedR4 failed shorted
Voltage source dead
This question is typical of those in the “Fault Analysis of Simple Circuits” worksheet found in the SocraticInstrumentation practice worksheet collection, except that all answers are provided for those questions. Feelfree to use this practice worksheet to supplement your studies on this very important topic.
file i03138
294

Answer 110
This is a graded question – no answers or hints given!
Notes 110
A good place to begin with this problem is to determine what the voltage drop should be between testpoints B and C in this circuit. A quick analysis reveals this proper voltage drop to be 8 volts (one-thirdof the power supply voltage). Since we are told the actual voltage drop between these points is 0 volts, weknow there is something definitely wrong in this circuit.
What we need to identify are faults which could prevent voltage from being dropped across points Band C when there should be voltage between those points. This could be caused by a dead source, an openfault preventing current from traveling through resistor R2, or a short-circuit in parallel with the test pointsin question (e.g. a short-circuited R2).
Fault Possible ImpossibleR1 failed open
√
R2 failed open√
R3 failed open√
R4 failed open√
R1 failed shorted√
R2 failed shorted√
R3 failed shorted√
R4 failed shorted√
Voltage source dead√
A short-circuited R1 is also possible, because this would shunt current away from the other three resistorsentirely, preventing voltage from being dropped across any of them.
295

Question 111
Lab Exercise
Your team’s task is to automate a “process unit” consisting of tubes, vessels, a measuring transmitter, afinal control element, and other components. At the conclusion of this lab exercise your team’s process unitwill be controlled by a loop controller so as to maintain its process variable at some operator-determinedsetpoint value. The process unit is pre-assembled for you – all your team needs to do is connect it to thecontroller and properly configure that controller.
During this lab exercise you will not study each system component in detail. The time will come tostudy each loop component in depth, in subsequent courses. For now, you are just learning how the variousdevices interconnect to form a functional control system. This will give you perspective and context for yourlater studies. A very similar exercise of automating a simple process will be repeated at the end of everyquarter (except Summer) by each student individually as a “capstone” activity.
The following table of objectives show what you and your team must complete within the scheduledtime for this lab exercise. Note how some of these objectives are individual, while others are for the team asa whole:
Objective completion table:
Performance objective Grading 1 2 3 4 TeamManual control of final control element (FCE) mastery – – – –
Transmitter senses process variable mastery – – – –Process is stable in automatic mode mastery – – – –
Loop calibrator sourcing signal to FCE mastery – – – –Loop calibrator reading transmitter signal (live) mastery – – – –
Loop calibrator simulating transmitter (live) mastery – – – –Loop diagram and inspection mastery – – – –
Tube and pipe fitting mastery – – – –Lab question: Instrument connections proportional – – – –
Lab question: Commissioning proportional – – – –Lab question: Mental math proportional – – – –Lab question: Diagnostics proportional – – – –
Decommission and lab clean-up mastery – – – –Personal tool kit complete (show on last day) mastery – – – –
Reply to email message on BTC account mastery – – – –
The only “proportional” scoring in this activity are the lab questions, which are answered by each studentindividually. A listing of potential lab questions are shown at the end of this worksheet question. The labquestions are intended to guide your labwork as much as they are intended to measure your comprehension,and as such the instructor may ask these questions of your team day by day, rather than all at once (on asingle day).
It is essential that your team plans ahead what to accomplish each day. A short (10minute) team meeting at the beginning of each lab session is a good way to do this, reviewingwhat’s already been done, what’s left to do, and what assessments you should be ready for.There is a lot of work involved with building, documenting, and troubleshooting these workinginstrument systems!
As you and your team work on this system, you will invariably encounter problems. You should alwaysattempt to solve these problems as a team before requesting instructor assistance. If you still requireinstructor assistance, write your team’s color on the lab whiteboard with a brief description of what youneed help on. The instructor will meet with each team in order they appear on the whiteboard to addressthese problems.
296

Lab Exercise – safety first!
Before you begin working in the lab room, let’s identify the locations of some important items:
• First-aid kit (near the north-west exterior door)
• Fire extinguisher (near the main lab entrance door)
• Chemical shower (near the main lab entrance door)
• Sink with eyewash nozzles (on the south end of the lab)
• Emergency power shut-off buttons (near the main lab entrance door)
• Emergency procedures handbook (on the south end of the main control panel)
• Danger tags, for tagging out equipment (near the main control panel)
• Extra safety glasses and goggles (near the instructors’ office doors)
• Step-ladders (north-east corner of lab room)
You must adhere to these safety rules at all times when working in the lab:
• No open-toed shoes (e.g. sandals) allowed in the lab!
• Eye protection must be worn at all times in the lab room!
• Never use a power tool you are unfamiliar with. Get assistance from the instructor before using it forthe first time! An instructor must be present in the room if you are using a power tool.
• No work with dangerous voltages (anything greater than 30 volts) without an instructor present in theroom!
• Hearing protection must be worn when working around or with loud tools!→ Chop saw→ Hand drill (using hole saw)
• Always use a step-ladder, never a chair, to reach for something in a high location!
An important safety policy at many industrial facilities is something called stop-work authority, whichmeans any employee has the right to stop work they question as unsafe. The same applies in this lab: eachand every student has the authority to stop work if they feel in any way unsafe!
297

Lab Exercise – process unit options
Several different process units have been constructed for your use, a number of them mounted to 2’ ×2’ plywood boards for convenient placement within racks at different points in the lab room. The followingphotographs show a couple of process unit examples.
Air pressure control process
In this particular process, a hand-operated valve (black handle) introduces compressed air into a vessel(black ABS plastic cylinder) while a pneumatically controlled valve (red) vents air from that vessel to theatmosphere. A transmitter (blue) senses the amount of accumulated air pressure inside the vessel and reportsit to the controller, which in turn sends an electrical signal to a current-pressure converter (grey) modulatingair pressure to the red control valve. By throttling the red control valve, the loop controller is able tomaintain a steady air pressure inside the black plastic vessel despite changes in the hand valve’s position orchanges in the supplied air pressure.
This is an example of a process requiring direct controller action: if the air pressure inside the vesselexceeds the setpoint value (i.e. there is too much air pressure in the vessel), the controller must increaseits signal to the control valve in order to vent more air out of the vessel and thereby decrease the vessel’spressure.
298

Turbine speed control process
In this particular process, compressed air exiting a nozzle (bent copper tube) impinges on the blades ofa turbine (7-bladed fan), spinning it to create a small amount of DC voltage. A transmitter (blue) sensesthat voltage and reports it to the controller, which in turn sends an electrical signal to a current-pressureconverter (silver box) modulating air pressure to a pneumatically actuated valve (red) throttling compressedair to the nozzle. By throttling this red control valve, the loop controller is able to maintain a steady turbinespeed despite changes in supplied air pressure or mechanical loading of the turbine.
This is an example of a process requiring reverse controller action: if the turbine’s speed exceeds thesetpoint value (i.e. it is spinning too fast), the controller must decrease its signal to the control valve inorder to discharge less compressed air out of the nozzle and thereby slow the turbine down.
One of the tasks of an instrument technician is to determine the necessary controller action from ananalysis of the process. For this reason it will be your team’s responsibility to determine the needed actionand to configure your controller accordingly – your instructor will not determine this for you.
299

Lab Exercise – commissioning the system (connecting final control element to loop controlleroutput)
The Instrumentation lab is equipped to facilitate the construction of working instrument “loops,” withover a dozen junction boxes, pre-pulled signal cables, and “racks” set up with 2-inch vertical pipes formounting instruments and 2’ by 2’ process units. The only wires you should need to install to build a workingsystem are those connecting the field instrument to the nearest junction box, and then small “jumper” cablesconnecting different pre-installed cables together within intermediate junction boxes.
It is simplest to begin the commissioning of your process unit by first connecting the final controlelement to the loop controller. If your team’s process unit uses a pneumatically actuated control valve, thenthe controller’s 4-20 mA signal will connect to an “I/P” current-to-pressure converter which should alreadybe tubed to the valve’s actuating diaphragm. If your team’s process unit uses some other final controlelement such as an electric heater or a motor speed drive, the controller’s 4-20 mA signal will connect tothose instead. In any case, the process unit will be equipped with a terminal block ready to accept thecontroller’s 4-20 mA output signal.
Your process may require compressed air to function. Clean, dry “instrument air” is available at allutility columns in the lab room, and along some of the instrument racks as well (through stainless-steeltubes). Make the connection between the nearest air supply and the process unit using a length of plastictubing with pre-attached tube fitting nuts and ferrules at the end. To see how tube fittings are assembled,you might want to inspect one of the pre-built systems in the lab to see how tubes are attached to instrumentsthere.
You have several options for loop controllers in the lab room: panel-mounted controllers (located onthe main control panel), remote-mounted PLC units (located in some of the junction boxes), and the lab’sDCS with two “nodes” located at the north and south ends of the lab room. You will need to consultdocumentation for each of these loop controller types to see which terminals you connect the valve’s signalwiring to. The PLC and DCS controllers have wiring diagrams located in the junction boxes. The panel-mounted loop controllers are documented in user’s manuals.
Once the final control element has been successfully connected to the loop controller’s output terminals,you may place the controller in “Manual” mode and use it to command the FCE through its full range ofaction. This is the first “loop check” test of your team’s system.
If you experience any trouble along the way, use your multimeter to diagnose the location of the problem.Bear in mind that the loop controller behaves as an electrical source while the FCE behaves as an electricalload to the 4-20 mA signal.
300

Lab Exercise – commissioning the system (pipe versus tube fittings)
One of the “just-in-time” learning activities students encounter in their first loop construction exercise ishow to use tapered pipe and instrumentation tube fittings. Those students familiar with household plumbingwill already be familiar with tapered pipe fittings, but instrument tube fittings are new to almost all newstudents.
Each student must individually demonstrate how to properly connect a tube to a Swagelok brandinstrument tube fitting, as well as properly join male and female tapered pipe (NPT) threads.
A pipe fitting is designed to join rigid metal pipes to other metal pipes and/or to instruments with fluidpressure ports. Standard American pipe threads are tapered, which means they achieve a leak-free connectionby tightening with significant torque. An essential detail to address with pipe fittings is how to seal andlubricate these tapered threads. This is done by applying either pipe thread compound (pipe “dope”), Teflontape, or other sealant materials to the mating threads prior to assembly. Failure to apply sealant to pipethreads will result in leaks and possibly damaged pipe fittings! Your instructor will verify correct applicationof pipe dope or pipe tape to the male threads, as well as verify that the male and female pipe fittings havebeen coupled together with adequate torque.
By contrast, a tube fitting is designed to join rigid or flexible tubes to other tubes and/or to pipe threads.Instrument-grade tube fittings achieve a seal by using compression to force a small metal ring (called theferrule) to grip the circumference of a tube with just the right amount of tension. Instrument tube fittingthreads are straight (not tapered), which means they do not become progressively tighter in the same waytapered pipe fittings do. No thread sealant (e.g. Teflon tape) is required to make tube fittings seal, just theproper amount of compression. In fact, thread sealant actually gets in the way of making a good seal withinstrument tube fittings.
The standard amount of tightening for initial assembly of 1/4 inch and 3/8 inch Swagelok brandinstrument tube fittings (“swaging” the ferrule around the tube for the first time) is one and one-quarterturns (1-1/4 turns). Re-making a tube fitting requires only that the nut be “snugged,” not re-tightened 1-1/4 turns! Your instructor will inspect your “swaged” tube after disassembly to check for evidence of propertightening.
For more detail on this important subject, refer to the “Pipe and Pipe Fittings” and “Tube and TubeFittings” sections of the “Instrument Connections” chapter of your Lessons In Industrial Instrumentationtextbook. Other good resources include documentation from pipe and tube fitting manufacturers. BothSwagelok and Parker publish free guides on the assembly and use of both types of fittings.
Common mistakes:
• Forgetting to apply pipe dope or pipe tape to tapered pipe fitting threads.• Applying pipe dope or pipe tape to tube fitting threads.• Over-tightening tube fitting nut.• Under-tightening tube fitting nut.• Failing to fully “seat” the tube into the fitting prior to tightening the nut.• Installing ferrule piece(s) backward, or omitting half of the two-piece Swagelok ferrule assembly.
301

Lab Exercise – commissioning the system (connecting transmitter to loop controller input)
The next step in building your team’s loop is to connect the process unit’s sensing device (the“transmitter”) to the loop controller. A suitable transmitter will already be mounted on the process unit,ready to connect. As with the final control element, the process unit will be equipped with a terminal blockready to accept wires connecting the transmitter to the controller’s 4-20 mA input terminals.
As with the valve’s control wiring, the only wires you should need to install to connect the transmitterto the controller are those connecting the field instrument to the nearest junction box, and then small“jumper” cables connecting different pre-installed cables together within intermediate junction boxes. Thepre-installed multi-conductor cables will span most of the distance between your transmitter and your loopcontroller.
Consult manufacturer’s documentation to see how to make the wiring connections between thetransmitter and the loop controller (consulting the pre-printed wiring diagrams for wiring details on thePLC and DCS controllers). You may find user’s manuals for the pressure transmitters online (the Internet).
Once the transmitter has been successfully connected to the loop controller’s output terminals, you mayactuate the process unit’s final control element and monitor the controller’s “process variable” display to seethe indication change. This is the second “loop check” test of your team’s system.
If you experience any trouble along the way, use your multimeter to diagnose the location of the problem.Bear in mind that the loop controller behaves as an electrical source while the transmitter behaves asan electrical load to the 4-20 mA signal, even though the transmitter is the component responsible forregulating the amount of current in this circuit. Such “loop-powered” transmitters are typical in processinstrumentation.
Note that determining how to connect your process transmitter to the controller input is typically themost confusing aspect of the “capstone” assessment (done at the end of Fall, Winter, and Spring quarters).The reason for this confusion is the diversity of transmitter types (loop-powered versus self-powered) andcontroller inputs (powered versus unpowered, voltage versus current). The key to properly determining thecorrect connections lies in analyzing the transmitter loop as a DC circuit, knowing it must have a DC powersource somewhere in it, and identifying each component’s function as either a source or a load in order tocorrectly route the 4-20 mA current signal through them all in series fashion.
302

Lab Exercise – commissioning the system (test in automatic mode)
After verifying the final control element’s operation and the transmitter’s ability to sense the processvariable, you are ready for the next step: configuring the loop controller to automatically control the process.
First, you will need to determine the necessary action for the controller: either direct or reverse. This issolely determined by the design of your process unit. From the previous two tests (FCE test and transmittertest), you should have all the information necessary to determine the effect of the FCE on the processvariable. If the FCE has a direct effect on the PV (i.e. increased output from the controller results inincreased PV) then the controller must be configured for reverse action. If the FCE has a reverse effect onthe PV (i.e. increased output results in decreased PV) then the controller must be configured for directaction.
Every loop controller is capable of implementing both types of action. To change the controller’s action,consult the manual for that controller. It will guide you to finding the proper parameter defining controlleraction.
Once the controller’s action has been properly configured, you should configure its “PID tuning”parameters. PID tuning is a complex subject, far beyond the scope of this exercise, so for now you will setthese parameters to modest values and let your instructor “tune” the controller for precise operation. Consultthe manual to find the PID tuning parameters for your team’s controller, and then set those parameters asfollows:
• (P) – set to a gain of 0.5, or a “proportional band” of 200%• (I) – set to minimum effect (very small repeats per minute, or very large minutes per repeat)• (D) – set to minimum effect (zero minutes)
After the loop controller’s action and PID tuning parameters have been properly configured, you areready to try operating the process in automatic mode. Begin by placing the controller in “Manual” modeand moving the output to such a point that the process variable reads approximately 50% of scale. Oncethat point has been reached, switch the controller from “Manual” mode to “Automatic” mode. If all is well,the process variable should remain fairly constant, the controller making automatic corrections to its outputsignal to maintain the PV at or near setpoint.
Successful demonstration of automatic-mode operation is the third “loop check” of your team’s system.
If a team is working efficiently, they should be able to commission a process unit withinthe span of one 3-hour lab session.
303

Lab Exercise – using a loop calibrator
Aside from your multimeter, one of the most important tools for the instrument technician to masteris the loop calibrator. These are special milliammeters equipped with the ability to generate 4-20 milliampsignals as well as measure them. As a team, you and your teammates will demonstrate the use of a loopcalibrator to do the following tasks while correctly identifying electrical properties such as source versusload, voltage polarities, and current directions (conventional flow) with the loop calibrator connected to thecircuit:
• Measure the 4-20 mA signal sent by the transmitter to the controller, identifying all electrical sourcesand loads and also properly identifying voltage polarities and current directions in the circuit
• Source a 4-20 mA signal to the final control element (taking the place of the controller), identifying allelectrical sources and loads and also properly identifying voltage polarities and current directions in thecircuit
• Simulate a transmitter to send your own 4-20 mA signal to the controller, identifying all electricalsources and loads and also properly identifying voltage polarities and current directions in the circuit
Details on the use of loop calibrators and their electrical functions may be found in the “UsingLoop Calibrators” subsection of the “Troubleshooting Current Loops” section of the “Analog ElectronicInstrumentation” chapter in your Lessons In Industrial Instrumentation textbook.
In this lab exercise, your team will be asked to demonstrate the use of a loop calibrator on the connectedprocess unit, and to do so in a way that is realistic to the profession. This means using the calibrator insuch a way as to avoid any detrimental effect on the process.
When sourcing a 4-20 mA signal to the final control element, you should first secure all energy sourcesthat would make the process respond to that 4-20 mA signal in order to ensure the process variable cannotreach unsafe levels. For example, if your process happens to be a turbine speed control, you should shutoff any manual valves that would allow air to reach the nozzle and potentially make the turbine spin out ofcontrol when the control valve is actuated by the loop calibrator’s signal.
When measuring the 4-20 mA signal sent by the transmitter, you should do so while the process isrunning in order to emulate a real-world condition where you as an instrument technician must diagnoseproblems on “live” processes. Of course, disconnecting any portion of the 4-20 mA transmitter circuit willinterrupt the PV signal sent to the controller, which may be disastrous for a running process with thecontroller in automatic mode. Therefore, you will need to place the controller in manual mode beforeperforming this test, and return the controller to automatic mode after reconnecting the wires at theconclusion of the test. A loop controller placed in manual mode ignores the PV signal and maintainsthe output at whatever value the human operator desires, which is what allows you to interrupt that PVsignal and perform your signal measurement without adversely affecting the process.
When simulating the transmitter with a loop calibrator to test the controller’s PV input, you shouldsimilarly place the controller in manual mode before performing the test. This will prevent the controllerfrom taking action on false information (as you simulate the transmitter responding over its full range ofmeasurement) and potentially driving the real process variable to unsafe levels. Return the controller toautomatic mode at the conclusion of your test.
If your process unit happens to be equipped with manual “block” and “bypass” valves around the controlvalve, it it possible to perform the current sourcing test on the control valve with the process running. Theprocedure for doing so is as follows: (1) Slowly open the bypass valve with the controller in automatic modeand let the controller shut off the control valve as it holds PV = SP. (2) Once the control valve has reachedthe fully shut position, switch the controller to manual mode and close both block valves. (3) Disconnectthe FCE wires from the controller and connect to the loop calibrator. (4) Perform the test using the loopcalibrator to “stroke” the control valve throughout its range. (5) Reconnect the FCE wires to the controller’soutput and verify control valve operation by stroking the valve through its whole range using the controller’s
304

adjustable output in manual mode. (6) Return the valve to its fully-closed position in manual mode andopen the block valves. (7) Switch the controller to automatic mode. (8) Slowly close the bypass valve andlet the controller open up the control valve as it holds PV = SP.
Loop calibrators, along with some other specialized tools, may be found in the team tool locker. Eachteam has a color-designated locker in the lab room containing certain specialized tools you are not expectedto own. Each team is responsible for ensuring these tools get put back into the locker at the end of each labsession, that the locker is locked at the end of each lab session, that all tools are kept in good working order,and also that the tool lockers remain free of personal items. Each tool locker will be inspected at the end ofthe quarter, with team members held responsible for replacing any missing tools at their own expense.
It should be noted that each locker contains an itemized list of all contents, which should be periodicallychecked to ensure nothing is missing.
305

Lab Exercise – documenting the system
Each student must sketch their own loop diagram for their team’s system, following proper ISAconventions. Sample loop diagrams are shown in the next question in this worksheet, and a loop diagram“template” is included at the end of this question (although this template may not precisely match theinstruments you have chosen for your loop). These loop diagrams must be comprehensive and detailed,showing every wire connection, every cable, every terminal block, range points, etc. The principle to keep inmind here is to make the loop diagram so complete and unambiguous that anyone can follow it to see whatconnects to what, even someone unfamiliar with industrial instrumentation. In industry, loops are oftenconstructed by contract personnel with limited understanding of how the system is supposed to function.The loop diagrams they follow must be so complete that they will be able to connect everything properlywithout necessarily understanding how it is supposed to work.
Every instrument and every signal cable in your loop needs to be properly labeled with an ISA-standardtag number. An easy way to do this is to wrap a short piece of masking tape around each cable (and placedon each instrument) then writing on that masking tape with a permanent marker. Although no industrystandard exists for labeling signal cables, a good recommendation is to label each two-wire cable with thetag number of the field instrument it goes to. Thus, every length of two-wire cable in a pressure transmittercircuit should be labeled “PT-x” (where “x” is the loop number), every flow control valve should be labeled“FV-x”, etc. Remember that the entire loop is defined by the process variable it measures: if the PV istemperature then the transmitter with be a TT, the control valve will be a TV, the controller with be a TC,etc.
When your entire team is finished drafting your individual loop diagrams, call the instructor to do aninspection of the loop. Here, the instructor will have students take turns going through the entire loop,with the other students checking their diagrams for errors and omissions along the way. During this timethe instructor will also inspect the quality of the installation, identifying problems such as frayed wires,improperly crimped terminals, poor cable routing, missing labels, lack of wire duct covers, etc. The teammust correct all identified errors in order to receive credit for their system.
After successfully passing the inspection, each team member needs to place their loop diagram in thediagram holder located in the middle of the lab behind the main control panel. When it comes time totroubleshoot another team’s system, this is where you will go to find a loop diagram for that system!
Common mistakes:
• Forgetting to label all signal wires (see example loop diagrams).• Forgetting to label all field instruments with their own tag names (e.g. PT-83, PIC-83, PV-83).• Forgetting to note all wire colors.• Forgetting to put your name on the loop diagram!• Basing your diagram off of a team-mate’s diagram, rather than closely inspecting the system for yourself.• Not placing loop sheet instruments in the correct orientation (field instruments on the left, control room
instruments on the right).
Creating and inspecting accurate loop diagrams should take no more than one full labsession (3 hours) if the team is working efficiently!
306

Lab questions
It is each team’s responsibility to study for these lab questions, and to be prepared to answer themthroughout the loop construction and testing process. These questions serve not only to measure yourprogress, but also to guide your progress as you construct, test, and diagnose your loop systems. Teams areencouraged to review this question list during each lab session’s initial planning time, to assess how far theyhave progressed in their understanding of the system and how far they still need to go.
Certain lab questions such as those under “Instrument installation” should be answerable by every teammember as soon as the loop is constructed. The instructor will meet with each team to quiz them on theselab questions at appropriate times throughout the multi-day lab exercise. Doing this helps encourage eachteam to progress at a good pace, stay abreast of the learning objectives, and also avoid a “rush” at the finaldeadline date for answering all lab questions.
• Instrument connections• Determine correct wire connections between instruments to create a working 4-20 mA loop circuit, based
on diagrams of instruments with terminals labeled• Correctly determine all electrical sources and loads, as well as all voltage polarities and current directions
in a 4-20 mA loop circuit, based on diagrams of instruments with terminals labeled
• Commissioning and Documentation• Demonstrate how to isolate potentially hazardous energy in your system (lock-out, tag-out) and also
how to safely verify the energy has been isolated prior to commencing work on the system• Demonstrate how a sound electrical connection is made at each terminal block• Identify the “high” and “low” pressure ports on a pressure transmitter, and explain their significance• Explain the difference between direct and reverse controller action• Explain in simple terms how a varying air pressure actuates the control valve mechanism• Identify multiple locations (referencing a loop diagram) you may measure various 4-20 mA instrument
signals in the system
• Mental math (no calculator allowed!)• Calculate the pneumatic pressure in a 3-15 PSI range corresponding to x percent.• Calculate the electrical current in a 4-20 mA range corresponding to x percent.• Calculate the electrical voltage in a 1-5 volt range corresponding to x percent.• Calculate the percentage value of a pneumatic pressure signal x PSI in a 3-15 PSI range.• Calculate the percentage value of an electrical current signal x mA in a 4-20 mA range.• Calculate the percentage value of an electrical voltage signal x volts in a 1-5 volt range.
• Diagnostics• Given a particular component or wiring fault (instructor specifies type and location), what symptoms
would the loop exhibit and why?• Determine whether or not a given diagnostic test will provide useful information, given a set of symptoms
exhibited by a failed system• Identify at least two plausible faults given the results of a diagnostic test and a set of symptoms exhibited
by a failed system• Propose a diagnostic test for troubleshooting a failed system and then explain the meanings of two
different test results
307

Lab Exercise – decommissioning and clean-up
The final step of this lab exercise is to decommission your team’s entire system and re-stock certaincomponents back to their proper storage locations, the purpose of which being to return the lab facility tothe state in which you found it (or better!) when you began this lab exercise. This includes, but is notlimited to:
• Returning the process unit to its proper storage location• Returning all wires and tubes to their storage locations• Resetting all controller parameters to their default values• Returning tools to the team tool locker• Removing your loop diagrams from the common holding area• Removing all temporary labels from instruments, cables, etc.• General clean-up (removal of all trash, sweeping floors, etc.)
Note: the process unit should be returned to its storage location in fully operationalcondition, so it will be ready for immediate use in the next lab exercise!
308

Lab Exercise – tool kit and email usage
Two additional objectives that are not technically a part of making this lab project function, but arenevertheless very important to your continued success in the Instrumentation program, include assemblinga personal tool kit and using your BTC email account (which is automatically created for every student atthe college).
You will be using your tool kit throughout the remainder of this program, and so it is very importantto have it complete and ready to use by the end of this lab exercise. Note that there are several optionalitems listed in addition to mandatory items. These optional tools are useful, but not 100% necessary for thework you will be doing in the lab. Also note that there are some consumable items in your tool list such aselectrical compression terminals which you will need to keep stocked as you use them in your labwork.
Likewise, you will be relying on email to receive important messages from your instructor(s) throughoutthe remainder of the program. These messages include, but are not limited to, job announcements, guestspeaker appearances, schedule changes, emergency notifications, scholarship announcements, and feedbackon your personal performance in the program. The reason we use email as opposed to using learningmanagement software is because it is imperative you learn how to appropriately use email for your chosencareer. Email is simply the most common and most practical medium businesses use for day-to-day electroniccommunication.
Every BTC student is automatically given an email account upon registration, and this account remainsactive for some time after graduation. If you would rather not add one more email account to your electroniclife, there is the option of having all messages received in your BTC email inbox automatically forwardedto the email platform of your choice (Yahoo, Hotmail, Gmail, Live, etc.) which may be selected as anoption within your BTC email management webpage. It is your responsibility to log in to your BTC emailaccount, set up any forwarding features you would like, and to check your email account daily to receive theseimportant messages.
The library staff at BTC provide technical support for all school-related IT (Information Technology)needs. If you are experiencing trouble with your email account, with password management, or any othernetwork-based technology necessary for your learning at BTC, the library staff are well-trained and helpfulin this regard.
Your readiness for email use will be assessed by your reply to an email message sent toyou by your instructor. Replying to this email message with an email message of your own isa mastery-level objective for every new student in this lab exercise.
When you graduate from this program and enter the workforce, your BTC email account will remainactive for some time, but not in perpetuity. Therefore, you must inform your instructors of your preferredemail account for post-graduation correspondence before you leave BTC. We use email to regularlycommunicate job announcements of interest to graduates, so it is in your best interest to remain connected.
file i00062
Answer 111
Notes 111
309

Lab questions
(1) Sketch wire connections necessary for this pressure transmitter to send a process variable signal to theFoxboro controller. Note that the transmitter is loop-powered (2-wire, 4-20 mA):
+−
24 VDC
ADC
H L
Loop-powered pressuretransmitter
Foxboro model 762CNA controller
1 to 5 VDC
1
3
250 ΩPV
2
4
26
27
MV
4 to 20 mA
(2) Describe how to visually identify the “high” and “low” pressure ports on a pressure transmitter, andexplain their significance.
(3) Calculate the percentage value represented by a 7 PSI pneumatic pressure signal in a 3-15 PSI range.
(4) A 4-20 mA loop-powered pressure transmitter connects to a 4-20 mA electronic indicator. Bothinstruments are supposed to be ranged for 0 to 300 PSI. When the transmitter senses an actual processpressure of 110 PSI, however, the indicator registers 125 PSI instead. An instrument technician measurescurrent in this 4-20 mA circuit during these conditions (i.e. process pressure = 110 PSI and indication= 125 PSI) and obtains a reading of 9.87 milliamps. Identify where the problem is most likely locatedin this pressure measurement system.
310

Lab questions
(1) Sketch wire connections necessary for this liquid level transmitter to send a process variable signal tothe Foxboro controller. Note that the transmitter is self-powered (4-wire, 4-20 mA):
Self-powered liquidlevel transmitter
L1 L2
120 VACline power
Liquid-sensing probe
+−
24 VDC
ADC
Foxboro model 762CNA controller
1 to 5 VDC
1
3
250 ΩPV
2
4
26
27
MV
4 to 20 mA
(2) Explain the difference between direct and reverse controller action, using an example if you find ithelpful.
(3) Calculate the percentage value represented by a 13 mA analog electronic signal in a 4-20 mA range.
(4) A level-indicating controller (LIC) receives its process variable signal from a loop-powered 4-20 mAelectronic level transmitter configured for a range of 0 to 200 inches. The system was working fine foryears, but then one day the LIC began to register −50 inches all the time regardless of the actual processliquid level. Measuring voltage across the transmitter terminals, you see your meter indicate 0 voltsDC. Two technicians working with you offer different analyses: one of them tells you the cable betweenthe transmitter and the controller must be failed open, while the other insists the cable must be failedshorted. What do you think might account for all the symptoms in this system? Explain your answerin detail.
311

Question 112
The Rules of Fault Club
(1) Don’t try to find the fault by looking for it – perform diagnostic tests instead
(2) Don’t try to find the fault by looking for it – perform diagnostic tests instead!
(3) The troubleshooting is over when you have correctly identified the nature and location of the fault
(4) It’s just you and the fault – don’t ask for help until you have exhausted your resources
(5) Assume one fault at a time, unless the data proves otherwise
(6) No new components allowed – replacing suspected bad components with new is a waste of time andmoney
(7) We will practice as many times as we have to until you master this
(8) Troubleshooting is not a spectator sport: you have to troubleshoot!
These rules are guaranteed to help you become a better troubleshooter, and will be consistentlyemphasized by your instructor.
312

Loop
dia
gra
mte
mpla
te
Description Manufacturer Model Notes
Loop Diagram: Revised by: Date:
Tag # Input range Output range
313

Loop diagram requirementsPerhaps the most important rule to follow when drafting a loop diagram is your diagram should be
complete and detailed enough that even someone who is not an instrument technician could understandwhere every wire and tube should connect in the system!
• Instrument “bubbles”• Proper symbols and designations used for all instruments.• All instrument “bubbles” properly labeled (letter codes and loop numbers).• All instrument “bubbles” marked with the proper lines (solid line, dashed line, single line, double lines,
no lines).• Optional: Calibration ranges and action arrows written next to each bubble.
• Text descriptions• Each instrument documented below (tag number, description, etc.).• Calibration (input and output ranges) given for each instrument, as applicable.
• Connection points• All terminals and tube junctions properly labeled.• All terminal blocks properly labeled.• All junction (“field”) boxes shown as distinct sections of the loop diagram, and properly labeled.• All control panels shown as distinct sections of the loop diagram, and properly labeled.• All wire colors shown next to each terminal.• All terminals on instruments labeled as they appear on the instrument (so that anyone reading the
diagram will know which instrument terminal each wire goes to).
• Cables and tubes• Single-pair cables or pneumatic tubes going to individual instruments should be labeled with the field
instrument tag number (e.g. “TT-8” or “TY-12”)• Multi-pair cables or pneumatic tube bundles going between junction boxes and/or panels need to have
unique numbers (e.g. “Cable 10”) as well as numbers for each pair (e.g. “Pair 1,” “Pair 2,” etc.).
• Energy sources• All power source intensities labeled (e.g. “24 VDC,” “120 VAC,” “20 PSI”)• All shutoff points labeled (e.g. “Breaker #5,” “Valve #7”)
314
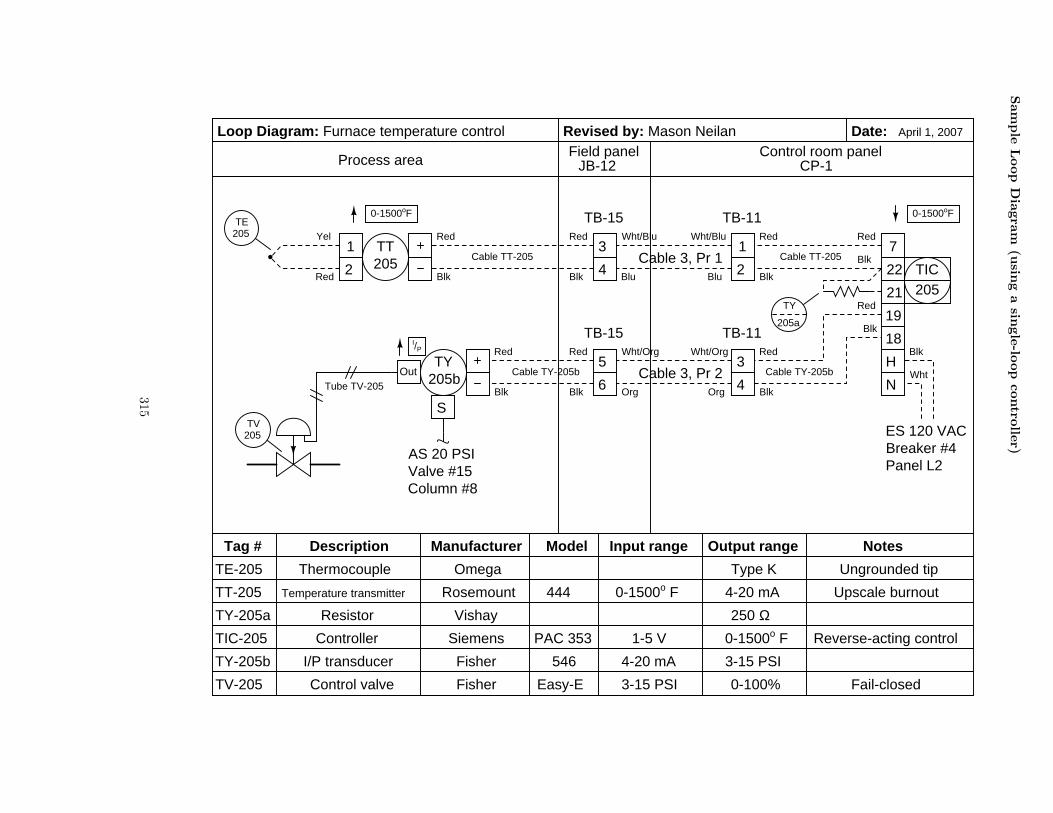
Sam
ple
Loop
Dia
gra
m(u
sing
asin
gle
-loop
contro
ller)
Process areaField panel Control room panel
Controller
Resistor
I/P transducer
Control valve
I/P
ES 120 VAC
AS 20 PSI
Loop Diagram: Furnace temperature control
TT205
JB-12
TB-15
TB-15
3
4
1
2
Temperature transmitterTT-205 Rosemount 444
TE205
CP-1
TB-11
TB-11
1
2
7
Vishay 250 ΩTY-205a
TIC-205 Siemens PAC 353
TY-205b
TV-205 Fisher Easy-E 3-15 PSI
Fisher
H
N
3
4
22
21
19
18
TY205b
TY
205a
Breaker #4Panel L2
5
6Cable TY-205b
Cable TT-205 Cable TT-205
Cable TY-205b
TIC205
Revised by: Mason Neilan
TV205
Tube TV-205
Column #8Valve #15
546
0-1500oF 0-1500oF
Fail-closed
Reverse-acting control
TE-205 Thermocouple Omega Type K Ungrounded tip
Red
BlkRed
Yel Red
Blk
Red
Blk
Red
Blk
Wht/Blu
Blu Blu
Wht/Blu
Cable 3, Pr 1
Cable 3, Pr 2
Wht/Org
Org Org
Wht/Org
Blk
Red
Blk
Red
Blk
Wht
Red
Blk
Red
Blk
Upscale burnout
Description Manufacturer Model Notes
Date:
Tag # Input range Output range
0-1500o F 4-20 mA
4-20 mA 3-15 PSI
0-100%
1-5 V 0-1500o F
April 1, 2007
Out
S
315

Sam
ple
Loop
Dia
gra
m(u
sing
DC
Scontro
ller)
Field process area
Description Manufacturer Model Notes
Loop Diagram: Revised by: Date:
DCS cabinet
Red
Blk
Red
Blk
Red
Blk
Fisher
Fisher
Tag # Input range Output range
Blue team pressure loop April 1, 2009
Card 4
Card 6Channel 6
Channel 611
12
29
30
Red
Blk
TB-80
TB-80
Field panel JB-25
TB-52
TB-52
PT-6 Pressure transmitter Rosemount 3051CD 0-50 PSI 4-20 mA
PIC6
PT6
Cable 4, Pr 1
Cable 4, Pr 8
1
2
15
16
Cable PT-6
Red
Blk
Red
Blk
Red
Blk
Red
Blk
Red
Blk
Red
Blk
Red
Blk
Red
Blk
Cable PV-6
11
12
11
12PY6
AS 20 PSI
PV6
0-50 PSI
I/P
0-50 PSI
846
Emerson DeltaV 4-20 mA 4-20 mA HART-enabled inputPIC-6
PY-6
PV-6
I/P transducer
Controller
Control valve Vee-ball
4-20 mA 3-15 PSI
3-15 PSI 0-100% Fail-open
Duncan D.V.
Tube PV-6
Cable PT-6
Cable PV-6
Analog input
Analogoutput
Direct-acting control
H
L
73
73
73 Cable PT-73 Cable PT-73
Cable PV-73Cable PV-73
PT-73
PIC-73
PY-73
PV-73
73
PIC
S
O
Tube PV-73
316

Sam
ple
Loop
Dia
gra
m(u
sing
pneum
atic
contro
ller)
Description Manufacturer Model Notes
Loop Diagram: Revised by: Date:
Tag # Input range Output range
LT24
In
H
LOut
C
D
A.S. 21 PSI
Tube LT-24a Tube LT-24b
A.S. 21 PSI
Process areaBulkhead panel
14
B-104Control panel CP-11
Tube LV-24
LV24
Tube LV-24
Supply
LIC
24
Tube LV-24
(vent)
Sludge tank level control I. Leaky April 1, 2008
LT-24 Level transmitter Foxboro 13A 25-150 "H2O 3-15 PSI
3-15 PSI 3-15 PSIFoxboroLIC-24 130
LV-24 Fisher Easy-E / 667 3-15 PSI 0-100% Fail closedControl valve
Controller
317

Sam
ple
Loop
Dia
gra
m(u
sing
PLC
,w
ithele
ctro
nic
positio
ner
insta
lled
on
valv
e)
Tag number Description Manufacturer Model Calibration Notes
ES 120 VAC
Red
Blk
Red
Process area
From fieldpanel disconnect
1 2 3 4
1A
Blk Wht Grn
21
11
12
1A10 PS-1
120 VAC
24 VDC1 amp
L1 NIN0+
IN1+
IN2+
IN3+
IN0-
IN1-
IN2-
IN3-
Blk Wht Grn
1762-IF4analog input card
L1
L2/N
Allen-Bradley ML11001762-IF4 input 4-20 mA
Rosemount 4-20 mA output
Blu Blu Blu
Blu
Blu
Blu
expansion slot 1
analog input cardexpansion slot 2
PLC
AutomationDirect C-More
Ethernet
Mask = 255.255.0.0
HMI touch-panel
800 mA
22BluBlk
FT
18
18
18
FIR
FC
1762-OF4
Cable FT-18
FT-18
FC-18
FIR-18
Flow transmitter 3051S0-100" WC input
IP = 169.254.10.91762-OF4 output 4-20 mA
P Cable FV-18V out 0
V out 1
V out 2
V out 3
Com
Com
I out 0
I out 1
I out 2
I out 3
Blu
Blu
Blu
Loop Red
Blk
Red
Blk
18FV
FV-18 Flow valve with positioner FisherED / 667DVC6010
IAS 20 PSI
4 mA = fully closed20 mA = fully open Fail-closed
Square-root characterization
H
L
Loop Diagram: Unit feed flow control Revised by: A. Bradley Date: April 1, 2013
Field panel FP-25
Loop
Supply
A
0-75 GPM
(Located in maincontrol room)
analog output card
318

file i00654
Answer 112
Your loop diagram will be validated when the instructor inspects the loop with you and the rest of yourteam.
Notes 112
319

Question 113
The INST200 mastery exam reviews several foundational concepts in electric and electronic circuits.Here are some resources for you to study in preparation for this exam:
Circuit sketching• “Pictorial Circuit Diagrams” worksheet, found in the Practice Problem Worksheets page of the Socratic
Instrumentation project→ (http://www.ibiblio.org/kuphaldt/socratic/sinst/doc/practice.html)
• “Bipolar Junction Transistors as Switches” worksheet, found in the Topical Worksheets page of theSocratic Electronics project:→ (http://www.ibiblio.org/kuphaldt/socratic/doc/topical.html)
• “Potentiometers” worksheet, found in the Topical Worksheets page of the Socratic Electronics project:→ (http://www.ibiblio.org/kuphaldt/socratic/doc/topical.html)
DC circuits• “Voltage Divider Circuits” worksheet, found in the Topical Worksheets page of the Socratic Electronics
project:→ (http://www.ibiblio.org/kuphaldt/socratic/doc/topical.html)
• “Current Divider Circuits” worksheet, found in the Topical Worksheets page of the Socratic Electronicsproject:→ (http://www.ibiblio.org/kuphaldt/socratic/doc/topical.html)
• “Kirchhoff’s Laws” worksheet, found in the Topical Worksheets page of the Socratic Electronics project:→ (http://www.ibiblio.org/kuphaldt/socratic/doc/topical.html)
• “Time Constant Circuits” worksheet, found in the Topical Worksheets page of the Socratic Electronicsproject:→ (http://www.ibiblio.org/kuphaldt/socratic/doc/topical.html)
• “Power Conversion Circuits” worksheet, found in the Topical Worksheets page of the SocraticElectronics project:→ (http://www.ibiblio.org/kuphaldt/socratic/doc/topical.html)
Mathematics• “Fundamental Principles of Algebra” worksheet, found in the Practice Problem Worksheets page of the
Socratic Instrumentation project→ (http://www.ibiblio.org/kuphaldt/socratic/sinst/doc/practice.html)
• “Trigonometry for AC Circuits” worksheet, found in the Topical Worksheets page of the SocraticElectronics project:→ (http://www.ibiblio.org/kuphaldt/socratic/doc/topical.html)
• “Applications of Trigonometry” worksheet, found in the Practice Problem Worksheets page of theSocratic Instrumentation project→ (http://www.ibiblio.org/kuphaldt/socratic/sinst/doc/practice.html)
Circuit fault analysis• “Basic Circuit Troubleshooting” worksheet, found in the Topical Worksheets page of the Socratic
Electronics project:→ (http://www.ibiblio.org/kuphaldt/socratic/doc/topical.html)
320

• “Fault Analysis of Simple Circuits” worksheet, found in the Practice Problem Worksheets page of theSocratic Instrumentation project→ (http://www.ibiblio.org/kuphaldt/socratic/sinst/doc/practice.html)
AC circuits• “Series and Parallel AC Circuits” worksheet, found in the Topical Worksheets page of the Socratic
Electronics project:→ (http://www.ibiblio.org/kuphaldt/socratic/doc/topical.html)
• “Passive Filter Circuits” worksheet, found in the Topical Worksheets page of the Socratic Electronicsproject:→ (http://www.ibiblio.org/kuphaldt/socratic/doc/topical.html)
• “Step-Up, Step-Down, and Isolation Transformer Circuits” worksheet, found in the Topical Worksheetspage of the Socratic Electronics project:→ (http://www.ibiblio.org/kuphaldt/socratic/doc/topical.html)
Operational amplifier circuits• “Open Loop Opamp Circuits” worksheet, found in the Topical Worksheets page of the Socratic
Electronics project:→ (http://www.ibiblio.org/kuphaldt/socratic/doc/topical.html)
• “Negative Feedback Opamp Circuits” worksheet, found in the Topical Worksheets page of the SocraticElectronics project:→ (http://www.ibiblio.org/kuphaldt/socratic/doc/topical.html)
• “Inverting and Noninverting Opamp Voltage Amplifier Circuits” worksheet, found in the TopicalWorksheets page of the Socratic Electronics project:→ (http://www.ibiblio.org/kuphaldt/socratic/doc/topical.html)
Electromechanical relay circuits• “Basic Relays” worksheet, found in the Topical Worksheets page of the Socratic Electronics project:
→ (http://www.ibiblio.org/kuphaldt/socratic/doc/topical.html)
• “Electromechanical Relay Logic” worksheet, found in the Topical Worksheets page of the SocraticElectronics project:→ (http://www.ibiblio.org/kuphaldt/socratic/doc/topical.html)
Semiconductor logic circuits• “TTL Logic Gates” worksheet, found in the Topical Worksheets page of the Socratic Electronics project:
→ (http://www.ibiblio.org/kuphaldt/socratic/doc/topical.html)
• “CMOS Logic Gates” worksheet, found in the Topical Worksheets page of the Socratic Electronicsproject:→ (http://www.ibiblio.org/kuphaldt/socratic/doc/topical.html)
• “Basic Logic Gate Troubleshooting” worksheet, found in the Topical Worksheets page of the SocraticElectronics project:→ (http://www.ibiblio.org/kuphaldt/socratic/doc/topical.html)
file i02999
321

Answer 113
Notes 113
322

Creative Commons License
This worksheet is licensed under the Creative Commons Attribution 4.0 International PublicLicense. To view a copy of this license, visit http://creativecommons.org/licenses/by/4.0/ or send aletter to Creative Commons, 171 Second Street, Suite 300, San Francisco, California 94105, USA. The termsand conditions of this license allow for free copying, distribution, and/or modification of all licensed worksby the general public.
Simple explanation of Attribution License:
The licensor (Tony Kuphaldt) permits others to copy, distribute, display, and otherwise use thiswork. In return, licensees must give the original author(s) credit. For the full license text, please visithttp://creativecommons.org/licenses/by/4.0/ on the internet.
More detailed explanation of Attribution License:
Under the terms and conditions of the Creative Commons Attribution License, you may make freelyuse, make copies, and even modify these worksheets (and the individual “source” files comprising them)without having to ask me (the author and licensor) for permission. The one thing you must do is properlycredit my original authorship. Basically, this protects my efforts against plagiarism without hindering theend-user as would normally be the case under full copyright protection. This gives educators a great dealof freedom in how they might adapt my learning materials to their unique needs, removing all financial andlegal barriers which would normally hinder if not prevent creative use.
Nothing in the License prohibits the sale of original or adapted materials by others. You are free tocopy what I have created, modify them if you please (or not), and then sell them at any price. Once again,the only catch is that you must give proper credit to myself as the original author and licensor. Given thatthese worksheets will be continually made available on the internet for free download, though, few peoplewill pay for what you are selling unless you have somehow added value.
Nothing in the License prohibits the application of a more restrictive license (or no license at all) toderivative works. This means you can add your own content to that which I have made, and then exercisefull copyright restriction over the new (derivative) work, choosing not to release your additions under thesame free and open terms. An example of where you might wish to do this is if you are a teacher who desiresto add a detailed “answer key” for your own benefit but not to make this answer key available to anyoneelse (e.g. students).
Note: the text on this page is not a license. It is simply a handy reference for understanding the LegalCode (the full license) - it is a human-readable expression of some of its key terms. Think of it as theuser-friendly interface to the Legal Code beneath. This simple explanation itself has no legal value, and itscontents do not appear in the actual license.
file license
323