The chemical characterisation of halo substructure in the Milky ...
39
MNRAS 000, 1—-33 (2021) Preprint 12 April 2022 Compiled using MNRAS L A T E X style file v3.0 The chemical characterisation of halo substructure in the Milky Way based on APOGEE Danny Horta 1,2 , ★ Ricardo P. Schiavon 1 , J. Ted Mackereth 3,4 , David H. Weinberg 5 , Sten Hasselquist 6 , Diane Feuillet 7 , Robert W. O’Connell 8 , Borja Anguiano 8 , Carlos Allende-Prieto 9,10 , Rachael L. Beaton 11 , Dmitry Bizyaev 12 Katia Cunha 13,14 , Doug Geisler 15,16,17 , D. A. García-Hernández 9,10 , Jon Holtzman 12 , Henrik Jönsson 18 , Richard R. Lane 19 , Steve R. Majewski 8 , Szabolcs Mészáros 20,21 , Dante Minniti 22,23 , Christian Nitschelm 24 , Matthew Shetrone 25 , Verne V. Smith 26 , Gail Zasowski 27 Affiliations are listed at the end of the paper Accepted XXX. Received YYY; in original form ZZZ ABSTRACT Galactic haloes in a Λ-Cold Dark Matter (ΛCDM) universe are predicted to host today a swarm of debris resulting from cannibalised dwarf galaxies that have been accreted via the process of hierarchical mass assembly. The chemo-dynamical information recorded in the Galactic stellar populations associated with such systems helps elucidate their nature, placing constraints on the mass assembly history of the Milky Way. Using data from the APOGEE and Gaia surveys, we examine APOGEE targets belonging to the following substructures in the stellar halo: Heracles, Gaia-Enceladus/Sausage (GES), Sagittarius dSph, the Helmi stream, Sequoia, Thamnos, Aleph, LMS-1, Arjuna, I’itoi, Nyx, Icarus, and Pontus. We examine the distributions of all substructures in chemical space, considering the abundances of elements sampling various nucleosynthetic pathways. Our main findings include: i) the chemical properties of GES, Heracles, the Helmi stream, Sequoia, Thamnos, LMS-1, Arjuna, and I’itoi match qualitatively those of dwarf satellites of the Milky Way, such as the Sagittarius dSph; ii) the abundance pattern of the recently discovered inner Galaxy substructure Heracles differs statistically from that of populations formed in situ. Heracles also differs chemically from all other substructures; iii) the abundance patterns of Sequoia (selected in various ways), Arjuna, LMS-1, and I’itoi are indistinguishable from that of GES, indicating a possible common origin; iv) the abundance patterns of the Helmi stream and Thamnos substructures are different from all other halo substructures; v) the chemical properties of Nyx and Aleph are very similar to those of disc stars, implying that these substructures likely have an in situ origin. Key words: Galaxy: general; Galaxy: formation; Galaxy: evolution; Galaxy: halo; Galaxy: abundances; Galaxy: kinematics and dynamics 1 INTRODUCTION "How did the Milky Way form?" is likely the most fundamental ques- tion facing the field of Galactic archaeology. When posed in a cosmo- logical context, the Λ-CDM model predicts that the Galaxy formed in great measure via the process of hierarchical mass assembly. In this scenario, nearby satellite galaxies are consumed by the Milky Way due to them being attracted to its deeper gravitational potential, and as a result merge with the Galaxy. In such cases, these merger events shape the formation and evolution of the Milky Way. Therefore, an understanding of the assembly history of the Milky Way in the context of Λ-CDM depends critically on the determination of the properties of the systems accreted during the Galaxy’s history, including their masses and chemical compositions. Moreover, the merger history of ★ E-mail: [email protected] the Galaxy has a direct impact on its resulting stellar populations at present time, and plays a vital role in shaping its components. Since the seminal work by Searle & Zinn (1978), many studies have aimed at characterising the stellar populations of the Milky Way, linking them to either an "in situ" or accreted origin. Although detection of substructure in phase space has worked extremely well for the identification of on-going and/or recent accretion events (e.g. Sagittarius dSph, Ibata et al. 1994; Helmi stream, Helmi et al. 1999), the identification of accretion events early in the life of the Milky Way has proven difficult due to phase-mixing. A possible solution to this conundrum resides in the use of additional information, typically in the form of detailed chemistry and/or ages (e.g., Nissen & Schuster 2010; Hawkins et al. 2015; Hayes et al. 2018; Haywood et al. 2018; Mackereth et al. 2019; Das et al. 2020; Montalbán et al. 2020; Horta et al. 2021a; Hasselquist et al. 2021; Buder et al. 2022; Carrillo et al. 2022). The advent of large spectroscopic surveys such as APOGEE © 2021 The Authors arXiv:2204.04233v1 [astro-ph.GA] 8 Apr 2022
-
Upload
khangminh22 -
Category
Documents
-
view
0 -
download
0
Transcript of The chemical characterisation of halo substructure in the Milky ...

MNRAS 000 1mdash-33 (2021) Preprint 12 April 2022 Compiled using MNRAS LATEX style file v30
The chemical characterisation of halo substructure in the Milky Waybased on APOGEE
Danny Horta12 Ricardo P Schiavon1 J Ted Mackereth34 David H Weinberg5Sten Hasselquist6 Diane Feuillet7 Robert W OrsquoConnell8 Borja Anguiano8Carlos Allende-Prieto910 Rachael L Beaton11 Dmitry Bizyaev12 Katia Cunha1314Doug Geisler151617 D A Garciacutea-Hernaacutendez910 Jon Holtzman12 Henrik Joumlnsson18Richard R Lane19 Steve R Majewski8 Szabolcs Meacuteszaacuteros2021 Dante Minniti2223Christian Nitschelm24 Matthew Shetrone25 Verne V Smith26 Gail Zasowski27Affiliations are listed at the end of the paper
Accepted XXX Received YYY in original form ZZZ
ABSTRACTGalactic haloes in a Λ-Cold Dark Matter (ΛCDM) universe are predicted to host today a swarmof debris resulting from cannibalised dwarf galaxies that have been accreted via the process ofhierarchical mass assembly The chemo-dynamical information recorded in the Galactic stellarpopulations associated with such systems helps elucidate their nature placing constraints on themass assembly history of the Milky Way Using data from the APOGEE and Gaia surveys weexamine APOGEE targets belonging to the following substructures in the stellar halo HeraclesGaia-EnceladusSausage (GES) Sagittarius dSph the Helmi stream Sequoia Thamnos AlephLMS-1 Arjuna Irsquoitoi Nyx Icarus and Pontus We examine the distributions of all substructuresin chemical space considering the abundances of elements sampling various nucleosyntheticpathways Our main findings include i) the chemical properties of GES Heracles the Helmistream Sequoia Thamnos LMS-1 Arjuna and Irsquoitoi match qualitatively those of dwarf satellitesof theMilkyWay such as the Sagittarius dSph ii) the abundance pattern of the recently discoveredinner Galaxy substructure Heracles differs statistically from that of populations formed in situHeracles also differs chemically from all other substructures iii) the abundance patterns ofSequoia (selected in various ways) Arjuna LMS-1 and Irsquoitoi are indistinguishable from that ofGES indicating a possible common origin iv) the abundance patterns of the Helmi stream andThamnos substructures are different from all other halo substructures v) the chemical propertiesof Nyx and Aleph are very similar to those of disc stars implying that these substructures likelyhave an in situ origin
Key words Galaxy general Galaxy formation Galaxy evolution Galaxy halo Galaxyabundances Galaxy kinematics and dynamics
1 INTRODUCTION
How did the MilkyWay form is likely the most fundamental ques-tion facing the field of Galactic archaeology When posed in a cosmo-logical context theΛ-CDMmodel predicts that the Galaxy formed ingreat measure via the process of hierarchical mass assembly In thisscenario nearby satellite galaxies are consumed by the Milky Waydue to them being attracted to its deeper gravitational potential andas a result merge with the Galaxy In such cases these merger eventsshape the formation and evolution of the Milky Way Therefore anunderstanding of the assembly history of theMilkyWay in the contextof Λ-CDM depends critically on the determination of the propertiesof the systems accreted during the Galaxyrsquos history including theirmasses and chemical compositions Moreover the merger history of
E-mail DHortaDarrington2018ljmuacuk
the Galaxy has a direct impact on its resulting stellar populations atpresent time and plays a vital role in shaping its components
Since the seminal work by Searle amp Zinn (1978) many studieshave aimed at characterising the stellar populations of the MilkyWay linking them to either an in situ or accreted origin Althoughdetection of substructure in phase space has worked extremely wellfor the identification of on-going andor recent accretion events (egSagittarius dSph Ibata et al 1994 Helmi stream Helmi et al 1999)the identification of accretion events early in the life of theMilkyWayhas proven difficult due to phase-mixing A possible solution to thisconundrum resides in the use of additional information typically inthe form of detailed chemistry andor ages (eg Nissen amp Schuster2010 Hawkins et al 2015 Hayes et al 2018 Haywood et al 2018Mackereth et al 2019 Das et al 2020 Montalbaacuten et al 2020 Hortaet al 2021a Hasselquist et al 2021 Buder et al 2022 Carrillo et al2022)
The advent of large spectroscopic surveys such as APOGEE
copy 2021 The Authors
arX
iv2
204
0423
3v1
[as
tro-
phG
A]
8 A
pr 2
022
2 D Horta et al
(Majewski et al 2017) GALAH (De Silva et al 2015) SEGUE(Yanny et al 2009a) RAVE (Steinmetz et al 2020) LAMOST (Zhaoet al 2012) H3 (Conroy et al 2019) amongst others in combinationwith the outstanding astrometric data supplied by the Gaia satellite(Gaia Collaboration et al 2018 2020a) revolutionised the field ofGalactic archaeology shedding new light into the mass assemblyhistory of the Galaxy
The core of the Sagittarius dSph system and its still formingtidal stream (Ibata et al 1994) have long served as an archetype fordwarf galaxy mergers in the Milky Way Moreover in the past fewyears several phase-space substructures have been identified in thefield of the Galactic stellar halo that are believed to be the debrisof satellite accretion events including the Gaia-EnceladusSausage(GES Helmi et al 2018 Belokurov et al 2018 Haywood et al 2018Mackereth et al 2019) Heracles (Horta et al 2021a) Sequoia (Barbaacuteet al 2019 Matsuno et al 2019 Myeong et al 2019) Thamnos 1 and2 (Koppelman et al 2019a) Nyx (Necib et al 2020) the substructuresidentified using the H3 survey namely Aleph Arjuna Irsquoitoi (Naiduet al 2020) LMS-1 (Yuan et al 2020)1 Icarus (Re Fiorentin et al2021) Cetus (Newberg et al 2009) and Pontus (Malhan et al 2022)While the identification of these substructures is helping constrainour understanding of the mass assembly history of the Milky Waytheir association with any particular accretion event still needs to beclarified Along those lines predictions from numerical simulationssuggest that a single accretion event can lead to multiple substructuresin phase space (eg Jean-Baptiste et al 2017Koppelman et al 2020)Therefore in order to ascertain the reality andor distinction of theseaccretion events one must combine phase-space information withdetailed chemical compositions for large samples
Recent work modelling the stellar halo suggests that accretedpopulations constitute over two thirds of all of the halo stellar masswithin sim25 kpc from the Galactic centre (eg Mackereth amp Bovy2020) of which approximately 30-50 (sim3times108M) is associatedwithGES This result is in agreement with recent work byNaidu et al(2020) which find that gt 65 of stellar halo populations in the innersim20 kpc have an accreted origin with the majority being from theGES progenitor Other studies have estimated an even higher stellarmass to this accretion event (namely sim05-2 times 109M) suggestingthat most (if not all) of the mass of the inner sim20 kpc of the Galacticstellar halo is comprised of a single accretion event (eg Helmi et al2018 Vincenzo et al 2019 Das et al 2020) Another importantsource of halo stellar mass not accounted for in previous studiesis Heracles whose progenitor mass was estimated by Horta et al(2021a) to be of the order of sim5times108M
The combined estimated mass from accreted populations withinsim20kpc when added to the estimated mass from dissolved andorevaporated globular clusters (GCs namely sim1-2times108M Schiavonet al 2017 Horta et al 2021b) outweighs earlier estimates of themass of the Galactic stellar halo namely sim4-7times108M (see Bland-Hawthorn amp Gerhard 2016 and references therein) When comparedto more recent estimates the sum of the mass arising from accretedpopulations and dissolved andor evaporated globular clusters yieldsa total mass that is approximately equivalent to the total estimatedmass of the stellar halo namely sim1-13times109M (eg Deason et al2019 Mackereth amp Bovy 2020) therefore suggesting a very smallcontribution from in situ halo populations at low [FeH]
Aside from assessing the mass contributed from accreted halopopulations understanding the chemo-dynamical properties of eachsubstructure enables the characterisation of each accretion event Bycomparing the chemo-dynamical properties of each substructure with119894119899 119904119894119905119906 populations it is possible to infer properties of the debrisrsquo pro-genitor helping shed light into theGalaxyrsquos past life and environmentThe properties of these disrupted satellite galaxies also provide a win-
1 This structure also goes by the name of Wukong (Naidu et al 2020)
dow for near-field cosmology and the study of lower-mass galaxiesin unrivalled detail
In this work we set out to combine the latest data releases fromthe APOGEE and Gaia surveys in order to dynamically determineand chemically characterise previously identified halo substructuresin the MilkyWay We attempt where possible to define the halo sub-structures using kinematic information only so that the distributionsof stellar populations in various chemical planes can be studied inan unbiased fashion This allows us to understand in more detail thereality and nature of these identified halo substructures as chemicalabundances encode more pristine fossilised records of the formationenvironment of stellar populations in the Galaxy
The paper is organised as follows Section 2 presents our selec-tion of the parent sample used in this work Section 21 includes adetailed description of how we identified the halo substructures InSection 3 we discuss the resulting orbital distributions of the iden-tified structures in the orbital energy and angular momentum planeSection 4 presents an in-depth chemical analysis of the identifiedhalo substructures in different chemical abundance planes where weshow the 120572 elements in Section 41 the iron-peak elements in Sec-tion 42 the odd-Z elements in Section 43 the carbon and nitrogenabundances in Section 44 a neutron capture element (namely Ce)in Section 45 and the [MgMn]-[AlFe] chemical composition planein Section 46 The chemical abundances for each halo substructureare then quantitatively compared in Section 5 We then discuss ourresults in the context of previous work in Section 6 and finalise thiswork by presenting our conclusions in Section 7
2 DATA AND SAMPLE
This paper combines the latest data release (DR17 Abdurrorsquouf et al2021) of the SDSS-IIIIV (Eisenstein et al 2011 Blanton et al 2017)and APOGEE survey (Majewski et al 2017) with distances and as-trometry determined from the early third data release from the Gaiasurvey (EDR3 Gaia Collaboration et al 2020b) The celestial coordi-nates and radial velocities supplied by APOGEE (Nidever et al 2015Holtzman et al in prep) when combined with the proper motions andinferred distances (LeungampBovy 2019b) based onGaia data providecomplete 6-D phase space information for approximately sim730000stars in the Milky Way for most of which exquisite abundances forup to sim20 different elements have been determined
All data supplied by APOGEE are based on observations col-lected by (almost) twin high-resolution multi-fibre spectrographs(Wilson et al 2019) attached to the 25m Sloan telescope at ApachePoint Observatory (Gunn et al 2006) and the du Pont 25 m tele-scope at Las Campanas Observatory (Bowen amp Vaughan 1973) El-emental abundances are derived from automatic analysis of stellarspectra using the ASPCAP pipeline (Garciacutea Peacuterez et al 2016) basedon the FERRE2 code (Allende Prieto et al 2006) and the line listsfrom Cunha et al (2017) and Smith et al (2021) The spectra them-selves were reduced by a customized pipeline (Nidever et al 2015)For details on target selection criteria see Zasowski et al (2013) forAPOGEEandZasowski et al (2017) forAPOGEE-2 andBeaton et al(2021) for APOGEE north and Santana et al (2021) for APOGEEsouth
We make use of the distances for the APOGEE DR17 cataloguegenerated by LeungampBovy (2019a) using the astroNN python pack-age (for a full description see LeungampBovy 2019b) These distancesare determined using a re-trained astroNN neural-network softwarewhich predicts stellar luminosity from spectra using a training setcomprised of stars with both APOGEEDR17 spectra andGaia EDR3parallax measurements (Gaia Collaboration et al 2020b) The model
2 githubcomcallendeprietoferre
MNRAS 000 1mdash-33 (2021)
Substructure in the Galactic stellar halo 3
is able to simultaneously predict distances and account for the paral-lax offset present in Gaia-EDR3 producing high precision accuratedistance estimates for APOGEE stars which match well with externalcatalogues (Hogg et al 2019) and standard candles like red clumpstars (Bovy et al 2014) We note that the systematic bias in distancemeasurements at large distances for APOGEE DR16 as described inBovy et al (2019) have been reduced drastically in APOGEE DR17Therefore we are confident that this bias will not lead to unforeseenissues during the calculation of the orbital parameters Our samplesare contained within a distance range of sim20 kpc and have a mean119889err119889 sim013 (except for the Sagittarius dSph which extends up tosim30 kpc and has a mean 119889err119889 sim016)
We use the 6-D phase space information3 and convert betweenastrometric parameters and Galactocentric cylindrical coordinatesassuming a solar velocity combining the proper motion from Sgr Alowast(ReidampBrunthaler 2020) with the determination of the local standardof rest of Schoumlnrich et al (2010) This adjustment leads to a 3Dvelocity of the Sun equal to [U V W] = [ndash111 2480 85]km sminus1 We assume the distance between the Sun and the GalacticCentre to be R0 = 8178 kpc (Gravity Collaboration et al 2019)and the vertical height of the Sun above the midplane 1199110 = 002 kpc(Bennett amp Bovy 2019) Orbital parameters were then determinedusing the publicly available code galpy4 (Bovy 2015 Mackerethamp Bovy 2018) adopting a McMillan (2017) potential and using theStaumlckel approximation of Binney (2012)
The parent sample employed in this work is comprised of starsthat satisfy the following selection criteria
bull APOGEE-determined atmospheric parameters 3500 lt Teff lt
5500 K and log 119892 lt 36bull APOGEE spectral SN gt 70bull APOGEE STARFLAG = 0bull astroNN distance accuracy of 119889err119889 lt 02
where 119889 and 119889err are heliocentric distance and its uncertainty re-spectively The SN criterion was implemented to maximise the qual-ity of the elemental abundances The Teff and log 119892 criteria aimed tominimise systematic effects at highlow temperatures and tominimisecontamination by dwarf stars We also removed stars with STARFLAGflags set in order to not include any stars with issues in their stellarparameters A further 7750 globular cluster stars were also removedfrom consideration using the APOGEE Value Added Catalogue ofglobular cluster candidate members from Schiavon et al (2022 inprep) (building on the method from Horta et al 2020 using pri-marily radial velocity and proper motion information) Finally starsbelonging to the Large and Small Magellanic clouds were also ex-cluded using the sample from Hasselquist et al (2021) (removing3748 and 1002 stars respectively) The resulting parent sample con-tains 199077 stars
In the following subsection we describe the motivation behindthe selection criteria employed to select each substructure in the stellarhalo of the Milky Way The criteria are largely built on selectionsemployed in previous works and are summarised in Table 1 and inFigure 1
21 Identification of substructures in the stellar halo
We now describe the method employed for identifying known sub-structures in the stellar halo of the Milky Way We set out to selectstar members belonging to the various halo substructures
We strive to identify substructures in the stellar halo by employ-ing solely orbital parameter and phase-space information where pos-
3 The positions proper motions and distances are takenderived from GaiaEDR3 data whilst the radial velocities are taken from APOGEE DR174 httpsdocsgalpyorgenv160
sible with the aim of obtaining star candidates for each substructurepopulation that are unbiased by any chemical composition selection
We take a handcrafted approach and select substructures basedon simple and reproducible selection criteria that are physically mo-tivated by the data andor are used in previous works instead ofresorting to clustering software algorithms which we find clusterthe 119899-dimensional space into too many fragments In the followingsubsections we describe the selection procedure for identifying eachsubstructure independently
We note that our samples for the various substructures are de-fined by a strict application to the APOGEE survey data of the criteriadefined by other groups often on the basis of different data sets Thelatter were per force collected as part of a different observational ef-fort based on specific target selection criteria It is not immediatelyclear whether or how differences between the APOGEE selectionfunction and those of other catalogues may imprint dissimilaritiesbetween our samples and those of the original studies We never-theless do not expect such effects to influence our conclusions in animportant way
211 Sagittarius
Since its discovery (Ibata et al 1994) many studies have sought tocharacterise the nature of the Sagittarius dwarf spheroidal (hereafterSgr dSph eg Ibata et al 2001 Majewski et al 2003 Johnston et al2005 Belokurov et al 2006 Yanny et al 2009b Koposov et al 2012Carlin et al 2018 Vasiliev amp Belokurov 2020) as well as interpretits effect on the Galaxy using numerical simulations (eg Johnstonet al 1995 Ibata et al 1997 Law et al 2005 Law amp Majewski2010 Purcell et al 2011 Goacutemez et al 2013) More recently theSgr dSph has been the subject of comprehensive studies on the basisof APOGEE data This has enabled a detailed examination of itschemical compositions both in the satellitersquos core and in its tidal tails(eg Hasselquist et al 2017 2019 Hayes et al 2020) Moreoverin a more recent study Hasselquist et al (2021) adopted chemicalevolution models to infer the history of star formation and chemicalevolution of the Sgr dSph Therefore in this paper the Sgr dSph isconsidered simply as a template massive satellite whose chemicalproperties can be contrasted to those of the halo substructures thatare the focus of our study
While it is possible to select high confidence Sgr dSph starcandidates using Galactocentric positions and velocities (Majewskiet al 2003) Hayes et al (2020) showed it is possible to make an evenmore careful selection by considering the motion of stars in a well-defined Sgr orbital plane We identify Sgr star members by followingthe method from Hayes et al (2020) Although the method is fullydescribed in their work we summarise the key steps for clarity andcompleteness We take the Galactocentric positions and velocities ofstars in our parent sample and rotate them into the Sgr orbital planeaccording to the transformations described in Majewski et al (2003)This yields a set of position and velocity coordinates relative to theSgr orbital plane but still centered on the Galactic Centre As pointedout in Hayes et al (2020) Sgr star members should stand out withrespect to other halo populations in different Sgr orbital planes Usingthis orbital plane transformation we select from the parent sampleSgr star members if they satisfy the following selection criteria
bull |120573GC| lt 30 ()bull 18 lt L119911Sgr lt 14 (times103 kpc kmsminus1)bull ndash150 lt V119911Sgr lt 80 (kmsminus1)bull XSgr gt 0 or XSgr lt ndash15 (kpc)bull YSgr gt ndash5 (kpc) or YSgr lt ndash20 (kpc)bull ZSgr gt ndash10 (kpc)bull pm120572 gt ndash4 (mas)bull 119889 gt 10 (kpc)
where 120573GC is the angle subtended between the Galactic Centre and
MNRAS 000 1mdash-33 (2021)
4 D Horta et al
Figure 1 Distribution of the identifed substructures in the Kiel diagram The parent sample is plotted as a 2D histogram where whiteblack signifies highlowdensity regions The coloured markers illustrate the different halo substructures studied in this work For the bottom right panel green points correspond to Pontusstars whereas the purple point is associated with Icarus Additionally in the Aleph and Nyx panels we also highlight with purple edges those stars that overlapbetween the APOGEE DR17 sample and the samples determined in Naidu et al (2020) and Necib et al (2020) respectively for these halo substructures
the Sgr dSph LzSgr is the azimuthal component of the angular mo-mentum in the Sgr plane VzSgr is the vertical component of thevelocity in the Sgr plane (XSgr YSgr ZSgr) are the cartesian coor-dinates centred on the Sgr dSph plane pm120572 is the right-ascensionproper motion and 119889 is the heliocentric distance which for Sgrhas been shown to be sim 23 kpc (Vasiliev amp Belokurov 2020) Ourselection yields a sample of 266 Sgr star members illustrated in theLzSgr vs VzSgr plane in Fig 2
212 Heracles
Heracles is a recently discovered metal-poor substructure located inthe heart of the Galaxy (Horta et al 2021a) It is characterised by starson eccentric and low energy orbits Due to its position in the inner fewkpc of the Galaxy it is highly obscured by dust extinction and vastlyoutnumbered by its more abundant metal-rich (in situ) co-spatialcounterpart populations Only with the aid of chemical compositionshas it been possible to unveil this metal-poor substructure which isdiscernible in the [MgMn]-[AlFe] plane It is important at this stagethat we mention a couple of recent studies which based chiefly onthe properties of the Galactic globular cluster system proposed theoccurrence of an early accretion event whose remnants should havesimilar properties to those of Heracles (named Kraken and Koalaby Kruijssen et al 2020 Forbes 2020 respectively) In the absenceof a detailed comparison of the dynamical properties and detailedchemical compositions of Heracles with these putative systems adefinitive association is impossible at the current time
In this work we define Heracles candidate star members follow-ing the work by Horta et al (2021a) and select stars from our parentsample that satisfy the following selection criteria
minus5000 0 5000 10000Lzsgr
minus300
minus200
minus100
0
100
200
300
v zs
gr
Sagittarius dSph
100
101
102
Nst
ars
Figure 2 Parent sample used in this work in the LzSgr vs VzSgr plane (seeSection 211 for details) Here Sgr stars clearly depart from the parent sampleand are easily distinguishable by applying the selection criteria from Hayeset al (2020) demarked in this illustration by the orange markers
bull 119890 gt 06bull ndash26 lt E lt ndash2 (times105 km2sminus2)bull [AlFe] lt ndash007 amp [MgMn] gt 025bull [AlFe] gt ndash007 amp [MgMn] gt 425times[AlFe] + 05475
Moreover we impose a [FeH] gt ndash17 cut to select Heracles candidatestar members in order to select stars from our parent sample that have
MNRAS 000 1mdash-33 (2021)
Substructure in the Galactic stellar halo 5
reliable Mn abundances in APOGEE DR17 Our selection yields aresulting sample of 300 Heracles star members
213 Gaia-EnceladusSausage
Recent studies have shown that there is an abundant population of starsin the nearby stellar halo (namely RGC 20-25 kpc) belonging to theremnant of an accretion event dubbed the 119866119886119894119886-EnceladusSausage(GES eg Belokurov et al 2018 Haywood et al 2018 Helmi et al2018 Mackereth et al 2019) This population is characterised bystars on highly radialeccentric orbits which also appear to follow alower distribution in the 120572-Fe plane presenting lower [120572Fe] valuesfor fixed metallicity than 119894119899 119904119894119905119906 populations
For this paper we select GES candidate star members by em-ploying a set of orbital information cuts Specifically GES memberswere selected adopting the following criteria
bull |L119911 | lt 05 (times103 kpc kmminus1)bull ndash16 lt E lt ndash11 (times105 km2sminus2)
This selection is employed in order to select the clump that becomesapparent in the E-L119911 plane at higher orbital energies and roughlyL119911 sim 0 (see Fig 4) and to minimise the contamination from high-120572 disc stars on eccentric orbits (namely the Splash Bonaca et al2017 Belokurov et al 2020) which sit approximately at Esimndash18times105km2sminus2 (see Kisku et al in prep) The angular momentum restrictionensures we are not including stars onmore prograderetrograde orbitsWe find that by selecting the GES substructure in this manner weobtain a sample of starswith highly radial (J119877 sim1x103 kpc kmsminus1) andtherefore highly eccentric (119890sim09) orbits in agreement with selectionsemployed in previous studies to identify this halo substructure (egMackerethampBovy 2020 Naidu et al 2020 Feuillet et al 2021 Buderet al 2022) The final GES sample is comprised of 2353 stars
We note that in a recent paper Hasselquist et al (2021) under-took a thorough investigation into the chemical properties of this halosubstructure and compared it to other massive satellites of the MilkyWay (namely the Magellanic Clouds Sagittarius dSph and Fornax)Although their selection criteria differs slightly from the one em-ployed in this study we find that their sample is largely similar to theone employed here as both studies employed APOGEE DR17 data
214 Retrograde halo Sequoia Thamnos Arjuna and IrsquoItoi
A number of substructures have been identified in the retrograde haloThe first to be discovered was Sequoia (Barbaacute et al 2019 Matsunoet al 2019 Myeong et al 2019) which was suggested to be the rem-nant of an accreted dwarf galaxy The Sequoia was identified giventhe retrograde nature of the orbits of its stars which appear to forman arch in the retrograde wing of the Toomre diagram Separatelyan interesting study by Koppelman et al (2019a) showed that theretrograde halo can be further divided into two components sepa-rated by their orbital energy values in the E-L119911 plane They suggestthat the high energy component corresponds to Sequoia whilst thelower energy populationwould be linked to a separate accretion eventdubbed Thamnos In addition Naidu et al (2020) proposed the exis-tence of additional retrograde substructure overlapping with Sequoiacharacterised by different metallicities which they named Arjuna andIrsquoItoi
As the aim of this paper is to perform a comprehensive studyof the chemical abundances of substructures identified in the halowe utilise all the selection methods used in prior work and select thesame postulated substructures in multiple ways in order to comparetheir abundances later Specifically we build on previous works (egMyeong et al 2019 Koppelman et al 2019a Naidu et al 2020)that have aimed to characterise the retrograde halo and select thesubstructures following a similar selection criteria
For reference throughout this work we will refer to the differ-ent selection criteria of substructures in the retrograde halo as theGC field and H3 selections in reference to the methodsurveyemployed to determine the Sequoia substructure in Myeong et al(2019) Koppelman et al (2019c) and Naidu et al (2020) respec-tively We will now go through the details of each selection methodindependently
TheGCmethod (used inMyeong et al 2019) selects Sequoia starcandidates by identifying stars that satisfy the following conditions
bull E gt ndash15 (times105 km2sminus2)bull J120601 Jtot lt ndash05bull J(JzminusJR) Jtot lt01
Here J120601 J119877 and J119911 are the azimuthal radial and vertical actionsand Jtot is the quadrature sum of those components This selectionyields a total of 116 Sequoia star candidates
The field method (used in Koppelman et al 2019c) identifiesSequoia star members based on the following selection criteria
bull 04 lt [ lt 065bull ndash135 lt E lt ndash1 (times105 km2sminus2)bull L119911 lt 0 (kpc kmsminus1)
where [ is the circularity and is defined as [ =radic1 minus 1198902 (Wetzel 2011)
These selection criteria yield a total of 95 Sequoia starsLastly we select the Sequoia based on the H3 selection criteria
(used in Naidu et al 2020) as follows
bull [ gt 015bull E gt ndash16 (times105 km2sminus2)bull L119911 lt ndash07 (103 kpc kmsminus1)
This selection produces a preliminary sample comprised of 236 Se-quoia stars However we note that Naidu et al (2020) use this se-lection to define not only Sequoia but all the substructures in thehigh-energy retrograde halo (including the Arjuna and Irsquoitoi sub-structures) In order to distinguish Sequoia Irsquoitoi and Arjuna Naiduet al (2020) suggest performing a metallicity cut motivated by theobserved peaks in the metallicity distribution function (MDF) of theirretrograde sample Thus we follow this procedure and further refineour Sequoia Arjuna and Irsquoitoi samples by requiring [FeH] gt ndash16cut for Arjuna ndash2 lt [FeH] lt ndash16 for Sequoia and [FeH] lt ndash2 forIrsquoitoi based on the distribution of our initial sample in the MDF (seeFig 3) This further division yields an H3 Sequoia sample comprisedof 65 stars an Arjuna sample constituted by 143 stars and an Irsquoitoisample comprised of 22 stars
Following our selection of substructures in the high-energy ret-rograde halowe set out to identify stars belonging to the intermediate-energy and retrograde Thamnos 1 and 2 substructures Koppelmanet al (2019c) state that Thamnos 1 and 2 are separate debris fromthe same progenitor galaxies For this work we consider Thamnos asone overall structure given the similarity noted by Koppelman et al(2019c) between the two smaller individual populations in chemistryand kinematic planes Stars from our parent sample were consid-ered as Thamnos candidate members if they satisfied the followingselection criteria
bull ndash18 lt E lt ndash16 (times105 km2sminus2)bull L119911 lt 0 (kpc kmsminus1)bull 119890 lt 07
These selection cuts are performed in order to select stars in our parentsample with intermediate orbital energies and retrograde orbits (seeFig 4 for the position of Thamnos in the E-L119911) motivated by thedistribution of the Thamnos substructure in the E-L119911 plane illustratedby Koppelman et al (2019c) This selection yields a Thamnos samplecomprised of 121 stars
MNRAS 000 1mdash-33 (2021)
6 D Horta et al
minus25 minus20 minus15 minus10 minus05 00[FeH]
0
5
10
15
20
25
30
35N
star
sArjunaSequoiaIrsquoItoi
Figure 3Metallicity distribution function of the high-energy retrograde sam-ple determined using the selection criteria from Naidu et al (2020) Thedashed black vertical lines define the division of this sample used by Naiduet al (2020) to divide the three high-energy retrograde substructures ArjunaSequoia and Irsquoitoi This MDF dissection is based both on the values used inNaidu et al (2020) and the distinguishable peaks in this plane (we do not usea replica value of the [FeH] used in Naidu et al (2020) in order to accountfor any possible metallicity offsets between the APOGEE and H3 surveys)
215 Helmi stream
The Helmi stream was initially identified as a substructure in or-bital space due to its high Vz velocities (Helmi et al 1999) Morerecent work by Koppelman et al (2019b) characterised the Helmistream in Gaia DR2 and found that this stellar population is bestdefined by adopting a combination of cuts in different angular mo-mentum planes Specifically by picking stellar halo stars based on theazimuthal component of the angular momentum (L119911) and its perpen-dicular counterpart (Lperp =
radicL2119909 + L2119910) the authors were able to select
a better defined sample of Helmi stream star candidates We build onthe selection criteria from Koppelman et al (2019b) and define ourHelmi stream sample by including stars from our parent populationthat satisfy the following selection criteria
bull 075 lt L119911 lt 17 (times103 kpc kmsminus1)bull 16 lt Lperp lt 32 (times103 kpc kmsminus1)
Our final sample is comprised of 85Helmi stream starsmembers
216 Aleph
Aleph is a newly discovered substructure presented in a detailed studyof theGalactic stellar halo byNaidu et al (2020) on the basis of theH3survey (Conroy et al 2019) It was initially identified as a sequencebelow the high 120572-disc in the 120572-Fe plane It is comprised by stars onvery circular prograde orbits For this paper we follow the methoddescribed in Naidu et al (2020) and define Aleph star candidates asany star in our parent sample which satisfies the following selectioncriteria
bull 175 lt V120601 lt 300 (kmsminus1)bull |V119877 | lt 75 (kmsminus1)bull [FeH] gt ndash08bull [MgFe] lt 027
where V120601 and V119877 are the azimuthal and radial components of thevelocity vector (in Galactocentric cylindrical coordinates) and weuse Mg as our 120572 tracer element The selection criteria yield a samplecomprised of 128578 stars We find that the initial selection criteriadetermine a preliminary Aleph sample that is dominated by in situ
disc stars likely obtained due to the prograde nature of the velocitycuts employed as well as the chemical cuts Thus in order to removedisc contamination and select 119905119903119906119890 Aleph star members we employtwo further cuts in vertical height above the plane (namely |119911| gt 3kpc) and in vertical action (ie 170 lt J119911 lt 210 kpc kmsminus1) whichare motivated by the distribution of Aleph in these coordinates (seeSection 322 from Naidu et al 2020) We also note that the verticalheight cut was employed in order to mimic the H3 survey selectionfunction After including these two further cuts we obtain a finalsample of Aleph stars comprised of 28 star members
217 LMS-1
LMS-1 is a newly identified substructure discovered by Yuan et al(2020) It is characterised bymetal poor stars that form an overdensityat the foot of the omnipresent GES in the E-L119911 plane This substruc-ture was later also studied by Naidu et al (2020) who referred to itas Wukong We identify stars belonging to this substructure adoptinga similar selection as Naidu et al (2020) however adopting differentorbital energy criteria to adjust for the fact that we adopt theMcMillan(2017) Galactic potential (see Fig 23 from Appendix B in that study)Stars from our parent sample were deemed LMS-1 members if theysatisfied the following selection criteria
bull 02 lt L119911 lt 1 (times103 kpc kmsminus1)bull ndash17 lt E lt ndash12 (times105 kmminus2sminus2)bull [FeH] lt ndash145bull 04 lt 119890 lt 07bull |119911| gt 3 (kpc)
We note that the 119890 and 119911 cuts were added to the selection criteria listedby Naidu et al (2020) This is because we conjectured that insteadof eliminating GES star members from our selection (as Naidu et al(2020) do) it is more natural in principle to find additional criteriathat distinguishes these two overlapping substructures Thuswe selectstars on less eccentric orbits than those belonging to GES but stillmore eccentric than most of the Galactic disc (ie 04 lt 119890 lt 07)Furthermore in order to ensure we are observing stars at the samedistances above the Galactic plane as in Naidu et al (2020) (definedby the selection function of the H3 survey) we add a vertical heightcut of |119911| gt 3 (kpc) Our selection identifies 31 stars belonging to theLMS-1 substructure
218 Nyx
Nyx has recently been put forward by Necib et al (2020) who iden-tified a stellar stream in the solar neighbourhood that they suggestto be the remnant of an accreted dwarf galaxy (Necib et al 2020)Similar to Aleph it is characterised by stars on very prograde orbitsat relatively small mid-plane distances (|Z| lt 2 kpc) and close to thesolar neighbourhood (ie |Y| lt 2 kpc and |X| lt 3 kpc) The Nyxstructure is also particularly metal-rich (ie [FeH] sim ndash05) Basedon the selection criteria used in Necib et al (2020) we select Nyxstar candidates employing the following selection criteria
bull 110 lt V119877 lt 205 (kmsminus1)bull 90 lt V120601 lt 195 (kmsminus1)bull |X| lt 3 (kpc) |Y| lt 2 (kpc) |Z| lt 2 (kpc)
The above selection criteria yield a sample comprising of 589 Nyxstars
219 Icarus
Icarus is a substructure identified in the solar vicinity comprised bystars that are significantly metal-poor ([FeH] sim ndash145) with circular(disc-like) orbits (Re Fiorentin et al 2021) In this work we selectIcarus star members using the mean values reported by those authors
MNRAS 000 1mdash-33 (2021)
Substructure in the Galactic stellar halo 7
and adopting a two sigma uncertainty cut around the mean Theselection used is listed as follows
bull [FeH] lt ndash105bull [MgFe] lt 02bull 154 lt L119911 lt 221 (times103 kpc kmsminus1)bull Lperp lt 450 (kpc kmsminus1)bull 119890 lt 02bull 119911max lt 15 (kpc)
These selection criteria yield an Icarus sample comprised of onestar As we have only been able to identify one star associated withthis substructure we remove it from the main body of this work andfocus on discerning why our selection method only identifies 1 starin Appendix A Furthermore we combine the one Icarus star foundin APOGEE DR17 with 41 stars found by Re Fiorentin et al (2021)in APOGEE DR16 in order to study the nature of this substructurein further detail Our results are discussed in Appendix A
2110 Pontus
Pontus is a halo substructure recently proposed by Malhan et al(2022) on the basis of an analysis of Gaia EDR3 data for a largesample ofGalactic globular clusters and stellar streams These authorsidentified a large number of groupings in action space associatedwithknown substructures Malhan et al (2022) propose the existence of apreviously unknown susbtructure they call Pontus characterised byretrograde orbits and intermediate orbital energy Pontus is locatedjust below Gaia-EnceladusSausage in the E-Lz plane but displaysless radial orbits (Pontus has an average radial action of J119877sim500 kpckmsminus1 whereas Gaia-EnceladusSausage displays a mean value ofJ119877sim1250 kpc kmsminus1) In this work we utilise the values listed inSection 46 from Malhan et al (2022) to identify Pontus candidatemembers in our sampleWe note that because both that study and oursuse the McMillan (2017) potential to compute the IoM the orbitalenergy values will be on the same scale Our selection criteria forPontus are the following
bull ndash172 lt E lt ndash156 (times105 kmminus2sminus2)bull ndash470 lt L119911 lt 5 (times103 kpc kmsminus1)bull 245 lt J119877 lt 725 (kpc kmsminus1)bull 115 lt J119911 lt 545 (kpc kmsminus1)bull 390 lt Lperp lt 865 (kpc kmsminus1)bull 05 lt 119890 lt 08bull 1 lt 119877peri lt 3 (kpc)bull 8 lt 119877apo lt 13 (kpc)bull [FeH] lt ndash13
where 119877peri and 119877apo are the perigalacticon and apogalacticon radiirespectively Using these selection criteria we identify two Pontuscandidate members in our parent sample As two stars comprise asample too small to perform any statistical comparison we refrainfrom comparing the Pontus stars in the main body of this workInstead we display and discuss the chemistry of these two Pontusstars in Appendix B for completeness
2111 Cetus
As a closing remark we note that we attempted to identify candidatemembers belonging to the Cetus (Newberg et al 2009) stream Usingthe selection criteria defined in Table 3 from Malhan et al (2022)we found no stars associated with this halo substructure that satisfiedthe selection criteria of our parent sample This is likely due to acombination of two factors (i) Cetus is a diffuse stream orbitingat large heliocentric distances (119889amp30 kpc Newberg et al 2009)which APOGEE does not cover well (ii) it occupies a region of thesky around the southern polar cap where APOGEE does not havemany field pointings at approximately 119897sim143 and 119887simndash70 (Newberget al 2009)
3 KINEMATIC PROPERTIES
In this Section we present the resulting distributions of the identifiedhalo substructures in the orbital energy (E) versus the azimuthal com-ponent of the angular momentum (L119911) plane in Fig 4 The parent sam-ple is illustrated as a density distribution and the halo substructuresare shown using the same colour markers as in Fig 1 By constructioneach substructure occupies a different locus in this plane Howeverwe do notice some small overlap between some of the substructures(for example between GES and Sequoia or GES and LMS-1) giventheir similar selection criteria More specifically we find that Hera-cles dominates the low energy region (E lt ndash2times105 kmminus2sminus2) whereasall the other substructures are characterised by higher energies Asshown before (eg Koppelman et al 2019c Horta et al 2021a) wefind that GES occupies a locus at low L119911 and relatively high E whichcorresponds to very radialeccentric orbits We find the retrograderegion (ie L119911 lt 0 times103 kpc kmsminus1) to be dominated by Thamnosat intermediate energies (E sim ndash17times105 kmminus2sminus2) and by SequoiaArjuna and Irsquoitoi at higher energies (E gt ndash14times105 kmminus2sminus2) on theother hand in the prograde region (Lz gt 0 times103 kpc kmsminus1) wefind the LMS-1 and Helmi stream structures which occupy a locusat approximately E sim ndash15times105 kmminus2sminus2 and Lz sim 500 kpc kmsminus1and E sim ndash14times105 kmminus2sminus2 and Lz sim 1000 kpc kmsminus1 respectivelyFurthemore the loci occupied by the Aleph and Nyx substructuresclosely mimic the region defined by disc orbits Lastly sitting aboveall other structures we find the Sagittarius dSph which occupies aposition at high energies and spans a range of angular momentumbetween 0 lt Lz lt 2000 kpc kmsminus1
4 CHEMICAL COMPOSITIONS
In this Section we turn our attention to the main focus of this work achemical abundance study of substructures in the stellar halo of theMilky Way In this Section we seek to first characterise these sub-structures qualitatively in multiple chemical abundance planes thatprobe different nucleosynthetic pathways In Section 5 we then com-pare mean chemical compositions across various substructures in aquantitative fashion Our aim is to utilise the chemistry to further un-ravel the nature and properties of these halo substructures and in turnplace constraints on their star formation and chemical enrichment his-tories We also aim to compare their chemical properties with thosefrom in situ populations (see Fig 5 for howwe determine in situ popu-lations) By studying the halo substructures using different elementalspecies we aim to develop an understanding of their chemical evolu-tion contributed by different nucleostynthetic pathways contributedeither by core-collapse supernovae (SNII) supernovae type Ia (SNIa)andor Asymptotic Giant Stars (AGBs) Furthermore as our methodfor identifying these substructures relies mainly on phase space andorbital information our analysis is not affected by chemical composi-tion biases (except for the case of particular elements in the HeraclesAleph LMS-1 Arjuna Irsquoitoi and (H3) Sequoia sample)
Our results are presented as follows In Section 41 we presentthe distribution of the halo substructures in the 120572-Fe plane usingMg as our 120572 element tracer In Section 42 we show the distributionof these substructures in the Ni-Fe abundance plane which providesinsight into the chemical evolution of the iron-peak elements Section43 displays the distribution of the halo substructures in an odd-Z-Feplane where we use Al as our tracer element Furthermore we alsoshow the C andN abundance distributions in Section 44 the Ce abun-dances (namely an 119904-process neutron capture element) in Section 45and the distribution of the halo substructures in the [MgMn]-[AlFe]plane in Section 46 5 This last chemical composition plane is in-
5 For each chemical plane we impose a further set of cuts of XminusFEminusFLAG=0and [XFe]errorlt015 to ensure there are no unforeseen issues when determin-ing the abundances for these halo substructures in ASPCAP
MNRAS 000 1mdash-33 (2021)
8 D Horta et al
Name Selection criteria Nstars
Heracles 119890 gt 06 ndash26 lt E lt ndash2 (times105 km2sminus2) [AlFe] lt ndash007 amp [MgMn] gt 025[AlFe] gt ndash007 [MgMn] gt 425times[AlFe] + 05475 [FeH] gt ndash17
300
Gaia-EnceladusSausage |L119911 | lt 05 (times103 kpc km sminus1) ndash16 lt E lt ndash11 (times105 km2sminus2) 2353
Sagittarius |120573GC | lt 30 () 18 lt L119911Sgr lt 14 (times103 kpc kmsminus1) ndash150 lt V119911Sgr lt 80(kmsminus1) XSgr gt 0 (kpc) or XSgr ltndash15 0 (kpc) YSgr gt ndash5 (kpc) or YSgr lt ndash20(kpc) ZSgr gt ndash10 (kpc) pm120572 gt ndash4 (mas) 119889 gt 10 (kpc)
266
Helmi stream 075 lt L119911 lt 17 (times103 kpc kmsminus1) 16 lt Lperp lt 32 (times103 kpc kmsminus1) 85
(GC) Sequoia (Myeong et al 2019) E gt ndash15 (times105 km2sminus2) J120601 Jtotltndash05 J(J119911minusJ119877 ) Jtotlt01 116
(field) Sequoia (Koppelman et al 2019c) 04lt[lt065 ndash135ltEltndash1 (times105 km2sminus2) L119911lt0 (kpc kmsminus1) 95
(H3) Sequoia (Naidu et al 2020) [gt015 Egtndash16 (times105 km2sminus2) L119911ltndash07 (times103 kpc kmsminus1) ndash2 lt [FeH] ltndash16
65
Thamnos ndash18 lt E lt ndash16 (times105 km2sminus2) L119911 lt 0 (kpc kmsminus1) 119890 lt 07 121
Aleph 175 lt V120601 lt 300 (kmsminus1) |V119877 | lt 75 (kmsminus1) FeH gt ndash08 MgFe lt 027 |z|gt 3 (kpc) 170 lt J119911 lt 210 (kpc kmsminus1)
28
LMS-1 02 lt L119911 lt 1 (times103 kpc kmsminus1) ndash17 lt E lt ndash12 (times105 kmminus2sminus2) [FeH] ltndash145 04 lt 119890 lt 07 |119911| gt 3 (kpc)
31
Arjuna [ gt 015 E gt ndash16 (times105 km2sminus2) L119911 lt ndash07 (times103 kpc kmsminus1) [FeH] gt ndash16 143
Irsquoitoi [ gt 015 E gt ndash16 (times105 km2sminus2) L119911 lt ndash07 (times103 kpc kmsminus1) [FeH] lt ndash2 22
Nyx 110 lt V119877 lt 205 (kmsminus1) 90 V120601 lt 195 (kmsminus1) |X| lt 3 (kpc) |Y| lt 2 (kpc)|Z| lt 2 (kpc)
589
Icarus [FeH] lt ndash145 [MgFe] lt 02 154 lt L119911 lt 221 (times103 kpc kmsminus1) Lperp lt450 (kpc kmsminus1) 119890 lt 02 119911max lt 15
1
Pontus ndash172 lt E lt ndash156 (times105 kmminus2sminus2) ndash470 lt L119911 lt 5 (times103 kpc kmsminus1) 245lt J119877 lt 725 (kpc kmsminus1) 115 lt J119911 lt 545 (kpc kmsminus1) 390 lt Lperp lt 865 (kpckmsminus1) 05 lt 119890 lt 08 1 lt 119877peri lt 3 (kpc) 8 lt 119877apo lt 13 (kpc) [FeH] lt ndash13
2
Table 1 Summary of the selection criteria employed to identify the halo substructures and the number of stars obtained for each sample For a more thoroughdescription of the selection criteria used in this work see Section 21 We note that all the orbital energy values used are obtained adopting a McMillan (2017)potential
Figure 4 Distribution of the identified halo substructures in the orbital energy (E) versus angular momentum wrt the Galactic disc (L119911 ) plane The parent sampleis plotted as a 2D histogram where whiteblack signifies highlow density regions The coloured markers illustrate the different structures studied in this work asdenoted by the arrows (we do not display Pontus(Icarus) as we only identify 2(1) stars respectively) The figure is split into two panels for clarity
MNRAS 000 1mdash-33 (2021)
Substructure in the Galactic stellar halo 9
Figure 5 Parent sample in the Mg-Fe plane The solid red lines indicate cutemployed to select the high- and low-120572 disc samples that we use in our 1205942analysiswhere the diagonal dividing line is defined as [MgFe] gt ndash0167[FeH]+ 015
teresting to study as it has recently been shown to help distinguishstellar populations from in situ and accreted origins (eg Hawkinset al 2015 Das et al 2020 Horta et al 2021a) Upon studying thedistribution of the substructures in different chemical compositionplanes we finalise our chemical composition study in Section 5 byperforming a quantitative comparison between the substructures stud-ied in this work for all the (reliable) elemental abundances availablein APOGEE For simplicity we henceforth refer to the [XFe]-[FeH]plane as just the X-Fe plane
Asmentioned in Section 2we exclude the Pontus and Icarus sub-structures from our quantitative chemical comparisons as the numberof candidate members of these substructures in the APOGEE cata-logue is too small The properties of Icarus and Pontus are brieflydiscussed in Appendices A and B respectively
41 120572-elements
We first turn our attention to the distribution of the substructures inthe 120572-Fe plane This is possibly the most interesting chemical compo-sition plane to study as it can provide great insight into the star forma-tion history and chemical enrichment processes of each subtructure(eg Matteucci amp Greggio 1986 Wheeler et al 1989 McWilliam1997 Tolstoy et al 2009 Nissen amp Schuster 2010 Bensby et al2014) Specifically we seek to identify the presence of the 120572-Fe kneeFor this work we resort to magnesium as our primary 120572 element asthis has been shown to be the most reliable 120572 element in previousAPOGEE data releases (eg DR16 Joumlnsson et al 2020) For thedistributions of the remaining 120572 elements determined by ASPCAP(namely O Si Ca S and Ti) we refer the reader to Fig D1-Fig D5in Appendix D
Figure 6 shows the distribution of each substructure in theMg-Feplane (coloured markers) compared to the parent sample (2D densityhistogram) We find that all the substructures ndashexcept for Aleph andNyxndash occupy a locus in this planewhich is typical of lowmass satellitegalaxies and accreted populations of theMilkyWay (eg Tolstoy et al2009 Hayes et al 2018 Mackereth et al 2019) characterised by lowmetallicity and lower [MgFe] at fixed [FeH] than in situ populationsMoreover we find that different substructures display distinct [MgFe]values implying certain differences despite their overlap in [FeH]However we also note that at the lowest metallicities ([FeH] lt ndash18)the overlap between different halo substructures increases
Next we discuss the distribution on the Mg-Fe plane of stars inour sample belonging to each halo substructure
bull 119878119886119892119894119905119905119886119903119894119906119904 As shown in Hasselquist et al (2017) Hasselquistet al (2019) and Hayes et al (2020) the stellar populations of theSgr dSph galaxy are characterised by substantially lower [MgFe]than even the low-120572 disc at the same [FeH] and traces a tail towardshigher [MgFe] with decreasing [FeH] Conversely at the higher[FeH] end we find that Sgr stops decreasing in [MgFe] and showsan upside-down knee likely caused by a burst in SF at late times thatmay be due to its interaction with the Milky Way (eg Hasselquistet al 2017 2021) Such a burst of star formation intensifies theincidence of SNe II with a consequent boost in the ISM enrichmentin its nucleosynthetic by-products such as Mg over a short timescale(sim 107 yr) Because Fe is produced predominantly by SN Ia over aconsiderably longer timescale (sim 108 minus 109 yr) Fe enrichment lagsbehind causing a sudden increase in [MgFe]
bull 119867119890119903119886119888119897119890119904 The [MgFe] abundances of the Heracles structureoccupy a higher locus than that of other halo substructures of similarmetallicity with the exception of Thamnos As discussed in Hortaet al (2021a) the distribution ofHeracles in the120572-Fe plane is peculiardiffering from that of GES and other systems by the absence of theabove-mentioned 120572-knee As conjectured in Horta et al (2021a) wesuggest that this distribution results from an early quenching of starformation taking place before SN Ia could contribute substantially tothe enrichment of the interstellar medium (ISM)
bull 119866119886119894119886-119864119899119888119890119897119886119889119906119904119878119886119906119904119886119892119890 Taking into account the small yetclear contamination from the high-120572 disc at higher [FeH] (see Fig 7for details) the distribution of GES dominates the metal-poor and120572-poor populations of the Mg-Fe plane (as pointed out in previousstudies eg Helmi et al 2018 Hayes et al 2018 Mackereth et al2019) making it easily distinguishable from the high-low-120572 discsWe find that GES reaches almost solar metallicities displaying thestandard distribution in the Mg-Fe plane with a change of slope ndashtheso-called ldquo120572-kneerdquondash occurring at approximately [FeH]simndash12 (Mack-ereth et al 2019) The metallicity of the ldquokneerdquo has long been thoughtto be an indicator of the mass of the system (eg Tolstoy et al 2009)and indeed it occurs at [FeH]gtndash1 for both the high- and low-120572 discsAs a result GES stars in the 119904ℎ119894119899 part of the 120572-119896119899119890119890 are characterisedby lower [MgFe] at constant metallicity than disc stars Interest-ingly even at the plateau ([FeH]ltndash12) GES seems to present lower[MgFe] than the high-120572 disc although this needs to be better quan-tified Furthermore we note the presence of a minor population of[MgFe] lt 0 stars at ndash18 lt [FeH] lt ndash12 which could be contami-nation from a separate halo substructure possibly even a satellite ofthe GES progenitor (see Fig 7 for details)Based purely on the distribution of its stellar populations on theMg-
Fe plane one would expect the progenitor of GES to be a relativelymassive system (see Mackereth et al 2019 for details) The factthat the distribution of its stellar populations in the Mg-Fe planecovers a wide range in metallicity bracketing the knee and extendingfrom [FeH]ltndash2 all the way to [FeH]simndash05 suggests a substantiallyprolonged history of star formation
bull 119878119890119902119906119900119894119886 The distribution of theGC field andH3 selected sam-ples (selected on the criteria described in Myeong et al (2019) Kop-pelman et al (2019c) and Naidu et al (2020) respectively) occupysimilar [MgFe] values ([MgFe]sim01) at lower metallicities ([FeH]ndash1) More specifically we find that all three Sequoia samples oc-cupy a similar position in theMg-Fe plane one that overlaps with thatof GES and other substructures at similar [FeH] values Along thoselines we find that the field and GC Sequoia samples seem to connectwith the H3 Sequoia sample where the H3 sample comprises thelower metallicity component of the fieldGC samples We examine inmore detail the distribution of the Sequoia stars in the 120572-Fe plane inSection 613
bull 119867119890119897119898119894 119904119905119903119890119886119898 Despite the low number of members associatedto this substructure its chemical composition in the Mg-Fe plane ap-pears to follow a single sequence and is confined to low metallicities([FeH]ltndash12) and intermediate magnesium values ([MgFe]sim02)However we do note that the stars identified for this substructure
MNRAS 000 1mdash-33 (2021)
10 D Horta et al
Figure 6 The resulting parent sample and identified structures from Fig 4 in the Mg-Fe plane The mean uncertainties in the abundance measurements for halosubstructures (colour) and the parent sample (black) are shown in the bottom left corner Colour coding and marker styles are the same as Fig 4 For the Aleph andNyx substructures we also highlight with purple edges stars from our APOGEE DR17 data that are also contained in the Aleph and Nyx samples from the Naiduet al (2020) and Necib et al (2020) samples respectively
minus2 minus1 0[FeH]
minus02
00
02
04
06
[Mg
Fe]
Gaia-EnceladusSausage
minus08
minus06
minus04
minus02
00
02
04
06
08
[AlF
e]
Figure 7 Gaia-EnceladusSausage (GES) sample in the Mg-Fe plane colourcoded by the [AlFe] abundance values The low [AlFe] stars are true GES starcandidates which display the expected low [AlFe] abundances observed inaccreted populations (see Section 43 for details) Conversely the high [AlFe]stars are clear contamination from the high-120572 disc likely associated with discstars on very eccentric and high energy orbits (Bonaca et al 2017 Belokurovet al 2020) A striking feature becomes apparent in this plane at ndash18 lt [FeH]lt ndash08 there is a population of very [MgFe]-poor stars (ie [MgFe] belowsim0) that could possibly be contamination from a separate halo substructure(although these could also be due to unforeseen problems in their abundancedetermination)
appear to be scattered across a wide range of [FeH] values Specifi-cally the Helmi stream occupies a locus that overlaps with the GESfor fixed [FeH] In Fig 19 we show that the best-fitting piece-wiselinear model prefers a knee that is inverted similar to although lessextreme than the case of Sgr dSph We discuss this in more detail inSection 614
bull 119879ℎ119886119898119899119900119904 Themagnesium abundances of Thamnos suggest thatthis structure is clearly different from other substructures in the retro-grade halo (namely Sequoia Arjuna and Irsquoitoi) It presents a muchhigher mean [MgFe] for fixed metallicity than the other retrogradesubstructures and appears to follow the Mg-Fe relation of the high-120572disc We find that Thamnos presents no 120572-knee feature and occupiesa similar locus in theMg-Fe plane to that of Heracles The distributionof this substructure in this plane with the absence of an 120572-Fe kneesuggests that this substructure likely quenched star formation beforethe onset of SN Ia
bull 119860119897119890119901ℎ By construction Aleph occupies a locus in the Mg-Feplane that overlaps with the metal-poor component of the low-120572 discGiven the distribution of this substructure in this chemical compo-sition plane and its very disc-like orbits we suggest it is possiblethat Aleph is constituted by warpedflared disc populations Becausethe data upon which our work and that by Naidu et al (2020) arebased come from different surveys it is important however to as-certain that selection function differences between APOGEE and H3are not responsible for our samples to have very different propertieseven though they are selected adopting the same kinematic criteriaIn an attempt to rule out that hypothesis we cross-matched the Naiduet al (2020) catalogue with that of APOGEE DR17 to look for Aleph
MNRAS 000 1mdash-33 (2021)
Substructure in the Galactic stellar halo 11
stars in common to the two surveys We find only two such stars6which we highlight in Fig 6 with purple edges While this is a verysmall number the two stars seem to be representative of the chem-ical composition of the APOGEE sample of Aleph stars which isencouraging
bull 119871119872119878 minus 1 Our results from Fig 6 show that the LMS-1 occupiesa locus in the Mg-Fe plane which appears to form a single sequencewith the GES at the lower metallicity end Based on its Mg andFe abundances and the overlap in kinematic planes of LMS-1 andGES we suggest it is possible that these two substructures could belinked where LMS-1 constitutes the more metal-poor component ofthe GESWe investigate this possible association further in Section 5
bull 119860119903 119895119906119899119886 This substructure occupies a distribution in the Mg-Fe plane that follows that of the GES Despite the sample beinglower in numbers than that for GES we still find that across ndash15lt [FeH] lt ndash08 this halo substructure overlaps in the Mg-Fe planewith that of the GES substructure Given the strong overlap betweenthese two systems as well as their proximity in the E-L119911 plane (seeFig 4) we suggest it is possible that Arjuna could be part of theGES substructure and further investigate this possible association inSection 5
bull 119868 prime119894119905119900119894 Despite the small sample size we find Irsquoitoi presentshigh [MgFe] and low [FeH] values (the latter by construction) andoccupies a locus in the Mg-Fe plane that appears to follow a singlesequence with the Sequoia (all three samples) and the GES sample
bull 119873119910119909 The position of this substructure in the Mg-Fe stronglyoverlaps with that of the high-120572 disc Given this result and the disc-like orbits of stars comprising this substructure we conjecture thatNyx is constituted by high-120572 disc populations and further investigatethis association in Section 5 Furthermore in a similar fashion asdone for the Aleph substructure we highlight in Fig 6 with purpleedges those stars in APOGEEDR17 that are also contained in the Nyxsample from Necib et al (2020) in order to ensure that our resultsare not biased by the APOGEE selection function We find that theoverlapping stars occupy a locus in this plane that overlaps with theNyx sample determined in this study and the high-120572 disc
42 Iron-peak elements
Following our analysis of the various substructures in the Mg-Feplane we now focus on studying their distributions in chemical abun-dance planes that probe nucleosynthetic pathways contributed impor-tantly by Type Ia supernovae We focus on nickel (Ni) which is theFe-peak element that is determined the most reliably by ASPCAPbesides Fe itself For the distribution of the structures in other iron-peak element planes traced by ASPCAP (eg Mn Co and Cr) werefer the reader to Fig F1ndash Fig F3 in Appendix F
The distributions of the halo substructures in the Ni-Fe planeare shown in Fig 8 We find that the distributions of GES Sgr dSphthe Helmi stream Arjuna LMS-1 and the three Sequoia samplesoccupy a locus in this plane that is characteristic of low mass satellitegalaxies andor accreted populations of the Milky Way displayinglower [NiFe] abundances than the low- and high-120572 disc populations(eg Shetrone et al 2003 Mackereth et al 2019 Horta et al 2021aShetrone et al 2022 in prep) In contrast the data for Heracles andThamnos display a slight correlation between [NiFe] and [FeH]connecting with the high-120572 disc at [FeH] sim minus1 (despite the differ-ences of these substructures in the other chemical composition planeswith in situ populations) Conversely we find that the Aleph and Nyxstructures clearly overlapwith in situ disc populations at higher [FeH]values agreeing with our result for these substructures on the Mg-Fe
6 We find that these two stars have a STARFLAG set with PERSISTminusLOWand BRIGHTminusNEIGHBOUR and thus do not survive our initial parent selectioncriteria However these warnings are not critical and should not have an effecton their abundance determinations
plane The distribution of Irsquoitoi shows a spread in [NiFe] for a smallrange in [FeH] that is likely due to observational error at such lowmetallicities
Interpretation of these results depends crucially on an under-standing of the sources of nickel enrichment Like other Fe-peakelements nickel is contributed by a combination of SNIa and SNe II(eg Weinberg et al 2019 Kobayashi et al 2020) The disc popu-lations display a bimodal distribution in Figure 8 which is far lesspronounced than in the case of Mg This result suggests that the con-tribution by SNe II to nickel enrichment may be more important thanpreviously thought (but see below) It is thus possible that the rela-tively low [NiFe] observed in MW satellites and halo substructureshas the same physical reason as their low [120572Fe] ratio namely a lowstar formation rate (eg Hasselquist et al 2021) This hypothesis canbe checked by examining the locus occupied by halo substructures ina chemical plane involving an Fe-peak element with a smaller contri-bution by SNe II such as manganese (eg Kobayashi et al 2020) Ifindeed the [NiFe] depression is caused by a decreased contributionby SNe II one would expect [MnFe] to display a different behaviourFigure F1 confirms that expectation with substructures falling on thesame locus as disc populations on the Mn-Fe plane
Another possible interpretation of the reduced [NiFe] towardsthe lowmetallicity characteristic of halo substructures is a metallicitydependence of nickel yields (Weinberg et al 2021) We may need toentertain this hypothesis since in contrast to the results presented inFigure 8 no [NiFe] bimodality is present in the solar neighbourhooddisc sample studied by Bensby et al (2014) which may call intoquestion our conclusion that SNe II contribute relevantly to nickelenrichment It is not clear whether the apparent discrepancy betweenthe data for nickel in Bensby et al (2014) and this work is due tolower precision in the former sample differences or systematics inthe APOGEE data
Given the distribution of the substructures in theNi-Fe plane ourresults suggest that i)Sgr dSphGES Sequoia (all three samples) andthe Helmi stream substructures show a slightly lower mean [NiFe]than in situ populations at fixed [FeH] as expected for accretedpopulations in the Milky Way on the basis of previous work (egNissen amp Schuster 1997 Shetrone et al 2003) ii) Heracles andThamnos fall on the same locus on the Ni-Fe plane presenting aslight correlation between [NiFe] and [FeH] iii) as in the case oftheMg-Fe plane Arjuna and LMS-1 occupy a similar locus in the Ni-Fe plane to that of GES further supporting the suggestion that thesesubstructures may be associated iv) AlephNyx mimic the behaviourof in situ low-high-120572 disc populations respectively
43 Odd-Z elements
Aside from 120572 and iron-peak elements other chemical abundancesprovided by ASPCAPAPOGEE that are interesting to study are theodd-Z elements These elements have been shown in recent workto be depleted in satellite galaxies of the MW and accreted systemsrelative to populations formed in situ (eg Hawkins et al 2015 Daset al 2020 Horta et al 2021a Hasselquist et al 2021) For this paperwe primarily focus on the most reliable odd-Z element delivered byASPCAP aluminium For the distribution of the structures in otherodd-Z chemical abundance planes yielded by APOGEE (namely Naand K) we refer the reader to Fig G1 and Fig G2 in Appendix G
Fig 9 displays the distribution of the substructures and par-ent sample in the Al-Fe plane using the same symbol conven-tion as adopted in Fig 6 We note that the parent sample showsa high density region at higher metallicities displaying a bimodal-ity at approximately [FeH] sim ndash05 where the high-low-[AlFe] se-quences correspond to the high-low-120572 discs respectively In addi-tion there is a sizeable population of aluminium-poor stars withminus05 ltsim [AlFe] ltsim 0 ranging from the most metal-poor stars in the
MNRAS 000 1mdash-33 (2021)
12 D Horta et al
Figure 8 The same illustration as in Fig 6 in the Ni-Fe space We note that the grid limit of appears clearly in this plane at the lowest [FeH] values
Figure 9 The same illustration as in Fig 6 in Al-Fe space We note that the grid limit appears clearly in this plane at the lowest [FeH] values
MNRAS 000 1mdash-33 (2021)
Substructure in the Galactic stellar halo 13
sample all the way to [FeH] sim minus057 This is the locus occupied byMW satellites and most accreted substructures with the exception ofAleph and Nyx Note also that the upper limit of the distribution ofthe Heracles population on this plane is determined by the definitionof our sample (see Horta et al 2021a for details)
The majority of the substructures studied occupy a similar locusin this plane which agrees qualitatively with the region where thepopulations from MW satellites are usually found (eg Hasselquistet al 2021) There is strong overlap between stars associated withthe GES the Helmi stream Arjuna Sequoia (all three samples) andLMS-1 substructures More specifically we find that GES dominatesthe parent population sample at [FeH] lt ndash1 being located at ap-proximately [AlFe] sim ndash03 At a slightly higher value of [AlFe]sim ndash015 and similar metallicities we find Heracles and ThamnosIn contrast Sgr dSph is characterised by an overall lower [AlFe]sim ndash05 value which extends below the parent disc population to-wards higher [FeH] reaching almost solar metallicity Within theminus2 ltsim [FeH] ltsim minus1 interval Heracles GES Helmi streams Tham-nos Nyx and to a lesser extent Sequoia show some degree of cor-relation between [AlFe] and [FeH] Towards the metal-poor end wefind the LMS-1 located at [AlFe]simndash03 which is consistent with thevalue found for Irsquoitoi although the sample of aluminium abundancesfor this latter structure is very small and close to the detection limitAs in the case of magnesium and nickel all three Sequoia samplesoccupy the same locus in the Al-Fe plane as Arjuna which stronglyoverlap with GES Again in the case of the Al-Fe plane we find thatthe case for Nyx and Aleph follow closely the trend established by insitu disc populations
44 Carbon and Nitrogen
In this subsection we examine the distribution of stars belonging tovarious substructures in the C-Fe and N-Fe abundance planes shownin Figures 10 and 11 respectively We note that in these chemicalplanes we impose an additional surface gravity constraint of 1 lt log119892lt 2 in order to minimise the effect of internal mixing along the giantbranch
In the C-Fe plane most substructures are characterised by sub-solar [CFe] displaying a clear correlation between that abundanceratio and metallicity The exceptions as in all previous cases areAleph and Nyx which again follow the same trends as in situ popula-tions Interestingly the Sgr dSph presents the lowest values of [CFe]at fixed [FeH] tracing a tight sequence at approximately [CFe]simndash05 spanning from ndash14 lt [FeH] lt ndash02 approximately sim05 dexbelow that of the Galactic disc In the case of Irsquoitoi due to the lownumbers of stars in this samplewe are unable to draw any conclusions
The distribution of substructures in the N-Fe plane follows a dif-ferent behaviour than seen in all other chemical planes Again exceptfor Aleph andNyx all systems display a trend of increasing [NFe] to-wards lower metallicities starting at [FeH] ltsim minus1 This trend cannotbe ascribed to systematics in the ASPCAP abundances or evolution-ary effects as the abundances are corrected for variations with log 119892Nitrogen abundances are notoriously uncertain particularly in thelow metallicity regime The compilation by Kobayashi et al (2020)shows that the [NFe] trend at low metallicity is strongly dependenton the analysis methods Discerning the source of systematics in theASPCAP abundances at [FeH] ltsim minus1 is beyond the scope of thispaper which focuses on a strictly differential analysis of the datawithin a metallicity regime where ASPCAP elemental abundancesattain exceedingly high precision (Section 5)
For completeness data covering the whole range of log 119892 forall substructures are displayed in the (C+N)-Fe plane in Fig E1 in
7 The clump located at [AlFe] sim minus01 and [FeH] gt 0 is not real but ratheran artifact due to systematics in the abundance analysis which does not affectthe bulk of the data
Appendix E By combining carbon and nitrogen abundances weminimise the effect of CNO mixing along the giant branch In thisplane MW satellites and accreted populations typically display alower [(C+N)Fe] chemical composition than their in situ counterparts(eg Horta et al 2021a Hasselquist et al 2021) This is in fact whatwe observe for all the structures identified again with the exceptionof Aleph and Nyx whose locus overlaps with that of in situ discpopulations
45 Cerium
Cerium is a neutron capture element of the 119904-process family with alarge enrichment contribution from AGB stars (Sneden et al 2008Joumlnsson et al 2020 Kobayashi et al 2020) In Fig 12 the discsample at [FeH]gt minus1 has a roughly horizontal locus at [CeFe]asymp minus01dominated by stars in the high-120572 population and an upward-pointingtriangular locus dominated by stars in the low-120572 sequence reaching[CFe]asymp +04 at [FeH]asymp minus02 The scatter within each of thesecomponents is large and may be partly observational The presence ofsubstantial Ce in high-120572 stars suggests that massive stars with shortlifetimes make a significant prompt contribution The rising-then-falling trend in the low-120572 population is expected from the metallicity-dependent yield of intermediate mass AGB nucleosynthesis at low[FeH] the number of seeds available for neutron capture increaseswith increasing metallicity but at high [FeH] the number of neutronsper seed becomes to low to produce the heavier 119904-process elements(Gallino et al 1998) See Weinberg et al (2021) for plots of [CeMg]vs [MgH] and further discussion of the disc trends
In this chemical composition plane we find that all the identifiedsubstructures with the exception of Aleph and Nyx present [CeFe]abundances that follow the mean trend with [FeH] of the parentpopulation until [FeH] sim minus1 Aleph and Nyx have higher [FeH]stars that generally lie within the broad disc locus Interestingly theSgr stars with [FeH] gt minus1 show a rising [CeFe] trend that tracks thebehaviour of the low-120572 disc population This trend is not obvious inthe other substructures though with the exception of Aleph and Nyxthey have few stars at [FeH] gt minus1 We interpret this upturn in bothSgr and the low-120572 disc as the signature of an AGB contribution witha metallicity dependent yield
At [FeH] lt minus1 the parent halo population and most substruc-ture stars exhibit mildly sub-solar [CeFe] with substantial scatterwhich may have a significant observational component The [CeFe]is similar to that of typical high-120572 disc stars at [FeH] gt minus1 Howeverthese stars have lower [120572Fe] than the high-120572 disc the signature ofFe enrichment from Type Ia SNe so if the Ce in these populationsis a prompt contribution from massive stars one might have naivelyexpected them to have depressed [CeFe] It is difficult to disentanglethe effects of metallicity-dependent Ce yields differences in the rela-tive contributions of high-mass and intermediate-mass stars and theimpact of Type Ia SN enrichment on the Fe abundance further ob-servational investigation and theoretical modeling will be needed todo so The [CeFe] locus of substructure stars at minus2 lt [FeH] lt minus1is similar to that in the dwarf satellites studied by Hasselquist et al(2021)
46 The [AlFe] vs [MgMn] plane
Having studied the distribution of the identified structures in chemicalabundance planes that aimed to give us an insight into the differentnucleosynthetic pathways contributed either by core-collapse type Iasupernovae and AGB stars we now focus our attention on analysingthe distribution of substructures in the stellar halo in an abundanceplane that lends insights into the accreted or in situ nature of Galacticstellar populations namely the [MgMn]-[AlFe] plane
Fig 13 shows the resulting distribution of the various structuresin the [MgMn]-[AlFe] plane This chemical plane has been proposed
MNRAS 000 1mdash-33 (2021)
14 D Horta et al
Figure 10 The same illustration as Fig 6 in the C-Fe plane For this chemical plane we restrict our sample to a surface gravity range of 1 lt log119892 lt 2 in order tominimise the effect of internal mixing in red giant stars
Figure 11 The same illustration as Fig 6 in the N-Fe plane As done in Fig 10 for this chemical plane we restrict our sample to a surface gravity range of 1 lt log119892lt 2 in order to minimise the effect of internal mixing in red giant stars We note that the grid limit appears clearly in this plane at the lowest [FeH] values
MNRAS 000 1mdash-33 (2021)
Substructure in the Galactic stellar halo 15
Figure 12 The same illustration as Fig 6 in the Ce-Fe plane We note that the grid limit appears clearly in this plane at the lowest [FeH] values
Figure 13 The same illustration as Fig 6 in the [MgMn]-[AlFe] plane
MNRAS 000 1mdash-33 (2021)
16 D Horta et al
by Das et al (2020) as a means to distinguishing accreted populationsfrom those formed in situ Horta et al (2021a) showed that in situ stel-lar populations with a small degree of chemical evolution occupy thesame locus in that plane as accreted populations By construction theHeracles substructure falls in the accreted locus of the diagram (seeFig 1 in Horta et al (2021a) for reference) However our results showthat all the other structures except for Aleph and Nyx also occupythe accreted locus of this plane Interestingly we find that althoughthe GES Sgr dSph the Helmi stream Sequoia (all three samples)Thamnos LMS-1 Arjuna and Irsquoitoi substructures occupy the samelocus they appear to show some small differences Specifically wefind that Sgr dSph occupies a locus in this plane positioned at lowermean [MgMn] than the other structures This is likely due to Sgrbeing more recently accreted by the Milky Way and thus had moretime to develop stellar populations with enrichedMn abundances thathave been contributed on a longer timescale by type Ia supernovaeThis feature is also seen to a lesser extent for Irsquoitoi Conversely athigher [MgMn] values (but still low [AlFe]) we find GES Hera-cles (by construction) Thamnos LMS-1 the Helmi stream Sequoia(all three samples) and Arjuna The distribution of these substruc-tures in this chemical plane reinforces the hypothesis of these halosubstructures arising from an accreted origin
In a similar fashion to the other chemical composition planeswe find that Aleph and Nyx overlap with in situ (disc) populations athigher [AlFe] suggestive that Aleph andNyx are likely substructurescomprised of in situ disc populations
5 A QUANTITATIVE COMPARISON BETWEEN HALOSUBSTRUCTURE ABUNDANCES
After qualitatively examining the chemical compositions of the previ-ously identified halo substructures in a range of chemical abundanceplanes we now focus on comparing the abundances in a quantitativefashion using a 1205942 method To do so we compare the mean valueof thirteen different elemental abundances manufactured in differentnucleosynthetic channels for each substructure at a fixed metallicitythat is well covered by the data The set of elemental abundanceschosen to run this quantitative test was determined based on thedistribution of the parent sample in the respective chemical compo-sition plane where we only chose those elements that did not displaya large scatter towards low metallicity due to increased abundanceuncertainties (on the order of 120590 sim015 dex) Out of the initial 20 el-emental abundances available in ASPCAP (excluding Fe) we utilisethe following thirteen elements C N O Mg Al Si S K Ca TiMn Ni and Ce We note that Na P V Cr and Co were removed dueto the large scatter at low metallicity whereas Cu and Nd were notconsidered due to ASPCAP not being able to determine abundancesfor these elements in APOGEE DR17
For our quantitative comparison we proceeded as followsi) We select a high- and low-120572 disc population based on Fig 5 for
reference and utilise these samples as representative disc samples forany comparison between in situ populations and halo substructures Inorder to account for any distance selection function effects we restrictour high-low-120572 samples to stars within 119889 lt 2 kpc and also determinean inner high-120572 disc sample (restricted to RGC lt 4 kpc which wewill use to compare to Heracles (which has a spatial distribution thatis largely contained within sim4 kpc from the Galactic Centre)
ii) Before performing any chemical composition comparisonswe correct the abundances for systematic trends with surface grav-ity Systematic abundance variations trends with log 119892 can be causedone one hand by real physical chemical composition variations asa function of evolutionary stage andor on the other by systematicerrors in elemental abundances as a function of stellar parametersThe former chiefly impact elements such as C N and O whose atmo-spheric abundances are altered by mixing during evolution along thegiant branch The latter impact various elements in distinct though
more subtle ways (see discussion in Weinberg et al 2021) Surfacegravity distributions of various substructures differ in important ways(Figure 1) so that such systematic abundance trends with log 119892 caninduce spurious artificial chemical composition differences betweensubstructures We thus follow a procedure similar to that outlined byWeinberg et al (2021) to correct each elemental abundance usingthe full parent sample As systematic trends with log 119892 are more im-portant towards the low and high ends of the log 119892 distribution werestrict our sample to stars within the 1 lt log 119892 lt 2 range We thenfit a second order polynomial to the [XH]-log 119892 relation and calcu-late the difference between that fit and the overall [XH] median Thedifference between these two quantities for any given log 119892 is thenadded to the original [XH] values so as to produce a flat relation be-tween [XH]corrected and log 119892 We then use these values to determinecorrected [XFe] abundances In a recent study Eilers et al (2021)pointed out that simple corrections for abundance trends as a functionof log 119892 could erase real differences associated with abundance gra-dients within the Galaxy That is because a magnitude limited surveymay cause an artificial dependence of log 119892 on distance Our studyaims at contrasting the chemical compositions of substructures thatare in principle associated with spatially self-contained progenitorsThus systematic differences linked to spatial abundance variationswithin each structure are irrelevant for our purposes so a straight-forward correction for abundance variations with log 119892 are perfectlyacceptable for our goals
iii) Upon obtaining corrected abundances for every halo sub-structure we determined the uncertainties in the abundances usinga bootstrapping resampling with replacement method (utilising theastropystatsbootstrap routine by Price-Whelan et al 2018)We generated 1000 realisations of the X-Fe chemical compositionplanes for every element and every halo substructure sample in or-der to assess the scatter in the abundance distribution For examplewe generated 1000 realisations of the C-Fe distribution for GES bydrawing 2353 values from the observed distribution with replace-ment (where 2353 is the size of our GES sample)
iv) For each one of the 1000 bootstrapped realisations of achemical composition plane of a halo substructure we determine the[XFe] value at a given metallicity ([FeH]comp) that is covered byboth halo substructures being compared by taking a 005 dex slicein [FeH] around [FeH]comp and determining the median value forstars in that [FeH] interval This yields 1000 [XFe] median valuesfor each of the thirteen elements studied for every halo substructure(and disc sample) compared
v) We take the mean and standard deviation of the medians dis-tribution for every [XFe] as our representative [XFe] and uncertaintyvalue respectively and use these to quantitatively compare the chem-ical abundances between two populations This sample median fromthe mean of the bootstrap medians is always close to the full samplemedian itself
vi) Upon obtaining the mean and uncertainty chemical abun-dance values for every halo substructure at [FeH]comp (for a rangeof thirteen reliable elemental abundances in APOGEE) we quantita-tively compare the chemical compositions across halo substructuresadopting a 1205942 statistic to assess the chemical similarities betweendifferent substructures This quantity was computed by using the fol-lowing relation
1205942 =sum119894
([XFe]119894sub minus [XFe]119894ref
)2(1205902[XFe]119894sub
+ 1205902[XFe]119894ref
) (1)
where [XFe]sub and [XFe]ref are the abundances of the halo sub-structure and the compared reference stellar population respectivelyand 120590[XFe]sub and 120590[XFe]ref are the corresponding uncertaintiesto those abundance values Since GES is the halo substructure forwhich our sample is the largest we use this substructure as our main
MNRAS 000 1mdash-33 (2021)
Substructure in the Galactic stellar halo 17
reference against which all other substructures as well as in situ discpopulations are contrasted
vii) Lastly in order to infer if two stellar populations presentconsistent chemical abundances in a statistical manner we determinethe probability value of the 1205942 result for twelve degrees of freedomusing the scipy (Virtanen et al 2020) statschi2cdf routineIn addition to the 1205942 value we also compute a metric of separation(defined as Σ[XFe] ) that is calculated by setting the denominatorof Eq 1 equal to 1 This separation metric provides an additionalway to quantify how similar the chemical compositions of two halosubstructures are that is unaffected by the sample size (as smallerhalo substructure samples will have larger uncertainties on their meanabundance values)
viii) For the case of Heracles and Aleph as the selection ofthese substructures relies heavily on the use of [AlFe] and [MgFe]respectively we remove these elements when comparing thesesubstructures and reduce the numbers of degrees of freedom toeleven when calculating the 1205942 probability value
In order to develop a more clear notion of the meaning of theresulting 1205942 values resulting from the above comparisons we performan additional exercise aimed at gauging the expected 1205942 values forthe cases where two samples are identical to each other or verydifferent To accomplish this we draw for each substructure three119873sub-sized random samples two from the high-120572 and one from thelow-120572 disc samples where 119873sub is the size of the sample of thatsubstructure We then calculate for each substructure two 1205942 valuesone resulting from the comparison of the high-120572 disc against itselfand the other from the comparison of the high-120572 disc against thelow-120572 disc samples As the high- and low-120572 disc both cover a similarrange in [FeH] and their abundances vary with [FeH] we select anarrow bin in [FeH] from which to draw our high- and low-120572 discsamples (namely between ndash045 lt [FeH] lt ndash035) This enables usto obtain random samples of high- and low-120572 disc populations at thesame [FeH] and allows us to directly compare the mean and scattervalues of the chemical abundances using the 1205942 method
The reader may inspect the resulting 1205942 and probability (1199011205942 )values obtained in Table 2 Here a 1199011205942 sim 1 signifies that two pop-ulations are statistically equal and 1199011205942 sim 0 means that they arestatistically different For the quantitative comparisons we employ athreshold of 1199011205942 = 01 as our benchmark where we will deem twosubstructures to be statistically similar if their associated probabilityvalue is higher than 1199011205942 gt 01 and different if below 1199011205942 lt 01
The resulting quantitative comparison between the halo sub-structures indicates that approximately half of the halo substructuresare statistically equal with regards to their chemical abundanceswhilst the other half are statistically different For example the 1205942
comparison between the GES and the three Sequoia samples implythat these four substructures are statistically the same as we find thatthe GC field and H3 Sequoia samples all have a high probability ofbeing statistically similar to the GES substructure (02 lt 1199011205942 lt 085)We find this also to be the case for the LMS-1 substructure for whichwe obtain a probability value of 046 Similarly an ever closer matchis found for the GES-Arjuna comparison yielding a probability valueof 088 Along similar lines we find that when comparing the Nyxto the high-120572 disc we obtain a probability value of 08 reinforcingour initial hypothesis that the Nyx is not an accreted substructurebut instead is a stellar population constituted of high-120572 disc starsMoreover we find that when comparing Heracles Sgr dSph andThamnos with the GES that the probability of these substructuresbeing statistically equal is sim0 This result is not entirely surprisingas all these substructures are postulated to be debris from separateaccretion events and thus should present differences in their chemicalabundances Interestingly we find two surprising results i) despitethe Aleph substructure presenting qualitatively the same chemistry asthe low-120572 disc its 1205942 value yields a probability of 005 suggestingthat these are not as similar as initially hypothesised ii) although
Heracles occupies a position in several chemical composition planesthat appears to follow a single sequence with the high-120572 disc the 1205942yielded when comparing this substructure to the high-120572 disc indi-cate that these are statistically different (with a probability value of1199011205942=0)
For the complete resulting probability values obtained whencomparing the chemistry between every halo substructure as well asthe high- and low-120572 disc we refer the reader to Fig 18
6 DISCUSSION
61 Summary of substructure in the stellar halo
Having qualitatively and quantitatively compared the chemical abun-dances of all the halo substructures under study in this Section wediscuss the results obtained for each identified substructure in thecontext of previous work
611 Heracles
Stars from this substructure follow low energy often eccentric orbitswith low L119911 being largely phase-mixed in velocity and action spaceAll these features are to be expected in the scenario where Heracleswas a massive system that merged early in the history of the MilkyWay Under this hypothesis dynamical friction would have driven thesystem quickly into low energy orbits sinking it into the heart of theGalaxy (Horta et al 2021a Pfeffer et al 2021)
The chemical compositions of the stars associated with Heraclesare in broad agreementwith this scenario The distribution ofHeraclesin the120572-Fe plane does not display the120572-Fe knee or shin components ofchemically evolved systems (McWilliam 1997) which suggests thatits star formation ceased before the contribution of supernovae typeIa became substantial (Horta et al 2021a) In Horta et al (2021a) wechecked that this result was not an effect of the chemical compositioncriteria adopted in the selection of Heracles stars by comparing themwith a similarly selected GES sample which did display a clear 120572-Feknee signature Furthermore Heracles occupies a locus in differentchemical planes that resembles that of lowmass galaxies of theMilkyWay andor accreted populations In particular Horta et al (2021a)show that the stars associated with Heracles make up a clump in the[MgMn]-[AlFe] plane in the region occupied by accreted andorchemically unevolved populations characterised by low [AlFe] andhigh [MgMn]
Recent work by Lane et al (2021) suggests that the concentra-tion associated with Heracles in E-L119911 space could be an artifact ofthe APOGEE selection function so the authors caution that the re-ality of this halo substructure should be further tested As discussedextensively in Horta et al (2021a) phase mixing makes it especiallyhard to discriminate accreted systems from their in situ counterpartsco-located in the inner few kpc of Milky Way on the sole basis ofkinematics Nonetheless theoretical predictions predict their exis-tence (eg Fragkoudi et al 2020 Kruijssen et al 2020 Pfeffer et al2021 Horta et al 2022 in prep) Detailed chemistry is thus crucialto tease out the remnants of accreted systems from the maze of in situpopulations overlapping in the inner few kpc of the Galaxy
For that reason we examine closely the comparison between theabundance patterns of Heracles data and the inner high-120572 disc at thesame [FeH] (Fig 17) Our 1205942 analysis shows that the two popula-tions differ chemically with high statistical significance (1205942 = 5311199011205942=0 similar to the value obtained when comparing the LMC tothe SMC see Table 2) To check whether this result is sensitive to thechoice of [FeH]comp we reran the analysis adopting [FeH]comp=ndash09 and [FeH]comp=ndash095 obtaining 1205942 value of 3628 and 4340respectively which corresponds to a probability value of 1199011205942=0 inboth cases
Examining more closely the contrast between the abundance
MNRAS 000 1mdash-33 (2021)
18 D Horta et al
Figure 14Δ[XFe] differences between the resultingmean values obtained using the procedure outlined in Section 5 (at [FeH]comp) for theGaia-EnceladusSausagesubstructure and the high-120572 disc stars (top) and for the Large and Small Magellanic Cloud (LMCSMC) samples from Hasselquist et al (2021) (bottom) in thirteendifferent chemical abundance planes grouped by their nucleosynthetic source channel The shaded regions illustrate the uncertainty on this Δ[XFe] value Alsoillustrated in the top rightleft are the 12059421199011205942 [FeH]comp values for the comparison between these two populations As can be seen from the abundance values the1205942 value and the 1199011205942 value it is evident that the GEShigh-120572 disc and the LMCSMC are quantitatively different given their chemical compositions
Compared samples [FeH]comp 1205942 1199011205942 ΣΔ[XFe] high120572-high120572 1205942 high120572-low120572 1205942
High120572 disc-GES ndash09 17534 000 050 978 462296
LMC-SMC ndash11 531 000 004 1005 151767
GES-Heracles ndash13 3590 000 006 1074 50743
GES-Sgr dSph ndash10 1500 000 011 855 54227
GES-Helmi stream ndash12 221 004 008 661 15393
GES-Sequoia (GC) ndash12 71 085 002 340 20794
GES-Sequoia (field) ndash13 159 020 016 404 21068
GES-Sequoia (H3) ndash19 127 039 024 342 22983
GES-Thamnos ndash14 742 000 018 882 16281
GES-LMS-1 ndash21 118 046 023 627 37165
GES-Arjuna ndash13 66 088 lt001 548 23082
GES-Irsquoitoi ndash21 139 030 023 675 12399
GES-Nyx ndash06 627 000 034 645 124671
high120572 disc-Nyx ndash06 79 080 lt001 645 124671
low120572 disc-Aleph ndash06 195 005 004 882 19569
Inner high-120572 disc-Heracles ndash1 531 000 004 1074 50743
Heracles-Thamnos ndash13 337 00 008 882 16281
Table 2 From left to right compared halo substructures [FeH] value used to compare the two compared substructures resulting 1205942 value from the comparisonbetween the listed halo substructures the probability value the 1205942 result falls upon for a 1205942 test with twelve (or eleven for the case of Heracles and Aleph) degreesof freedom the metric separation ΣΔ[XFe] 1205942 value between two randomly chosen high-120572 disc samples of the same size as the smallest substructure compared1205942 value between a randomly chosen high-120572 and low-120572 disc sample of the same size as the smallest substructure compared The LMCSMC samples were takenfrom Hasselquist et al (2021)
MNRAS 000 1mdash-33 (2021)
Substructure in the Galactic stellar halo 19
Figure 15 The same mean and mean error abundance values as shown in Fig 14 but comparing the Heracles Sagittarius dSph Helmi stream Arjuna and Thamnossubstructures with the Gaia-EnceladusSausage substructure We note that those substructures with fewer stars present larger uncertainties in their Δ[XFe] value
patterns of Heracles and the inner high-120572 disc we find that theydiffer in interesting ways By far the elements displaying the largestdifferences are oxygen magnesium and silicon whose abundancesare lower in Heracles than in the inner high-120572 disc At face value thisdifference implies less SNII enrichment in Heracles than in the innerhigh-120572 disc possibly reflecting a lower star formation rate A similarbut smaller difference is seen in carbon nitrogen and potassiumInterestingly (as in the case of GES see Section 612) we find[CeFe]sim0 suggesting a small contribution to chemical enrichmentfrom the 119904-process nucleosynthesis channel
We point out that it is possible that the chemical properties as-
cribed to Heracles may be to some extent influenced by our selectionmethod which is partly based on chemistry That selection how-ever is far from arbitrary It is rather informed by the fact that thedistribution of inner Galaxy stellar populations form a clear clumpin the accretedchemically unevolved region of the [MgMn]-[AlFe]plane (see Figure 1 of Horta et al 2021a) Our 1205942 analysis shows thatHeracles presents an almost unique abundance pattern differing in a(sometimes small yet) statistically significant way from most stellarpopulations under study For instance we find that the abundancepatterns of Heracles and GES are different (ie 1199011205942 = 0) This is alsothe case when comparing Heracles to the Sequoia (all three samples)
MNRAS 000 1mdash-33 (2021)
20 D Horta et al
Figure 16 The same as Fig 15 but comparing the three Sequoia samples LMS-1 and Irsquoitoi substructures with the Gaia-EnceladusSausage substructure
Arjuna Thamnos andNyx This result reinforces the hypothesis fromHorta et al (2021a) that Heracles is likely the remnant of a separateearlymassive accretion event
We conclude by stating that our data are consistent with Heraclesbeing the remnant of a satellite that merged with the Milky Way in itsearly history Further studies based on an expanded set of elementalabundances for a larger sample as well as detailed modelling basedboth on cosmological numerical simulations and standard chemicalevolution prescriptions are required to definitively establish the originof Heracles
612 Gaia-EnceladusSausage
Since its discovery (Belokurov et al 2018 Helmi et al 2018) theGaia-EnceladusSausage (GES) substructure has been extensivelystudied both from an orbital and chemical compositions perspective(eg Hayes et al 2018 Mackereth et al 2019 Koppelman et al2019a Vincenzo et al 2019 Aguado et al 2020 Feuillet et al 2020Simpson et al 2020 AnampBeers 2021 Horta et al 2021a Hasselquistet al 2021 Buder et al 2022 Carrillo et al 2022) In this work wehave identified a large sample of GES stars and have shown that starsbelonging to this population are characterized by intermediate-to-high orbital energies and high eccentricity displaying no significantsystemic disc-like rotation
MNRAS 000 1mdash-33 (2021)
Substructure in the Galactic stellar halo 21
Figure 17 The same as Fig 14 but comparing the Nyx substructures with the Gaia-EnceladusSausage substructure and the high-120572 discs as well as a comparisonbetween the Heracles and inner high-120572 disc Heracles and Thamnos and Aleph and the low-120572 disc
The chemical compositions of the GES substructure are charac-terised by lower [120572Fe] at [FeH] gtsim minus16 than high-120572 disc for most120572 elements (namely Mg O Si Ca S) in agreement with previouswork (eg Hayes et al 2018 Haywood et al 2018 Helmi et al 2018Mackereth et al 2019 Horta et al 2021a Buder et al 2022) and dis-plays an 120572-knee at [FeH]simndash11 (see Fig 19) The stellar populationsof GES are also characterised by lower Al C and Ni than in situ pop-ulations resembling the abundance patterns of stars from satellites oftheMilkyWay (Horta et al 2021a Hasselquist et al 2021) They alsooccupy the accretedunevolved region of the [MgMn]-[AlFe] planeIn summary the chemical compositions of GES confirm the results
from previous studies and reinforce the idea that this halo substruc-ture is the remnant of an accreted satellite whose debris dominate thelocalinner regions of the stellar halo
613 Sequoia
The Sequoia substructure was initially discovered due to the highlyunbound and retrograde orbits of its constituent stars and associatedglobular clusters (eg Barbaacute et al 2019Matsuno et al 2019Myeonget al 2019) which made it easily distinguishable from in situ popu-lations Since its discovery several groups have sought to identify it
MNRAS 000 1mdash-33 (2021)
22 D Horta et al
Figure 18 Confusion matrix of the probability values (estimated using the 1205942 calculated using Eq 1) obtained when comparing the chemical compositions of allthe halo substructures with each other and with a high-low-120572 discs Here each substructure is compared with its counterpart using a [FeH] value that is wellcovered by the data (see Fig H1 in Appendix H for further details) where red(blue) signifies a high(low) probability of two systems being statistically equal giventheir chemical compositions Comparisons with blank values are due to the two substructures being compared not having any overlap in [FeH]
using different surveys It has also been examined byKoppelman et al(2020) on the basis of 119873-body simulations by Villalobos amp Helmi(2008) suggesting that rather than a separate system Sequoia mayconstitute a fringe population of stars in low eccentricity retrogradeorbits left over after the GES merger In this work we have selectedthe Sequoia substructure by employing three independent definitionsderived from the Myeong et al (2019) Koppelman et al (2019c)and Naidu et al (2020) works respectively
When inspecting the chemical distribution of these three inde-pendent Sequoia samples in multiple chemical composition planeswe have found that the Sequoia samples defined by Myeong et al(2019) Koppelman et al (2019c) and Naidu et al (2020) occupya similar locus in all chemical composition planes that resemblesthat of low mass satelite galaxies of the MW andor accreted popu-lations displaying low Mg Al C and Ni that overlap with the GESsubstructure Furthermore when running a quantitative 1205942 compar-ison between the three Sequoia samples we find that their chemi-cal compositions are indistinguishable from each other yielding ahigh probability value of 1199011205942=093 for the comparison between theKoppelman et al (2020) samples and Naidu et al (2020) samples1199011205942=095 between the Koppelman et al (2020) and Myeong et al(2019) samples and 1199011205942=099 for that between the Myeong et al(2019) and Naidu et al (2020) samples Therefore we conclude re-assuringly that the chemical composition we obtain for the Sequoiasystem does not depend on the selection criterion adopted
As in the case of the systems discussed above Sequoia occupiesthe accretedunevolved region of the [MgMn]-[AlFe] plane which isencouraging given that two of those samples were selected purely onthe basis of orbital parameters Interestingly we note that the Naiduet al (2020) sample appears to be simply the metal-poor tail of theMyeong et al (2019) and Koppelman et al (2019c) samples
A quantitative comparison of these Sequoia samples with GES
shows that all four populations have consistent and similar chemistryMore specifically we find that the Myeong et al (2019) Koppelmanet al (2019c) and Naidu et al (2020) Sequoia samples yield a prob-ability value of 1199011205942=085 1199011205942=02 and 1199011205942=039 respectively Atface value this chemical similarity corroborates the hypothesis raisedby Koppelman et al (2020) that stars with low eccentricity and ret-rograde orbits with relatively high energies could have resulted fromthe GES merger
The hypothesis advanced by Koppelman et al (2020) embodiesa falsifiable prediction of a metallicity difference between the twosystems Such a difference would be expected had Sequoia been orig-inally associated with the stellar populations located in the outskirtsof GES They argue that for a GES system of 119872 sim 1096M themetallicity gradient expected between the outer regions stripped first(ie Sequoia) and the main body (ie GES) would be of the or-der of sim03 dex We exclude from that test the sample selected byNaidu et al (2020) since it adopts a metallicity cut which wouldbias our results The mean metallicities inferred when adopting eitherthe Myeong et al (2019) or the Koppelman et al (2019c) Sequoiasamples are 〈[FeH]〉 = minus141 and ndash131 respectively In contrastwe obtain 〈[FeH]〉 = minus119 for our GES sample suggesting a differ-ence of sim01-02 dex which is roughly consistent with the predictionby Koppelman et al (2020) It is interesting however that no differ-ence in abundance pattern exists between Sequoia and GES at fixed[FeH] which under Koppelman et al (2020)rsquos hypothesis would sug-gest the absence of abundance ratio gradients in the GES progenitorAt face value this result is at odds with the observations of existingsatellites of the Milky Way For instance an [120572Fe] gradient is knownto be present in the Sgr dSph (eg Hayes et al 2020 Hasselquistet al 2021) The latter difference may however be explained awayas resulting from the occurrence of recent episodes of star formationin the Sgr dSph which would have a strong impact on [120572Fe] of the
MNRAS 000 1mdash-33 (2021)
Substructure in the Galactic stellar halo 23
younger populations (eg Hasselquist et al 2021) It is thus con-ceivable that the absence of a detectable [120572Fe] difference betweenSequoia and GES results from an early quenching of star formation
Our samples for GES and Sequoia cover in a statistically mean-ingful way a wide range of metallicities so that they lend themselvesnicely to a more detailed comparison of the distributions of those twosystems in the 120572-Fe plane A crucial diagnostic is the metallicity ofthe ldquo120572-kneerdquo [FeH]knee (Section 41) which is strongly sensitiveto the details of the star formation history of the system In recentstudies Matsuno et al (2019) Monty et al (2020) and Aguado et al(2020) suggest that Sequoia is characterised by a substantially lower[FeH]knee than GES To test that hypothesis we perform a piece-wise linear fit to our GES and Sequoia samples in order to accuratelydetermine the position of the [FeH]knee in those two systems in amanner similar to the approach followed by Mackereth et al (2019)
The resulting fits (solid lines) and 1-120590 dispersions (shaded re-gions) are displayed along with respective samples for GES (blue)Sequoia (green and red for the Myeong et al 2019 Koppelman et al2019c samples respectively) in Figure 19 The piece-wise functionwas determined using the PiecewiseLinFit function included aspart of the pwlf package (Jekel amp Venter 2019) Due to its lowmetallicity upper limit the Sequoia sample from Naidu et al (2020)is excluded from the comparison The [FeH]knee values for GES andthe two Sequoia samples are within sim01 dex from each other Thelargest difference in fact is that between the Myeong et al (2019)and Koppelman et al (2019c) with the latter resulting in a larger[FeH]knee This result suggests the absence of significant differencesin the star formation histories of the two systems despite the slightlydifferent mean metallicities discussed above Since the [FeH]knee pa-rameter is considerably less sensitive to uncertainties due to selectioneffects we conclude that the precursors of GES and Sequoia under-went similar star formation histories which supports the hypothesisthat they were once different components of the same system
In a recent paper Naidu et al (2021) propose that Sequoiarather than constituting the outskirts of GES was instead one of itssatellites That notion is predicated on their estimated ratio betweenthe masses of the two systems (roughly 110) and their chemicalcomposition differences Naidu et al (2021) call particular attentionto the large metallicity gradient implied by an association betweenSequoia and GES referring as well to the difference in [FeH]kneefrom the literature Our results call into question the existence of animportant difference in [FeH]knee andmeanmetallicity thus possiblyaccommodating comfortably the possibility of an association betweenthe two systems
Along those lines in a recent work Matsuno et al (2021) de-termined the abundances of 12 Sequoia stars on the basis of high-resolution spectra obtained with the Subaru High Dispersion Spec-trograph Their Sequoia sample was selected following the criteriaby Koppelman et al (2019c) Matsuno et al (2021) compared theirchemical compositions to those of GES members selected from Nis-sen amp Schuster (2010) and Reggiani et al (2017) The authors foundthat the abundances of Na Mg and Ca differed from GES for 8 out ofthe 10 stars in the cleaned Sequoia sample at the 2120590 level which isat odds with the findings presented in this work Thus we decided todouble-check our results by running Matsuno et al (2021)rsquos method-ology on our data We fit a quadratic polynomial to our GES dataand estimated the residuals of the Sequoia sample stars relative to thepolynomial value at their measured [FeH] Because APOGEE doesnot yield reliable sodium abundances at lowmetallicities we replacedthat element by aluminium to run this test as it is the APOGEE el-ement sharing a nucleosynthetic source that is closest to that of NaOut of the 45 Sequoia stars (selected as in Myeong et al (2019))that fall within the ndash18 lt [FeH] lt ndash14 metallicity range adoptedby Matsuno et al (2021) we find that 424043 stars fall within 2120590of the quadratic polynomial fit to the GES sample when examiningthe MgAlCa abundance planes When the Koppelman et al (2019c)Sequoia sample is considered we find that 222223 out of the total 26
Figure 19 Piece-wise polynomial fit (solid line) and 1-120590 dispersion (shadedregion) for GES Sequoia Arjuna and Helmi stream samples Data and fitsare displaced vertically for clarity The resulting [FeH]knee values are shownThe Mg-Fe knee of GES and Sequoia are within 01 dex from each other withthe largest difference being found between the two Sequoia samples By thesame token [FeH]knee for Arjuna differs from that GES by only 005 dex Thestar formation efficiencies of these systems as indicated by [FeH]knee seemnot to have been substantially different Conversely for the Helmi stream wefind an inverted knee that occurs at [FeH]kneesimndash17 suggestive of a verydifferent star formation history when compared to GES Sequoia and Arjuna
stars match the abundances of MgAlCa In conclusion when repli-cating the procedure performed by Matsuno et al (2021) on the basisof APOGEE data we find that the majority of our sample (gt90)falls within 2120590 of the [XFe]-[FeH] quadratic polynomial fit to theGES sample This test confirms our finding that Sequoia and GES arevery similar in the chemical space sampled by APOGEE The reasonfor the discrepancy between our results and those by Matsuno et al(2021) is unclear
In summary we conclude that the chemical composition dataare possibly consistent with a common origin between Sequoia andGES although further data and modeling are required to fully clarifythe matter
614 Helmi stream
The Helmi stream is a halo substructure that appears to jut out of theGalactic disc It is characterised by stars on highly perpendicular (iehigh Lperp and vz) and prograde orbits (Helmi et al 1999 Koppelmanet al 2019b) which appear to form a pillar at high orbital energies inthe progradewing of the E-L119911 plane (see Fig 4) Despite this substruc-ture being discovered decades ago its chemical compositions havenot been studied in great detail largely due to the difficulty of ob-taining a high confidence sample with reliable chemical compositioninformation
Our results on the chemical compositions of the Helmi streamimply that unsurprisingly this substructure presents chemistry thatis typical of accreted populations andor dwarf satellites (ie lowMg Al C and Ni) We also find that despite it being selected purelyon a kinematic and position basis it occupies the accretedunevolvedregion of the [MgMn]-[AlFe] which combined with its orbital prop-erties confirms its accreted nature Furthermore we find that whencomparing this halo substructure with the others studied in this workthe Helmi stream differs statistically from all other halo substruc-tures In Figure 19 we display the data for the Helmi stream alongsidea piecewise polynomial fit performed in the same way as describedfor GES and the Sequoia samples Interestingly the best fit for theHelmi stream indicate the occurrence of an ldquoinverted kneerdquo wherebythe slope of the relation between Mg-Fe becomes less negative As
MNRAS 000 1mdash-33 (2021)
24 D Horta et al
discussed above for the case of the Sgr dSph this is the signature of aburst of star formation This is a very interesting result which meritsfurther investigation on the basis of a larger sample
615 Arjuna
The existence of this substructure was proposed byNaidu et al (2020)as part of the H3 survey (Conroy et al 2019) Naidu et al (2020) showthat the MDF of the retrograde component of the halo displays threepeaks which they ascribe to Arjuna (the most metal-rich) Sequoiaand Irsquoitoi (the most metal-poor see Fig 3) Naidu et al (2021) arguethat Arjuna corresponds to the outer parts of the GES progenitorwhich according to their fiducial numerical simulation was strippedearly in the accretion process thus preserving the highly retrogradenature of the GES approaching orbit In additional support to thatproposition Naidu et al (2021) point out that the peak [FeH] andmean [120572Fe] of Arjuna are in excellent agreement with those of GESwhich in turn should be consistent with a much lower metallicitygradient in the GES progenitor than suggested by Koppelman et al(2020)
The detailed quantitative comparison of the chemical compo-sitions of Arjuna and GES (Figure 15) shows that the similarity ofthese two systems indeed encompasses a broader range of elementalabundances leading to a 1199011205942 = 088 In addition the distributions ofArjuna and GES stars in the 120572-Fe plane are also very similar withthe two values for [FeH]knee agreeing within 005 dex (see Fig 19)
Therefore our results are at face value in agreementwith the sug-gestion by Naidu et al (2021) that the stars associated with the Arjunasubstructure were originally part of GES That association predictsa very low metallicity gradient for GES at the time of the mergerwith the Milky Way Further theoretical and observational work isrequired to ascertain the reality of that prediction (see discussion ineg Horta et al 2021a Naidu et al 2021)
616 Irsquoitoi
Similarly to Arjuna the Irsquoitoi substructure is a high-energy retrogradesubstructure identified byNaidu et al (2020)However it is comprisedby more metal-poor stars (see Fig 3) than its high-energy retrogradecounterparts Arjuna and Sequoia Naidu et al (2021) propose thatIrsquoitoi was in fact a satellite of GES based on its low metallicityand high energy retrograde orbit Our detailed comparison of thechemistry of GES and Irsquoitoi suggests that their abundance patternsare consistent with a 1199011205942 = 03 (Figure 16) We point out howeverthat this result is highly uncertain given the relatively small size ofour Irsquoitoi sample and its low metallicity ([FeH]comp = minus21) whichplaces its stars in a regime where ASPCAP abundances are relativelyuncertain The matter needs revisiting on the basis of more detailedchemical composition studies applied to a larger sample
617 Thamnos
Initially conjectured by its discoverers to be the amalgamation of twosmaller systems (Koppelman et al 2019c) Thamnos is a substruc-ture that occupies a locus in the retrograde wing of the velocity andIoM planes It is comprised of stars with intermediate orbital energy(ie Esimndash18times105 km2 sminus2) and fairly eccentric orbits (119890sim05) thatoccupies a position at the foot of GES in the Toomre diagram
As in the case of most orbital substructures in this study we findthat the locus occupied by Thamnos in the Ni-Fe C-Fe and [MgMn]-[AlFe] chemical planes resembles that of low-mass satellite galaxiesand accreted populations of the Milky Way However Thamnos dis-tinguishes itself from other substructures by showing a relatively high[120572Fe] ratio although not as high as Heracles In fact Thamnos doesnot match the abundance pattern of any other substructure in thisstudy
618 Aleph
Aleph was identified in a study of the stellar halo based on the H3survey (Naidu et al 2020) In this workwe identify Alephmembers byselecting fromour parent sample stars that satisfy the selection criteriaoutlined in Naidu et al (2020)We have also searched for stars that areincluded in both the sample by Naidu et al (2020) and in APOGEEDR17 (highlighted in the chemical abundance figures with purpleedges) As described in their work this substructure is comprised ofstars on very strongly prograde orbits with low eccentricity whichappear to follow the same distribution as the Galactic disc componentalthough at higher J119911 values
We find that the locus occupied by Aleph in various chemicalplanes is placed somewhere in between low- and high-120572 disc starswhile sitting squarelywithin the in situ region of the [MgMn]-[AlFe]plane This is also the case for the two stars contained in both thesample by Naidu et al (2020) and in the APOGEE DR17 data Ourquantitative comparison of the Aleph chemistry with that of the low-120572disc suggests a statistically different albeit on the borderline (1205942 =1947 and 1199011205942 = 005) This is in fact not surprising seeing as thedistribution of Aleph stars on the Mg-Fe plane straddles both the highand low-120572 discs (Figure 6) These results suggest that Aleph may bea stellar population comprised of a mix of warpedflared low-120572 discand high-120572 disc stars which also explains its location within the locusof in situ stellar populations in the [MgMn]-[AlFe] plane
619 LMS-1
LMS-1 is a metal-poor substructure comprised of stars on mildlyprograde orbits at intermediatehigh orbital energies Yuan et al(2020) identified this substructure by applying a clustering algo-rithm to SDSS and LAMOST data in the E-L119911 plane Although itpresents great overlap with the GES in IoM space it is suggested tobe an independent substructure based on the detection of a metallicitypeak in the MDF of the stars included within the E-L119911 box definingthis system (Naidu et al 2020) Yuan et al (2020) also note thatthere are potentially several globular clusters with similar metallicityand orbital properties In this work we identified LMS-1 candidatesadopting the same selection criteria as Naidu et al (2020)rsquos obtaininga relatively small sample of only 31 stars
We examine the distribution of LMS-1 stars in various chemicalplanes concluding that its chemistry is consistent with those of otheraccreted systems with all its stars falling in the accretedunevolvedregion of the [MgMn]-[AlFe] plane Furthermore the sim05 proba-bility value obtainedwhen comparing this halo substructurewithGESsuggests that at face value LMS-1 could be part of either of the om-nipresent GES substructure However these comparisons are madeat [FeH]comp = minus21 where our samples are small and ASPCAPabundances are relatively more uncertain and in situ and accretedstructures tend to converge towards the same locus in the regions ofchemical space sampled byAPOGEE (eg Horta et al 2021a)More-over given its location in IoM space it is possible that our LMS-1sample is importantly contaminated by GES stars
As mentioned in Section 614 Jean-Baptiste et al (2017) showthat a single accretion event can lead to multiple overdensities inorbital space (see also Koppelman et al 2020) Due to the chemicalsimilarity between LMS-1 and GES and the close proximity betweenthese two halo substructures in orbital planes (see Fig 4) an associa-tion between these two systems seems tempting However we defera firmer conclusion to a future when more elemental abundances areobtained for a larger sample of both LMS-1 and GES candidates
6110 Nyx
The Nyx substructure is conjectured to be a stellar stream in the solarvicinity of the Milky Way (Necib et al 2020) Given the chemicalcompositions obtained for this substructure in this work and its strong
MNRAS 000 1mdash-33 (2021)
Substructure in the Galactic stellar halo 25
overlap with the high-120572 disc in all the chemical planes studied wesuggest that the Nyx is likely comprised by in situ high-120572 disc popula-tions Our quantitative estimate of the similarity between Nyx and thestars from the high-120572 disc yields a very low 1205942 with associated like-lihood probability of 08 We note that the stars in common betweenour sample and that of Necib et al (2020) seem to boldly confirm thisresult Along these lines we note that our result is in agreement witha recent study focused on studying the chemical compositions of theNyx substructure (Zucker et al 2021) who also conjecture Nyx to becomprised of Galactic (high-120572) disc populations
7 CONCLUSIONS
The unequivocal association with accretion events of halo substruc-tures identified on the basis of orbital information alone is extremelydifficult as demonstrated by recent numerical simulations (eg Jean-Baptiste et al 2017 Koppelman et al 2020 Naidu et al 2021)Substructure in integrals of motion space can also be influenced oreven artificially created by survey selection effects (Lane et al 2021)Because the chemical compositions of halo substructures contain afossilised record of the evolutionary histories of their parent galax-ies abundance pattern information can help linking substructure inorbital space to their progenitor systems
In this work we have utilised a cross-matched catalogue of thelatest APOGEE (DR17) and Gaia (EDR3) data releases in orderto study the chemo-dynamic properties of substructures previouslyidentified in the stellar halo of the Milky Way We have successfullydistinguished stars in the APOGEEDR17 catalogue that are likely as-sociated with the following substructures Gaia-EnceladusSausageSagittarius dSph Heracles Helmi stream Sequoia Thamnos AlephLMS-1 Arjuna Irsquoitoi Nyx Icarus and Pontus Using the wealth ofchemical composition information provided by APOGEE we haveexamined the distributions of the stellar populations associated withthese substructures in a range of abundance planes probing differentnucleosynthetic channels We performed a quantitative comparisonof the abundance patterns of all the substructures studied in order toevaluate their mutual associations or lack thereof Below we sum-marise our main conclusions
bull We show that the chemical compositions of the majority of thehalo substructures so far identified in theGalactic stellar halo (namelyGaia-EnceladusSausage Heracles Sagittarius dSph Helmi streamSequoia Thamnos LMS-1 Arjuna Irsquoitoi) present chemical com-positions which resemble those of low-mass satellites of the MWandor accreted populations There are however a couple of excep-tions namely Nyx and Aleph that do not follow this pattern andinstead present chemical properties similar to those of populationsformed in situ Furthermore in Appendix A we discuss the nature ofIcarus concluding that this substructure is likely comprised of starsformed in situ for which the ASPCAP abundances are unreliable
bull The chemical properties of the inner-Galaxy Heracles substruc-ture differ from those of its co-located low-metallicity high-120572 disccounterparts in a statistically significant way Abundances of 120572 el-ements oxygen magnesium and silicon are lower in Heracles thanin its co-spatial high-120572 disc counterparts suggesting that the ratio ofSNIISNIa enrichment in Heracles has been lower in that system thanin the early disc By the same token Heracles is found to have higher[120572Fe] ratios than GES which as suggested by Horta et al (2021a)is an indication of an early truncation of star formation and the re-sulting absence of an 120572-knee in the former system The abundancepattern of Heracles is indeed found to differ from all of the other sub-structures studied in this work Further studies based on additionalelemental abundances for larger samples as well as detailed numer-ical modelling are required to definitively ascertain the existence ofthis system and more thoroughly characterise its properties
bull We show that a large fraction of the substructures studied
(namely Sequoia Arjuna LMS-1 Irsquoitoi) present chemistry indis-tinguishable from that of the omnipresent Gaia-EnceladusSausageThese findings bring into question the independence of these substruc-tures which are at least partially overlapping with GES in kinematicplanes (see Fig 4) In view of these similarities claims in the litera-ture about the nature of Sequoia as being originally a higher angularmomentum component located in the outskirts of GES (Koppelmanet al 2020) a satellite of GES (Naidu et al 2021) or an altogetherunrelated system (Myeong et al 2019) may need to be reexaminedThe possibility that Sequoia was a detached but much less massivegalaxy than GES is likely challenged by their chemical similarity Onthe other hand confirmation that it or Arjuna might be the remainsof populations originally located in the outskirts of GES dependscrucially on the magnitude of chemical composition gradients oneshould expect for dwarf galaxies at 119911 asymp 2 and on whether that is asufficiently discriminating criterion
bull Wefound that the halo hosts substructureswhich differ fromGESin a statistically significant way Three among those susbstructuresdisplay chemistry that is genuinely suggestive of an accreted naturenamely Heracles Thamnos and the Helmi stream (although for thelatter this conclusion is not firm due to uncertainties in the chemistryand small sample size)
bull Conversely the chemistry of the two remaining substructuresNyx and Aleph is indistinguishable from that of in situ populationsWe conjecture that Nyx forms part of the high-120572 disc For the caseof Aleph we suggest that it is likely comprised of stars both from thelow-120572 (flaredwarped) disc as well as stars from the high-120572 disc
bull Our results suggest that the localinner (R119866119862 20kpc) halo iscomprised of the debris from at least three massive accretion events(HeraclesGES and Sagittarius) and two lowermass debris (Thamnosand Helmi stream) Upcoming large spectroscopic surveys probingdeeper into the outer regions of the stellar halo (beyond R119866119862 sim20kpc)will likely uncover the debris from predicted lower-massmore recentaccretions (eg van den Bosch et al 2016 Horta et al 2022 inprep) andwill enable the full characterisation of those already knownConversely the precise contribution of massive accretion to the stellarpopulations content of the inner few kpc of the halo is still to be fullygauged Heracles is likely the result of a real accretion event likelythe most massive to have ever happened in the history of the MilkyWay but we are still scratching its surface
This paper presents a chemical composition study of substruc-tures identified (primarily) on the basis of phase-space and orbitalinformation in the stellar halo of the Milky Way Current and up-coming surveys will continue to map the stellar halo and will providefurther clues to the nature and reality of phase-space substructuresdiscovered in recent years For the inner regions of the Galaxy andthe local halo the Milky Way Mapper (Kollmeier et al 2017) andthe Galactic component of the MOONS GTO survey (Gonzalez et al2020) will provide revolutionising chemo-dynamical information formassive samples For the outer regions of the stellar halo theWEAVE(Dalton et al 2012) 4MOST (de Jong et al 2019) and DESI (DESICollaboration et al 2016) surveys will provide spectroscopic data formillions of stars in both high and low resolution In addition in thiswork we have only studied the chemistry of phase-mixed accretionevents However there is a plethora of halo substructures in the formof stellar streams that has not been studied in this work and alsorequire to be fully examined (see Li et al 2021 for a recent exam-ple) The advent of surveys like 1198785 (Li et al 2019) will aid in suchendeavours All this information when coupled with the exquisiteastrometry and upcoming spectroscopic information from the Gaiasatellite will provide the necessary information for further discover-ies and examinations of substructure in the stellar halo of the MilkyWay
MNRAS 000 1mdash-33 (2021)
26 D Horta et al
ACKNOWLEDGEMENTS
The authors thank Rohan Naidu and Charlie Conroy for making avail-able the H3 catalogue in digital format and Paola Re Fiorentin andAlessandro Spagna for sharing their Icarus starrsquos APOGEE IDs DHthanksMelissa Ness Holger Baumgardt and CullanHowlett for help-ful scientific discussions and Sue Alex and Debra for their constantsupport DG gratefully acknowledges financial support from the Di-reccioacuten de Investigacioacuten y Desarrollo de la Universidad de La Serenathrough the Programa de Incentivo a la Investigacioacuten de Acadeacutemicos(PIA-DIDULS) Funding for the Sloan Digital Sky Survey IV hasbeen provided by the Alfred P Sloan Foundation the US Depart-ment of Energy Office of Science and the Participating InstitutionsSDSS acknowledges support and resources from the Center for High-Performance Computing at the University of Utah The SDSS website is wwwsdssorg SDSS ismanaged by theAstrophysical ResearchConsortium for the Participating Institutions of the SDSS Collabora-tion including the Brazilian Participation Group the Carnegie Insti-tution for Science Carnegie Mellon University the chilean Partici-pation Group the French Participation Group Harvard-SmithsonianCenter for Astrophysics Instituto de Astrofiacutesica de Canarias TheJohns Hopkins University Kavli Institute for the Physics and Math-ematics of the Universe (IPMU) University of Tokyo the KoreanParticipation Group Lawrence Berkeley National Laboratory Leib-niz Institut fuumlr Astrophysik Potsdam (AIP) Max-Planck-Institut fuumlrAstronomie (MPIAHeidelberg)Max-Planck-Institut fuumlr Astrophysik(MPA Garching) Max-Planck-Institut fuumlr Extraterrestrische Physik(MPE) National Astronomical Observatories of china New MexicoState University New York University University of Notre DameObservatAtildeşrio Nacional MCTI The Ohio State University Pennsyl-vania State University Shanghai Astronomical Observatory UnitedKingdom Participation Group Universidad Nacional AutAtildeşnoma deMAtildeľxico University of Arizona University of Colorado BoulderUniversity of Oxford University of Portsmouth University of UtahUniversity of Virginia University of Washington University of Wis-consin Vanderbilt University and Yale University
This work presents results from the European Space Agency(ESA) space mission Gaia Gaia data are being processed by the GaiaData Processing and Analysis Consortium (DPAC) Funding for theDPAC is provided by national institutions in particular the institutionsparticipating in the Gaia MultiLateral Agreement (MLA) The Gaiamissionwebsite is httpswwwcosmosesaintgaia TheGaia archivewebsite is httpsarchivesesacesaintgaia
Software Astropy (Astropy Collaboration et al 2013 Price-Whelan et al 2018) SciPy (Virtanen et al 2020) NumPy (Oliphant06 ) Matplotlib (Hunter 2007) Galpy (Bovy 2015 Mackereth ampBovy 2018) TOPCAT (Taylor 2005)
Facilities Sloan Foundation 25m Telescope of Apache PointObservatory (APOGEE-North) Ireacuteneacutee du Pont 25mTelescope of LasCampanas Observatory (APOGEE-South) Gaia satelliteEuropeanSpace Agency (Gaia)
DATA AVAILABILITY
All APOGEE DR17 data used in this study is publicly available andcan be found at https wwwsdssorgdr17
REFERENCES
Abdurrorsquouf et al 2021 arXiv e-prints p arXiv211202026Aguado D S et al 2020 arXiv e-prints p arXiv201201430Allende Prieto C Beers T C Wilhelm R Newberg H J Rockosi C MYanny B Lee Y S 2006 ApJ 636 804
An D Beers T C 2021 arXiv e-prints p arXiv210409737Astropy Collaboration et al 2013 aap 558 A33
Barbaacute R H Minniti D Geisler D Alonso-Garciacutea J Hempel M MonachesiA Arias J I Goacutemez F A 2019 ApJ 870 L24
Beaton R L et al 2021 arXiv e-prints p arXiv210811907Belokurov V et al 2006 ApJ 642 L137Belokurov V Erkal D Evans N W Koposov S E Deason A J 2018MNRAS 478 611
Belokurov V Sanders J L Fattahi A Smith M C Deason A J EvansN W Grand R J J 2020 MNRAS 494 3880
Bennett M Bovy J 2019 MNRAS 482 1417Bensby T Feltzing S Oey M S 2014 AampA 562 A71Binney J 2012 MNRAS 426 1324Birky J Hogg D W Mann A W Burgasser A 2020 The AstrophysicalJournal 892 31
Bland-Hawthorn J Gerhard O 2016 ARAampA 54 529Blanton M R et al 2017 AJ 154 28Bonaca A Conroy C Wetzel A Hopkins P F Kereš D 2017 ApJ 845101
Bovy J 2015 ApJS 216 29Bovy J et al 2014 ApJ 790 127Bovy J Leung HW Hunt J A S Mackereth J T Garciacutea-Hernaacutendez D ARoman-Lopes A 2019 MNRAS 490 4740
Bowen I S Vaughan A H J 1973 Appl Opt 12 1430Buder S et al 2022 MNRAS 510 2407Carlin J L Sheffield A A Cunha K Smith V V 2018 ApJ 859 L10Carrillo A Hawkins K Jofreacute P de Brito Silva D Das P Lucey M 2022arXiv e-prints p arXiv220210416
Conroy C et al 2019 ApJ 883 107Cunha K et al 2017 ApJ 844 145DESI Collaboration et al 2016 arXiv e-prints p arXiv161100036Dalton G et al 2012 inMcLean I S Ramsay S K Takami H eds Societyof Photo-Optical Instrumentation Engineers (SPIE) Conference SeriesVol 8446 Ground-based and Airborne Instrumentation for AstronomyIV p 84460P doi10111712925950
Das P Hawkins K Jofreacute P 2020 MNRAS 493 5195De Silva G M et al 2015 MNRAS 449 2604Deason A J Belokurov V Sanders J L 2019 MNRAS 490 3426Eilers A-C Hogg D W Rix H-W Ness M K Price-Whelan A MMeszaros S Nitschelm C 2021 arXiv e-prints p arXiv211203295
Eisenstein D J et al 2011 AJ 142 72Feuillet D K Feltzing S Sahlholdt C L Casagrande L 2020 MNRAS497 109
Feuillet D K Sahlholdt C L Feltzing S Casagrande L 2021 MNRAS508 1489
Forbes D A 2020 MNRAS 493 847Fragkoudi F et al 2020 MNRAS 494 5936Gaia Collaboration et al 2018 AampA 616 A1Gaia Collaboration Brown A G A Vallenari A Prusti T de Bruijne J H JBabusiaux C Biermann M 2020a arXiv e-prints p arXiv201201533
Gaia Collaboration Brown A G A Vallenari A Prusti T de Bruijne J H JBabusiaux C Biermann M 2020b arXiv e-prints p arXiv201201533
Gallino R Arlandini C Busso M Lugaro M Travaglio C Straniero OChieffi A Limongi M 1998 ApJ 497 388
Garciacutea Peacuterez A E et al 2016 AJ 151 144Goacutemez F A Minchev I OrsquoShea B W Beers T C Bullock J S PurcellC W 2013 MNRAS 429 159
Gonzalez O A et al 2020 The Messenger 180 18Gravity Collaboration et al 2019 AampA 625 L10Gunn J E et al 2006 AJ 131 2332Hasselquist S et al 2017 ApJ 845 162Hasselquist S et al 2019 ApJ 872 58Hasselquist S et al 2021 arXiv e-prints p arXiv210905130Hawkins K Jofreacute P Masseron T Gilmore G 2015 MNRAS 453 758Hayes C R et al 2018 ApJ 852 49Hayes C R et al 2020 ApJ 889 63Haywood M Di Matteo P Lehnert M D Snaith O Khoperskov S GoacutemezA 2018 ApJ 863 113
Helmi A White S D M de Zeeuw P T Zhao H 1999 Nature 402 53Helmi A Babusiaux C Koppelman H H Massari D Veljanoski J BrownA G A 2018 Nature 563 85
Hogg D W Eilers A-C Rix H-W 2019 The Astronomical Journal 158147
Horta D et al 2020 MNRAS 493 3363Horta D et al 2021a MNRAS 500 1385
MNRAS 000 1mdash-33 (2021)
Substructure in the Galactic stellar halo 27
Horta D et al 2021b MNRAS 500 5462Hunter J D 2007 Computing In Science amp Engineering 9 90Ibata R A Gilmore G Irwin M J 1994 Nature 370 194Ibata R A Wyse R F G Gilmore G Irwin M J Suntzeff N B 1997 AJ113 634
Ibata R Irwin M Lewis G F Stolte A 2001 ApJ 547 L133Jean-Baptiste I DiMatteo P HaywoodM GoacutemezAMontuoriM CombesF Semelin B 2017 AampA 604 A106
Jekel C F Venter G 2019 pwlf A Python Library for Fitting 1D Con-tinuous Piecewise Linear Functions httpsgithubcomcjekelpiecewise_linear_fit_py
Johnston K V Spergel D N Hernquist L 1995 ApJ 451 598Johnston K V Law D R Majewski S R 2005 ApJ 619 800Joumlnsson H et al 2020 arXiv e-prints p arXiv200705537Kobayashi C Karakas A I Lugaro M 2020 ApJ 900 179Kollmeier J A et al 2017 SDSS-V Pioneering Panoptic Spectroscopy(arXiv171103234)
Koposov S E et al 2012 ApJ 750 80Koppelman H H Helmi A Massari D Price-Whelan A M StarkenburgT K 2019a arXiv e-prints p arXiv190908924
Koppelman H H Helmi A Massari D Roelenga S Bastian U 2019bAampA 625 A5
Koppelman H H Helmi A Massari D Price-Whelan A M StarkenburgT K 2019c AampA 631 L9
Koppelman H H Bos R O Y Helmi A 2020 AampA 642 L18Kruijssen J M D et al 2020 arXiv e-prints p arXiv200301119Lane J M M Bovy J Mackereth J T 2021 arXiv e-prints parXiv210609699
Law D R Majewski S R 2010 ApJ 714 229Law D R Johnston K V Majewski S R 2005 ApJ 619 807Leung H W Bovy J 2019a MNRAS p 2167Leung H W Bovy J 2019b MNRAS 483 3255Li T S et al 2019 MNRAS 490 3508Li T S et al 2021 arXiv e-prints p arXiv211006950Mackereth J T Bovy J 2018 PASP 130 114501Mackereth J T Bovy J 2020 MNRAS 492 3631Mackereth J T et al 2019 MNRAS 482 3426Majewski S R Skrutskie M F Weinberg M D Ostheimer J C 2003 ApJ599 1082
Majewski S R et al 2017 AJ 154 94Malhan K et al 2022 ApJ 926 107Matsuno T Aoki W Suda T 2019 ApJ 874 L35Matsuno T Hirai Y Tarumi Y Hotokezaka K Tanaka M Helmi A 2021AampA 650 A110
Matteucci F Greggio L 1986 AampA 154 279McMillan P J 2017 MNRAS 465 76McWilliam A 1997 ARAampA 35 503Montalbaacuten J et al 2020 arXiv e-prints p arXiv200601783Monty S Venn K A Lane J M M Lokhorst D Yong D 2020 MNRAS497 1236
Myeong G C Vasiliev E Iorio G Evans N W Belokurov V 2019 MN-RAS 488 1235
Naidu R P Conroy C Bonaca A Johnson B D Ting Y-S Caldwell NZaritsky D Cargile P A 2020 arXiv e-prints p arXiv200608625
Naidu R P et al 2021 arXiv e-prints p arXiv210303251Necib L et al 2020 Nature AstronomyNewberg H J Yanny B Willett B A 2009 ApJ 700 L61Nidever D L et al 2015 AJ 150 173Nissen P E Schuster W J 1997 AampA 326 751Nissen P E Schuster W J 2010 AampA 511 L10Oliphant T 2006ndash NumPy A guide to NumPy USA Trelgol Publishinghttpwwwnumpyorg
Pfeffer J Lardo C Bastian N Saracino S Kamann S 2021 MNRAS 5002514
Price-Whelan A M et al 2018 aj 156 123Purcell C W Bullock J S Tollerud E J Rocha M Chakrabarti S 2011Nature 477 301
Re Fiorentin P Spagna A Lattanzi M G Cignoni M 2021 ApJ 907 L16Reggiani H Meleacutendez J Kobayashi C Karakas A Placco V 2017 AampA608 A46
Reid M J Brunthaler A 2020 ApJ 892 39Santana F A et al 2021 arXiv e-prints p arXiv210811908Schiavon R P et al 2017 MNRAS 465 501
Schoumlnrich R Binney J Dehnen W 2010 MNRAS 403 1829Searle L Zinn R 1978 ApJ 225 357Shetrone M Venn K A Tolstoy E Primas F Hill V Kaufer A 2003 AJ125 684
Simpson J D et al 2020 arXiv e-prints p arXiv201102659Smith V V et al 2021 AJ 161 254Sneden C Cowan J J Gallino R 2008 ARAampA 46 241Souto D et al 2020 ApJ 890 133Steinmetz M et al 2020 AJ 160 83Taylor M B 2005 in Shopbell P Britton M Ebert R eds AstronomicalSociety of the Pacific Conference Series Vol 347 Astronomical DataAnalysis Software and Systems XIV p 29
Tolstoy E Hill V Tosi M 2009 ARAampA 47 371Vasiliev E Belokurov V 2020 MNRAS 497 4162Villalobos Aacute Helmi A 2008 MNRAS 391 1806Vincenzo F Spitoni E Calura F Matteucci F Silva Aguirre V Miglio ACescutti G 2019 MNRAS 487 L47
Virtanen P et al 2020 Nature Methods 17 261Weinberg D H et al 2019 ApJ 874 102Weinberg D H et al 2021 arXiv e-prints p arXiv210808860Wetzel A R 2011 MNRAS 412 49Wheeler J C Sneden C Truran James W J 1989 ARAampA 27 279Wilson J C et al 2019 PASP 131 055001Yanny B et al 2009a AJ 137 4377Yanny B et al 2009b ApJ 700 1282Yuan Z Chang J Beers T C Huang Y 2020 ApJ 898 L37Zasowski G et al 2013 AJ 146 81Zasowski G et al 2017 AJ 154 198Zhao G Zhao Y-H Chu Y-Q Jing Y-P Deng L-C 2012 Research inAstronomy and Astrophysics 12 723
Zucker D B et al 2021 arXiv e-prints p arXiv210408684de Jong R S et al 2019 The Messenger 175 3van den Bosch F C Jiang F Campbell D Behroozi P 2016 MNRAS 455158
1 Astrophysics Research Institute 146 Brownlow Hill Liverpool L35RF UK2 School of Mathematics and Physics The University of QueenslandSt Lucia QLD 4072 Australia3 Canadian Institute for Theoretical Astrophysics University ofToronto Toronto ON M5S 3H8 Canada4Dunlap Institute for Astronomy and Astrophysics University ofToronto Toronto ON M5S 3H4 Canada5 Department of Astronomy and Center for Cosmology and AstroPar-ticle Physics Ohio State University Columbus OH 43210 USA6Space Telescope Science Institute 3700 San Martin Drive Balti-more MD 21218 USA7 Lund Observatory Department of Astronomy and TheoreticalPhysics Box 43 SE-221 00 Lund Sweden8 Department of Astronomy University of Virginia CharlottesvilleVA 22904-4325 USA9 Instituto de Astrofiacutesica de Canarias (IAC) E-38205 La LagunaTenerife Spain10 Universidad de La Laguna (ULL) Departamento de AstrofiacutesicaE-38206 La Laguna Tenerife Spain11The Observatories of the Carnegie Institution for SciencePasadena CA 91101 USA12New Mexico State University Las Cruces NM 88003 USA13 University of Arizona Tucson AZ 85719 USA14 Observatoacuterio Nacional Satildeo Cristoacutevatildeo Rio de Janeiro Brazil15 Departamento de Astronomiacutea Casilla 160-C Universidad de Con-cepcioacuten Chile16 Instituto de Investigacioacuten Multidisciplinario en Ciencia y Tec-nologiacutea Universidad de La Serena Avenida Rauacutel Bitraacuten SN LaSerena Chile17 Departamento de Astronomiacutea Facultad de Ciencias Universidadde La Serena Av Juan Cisternas 1200 La Serena Chile18 Materials Science and Applied Mathematics Malmouml UniversitySE-205 06 Malmouml Sweden19 Centro de Investigacioacuten en Astronomiacutea Universidad Bernardo
MNRAS 000 1mdash-33 (2021)
28 D Horta et al
OrsquoHiggins Avenida Viel 1497 Santiago Chile20 Gothard Astrophysical Observatory ELTE Eotvoumls Loraacutend Univer-sity 9700 Szombathely Szent Imre H st 112 Hungary21 MTA-ELTE Lenduumllet Momentum Milky Way Research GroupHungary22 Departamento de Ciencias Fisicas Facultad de Ciencias Exac-tas Universidad Andres Bello Av Fernandez Concha 700 SantiagoChile23 Vatican Observatory V00120 Vatican City State Italy24Centro de Astronomiacutea (CITEVA) Universidad de AntofagastaAvenida Angamos 601 Antofagasta 1270300 Chile25 University of Texas at Austin McDonald Observatory TX 79734-3005 USA26National Optical Astronomy Observatories Tucson AZ 85719USA27 Department of Physicsamp Astronomy University of Utah Salt LakeCity UT 84105 USA
APPENDIX A THE REALITY OF ICARUS
The Icarus substructure is a metal-poor [MgFe]-poor structure thatwas identified by Re Fiorentin et al (2021) using the APOGEE DR16and GALAH DR3 data We have attempted to identify Icarus starmembers by employing the criteria listed byRe Fiorentin et al (2021)and identified only one potential member within the parent sampledescribed in Section 219 We thus decided to retrieve the DR17properties of the 41 Icarus stars presented by Re Fiorentin et al(2021) on the basis of APOGEE DR16 data
We found that only 3 out of the 41 Icarus candidates have Teffand log 119892 characteristic of red giant stars The remaining 38 starshave stellar parameters consistent with a main sequence or subgiantnature (Figure A1) which is the reason why the selection criteriadescribed in Section 2 excluded them from our parent sample Thisfinding is confirmed by the positions of the Icarus member samplein the Gaia colour-magnitude diagram shown in Figure A2 Icaruswas conjectured to be an accreted substructure in the Galactic discbased largely on chemical abundance informationHowever elementalabundances for sub-giant and main-sequence and particularly forM dwarfs were not very reliable in APOGEE DR16 (although seeBirky et al 2020 Souto et al 2020) Therefore we decided to performsome checks to see if the resulting abundances for these (primarily)M dwarf stars are reliable in APOGEE DR17
We checked the STARminusFLAG and ASPCAPminusFLAG flags of the41 Icarus stars determined by Re Fiorentin et al (2021) Theresults from this examination showed that i) 2541 stars hada BRIGHTminusNEIGHBOUR PERSISTminusHIGH PERSISTminusLOWLOWminusSNR SUSPECTminusBROADminusLINES SUSPECTminusROTATIONMULTIPLEminusSUSPECT flag set in their STARminusFLAG suggestingthe occurrence of various issues with the observed spectra ofthese stars which can lead up to uncertainties in stellar pa-rameters and elemental abundances ii) 4041 stars had one ormore of the following ASPCAP_FLAGs raised STARminusWARNCOLOURminusTEMPERATUREminusWARN SNminusWARN VSINIminusWARNVMICROminusWARN NminusMminusWARN TEFFminusWARN LOGGminusWARNsuggesting that the results from the ASPCAP analysis for these starsare likely uncertain
In light of these results we chose to exclude Icarus from thisstudy and suggest that this substructure is not the debris from a can-nibalised dwarf galaxy but is rather likely comprised of (primarily)M-dwarf stars with unreliable APOGEE abundances in the disc ofthe Milky Way
Figure A1Kiel diagram of the parent sample used in this work the Icarus staridentified in this paper (purple) and the Icarus stars identified by Re Fiorentinet al (2021) (yellow) using APOGEE DR17 data
Figure A2 The same samples as in Fig A1 now in theGaia colour magnitudediagram using Gaia EDR3 data
APPENDIX B THE CHEMICAL COMPOSITIONS OFPONTUS ACCORDING TO APOGEE
As we have only been able to identify two star members belonging tothe Pontus halo substructure we will refrain from making any strongstatement about its chemistry However based solely on the chemicalcompositions of the two member stars we have identified in this workwe find that the Pontus substructure presents elevated abundancesin 120572-elements (namely in O Mg Si) low C Al Ti and Ce andapproximately solar Mn and Ni The two stars we find associatedwith the Pontus substructure display similar chemical compositionsto that of other halo substructures andor satellite galaxies of theMilky Way Although it is impossible to attribute any similarities ordifferences on the basis of two stars alone given the close proximitybetween these two Pontus stars and Thamnos in the E-L119911 plane it istempting to associate the former to the later However a larger sampleof Pontus stars with reliable chemistry is required to ascertain thisspeculation
MNRAS 000 1mdash-33 (2021)
Substructure in the Galactic stellar halo 29
Figure B1 Pontus stars (light green points) in every chemical composition plane studied in this work from carbon to cerium We note that for the C and N plotswe restrict our sample to stars with 1 lt log119892 lt 2 to account for dredge-up effects in the red giant branch and for all abundances we also make the following cutsXminusFEminusFLAG = 0 and XminusFEminusERR lt 015 For the case of N Na Cr Co and Ce the XminusFEminusERR lt 015 restriction removes the two Pontus stars and for S it removesone
APPENDIX C CHEMICAL AND KINEMATICPROPERTIES OF HALO SUBSTRUCTURES
MNRAS 000 1mdash-33 (2021)
30 D Horta et al
Table C1Mean orbital parameter values for each substructure studied in this work We note that the the angular momentum actions orbital energy eccentricitymaximum height above the plane perigalacticon and apogalacticon are computed using the McMillan (2017) potential
Name (vRv120601 vz) (LxLyL119911 ) (JrJ120601 Jz)(kmsminus1) (kpc kmsminus1) (kpc kmsminus1)
Heracles (198plusmn10631 1166plusmn6819235plusmn9040)
(ndash163plusmn14857 ndash376plusmn190742647plusmn11723)
(10485plusmn7797 2942plusmn1169216081plusmn11525)
Gaia-EnceladusSausage
(ndash302plusmn17909 687plusmn4665569plusmn12371)
(1637plusmn46905 6990plusmn866591538plusmn26042)
(104302plusmn44916 2981plusmn2601073578plusmn65055)
Sagittarius (18478plusmn6670 10556plusmn1240212494plusmn6512)
(46023plusmn34539 398296plusmn13880773578plusmn86083)
(116412plusmn57514 71383plusmn87168303059plusmn123689)
Helmi stream (ndash3450plusmn13106 15067plusmn6045 ndash6337plusmn16474)
(ndash44924plusmn121039 10621plusmn166654116573plusmn27468)
(79340plusmn135224 117770plusmn28038135360plusmn56947)
Sequoia (GC) (3302plusmn16533 ndash17278plusmn103351701plusmn10654)
(54664plusmn85513 12407plusmn88985 ndash148330plusmn77886)
(114020plusmn68265 ndash146083plusmn7741251801plusmn40626)
Sequoia (field) (1782plusmn18071 ndash8964plusmn63592630plusmn15267)
(24073plusmn70825 10455plusmn99264 ndash70792plusmn32893)
(111681plusmn49320 ndash69200plusmn32336100038plusmn79471)
Sequoia (H3) (2949plusmn13960 ndash17134plusmn8995926plusmn13364)
(69457plusmn80568 22029plusmn102537 ndash143997plusmn77889)
(83867plusmn93226 ndash141729plusmn7759070911plusmn60928)
Thamnos (1305plusmn8702 ndash11838plusmn4033 ndash1271plusmn7143)
(9286plusmn29491 13309plusmn46147 ndash84980plusmn19288)
(26658plusmn9132 ndash82993plusmn1892818787plusmn14879)
Aleph (ndash404plusmn3855 21250plusmn2329ndash1404plusmn3363)
(ndash34582plusmn65652 ndash12449plusmn36904204006plusmn42291)
(4406plusmn3572 205517plusmn4270918846plusmn1046)
LMS-1 (561plusmn9313 12565plusmn34121673plusmn9498)
(ndash20177plusmn69843 6887plusmn9014782452plusmn13136)
(25487plusmn11066 83690plusmn1323666016plusmn47059)
Arjuna (2083plusmn17558 ndash15331plusmn86743347plusmn13344)
(61303plusmn102587 ndash417plusmn104382 ndash128314plusmn63218)
(147970plusmn209964 ndash126386plusmn6256577553plusmn66340)
Irsquoitoi (1961plusmn9941 ndash15635plusmn63475913plusmn13386)
(56258plusmn106428 ndash37526plusmn109275ndash136007plusmn42232)
(45574plusmn54887 ndash133853plusmn4192189737plusmn61583)
Nyx (13385plusmn2127 15801plusmn2621573plusmn4888)
(ndash5772plusmn16431 1724plusmn36547124237plusmn27675)
(29119plusmn10429 125834plusmn278255549plusmn5431)
MNRAS 000 1mdash-33 (2021)
Substructure in the Galactic stellar halo 31
Table C2 Table C1 continued
Name E (ecczmax119877peri119877apo)(km2sminus2) (ndashkpckpckpc)
Heracles ndash22486022plusmn1532244 (081plusmn012 167plusmn085033plusmn024 301plusmn102)
Gaia-EnceladusSausage
ndash14239472plusmn1251988 (093plusmn006 984plusmn614061plusmn103 1715plusmn522)
Sagittarius ndash10765444plusmn1715396 (069plusmn020 3574plusmn1768881plusmn734 3812plusmn1786)
Helmi stream ndash12768822plusmn1824458 (065plusmn015 1637plusmn937397plusmn136 2405plusmn2067)
Sequoia (GC) ndash12670632plusmn1789271 (073plusmn010 1111plusmn901413plusmn249 2655plusmn1452)
Sequoia (field) ndash12655368plusmn759299 (085plusmn005 1382plusmn605184plusmn078 2262plusmn572)
Sequoia (H3) ndash13265856plusmn2075816 (065plusmn013 1070plusmn1007422plusmn231 2288plusmn1663)
Thamnos ndash16997244plusmn553953 (057plusmn010 310plusmn160247plusmn070 905plusmn108)
Aleph ndash14604856plusmn955377 (018plusmn007 406plusmn056846plusmn200 1206plusmn273)
LMS-1 ndash15676637plusmn1049348 (061plusmn006 704plusmn275259plusmn054 1089plusmn195)
Arjuna ndash12502044plusmn2292119 (074plusmn012 1713plusmn2315370plusmn227 3173plusmn3498)
Irsquoitoi ndash13651256plusmn1819876 (055plusmn016 1087plusmn653484plusmn198 1809plusmn1051)
Nyx ndash16139810plusmn860429 (050plusmn008 158plusmn085378plusmn095 1120plusmn198)
MNRAS 000 1mdash-33 (2021)
32 D Horta et al
Table C3 Mean 〈[XFe]〉 abundance values for every halo substructure identified in this study As we only identified 2(1) stars belonging to Pontus(Icarus) weexclude these halo substructures from this table
〈[XFe]〉 Heracles Gaia-EnceladusSausage
Sagittarius Helmistream
Sequoia(GC)
Sequoia( 119891 119894119890119897119889)
〈[CFe]〉 ndash030plusmn018 ndash030plusmn029 ndash038plusmn014 ndash035plusmn036 ndash031plusmn032 ndash037plusmn023
〈[NFe]〉 026plusmn018 019plusmn037 004plusmn014 022plusmn033 013plusmn034 015plusmn035
〈[OFe]〉 032plusmn009 024plusmn019 ndash001plusmn008 027plusmn016 026plusmn017 024plusmn018
〈[NaFe]〉 ndash001plusmn042 002plusmn051 ndash034plusmn027 021plusmn048 014plusmn050 005plusmn051
〈[MgFe]〉 028plusmn006 016plusmn014 ndash003plusmn008 019plusmn014 017plusmn013 014plusmn016
〈[AlFe]〉 ndash013plusmn009 ndash021plusmn023 ndash044plusmn008 ndash025plusmn021 ndash029plusmn017 ndash028plusmn020
〈[SiFe]〉 025plusmn006 014plusmn013 ndash005plusmn010 016plusmn012 015plusmn010 013plusmn016
〈[CaFe]〉 019plusmn012 015plusmn018 001plusmn007 014plusmn016 016plusmn017 015plusmn019
〈[TiFe]〉 ndash004plusmn013 ndash004plusmn020 ndash015plusmn009 ndash011plusmn020 ndash007plusmn021 ndash009plusmn017
〈[CrFe]〉 ndash013plusmn033 ndash010plusmn040 ndash007plusmn019 ndash004plusmn036 ndash004plusmn041 ndash018plusmn040
〈[MnFe]〉 ndash032plusmn014 ndash028plusmn022 ndash020plusmn010 ndash023plusmn020 ndash033plusmn018 ndash028plusmn017
〈[CoFe]〉 ndash019plusmn036 ndash009plusmn044 ndash016plusmn015 ndash006plusmn037 ndash008plusmn044 ndash008plusmn042
〈[NiFe]〉 ndash003plusmn008 ndash007plusmn015 ndash014plusmn006 ndash006plusmn010 ndash011plusmn010 ndash009plusmn011
〈[CeFe]〉 ndash015plusmn024 ndash011plusmn036 ndash000plusmn026 ndash012plusmn034 ndash012plusmn042 ndash017plusmn039
〈[FeH]〉 ndash130plusmn021 ndash118plusmn042 ndash072plusmn034 ndash139plusmn055 ndash141plusmn036 ndash131plusmn037
Table C4 Table C3 continued
〈[XFe]〉 Sequoia(1198673))
Thamnos Aleph LMS-1 Arjuna Irsquoitoi Nyx
〈[CFe]〉 ndash025plusmn043 ndash017plusmn028 001plusmn007 ndash046plusmn023 ndash033plusmn022 ndash040plusmn059 007plusmn009
〈[NFe]〉 023plusmn039 012plusmn036 017plusmn008 029plusmn039 011plusmn029 023plusmn053 008plusmn016
〈[OFe]〉 031plusmn017 043plusmn013 019plusmn009 038plusmn011 023plusmn017 041plusmn012 033plusmn011
〈[NaFe]〉 044plusmn055 024plusmn057 002plusmn026 038plusmn049 ndash001plusmn046 071plusmn056 004plusmn032
〈[MgFe]〉 022plusmn013 033plusmn008 017plusmn006 028plusmn009 014plusmn013 034plusmn005 032plusmn008
〈[AlFe]〉 ndash033plusmn019 ndash006plusmn023 012plusmn007 ndash030plusmn010 ndash026plusmn020 ndash033plusmn007 024plusmn012
〈[SiFe]〉 017plusmn010 030plusmn010 010plusmn005 022plusmn007 014plusmn011 023plusmn007 021plusmn006
〈[CaFe]〉 017plusmn022 026plusmn018 006plusmn004 010plusmn027 017plusmn010 019plusmn048 017plusmn008
〈[TiFe]〉 ndash006plusmn029 001plusmn017 007plusmn010 ndash011plusmn020 ndash010plusmn016 004plusmn027 015plusmn009
〈[CrFe]〉 009plusmn045 ndash005plusmn040 ndash004plusmn011 ndash012plusmn040 ndash016plusmn037 023plusmn041 ndash005plusmn016
〈[MnFe]〉 ndash032plusmn022 ndash037plusmn018 ndash008plusmn005 ndash030plusmn022 ndash032plusmn017 001plusmn013 ndash015plusmn009
〈[CoFe]〉 007plusmn046 002plusmn041 002plusmn022 ndash002plusmn052 ndash013plusmn040 019plusmn046 006plusmn026
〈[NiFe]〉 ndash009plusmn014 ndash004plusmn012 003plusmn002 ndash005plusmn012 ndash009plusmn009 ndash001plusmn013 006plusmn004
〈[CeFe]〉 ndash013plusmn042 ndash013plusmn031 ndash012plusmn029 ndash017plusmn025 ndash013plusmn039 002plusmn035 ndash016plusmn029
〈[FeH]〉 ndash180plusmn009 ndash153plusmn036 ndash053plusmn017 ndash183plusmn025 ndash124plusmn024 ndash214plusmn010 ndash055plusmn029
MNRAS 000 1mdash-33 (2021)
Substructure in the Galactic stellar halo 33
APPENDIX D 120572-ELEMENTS
APPENDIX E (C+N)FE
APPENDIX F IRON-PEAK ELEMENTS
APPENDIX G ODD-Z ELEMENTS
APPENDIX H [FEH] USED TO COMPARESUBSTRUCTURES
This paper has been typeset from a TEXLATEX file prepared by the author
MNRAS 000 1mdash-33 (2021)
34 D Horta et al
Figure D1 The same illustration as Fig 6 in the Si-Fe plane
Figure D2 The same illustration as Fig 6 in the O-Fe plane
MNRAS 000 1mdash-33 (2021)
Substructure in the Galactic stellar halo 35
Figure D3 The same illustration as Fig 6 in the Ca-Fe plane
Figure D4 The same illustration as Fig 6 in the S-Fe plane We note that the grid limit appears clearly in this plane at the lowest [FeH] and highest [SFe] values
MNRAS 000 1mdash-33 (2021)
36 D Horta et al
Figure D5 The same illustration as Fig 6 in the Ti-Fe plane
Figure E1 The same illustration as Fig 6 in the (C+N)-Fe plane
MNRAS 000 1mdash-33 (2021)
Substructure in the Galactic stellar halo 37
Figure F1 The same illustration as Fig 6 in the Mn-Fe plane We note that the grid limit appears clearly in this plane at the lowest [FeH] values
Figure F2 The same illustration as Fig 6 in the Co-Fe plane We note that the grid limit appears clearly in this plane at the lowest [FeH] values
MNRAS 000 1mdash-33 (2021)
38 D Horta et al
Figure F3 The same illustration as Fig 6 in the Cr-Fe plane We note that the grid limit appears clearly in this plane at the lowest [FeH] values
Figure G1 The same illustration as Fig 6 in the Na-Fe plane We note that the grid limit appears clearly in this plane at the lowest [FeH] values
MNRAS 000 1mdash-33 (2021)
Substructure in the Galactic stellar halo 39
Figure G2 The same illustration as Fig 6 in the K-Fe plane We note that the grid limit appears clearly in this plane at the lowest [FeH] values
Figure H1 [FeH]comp used to obtain the results from Fig 18 when comparing every halo substructure with all the other substructures and with a high-low-120572 discsample
MNRAS 000 1mdash-33 (2021)
- 1 Introduction
- 2 Data and sample
-
- 21 Identification of substructures in the stellar halo
-
- 3 Kinematic properties
- 4 Chemical Compositions
-
- 41 -elements
- 42 Iron-peak elements
- 43 Odd-Z elements
- 44 Carbon and Nitrogen
- 45 Cerium
- 46 The [AlFe] vs [MgMn] plane
-
- 5 A quantitative comparison between halo substructure abundances
- 6 Discussion
-
- 61 Summary of substructure in the stellar halo
-
- 7 Conclusions
- A The reality of Icarus
- B The chemical compositions of Pontus according to APOGEE
- C Chemical and kinematic properties of halo substructures
- D -elements
- E (C+N)Fe
- F Iron-peak elements
- G Odd-Z elements
- H [FeH] used to compare substructures
-
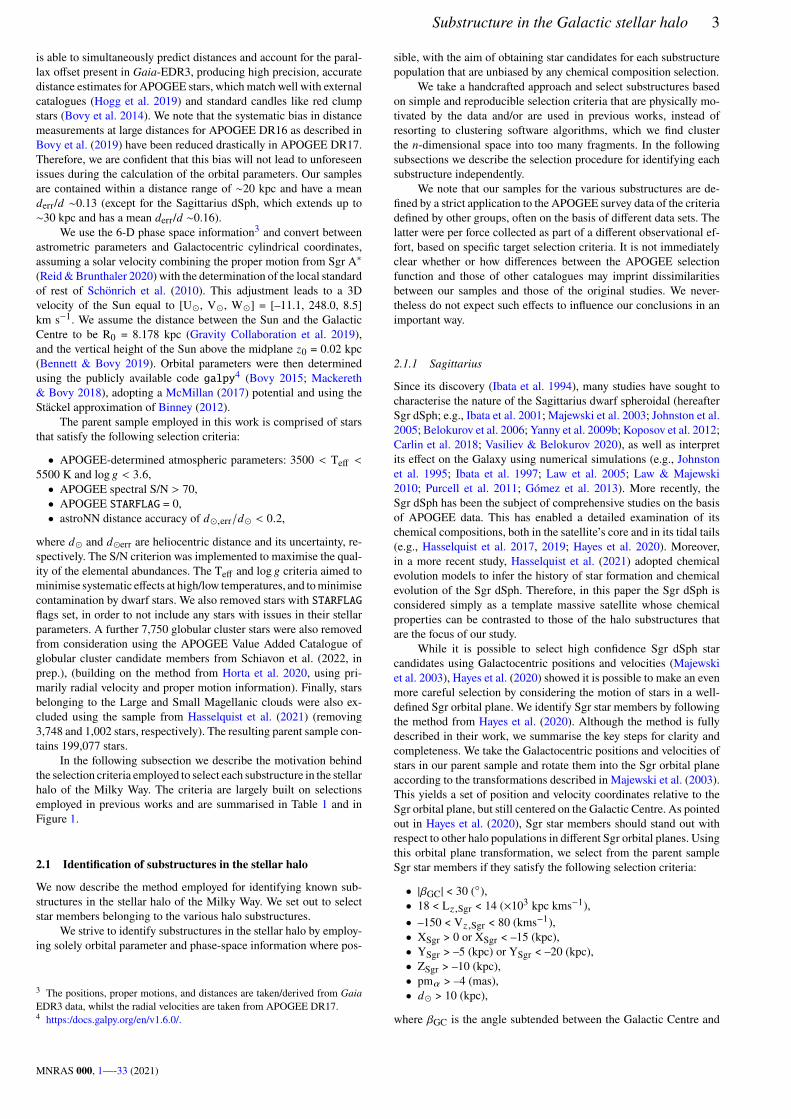