Cell count moments in the halo model
16
arXiv:1007.4667v1 [astro-ph.CO] 27 Jul 2010 Mon. Not. R. Astron. Soc. 000, 000–000 (0000) Printed 3 November 2013 (MN L A T E X style file v2.2) Cell Count Moments in the Halo Model J. N. Fry, 1,2⋆ S. Colombi, 2⋆ Pablo Fosalba, 3⋆ Anand Balaraman, 1,4⋆ Istv´ an Szapudi 5⋆ and R. Teyssier 6,7⋆ 1 Department of Physics, University of Florida, Gainesville FL 32611-8440, USA 2 Institut d’Astrophysique de Paris & UPMC (UMR 7095), 98 bis boulevard Arago, 75014 Paris, France 3 Institut de Ci` encies de l’Espai, IEEC–CSIC, Campus UAB, F. de Ci` encies, Torre C5 par-2, Barcelona 08193, Spain 4 Department of Physics, Georgia Southern University, Statesboro GA 30460, USA 5 Institute for Astronomy, University of Hawaii, 2680 Woodlawn Drive, Honolulu, HI 96822, USA 6 Service d’Astrophysique, CEA Saclay, Orme des Merisiers, 91191 Gif-sur-Yvette Cedex, France 7 Institut f¨ ur Theoretische Physik, Universit¨ at Z¨ urich, Winterthurer Strasse 190, CH-8057 Z¨ urich, Schweiz 3 November 2013 ABSTRACT We study cell count moments up to fifth order of the distributions of haloes, of halo substructures as a proxy for galaxies, and of mass in the context of the halo model and compare theoretical predictions to the results of numerical simulations. On scales larger than the size of the largest cluster, we present a simple point cluster model in which results depend only on cluster-cluster correlations and on the distribution of the number of objects within a cluster, or cluster occupancy. The point cluster model leads to expressions for moments of galaxy counts in which the volume-averaged moments on large scales approach those of the halo distribution and on smaller scales exhibit hierarchical clustering with amplitudes S k determined by moments of the occupancy distribution. In this limit, the halo model predictions are purely combinatoric, and have no dependence on halo profile, concentration parameter, or potential asphericity. The full halo model introduces only two additional effects: on large scales, haloes of different mass have different clustering strengths, introducing relative bias parameters; and on the smallest scales, halo structure is resolved and details of the halo profile become important, introducing shape-dependent form factors. Because of differences between discrete and continuous statistics, the hierarchical amplitudes for galaxies and for mass behave differently on small scales even if galaxy number is exactly proportional to mass, a difference that is not necessarily well described in terms of bias. Key words: large-scale structure of Universe – methods: numerical – methods: sta- tistical 1 INTRODUCTION Describing the properties of the distribution of matter in the universe in terms of the masses, spatial distribution, and shapes of clusters, or haloes, is an enterprise with a long history (Neyman & Scott 1952; McClelland & Silk 1977; Peebles 1980; Scherrer & Bertschinger 1991; Sheth & Saslaw 1994; Sheth 1996b). Recently, with the new ingredi- ent of a universal halo profile found in numerical simulations (Navarro, Frenk, & White 1997; Moore et al. 1999; Navarro et al. 2004), interest in the model has been rekindled (Seljak ⋆ E-mail: [email protected]fl.edu (JNF); [email protected] (SC); fos- [email protected] (PF); [email protected] (AB); [email protected] (IS); [email protected] (RT) 2000; Ma & Fry 2000b; Peacock & Smith 2000; Scoccimarro, Sheth, Hui, & Jain 2001). This model is not seen as literally true, but its constructions give plausible estimates for cor- relation functions because at a given scale, density-weighted statistics are dominated by the highest density systems, the collapsed haloes. The model has been shown to reproduce two-point and higher order density correlation functions in simulations, and, with a carefully chosen halo mass func- tion and ‘concentration parameter,’ can be consistent with self-similar stable clustering (Ma & Fry 2000a; Smith et al. 2003). Among its many other applications to weak gravi- tational lensing, pair velocities, the Ly-α forest, and CMB foregrounds, we find that the halo model also allows us to address the different behaviors of the continuous mass den- sity and of discrete objects such as galaxies.
Transcript of Cell count moments in the halo model

arX
iv:1
007.
4667
v1 [
astr
o-ph
.CO
] 2
7 Ju
l 201
0
Mon. Not. R. Astron. Soc. 000, 000–000 (0000) Printed 3 November 2013 (MN LATEX style file v2.2)
Cell Count Moments in the Halo Model
J. N. Fry,1,2⋆ S. Colombi,2⋆ Pablo Fosalba,3⋆ Anand Balaraman,1,4⋆ Istvan Szapudi5⋆
and R. Teyssier6,7⋆
1Department of Physics, University of Florida, Gainesville FL 32611-8440, USA2Institut d’Astrophysique de Paris & UPMC (UMR 7095), 98 bis boulevard Arago, 75014 Paris, France3Institut de Ciencies de l’Espai, IEEC–CSIC, Campus UAB, F. de Ciencies, Torre C5 par-2, Barcelona 08193, Spain4Department of Physics, Georgia Southern University, Statesboro GA 30460, USA5Institute for Astronomy, University of Hawaii, 2680 Woodlawn Drive, Honolulu, HI 96822, USA6Service d’Astrophysique, CEA Saclay, Orme des Merisiers, 91191 Gif-sur-Yvette Cedex, France7Institut fur Theoretische Physik, Universitat Zurich, Winterthurer Strasse 190, CH-8057 Zurich, Schweiz
3 November 2013
ABSTRACT
We study cell count moments up to fifth order of the distributions of haloes, ofhalo substructures as a proxy for galaxies, and of mass in the context of the halo modeland compare theoretical predictions to the results of numerical simulations. On scaleslarger than the size of the largest cluster, we present a simple point cluster model inwhich results depend only on cluster-cluster correlations and on the distribution of thenumber of objects within a cluster, or cluster occupancy. The point cluster model leadsto expressions for moments of galaxy counts in which the volume-averaged momentson large scales approach those of the halo distribution and on smaller scales exhibithierarchical clustering with amplitudes Sk determined by moments of the occupancydistribution. In this limit, the halo model predictions are purely combinatoric, and haveno dependence on halo profile, concentration parameter, or potential asphericity. Thefull halo model introduces only two additional effects: on large scales, haloes of differentmass have different clustering strengths, introducing relative bias parameters; and onthe smallest scales, halo structure is resolved and details of the halo profile becomeimportant, introducing shape-dependent form factors. Because of differences betweendiscrete and continuous statistics, the hierarchical amplitudes for galaxies and formass behave differently on small scales even if galaxy number is exactly proportionalto mass, a difference that is not necessarily well described in terms of bias.
Key words: large-scale structure of Universe – methods: numerical – methods: sta-tistical
1 INTRODUCTION
Describing the properties of the distribution of matter inthe universe in terms of the masses, spatial distribution,and shapes of clusters, or haloes, is an enterprise with along history (Neyman & Scott 1952; McClelland & Silk1977; Peebles 1980; Scherrer & Bertschinger 1991; Sheth &Saslaw 1994; Sheth 1996b). Recently, with the new ingredi-ent of a universal halo profile found in numerical simulations(Navarro, Frenk, & White 1997; Moore et al. 1999; Navarroet al. 2004), interest in the model has been rekindled (Seljak
⋆ E-mail: [email protected] (JNF); [email protected] (SC); [email protected] (PF); [email protected] (AB);[email protected] (IS); [email protected] (RT)
2000; Ma & Fry 2000b; Peacock & Smith 2000; Scoccimarro,Sheth, Hui, & Jain 2001). This model is not seen as literallytrue, but its constructions give plausible estimates for cor-relation functions because at a given scale, density-weightedstatistics are dominated by the highest density systems, thecollapsed haloes. The model has been shown to reproducetwo-point and higher order density correlation functions insimulations, and, with a carefully chosen halo mass func-tion and ‘concentration parameter,’ can be consistent withself-similar stable clustering (Ma & Fry 2000a; Smith et al.2003). Among its many other applications to weak gravi-tational lensing, pair velocities, the Ly-α forest, and CMBforegrounds, we find that the halo model also allows us toaddress the different behaviors of the continuous mass den-sity and of discrete objects such as galaxies.
2 J. N. Fry et al.
In this paper we reexamine the statistical behavior ofintegral moments of total mass or number counts in thecontext of the halo model. Our results, formulated directlyin position space, complement and extend those of Scocci-marro, Sheth, Hui, & Jain (2001) in the Fourier domain. InSection 2 we present definitions of the various statistics weneed and introduce generating function tools that will beapplied in later sections. In Section 3 we apply the probabil-ity generating function machinery for a system of identicalclusters in the point cluster limit, a model we call the ‘naivehalo model,’ to express the statistics of counts in cells interms of properties of the halo number and halo occupancydistributions. In Section 4 we compare the model to resultsobtained from numerical simulations. We find that the naivepoint cluster model describes the qualitative behavior butfails in quantitative detail, but insight gathered from themodel in the generating function formalism is easily appliedin the full halo model. This leads us in Section 5 to considerthe halo model in its full detail, summing over haloes ofdifferent mass, with both halo occupations and halo correla-tions functions of halo mass. Properly interpreted, the naivepoint cluster results obtained using the generating functioncontinue to apply when averaged over halo masses and overgalaxy positions within a halo. This allows us to extend tosmall scales, where haloes are resolved, introducing geomet-ric form factors for haloes that can no longer be consid-ered as points. Working directly in space instead of in theFourier transform domain allows us to exhibit manifestlysymmetries under particle exchange at all orders; avoids thenecessity to introduce an approximate factoring of windowfunction products W1W2W12 ≈ W 2
1W22 , etc.; and avoids the
necessity to make any assumptions or approximations aboutconfiguration dependence. Known forms of the halo massfunction, bias, and occupation number allow us to computefrom first principles results in scale-free and specific cos-mological models. Section 6 contains a final discussion, andsome technical results are included in appendices.
2 STATISTICAL DEFINITIONS
We study statistics of the continuous mass density and ofdiscrete objects that for convenience we denote as “galax-ies.” For a galaxy number distribution that is a random sam-pling of a process with a smooth underlying number densityfield n(r), factorial moments of the number of galaxies in arandomly placed volume directly reflect moments of the un-derlying continuous density field (Szapudi & Szalay 1993),⟨
N [k]⟩
= Nk µk, (1)
where N [k] = N !/(N − k)! = N(N − 1) · · · (N − k + 1),and the moments µk are volume averages of correspondingmoments of the underlying density field,
µk =1
V k
∫
V
d3r1 · · ·d3rk µk(r1, . . . , rk), (2)
⟨
n(r1) · · ·n(rk)⟩
= nk µk(r1, . . . , rk), (3)
typically integrated over a spherical volume of radius R.Moments of powers
⟨
Nk⟩
then contain contributions arisingfrom discreteness; for k = 2 through 5 these are⟨
N2⟩
= N + N2µ2, (4)
⟨
N3⟩
= N + 3N2µ2 + N3µ3, (5)⟨
N4⟩
= N + 7N2µ2 + 6N3µ3 + N4µ4, (6)⟨
N5⟩
= N + 15N2µ2 + 25N3µ3 + 10N4µ4 + N5µ5. (7)
In the limit N =⟨
N⟩
≫ 1 the highest power of N domi-
nates and⟨
Nk⟩
= Nk µk, as for a continuous density; thefactorial moment, in removing the lower order or discrete-ness terms, leaves a discreteness corrected moment that re-flects only spatial clustering. The moments µk can be addi-tionally separated into irreducible contributions ξk, as
µ2 = 1 + ξ2, (8)
µ3 = 1 + 3ξ2 + ξ3, (9)
µ4 = 1 + 6ξ2 + 3ξ22 ++4ξ3 + ξ4, (10)
µ5 = 1 + 10ξ2 + 10ξ3 + 15ξ22 + 10ξ2ξ3 + 5ξ4 + ξ5, (11)
also written as “connected” moments,⟨
N [k]⟩
c= Nk ξk. (12)
The relations between the µk and the ξk can be summarizedin the generating functions M(t) and K(t) = logM(t) (Fry1985),
M(t) =
∞∑
k=0
1
k!Nkµkt
k, K(t) =
∞∑
k=1
1
k!Nk ξkt
k. (13)
With the factors 1/k!, M and K are sometimes called ex-ponential generating functions of the moments µk, ξk. It isoften found that the correlations vary with scale roughly asξk ∝ ξk−1. The hierarchical amplitudes Sk are defined by
ξk = Sk ξk−1. (14)
The normalization of ξk to Sk then removes much of thedependence of ξk on scale.
Generating functions provide an interesting connectionbetween discrete and continuous processes. For a continuousvariate x with moment generating function Mc(t) =
⟨
etx⟩
,the generator of a distribution of discrete countsN for whichx is the local density is Md(t) = Mc(e
t−1) (Fry 1985). Thisrelation of generating functions provides directly the dis-creteness terms in equations (4–7). For discrete counts withprobabilities PN , also useful is the probability generatingfunction
G(z) =
∞∑
N=0
PN zN . (15)
For a discrete realization of an underlying continuous num-ber density, G(z) is related to the exponential generatingfunction of factorial moments by M(t) = G(t+1) (Fry 1985;Szapudi & Szalay 1993).
3 CELL COUNTS ON LARGE SCALES: THE
POINT CLUSTER MODEL
Using the tools introduced in the previous section we cannow construct the generating function of total number countin the point cluster limit. On large scales, we expect thatwe can consider relatively compact clusters in their entiretyto be either inside or outside of V . The total number ofgalaxies in a volume is then the sum over all the clusters inthe volume,

Cell Count Moments in the Halo Model 3
N =
Nh∑
i=1
Ni, (16)
where the number of clusters Nh and the number of galaxiesNi in each cluster are chosen randomly and at first we takethe cluster occupation numbers Ni to be independent andidentically distributed. A similar sum over clusters arises insituations ranging from the distribution of particle multiplic-ities in hadron collisions at high energy accelerators (Finkel-stein 1988; Hegyi 1994; Tchikilev 1999) to the distributionof rainfall totals (Rodriguez-Iturbe et al. 1987; Cowpertwait1994; Evin & Favre 2008).
We can characterize the net count distribution directlyfor small counts and in general using the generating functionG(z). Let pn be the probability of V containing n clusters,and let qn be the probability that a cluster has n members.Because a cluster with no members is uninteresting, for sim-plicity we take q0 = 0 here; for the case q0 6= 0, see AppendixA. Then, to have no count, we must have no clusters; to havetotal count 1, we must have one cluster with one member; tohave total count 2 we can have one cluster with 2 membersor two clusters with 1 member, and so on. The first severalprobabilities PN that V contains N total galaxies are then
P0 = p0 (17)
P1 = p1q1 (18)
P2 = p1q2 + p2q21 (19)
P3 = p1q3 + 2p2q1q2 + p3q31 (20)
P4 = p1q4 + p2(2q1q3 + q22) + 3p3q21q2 + p4q
31 (21)
P5 = p1q5 + p2(2q1q4 + 2q2q3)
+p3(3q21q3 + 3q1q
22) + 4p4q
31q
2 + p5q51 . (22)
For these first few low order terms, PN is the coefficientof zN in the composition of generating functions gh [gi(z)].This is the general result, as can be seen easily from thegenerating function for the total count probabilities PN ,
G(z) =⟨⟨
zN1+N2+···+NNh
⟩⟩
=⟨⟨
zNi
⟩
Nh
⟩
=⟨
[gi(z)]Nh
⟩
= gh[gi(z)]. (23)
where the double angle brackets indicate an average overboth the distributions of cluster occupancy and cluster num-ber (see Szapudi & Szalay 1993).
We can also compute moments directly and using gen-erating functions. The mean of N =
∑
Ni is the number ofhaloes times the average occupation per halo,⟨
N⟩
=⟨
NhNi
⟩
= NhNi. (24)
The square N2 =∑
Ni
∑
Nj contains Nh terms with i = jand Nh(Nj − 1) terms with i 6= j,⟨
N2⟩
=⟨
NhN2i +Nh(Nh − 1)NiNj
⟩
= Nh(Ni + N2i µ2,i) + N2
h(1 + ξ2,h)N2i (25)
Similar direct calculations give⟨
N3⟩
=⟨
NhN3i +Nh(Nh − 1) 3N2
i Nj
+Nh(Nh − 1)(Nh − 2)NiNjNk
⟩
(26)⟨
N4⟩
=⟨
NhN4i +Nh(Nh − 1) (4N3
i Nj + 3N2i N
2j )
+Nh(Nh − 1)(Nh − 2) 6N2i NjNk
+Nh(Nh − 1)(Nh − 2)(Nh − 3)NiNjNkNl
⟩
(27)
⟨
N5⟩
=⟨
NhN5i +Nh(Nh − 1) (5N4
i Nj + 10N3i N
2j )
+N[3]h (10N3
i NjNk + 15N2i N
2j Nk)
+N[4]h 10N2
i NjNkNl +N[5]h NiNjNkNlNm
⟩
, (28)
and from these, the discreteness corrected, connected mo-ments of total count are
ξ2 = ξ2,h +µ2,i
Nh
(29)
ξ3 = ξ3,h +3µ2,iξ2,h
Nh
+µ3,i
N2h
(30)
ξ4 = ξ4,h +6µ2,iξ3,h
Nh
+(4µ3,i + 3µ2
2,i)ξ2,h
N2h
+µ4,i
N3h
(31)
ξ5 = ξ5,h +10µ2,iξ4,h
Nh
+(10µ3,i + 15µ2
2,i)ξ3,h
N2h
+(10µ2,iµ3,i + 5µ4,i)ξ2,h
N3h
+µ5,i
N4h
, (32)
etc. Clearly, the effort and complexity increase at each order.Identical results are obtained by the composition of gener-ating functions in equation (23). The general term can beobtained from the generating function K(t) for moments oftotal counts. Using the relation M(t) = G(t + 1), the com-position of probability generating functions in equation (23is also a composition of moment generating functions,
K(t) = log[M(t)] = log[G(t+ 1)]
= loggh[gi(t+ 1)] = loggh[Mi(t)]
= logMh[Mi(t)− 1] = Kh[Mi(t)− 1], (33)
from which it is clear that ξk continues to depend to all or-ders on the connected moments ξk,h of halo number as thecoefficients inKh and the raw moments µk,i of the halo occu-pation distribution as the coefficients in Mi. The generatingfunction in equation (33) and the expressions for moments ofcounts in equations (29)–(32) plus extension to higher ordersconstitute the main result of the point cluster model. Thepoint cluster results are independent of the internal detailsof halo profiles or concentrations. The general expression forξk contains contributions from occupation number momentsof order 1 through k and halo correlations of order 1 throughk; in ξ5, the first term arises from five objects in five separatehaloes, the last from occupancy five in a single halo, whileother terms represent four haloes with occupancies (2,1,1,1);three haloes with occupancies (3,1,1) and (2,2,1); and twohaloes with occupancies (3,2) and (4,1). The numerical fac-tors represent the number of equivalent halo assignments.The sum of the combinatoric factors of a given ξn,h in theexpression for ξk are known as Stirling numbers of the sec-ond kind, S(n, k), the number of ways of putting n distin-guishable objects into k cells with no cells empty (Scherrer& Bertschinger 1991). Here they are produced from a gener-ating function in a manner such that any term desired canbe easily produced by an algebraic manipulator.
Some special cases are useful to consider. For single-element clusters, Ni = 1 with probability 1, the occupa-tion moments are µ1 = 1 and µk = 0 for k > 2, galax-ies are haloes and galaxy correlations are halo correlations,ξk = ξk,h. For Poisson occupation number, the occupationmoments are all µk,i = 1, and the halo model expressions re-produce the discreteness terms of equations (4)–(7). This isthe locally Poisson realization of a distribution with spatially

4 J. N. Fry et al.
varying n(r). For uncorrelated cluster positions, irreduciblemoments arise only from objects in the same halo; in thiscase the halo number Nh has a Poisson distribution, and thesingle-halo contribution to the count moment,
ξ1hk =µk,i
Nk−1h
, (34)
is often called the Poisson term. The composition of gener-ating functions for a Poisson halo distribution was studiedby Sheth (1995a,b). The point cluster model varies fromthe halo clustering limit to the Poisson limit as a func-tion of scale. Typically, the two-point function behaves asξ(r) ∼ r−γ with γ ≈ 2, and higher order correlations scalehierarchically, as ξk = Sk ξ
k−1 with nearly constant Sk.Since N grows as R3, the dominant contribution to ξk onlarge scales then comes from the halo correlation, ξk ≈ ξk,h,but on scales where N ξ . 1, the point cluster model givesthe one-halo term in equation (34). In this regime totalnumber count moments have hierarchical correlations, withSk = µk,i/µ
k−12 .
Many common statistical models are constructed start-ing with a Poisson halo number distribution, so that ξk,h = 0for k > 2, and equation (34) holds exactly. If the occu-pancy distribution is also Poisson, µk,i = 1, then Sk = 1for all k (S1 = S2 = 1 always), saturating constraintsS2mS2n > S2
m+n arising from the Schwarz inequality; this isa realization of the minimal hierarchical model of Fry (1985).Other examples of compound Poisson distributions includethe negative binomial distribution, which is the compositionof a Poisson cluster distribution with a logarithmic occupa-tion distribution (Sheth 1995b), and the thermodynamic orquasi-equilibrium distribution of Saslaw & Hamilton (1984),which is the composition of a Poisson cluster distributionwith a Borel occupation distribution (Saslaw 1989; Sheth &Saslaw 1994; Sheth 1995a).
There is one generalization that is also useful, wherethe total number of objects is the sum of contributions fromtwo independent populations, N = Nc+Nb such as the sumof a strongly clustered population plus a weakly clustered“background” (cf. Soneira & Peebles 1977). In this case thecumulant moments ξk are simply additive,
Nk ξk → Nkc ξc,k + Nk
b ξb,k. (35)
If the background contributes to the total count, N = Nc +Nb, but not to higher order moments, we have
ξk =Nk
c
(Nb + Nc)kξc,k = fk
c ξc,k, (36)
where fc is the fraction of clustered objects. Although thecorrelations are diluted, this says that the amplitudes fork > 3 are amplified, Sk = Sc,k/f
k−2c .
4 NUMERICAL RESULTS
In this section we compare the model to statistics of galaxiesand haloes identified within the setting of a single numericalsimulation. The sample we use is the same one analyzed inColombi, Chodorowski & Teyssier (2007, hereafter CCT),where many more details can be found. The simulation isperformed with the adaptive mesh refinement (AMR) code
RAMSES (Teyssier 2002), assuming a standard ΛCDM cos-mology with Ωm = 0.3, ΩΛ = 0.7, H0 = 100 h kms−1 Mpc−1
with h = 0.7, and a normalization σ8 = 0.93, where σ8 is theroot mean square initial density fluctuations in a sphere ofradius 8h−1 Mpc extrapolated linearly to the present time.The simulation contains 5123 dark matter particles on theAMR grid, initially regular of size 5123, in a periodic cubeof size Lbox = 200 h−1 Mpc; the mass of a single particle isthen 7.09×10⁹ M⊙. Additional refinement is allowed duringruntime: cells containing more thanNAMR = 40 particles aredivided using the standard AMR technique with a maximumof 7 levels of refinement.
A halo catalog, Eh, and a “galaxy” (subhalo) catalog,Eh, are extracted from the final state of the simulation us-ing the publically available software adaptaHOP (Auber, Pi-chon & Colombi 2004); details of the procedure can again befound in CCT. We use the number of dark matter substruc-tures in each halo detected by adaptaHOP as a proxy for thegalaxy distribution. A halo can contain one or more galax-ies: a single component halo hosts one galaxy (or is its ownsubstructure), and an N-component halo hosts N galaxies.The substructure distribution differs somewhat from that ofgalaxies (see the discussions in CCT andWeinberg, Colombi,Dave & Katz 2008), but it provides a discrete number countdistribution that is useful to test how the behavior of thediscrete halo model differs from that of the continuous massdistribution.
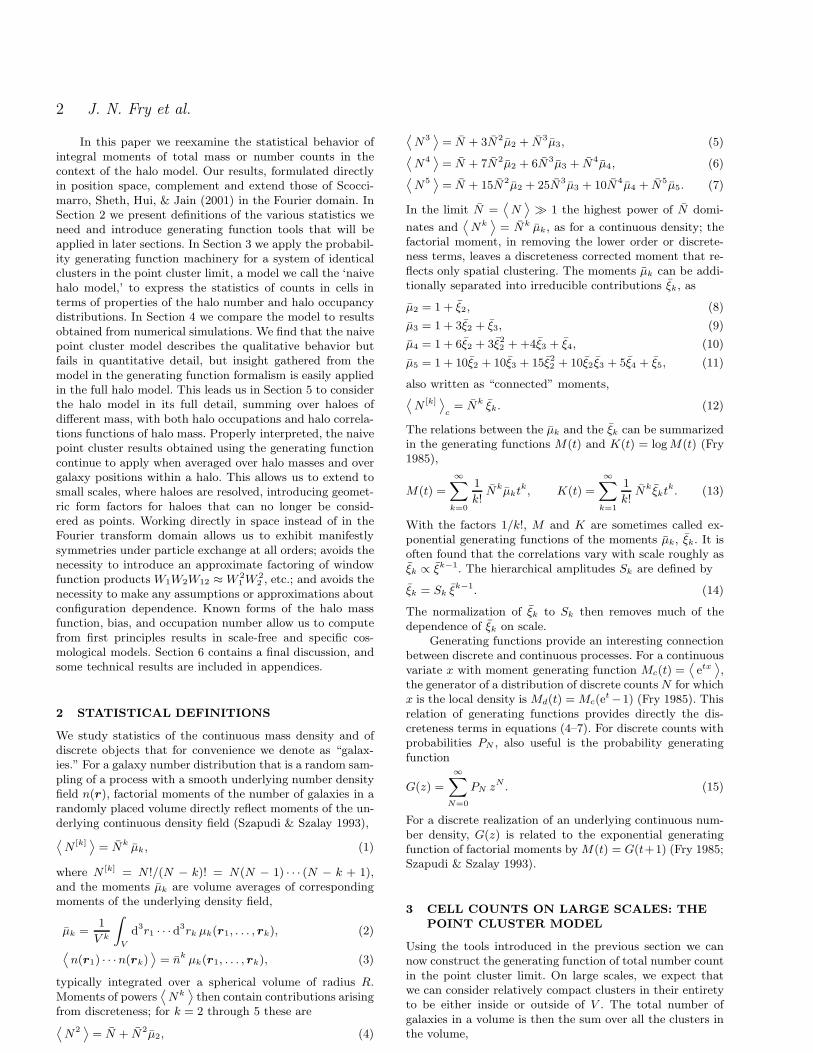
Figure 1 shows the distributions of halo mass f(m)and of occupation number PN for the full halo catalog.The range of masses covers almost four decades; the largesthalo contains 53 substructures. Moments of these distri-butions give the occupation moments µk that appear inequations (29)–(32) and the point halo hierarchical am-plitudes Sk = µk/µ
k−12 . For comparison, smooth lines in
the figure show the Press–Schechter (solid line) and Sheth–Tormen (dotted line) mass functions, plotted for δc = 1.50.The Press–Schechter and Sheth–Tormen mass distributionsprovide a good representation of the mass function forM & 1012 M⊙, rising with mass a little more weakly than1/M towards small masses and with an exponential cutoffat large mass. The number distribution behaves as a powerlaw, PN ∼ 1/Np, with p in the range 2.0–2.4. The subclumpfinder adaptaHOP identifies haloes as connected regions withdensity contrast larger than δ > 80 employing a standardSPH softening of the particle distribution with NSPH = 64neighbors (see, e.g., Monaghan 1992). This, along with themass resolution of the structures resolved by RAMSES, con-trolled by the value of NAMR, leads to the rather soft small-M cutoff on the halo mass function in Figure 1 and also thelow value of δc.
The full samples Eh and Eg contain 50234 haloes and64316 “galaxies”, respectively. Most haloes have a singlecomponent; the average number of substructures per halois Ni = 1.28. From these two parent catalogs, we apply var-ious mass thresholdings to extract subsamples from Eh andEg that we denote Eh(Mmin,Mmax) where Mmin and Mmax,given in solar masses, correspond to minimum and maxi-mum mass thresholds of the host haloes respectively. Weuse these subcatalogs to test the variation of halo clusteringwith mass. The different realizations break down as follows:
(i) The full sample separated into “light” and “mas-

Cell Count Moments in the Halo Model 5
Figure 1. Distribution of halo masses f(M) (histogram; bottomscale) as a function of M and substructure occupation numberprobability PN (shaded histogram; top scale) as a function ofN . The solid and dashed curves show the Press–Schechter andSheth–Tormen mass functions.
Table 1. Details of the catalogs extracted from RAMSES. The twofirst columns give the halo mass range, Mmin < Mh < Mmax (inunits of M⊙); the third and fourth columns give the number ofobjects in the halo and substructure catalogs; and the fifth andsixth columns give the average number of substructures and darkmatter particles per halo.
Mmin Mmax Nhaloes Nsubs N subsi N dm
i
0 ∞ 50234 64316 1.28 9670 1014 49740 59203 1.19 636
5× 10¹¹ ∞ 43482 57564 1.32 11095× 1011 1014 42988 52451 1.22 7274× 1012 ∞ 11934 24918 2.09 34414× 1012 1014 11440 19805 1.73 21081014 ∞ 494 5113 10.35 34315
sive” halo subsamples, Eh(0,∞) ≡ Eh ≡ Eh(0, 1014) +
Eh(1014,∞), and the substructure counterparts.
(ii) A catalog of haloes with masses larger than 5 ×10¹¹M⊙, which avoids the strongest rolloff at small mass,separated likewise into two subsamples, Eh(5 × 10¹¹,∞) ≡Eh(5×10¹¹, 1014)+Eh(10
14,∞), and the substructure coun-terparts;
(iii) A catalog of haloes with masses larger than 4 ×10¹²M⊙, which avoids essentially all of the rolloff at smallmass, separated likewise into two subsamples, Eh(4 ×10¹²,∞) ≡ Eh(4 × 10¹², 1014) + Eh(10
14,∞), and the sub-structure counterparts.
Table 1 summarizes subcatalog information.From the distribution of mass and the catalogs of haloes
and subhaloes in the simulation we compute correlationstatistics ξk for k = 2–5. Figure 2 shows the variance, orvolume-averaged two-point correlation function ξ2, evalu-ated for spherical volumes of radius R as a function ofR, for dark matter, or mass (solid line), and for haloes(long-dashed line). Dotted lines show the predictions of thepoint cluster model: the upper line for only the mass in
haloes, and the lower line including mass not contained inhaloes as an unclustered background, as in eq. (36), withfc =
∑
Mh/Mtot = 0.36. Finally, the short-dashed line in-cludes two additional aspects from the full halo model, amodest relative bias factor b = 1.22 between mass and haloeson large scales, and the effects of resolved haloes, detailedin Section 5 below.
Panels in Figure 3 show the second moment evalu-ated for substructure “galaxies” ξ2,g (solid lines) and forhaloes, ξ2,h (long-dashed lines) for the four inclusive cata-logs: haloes of all masses, haloes with M > 5 × 10¹¹ M⊙,with M > 4 × 10¹² M⊙, and with M > 1014 M⊙, as iden-tified in the caption. Dotted curves show the predictions ofthe simple point cluster model. Although it has shortcom-ings in detail, on scales of a few Mpc the point cluster modelwith no adjustments reproduces the trends with scale andfrom catalog to catalog to within a factor of two or so overfour decades of correlation strength. Dashed curves show aquantitative improvement with a very modest adjustment ofparameters, relative bias factors of 1.2 or 1.3 and occupationmoments adjusted by a factor of 2, as given in the middlecolumns in Table 2. For radius smaller than 1h−1Mpc finitehalo size starts to become important. The mass thresholdM > 5 × 10¹¹ M⊙ removes only haloes containing a sin-gle substructure (the smallest halo containing two substruc-tures has a mass 8×10¹¹ M⊙), and so affects only the mean
N =⟨
N⟩
but none of the higher factorial moments⟨
N [k]⟩
,just as for an unclustered background population as in equa-tion (36). Thus, in the regime where the normalized momentis large, ξk ≫ 1, it is simply rescaled, ξ′k/ξk = (N/N ′)k.This is apparent for the data plotted in Figure 2, wherefor the smallest cells ξ2 for the Eg(5 × 10¹¹) subsample islarger than that for the full Eg sample by a factor 1.249,very close to the number ratio (64316/57564)2 = 1.246. Thenext mass threshold, M > 4 × 10¹² M⊙, removes doublyand also triply occupied haloes (the smallest halo contain-ing three substructures has a mass 1.8 × 10¹² M⊙), and sothis threshold changes the shape of ξ2 and ξ3.
Panels in Figure 4 show the hierarchical amplitude S3
for the four subhalo catalogs (solid lines), and for the cor-responding halo catalogs (long-dashed lines). Finite volumelimitations are apparent at large scales, and the Eh(10
14)sample is not large enough for a reliable third moment onalmost any scale. Dotted lines show the naive point clus-ter model. Again, the first mass cut M > 5 × 10¹¹ M⊙removes only haloes containing a single substructure fromthe full catalog, changing only the mean count; and onthe smallest scales the expected scaling S′
3/S3 = N ′/N =57563/64316 = 0.895 is again satisfied.
Figure 5 shows the amplitudes S3, S4, and S5 for fordark matter (solid lines) and for haloes (long-dashed lines).Figure 6 shows the Sk for substructures (solid lines) and forhaloes (long-dashed lines), for the entire Eh halo sample.The naive point cluster model agrees with the simulationsqualitatively but not quantitatively. One possible explana-tion is that halo occupation is correlated with environment,and a modest adjustment of the point cluster parametersgives a good fit. Table 2 shows the naive point cluster modelresult using occupation probabilities pN and the halo massfunction n(M) from the simulations, and also the result ofadjusting fit parameters. In the point cluster model, the pa-rameters are factorial moments µk =
⟨
N [k]⟩
/Nk for galax-

6 J. N. Fry et al.
Figure 2.Variance ξ2(r) for mass (solid line) and for halo number(long-dashed line) measured for spheres of radius r in numericalsimulations compared with the halo model. Dotted lines show thepoint cluster model of equation (29); the upper line shows onlythe contribution of particles in haloes, while the lower dotted lineincludes particles not in haloes as an unclustered background.The short-dashed line includes a bias b = 1.25 between mass andhaloes on large scales and the effects of resolved haloes on smallscales.
Figure 3. Cell count variance ξ2(r) in spheres of radius r ob-tained from numerical simulations compared with the halo model.
Solid lines show ξ2 measured for galaxies (substructures) andlong-dashed lines show ξ
2,h measured for haloes identified in thesimulations for the four subcatalogs. Results for all haloes arepresented in panel (a), M > 5 × 10¹¹ in panel (b), 4 × 10¹² inpanel (c), and 1014M⊙ in panel (d). The dotted lines show thepoint cluster model of equation (29), and the short-dashed linesinclude bias and resolved haloes.
ies and µk =⟨
Mk⟩
/Mk for mass, computed for the haloesidentified in the simulation. The quantity identified as “b”is the large-scale relative bias between galaxies and haloes,b2 = ξ2,g/ξ2,h.
Figure 4. Hierarchical amplitudes S3(r) from numerical simula-tions for substructure “galaxy” catalogs (solid lines) and for thecorresponding haloes (long-dashed lines) The dotted lines showthe naive point cluster model, and the short-dashed lines includebias and resolved haloes. Panels show the four different subcata-logs, as in Figure 3.
Figure 5. Hierarchical amplitudes Sk(r) for mass density fromnumerical simulations for k = 3, 4, and 5 (bottom to top). Solidlines show Sk measured for mass; long-dashed lines show Sk forhaloes. Dotted lines show the naive point cluster model expres-
sions in equations (30–32) and same results but adjusted for aweakly clustered background (not contained in haloes). The short-dashed lines also include a bias factor on large scales and the ef-fects of resolved haloes on small scales, as detailed in Section 5below.
5 THE FULL HALO MODEL
To extend our understanding we turn to the context ofthe recently developed phenomenological halo model (Seljak2000; Ma & Fry 2000b; Peacock & Smith 2000; Scoccimarro,Sheth, Hui, & Jain 2001; Cooray & Sheth 2002), in whichclustering on small scales is derived from the mass function,profiles, and clustering properties of dark matter haloes. Nu-merical simulations have suggested haloes have a universal

Cell Count Moments in the Halo Model 7
Table 2. Correlation parameters for “galaxies” and mass. The first five columns show values in the simple point cluster model, in whichall haloes are identical, using the simulation halo distributions pN and f(M); the next five columns show fit values (f); and the last fivecolumns show values computed in the detailed halo model (m).
Sample b/bh µ2 S3 S4 S5 b/bfh µf2 Sf
3 Sf4 Sf
5 b/bmh µm2 Sm
3 Sm4 Sm
5
dark matter (mass) 1 4.00 7.18 93.0 1460 1.25 1.96 7.2 93 1460 1.71 34.3 6.8 101 2450all haloes 1 1.35 9.92 168 3360 1.22 0.60 3.4 26 330 1.39 10.6 7.15 115 2980m > 5× 10¹¹ M⊙ 1 1.46 8.88 134 2410 1.23 0.70 3.4 25 300 1.37 6.95 5.24 59.5 1050m > 4× 10¹² M⊙ 1 2.10 4.00 26.8 212 1.34 1.27 2.3 10 68 1.30 3.03 3.27 22.4 239m > 1× 10¹⁴ M⊙ 1 1.50 1.50 2.93 6.59 1.36 1.09 1.7 4.0 13 1.12 1.54 1.41 3.01 9.30
Figure 6. Hierarchical amplitudes Sk(r) for galaxy number countmeasured in from numerical simulations for k = 3, 4, and 5 (bot-tom to top). Solid lines show galaxy (substructure) Sk, and long-dashed lines show halo Sk,h. Dotted lines show the point clustermodel expressions in equations (30–32).
density profile (Navarro, Frenk, & White 1997; Moore et al.1999; Navarro et al. 2004),
ρ(r)
ρ= Au
( r
rs
)
, (37)
where the scale rs and amplitude A are functions of the halomass. In particular, rs is related to the virial radius r200,within which the average density is 200 times the mean, bya “concentration parameter” c(m), rs = r200/c; this thenalso determines the amplitude A. For a large cluster, saym = 1015M⊙, the virial radius is about 3h−1Mpc; and withc ≈ 6 the scale radius is rs ≈ 500 h−1kpc. Thus, at roughlyMpc and smaller scales we begin to resolve clusters, and weexpect to have to replace the point cluster model with thefull halo model.
The halo mass function is conveniently written as afunction of the dimensionless overdensity ν = δc/σ(m),where δc is the threshold overdensity that leads to a col-lapsed halo, often δc = 1.68, and σ2(R) is the mean squaremass fluctuation within a sphere of radius R evaluated forthe linearly evolved input power spectrum. Specifically,
σ2(m) =
∫
d3k
(2π)3P (k)W 2(kR) , (38)
where W (x) = 3(sin x − x cos x)/x3 is the Fourier windowcorresponding to a real-space top-hat window function, andm = 4πρR3/3. In terms of ν, the density of haloes of massM is then written
dn
dm=
d(ln ν)
d(lnm)
ρ
m2νf(ν). (39)
The Gaussian distribution function f(ν) of Press &Schechter (1974, PS) and the refinement of Sheth & Tor-men (1999, ST) have
νf(ν) = 2A[
1 + (qν2)−p]
(
qν2
2π
)1/2
e−qν2/2. (40)
The normalization A is chosen so that∫
dν f(ν) = 1 and isindependent of q. The Press–Schechter function has q = 1,p = 0, A = 1
2; the Sheth–Tormen form has q = 0.707, p =
0.3, A ≈ 0.32218.
5.1 One-Halo Term in the Point Cluster Limit
In the point cluster limit of the full halo model, the sumover haloes in equation (16) and the resulting compositionof generating functions in equation (23) remain true, butthe calculation now includes an average over the distribu-tion of halo masses as well as over halo occupation and halocount, both of which now differ with halo mass. The result-ing order-k connected correlation function is again a sum ofcontributions from a single halo to k different haloes, just asin equations (29)–(32), with the same coefficients. For theone-halo term of the order-k moment in the full halo model,the average over all haloes includes an average over the halomass function dn/dm,
ξ1hk =
⟨
N[k]i
⟩
⟨
Ni
⟩k→
∫
dm (dn/dm)V⟨
N [k](m)⟩
[∫
dm (dn/dm)V⟨
N(m)⟩]k
, (41)
where N(m) = Ni(m) is the occupancy of a halo of mass m.The factor in brackets in the denominator is∫
dmdn
dmV⟨
N(m)⟩
= nhV⟨
Ni
⟩
= NhNi = N, (42)
where nh is the number density of all haloes, Nh = nhVis the mean number of haloes in V , and Ni is the averageoccupation over haloes of all masses; and the numerator is∫
dmdn
dmV⟨
N [k](m)⟩
= nhV⟨
N[k]i
⟩
= NhNki µk,i. (43)
The one-halo term of the full halo model thus producesthe same result as the previous point cluster result, ξ1hk =µk,i/N
k−1h , with occupation moment

8 J. N. Fry et al.
µk,i =
∫
dm (dn/dm)⟨
N [k](m)⟩
/∫
dm (dn/dm)[∫
dm (dn/dm)⟨
N(m)⟩
/∫
dm (dn/dm)]k
. (44)
We can compute occupation moments µk for mass fromfirst principles by taking number N to be proportional tomass (the number of hydrogen atoms or dark matter parti-cles), N ∝ m and N [k] ∝ mk (with no discreteness terms).From (44), these are
µk =[∫
dm (dn/dm)mk ] [∫
dm (dn/dm) ]k−1
[∫
dm (dn/dm)m ]k, (45)
with corresponding hierarchical amplitudes
Sk =µk
µk−12
=
[∫
dν f(ν)mk−1][∫
dν f(ν)]k−2
[∫
dν f(ν)m]k−1
(46)
over the range of scales where the one-halo term dominatesbut haloes are not resolved. In this case, results are deter-mined entirely by the mass function, which in turn is relatedto the primordial power spectrum. For a power-law powerspectrum, with ν = (m/m1)
(3+n)/6, and with the Press–Schechter and Sheth–Tormen forms of the mass functions,the integrals can be done analytically, giving
Sk =I(k) [I(1)]k−2
[I(2)]k−1, (47)
where
I(k) = Γ[
3(k − 1)
3 + n+
1
2
]
+ 2−p Γ[
3(k − 1)
3 + n+
1
2− p
]
, (48)
independent of q. For a Poisson cluster distribution (onsmall scales cluster correlations are unimportant) and forthe Press–Schechter mass function, this expression was alsoobtained by Sheth (1996b). For the Press–Schechter massfunction, which has p = 0, and for spectral index n = 0 thisgives the particularly simple result Sk = (2k − 3)!!. Resultsfor power-law spectra are shown in Figure 7, together withresults from numerical simulations by Colombi, Bouchet, &Hernquist (1996) (plotted are the values of Sk measuredat ξ = 100, but values at ξ = 10 or ξ = 1 differ by lessthan the error bars). The Sheth–Tormen mass function ap-pears to agree poorly with the numerical results; this is oneinstance where the observed behavior seems to prefer thePress–Schechter form, at least for n not too negative. How-ever, the Sheth–Tormen function is relatively more weightedtowards smaller masses, and in numerical simulations thereis always a smallest mass that can be considered. Thus, weexamine the results of a small mass cutoff in the integral, of10−4 and 10−2 in units of the mass m1 at which ν(m1) = 1.A 10−4 cutoff mass has little effect on PS but is significantfor ST, and a 0.01 cutoff has a significant effect on both. Inthe simulations, the ratio of the particle mass to the non-linear mass is typically in the range 0.001–0.01, and the STmass function with a moderate low-mass cutoff does agreewith the simulations results, at least for −1 < n < 1. As nbecomes more negative, all the halo model curves rise muchmore rapidly than the trend seen in the simulation results.This may reflect an increasing difficulty in simulating nega-tive values of n (cf. Jain & Bertschinger 1998).
Figure 7. Amplitudes Sk for k = 3, 4, 5 (bottom to top). asa function of spectral index n for power-law spectra. For each kcurves are two sets of curves; the lower set (blue in color) showsresults for the Press–Schechter mass function, and the upper set(red in color) for Sheth–Tormen, computed from eq. (46). Solidlines show Sk integrating over all masses; long-dashed curves havea lower mass cutoff m > 10−4; and short-dashed curves havem > 10−2, in units of the mass m1 at which ν(m1) = 1. Thedot-dashed (green) curves show the predictions of hyperextendedperturbation theory (Scoccimarro & Frieman 1999). Symbols witherror bars show results from numerical simulations (Colombi,Bouchet, & Hernquist 1996).
For statistics of galaxy number counts, we must averageover moments of halo occupation number,
Sk =
[∫
dν f(ν)⟨
N [k](m)⟩
/m][∫
dν f(ν)⟨
N(m)⟩
/m]k−2
[∫
dν f(ν)⟨
N [2](m)⟩
/m]k−1
(49)
(the factor 1/m remains from the PS or ST halo mass func-tion). In simulations, in general it is found the mean num-ber of galaxies
⟨
N(m)⟩
grows more slowly than linearly
in mass. Models have included a power-law,⟨
N(m)⟩
=
(m/m1)β, with β . 1 and perhaps with a minimum mass
cutoff m0; a broken two-power-law model (Berlind & Wein-berg 2002); and a similarly behaved but smoothly interpo-lated function (Berlind et al. 2003). Substructures or subhalooccupation numbers exhibit a similar behavior, but perhapswith β → 1 at high mass (Kravtsov et al. 2004). Higher ordercorrelations also require higher order moments of the halooccupation distribution, which are typically sub-Poisson at
small N , with⟨
N(N − 1)(m)⟩
<⟨
N(m)⟩2. From semian-
alytic galaxy formation considerations, Scoccimarro, Sheth,Hui, & Jain (2001) extend to higher orders by assuming abinomial distribution, also used by Kravtsov et al. (2004).However, a representation of the galaxy number count dis-tribution as a central galaxy plus a Poisson distribution ofsatellites (Berlind et al. 2003; Kravtsov et al. 2004; Zheng et.al 2005; Zheng & Weinberg 2007; Zheng et al. 2007, 2009) isbecoming increasingly popular. In this representation, bothcentral and satellite distributions are characterized entirelyby their means
⟨
Nc
⟩
= Nc and⟨
Ns
⟩
= Ns. Since Nc takeson only the values 0 and 1, so that for any positive power

Cell Count Moments in the Halo Model 9
⟨
Npc
⟩
= Nc, and since for a Poisson satellite distribution⟨
N[k]s
⟩
= Ns, the factorial moments of halo occupancy are
⟨
N [k]⟩
= Nks + k NcN
k−1s . (50)
The central object can be modeled as a sharp or smoothedstep function (Berlind et al. 2003), and Zheng et. al (2005)present expressions for moments with parameters extractedfrom simulations. A main import of all models is that mo-ments of occupation number grow more slowly than linearlywith mass, a behavior that we model as the simpler formN(m) ∼ mβ with β . 1. With the Sheth–Tormen mass func-tion and with no small-mass cutoff, Sk for number counts isagain a ratio of Γ-functions,
Sk =Iβ(k) [Iβ(1)]
k−2
[Iβ(2)]k−1
, (51)
where now
Iβ = Γ[
3β(k − 1)
(3 + n)+
1
2
]
+ 2−p Γ[
3β(k − 1)
(3 + n)+
1
2− p
]
. (52)
We can use the Poisson model to obtain the occupancyprobability distribution averaged over all haloes. For a Pois-son distribution with mean µ(m), the probability pN for ahalo of massm to contain N galaxies (orN satellite galaxies)is pN = µN e−µ/N !. Averaged over the power-law portionof the Press–Schechter mass function dn/dm ∼ ν/m2, withthe integral cut off by the Poisson exponential e−µ beforethe exponential cutoff in the mass function is reached, theprobability pN of N objects in any halo scales as
pN ∝[N + (3 + n)/6β − 1− 1/β]!
N !, (53)
where ν ∼ m(3+n)/6 and µ(m) ∼ mβ. As N becomes large,this behaves as a power law,
pN ∼ N−r, r = 1 +1
β−
(3 + n)
6β. (54)
For n ≈ −2 and β . 1 the exponent is near r = −2, a goodapproximation to the distribution plotted in Figure 1. ForSheth–Tormen the power is shifted by 2p(3 + n)/6β, or byabout 0.1.
5.2 Resolved Haloes
For small volumes we can no longer take haloes as point ob-jects, but must take into account the distribution of objectswithin a halo. In the full halo model, the one-halo contribu-tion to the k-point function ξ1hk for mass is a convolution ofhalo profiles (Ma & Fry 2000b),
ξ1hk =
∫
dm (dn/dm)mk∫
d3r′u(y′1) · · ·u(y
′k)
[∫
dm (dn/dm)m∫
d3r′ u(y′)]k
, (55)
where the position r′ of the halo centre runs over all space,
y′i = |ri − r
′|/rs, and the scaled halo profile u(r) is nor-malized to unit integral. From equation (55), the volume-averaged correlation is then
ξ1hk =
∫
dm (dn/dm)mk∫
d3r′ [F (r′)]k
[∫
dm (dn/dm)m∫
d3r′ F (r′)]k
, (56)
where F (r′) is the portion of the total volume of a halocentred at r′ that lies within V ,
F (r′) =
∫ R
0
d3r u(
r − r′
rs
)
. (57)
Note that the integrand is a function of r/rs, and since thescale radius rs depends on mass, the from factor F is ingeneral also a function of halo mass. From equations (56)and (57) we can recover the point cluster model: if a volumeis much larger than a halo size, R ≫ rs for all haloes, thenF (r′) is very small unless the halo itself is within V , in whichcase the integral then contains the entire halo contents. Inthis limit and with unit normalization, F → 1 for r
′ in Vand F → 0 for r
′ outside V . Then, the integral over r′ is
just a factor of V , and we recover the point cluster model.For resolved haloes in moments of discrete galaxy counts
we consider first the second count moment ξ2. Let a halocontain N objects, and let N ′ be the number of these objectsthat are contained within V . Then N ′ =
∑
Ni, where eitherNi = 1 with probability pi if object i is counted or Ni = 0if object i is not, and the second moment is
⟨
N ′(N ′ − 1)⟩
=⟨ N∑
i=1
Ni
(
N∑
j=1
Nj − 1)
⟩
=⟨
∑
i6=j
NiNj +N∑
i=1
N2i −
N∑
i=1
Ni
⟩
. (58)
But since Ni takes on the values 0 or 1, N2i = Ni and the last
two terms cancel, leaving the sum only over distinct objects
⟨
N ′(N ′ − 1)⟩
=⟨
∑
i6=j
NiNj
⟩
=⟨
N(N − 1)⟩
p2. (59)
If object positions within a halo are uncorrelated, the prob-ability p that an object within a given halo is located withinthe volume V is just the fraction F of the halo that is withinV , form factor in equation (57), the same for all objects andindependent of the halo occupation N ,⟨
N ′(N ′ − 1)⟩
=⟨
N(N − 1)⟩ ⟨
F 2⟩
. (60)
This agrees with the usual practice, to distribute the averagepair count
⟨
N(N − 1)⟩
, weighted by the square of the halo
profile form factor⟨
F 2⟩
,
µ2 =
∫
dm (dn/dm)⟨
N(N − 1)⟩ ⟨
F 2⟩
/ nh[ ∫
dm (dn/dm)⟨
N(m)⟩
/ nh
]2, (61)
where the volume-averaged form factor is
⟨
F k⟩
=1
V
∫ ∞
0
d3r′[
F (r′)]k
. (62)
In the position space formulation symmetry over all par-ticles is manifestly maintained in the form-factor integrals,without need to introduce the approximation W12 ≈ W1W2.The form factor F does not appear in N in the denominatorof equation (61), since, as can be easily seen by changing theorder of integration,
⟨
F⟩
= 1. The calculation for a halooccupation distribution consisting of a central object plusNs = N − 1 satellites yields⟨
N ′[2]⟩
=⟨
N [2]s
⟩ ⟨
F 2⟩
+2⟨
Ns
⟩ ⟨
F Fc
⟩
, (63)
where Fc = 1 for r < R and vanishes otherwise. Extendingto general k, we obtain⟨
N ′[k]⟩
=⟨
N [k]⟩ ⟨
F k⟩
(64)

10 J. N. Fry et al.
with no central object, or⟨
N ′[k]⟩
=⟨
N [k]s
⟩ ⟨
F k⟩
+k⟨
N [k−1]s
⟩ ⟨
F k−1 Fc
⟩
, (65)
with a central object. The last term could contain a factor⟨
Nc
⟩
if this is not 1. The form-factor-corrected halo occu-pation moment is then
µk =
∫
dm (dn/dm)⟨
N [k](m)⟩ ⟨
F k⟩
/ nh
[ ∫
dm (dn/dm)⟨
N(m)⟩
/ nh
]k,
(66)
modified as in equation (65) for a central object.For moments of dark matter mass, a reasonably good
representation of the numerical results is obtained usingthe NFW profile, but for substructures this is not the case.The substructure profile was seen in Diemand et al. (2004)to follow roughly an isothermal profile, and we have stud-ied using the isothermal sphere profile also. The measure-ments of Diemand et al. (2004) and our own do not pro-vide enough statistics to infer a mass dependence of theconcentration parameter, and so we use a constant valuec = 10 that gives reasonable results on small scales. Fig-ure 8 shows the volume-averaged form factor for k = 2–5for NFW haloes (solid lines) and for the isothermal sphereprofile (long-dashed lines), both with c = 10. Curves areplotted as a function of Y = R/rs, where rs = r200/c. Asexpected, the form factor goes to 1 at large scale and fallsrapidly for small R, where only a small fraction of a halo issampled. Note that
⟨
F k⟩
6⟨
Fn⟩
if k < n. The integralconverges to 1 on large scales, the point cluster regime, butfalls rapidly for Y < c. In equation (66), for fixed R, thisfactor decreases rapidly for increasing mass.
Figure 9 shows the form-factor corrected, one-halo Sk =µk/µ
k−12 , normalized by its value in the point-cluster limit,
as a function of R, for k = 3, 4, and 5 (bottom to top; dif-ferent orders k offset for clarity). On small scales, smallerthan a few Mpc, this shows the effect of resolved haloes.The result depends on both halo profile and on the distri-bution function: solid lines show NFW haloes averaged overmass; long-dashed lines show the same haloes averaged overnumber; short-dashed lines show the isothermal profile withc = 10; and dotted lines show isothermal profiles with con-centration c(m) as for NFW. On large scales halo profileshape has no effect, but on small scales the differences fordifferent profiles and weightings are substantial.
From the halo model can extract small-scale behaviorsof the correlations ξk, which can be different for galaxiesand for mass. The concentration parameter plays a criticalrole in the result. For scale invariant spectra (c.f. Davis &Peebles 1977) we expect c(m) ∼ M−α, with α = (3+n)/6 (inMa & Fry 2000a, this parameter is β). For ΛCDM, over ourrelatively small range in mass we also take the concentrationparameter to scale as a power of mass, α ≈ 0.11 or 0.12(Bullock et al. 2001; Zhao et al. 2003), corresponding to aneffective n ≈ −2.3. As above, let the number of objects ina halo grow with mass as
⟨
N [k]⟩
∼ mkβ (for statistics of
mass β = 1). Finally, let dn/dm ∼ νp′/m2 as m → 0, whereν ∼ m(3+n)/6 and p′ = 1 for PS and p′ = 1 − 2p = 0.4for ST (in Ma & Fry 2000a, this parameter is α). Then,ignoring the exponential factor in dn/dm on small scaleswhere ν is small and changing integration variable from mto Y = R/rs = cR/r200 in equation (66), we see that µk
scales as
Figure 8.Volume-averaged form factor⟨
F k⟩
for k = 2–5 (upper
left to lower right), as a function of Y = R/rs. Solid lines showsresult for NFW profile; long-dashed lines show isothermal profile,both with c = 10.
µk ∼[
R1/(α+1/3)][kβ+p′(3+n)/6−1]
(67)
and the k-point function ξk = µk/Nk−1h scales as R−γk , with
γk =3
1 + 3α[3(k − 1)α+ k(1− β)]−
(3 + n)p′
2(1 + 3α)(68)
= (k − 1)3(5− 2β + n)
5 + n+
6(1− β)
5 + n−
(3 + n)p′
5 + n, (69)
independent of the shape of the halo profile. For β = 1 thisis the same as the result obtained by Ma & Fry (2000a)(beware a change of notation) for mass, and for β = 1 − ǫis the result obtained by Scoccimarro, Sheth, Hui, & Jain(2001) for galaxy number. This is of the hierarchical formonly for p′ = 0, which is not true for either of the PS or STmass functions, and for β = 1. Departures from hierarchicalscaling in the small-R behavior of Sk grow with k,
Sk ∼ R(k−2)∆γ , (70)
where
∆γ =(3 + n)p′ − 6(1− β)
2(1 + 3α)=
(3 + n)p′ − 6(1− β)
5 + n(71)
(∆γ ≈ −0.26 for the choices p′ = 0.4, β ≈ 0.8, n ≈ −2). Thepresence of ever higher powers of ξ2 in Sk = ξk/ξ
k−12 em-
phasizes any scaling defects in ξ2. An interesting alternativenormalization is
S′k =
ξk
ξ(k−1)/(k−2)k−1
=Sk
S(k−1)/(k−2)k−1 .
(72)
Departures from scaling in S′k decrease with k for k > 3, as
S′k ∼ R∆γ/(k−2) (73)
for the same ∆γ given in equation (71).
5.3 Multiple-Halo Terms
Terms that involve objects in multiple haloes also depend oncorrelations among haloes. In the perturbative regime, halo

Cell Count Moments in the Halo Model 11
Figure 9. Form-factor corrected one-halo Sk as a function ofR, normalized to its point cluster value, for k = 3, 4, and 5(bottom to top; different k offset for clarity). Solid lines show Sk
for NFW profiles weighted by mass mk; long-dashed lines showNFW profile weighted by number N [k]; short-dashed lines showisothermal profile with c = 10 weighted by number; and dottedlines show isothermal profile with c = c(m).
correlations have bias factors that are functions of the halomasses, and higher order correlation functions also involvehigher order bias parameters (Fry & Gaztanaga 1993); forinstance, the halo three-point function is
ξ3,h = b(m1)b(m2)b(m3) ξ3,ρ(r12, r13, r23)
+ b2 [ξ2,ρ(r12)ξ2,ρ(r13) + cyc. (123)], (74)
where the ξρ are correlation statistics for the underlying (pri-mordial) density distribution. As a function of mass, thelinear bias factor found for PS by Mo, Jing & White (1996,1997) and adapted for the ST halo mass function (Sheth &Tormen 1999; Casas-Miranda et al. 2003) is
b = 1 +qν2 − 1
δc+
2p
δc
1
[1 + (qν2)p], (75)
with further refinements for small mass suggested by Jing(1999). Higher order functions also require higher order biasparameters (Mo, Jing & White 1997; Scoccimarro, Sheth,Hui, & Jain 2001),
b2 =8
21δc
qν2 − 1 +2p
[1 + (qν2)p]
+1
δ2c
q2ν4 − 3qν2 +2p(qν2 + 2p− 1)
[1 + (qν2)p]
, (76)
etc. Higher order bias terms b3, etc., vanish when integratedover the full halo mass function. Even with a low mass cutoffor with different mass or number weightings we expect thatthey remain generally small; and so we will drop them fromnow on (but see Angulo et al. 2008).
We exhibit in detail the k-halo and two-halo contribu-tions to ξk in the full halo model. The k-halo contributionto ξk is
Nkξkhk =
k∏
i=1
∫
dmidn
dmi
⟨
N(mi)⟩
(77)
×
∫
d3r′1 u(y′1) · · ·d
3r′k u(y′k) ξk,h(r
′1, . . . , r
′k),
where N is as given in equation (42). Ignoring non-linearbias terms, so that in terms of the underlying densitycorrelation ξk,ρ the halo correlation function is ξk,h =b(m1) · · · b(mk) ξk,ρ, the volume-averaged correlation be-comes
Nk ξkhk =
k∏
i=1
∫
dmidn
dmib(mi)
⟨
N(mi)⟩
(78)
×
∫
d3r′1 F (r′1) · · · d3r′k F (r′k) ξk,ρ(r
′1, . . . , r
′k).
In the point cluster limit on large scales, for which F = 1for r′ in V and F = 0 for r
′ outside V , this gives
ξkhk,h = bk ξk,ρ =bk
bkhξk,h, (79)
with an occupation-number weighted bias factor,
b =
∫
dm (dn/dm)⟨
N(m)⟩
b(m)∫
dm (dn/dm)⟨
N(m)⟩ , (80)
The halo correlation function ξk,h is ξk,h = b kh ξk,ρ, with a
bias factor weighted only by the halo mass distribution,
bh =
∫
dm (dn/dm) b(m)∫
dm (dn/dm). (81)
Factors of mass or number weight greater contributions athigher masses, where b(m) takes on larger values, so in gen-eral b > bh; galaxies are more strongly correlated than haloeson large scales, though only by a small amount. Ratios ofintegrals b/bh over the Sheth–Tormen mass function with⟨
N⟩
∝ m for mass and⟨
N⟩
∝ mβ with β = 0.8 for num-ber are listed in Table 2.
Similarly, we can write intermediate terms. The two-halo contribution to ξk is a sum of terms of the form
Nk ξ2hk =s k!
k1! k2!
∫
dm1dn
dm1dm2
dn
dm2
⟨
N[k1]1
⟩ ⟨
N[k2]2
⟩
×
∫
d3r′1 d3r′2 [F (r′1)]
k1 [F (r′2)]k2 b(m1)b(m2) ξ2(r
′12),
(82)
where k = k1+k2. (If k1 = k2 there is an additional symme-try factor of s = 1
2because the partition and its complement
are identical; the generating function gives all combinatoricfactors automatically.) On large scales, where the halo sizeis insignificant and the form factors take the value F = 1over essentially the entire volume V , the full two-halo termis thus the sum over partitions
ξ2hk =s k!
k1! k2!
bk1
bh
bk2
bh
µk1µk2
ξ2,h
Nk−2h
, (83)
where bk is weighted by⟨
N [k]⟩
,
bk =
∫
dm (dn/dm)⟨
N [k](m)⟩ ⟨
F k⟩
b(m)∫
dm (dn/dm)⟨
N [k]⟩ ⟨
F k⟩ . (84)
For moments of mass, the factors⟨
N [k](m)⟩
become mk.Weighted by different factors of number or mass, the biasparameters bk will in general be different from b = b1 defined
12 J. N. Fry et al.
in equation (80); the lower mass limit for the integral alsoincreases for higher order moments. On small scales, wherehaloes are resolved, the halo size, and thus the factor F (r′),depend also on halo mass: the mass and position integralscannot be factored or simplified. However, since F 6 1, theexpression in equation (83) is an upper limit to the two-halocontribution, and even without the form factors the two-halo contribution is dominated by the one-halo term givenin equation (56) as R → 0. Extension to other intermediateorders follows similar lines.
6 DISCUSSION
We have studied the behavior of cell count moments, in-cluding the variance ξ2 and the hierarchal amplitudes Sk fork = 3, 4, and 5, in the context of the halo model, and wehave compared the model with results of numerical simula-tions for statistics mass and of galaxy (substructure) num-ber counts identified in the same simulation. Expressions(29)–(32) constitute the halo model predictions for the two-,three-, four-, and five-point functions; a composition of gen-erating functions for the halo number and halo occupancydistributions, as presented in equation (33), produces auto-matically the halo model result at general order, includingall terms and combinatoric factors. The naive, point-clusterform of the model with identical haloes is easily generalisedto include averages over a distribution of halo masses andover positions within resolved haloes. The general form ofthe naive point cluster model results continues to hold, withthe addition of a modest bias, of a factor of two or less,on large scales, and form factors that reflect shapes of re-solved haloes on small scales. With these components, thehalo model is able to reproduce in quantitative detail statis-tical moments for mass and for substructure samples whosedensities vary by a factor of one hundred.
On scales greater than of order a few Mpc, theoret-ical predictions are well represented in the point clusterversion of the halo model. The point cluster model resultsrange from a biased realization of halo correlations on largescales to intermediate scales, for which N ξ . 1, where sin-gle halo contributions dominate, but haloes are still unre-solved. In this limit the results of the halo model are in-dependent of details such as halo profile, asphericity, andconcentration parameter. Intermediate results are robust;the variance ξ2 = µ2/N
2h steepens, approaching r−3, an ef-
fect seen in scaling studies (Hamilton et al. 1991; Peacock& Dodds 1996); and the amplitudes Sk are constant, as inthe plateau seen in scale free models by Colombi, Bouchet,& Hernquist (1996). These results are independent of pro-file shape or bias. The halo model with Press–Schechter orSheth–Tormen mass function allows us to compute from firstprinciples values for the hierarchical amplitudes Sk for scale-invariant models with power spectrum P ∼ kn. As shownin Figure 7, the halo model predictions are sensitive to themass function and to mass cutoffs. For scale-free models withinitial spectrum P (k) ∼ kn, the halo model reproduces thegeneral trends of Sk(n). Disagreements for more negativen are probably an indication of the difficulty of simulatingthese spectra.
The largest halo has rs ≈ 500 h−1kpc; on scales smallerthan this, we must include the effects of finite halo size. Re-
solved haloes introduce scale-dependent form factors in theµk,i(R), as in Section 4. Analysis of resolved haloes is madesubstantially more efficient by analytic expressions for theform factors, contained in Appendix C. Small-scale resultssuggest that the profile shape is different for mass and forsubstructures. In our limited efforts we have not found aprofile shape that allows us to fit the shape of Sk on allscales in the resolved halo regime. For that matter, we donot really know that a universal profile shape applies forthe distribution of galaxies within haloes of different size;A possible explanation is that tidal disruption leads to nouniversal profile that applies on all scales; or, the halo modelpicture itself may be oversimplistic. Nevertheless, on largescales our simulation and model results seem to have thepotential to agree with observations (Ross et al. 2006).
As observations become more and more precise, so it isincreasingly important to be able to model clustering statis-tics with precision. This appears to be possible for mass onboth large and small scales. On large scales, perturbationtheory (biased linear theory) is accurate to better than 1%.On small scales, where statistics are dominated by tightlybound, high-density collapsed haloes, using published formsfor the mass function f(m) and the concentration parame-ter c(m) with no attempt to optimize, the halo model repro-duces the variance for our simulation again to within a fewpercent. This is suggestive but not in itself a proof of thehalo model; history has shown that there may be many con-structs that lead to the same two-point function; thus, it isa nontrivial result that the halo model also reproduces withaccuracy the higher order correlation functions on small andlarge scales as well. There are somewhat larger deviations onintermediate scales, where the halo model predictions aretoo large by 5–10%, in a direction that is only made worseby including higher order perturbative corrections. This isa regime where the halo model seems to be least likely tobe valid, where there is a significant amount of inhomoge-neously clustered mass not contained in spherical haloes;another interesting possibility in this regime is renormalizedperturbation theory (Crocce & Scoccimarro 2006). The halomodel predictions also match very well number count statis-tics on both large and intermediate scales, the point clusterregime, across all the different subcatalogs with differentmass thresholds. This is perhaps not a surprise, since thereis no “background” population of objects outside haloes; ob-jects in haloes account for all the objects there are. However,such precision does not seem to be within reach on smallscales. The results we present use an isothermal profile withfixed c = 10, but this is at best only a first approximation.With a small number of haloes, we do not know the pro-file shape, although it seems that the NFW profile does notwork, and we do not know how the halo radius or concen-tration parameter depends on mass. This may be the resultof using substructures instead of galaxies in a full hydro-dynamic simulation; substructures in high density regions,may be tidally disrupted (Weinberg, Colombi, Dave & Katz2008).
Halo model statistics computed over mass and numberdistributions taken from the simulation work well. It is inprinciple possible to compute correlations from first princi-ples, starting with a primordial power spectrum, using theSheth-Tormen halo mass function and a prescription such asa Poisson satellite number. Application to scale-free simula-
Cell Count Moments in the Halo Model 13
tions with initial spectrum P ∼ kn gives plausible results forSk(n), at least for n not too negative, once taking into ac-count finite simulation resolution. In practice, the predictedrelative bias factors bg/bh do not quite match the numericalresults. but this is probably due to finite volume effects. Inparticular, the halo five-point function is barely detected.
In the end, on small scales there are substantial differ-ences between the discrete statistics of number counts andthe continuous statistics of of mass. The distribution func-tion of halo occupation number has a behavior different fromthat of the distribution of halo mass, and factorial momentsof discrete counts behave differently than moments of mass,even if the mean occupation number itself were a faithfultracer of total mass, all which contribute to differences inSk, both in value and in shape as a function of scale, to theextent that it is not clear that the concept of bias betweengalaxy and mass statistics, even a non-linear bias, is a usefulconcept.
It may sometimes seem that with a halo profile shape,mass function, concentration parameter, and asphericity allto be specified, the halo model is infinitely adjustable. How-ever, on intermediate and large scales much of this freedomdisappears, and the model depends only on the compound-ing of statistics. In the halo model calculation, we see thatthe overall size of the correlation function ξk or the ampli-tude Sk is determined by moments µk =
⟨
mk⟩
of mass or
factorial moments µk =⟨
N [k]⟩
of halo occupation number;while details of shape on small scales provide informationon the halo profile,
⟨
F k⟩
. That the model can reproduce indetail the measured Sk for k = 3–5, simultaneously for bothmass and number, and can handle probabilities as well asmoments, is a nontrivial success.
ACKNOWLEDGMENTS
We thank David Weinberg for many helpful comments andsuggestions. I.S. is grateful to NASA for support from grantNNG06GE71G. J.N.F. thanks the IAP for hospitality duringthis work. Parts of this work were clarified in discussions atthe Aspen Center for Physics workshop on the Halo Model.This research has made use of NASA’s Astrophysics DataSystem.
REFERENCES
Angulo R. E., Baugh C. M., Lacey C. G., 2008, MNRAS,387, 921
Aubert D., Pichon C., Colombi S., 2004, MNRAS, 352, 376Berlind A. A., Weinberg D. H., 2002, ApJ, 575, 587Berlind A. A. et al., 2003, ApJ, 593, 1Blaizot J. et al., 2006, MNRAS, 523Bullock J. S. et al., 2001, MNRAS, 321, 559Casas-Miranda R., Mo H. J., Boerner G., 2003, MNRAS,339, 872
Colombi S., Bouchet F. R., Hernquist L., 1996, ApJ, 465,14
Colombi S., Chodorowski M. J., Teyssier, R., 2007,MNRAS, 375, 348 (CCT)
Cooray A., Sheth R., 2002, Phys. Rep., 372, 1
Cowpertwait P. S. P., 1994, Royal Society of London Pro-ceedings Series A, 447, 23
Crocce M., Scoccimarro R., 2006, PRD, 73, 063519Davis M., Peebles P. J. E., 1977, ApJS, 34, 425Diemand J., Moore B., Stadel J., 2004, MNRAS, 352, 535Evin G., Favre A.-C., 2008, Water Resour. Res., 44,W03433
Finkelstein J., 1988, PRD, 37, 2446Fry J. N., 1985, ApJ, 289, 10Fry J. N., Gaztanaga E., 1993, ApJ, 413, 447Hamilton A. J. S., Kumar P., Lu E., Matthews A., 1991,ApJ, 374, L1
Hegyi S., 1994, Phys. Lett. B 327, 171Hockney R. W., Eastwood J. W., 1981, Computer Simula-tion Using Particles (New York: McGraw Hill)
Jain B., Bertschinger E., 1998, ApJ, 509, 517Jing Y. P., 1999, ApJ, 515, L45Kravtsov A. V. et al., 2004, ApJ, 609, 35Ma C.-P., Fry J. N., 2000a, ApJ, 538, L107Ma C.-P., Fry J. N., 2000b, ApJ, 543, 503McClelland J., Silk J., 1977, ApJ, 217, 331Mo H. J., Jing Y. P., White S. D. M., 1996, MNRAS, 282,1096
Mo H. J., Jing Y. P., White S. D. M., 1997, MNRAS, 284,189
Monaghan J. J., 1992, ARA&A, 30, 543Moore B. et al., 1999, MNRAS, 310, 1147Navarro J. F., Frenk C. S., White S. D. M., 1997, ApJ, 490,493
Navarro J. F. et al., 2004, MNRAS, 349, 1039Neyman J., Scott E. L., 1952, ApJ, 116, 144Peacock J. A., Dodds S. J., 1996, MNRAS, 280, L19Peacock J. A., Smith R. E., 2000, MNRAS, 318, 1144Peebles P. J. E., 1980, The Large-Scale Structure of theUniverse (Princeton: Princeton Univ. Press)
Press W. H., Schechter P., 1974, ApJ, 187, 425Rodriguez-Iturbe I., Cox D. R., Isham, V., 1987, RoyalSociety of London Proceedings Series A, 410, 269
Ross A. J., Brunner R. J. Myers A. D., 2006, ApJ, 649, 48Saslaw W. C., 1989, ApJ, 341, 588Saslaw W. C., Hamilton A. J. S., 1984, ApJ, 276, 13Scherrer R. J., Bertschinger E., 1991, ApJ, 381, 349Scoccimarro, R., Frieman, J. A., 1999, ApJ, 520, 35Scoccimarro R., Sheth R. K., Hui L., Jain B. 2001, ApJ,546, 20
Seljak U., 2000, MNRAS, 318, 203Sheth R. K., 1995a, MNRAS, 274, 213Sheth R. K., 1995b, MNRAS, 276, 796Sheth R. K., 1996, MNRAS, 281, 1124Sheth R. K., Saslaw W. C., 1994, ApJ, 437, 35Sheth R. K., Tormen G., 1999, MNRAS, 308, 119Smith R. E. et al., 2003, MNRAS, 341, 1311Soneira R. M., Peebles P. J. E., 1977, ApJ, 211, 1Szapudi I., 1998, ApJ, 497, 16Szapudi I., Quinn T., Stadel J., Lake G., 1999, ApJ, 517,54
Szapudi I., Szalay A. S., 1993, ApJ, 408, 43Tchikilev O. G., 1999, PRD, 59, 94008Teyssier R., 2002, A&A 385, 337Weinberg D. H., Colombi S., Dave R., Katz N., 2008, ApJ,678, 6
Zheng Z., Weinberg D. H., 2007, ApJ, 659, 1

14 J. N. Fry et al.
Zheng Z. et al., 2005, ApJ, 633, 791Zheng, Z., Coil, A. L., & Zehavi, I., 2007, ApJ, 667, 760Zheng, Z., Zehavi, I., Eisenstein, D. J., Weinberg, D. H., &Jing, Y. P., 2009, ApJ, 707, 554
Zhao D. H., Jing Y. P., Mo H. J., Borner, G., 2003, ApJ,597, L9
APPENDIX A: EMPTY HALOES
We show in this Appendix that for every composite distri-bution PN that includes empty haloes with a nonzero proba-bility q0 6= 0, there is another with q′0 = 0 that produces thesame PN . Thus, excluding (or including) empty haloes doesnot impose a physical restriction on the resulting occupationdistribution PN .
Suppose we start with a distribution with q0 6= 0. Then,the total count probabilities will include contributions frommany clusters with no occupancy,
P0 = p0 + p1q0 + p2q2k + p3q
30 + · · · (A1)
P1 = p1q1 + 2p2q1q0 + 3p3q1q20 + · · · (A2)
P2 = p1q2 + p2(q21 + 2q2q0) + p3(3q2q
20 + 3q21q0) + · · · (A3)
P3 = p1q3 + p2(2q1q2 + 2q3q0)
+p3(q31 + 6q1q2q0 + 3q3q
20) + · · · (A4)
We can easily create an occupancy distribution with noempty haloes while maintaining the same relative probabil-ities by defining a new set of probabilities q′n such q′0 = 0and q′n = qn/(1 − q0) for n > 0. This distribution has thegenerating function
g′i(z) =gi(z)− q01− q0
. (A5)
Note that since gi(0) = q0, this gives g′i(0) = 0, and g′i(1) =
gi(1) = 1.We can then modify the halo occupation number prob-
ability p′n in what turns out to be a sensible way to producein the end the same PN . With q′0 = 0 we must have P0 = p′0,so we take
p′0 =
∞∑
n=0
pnqn0 = gh(q0). (A6)
Next, to have P1 = p′1q′1.
p′1q′1 =
p′1q11− q0
=
∞∑
n=0
npnq1qn−10 = q1
dgh(z)
dz
∣
∣
∣
∣
z=q0
, (A7)
we take p′1 = (1− q0)(dgh/dz)|q0 . Similarly, to have
P2 = p′1q′2 + p′2q
′21
= q2∑
npnqn−10 + q21
1
2
∑
n(n− 1)pnqn−10 , (A8)
we take p′2 = 12(1− q0)
2(d2gh/dz2)|q0 . These p′n follow from
the generating function
g′h(z) = gh[(1− q0)z + q0]. (A9)
The coefficient of each term in the expansion is a sum ofproducts of positive numbers with positive coefficients, andso p′n > 0; and g′h(1) = gh(1−q0+q0) = 1, so that each term
must satisfy p′n 6 1 and the distribution is properly normal-ized. The composition of these two modified distributionsthen gives
G′(z) = g′h[g′i(z)] = gh[(1− q0)g
′i(z) + q0] = gh[gi(z)], (A10)
and so the same PN , as desired.For the case of a Poisson cluster number distribution,
Finkelstein (1988) shows that the revised p′n again area Poisson distribution with mean N ′ = N(1 − q0). Thegeneral case has essentially the same interpretation. Thecontinuum (discreteness corrected) moments, generated byM(t) = G(1 + t), follow from
M ′h(t) = G′(1 + t) = G[(1− q0)(1 + t) + q0)]
= G[1 + (1− q0)t] = M [(1− q0)t]. (A11)
Thus, continuum moments are scaled by a factor (1 − q0)n
which absorbed in the mean N ′i = Ni(1 − q0), leave the
correlations µn unchanged: the q′k are a discrete realizationof the same underlying number density field. In a sense, thisis the equivalent of including an unclustered background, asin equation (36).
In general q0 can be mapped to any value 0 < α < 1 bythe transformations
g′i(z) =gi(z)− α
1− α, g′h(z) = gh[(1− α)z + α], (A12)
and it remains true that the generating function of to-tal count probabilities is unchanged, G(z) = g′h[g
′i(z)] =
gh[gi(z)].
APPENDIX B: ALGORITHMS FOR
COMPUTING THE COUNT-IN-CELL
DISTRIBUTION FUNCTION
In this Appendix we detail how the count-in-cell distribu-tion function PN (ℓ) is estimated in these samples. Thereexist many efficient ways to measure this function in cubi-cal cells (e.g., Szapudi 1998; Szapudi, Quinn, Stadel & Lake1999; Blaizot et al. 2006). The problem is however moreintricate for spherical cells of radius ℓ, which we prefer touse in this paper, since the analytical calculations are mucheasier to derive for these latter. Although it is rather usualand fair to approximate spherical cells with cubical cells ofsame volume with a small form factor correction (e.g., Sza-pudi 1998, and references therein), we prefer here to avoidthis approximation. Then, the two most common ways ofmeasuring function PN (ℓ) for spherical cells are
(i) The FFT method: it consists in assigning the particlesto a grid of size Ngrid using e.g. nearest grid point or cloud-in-cell interpolation (e.g., Hockney & Eastwood 1981), FastFourier Transform (FFT) the corresponding density distri-bution, multiply the result by the Fourier transform of thetop hat filter in Fourier space, and then Fourier transformback to estimate function PN (ℓ). Obviously the FFT methodis valid only if the cell size is much larger than the size of amesh element.
(ii) The direct assignment method: it consists in creating alist of candidate cells positioned on a regular pattern of sizeNgrid, then on scanning the list of particles and assigningthem to each cell when relevant to augment the correspond-ing count. This method does not suffer the defects of the

Cell Count Moments in the Halo Model 15
Table A1. Parameters used to perform the count-in-cells measurements. The first line gives the inverse scale in units of the simulationbox size Lbox/ℓ; the smallest and the largest scales, Lbox/ℓ = 1024 and Lbox/ℓ = 8, correspond to ℓ = 0.2h−1 Mpc and ℓ = 25h−1 Mpc,respectively. The second line gives the size of the grid of sampling cells, Ngrid, used to perform the measurements at a given ℓ for thefull dark matter sample, RAMSES; Ngrid = 2048 means that 20483 cells were used, corresponding to a minimum possible value of PN ofthe order of 1.16× 10⁻¹⁰. The third line identifies the count-in-cell measurement method used for each scale under consideration, T foroct-tree walk, F for FFT, and D direct assignment. The fourth and fifth lines give Ngrid and the method for all the other samples.
Lbox/ℓ 1024 512√2 512 256
√2 256 128
√2 128 64
√2 64 32
√2 32 16
√2 16 8
√2 8
RAMSES
Ngrid 2048 2048 2048 2048 2048 2048 1024 1024 1024 1024 512 512 512 512 512method T T T T T T T T T T T T F F F
OthersNgrid 1024 1024 1024 1024 1024 1024 1024 1024 1024 1024 512 512 512 512 512
method D D D D D D D D D D D D D D D
FFT, so can be used even for very small scales, but can be-come prohibitive at large scales, when the network of cellsstarts to significantly self-overlap (i.e. a particle is assignedto a large number of cells).
Naturally, a good choice consists in using the direct assign-ment method at small scales and the FFT method at largescales. However, the very large number of particles, 5123,in our full RAMSES dark matter called for an additional al-gorithmic improvement, valid at intermediate scales. Ourimplementation, CountKD, is a code based on a decomposi-tion of space using standard oct-tree technique, similarly asin Szapudi, Quinn, Stadel & Lake (1999), but for sphericalcells. The oct-tree decomposition allows one to approximatea spherical cell with a coverage of cubes of varying size, thislatter decreasing (by factors of 2) when approaching the cellboundary. At some point, when maximum allowed level ofrefinement is reached (or when there is only one particle peroct-tree cell), the position of particles themselves is used todecide if they belong to the cell in consideration or not. Ob-viously, this method is efficient only if there are sufficientlymany particles per cell, otherwise it is faster to perform di-rect assignment as explained above. For this work, we didnot bother to find the optimal compromise between directassignment, oct-tree walk and FFT method and performedthe measurements as described in Table A1. The main goalwas simply to reach a reasonable level of accuracy to samplecorrectly the large N tails of function PN(ℓ) in a reasonableamount of CPU time while avoiding as much as possible theFFT method which is sensitive to the pixelization of thedata.
APPENDIX C: FORM FACTOR INTEGRALS
In this Appendix we present analytic expressions for theform factors F (x; y, c), the fraction of a halo with concen-tration parameter c and centre at r/rs = x that is containedwithin a spherical volume of radius R/rs = y. First, notethat the volume V of the intersection of two spheres of radiia and b whose centres are separated by distance d is
V(a, b, d) =
I(a, b, d), |a− b| 6 d 6 a+ b,
0, d > a+ b,
4π
3min(a3, b3), d 6 |a− b|,
(C1)
where the shared volume I(a, b, d) of spheres that partiallyoverlap is
I(a, b, d) ≡π
d
[
1
12d4 −
1
2d2(a+ b2)
+2
3d(a3 + b3)−
1
4(a2 − b2)2
]
. (C2)
Next, note that a decreasing profile ρ(r) can be modelled asa sum of step functions, truncated at an outer radius rmax.This means that the profile is composed of an ensemble ofspheres of decreasing densities ρi and increasing radii ri,i = 0, . . . , N , with r0 = 0, rN = rmax. Then, for ρ(r) = ρifor ri−1 < r 6 ri, we can write
ρ(r) = ρN −∑
ri>r
∆ρi, ∆ρi ≡ ρi − ρi−1. (C3)
Now, let us compute the mass contained within radius R ofthe origin for a halo centred at a distance d,
M(d,R) =
∫
r<R
d3r ρ(d+ r). (C4)
From equation (C3), the calculation reduces to the sum ofintersections of spheres with appropriate weights,
M(d,R) = ρ(rmax)V(R, rmax, d)−∑
i
V(ri, R, d)∆ρi. (C5)
In the continuous limit, we obtain the final expression
M(d,R) = ρ(rmax)V(R, rmax, d)
−
∫ r<rmax
|R−r|<d<r+R
I(r,R, d)dρ
drdr
−
∫ r<rmax
d<|r−R|
4π
3min(R3, r3)
dρ
drdr. (C6)
We apply this in particular to the NFW and isothermalsphere profiles.
C1 Convolution of the NFW profile
The truncated NFW profile writes, in scaled units
ρNFW(r) =
1
r(1 + r)2, r 6 c,
0, r > c .
(C7)

16 J. N. Fry et al.
The calculation of the integral gives
MNFW(x) = −
I(r, y, x)ρ(r)−2π(x+ 1)
xln(1 + r)
+πr
x−
πr
x
[
y2 − (x+ 1)2
1 + r
]r=r+
r=r−
−
4
3πr3ρ(r)− 4π
[
1
r + 1+ ln(r + 1)
]r=r1
r=0
−
4
3πy3ρ(r)
r=c
r=r−
+ ρ(c)V(c, y, x), (C8)
where ρ = ρNFW, x = d/rs, Y = R/rs, c = rmax/rs, and
r+ = min(c, x+ y), (C9)
r− = min(c, |x− y|), (C10)
r1 = min[c,max(y − x), 0)]. (C11)
Evaluated for y > c and x = 0 this gives the total mass,
M = 4π[(1 + c) ln(1 + c)− c]
(1 + c), (C12)
and the normalized NFW form factor is then
FNFW(x, Y, c) =MNFW(x;Y, c)
4π[(1 + c) ln(1 + c)− c]/(1 + c). (C13)
C2 Convolution of the Isothermal profile
The isothermal profile writes, in scaled units
ρISO(r) =
1
1 + r2, r 6 c,
0, r > c .(C14)
The calculation of the integral gives
MISO(x) = −
I(r, x, d)ρ(r)− 2π(r − arctan r)
+π
2x
[
(x2 − y2 − 1) log(1 + r2) + r2]
r=r+
r=r−
−
4π
3r3ρ(r)− 4π(r − arctan r)
r=r1
r=0
−
4
3πy3ρ(r)
r=c
r=r−
+ ρ(c)V(c, y, x), (C15)
where ρ = ρISO and r+, r−, and r1 are as in equations (C9)–(C11). Evaluated for y > c and x = 0 this gives the totalmass,
M = 4π(c− arctan c), (C16)
and the normalized form factor for the isothermal profile is
FISO(x, Y, c) =MISO(x;Y, c)
4π(c− arctan c). (C17)