DOCUMENT RESUME Kids Count - ERIC
79
DOCUMENT RESUME ED 424 966 PS 027 098 TITLE Kids Count: The State of the Child in Tennessee, 1994. INSTITUTION Tennessee State Commission on Children and Youth, Nashville. SPONS AGENCY Annie E. Casey Foundation, Baltimore, MD. PUB DATE 1994-09-00 NOTE 78p.; For related Tennessee Kids Count documents, see PS 027 096-027 102. PUB TYPE Numerical/Quantitative Data (110) Reports Descriptive (141) EDRS PRICE MF01/PC04 Plus Postage. DESCRIPTORS Acquired Immune Deficiency Syndrome; Adolescents; Birth Weight; Child Abuse; *Child Health; Child Neglect; Child Welfare; *Children; Counties; Crime; Demography; Dropout Rate; Drug Abuse; Early Parenthood; Elementary Secondary Education; Employment Patterns; Health Insurance; Infant Mortality; Juvenile Justice; Mental Health; Mortality Rate; One Parent Family; *Poverty; Prenatal Care; *Social Indicators; Special Education; State Surveys; Statistical Surveys; Tables (Data); Trend Analysis; Violence; Welfare Recipients; *Well Being IDENTIFIERS Child Mortality; *Indicators; Out of Home Care; Sexually Transmitted Diseases; *Tennessee; Vaccination ABSTRACT This Kids Count report examines trends in the well being of Tennessee's children. The statistical portrait is based on 23 indicators of child well being: (1) single-parent families; (2) family income/poverty; (3) children receiving Aid to Families with Dependent Children; (4) students participating in school nutrition programs; (5) teen unemployment rate; (6) child abuse and neglect rate; (7) children referred to juvenile courts; (8) child commitment rate to state care/custody; (9) enrollment in state health insurance program; (10) prenatal care rate; (11) low-birthweight rate; (12) infant mortality rate; (13) immunization rate; (14) child death rate; (15) teen pregnancy rate; (16) teen drug abuse; (17) teen HIV/AIDS incidence; (18) teen sexually transmitted disease rate; (19) teen violent death rate; (20) academic achievement; (21) students receiving special education; (22) high school dropout rate; and (23) incidence of school violence. Following an executive summary, the data are presented in three sections. Section 1 indicates that more than 25 percent of Tennessee children live in poverty and juvenile court referrals for violent crime has more than doubled in the last decade. Section 2 reveals that nearly a third of 1992 births lacked adequate prenatal care, nonwhite infant mortality was more than twice the white rate, child mortality declined 28 percent from 1980 to 1992, and the rates of pregnancy and sexually transmitted diseases declined from 1991 to 1992. Section 3 indicates that the high school dropout rate declined 24 percent from 1991 to 1992 and firearm-related expulsions increased dramatically from 1990 to 1992. (KB) ******************************************************************************** Reproductions supplied by EDRS are the best that can be made from the original document. ********************************************************************************
-
Upload
khangminh22 -
Category
Documents
-
view
2 -
download
0
Transcript of DOCUMENT RESUME Kids Count - ERIC
DOCUMENT RESUME
ED 424 966 PS 027 098
TITLE Kids Count: The State of the Child in Tennessee, 1994.INSTITUTION Tennessee State Commission on Children and Youth, Nashville.SPONS AGENCY Annie E. Casey Foundation, Baltimore, MD.PUB DATE 1994-09-00NOTE 78p.; For related Tennessee Kids Count documents, see PS 027
096-027 102.PUB TYPE Numerical/Quantitative Data (110) Reports Descriptive
(141)
EDRS PRICE MF01/PC04 Plus Postage.DESCRIPTORS Acquired Immune Deficiency Syndrome; Adolescents; Birth
Weight; Child Abuse; *Child Health; Child Neglect; ChildWelfare; *Children; Counties; Crime; Demography; DropoutRate; Drug Abuse; Early Parenthood; Elementary SecondaryEducation; Employment Patterns; Health Insurance; InfantMortality; Juvenile Justice; Mental Health; Mortality Rate;One Parent Family; *Poverty; Prenatal Care; *SocialIndicators; Special Education; State Surveys; StatisticalSurveys; Tables (Data); Trend Analysis; Violence; WelfareRecipients; *Well Being
IDENTIFIERS Child Mortality; *Indicators; Out of Home Care; SexuallyTransmitted Diseases; *Tennessee; Vaccination
ABSTRACTThis Kids Count report examines trends in the well being of
Tennessee's children. The statistical portrait is based on 23 indicators ofchild well being: (1) single-parent families; (2) family income/poverty; (3)
children receiving Aid to Families with Dependent Children; (4) studentsparticipating in school nutrition programs; (5) teen unemployment rate; (6)
child abuse and neglect rate; (7) children referred to juvenile courts; (8)
child commitment rate to state care/custody; (9) enrollment in state healthinsurance program; (10) prenatal care rate; (11) low-birthweight rate; (12)
infant mortality rate; (13) immunization rate; (14) child death rate; (15)
teen pregnancy rate; (16) teen drug abuse; (17) teen HIV/AIDS incidence; (18)
teen sexually transmitted disease rate; (19) teen violent death rate; (20)
academic achievement; (21) students receiving special education; (22) highschool dropout rate; and (23) incidence of school violence. Following anexecutive summary, the data are presented in three sections. Section 1indicates that more than 25 percent of Tennessee children live in poverty andjuvenile court referrals for violent crime has more than doubled in the lastdecade. Section 2 reveals that nearly a third of 1992 births lacked adequateprenatal care, nonwhite infant mortality was more than twice the white rate,child mortality declined 28 percent from 1980 to 1992, and the rates ofpregnancy and sexually transmitted diseases declined from 1991 to 1992.Section 3 indicates that the high school dropout rate declined 24 percentfrom 1991 to 1992 and firearm-related expulsions increased dramatically from1990 to 1992. (KB)
********************************************************************************
Reproductions supplied by EDRS are the best that can be madefrom the original document.
********************************************************************************

) s
4 10.. .0 0
*e Ill1
ll )
\ k i I ' 11
I '
-.3 ono so dan so 1111111
NM unitimaitun
iniussunuenu 1111111sa It 111111011111MINSIM
llar1111110111100,11110111,11111
; o sa
- alias S 6111144611114 'id Wictiolifithestribil
Alusitittitt *iihtudepli .:liosmmikuniojits di II N4
imobssiWitibo Tun ow, -1100.0411101 hos nu 1$11141141111 UMW sin P,sonlithinoospillissiatio
sursissiii isittisist a NM galectiois uiihiiiiuuiitsI
! oleossies so bild111111111, OWSWINWOffiltitioi 112,004110411.4wimitilic i4,24sitAANsmsbuisassmassi
*
--.
31L-15..a C.
Jra
II, 4 111
. . . . .
I . . I
r 1
I
II
II
*
k4
1111111114
41.1110,
33SS3NN31

Tennessee KIDS COUNTThe State of the Child in
Tennessee, 1 994
TENNESSEE COMMISSION ON CHILDREN & YOUTHTENNESSEE KIDS COUNTGATEWAY PLAZA BUILDING, FIRST FLOOR710 JAMES ROBERTSON PARKWAYNASHVILLE, TN 37243-0800
(615) 741-26331-800-264-0904FAX: (615) 741-5956
Permission is granted to reproduce any portion of this publication.
cirsi;pt, Tennessee Commission on Children and Youth authori-zation number 316009. 7000 copies. September, 1994.This public document was promulgated at a cost of$1.17 each.
The state of Tennessee is an equal opportunity, equal access, affirmative action employer.
3The State of the Child in Tennessee, 1994 A Tennessee KIDS COUNTifennessee Commission on Children and Youth Report 1

This publication is dedicated- to the memory ofYimfPnjor.
Tennessee Commission =Children and9'outhmember9imPryorpassed away May 17, 1994.
A May 19 proclamation by the Tennessee 9-fouse of Representatives reflects the feelings of
many. It says, inpart: withgreatsorrow and aprofoundsense of foss that the members
of this General Assemb fearnedof theuntirnet y death e ourfriend, lames F.Pryor...gintPryor
was ackiwwle4erianddeeplyrespectedas an enegeticschotar andfeacang advocate onifultters
pertaining to theprotectionechddren andthepromotionofchi tiheaftk safety, andweft-being
jim tirefes4 served the citizens of Tennessee with great industry and inteffilence ..."
Mr. Pryor was a member of the Northeast Council on Children andyouth, a charter member
and first chairman of the Tennessee Networkfor Child Advocacy, a member and chairman of
theTennessee ChaSexual AbuseTaskForce, a founefing member of the Tenne.ssee Chapter of
theAmericanProfessional-society on the Abuse cf Children, and thefounder of the Child-Abuse
Prevention. Center of Northeast Tennessee.
An attorney an d agnuruate of the 'University ofTennessee College of Law, Mr. Pyror served
as FacuItyStaff Attorney at the Legalainic of the UTCollege of Law, as anAgistantDistrict
Attorney in Knox. County, and as Chief Assistant District Attorney of the Thu. dDistrict.
9-k was a member of the First Baptist Church, Greeneville, where he taught Sunday school.
5-& is survived by his wife, M.E. Pryor, and two children, Laura Xmberfee Pryor and james
9Zussell -Pryor.
jim Pryor was a man of consi&rabfe charm, humor and intelligence. 91 is deeptj missed

Table of ContentsForward 4
Executive Summary 5
CHAPTER 1: FAMILY AND COMMUNITIESSingle-Parent Families 8
Poverty 10
AFDC 12
Nutrition 14
Teen Employment 18
Domestic Violence 20Child Abuse 22Teen Crime 24State Care, Custody 28
CHAPTER 2: HEALTHTenn Care 34Prenatal Care 36Low Birth Weight 38Infant Mortality 40Immunizations 42Child Deaths 44Teen Pregnancy 46Drug Abuse 50HIV/AIDS 51
STDs 52Violent Deaths 54
CHAPTER 3: EDUCATIONEnrollment, etc. 58Student Learning 60ACT Scores 62Special Education 64Dropping Out 66School Violence 68References 71
Glossary 75Appendix 75Acknowledgments 76
The State of the Child in Tennessee. 1994 A Tennessee KIDS COUNT/Fennessee Commission on Children and Youth Report 3

FORWARDKids Count: The State of the Child in Tennessee is the most comprehensive report on the
health, education, social and economic indicators of well-being for children in the state. TheTennessee Kids Count Project is part of a national and state-by-state effort to track thestatus of children in the United States. By providing policy makers and citizens withbenchmarks of child well-being, Kids Count seeks to enrich local, state, and nationaldiscussions concerning ways to secure better futures for all children.
The Tennessee Kids Count Project is administered by the Tennessee Commission onChildren and Youth (TCCY), an independent state agency created by the TennesseeGeneral Assembly. The primary mission of the commission is advocacy for improvementsin the quality of life for Tennessee children and families. TCCY collects and disseminatesinformation on children and families for the planning and coordinating of policies, programsand services, administers and distributes funding for teen pregnancy prevention programs,improvements in juvenile justice, and evaluates the implementation of Tennessee'sChildren's Plan.There has been a Commission on Children and Youth or Children's Services Commission
in Tennessee since the 1950s. The current statutory framework of the Commission onChildren and Youth was enacted in 1988. The 21 commission members, appointed by thegovernor for three-year staggered terms, serve as the policy board for the agency. Eachdevelopment district is represented by at least one commission member, and the commis-sioners of state departments serving children are ex-officio members. The commission alsohas youth advisory members as necessary to meet the requirements for serving as theState Advisory Group under the federal Juvenile Justice and Delinquency Prevention Act.
The commission staffs and coordinates nine regional councils that address local needsof children and families, provide organizational structure for statewide networking on behalfof children and families, and provide local input to the commission. Council membersinclude children's services professionals and other citizens interested in improving the livesof Tennessee children.The goal of the Tennessee Kids Count Project is to increase public awareness of the plight
of many children and encourage grassroots support for public and private efforts to improvetheir quality of life.
Tennessee is one of 48 states to receive a four-year, $400,000 Kids Count grant. Thegrant program is funded by The Annie E. Casey Foundation, the nation's largest philan-thropy devoted exclusively to disadvantaged children. Based in Baltimore, Maryland, thefoundation was established by the founders of United Parcel Service to improve family andcommunity environments that shape young people's health, development, education,opportunities and aspirations.
At the national level, the principal activity of the initiative is the publication of the annualKIDS COUNT Data Book, which uses the best available data to measure the educational,social, economic, and physical well-being of children. The Casey Foundation is funding thestate-level KIDS COUNT projects to provide a more detailed, community-by-communitypicture of the condition of children.
Through the Kids Count Project, understandable information about the well-being ofchildren is gathered and disseminated so citizens, advocates, policy makers, and politicalleaders will have timely and reliable information.
6
4 The State of the Child in Tennessee, 1994 A Tennessee KIDS COUNT/Tennessee Commission on Children and Youth Report

EXECUTIVE SUMMARYThe statistical information in this report was gathered from raw data and reports generated by other Ten-
nessee state agencies or state departments, the U.S. Census Bureau, and other sources of data on children.The most current available data are presented here. Narratives on each child well-being indicator weredeveloped to provide contextual information for the county-by-county statistics. An analysis of the data in thisreport reveals vital information on the quality of life for Tennessee's children. The major findings of this reportare listed here.
CHAPTER I - FAMILIES AND COMMUNITIESSingle-Parent FamiliesTennessee ranks second worse among the states in the percent of children living in single-parent families. From
1985 to 1991, there has been a 33 percent increase. Children from single-parent families are more likely thanchildren living with two parents to live in poverty, have low academic achievement, and become involved with thejuvenile justice system.
Poverty, AFDC, and Child Nutrition ProgramsMore than a fourth of Tennessee children live in poverty. Current AFDC payments in Tennessee are not enough
to bring families out of poverty. The maximum AFDC benefit a family of three in Tennessee can receive is $185per month while the national average benefit level is $393.
Many Tennessee students who are eligible to participate in the government-subsidized, free- and reduced-price breakfast program cannot do so because their schools do not offer it. Although the School BreakfastProgram is an entitlement program, it is not available to 18.2 percent of the eligible children.
Teen CrimeThe number of referrals to juvenile courts in Tennessee for violent crimes has more than doubled in the past
decade. Many factors that are strong predictors of violent behavior are known. They include increased availabilityof firearms, alcohol and other drugs. Other important factors predictive of teen crime include lack of parentalsupervision, poverty and single parenthood. In 1992, only 13.7 percent of juveniles referred for murder in
Tennessee lived with both parents.
Children in State Care or State CustodySince Tennessee's Children's Plan was implemented in 1991, the number of new commitments has been fairly
stable. Prior to The Children's Plan, new commitments to state care increased 65 percent between FY 1983-84and FY 1990-91. Between FY 1990-91 and FY 1993-94 there was an eight percent increase in commitments.Approximately one percent of Tennessee's children are in state custody.
CHAPTER 2 - HEALTHTennCareAlmost one in four Tennesseans is covered by TennCare. More than 50,000 children ages birth to 13 who were
not eligible to be covered under Medicaid are now covered by TennCare. More than 119,860 females ages 14to 44, roughly childbearing age, are now covered and have greater access to prenatal care. A total of 385,938people who were uninsurable or uninsured in Tennessee now have medical insurance through TennCare.
Prenatal Care, Low Birth Weight and Infant MortalityNearly a third of all births in Tennessee in 1992 lacked adequate prenatal care. Women who do not receive
adequate prenatal care are at risk of delivering premature or low-birth-weight babies. Low birth weight is a majorcause of infant mortality. There was a four percent increase from 1990 to 1992 in low-birth-weight babies bornin Tennessee. In 1990, 8.2 percent of all births were infants weighing less than 5.5 pounds. In 1992, 8.5 percentof all births were of low birth weight.
Tennessee's infant mortality rate declined 54 percent from 1973 to 1991, from 20.3 per 1,000 in 1973 to9.4 in 1992. The most recent figures show this downward trend may be accelerating. From 1990 to 1992there was a five percent decline in Tennessee's infant mortality rate. The infant mortality rate went from 10.3per 1,000 in 1990 to 9.8 in 1992.
The nonwhite infant mortality rate in Tennessee is more than twice as high as the white rate. The whiteinfant mortality rate in Tennessee is 6.9 per 1,000 compared to the nonwhite rate of 16.9 per 1,000. InTennessee, more than 99 percent of the nonwhite population is African American.
Child DeathsThere has been a 28 percent decline in the child death rate from 1980 to 1992 in Tennessee among
children aged 1 through 14 years old. The rate in 1992 was 31.9 per 100,000 compared to 44 per 100,000 in1980. Accidents are the leading cause of death 41.5 percent of Tennessee's child deaths were caused byaccidents. Continued
The State of the Child in Tennessee, 1994 A Tennessee KIDS COUNT ennessee Commission on Children and Youth Report 5

Teen PregnancyFrom 1991 to 1992, there was a seven percent decrease in Tennessee's teen pregnancy rate for girls
aged 10 17 years. In 1992, the rate was 23.8 pregnancies per 1,000 females compared to 25.6 in 1991.Decreases occurred in rates for both white and non-white females from 1991 to 1992. The white rate de-clined 7.9 percent from 19.1 to 17.6. The non-white rate declined 6.1 percent from 48.9 to 45.9.
Sexually Transmitted Disease RateA dramatic 23 percent decline occurred in the sexually transmitted disease (STD) rate for Tennessee from
1991 to 1993 for teens aged 15-19. During 1993 in Tennessee, 7,581 teens aged 15-19 were reportedhaving STDs for a rate of 2092.0 per 100,000 while the 1991 teen STD rate was 2636.4 per 100,000.
Teen Violent DeathsThe number of teen violent deaths has increased six percent from 1984 to 1992. There were 253 teen
violent deaths in 1984 compared to 269 deaths in 1992. The teen violent death rate in 1992 was 73.9 per100,000. Approximately 90.7 percent of the 269 violent teen deaths in 1992 were due to motor vehicleaccidents or firearm injuries.
Teen firearm deaths increased 135 percent from 1984 to 1992. In 1984, 12.8 percent of all teen deathswere firearm-related. By 1992 the figure had grown to 30.2 percent of all teen deaths. Sixty-eight percent ofall the state's teen firearm deaths occurred in the metropolitan counties of Shelby, Davidson, Hamilton, andKnox.
CHAPTER 3 - EDUCATION
School Enrollment, Grade Retentions and Graduation RateStudent enrollment from 1990 to 1993 increased six percent from 858,991 students in 1990 to 906,451
students in 1993. More students failed to be promoted to the next grade in 1993 after two years of continu-ous decline. The greatest increase in retentions was at the high school level with a 22 percent increase from1992 to 1993. In 1992, 18,599 students were retained and in 1993 the figure was 46,299.
The number of high school graduates declined 21 percent from 1990 to 1994 while twelfth grade netenrollment increased. In 1990, there were 55,582 graduates compared to 43,564 in 1993. Twelfth grade netenrollment went from 52,795 students in 1990 to 53,258 in 1993.
School Suspensions and ExpulsionsIncidents of school suspensions have risen 49 percent from 1990. There were 71,498 suspensions in 1990
and in 1993 there were 106,756 suspensions. Expulsions increased 78 percent from 1990 to 1994. In 1990there were 397 students expelled and 709 students were expelled in 1993.
Reasons for suspensions and expulsions that have significantly increased over time include: absenteeism,tardiness, and truancy; immoral/disreputable conduct; personal violence; fighting among students; andpossession of a firearm or other dangerous weapon.
Student LearningTennessee students are performing within the average range compared to other students in the nation. For
five years, Tennessee students have scored at or above the average range on 98 percent of the nationallynormed test items on the Tennessee Comprehensive Assessment Test (TCAP).
The results of the test items on TCAP that measure mastery of grade-level skills are not as encouraging.Only 57.1 percent of students in grades two through eight mastered grade-level language arts skills on the1994 TCAP exam. Only 46.8 percent of students in grades two through eight mastered their grade-levelmath skills on the 1994 statewide test.
Dropping OutTennessee's dropout rate had a 24 percent decline from school years 1991-92 to 1992-93. The percent-
age of Tennessee dropouts declined from 6.3 percent in 1991-92 to 4.8 percent in 1992-93.
School ViolenceThere were more than five times more students expelled for possession of firearms and other danger-
ous weapons during the 1992-93 school year compared to 1990-91 in Tennessee. During 1990-91, therewere 33 expulsions compared to 173 expulsions in the 1992-93 school year.
8
6 The State of the Child in Tennessee, 1994 A Tennessee KIDS COUNT/fennessee Commission on Children and Youth Report

Chapter 1Family and Communities
9
The State of the Child in Tennessee, 1994 A Tennessee KIDS COUNT/Fennessee Commission on Children and Youth Report 7

Tennessee's Percentage Second-Worst in NationNearly one-third of children in Tennessee live in single-parent families. [1]
Tennessee ranks second worst in the nation in percentage of children living insingle-parent families. Only Mississippi has a higher percentage. [2]
An average of 32.6 percent of Tennessee children nearly one in three livedin single-parent families, KIDS COUNT has calculated, using averages from1989 through 1993. [3]
Since 1.985, the percentage of Tennessee children living in single-parentfamilies has increased by 33 percent - the fifth worst growth rate in the country.The four states with higher growth rates Montana, Minnesota, North Dakota,and South Da-kota averagedonly 19.7 percentof their childrenliving in single-parent families.[4]
Tennessee'sgrowth in thepercentage ofchildren living insingle-parentfamilies, whileworse than thenation as awhole, nonethe-less reflects anational trend. "The share of children living in single-parent families increasedfrom 22.7 percent in 1985 to 25.1 percent in 1991 [nationally.] The increase inthe percentage of children living in this type of family was pervasive. All but sixstates recorded an increase in this measure between 1985 and 1991." [5]
Tennessee's ranking on the percentage of children living in single-parentfamilies is significant because many single parents lack the supports and secu-rity to provide adequately for their children. And in trying to provide financialsecurity for their families, some single parents do not have enough emotionalenergy left to really nurture their children.
Also, there are significant relationships between single-parent families andpoverty and single-parent families and juvenile justice involvement.
"Children growing up in single-parent households typically do not have thesame economic, housing, or human resources available as those growing up intwo-parent families. For example, the most recent national figures from theCensus Bureau indicate that among families with children, the poverty rate forsingle-parent families is 42 percent, compared to 8 percent for two-parent fami-lies. Poverty among single-parent families is rarely eliminated by public assis-tance programs available to poor children. For example, the combination ofAFDC and Food Stamps is below the poverty line in every state and under 75percent of the poverty line in 38 states and the District of Columbia. In addition,relatively few single parents receive child suppThayments, and even fewer
40
35
30
25
20
Percent of Children in Single-Parent Households*Tennessee and Surrounding States
1, 1,610> Q.4 l'*+ Qs, t 4 4 le
>,s % % "vcyg. 4,06 'o4). 6'4>:
Source: 1994 KIDS COUNT Data Book *Average 1989 through 1993
8 The State of the Child in Tennessee, 1994 A Tennessee KIDS COUNT/Tennessee Commission on Children and Youth Report
receive the full childsupport payments towhich they areentitled." [6]
The relationshipbetween growing upin a single-parentfamily and involve-ment with the juve-nile justice system iswell documented.(See Teen Crime,pages 24 through27.)
Single-parenthoodoccurs in variousways: "... death of apartner, birth of achild to an unmarriedmother, separation,desertion and di-vorce ..." [7]
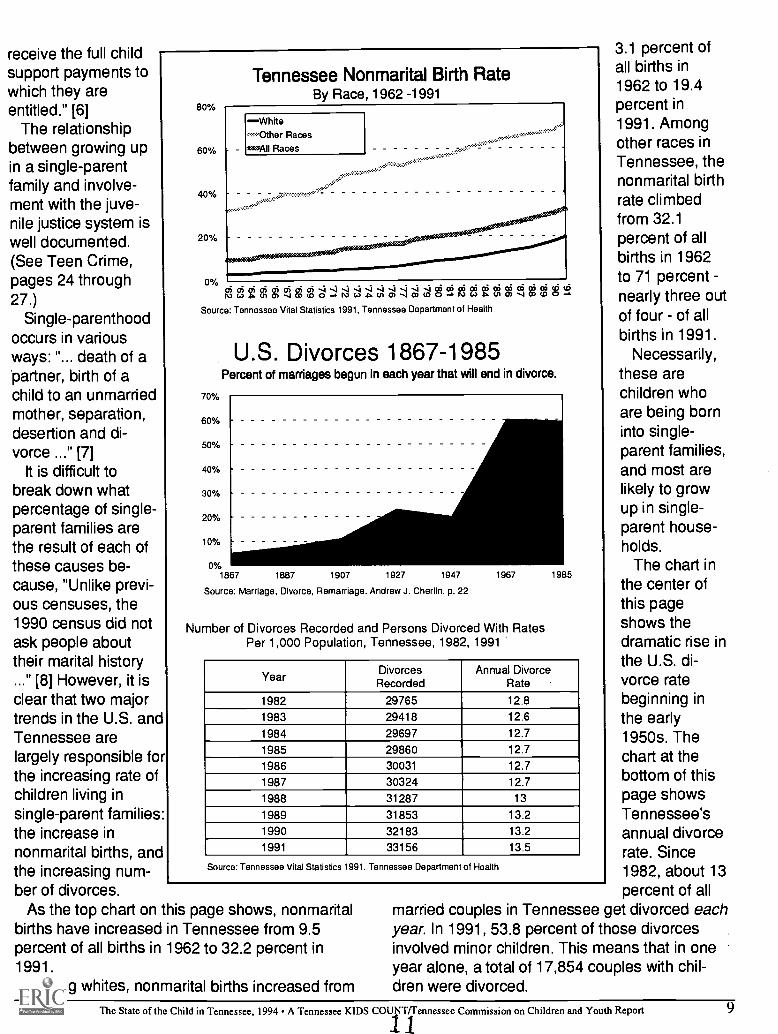
It is difficult tobreak down whatpercentage of single-parent families arethe result of each ofthese causes be-cause, "Unlike previ-ous censuses, the1990 census did notask people abouttheir marital history..." [8] However, it isclear that two majortrends in the U.S. andTennessee arelargely responsible forthe increasing rate ofchildren living insingle-parent families:the increase innonmarital births, andthe increasing num-ber of divorces.
As the top chart on this page shows, nonmarbirths have increased in Tennessee from 9.5percent of all births in 1962 to 32.2 percent in1991.
Among whites, nonmarital births increased fr
80%
60%
40%
20%
Tennessee Nonmarital Birth RateBy Race, 1962 -1991
...Other RacesIretsAll Races
'
en 2 2 go' S' F:1 Vi 8 2? FS 2 2 8 !!:
Source: Tennessee Vital Statistics 1991, Tennessee Department of Health
70%
60%
50%
40%
30%
20%
10%
0%1867 1887 1907 1927 1947
Source: Marriage, Divorce, Remarriage. Andrew J. CherlIn. p. 22
U.S. Divorces 1867-1985Percent of marriages begun in each year that will end in divorce.
1967
Number of Divorces Recorded and Persons Divorced With RatesPer 1,000 Population, Tennessee, 1982, 1991
1985
YearDivorcesRecorded
Annual DivorceRate
1982 29765 12.8
1983 29418 12.6
1984 29697 12.7
1985 29860 12.7
1986 30031 12.7
1987 30324 12.7
1988 31287 13
1989 31853 13.2
1990 32183 13.2
1991 33156 13.5
Source: Tennessee Vital Statistics 1991. Tennessee Department of Health
3.1 percent ofall births in1962 to 19.4percent in1991. Amongother races inTennessee, thenonmarital birthrate climbedfrom 32.1percent of allbirths in 1962to 71 percentnearly three outof four - of allbirths in 1991.
Necessarily,these arechildren whoare being borninto single-parent families,and most arelikely to growup in single-parent house-holds.
The chart inthe center ofthis pageshows thedramatic rise inthe U.S. di-vorce ratebeginning inthe early1950s. Thechart at thebottom of thispage showsTennessee'sannual divorcerate. Since1982, about 13percent of all
ital married couples in Tennessee get divorced eachyear. In 1991, 53.8 percent of those divorcesinvolved minor children. This means that in oneyear alone, a total of 17,854 couples with chil-
om dren were divorced.
The State of the Child in Tennessee, 1994 A Tennessee KIDS COU4ITifennessee Commission on Children and Youth Report 9
I

Children are Among the Poorest of the Poor in Tennessee.
In 1991, the most recent year for which state figures are available, 25.8 percent ofchildren in the state lived in families with income below the federal poverty level. Thenational figure was 20 percent.
More recent national child poverty statistics have shown an increase. The U.S. CensusBureau recently reported that the number of children in poverty increased in 1993. Therewere 15.7 million children living in poverty in 1993, or 22.7 percent of all children. In1992, there were 15.2 million children living in poverty 22.3 percent of all children.
Tennessee ranked 46 out of the states in the percent of children living in poverty,according to the 1994 national Kids Count Data Book. Only Mississippi, New Mexico,Louisiana, and West Virginia ranked worse.
Several explanations as to why child poverty is increasing have been proposed. Ac:.cording to an official of the Children's Defense Fund, it is "much harder for young families
Oto make ends meet than it used to be. The message here is that poverty is going to keeptightening its grip on children until parents can find stable jobs with decent pay." [1]
The Census Bureau reports that it is an odd phenomena that child poverty rates arerising during a robust economy. The rationale, according to economists, is tied intosomething called a 'silent depression.' As the U.S. economy "settles into a worldeconomy and high-paying union jobs continue to disappear, more Americans are takingon lower paying service sector jobs. Although some of the problems stem from moreworkers forced into part-time work, that is not the whole answer. In 1979, 12 percent offull-time workers earned too little to keep a family of four out of poverty; in 1993 that roseto 16.2 percent, according to census data." [2]
In Tennessee the problem of poverty is exacerbated by the population increase inwhite, impoverished migrants from Georgia, Florida, and Michigan. A recent study oninterstate migration revealed that from 1985 to 1990, Tennessee was among the top fivestates with internal migration of impoverished whites from those three states.
The percent of children in poverty is used as a well-being indicator because it is ameasure for the current and future risk to children's well-being. Current risks include lackof access to basic goods and services and unsafe environments. Poor families lack theincome needed to provide for their children's basic needs such as adequate food, cloth-ing, and shelter. For example, poor children are "more likely to be malnourished; poorchildren aged 2-5 are almost three times more likely than non-poor to fall in the lowestpercentile for height-for-age." [3]
Regarding lack of access to basic services, poor families do not have access to "qualityservices that contribute to a child's development such as: health insurance and healthservices; quality day care; recreation; early childhood education. For example, poorchildren are less likely than non-poor to be immunized against childhood diseases, tohave a regular health care provider, or to have regular physician visits." [4]
Poverty as a measure of the future risk to children's well-being includes adverse out-comes in young adulthood such as dropping out of school and teen pregnancy. Poorchildren are three times more likely to drop out of school. Teen girls living in poverty arefive and a half times more likely to become teen mothers. Family characteristics associ-ated with financial insufficiency include low parent education, young parental age, single-parent families, low skill levels, and lack of steady full-time employment.
Too many children in Tennessee are growing up with "parents who have relatively loweducation levels and little employment experience. These children are at great risk oflong-term poverty and welfare dependence, especially if they live in single-parent fami-lies. A high proportion of female-headed families with children born outside of marriagerely on welfare or other forms of government assistance. Nationally, 83 percent did sofrom 1983 to 1986. Because childrearing with limited resources can be damaging to thechild, the family, and society, the need to encourage self-sufficiency among such familiesis agreed upon by policymakers and citizens from a range of political perspectives. Thebest means for doing so, however, are currently being researched and debated." [5]
The encouraging news is that Tennessee's per capita personal income has grownfaster than any other state's in the past 10 years. The state's per capita personal incomeincreased from $9,850 in 1983 to $18,434 in 1993 an increase of 87.1 percent. Al-though the state has a strong economy, the per capita income is still below the 1993national average of $20,817. Forty-three Tennessee counties had per capita incomesbelow the 1991 poverty threshold for a family of four $13,924. Note that the povertythreshold is based on household income and not per capita income.
10 The State of the Child in Tennessee, 1994 A Tennessee KIDS COUNT/Tennessee Commission on Children and Youth Report
12

Per Capita Personal Income by County, 1992
CountyPer Capita Income*
In DollarsAnderson 18,587:Bedford 15,589:Benton 13,945:Bledsoe 11,588
17,098:Bradley 16,868:Campbell 11,846Cannon 14,944:Carroll 14,643Carter 13,176
heatharTI 14,743:Chester 11,673:Claiborne 12,559Clay 13,016
13,412.......:Coffee 17,429Crockett 16,180Cumberland: 13,234:::DaVidSon 22,273Zsecatur 12,739:De Kalb 15,320:Dickson 15,583
yer 16,287.:Payette 14,233fentress 12,345'Franklin 14,586:Gibsdri. 15,986les
.15,975
biainger 11,910'.Greene 13,867Zeundy 11,590:Hamblen 15,948Hamilton 19,853
CountyPer Capita Income*
In Dollars:Hancock 10,150iflardeman 13,111:Hardin 12,891Hawkins 14,767:144Ylkood 15,080Henderson 13,861:ffenry 15,221HiCkman 12,728:Hbuston 11,640Humphreys 14,022Jackson 12,791
:Oefferson 14,1009,966
19,601take 11,911
13,611,-awrence 15,177
12,592:tindoln 14,951totidon 15,569:MdMinn 14,394
10.110y 13,999Madon 13,630
::Madison 17,340:Marion 13,878Marshall 17,315140.iy 16,517:1Aes 12,6111Adinroe 12,602MOntgomery 14,868
:.Modre 13,659:Morgan 11,675Dbfori".. 16,889
Ranges
9944 to 17721
12729 to 14233
14234 to 15975
15974 to 24149
CountyPer Capita Income*
In Dollars:OVerton 11,920:Perry 12,579Pickett 12,970Polk 13,152Putnam 16,000iirlea 13,040:f4oane 16,016:flobertson 15,714:Rutherford 17,875:8Cott 11,888:SOUatchie 13,245:Sevier 15,749:Shelby 20,447Smith 15,210:Stewart 12,524
:%.!!i;en 17,794:Sumner 17,807:Tipton 15,044'Trousdale 12,491:Unicoi 14,808lfrilon 11,579:Van Buren 10,157:Warren 14,510:Washington:: 17,199:Wayhe 11,965:Weakley 14,753:Whife 13,221:Williamson::: 26,149:Wil.SOO:::::::,. 18,181
etifieStee 17,674
S:10 20,114Source: U.S. Department of Commerce, Bureau of Economic Analysis.* Per capita personal income includes the income that is not taken into account by U.S. Census per capitapersonal income report.
1 3 BEST COPY AVAILABLE
The State of the Child in Tennessee, 1994 A Tennessee KIDS COUNT/Tennessee Commission on Children and Youth Report 11

AFDC Inadequate to Bring Families Out of PovertyToday's cash welfare payments are not sufficient to bring children and their families outof poverty in Tennessee. Current AFDC payments are well below what the U.S. Depart-ment of Housing and Urban Development says is needed to rent 'decent, safe, andsanitary' housing of a 'modest' nature.
AFDC provides aid only to those poor children who fit within defined groups. AFDCprovides aid for a needy child only if the child lives with a relative and one of the child'sparents is dead or otherwise absent from the home, or is incapacitated or unemployed.
As a 'means tested' program, a family cannot qualify for aid unless its income is belowthe standards set by the state. The amount of aid provided to a family is based on thedifference between its maximum net income and the 'standard of need.' In Tennessee,the standard of need is determined by the Tennessee Department of Human Servicesand, subsequently, adopted by the Tennessee General Assembly to become official.
The current standard of need is inadequate. Tennessee ranked 42 on the 1994 needstandard for a family of three in a study by the Center on Social Welfare Policy and Law.Tennessee's standard is $426 while the average need standard in the U.S. is $65742]
Tennessee's 1994 AFDC benefit level for a family of three is less than half the nationalaverage. In the study by the Center on Social Welfare Policy and Law, Tennesseeranked 48 only Alabama and Mississippi had lower benefit levels. The national averagebenefit level for a family of three is $393 while Tennessee's maximum is $185, less thanhalf of the national average. [3]
Additionally, Tennessee's 1994 AFDC benefits are worth less than those in 1975.Tennessee is one of eight states where the benefit levels in January 1994 were lessthan they had been in January 1991. The monthly benefit levels for a family of three inTennessee from January 1991 to January 1994 went from $195 to $185. This $10 cutwas a 5.1 percent decrease. The change in the real value of monthly benefits measur-ing 1994 benefits in 1991 dollars showed a decline of $25 or 12.6 percent. [4]
Despite the declining value, there was a 65 percent increase in the monthly averagenumber of families receiving AFDC from 1987 to 1994. The monthly average in 1987was 63,816 families per month while the monthly average number for families on AFDCin 1994 was 105,672.
Increases in the number of caseloads have been accompanied by increases in thepercent of AFDC caretakers in the work force from 12.8 percent in 1988 to 20.4 percentin 1993. However, 83.1 percent have work histories. When asked why they weren'tworking, over half (53.7 percent) cited disabilities, health problems, lack of child care, ortheir children were too young. [5]
Despite myths to the contrary, a family of three is the typical AFDC family in Tennes-see; 90.4 percent of the AFDC caretakers in 1993 had three children or fewer. [6]
Another myth that welfare recipients do not want to get off welfare is being de-bunked by a state program designed to help families who receive welfare becomefinancially independent.
Tennessee's JOBSWORK program, administered by the Tennessee Department ofHuman Services and funded with federal and state dollars, helped about 62 percent ofits clients who completed the program end their dependence on AFDC, a recent surveyrevealed.
The study, conducted by the University of Memphis, also revealed about 46 percent ofJOBSWORK participants who completed the program no longer received Food Stamps;and more than 85 percent earned well above minimum wage.
Participation in JOBSWORK is not mandatory statewide. However, pilot programs in15 Tennessee counties noW require all AFDC recipients to participate in the first compo-nent of the program unless they are exempt for reasons such as having a disability,having a child less than one year old, or being under 16 or over 60 years old. The firstcomponent includes a month of training in areas such as survival skills for women,financial management, nutrition, coping with crisis, and self-advocacy. Persons whoparticipate in the first component are encouraged to move on to the second component,which provides education or vocational training and help with finding employment.
12 The State of the Child in Tennessee, 1994 A Tennessee KIDS COUNTaennessee Commission on Children and Youth Report

Percent of Children Receiving AFDCMonthly Average, Fiscal Year 1994
CountyAFDC
Number Percent:MderSbei 2,157 13.2:Bedford 846 10.6:f3enton 385 11.6pledsoe 445 19.2filount 2,091 10.3:13radley 1,573 8.4:Campbeif 2,209 25.2iannon 266 10.0Carroll 675 10.3'ariner 1,480 13.1.ChneEitham 692 8.4'Ohester 316 9.8:::Claiborne 1,107 16.6'.:Olay 201 12.4iCocke 1,428 20.7..Coffee 1,312 12.3
rockeit 367 11.6tilthberlahd 849 10.2:0M:6ft:in 26,280 21.4Decatur 218 9.57.0eKalb 453 13.3:Dickson, 1,119 10.8'Dyer 1,411 15.6f ayette 1,369 18.4:f entress 638 17.2franklin 889 10.3Obsori 1,503 13.7:Giles 732 11.1Grainger 544 13.2.Greene 1,649 13.0i:Grundy.. 809 22.8:HaMblen 1,937 15.9liaMillorl , 11,935 17.3
CountyAFDC
Number PercentHatitOOk 445 27.3+lardOman 1,424 21.6i.rd1n 833 14.6:HaWkins 1,521 14.5Haywood 1,142 20.9:HOOderson1 406 7.6iii6hey: ,i 729 11.8tlickman 484 11.7tlstonou 178 10.7. ..tiumphreys 389 10.1:JaCkson 230 11.3:Jefferson 971 13.0:Johnson 472 15.6:Knox 11,431 14.5:Lake 321 22.0Iailideniolale ii: 1,543 24.1:Lawrence 717 7.6Lewis 255 10.8:Lincoln 638 8.8:Loudon 638 8.5IMOMinn 1,174 11.4McNairy 851 15.8:Macon 374 9.2:Madison 3,778 17.9:Marion 941 14.5:Marshall 469 8.2:Maury 1,896 12.7iMeigs 296 15.0Monroe 1,202 15.3:Ntoeitottiesey 2,597 9.0!tidtire.:Morgan:10bion
62 5.3600 13.7933 12.3
Percent Ranges
!4.4 to 9.8
9.9 to 11.8
11.9 to 153
15.4 to 27.3
CountyAFDC
Number. PercentOVerton 489 11.8Perry 107 6.5Pickett 123 11.4Polk 304 9.7Putnam 1,053 8.5Rhea 1,188 19.6Roane 1,338 12.5Robertson 982 8.2Rutherford 2,356 6.5Scott 1,137 _ 22.1
Sequatchie 350 15.1
Sevier 1,139 8.8Shelby 60,720 25.8Smith 295 8.3Stewart 182 8.4Sullivan 3,575 11.3Sumner 1,754 5.9Tipton 2,076 17.2Trousdale 145 10.2Unicoi 392 11.3Union 572 15.2Van Buren 153 12.7Warren 968 11.8Washington: 2,570 12.5Wayne 370 10.5Weakley 607 8.0White 503 10.4Williamson : 1,128 4.4Wilson 1,441 7.3
. ennessee. 197,842 15.8
Source: Administrative Review Section, Tennessee Department of Human Services.Note: Percent is based on the 1993 population estimates made by Department of Sociology, University of Tennessee,Knoxville. The state average is not necessarily the sum of the county averages.
FY 1994 is from July 1993 to June 1994. BEST COPY AVAILABLE
The State of the Child in Tennessee, 1994 A Tennessee KIDS COUN essee Commission on Children and Youth Report 13

Imio
INADEQUATE NUTRITION MAY CAUSE LASTING DAMAGE
Inadequate nutrition, which affects the physical and cognitive developmentof children, may produce lasting damage to them. "Undernutrition is closelyassociated with poverty, and the effects of undernutrition are made worse bythe range of socio-environmental insults that often accompany poverty." [1]With approximately 247,366 children living in poverty in Tennessee during1990, thousands of them are experiencing hunger.
To protect the nutritional status of low-income children, two entitlementprograms are available, the School Breakfast Program and the NationalSchool Lunch Program. These programs are open to all public and non-profitprivate schools and all residential child care institutions. The meals must meetspecific nutritional requirements to qualify for federal funds.
The federal government reimburses schools for all or part of the cost ofevery meal. The amount children pay for breakfast depends on the financialcircumstances of each child's family as reflected in applications submitted toschools orother requireddocumenta-tion. Childrenfrom familieswith incomesbelow 130percent of thepoverty line($18,655 for afamily of fourin school year1993-94)receive mealsfree. Childrenfrom familieswith incomesbetween 130 and 185 percent of poverty ($26,548 for a family of four in schoolyear 1993-94) receive meals at a reduced price. All other children receivewhat is officially designated a paid meal. [2]
Although the School Breakfast Program is an entitlement program, it is notavailable to many eligible children because some schools do not offer it. InTennessee, the reasons most often cited for school non-participation aredisruption to the school schedule or less than 50 students participate.In Tennessee during March 1994, twice as many students participated in thelunch program as the breakfast program. During March, 248,916 low-incomechildren participated in the National School Lunch Program while 110,959participated in the School Breakfast Program.
Despite these disparities, Tennessee has made progress since 1991 inbetter low-income student participation in the breakfast program. In March
Free- and Reduced-Price Meals ProgramPercent of School Population Participating*
40%
35%
30%
25%
20%
15%
10%
5%
0%1991 1992 1993
MLUNCH OBREAKFAST1
Source: Tennessee Department of Education. *March of each year shown.
1994
1 c
14 The State of the Child in Tennessee. 1994 A Tennessee KIDS COUNT/fennessee Commission on Children and Youth Report

Percent of Students Participating in School Lunch ProgramsWho Received Lunch at Free or Reduced Prices, 1993-1994
CountyLunch
Number* Percent**Ander Sdri 2,950 43.1.Bedford 1,410 34.0:Benton 944 44.0:Bledsoe 709 54.0llount 3,439 33.37Bradley 3,109 37.5.ampbell 3,142 67.0:Cannon 567 42.0:.CarroH 1,680 44.5:Carter 3,397 58.9
heeffieriV 1,132 29.0:Chester 781 44.0Claiborne 2,273 67.0:Clay 659 64.0Cocke 2,440 63.6:COifee 1,999 33.9:Crockett 895 44.6:Cumberland 2,354 49.0:DaVidSon 22,694 59.0,.Decatur 605 38.0'iDeKalb 857 45.0:Ps,.0.? 1,976 41.0:Dyer 2,145 42.8fayette 3,086 85.0:fentress 1,416 71.0Franklin 1,671 40.0_...:.Gibson 2,783 42.8-ic_o. 1,310 39.0:Cirainger 1,297 57.0:.Greene 2,645 43.8:.Gruncly 1,022 74.0:Hamblen 2,632 42.0Hamilton
. : 12 ,126 45.1
CountyLunch
Number* Percent**Hancook 957 93.0Hardeman 2,544 66.0Hardin 1,375 54.0Hawkins 2,348 46.3.Haywàod 2,426 74.0.Henderson 1,048 35.9Henry 1,612 46.1Hickman 917 46.0Houston 475 46.0Hurhphre s 805 36.0ackson 648 60.0
Jefferson 1,552 39.0Johnson 1,059 66.0
-Knox 11,291 37.0Lake 559 63.0,Lau d e rdale 2 ,742 70.0
awrence 2,098 40.0Lewis 521 37.0Lincoln 1,320 35.9Loudon 1,689 38.4McMinn 2,019 36.6
McNalrY 1,323 43.0Macon 818 36.0Madison 4,783 54.0Marion 1,404 41.0Marshall 939 29.0Maury 2,600 35.0Meigs 603 54.0Monroe 1,998 49.0MOntgomety 5,694 51.0môoe6 181 28.0Morgan 1,407 59.0000 1,658 39.7
Percent Ranges
!15.6 to 38.0
38.1 so 44.5
444 to 54.0
54.1 to 93.0
CountyLunch
Number* Percent**OVre On' 1,141 52.0.Perry 384 47.0Pickett 456 73.0
:.P,Olk 684 48.0.:Piiiii0i 2,162 37.0'Rhea 1,555 51.2:Roane 2,136 38.3-:Robertson 1,895 30.0**Rutherford 4,408 29.3-Stott 2,424 77.8Sequatchie 677 51.0.Sevier. ,... 2,808 45.0-SttelbY' 57,559 69.6Smith 838 37.0Stewart 589 44.0SulliVan 5,687 40.5Sumner 2,991 24.0Tipton 3,242 46.3Trousdale 283 31.0Unicoi 744 48.0Union 1,072 56.0Van Buren 326 49.0Warren 1,497 41.0.Washington: 3,607 46.8Wayne 953 49.0Weakley 1,444 39.0Whife 1,080 40.0Williamson 1,342 15.6Wilson 1,874 22.9
Tennessee. 261,994 48.0
Source: School Nutrition Program, Tennessee Department of Education.* Number of students participating in free- and reduced-price lunch program.**Percent is the number of students getting free or reduced price lunches divided by the total number of studentsparticipating in school lunch programs.
The State of the Child in Tennessee, 1994 A Tennessee KIDS COUNT ennessee Commission on Children and Youth Report 15

1991, there were 102,307 participants (13.2percent of the total school population) comparedto 115,399 in March 1994, (17.7 percent of thetotal school population). To reach more children,Tennessee applied for and received federal start-up funds in 1994 to encourage the initiation ofschool breakfast programs.
Research on the benefits of the School Break-fast Program shows that children who participatedhad significantly higher standardized achievementtest scores than eligible non-participants. [3]"Children getting school breakfast also had signifi-cantly reduced absence and tardiness rates." [4]
Raising test scores and improving attendanceare only two reasons why the breakfast and lunchprograms are essential. The United States DairyAssociation (USDA) research on the NationalSchool Lunch Program shows that children whoparticipate in the lunch program have "superiornutritional intake compared to those who do not.Studies also show that low-income children de-pend on the School Lunch Program for one-thirdto one-half of their nutritional intake each day.These findings indicate that this program is highlysignificant insofar as protecting the nutritionalstatus of most participating low-income children." [5]
According to the 1994 Tufts study, The LinkBetween Nutrition and Cognitive Development in
Children, recent research provides "compellingevidence that undernutrition during any period ofchildhood can have detrimental effects on thecognitive development of children and their laterproductivity as adults. In ways not previouslyknown, undernutrition impacts the behavior ofchildren, their school performance, and their over-all cognitive development. These findings areextremely sobering in light of the existence ofhunger among millions of American children." [6]
Even short-term nutritional deficiencies can"influence children's behavior, ability to concen-trate, and to perform complex tasks. Deficiencies inspecific nutrients, such as iron, have an immediateeffect on the ability to concentrate. Child hunger,defined by inadequate nutrition intake during theearly years, is capable of producing progressivehandicaps impairments which can remainthroughout life." [7]
The Tufts study provides evidence which sug-gests that undernutrition "costs far more than thediminished well-being of youngsters during child-hood. By robbing children of their natural humanpotential, undernutrition results in lost knowledge,brain power and productivity for the nation. Thelonger and more severe the malnutrition, thegreater the likely loss and the greater the cost toour country." [8]
CHILD NUTRITION PROGRAMS - INCOME GUIDELINES FOR CHILD NUTRITION PROGRAMS1993-1994
Size ofHousehold
Free Meals - 130% of Poverty
Year Month Week
Reduced-Price Meals - 185% of Poverty
Year Month Week
1 $9,061 $756 $175 $12,895 $1,057 $2482 $12,259 $1,022 $236 $17,446 $1,454 $3363 $15,457 $1,289 $298 $21,997 $1,834 $4244 $18,655 $1,555 $359 $26,548 $2,213 $5115 $21,853 $1,822 $421 $31,099 $2,592 $5996 $25,051 $2,088 $482 $35,650 $2,971 $6867 $28,249 $2,355 $544 $40,201 $3,351 $7748 $31,447 $2,621 $605 $44,752 $3,730 $861
Each addibonal $3,198 $267 $62 $4,551 $380 $88
1816 The State of the Child in Tennessee, 1994 A Tennessee KIDS COUNT/Tennessee Commission on Children and Youth Report

Percent of Students Participating in School Lunch Programs forWhom School Breakfast Programs Were Available, 1993-1994
Shelb
011
son
00 0
Or
te11
8110 Mont ems o onSumner
01111 011 Oa OM/1 011 Dickson Dawdeon
um m
Crockettudardala
Ha wood IdCHenderson p
on ace urCheater
Hmkmon
Lewis
Macon la P kett
roue on Fentress00
Snuth
son Putnam
Rothe ord
MOO
Mars
a a a ar ernan W° n° Lowrance Snip,
CountyBreakfast
PercentAnderSoft,: 100.0:Bedford 86.2:Benton 76.0:Bledsoe 100.0ig.t.lo.W.It 87.2]Bradley 100.2.tampbell 100.0:Cannon 71.9Carroll 90.6Carter 100.0:Cheatharrij; i!: 100.0:Chester 72.6:Claiborne 99.9:Clay 100.0T.C.Ocke 97.7ieOffee:.:.:.:...: 58.2-Cfackett 100.0:Ciirriberland:: 100.0DaiiidSart 78.4Decatu r 76.1OeRalli 17.5DiCkSori 65.5:Dyer 82.6:Fayette 100.0:Fentress 99.9:Franklin 81.9:Gibson 67.7:Giles 100.0:Grainger 100.0Greene 77.7'Grundy 100.0Harhblen 78.9:Hamilton. 49.3
Bedford
nc
Moore
Coffee
p Franklin
Stott Orrl
kl an Mdemon
hit. CumberlandRoane
Loudonon Urall
Warren aBledsoe
Crund McMinn
S uatchle
Hami onMarton ro
CountyBreakfast
Percent:Han CoCk 100.0Harde m an 100.0Hardin 48.5:Hawkins 100.0
yWoOd 100.0'Henderson 100.0.Henry 65.1,Hickman 71.9'.171buston 100.0Hum reys:i. 77.1'JackS'onh 100.0:Jefferson 100.0:Johnson 100.0'Kri Px 100.0ta e 100.0
:t:.6.e10.rclale:.: 100.0: LaWre ride 100.0'Lewis 70.9Lincoln 63.4Loudon 99.8MCMirin 66.7:McNairy 63.4Macon 77.5Madison 100.0:Marion 79.4'Marshall 46.9MaurY 50.4Meigs 67.4Monroe 56.4Montgomery 100.0.Moore 51.1:Morgan 100.0:Obion 65.2
Source: School Nutrition Program, Tennessee Department of Education.
1 9
HancockO Or00 OM ns
mon
Knee
Monroe
Suliivon
Crain et Woshin onHamblen 0i...he
JeffersonUnica
a Cr
Percent Ranges
0 to 25 1
25 2 so 50 1
502 to 75 1
75 2 to 100 0
CountyBreakfast
Percent:OVerton 100.0:Perry 70.8:Pickett 100.0:Polk 100.0:Rutnani- 100.0:Rhea 56.1:Roane 100.0:Robertson 76.6:Rutherford 64.0Scott 100.0Secitiatetlie:::::: 100.1:$0Vier 100.0:Shelby 80.5:Smith 100.0:Stewart 100.0. ..
.Sullivan 89.21Sumner 57.7:Tipton 88.8iTrousdale 0.0::Unicoi 100.0k.Jnion 100.0:Van Buren 100.0:Warren 100.0:Washington 100.0Wayne' 100.0Weakley 82.6Phito 100.0:Williamson 24.6iWilson 98.6
Tennessee 81.8
13 COPY AVM RE
The State of the Child in Tennessee, 1994 A Tennessee KIDS COUNT/Tennessee Commission on Children and Youth Report 17

cis
Teen Employment has Advantages, DisadvantagesIs teen employment good or bad for teens who are in school? What are the advan-
tages and disadvantages of teen employment?Two of the benefits to teens who take part-time jobs while in school are the oppor-
tunity to develop personal responsibility for assigned duties and to become moreself-reliant. Teens with jobs in retail sales and other jobs that require extensive socialinteraction learn to deal more effectively with other people and co-workers. Workingalso contributes to the acquisition of knowledge about business matters, financialconcepts, consumer matters, and loyalty to a company. [1]
Another important benefit of working is for teens to learn different socializationskills from those they learn in school. "Schools are not equipped to train youth in thenon-academic skills of being an adult, which include learning to take responsibility forself-management, learning how to function in activities that have implications forother people, acquiring the ability to take decisive actions and learning to work." [2]
Detrimental aspects of working can be observed in teens who work more than 20hours a week. Some of the negative effects are decreased involvement in extracur-ricular activities, declining grades, and physical fatigue. In some cases, studentsreported that the demands of school and workplace made them hate school andwant to quit. There is substantial evidence that high levels of job stress or longworking hours can lead to increased cigarette, alcohol, and marijuana use. [3]
Another negative effect of teen employment is that excessive commitment to a jobmay interfere with the work of growing up. This results when adolescents spend toomuch time and energy "in a role that is too constraining and involves tasks that aretoo simple, unchallenging, and irrelevant to their future to promote development. Byspending too much time working, teens may be passing up equally rigorous, butunpaid, work of growing up work that requires exploration, experimentation, andintrospection." [4]
Clearly, it is debatable whether employment is good or bad for teens. The answerundoubtedly depends on the teen and his or her maturity, economic need and thenature of his or her employment.
The chart below shows teen unemployment rates based on monthly CensusBureau estimates, which are useful for observing trends. It shows unemploymentrates for teens 16 to 19 years old who are available for work and actively seekingwork. Teen unemployment dropped steadily from 28.6 percent in 1983 to 14.1percent in 1990. The teen unemployment rate then increased to 18.4 percent in1991 and declined slightly to 17.1 percent in 1992.
The map and table on the next page contain figures based on the 1990 Census,which, though different from the data in the chart below, are nonetheless useful forobserving recent conditions.
Teen Unemployment in Tennessee*1983-1992, 16-19 Year-Olds
30%
25%
20%
15%
10%
5%
0%1983 1984 1985 1986 1987 1989 1990 1991 1992
Source: Tennessee Department of Employment Security*Estimates based on the Current Population Survey conducted monthly by the U.SCensus Bureau. Map and table at right are based on the 1990 U.S. Census. As aresult. figures In this chart and the map and table at right dtffer.
18 The State of the Child in Tennessee, 1994 A Tennessee KIDS COUNT/Tennessee Commi000n Children and Youth Report
BEST COPY AVAVLABLE

Youth Unemployment Rate (Ages 16-19)*, 1993Note: This rate is percent.
1
CountyYouth Unemployment
Number PercentXideltdri 340 16.9Bedford 190 19.0:Benton 100 22.2:Bledsoe 40 21.1
OPP.F11.. 440 18.7radley 560 21.4
:Cempbell .330 32.0.Zennon 10 4.0'parroll 170 22.1terfer 260 17.8:Chgetham . 140 20.0Chester 50 10.0:Claiborne 190 22.9:Clay 40 19.0.:COcke 310 30.7:P1Offeg. .
160 14.7
Pf:Pc!s0t. 100 25.0COM deriand 210 20.0Da Vided.h- 2,210 16.5i:Decatur 50 17.9QeKalb 80 16.3::Didkson 190 19.6Dyer 300 26.8:f ayette 110 20.4:fentress 150 28.3franklin 220 20.20,0.0.0. .
270 23.1::Giles 180 23.1Orainger 150 28.8Greene 660 37.3iru ndy 100 31.3:flarriblen 560 29.9-Hamil ton:..., :
1,300 17.1
CountyYouth Unemployment
Number Percent,Hendodk" 20 18.2Hardeman 200 32.8:Hardin 190 24.7Hawkins 320 25.6Haywood 210 40.4'Henderson 120 18.5'Henry 170 18.1:Hickman 160 32.0Houston 70 43.8:Humphreys 140 31.8
aCkson 70 26.9:.Jefferson 270 23.1:Johnson 80 21.1*Knox 1,400 13.8take 30 17.6Lauderdale 320 48.5:Lawrence 280 23.1tewis 40 13.8tincoln 230 25.8:Loudon 220 22.0'McMinn 320 25.4fv1cNairy 190 30.6Macon 80 16.3.Madison 460 18.3.Marion 170 23.3.:Marshall 80 11.3Maury 340 18.3iMeigs 30 12.0:Monroe 270 26.7Montgomery, 590 21.9Mdore 0 0.0.Morgan 50 19.2..obion 200 22.0
Percent Ranges
!O to 17.9
10.0 so 21.4
21.5 to 25.8
25.9 so 48.5
CountyYouth Unemployment
Number PercentOVeeton 150 24.2Perry 40 33.3
-,Plckett 30 30.0.POlk 90 25.0
:PO,f6Pl..' 390 19.4:Rhea 130 17.6:Roane 300 24.6Robertson 360 24.8Rutherford ::: 780 16.7Scott 160 39.0:0.equatchieA 50 17.9Sevier 440 24.3Shelby_ 4,800 23.2Smith 80 18.2Stewart 50 20.0Sullivan 780 20.9Sumner 590 17.1
Tipton 220 21.8Trousdale 50 33.3:Unicoi 150 37.5Union 50 14.7'Van Buren :: 30 25.0.Warren 230 20.2Wathingtorf 560 19.0:Wayne 50 11.1
Weakley 150 11.5White 190 33.9Williamson 250 11.5-WilSon 350 16.7
29,000 20.6
Note: Youth unemployed rate is the number of persons unemployed ages 16-19 years old, expressed as percent oflabor force ages 16-19. Youth unemployed are those who are 16-19 years old and don't have a job but are available
for work and actively seeking work. The numbers are the estimates based on 1990 U.S. Census population data.Source: Tennessee Department of Employment Security. 21
The State of the Child in Tennessee, 1994 A Tennessee KIDS COUNT/Tennessee Commission on Children and Youth Report 19

Domestic Violence Impacts Children in Many WaysDomestic violence is not just between adults.Official crime statistics tell the tales of battered babies, assaultive siblings and
beaten wives. Brothers and sisters "beat, stab, and shoot each other. There arehusbands who are struck and beaten by their wives, and even grandparents arebattered by their own children. Violence in one generation affects and encouragesviolence in another generation. In many families, perhaps a majority of violentfamilies, violence is not even considered taboo or wrong. Rather it is an acceptableand integral part of the way a family functions." [1]
The belief that all family life is safe and secure has been shattered by those whohave pointed out the alarming frequency of various violent incidents in manyAmerican families. Family violence crosses all socioeconomic, geographical, andreligious distinctions. It occurs in all age brackets, regardless of one's ethnic group,state of sobriety, or education. [2]
This topic was once considered either a family secret or acceptable behaviorwithin a patriarchal society. Extensive research by social scientists has suggestedthat family violence is widespread and is interwoven with the very fabric of society'sattitudes and values. [3] Now, graphic media coverage of celebrated cases andregular discussions on the most widely seen television programs are common-place. [4]
Unfortunately, domestic violence may be underreported because many womenfail to report incidents of violence. According to many criminologists, battered,abused victims often may be too fearful and demoralized to reach out for help; alsothe criminal justice system is more trained to apprehend and deal primarily withperpetrators of street crimes than domestic conflicts. For example, until recently,domestic disputes were considered to be routine calls by the police. Increasingly,however, "these family problems have spilled into the courts as assault, aggra-vated assaults, and murder. And as the cycle of family violence has continued,young children have adopted their parents' methods for dealing with discord andoften with devastating effects. School counselors and social workers now claimthat domestic strife has resulted in school and street violence, as these childrenand youth carry their problems and weapons into society." [5]
It is estimated that between 2 to 4 million American women each year areabused in their homes. [6] Six out of every ten married couples have experiencedviolence at some time during their marriage.
Domestic violence may touch as many as one fourth of all American families. [7]Many researchers, however, believe that this figure 'substantially underrepresentsthe extent of violence in American families, perhaps by half.' Others estimate thatphysical assault occurs in nearly one-third of American families.' Lenore Walker,author of The Battered Woman, holds that 'as many as fifty percent of all womenwill be battering victims at some point in their lives." [8]
Many children are present to witness this violence. It is estimated that at least 3.3million children in the U.S. between the ages of 3 and 17 years are at risk ofexposure to parental violence. [9] Children may witness domestic violence directlyor indirectly. A child may observe this violence directly by seeing father (or anotherintimate partner of mother) threaten or hit mother.
Children may overhear this behavior from another part of the home, such as theirown bedroom. They may be exposed to the results of this violence without hearingor seeing the commission of any aggressive act. For example, children may see
20 The State of the Child in Tennessee, 1994 A Tennessee KIDS COUNTrfennessee and Youth Report

the bruises or other injuries clearly visible on theirmothers or the "emotional consequences of fear,hurt, and intimidation that may be very apparent tothem. Less commonly, children may be exposed toisolated incidents of violence, although thesecases are unlikely to come to the attention of policeor other social service professionals. In too manycases, these children have observed repeated actsof violence perpetrated by multiple partnersthroughout theirentire childhood."[10]
Children who livein violent homes arepsychologicallyabused and may beverbally, physically,and sexuallyabused. Childrenfrom violent homes are characterized by:constant fear, terror, confusion and insecurity;
increasing deceptiveness: lying, excuses foroutings, stealing, cheating;
poor definition of personal boundaries, violation ofothers personal boundaries, accepting blame orprojecting blame;
little or no understanding of the dynamics ofviolence; often assumes violence to be the norm:self-blame (depending on age) for family feuding,separations, divorce, and internal conflicts;
continuation of abuse patterns in adult life;frequently participating in pecking order battering
(maim or kill animals, batter siblings); often batterparents in later years;
poor problem solving skills: may use violence asproblem solving technique in school, with peers,with family demonstrates aggression or passivity;
poor sexual image, uncertainly about appropriatebehavior, confused model identification, immaturityin peer relationships;
being at higher risk for assaults;heightened suicide risks and attempts increased
thoughts of suicide and/or murdering parents,prone to negligence and carelessness;
feeling used and powerless. [11]Some children suffer permanent psychological
damage from experiencing violence in their home.Others face physical injury as well when they areabused themselves or "caught in the cross fire of
their fathers' violence." [12]Many researchers have noted a significant
overlap between wife assault and child abuse.There is reason to suspect that many childrensuffer from repeated exposure to violence, both asdirect and indirect victims." [13]
Children are at high risk of suffering physicalabuse in homes where domestic violence occurs.Even if they are not physically abused themselves,
children who wit-ness domesticviolence suffer verysimilar psychologi-cal trauma associ-ated with childrenwho are physicallyabused. [14]
The abusivefamily typically has
a "rigid boundary between family and the outsideworld" and a strong belief that a man's powerwithin his family is not subject to outside surveil-lance or checks." [15] Wife and child batteringprovide other examples of how traditional valuescan go wrong. Research studies have shown thatabusive families are "marked by constant competi-tion over who will be taken care of." [16] Thissuggests that abuse is sometimes an extension ofdemands for privacy, intimacy, and individualfulfillment through the family. Battering often oc-curs in the "most private parts of the house; ittends to be triggered by very traditional demandsfrom the man and perpetuated by passive ratherthan assertive responses by the woman." [17]Infants may suffer serious unintended conse-quences when raised in an environment of wifeabuse. "Their basic needs for attachment to theirmother may be significantly disrupted. A motherliving in fear of her husband may be unable tohandle the stressful demands of an infant. Clearly,an infant will recognize this distance and lack ofavailability of his or her principal caretaker. Infantsand toddlers may also be injured in a violent epi-sode by being caught in the cross fire. They maybe accidentally hit, pushed or dropped during aviolent outburst, or their mother may hold them fortheir own safety but discover that their father hasno regard for their physical and emotional vulner-ability." [18]
Children are at high risk of suffering physical abusethemselves in homes where domestic violence oc-curs. Even if they are not physically abused them-selves, children who witness domestic violence suf-fer very similar psychological trauma associated withchildren who are physically abused.
The State of the Child in Tennessee, 1994 A Tennessee KIDS COUNT/fennessee o mission On Children and Youth Report 21

cE
IlorIty Abused byFamlly Members
More than 11,000 Tennessee Children Abused or Neglected in '93
"Child abuse and neglect occur when a child is mistreated, resulting in injury or riskof harm. Abuse can be verbal, emotional or sexual." [1]
In Fiscal Year1993 in Tennes-see "...evidencewas found that11,296 childrenwere abused and/or neglected ...Twenty-two per-cent of all reportsinvolved childrenfrom birth throughtwo years of age ...Of all indicatedreports of abuseand/or neglect, 66percent of the childvictims wereabused/neglectedby their naturalparents." [2]
As the chart (right) shows, roughly a third of allegations are considered indicatedeach year, and the number of indicated victims has not changed significantly in recentyears.
Allegations of child abuse orneglect must be made to theTennessee Department ofHuman Services (DHS) directly,or to law enforcement or juve-nile courts, who then notifyDHS.DHS investigations are pur-
sued in the following cases:1) reports alleging physicalabuse or neglect of childrenfrom birth to 18 years;2) reports alleging sexualabuse of children from birth to12 years; and3) reports alleging sexualabuse of children 13 to 18years old, provided that the
alleged perpetrator is a relative, caretaker, or someone residing in the home. [3]Children are removed from their homes during the investigation only "if needed to
protect the child," Child Protective Services A Parents' Guide, a DHS brochure, says."In many cases this does not happen and the child can stay in his or her home," thebrochure says. "Sometimes, if needed to protect the child, [the parents and/or otheradults in the home], relatives and DHS can work out a plan for the child to live withrelatives for a while during the investigation. A child is placed in temporary foster care... by court order only if it is the only way to protect the child."
After an investigation is conducted by DHS, a particular case is determined indicatedor unfounded. If the investigation concludes that an incidence of abuse occurred, thecase is declared "indicated." If the investigation concluded that it did not occur, it is"unfounded."
If the report is declared indicated, DHS arranges for services needed to protect andhelp the child. Services will also be arranged to help adults in the home so that thechild may remain in the home, or, if the child has been removed, so that he or she canbe returned to his or her home.
Child Abuse/Neglect VictimsFiscal Years 1988-1993
35,000
30,000
25,000
20,000
15,000
10,000
5,000
0
Ca
- -CO
- - COIV
00CO0cc17)
-
-
--.IIV
430.....I
-..-..IVLIDCD
IV._.0.-.-..t )crICI
_.0
1988 1989 1990
Source: Tennessee Department of Human Services
1991 1992 1993
DAlleged IMIndicated
Indicated Child Abuse ReportsShown By Perpetrator Type, Fiscal Year 1992-93
Parent,Relative
Source: Tennessee Department of Human ServicesFriend of the family
"Foster/adoptive parent; school, child care, institutional staff
eighbor, Friend'
05ntkanrOCOther
Caregrvers
22 The State of the Child in Tennessee, 1994 A Tennessee KIDS COUNT/Tennessee Commissio2n4hildren and Youth Report

Indicated Child Abuse & Neglect Rate*, 1992-1993Note: This rate is Per 1,000, NOT percent.
CountyChild Abuse
Number RateAn erson 133 8.1:Bedford 84 10.6Benton 45 13.6Bledsoe 1 0.4Pount 167 8.3Bradley 159 8.6'Campbell 110 12.4Cannon 45 17.0'Carroll 57 8.7'Carter 95 8.4:CheiithiiM 52 6.5:Chester 40 12.4:Claiborne 54 8.1:Clay 6 3.7Cocke 121 17.5:Coffee' 54 5.1
r.oc4tt. 45 14.1:Cumberland. 43 5.2
aVidSOn 891 7.3.Detatur 57 24.5, DeKalb 27 7.9
: 60 5.9.Dickson:Dyer 106 11.8Fayette 41 5.5
'Fentress 19 5.1'Franklin 105 12.1
..Oks.9.n 115 10.4:Giles 58 8.8Grainger 20 4.8:Greene 92 7.2...PrIP.VY 31 8.6:Hamblen 69 5.7:Hamilton., 780 11.3Source: Tennessee Department of Hum
Rate is based on the 1992 population estimates made by Department of Sociology,University of Tennessee, Knoxville.
2 5
CountyChild Abuse
Number Rate::HancOck : 58 35.0:Hardeman 26 3.9'Hardin 58 10.2:Hawkins 54 5.1:Haywood 10 1.8'Henderson .. 84 15.6..Henry 65 10.4:Hickman 40 9.8:Houston 34 20.3ItlurnphreYS:'::, 27 6.9:Ja.OPP'fl. 5 2.4:Jefferson 48 6.4:Johnson 12 3.9:Knox 1,010 12.9Lake 24 16.2:Lauderdale : 119 18.6
awfellce 72 7.7:Lewis 9 3.8:Lincoln 49 6.8:Loudon 34 4.6McMinn 50 4.8McNairy 56 10.3Macon 14 3.5.Madison 274 13.0:Marion 42 6.5Marshall 16 2.8*Maury 92 6.3'Meigs 24 12.1:Monroe 26 3.3:MOritgOnieq 318 11.2:MObre 8 6.7Morgan 24 5.5Obion 65 8.5
Rate Ranges
!OA to 5.1
5.2 to 7.3
74 to 11.0
11.1 to 35.0
CountyChild Abuse
Number RateOVerto ei. 42 10.0Perry 16 9.7Pickett 6 5.5Polk 19 6.0PUtnam 56 4.6Rhea 61 10.0Roane 79 7.3Robertson 73 6.2Rutherford 41 1.2Scott 43 8.3S.PG1Patchie. 14 6.0Sevier 156 12.3Shelby 3,003 12.9Smith 19 5.4Stewart 5 2.3Sullivan 141 4.4Sumner 168 5.7Tipton 179 15.1Trousdale 5 3.5Unicol 4 1.1Union 23 6.2Van Buren 25 20.3Warren 91 11.0:Washingtont 139 6.8Wayne 33 9.3Weakley 51 6.7White 35 7.3Williamson 52 2.1Wilson 88 4.5
11,296 9.1
BEST COPY AVAHABLE
The State of the Child in Tennessee, 1994 A Tennessee KIDS COUNT/fennessee Commission on Children and Youth Report 23

Is There a Teen Crime Wave in Tennessee?Throughout the nation the media have recently focused on teen crime. Legislatures
have proposed numerous revisions in juvenile and criminal law to reduce a teen crime
wave that is believed to be sweeping the country.Tennessee is no exception. More than 50 juvenile-crime-related bills were introduced
in the Tennessee General Assembly during the 1993-94 session.Some have argued that the public has been misled by a media feeding frenzy about
juvenile crime. The fundamental question to answer regarding teen crime is whetherTennessee teens are committing more crimes now than a decade ago.
The answer is yes.Since 1984, the number of referrals to juvenile courts in Tennessee for violent crimes
has more than doubled, according to annual statistical reports of the TennesseeCouncil of Juvenile and Family Court Judges [1], while the population of teens inTennessee hasdecreased. In 1984, atotal of 2,753 referralswere made to juvenilecourts for offensesagainst persons. In1992, the latest yearfor which figures areavailable, 5,926referrals were madefor the same offenses,the 1992 AnnualStatistical Report ofthe Council of Juvenileand Family CourtJudges says. [2]
Referrals are allega-tions, and each youthmay be referredseveral times, so the referral figures do not represent the number of youths chargedwith offenses, but rather the number of offenses charged.
The table below presents the number of referrals for offenses
Tennessee Juvenile Court ReferralsFor Offenses Against Persons
6000
5500
5000
4500
4000
3500
3000
25001984 1987 1991 1992
Source: Annual Tennessee Juvenile Court Statistical Reports tor 1984, 1987, 1991, 1992
against persons in1984, 1987,1991, and1992. Mostcategoriesshow in-creases.Rape andassault tomurder reflectdecreases.The reduc-tions in as-sault tomurder maybe correlatedwith theincreasing
Tennessee Juvenile Court Referralsfor Offenses Against Persons, 1984-1992
OFFENSES 1984 1987 1991 1992MURDER 40 40 79 111
MANSLAUGHTER 18 11 35 66
ROBBERY MTH ADEADLY WEAPON
118 202 231 304
ROBBERY 170 220 166 227
ASSAULT TOMURDER
78 126 38 38
ASSAULT 1962 2963 4147 4794RAPE 157 297 124 147
ASSAULT TO RAPE 30 33 32 42
SEIL OFFENSES
(ccePt raPe.prostitution)
172 205 143 187
velCuLanHOMICIDE
8 15 15 10
TOTAL 2753 4112 4994 5926
Source:Annual Tennessee Juvenile Court Statistical Reports to 1884, 1987, 1991 and 1892. 2 6
24 The State of the Child in Tennessee, 1994 A Tennessee KIDS COUNT/Tennessee Commission on Children and Youth Report

Percent of Children* Referred to Juvenile Courts,January 1992 - December 1992
Imari*On Of
Crockett
Hendonion
CO 41,
Choate
1E:al on Macon Ott
°minerreSOMeal G 0 en
cue on Ore Smrlhn Dickeon indoon 16011
UT re
HickmanPlnilorn°°°4 Rutherford Cannon
Mau
13
M-11 (4..fE[ ftfr.. mc a W. no .frondo Cues
CountyReferrals
Number Percent'An ersdn 824 5.0Bedford 302 3.8Benton 51 1.5Bledsoe 84 3.6Blog.n1 672 3.3'Bradley 391 2.1Campbell 98 1.1Cannon 69 2.6'Carroll 178 2.7'.Carfer 185 1.6Cheatham 397 4.9:Chester 148 4.6.Claiborne 298 4.5Clay 32 2.0Cocke 380 5.5QoffeP. 345 3.3.Crockett 95 3.0Cumberland 346 4.2DaVidson 4,792 3.9Decatur 34 1.5DeKalb 123 3.6Dicks0 317 3.1Dyer 391 4.3Fayette 270 3.6Fentress 141 3.8Franklin 185 2.1GibSOn 271 2.5Giles 138 2.1Grainger 164 4.0Greene 537 4.2Grundy 31 0.9Harnblen 529 4.4Hamilton 1,975 2.9
Note: ' For children under 18 years old.Unicoi County is not in the system.
Source: 1992 Annual Statistical Report, Council of Juvenile and Family Court Judges, 1
Coffee
Moore
oc FranWIn
IRutnami
hd CYM
an urenorr.
Grtind
S utitehle
=1
orn
id on 013011
nd
Roane
Loudon
e a
Me
MeMlnn
Hamilton
CountyReferrals
Number PercentHancOck 22 1.3.Hardeman 264 4.0Hardin 143 2.5'Hawkins 646 6.2:Haywood 250 4.5Henderson :: 187 3.5Henry 166 2.6Hickman 99 2.4:HOuston 52 3.1:Hu ftiphi*..: 110 2.8.JaCkSon 18 0.9.Jefferson 241 3.2:Johnson 48 1.6:Knox 2,268 2.9.Lake 35 . 2.4.LaUdeidale 278 4.3*Lawrence 340 3.6:Lewis 153 6.4Lincoln 201 2.8Loudon 285 3.8:McMinn 377 3.6McNairy 184 3.4Macon 119 2.9'Madison 636 3.0.Marion 291 4.5.Marshall 378 6.7.Maury 182 1.2Meigs 38 1.9Monroe 327 4.2i.Montgomery 1,465 5.2MObre : 20 1.7
''.iviargan 116 2.6:Obibn 286 3.7
noon
now
Blount
Ole Or
Hamblen
Jeffervon
ICoIPercent Ranges
!0 to 2.5
2.6 to 3.4
3.5 to 44
4.5 to 7.6
CountyReferrals
Number PercentOVerton 48 1.1Perry 68 4.1Pickett 57 5.2Polk 134 4.2Putnam, 751 6.1Rhea 255 4.2Roane 193 1.8Robertson 651 5.5Rutherford 745 2.1
259 5.0,SCOttSequatchie 121 5.2Sevier 644 5.1Shelby 14,535 6.2Smith 95 2.7Stewart 79 3.7SUllivan 1,802 5.6Sumner 846 2.9Tipton 302 2.5Trousdale 49 3.4Unicoi"' 0 0.0Union 253 6.8Van:.Buren.... 5 0.4Watean 447 5.4WaShingtOn.:: 1,559 7.6Wa9n6 83 2.3:Weakley 426 5.6White 139 2.9Williamson 1,091 4.4'Wit Son 595 3.1
enneSSOC 51,250 4.1
9
T COPY AVAILMiLE
The State of the Child in Tennessee. 1994 A Tennessee KIDS COUNT/Tennessee Commission on Children and Youth Report 25

lethality of juvenile conflict and conse-quently the increase in murder referrals.
Having established that teen violentcrime is increasing, the next question iswhy?
The American Psychological Association(APA), in its publication Violence & Youth:Psychology's Response, identifies factorsthat are strong predictors of violent behav-ior.
Lack of parental supervision is one of thestrongest predictors, the report says. [3]Other parental factors include parentssupporting aggressive behavior by chil-dren, failing to teach nonviolent methods ofsolving social problems, and inconsistent,harsh and continued physical punishment.[4]
Poverty, with its "sense of relative depri-vation and ... lack of opportunity ... facili-tates higher rates of violence," the reportsays. [5]
Among the ways poverty leads to vio-lence, the report says, are poverty's effectof discouraging family stability; inadequatenutrition, medical care and emotionalsupport; and neighborhood instability. [6]
While race would appear to be a factorabout 59 percent of crimes against personscommitted by male juveniles were commit-ted by African-American males in 1992 [7],even though 20.7 percent of Tennessee'sunder-18 population is African American [8]
"...it is very likely that socioeconomicinequality not race facilitates higher ratesof violence among ethnic minority groups,"[9] the APA report says. "Few differencesamong the races are found in rates ofviolence when people at the same socio-economic level are compared."
However, race can be a factor in vio-lence when prejudice and discrimination"damage the self-confidence and self-esteem of those discriminated against andlay a foundation for anger, discontent, andviolence." [10]
Single parenthood may be anotherfactor. There is a significant relationshipbetween single-parent families, poverty,and juvenile justice involvement.
National figures prepared by the Popula-tion Reference Bureau (PRB) in its publica-tion The Challenge of Change show arelationship between single-parent families
LIVING ARRANGEMENTS OF CHILDRENREFERRED TO JUVENILE COURTREFERRALS FOR MURDER, 1992
Mother53.0%
Other10.3%
Not Reported Parent/Stapparent2.6% 18.8%
Father1.7%
Both Parents13.7%
Source: Tennessee Council of Juvenile and Family Court Judges
LIVING ARRANGEMENT OF CHILDRENREFERRED TO JUVENILE COURT
OFFENSES AGAINST PERSONS, 1992Mother47.2%
Not Reported5.8% Both Parents
19.9%
Source: Tennessee Council of Juvenile and Family Court Judges
Parent/Stepparent8.9%
LIVING ARRANGEMENTS OF ALL CHILDRENREFERRED TO JUVENILE COURT
THREE-YEAR AVERAGES FOR 1989, 1991, and 1992Mother36.4%
Both Parents25.2%
o 8 Other19.2%
Father4.6%
Not available5.6%
Parent/Stepparent9.0%
Source: Annual Juvenile Court Statistical Reports for 1989, 1991, and 1992.
26 The State of the Child in Tennessee, 1994 A Tennessee KIDS COUNT/Tennessee Commission on Children and Youth Report

and poverty. In 1990, 79.6 percent of single-parentfamilies lived in poverty, according to the PRB report.[11]
Tennessee figures confirm a relationship regardingsingle-parenthood and juvenile justice involvement.In 1992, only 13.7 percent of (16 of the 107) juve-niles referred for murder in Tennessee lived withboth parents, Tennessee Council of Juvenile andFamily Court Judges research shows (see chart). Aslight majority, 53 percent, lived only with theirmothers.
For all crimes against persons in Tennessee in1992, 19.9 percent of juveniles referred lived withboth parents, while 47.2 percent lived with theirmothers (see chart).
Three-year averagesof children referred tojuvenile court (seechart) for al/offenses,including non-violentand property offenses,show a smaller percent-age, 36.4 percent, ofchildren referred tojuvenile courts lived
centage of children living in single-parent families.Since 1985, KIDS COUNT reported, the percentageof children living in single-parent families has in-creased by 33 percent.
An increase in the availability of firearms is anotherfactor in teen violence, the APA report says, addingabout 270,000 students carry guns to school eachday in the U.S. The National Rifle Association esti-mates there are about 200 million guns in the handsof private citizens. In a 1993 survey of Tennesseehigh school students, 18.2 percent of males reportedthey had carried a gun on one or more of the past 30days. [14]
Alcohol is another factor in teen violence. "Use ofalcohol," the APA
"Violence is woven into thefabric of American society."Violence & Youth: Psychology'sResponse, A report from theAmerican Psychological Association
with their mothers only compared to those referredfor violent crimes. Also, a larger percentage ofchildren referred for all offenses, 25.2, lived with bothparents. This indicates that children and youth wholive with their mothers only are more likely to commitviolent crimes than the population of all children andyouth referred to juvenile courts. The variations inpercentages for each of the three years averagedare less than one percent.
The "other" category in each of the charts includeschildren living with relatives, in foster families, ingroup homes, in institutions, independently, in othersettings, and "not reported." It is probable that thepercentages of these children who are from single-parent families are at least as high as those referredto juvenile court while still living at home.
If single parenthood is a factor in teen violence, theproblem is likely to grow in Tennessee. Tennesseewas recently ranked the second worst state in thenation in the percentage of all children who live insingle-parent families. The 1994 KIDS COUNT DataBook, a yearly national study of the well-being ofchildren, said an average of 32.6 percent of Tennes-see children nearly one in three lived in single-parent families from 1989 through 1993. [12] OnlyMississippi had a higher percentage. [13]
Also, the KIDS COUNT report said, Tennesseehad the fifth worst growth rate in the nation of per-
report says, "plays amajor role in interper-sonal violence involv-ing youth ... In about65 percent of all homi-cides, perpetrators,victims, or both hadbeen drinking, andalcohol is a factor in atleast 55 percent of all
fights and assaults in the home." [15]Other drugs, it says, particularly addictive and
expensive drugs such a heroin and cocaine, alsocontribute to violence because users resort to violentcrime to support their habits, and drug marketing is aviolent business. [16]
Also, the report says, "The use of alcohol and otherdrugs by parents has been associated with violentbehavior by their children ... Substance-abusingparents are more apt to become physically abusive,sexually abusive, or neglectful in ways that exposetheir children to risk of abuse by others." [17]
Finally, it must be remembered that teens have notcornered the market on violence. Teen violence is areflection of our increasingly violent society. "Vio-lence is woven into the fabric of American society,"the APA report says. "Though most Americans abhorviolence in their communities, ho.mes, and schools,this country has the highest rate of interpersonalviolence of any industrialized country ... Our folkheroes and media images from the cowboy of theold west, to John Wayne, Clint Eastwood, and ArnoldSchwarzenegger often glorify interpersonal violenceon an individual and personal level ... Although fewAmericans would claim to enjoy or encourage vio-lence, many, at the very minimum, passively con-done aggression and violence through acceptance
44-current film and television productions." [18]
The State of the Child in Tennessee, 1994 A Tennessee KIDS COUNT/rennessee Commission on Children and Youth Report 27

Too Many Children in State CustodyThe Children's Plan is Tennessee's effort to develop a more comprehensive
children's services delivery system. In February 1991 the Department of Financeand Administration (F&A) announced the plan and presented general conceptsand strategies for implementation. At that time the four primary goals of theChildren's Plan were introduced. The exact language of the four goals has beenpresented slightly differently at various times, but the basic goals are:
Goal 1: Reduce the number of children in state care.
Goal 2: Provide more appropriate placements and services for children incare.
Goal 3: Improve management of the children's services delivery system.
Goal 4: Maximize the collection of federal and other funding.
To make comparisons with pre-Children's Plan information as accurate aspossible, all state level information presented on children in care in this sectionincludes children placed in psychiatric hospitals under voluntary commitments,Juvenile Court Commitment Orders (JCCOs), and Department of Mental Healthand Mental Retardation (MHMR) custody. For FY 92-93 and FY 93-94, statewideinformation also includes MHMR custody in non-institute placements. This non-institute information was unavailable prior to FY 92-93. Information presented atthe county level includes only children in custody. Custody includes departmentalcustody andJuvenile CourtCommitmentOrders, but notvoluntarycommitments.
TheChildren'sPlan wasdevelopedpartially inresponse tothe continuingrise in newcommitmentsto state careeach year.Between FY83-84 and FY 90-91, new commitments increased by 65 percent. Of greaterconcern than the increase in new commitments was the alarming increase in thenumber of children remaining in care at the end of each fiscal year. Unfortunatelythere is no highly reliable information on the number of children remaining in carebefore FY 88-89. However, the number remaining in care increased by 21 per-
10,000
9,000
8,000
7,000
6,000
5,000
Commitments to State CareTennessee, FY 83-84 Through FY 93-94
,°'rIatikkoilmootwoor.
4,000
'917'
Source: F&A, Office of Children's Services AdministrationDHS Commitments Through FY 92 Inflated To Correct Underreporting
28 The State of the Child in Tennessee, 1994 A Tennessee KIDS COUNT/Tennessee Commission on Children and Youth Report

Commitment Rate of Children to State Custody, FY 93-94Note: This rate is Per 1,000, NOT percent.
CountyCommitments
Number RateAndeiSbri .1 82 5.0'Bedford 82 10.6:Benton 16 4.8'.kiledsoe 15 6.3itPount 154 7.8i_Pradley 136 7.5::Campbell 1 96 10.7:Cannon 1 27 10.2..Carroll 30 4.6
arter 79 6.9::Cheathain 1 54 7.1
hester 24 8.0:Claiborne 1 38 5.7
lay 6 3.6ocke 97 13.9
Oiffee 1 125 12.0'Crockett 17 5.2tumberland 41 5.0:.Dthan 741 6.4:Decatur 28 11.7'DeKalb 9 2.6DiOkson 85 8.9D er 75 8.4:f a ette 46 6.0[Fentress 16 4.2Franklin 174 20.4'Glbta.On 104 9.4:iles. 40 6.2i.rainger 13 3.1Greene 50 3.9:Grundy 29 7.8:Harnblen 93 7.717)4006 ': 457 6.6
CountyCommitments
Number Rateanoodk 24 14.1
Hardeman 41 6.2Hardin 35 6.2Hawkins 26 2.5Flaiii.00d 49 8.7FlendPrsor 61 11.2Henry 53 8.3Hickman 21 5.2Houston 12 7.1Humphreys 25 6.3Jackson 17 8.0Jefferson 34 4.7Johnson 27 8.5Knox 507 6.7Lake 12 7.7Lauderdale 48 7.5Lawrenpe 52 5.6Lewis 17 6.9Lincoln 48 6.9Loudon 87 11.9McMinn 88 8.5McN411'Y 27 4.9Macon 18 4.5Madison 249 12.3Marion 42 6.4Marshall 44 8.1Maury 133 9.3Meigs 19 9.5.Monroe 62 8.0Montgomery. 225 8.4:Moore 7 5.8.Mor an 26 5.8Obi On 64 8.2
'dr
Rate Ranges
!1.8 to 5.7
5.8 to 7.2
7.3 to 8.7
8.8 to 20.4
CountyCommitments
Number Rate..OVertOh 41 9.7Perry 3 1.8:Pickett 10 9.0Polk 20 6.1
Putnam 64 5.713hea 50 8.1floane 1 76 6.8:Robertson 1 92 8.1flutherford ': 161 5.1*Scott 53 9.8;$eclu0.00 20 8.7'Sevier 48 3.9.Shelby 1,565 6.9.:Smith 33 9.3:Stewart 1 28 13.3SiilliVan 202 6.3.Surr.IPPf. 217 7.6Tipton 85 7.4:Trousdale 21 14.8
26 7.2,Unicoi:Union 15 4.1
Yan BP!"Prl. 7 5.5:Warren 62 7.5Washington.. 141 7.0:Wayne 17 4.8Wdakley 58 8.2White 44 9.2Williamson : 120 5.1:Wilson 144 7.8
8,702 7.2
Note: The population ages 1-17 is calculated from 1990 Census data tables provided by the Center for Business andEconomic Research, College of Business Administration, The University of Tenessee, Knoxville, 1992.State fiscal year was from July 1, 1993 through June 30, 1994.
BEST COPY AVAILABLEThe State of the Child in Tennessee, 1994 A Tennessee KIDS COUNT/Tennbse Commission on Children and Youth Report 29

cent from FY 88-89 to FY 90-91, while commit-ments over the same period increased by fivepercent. This indicated that the system was notproviding needed permanency for children byreturning them to their families, or determining thatreunification would not be possible and proceedingwith termination of parental rights and placementfor adoption. The graph on page 28 shows thenumber of commitments to state care from FY 83-84 through FY 93-94. The graph on this pageshows the num-ber of childrencommitted to careand the number ofchildren remain-ing in care at theend of the fiscalyear for FY 89-90through FY 93-94.
The number ofnew commitmentsto state care hasbeen fairly stableeach year sincethe Children'sPlan began in1991. With theexception of FY93-94, the num-ber of commit-ments under the Children's Plan is lower than itwas in the year before the plan was announced.There was an eight percent increase in new com-mitments from FY 90-91 to FY 93-94, due entirelyto the FY 93-94 increase. This is important, be-cause many Children's Plan stakeholders hadthought that commitments were going up everyyear under the Children's Plan. This relative stabil-ity is also in spite of an increasing number ofreferrals to juvenile court and an increasing num-ber of violent offenses committed by juveniles.
In FY 93-94, there was wide variation in commit-
ment rates to custody across Tennessee's coun-ties. Perry County had the lowest rate, with 1.8 per1,000 children under 18 years old. Franklin Countyhad the highest rate with 20.4. The state commit-ment rate was 7.2 per 1,000.
Number of Children Remaining in Cate and CustodyThe number of children remaining in care and
custody has increased at a dramatic rate. Therewas a 33 percent increase in the number of chil-
dren in care atthe end of June1994 versusJune 30, 1991(see chart, thispage). Thetrends in commit-ments and chil-dren remaining incare are verysimilar to thetrends seen atthe national level.
The reason thatthere are morechildren in careand custody inTennessee aswell as nationallyis mostly due to
the fact that there have been more entries thanexits. For example, in the period from July 1, 1992through June 30, 1994 there were 16,928 commit-ments to custody but only 13,891 exits. Thus therewere 3,037 more children committed to custodythan removed from it.
There was large variation in rates of children incustody across Tennessee's counties for FY 93-94. The lowest rate was 3.6 per 1,000 childrenunder 18 years old for Grainger County. HancockCounty had the highest rate, with 24.1. The staterate of children in custody *as 10.0 per 1,000.
Commitments and
12,000
10,000
8,000
6,000
4,000
2,000
0FY 90 FY 91 FY 92 FY 93
Source: F&A, Office of Children's Services AdministrationDHS Commitments Through FY 92 Inflated To Correct Underreporting
FY 89-90 Thr
Remaining in Careough FY 93-94
FY 94
32
30 The State of the Child in Tennessee, 1994 A Tennessee KIDS COUNT/fennessee Commission on Children and Youth Report

Rate of Children Remaining in State Custody, June 30, 1994Note: This rate is Per 1,000, NOT percent.
CountyIn State Custody
Number Ratenderson 181 11.1
:Bedford 142 18.4:Benton 24 7.2:Bledsoe 15 6.3:Blotint 177 9.0:Bradley 262 14.4.Campbell 107 11.9Cannon 56 21.2:Carroll 50 7.7:Carter 83 7.3>eatnam 95 12.5Chester 18 6.0'Claiborne 42 6.3'..Clay 13 7.8:Cocke 87 12.5
.1 149 14.4..Q0ftee,C.rockett 20 6.1Ciienber land 79 9.7:Da VidSon 902 7.7Decatur 41 17.1
[ De Kalb 22 6.4Dicksqn 144 15.0D er 77 8.6Fa ette 60 7.9Fentress 20 5.2Franklin 160 18.8
i Gibion 105 9.5Giles 37 5.8Grainger 15 3.6Greene 99 7.7Grundy 37 10.0Hamblen 112 9.3Hamilton 776 11.2
CountyIn State Custody
Number Rate::HandoCk 41 24.1:Hardeman 60 9.1:Hardin 52 9.2Hawkins 74 7.0:Haywood 83 14.7:Henderson 70 12.8:Henry 54 8.5:Hickman 60 14.9:Houston 8 4.7116mphreys:,.: 49 12.3
ack:Sdri:' 32 15.1:Jefferson 52 7.2Johnson 35 11.0:Knox 811 10.8Lake 14 8.9:Lauderdale : 96 15.0:Lawrence 86 9.3:Lewis 28 11.3i:Lincoln 69 9.9:Loudon 54 7.4:McMinn 148 14.3McNairy 39 7.1Macon 34 8.4Madison 368 18.1Marion 73 11.2Marshall 46 8.4:Maury 162 11.3:Meigs 22 11.0:Monroe 47 6.1:Montgomery 352 13.2:Mocire' 8 6.7
40 9.0[MorganObion 69 8.8
Rate Ranges
!3 4 to 7.7
7 8 to 9.7
9 8 to 12 7
12.8 to 24.1
CountyIn State Custody
Number Rate::0Veildri 59 13.9Perry 11 6.6Pickett 12 10.7Polk 30 9.1:Pi.itnarill 110 9.8:flhea 74 12.0Roane 81 7.3.Robertson 189 16.6ilifltlierfordF 254 8.0
. ... . ..:Scott 60 11.2Sequatcnie 31 13.6Sevier 81 6.6
:Shelby 1,949 8.6:Smith 47 13.3:Stewart 27 12.8:SulliVan 295 9.1:Sumner 277 9.7:Tipton 129 11.2Trousdale 18 12.7:AJ.nicoi 34 9.5:Wiidn 30 8.2:9:ail pUriii- 15 11.8Warren 84 10.1:WaShirigtört::: 258 12.8Mayrit4 23 6.4iWeakley 51 7.2:Whiitarnespn 74 15.4
160 6.8SAfilson 234 12.6
Tën'i'5sèèt 12,140 10.0
Note: The population ages 1-17 is calculated from 1990 Census data tables provided by the Center for Business andEconomic Research, College of Business Administration, The University of Tenessee, Knoxville, 1992.
33 BEST COPY AVADLALEThe State of the Child in Tennessee, 1994 A Tennessee KIDS COUNTffennessee Commission on Children and Youth Report 31

SUMMARY CHAPTER 1 FAMILY AND COMMUNITIES
Single-Parent FamiliesNearly a third of Tennessee children live in single-parent families.The percentage of children living in single-parent families in Tennessee has increased by 33 percent
since 1985.Nonmarital births in Tennessee have increased from 9.5 percent of all births in 1962 to 32.2 percent
in 1991.
PovertyMore than a fourth of Tennessee children live in poverty.Tennessee has the highest per-capita-income growth rate in the nation.Forty-three Tennessee counties had per capita incomes below the poverty threshold.
AFDCAFDC payments in Tennessee are not enough to bring families out of poverty.The maximum AFDC benefit a family of three in Tennessee can receive is $185 per month.In 1993, 90.4 percent of AFDC caretakers had three children or fewer.
NutritionMany Tennessee students who are eligible to participate in the free- and reduced-price breakfast
program cannot do so because their schools do not offer it.
Although eligibility requirements are the same for the free- and reduced-price breakfast and lunch
programs, less than half of the students participating in the lunch program also participated in the
breakfast program.In March 1994, 248,916 Tennessee students participated in the lunch program, while 110,959
participated in the breakfast program.
Child AbuseAbout a third of reports of child abuse or neglect are found to be "indicated" each year.The number of "indicated" victims of child abuse or neglect has not changed significantly in recent
years.The vast majority of perpetrators of child abuse in Tennessee are parents or relatives of the victims.
Teen CrimeThe number of referrals to juvenile courts in Tennessee for violent crimes has more than doubled in
the past decade.Many factors that are strong predictors of violent behavior are known. They include lack of parental
supervision, poverty, single parenthood, increased availability of firearms, alcohol and other drugs,
and our increasingly violent society.In 1992, only 13.7 percent of juveniles referred for murder in Tennessee lived with both parents.
State Care, CustodyBetween FY 1983-84 and FY 1990-91, commitments to state care increased by 65 percent.From July 1, 1992 to June 30, 1994, 16,928 children and youth were committed to state care and
13,891 left state care.Grainger County had the lowest rate of children in custody at 3.6 per 1,000, and Hancock had the
highest rate at 24.1 per 1,000.3 4
32 The State of the Child in Tennessee, 1994 A Tennessee KIDS COUNT/fennessee Commission on Children and Youth Report

Chapter 2Health
35
The State of the Child in Tennessee, 1994 A Tennessee KIDS COUNT/Fennessee Commission on Children and Youth Report 33

Thousands More Children Now Have Health InsuranceTenn Care replaces Medicaid and provides health care coverage for persons
who were eligible for Medicaid. Additionally, people who are uninsurable andpeople who were uninsured on or after July 1, 1994 may apply for Medicaid
coverage.Tenn Care contracts with managed care organizations (MC0s) - private com-
panies which in turn contract with doctors, hospitals, clinics and other healthcare providers to deliver health care services.
The state is divided into 12 regions, each of which has two or more MCOsfrom which residents in each region can pick. If a recipient does not pick one,the state assigns an MCO.
Former Gov. Ned McWherter, in a brochure produced by the TennesseeDepartment of Health, outlined the "beliefs" upon which Tenn Care is based.
They are:People should be able to get quality, affordable health care;Health care costs can be controlled so Tennesseans won't have to pay more
taxes;People should be able to work their way off welfare without the fear of losing
their health care coverage;We should stress preventing health problems, as well as treating them."The most obvious benefit of Tenn Care to children is that tens of thousands of
them who previously were not covered by health insurance are now insured. Asthe chart below shows, more than 52,000 children ages birth to 13 who were noteligible to be covered under Medicaid are covered by TennCare. Additionally,nearly than 104,000 girls and women ages 14 to 44 roughly childbearing ageare now covered and have greater access to prenatal care.
Many of those who are covered by Tenn Care, but were not covered by Medic-aid, are lower-income working people who, because of their limited financialresources, previously had to self-ration health care. This necessarily oftenmeant having little prenatal care and preventative medical care for children andtheir parents. It also often meant that many typical childhood illnesses, such asear infections, which are usually easily treated, became quite serious beforemedical care was sought.
Not only does Tenn Care make health care available and affordable for manypreviously uninsured families, it also reduces the stress caused by the ever-looming fear of financial disaster caused by not having medical insurance.
Clearly Tenn Care is a prescription for healthier children in Tennessee.
Tenn Care Coverage By Rate Category, 10/24/94
Rate CategoryLess than 1 year of ageAges 1 to 13Ages 14 to 44 (male)Ages 14 to 44 (female)Ages 45 to 64Ages 65 and overMedicaid/Medicare DualsAid to the blind/disabledTotal Enrollees
Source: TennCare Bureau
Medicaid EligiblesUninsured/
Uninsurable Eligibles31,826 1,616280,936 50,52953,161 119,861
172,075 103,93610,711 75,131
4,723 5,340142,231 404126,350 29,121
822,013 385,938
3 13
34 The State of the Child in Tennessee, 1994 A Tennessee KIDS COUNT/Tennessee Commission on Children and Youth Report

Percent of Total Population Enrolled in TennCareOctober 1994
:
CountyTennCare
Number PercentAnderSbri" : 15,429 22.6:Bedford 6,203 19.6:Benton 3,784 26.2:Bledsoe 3,016 30.7Blognt 16,928 19.0:Bradley 14,537 19.1:Campbell 14,986 42.8:Cannon 2,381 22.4Carroll 6,147 22.6tarter. 13,628 26.4:Chpatham 5,615 18.7
hester 2,941 22.8:Claiborne 9,983 37.4'Clay 2,252 31.8Cocke 11,225 38.4Coffee 10,434 25.3:Crockett 3,390 26.5Cu rriberfand 9,461 25.2
aiiidStin 121,752 23.3:Decatur 2,776 26.9:DeKalb 3,996 27.3IPOs9P 7,885 20.9:Dyer 9,087 25.9F ayette 7,454 29.2if entress 6,998 48.0Franklin 7,130 20.0:Gibion.. 10,393 23.0:Giles 4,994 19.1Grainger 5,506 32.0.Greene 14,704 26.2:Grundy 6,058 46.0Harriblen 12,808 25.1:Hamilton 59,756 21.1Note: Percent is based on the 1994 popKnoxville. The state total includes 1,401out-of-state cases enrolled in TennCare by October 24, 1994.
CountyTennCare
Number PercentanCobk 3,276 49.5
:Hardeman 7,936 34.2:Hardin 8,177 35.8:Hawkins 12,270 27.4F.laywood 6,686 35.2:flenclerson:;* 4,615 21.0;Henry 6,335 23.1:fliCkMan 4,290 24.5Hiti.tiSton 1,926 27.2.11,0.rvt!reysi,ii: 3,340 21.3:',J ackSon 2,805 30.3:.lefferson 8,522 25.4JOnnson 4,733 34.6Kritiii 67,007 19.6i:Lake: 2,430 34.4Lauderdale ::::, 7,939 34.4:taiiiireride, ,
7,252 20.2:Lewis 2,616 28.9ltincoln 5,940 20.5toudon.. 6,850 21.1'I'viclMinn 9,816 23.1
M60,41.6i. 6,925 31.0:Macon 4,052 25.2:Madison 19,230 24.2:Marion 7,377 29.5:Marshall 3,860 17.1:MaurY, 12,087 21.4i:Meigs 2,633 32.0Monroe 10,281 32.9Montgomery 18,308 16.9MCbife :: 806 16.9:1AOrgan 5,543 31.6:Obidn 6,747 21.6
Percent Ranges
8.7 to 21.3
21.4 to 25.9
26.0 to 30.8
30.9 to 51.4
CountyTennCare
Number PercentOveitdñ 5,052 28.7.Perry 1,579 23.3Pickett 1,658 36.0:Polk 3,692 27.1'PUfriam 10,251 19.3.FlheP 7,487 30.8:Roane 11,466 24.7Robertson 8,198 18.8Ruth erfOrd 17,888 13.2Scott 9,331 51.6Sequatchie 2,776 30.9Sevier 14,528 26.1Shelby 259,777 30.8Smith 3,149 22.0Stewart 2,420 24.5Sullivan 32,102 22.5Sumner 16,810 14.8Tipton 10,720 26.9Trousdale 1,638 27.5Unicoi 4,429 26.9Onion 4,611 31.7Van Buren 1,316 27.3Warren 8,684 26.3WathirigtOn 20,254 21.7Wayne 3,901 28.0Weakley 5,517 17.4White 5,330 26.2Williamson 8,112 8.7Wilson 11,140 15.2
eri6eiiee 1 1,211,464 24.2
3 7 BEST GM AVAILABLE" A
The State of the Child in Tennessee, 1994 A Tennessee KIDS COUNTaennessee Commission on Children and Youth Report 35

Some Don't Even Try To Get Adequate Prenatal CarePrenatal care, and the lack thereof, is an indicator of child well-being because "lack of adequate
prenatal care is associated with poor pregnancy outcomes, including high rates of infant andneonatal death, premature birth, birth defects, maternal death, and birth complications." [1]
Not only do women who fail to get adequate prenatal care risk developing easily preventableconditions that put their babies at risk of health problems, such as gestational diabetes,but manyof them actively do things that can harm their babies. A recent study of women who failed to getadequate prenatal care during their pregnancies says 75 percent "engaged in behaviors known tobe harmful to the fetus." [2]
"Cigarette smoking was the most frequently cited adverse behavior," the study said. Othersdrank alcohol and took other drugs. Very obese women ignored theirprescribed diets.
Given the possible ramifications of failure to get prenatal care and given government effortsduring the past two decades to make it affordable and accessible [3], the olDvious question is: whydid 32.5 percent of Tennessee births lack adequate prenatal care in 1992?
The national study of women who failed to get adequate prenatal care says the women revealedfour main reasons: their lifestyles differed from those of mainstream society; they believed prenatalcare was important, but stressful events in their lives took priority; they had attempted to get care,but were discouraged, turned away, or given poor information by service delivery personnel; andthey did not want their babies. [4]
There are two distinct types of women who fail to get adequate prenatal care, the study says:those who make little or no attempt to get prenatal care; and those who try and fail. [5]
Women who did not seek prenatal care "tended to be single, to have poor support from theirmates, but good family support, to be dependent on AFDC, and to have less than a high schooleducation. Most had public or private insurance to cover prenatal care, but they did not takeadvantage of it. The reasons these women gave for non-use of care were that the baby wasunwanted or they had lifestyles in which prenatal care was a low priority." [6]
About 14 percent of those who did not seek prenatal care "had a high level of pregnancy denial."[7] Typically, those in denial claimed not to be aware they were pregnant until they gave birth, orno more than a week before giving birth.
Generalizing about women who do not seek prenatal care at all, the study said their failure toseek care "is a symptom of nonfinancial service system inadequacies, problematic life situations,and serious individual and family dysfunctions." [8]
Saying "the reasons for non-use of prenatal care are diverse and often complex," the studyconcluded that non-seekers would not have sought prenatal care "even under the best prenatalcare system." [9]
Conversely, about half of the women in the study had made "a number' of unsuccessful at-tempts to obtain prenatal care.
"These women tended to be married, to have good support from their mates and families, to behigh school graduates, and to have income from employment." Also, most did not have public orprivate insurance that would cover prenatal care costs. [10]
One reason cited by them for failure to get prenatal care was inconvenience and expense.Distance to care was the major factor for rural low-income women ..." Lack of child care for womenwith children was also a problem." [11]
Many of the women did not know where to go for care. Some, although their families had earnedincome, did not have enough income to pay for prenatal care typically requiring a down paymentof at least $500 and were incorrectly told they did not qualify for government assistance. Somewho tried to apply for government assistance were badly treated by welfare agencies whenawlying, and gave up.
For many of them, the combined stress of events in their lives, financial worries and unplannedpregnancies was compounded by stress in negotiating the service system.
The study concluded by saying that no amount of funding for prenatal care programs will ensurethat all or most women will get adequate prenatal care. Women who do not seek prenatal careneed post-discharge follow-up from social workers 'Which may include realistic and timely plans toprevent further pregnancies, adoption or custody counseling, or referral to protective caseworkservices." [12]
It also noted that many of these women, particularly those who were indigent, had previouslyrequested sterilization, but funds and staff were not available. Many were apparently incapable ofsuccessfully preventing pregnancy. [13]
For those who seek prenatal care, the study recommends "brief counseling and information andreferral during the hospital confinement ... including information on how to gain access to thesystem if a future pregnancy occurs. Seekers also need ...family-planning information, as well ashousing, employment, child care, and budget planning referrals." [14]
Most importantly, the study said, "all no-prenatal-care uses should be flagged for hospital socialwork department triage." [15]
36 The State of the Child in Tennessee, 1994 A Tennessee KIDS COUNT/Tennessee Commission on Children and Youth Report

Percent of Births Lacking Adequate Prenatal Care, 1992
CountyPrenatal Care
CountyPrenatal Care
Adequate Not Adequate Adequate Not Adequaten erson 78.8 21.2 Handock 65.4 34.5
:i8edford 58.7 41.2 i:Hardeman 52.4 47.6.Benton 64.2 35.8 :Hardin 68.0 32.0Bledsoe 68.9 31.1 flawkins 60.2 39.8131P:tint; 73.7 26.4 Tlaywood, 56.7 43.3:piadley 66.6 33.4 Henderso.r,1,, 60.3 39.7
75.8 24.3 ;Henry 57.8 42.2:Cannon 47.5 52.5 .::Hickman 69.5 30.5:Carroll 67.9 32.1 :Houston 41.2 58.8'Carter 72.6 27.4 69.8 30.2PI.Pattlam 81.0 19.0 4,a0k.SOn 52.4 47.7Chester 61.7 38.3 Jefferson 71.6 28.5Claiborne 73.5 26.5 Johnson 75.0 25.0'Clay 64.8 35.2 Knox 79.7 20.3c,loCke 65.9 34.1 Lake 68.5 31.4coffee 64.1 35.9 Lauderdale ; 68.3 31.7
._Crockett 60.9 39.0 Lawrence ; 75.0 25.0CUMbeilahd 63.4 36.6 Lewis 68.0 32.0'DaVidSon 79.9 20.1 Lincoln 65.6 34.5Decatur 55.2 44.8 Loudon 66.4 33.6DeKalb 66.5 33.5 McMinn 62.2 37.8Dickson 75.0 25.0 McNairy- 63.7 36.3Dyer 76.1 24.0 Macon 71.6 28.4Fayette 59.9 40.1 Madison 55.2 44.9
:Fentress 70.9 29.1 :Marion 68.3 31.7'Franklin 66.7 33.2 :Marshall 69.6 30.4
55.6 44.3 :Maur 74.8 25.2iGiles,,, 72.6 27.4 Meigs 58.7 41.3Grainger 77.8 22.2 :Monroe 65.5 34.5Greene 62.9 37.1 :Montgomery.
Vaofe"'49.069.2
51.030.7Grundy 52.9 47.0
Hamblen ' 69.8 30.2 Mbr an 79.7 20.3Härñlltôn'.... 70.3 29.7 Obion 80.7 19.3
Percent Ranges
!9.5 to 26.5
26.4 io 33.2
33.3 to 38.3
38.4 to 58.8
Prenatal CareCountyOVertPnPerryPickettPolkPUtnimRheaRoaneRobertsonRutherfordSCOti 1
,SeguatchieSevierShelbySmithStewartSulliVan'Sumner,Ti tonTrousdaleUnicoiUnion.....Van BUren'WarrenWathingtoWWaYiieWeakleyWhite
:Wilson
Adequate Not Adequate64.1 35.966.2 33.860.5 39.669.4 30.762.7 37.362.3 37.666.8 33.266.1 33.956.5 43.482.6 17.473.9 26.167.5 32.558.6 41.475.0 25.043.6 56.462.4 37.682.4 17.655.9 44.169.2 30.869.0 30.974.0 26.164.3 35.765.9 34.176.4 23.681.0 19.070.8 29.245.1 54.890.5 9.576.3 23.7
67.5 32.5
Note: Rate is based on the 1992 population estimates made by Department of Sociology, University of Tennessee,Knoxville.riTJ
I COPY AVAILABLE3 9
The State of the Child in Tennessee, 1994 A Tennessee KIDS COUNT/Tennessei Commission on Children and Youth Report 37

Low-Birth-Weight Babies Account For Half of Infant Deaths
Low birth weight, being born weighing less than 5.5 pounds, is an indicator of child
well-being because "... in the United States, low-birth-weight infants account for two-thirds of the newborn deaths in the first 28 days after birth and half of all deaths duringthe first year of life. [1] In fact, "...infant mortality is inversely proportional to birthweight..." [2] Moreover, these infants are much more likely to suffer from chronichandicapping conditions, such as cerebral palsy, blindness, mental retardation, and
learning disabilities." [3]The State of Tennessee has set a goal of, by the year 2000, reducing the percent-
age of low-birth-weight births to no more than 7.1 percent of all births. Unfortunately,Tennessee is moving in the wrong direction to reach this goal.
Both the number and percent of babies born in Tennessee weighing less than 5.5pounds increased from 1990 to 1992. The percentage increased from 8.2 percent ofall births in 1990 to 8.5 percent in 1992. The number of low-birth-weight babies bornin Tennessee grew from 6,160 in 1990 to 6,265 in 1992 an increase of 105.
Although the statewide figures were worse from 1990 to 1992, 41 counties sawimprovements. Among the metropolitan counties, only Davidson County improved,going from 787 low-weight births in 1990 to 752 in 1992 a decrease of 35 low-weightbirths in two years. Shelby County had the largest numerical increase, going from1,700 low-weight births in 1990 to 1,752 in 1992. Hamilton County increased by 15low-weight births, and Knox County increased by 28.
The largest numerical declines from 1990 to 1992, other than in Davidson County,were in Blount and Bradley counties, which both reduced low-weight births by 11;Dyer County, reduced by 15; Franklin, reduced by 17; Gibson County, reduced by 18;Rutherford County, reduced by 18; Smith County, reduced by 15; Trousdale County,reduced by 10; Warren County; reduced by 9; Weak ley County, reduced by 18; andWilliamson County, reduced by 15.
The biggest numerical increases in low-weight births outside the metropolitancounties from 1990 to 1992 were in: Fayette County, increased by 26; MadisonCounty, increased by 28; Montgomery County, increased by 26; Obion County,increased by 15; and Robertson County, increased by 21.
Recent medical publications indicate all the causes of low birth weight are not yetknown. For example, in a report on a study on infant mortality, The New EnglandJournal of Medicine asks, "What is the role of stress and psychological factors?Greater advantage needs to be taken of the evolving refinements in psychosocial,physiologic, and biomedical testing in assessing the role of stress, since it may be
important ... We need to understand why some pregnant women react to stress in
ways that have such profound biologic effects as prematurity and neonatal death." [4]Some factors common to low-weight births are known. They are: inadequate prena-
tal care; young teens having babies; poverty, and pregnant women using tobacco and
alcohol and other drugs.Ways to reduce the incidence of low birth weight are also being explored. "Because
the factors affecting birth weight are so complex, comprehensive care is required toreduce the rate of low birth weight," the New England Journal of Medicine, says. "Theinterplay of environmental, behavioral, biologic, clinical, and other factors can besystematically addressed only through comprehensive care ... Much of the effort toreduce the rate of low birth weight has been directed toward identification of the risksand intervention during prenatal care. Much more attention needs to be paid toeducation, preventative medicine, and services before conception. At the same time,it is necessary to promote high-quality prenatal and neonatal care, especially sincethe latter can compensate for many inadequacies in the quality and distribution of
maternal health services ... Benefits could be realized from the application of ourpresent knowledge, however, by the provision of more effective prenatal care, andimproved and expanded family-planning services would reduce unwanted and un-timely pregnancies, especially among teenagers."
[5]4 0
38 The State of the Child in Tennessee, 1994 A Tennessee KIDS COUNTaennessee Commission on Children and Youth Report

Percent of Low-Birth-Weight Babies, 1992
CountyLow-Birth-Weight Babies
Number PercentAndeitdif :i 70 7.6'Redford 32 7.5:Benton 15 8.7:Bledsoe 5 5.6tlovnt 61 5.3:B.a.c.:41, 58 5.4tampbell 35 7.6tannon 17 10.5:Carroll 26 7.8:Carter 43 7.5"thaatham ::. 28 6.9thester 12 6.6'Claiborne 27 7.6Clay 2 2.3tocke 32 7.8COffee 46 7.8:Crockett 15 7.8:Cionberland 33 7.1:DaVidSon 752 8.9:Decatur 8 6.0OeKaili 9 5.4.:Pickson 48 9.1:Dyer 38 7.4:fayette 46 11.2:Fentress 11 5.8franklin 21 5.1'GitiSOn 45 7.2Giles 31 8.9*Grainger 14 6.0.Greene 50 7.8'Grundy 13 7.0.HaMblen 45 6.3Hamilton- 362 9.0
Note: Rate is based on the 19A2 nom,
CountyLow-Birth-Weight Babies
Number PercentHancock 7 8.6Hardeman 37 8.9Hardin 20 6.5Hawkins 45 7.3Haywood 26 8.9Henclersor) 20 7.6Hen 27 8.0Hickman 14 5.9Houston 8 7.8_Hum hreys 15 8.2Jackson 9 8.6Jefferson 31 7.4Johnson 14 7.6Knox 405 8.7Lake 8 9.0Lauderdale 34 9.6Lawrence 37 7.1Lewis 8 6.4Lincoln 38 10.1Loudon 28 7.3MCMInn 43 7.3M9NalrY 22 6.4Macon 14 6.5Madison 124 9.9Marion 27 8.4Marshall 24 7.4Maury 70 8.9Meigs 7 7.6Monroe 30 7.4Moritgortierx 176 7.5Moore 3 5.8Morgan 14 7.1plaion 41 9.8
Percent Ranges
!2.3 to 6.4
6.5 to 7.5
7.6 to 8.6
8.7 to 12.7
CountyLow-Birth-Weight Babies
Number Percent::0Veitori 9 5.4Rerry 5 7.0:Pickett 4 9.3Polk 11 6.9
:putriarri- 47 6.4Rhea 28 8.4Roane 34 6.1:illobertson 59 9.7Rutherford ::: 126 6.2Scott 16 6.1Sequatchie :: 9 8.1:Sevier 58 7.8Shelby 1,752 11.2Smith 8 4.7
Stewart 11 8.3Sullivan 132 7.3$urnner 91 6.3Ti ton 67 10.5:Trousdale 5 5.5:.Unicoi 15 8.6:Union 19 12.7)iii 80i.en' :: 7 10.0:Warren 32 7.3MaShinot6iiil 70 6.3Waki le 14 7.6:Weak ley 18 5.5Vhite 18 7.3:iWilliamson,: 50 4.4:Wil.00::::::::::: 74 7.6
6,265 8.5
7.1ation estimates made by Department of Sociology, University of Tennessee,
Knoxville.* U.S. rate is for 1991 and from Kids Count: State Profiles of Child Well-being, The Annie E. Casey Foundation, 1994Baltimore, MD.
4 1The State of the Child in Tennessee, 1994 A Tennessee KIDS COUNT/fennessee Commission on Children and Youth Report
BEST IMPY AVAgLAbLL39

40
Infant Death Rate Improves, Other Races' Rate Nearly Double White Rate
The reason infant mortality death before a child's first birthday is indicative of childwell-being is obvious. The medical descriptions of the causes are well-documented. In
1992, the five leading causes of infant mortality were birth defects, sudden infant deathsyndrome, short gestation and low birth weight, respiratory distress syndrome, andinfections specific to the perinatal period, according to the Tennessee Department ofHealth. Precisely what causes these conditions, is less well-known, however.
For example, what causes the second leading cause of infant mortality suddeninfant death syndrome (SIDS) has not yet been determined. And it may include asignificant number of infant murders, said the late Jim Pryor, a prosecutor, expert inchild abuse, and member of the Tennessee Commission on Children and Youth.
Tennessee has the lowest infant homicide rate in the U.S., he said, because too fewinfant homicides are discovered due to inadequate training of some persons whoperform autopsies.
A review of general infant mortality data shows Tennessee's infant mortality rate hasmore or less declined steadily during the past two decades from a rate of 20.3 per1,000 in 1973 to 9.4 in 1992. In 1973, 1,303 Tennessee infants died. In 1992, 691died.
The latest figures show the downward trend may be accelerating. From 1990 to 1992the number of infant deaths inTennessee decreased by 79deaths from 770 in 1990. Therate has declined from 10.3 per1,000 deaths in 1990 to 9.8 in1992.
However, when broken downby race, the picture is far lessencouraging. While whites inTennessee had an infantmortality rate of 6.9 per 1,000live births compared to anational rate of 8.9 [1] "otherraces," which in Tennessee ismore than 99 percent AfricanAmericans, had an infantmortality rate of 16.9 per 1,000.
The much-higher rate forAfrican Americans "could bedue to a number of factors,such as poor maternal health before pregnancy, increased physiologic risks associatedwith psychosocial risks, poor health habits during pregnancy, insufficient access tohealth care services, substandard health care (from physicians or other health carepersonnel), or standard medical care that does not adequately address the needs ofpregnant black women." [2]
Tennessee Infant DeathsPer 1,000 Live Births
1400
1200
1000
800
600
400
200
Source: Tennessee Department of Health
LEADING CAUSES OF INFANT DEATHS, PER 1,000LIVE BIRTHS, BY RACE, RESIDENT DATA, TENNESSEE, 1992
All Races White All Other RacesCause of Death Number Rate NumberAll CausesBirth DefectsSudden Infant Death SyndromeShort Gestation and Low Birth WeightRespiratory Distress SyndromeInfections Specific to Perinatal PeriodAoddentsBirth Corrplications (placenta, cord, membranes)Maternal Pregnancy ComplicationsPneumonia and FluIntrauterine Hypoxia* and Birth AsphyidaSepticemia**Neonatal Hemorrhage'Oxygen starvation
Blood poboning caused by microorganisms
691 9.4158 2.1
133 1.885 1.245 0.622 0.317 0.213 0.212 0.28 0.1
8 0.1
4 0.1
4 0.1
38210288343011
1375331
1
4 2
Rate Number Rate6.9 309 16.91.8 56 3.1
1.6 45 2.50.6 51 2.80.5 15 0.8
0.2 11 0.60.2 4 0.20.1 6 0.30.1 7 0.40.1 5 0.30 5 0.30 3 0.20 3 0.2
Source: Tennessee Department of Health
The State of the Child in Tennessee, 1994 A Tennessee KIDS COUNT/Tennessee Commission on Children and Youth Report

Infant Mortality Rate (Per 1,000 Live Births), 1992Note: This rate is Per 1,000, NOT percent.
14%:1 CCM -
ckett14 0
H wood
1=1
non Fe-ari
Mont am.
00 an ea amcheon
Hmkman
m wan
MII arneen
0 *MOO Pt Mau
heftierCO ur Lame
CountyInfant Mortality
Number RateAhder Son 10 10.9Bedford 8 18.9:Benton 5 28.9:Bledsoe 1 11.1:Blount 4 3.5:Bradley 2 1.9:Campbell 4 8.7Cannon 1 6.2Carroll 5 15.0rcarier° 5 8.7:Cheatham .:: 1 2.5:Chester 1 5.5:Claiborne 2 5.6.Clay 0 0.0COcke 2 4.9Coffee 5 8.5:Crockett 1 5.2:Cumberland:: 5 10.8,:DaVidSorr :: 86 10.2IDecatur 2 14.9.:DeKalb 1 6.0:POPPP.. 3 5.7:Dyer 3 5.8:Fayette 6 14.7.:fentress 2 10.6:Franklin 2 4.9Gi15iiiii- 6 9.5::044 3 8.6'..Crainger 1 4.3
reene 6 9.4'.:Orundy 2 10.7iHaMblen 9 12.6
,amilton 34 8.5
MaconUOMM
MMI1 00
South
hrd Cannon
NM)Mare a
011 MOOLEM are
Id an
nd
an uren
Warren 00non I 00 00
Co Ind McMinn "hr..uatch
1100
Knox
Roane
Lhudon Blount
Mooretrrance Forn. rt,c,,, FranWIn Iaj Hami on
m
CountyInfant Mortality
Number RateHatidook. 0 0.0Hardeman 8 19.2Hardin 2 6.5Hawkins 5 8.1
.1-1PYWP04. .2 6.9
Henderson 3 11.5Henry 0 0.0Hickman 0 0.0Houston 0 0.0Humphreys 0 0.0*40.. o 0.0Jefferson 1 2.4Johnson 1 5.4Knox 30 6.4Lake 1 11.2... .. ..Lauderdale 4 11.2Lawrence 6 11.6Lewis 0 0.0Lincoln 6 16.0Loudon 4 10.5MCMinii 1 1.7McNairy 0 0.0Macon 0 0.0Madison 11 8.8Marion 3 9.3Marshall 1 3.1
Maury 5 6.3,Meigs, 0 0.0Monroe 2 4.9
:Montgomery.: 21 9.0MOdra 2 38.5MOrgan 4 20.3%.iPn .
7.2
Hancock
11101 Of Waelun on
Harnb n f:E=f
Jettemon
OC
OV
A
Rate Ranges
!0 io 3.5
34 to 7.1
7.2 to 10.8
10.9 to 38.5
CountyInfant Mortality
Number Rate.0Vettori 1 6.0Perry 0 0.0
:Pickett 1 23.3ROlk 1 6.3
:Pij.tri'ain 8 10.9
..,RtIPP.. 2 6.0:IHoane 4 7.1.Rbbertson 2 3.3.:RUtherford 16 7.9.Soott 2 7.6
P!:IP.OtOle: 0 0.0eVier 3 4.0
'Shelby 223 14.3Sinith 0 0.0:Stewart 1 7.55U.IliV411. .
18 10.0Sumner 14 9.6Tipton 9 14.1
Trousdale 0 0.0.Unicoi 3 17.2:Uhion 0 0.0Nan BUren 7 0 0.0Warren 3 6.9Washington:' 6 5.4Wayne 2 10.9:Weakley 3 9.1
White 3 12.2Williamson ii: 4 3.5Wilson 8 8.2
:Termessee 691 9.4
8.9Note: Rate is based on the 1992 population estimates made by Department of Sociology, University of Tennessee,Knoxville.
U.S. rate is for 1991 and froM Kids Count: State Profiles of Child Well-being, The Annie E. Casey Foundation, 1994Baltimore, MD. 4 3
The State of the Child in Tennessee, 1994 A Tennessee KIDS COUNTffennessee Commission on Children and Youth Report 41

PREVENTABLE DISEASES MAKING COMEBACKThe dramatic decline in the incidence of common childhood diseases has resulted
in part from inoculations with highly effective vaccines. The number of reported casesof diphtheria, polio, rubella, and tetanus has declined by 97 percent in the U.S. [1]According to researchers, "the impact of vaccination on the health of the world'speoples is hard to exaggerate. With the exception of safe water, no other modality,not even antibiotics, has had such a major affect on mortality reduction and popula-tion growth." [2]
The remarkable decline in the incidence of vaccine-preventable diseases in the U.S.has correlated with approximately 95 percent or more in school-age children whohave been immunized prior to school enrollment. These improved immunization ratescan be attributed in part to the enactment and enforcement of school immunizationlaws in each state. [3]
The National Immunization Campaign has helped promote immunizations throughcoalitions such as the Nashville Immunization Coalition. One focus of the campaign isto provide immunizations at non-traditional sites such as in shopping malls, schools,Head Start centers, and outreach projects.
Despite the existence and availability of these vaccines, as many as 3.5 millionchildren worldwide die each year from diseases that could be prevented. [4]
Failure to immunize young children has resulted in the measles epidemic of 19891991, and a relative resurgence of mumps since 1986. [9]
Last year, whooping cough which once killed more American children that all otherinfectious diseases combined reached its highest level in 26 years. A 1993 studyfound that three-fourths of the victims mostly children aged 2 to 12 had been fullyimmunized. The results of the 1993 study conclude that "it is clear that the pertussisvaccine failed to give full protection against the disease." [5] The study's lead re-searcher called for a nationwide assessment of the vaccine, now administered tomillions of infants and preschoolers.
The Centers for Disease Control (CDC) says there is no hard evidence that thepertussis vaccine has "lost its punch" and urges parents to keep immunizing. Anepidemiologist with the CDC's National Immunization Program stated that a morelikely cause of the increase in whooping cough cases is the "waning immunity amongolder children who have been vaccinated and the growing number of adults who havenever been exposed to the disease and ... may serve as a reservoir." [6] The CDC isconsidering a strategy to expand immunization guidelines to include vaccination ofschool-age children and perhaps young adults. [7]
In addition to the year 2000 goal of 90 percent immunization completion rates, thePresident's Childhood Immunization Initiative establishes coverage goals for indi-vidual vaccines. By 1996, 90 percent of two-year-olds should be vaccinated with onedose of measles-mumps-rubella (MMR), three doses of oral polio vaccine (OPV),three or more doses of diphtheria-tetanus-pertussis (DTP) and three doses ofhaemophilus influenza type b vaccine. The 1996 goal for hepatitis B vaccine is 70percent.
For children two years old or younger, the immunization rates in some areas arebelow the national goal of 90 percent for completion of the recommended immuniza-tions by the second birthday. [8]
Suggested Immunization ScheduleAGE VACCINE RECOMMENDED
2 Months4 Months6 Months15 Months4-6 YearsEvery 10 Years
DTP 1*, Oral Polio 1, HIB 1**, Hepatitis B 1DTP 2, Oral Polio 2, HIB 2, Hepatitis B2DTP 3, HIB 3, Hepatitis B 3MMR 1***, HIB 4, DTP 4, Oral Polio 3DTP 5, Oral Polio 4, MMR 2Tetanus and Diphtheria (Td)
Diphtheria, Tetanus, and pertussis (Whooping Cough) 4 4** HIB Meningitis and other Haemophilus Infections*** Measles, Mumps, and Rubella
42 The State of the Child in Tennessee, 1994 A Tennessee KIDS COUNT/Tennessee Commission on Children and Youth Report

Results from a recent statewide survey of 1,690 children aged two years old conducted by the TennesseeDepartment of Health (TDH) revealed a 72 percent statewide vaccine completion rate in 1993. This rate was forthe basic 4:3:1 series (4 doses of DTP, 3 doses of OPV and 1 dose of MMR). This is a slight increase (1.6percent) over 1992, but considerably less than the year 2000 goal of 90 percent completion rates. [10]
A critical aspect of the survey of two-year-old children is that it allows the TDH to analyze risk factors associ-ated with incomplete vaccination by two years of age. The risk factors, in order of degree of influence, are: age atfirst immunization; birth order; mother's age; mother's marital status; race; and mother's education. The order ofimportance is the same throughout the state although the relative influence of any one factor may differ fromregion to region, according to the TDH. [11]
The first three factors are the most predictive of incomplete vaccination compared to the other variables: thechild's age at first vaccination; the child's birth order; and the age of the mother. The TDH states that thesevariables can be useful in developing methods to target those children at highest risk of incomplete vaccination.Follow-up efforts can be prioritized by the TDH on the basis of the identified risk factors. [12]
For children of all ages, researchers have cited four reasons for low immunization rates. First, many opportuni-ties to vaccinate children are missed. An example is the failure of providers to administer recommended immuni-zations during health care visits because they are misinformed about contraindications or because they areunwilling to give more than two vaccines during the same visit. Researchers found frequently missed opportuni-
ties to administer the measles-mumps-rubella vaccine were due to ear infections,upper and lower respiratory tract infections,and other minor illnesses that are notcontraindications to vaccinations. "Sinceyoung children typically have six to eightrespiratory tract infections each year, respi-ratory illnesses, if considered acontraindication, would be a substantialbarrier to age-appropriate immunization."[13]
The second reason for low immunizationrates nationwide is that the deficiencies inthe health care delivery system in the publicsector have limited the administration ofvaccines. Some of these deficiencies includeinsufficient clinical staff and policies thatserve as barriers. The third and fourthreasons for low immunization rates areinadequate access to medical care and lackof public awareness in some communities,which result in a lack of demand for immuni-zation services. [14]
To improve immunization rates, there mustbe increased awareness of the necessity forage-appropriate inoculations and under-
standing that minor illnesses should not be considered contraindications to vaccination. Access to immunizationsis essential to reach the 90 percent immunization rates by the year 2000. The National Immunization Campaignhas shown promise in promoting communities to administer immunizations at non-traditional sites to providebetter service delivery for parents and their children.
Vaccination Survey Rate of 24-Month-Old ChildrenREGION "4:3:1" COMPLETION RATE (%)
East 1East 2Central 3Central 4Middle 5Middle 6West 7West 8Memphis-ShelbyNashville-DavidsonKnoxville-KnoxChattanooga-HamiltonJackson-MadisonSullivanTennessee (weighted)
1992 199371.7 86.668.0 75.779.7 80.779.0 83.578.4 79.576.8 81.194.4 84.380.9 73.256.0 51.366.5 72.868.7 72.968.7 72.778.7 82.780.0 74.470.4 72.0
Source: Tennessee Department of Health, 1993. See list of regions in appendix.
REPORTED CASES OF VACCINE-PREVENTABLE CHILDHOOD DISEASES IN THE U.S.
MAXIMUM NUMBERDISEASE OF CASES AND YEAR CASES IN 1991 PERCENT CHANGEDiphtheria 206,939 1921 2 -99.9%Measles 894,134 1941 9,488 -98.9%Mumps* 152,209 1968 4,031 -97.4%Pertussis (Whooping Cough)Polio (paralytic)Rubella**
265,269 193421,269 195257,686 1969
2,5750***
1,372
-99.0%-100.0%-97.6%
Congenital Rubella Syndrome 20,000 1964-1965 36 -99.8%Tetanus 1,560*** 1923 49 -96.9%
Mumps became a reportable disease in 1968** Rubella became a reportable disease in 1966.*** Vaccine causes 5 to 10 cases annually.Source: New England Journal of Medicine, December 17, 1992. p. 1,794.
The State of the Child in Tennessee, 1994 A Tennessee KIDS COUNT/fennessee =mission on Children and Youth Report 43

Tennessee Child Death Rate ImprovingThe good news about Tennessee's child death rate is that it is improving. The
Tennessee death rate among children ages 1 through 14 years old in 1980 was 44per 100,000. In 1990, it had declined to 35 per 100,000. In 1992, the rate was 31.9per 100,000. In 1990, 333 Tennessee children died, compared to 306 in 1992 an 8.1percent reduction.
The bad news is that Tennessee still ranks 39th in the nation in child deaths. Thenational rate, averaged from 1985 through 1991, was 30.7 per 100,000.
There are many causes of child death in Tennessee, but accidents are the primarykiller of children. As the charts below indicate, about 41.5 percent of Tennessee'schild deaths were caused by accidents in 1992 - 127 of 306 deaths. The greatestdecline in child deaths from 1990 to 1992 was in non-vehicular accidents. In 1990, 51
children ages 1-4 died in non-vehicular accidents, compared to 29 in 1992. In 1990,42 deaths of children ages 5 to 14 were attributed to non-vehicular accidents, com-pared to 32 in 1992.
More than a third about 36 percent of accidental child deaths in Tennessee 20for 1- to 4-year-olds and 46 for 5- to 14-year-olds were caused by vehicle accidentsin 1992. In 1990, about 47 percent of accidental deaths were vehicle deaths.
The reduction in child deaths particularly for young children is partially attributableto Tennessee's 1977 child restraint device law, which requires each child less thanfour years old to be in a child passenger restraint device when in a moving vehicle.Motor vehicle accidents took 29 lives of 1- to four-year-olds in 1990, and 20 in 1992.Only four of the 15 children in the 0- to-three-year-old age group who were killed invehicle crashes in 1992 were in proper child restraint devices. [1]
The number of tickets handed out by the Tennessee Highway Patrol for violation ofthe child restraint law decreased from 7,590 in fiscal year 1990-91 to 6,585 in fiscalyear 1992-93, indicating compliance may be increasing. The Tennessee Departmentof Safety estimated compliance with the child restraint law to be about 40 percent in1990 up from about 9 percent in 1977.
Compliance with the law and the effectiveness of safety seats may be increasingbecause of traffic judges who are increasingly sentencing violators to training classesin which offenders learn how risky it is not to use vehicle child restraints and in whichthey learn how to properly use them.
Vehicles are also dangerous to children on foot. In 1992, 13 pedestrians ages birthto 15 were killed by vehicles. [2]
Child Death Rate Per 100,000 By Leading Causes, Ages 1-4, 1992
CAUSES NUMBER OF DEATHS RATEAccidents 49 18.0Motor Vehicle Accidents 20 7.3(Included in "ACCIDENTS", above)
Birth Defects 16 5.9Cancer 13 4.8Homicide 10 3.7Two Or MoreCauses Tied 4 1.5Source: Tennessee Department of Health
Child Death Rate Per 100,000 By Leading Causes, Ages 5-14, 1992
CAUSES NUMBER OF DEATHS RATEAccidentsMotor Vehicle Accidents 46(Included in "ACCIDENTS", above)
Cancer 24Birth Defects 10Heart Disease 4Two Or More Causes rued 4 4 6Source: Tennessee Department of Health
78 11.36.7
3.51.50.60.6
44 The State of the Child in Tennessee, 1994 A Tennessee KIDS COUNTrfennessee Commission on Children and Youth Report

Child Death Rate Per 100,000 Children Ages 1-14, 1992Note: This rate is Per 100,000, NOT percent.
CountyChild Deaths
Number Rate:AMOS Ott 4 31.3:Bedford 2 32.7:Benton 0 0.0Bledsoe 0 0.0Blount 4 25.9
4 28.3irnpbeli 1 14.9iCannon 1 47.8párroll 1 19.8:Carter 4 46.8PnPattTgl. 3 46.9:]..Oilester 0 0.0:Olaiborne 2 39.6Day 0 0.0:Cooke 2 37.9:Coffee, 0 0.0
.rockett 0 0.0:Cumberland, 1 15.8DaVidSoir 32 34.1:Decatur 1 55.6:De Kalb 0 0.0:DiCkson 2 25.3:Dyer 4 56.8:Fayette 3 51.7:Fentress ::: 1 35.0:Franklin i:: 0 0.0:Gibson ::i 3 35.1iGiles 3 60.0:Grainger 2 63.0:Greene ::: 1 10.3:Grundy 2 72.2Hair blen 2 21.7.... ..
:Harm n ::: 14 26.3
CountyChild Deaths
Number Rate:HancoCk 0 0.0:Hardeman 3 58.0'Hardin 3 68.6.Hawkins 3 37.4.Haywoo ..::::: 2 45.9.., o o.o,Handabri':Henry 5 102.9Hickman 4 126.5'Houston 0 0.0.HUmphreys:jaCkson
0 0.00 0.0
ffersdn 2 36.9:johnson 0 0.0-Knox 15 25.2'Lake 1 87.9..1.:4WPr.dale 2 39.4.Lawrence 3 41.3:Lewis 0 0.0'Lincoln 1 17.9:Loudon 4 70.3'McMinn 1 12.6:MCNairy 9 213.0:Macon 0 0.0Madison 4 24.5:Marion 0 0.0:Marshall 0 0.0:Maury 3 25.8Meigs 1 66.0:Monroe 2 33.9:Montgomery 3 13.8Moore 0 0.0.MOrgan 2 59.6
2 34.3
Rate Ranges
so 0
0.1 to 24.3
47.0 oo 213.0
27.0 se 441
CountyChild Deaths
Number Rate:OVertdh 0 0.0.:Peeey 0 0.0:.PiCkett 0 0.0POlk
-Putnam2 84.53 33.3
11hp.4 3 64.8ROane 0 0.0Robertson 5 53.6Riitherford 6 22.1:*S6iift
.....2 49.20 0.02 20.4
Shelby 70 38.6SMith 0 0.0Stewart 0 0.0sullivan 6 24.7Sumner 6 26.2:Tipton 5 53.3Trousda1e . 0 0.0
1 37.7Union 1 34.3
1 104.5Warren 4 62.4:WaShingtoW 5 32.2Mayri-di 1 36.6Weakley:White
01
0.026.9
Williamson 3 15.1WilSon 5 32.7
17r.etitise-§6661 306 31.9
Source: Office of Health Statistics and INote: Rate is based on the 1992 population estimates made by Department of Sociology, University of Tennessee,Knoxville. U.S. rate is for 1991 and from Kids Count: State Profiles of Child Well-being, The Annie E. CaseyFoundation, 1994, Baltimore, MD.
30.7
The State of the Child in Tennessee, 1994 A Tennessee KIDS COUNT/Tennesfife =mission on Children and Youth Report
BEST COPY AVAILABLE45

Tennessee Teen Pregnancy Rate ImprovesTennessee's 1992 adolescent pregnancy rate dropped to a level not reported since
the mid-1980s. The pregnancy rate for 10-17 year olds decreased seven percent to23.8 pregnancies per 1,000 females, down from 25.6 in 1991. Decreases occurred inrates for both white and non-white females from 1991 to 1992. The white rate de-clined 7.9 percent from 19.1 to 17.6. The non-white rate declined from 48.9 to 45.9, adecrease of 6.1 percent. While the pregnancy rate for 10-14 year olds remainedstable at 3.2, the rates for 15-17 year olds decreased from 60.9 to 56.5. The mostdramatic decrease occurred in the white 15-17 age group, which decreased from46.5 to 42.8 an 8 percent decrease.
One factor in the reduction of the teen pregnancy rate may be the advent of thestate's Adolescent Pregnancy Initiative. The initiative focuses on three areas: pre-venting teen pregnancies; increasing community involvement and awareness of theproblems of teen pregnancy; and improving teen pregnancy outcomes and parentingclasses. Another factor may be the statutory requirement since the 1991-92 aca-demic year that family life education be taught in Tennessee schools. The statefamily life curriculum stresses responsibility and family relationships, focuses onabstinence, and may include sex education.
Another factor may be local teen pregnancy prevention programs which are at leastpartially funded by state grants.
Among the reasons teen pregnancy is discouraged is early childbearing results in
negative medicalconsequences formother and child.The worst physi-cal effects ofchildbirth aresuffered bymothers under theage of 15 whohave greater risksof complicationsand mortality.Teen mothersunder the age of18 are also "morelikely to havetoxemia, anemia,and prolonged labor. Their babies are at higher risk of prematurity and low birthweight." [1]
Teens begin their pregnancies with many preexisting conditions, such as alcoholuse, substance abuse, poor nutrition, sexually transmitted diseases, and anemia, thatcan produce negative outcomes. The consequences "stem from the problem behav-ior or illness, not from the mere fact of age at conception." [2]
Compared to young women who delay childbearing until their twenties, teen moth-ers are generally socially disadvantaged. Teen mothers have reduced educationalattainment, "unstable marriages and high divorce rates, or no marriage, more subse-quent births closer together and unintended, lower status jobs, lower incomes, and insome cases, long-term welfare dependency. Adverse effects on children of teenparents include lower achievement, many more behavioral and emotional problems,high risk of becoming teen parents themselves, and a lifetime of poverty." [3]
In addition to the personal costs, the societal costs of teen pregnancy are tremen-dous. Public costs related to teen childbearing totaled $120.3 billion in Aid to Fami-lies with Dependent Children (AFDC), Medicaid, and Food Stamps from 1985through 1990. If each birth had been postponed until the mother was at least 20, anestimated $48.1 billion could have been saved, according to a report by the U.S.General Accounting Office. [4] 4 8 continued
120
100
80
60
40
20
Teen Pregnancy and Live Birth Rate(Per 1,000 Women Ages 15-17) by Race, 1991
White
Source: Tennessee Department of Health
Other Races
46 The State of the Child in Tennessee, 1994 A Tennessee KIDS COUNT/Tennessee Commission on Children and Youth Report

Teen Pregnancy Rate (Per 1,000 Women Ages 15-17), 1992Note: This rate is Per 1,000, NOT percent.
Hancoc
irrrnrrn
CountyTeen Pregnancy
Number RateAnderadh 75 55.6
Bedford 37 55.9
Banton 10 32.9
:Bledsoe 9 49.2
::15.19PtIt 82 46.4
:Bradley 90 53.2
tampbell 41 49.8
:Cannon 17 82.1
tarroH 31 56.7
tartar.70"FeRfitTn-
36 32.5
22 36.6
itilester 11 31.1
Claiborne 28 43.7
Clay 6 40.0
:COcke 39 62.2
:Offee 54 61.4
:Crockett 8 30.5
:Cdmberland 38 52.3
:DaVid6On:' 692 69.8
:iDecatur 13 65.7
:DeKalb 19 64.2
tickson 26 32.0
:Dyer 47 61.2
:fayette 51 89.3
fentress 22 63.8
ifranklin 37 45.3
:Gibson 52 55.1
.,Giles 23 39.2
:Grainger 21 60.2
Greene 55 48.0
:Grundy 18 54.1
'Hamblen 52 47.3
,,,Harrilt0 333 57.0
Note: Rate is based on the 1992 DonKnoxville.
CountyTeen Pregnancy
Number RateHancock 7 51.1
Hardeman 61 116.6
Hardin 27 55.7
Hawkins 39 40.7
Haywood 38 88.6
Henderson 26 57.3
Henry 19 37.0
Hickman 13 37.9
Houston 10 63.7
Hurnphreys 16 50.8
Ja6.ri 15 86.2
Jefferson 27 33.4
Johnson 21 75.8
Knox 312 44.0
Lake 12 90.9
.Lauderdala 40 77.5
Lawrence 40 51.9
Lewis 10 49.3
Lincoln 27 44.0
Loudon 24 38.5
McMinn 43 47.1
McNairy 36 79.3
Macon 16 49.7
Madison 116 65.2
Marion 25 43.5
Marshall 25 53.0
Maury 74 67.3
Meigs 4 23.5
Monroe 41 54.7
Montgomery, 95 43.4
MOdre 6 54.5
.Morgan 13 33.7
Obion 41 59.4
Rate Ranges
!II 7 to 39.5
394 to 49.7
49.11 to 40.2
40.3 44 1144
CountyTeen Pregnancy
Number RateOVartdri.' ::: 11 29.7
:Perry 8 59.3
,Pickett 2 23.0
:polk 13 40.9
:Putnam 44 33.7
.:Rhea 17 28.7
Fioane 50 51.2
Robertson :::: 34 39.4
:illutherford ::: 122 39.2
.:Scott 15 35.8
Sequatchie4 6 30.9
:Sevier 56 51.2
Shelby 1,506 83.1
Smith 7 24.1
Stewart 10 50.8
:SUlliVan 117 40.9
Sumner 111 45.6
*Tipton 60 69.5
:Trousdale 10 87.0
:Linicoi 13 36.4
linion 9 29.0
Vall PYreil :,:: 1 97warren 42 59.3
Washington:: 79 38.6
.wayrie 14 46.2
.Weakley 20 21.7
'NO:Olte. 26 68.1
:Williamson :: 68 34.6
'Wilson 66 44.4
TéAéSé 5,951 56.5
ation estimates made by Department of Sociology, University of Tennessee,
EST COPY AVAILA ii LE4
The State of the Child in Tennessee, 1994 A Tennessee KIDS COUNT/Tennessee Commission on Children and Youth Report 47

What are the facts about teen pregnancyand teen births?
Not all sexually active teens are at equal risk ofnegative outcomes from their behavior. Youngwomen who engage in sexual intercourse at an earlyage have a higher risk of unintended pregnancy,primarily because they are not using contraception.According to a 1979 Johns Hopkins Survey, only 31percent of girls who had sex before they were 15used any form ofcontraception. Incontrast, for thosewho had first sexbetween 15 and 17years, 52 percentused contraception.Older teens instable relationshipsappeared to beable to use effec-tive contraception.[51
n Tennessee,36.2 percent ofteens in grades 9-12 had sexualintercourse beforethe age of 15,according to theirresponses to the1993 Youth Risk Behavior Survey (YRBS). TheYRBS solicited responses from 38 randomly se-lected Tennessee public schools in the self-reportedsurvey of 3,691 students administered by the Ten-nessee Department of Health in conjunction with theTennessee Department of Education.
Teens are having unprotected sex. The YRBSresults showed that among 12th graders who weresexually active, 10.7 percent used no method ofcontraception. Unprotected sex is a greater risk forAfrican-American teens than white, according to theYRBS results. Overall, twice as many African-Ameri-can teens (17.2 percent) reported having unpro-tected sex compared to white teens (8.9 percent).The results of unprotected sex is apparent in teenpregnancy statistics. In Tennessee during 1991,6,433 girls ages 15-17 became pregnant for a rate of60.9 per 1,000 - slightly less than the 1990 teenpregnancy rate of 63.4.
In Tennessee, a greater percentage of all birthsare to single teens compared to the rest of the U.S.During 1991, 11 .a percent of all births in Tennesseewere to single teens nine percent is the U.S. aver-age. [6] For all girls in Tennessee aged 15-17, bothmarried and single, 4,703 gave birth for a rate of44.5 per 1,000.
Approximately 41 percent of teen pregnanciesresult in abortion in the U.S. [7] Only 26 percent ofteen pregnancies ended in abortions in Tennesseeduring 1991: there were 1,686 induced terminationsfor girls aged 15-17 and a total of 44 fetal deaths.
Girls who are achievers (e.g. who are doing well inschool and expect to go to college), when confrontedwith teen pregnancy, obtain abortions, according to
findings from the National Longitudinal Survey ofYouth. [8] Girls with low basic skill mastery fromfamilies living in poverty are five to seven times morelikely to become mothers during their teen years thangirls with average or better basic skills mastery andnot from families in poverty. Research has shownthat differences among whites, African Americans,and Hispanics were insignificant. It provides "strongconfirmation for the 'underclass' theory that increas-
ing numbers of youngpeople in the UnitedStates are fallingbehind and being castin roles that willprevent them fromever catching up andmaking it. Althoughrace is a factor, poorachieving whiteyoungsters have lowodds for success aswell." [9]
Young women whobecome teen parentsare those who "enterinto sexual relation-ships at very earlyages and use nocontraception. Theyare low achievers in
school, have poor prospects, and low expectationsfor the future. Girls who become teen mothers oftenhave friends whose attitudes are accepting of earlyparenthood. Teen mothers come from poor families,frequently single-headed (mother) households, withlow educational levels, and often their mothers wereteen mothers as well as their older sisters. Girls whobecome teen mothers do not have parents whosupport or monitor them. Their homes are located inpoverty areas ... with high unemployment rates." [10]
What do young people think about teenparenthood?
Most young people view teen parenthood nega-tively. In the 1987 National Survey of Children, fourout of five youths aged 18-22 agreed that becominga teen parent is one of the worst things that couldhappen to a 16-year-old girl or boy. [11]
For young teens who become parents, few want tobe. Eighty-four percent of teen pregnancies for girlsaged 17 and younger were unintended, according tothe national survey. The pregnancies occurredsooner than desired or were not wanted at any time.[12] This is considerably more than older teens aged18-19: approximately two thirds of births to olderteens were described by the teen as having beenwanted, according to the 1988 National Survey ofFamilies and Households. [13)
Because adolescents are still in the process offorming their identities, establishing their self-confi-dence, and "learning how to manage relationshipsand intimacy, sexual activity before a young personis emotionally mature can be a painful and psycho-logically damaging experience." [14]
Tennessee TeenPer 1,000 A
65
60
55
50
Pregnancy Rateges 15-17
1985 1988 1989
Source: Tennessee Department of Health
1990 1991 1992
48 The State of the Child in Tennessee, 1994 A Tennessee KIDS COUNTffennessee Commission ce,CM1dren and Youth Report
J U

Teen Live Birth Rate (Per 1,000 Women Ages 15-17), 1992Note: This rate is Per 1,000, NOT percent.
CountyLive Birth
Number RateAnderson
: 51 37.8:aedford 27 40.8,ifienton 9 29.6:Bledsoe 9 49.2'13tount 68 38.5:Bracliel, 73 43.2'Campbell 38 46.2Cannon 16 77.3'Carroll 20 36.6tarter 27 24.401e* .... 17 28.3....Chester 8 22.6:Claiborne 20 31.2Clay 6 40.0'Cooke 29 46.3O.Offee 44 50.1:Crockett 6 22.9'Cumberland. 31 42.6-DaVids On. 494 49.8Decatur 12 60.6:06Ka lb 18 60.80i0.s!iiii 23 28.3'Dyer 33 43.0:Fayette 41 71.8Fentress 17 49.3
,:Ftanklin 28 34.3Gibson 37 39.2:.G,iles 16 27.3:Grainger 21 60.2'Greene 39 34.1'Grundy 16 48.0, :-Hamblen 41 37.3'Hamilton 260 44.5
Live BirthCounty Number RateHantOdk 6 43.8:Hardernan 11 55 105.2:Hardin 21 43.3:Hawkins 34 35.5
30 69.9Henderson 19 41.9:Henry 15 29.2:Hickman 12 35.0Houston 9 57.3HumiOhieyS 12 38.1Jackson 12 69.0Jefferson 19 23.5Johnson 19 68.6Knox 217 30.6take 11 83.3iaubei'dale 35 67.8Lawrence 33 42.9:Lewis 9 44.3tincoln 20 32.6:toudon 16 25.6.:McMinn 38 41.6'McNairy 29 63.9.Macon 15 46.6:Madison 94 52.9Marion 23 40.0Marshall 18 38.1filaUry 51 46.4Meigs 4 23.5
iMonroe 30 40.0:MontgOniery 72 32.9MOdi'e 5 45.5Morgan 10 25.9Obion 32 46.4
Rate Ranges!9 7 a 30.1
30 2 54 341.9
39 0 io 49.2
49 3 45 105.2
CountyLive Birth
Number Rate1:hiertori 10 27.0Perry 7 51.9Pickett 2 23.0Polk 12 37.7PUtnam 33 25.3Rhea 14 23.6Roane 38 38.9Robertson 26 30.1
-Rutherford 96 30.8Scott 15 35.8Sequatchie 6 30.9Sevier 39 35.7Shelby 1,046 57.7Smith 5 17.2Stewart 7 35.5Sullivan 99 34.6Sumner 78 32.1Tipton 50 57.9Trousdale 7 60.9Unicoi 12 33.6Uniiin 9 29.0Van 13 Uien 1 9.7.Warren 37 52.3Washington.' 59 28.8.Wayrie.'::::.:::':::::::. 13 42.9.wdawdy 14 15.2-...White 21 55.0Williamson 44 22.4WilSon 37 24.9
Pretinttiee.: 4,457 42.3
Note: Rate is based on the 1992 population estimates made by Department of Sociology, University of Tennessee,Knoxville.
51 EST COPY AVAILABLE
The State of the Child in Tennessee, 1994 A Tennessee KIDS COUNT/Tennessee Commission on Children and Youth Report 49

a)
is Teen Substance Abuse Growing?Good data on drug abuse are difficult to gather. Some drug abuse data are gathered from self-
reports, which may be neither objective nor reliable.There are two sources of data regarding drug abuse among teens in Tennessee. One, the 1993
Youth Risk Behavior Survey [1] is a weighted survey of Tennessee high school students that relies on
setf-reporling. The other is records of referrals to juvenile courts.These sources indicate that alcohol is overwhelmingly the drug of choice among Tennessee teens.
Marijuana ran a distant second, and, perhaps surprisingly, cocane and its various derivatives appar-
ently ran a distant third.A review of records compiled by the Tennessee Coundl of Juvenile and Family Court Judges shows
3,549 referrals were made to juvenile courts for alcohol possession, drinking or drunkenness in 1992.During the same year, 613 referrals were made for possession orsale of marijuana, and 599 referrals
were made for possession of controlled substances.The 1993 Youth Risk Behavior Survey shows that 76.8 percent of Tennessee high school students
have taken at least one drink of alcohol, 32.5 percent have smoked marijuana, and 5.1 percent have
taken some form of cocaine.All of these figures are lower than reported in 1990, the first year the survey was conducted. The
1990 Youth Risk Behavior Survey showed that 83 percent of Tennessee high school students hadtaken at least one drink of alcohol, 35.3 percent had smoked marijuana, and 7.1 patent had taken
some form of cocaine.During the 30-day period before the 1993 survey, 42.6 percent had consumed alcohol, 16.5 percent
had smoked marijuana, and two percent had taken cocaine in some form.A comparison with results of the 1990 survey shows reductions in the percentageswho had recently
consumed alcohol and those who had recently taken cocaine, and a small increase in the percentagewho had recently smoked marijuana. During the 30-day period before the 1990 survey, 50.3 percenthad consumed alcohol, 15.5 percent had smoked manjuana, and 22 percent had taken cocaine in
some form.Other drugs were addressed in the surveys in only one question, which in 1993 asked if students
had ever "used any other type of illegal drug, such as LSD, PCP, ecstasy, mushrooms, speed, ice,heroin or pills." In 1993, nearly a fifth 19.5 percent answered that they had. In 1990 152 percentanswered affirmatively to a similarty worded question.
A recent Memphis juvenile court study indicates cocaine may be a larger problem in urban areasthan the statewide risk behavior study shows.
The 1993 Memphis study involved indiscriminate drug testing of juveniles ages 14-17 who werebrought to the Memphis juvenile courts detention center by law enforcement personnel. In his memoaccompanying the study, Judge Kenneth A. Turner, Judge of the Juvenile Court of Memphis andShelby County, writes, "Five percent of detainees were found to be using cocaine ... and 27 percentwere using marijuana ... Juvenile Court arrest statistics, however, reveal far more arrests for cocainethan marijuana trafficking. In 1992 only 122 juveniles were arrested on marijuana charges, whereas496 were arrested on cocaine charges."
As to whether substance abuse has increased among Tennessee teens, juvenile court data showsignificant increases in referrals related to alcohol, marijuana and controlled substances (see chartbelow). However, reporting difficulties and changes in methods of reporting and compiling data overthe years may partially account for increases or decreases in referr& in each offense category.
The data also show reductions in some referral categories. Comparing 1984 referral data to 1992data, reductions occur in sale of controlled substances and driving under the influence. The reductionin DUI referrals may reflect the nation's changing attitudes toward drunken driving. A comparison of1987 referral data and 1992 data shows a significant reduction in possession or sale of marijuanareferrals and only a slight increase in alcohol possession, drinking and drunkenness referrals.
Juvenile Court Referrals For Alcohol/Other Drug OffensesTennessee 1984, 1987, 1991, 1992
Offense 1984 1987 1991 1992Alcohol possession,
drinking, drunkenness2436 3489 3535
.
3549
Sale of controlledsubstances
832 194 707 508
Possession or saleof marijuana
79 1105 438 613
Possession ofcontrolled substances
184 333 367 599
Driving underthe influence
441 530 252 272
Source: Tennessee Council of Juvenile and Family Court Judgesr-; 2
50 The State of the Child in Tennessee, 1994 A Tennessee KIDS COUNT/Tennessee Commission on Children and Youth Report

iccPP'
Isr
Many Teens May Be Infected and Not Know ItAIDS, acquired immune deficiency syndrome, is a result of infection with the human
immunodeficiency virus or HIV. HIV attacks and destroys the immune system, leavingthe body unable to fight sickness and disease. To date, there is no known cure for the disease.
Many teens may be infected with the HIV virus and not know it. Many people in theirtwenties who have the disease now are likely to have been infected as teenagers. [1]
The HIV virus lives in blood, semen, and vaginal secretions and is spread by havingsex with an infected partner; sharing needles with an infected person; from an infectedpregnant woman to her baby; or blood transfusions and blood-clotting products.
For each person reported with AIDS, there are others infected with HIV who have notyet developed a diagnosed AIDS-related condition. Many people with HIV go untestedfor the virus since the early symptoms of the infection are rare and, when present, oftengo unrecognized due to a lack of knowledge regarding risk behaviors, and due to a lackof access to services. [2]
AIDS is spreading more rapidly among young adults in Tennessee than across thenation as a whole. State records show 25 percent (886 cases) of the cumulative reportsof persons with AIDS in Tennessee (3,487 cases) were aged 20-29 at the time of theirdiagnosis. The national average is 19 percent. It is likely that many of these youngadults became infected with HIV as teens since it takes seven to ten years for someoneinfected with HIV to develop an AIDS-related condition.
Females now account for a greater proportion of all AIDS cases reported in Tennes-see than in the past. In 1985, the number of new AIDS cases for females (two cases)represented approximately three percent of the total 79 new cases diagnosed that year.By 1992, "the 79 new cases among women represented 11 percent of the year's 723cases. In Tennessee, the 276 adolescent and adult women represent approximatelyeight percent of all AIDS cases (3,487) reported through October 1993. Nationally,women represent approximately 12 percent of all AIDS cases reported (40,702 of339,250) through September, 1993. [3]
For childbearing women and newborns in Tennessee, HIV infection is a significantproblem, according to the findings of an ongoing statewide survey. If the mother isinfected, the newborn will acquire antibodies indicating the presence of the virus. Theinfant may or may not develop the virus; about 30 percent of infants born to infectedmothers develop AIDS. [4] A recent national study has shown AZT treatments to H IV-infected pregnant women seriously reduced the percentage of babies born with HIV. [5]
Among African-American childbearing women, there is a steady increase in HIVinfections while infection for white childbearing women remains stable, according to theTennessee Department of Health.
Statewide prevalence rates indicate a continued incidence of new HIV infectionsamong childbearing women. The prevalence rate for white childbearing women hasremained unchanged at four HIV-infected women per 10,000 births. There was a signifi-cant increase in the prevalence rate of African-American childbearing women from 16HIV-infected women per 10,000 births from April 1989 through March 1990 to 33 HIV-infectedwomen per 10,000 births from April 1992 through March 1993. [6]
From 1982 through October 1993, 28 teens aged 13-19 at the time of their diagnosiswith AIDS have been reported in Tennessee. Nine of these teens have died. Fifteen (54percent) of the 28 teens were white and 13 (46 percent) were African-American. These28 teens represent 0.8 percent of the total number of persons with AIDS (3,487) re-ported in Tennessee through October, 1993. Nationally, teens aged 13-19 represent 0.4percent of all reported persons with AIDS (1,415 of 339,250) through September, 1993.
Sexually active individuals who have unprotected sex with many partners are atserious risk of contracting the HIV virus. In the 1992 Risk Behavior Survey conductedstatewide with 3,234 teens, 25 percent of the sexually active teens reported having fouror more partners. Of those who had sexual intercourse in the last three months, only 51percent reported using a condom. [7]
The Tennessee Department of Health estimates that at any point in time, 50 percentor more of persons infected with HIV have not been tested. The exact numbers ofTennesseans infected with HIV at any age, therefore, is unknown.
It is estimated that 14,000 persons in Tennessee are currently infected with the HIVvirus, according to the Tennessee Department of Health. In 1993, an estimated 2,000people became infected, and by the end of 1994, a total of 16,000 will become infectedwith HIV, as estimated by projections by the Tennessee Department of Health. Nation-ally, one million persons are estimated to be HIV infected and worldwide estimates are10 to 12 milfion infected persons, according to the Centers for Disease Control.
The State of the Child in Tennessee, 1994 A Tennessee KIDS COUNTifennessee Commission on Children and Youth Report
5 351

Teen STD Rate Shows 23 Percent Improvement
Sexually transmitted diseases (STD) present serious risks to many teens. During
1993 in Tennessee, 7,581 teens aged 15-19 were reported having chlamydia,gonorrhea, syphilis, or chanchroid (a bacterial infection ), for a rate of 2092.0 per
100,000. The 1992 rate was 2158.8 per 100,000.The 1993 STD rate for teens is a 23 percent reduction from the 1991 teen STD
rate (9,664 teens for a rate of 2636.4). An official with the Tennessee Departmentof Health said efforts at the state level to improve clinical services to teens with
STDs, improved medication, and general education about STDs and HIV in the
schools have helped reduce the STD rate.Although the recent decrease in the teen STD rate is good news, there are still
too many teens contracting sexually transmitted diseases.Nationally, three million teens contract an STD annually, according to estimates
by the Centers for Disease Control. One fourth of all adolescents become infectedbefore they graduate from high school. [1]
Adolescents have higher rates of gonorrhea and chlamydia than any other age
group. In some areas of the U.S., up to 40 percent of the teen girls have beeninfected with chlamydia, the most common bacterial STD. More than 200,000teens nationally aged 15-19 were infected with gonorrhea in 1989 and as many as
44,000 were infected with herpes. [2]The syphilis infection rate for young people aged 15 to 19 in the U.S. jumped
from 15 to 25 per 100,000 between 1985 and 1989, according to the Centers for
Disease Control.STDs have tremendous personal and societal costs. They can cause serious,
lasting health problems, including sterility, infertility, cervical cancer, ectopic preg-nancies, infections passed on to newborns, or fetal loss. [3] The national aggre-gated annual costs of herpes, gonorrhea, chlamydia, and pelvic inflammatorydisease are estimated to be a total of $8.4 billion, according to the Centers for
Disease Control.Young women are particularly at great risk for getting an STD. The younger the
age at which a girl first enters into sexual relationships, the more likely that nega-tive consequences will follow. Early sexual initiates have more frequent acts ofcoitus and multiple partners, and are less likely to use effective methods of contra-ception. [4] The earlier the age of first intercourse, the longer the delay in going toa clinic to obtain contraception. [5]
A young girl may be sexually active and not at risk of pregnancy due to heryoung age. Increasing numbers of young girls are having coitus prior to their firstmenstrual periods (menarche). "There has been a downward trend in the age ofmenarche of about four months per decade since 1850." [6] The average age is12 1/2 years. Young girls today are reaching menarche at younger ages than theydid 100 years ago. Additionally, the rate of early initiation into sexual activity hasincreased over the course of the century. [7]
One factor that leads very young people to have sex is involvement with drugs.Research has shown that the higher the stage of drug involvement and the earlierthe reported initiation into drugs, the greater the probability of early sex. [8] Overthe past 20 years, the rates of sexual experimentation, pregnancy, and out-of-wedlock childbearing have increased dramatically among young women ages 15-19. The increased rates in premarital sex and drug use may be related, eitherbecause both are influenced by similar factorsardaecause one constitutes a riskfactor for the other. [9]
52 The State of the Child in Tennessee, 1994 A Tennessee KIDS COUNTaennessee Commission on Children and Youth Report

Sexually Transmitted Disease Rate (for Teens 15-19), 1993Note: This rate is Per 100,000, NOT percent.
CountySTD
Number RatehdarSdri 38 836.8
:Bedford 37 1,666.7Birtton 2 210.1:Bledsoe 1 127.2Blount 19 319.2i,Wad!PY 26 454.4,Campbell 5 185.2Cannon 1 137.6Carroll 13 679.2
.arter 16 435.6:Cheatham 5 247.2:Chester 10 828.5:Claiborne 1 46.3Clay 0 0.0COcke 21 986.4
OffP.O. 20 703.7000. 11 1,234.6
:Ciirriberiarid:: 12 484.5iDaVidSbh 1,282 3,678.1'Decatur 7 1,029.4:De Kalb 2 202.2:Dickson 5 184.7:D er 26 1,037.1:Fayette 45 2,164.5Fentress 0 0.0:Franklin 20 706.2!GibSoh ; 39 1,260.9:Giles 8 402.2Grainger 2 159.0:Greene 37 947.7:Grundy 9 847.5:ft,ariiblen 45 1,198.7:Harhiltorl: 613 3,098.5
CountySTD
Number RateHariCoCk 0 0.0Hardeman 73 4,227.0Hardin 2 123.3Hawkins 14 439.6Ha ood 77 5,263.2Henderson 18 1,198.4Henry 33 1,864.4Hickman 0 0.0Houston 0 0.0Humphreys 2 183.7J4.0.sori. 2 329.5Jefferson 8 285.9Johnson 3 313.2Knox 383 1,549.5Lake 11 2,455.4
:Lauderdale- 40 2,414.0LaWrert.e 14 539.5Lewis 0 0.0Lincoln 2 99.1Loudon 4 185.1McMinn 26 845.8.McNairy 15 1,002.0Macon 1 90.2:Madison 291 4,846.0Marion 8 418.8Marshall 9 564.6Maury 116 3,027.9Meigs 1 164.2:Monroe 4 161.7.Montgomery 95 1,153.8Madr6 1 278.6:Morgan 6 442.8:.Q.b.icjit 68 2,887.5
Rate Ranges
! e 1852
1853 a 464 5
4114.4 Is 1021.4
1021.5 15 52633
CountySTD
Number RateOverton's 1 78.6.Per 3 660.8-Pickett 0 0.0Polk 4 394.9
j3utnarh- 6 128.2iiRhea 6 308.3Roane 19 578.4Ilobertson 32 1,079.3Rutherford 102 928.7Scóft 2 138.9
klualehie : 0 0.0Sevier 10 265.0Shelby 3,279 5,118.4'Smith 6 616.0Stewart 8 1,197.6:Sullivan 92 943.1Su mner 47 562.9:Tipton 80 2,650.8Trousdale 2 495.0Unicoi 4 358.7Union 5 476.2
'Van Biiren 2 581.4:Warren 18 765.0-WaShingtort 63 921.7:Wa9he 2 197.6:Weakley 13 435.7White: 6 438.9:Williamson 46 698.5Wilson 18 351.0
Terineeel 7,581 2,092.0
Note: There are 44 out-of-state STD cases not included in the state total.Rate is based on the 1993 population estimates made by Department of Sociology
5 5AVVA;tit
The State of the Child in Tennessee, 1994 A Tennessee KIDS COUNT/Tennessee Commission on Children and Youth Report 53

Firearms Take an Increasingly Larger Percentage of Teen LivesFirst, a little perspective: More than 99.9 percent of teenagers do not die violent
1 deaths each year in Tennessee. The number of teens who die violently is so rela-tively small that the rate is calculated per 100,000.
The 1992 teen violent death rate, the most recent year for which complete dataare available, is 73.9 per 100,000 .0739 percent. [1]
However, the number of violent teen deaths is growing somewhat compared to a
MCdecade ago. In 1984there were 253 violentteen deaths, comparedto 269 in 1992. [2]
MiCillii.
Sadder yet is the factthat most violent teendeaths could be pre-vented.
In 1992, about 90percent of the 269violent teen deathswere the result of either
4111)
motor vehicle accidentsor were firearm-related.
Specifically, 144 weremotor vehicle accidents,
deaths. [3]and 100 were firearm
The majority of thevehicle accident deathscould have been pre-vented if more of theteens had been wearingseatbelts.
The firearm deathsinclude suicides, homi-
*llcides and accidents.
Limiting access toguns for teens couldclearly reduce thenumber of firearme deaths.
However, the number
a) teens is growing rapidly,of firearm deaths among
as is the percentage ofviolent teen deaths that isdue to firearms.
In 1984, 12.8 percent of0 all teen deaths, including
37 percent were. In 1984,firearm-related. In 1992,
42 of the 328 teen
non-violent deaths, were
Indeaths, including non-violent deaths, werefirearm related. In 1992100 of the 331 teendeaths were firearmrelated. [5]
Forty percent of all teenIPP firearm deaths occurred in Shelby County in 1992, and Shelby County, Davidson,
Hamilton and Knox counties together accounted for about 67 percent of all of thestate's teen firearm deaths. [6]
Leading Causes of Teen Violent Deaths
160
140
120
100
80
60
40
20
0
Tennessee, 1992
144
MotorVehicle
Acddents
Source: Tennessee Department of Health*Includes firearm deaths from Homicide, Suicide, Other Accidents
Homicide
36
20
PER71
100
S..
Suicide Other Accidents Firearms*
Tennessee Teen Firearm DeathsAges 15-19, 1984-1992
100
90
80
70
60
50
40
!Series 11:::1
V.
1984 1985 1986 1987 1988 1989 1990 1991 199242 45 66 68 46 7 82 84 100
Source: Tennessee Department of Health
Percent of Tennessee Teen DeathsCaused by Firearms
1984 and 1992
ONon-Flrearm FIrearm
Source: Tennessee Department of Health
5 654 The State of the Child in Tennessee, 1994 A Tennessee KIDS COUNT/Tennessee Commission on Children and Youth Report

Teen Violent Death Rate (Per 100,000 Teens Ages 15-19), 1992Note: This rate is Per 100,000, NOT percent.
nom
CountyViolent Death
Number RateAnderson 2 43.7.Bedford 1 44.8Benton 0 0.0:Bledsoe 0 0.0riliotirit 4 66.8'._Pradley. 4 68.9Campbell 2 72.4'Cannon 0 0.0*Carroll 2 103.4Carter 1 26.7:Cheatho: 1 50.1Chester 0 0.0Claiborne 0 0.0Clay 1 199.6Cocke 1 46.0tciffee 1 35.2sCrockett 1 110.5bumberland 3 120.3Davidson 27 77.6Decatur 0 0.0DeKelb 0 0.0Dicke On 0 0.0D er 1 39.5Fayette 3 143.3Fentress 1 84.5Franklin 1 34.9Gibson 3 95.3Giles 3 150.2Grainger 2 156.5Greene 4 100.5Grundx 0 0.0
I Hamblen , 3 78.1Hamilton 13 64.8
CountyViolent Death
Number Rate.HancoCk 1 213.2.Hardeman 1 57.4:Hardin 0 0.0.Hawkins 4 122.6Haywbod 0 0.0:Henderson 3 198.2'Henry 2 111.7Hickman 1 85.5:Houston 0 0.0'HU triphreY&::: 0 0.0njaakiiii 1 161.0:Jefferson 2 70.1'Johnson . 0 0.0Knox 11 44.4.Lake 2 430.1'l..ailderdale ; 0 0.0'Lawrence 3 115.4Lewis 0 0.0
.Lincoln 4 199.4Loudon 1 46.0.McMinn 1 32.1.McNairy 2 131.8:Macon 1 89.8'Madison 2 33.3:Marion 2 103.0;Marshall 1 63.1'MaurY 4 105.2-Meigs 1 161.0:Monroe 5 198.2..Montgomery 6 74.0Atibre 1 272.5Mor an 0 0.0Obion 2 83.0
Rate Ranges
0 so 0
0.1 so 4111.0
dill to 110.5
1104 to 430.1
CountyViolent Death
Number Rate:OVertbn 0 0.0'Per, 1 217.9'Pickett 0 0.0polk 1 94.6Putnam 3 64.11:ROPP 3 150.9*Roane 1 29.7Robertson : 2 68.0l'iutherford 5 47.2
,S6Oft 0 0.0,iSequ4tchie, 0 0.0'SeVier 3 79.9Shelby 67 104.5Smith 2 206.2Stewart 0 0.0SUlliVan , 2 20.0Sumner 5 60.7Tipton 1 33.6Trousdale 1 246.9Unicoi 1 87.9Union 3 287.6Van Buren 0 0.0Warren 2 84.4.Washingtom: 6 86.4Wayne 1 97.6Weakley 0 0.0:White 1 72.5.:.1/Villiarrison 3 47.3:Wilson 6 118.5
Tenfiegiee 269 73.9
Note: Rate is based on the 1992 population estimates made by Department of Sociology, University of Tennessee,Knoxville.
U.S. rate is for 1991 and from Kids Count: State Profiles of Child Well-being, The Annie E. Casey Foundation, 1994Baltimore, MD.
The State of the Child in Tennessee, 1994 A Tennessee KIDS COUNT/Tertnessee Commission on Children and Youth Report
BEST IPY AM Ant IP55

SUMMARY CHAPTER 2: HEALTH
Tenn CareMore than 50,000 children ages birth to who were not eligible to be covered under Medicaid are covered by TennCare.
More than 103,000 girls and women ages 14 to 44 roughly childbearing age - are now covered and have greater access to
prenatal care.A total of 385,938 people who were uninsurable or uninsured in Tennessee now have medical insurance through Tenn Care.
Prenatal CareNearly a third of all births in Tennessee in 1992 lacked adequate prenatal care.There are two distinct types of women who fail to get adequate prenatal care: those who make little or no attempt to get prenatal care; and
those who try and fail.
Low Birth WeightBoth the number and percent of babies born in Tennessee weighing less than 5.5 pounds increased from 1990 to 1992. The
percentage increased from 8.2 percent of all births in 1990 to 8.5 percent in 1992.The number of low-birth-weight babies born in Tennessee grew from 6,160 in 1990 to 6,265 in 1992 an increase of 105.Forty-one counties saw improvements in low-weight births.
Infant MortalityTennessee's infant mortality rate has more or less declined steadily during the past two decades from a rate of 20.3 per
1,000 in 1973 to 9.4 in 1992.In 1973, 1,303 Tennessee infants died. In 1992, 691 died.The latest figures show the downward trend may be accelerating. From 1990 to 1992 the number of infant deaths in Ten-
nessee decreased by 79 deaths from 770 in 1990. The rate has declined from 10.3 per 1,000 deaths in 1990 to 9.8 in 1992.
ImmunizationsA survey of 1,690 children aged two years old conducted by the Tennessee Department of Health (TDH) revealed a 72
percent statewide vaccine completion rate in 1993.The 1993 immunization rate of 72 percent was a slight increase (1.6 percent) over 1992, but considerably less than the year
2000 goal of 90 percent completion rates.
Child DeathsThe Tennessee death rate among children ages 1 through 14 years old in 1980 was 44 per 100,000. In 1992, the rate was
31.9 per 100,000.In 1990, 333 Tennessee children died, compared to 306 in 1992 an 8.1 percent reduction.Tennessee ranks 39th in the nation in child deaths.The primary killer of children is accidents. About 41.5 percent of Tennessee's child deaths were caused by accidents in
1992 127 of 306 deaths.
Teen PregnancyTennessee's 1992 adolescent pregnancy rate dropped to a level not reported since the mid-1980s. The pregnancy rate for
10-17 year olds decreased seven percent to 23.8 pregnancies per 1,000 females, down from 25.6 in 1991.Decreases occurred in rates for both white and non-white females from 1991 to 1992. The white rate declined 7.9 percent
from 19.1 to 17.6. The non-white rate declined from 48.9 to 45.9, a decrease of 6.1 percent. The most dramatic decreaseoccurred in the white 15-17 age group, which decreased from 46.5 to 42.8 an 8 percentdecrease.
Drug AbuseAlcohol is overwhelmingly the drug of choice among Tennessee teens. Marijuana ran a distant second, and, perhapssurprisingly, cocaine and its various derivatives apparently ran a distant third.
The 1993 Youth Risk Behavior Survey shows that 76.8 percent of Tennessee high school students have taken at least onedrink of alcohol, 32.5 percent have smoked marijuana, and 5.1 percent have taken some form of cocaine.
The 1990 Youth Risk Behavior Survey showed that 83 percent of Tennessee high school students had taken at least onedrink of alcohol, 35.3 percent had smoked marijuana, and 7.1 percent had taken some form of cocaine.
STDsDuring 1993 in Tennessee, 7,581 teens aged 15-19 were reported having chlamydia, gonorrhea, syphilis, or chanchroid (a
bacterial infection ), for a rate of 2092 per 100,000.The 1993 STD rate for teens is a 23 percent reduction from the 1991 teen STD rate (9,664 teens for a rate of 2636.4).
Violent DeathsThe 1992 teen violent death rate, the most recent year for which complete data are available, is 73.9 per 100,000 .0739
percent.The number of violent teen deaths is growing compared to a decade ago. In 1984 there were 253 violent teen deaths,
compared to 284 in 1991.In 1991, about 85 percent of the 284 violent teen deaths were the result of either motor vehicle accidents or were firearm-
related -158 were motor vehicle accidents, and 84 were firearm deaths.The number of firearm deaths among teens is growing rapidly, as is the percentage of violent teen deaths that is due to
firearms.In 1984, 12.8 percent of all teen deaths, including non-violent deaths, were firearm-related. In 1992, 30.2 percent were. In
1984, 42 of the 328 teen deaths, including non-violent deaths, were firearm related. In 1992 100 of the 331 teen deaths werefirearm related. 5856 The State of the Child in Tennessee, 1994 A Tennessee KIDS COUNT/Tennessee Commission on Children and Youth Report

Chapter 3Education
59
The State of the Child in Tennessee, 1994 A Tennessee KIDS COUNT/Fennessee Commission on Children and Youth Report 57

d
a
Net EnrollmentDuring the last four years, there have been many changes in
Tennessee's schools but what has remained constant is the increase instudent enrollment. Overall, there has been a steady, moderate in-
crease in students enrolled in Tennessee public schools. From 1990 to1993, there has been a six percent increase in net enrollment from858,991 students in 1990 to 906,451 students in 1993.
PromotionThe four-year trend in grade promotions is similar to net enrollment.
There has been a continual, moderate increase in the number of stu-dents promoted to the next grade. From 1990 to 1993 there was a three
percent increase in grade promotions from 744,484 promotions in 1990
to 772,730 in 1993. The state performance goal for promotion to thenext grade from kindergarten through eighth grade is 97 percent.
RetentionFor students who fail to be promoted and are retained in the same
grade, there was a seven percent increase in 1993 after two years ofcontinuous decline. In 1993 there were 46,299 students retained com-pared to 43,176 in 1992. From 1991 to 1992 there was a two percentdecline from 44,101 students retained in 1991 to 43,176 retained in1992. There was a three percent decline from 1990 to 1991 with 45,874students retained in 1990 and 44,101 retentions in 1991.
The greatest increase in retentions was at the high school level. There
was a 22 percent increase in the number of high school students re-tained from 1992 (18,599) to 1993 (46,299). Ninth grade had the great-est number of retentions in 1993 with 9,432 students retained a 35percent increase from 1992 (6,963 retained). Tenth grade, the secondhighest, had 6,384 students retained - a 25 percent increase from 1992(5,102 retained). Eleventh grade had a 14 percent increase in retentionsfrom 1992 (3,535 to 1993 (4,042).
GraduationFrom 1990 to 1994, there has been a 21 percent decline in high
school graduates with 55,582 graduates in 1990 to 43,564 graduates in
1993. During this four-year period, the most dramatic decline occurredbetween 1991 and 1992 when there was a 19 percent decline in oneyear's time. In 1991, there were 54,595 high school graduates and only44,081 graduates in 1992.
In 1993, there were 34,708 high school students graduating withregular diplomas. Students receiving the regular high school diplomaare required to earn 20 units of credit and pass the Tennessee Profi-ciency Test. The regular diploma is awarded to special education stu-dents who have completed an individualized educational program and
have passed the Tennessee Proficiency Test.
6 058 The State of the Child in Tennessee. 1994 A Tennessee KIDS COUNT/Tennessee Commission on Children and Youth Report

During 1993, there were 7,295 honors diplo-mas, 1,295 special education diplomas, and 285certificates of attendance.
School SuspensionsIncidents of school suspensions have risen
dramatically with a 49 percent increase from1990 (71,498) to 1993 (106,756). Reasons forsuspensions as reported to the Department ofEducation include: absenteeism, tardiness andtruancy, immoral/disreputable conduct, personalviolence, fighting among students, damage toschool property, alcohol use, drug use, theft,extortion or gambling, tobacco products, firearmor dangerous weapon.
Although there was a dramatic increase insuspensions from the school year 1989-90 to1992-93, the overall trend during this timeshowed a gradual increase each year since 1990.There was a nine percent increase from 1990(71,517 suspensions) to 1991 (78,517 suspen-sions). The increase in school suspensionsjumped 12 percent between 1991 and 1992(88,625 suspensions). Between 1992 and 1993,the increase leaped to 20 percent.
School ExpulsionsThe number of students expelled from school
has increased 78 percent in the four-year periodbetween 1990 and 1994. The reasons for schoolexpulsions are the same as those listed in thisreport for school suspensions.
From 1990 to 1991, there was a significant 15percent increase from 397 expulsions in 1990 to440 in 1991. Between 1991 and 1992, expulsionsdeclined three percent. From 1992 to 1993, therewas a dramatic 66 percent increase from 426 in1992 to 709 school expulsions in 1993.
Among the reasons for expelling a child fromschool, those reasons which have significantlyincreased from 1991 to 1993 include: absentee-ism, tardiness, and truancy; immoral, disrepu-table conduct; personal violence; fighting amongstudents; and possession of a firearm or danger-ous weapon. EST COPY AVM LA
Four-Year Trend in Tennessee High School Graduates,1990-1993
70,000
60,000
50,000
55,582 54,595
44,081 43,564
40,000
30,000
20,000
10,000
01990 1991 1992 1993
SOurce: Tennessee Department of Education Annual Statistical Reports, 1990 - 1893
Four-Year Trend In incidents of Suspensions, 1990-1993
120,000
100,00088,625
106,756
80,000 78,51771,498
60,000
40,000
20,000
01990 1991 1992 1993
Source: Tennessee Department of Education Annual Statistical Reports, 1980 - 1993
Four-Year Trend in School Expulsions, 1990 to 1993
800
709
600
440 426400
397
200
01990 1991 1992 1993
Source: Tennessee Department of Education's Annual Statistical Reports, 1990 - 1993.
BLE
The State of the Child in Tennessee, 1994 A Tennessee KIDS CO ennessee Commission on Children and Youth Report 59

Students Promoted Without Mastering Grade-Level Skills
TEST RESULTS ON GRADE-LEVEL SKILLSMany Tennessee students are not mastering grade-level skills, according to the
Tennessee Comprehensive Achievement Program (TCAP) test results. This indicates
that many students are promoted, yet are unprepared for the next grade.
The part of TCAP that measures grade-level skills, the criterion-referenced portion,
reflects the Tennessee math and language arts curricula, and includes only grade-level
test items. It was developed specifically for Tennessee students in grades two through
eight.For language arts skills, 57.1 percent of students in grades two through eight mastered
their grade-level language arts skills on the 1994 TCAP exam. Third grade had the
highest percent of student mastery in language with 68.2 percent mastering third gradelanguage skills. Although eighth grade had the lowest percent of student grade-level
mastery with 48.4 percent mastering eighth grade skills, their 1994 TCAP scores im-
proved since the 1993 TCAP when only 47.9 percent mastered grade-level skills.
For math skills, 46.8 percent of students in grades two through eight mastered their
grade-level math skills in 1994. This is an increase in 3.5 percent from 1993 when the
average was 44.3 percent. Second grade had the highest percent of student grade-
level math mastery with 84.7 percent mastery. This is a decline since 1993 when second
grade averaged 86 percent mastery. Although seventh grade had the lowest percent ofstudents mastering grade-level math skills with 28 percent mastering seventh grade-
level skills, this was an increase since 1993 when only 24.9 percent achieved mastery.
A goal of the 21st Century Schools Plan is for all students to perform at grade level by
the year 2000. To achieve this goal, efforts must be made to study the state curriculum,
how it is taught and how it is tested.Continuous curriculum refinements should be made. It is also essential that the most
effective instructional strategies for teaching grade-level skills to all students be identi-
fied. These strategies could be presented during teacher inservice training.TCAP results should be analyzed to ensure that TCAP is a reliable and valid measure
of what students have learned from the state curriculum. Consideration should be given
to testing conditions such as when and how TCAP is administered. When a test is given
is a critical factor in getting optimum student achievement and should be consideredcarefully by teachers and principals. A test administrator's attitude about or behaviorduring testing may unduly influence test results. A test administrator who is very anxious
about the test results may inadvertently make the students anxious. Test anxiety has
been shown to have a negative effect on test results.
TEST RESULTS FOR NATIONAL COMPARISONOverall, Tennessee students are performing within the average range compared to
other students in the nation, according to the 1994 TCAP results. That portion of TCAP
used for national comparison is the norm-referenced test for students in grades two
through eight and ten. It reflects as comprehensively as possible the curricula of schools
throughout the country.Norm-referenced test items on TCAP include those at grade-level skills as well as
those above and below grade level. These test items assess student knowledge in math,reading, language, science, social studies, study skills and spelling.
For five years, Tennessee students have scored at or above the average range on 98
percent of the nationally normed test items. In technical terms, the scores clustered inthe 5th and 6th stanines. Stanine scores of 1, 2, and 3 are considered below average; 4,5, and 6 are average; and 7, 8, and 9 are above average.
Nationally, 23 percent of the student population falls in the above average stanines on
each subtest. The percent of Tennessee students scoring in the above average range ishigher than the national average in 85 percent of the subtests.
To summarize, a goal of the 21 Century Schools program is to achieve an average
60 The State of the Child in Tennessee, 1994 A Tennessee KIDS COUNTifennessee on Children and Youth Report
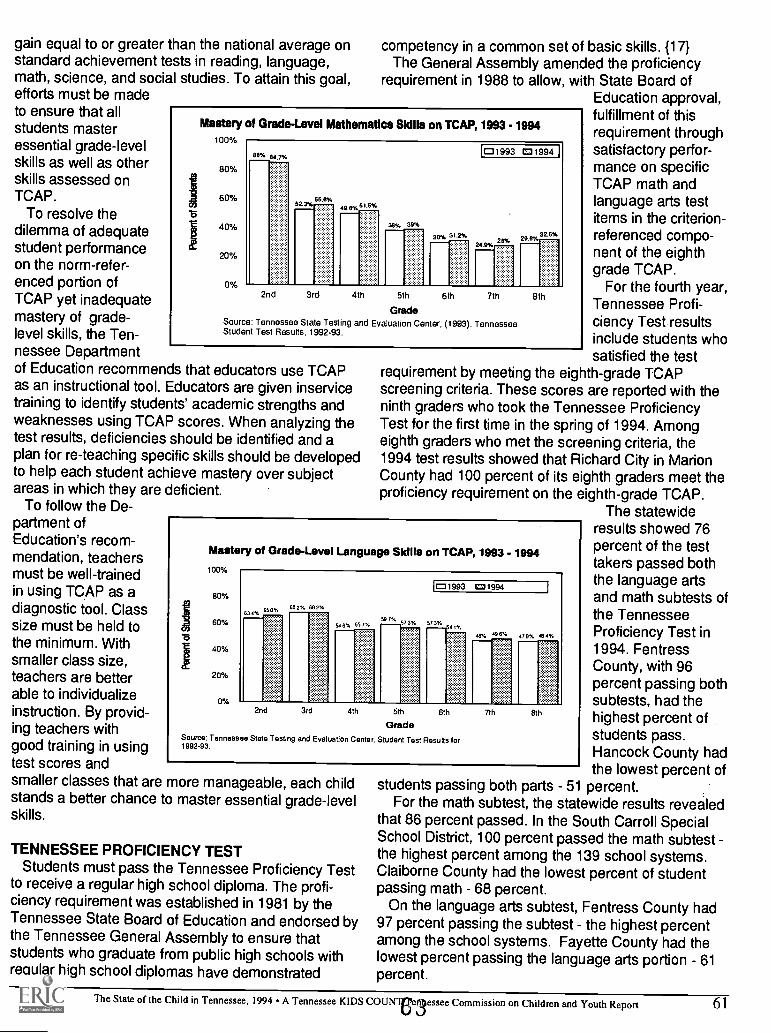
gain equal to or greater than the national average onstandard achievement tests in reading, language,math, science, and social studies. To attain this goal,efforts must be madeto ensure that allstudents masteressential grade-levelskills as well as otherskills assessed onTCAP.
To resolve thedilemma of adequatestudent performanceon the norm-refer-enced portion ofTCAP yet inadequatemastery of grade-level skills, the Ten-nessee Departmentof Education recommends that educators use TCAPas an instructional tool. Educators are given inservicetraining to identify students' academic strengths andweaknesses using TCAP scores. When analyzing thetest results, deficiencies should be identified and aplan for re-teaching specific skills should be developedto help each student achieve mastery over subjectareas in which they are deficient.
To follow the De-partment ofEducation's recom-mendation, teachersmust be well-trainedin using TCAP as adiagnostic tool. Classsize must be held tothe minimum. Withsmaller class size,teachers are betterable to individualizeinstruction. By provid-ing teachers withgood training in usingtest scores andsmaller classes that are more manageable, each childstands a better chance to master essential grade-levelskills.
competency in a common set of basic skills. {17}The General Assembly amended the proficiency
requirement in 1988 to allow, with State Board ofEducation approval,fulfillment of thisrequirement throughsatisfactory perfor-mance on specificTCAP math andlanguage arts testitems in the criterion-referenced compo-nent of the eighthgrade TCAP.
For the fourth year,Tennessee Profi-ciency Test resultsinclude students whosatisfied the test
requirement by meeting the eighth-grade TCAPscreening criteria. These scores are reported with theninth graders who took the Tennessee ProficiencyTest for the first time in the spring of 1994. Amongeighth graders who met the screening criteria, the1994 test results showed that Richard City in MarionCounty had 100 percent of its eighth graders meet theproficiency requirement on the eighth-grade TCAP.
The statewideresults showed 76percent of the testtakers passed boththe language artsand math subtests ofthe TennesseeProficiency Test in1994. FentressCounty, with 96percent passing bothsubtests, had thehighest percent ofstudents pass.Hancock County hadthe lowest percent of
students passing both parts 51 percent.For the math subtest, the statewide results revealed
that 86 percent passed. In the South Carroll SpecialSchool District, 100 percent passed the math subtestthe highest percent among the 139 school systems.Claiborne County had the lowest percent of studentpassing math 68 percent.
On the language arts subtest, Fentress County had97 percent passing the subtest the highest percentamong the school systems. Fayette County had thelowest percent passing the language arts portion 61percent.
Mastery 01 Grade-Level Mathematics Skills on TCAP, 1993 - 1994100%
80%
60%
40%
20%
0%
88% 84.7%
55.8%2.3%,777
38% 36%312%
CI 1993 r:3 1994
2nd 3 d 4th 5th
GradeSource: Tennessee State Testing and Evaluation Center, (1993). TennesseeStudent Test Results, 1992-93.
6th 7th 8th
Mastery of Grade-Level Langu
100%
80%
60%
40%
20%
/v
age Skills on TCAP, 1993 - 1994
63 4%
01993 011994
60 2% 68 2%
49 6% 47 g% 48 4%
2nd 3rd ath 5th 61
GradeSource: Tennessee State Testing and Evaluation Center. Student Test Results for1992-93.
7th 81
TENNESSEE PROFICIENCY TESTStudents must pass the Tennessee Proficiency Test
to receive a regular high school diploma. The profi-ciency requirement was established in 1981 by theTennessee State Board of Education and endorsed bythe Tennessee General Assembly to ensure thatstudents who graduate from public high schools withregular high school diplomas have demonstrated
The State of the Child in Tennessee, 1994 A Tennessee KIDS COUN1Ce3essee Commission on Children and Youth Report 6 1

State ACT Scores Near National AverageThe majority of college-bound students in Tennessee take the American College
Testing (ACT) Program for admission to public colleges and universities. The ScholasticAptitude Test (SAT), a college admissions test used primarily by non-public colleges and
universities, is not as widely administered in Tennessee. Only 13 percent ofTennessee's graduating seniors took the SAT in 1993.
The ACT is a complex and comprehensive assessment that provides an amazing
amount of information on Tennessee high school students who may enter colleges anduniversities. The results of the ACT reveal how college-bound students in Tennessee
compare to their peers across the nation. The assessment measures student achieve-
ment in skills developed in high school. Background information on the students, their
interests in particular careers, and results on their academic assessments are provided.Additionally, the ACT score is predictive of a student's ability in college-level courses.
There are three components of the ACT. The first part is comprised of four subteststhat measure academic ability: English, mathematics, reading, and scientific reasoning.The ACT also has a lengthy Student Profile section that provides background informa-tion on the students taking the ACT. The third portion of the assessment is the InterestInventory that measures students' preferences and categorizes them into general career
or occupational areas.Information from the ACT provides data for students in their educational and voca-
tional planning and provides equal educational opportunities for students. Forpostsecondary institutions, ACT data aids in advisement and counseling inpostsecondary planning, college recruitment and retention, and helps simplify admission
systems.A Profile of Tennessee Students
In 1993, 31,064 juniors and seniors took the ACT in Tennessee out of the total juniorand senior classes' enrollment of 108,669 students. Seventy-six percent of these stu-
dents were seniors and 23 percent were juniors. Nationally, 65 percent were seniors
and 34 percent were juniors.Regarding ethnic origin, 73 percent of the Tennessee students were white compared
to 71 percent nationally. Fifteen percent of the Tennessee test takers were AfricanAmerican compared to nine percent nationally. Three percent of the students wereeither Native Americans, Asians or members of other ethnic groups in Tennessee,compared to 6 percent nationally. Nine percent of the students in Tennessee did notrespond to the question of their ethnic origin.
A standard score scale is used for reporting scores on the four ACT academic tests.On the four separate academic tests, the statewide average composite score was 20.2.
The national composite average was 20.7.A profile of the 31,064 Tennessee students who took the ACT in 1993 shows that
many students who took the assessment have high academic aspirations. Forty-fivepercent reported seeking either a graduate degree or a professional degree the na-tional average was 44.2 percent. Thirty-four percent want a bachelor's degree in Ten-
nessee compared to 19.7 percent nationally. Other students were pursuing eithervocational/technical training, associate's degrees, or other postsecondary training.
Eighty-five percent of the Tennessee students reported their grade point averageabove 2.0 compared to 87 percent nationally. Sixty-eight percent reported being in thetop half of their graduating classes with 35 percent in the top quarter. Nationally, 72percent reported being in the top half of their classes with 40 percent in the top quarter.
Fifty percent of the Tennessee students reported an estimated annual family incomegreater than $30,000 compared to 56 percent of the students in the rest of the country.Seventy-six percent of the Tennessee students expressed the need for financial aid in
college while 79 percent of students nationally expressed the same need. Sixty-twopercent of the Tennessee students stated they needed to find work while in college tohelp meet their expenses, compared to 66 percent of students nationally.
62 The State of the Child in Tennessee, 1994 A Tennessee KIDS COUNT/Fennessee Commission ildren and Youth Report

Average ACT Composite* Scores, 1993
CountyACT Composite
Number Averagendeiton 500 21.4
Bedford 217 20.3Benton 86 19.7
:Bledsoe 40 18.8`..Blo-unt 506 21.1.8.rad!Py 418 20.0.Campbeii 137 18.7Cannon 45 19.2Carroll 202 19.8:Carter 277 19.8'Cheatham 137 20.0Cheater 80 22.0Claiborne 135 19.6'Clay 42 19.4Cooke 159 19.6Ooffae 293 20.9:Crockett 45 18.9Cumberland 161 20.8:Davidson 2,695 20.4
ecatur 46 18.7beKalb-'Dickson
74 19.2202 20.1
by er 228 19.6Fayette 150 17.5:Fentress 96 19.8Franklin 249 19.9Gibaon 295 19.9Giles 170 19.6Grainger 57 18.9Greene 317 19.6Grundy 83 18.6.Hariiblen 329 19.9
1,896 20.8
CountyACT Composite
Number AverageHanCOok 22 0.0:Hardeman ; 154 18.6:Hardin 150 19.7:HaWkins 227 19.9;fiayiiiood 118 18.1:Henderson i: 135 20.2
enry 160 19.7:HiCkman 87 20.0:HOUSton 40 18.6:HdriiPhreie::: 120 20.0Jatkw, 39 20.6Jefferson 193 19.9Johnson 40 19.0:Knox 1,953 21.0Lake 24 0.0:Lauderdale 140 19.1:Lawrence 200 20.1:Lewis 64 19.6Lincoln 151 19.9:Loudon 214 19.9:McMinn 259 20.2;McNairy 152 20.6-tviacon 92 19.5:Madison 564 20.2:Marion 133 19.4',..Marshall 141 19.6:Maury 408 19.9:Meigs 51 18.7.tAonroe 194 19.2:MolitOOMery 540 20.2Madre 20 0.0
'Mar an 87 19.0Obion' 237 20.3
Average Scores
Net Available
17.5 to It/
19.3 to 19.7
19.5 So 20.2
20.3 to 22.0
CountyACT Composite
Number Average:OVertori 87 19.5:Perry 39 19.3:Pickett 24 0.0:Polk 74 20.2.putnam 324 20.9'Rhea 137 20.2'Roane 303 20.3:Robertson 306 19.7:Rutherford 787 20.6Scott 129 20.0Se uatchie 58 19.0Sevio 358 20.5Shelby 6,167 19.7Smith 102 19.4Stewart 58 19.6Sullivan 1,013 21.1Sumner 793 20.6Ti ton 276 19.3Trousdale 34 19.9Unicoi_ 112 19.1thiiori 48 18.9:Van Buren 11 0.0Warren 162 20.6Washington:i 489 20.9Wa ne"" 65 20.0Weakley 198 19.2.White 106 19.0Williamson : 805 21.9Wilatin 508 19.7
:17.6.6ife-aSo'6:::::::: 31,064 20.2
875,603 20.7Note: Average composite score is the average of the four ACT subtests; reading, mathematics, English, andscientific reasoning.Source: Department of Program Evaluation and Institutional Research Services, American College Testing, 1994.
65The State of the Child in Tennessee, 1994 A Tennessee KIDS COUNT/Tennessee Commission on Children and Youth Report 63

services in Tennessee public schools 17.6 percent of the total school.population.This figure includes 18,626 gifted children. A gifted child is one whose intellectual
During the 1992-93 school year, 159,513 children received special educationUse of Special Education Services Increasing
abilities and potential for achievement are so outstanding that special provisionsare required to meet the established educational needs.
Compared to 1990-91 school year, the total number of children receiving specialeducation services during 1992-93 represents a 13 percent (140,967 students)increase in number of students served. When looking at specific handicappingconditions to account for the difference in these two school years, dramafic in-creases are apparent in the number of children served with health impairmentsand severe emotional disturbances.
There was a 66 percent increase in health impaired children served from 1990-
91 (2,984 children) to 1992-93 (4,951). Health impairment refers to a child whohas "limited strength, vitality or alertness due to chronic or acute health problems,such as heart condition, tuberculosis, rheumatic fever, nephritis, asthma, sickle cell
anemia, hemophilia, epilepsy, lead poisoning, leukemia, or diabetes which ad-versely affects his or her educational performance. [1]
There was a 27 percent increase in the number of children with severe emo-tional disturbances from 1990-91 (2,922 children) to 1992-93 (3,733). For a childto receive services for severe emotional disturbances, the chil+:1 must exhibit one ormore of the following:
1. Inability to learn which cannot be explained primarily by intellectual, sensory,health, or specific learning disability factors.2. Inability to build or maintain satisfactory interpersonal relationships with peers,
teachers, and other significant persons.3. Inappropriate types of behavior or feelings under normal circumstances.4. General pervasive mood of unhappiness or depression.5. Tendency to develop physical symptoms or fears associated with personal or
school problems. [2]One reason for the
increase is more chil-dren are being identi-fied as being in need ofspecial help. Earlyidentification is neededlo detect a child'sdisability prior to schoolage so that appropriateservices can be pro-vided for the child and,if warranted, for thefamily. Longitudinalresearch has demon-strated that the earlier achild's disability isidentified and appropri-ate services are pro-vided, the less exten-sive are the problemscaused by the disabil-ity." [3]
Chilci identification is the first step toward providing full and appropriate servicesfor children with disabilities. Local school systems are required to identify, locate,and evaluate all children within their jurisdictions, ages birth through 21, who maybe in need of special education and related services.
Most children with obvious and/or severe disabilities are located and "identifiedeasily because they have been served by local treatment and health care agen-cies. In planning a child-find and public awareness campaign, special effort shouldbe made to find hard-to-reach children whose parents may not be aware of theneed for, and availability of, early intervention services. Methods should also beplanned to reach persons in the community who may not understand Englishlanguage materials and broadcasts and persons living in rural or isolatedgeo-graphic areas." [4]
Eery Intervention Program Participants by Tennessee Region, December 1, 1993
Children Aged 0-3 Receiving Services
400
300
200
100
0FT ET SE UC GN SC NW SW MD
Tennessee Regions (see map In appendix)Source: Tennessee Department of Education
ClAge 0-1
0Age 1-291Age 2-3
G
64 The State of the Child in Tennessee, 1994 A Tennessee KIDS COUNT/Tennessee Commission on Children and Youth Report

Percent of Students Receiving Special Education, 1992-1993
CountySpecial Education
Number PercentAnderson 3,495 26.2:Bedford 1,146 18.9:Benton 515 19.3:Bledsoe 486 26.8'..Blo, grit 3,032 18.8'Bradley 2,828 19.5:tampbeil 1,284 19.0.Cannon 378 18.9:Carroll 898 16.6Cartei 2,160 24.4.Ch eatharh 844 13.5:Chester 387 15.8...Claiborne 1,060 20.5:Clay 234 17.4.Cocke 1,056 18.5:Coffea 2,319 25.8.Crockett 370 14.1'Cu mberlind. 1,073 15.8.DaVidSon 10,427 14.4Decatur 364 19.3DeKalb 383 13.4Dickson 1,629 21.8D er 1,317 18.4Fa ette 1,074 20.9Fentress 439 17.8Franklin 1,138 17.9Gibson 1,472 16.6Giles 955 19 .6Grainger 675 20.9Greene 2,048 21.5Grundy 814 30.3Hamblen 2,292 23.7Haiiiiltaii 7,511 15.3
CountySpecial Education
Number PercentHatiCOOk 295 22.8Hardernan 897 16.8Hardin 839 19.9Hawkins 1,527 19.9Ha pod 569 13.4Henderson 950 21.7Hen 987 19.0Hickman 775 23.9Houston 243 17.4Hu mph reys 501 16.0Jackson 232 14.7Jefferson 1,027 17.0Johnson 508 20.0Knox 9,707 17.5Lake 181 14.3Lauderdale 935 17.6Lawrence 1,181 17.2Lewis 331 16.3Lincoln 992 17.3Loudon 1,248 20.2McMinn 1,980 23.1McNairy 729 16.9Macon 406 12.6Madison 2,662 17.7Marion 1,027 19.6Marshall 997 22.2Maur 1,973 16.9Meigs 502 29.8Monroe 1,056 17.0Montgomery 3,180 15.4MOb.re 131 13.4.Mbrgan 721 20.1Obion 1,088 18.0
Source: Tennessee Department of Education.
Percent Ranges
10.0 to 14.4
16.7 to 18.9
19.0 to 21.1
21.2 to 31.7
CountySpecial Education
Number PercentOitertonPerry
734 23.3279 22.9
Pickett 173 19.8PolkPutnam
451 18.71,580 17.3
Rhea 659 13.5Roane 1,754 21.1Robertson 1,831 20.3Rutherford 4,401 16.5Scott 759 16.6Seq6atai,le, 540 31.7Sevier 1,907 18.4Shelby 19,539 12.4Smith 302 10.0Stewart 386 22.1StillOn 5,953 23.9Sumner 4,843 23.0Ti ton 2,057 21.2
1Trousdale 175 14.6Unicoi 751 26.5Union 525 20.1Van Buren 206 23.8Warren 1,305 19.7Wahihgton. 2,474 16.6WaYild 611 21.0Weakley 824 15.8;White 1 730 19.9Williamson 3,306 20.2
Wilson 2,039 14.1
.Tennesiee 157,574 17.4
6 7 BEST COPY AMIABLE
The State of the Child in Tennessee, 1994 A Tennessee KIDS COUNT/Tennessee Commission on Children and Youth Report 65

Number of Dropouts in Tennessee DecreasingHigh school dropouts, as reported here, are the percent of students who drop out
of grades 9-12 in a calendar year. The dropout rate is calculated by dividing the
number of dropouts within the year by the net student enrollment at the end of the
school year.Getting an education is the principal route to a satisfying adult life in the U.S.
Increasingly, failure to complete school is a 'powerful precursor of long-term disad-
vantage." [1]Dropouts face serious, long-term economic consequences resulting from their
decisions to quit school. They experience higher job turnover, unemployment, and
earn much less than their counterparts who either finished high school or college.
The unemployment rate in 1990 for dropouts (8.5 percent) was almost two times
greater than the unemployment rate for individuals with a high school diploma (4.9
percent). [2] Each male dropout will earn on average $260,000 less and pay
$78,000 less in taxes during his lifetime than those who graduate from high school.
For a femaledropout, thefigures are$200,000 and$60,000,respectively.
[31Gov. Ned
McWherterinitiated two ofthe threerecentlyenacted lawsto help keepteens inschool untilthey graduate.A 1992 lawwas enacted which increased the age of mandatory school attendance from age 16
to 17. [4] The other two laws use the driver's license as an incentive for students to
stay in school. A law enacted in 1990 denies a learner's permit or driver's license to
any teen under 18 years old who drops out of school and is not pursuing a general
educational development (GED) certificate. [5] The second law using the driver's
license incentive was passed in 1994. It requires that dropouts returning to school
must meet specific academicperformance standards to get their driver's licenses.
The returning student must attend school for a complete grading period and pass
three courses before the student is eligible to obtain a driver's license.
Recent legislation and educational efforts to reduce the number of dropouts in the
state have been successful. The percentage of dropouts declined from 6.3 percent
in 1991-92 to 4.8 percent in 1992-93. In 1992-93, there were 11,832 dropouts
compared to 15,223 dropouts in 1991-92.Although the decline in number of dropouts is good news, the 11,832 teens who
failed to complete their high school education are at a serious disadvantage in the
contemporary work place. Today's working environment requires higher levels of
literacy, more education, increased technological skills, and, most importantly, the
ability to begin careers that require lifelong learning. People who do not complete
high school are faced with a lifetime of limited opportunities. [6]
$80,000
$70,000
$60,000
$50,000
$40,000
$30,000
$20,000
$10,000
$0
Average Income andEducational AttainmentTennesseans Aged 25 and Older
$$19,400
22,644
$14,304
Not H.S.Grad
..........
H.S.Grad
$65,733
31,996 $33,996
$46,929
Assoc. Bachelor's Master Professional Ph.D.
Degree Degree Degree Degree
Source: U.S. Dept ol Commerce, Bureau of M. OMILls. 1950 Census of Populationand Homily, Public Uso
Maodate, Filo: Tennis...
866 The State of the Child in Tennessee, 1994 A Tennessee KIDS COUNT/Tennessee Commission on Children and Youth Report

Percent of High School (Grades 9-12) Dropouts, 1992-1993
LI
on
Ito on
Crockett
Ho wood
00
son
.Or
0.1
Chester
1mcklakei
ULM-00.0 NOM OrM0
US on
a anurnnor
ram
OA n ckeon vi DOM
urn r
WU ameonHickman
MauLoma
CountyDropouts
Number PercentWridertbri ::: 108 2.8:Bedford :: 90 5.2:Benton ::: 16 2.0Bledsoe : 61 14.3
116_
2.613radley :' 216 5.2tampbell :: 88 4.4:Cannon 27 4.8:Carroll 24 1.5tartertheatham
89 3.381 4.8
:Chester . 16 2.2Claiborne 64 4.6Clay 7 1.6Cooke 59 3.7toffee 104 4.0Crockett 19 2.8
Urriberland 144 6.6DaVidton 1,386 8.0Decatur 28 4.5De Kalb 28 3.9DiCkson 89 4.3Dyer 39 1.9Fayette 89 6.5Fentress 19 7.8Franklin 74 4.2Gibson 64 2.5GOes 63 4.6Grainger 44 4.4Greene 190 6.2Grundy 68 8.2HaMblen 89 3.2
587 5.1
Mom
20.1
ord
p.m)
a P kelt
00 an .
Putnam
11M011
0 00
00000
run
en MM. 1E11OCI
Ma an
tiMIR r" nd
M 11,011
COO
S iioohlo
nra-ail, Franklin "no.
nion
demon
Knox
alma
Lou on
ea
M
McMinn Ik.rFie
Ham onro
CountyDropouts
Number Percent:fferitOCk-- 12 3.4:11ardeman 71 4.6:Hardin 55 4.3.tlawkins 72 3.3HaYwood 33 2.6:Henderson, 65 5.2Henry 45 3.0:tfickman 32 3.5.Houston 27 5.7HUmphreys .
..J4CksOn24 2.520 3.9
:jeffersoh 98 5.7..khnson 42 5.5Knox 420 2.6Lake 10 2.71.4.0.0000 63 4.5Lawrence 108 5.3LewisLincoln
10 1.898 6.5
:Loudon 120 6.2:McMinn 91 3.6:MONairY 74 5.4:Macon 43 4.9:Madison 210 5.1:MarionMarshall-Maury:Mei sMonroe
27 1.756 4.4
131 4.220 3.795 4.9
MontqomeryMoore.
1356
2.62.0
MOrgen 35 3.3Obion 49 2.6
Source: Tennessee Department of Education.
69
Mount
rneHancock
00, ftHamblen
OrCM,
Ot
[Greene]
ashen an
Unica
J men
O Cr
Percent Ranges!1.3 to 2.8
2.9 to 4.3
4.4 to 5.3
5.4 to 14.3
CountyDropouts
Number PercentOvotott-: 64 6.8Perry 20 5.7Pickett 3 1.3
.:POlk 32 4.2pOtnaiii 43 1.7,flhea 1 19 1.4iiRoane 91 3.5'Rbbertson :: 74 3.3"Riitherford 341 5.0......SCott
,76 5.7
ebfUitdhi:el 31 5.8Sevier 74 2.6Shelby 2,904 7.4Smith 36 4.5Stewart 15 2.8Sullivan 197 2.6Sumner 303 4.7Tipton 109 4.4Trousdale : 11 3.2Unicoi 46 5.3Union 83 12.0Vah pUieli 13 5.6Warren 190 11.3Washington,: 140 3.1wasiii6 44 5.2Weak ley 61 4.1'White 59 5.5:Williamson 81 2.0Wilson 89 2.4
Tennessee 11,832 4.8
BEST COPY AVAIOABLE
The State of the Child in Tennessee, 1994 A Tennessee KIDS COUNTaennessee Commission on Children and Youth Report 67

cn
What Causes School Violence, and How Does it Affect Teens?
The last haven of safety for many children has been the school.With the increase in violent acts in school and greater numbers ofstudents carrying guns, many students are fearful.
Students' fear of violence is not unjustified. Possession of fire-
arms in schools is a serious and growing problem in Tennesseeschools that is growing. There were more than five times morestudents expelled for possession of firearms and other dangerousweapons during the 1992-93 school year compared to 1990-91 inTennessee. During 1990-91, there were 33 expulsions comparedto 173 expulsions in the 1992-93 school year.
Guns in school represent a threat to everyone. On April 21,1994, a 7th grade student at a Metropolitan Nashville/DavidsonCounty school was shot in the back of his head and killed duringmusic class while watching Beauty and the Beast.
The student seated behind him shot him with a .25 caliber auto-matic pistol, which police believe went off accidentally. This trag-edy has left students, parents, educators, and the public fearfulabout school safety and the availability of guns.
When students don't feel safe, it is hard for them to learn. Actsof violence disrupt the normal functioning of the school, and thefear of violence can prevent students and teachers from concen-trating on meaningful learning and teaching.
The academic achievement of students who don't feel safe atschool suffers in comparison to those who feel safe. A 1993 surveyof 6th, 7th, and 8th graders showed that students who did not feelsafe scored significantly lower on the Tennessee Comprehensive
Number of Students Expelled from School For Firearms1990-1993, Tennessee
120
100
80
60
40
20
_A
.
...
1990-91 1991-92
Source: Tennessee Department of Education 701992-93
68 The State of the Child in Tennessee, 1994 A Tennessee KIDS COUNTaennessee Commission on Children and Youth Report

Assessment Program tests than studentswho felt safe.
Violent acts or the threat of violenceagainst other students and school personnelhave more than doubled the number ofschool expulsions and substantially in-creased the number of incidents of suspen-sion within the past three years. The numberof expulsions rose from 37 in 1990-91 to 85expulsions in 1992-93.
Consider the following findings on schoolviolence:
One large national study showed that junior(vs. senior) high schools, and schools withmore male students, larger enrollments, andlarger classes experienced more violence,as did schools lacking strict and fair adminis-tration of discipline. [1]
Another study by the National ResearchCouncil cites four characteristics of schoolsthat may contribute to violence:1. relatively high numbers of students oc-cupy a limited amount of space;2. the capacity to avoid confrontations issomewhat reduced;3. the imposition of behavioral routines andconformity may contribute to feelings ofanger, resentment, and rejection; and4. poor building design may facilitate thecommission of violent acts. [2]
Students' attitudes about school may alsocontribute to school violence. Research hasshown that school violence is more prevalentwhere students:1. felt their classes did not teach them whatthey wanted to learn;2. did not consider their grades important;3. did not plan to go to college; and4. felt they had no influence over their ownlives. [3]
The possession, use and sale of illegal
drugs is another serious problem that isgrowing. The number of school suspen-sions in Tennessee for the possession, useor sale of illegal drugs more than doubledfrom 1990-91 to 1992-93. The number ofsuspensions in 1990-91 was 809. In 1992-93, there were 1,780 suspensions for drug-related problems.How do teens become violent?Research shows that there are at least 11factors that contribute to violent behavior:biological factors; child rearing conditions;ineffective parenting; emotional and cogni-tive development; gender differences; sexrole socialization; relations to peers; cul-tural milieu; social factors (i.e., economicinequality, lack of opportunity); and mediainfluences. [4]
Factors contributing to the developmentof antisocial behavior include family char-acteristics and a breakdown of familyprocesses and relationships, includingviolence. "Criminal history or antisocialpersonality in a parent, parental rejectionof the child, and inconsistent and physicallyabusive parental discipline ail seem tocontribute to early aggressive behaviors.Lack of parental supervision is one of thestrongest predictors of the development ofconduct problems and delinquency. Par-ents who support the use of aversive andaggressive behaviors by children and fail toteach nonviolent and effective methods ofsolving social problems contribute to thedevelopment of coercive family interactionsand to later patterns of antisocial behaviorin the child." [5]
"Personal, family, school, and societalfactors all contribute to school violence. Ef-forts to reduce school violence must con-sider these multiple sources of the problem." [6]
71The State of the Child in Tennessee, 1994 A Tennessee KIDS COUNT/fennessee Commission on Children and Youth Report 69

SUMMARY CHAPTER 3: EDUCATION
Enrollmento There has been a steady, moderate increase in students enrolled in Tennessee public
schools. From 1990 to 1993, there has been a six percent increase in net enrollment from
858,991 students in 1990 to 906,451 students in 1993.
Student LearningFor language arts skills, 57.1 percent of students in grades two through eight mastered
their grade-level language arts skills on the 1994 TCAP exam.
Third grade had the highest percent of student mastery in language with 68.2 percent mas-
tering third grade language skills.
Although eighth grade had the lowest percent of studentgrade-level mastery with 48.4
percent mastering 8th grade skills, their 1994 TCAP scores improved since the 1993 TCAP
when only 47.9 percent mastered grade-level skills.
46.8 percent of students in grades two through eight mastered their grade-level math skills
in 1994. Second grade had the highest percent of student grade-level math mastery with
84.7 percent mastery.
ACT ScoresTennessee's average ACT scores in 1993 were near the national average.
Dropping OutThe percentage of dropouts in Tennessee declined from 6.3 percent in 1991-92 to 4.8 per-
cent in 1992-93. In 1992-93, there were 11,832 dropouts compared to 15,223 dropouts in
1991-92.
School ViolenceThere were more than five times more students expelled for possession of firearms
and other dangerous weapons during the 1992-93 school year compared to 1990-91 in
Tennessee. During 1990-91, there were 33 expulsions compared to 173 expulsions in
the 1992-93 school year.
70 The State of the Child in Tennessee. 1994 A Tennessee KIDS COUNTifennessee Commission on Children and Youth Report

ReferencesSingle-Parent Families1. The Annie E. Casey Foundation, (1994). Kids Count Data Book: State Profiles ofChild Well-Being. Baltimore, Maryland,p. 117.2. Ibid., p. 81.3. Ibid., p. 117.4. Ibid., pp. 85, 79, 101, and 115.5. Ibid., p. 16.6. Ibid.7. Millar, J., (1989). Poverty and the Lone-Income Family: The Challenge to Social Policy. Bath, England: University ofBath's School of Social Sciences, p. 6.8. Zill, N., and Nord., C.W., (1994). Running in Place: How American Families are Faring in a Changing Economic andIndividualistic Society. Washington, DC: Child Trends Inc., p. 3.
Poverty/Income1. Poverty engulfing more children, fewer seniors, (1994, October 11). The Tennessean p. 4a.2. Ibid.3. The Annie E. Casey Foundation, (1992). Handout on children in poverty for the Kids Count project.4. Ibid., p. 2.5. Zill, N. And Nord., C.W. (1994). Running in Place: How American Families are Faring in a Changing Economic andIndividualistic Society. Washington, DC; Child Trends, Inc., p. 82.
AFDC1. Axinn, J.M. and Hirsh, A.E., (1993). Publication on Families in Society from The Journal of Contemporary HumanServices, p. 565.2. Center on Social Welfare and Law, (1994, June). Living at the Bottom: An Analysis of 1994 AFDC Benefit Levels. NewYork City.3. Ibid.4. Ibid.5. Center for Business and Economic Research, (1994, March). Aid to Families With Dependent Children: 1993 CaseCharacteristic Study. University of Tennessee: Knoxville, Tennessee.6. Ibid.
Nutrition1. Center on Hunger, Poverty, and Nutrition Policy, (1993, Fall). A Statement on the Link Between Nutrition and CognitiveDevelopment. Medford, MA: Tufts University, School of Nutrition, p. 14.2. Food Research and Action Center, (1993). School Breakfast Score Card: 1992-1993. Washington, D.C.3. Center on Hunger, Poverty, and Nutrition Policy's 1993 report, p. 9.4. Ibid.5. Ibid., p. 106. Ibid., p. 5.7. Ibid.8. Ibid.
Teen Employment1. Jacobs., H.N., (1990). The Advantages and Disadvantages of Teenage Employment on Student Achievement. Unpub-lished research for Trevecca Nazarene College, Nashville, Tennessee.2. President's Science Advisory Committee's Panel on Youth, (1973). Youth: Transition to Adulthood. Washington, D.C.3. Woricrnan, B., (1990). Dear professor: this is what I want you to know. Phi Delta Kappan, 48, 668-671.
Domestic Violence1. Jaffe, Wolfe, Wilson, (1990). Children of Battered Women. Newbury Park, CA: Sage Publications, p. 42. Straus, M.A., Gelles, R.J., and Steinmetz, S.K., (1980). Behind Closed Doors: Violence in the American Family. GardenCity, NY: Anchor Press.3. Ibid.4. Ibid.5. The News Beacon, (1994, June 29). Nashville, TN, p. 1.6. Novello, A.G., (1992). "From the Surgeon General, U.S. Public Health Service," The Journal of the American MedicalAssociation, 267(23), p. 3,132.7. Ibid.8. Ibid.
73 copy Avim BLEThe State of the Child in Tennessee, 1994 A Tennessee KIDS COUNT/Tennessee Commission on Children and Youth Report 71

9. Jaffe, Wolfe, and Wilson's 1990 publication, Children of Battered Women, p. 21.10. Ibid., p. 17.11. Ibid.12. Ibid.13. Ibid., p. 22.14. Fact sheets by the National Woman Abuse Prevention Project on the effects of domestic violence on children. Undatedpublication.15. Hewlett, S.A., (1991). When the Bough Breaks. Basic Books, p. 279.16. Ibid.17. Ibid.18. Ibid., p. 7.
Child Abuse1. Tennessee Department of Human Services, (1993, December). Facts About Child Abuse. Nashville, Tennessee.2. Ibid.3. Tennessee Department of Human Services, (1992, September 10). Questions and Answers About Child ProtectiveServices.
Teen Crime1. Tennessee Children's Services Commission, (1984). Tennessee Annual Juvenile Court Statistical Report. Nashville, TN;Tennessee Council of Juvenile and Family Court Judges, (1992). Annual Statistical Report. Nashville, TN.2. Ibid.3. American Psychological Association, (1993). Violence and Youth: Psychology's Response. Volume I: Summary Reportof the American Psychological Association's Commission on Violence and Youth. Washington, DC, p. 19.4. Ibid.5. Ibid., p. 23.6. Ibid., p. 24.7. Tennessee Council of Juvenile and Family Court Judges, (1992). Annual Statistical Report. Nashville, TN.8. Tennessee Commission on Children and Youth, (1992). Kids Count: The State of the Child in Tennessee. Nashville, TN.9. American Psychological Association's 1993 report on Violence and Youth, p. 23.10. Ibid., p. 25.11. Population Reference Bureau, (1992, September). The Challenge of Change: What the 1990 Census Tells Us AboutChildren. Washington, DC: Center for the Study of Social Policy, p. 51.12. The Annie E. Casey Foundation, (1994). Kids Count Data Book: State Profiles of Child Well-Being. Baltimore, MD, p.117.13. Ibid., p. 81.14. Tennessee Department of Health, (1993, October 12). Youth Risk Behavior Survey. Nashville, TN.15. American Psychogical Association's 1993 report on Violence and Youth p. 28.16. Ibid.17. Ibid.18. Ibid., p. 22.
Prenatal Care1. Nonuse of prenatal care: implications for social work involvement, (1994, May). Health and Social Work, 19(2), p. 84.2. bid., p. 87.3. bid., p. 84.4. bid., p. 87.5. bd., p. 86.6. bid., p. 90.7. bid.8. bid., p. 91.9. bid.10. Ibid., p. 87.11. Ibid.12. Ibid., p. 91.13. Ibid.14. Ibid.15. Ibid.
Low Birth Weight1. The racial disparity in infant mortality, (1992, October 1). The New England Journal of Medicine, p. 1,022.2. American Nurses' Association, (1987). Access to Prenatal Care: Key to Preventing Low Birthweight. Kansas City, MO, p.V.
3. The racial disparity in infant mortality, (1992, October 1). The New England Journal of Medicine., p. 1,023.4. Ibid.
72 The State of the Child in Tennessee, 1994 A Tennessee KIDS COUNT/Fennessee Commission on Children and Youth Report

5. Ibid.
Infant Mortality1. The Annie E. Casey Foundation, (1994). Kids Count Data Book: State Profiles of ChildWell-Being. Baltimore, MD.2. Schoendorf, K.C. et al., (1992, June 4). Mortality among black as compared with white college-educated parents. TheNew England Journal of Medicine. 326(23), p. 1,525.
Immunizations1. Peter, G. , (1992, December 17). Childhood immunizations. The New England Journal of Medicine, p. 1,794.2. Plotkin, S.I. and Plotkin, S.A. (1988). A short history of immunization. Vaccines. Philadelphia, PA: W.B. Saunders, p. 1-7.3. Ibid., p. 587-611.4. Nashville Immunization Coalition brochure, 1994.5. The Tennessean, (1994, July 16). World News Extra, p. 7.6. Ibid.7. Ibid.8. Peter, J., (1992, December 17). Childhood immunizations, The New England Journal of Medicine, p. 1,792.9. Ibid.10. Centers for Disease Control Advisory Memorandum #88 from the Tennessee Department of Health on April 4, 1994.11 Ibid.12. Ibid.13. Peter, J. (1992, December 17). Childhood immunizations, The New England Journal of Medicine, p. 1,795.14. Ibid., p. 1,794.
Child Deaths1, Tennessee Department of Safety, (1993). Tennessee Motor Vehicle Traffic Accident Facts: 1988-1992. Nashville, TN.2. Ibid., p. 27.
Teen Pregnancy1. Dryfoos, J.G., (1990). Adolescents At Risk: Prevalence and Prevention. New York, NY: Oxford University Press, p. 65.2. Ibid.3. Ibid.4. U.S. General Accounting Office, Health and Human Services Division, January, 1994.5. Facts at a Glance, (1994, January). Washington, DC: Child Trends, Inc.6. Dryfoos, J.G., (1990). Adolescents at Risk: Prevalence and Prevention. New York, NY: Oxford University Press, p. 70.7. The Annie E. Casey Foundation, (1994). Kids Count Data Book: State Profiles of Well-Being. Baltimore, MD.8. National Center for Education Statistics, (1993, October). Youth Indicators 1993: Trends in the Well-Being of Americanloth. Washington, DC: U.S. Department of Education, Office of Educational Research and Improvement.9. Dryfoos, J.G., (1990). Adolescents at Risk: Prevalence and Prevention.10. Ibid., p. 7411. Ibid., p. 75.12. Facts at a Glance, (1994, January). Washington, DC: Child Trends, Inc.13. Ibid.14. Ibid.15. Ibid.16. National Commission on Children, (1991). Beyond Rhetoric: A New American Agenda for Children and Families.Washington, DC, p. 226-227.
HIV/AIDS1. U.S. Department of Health and Human Services, Centers for Disease Control, H1V/AIDS Surveillance Bulletin, April1991, pp. 1-18; S.B. Manoff et al., Acquired Immunodeficiency Syndrome in Adolescents: Epidemiology, Prevention andPublic Health Issues," Centers for Disease Control: Current Issues in Pediatrics 8 (1989) :309-314; U.S. Department ofHealth and Human Services, National Center for Heatth Statistics, Health, United States, 1989 (Washington, D.C.: U.S.Department of Health and Human Services, Public Health Services, 1990) p. 20; Children's Defense Fund, S.O.S. America!A Children's Defense Fund Budget (Washington, D.C.: Children's Defense Fund, 1990), p. 58.2. Tennessee Department of Health, (1993). HIV/AIDS Among Children and Adolescents in Tennessee: Update ThroughOctober 31, 1993.3. Ibid.4. Ibid.5. Newborns with AIDS, (1994, March 7). Newsweek, p. 53.6. Tennessee Department of Health, (1993). HIV/AIDS Among Children and Adolescents in Tennessee: Update ThroughOctober 31, 93.7. Tennessee Department of Health , (1993, October 12). Youth Risk Behavior Survey. Nashville, TN.
The State of the Child in Tennessee, 1994 A Tennessee KIDS COUNT/fennessee Commission on Children and Youth Report 73

Sexually Transmitted Diseases1. Mil !stein, S., (1988). The Potential of School Linked Centers to Promote Adolescent Health and Development. New York,
NY: Carnegie Council on Adolescent Development, p. 6.2. Centers for Disease Control, 1990 Division of STD/HIV Prevention Annual Report, "Syphilis" and Gonorrhea" tables.
3. Centers for Disease Control, 1991; American Social Health Association, 1991.4. Dryfoos, J.G., (1990). Adolescents At Risk: Prevalence and Prevention. New York: Oxford University Press.
5. Ibid.6. Ibid., p. 667. Ibid.8. Rosenbaum, E. And Kandel, (August, 1990). Early onset of adolescent sexual behavior and drug involvement. Journal of
Marriage and the Family, 2, pp. 783-789.9. Ibid.
Teen Violent Deaths1. Tennessee Department of Health, (1993). Picture of the Present. Part TwO. Nashville, TN.
2. Ibid.3. Ibid.4. Ibid.
Enrollment, etc.Data in the introductory section were gathered from the Tennessee State Department of Education's Annual Statistical
Reports from 1989-90, 1990-91, 1991-92, and 1992-93.
Student LearningData in this section were gathered from State Testing and Evaluation Center's 1992-93 Tennessee Student Test Results:
TCAP.
ACT ScoresData in this section were gathered from The American College Testing program's Student Profile of Tennessee students
who took the test in 1993 and score reports from the test administrationof 1993.
Dropping Out1. National Commission on Children, (1991). Beyond Rhetoric: A New American Agenda for Children and Families. Wash-
ington, DC, p. 235.2. U.S. Department of Commerce, Bureau of the Census, 1990 Census of Population and Housing, Public Use Microdata,
File: Tennessee.3. U.S. General Accounting Office, (1994, January). Residential Care: Some High Risk Youth Benefit, But More StudyNeeded. A Report to the Chairman, Subcommittee on Oversight of Government Management, Committee on Governmental
Affairs, U.S. Senate. Wahington, DC.4. T.C.A. 49-6-30015. T.C.A. 49-6-30176. National Commision on Children, (1991). J3eyond Rhetoric: A New American Agenda for Children and Families. Wash-
ington, DC.
Special Education1. Tennessee Department of Education, (1993). Special Education Manual. Developed by the Special Education Division ofthe Department of Education, Nashville, TN, p. 14.1.2. Ibid., p. 17.4.3. Ibid.4. Ibid., p. 1.1.
School Violence1. Office of Educational Research and Improvement, (1993). Reaching the Goals: Goal 6 Safe. Disciplined. and Drug-FreeSchools. Washington, DC: U.S. Department of Education, p. 8.2. American Psychological Association, (1993). Violence and Youth: Psychology's Response. Volume I: Summary Reportof the American Psychological Association Commission on Violence and Youth. Washington, DC.3. Ibid., p. 20.4. Ibid., p. 8.5. Ibid., p. 17.6. Ibid., p. 18-19.
74 The State of the Child in Tennessee, 1994 A Tennessee KIDS COUNT/Fennessee Commission on Children and Youth Report

GlossaryAverage ACT Compos ite Scores is the ave rage ofthefoursubtests of the American College Testing (ACT) co Ilege entrance examination. The subtestsare: reading; mathematics; English; and scientific reasoning.
Births Lacking Adequate Prenatal Care is the percent of births wh ich have inadequate or intermediate pren atal care measured bythe Kessner Index.Kessner Index is a scale of adequacy of prenatal care based on standards of the American College of Obstetricians and Gynecologists. This indexof adequacy of prenatal care is based on the number of prenatal visits adjusted for gestational age.
Child Abuse and Neglect Rate is the number of cases per 1,000 children under 18 years old in which someone causes foreseeable and avoidableinjury or impairment to a child or contributes to the unreasonable prolonging or worsening of an existing injuryor impairment in a child.
Child Death Rate is the number of deaths per 100,000 children aged 1-14 from all causes. The data are reported by residence. (This rate may appearexcessively high in counties with small populations although few child deaths occurred.)
Children Receiving AFDC is the percent of children under 18 years old who received financial support from Aid to Families with Dependent Children(AFDC) which provides subsistence-level income for children and families.
Children Referred to Juvenile Courts is the percent of children under 18 years old who are referred to a juvenile court. There are three categoriesof reasons for referrals. The first category includes offenses against persons, offenses against property, illegal conduct, violation proceedings, andstatus offenses. The second category involves issues affecting the safety and well-being of the referred child such as abuse, dependency, neglect,termination of parental rights, etc. The third category includes judicial actions taken on behalf of the childor upon request of the child and parent orguardian.
Commitments to State Custody are court orders issued by a juvenile court judge or referee giving legal custody of a child to the state. Children maybe committed by a juvenile court tothe custody of the Department of Education (Tennessee Preparatory School), the Department of Human Services,the Department of Mental Health and Mental Retardation, the Department of Youth Development, orcommittedon a Juvenile Court Commitment Order(JCCO).
Children Remaining in State Custody are children under 21 years old who are in the legal custody of the stateon June 30, the last day of the statefiscal year.
High School (Grade 9-12) Dropouts is the number of dropouts per 100 students of grades 9-12 in a calendar year from June to June (the schoolyear and preceding summer) divided by net enrollment at the end of school year. The number of dropouts is collected and reported by school systemsutilizing the Tennessee School Register (TSR).
Infant Mortality Rate is the number of deaths of per 1,000 live births of infants under one year of age. The data are reported by residence.
Low-Birth-Weight Babies is the percent of live births recorded as low-birth-weight babies who weigh under 2,500 grams (5.5 pounds) at birth.
Per Capita Income by County is the per capita personal income for a county.
Sexually Transmitted Disease Rate is the number of teens ages 15-17 per 100,000 who were diagnosed with sexually transmitted diseases.
Students In Special Education is the percent of students in Tennessee school systems who received special education services. Thisg roup includesgiftedchildren andthosewith disabling conditions including learning disabilities, mentally retarded, speech or language impaired, emotionallydisturbed,autistic, heatth impaired, physically impaired, deaf, hearing impaired, visually impaired, deaf/blind, multihandicapped, functionally retarded,developmentally delayed, or traumatic brain injury.
Teen Pregnancy Rate is the number of live births, reported fetal deaths, and induced terminations of pregnancy per 1,000 women aged 15-17.
Teen Violent Death Rate is the number of deaths per 100,000 of teens ages 15-19 from homicide, suicide, and accidents.
Youth Unemployment Rate is the percent of unemployed persons ages 16-19years old, expressed as a percent of the labor force for ages 16-19.
Appendix: Tennessee RegionsBEST COPY AVAILABLE
Tennessee Health Department Regions for the chart on page 43En Li Central 4Carter CannonGreene ClayHancock CumberlandHawkins De KalbJohnson FentressUnicoi JacksonWashington Macon
Overtonfast 2 PickettAnderson PutnamBlount SmithCampbell Van BurenClaborne WarrenCooke WhiteGraingerHamblenJefferson tihtikarnLoudon DicksonMonroe HoustonRoane HumphreysScott MontgomerySevier RobertsonUnion Rutherford
Stewart
Melee SumnerTrousdale
Bradley WilliamsonFranklin WilsonGrundyMcMinn Central 4Marion BedfordMeigs CoffeePolk GilesRhea HickmanSeauatchie Lawrence
LewisLincolnMarshallMauryMoorePerryWayne
West 7BentonCarrollCrockettDyerGibsonHenryLakeObionWeak ley
Waal/ChesterDecaturFayetteHardemanHardinHaywoodHendersonLauderdaleMcNairyTipton
Tennessee Department of Education DistrictsFrom chart on page 64
UpperCumberland (UC)Northwest (NW) First TN (FT)
iwrirPoirapNW- jiYfifillipt/4114uVrato4.4" iteler46ffoinism.46 .TN(ET)
ANUMINIMIlwihwimaiSouthwest South Central(SW) (SC)
( 7
Southeast(SE) GN = Greater Nashville
MD = Memphis Delta
The State of the Child in Tennessee 1994 A Tennessee KIDS COUNT/Tennessee Commissionon Children and Youth Report 75

AcknowledgmentsTennessee KIDS COUNT
Tennessee KIDS COUNT Director Denise Dunbar, Ed.DTennessee KIDS COUNT Research Analyst Jing Zhou
Editor - John T. HardingExecutive Editor Linda O'Neal
Tennessee KIDS COUNT is funded by The Annie E. Casey Foundation.
TCCY Coordinators of Regional Councils on Children and YouthDebbie Anderson Kay HesterNorthwest Council on Children and Mid-Cumberland CouncilYouth on Children and YouthP.O. Box 505 Gateway Plaza, First Floor112 West Maple 710 James Robertson ParkwayDresden, TN 38225 Nashville, TN 37243-0800(901) 364-5000 (615) 532-1579FAX: (901) 364-5000 FAX: (615) 741-5956Marilyn DavisSoutheast Councilon Children and Youth540 McCallie Avenue, Suite 643Chattanooga, TN 37402(615) 634-6210
Kathy DanielsUpper Cumberland Council onChildren and Youth1225 South Willow AvenueCookeville, TN 38501(615) 432-4111FAX: (615) 432-6010
Robert SmithEast Tennessee Council on Childrenand Youth531 Henley Street #710Knoxville, TN 37902(615) 594-6658FAX: (615) 594-6658Judy MatthewsSouthwest Council onChildren and YouthState Office Building Box 13Jackson, TN 38301(901) 423-6545FAX: (901) 423-6545
Juanita WhiteMemphis/Shelby CountyChildren and Youth Council170 North Main, Room 707Memphis, TN 38103(901) 543-7657FAX: (901) 543-7657
Diane WiseNortheast Tennessee Council onChildren and Youth207 North Boone Street, Suite 800Johnson City, TN 37604(615) 928-0224FAX: (615) 928-5209
Elaine WilliamsSouth Central Tennessee Council onChildren and YouthP.O. Box 955Spring Hill, TN 37174-0955(615) 388-1053 or 381-2040FAX (615) 381-2053
Tennessee Commission on Chi Wien and YouthPhilip Acord, Chair
Chattanooga
Cleo Brooks BoydJackson
Kristin CunninghamNashville
Eric DupreeMcKenzie
Cheryl GannonCleveland
Connie GivensRogersville
Sharon GreenJohnson City
Jan JohnsonDunlap
John Jones.Memphis
Dennie LittlejohnKnoxville
George LovellColumbia
Alnita McClureMemphis
Bob NapierKnoxville
Diane NeighborsNashville
Susan Pang leCookeville
June PerriganJackson
Sheila PetersNashville
Mary Kate RidgewayParis
May ShayneNashville
Antonio SmithMemphis
Gerald StowBrentwood
Chiffonda WashingtonNashville
Donna Roberts WohlfordBristol
Linda O'Neal, Executive DirectorJanet Coscarelli, Assistant Director
Tennessee KIDS COUNT Technical Advisory Committee
May W. Shayne, Chairperson
Director, Center for State and Local Government Policy, Vanderbitt Institute for Public Policy Studies
Louise BarnesRegional Coordinator, Children and Adolescents Section,Tennessee Department of Mental Heath and Mental Retardation
Benjamin BrownDirector of Accountability Systems,Tennessee Department of Education
David CordrayProfessor of Public Policy,Vanderbilt Institute for Public Policy Studies
Charles MasonProfessor, College of Social Work,University of Tennessee
Lorraine GreeneDeputy Director, "I Have a Future, "Meharry Medical College
Robert InnesDirector of Undergraduate Studies in Human Development,
Vanderbitt University
William Robert IvesVice-president, Management Information Network,Tennessee Hospital Association
Robert KronickProfessor of Education, College of Education,University of Tennessee
Irving LazarResearch Professor of Public Policy,Vanderbilt Institute for Public Policy Studies
Lisa McinturffExecutive Director,Tennessee Voices for Children
Gregory MaynardDirector of Planning,Tennessee Department of Youth Development
Matt MurrayProfessor, Center for Business and Economic Research,University of Tennessee
George Plum leeChief of Technical and Informational Services,Tennessee Department of Health
Ron SimmonsResearch SpecialistTennessee Board of Regents
Joanne Jankovic ThompsonAssistant Professor, College of Social Work,University of Tennessee
Charles WilsonDirector of Child Welfare Services,Tennessee Department of Human Services
Special thanks to the state departments' staff members who provided information for thispublication.
76 The State of the Child in Tennessee, 1994 A Tennessee KIDS COUNT/rennessee Commission on Children and YouthReport

(9/92)
U.S. DEPARTMENT OF EDUCATIONOffice of Educational Research and Improvement (OERI)
Educational Resources Information Center (ERIC)
NOTICE
REPRODUCTION BASIS
ERIC
This document is covered by a signed "Reproduction Release(Blanket)" form (on file within the ERIC system), encompassing allor classes of documents from its source organization and, therefore,does not require a "Specific Document" Release form.
This document is Federally-funded, or carries its own permission toreproduce, or is otherwise in the public domain and, therefore, maybe reproduced by ERIC without a signed Reproduction Releaseform (either "Specific Document" or "Blanket").
PSoa-( (pc