University of Groningen The stellar mass-halo mass relation of ...
21
University of Groningen The stellar mass-halo mass relation of isolated field dwarfs Read, J. I.; Iorio, G.; Agertz, O.; Fraternali, F. Published in: Monthly Notices of the Royal Astronomical Society DOI: 10.1093/mnras/stx147 IMPORTANT NOTE: You are advised to consult the publisher's version (publisher's PDF) if you wish to cite from it. Please check the document version below. Document Version Publisher's PDF, also known as Version of record Publication date: 2017 Link to publication in University of Groningen/UMCG research database Citation for published version (APA): Read, J. I., Iorio, G., Agertz, O., & Fraternali, F. (2017). The stellar mass-halo mass relation of isolated field dwarfs: a critical test of ΛCDM at the edge of galaxy formation. Monthly Notices of the Royal Astronomical Society, 467(2), 2019-2038. https://doi.org/10.1093/mnras/stx147 Copyright Other than for strictly personal use, it is not permitted to download or to forward/distribute the text or part of it without the consent of the author(s) and/or copyright holder(s), unless the work is under an open content license (like Creative Commons). The publication may also be distributed here under the terms of Article 25fa of the Dutch Copyright Act, indicated by the “Taverne” license. More information can be found on the University of Groningen website: https://www.rug.nl/library/open-access/self-archiving-pure/taverne- amendment. Take-down policy If you believe that this document breaches copyright please contact us providing details, and we will remove access to the work immediately and investigate your claim. Downloaded from the University of Groningen/UMCG research database (Pure): http://www.rug.nl/research/portal. For technical reasons the number of authors shown on this cover page is limited to 10 maximum. Download date: 13-03-2022
-
Upload
khangminh22 -
Category
Documents
-
view
4 -
download
0
Transcript of University of Groningen The stellar mass-halo mass relation of ...
University of Groningen
The stellar mass-halo mass relation of isolated field dwarfsRead, J. I.; Iorio, G.; Agertz, O.; Fraternali, F.
Published in:Monthly Notices of the Royal Astronomical Society
DOI:10.1093/mnras/stx147
IMPORTANT NOTE: You are advised to consult the publisher's version (publisher's PDF) if you wish to cite fromit. Please check the document version below.
Document VersionPublisher's PDF, also known as Version of record
Publication date:2017
Link to publication in University of Groningen/UMCG research database
Citation for published version (APA):Read, J. I., Iorio, G., Agertz, O., & Fraternali, F. (2017). The stellar mass-halo mass relation of isolated fielddwarfs: a critical test of ΛCDM at the edge of galaxy formation. Monthly Notices of the Royal AstronomicalSociety, 467(2), 2019-2038. https://doi.org/10.1093/mnras/stx147
CopyrightOther than for strictly personal use, it is not permitted to download or to forward/distribute the text or part of it without the consent of theauthor(s) and/or copyright holder(s), unless the work is under an open content license (like Creative Commons).
The publication may also be distributed here under the terms of Article 25fa of the Dutch Copyright Act, indicated by the “Taverne” license.More information can be found on the University of Groningen website: https://www.rug.nl/library/open-access/self-archiving-pure/taverne-amendment.
Take-down policyIf you believe that this document breaches copyright please contact us providing details, and we will remove access to the work immediatelyand investigate your claim.
Downloaded from the University of Groningen/UMCG research database (Pure): http://www.rug.nl/research/portal. For technical reasons thenumber of authors shown on this cover page is limited to 10 maximum.
Download date: 13-03-2022
MNRAS 467, 2019–2038 (2017) doi:10.1093/mnras/stx147Advance Access publication 2017 January 25
The stellar mass–halo mass relation of isolated field dwarfs: a criticaltest of �CDM at the edge of galaxy formation
J. I. Read,1‹ G. Iorio,2,3 O. Agertz1 and F. Fraternali2,4
1Department of Physics, University of Surrey, Guildford, Surrey GU2 7XH, UK2Dipartimento di Fisica e Astronomia, Universita di Bologna, Viale Berti Pichat 6/2, I-40127, Bologna, Italy3INAF – Osservatorio Astronomico di Bologna, via Ranzani 1, I-40127, Bologna, Italy4Kapteyn Astronomical Institute, University of Groningen, Landleven 12, NL-9747 AD Groningen, the Netherlands
Accepted 2017 January 17. Received 2016 December 6; in original form 2016 July 11
ABSTRACTWe fit the rotation curves of isolated dwarf galaxies to directly measure the stellar mass–halomass relation (M�–M200) over the mass range 5 × 10⁵ � M�/M� � 108. By accountingfor cusp-core transformations due to stellar feedback, we find a monotonic relation withlittle scatter. Such monotonicity implies that abundance matching should yield a similar M�–M200 if the cosmological model is correct. Using the ‘field galaxy’ stellar mass functionfrom the Sloan Digital Sky Survey (SDSS) and the halo mass function from the � colddark matter Bolshoi simulation, we find remarkable agreement between the two. This holdsdown to M200 ∼ 5 × 10⁹ M�, and to M200 ∼ 5 × 10⁸ M� if we assume a power-lawextrapolation of the SDSS stellar mass function below M� ∼ 107 M�. However, if instead ofSDSS we use the stellar mass function of nearby galaxy groups, then the agreement is poor.This occurs because the group stellar mass function is shallower than that of the field belowM� ∼ 109 M�, recovering the familiar ‘missing satellites’ and ‘too big to fail’ problems.Our result demonstrates that both problems are confined to group environments and must,therefore, owe to ‘galaxy formation physics’ rather than exotic cosmology. Finally, we repeatour analysis for a � Warm Dark Matter cosmology, finding that it fails at 68 per cent confidencefor a thermal relic mass of mWDM < 1.25 keV, and mWDM < 2 keV if we use the power-lawextrapolation of SDSS. We conclude by making a number of predictions for future surveysbased on these results.
Key words: galaxies: dwarf – galaxies: irregular – galaxies: kinematics and dynamics – LocalGroup – cosmological parameters – dark matter.
1 IN T RO D U C T I O N
The standard �cold dark matter (�CDM) cosmological modelgives an excellent description of the growth of structure in the Uni-verse, matching the observed temperature fluctuations in the cosmicmicrowave background radiation (e.g. Smoot et al. 1992; PlanckCollaboration XVI 2014), the growth of large-scale structure (e.g.Springel, Frenk & White 2006), the clustering of galaxies (Crocceet al. 2016), large-scale weak lensing distortions (e.g. Blandfordet al. 1991; Fu et al. 2014), baryon acoustic oscillations (e.g. Blake& Glazebrook 2003; Eisenstein et al. 2005; Dawson et al. 2013)and the flux power spectrum of quasar absorption lines (e.g. Croftet al. 1998; Baur et al. 2016). However, over the past two decadesthere have been persistent tensions claimed on small scales insidegalaxy groups and individual galaxies. These include the following.
� E-mail: [email protected]
(i) The ‘missing satellites’ problem: pure dark matter cosmo-logical simulations of structure formation predict that thousandsof bound dark matter haloes should be orbiting the Milky Wayand Andromeda, yet only a few tens of visible satellites havebeen observed to date (e.g. Klypin et al. 1999; Moore et al. 1999;McConnachie 2012).
(ii) The ‘cusp-core’ problem: these same simulations predict thatthe dark matter density distribution within galaxies should be self-similar and well fitted at the ∼10 per cent level by the ‘NFW’ profile(Navarro, Frenk & White 1996b):
ρNFW(r) = ρ0
(r
rs
)−1 (1 + r
rs
)−2
(1)
where the central density ρ0 and scalelength rs are given by
ρ0 = ρcrit�c3gc/3; rs = r200/c (2)
C© 2017 The AuthorsPublished by Oxford University Press on behalf of the Royal Astronomical Society
Downloaded from https://academic.oup.com/mnras/article-abstract/467/2/2019/2957023by University of Groningen useron 23 January 2018
2020 J. I. Read et al.
gc = 1
log (1 + c) − c1+c
; r200 =[
3
4M200
1
π�ρcrit
]1/3
. (3)
c is the dimensionless ‘concentration parameter’; � = 200 is theover-density parameter; ρcrit is the critical density of the Universetoday; r200 is the ‘virial’ radius at which the mean enclosed densityis � × ρcrit; and M200 is the ‘virial’ mass within r200.
For over two decades now, the rotation curves of small dwarf andlow surface brightness galaxies have favoured a central constantdensity core over the ‘cuspy’ NFW profile described above (e.g. Flo-res & Primack 1994; Moore 1994; de Blok & Bosma 2002; Kuziode Naray & Kaufmann 2011; Oh et al. 2011; Hague & Wilkin-son 2013).
(iii) The ‘too big to fail’ (TBTF) problem: the central velocitydispersion of Local Group dwarfs appears to be too low to be con-sistent with the most massive subhaloes in �CDM (Read et al. 2006;Boylan-Kolchin, Bullock & Kaplinghat 2011).
The above puzzles could be hinting at physics beyond �CDM,for example exotic inflation models (e.g. Zentner & Bullock 2002),or exotic dark matter models (e.g. Moore 1994; Rocha et al. 2013;Elbert et al. 2015). However, it is important to emphasize that allof these puzzles arise from a comparison between the observedUniverse and a model �CDM universe entirely devoid of stars andgas (that we shall refer to from here on as ‘baryons’; e.g. see thediscussion in Pontzen & Governato 2014 and Read 2014). Semi-analytic models make some attempt to improve on this by paintingstars on to pure dark matter simulations (e.g. Baugh 2006). However,implicit in such analyses is an assumption that the distribution ofdark matter is unaltered by the process of galaxy formation. It isbecoming increasingly likely that this assumption is poor, especiallywithin group environments and on the scale of tiny dwarf galaxies.
Navarro, Eke & Frenk (1996a) were the first to suggest that darkmatter could be collisionlessly heated by impulsive gas mass lossdriven by supernova explosions. They found that, for reasonable ini-tial conditions corresponding to isolated dwarf galaxies, the effectis small (see also Gnedin & Zhao 2002). However, Read & Gilmore(2005) showed that the effect can be significant if star formation pro-ceeds in repeated bursts, gradually grinding a dark matter cusp downto a core. There is mounting observational evidence for such burstystar formation (Leaman et al. 2012; Weisz et al. 2012a; Teyssieret al. 2013; Kauffmann 2014; McQuinn et al. 2015), while thephysics of such ‘cusp-core transformations’ is now well-understood(Pontzen & Governato 2012; Pontzen et al. 2015, and for a reviewsee Pontzen & Governato 2014). The latest numerical simulationsthat resolve the effect of individual supernovae explosions are sub-stantially more predictive (e.g. Chan et al. 2015; Onorbe et al. 2015;Read, Agertz & Collins 2016a, hereafter R16a); these demonstratethat dark matter cores are an unavoidable prediction of �CDM (withbaryons) for all low-mass dwarf galaxies, so long as star formationproceeds for long enough.1
However, there remains a debate in the literature over the effi-ciency of star formation in low-mass haloes. Di Cintio et al. (2014),Chan et al. (2015) and Tollet et al. (2016) find insufficient star forma-tion to excite cusp-core transformations below M200 ∼ 1010 M�;
1 Two recent studies have claimed that dark matter cores do not form atany mass scale (Sawala et al. 2016b; Zhu et al. 2016). However, both ofthese used simulations with a ‘cooling floor’ of 104 K, meaning that they areunable to resolve the clumpy interstellar medium. Resolving this is crucialfor exciting cusp-core transformations, as explained in Pontzen & Governato(2012).
Madau, Shen & Governato (2014) find that core formation pro-ceeds in M200 ∼ 109 M� dwarfs; and R16a find that core formationproceeds ‘all the way down’ to halo masses ∼108 M�. Thesedifferences owe in part to resolution. R16a have a typical spatialresolution of 4 pc for their isolated dwarfs, with a stellar and darkmatter particle mass resolution of ∼250 M�. This allows them toresolve the � 500 pc size cores that form in their M200 � 109 M�dwarfs. Such small cores cannot be captured by the Di Cintio et al.(2014) and Tollet et al. (2016) simulations that have a spatial reso-lution of ∼ 80–100 pc. However, Chan et al. (2015) have a spatialresolution of ∼30 pc for their 109 M� dwarf, yet they find thatno significant dark matter core forms. This owes to a second keydifference between these studies: the treatment of reionization. InR16a, reionization is not modelled and so star formation is allowedto proceed unhindered at very low halo mass. In all of the otherstudies, some model of reionization heating is included. But themass scale at which reionization begins to suppress star forma-tion, Mreion, remains controversial. Some recent simulations favoura high Mreion ∼ 1010 M� (e.g. Chan et al. 2015; Tollet et al. 2016),while others favour a much lower Mreion ∼ 5 × 10⁸ M� (Gnedin& Kaurov 2014), consistent with the assumption of no reionizationin R16a. Observationally, the continuous low star formation rateof nearby dwarf irregular galaxies (dIrrs) appears to favour a lowMreion (Ricotti 2009; Weisz et al. 2012b, and see the discussion inR16a). We will discuss Mreion further in Section 6.7.
Despite the differences in Mreion, all of the above studies findthat when dark matter cores do form, they are of a size of approxi-mately the projected half stellar mass radius (R1/2). Such cores aredynamically important by construction because they alter the darkmatter distribution precisely where we can hope to measure it usingstellar kinematics (R16a). They also have important effects beyondjust the internal structure of galaxies. Cored dwarfs are much moresusceptible to tidal shocking and stripping on infall to a largerhost galaxy (e.g. Read et al. 2006; Penarrubia et al. 2010; Brookset al. 2013). This aids in the morphological transformation of dwarfsfrom discs to spheroids (Mayer et al. 2001a; Łokas, Kazantzidis& Mayer 2012; Kazantzidis, Łokas & Mayer 2013), and physi-cally reshapes the dark matter halo mass function within groups(Penarrubia et al. 2010; Zolotov et al. 2012; Brooks et al. 2013;Wetzel et al. 2016, and see the discussion in R16a).
Using simulations of isolated dwarfs at a spatial and mass reso-lution of ∼4 pc and ∼250 M�, respectively, R16a derived a new‘CORENFW’ fitting function that describes cusp-core transforma-tions in �CDM over the mass range 108 � M200/M� � 1010 (seeequation 6). In Read et al. (2016b) (hereafter R16b), we showedthat this gives a remarkable match to the rotation curves of four iso-lated dIrrs, using just two free fitting parameters: M200 and c [thattake on the same meaning as in equation (1) for the NFW profile].In particular, using mock data, we demonstrated that if the data aregood enough (i.e. if the dwarfs are not face-on, starbursting and/orof uncertain distance) then we are able to successfully measure bothM200 and c within our quoted uncertainties.
In this paper, we apply the rotation curve fitting method describedin R16b to 19 isolated dwarf irregulars (dIrrs) to measure the stellarmass–halo mass relation M�–M200|rot over the stellar mass range5 × 105 � M�/M� � 108. We then compare this with the stellarmass–halo mass relation obtained from ‘abundance matching’: M�–M200|abund to arrive at a comparatively clean test of our currentcosmological model.
This paper is organized as follows. In Section 2, we show howthe comparison between M�–M200|rot and M�–M200|abund constitutesa rather clean cosmological probe at the edge of galaxy formation.
MNRAS 467, 2019–2038 (2017)Downloaded from https://academic.oup.com/mnras/article-abstract/467/2/2019/2957023by University of Groningen useron 23 January 2018
The stellar mass-halo mass relation of dIrrs 2021
In Section 3, we describe our data compilation of rotation curves,stellar masses and stellar mass functions. In Section 4, we brieflyreview our rotation curve fitting method that is described and testedin detail in R16b. In Section 5, we present the results from applyingour rotation curve fitting method to 19 isolated dIrrs in the field(the individual fits and fitted parameters are reported in Table 2and Appendix A). In Section 6, we discuss the implications of ourresults and their relation to previous works in the literature. Finally,in Section 7 we present our conclusions.
2 A C L E A N C O S M O L O G I C A L P RO B E AT T H EE D G E O F G A L A X Y F O R M ATI O N
In this paper, we test cosmological models by comparing the stel-lar mass–halo mass relation derived from galaxy rotation curves(M�–M200|rot) with the mean stellar mass–halo mass relation de-rived from ‘abundance matching’ (M�–M200|abund). The idea initself is not new. For example, Moster et al. (2010) compareM�–M200|abund in �CDM with the stellar mass–halo mass relationderived from galaxy–galaxy lensing, finding good agreement. How-ever, most studies to date have focused on the high mass end ofthis relation where the differences between �CDM and alternativecosmologies like � Warm Dark Matter (�WDM) are small (e.g.Cacciato et al. 2009; Shan et al. 2015; and see Fig. 3). More re-cently, Pace (2016, hereafter P16) and Katz et al. (2017) have usedthe baryon-influenced mass models from Di Cintio et al. (2014) tofit rotation curves and measure M200 and c for a large sample ofdwarfs, comparing their results with abundance matching predic-tions. We will compare and contrast our analysis with these studiesin Section 6. However, what is new to this paper are the followingkey ingredients: (i) we focus on building a particularly clean sam-ple of rotation curves, derived in a consistent manner and with astate-of-the-art technique 3DBAROLO (Di Teodoro & Fraternali 2015;Iorio et al. 2016); (ii) we perform our comparison at M� � 108 M�,maximizing the constraints on cosmological models; and (iii) wemake use of a new predictive CORENFW profile for the dark matterdistribution on these mass scales that accounts for cusp-core trans-formations due to stellar feedback (R16a; R16b). In the remainderof this section, we discuss in detail how our cosmological test worksand why it is particularly clean.
Classical abundance matching relies on a key assumption thatgalaxy stellar masses are monotonically related to dark matterhalo masses (Vale & Ostriker 2004). Armed with this, galaxiesare mapped to dark matter haloes of the same cumulative numberdensity, providing a statistical estimate of M�–M200|abund for a givencosmological model. Thus, by comparing this M�–M200|abund withM�–M200|rot, we arrive at a comparatively clean cosmological probeof structure formation on small scales. The probe is clean becauseit relies only on the following theoretical ingredients.
(i) A monotonic relation between stellar mass and halo mass.We will directly test this with our measurement of M�–M200|rot inSection 5.2.
(ii) The dark matter halo mass function. This is readily calcu-lated for a given cosmological model using cosmological sim-ulations (e.g. Dehnen & Read 2011; Klypin, Trujillo-Gomez &Primack 2011).
(iii) A robust prediction of the internal dark matter distributionin dIrrs ρdm(r), for a given cosmological model. This is requiredin order to measure M200 from rotation curve data to obtain M�–M200|rot. In Section 5.1 we show that while our CORENFW darkmatter density profile gives a significantly better fit to our sampleof rotation curves than the NFW profile, we are not particularly
Table 1. Cosmological parameters assumed in thiswork. From top to bottom, these are: the Hubble pa-rameter, the ratio of matter and dark energy densityto the critical density, the ‘tilt’ of the power spectrum,and the amplitude of the power spectrum on a scale of8h−1 Mpc (see e.g. Peacock 1999, for a full definitionof these). These parameters are chosen to match thoseused in the Bolshoi simulation (Klypin et al. 2011)and give a good description of the latest cosmologicaldata (see the discussion in Klypin et al. 2011).
Cosmological parameter Value
Hubble h 0.7�M 0.27�� 0.73Tilt n 0.95σ 8 0.82
sensitive to this choice so long as ρdm → ρNFW (see equation 1) forr > R1/2.
Armed with the above theory ingredients, our probe relies solelyon observational data: rotation curves for dwarf galaxies with well-measured inclination and distance, and no evidence of a recent star-burst (see R16b); stellar masses derived from SED model fitting2;and a good measure of the stellar mass function of galaxies.
For our abundance matching, we use as default the stellar massfunction from Sloan Digital Sky Survey (SDSS) that reaches downto M� ∼ 107 M� (Blanton et al. 2005; Baldry, Glazebrook &Driver 2008; Behroozi, Conroy & Wechsler 2010; Behroozi, Wech-sler & Conroy 2013) and the halo mass function from the �CDM‘Bolshoi’ simulation that is accurate to M200 ∼ 1010 M� (Klypinet al. 2011; the cosmological parameters assumed by this simulationare reported in Table 1). Below these mass scales, we use power-law extrapolations. We compare the SDSS stellar mass function tothose derived in Read & Trentham (2005) (hereafter RT05), GAMA(Baldry et al. 2012) and zCOSMOS (Giodini et al. 2012) in Fig. 1.The survey data are described in Section 3.2, while we explorereasons for their different faint end slopes in Section 5.3.
In addition to testing a �CDM cosmology, we explore an effec-tive � ‘warm’ dark matter cosmology (�WDM). This correspondsto a dark matter particle that is relativistic for some time after decou-pling in the early Universe, leading to a suppression in the growthof structure on small scales and at early times (e.g. Avila-Reeseet al. 2001; Bode, Ostriker & Turok 2001). We describe this modelin detail in Section 5.5.
3 TH E DATA
3.1 The rotation curve sample
We compile H I data for 19 isolated dIrrs over the mass range 5 × 10⁵
� M�/M� � 108 from Weldrake, de Blok & Walter (2003) and Ohet al. (2015), and stellar mass and surface density data from Zhanget al. (2012). Our sample selection, which primarily comprises asubset of Little THINGS galaxies, is discussed in detail in Iorio et al.(2016) and R16b. We exclude galaxies that are known to have very
2 Note that such stellar masses are theoretically derived quantities, notdirectly measured from the data. However, this critique applies equally tothe stellar masses derived for M�–M200|rot and M�–M200|abund. As such, thecomparison between these two should not be sensitive to the details of ourstellar mass modelling, so long as we are consistent.
MNRAS 467, 2019–2038 (2017)Downloaded from https://academic.oup.com/mnras/article-abstract/467/2/2019/2957023by University of Groningen useron 23 January 2018
2022 J. I. Read et al.
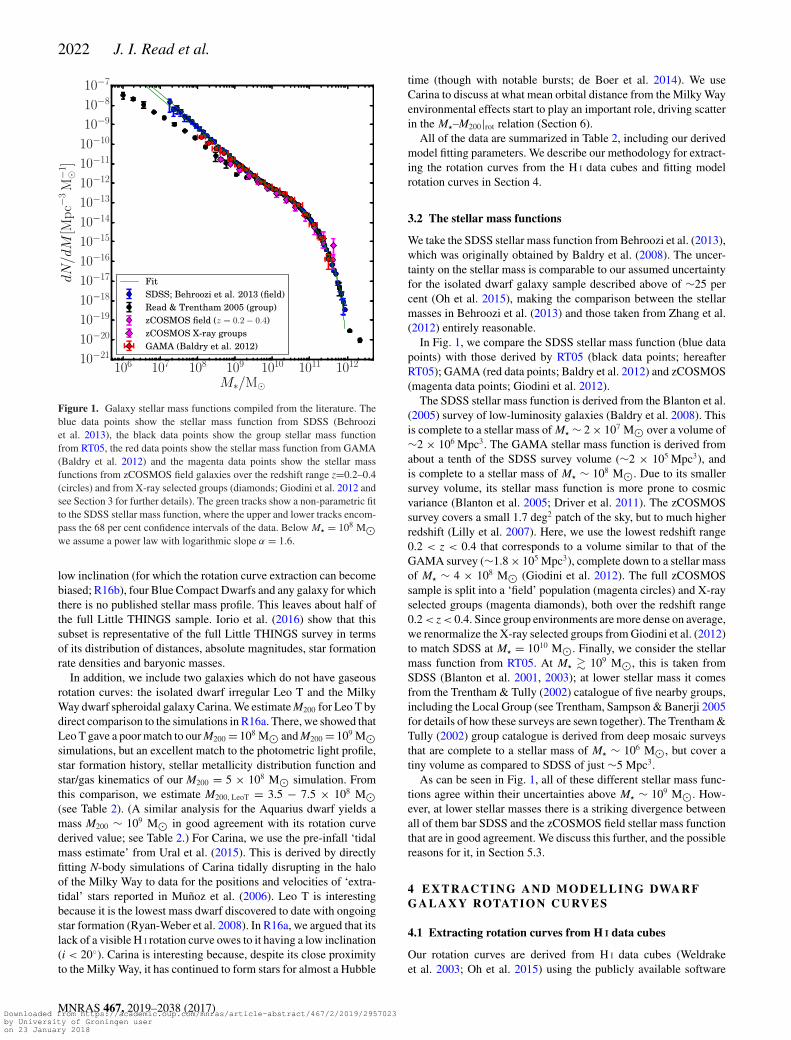
Figure 1. Galaxy stellar mass functions compiled from the literature. Theblue data points show the stellar mass function from SDSS (Behrooziet al. 2013), the black data points show the group stellar mass functionfrom RT05, the red data points show the stellar mass function from GAMA(Baldry et al. 2012) and the magenta data points show the stellar massfunctions from zCOSMOS field galaxies over the redshift range z=0.2–0.4(circles) and from X-ray selected groups (diamonds; Giodini et al. 2012 andsee Section 3 for further details). The green tracks show a non-parametric fitto the SDSS stellar mass function, where the upper and lower tracks encom-pass the 68 per cent confidence intervals of the data. Below M� = 108 M�we assume a power law with logarithmic slope α = 1.6.
low inclination (for which the rotation curve extraction can becomebiased; R16b), four Blue Compact Dwarfs and any galaxy for whichthere is no published stellar mass profile. This leaves about half ofthe full Little THINGS sample. Iorio et al. (2016) show that thissubset is representative of the full Little THINGS survey in termsof its distribution of distances, absolute magnitudes, star formationrate densities and baryonic masses.
In addition, we include two galaxies which do not have gaseousrotation curves: the isolated dwarf irregular Leo T and the MilkyWay dwarf spheroidal galaxy Carina. We estimate M200 for Leo T bydirect comparison to the simulations in R16a. There, we showed thatLeo T gave a poor match to our M200 = 108 M� and M200 = 109 M�simulations, but an excellent match to the photometric light profile,star formation history, stellar metallicity distribution function andstar/gas kinematics of our M200 = 5 × 10⁸ M� simulation. Fromthis comparison, we estimate M200, LeoT = 3.5 − 7.5 × 10⁸ M�(see Table 2). (A similar analysis for the Aquarius dwarf yields amass M200 ∼ 109 M� in good agreement with its rotation curvederived value; see Table 2.) For Carina, we use the pre-infall ‘tidalmass estimate’ from Ural et al. (2015). This is derived by directlyfitting N-body simulations of Carina tidally disrupting in the haloof the Milky Way to data for the positions and velocities of ‘extra-tidal’ stars reported in Munoz et al. (2006). Leo T is interestingbecause it is the lowest mass dwarf discovered to date with ongoingstar formation (Ryan-Weber et al. 2008). In R16a, we argued that itslack of a visible H I rotation curve owes to it having a low inclination(i < 20◦). Carina is interesting because, despite its close proximityto the Milky Way, it has continued to form stars for almost a Hubble
time (though with notable bursts; de Boer et al. 2014). We useCarina to discuss at what mean orbital distance from the Milky Wayenvironmental effects start to play an important role, driving scatterin the M�–M200|rot relation (Section 6).
All of the data are summarized in Table 2, including our derivedmodel fitting parameters. We describe our methodology for extract-ing the rotation curves from the H I data cubes and fitting modelrotation curves in Section 4.
3.2 The stellar mass functions
We take the SDSS stellar mass function from Behroozi et al. (2013),which was originally obtained by Baldry et al. (2008). The uncer-tainty on the stellar mass is comparable to our assumed uncertaintyfor the isolated dwarf galaxy sample described above of ∼25 percent (Oh et al. 2015), making the comparison between the stellarmasses in Behroozi et al. (2013) and those taken from Zhang et al.(2012) entirely reasonable.
In Fig. 1, we compare the SDSS stellar mass function (blue datapoints) with those derived by RT05 (black data points; hereafterRT05); GAMA (red data points; Baldry et al. 2012) and zCOSMOS(magenta data points; Giodini et al. 2012).
The SDSS stellar mass function is derived from the Blanton et al.(2005) survey of low-luminosity galaxies (Baldry et al. 2008). Thisis complete to a stellar mass of M� ∼ 2 × 10⁷ M� over a volume of∼2 × 10⁶ Mpc3. The GAMA stellar mass function is derived fromabout a tenth of the SDSS survey volume (∼2 × 10⁵ Mpc3), andis complete to a stellar mass of M� ∼ 108 M�. Due to its smallersurvey volume, its stellar mass function is more prone to cosmicvariance (Blanton et al. 2005; Driver et al. 2011). The zCOSMOSsurvey covers a small 1.7 deg2 patch of the sky, but to much higherredshift (Lilly et al. 2007). Here, we use the lowest redshift range0.2 < z < 0.4 that corresponds to a volume similar to that of theGAMA survey (∼1.8 × 10⁵ Mpc3), complete down to a stellar massof M� ∼ 4 × 10⁸ M� (Giodini et al. 2012). The full zCOSMOSsample is split into a ‘field’ population (magenta circles) and X-rayselected groups (magenta diamonds), both over the redshift range0.2 < z < 0.4. Since group environments are more dense on average,we renormalize the X-ray selected groups from Giodini et al. (2012)to match SDSS at M� = 1010 M�. Finally, we consider the stellarmass function from RT05. At M� � 109 M�, this is taken fromSDSS (Blanton et al. 2001, 2003); at lower stellar mass it comesfrom the Trentham & Tully (2002) catalogue of five nearby groups,including the Local Group (see Trentham, Sampson & Banerji 2005for details of how these surveys are sewn together). The Trentham &Tully (2002) group catalogue is derived from deep mosaic surveysthat are complete to a stellar mass of M� ∼ 106 M�, but cover atiny volume as compared to SDSS of just ∼5 Mpc3.
As can be seen in Fig. 1, all of these different stellar mass func-tions agree within their uncertainties above M� ∼ 109 M�. How-ever, at lower stellar masses there is a striking divergence betweenall of them bar SDSS and the zCOSMOS field stellar mass functionthat are in good agreement. We discuss this further, and the possiblereasons for it, in Section 5.3.
4 E X T R AC T I N G A N D M O D E L L I N G DWA R FG A L A X Y ROTAT I O N C U RV E S
4.1 Extracting rotation curves from H I data cubes
Our rotation curves are derived from H I data cubes (Weldrakeet al. 2003; Oh et al. 2015) using the publicly available software
MNRAS 467, 2019–2038 (2017)Downloaded from https://academic.oup.com/mnras/article-abstract/467/2/2019/2957023by University of Groningen useron 23 January 2018
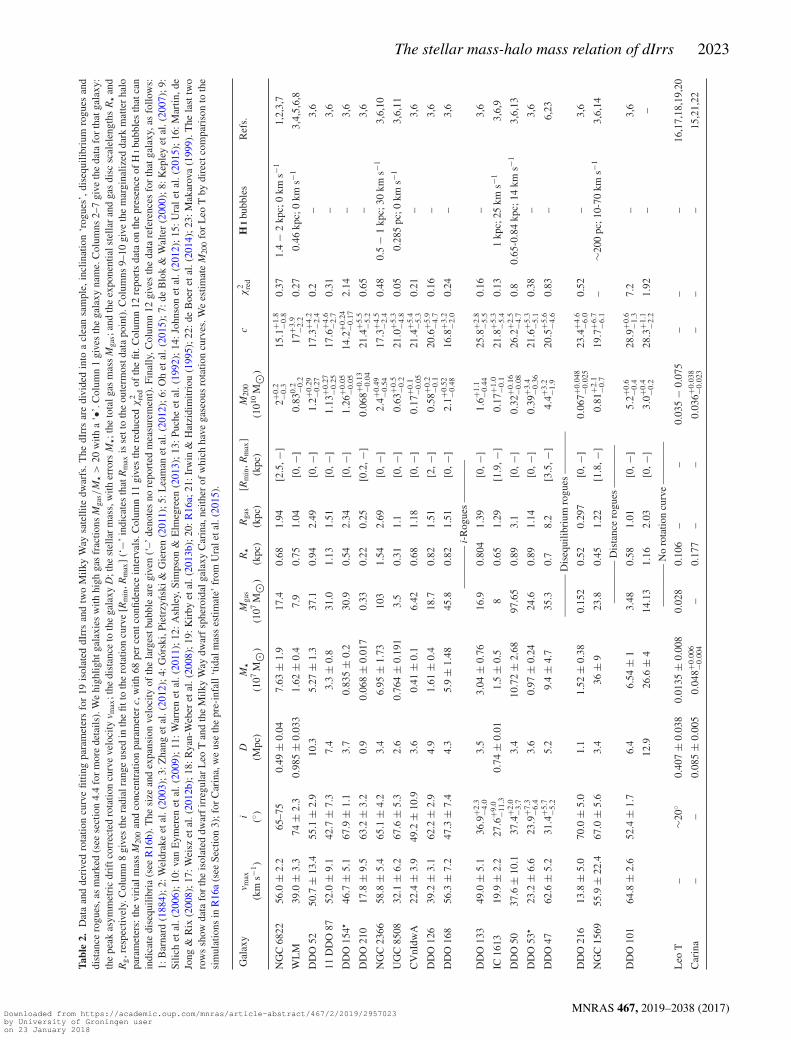
The stellar mass-halo mass relation of dIrrs 2023
Tabl
e2.
Dat
aan
dde
rive
dro
tatio
ncu
rve
fittin
gpa
ram
eter
sfo
r19
isol
ated
dIrr
san
dtw
oM
ilky
Way
sate
llite
dwar
fs.T
hedI
rrs
are
divi
ded
into
acl
ean
sam
ple,
incl
inat
ion
‘rog
ues’
,dis
equi
libri
umro
gues
and
dist
ance
rogu
es,a
sm
arke
d(s
eese
ctio
n4.
4fo
rm
ore
deta
ils).
We
high
light
gala
xies
with
high
gas
frac
tions
Mga
s/M
�>
20w
itha
‘•’.C
olum
n1
give
sth
ega
laxy
nam
e.C
olum
ns2–
7gi
veth
eda
tafo
rth
atga
laxy
:th
epe
akas
ymm
etri
cdr
iftc
orre
cted
rota
tion
curv
eve
loci
tyv m
ax;t
hedi
stan
ceto
the
gala
xyD
;the
stel
lar
mas
s,w
ither
rors
M�;t
heto
talg
asm
ass
Mga
s;an
dth
eex
pone
ntia
lste
llar
and
gas
disc
scal
elen
gths
R�
and
Rg,r
espe
ctiv
ely.
Col
umn
8gi
ves
the
radi
alra
nge
used
inth
efit
toth
ero
tatio
ncu
rve
[Rm
in,R
max
](‘
−’in
dica
tes
that
Rm
axis
sett
oth
eou
term
ostd
ata
poin
t).C
olum
ns9–
10gi
veth
em
argi
naliz
edda
rkm
atte
rha
lopa
ram
eter
s:th
evi
rial
mas
sM
200
and
conc
entr
atio
npa
ram
eter
c,w
ith68
per
cent
confi
denc
ein
terv
als.
Col
umn
11gi
ves
the
redu
ced
χ2 re
dof
the
fit.C
olum
n12
repo
rts
data
onth
epr
esen
ceof
HIbu
bble
sth
atca
nin
dica
tedi
sequ
ilibr
ia(s
eeR
16b)
.The
size
and
expa
nsio
nve
loci
tyof
the
larg
estb
ubbl
ear
egi
ven
(‘–’
deno
tes
nore
port
edm
easu
rem
ent)
.Fin
ally
,Col
umn
12gi
ves
the
data
refe
renc
esfo
rth
atga
laxy
,as
follo
ws:
1:B
arna
rd(1
884)
;2:W
eldr
ake
etal
.(20
03);
3:Z
hang
etal
.(20
12);
4:G
orsk
i,Pi
etrz
ynsk
i&G
iere
n(2
011)
;5:L
eam
anet
al.(
2012
);6:
Oh
etal
.(20
15);
7:de
Blo
k&
Wal
ter
(200
0);8
:Kep
ley
etal
.(20
07);
9:Si
lich
etal
.(20
06);
10:
van
Eym
eren
etal
.(20
09);
11:
War
ren
etal
.(20
11);
12:
Ash
ley,
Sim
pson
&E
lmeg
reen
(201
3);
13:
Puch
eet
al.(
1992
);14
:Jo
hnso
net
al.(
2012
);15
:U
ral
etal
.(20
15);
16:
Mar
tin,d
eJo
ng&
Rix
(200
8);1
7:W
eisz
etal
.(20
12b)
;18:
Rya
n-W
eber
etal
.(20
08);
19:K
irby
etal
.(20
13b)
;20:
R16
a;21
:Irw
in&
Hat
zidi
mitr
iou
(199
5);2
2:de
Boe
ret
al.(
2014
);23
:Mak
arov
a(1
999)
.The
last
two
row
ssh
owda
tafo
rth
eis
olat
eddw
arf
irre
gula
rL
eoT
and
the
Milk
yW
aydw
arf
sphe
roid
alga
laxy
Car
ina,
neith
erof
whi
chha
vega
seou
sro
tatio
ncu
rves
.We
estim
ate
M20
0fo
rL
eoT
bydi
rect
com
pari
son
toth
esi
mul
atio
nsin
R16
a(s
eeSe
ctio
n3)
;for
Car
ina,
we
use
the
pre-
infa
ll‘t
idal
mas
ses
timat
e’fr
omU
rale
tal.
(201
5).
Gal
axy
v max
iD
M�
Mga
sR
�R
gas
[Rm
in,R
max
]M
200
cχ
2 red
HI
bubb
les
Ref
s.(k
ms−
1)
(◦)
(Mpc
)(1
07M
�)(1
07M
�)(k
pc)
(kpc
)(k
pc)
(1010
M�)
NG
C68
2256
.0±
2.2
65–7
50.
49±
0.04
7.63
±1.
917
.40.
681.
94[2
.5,−
]2+0
.2−0
.315
.1+1
.8−0
.80.
371.
4−
2kp
c;0
kms−
11,
2,3,
7
WL
M39
.0±
3.3
74±
2.3
0.98
5±
0.03
31.
62±
0.4
7.9
0.75
1.04
[0,−
]0.
830.
2 −0.2
17+3
.9−2
.20.
270.
46kp
c;0
kms−
13,
4,5,
6,8
DD
O52
50.7
±13
.455
.1±
2.9
10.3
5.27
±1.
337
.10.
942.
49[0
,−]
1.2+0
.29
−0.2
717
.3+4
.2−2
.40.
2–
3,6
11D
DO
8752
.0±
9.1
42.7
±7.
37.
43.
3±
0.8
31.0
1.13
1.51
[0,−
]1.
13+0
.27
−0.2
517
.6+4
.6−2
.70.
31–
3,6
DD
O15
4�46
.7±
5.1
67.9
±1.
13.
70.
835
±0.
230
.90.
542.
34[0
,−]
1.26
+0.0
5−0
.05
14.2
+0.2
4−0
.17
2.14
–3,
6
DD
O21
017
.8±
9.5
63.2
±3.
20.
90.
068
±0.
017
0.33
0.22
0.25
[0.2
,−]
0.06
8+0.1
3−0
.04
21.4
+5.5
−5.2
0.65
–3,
6
NG
C23
6658
.8±
5.4
65.1
±4.
23.
46.
95±
1.73
103
1.54
2.69
[0,−
]2.
4+0.4
9−0
.54
17.3
+4.5
−2.4
0.48
0.5
−1
kpc;
30km
s−1
3,6,
10
UG
C85
0832
.1±
6.2
67.6
±5.
32.
60.
764
±0.
191
3.5
0.31
1.1
[0,−
]0.
63+0
.5−0
.221
.0+5
.3−4
.80.
050.
285
pc;0
kms−
13,
6,11
CV
nIdw
A22
.4±
3.9
49.2
±10
.93.
60.
41±
0.1
6.42
0.68
1.18
[0,−
]0.
17+0
.1−0
.05
21.4
+5.4
−5.3
0.21
–3,
6
DD
O12
639
.2±
3.1
62.2
±2.
94.
91.
61±
0.4
18.7
0.82
1.51
[2,−
]0.
58+0
.2−0
.120
.6+5
.9−4
.70.
16–
3,6
DD
O16
856
.3±
7.2
47.3
±7.
44.
35.
9±
1.48
45.8
0.82
1.51
[0,−
]2.
1+0.5
2−0
.48
16.8
+3.2
−2.0
0.24
–3,
6
——
——
i-R
ogue
s—
——
—
DD
O13
349
.0±
5.1
36.9
+2.3
−4.0
3.5
3.04
±0.
7616
.90.
804
1.39
[0,−
]1.
6+1.1
−0.4
425
.8+2
.8−5
.50.
16–
3,6
IC16
1319
.9±
2.2
27.6
+9.0
−11.
30.
74±
0.01
1.5
±0.
58
0.65
1.29
[1.9
,−]
0.17
+1.0
−0.1
21.8
+5.3
−5.4
0.13
1kp
c;25
kms−
13,
6,9
DD
O50
37.6
±10
.137
.4+2
.0−3
.73.
410
.72
±2.
6897
.65
0.89
3.1
[0,−
]0.
32+0
.16
−0.0
826
.2+2
.5−4
.70.
80.
65-0
.84
kpc;
14km
s−1
3,6,
13
DD
O53
�23
.2±
6.6
23.9
+7.3
−6.4
3.6
0.97
±0.
2424
.60.
891.
14[0
,−]
0.39
+3.4
−0.3
621
.6+5
.3−5
.10.
38–
3,6
DD
O47
62.6
±5.
231
.4+5
.7−5
.25.
29.
4±
4.7
35.3
0.7
8.2
[3.5
,−]
4.4+3
.2−1
.920
.5+5
.6−4
.60.
83–
6,23
——
——
Dis
equi
libri
umro
gues
——
——
DD
O21
613
.8±
5.0
70.0
±5.
01.
11.
52±
0.38
0.15
20.
520.
297
[0,−
]0.
067+0
.048
−0.0
2523
.4+4
.6−6
.00.
52–
3,6
NG
C15
6955
.9±
22.4
67.0
±5.
63.
436
±9
23.8
0.45
1.22
[1.8
,−]
0.81
+2.1
−0.7
19.7
+6.7
−6.1
–∼2
00pc
;10-
70km
s−1
3,6,
14
——
——
Dis
tanc
ero
gues
——
——
DD
O10
164
.8±
2.6
52.4
±1.
76.
46.
54±
13.
480.
581.
01[0
,−]
5.2+0
.6−0
.428
.9+0
.6−1
.37.
2–
3,6
12.9
26.6
±4
14.1
31.
162.
03[0
,−]
3.0+0
.4−0
.228
.3+1
.1−2
.21.
92–
–
——
——
No
rota
tion
curv
e—
——
—
Leo
T–
∼20◦
0.40
7±
0.03
80.
0135
±0.
008
0.02
80.
106
––
0.03
5−
0.07
5–
––
16,1
7,18
,19,
20
Car
ina
––
0.08
5±
0.00
50.
048+0
.006
−0.0
04–
0.17
7–
–0.
036+0
.038
−0.0
23–
––
15,2
1,22
MNRAS 467, 2019–2038 (2017)Downloaded from https://academic.oup.com/mnras/article-abstract/467/2/2019/2957023by University of Groningen useron 23 January 2018

2024 J. I. Read et al.
3DBAROLO (Di Teodoro & Fraternali 2015). 3DBAROLO fits tilted-ringmodels directly to the data cube by building artificial 3D dataand minimizing the residuals, without explicitly extracting velocityfields (as in e.g. Oh et al. 2015). This ensures full control of theobservational effects and, in particular, a proper account of beamsmearing that can strongly affect the derivation of the rotation veloc-ities in the inner regions of dwarf galaxies (see e.g. Swaters 1999).3DBAROLO was extensively tested on mock data in R16b and shownto give an excellent recovery of the rotation curve so long as thebest-fitting inclination angle was ifit > 40◦. The final rotation curveswere corrected for asymmetric drift, as described in R16b and Iorioet al. (2016). The detailed description of the data analysis, includingcomments on individual galaxies, are presented in those papers.
4.2 The mass model
We use the same mass model as described in detail in R16b. Briefly,we decompose the circular speed curve into contributions fromstars, gas and dark matter:
v2c = v2
∗ + v2gas + v2
dm, (4)
where v� and vgas are the contributions from stars and gas, respec-tively, and vdm is the dark matter contribution. We assume that boththe stars and gas are well-represented by exponential discs:
v2∗/gas = 2 GM∗/gas
R∗/gasy2 [I0(y)K0(y) − I1(y)K1(y)] (5)
where M�/gas is the mass of the star/gas disc, respectively; R�/gas
is the exponential scalelength; y = R/M�/gas is a dimensionlessradius parameter; and I0, I1, K0 and K1 are Bessel functions (Binney& Tremaine 2008). We fix the values of R� and Rgas in advanceof running our Markov Chain Monte Carlo (MCMC) models (seeSection 4.3). All values used are reported in Table 2.
For the dark matter profile, we use the CORENFW profile fromR16a:
McNFW(< r) = MNFW(< r)f n (6)
where MNFW( < r) is the usual NFW enclosed mass profile (Navarroet al. 1996b):
MNFW(< r) = M200gc
[ln
(1 + r
rs
)− r
rs
(1 + r
rs
)−1]
(7)
and M200, c, rs, gc, ρcrit and � = 200 are as in equation (1).The function fn generates a shallower profile below a core radius
rc:
f n =[
tanh
(r
rc
)]n
(8)
where the parameter 0 < n ≤ 1 controls how shallow the corebecomes (n = 0 corresponds to no core; n = 1 to complete coreformation). The parameter n is tied to the total star formation time3
tSF:
n = tanh(q); q = κtSF
tdyn(9)
3 More precisely, the total duration of star formation, not to be confusedwith the star formation depletion time-scale tdep = �gas/�SFR (e.g. Bigielet al. 2011).
where tdyn is the circular orbit time at the NFW profile scale radiusrs:
tdyn = 2π
√r3
s
GMNFW(rs)(10)
and κ = 0.04 is a fitting parameter (see R16a). For the isolateddwarfs that we consider here, we assume tSF = 14 Gyr such thatthey have formed stars continuously for a Hubble time. For thisvalue of tSF, n ∼ 1 and we expect the dwarfs to be maximally cored.
The core size is set by the projected half stellar mass radius ofthe stars R1/2:
rc = ηR1/2 (11)
where, for an exponential disc, R1/2 = 1.68R�. By default, we as-sume that the dimensionless core size parameter η = 1.75, sincethis gives the best match to the simulations in R16a. However, asdiscussed in R16a, there could be some scatter in η due to varyinghalo spin, concentration parameter and/or halo assembly history. Weexplore our sensitivity to η in Appendix B where we perform ourrotation curve fits using a flat prior on η over the range 0 < η < 2.75(the upper bound on the η prior is set by energetic arguments;see Appendix B for details). This allows both no core (η = 0),corresponding to an NFW profile, and substantially larger coresthan were found in the R16a simulations. In Appendix B, we showthat the NFW profile (η = 0) is disfavoured at >99 per cent con-fidence, reaffirming the well-known cusp-core problem (see Sec-tion 1). However, as we showed for WLM in R16b, η is otherwisepoorly constrained (though consistent with our default choice ofη = 1.75). Allowing η to vary slightly increases our errors on M200
but is otherwise benign. This is because M200 is set by the outer-most bins of the rotation curve where in many cases it begins toturn over and become flat. Indeed, in Section 5.1, we show thatdemanding an NFW profile leads to a poor rotation curve fit, butlittle change in our derived halo masses. This demonstrates that solong as the dark matter density profile ρdm approaches the NFWform for r > R1/2, our measurements of M200 are not sensitive toour particular CORENFW parametrization of ρdm.
4.3 Fitting the mass model to data and our choice of priors
We fit the above mass model to the data using the EMCEE affineinvariant MCMC sampler from Foreman-Mackey et al. (2013). Weassume uncorrelated Gaussian errors such that the Likelihood func-tion is given by L = exp(−χ2/2). We use 100 walkers, each gen-erating 1500 models and we throw out the first half of these as aconservative ‘burn in’ criteria. We explicitly checked that our re-sults are converged by running more models and examining walkerconvergence. All parameters were held fixed except for the darkmatter virial mass M200, the concentration parameter c, and the to-tal stellar mass M�. We assume a flat logarithmic prior on M200 of8 < log10[M200/M�] < 11, a flat linear prior on c of 14 < c < 30and a flat linear prior on M� over the range given by stellar pop-ulation synthesis modelling, as reported in Table 2. For the mocksimulation data and the real data, we assume an error on M� of25 per cent unless a larger error than this is reported in the literature(Zhang et al. 2012; Oh et al. 2015). The generous prior range on cis set by the cosmic mean redshift z = 0 expectation value of c atthe extremities of the prior on M200 (Maccio et al. 2007). In R16b,we showed that our results are not sensitive to this prior choice.For each galaxy, we fit data over a range [Rmin, Rmax] as reported inTable 2, where ‘−’ means that Rmax was set by the outermost data
MNRAS 467, 2019–2038 (2017)Downloaded from https://academic.oup.com/mnras/article-abstract/467/2/2019/2957023by University of Groningen useron 23 January 2018
The stellar mass-halo mass relation of dIrrs 2025
point. Rmin is marked by thin vertical lines on the individual rotationcurve fits reported in Appendix A. For most galaxies, Rmin = 0. It isonly non-zero where the innermost rotation curve is affected by anexpanding H I bubble (see R16b for further details). In Appendix B,we explore allowing the core size parameter η (equation 11) to varyalso in the fits.
4.4 Tests on mock data and the exclusion of ‘rogues’
Our ability to measure M200 and c from mock rotation curve datawas extensively tested in R16b. There, we showed that there arethree key difficulties that can lead to systematic biases. First, wemust account for cusp-core transformations due to stellar feedbackif we wish to obtain a good fit to the rotation curve inside R1/2.We account for this by using our CORENFW profile (Section 4.2).Secondly, our simulated dwarfs continuously cycle between qui-escent and ‘starburst’ modes that cause the H I rotation curve tofluctuate. This can lead to a systematic bias on M200 of up to halfa dex in the most extreme cases. However, this disequilibrium canbe readily identified by the presence of large and fast-expanding(� 20–30 km s−1) H I superbubbles in the ISM. Thirdly, low incli-nation galaxies, particularly if also undergoing a starburst, can bedifficult to properly inclination correct. Using mock H I data cubes,we found that 3DBAROLO can return a systematically low inclinationif ifit � 40◦. For this reason, if 3DBAROLO returns an inclination ofifit < 40◦, we marginalize over i in our fits assuming a flat prior overthe range 0◦ < i < 40◦. We call such galaxies ‘inclination Rogues’or i-Rogues and we discuss them in Appendix B. (We find that fiveof our 19 dIrrs are i-Rogues.)
Two galaxies – DDO 216 (Pegasus) and NGC 1569 – have highlyirregular rotation curves. For Pegasus, this owes to the limited radialextent of its rotation curve that does not extend beyond R1/2. ForNGC 1569, its inner rotation curve is shallower than required tosupport even its stellar mass, indicating that it is far from equilib-rium. This is further supported by the presence of large and fast-expanding H I holes (see R16b, Table 2 and Johnson et al. 2012)and the fact that it is classified as a ‘Blue Compact Dwarf’, witha very recent starburst some ∼40 Myr ago (McQuinn et al. 2010).[Indeed, Lelli, Verheijen & Fraternali (2014) classify it as having a‘kinematically disturbed H I disc’ and do not attempt to derive itsrotation curve.] From a more theoretical standpoint, R16b and morerecently El-Badry et al. (2017) show that starbursts are expected todrive exactly the sort of disequilibrium seen in NGC 1569. Forthese reasons, we exclude these two ‘disequilibrium rogues’ fromfurther analysis from here on. For completeness, we report theirbest-fitting M200 and c in Table 2 and we show their rotation curvefits in Appendix A.
Finally, one galaxy – DDO 101 – has a very uncertain distance;we refer to this galaxy as a ‘distance Rogue’. We discussed DDO101 in detail in R16b, showing that for a distance of ∼12 Mpc itcan be well fitted by a CORENFW dark matter halo. We considerits position on the M�–M200|rot relation alongside the i-Rogues inAppendix B.
5 R ESULTS
5.1 The rotation curve fits
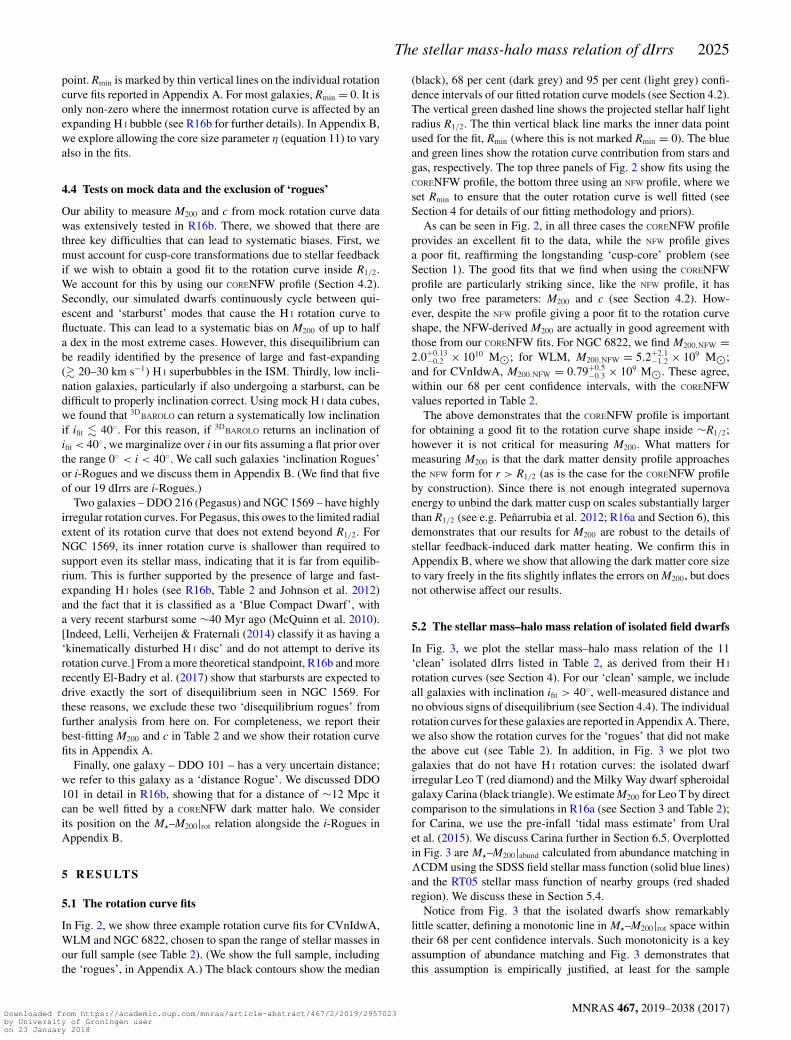
In Fig. 2, we show three example rotation curve fits for CVnIdwA,WLM and NGC 6822, chosen to span the range of stellar masses inour full sample (see Table 2). (We show the full sample, includingthe ‘rogues’, in Appendix A.) The black contours show the median
(black), 68 per cent (dark grey) and 95 per cent (light grey) confi-dence intervals of our fitted rotation curve models (see Section 4.2).The vertical green dashed line shows the projected stellar half lightradius R1/2. The thin vertical black line marks the inner data pointused for the fit, Rmin (where this is not marked Rmin = 0). The blueand green lines show the rotation curve contribution from stars andgas, respectively. The top three panels of Fig. 2 show fits using theCORENFW profile, the bottom three using an NFW profile, where weset Rmin to ensure that the outer rotation curve is well fitted (seeSection 4 for details of our fitting methodology and priors).
As can be seen in Fig. 2, in all three cases the CORENFW profileprovides an excellent fit to the data, while the NFW profile givesa poor fit, reaffirming the longstanding ‘cusp-core’ problem (seeSection 1). The good fits that we find when using the CORENFWprofile are particularly striking since, like the NFW profile, it hasonly two free parameters: M200 and c (see Section 4.2). How-ever, despite the NFW profile giving a poor fit to the rotation curveshape, the NFW-derived M200 are actually in good agreement withthose from our CORENFW fits. For NGC 6822, we find M200,NFW =2.0+0.13
−0.2 × 10¹⁰ M�; for WLM, M200,NFW = 5.2+2.1−1.2 × 10⁹ M�;
and for CVnIdwA, M200,NFW = 0.79+0.5−0.3 × 10⁹ M�. These agree,
within our 68 per cent confidence intervals, with the CORENFWvalues reported in Table 2.
The above demonstrates that the CORENFW profile is importantfor obtaining a good fit to the rotation curve shape inside ∼R1/2;however it is not critical for measuring M200. What matters formeasuring M200 is that the dark matter density profile approachesthe NFW form for r > R1/2 (as is the case for the CORENFW profileby construction). Since there is not enough integrated supernovaenergy to unbind the dark matter cusp on scales substantially largerthan R1/2 (see e.g. Penarrubia et al. 2012; R16a and Section 6), thisdemonstrates that our results for M200 are robust to the details ofstellar feedback-induced dark matter heating. We confirm this inAppendix B, where we show that allowing the dark matter core sizeto vary freely in the fits slightly inflates the errors on M200, but doesnot otherwise affect our results.
5.2 The stellar mass–halo mass relation of isolated field dwarfs
In Fig. 3, we plot the stellar mass–halo mass relation of the 11‘clean’ isolated dIrrs listed in Table 2, as derived from their H I
rotation curves (see Section 4). For our ‘clean’ sample, we includeall galaxies with inclination ifit > 40◦, well-measured distance andno obvious signs of disequilibrium (see Section 4.4). The individualrotation curves for these galaxies are reported in Appendix A. There,we also show the rotation curves for the ‘rogues’ that did not makethe above cut (see Table 2). In addition, in Fig. 3 we plot twogalaxies that do not have H I rotation curves: the isolated dwarfirregular Leo T (red diamond) and the Milky Way dwarf spheroidalgalaxy Carina (black triangle). We estimate M200 for Leo T by directcomparison to the simulations in R16a (see Section 3 and Table 2);for Carina, we use the pre-infall ‘tidal mass estimate’ from Uralet al. (2015). We discuss Carina further in Section 6.5. Overplottedin Fig. 3 are M�–M200|abund calculated from abundance matching in�CDM using the SDSS field stellar mass function (solid blue lines)and the RT05 stellar mass function of nearby groups (red shadedregion). We discuss these in Section 5.4.
Notice from Fig. 3 that the isolated dwarfs show remarkablylittle scatter, defining a monotonic line in M�–M200|rot space withintheir 68 per cent confidence intervals. Such monotonicity is a keyassumption of abundance matching and Fig. 3 demonstrates thatthis assumption is empirically justified, at least for the sample
MNRAS 467, 2019–2038 (2017)Downloaded from https://academic.oup.com/mnras/article-abstract/467/2/2019/2957023by University of Groningen useron 23 January 2018
2026 J. I. Read et al.
Figure 2. Rotation curve fits for three example galaxies: CVnIdwA, WLM and NGC 6822, chosen to span the range of stellar masses in our full sample(see Table 2). We show the full sample, including the ‘rogues’, in Appendix A. The black contours show the median (black), 68 per cent (dark grey) and95 per cent (light grey) confidence intervals of our fitted rotation curve models (see Section 4.2). The vertical green dashed line shows the projected stellar halflight radius R1/2. The thin vertical black line marks the inner data point used for the fit, Rmin (where this is not marked Rmin = 0). The blue and green linesshow the rotation curve contribution from stars and gas, respectively. The top three panels show fits using our CORENFW profile that accounts for cusp-coretransformations due to stellar feedback (see Section 4.2). These give an excellent fit to the rotation curve shape in all three cases. The bottom three panelsshow fits using an NFW profile, where we set Rmin to ensure that the outer rotation curve is well fitted. This gives a much poorer fit to the rotation curve shape,reaffirming the longstanding ‘cusp-core’ problem.
of isolated dIrrs that we consider here. There is, however, onesignificant outlier, DDO 154. We discuss this interesting galaxyfurther in Section 6.
5.3 The stellar mass function in groups and in the field
In this section, we compare four stellar mass functions taken fromthe literature, as reported in Fig. 1. The blue data points show thestellar mass function from SDSS (Behroozi et al. 2013), the reddata points from GAMA (Baldry et al. 2012), the black data pointsfrom RT05 and the magenta data points from zCOSMOS (Giodiniet al. 2012). (See Section 3 for a description of these surveys.)The green tracks show a non-parametric fit to the SDSS stellarmass function, where the upper and lower tracks encompass the68 per cent confidence intervals of the data. Below M� = 108 M�,we fit a single power law to the SDSS data and use this to extrapolateto lower stellar mass. As in Baldry et al. (2008), we find a best-fittinglogarithmic slope of α = 1.6, where dN/dM|M∗<108 M� ∝ M−α .
5.3.1 Evidence for a shallower group stellar mass function belowM� ∼ 109 M�First, notice that below M� ∼ 109 M� the SDSS and RT05 stel-lar mass functions diverge, with the RT05 mass function becoming
substantially shallower. This difference has been noted previouslyin the literature (e.g. Baldry et al. 2008) but to date has remainedunexplained. Here, we suggest that it owes to an environmentaldependence. The RT05 stellar mass function was built using a com-pilation of SDSS data at the bright end, and the luminosity functionof the Trentham & Tully (2002) local groups catalogue at the faintend (see Section 3.2). Thus, by construction, below M� ∼ 109 M�RT05 measured the stellar mass function of nearby galaxy groups.Indeed, we find further evidence for this from the zCOSMOS sur-vey. Giodini et al. (2012) split the zCOSMOS stellar mass func-tion into a ‘field galaxy’ sample (Fig. 1; magenta circles) and anX-ray selected group sample (magenta diamonds) over the redshiftrange z = 0.2–0.4. As can be seen in Fig. 1, the zCOSMOS stel-lar mass functions are only complete down to M� ∼ 4 × 10⁸ M�(see Section 3) but nonetheless, at this mass scale, there is a sta-tistically significant bifurcation between the zCOSMOS field andgroup samples that matches that seen in SDSS and RT05.
There are two key challenges involved in comparing zCOSMOSwith RT05 and SDSS. First, the redshift range of the surveys isdifferent (see Section 3). However, this is not a significant effectsince the stellar mass function is known to be almost constant outto z = 0.5 (Behroozi et al. 2013). (Indeed, we find no differencebetween the zCOSMOS field stellar mass function (magenta circles)and that of SDSS (blue data points) down to M� ∼ 4 × 10⁸ M�.)
MNRAS 467, 2019–2038 (2017)Downloaded from https://academic.oup.com/mnras/article-abstract/467/2/2019/2957023by University of Groningen useron 23 January 2018
The stellar mass-halo mass relation of dIrrs 2027
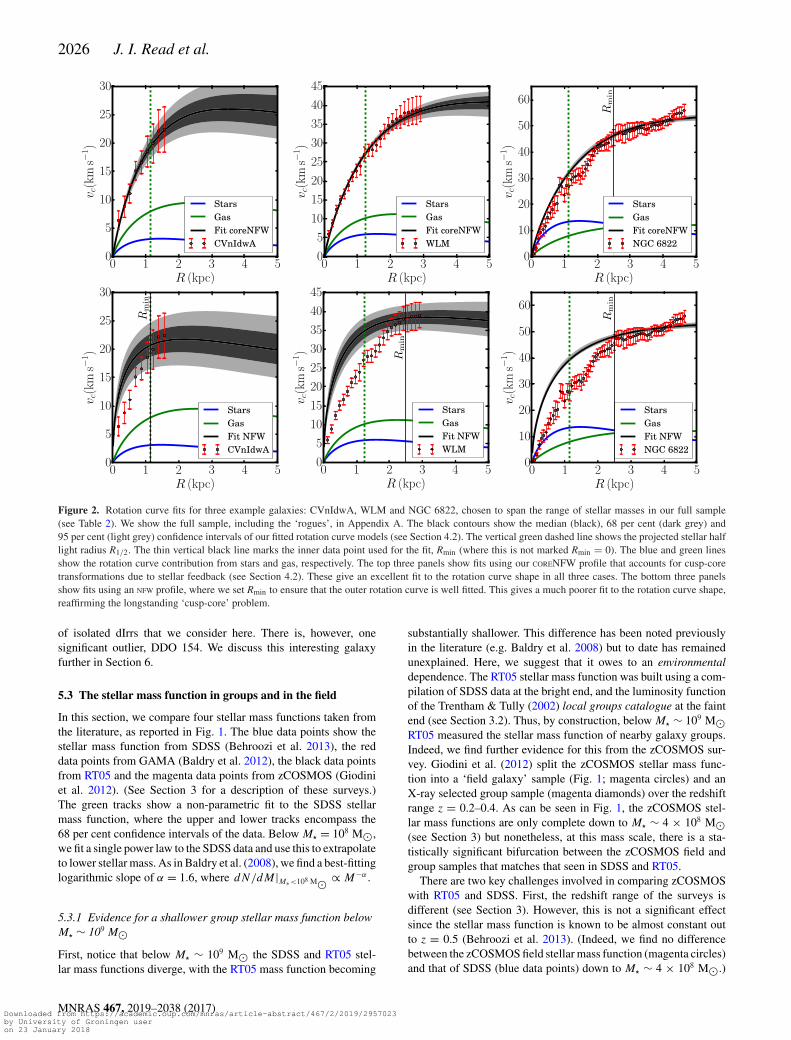
Figure 3. The stellar mass–halo mass relation of 11 isolated dIrr galaxies,derived from their H I rotation curves (M�–M200|rot), and two galaxies thatdo not have H I rotation curves: the isolated dwarf irregular Leo T (diamond)and the Milky Way dwarf spheroidal galaxy Carina (black triangle). (Themasses of these two galaxies are derived as described in Section 3.) Alldata are reported in Table 2. Overplotted are M�–M200|abund calculated fromabundance matching in �CDM using the SDSS field stellar mass function(solid blue lines) and the RT05 stellar mass function of nearby groups (redshaded region). The lines are dashed where they rely on a power-law extrap-olation of the SDSS stellar mass function below M� ∼ 107 M�. Notice thatM�–M200|abund (blue lines) gives a remarkable match to M�–M200|rot (purpledata points) down to M200 ∼ 5 × 10⁹ M�, and M200 ∼ 5 × 10⁸ M� if weuse the power-law extrapolation of the SDSS stellar mass function (dashedlines). However, M�–M200|abund derived from the stellar mass function ofnearby galaxy groups (red shaded region) gives a poor match.
Secondly, the definition of a ‘group’ differs. The Giodini et al.(2012) groups are selected based on co-added XMM and ChandraX-ray images, using a wavelet method to detect extended emission(Finoguenov et al. 2007). In this way, they find groups over themass range 0.14 < M500/(1013M�) < 26. By contrast, Trentham &Tully (2002) study five nearby optically selected groups, includingthe Local Group. Only one of these has reported X-ray emission(Romanowsky et al. 2009), but they do span a similar mass rangeto the Giodini et al. (2012) sample (Zhang et al. 2007; Makarov& Karachentsev 2011; Penarrubia et al. 2016). For these reasons,a direct comparison between the Trentham & Tully (2002) andGiodini et al. (2012) groups is reasonable. Indeed, their stellar massfunctions agree remarkably well down to the stellar mass limit ofthe zCOSMOS survey (compare the magenta diamonds and blackdata points in Fig. 1).
Finally, consider the GAMA stellar mass function in Fig. 1(red data points). This agrees well with both the zCOSMOS fieldsample (magenta circles) and SDSS (blue data points) down toM� ∼ 2 × 10⁸ M�. The one data point below this is slightly, thoughnot statistically significantly, shallower than SDSS. It is beyond thescope of this present work to explore this discrepancy in any detail,though it has been noted previously (e.g. Baldry et al. 2012). Asemphasized in Section 3, the GAMA survey covers about one tenth
of the volume of SDSS and is complete only at a higher stellarmass. For these reasons, we will use the SDSS stellar mass functionfor the remainder of this paper. We discuss the GAMA stellar massfunction further in Section 6.
5.3.2 The origin of the M� ∼ 109 M� mass scale
The shallower group stellar mass function that we find here isperhaps not surprising. It has long been known that satellites arequenched on infall to groups due to a combination of ram-pressurestripping and tides (e.g. Peng et al. 2012; Gatto et al. 2013; Carolloet al. 2013). Ram pressure shuts down star formation, leading toa lower stellar mass for a given pre-infall halo mass, while tidesphysically destroy haloes depleting the dark matter subhalo massfunction. In the Milky Way, this is evidenced by the ‘distance–morphology’ relation: most satellites within ∼200 kpc of the Galac-tic Centre have truncated star formation and are devoid of gas,while those at larger radii have H I and are currently forming stars(e.g. Haynes, Giovanelli & Chincarini 1984; Mateo 1998; Mayeret al. 2001b; Grebel, Gallagher & Harbeck 2003; Tolstoy, Hill &Tosi 2009; McConnachie 2012; Gatto et al. 2013).
It is interesting to ask, however, whether ram pressure or tidescan explain why the stellar mass function is affected only belowM� ∼ 109 M�. In R16a, we calculated the effect of tides on satellitesorbiting within a Milky Way mass host (their section 4.3). The effectis maximized if satellites have their dark matter cusps transformedinto cores. But even in this extremum limit, satellites are only fullydestroyed if they have a pericentre of rp � 30 kpc and a mass M200 �1010 M�. Using our M�–M200|rot relation in Fig. 3, this correspondsto a stellar mass of M� ∼ 2 − 3 × 10⁷ M�, suggesting that tidesare not likely to be the primary cause of the shallower group stellarmass function that we find here.
The second potential culprit is ram pressure. This occurs when(Gatto et al. 2013):
ρh(rp)v2p � 1
5ρd
v2max
2(12)
where ρh is the coronal gas density of the host at pericentre; vp isthe velocity of the satellite at pericentre; ρd is the density of gasin the dwarf ISM; vmax is the peak rotational velocity of the dwarf4
and the factor 1/5 accounts for non-linear effects (Gatto et al. 2013).For a satellite falling into the Milky Way, ρh ∼ 3 ×
10−4 atoms cm−3; vp ∼ 450 km s−1; and ρd ∼ 0.1 atoms cm−3
(Gatto et al. 2013). Thus, we can rearrange equation (12) to providea limiting vmax below which ram pressure becomes important:
vmax,ram =√
10ρh
ρdvp ∼ 78 km s−1. (13)
This is similar to the vmax of the LMC (van der Marel et al. 2002) thathas a stellar mass of M� ∼ 1.5 × 10⁹ M� (McConnachie 2012). Thissuggests that the shallower group stellar mass function that we findhere owes to satellite quenching, driven primarily by ram pressure.Indeed, Geha et al. (2012) found, using SDSS data, that all fieldgalaxies above M� = 109 M� are star-forming today, independentof environment. By contrast, galaxies with M� < 109 M� can be
4 We have assumed here that v2max 2σ 2∗ , where σ� is the stellar velocity
dispersion of the dwarf. This amounts to an assumption of a flat, isothermal,rotation curve for the dwarf (e.g. Binney & Tremaine 2008).
MNRAS 467, 2019–2038 (2017)Downloaded from https://academic.oup.com/mnras/article-abstract/467/2/2019/2957023by University of Groningen useron 23 January 2018
2028 J. I. Read et al.
quenched, with the quenched fraction increasing with proximity toa larger host galaxy.
5.4 Abundance matching in groups and in the field
In this section, we measure M�–M200|abund using the stellar massfunctions in Fig. 1 matched to the �CDM Bolshoi simulation(Klypin et al. 2011). Our abundance matching is ‘non-parametric’in the sense that we numerically integrate the curves in Fig. 1 toobtain the cumulative stellar mass function; we then match thesenumerically to the cumulative halo mass function from the Bolshoisimulation. For this latter, we use a Schechter function fit to thehalo mass function, defining the ‘halo mass’ as the virial mass M200
before infall.The results are shown in Fig. 3 for the SDSS field stellar mass
function (blue lines) and the RT05 group stellar mass function(red shaded region). The lines are dashed where they rely on apower-law extrapolation of the SDSS stellar mass function be-low M� ∼ 107 M�. (We compare and contrast our abundancematching results with previous determinations in the literature inAppendix C.)
Notice that M�–M200|abund (blue lines) gives a remarkable matchto M�–M200|rot (purple data points) down to M200 ∼ 5 × 10⁹ M�,and M200 ∼ 5 × 10⁸ M� if we use the power-law extrapolationof SDSS. However, M�–M200|abund derived from the stellar massfunction of nearby galaxy groups (RT05; red shaded region) gives apoor match. In particular, it leads to the familiar result that all dwarfgalaxies must inhabit implausibly massive ∼1010 M� haloes (e.g.Read et al. 2006) that has become known as the ‘too big to fail’(TBTF) problem (e.g. Boylan-Kolchin et al. 2011).
There are a number of problems with using the RT05 stellar massfunction for ‘classical’ abundance matching as we have done here.First, we have assumed a monotonic relation between M� and M200.We have shown that this is true for our sample of isolated dIrrs(Section 5.2), but we expect it to fail for satellites whose M� willdepend on M200, their time of infall and their orbit, inducing scatterin M� for a given pre-infall M200 (e.g. Ural et al. 2015; Tomozeiu,Mayer & Quinn 2016; Garrison-Kimmel et al. 2017, and see Sec-tion 5.3.2). Secondly, there is what we might call a ‘volume prob-lem’. If we wish to match a pure-dark matter simulation to the MilkyWay, what volume should we use to normalize the Milky Way satel-lite mass function? Brook et al. (2014) and Garrison-Kimmel et al.(2014, hereafter G-K14) solve this by explicitly matching satellitesto constrained simulations of the Local Group. Here, we solve itby using the RT05 stellar mass function. This solves the ‘volumeproblem’ by renormalizing the group stellar mass functions derivedfrom Trentham & Tully (2002) to match SDSS at the bright end (seeSection 3). Since this normalizes the volume to SDSS field galaxies,we must then abundance match RT05 with the full Bolshoi simula-tion, as we have done here. Indeed, in Appendix C we verify thatour RT05 M�–M200|abund relation, derived in this way, agrees verywell with those derived independently by Brook et al. (2014) andG-K14. Finally, there is the problem of satellite quenching. As dis-cussed in Section 5.3.2, satellites can have their star formation shutdown by ram-pressure stripping, or be tidally disrupted on infall.Tidal stripping is already dealt with, in part, by using the pre-infallM200 (e.g. Diemand, Kuhlen & Madau 2007). However, we expecttidal disruption to be enhanced by cusp-core transformations andthe presence of the stellar disc, neither of which are captured by puredark matter simulations (e.g. Read et al. 2006; D’Onghia et al. 2010;Penarrubia et al. 2010; Zolotov et al. 2012; Wetzel et al. 2016, andsee the discussion in R16a).
For all of the above reasons, we expect ‘classical’ abundancematching with the RT05 stellar mass function to fail. Nonethe-less, it is instructive because the key assumptions that go into itare common in the literature (e.g. G-K14; Brook et al. 2014). In-deed, it is likely that these assumptions are responsible for the nowlongstanding ‘missing satellites’ and TBTF problems that manifestfor satellite galaxies below MTBTF ∼ 1010 M� (Read et al. 2006;Boylan-Kolchin, Bullock & Kaplinghat 2011; Tollerud, Boylan-Kolchin & Bullock 2014, and see Section 1). The fact that M�–M200|rot matches M�–M200|abund for our sample of isolated dIrrsdemonstrates that every isolated field halo is occupied with a dIrrdown to M200 ∼ 5 × 10⁹ M� and to M200 ∼ 5 × 10⁸ M� if we usethe power-law extrapolation of SDSS. Furthermore, these dwarfsinhabit dark matter haloes that are perfectly consistent with theirobserved gaseous rotation curves. Thus, our sample of isolated dIrrs– that extend to M200 < MTBTF – has no missing satellites or TBTFproblem, suggesting that both depend on environment. We discussthis further in Section 6.
5.5 Constraints on warm dark matter
We have shown so far that the field dIrr M�–M200|abund is consis-tent with M�–M200|rot in �CDM. In this section, we consider howwell these match in a �WDM cosmology. We use the formulae inSchneider et al. (2012) to transform the Bolshoi halo mass function,derived for �CDM, to one in �WDM5:
dN
dM
∣∣∣∣WDM
= dN
dM
∣∣∣∣CDM
(1 + Mhm
M
)−β
(14)
where Mhm = 4/3πρcrit(λhm/2)3 is the ‘half mode mass’, β = 1.16,λhm is the ‘half mode’ scalelength, given by:
λhm = 0.683(mWDM
keV
)−1.11(
�M
0.25
)0.11 (h
0.7
)1.22
Mpc h−1, (15)
where mWDM is the warm dark matter particle mass in keV, �M isthe matter density of the Universe at redshift z = 0, and h is theHubble parameter (we assume the same cosmological parametersas in the Bolshoi simulation; see Table 1.).
In Fig. 4, we show tracks of M�–M200|abund in �WDM for varyingthermal relic mass over the range 1 < mWDM < 5 keV, as marked(green lines). Where these lines rely on the extrapolated SDSSstellar mass function, they are dashed. We deliberately pick themost conservative limits by using the lower bound of the SDSSstellar mass function to calculate M�–M200|abund.
As can be seen from Fig. 4, without using the power-law extrap-olation of the SDSS stellar mass function below M� ∼ 107 M�, wecan rule out mWDM < 1.25 keV at 68 per cent confidence. Using thepower-law extrapolation, this limit improves to mWDM < 2 keV at68 per cent confidence. If we further add the Leo T data point, thenthis tightens to mWDM < 3 keV. However, for this limit to become
5 There is a known problem in the literature with the formation of spurioushaloes at the resolution limit in WDM simulations (e.g. Wang & White 2007;Angulo, Hahn & Abel 2013; Hahn, Abel & Kaehler 2013; Lovell et al. 2014;Hobbs et al. 2016). Equation (14) is derived from fits to N-body simulationswhere such spurious haloes have been pruned from the analysis. We refer toit as describing an ‘effective warm dark matter’ cosmology because it reallydescribes a suppression in the halo mass function at low mass, parametrizedby an effective thermal relic mass, mWDM. More realistic WDM models willshow model-specific features in the small-scale matter power spectrum (seee.g. Boyarsky et al. 2009 for sterile neutrino models). It is beyond the scopeof this present work to test such models in detail.
MNRAS 467, 2019–2038 (2017)Downloaded from https://academic.oup.com/mnras/article-abstract/467/2/2019/2957023by University of Groningen useron 23 January 2018

The stellar mass-halo mass relation of dIrrs 2029
Figure 4. M�–M200|rot (purple data points) as compared to M�–M200|abund
in �CDM (blue lines) and �WDM (green lines), using the SDSS field stellarmass function. The thermal relic mass mWDM is marked on the curves inkeV. The lines and symbols are as in Fig. 3.
robust we would need to find many more Leo T-like galaxies in theLocal Volume, ideally with measured rotation curves. We discussthis further in Section 6.
Our limit on mWDM approaches the latest limits fromthe Lyman α forest (e.g. Baur et al. 2016). It is competitive witha more model-dependent limit from Local Group satellite galax-ies (e.g. Anderhalden et al. 2013) and a recent constraint from thehigh-redshift UV luminosity function (Menci et al. 2016). We dis-cuss how our constraint will improve with a deeper stellar massfunction and/or a complete census of low-mass isolated dwarfs inSection 6.
6 D ISCUSSION
6.1 A shallower group stellar mass function belowM� ∼ 109 M�In Section 5.3, we argued that the stellar mass function is shallowerin groups below M� ∼ 109 M�. It has been noted already in theliterature that there are significant differences in both the luminosityand stellar mass functions of galaxy clusters and field galaxies(e.g. Trentham 1998; Xia et al. 2006; Bolzonella et al. 2010; Penget al. 2010, 2012; Eckert et al. 2016). However, a similar suchenvironmental dependence on group scales has proven more elusive.Using SDSS data, Yang, Mo & van den Bosch (2009) found nodifference between the stellar mass function in groups and the field.However, they were only complete down to M� ∼ 109 M� andso would not have been able to detect the difference that we findhere. In principle, it should be possible to split the SDSS luminosityfunction in Blanton et al. (2005) into a group and field sample to testour findings, but this is beyond the scope of this present work. As wenoted in Section 5.3, it is compelling that Geha et al. (2012) reporta field galaxy quenching mass scale of M� = 109 M� that dependson proximity to a larger host galaxy. This is precisely the stellarmass scale at which we calculated that ram-pressure stripping will
become important (Section 5.3.2), and it is precisely the mass scaleat which we find a suppression in the group stellar mass function.We will explore these ideas further in future work.
6.2 The missing satellite problem and TBTF in groups and thefield
We have shown that abundance matching in �CDM is con-sistent with isolated dwarf galaxy rotation curves down toM200 ∼ 5 × 10⁹ M�, and M200 ∼ 5 × 10⁸ M� if we assumea power-law extrapolation of the SDSS stellar mass function. Adirect corollary of this is that every single halo in the field is occu-pied with a galaxy down to these limits and, furthermore, that theirgas dynamics are consistent with the halo that they live in. Thismeans that there is no ‘missing satellites’ or TBTF problem in thefield down to these limits.
The above is interesting because both the missing satellites andTBTF problems occur in the Milky Way and Andromeda satel-lite population below a mass scale of MTBTF ∼ 1010 M� (Readet al. 2006; Boylan-Kolchin et al. 2011; Tollerud et al. 2014). Ifthere is no similar problem at this mass scale for isolated ‘field’galaxies, then both problems must owe to some environmental ef-fect. Indeed, a likely culprit is quenching due to ram pressure oninfall to groups, as we have discussed already in Section 5.3.2. Itis beyond the scope of this paper to determine whether or not suchenvironmental processes can fully solve the missing satellites andTBTF problems inside groups. However, it is hard to understandhow some change to the underlying cosmological model could actinside groups but not in the field. For this reason, we assert thatboth of these small-scale puzzles must owe to ‘galaxy formationphysics’, rather than exotic cosmology.
A final implication of the above result is that we expect significantscatter in M� for a given pre-infall M200 inside groups. This meansthat, inside groups, classical ‘monotonic’ abundance matching willfail (see also Ural et al. 2015; Tomozeiu et al. 2016). However, moresophisticated mappings between dark and luminous subhaloes thattake account of the radial or orbit distribution of satellites couldstill work (e.g. Lux, Read & Lake 2010; Maccio et al. 2010; An-derhalden et al. 2013). Similarly, it may be possible to build aworking abundance matching model that simply introduces signifi-cant scatter in the M� − M200 relation below some stellar mass scale(e.g. Jethwa, Belokurov & Erkal 2016; Garrison-Kimmel et al. 2017,and see Appendix C).
6.3 Comparison with other works
Our result that there is no missing satellites or TBTF problemfor field dIrrs is apparently at odds with Klypin et al. (2015) andPapastergis et al. (2015) who report a severe abundance/TBTF prob-lem in the Local Volume. To arrive at this conclusion, both studiescompare the distribution function of H I velocity line widths of asample of Local Volume galaxies with predictions from the Bolshoisimulation. However, this relies on being able to convert H I veloc-ity line widths to the peak rotation velocity of dark matter haloes,vmax. Brook & Shankar (2016) have argued that this conversionis complex, particularly for dwarfs with vmax < 50 km s−1. Withreasonable assumptions, they find that they can reconcile �CDMwith the data in Klypin et al. (2015) (and see also Papastergis &Shankar 2016). Recently, however, Trujillo-Gomez et al. (2016)have revived the debate. They take similar care with the conversionfrom H I line widths to vmax, accounting for ‘cusp-core’ transforma-tions due to stellar feedback. Yet, they find that the Local Volume
MNRAS 467, 2019–2038 (2017)Downloaded from https://academic.oup.com/mnras/article-abstract/467/2/2019/2957023by University of Groningen useron 23 January 2018
2030 J. I. Read et al.
abundance problem persists. It is beyond the scope of this workto explore this further, but we note that if the stellar mass func-tion is shallower inside groups, then it is likely to be suppressedalso on the ∼10 Mpc3 scale of the Local Volume. If this is thecase, then Local Volume galaxies should lie on the M�–M200|rot
relation that we find here, but have a stellar mass function that isshallower than SDSS.
Our results are also in tension with the higher redshift studyof Miller et al. (2014). They derive an M�–M200|rot relation forgalaxies over the redshift range 0.2 < z < 1, finding a significantoffset from M�–M200|abund. However, due to the higher redshift oftheir galaxy sample, they have only a single measure of the rota-tional velocity at 2.2 disc scalelengths. This is then extrapolatedto the velocity at the virial radius V200 via a weak lensing cali-bration at a stellar mass of log10[M�/M�] = 9.0. As highlightedby Miller et al. (2014), this could introduce a potentially largesystematic error. Furthermore, it is challenging with just a sin-gle measurement of the rotation velocity to identify ‘rogues’ (seeFigs A1–A3). We will explore the Miller et al. (2014) data furtherin future work.
More similar to our analysis here is the recent study of P16.They use the baryon-influenced mass models from Di Cintio et al.(2014) to fit rotation curves and measure M200 and c for a largesample of dwarfs in the Little THINGS and THINGS surveys.Comparing their results with abundance matching predictions, sim-ilarly to our analysis here, they arrive at the opposite conclusionthat �CDM is inconsistent with the data. Our analyses are suf-ficiently different that a detailed comparison is somewhat chal-lenging, but we note here three key differences that likely leadto this apparent discrepancy: (i) P16 use the Little THINGS andTHINGS rotation curves, whereas we derive the rotation curvesusing 3DBAROLO (Iorio et al. 2016); (ii) P16 use the Di Cintio et al.(2014) model that does not show cusp-core transformations be-low M200 ∼ 1010 M�, whereas we use the CORENFW profile fromR16a that does; and (iii) P16 primarily compare their results withM�–M200|abund from G-K14, whereas we favour matching the SDSSstellar mass function to the Bolshoi simulation. The most signifi-cant of these is (iii). The G-K14 M�–M200|abund relation relies onLocal Group galaxies. This is problematic since – as we arguedin Section 5.4 – classical abundance matching is expected to failinside groups. Indeed, using the RT05 group stellar mass function,we derive an (erroneous) M�–M200|abund relation that is remarkablysimilar to that derived in G-K14, and a similar relation derived inBrook et al. 2014 (see Appendix C).
A similar critique explains the apparent discrepancy betweenour findings here and the earlier work of Ferrero et al. (2012).They find, in agreement with us, that galaxies with stellar massM� � 3 × 10⁷ M� inhabit haloes with mass M200 � 1010 M�.However, they argue that this is at odds with abundance match-ing in �CDM. Similarly to P16, this is because they use a steepM�–M200|abund that is similar to our erroneous RT05 ‘group’ re-lation. Using the shallower field galaxy SDSS M�–M200|abund, theFerrero et al. (2012) results are in good agreement with ours.
Finally, Katz et al. (2017) have recently compared the Di Cintioet al. (2014) model to data for 147 rotation curves from the SPARCsample. Comparing their derived M�–M200|rot relation with M�–M200|abund, they conclude similarly to us here that �CDM worksvery well. In this case, there is no discrepancy. Katz et al. (2017)focus on galaxies that are substantially more massive than those westudy here, with M200 > 1010 M�. In this sense, the Katz et al.(2017) study is wholly complementary to ours that focuses on theregime M200 < 1010 M�.
6.4 The interesting outlier DDO 154
As discussed in Section 5.2, our M�–M200|rot relation in Fig. 3 hasone significant outlier, DDO 154. This galaxy also has an unusuallyhigh H I gas mass fraction, with MHI/M∗ = 37. At its currently ob-served star formation rate of M∗ = 3.82 × 10⁻³ (Zhang et al. 2012),DDO 154 would move on to our M�–M200|rot relation in ∼5.7 Gyr.This is an interesting time-scale. In �CDM, most major galaxymergers are complete by redshift z = 1 some ∼8 Gyr ago (e.g.Stewart et al. 2009). Thus, if post-merger isolated dwarfs look likeDDO 154, then most would have had time to deplete their excess H I
gas and move on to the M�–M200|rot relation by today. A possible ex-planation for DDO 154, then, is that it has just undergone a relativelyrare late merger. We will explore this idea further in future work.
6.5 How close is too close?
It is interesting to ask how close to the Milky Way satellites can orbitbefore they become quenched. The Carina dwarf spheroidal is par-ticularly interesting in this regard. Its orbit remains highly uncertaindue to its large proper motion errors, but Lux et al. (2010) find that itseems to be substantially more circular than the mean of subhaloesin a �CDM pure dark matter simulation. With an apo-to-pericentreratio of rp/ra = 0.3 − 0.7, it is also potentially more circular thanall of the other Milky Way dwarfs, except one: Fornax. Fornax is ona cosmologically unusual near circular orbit, with rp/ra ∼ 0.6–0.8(Lux et al. 2010). Along with Carina, it is the only other Milky Waydwarf spheroidal that has continued to form stars for nearly a Hubbletime (del Pino et al. 2013). Such circularity may be the key to thesedwarfs’ ability to continue to form stars, lending further support tothe idea that quenching is driven primarily by ram pressure. Fromequation (12), we can see that ram pressure is proportional to thesatellite velocity at pericentre squared: v2
p . Circular orbits minimizevp and will therefore also minimize the effect of ram-pressure strip-ping. The fact that Carina appears to lie on the M�–M200|rot relationof isolated dwarfs suggests that it has come just about as close to theMilky Way as possible while maintaining its ability to form stars.This may help to explain its puzzlingly unique star formation history(de Boer et al. 2014).
6.6 Implications for cusp-core transformations at low stellarmass
In R16a, we found that dark matter cusp-core transformations forisolated dwarfs continue down to at least M� ∼ 5 × 10⁵ M�(M200 ∼ 5 × 10⁸ M�), under the assumption that reionization doesnot shut down star formation at this mass scale (see Sections 1and 6.7 for more discussion on this point). However, several worksin the literature have claimed that there is insufficient energy in suchlow stellar mass systems for cusp-core transformations to proceed(e.g. Penarrubia et al. 2012; Garrison-Kimmel et al. 2013; Di Cintioet al. 2014; Tollet et al. 2016). We are now in a position to revisit thisproblem. As discussed in R16a, the main difference between all ofthe studies in the literature to date has been in the stellar mass to halomass relation (either assumed or self-consistently calculated usinghydrodynamic simulations). The more stars a given halo forms, themore supernovae it has to unbind its dark cusp.
Following Penarrubia et al. (2012) and R16a, we may estimatethe supernova energy that is available to transform cusps to coresas:
�E = ESNM∗〈m∗〉 ξ (m∗ > 8 M�)εDM (16)
MNRAS 467, 2019–2038 (2017)Downloaded from https://academic.oup.com/mnras/article-abstract/467/2/2019/2957023by University of Groningen useron 23 January 2018
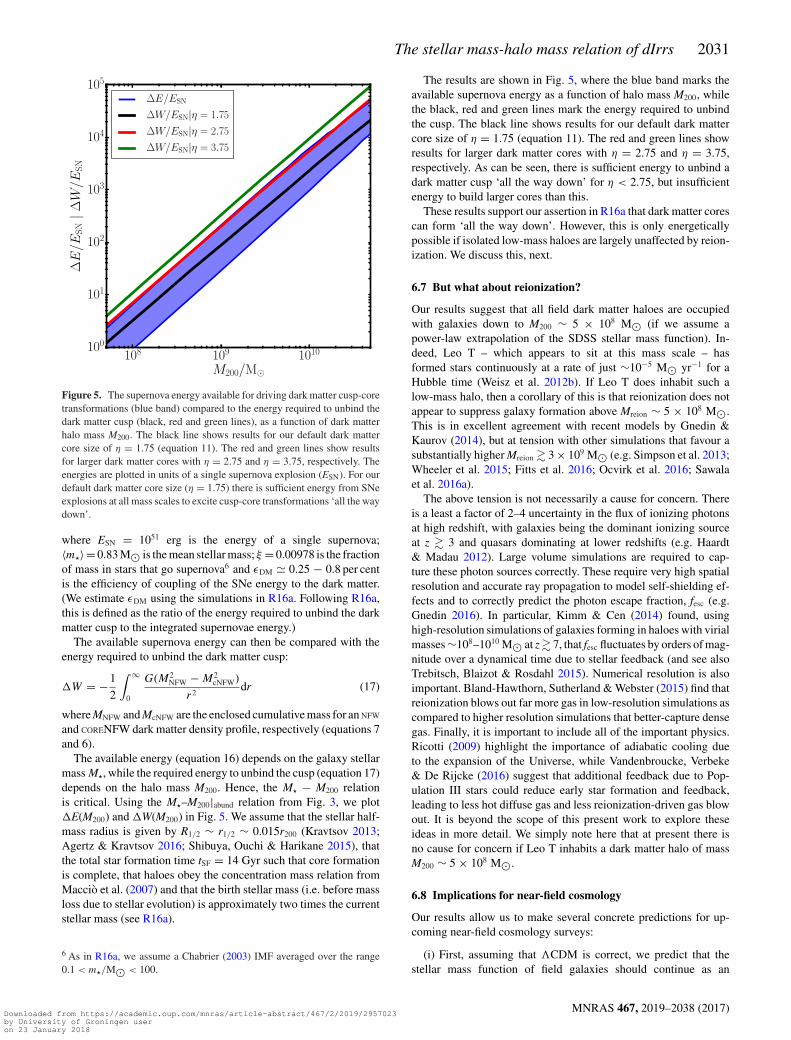
The stellar mass-halo mass relation of dIrrs 2031
Figure 5. The supernova energy available for driving dark matter cusp-coretransformations (blue band) compared to the energy required to unbind thedark matter cusp (black, red and green lines), as a function of dark matterhalo mass M200. The black line shows results for our default dark mattercore size of η = 1.75 (equation 11). The red and green lines show resultsfor larger dark matter cores with η = 2.75 and η = 3.75, respectively. Theenergies are plotted in units of a single supernova explosion (ESN). For ourdefault dark matter core size (η = 1.75) there is sufficient energy from SNeexplosions at all mass scales to excite cusp-core transformations ‘all the waydown’.
where ESN = 1051 erg is the energy of a single supernova;〈m�〉= 0.83 M� is the mean stellar mass; ξ = 0.00978 is the fractionof mass in stars that go supernova6 and εDM 0.25 − 0.8 per centis the efficiency of coupling of the SNe energy to the dark matter.(We estimate εDM using the simulations in R16a. Following R16a,this is defined as the ratio of the energy required to unbind the darkmatter cusp to the integrated supernovae energy.)
The available supernova energy can then be compared with theenergy required to unbind the dark matter cusp:
�W = −1
2
∫ ∞
0
G(M2NFW − M2
cNFW)
r2dr (17)
where MNFW and McNFW are the enclosed cumulative mass for an NFW
and CORENFW dark matter density profile, respectively (equations 7and 6).
The available energy (equation 16) depends on the galaxy stellarmass M�, while the required energy to unbind the cusp (equation 17)depends on the halo mass M200. Hence, the M� − M200 relationis critical. Using the M�–M200|abund relation from Fig. 3, we plot�E(M200) and �W(M200) in Fig. 5. We assume that the stellar half-mass radius is given by R1/2 ∼ r1/2 ∼ 0.015r200 (Kravtsov 2013;Agertz & Kravtsov 2016; Shibuya, Ouchi & Harikane 2015), thatthe total star formation time tSF = 14 Gyr such that core formationis complete, that haloes obey the concentration mass relation fromMaccio et al. (2007) and that the birth stellar mass (i.e. before massloss due to stellar evolution) is approximately two times the currentstellar mass (see R16a).
6 As in R16a, we assume a Chabrier (2003) IMF averaged over the range0.1 < m�/M� < 100.
The results are shown in Fig. 5, where the blue band marks theavailable supernova energy as a function of halo mass M200, whilethe black, red and green lines mark the energy required to unbindthe cusp. The black line shows results for our default dark mattercore size of η = 1.75 (equation 11). The red and green lines showresults for larger dark matter cores with η = 2.75 and η = 3.75,respectively. As can be seen, there is sufficient energy to unbind adark matter cusp ‘all the way down’ for η < 2.75, but insufficientenergy to build larger cores than this.
These results support our assertion in R16a that dark matter corescan form ‘all the way down’. However, this is only energeticallypossible if isolated low-mass haloes are largely unaffected by reion-ization. We discuss this, next.
6.7 But what about reionization?
Our results suggest that all field dark matter haloes are occupiedwith galaxies down to M200 ∼ 5 × 10⁸ M� (if we assume apower-law extrapolation of the SDSS stellar mass function). In-deed, Leo T – which appears to sit at this mass scale – hasformed stars continuously at a rate of just ∼10−5 M� yr−1 for aHubble time (Weisz et al. 2012b). If Leo T does inhabit such alow-mass halo, then a corollary of this is that reionization does notappear to suppress galaxy formation above Mreion ∼ 5 × 10⁸ M�.This is in excellent agreement with recent models by Gnedin &Kaurov (2014), but at tension with other simulations that favour asubstantially higher Mreion � 3 × 10⁹ M� (e.g. Simpson et al. 2013;Wheeler et al. 2015; Fitts et al. 2016; Ocvirk et al. 2016; Sawalaet al. 2016a).
The above tension is not necessarily a cause for concern. Thereis a least a factor of 2–4 uncertainty in the flux of ionizing photonsat high redshift, with galaxies being the dominant ionizing sourceat z � 3 and quasars dominating at lower redshifts (e.g. Haardt& Madau 2012). Large volume simulations are required to cap-ture these photon sources correctly. These require very high spatialresolution and accurate ray propagation to model self-shielding ef-fects and to correctly predict the photon escape fraction, fesc (e.g.Gnedin 2016). In particular, Kimm & Cen (2014) found, usinghigh-resolution simulations of galaxies forming in haloes with virialmasses ∼108–1010 M� at z � 7, that fesc fluctuates by orders of mag-nitude over a dynamical time due to stellar feedback (and see alsoTrebitsch, Blaizot & Rosdahl 2015). Numerical resolution is alsoimportant. Bland-Hawthorn, Sutherland & Webster (2015) find thatreionization blows out far more gas in low-resolution simulations ascompared to higher resolution simulations that better-capture densegas. Finally, it is important to include all of the important physics.Ricotti (2009) highlight the importance of adiabatic cooling dueto the expansion of the Universe, while Vandenbroucke, Verbeke& De Rijcke (2016) suggest that additional feedback due to Pop-ulation III stars could reduce early star formation and feedback,leading to less hot diffuse gas and less reionization-driven gas blowout. It is beyond the scope of this present work to explore theseideas in more detail. We simply note here that at present there isno cause for concern if Leo T inhabits a dark matter halo of massM200 ∼ 5 × 10⁸ M�.
6.8 Implications for near-field cosmology
Our results allow us to make several concrete predictions for up-coming near-field cosmology surveys:
(i) First, assuming that �CDM is correct, we predict that thestellar mass function of field galaxies should continue as an
MNRAS 467, 2019–2038 (2017)Downloaded from https://academic.oup.com/mnras/article-abstract/467/2/2019/2957023by University of Groningen useron 23 January 2018
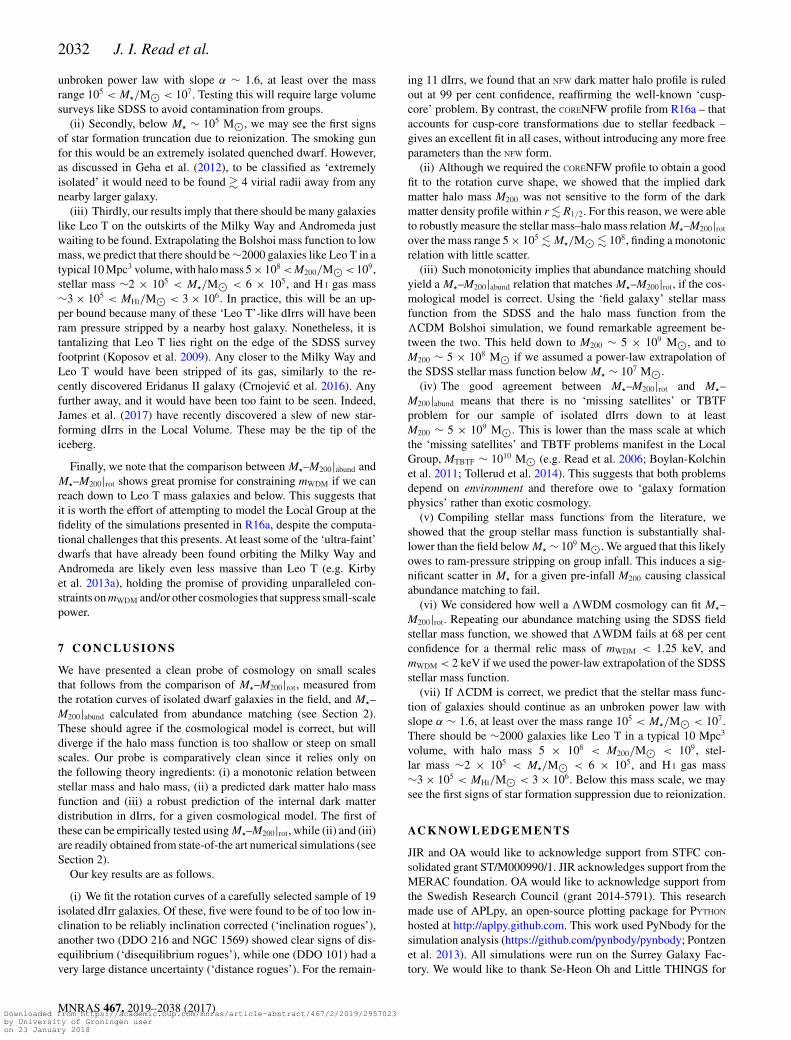
2032 J. I. Read et al.
unbroken power law with slope α ∼ 1.6, at least over the massrange 105 < M�/M� < 107. Testing this will require large volumesurveys like SDSS to avoid contamination from groups.
(ii) Secondly, below M� ∼ 105 M�, we may see the first signsof star formation truncation due to reionization. The smoking gunfor this would be an extremely isolated quenched dwarf. However,as discussed in Geha et al. (2012), to be classified as ‘extremelyisolated’ it would need to be found � 4 virial radii away from anynearby larger galaxy.
(iii) Thirdly, our results imply that there should be many galaxieslike Leo T on the outskirts of the Milky Way and Andromeda justwaiting to be found. Extrapolating the Bolshoi mass function to lowmass, we predict that there should be ∼2000 galaxies like Leo T in atypical 10 Mpc3 volume, with halo mass 5 × 10⁸ < M200/M� < 109,stellar mass ∼2 × 10⁵ < M�/M� < 6 × 10⁵, and H I gas mass∼3 × 10⁵ < MHI/M� < 3 × 10⁶. In practice, this will be an up-per bound because many of these ‘Leo T’-like dIrrs will have beenram pressure stripped by a nearby host galaxy. Nonetheless, it istantalizing that Leo T lies right on the edge of the SDSS surveyfootprint (Koposov et al. 2009). Any closer to the Milky Way andLeo T would have been stripped of its gas, similarly to the re-cently discovered Eridanus II galaxy (Crnojevic et al. 2016). Anyfurther away, and it would have been too faint to be seen. Indeed,James et al. (2017) have recently discovered a slew of new star-forming dIrrs in the Local Volume. These may be the tip of theiceberg.
Finally, we note that the comparison between M�–M200|abund andM�–M200|rot shows great promise for constraining mWDM if we canreach down to Leo T mass galaxies and below. This suggests thatit is worth the effort of attempting to model the Local Group at thefidelity of the simulations presented in R16a, despite the computa-tional challenges that this presents. At least some of the ‘ultra-faint’dwarfs that have already been found orbiting the Milky Way andAndromeda are likely even less massive than Leo T (e.g. Kirbyet al. 2013a), holding the promise of providing unparalleled con-straints on mWDM and/or other cosmologies that suppress small-scalepower.
7 C O N C L U S I O N S
We have presented a clean probe of cosmology on small scalesthat follows from the comparison of M�–M200|rot, measured fromthe rotation curves of isolated dwarf galaxies in the field, and M�–M200|abund calculated from abundance matching (see Section 2).These should agree if the cosmological model is correct, but willdiverge if the halo mass function is too shallow or steep on smallscales. Our probe is comparatively clean since it relies only onthe following theory ingredients: (i) a monotonic relation betweenstellar mass and halo mass, (ii) a predicted dark matter halo massfunction and (iii) a robust prediction of the internal dark matterdistribution in dIrrs, for a given cosmological model. The first ofthese can be empirically tested using M�–M200|rot, while (ii) and (iii)are readily obtained from state-of-the art numerical simulations (seeSection 2).
Our key results are as follows.
(i) We fit the rotation curves of a carefully selected sample of 19isolated dIrr galaxies. Of these, five were found to be of too low in-clination to be reliably inclination corrected (‘inclination rogues’),another two (DDO 216 and NGC 1569) showed clear signs of dis-equilibrium (‘disequilibrium rogues’), while one (DDO 101) had avery large distance uncertainty (‘distance rogues’). For the remain-
ing 11 dIrrs, we found that an NFW dark matter halo profile is ruledout at 99 per cent confidence, reaffirming the well-known ‘cusp-core’ problem. By contrast, the CORENFW profile from R16a – thataccounts for cusp-core transformations due to stellar feedback –gives an excellent fit in all cases, without introducing any more freeparameters than the NFW form.
(ii) Although we required the CORENFW profile to obtain a goodfit to the rotation curve shape, we showed that the implied darkmatter halo mass M200 was not sensitive to the form of the darkmatter density profile within r � R1/2. For this reason, we were ableto robustly measure the stellar mass–halo mass relation M�–M200|rot
over the mass range 5 × 10⁵ � M�/M� � 108, finding a monotonicrelation with little scatter.
(iii) Such monotonicity implies that abundance matching shouldyield a M�–M200|abund relation that matches M�–M200|rot, if the cos-mological model is correct. Using the ‘field galaxy’ stellar massfunction from the SDSS and the halo mass function from the�CDM Bolshoi simulation, we found remarkable agreement be-tween the two. This held down to M200 ∼ 5 × 10⁹ M�, and toM200 ∼ 5 × 10⁸ M� if we assumed a power-law extrapolation ofthe SDSS stellar mass function below M� ∼ 107 M�.
(iv) The good agreement between M�–M200|rot and M�–M200|abund means that there is no ‘missing satellites’ or TBTFproblem for our sample of isolated dIrrs down to at leastM200 ∼ 5 × 10⁹ M�. This is lower than the mass scale at whichthe ‘missing satellites’ and TBTF problems manifest in the LocalGroup, MTBTF ∼ 1010 M� (e.g. Read et al. 2006; Boylan-Kolchinet al. 2011; Tollerud et al. 2014). This suggests that both problemsdepend on environment and therefore owe to ‘galaxy formationphysics’ rather than exotic cosmology.
(v) Compiling stellar mass functions from the literature, weshowed that the group stellar mass function is substantially shal-lower than the field below M� ∼ 109 M�. We argued that this likelyowes to ram-pressure stripping on group infall. This induces a sig-nificant scatter in M� for a given pre-infall M200 causing classicalabundance matching to fail.
(vi) We considered how well a �WDM cosmology can fit M�–M200|rot. Repeating our abundance matching using the SDSS fieldstellar mass function, we showed that �WDM fails at 68 per centconfidence for a thermal relic mass of mWDM < 1.25 keV, andmWDM < 2 keV if we used the power-law extrapolation of the SDSSstellar mass function.
(vii) If �CDM is correct, we predict that the stellar mass func-tion of galaxies should continue as an unbroken power law withslope α ∼ 1.6, at least over the mass range 105 < M�/M� < 107.There should be ∼2000 galaxies like Leo T in a typical 10 Mpc3
volume, with halo mass 5 × 10⁸ < M200/M� < 109, stel-lar mass ∼2 × 10⁵ < M�/M� < 6 × 10⁵, and H I gas mass∼3 × 10⁵ < MHI/M� < 3 × 10⁶. Below this mass scale, we maysee the first signs of star formation suppression due to reionization.
AC K N OW L E D G E M E N T S
JIR and OA would like to acknowledge support from STFC con-solidated grant ST/M000990/1. JIR acknowledges support from theMERAC foundation. OA would like to acknowledge support fromthe Swedish Research Council (grant 2014-5791). This researchmade use of APLpy, an open-source plotting package for PYTHON
hosted at http://aplpy.github.com. This work used PyNbody for thesimulation analysis (https://github.com/pynbody/pynbody; Pontzenet al. 2013). All simulations were run on the Surrey Galaxy Fac-tory. We would like to thank Se-Heon Oh and Little THINGS for
MNRAS 467, 2019–2038 (2017)Downloaded from https://academic.oup.com/mnras/article-abstract/467/2/2019/2957023by University of Groningen useron 23 January 2018
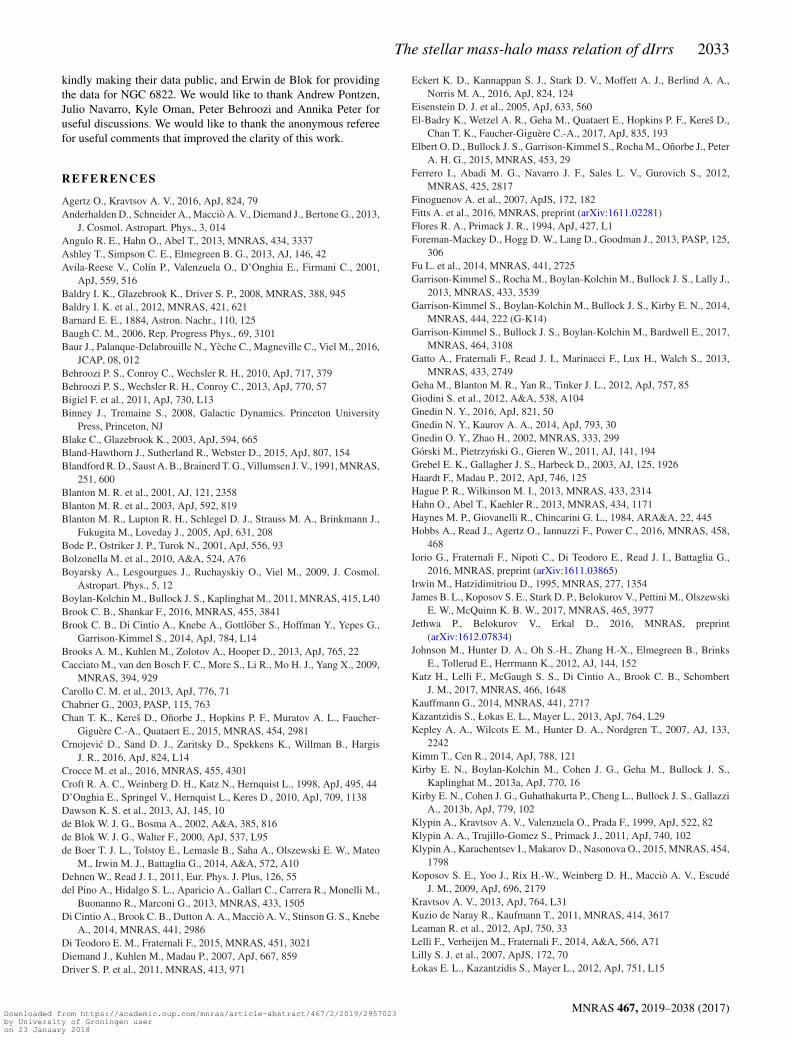
The stellar mass-halo mass relation of dIrrs 2033
kindly making their data public, and Erwin de Blok for providingthe data for NGC 6822. We would like to thank Andrew Pontzen,Julio Navarro, Kyle Oman, Peter Behroozi and Annika Peter foruseful discussions. We would like to thank the anonymous refereefor useful comments that improved the clarity of this work.
R E F E R E N C E S
Agertz O., Kravtsov A. V., 2016, ApJ, 824, 79Anderhalden D., Schneider A., Maccio A. V., Diemand J., Bertone G., 2013,
J. Cosmol. Astropart. Phys., 3, 014Angulo R. E., Hahn O., Abel T., 2013, MNRAS, 434, 3337Ashley T., Simpson C. E., Elmegreen B. G., 2013, AJ, 146, 42Avila-Reese V., Colın P., Valenzuela O., D’Onghia E., Firmani C., 2001,
ApJ, 559, 516Baldry I. K., Glazebrook K., Driver S. P., 2008, MNRAS, 388, 945Baldry I. K. et al., 2012, MNRAS, 421, 621Barnard E. E., 1884, Astron. Nachr., 110, 125Baugh C. M., 2006, Rep. Progress Phys., 69, 3101Baur J., Palanque-Delabrouille N., Yeche C., Magneville C., Viel M., 2016,
JCAP, 08, 012Behroozi P. S., Conroy C., Wechsler R. H., 2010, ApJ, 717, 379Behroozi P. S., Wechsler R. H., Conroy C., 2013, ApJ, 770, 57Bigiel F. et al., 2011, ApJ, 730, L13Binney J., Tremaine S., 2008, Galactic Dynamics. Princeton University
Press, Princeton, NJBlake C., Glazebrook K., 2003, ApJ, 594, 665Bland-Hawthorn J., Sutherland R., Webster D., 2015, ApJ, 807, 154Blandford R. D., Saust A. B., Brainerd T. G., Villumsen J. V., 1991, MNRAS,
251, 600Blanton M. R. et al., 2001, AJ, 121, 2358Blanton M. R. et al., 2003, ApJ, 592, 819Blanton M. R., Lupton R. H., Schlegel D. J., Strauss M. A., Brinkmann J.,
Fukugita M., Loveday J., 2005, ApJ, 631, 208Bode P., Ostriker J. P., Turok N., 2001, ApJ, 556, 93Bolzonella M. et al., 2010, A&A, 524, A76Boyarsky A., Lesgourgues J., Ruchayskiy O., Viel M., 2009, J. Cosmol.
Astropart. Phys., 5, 12Boylan-Kolchin M., Bullock J. S., Kaplinghat M., 2011, MNRAS, 415, L40Brook C. B., Shankar F., 2016, MNRAS, 455, 3841Brook C. B., Di Cintio A., Knebe A., Gottlober S., Hoffman Y., Yepes G.,
Garrison-Kimmel S., 2014, ApJ, 784, L14Brooks A. M., Kuhlen M., Zolotov A., Hooper D., 2013, ApJ, 765, 22Cacciato M., van den Bosch F. C., More S., Li R., Mo H. J., Yang X., 2009,
MNRAS, 394, 929Carollo C. M. et al., 2013, ApJ, 776, 71Chabrier G., 2003, PASP, 115, 763Chan T. K., Keres D., Onorbe J., Hopkins P. F., Muratov A. L., Faucher-
Giguere C.-A., Quataert E., 2015, MNRAS, 454, 2981Crnojevic D., Sand D. J., Zaritsky D., Spekkens K., Willman B., Hargis
J. R., 2016, ApJ, 824, L14Crocce M. et al., 2016, MNRAS, 455, 4301Croft R. A. C., Weinberg D. H., Katz N., Hernquist L., 1998, ApJ, 495, 44D’Onghia E., Springel V., Hernquist L., Keres D., 2010, ApJ, 709, 1138Dawson K. S. et al., 2013, AJ, 145, 10de Blok W. J. G., Bosma A., 2002, A&A, 385, 816de Blok W. J. G., Walter F., 2000, ApJ, 537, L95de Boer T. J. L., Tolstoy E., Lemasle B., Saha A., Olszewski E. W., Mateo
M., Irwin M. J., Battaglia G., 2014, A&A, 572, A10Dehnen W., Read J. I., 2011, Eur. Phys. J. Plus, 126, 55del Pino A., Hidalgo S. L., Aparicio A., Gallart C., Carrera R., Monelli M.,
Buonanno R., Marconi G., 2013, MNRAS, 433, 1505Di Cintio A., Brook C. B., Dutton A. A., Maccio A. V., Stinson G. S., Knebe
A., 2014, MNRAS, 441, 2986Di Teodoro E. M., Fraternali F., 2015, MNRAS, 451, 3021Diemand J., Kuhlen M., Madau P., 2007, ApJ, 667, 859Driver S. P. et al., 2011, MNRAS, 413, 971
Eckert K. D., Kannappan S. J., Stark D. V., Moffett A. J., Berlind A. A.,Norris M. A., 2016, ApJ, 824, 124
Eisenstein D. J. et al., 2005, ApJ, 633, 560El-Badry K., Wetzel A. R., Geha M., Quataert E., Hopkins P. F., Keres D.,
Chan T. K., Faucher-Giguere C.-A., 2017, ApJ, 835, 193Elbert O. D., Bullock J. S., Garrison-Kimmel S., Rocha M., Onorbe J., Peter
A. H. G., 2015, MNRAS, 453, 29Ferrero I., Abadi M. G., Navarro J. F., Sales L. V., Gurovich S., 2012,
MNRAS, 425, 2817Finoguenov A. et al., 2007, ApJS, 172, 182Fitts A. et al., 2016, MNRAS, preprint (arXiv:1611.02281)Flores R. A., Primack J. R., 1994, ApJ, 427, L1Foreman-Mackey D., Hogg D. W., Lang D., Goodman J., 2013, PASP, 125,
306Fu L. et al., 2014, MNRAS, 441, 2725Garrison-Kimmel S., Rocha M., Boylan-Kolchin M., Bullock J. S., Lally J.,
2013, MNRAS, 433, 3539Garrison-Kimmel S., Boylan-Kolchin M., Bullock J. S., Kirby E. N., 2014,
MNRAS, 444, 222 (G-K14)Garrison-Kimmel S., Bullock J. S., Boylan-Kolchin M., Bardwell E., 2017,
MNRAS, 464, 3108Gatto A., Fraternali F., Read J. I., Marinacci F., Lux H., Walch S., 2013,
MNRAS, 433, 2749Geha M., Blanton M. R., Yan R., Tinker J. L., 2012, ApJ, 757, 85Giodini S. et al., 2012, A&A, 538, A104Gnedin N. Y., 2016, ApJ, 821, 50Gnedin N. Y., Kaurov A. A., 2014, ApJ, 793, 30Gnedin O. Y., Zhao H., 2002, MNRAS, 333, 299Gorski M., Pietrzynski G., Gieren W., 2011, AJ, 141, 194Grebel E. K., Gallagher J. S., Harbeck D., 2003, AJ, 125, 1926Haardt F., Madau P., 2012, ApJ, 746, 125Hague P. R., Wilkinson M. I., 2013, MNRAS, 433, 2314Hahn O., Abel T., Kaehler R., 2013, MNRAS, 434, 1171Haynes M. P., Giovanelli R., Chincarini G. L., 1984, ARA&A, 22, 445Hobbs A., Read J., Agertz O., Iannuzzi F., Power C., 2016, MNRAS, 458,
468Iorio G., Fraternali F., Nipoti C., Di Teodoro E., Read J. I., Battaglia G.,
2016, MNRAS, preprint (arXiv:1611.03865)Irwin M., Hatzidimitriou D., 1995, MNRAS, 277, 1354James B. L., Koposov S. E., Stark D. P., Belokurov V., Pettini M., Olszewski
E. W., McQuinn K. B. W., 2017, MNRAS, 465, 3977Jethwa P., Belokurov V., Erkal D., 2016, MNRAS, preprint
(arXiv:1612.07834)Johnson M., Hunter D. A., Oh S.-H., Zhang H.-X., Elmegreen B., Brinks
E., Tollerud E., Herrmann K., 2012, AJ, 144, 152Katz H., Lelli F., McGaugh S. S., Di Cintio A., Brook C. B., Schombert
J. M., 2017, MNRAS, 466, 1648Kauffmann G., 2014, MNRAS, 441, 2717Kazantzidis S., Łokas E. L., Mayer L., 2013, ApJ, 764, L29Kepley A. A., Wilcots E. M., Hunter D. A., Nordgren T., 2007, AJ, 133,
2242Kimm T., Cen R., 2014, ApJ, 788, 121Kirby E. N., Boylan-Kolchin M., Cohen J. G., Geha M., Bullock J. S.,
Kaplinghat M., 2013a, ApJ, 770, 16Kirby E. N., Cohen J. G., Guhathakurta P., Cheng L., Bullock J. S., Gallazzi
A., 2013b, ApJ, 779, 102Klypin A., Kravtsov A. V., Valenzuela O., Prada F., 1999, ApJ, 522, 82Klypin A. A., Trujillo-Gomez S., Primack J., 2011, ApJ, 740, 102Klypin A., Karachentsev I., Makarov D., Nasonova O., 2015, MNRAS, 454,
1798Koposov S. E., Yoo J., Rix H.-W., Weinberg D. H., Maccio A. V., Escude
J. M., 2009, ApJ, 696, 2179Kravtsov A. V., 2013, ApJ, 764, L31Kuzio de Naray R., Kaufmann T., 2011, MNRAS, 414, 3617Leaman R. et al., 2012, ApJ, 750, 33Lelli F., Verheijen M., Fraternali F., 2014, A&A, 566, A71Lilly S. J. et al., 2007, ApJS, 172, 70Łokas E. L., Kazantzidis S., Mayer L., 2012, ApJ, 751, L15
MNRAS 467, 2019–2038 (2017)Downloaded from https://academic.oup.com/mnras/article-abstract/467/2/2019/2957023by University of Groningen useron 23 January 2018
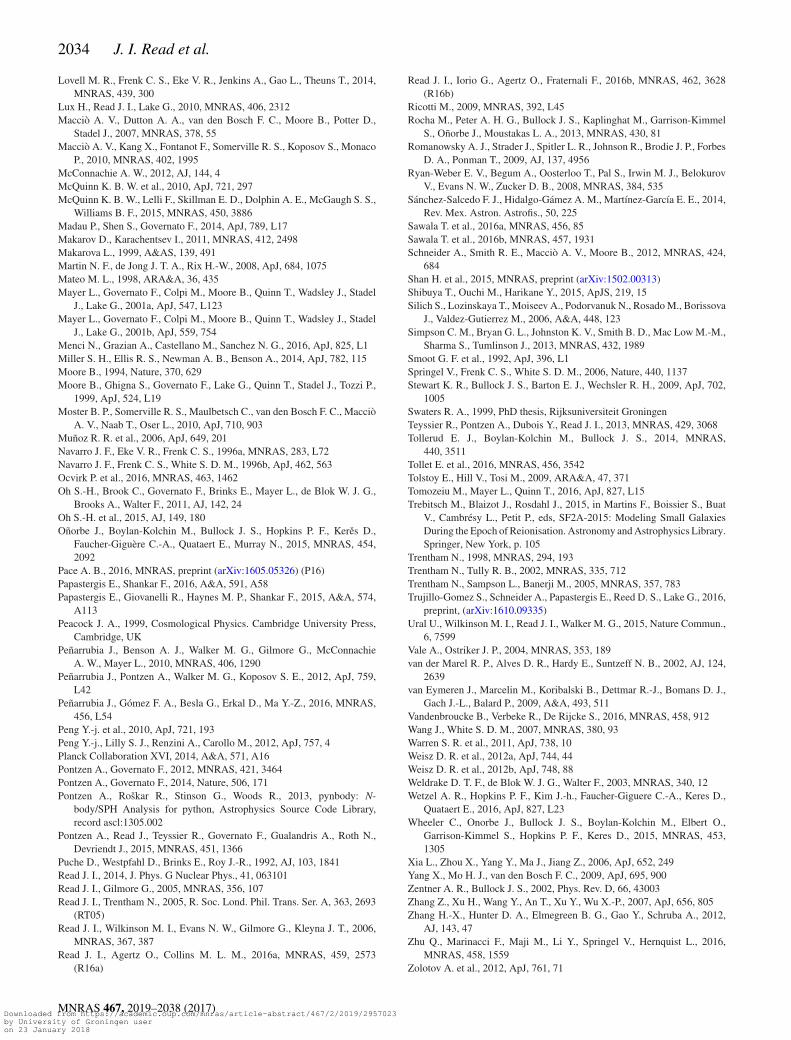
2034 J. I. Read et al.
Lovell M. R., Frenk C. S., Eke V. R., Jenkins A., Gao L., Theuns T., 2014,MNRAS, 439, 300
Lux H., Read J. I., Lake G., 2010, MNRAS, 406, 2312Maccio A. V., Dutton A. A., van den Bosch F. C., Moore B., Potter D.,
Stadel J., 2007, MNRAS, 378, 55Maccio A. V., Kang X., Fontanot F., Somerville R. S., Koposov S., Monaco
P., 2010, MNRAS, 402, 1995McConnachie A. W., 2012, AJ, 144, 4McQuinn K. B. W. et al., 2010, ApJ, 721, 297McQuinn K. B. W., Lelli F., Skillman E. D., Dolphin A. E., McGaugh S. S.,
Williams B. F., 2015, MNRAS, 450, 3886Madau P., Shen S., Governato F., 2014, ApJ, 789, L17Makarov D., Karachentsev I., 2011, MNRAS, 412, 2498Makarova L., 1999, A&AS, 139, 491Martin N. F., de Jong J. T. A., Rix H.-W., 2008, ApJ, 684, 1075Mateo M. L., 1998, ARA&A, 36, 435Mayer L., Governato F., Colpi M., Moore B., Quinn T., Wadsley J., Stadel
J., Lake G., 2001a, ApJ, 547, L123Mayer L., Governato F., Colpi M., Moore B., Quinn T., Wadsley J., Stadel
J., Lake G., 2001b, ApJ, 559, 754Menci N., Grazian A., Castellano M., Sanchez N. G., 2016, ApJ, 825, L1Miller S. H., Ellis R. S., Newman A. B., Benson A., 2014, ApJ, 782, 115Moore B., 1994, Nature, 370, 629Moore B., Ghigna S., Governato F., Lake G., Quinn T., Stadel J., Tozzi P.,
1999, ApJ, 524, L19Moster B. P., Somerville R. S., Maulbetsch C., van den Bosch F. C., Maccio
A. V., Naab T., Oser L., 2010, ApJ, 710, 903Munoz R. R. et al., 2006, ApJ, 649, 201Navarro J. F., Eke V. R., Frenk C. S., 1996a, MNRAS, 283, L72Navarro J. F., Frenk C. S., White S. D. M., 1996b, ApJ, 462, 563Ocvirk P. et al., 2016, MNRAS, 463, 1462Oh S.-H., Brook C., Governato F., Brinks E., Mayer L., de Blok W. J. G.,
Brooks A., Walter F., 2011, AJ, 142, 24Oh S.-H. et al., 2015, AJ, 149, 180Onorbe J., Boylan-Kolchin M., Bullock J. S., Hopkins P. F., Keres D.,
Faucher-Giguere C.-A., Quataert E., Murray N., 2015, MNRAS, 454,2092
Pace A. B., 2016, MNRAS, preprint (arXiv:1605.05326) (P16)Papastergis E., Shankar F., 2016, A&A, 591, A58Papastergis E., Giovanelli R., Haynes M. P., Shankar F., 2015, A&A, 574,
A113Peacock J. A., 1999, Cosmological Physics. Cambridge University Press,
Cambridge, UKPenarrubia J., Benson A. J., Walker M. G., Gilmore G., McConnachie
A. W., Mayer L., 2010, MNRAS, 406, 1290Penarrubia J., Pontzen A., Walker M. G., Koposov S. E., 2012, ApJ, 759,
L42Penarrubia J., Gomez F. A., Besla G., Erkal D., Ma Y.-Z., 2016, MNRAS,
456, L54Peng Y.-j. et al., 2010, ApJ, 721, 193Peng Y.-j., Lilly S. J., Renzini A., Carollo M., 2012, ApJ, 757, 4Planck Collaboration XVI, 2014, A&A, 571, A16Pontzen A., Governato F., 2012, MNRAS, 421, 3464Pontzen A., Governato F., 2014, Nature, 506, 171Pontzen A., Roskar R., Stinson G., Woods R., 2013, pynbody: N-
body/SPH Analysis for python, Astrophysics Source Code Library,record ascl:1305.002
Pontzen A., Read J., Teyssier R., Governato F., Gualandris A., Roth N.,Devriendt J., 2015, MNRAS, 451, 1366
Puche D., Westpfahl D., Brinks E., Roy J.-R., 1992, AJ, 103, 1841Read J. I., 2014, J. Phys. G Nuclear Phys., 41, 063101Read J. I., Gilmore G., 2005, MNRAS, 356, 107Read J. I., Trentham N., 2005, R. Soc. Lond. Phil. Trans. Ser. A, 363, 2693
(RT05)Read J. I., Wilkinson M. I., Evans N. W., Gilmore G., Kleyna J. T., 2006,
MNRAS, 367, 387Read J. I., Agertz O., Collins M. L. M., 2016a, MNRAS, 459, 2573
(R16a)
Read J. I., Iorio G., Agertz O., Fraternali F., 2016b, MNRAS, 462, 3628(R16b)
Ricotti M., 2009, MNRAS, 392, L45Rocha M., Peter A. H. G., Bullock J. S., Kaplinghat M., Garrison-Kimmel
S., Onorbe J., Moustakas L. A., 2013, MNRAS, 430, 81Romanowsky A. J., Strader J., Spitler L. R., Johnson R., Brodie J. P., Forbes
D. A., Ponman T., 2009, AJ, 137, 4956Ryan-Weber E. V., Begum A., Oosterloo T., Pal S., Irwin M. J., Belokurov
V., Evans N. W., Zucker D. B., 2008, MNRAS, 384, 535Sanchez-Salcedo F. J., Hidalgo-Gamez A. M., Martınez-Garcıa E. E., 2014,
Rev. Mex. Astron. Astrofis., 50, 225Sawala T. et al., 2016a, MNRAS, 456, 85Sawala T. et al., 2016b, MNRAS, 457, 1931Schneider A., Smith R. E., Maccio A. V., Moore B., 2012, MNRAS, 424,
684Shan H. et al., 2015, MNRAS, preprint (arXiv:1502.00313)Shibuya T., Ouchi M., Harikane Y., 2015, ApJS, 219, 15Silich S., Lozinskaya T., Moiseev A., Podorvanuk N., Rosado M., Borissova
J., Valdez-Gutierrez M., 2006, A&A, 448, 123Simpson C. M., Bryan G. L., Johnston K. V., Smith B. D., Mac Low M.-M.,
Sharma S., Tumlinson J., 2013, MNRAS, 432, 1989Smoot G. F. et al., 1992, ApJ, 396, L1Springel V., Frenk C. S., White S. D. M., 2006, Nature, 440, 1137Stewart K. R., Bullock J. S., Barton E. J., Wechsler R. H., 2009, ApJ, 702,
1005Swaters R. A., 1999, PhD thesis, Rijksuniversiteit GroningenTeyssier R., Pontzen A., Dubois Y., Read J. I., 2013, MNRAS, 429, 3068Tollerud E. J., Boylan-Kolchin M., Bullock J. S., 2014, MNRAS,
440, 3511Tollet E. et al., 2016, MNRAS, 456, 3542Tolstoy E., Hill V., Tosi M., 2009, ARA&A, 47, 371Tomozeiu M., Mayer L., Quinn T., 2016, ApJ, 827, L15Trebitsch M., Blaizot J., Rosdahl J., 2015, in Martins F., Boissier S., Buat
V., Cambresy L., Petit P., eds, SF2A-2015: Modeling Small GalaxiesDuring the Epoch of Reionisation. Astronomy and Astrophysics Library.Springer, New York, p. 105
Trentham N., 1998, MNRAS, 294, 193Trentham N., Tully R. B., 2002, MNRAS, 335, 712Trentham N., Sampson L., Banerji M., 2005, MNRAS, 357, 783Trujillo-Gomez S., Schneider A., Papastergis E., Reed D. S., Lake G., 2016,
preprint, (arXiv:1610.09335)Ural U., Wilkinson M. I., Read J. I., Walker M. G., 2015, Nature Commun.,
6, 7599Vale A., Ostriker J. P., 2004, MNRAS, 353, 189van der Marel R. P., Alves D. R., Hardy E., Suntzeff N. B., 2002, AJ, 124,
2639van Eymeren J., Marcelin M., Koribalski B., Dettmar R.-J., Bomans D. J.,
Gach J.-L., Balard P., 2009, A&A, 493, 511Vandenbroucke B., Verbeke R., De Rijcke S., 2016, MNRAS, 458, 912Wang J., White S. D. M., 2007, MNRAS, 380, 93Warren S. R. et al., 2011, ApJ, 738, 10Weisz D. R. et al., 2012a, ApJ, 744, 44Weisz D. R. et al., 2012b, ApJ, 748, 88Weldrake D. T. F., de Blok W. J. G., Walter F., 2003, MNRAS, 340, 12Wetzel A. R., Hopkins P. F., Kim J.-h., Faucher-Giguere C.-A., Keres D.,
Quataert E., 2016, ApJ, 827, L23Wheeler C., Onorbe J., Bullock J. S., Boylan-Kolchin M., Elbert O.,
Garrison-Kimmel S., Hopkins P. F., Keres D., 2015, MNRAS, 453,1305
Xia L., Zhou X., Yang Y., Ma J., Jiang Z., 2006, ApJ, 652, 249Yang X., Mo H. J., van den Bosch F. C., 2009, ApJ, 695, 900Zentner A. R., Bullock J. S., 2002, Phys. Rev. D, 66, 43003Zhang Z., Xu H., Wang Y., An T., Xu Y., Wu X.-P., 2007, ApJ, 656, 805Zhang H.-X., Hunter D. A., Elmegreen B. G., Gao Y., Schruba A., 2012,
AJ, 143, 47Zhu Q., Marinacci F., Maji M., Li Y., Springel V., Hernquist L., 2016,
MNRAS, 458, 1559Zolotov A. et al., 2012, ApJ, 761, 71
MNRAS 467, 2019–2038 (2017)Downloaded from https://academic.oup.com/mnras/article-abstract/467/2/2019/2957023by University of Groningen useron 23 January 2018

The stellar mass-halo mass relation of dIrrs 2035
A P P E N D I X A : TH E ROTAT I O N C U RV E F I T S
In this Appendix, we show the rotation curves and model fits for allof the galaxies listed in Table 2. In Figs A1 and A2, we show all ofthe galaxies that we include in Fig. 3; in Fig. A3, we show all of the‘rogues’ that we exclude from further analysis. The rogues fall intothree categories: ‘inclination’ i-Rogues (top row); ‘disequilibrium’Diseq. Rogues (middle row) and ‘distance’ D-Rogues (bottom row),as marked (see Section 4.4). The first class of these three haveuncertain inclination, with ifit < 40◦. The second class show signsof disequilibrium, either in the form of significant fast-expanding
H I bubbles (see Table 2), or – as is the case for Pegasus – becausewe only have data for the inner rotation curve inside R1/2. This innerregion is particularly susceptible to disequilibrium effects from bothsupernova-driven H I holes and non-circular motions. (This can beseen, for example, in the inner rotation curves of NGC 6822 andDDO 126 that are otherwise both in our ‘good’ sample.) The thirdclass (which contains only DDO 101) have very uncertain distanceD (see R16b for a detailed discussion of this galaxy.). The individualgalaxies are discussed in more detail in Iorio et al. (2016) where wepresent the full details of our rotation curve derivation, including acomparison with the rotation curves from Little THINGS.
Figure A1. Rotation curve data (red data points) and models for our sample of ‘good’ dIrr galaxies (see Table 2). The black contours show the median (black),68 per cent (dark grey) and 95 per cent (light grey) confidence intervals of our fitted CORENFW rotation curve models (see Section 4.2). The vertical greendashed line shows the projected stellar half light radius R1/2. The thin vertical black line marks the inner data point used for the fit, Rmin (where this is notmarked Rmin = 0). The blue and green lines show the rotation curve contribution from stars and gas, respectively.
MNRAS 467, 2019–2038 (2017)Downloaded from https://academic.oup.com/mnras/article-abstract/467/2/2019/2957023by University of Groningen useron 23 January 2018
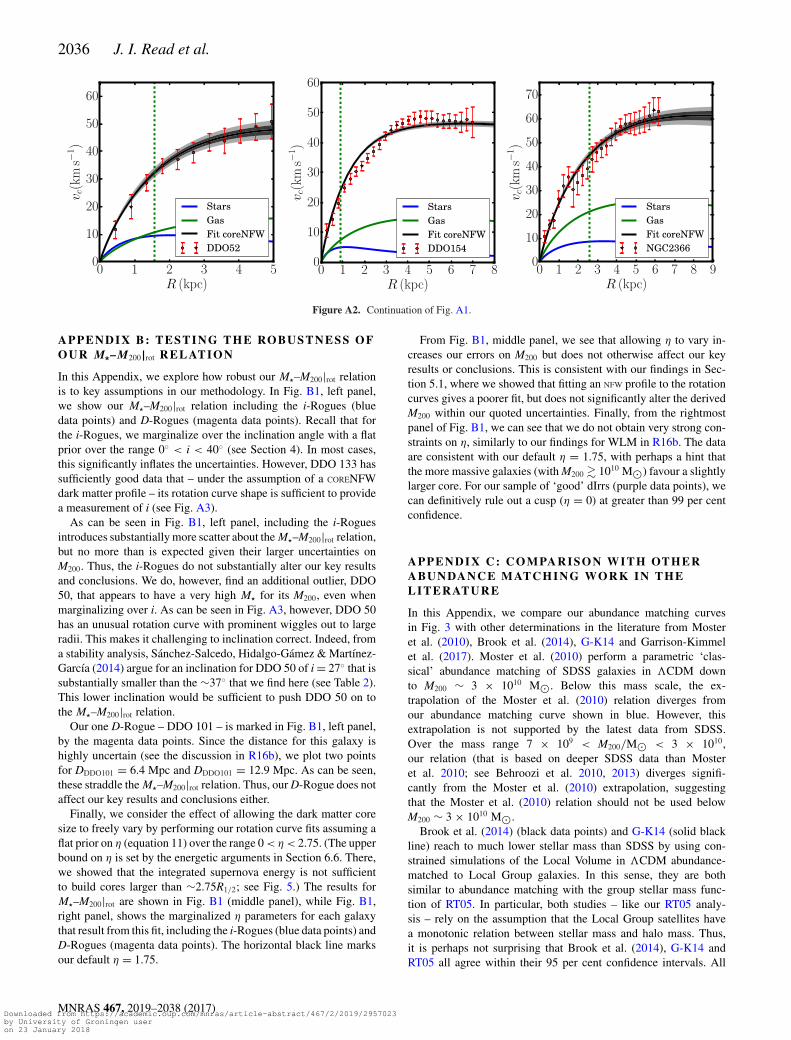
2036 J. I. Read et al.
Figure A2. Continuation of Fig. A1.
APPENDIX B: TESTING THE ROBUSTNES S O FO U R M�– M200|rot R E L AT I O N
In this Appendix, we explore how robust our M�–M200|rot relationis to key assumptions in our methodology. In Fig. B1, left panel,we show our M�–M200|rot relation including the i-Rogues (bluedata points) and D-Rogues (magenta data points). Recall that forthe i-Rogues, we marginalize over the inclination angle with a flatprior over the range 0◦ < i < 40◦ (see Section 4). In most cases,this significantly inflates the uncertainties. However, DDO 133 hassufficiently good data that – under the assumption of a CORENFWdark matter profile – its rotation curve shape is sufficient to providea measurement of i (see Fig. A3).
As can be seen in Fig. B1, left panel, including the i-Roguesintroduces substantially more scatter about the M�–M200|rot relation,but no more than is expected given their larger uncertainties onM200. Thus, the i-Rogues do not substantially alter our key resultsand conclusions. We do, however, find an additional outlier, DDO50, that appears to have a very high M� for its M200, even whenmarginalizing over i. As can be seen in Fig. A3, however, DDO 50has an unusual rotation curve with prominent wiggles out to largeradii. This makes it challenging to inclination correct. Indeed, froma stability analysis, Sanchez-Salcedo, Hidalgo-Gamez & Martınez-Garcıa (2014) argue for an inclination for DDO 50 of i = 27◦ that issubstantially smaller than the ∼37◦ that we find here (see Table 2).This lower inclination would be sufficient to push DDO 50 on tothe M�–M200|rot relation.
Our one D-Rogue – DDO 101 – is marked in Fig. B1, left panel,by the magenta data points. Since the distance for this galaxy ishighly uncertain (see the discussion in R16b), we plot two pointsfor DDDO101 = 6.4 Mpc and DDDO101 = 12.9 Mpc. As can be seen,these straddle the M�–M200|rot relation. Thus, our D-Rogue does notaffect our key results and conclusions either.
Finally, we consider the effect of allowing the dark matter coresize to freely vary by performing our rotation curve fits assuming aflat prior on η (equation 11) over the range 0 < η < 2.75. (The upperbound on η is set by the energetic arguments in Section 6.6. There,we showed that the integrated supernova energy is not sufficientto build cores larger than ∼2.75R1/2; see Fig. 5.) The results forM�–M200|rot are shown in Fig. B1 (middle panel), while Fig. B1,right panel, shows the marginalized η parameters for each galaxythat result from this fit, including the i-Rogues (blue data points) andD-Rogues (magenta data points). The horizontal black line marksour default η = 1.75.
From Fig. B1, middle panel, we see that allowing η to vary in-creases our errors on M200 but does not otherwise affect our keyresults or conclusions. This is consistent with our findings in Sec-tion 5.1, where we showed that fitting an NFW profile to the rotationcurves gives a poorer fit, but does not significantly alter the derivedM200 within our quoted uncertainties. Finally, from the rightmostpanel of Fig. B1, we can see that we do not obtain very strong con-straints on η, similarly to our findings for WLM in R16b. The dataare consistent with our default η = 1.75, with perhaps a hint thatthe more massive galaxies (with M200 � 1010 M�) favour a slightlylarger core. For our sample of ‘good’ dIrrs (purple data points), wecan definitively rule out a cusp (η = 0) at greater than 99 per centconfidence.
A P P E N D I X C : C O M PA R I S O N W I T H OT H E RA BU N DA N C E M AT C H I N G WO R K I N T H EL I T E R AT U R E
In this Appendix, we compare our abundance matching curvesin Fig. 3 with other determinations in the literature from Mosteret al. (2010), Brook et al. (2014), G-K14 and Garrison-Kimmelet al. (2017). Moster et al. (2010) perform a parametric ‘clas-sical’ abundance matching of SDSS galaxies in �CDM downto M200 ∼ 3 × 10¹⁰ M�. Below this mass scale, the ex-trapolation of the Moster et al. (2010) relation diverges fromour abundance matching curve shown in blue. However, thisextrapolation is not supported by the latest data from SDSS.Over the mass range 7 × 10⁹ < M200/M� < 3 × 10¹⁰,our relation (that is based on deeper SDSS data than Mosteret al. 2010; see Behroozi et al. 2010, 2013) diverges signifi-cantly from the Moster et al. (2010) extrapolation, suggestingthat the Moster et al. (2010) relation should not be used belowM200 ∼ 3 × 10¹⁰ M�.
Brook et al. (2014) (black data points) and G-K14 (solid blackline) reach to much lower stellar mass than SDSS by using con-strained simulations of the Local Volume in �CDM abundance-matched to Local Group galaxies. In this sense, they are bothsimilar to abundance matching with the group stellar mass func-tion of RT05. In particular, both studies – like our RT05 analy-sis – rely on the assumption that the Local Group satellites havea monotonic relation between stellar mass and halo mass. Thus,it is perhaps not surprising that Brook et al. (2014), G-K14 andRT05 all agree within their 95 per cent confidence intervals. All
MNRAS 467, 2019–2038 (2017)Downloaded from https://academic.oup.com/mnras/article-abstract/467/2/2019/2957023by University of Groningen useron 23 January 2018
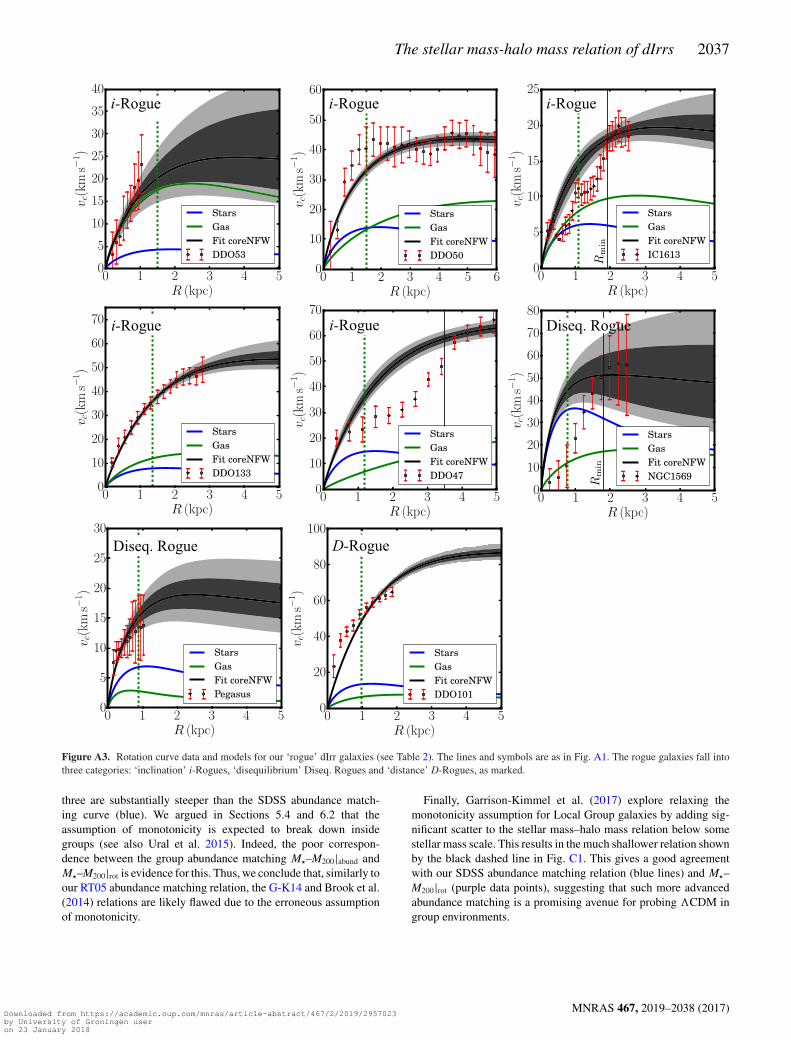
The stellar mass-halo mass relation of dIrrs 2037
Figure A3. Rotation curve data and models for our ‘rogue’ dIrr galaxies (see Table 2). The lines and symbols are as in Fig. A1. The rogue galaxies fall intothree categories: ‘inclination’ i-Rogues, ‘disequilibrium’ Diseq. Rogues and ‘distance’ D-Rogues, as marked.
three are substantially steeper than the SDSS abundance match-ing curve (blue). We argued in Sections 5.4 and 6.2 that theassumption of monotonicity is expected to break down insidegroups (see also Ural et al. 2015). Indeed, the poor correspon-dence between the group abundance matching M�–M200|abund andM�–M200|rot is evidence for this. Thus, we conclude that, similarly toour RT05 abundance matching relation, the G-K14 and Brook et al.(2014) relations are likely flawed due to the erroneous assumptionof monotonicity.
Finally, Garrison-Kimmel et al. (2017) explore relaxing themonotonicity assumption for Local Group galaxies by adding sig-nificant scatter to the stellar mass–halo mass relation below somestellar mass scale. This results in the much shallower relation shownby the black dashed line in Fig. C1. This gives a good agreementwith our SDSS abundance matching relation (blue lines) and M�–M200|rot (purple data points), suggesting that such more advancedabundance matching is a promising avenue for probing �CDM ingroup environments.
MNRAS 467, 2019–2038 (2017)Downloaded from https://academic.oup.com/mnras/article-abstract/467/2/2019/2957023by University of Groningen useron 23 January 2018
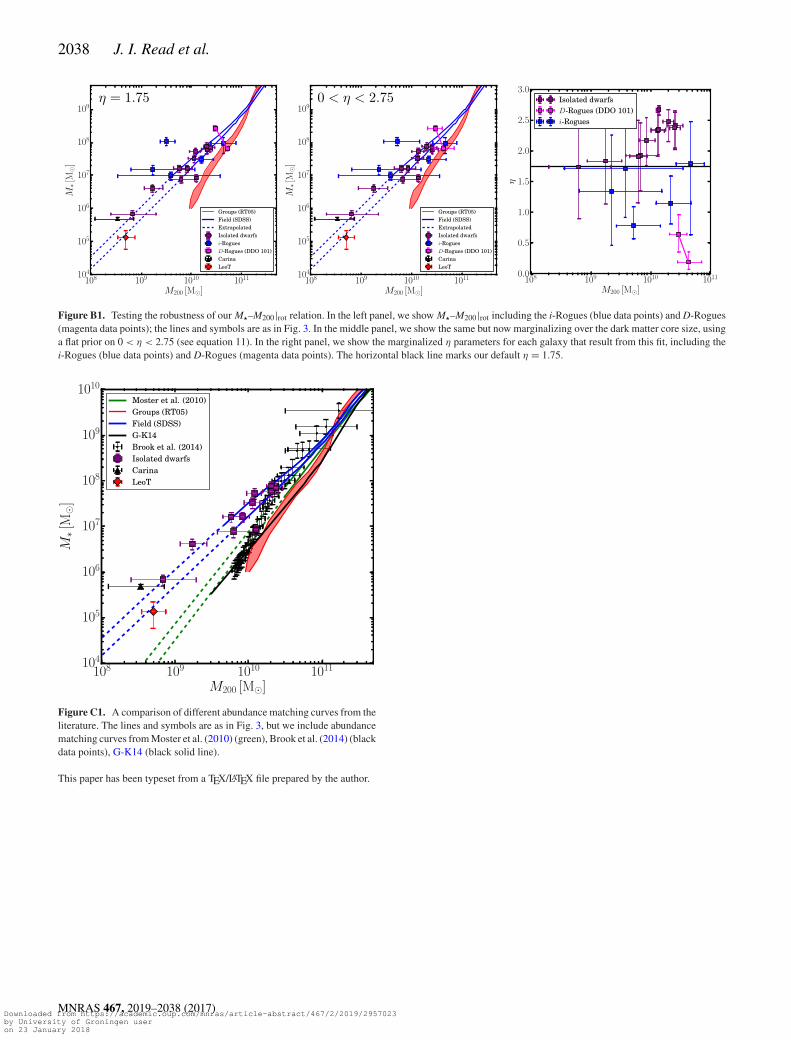
2038 J. I. Read et al.
Figure B1. Testing the robustness of our M�–M200|rot relation. In the left panel, we show M�–M200|rot including the i-Rogues (blue data points) and D-Rogues(magenta data points); the lines and symbols are as in Fig. 3. In the middle panel, we show the same but now marginalizing over the dark matter core size, usinga flat prior on 0 < η < 2.75 (see equation 11). In the right panel, we show the marginalized η parameters for each galaxy that result from this fit, including thei-Rogues (blue data points) and D-Rogues (magenta data points). The horizontal black line marks our default η = 1.75.
Figure C1. A comparison of different abundance matching curves from theliterature. The lines and symbols are as in Fig. 3, but we include abundancematching curves from Moster et al. (2010) (green), Brook et al. (2014) (blackdata points), G-K14 (black solid line).
This paper has been typeset from a TEX/LATEX file prepared by the author.
MNRAS 467, 2019–2038 (2017)Downloaded from https://academic.oup.com/mnras/article-abstract/467/2/2019/2957023by University of Groningen useron 23 January 2018