University of Groningen Profiling Speech Sound ... - CORE
15
University of Groningen Profiling Speech Sound Disorders for Clinical Validation of the Computer Articulation Instrument van Haaften, Leenke; Diepeveen, Sanne; Terband, Hayo; Vermeij, Bernadette; van den Engel-Hoek, Lenie; de Swart, Bert; Maassen, Ben Published in: American journal of speech-language pathology DOI: 10.1044/2018_AJSLP-MSC18-18-0112 IMPORTANT NOTE: You are advised to consult the publisher's version (publisher's PDF) if you wish to cite from it. Please check the document version below. Document Version Publisher's PDF, also known as Version of record Publication date: 2019 Link to publication in University of Groningen/UMCG research database Citation for published version (APA): van Haaften, L., Diepeveen, S., Terband, H., Vermeij, B., van den Engel-Hoek, L., de Swart, B., & Maassen, B. (2019). Profiling Speech Sound Disorders for Clinical Validation of the Computer Articulation Instrument. American journal of speech-language pathology, 28(2), 844-856. https://doi.org/10.1044/2018_AJSLP-MSC18-18-0112 Copyright Other than for strictly personal use, it is not permitted to download or to forward/distribute the text or part of it without the consent of the author(s) and/or copyright holder(s), unless the work is under an open content license (like Creative Commons). Take-down policy If you believe that this document breaches copyright please contact us providing details, and we will remove access to the work immediately and investigate your claim. Downloaded from the University of Groningen/UMCG research database (Pure): http://www.rug.nl/research/portal. For technical reasons the number of authors shown on this cover page is limited to 10 maximum. Download date: 26-12-2020 brought to you by CORE View metadata, citation and similar papers at core.ac.uk provided by University of Groningen
-
Upload
khangminh22 -
Category
Documents
-
view
0 -
download
0
Transcript of University of Groningen Profiling Speech Sound ... - CORE
University of Groningen
Profiling Speech Sound Disorders for Clinical Validation of the Computer ArticulationInstrumentvan Haaften, Leenke; Diepeveen, Sanne; Terband, Hayo; Vermeij, Bernadette; van denEngel-Hoek, Lenie; de Swart, Bert; Maassen, BenPublished in:American journal of speech-language pathology
DOI:10.1044/2018_AJSLP-MSC18-18-0112
IMPORTANT NOTE: You are advised to consult the publisher's version (publisher's PDF) if you wish to cite fromit. Please check the document version below.
Document VersionPublisher's PDF, also known as Version of record
Publication date:2019
Link to publication in University of Groningen/UMCG research database
Citation for published version (APA):van Haaften, L., Diepeveen, S., Terband, H., Vermeij, B., van den Engel-Hoek, L., de Swart, B., &Maassen, B. (2019). Profiling Speech Sound Disorders for Clinical Validation of the Computer ArticulationInstrument. American journal of speech-language pathology, 28(2), 844-856.https://doi.org/10.1044/2018_AJSLP-MSC18-18-0112
CopyrightOther than for strictly personal use, it is not permitted to download or to forward/distribute the text or part of it without the consent of theauthor(s) and/or copyright holder(s), unless the work is under an open content license (like Creative Commons).
Take-down policyIf you believe that this document breaches copyright please contact us providing details, and we will remove access to the work immediatelyand investigate your claim.
Downloaded from the University of Groningen/UMCG research database (Pure): http://www.rug.nl/research/portal. For technical reasons thenumber of authors shown on this cover page is limited to 10 maximum.
Download date: 26-12-2020
brought to you by COREView metadata, citation and similar papers at core.ac.uk
provided by University of Groningen

AJSLP
Research Article
Profiling Speech Sound Disorders forClinical Validation of the Computer
Articulation InstrumentLeenke van Haaften,a Sanne Diepeveen,a,b Hayo Terband,c Bernadette Vermeij,d
Lenie van den Engel-Hoek,a Bert de Swart,a,b and Ben Maassene
Purpose: The current article presents data from 2 studieson clinical groups of children referred for speech assessment.The aims of these studies are to validate the ComputerArticulation Instrument (CAI) with the known-group validationmethod and to determine the differential diagnostic powerof the resulting speech profiles.Method: Study 1 examined known-group validity bycomparing the scores of 93 children diagnosed with speech-language difficulties on the picture naming (PN) task of theCAI with intelligibility judgments given by speech-languagepathologists. In Study 2, the speech profiles of 41 childrendiagnosed with speech sound disorders (SSDs), consistingof 4–6 factor scores extracted from the 4 tasks of the CAI,namely, PN, nonword imitation (NWI), word and nonwordrepetition, and maximum repetition rate (MRR), were validatedagainst clinical judgments of severity of the SSD given byspeech-language pathologists.Results: In Study 1, a repeated-measures analysis ofvariance revealed a significant effect of intelligibility levelon the PN performance of the CAI and there were highly
significant correlations between intelligibility and PNperformance in the expected direction. Neither intelligibilitylevel nor PN performance was related to nonverbalintelligence and language scores. The analysis of varianceand a series of t tests in Study 2 revealed significantdifferences between the moderate and severe groups forthe CAI factors based on PN and NWI and the bisyllabicand trisyllabic sequences of MRR, but not for the factorword and nonword proportion of whole-word variabilitybased on word and nonword repetition, and the monosyllabicsequences of MRR. These results suggest that, especially,the tasks PN, NWI, and the bisyllabic and trisyllabicsequences of MRR are most sensitive for diagnosingSSDs.Conclusions: The findings of these 2 studies support theknown-group validity of the CAI. Together with the resultsof a previous study of our group on reliability and validity(van Haaften et al., 2019), we can conclude that the CAI isa reliable and valid tool for assessment of children withSSDs.
Children with speech production problems are oneof the four subtypes that can be distinguished inchildren with a specific language impairment (Van
Weerdenburg, Verhoeven, & Van Balkom, 2006). Theyshow a specific profile as compared to the other subtypesof children with language impairments: difficulties withlexical–semantic abilities, with auditory conceptualization,or with verbal sequential memory (Van Weerdenburg et al.,2006). Recently, Bishop et al. (2017) proposed to use theterm developmental language disorder (DLD) when a lan-guage disorder was not associated with a known biomedicaletiology. They state that DLD is a heterogeneous categorythat encompasses a wide range of problems, including ex-pressive phonological problems. Phonological problems inpreschoolers that are not accompanied by other languageproblems do not meet the criteria for DLD. Therefore,Bishop et al. propose to use the more general term speech
aDepartment of Rehabilitation, Donders Institute for Brain,Cognition and Behaviour, Radboud University Medical Center,Nijmegen, the NetherlandsbHAN University of Applied Sciences, Nijmegen, the NetherlandscUtrecht Institute of Linguistics-OTS, Utrecht University, the NetherlandsdDutch Foundation for the Deaf and Hard of Hearing Child,Amsterdam, the NetherlandseCenter for Language and Cognition, Groningen University,the Netherlands
Correspondence to Ben Maassen: [email protected]
Editor-in-Chief: Kristie SpencerEditor: Kirrie Ballard
Received May 18, 2018Revision received October 11, 2018Accepted November 12, 2018https://doi.org/10.1044/2018_AJSLP-MSC18-18-0112Publisher Note: This article is part of the Special Issue: Selected PapersFrom the 2018 Conference on Motor Speech—Clinical Science andInnovations.
Disclosure: The authors have declared that no competing interests existed at the timeof publication.
American Journal of Speech-Language Pathology • Vol. 28 • 844–856 • July 2019 • Copyright © 2019 American Speech-Language-Hearing Association844

sound disorder (SSD) for such cases. SSD is an umbrellaterm that includes expressive phonological problems andproblems with speech production that have motor or physi-cal origins or involve misarticulations such as a lisp, wherea sound is produced in a distorted way without losing thecontrast with other sounds. Children with SSDs are one ofthe most common clinical populations for speech-languagepathologists (SLPs; Mullen & Schooling, 2010); the reportedprevalence is highly variable, ranging from 2.3% to 24.6%(Eadie et al., 2015; Law, Boyle, Harris, Harkness, & Nye,2000). They form a heterogeneous group, showing variabil-ity in severity, etiology, proximal causes, speech error char-acteristics, and response to treatment (Dodd, 2011).
There are several widely recognized classification sys-tems for SSDs featuring a variety of approaches, namely,etiology, descriptive linguistics, and psycholinguistic andpsychomotor processing (Waring & Knight, 2013). In cur-rent practice, symptom patterns form the basis of diagnosticclassification (Dodd, 1995b, 2014). The Speech DisordersClassification System described by Shriberg et al. (2017)divides SSDs into three classes, based on etiology: speechdelay, speech errors, and motor speech disorder (MSD; in-cluding dysarthria, childhood apraxia of speech [CAS], andMSD–not otherwise specified). Examples of symptoms ofMSD include slow speech rate, distorted substitutions ofspeech sounds, increased difficulty with multisyllabic words,and prosodic errors. Yet, there is no validated list of diag-nostic patterns for differential diagnosis of SSDs. For example,one of the speech symptoms that is described for differenttypes of SSDs is inconsistency of speech errors. From a pho-nological point of view, high inconsistency of speech errorscould indicate an unstable phonological system, also calleda phonological planning deficit (Dodd, 1995a; Macrae, Tyler,& Lewis, 2014), or unstable lexical representations (Sosa &Stoel-Gammon, 2012). However, inconsistency is also acharacteristic of CAS (Davis, Jakielski, & Marquardt, 1998;Forrest, 2003; Iuzzini-Seigel, Hogan, & Green, 2017). In thelatter case, inconsistency is explained by an unstable motorsystem (articulomotor planning and programming). Thus,the same symptom can refer to different underlying deficits,and the same deficit can result in different symptoms, leadingto a wide variety of symptoms within subtypes and muchsymptomatic overlap between subtypes of SSDs. Therefore,in clinical practice, a reorientation from behavioral diagnosticsto process-oriented diagnostics is required in order to revealthe proximal causes of SSDs (Terband & Maassen, 2012).
Psycholinguistic and psychomotor models give a con-ceptual basis to analyze speech disorders and form the ba-sis for a process-oriented diagnostic classification systembased on the identification of the breakdown in the chainof sequential and parallel speech processes (Baker, Croot,McLeod, & Paul, 2001). Rather than categorization of SSDsbased on single symptoms or sets of symptoms, process-oriented diagnostics primarily focus on speech profiles com-prising clustered symptoms that can be interpreted in termsof the underlying speech production processes. An exampleof a psycholinguistic processing model is the model describedby Levelt (1989), in which “conceptualizing a preverbal
message,” either from memory or from perception, is thefirst process in speaking. The next process is formulatinga word or sentence, driven by two steps of lexicalization:selecting a lemma, containing meaning and grammaticalinformation, and the corresponding lexeme or word form,which forms the input for the next stage of phonologicalencoding. Phonological encoding entails specifying the se-quence of speech sounds together with their syllabic andprosodic structure. These syllables are the basic units ofarticulomotor planning and programming. The final pro-cess of actually performing the articulatory movements isexecution, resulting in an acoustic speech signal (Maassen& Terband, 2015). Levelt, Roelofs, and Meyer (1999) vali-dated this processing model with normal speech productiondata, and Nijland (2003) further elaborated on the planning,execution, and monitoring stages of the model and appliedit to analyses of SSDs. By conducting different speech ex-periments in children with CAS, Nijland could concludethat both phonetic planning and motor programming aredeviant in children with CAS. Levelt’s model is relevant foranalyzing SSDs because of the stages lexeme retrieval, pho-nological encoding, and self-monitoring, which are theprocesses underlying consistent and inconsistent phonologi-cal disorder (PD). MSDs, of which CAS and dysarthria arethe main diagnostic categories, can be described by meansof the motor planning, programming, and execution pro-cesses. However, the main objective of a process-orientedapproach is not to categorize but to give a complete charac-terization of the speech profile, such that underlying pro-cessing deficits can be identified. Insight into the deficitsthat might be the underlying causes of the child’s difficultyrequires an extensive analysis of a child’s performance on arange of speech tasks that reflect different levels of process-ing. Based on these premises, the Computer ArticulationInstrument (CAI) was developed (Maassen et al., 2019).The CAI consists of a battery of speech production tasksand is based on a series of studies of Dutch children withdevelopmental and acquired SSDs (Nijland, Maassen, &van der Meulen, 2003; Nijland, Maassen, van der Meulen,Gabreëls, et al., 2003; Nijland, Terband, & Maassen, 2015;Thoonen, Maassen, Gabreels, & Schreuder, 1999; Thoonen,Maassen, Gabreëls, & Schreuder, 1994). The CAI has amodular structure and provides an interactive administra-tion and scoring of four speech tasks. The tasks comprise(a) picture naming (PN), (b) nonword imitation (NWI),(c) word and nonword repetition (WR and NWR), and(d) maximum repetition rate (MRR), thereby covering pho-nological and speech motor skills.
As demonstrated in Figure 1, PN taps into the wholechain of speech processes, from preverbal visual–conceptualprocessing to lemma access, word-form selection, phono-logical encoding, motor planning, and articulation (motorexecution; Maassen & Terband, 2015). During NWI, a childis asked to reproduce nonwords (or nonsense words). Incontrast to PN, a child cannot revert to its lexicon duringthis task, and thus the child either needs to analyze the pho-nological structure of the nonword directly, addressing thephonological decoding and encoding system, or follows the
van Haaften et al.: Clinical Validation of the CAI 845

auditory-to-motor-planning pathway. In WR and NWR, achild is asked to repeat a word or nonword five times. Thistask aims to assess variability in speech production, whichoccurs when a child uses multiple productions of the sameword or nonword. MRR is a pure motor task (articulomotorplanning and programming) and does not require any knowl-edge of words, syllables, or phonemes. The evaluation ofspeech production in the CAI is based on phonetic tran-scriptions and acoustic measurements. Both the tasks andspeech analyses are computer implemented (van Haaftenet al., 2019). Rather than focusing on single diagnosticmarkers, two types of analyses are conducted within theCAI: (a) objective and quantitative assessment of symptomsand (b) contrasting severity of symptoms across tasks. Theoutcome of this assessment battery is a speech performanceprofile that can be interpreted as characteristics of breakdownin underlying processes. Normative data from 1,524 childrenin the age range of 2;0–6;11 (years;months) have been collected,such that performance on the CAI as a whole, as well as theprofile of performances on the different tasks, can be quantifiedin percentile scores, which allows for interpretation in terms ofstrengths and weaknesses (Maassen et al., 2019).
In a previous study of our research group, we assessedthe psychometric properties of the CAI, including reli-ability and construct validity (van Haaften et al., 2019).Overall, sufficient to good values were found for interra-ter reliability, but intraclass correlation coefficients ontest–retest reliability were low, probably due to better perfor-mance at retest reflecting a test–retest learning effect inaddition to normal development. The study also describedtwo aspects of construct validity. The first aspect, criterionvalidity, was confirmed by clear and significant age trends
in CAI parameters in a large sample of typically developingchildren aged between 2 and 7 years. The second aspect ofconstruct validity, structural validity, was assessed by factoranalysis and correlations. Factor analyses on a totalnumber of 20 parameters revealed five meaningful factors:PN; segmental quality of NWI (NWI-Seg); quality of syl-labic structure of NWI (NWI-Syll); word and nonword pro-portion of whole-word variability (PWV), based on WRand NWR; and MRR. Weak correlations were found be-tween CAI factor scores, indicating the independent con-tribution of each factor to the speech profile.
Further steps are needed in the validation process ofthe CAI. The ultimate goal is to assess the strengths of thefive CAI factors in identifying the breakdown of speechprocesses in children with SSDs (process-oriented diagnos-tics), which will be described in future articles. The moreimmediate step, determining known-group validity, is pre-sented in the current study. Known-group validity is a thirdaspect of construct validity and refers to the degree to whicha measure is sensitive to differentiate between subgroupsthat are hypothesized to have different scores (Portney &Watkins, 2009). To assess this aspect of construct validityof the CAI, this article presents data from two studies onclinical groups of children with speech language impairmentsand SSDs. The aim of Study 1 is to determine known-groupvalidity by comparing the scores of children with speechlanguage impairments, as diagnosed on the basis of lan-guage and intelligence tests, on one task of the CAI (PN)with intelligibility judgments given by SLPs. Study 2 aimsto determine the diagnostic power of all four tasks of theCAI by comparing the five CAI factors: PN, NWI-Seg,NWI-Syll, PWV, and MRR (see also Table 4) with a
Figure 1. The speech production processes assessed in the four tasks of the Computer Articulation Instrument (Maassen& Terband, 2015; Figure 15.2). MRR = maximum repetition rate.
846 American Journal of Speech-Language Pathology • Vol. 28 • 844–856 • July 2019

severity judgment of the speech difficulties (mild, moderate,and severe) of children with SSDs.
Study 1The first study was designed to validate the scores on
the PN task of the CAI with intelligibility judgments (good,moderate, poor) in children diagnosed with speech languageimpairments. For this study, the parameter “percentageof consonants correct” of the PN task is used (PN-PCC),and nonverbal intelligence and language tests are used forthe speech language impairment diagnosis.
MethodEthics, Consent, and Permissions
The research ethics committee of the Radboud Univer-sity Nijmegen Medical Centre stated that this study does notfall within the remit of the Medical Research Involving HumanSubjects Act (Wet medisch-wetenschappelijk onderzoek metmensen; file number: CMO 2016-2985). Therefore, this studycan be carried out (in the Netherlands) without an approvalby an accredited research ethics committee. Informed consentwas obtained from all parents or guardians.
ParticipantsNinety-three children aged between 3;0 and 4;0
participated in this study (see Table 1). The sample con-sisted of 73 boys and 20 girls, representative for the genderdistribution in children with speech language impairments.All children attended one of the intervention centers forpreschoolers with speech language impairments at theNederlandse Stichting voor het Dove en SlechthorendeKind, a specialized diagnostic and intervention center forchildren with hearing loss or speech language impairments.Before admission to the center, these children had beenreferred to an audiology center (AC) by their family doc-tor or health care physician on the basis of suspected speechlanguage impairment. At the AC, nonverbal intelligence isassessed by a psychologist, receptive and expressive languagetests are administered by an SLP, and hearing status is eval-uated by audiometry. Children meet the criteria for referral
to a speech language impairment intervention center whenthey have difficulties in language production and/or languagecomprehension and/or when their speech is highly unintelli-gible. Admission takes place if they have a score of at least1.5 SDs below the mean on at least one standardized, norm-referenced language test. Children with hearing loss of 25 dBor more were excluded for this study.
Nonverbal intelligence and language skills were assessedwithin a period ranging from 3 months before until 3 monthsafter the start of the intervention. If language scores weremissing or were older than 3 months at the start of the in-tervention, language performance was assessed by the SLPof the intervention center within 3 months after the inter-vention started.
Materials and ProcedureNonverbal intelligence was assessed with the Snijders-
Oomen Nonverbal Intelligence Test 2½-7–Revised (Snijders,Tellegen, Winkel, & Laros, 2003), yielding a nonverbal intel-ligence quotient (NVIQ). Vocabulary was tested with theDutch version of the Peabody Picture Vocabulary Test–III(Schlichting, 2005), yielding a vocabulary quotient (QPPVT).The Schlichting Test for Language Comprehension andLanguage Production (Schlichting & Spelberg, 2010a, 2010b)was used to measure receptive (receptive language quotient:RLQ) and expressive (sentence and word production quo-tient: SWQ) language skills. These norm-based standardscores or Q scores (M = 100, SD = 15) of each test wereused for the analyses.
In addition to the measures for nonverbal intelligenceand language, the CAI was administered to all the children(Maassen et al., 2019). For this study, the PN task of theCAI was used. The task was administered by SLPs of thespeech language impairment early intervention group,specifically trained in the administration of the CAI. PNcontains 60 words, covering the full inventory of vowels,consonants, clusters, and syllable structures of the Dutchlanguage. For this study, the parameter PN-PCC was usedfor analyses. Individual PN-PCC scores were transformedinto z scores by subtracting the mean of the normativegroup and dividing by the standard deviation of the studygroup; this was done for three age groups (36–39, 40–43,and 44–47 months) separately. The reason for dividing by
Table 1. Number of children per age category and completed tests.
Age category N Boys Girls NVIQ QPPVT RLQ SWQ PN-PCC-Q
36–39 months 29 23 6 26 25 23 22 2940–43 months 35 28 7 32 33 21 22 3544–47 months 29 22 7 26 28 19 17 29
Total 93 73 20 84 86 63 61 93% Missing values 9.7% 7.5% 32.3% 34.4% 0%
Note. NVIQ = nonverbal intelligence quotient; QPPVT = Peabody Picture Vocabulary Test, vocabulary quotient; RLQ = receptive languagequotient; SWQ = sentence and word production quotient; PN-PCC-Q = Computer Articulation Instrument’s picture naming percentage consonantscorrect quotient.
van Haaften et al.: Clinical Validation of the CAI 847
the standard deviation of the study group rather than thestandard deviation of the norm group was that the formerwas approximately three times as large as the latter (18.9compared to 6.3). Applying the broader confidence intervalsof the study group yields the more conservative estimates.z Scores were transformed into Q scores (formula: Q = 100 +15*z) to make them comparable to the cognitive and lan-guage scores NVIQ, QPPVT, RLQ, and SWQ.
For each child, the SLP rated the intelligibility on athree-level scale: good, moderate, or poor. The same methodis used in the study of Lohmander, Lundeborg, and Persson(2016). Twenty-two children were rated with a “good” intel-ligibility, 46 were rated as with a “moderate” intelligibility,and 25 children were rated with a “poor” intelligibility.
Statistical AnalysesTo test the hypothesis that there is a difference in mean
Q scores of the nonverbal intelligence test, language tests, andCAI for the three intelligibility levels, a one-way repeated-measures analysis of variance (ANOVA) was conducted withQ score as a dependent variable, test instrument as a within-subject factor (five levels: NVIQ, QPPVT, RLQ, SWQ, andPN-PCC quotient [PN-PCC-Q]), and intelligibility level asa between-subjects factor (three levels: good, moderate, andpoor). Mauchly’s test of sphericity was conducted to test thehypothesis that the variances of differences between condi-tions are equal. Bonferroni correction was applied for posthoc comparisons. A series of ANOVAs was performed toevaluate differences between Q scores for the three levels ofintelligibility. Levene’s test of equality of error variances wasconducted to test the homogeneity of variance assumption.Bonferroni correction was applied for post hoc comparisons.Correlations between Q scores and intelligibility levels werecalculated with Spearman rank correlation coefficients, andcorrelations between the Q scores of the different tests werecalculated with Pearson rank correlation coefficients. Missingvalues were replaced by the mean per age group (i.e., meanimputation method). All statistical analyses were performedusing SPSS Version 20 for Windows (SPSS Inc.).
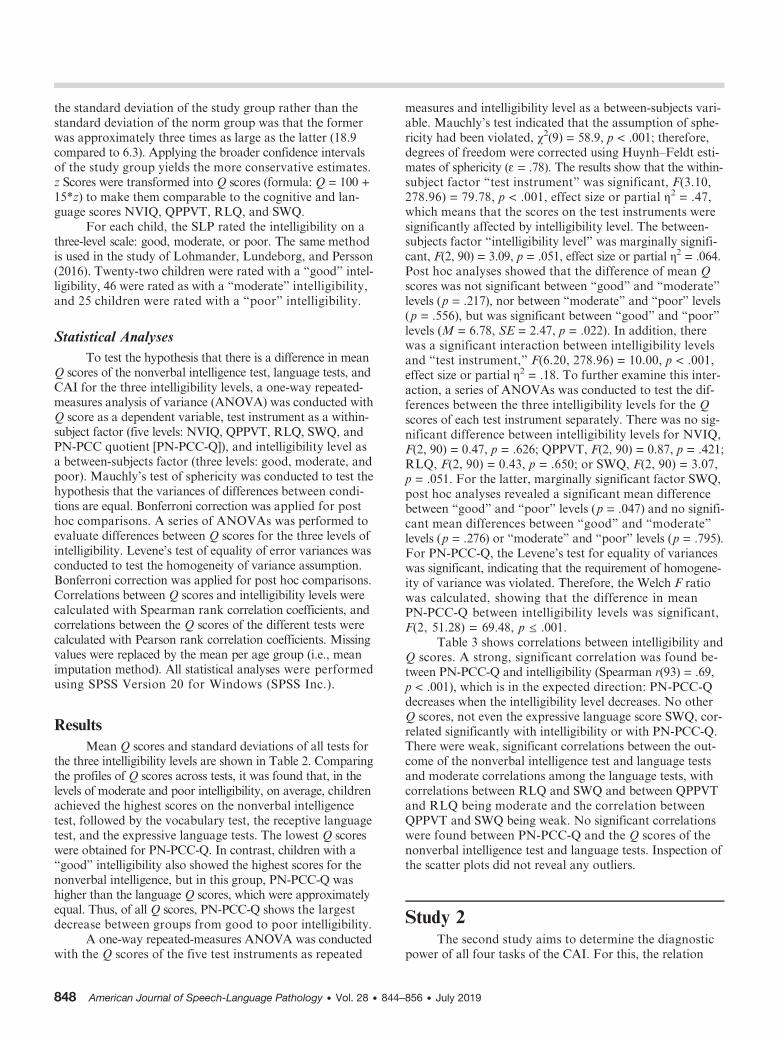
ResultsMean Q scores and standard deviations of all tests for
the three intelligibility levels are shown in Table 2. Comparingthe profiles of Q scores across tests, it was found that, in thelevels of moderate and poor intelligibility, on average, childrenachieved the highest scores on the nonverbal intelligencetest, followed by the vocabulary test, the receptive languagetest, and the expressive language tests. The lowest Q scoreswere obtained for PN-PCC-Q. In contrast, children with a“good” intelligibility also showed the highest scores for thenonverbal intelligence, but in this group, PN-PCC-Q washigher than the language Q scores, which were approximatelyequal. Thus, of all Q scores, PN-PCC-Q shows the largestdecrease between groups from good to poor intelligibility.
A one-way repeated-measures ANOVA was conductedwith the Q scores of the five test instruments as repeated
measures and intelligibility level as a between-subjects vari-able. Mauchly’s test indicated that the assumption of sphe-ricity had been violated, χ2(9) = 58.9, p < .001; therefore,degrees of freedom were corrected using Huynh–Feldt esti-mates of sphericity (ɛ = .78). The results show that the within-subject factor “test instrument” was significant, F(3.10,278.96) = 79.78, p < .001, effect size or partial η2 = .47,which means that the scores on the test instruments weresignificantly affected by intelligibility level. The between-subjects factor “intelligibility level” was marginally signifi-cant, F(2, 90) = 3.09, p = .051, effect size or partial η2 = .064.Post hoc analyses showed that the difference of mean Qscores was not significant between “good” and “moderate”levels (p = .217), nor between “moderate” and “poor” levels(p = .556), but was significant between “good” and “poor”levels (M = 6.78, SE = 2.47, p = .022). In addition, therewas a significant interaction between intelligibility levelsand “test instrument,” F(6.20, 278.96) = 10.00, p < .001,effect size or partial η2 = .18. To further examine this inter-action, a series of ANOVAs was conducted to test the dif-ferences between the three intelligibility levels for the Qscores of each test instrument separately. There was no sig-nificant difference between intelligibility levels for NVIQ,F(2, 90) = 0.47, p = .626; QPPVT, F(2, 90) = 0.87, p = .421;RLQ, F(2, 90) = 0.43, p = .650; or SWQ, F(2, 90) = 3.07,p = .051. For the latter, marginally significant factor SWQ,post hoc analyses revealed a significant mean differencebetween “good” and “poor” levels (p = .047) and no signifi-cant mean differences between “good” and “moderate”levels (p = .276) or “moderate” and “poor” levels (p = .795).For PN-PCC-Q, the Levene’s test for equality of varianceswas significant, indicating that the requirement of homogene-ity of variance was violated. Therefore, the Welch F ratiowas calculated, showing that the difference in meanPN-PCC-Q between intelligibility levels was significant,F(2, 51.28) = 69.48, p ≤ .001.
Table 3 shows correlations between intelligibility andQ scores. A strong, significant correlation was found be-tween PN-PCC-Q and intelligibility (Spearman r(93) = .69,p < .001), which is in the expected direction: PN-PCC-Qdecreases when the intelligibility level decreases. No otherQ scores, not even the expressive language score SWQ, cor-related significantly with intelligibility or with PN-PCC-Q.There were weak, significant correlations between the out-come of the nonverbal intelligence test and language testsand moderate correlations among the language tests, withcorrelations between RLQ and SWQ and between QPPVTand RLQ being moderate and the correlation betweenQPPVT and SWQ being weak. No significant correlationswere found between PN-PCC-Q and the Q scores of thenonverbal intelligence test and language tests. Inspection ofthe scatter plots did not reveal any outliers.
Study 2The second study aims to determine the diagnostic
power of all four tasks of the CAI. For this, the relation
848 American Journal of Speech-Language Pathology • Vol. 28 • 844–856 • July 2019

between the five CAI factors (PN, NWI-Seg, NWI-Syll,word and nonword PWV, and MRR) and clinical judg-ments of severity of the speech disorder by the SLPs isinvestigated.
MethodEthics, Consent, and Permissions
The ethics approval for Study 1 also applied to Study 2.
ParticipantsThe participants in Study 2 were 41 children with an
age range from 3;0 to 6;4, with 26 boys and 15 girls. Forthis study, children with SSDs were recruited from severalinstitutions: 19 children from primary health care services,one child from an AC, and 21 children from a specialschool for children with language and hearing impair-ments. All parents or caregivers were given an informationletter. After obtaining the signed parental consent form,the child was included in the study.
The parents or caregivers of all 41 children were askedto provide information about the children’s hearing status.They were asked whether the child had a history of hearingproblems, if hearing problems had been recorded duringthe regular governmental (neonatal) hearing screening, and,if available, if they could provide us with hearing acuitydata (pure-tone thresholds). Thirty children passed a bilat-eral hearing screening at 20 dB. Parents or caregivers of the
other 11 children reported no history of hearing problemsand no hearing problems recorded during the regular gov-ernmental (neonatal) hearing screening.
Prior to the procedures of this study, a speech diag-nosis was reported by the SLP of the child, based on clini-cal observation and a standard speech-language protocol,including standardized language tests. Speech was observedwith different instruments. Until now, for the Dutch lan-guage, no standardized and normalized speech assessmentis available. All children were diagnosed with SSDs, mostof them (n = 36) with a PD, two children with CAS, andthree children with an unknown diagnosis because no de-tails were available about the children’s speech apart fromthe fact that their SSD was severe. Differential diagnosiswas part of the clinical reasoning process of the SLP andwas done based on diagnostic criteria described in stud-ies such as Forrest (2003) and Shriberg and Kwiatkowski(1994).
Materials and ProcedureFor this study, all participants were tested on their
speech skills with the CAI. All four tasks (PN, NWI, WRand NWR, and MRR) were administered. Both the ad-ministration of the tests and the analyses of the speech arecomputer implemented. Table 4 shows the parameters usedto assess task performance; a detailed description of theCAI and these parameters, as well as a description of thenormative data set, is presented in Maassen et al. (2019) andvan Haaften et al. (2019); for all parameters, percentile
Table 3. Spearman and Pearson rank correlations between intelligibility levels and Q scores and between Q scores (N = 93).
Intelligibility level and Q scores Intelligibility level NVIQ QPPVT RLQ SWQ PN-PCC-Q
Intelligibility level Spearman r 1 .027 −.14 −.11 .20 .69**NVIQ Pearson r — 1 .36** .31** .35** .10QPPVT Pearson r — 1 .52** .36** −.22RLQ Pearson r — 1 .48** −.15SWQ Pearson r — 1 .21PN-PCC-Q Pearson r — 1.
Note. NVIQ = nonverbal intelligence quotient; QPPVT = Peabody Picture Vocabulary Test, vocabulary quotient; RLQ = receptive languagequotient; SWQ = sentence and word production quotient; PN-PCC-Q = Computer Articulation Instrument’s picture naming percentageconsonants correct quotient.
*Correlation of factor scores is significant at the .05 level (two-tailed). **Correlation of factor scores is significant at the .01 level (two-tailed).
Table 2. Mean Q scores for the nonverbal intelligence, language, and speech tests.
Intelligibilityscore N
NVIQ QPPVT RLQ SWQ PN-PCC-Q
M SD M SD M SD M SD M SD
Good 22 102.8 11.6 84.7 18.8 78.6 11.3 78.2 10.4 92.5 5.99Moderate 46 99.9 11.2 89.9 16.6 80.9 13.7 74.0 9.50 73.4 11.3Poor 25 100.9 11.4 90.9 18.2 82.2 14.0 71.3 9.33 62.5 14.1
Note. NVIQ = nonverbal intelligence quotient; QPPVT = Peabody Picture Vocabulary Test, vocabulary quotient; RLQ = receptive languagequotient; SWQ = sentence and word production quotient; PN-PCC-Q = Computer Articulation Instrument’s picture naming percentageconsonants correct quotient.
van Haaften et al.: Clinical Validation of the CAI 849

scores can be determined. A factor analysis on all 20 pa-rameters of the normative data, obtained from a total num-ber of 1,524 children, yielded five factors: (a) PN, (b)NWI-Seg, (c) NWI-Syll, (d) PWV of words and non-words, and (e) MRR (van Haaften et al., 2019). For thisstudy, factor scores were calculated based on the factorweights obtained from this factor analysis. Because there weremany missing values in the MRR task (see below), separatefactor scores were calculated on only the monosyllabic MRRsequences (/papa../, /tata../, /kaka../; yielding factor MRR-Mono) and the bisyllabic (/pata../, /taka../) and trisyllabic(/pataka../) sequences, yielding factor MRR-BiTri.
Prior to the administration of the CAI, severity of theSSDs was judged by the child’s SLP (N = 11) on a severityscale with three categories—mild, moderate, and severe—following the categories proposed by Dodd (1995c). An SLPrated the severity of an SSD as mild when a child is mostlyintelligible in spontaneous speech but errors are obviousand distracting from content. The severity was rated moderatewhen single words are often intelligible in context but con-nected speech is often difficult to understand, particularlyout of context. The category severe was rated when most ut-terances are unintelligible on the first meeting. Also, thepersistence of the speech disorder and the consequences oncommunication abilities were taken into account whenrating severity. The category “moderate” was scored for14 children, and 27 children were scaled as “severe.” Noneof the children was scaled as having a “mild” speech disorder.Therefore, the statistical analyses of this study are based on
two severity categories: moderate and severe. Table 5 showsthe distribution of the participants in the three severity cate-gories by speech diagnosis.
The tasks of the CAI were administered by (candidate)SLPs specifically trained in the administration of the CAI.
Statistical AnalysesThe factor PWV had two missing values, and these
were replaced by the overall PWV mean (M = −1.20; i.e.,mean imputation method). Much more missing data wereobserved for the MRR tasks, due to speech–motor difficultiesand/or shyness or inattentiveness of the child; also, a fewrecordings could not be analyzed due to the low acousticquality. Of the total number of 41 children, only 23 producedat least two monosyllabic sequences correctly (44% missing),
Table 4. Computer Articulation Instrument parameters per speech task and extracted factors.
Task Factor Parameter
PN PN PCCI Percentage of consonants correct in syllable-initial positionPVC Percentage of vowels correctLevel 5 Percentage of correct consonants /l/ and /R/RedClus Percentage of reduction of initial consonant clusters from two consonants
to oneCCVC Percentage of correct syllable structure CCVC (C = consonant, V = vowel)
NWI NWI-Seg PCCI Percentage of consonants correct in syllable-initial positionPVC Percentage of vowels correctLevel 4 Percentage of correct consonants /b/, /f/, and /ʋ/Level 5 Percentage of correct consonants /l/ and /R/CVC Percentage of correct syllable structure CVC
NWI-Syll RedClus Percentage of reduction of initial consonant clusters from two consonantsto one
CCVC Percentage of correct syllable structure CCVCWR PWV PWV Word Proportion of whole-word variability: word repetitionNWR PWV Nonword Proportion of whole-word variability: nonword repetitionMRR MRR-Mono MRR-pa Number of syllables per second of sequence /pa/
MRR-ta Number of syllables per second of sequence /ta/MRR-ka Number of syllables per second of sequence /ka/
MRR-BiTri MRR-pataka Number of syllables per second of sequence /pataka/MRR-pata Number of syllables per second of sequence /pata/MRR-taka Number of syllables per second of sequence /taka/
Note. PN = picture naming; NWI = nonword imitation; WR = word repetition; NWR = nonword repetition; MRR = maximum repetition rate; PN =factor score of all parameters of picture naming; NWI-Seg = factor score of the segmental parameters of nonword imitation; NWI-Syll = factor scoreof the syllable structure parameters of nonword imitation; PWV = factor score of the two PWV parameters of word and nonword repetition;MRR-Mono = factor score of the monosyllabic items of maximum repetition rate parameters; MRR-BiTri = factor score of the bisyllabic andtrisyllabic items of maximum repetition rate parameters.
Table 5. Speech diagnosis by severity categories.
Severitycategory
Speech disorder
PD CAS Unknown Total
Mild 0 0 0 0Moderate 13 1 0 14Severe 23 1 3 27
Total 36 2 3 41
Note. PD = phonological disorder; CAS = childhood apraxia ofspeech.
850 American Journal of Speech-Language Pathology • Vol. 28 • 844–856 • July 2019
and only nine of these 23 (amounting to 78% missing data)produced at least two of the bisyllabic or trisyllabic se-quences. Because of this large number of missing values, noimputation was applied, but a separate analysis was con-ducted instead on the group of 23 children. The 14 childrenwho were not able to produce the bisyllabic or trisyllabic se-quences were assigned the lowest z score, such that failureto produce these sequences was marked as poor performance.One-way repeated-measures ANOVAs were conducted totest the hypothesis that there is a difference in CAI factorsfor the two severity categories, comprising two levels:“moderate” and “severe.” Because of the missing data infactors MRR-Mono and MRR-BiTri, the first analysiswas conducted on the four remaining factors: PN, NWI-Seg,NWI-Syll, and PWV. Subsequently, a one-way repeated-measures ANOVA was conducted with six CAI factors, in-cluding MRR-Mono and MRR-BiTri. Mauchly’s tests ofsphericity were conducted to test the hypothesis that thevariances of differences between conditions are equal. Next,if in the ANOVA either severity level or the interaction be-tween severity level and CAI factor was significant, a seriesof independent t tests was conducted to evaluate the differencein factor scores between the moderate and severe groups foreach of the four or six CAI factors separately. Levene’s test ofequality of error variances was conducted to test the homo-geneity of variance assumption. Correlations between CAIfactors and severity categories were calculated by Spearmanrank correlation coefficients (r), and correlations betweenthe CAI factors were assessed by calculating Pearson rankcorrelation coefficients (r). All statistical analyses were per-formed using SPSS Version 20 for Windows (SPSS Inc.).
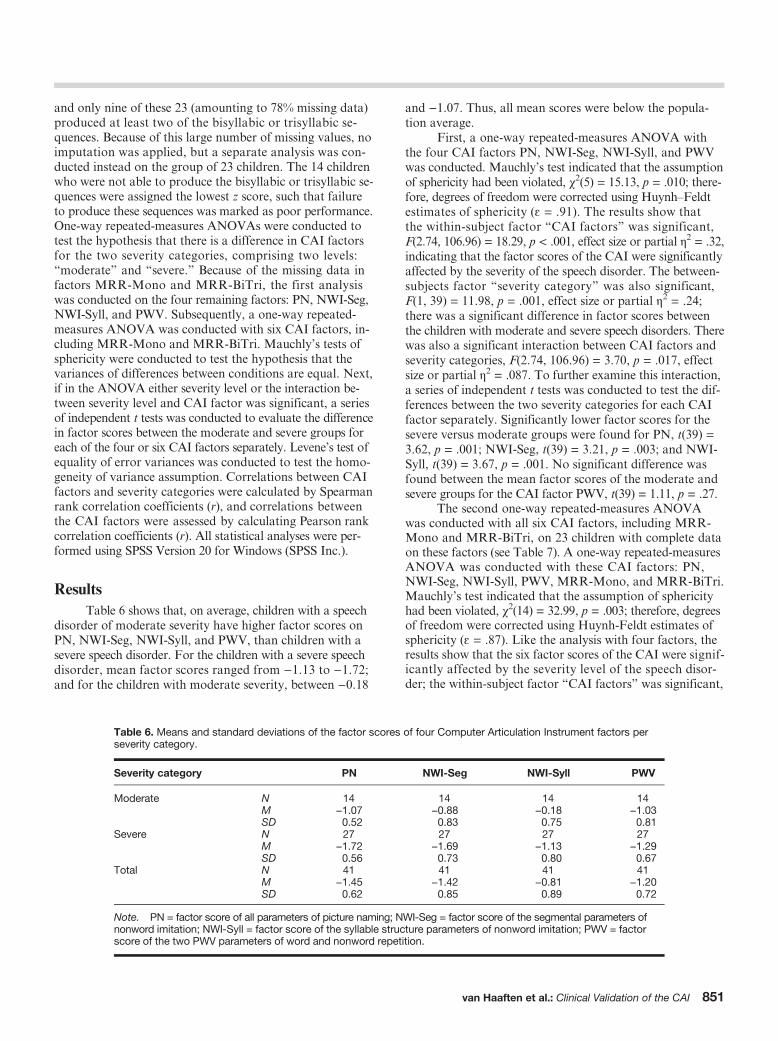
ResultsTable 6 shows that, on average, children with a speech
disorder of moderate severity have higher factor scores onPN, NWI-Seg, NWI-Syll, and PWV, than children with asevere speech disorder. For the children with a severe speechdisorder, mean factor scores ranged from −1.13 to −1.72;and for the children with moderate severity, between −0.18
and −1.07. Thus, all mean scores were below the popula-tion average.
First, a one-way repeated-measures ANOVA withthe four CAI factors PN, NWI-Seg, NWI-Syll, and PWVwas conducted. Mauchly’s test indicated that the assumptionof sphericity had been violated, χ2(5) = 15.13, p = .010; there-fore, degrees of freedom were corrected using Huynh–Feldtestimates of sphericity (ɛ = .91). The results show thatthe within-subject factor “CAI factors” was significant,F(2.74, 106.96) = 18.29, p < .001, effect size or partial η2 = .32,indicating that the factor scores of the CAI were significantlyaffected by the severity of the speech disorder. The between-subjects factor “severity category” was also significant,F(1, 39) = 11.98, p = .001, effect size or partial η2 = .24;there was a significant difference in factor scores betweenthe children with moderate and severe speech disorders. Therewas also a significant interaction between CAI factors andseverity categories, F(2.74, 106.96) = 3.70, p = .017, effectsize or partial η2 = .087. To further examine this interaction,a series of independent t tests was conducted to test the dif-ferences between the two severity categories for each CAIfactor separately. Significantly lower factor scores for thesevere versus moderate groups were found for PN, t(39) =3.62, p = .001; NWI-Seg, t(39) = 3.21, p = .003; and NWI-Syll, t(39) = 3.67, p = .001. No significant difference wasfound between the mean factor scores of the moderate andsevere groups for the CAI factor PWV, t(39) = 1.11, p = .27.
The second one-way repeated-measures ANOVAwas conducted with all six CAI factors, including MRR-Mono and MRR-BiTri, on 23 children with complete dataon these factors (see Table 7). A one-way repeated-measuresANOVA was conducted with these CAI factors: PN,NWI-Seg, NWI-Syll, PWV, MRR-Mono, and MRR-BiTri.Mauchly’s test indicated that the assumption of sphericityhad been violated, χ2(14) = 32.99, p = .003; therefore, degreesof freedom were corrected using Huynh-Feldt estimates ofsphericity (ɛ = .87). Like the analysis with four factors, theresults show that the six factor scores of the CAI were signif-icantly affected by the severity level of the speech disor-der; the within-subject factor “CAI factors” was significant,
Table 6. Means and standard deviations of the factor scores of four Computer Articulation Instrument factors perseverity category.
Severity category PN NWI-Seg NWI-Syll PWV
Moderate N 14 14 14 14.M −1.07 −0.88 −0.18 −1.03SD 0.52 0.83 0.75 0.81
Severe N 27 27 27 27.M −1.72 −1.69 −1.13 −1.29SD 0.56 0.73 0.80 0.67
Total N 41 41 41 41.M −1.45 −1.42 −0.81 −1.20SD 0.62 0.85 0.89 0.72
Note. PN = factor score of all parameters of picture naming; NWI-Seg = factor score of the segmental parameters ofnonword imitation; NWI-Syll = factor score of the syllable structure parameters of nonword imitation; PWV = factorscore of the two PWV parameters of word and nonword repetition.
van Haaften et al.: Clinical Validation of the CAI 851

F(4.3, 90.9) = 6.40, p < .001, effect size or partial η2 = .23.The between-subjects factor “severity category” was alsosignificant, F(1, 21) = 4.60, p = .04, effect size or partial η2
= .18, as well as the interaction between CAI factors and se-verity categories, F(4.3, 90.9) = 4.17, p = .003, effect size orpartial η2 = .17. To further examine this interaction, inde-pendent t tests were conducted to test the differences be-tween the two severity categories for all six factors. ForNWI-Syll, t(21) = 2.61, p = .016, and MRR-BiTri, t(0.0) =2.35, p = .043, the differences between the mean factor scoresof the moderate and severe groups reached significance. Nosignificant difference was found between the severity groupsfor PWV. For PN and NWI-Seg, the differences were onlymarginally significant in this second analysis, most likelydue to less power as compared to the first analysis. It is re-markable that there is no difference between the moderateand severe groups for MRR-Mono, but there is a large sig-nificant difference for MRR-BiTri. We will come back tothis issue in the general discussion.
Table 8 shows correlations between severity categoryand CAI factors. Moderate, significant correlations werefound between severity category and PN, NWI-Seg, and
NWI-Syll. Children with a severe disorder had lower CAIfactor scores. The factor scores of PN, NWI-Seg, andNWI-Syll showed strong correlations; the correlations withPWV and MRR-BiTri were weak to moderate. No signifi-cant correlations were found between MRR-Mono andany other CAI factor.
DiscussionThe CAI is a computer-based assessment for speech
production with a range of speech tasks that reflect differ-ent levels of processing (phonological and speech motorskills), and it provides normative data based on a sampleof 1,524 children in the age range of 2;0–6;11. A previousstudy on psychometric characteristics of the CAI revealedsufficient interrater reliability, test–retest reliability, andconstruct validity (van Haaften et al., 2019). In this currentarticle, we report known-group validity, based on the out-come of two studies in children with speech language im-pairment and SSDs.
Table 7. Means and standard deviations of the factor scores of six Computer Articulation Instrument factors per severity category.
Severity category PN NWI-Seg NWI-Syll PWV MRR-Mono MRR-BiTri
ModerateN 10 10 10 10 10 10.M −1.05 −0.80 −0.29 −0.97 −1.12 −1.15SD 0.46 0.69 0.80 0.85 0.89 1.56
SevereN 13 13 13 12 13 13.M −1.52 −1.45 −1.14 −1.28 −0.60 −2.31SD 0.67 0.84 0.75 0.75 0.85 0.06
TotalN 23 23 23 22 23 23.M −1.31 −1.17 −0.77 −1.14 −0.82 −1.81SD 0.62 0.83 0.87 0.80 0.89 1.16
Note. PN = factor score of all parameters of picture naming; NWI-Seg = factor score of the segmental parameters of nonword imitation;NWI-Syll = factor score of the syllable structure parameters of nonword imitation; PWV = factor score of the two PWV parameters of wordand nonword repetition; MRR-Mono = factor score of the monosyllabic items of maximum repetition rate parameters; MRR-BiTri = factorscore of the bisyllabic and trisyllabic items of maximum repetition rate parameters.
Table 8. Spearman rank correlations and Pearson correlations between severity category and Computer Articulation Instrument factors andbetween Computer Articulation Instrument factors.
Severity category and CAI factors Severity category PN NWI-Seg NWI-Syll PWV MRR-Mono MRR-BiTri
N 41 41 41 41 41 23 23
Severity category Spearman r 1 −.53** −.50** −.50** −.19 .28 −.32PN Pearson r — 1 .80** .81** .39* −.09 .41*NWI-Seg Pearson r — 1 .68** .60** .12 .53*NWI-Syll Pearson r — 1 .51** −.03 .44*PWV Pearson r — 1 −.07 .21MRR-Mono Pearson r — 1 −.02MRR-BiTri Pearson r — 1
Note. CAI = computer articulation instrument; PN = factor score of all parameters of picture naming; NWI-Seg = factor score of the segmentalparameters of nonword imitation; NWI-Syll = factor score of the syllable structure parameters of nonword imitation; PWV = factor score ofthe two PWV parameters of word and nonword repetition; MRR-Mono = factor score of the monosyllabic items of maximum repetition rateparameters; MRR-BiTri = factor score of the bisyllabic and trisyllabic items of maximum repetition rate parameters.
*Correlation of factor scores is significant at the .05 level (two-tailed). **Correlation of factor scores is significant at the .01 level (two-tailed).
852 American Journal of Speech-Language Pathology • Vol. 28 • 844–856 • July 2019
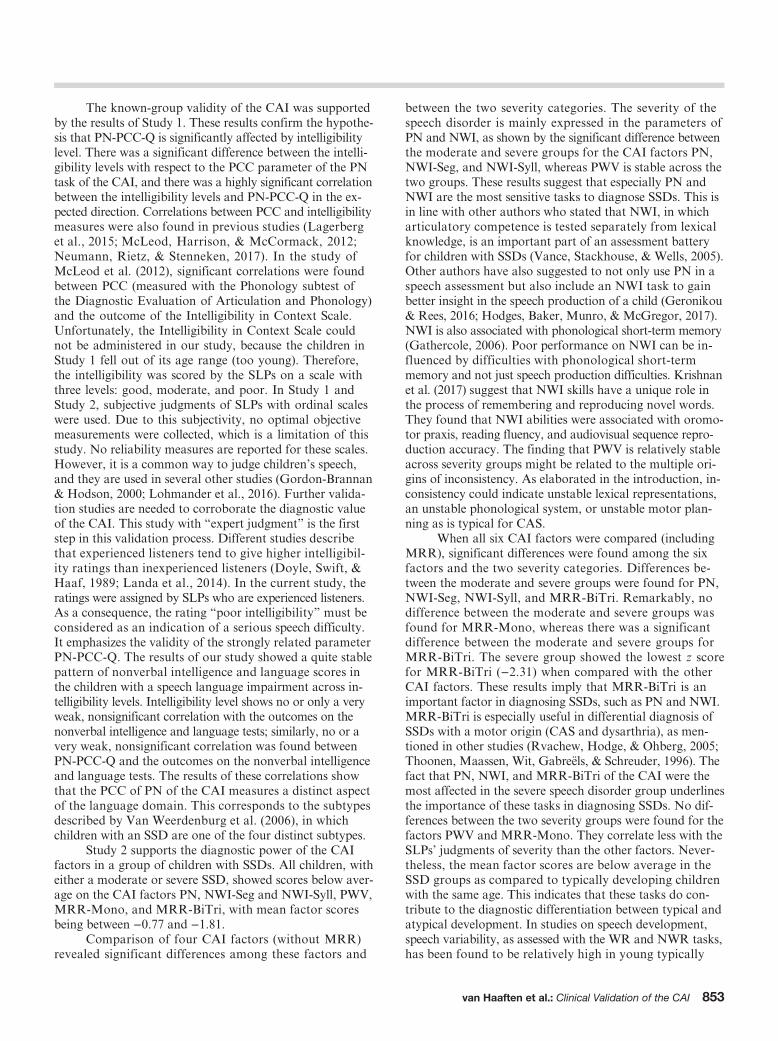
The known-group validity of the CAI was supportedby the results of Study 1. These results confirm the hypothe-sis that PN-PCC-Q is significantly affected by intelligibilitylevel. There was a significant difference between the intelli-gibility levels with respect to the PCC parameter of the PNtask of the CAI, and there was a highly significant correlationbetween the intelligibility levels and PN-PCC-Q in the ex-pected direction. Correlations between PCC and intelligibilitymeasures were also found in previous studies (Lagerberget al., 2015; McLeod, Harrison, & McCormack, 2012;Neumann, Rietz, & Stenneken, 2017). In the study ofMcLeod et al. (2012), significant correlations were foundbetween PCC (measured with the Phonology subtest ofthe Diagnostic Evaluation of Articulation and Phonology)and the outcome of the Intelligibility in Context Scale.Unfortunately, the Intelligibility in Context Scale couldnot be administered in our study, because the children inStudy 1 fell out of its age range (too young). Therefore,the intelligibility was scored by the SLPs on a scale withthree levels: good, moderate, and poor. In Study 1 andStudy 2, subjective judgments of SLPs with ordinal scaleswere used. Due to this subjectivity, no optimal objectivemeasurements were collected, which is a limitation of thisstudy. No reliability measures are reported for these scales.However, it is a common way to judge children’s speech,and they are used in several other studies (Gordon-Brannan& Hodson, 2000; Lohmander et al., 2016). Further valida-tion studies are needed to corroborate the diagnostic valueof the CAI. This study with “expert judgment” is the firststep in this validation process. Different studies describethat experienced listeners tend to give higher intelligibil-ity ratings than inexperienced listeners (Doyle, Swift, &Haaf, 1989; Landa et al., 2014). In the current study, theratings were assigned by SLPs who are experienced listeners.As a consequence, the rating “poor intelligibility” must beconsidered as an indication of a serious speech difficulty.It emphasizes the validity of the strongly related parameterPN-PCC-Q. The results of our study showed a quite stablepattern of nonverbal intelligence and language scores inthe children with a speech language impairment across in-telligibility levels. Intelligibility level shows no or only a veryweak, nonsignificant correlation with the outcomes on thenonverbal intelligence and language tests; similarly, no or avery weak, nonsignificant correlation was found betweenPN-PCC-Q and the outcomes on the nonverbal intelligenceand language tests. The results of these correlations showthat the PCC of PN of the CAI measures a distinct aspectof the language domain. This corresponds to the subtypesdescribed by Van Weerdenburg et al. (2006), in whichchildren with an SSD are one of the four distinct subtypes.
Study 2 supports the diagnostic power of the CAIfactors in a group of children with SSDs. All children, witheither a moderate or severe SSD, showed scores below aver-age on the CAI factors PN, NWI-Seg and NWI-Syll, PWV,MRR-Mono, and MRR-BiTri, with mean factor scoresbeing between −0.77 and −1.81.
Comparison of four CAI factors (without MRR)revealed significant differences among these factors and
between the two severity categories. The severity of thespeech disorder is mainly expressed in the parameters ofPN and NWI, as shown by the significant difference betweenthe moderate and severe groups for the CAI factors PN,NWI-Seg, and NWI-Syll, whereas PWV is stable across thetwo groups. These results suggest that especially PN andNWI are the most sensitive tasks to diagnose SSDs. This isin line with other authors who stated that NWI, in whicharticulatory competence is tested separately from lexicalknowledge, is an important part of an assessment batteryfor children with SSDs (Vance, Stackhouse, & Wells, 2005).Other authors have also suggested to not only use PN in aspeech assessment but also include an NWI task to gainbetter insight in the speech production of a child (Geronikou& Rees, 2016; Hodges, Baker, Munro, & McGregor, 2017).NWI is also associated with phonological short-term memory(Gathercole, 2006). Poor performance on NWI can be in-fluenced by difficulties with phonological short-termmemory and not just speech production difficulties. Krishnanet al. (2017) suggest that NWI skills have a unique role inthe process of remembering and reproducing novel words.They found that NWI abilities were associated with oromo-tor praxis, reading fluency, and audiovisual sequence repro-duction accuracy. The finding that PWV is relatively stableacross severity groups might be related to the multiple ori-gins of inconsistency. As elaborated in the introduction, in-consistency could indicate unstable lexical representations,an unstable phonological system, or unstable motor plan-ning as is typical for CAS.
When all six CAI factors were compared (includingMRR), significant differences were found among the sixfactors and the two severity categories. Differences be-tween the moderate and severe groups were found for PN,NWI-Seg, NWI-Syll, and MRR-BiTri. Remarkably, nodifference between the moderate and severe groups wasfound for MRR-Mono, whereas there was a significantdifference between the moderate and severe groups forMRR-BiTri. The severe group showed the lowest z scorefor MRR-BiTri (−2.31) when compared with the otherCAI factors. These results imply that MRR-BiTri is animportant factor in diagnosing SSDs, such as PN and NWI.MRR-BiTri is especially useful in differential diagnosis ofSSDs with a motor origin (CAS and dysarthria), as men-tioned in other studies (Rvachew, Hodge, & Ohberg, 2005;Thoonen, Maassen, Wit, Gabreëls, & Schreuder, 1996). Thefact that PN, NWI, and MRR-BiTri of the CAI were themost affected in the severe speech disorder group underlinesthe importance of these tasks in diagnosing SSDs. No dif-ferences between the two severity groups were found for thefactors PWV and MRR-Mono. They correlate less with theSLPs’ judgments of severity than the other factors. Never-theless, the mean factor scores are below average in theSSD groups as compared to typically developing childrenwith the same age. This indicates that these tasks do con-tribute to the diagnostic differentiation between typical andatypical development. In studies on speech development,speech variability, as assessed with the WR and NWR tasks,has been found to be relatively high in young typically
van Haaften et al.: Clinical Validation of the CAI 853

developing children (2- and 3-year-olds; Sosa, 2015), and suchvariability decreases with age (Holm, Crosble, & Dodd,2007). In a previous study (van Haaften et al., 2019), wealso found minor decreases of the PWV with age. Increasedvariability has also been associated with certain types ofspeech disorders, such as CAS (Davis et al., 1998; Dodd,1995b; Forrest, 2003; Holm et al., 2007; Iuzzini-Seigelet al., 2017) and inconsistent PDs (Dodd, 1995b). In thisstudy, PWV shows a mean below-average factor score anda moderate to strong correlation (.39–.60) to the PN andNWI factors, although the PWV scores for moderate andsevere disorders do not differ. To get a better understandingof these complex relations, a scatter plot of PWV andNWI-Seg factor scores was made (see Figure 2). Regressionlines show a small difference in PWV between moderateand severe disorders; interestingly, for both severity groups,the correlation with NWI-Seg is equally strong. This suggeststhat PWV can serve as a diagnostic marker for SSDs; vali-dation studies with other speech and language diagnosesneed to be conducted.
MRR performance of monosyllabic sequences showsno relation with the other task parameters, suggesting thatMRR-Mono assesses an independent aspect of speech pro-duction. This is in accordance with such studies as the oneby Staiger, Schölderle, Brendel, Bötzel, and Ziegler (2017),who concluded, from factor analyses of speech data frompatients with neurological movement disorders as comparedto control subjects, that speech tasks and oral motor taskssuch as rapid syllable repetition measure separate traits.Krishnan et al. (2017) studied the correlation between NWIand other tasks. They also found no correlation betweenMRR-Mono and NWI, whereas an alternate MRR task
(such as MRR-BiTri) correlated significantly with NWI.From the perspective of a process-oriented approach, Maassenand Terband (2015) argued that MRR, being a pure motortask that does not require any knowledge of words, sylla-bles, or phonemes, can be used to assess speech motor skills.Still, like PWV, mean MRR-Mono factor scores are belowthe population average and thus, like PWV, might serve as adiagnostic marker for SSDs. However, in contrast to PWV,MRR-Mono does not correlate with severity. Furtherstudies are needed to delineate the role of the purely repetitive(MRR-Mono) and sequential (MRR-BiTri) variants in SSDs.
This study yields strong indications that comparisonof the performance on the different speech tasks of the CAIprovides information on the underlying speech processingdifficulties of children with SSDs. Interestingly, the childrenwith SSDs show a distinct factor structure, which differsfrom that of the normative study. As mentioned in the in-troduction, in the normative study on 1,524 typically devel-oping children, weak and very weak correlations betweenfactor scores were found, from which it can be concludedthat the CAI factors represent independent components ofthe speech production process. Aligned with psycholinguis-tic models, such as Levelt’s model, the current study de-scribes the speech profile of a group of children with SSDsby conducting different speech tasks covering all differentspeech processes (phonological and speech motor skills). Alimitation of this study is the use of a heterogeneous groupof children with SSDs, without analyzing the results of dif-ferent subgroups. This is an important next step in process-oriented diagnostics. The crucial statistical remark to bemade here is that factor analysis is based not on averageskills but on variability in skills and especially covariance.It can be argued that, in a typical population, variability inskills is not caused by specific underlying factors but ratherreflects random noise. In contrast, in an atypical populationsuch as children with SSDs, underlying deficits can causelarge covariance if task requirements show overlap; analyz-ing this structure of overlapping and nonoverlapping taskperformances is the first step in process-oriented diagnos-tics. Future investigations are needed to compare subgroupsof children with different types of SSDs, such that moreprofiles of CAI factors can be determined to further revealthe proximal causes of SSDs.
Following the results of the study, the most impor-tant implication for clinical practice is to distinguish typi-cal speech development from atypical speech developmentby the administration of different speech tasks, such as in-corporated in the CAI. This allows for process-oriented di-agnostics, which is important for targeted intervention inchildren with SSDs.
AcknowledgmentsThe authors did not receive any grant funding for this study,
but this research was partially supported by Het Revalidatiefonds(The Fund for Rehabilitation). The authors wish to thank all thechildren who participated, their parents, and all the SLPs for theirvaluable help with the administration and scoring of the tests.
Figure 2. Scatter plot of the segmental quality of nonword imitation(NWI-Seg) and word and nonword proportion of whole-word variability(PWV factor scores), showing the correlations for both groups ofchildren with moderate and severe speech sound disorders (SSDs).Although the difference in PWV between the two groups is small,the correlations with NWI-Seg are moderate to strong.
854 American Journal of Speech-Language Pathology • Vol. 28 • 844–856 • July 2019

ReferencesBaker, E., Croot, K., McLeod, S., & Paul, R. (2001). Psycholinguistic
models of speech development and their application to clinicalpractice. Journal of Speech, Language, and Hearing Research,44(3), 685–702. https://doi.org/10.1044/1092-4388(2001/055)
Bishop, D. V. M., Snowling, M. J., Thompson, P. A., Greenhalgh, T.,Adams, C., Archibald, L., . . . House, A. (2017). Phase 2 ofCATALISE: A multinational and multidisciplinary Delphi con-sensus study of problems with language development: Terminology.The Journal of Child Psychology and Psychiatry, 58(10),1068–1080. https://doi.org/10.1111/jcpp.12721
Davis, B. L., Jakielski, K. J., & Marquardt, T. P. (1998). Develop-mental apraxia of speech: Determiners of differential diagnosis.Clinical Linguistics & Phonetics, 12(1), 25–45. https://doi.org/10.3109/02699209808985211
Dodd, B. (1995a). Children’s acquisition of phonology. In B. Dodd(Ed.), Differential diagnosis and treatment of children with speechdisorder (pp. 21–48). London, England: Whurr.
Dodd, B. (1995b). Children with speech disorder: Defining the prob-lem. In B. Dodd (Ed.), Differential diagnosis and treatment of chil-dren with speech disorder. (pp. 1–19). London, England: Whurr.
Dodd, B. (1995c). Procedures for classification of subgroups ofspeech disorder. In B. Dodd (Ed.), Differential diagnosis andtreatment of children with speech disorder (pp. 49–64). London,England: Whurr.
Dodd, B. (2011). Differentiating speech delay from disorder: Doesit matter? Topics in Language Disorders, 31(2), 96–111. https://doi.org/10.1097/TLD.0b013e318217b66a
Dodd, B. (2014). Differential diagnosis of pediatric speech sounddisorder. Current Developmental Disorders Reports, 1(3), 189–196.https://doi.org/10.1007/s40474-014-0017-3
Doyle, P. C., Swift, E. R., & Haaf, R. G. (1989). Effects of listenersophistication on judgments of tracheoesophageal talker intelli-gibility. Journal of Communication Disorders, 22(2), 105–113.https://doi.org/10.1016/0021-9924(89)90027-0
Eadie, P., Morgan, A., Ukoumunne, O. C., Ttofari Eecen, K.,Wake, M., & Reilly, S. (2015). Speech sound disorder at4 years: Prevalence, comorbidities, and predictors in a com-munity cohort of children. Developmental Medicine & ChildNeurology, 57(6), 578–584. https://doi.org/10.1111/dmcn.12635
Forrest, K. (2003). Diagnostic criteria of developmental apraxia ofspeech used by clinical speech-language pathologists. AmericanJournal of Speech-Language Pathology, 12(3), 376–380. https://doi.org/10.1044/1058-0360(2003/083)
Gathercole, S. E. (2006). Nonword repetition and word learning:The nature of the relationship. Applied Psycholinguistics, 27(4),513.
Geronikou, E., & Rees, R. (2016). Psycholinguistic profiling re-veals underlying impairments for Greek children with speechdisorders. Child Language Teaching and Therapy, 32(1), 95–110.https://doi.org/10.1177/0265659015583915
Gordon-Brannan, M., & Hodson, B. (2000). Intelligibility/severitymeasurements of prekindergarten children’s speech. AmericanJournal of Speech-Language Pathology, 9(2), 141–150. https://doi.org/10.1044/1058-0360.0902.141
Hodges, R., Baker, E., Munro, N., & McGregor, K. K. (2017). Re-sponses made by late talkers and typically developing toddlersduring speech assessments. International Journal of Speech-Language Pathology, 19(6), 587–600. https://doi.org/10.1080/17549507.2016.1221452
Holm, A., Crosble, S., & Dodd, B. (2007). Differentiating normalvariability from inconsistency in children’s speech: Normativedata. International Journal of Language & Communication Disor-ders, 42(4), 467–486. https://doi.org/10.1080/13682820600988967
Iuzzini-Seigel, J., Hogan, T. P., & Green, J. R. (2017). Speech in-consistency in children with childhood apraxia of speech,language impairment, and speech delay: Depends on thestimuli. Journal of Speech, Language, and Hearing Research,60(5), 1194–1210. https://doi.org/10.1044/2016_JSLHR-S-15-0184
Krishnan, S., Alcock, K. J., Carey, D., Bergström, L., Karmiloff-Smith, A., & Dick, F. (2017). Fractionating nonword repetition:The contributions of short-term memory and oromotor praxisare different. PLOS ONE, 12(7), 1–18. https://doi.org/10.1371/journal.pone.0178356
Lagerberg, T. B., Hartelius, L., Johnels, J. Å., Ahlman, A.-K.,Börjesson, A., & Persson, C. (2015). Swedish Test of Intelli-gibility for Children (STI-CH)—Validity and reliability of acomputer-mediated single word intelligibility test for children.Clinical Linguistics & Phonetics, 29(3), 201–215. https://doi.org/10.3109/02699206.2014.987925
Landa, S., Pennington, L., Miller, N., Robson, S., Thompson, V.,& Steen, N. (2014). Association between objective measure-ment of the speech intelligibility of young people with dysarthriaand listener ratings of ease of understanding. InternationalJournal of Speech-Language Pathology, 16(4), 408–416. https://doi.org/10.3109/17549507.2014.927922
Law, J., Boyle, J., Harris, F., Harkness, A., & Nye, C. (2000).Prevalence and natural history of primary speech and languagedelay: Findings from a systematic review of the literature. In-ternational Journal of Language & Communication Disorders,35(2), 165–188.
Levelt, W. (1989). Speaking: From intention to articulation.Cambridge, MA: MIT Press.
Levelt, W., Roelofs, A., & Meyer, A. S. (1999). A theory of lexicalaccess in speech production. Behavioral and Brain Sciences,22(1), 1–75.
Lohmander, A., Lundeborg, I., & Persson, C. (2016). SVANTE—The Swedish Articulation and Nasality Test—Normative dataand a minimum standard set for cross-linguistic comparison.Clinical Linguistics & Phonetics, 31, 137–154. https://doi.org/10.1080/02699206.2016.1205666
Maassen, B., & Terband, H. (2015). Process-oriented diagnosis ofchildhood and adult apraxia of speech (CAS and AOS). InM. A., Redford (Ed.), The handbook of speech production(1st ed., pp. 331–350). United Kingdom: Wiley.
Maassen, B., van Haaften, L., Diepeveen, S., Terband, H.,van den Engel-Hoek, L., Veenker, T., & De Swart, B.(2019). Computer articulation instrument. Amsterdam, theNetherlands: Boom Uitgevers.
Macrae, T., Tyler, A. A., & Lewis, K. E. (2014). Lexical andphonological variability in preschool children with speechsound disorder. American Journal of Speech-Language Pathology,23, 27–35. https://doi.org/10.1044/1058-0360(2013/12-0037)
McLeod, S., Harrison, L. J., & McCormack, J. (2012). The intelli-gibility in context scale: Validity and reliability of a subjectiverating measure. Journal of Speech, Language, and HearingResearch, 55(2), 648–656. https://doi.org/10.1044/1092-4388(2011/10-0130)
Mullen, R., & Schooling, T. (2010). The national outcomes mea-surement system for pediatric speech-language pathology. Lan-guage, Speech, and Hearing Services in Schools, 41(1), 44–60.https://doi.org/10.1044/0161-1461(2009/08-0051)
Neumann, S., Rietz, C., & Stenneken, P. (2017). The German In-telligibility in Context Scale (ICS-G): Reliability and validityevidence. International Journal of Language & CommunicationDisorders, 52(5), 585–594. https://doi.org/10.1111/1460-6984.12303
Nijland, L. (2003). Developmental apraxia of speech: Deficits inphonetic planning and motor programming. Wageningen, theNetherlands: Ponson & Looijen.
van Haaften et al.: Clinical Validation of the CAI 855

Nijland, L., Maassen, B., & van der Meulen, S. (2003). Evidence ofmotor programming deficits in children diagnosed with DAS.Journal of Speech, Language, and Hearing Research, 46(2),437–450. https://doi.org/10.1044/1092-4388(2003/036)
Nijland, L., Maassen, B., van der Meulen, S., Gabreëls, F.,Kraaimaat, F. W., & Schreuder, R. (2003). Planning of sylla-bles in children with developmental apraxia of speech. ClinicalLinguistics & Phonetics, 17(1), 1–24. https://doi.org/10.1080/0269920021000050662
Nijland, L., Terband, H., & Maassen, B. (2015). Cognitive functionsin childhood apraxia of speech. Journal of Speech, Language,and Hearing Research, 58(3), 550–565. https://doi.org/10.1044/2015_JSLHR-S-14-0084
Portney, L., & Watkins, M. (2009). Foundations of clinical research:Applications to practice. Upper Saddle River, NJ: PrenticeHall.
Rvachew, S., Hodge, M., & Ohberg, A. (2005). Obtaining and inter-preting maximum performance tasks from children: A tutorial.Journal of Speech-Language Pathology and Audiology, 29(4),146–157.
Schlichting, L. (2005). Peabody Picture Vocabulary Test–III Dutchversion (PPVT-III-NL). Amsterdam, the Netherlands: PearsonAssessment and Information B.V.
Schlichting, L., & Spelberg, H. L. (2010a). Schlichting Test voorTaalbegrip [Schlichting Test for Language Comprehension].Houten, the Netherlands: Bohn Stafleu van Loghum.
Schlichting, L., & Spelberg, H. L. (2010b). Schlichting Test voorTaalproductie-II [Schlichting Test for Language Production].Houten, the Netherlands: Bohn Stafleu van Loghum.
Shriberg, L. D., & Kwiatkowski, J. (1994). Developmental phono-logical disorders I: A clinical profile. Journal of Speech andHearing Research, 37(5), 1100–1126.
Shriberg, L. D., Strand, E. A., Fourakis, M., Jakielski, K. J., Hall,S. D., Karlsson, H. B., . . . Wilson, D. L. (2017). A diagnosticmarker to discriminate childhood apraxia of speech from speechdelay: I. Development and description of the pause marker.Journal of Speech, Language, and Hearing Research, 60(4),1096–1117. https://doi.org/10.1044/2016_JSLHR-S-15-0296
Snijders, J. T., Tellegen, P. J., Winkel, M., & Laros, J. A. (2003).Snijders-Oomen Nonverbal Intelligence Test–Revised SON-R5–17 jaar. Lisse, the Netherlands: Swets & Zeitlinger.
Sosa, A. V. (2015). Intraword variability in typical speech devel-opment. American Journal of Speech-Language Pathology,24(1), 24–35. https://doi.org/10.1044/2014_AJSLP-13-0148
Sosa, A. V., & Stoel-Gammon, C. (2012). Lexical and phonologicaleffects in early word production. Journal of Speech, Language,and Hearing Research, 55(2), 596–608. https://doi.org/10.1044/1092-4388(2011/10-0113)
Staiger, A., Schölderle, T., Brendel, B., Bötzel, K., & Ziegler, W.(2017). Oral motor abilities are task dependent: A factor ana-lytic approach to performance rate. Journal of Motor Behavior,49(5), 482–493. https://doi.org/10.1080/00222895.2016.1241747
Terband, H., & Maassen, B. (2012). Childhood apraxia of speech:From symptom based diagnosis to process-oriented diagnosis.Logopedie en Foniatrie, 84, 229–234.
Thoonen, G., Maassen, B., Gabreëls, F., & Schreuder, R. (1994).Feature analysis of singleton consonant errors in developmentalverbal dyspraxia (DVD). Journal of Speech and Hearing Re-search, 37(6), 1424–1440. https://doi.org/10.1044/jshr.3706.1424
Thoonen, G., Maassen, B., Gabreels, F., & Schreuder, R. (1999).Validity of maximum performance tasks to diagnose motorspeech disorders in children. Clinical Linguistics & Phonetics,13(1), 1–23. https://doi.org/10.1080/026992099299211
Thoonen, G., Maassen, B., Wit, J., Gabreëls, F., & Schreuder, R.(1996). The integrated use of maximum performance tasks indifferential diagnostic evaluations among children with motorspeech disorders. Clinical Linguistics & Phonetics, 10(4),311–336. https://doi.org/10.3109/02699209608985178
van Haaften, L., Diepeveen, S., Van den Engel-Hoek, L., Jonker, M.,de Swart, B., & Maassen, B. (2019). The psychometric evalua-tion of a speech production test battery for children: Thereliability and validity of the computer articulation instrument(CAI). Journal of Speech, Language, and Hearing Research.Advance online publication. https://doi.org/10.1044/2018_JSLHR-S-18-0274
Van Weerdenburg, M., Verhoeven, L., & Van Balkom, H. (2006).Towards a typology of specific language impairment. TheJournal of Child Psychology and Psychiatry, 47(2), 176–189.https://doi.org/10.1111/j.1469-7610.2005.01454.x
Vance, M., Stackhouse, J., & Wells, B. (2005). Speech-productionskills in children aged 3–7 years. International Journal of Lan-guage & Communication Disorders, 40(1), 29–48. https://doi.org/10.1080/13682820410001716172
Waring, R., & Knight, R. (2013). How should children with speechsound disorders be classified? A review and critical evaluationof current classification systems. International Journal of Lan-guage & Communication Disorders, 48(1), 25–40. https://doi.org/10.1111/j.1460-6984.2012.00195.x
856 American Journal of Speech-Language Pathology • Vol. 28 • 844–856 • July 2019

Copyright of American Journal of Speech-Language Pathology is the property of AmericanSpeech-Language-Hearing Association and its content may not be copied or emailed tomultiple sites or posted to a listserv without the copyright holder's express written permission.However, users may print, download, or email articles for individual use.