University of Groningen Corporate Governance and ...
285
University of Groningen Corporate Governance and Managerial Misconduct Wijayati, Nureni DOI: 10.33612/diss.131947533 IMPORTANT NOTE: You are advised to consult the publisher's version (publisher's PDF) if you wish to cite from it. Please check the document version below. Document Version Publisher's PDF, also known as Version of record Publication date: 2020 Link to publication in University of Groningen/UMCG research database Citation for published version (APA): Wijayati, N. (2020). Corporate Governance and Managerial Misconduct: Evidence from Indonesia. University of Groningen. https://doi.org/10.33612/diss.131947533 Copyright Other than for strictly personal use, it is not permitted to download or to forward/distribute the text or part of it without the consent of the author(s) and/or copyright holder(s), unless the work is under an open content license (like Creative Commons). The publication may also be distributed here under the terms of Article 25fa of the Dutch Copyright Act, indicated by the “Taverne” license. More information can be found on the University of Groningen website: https://www.rug.nl/library/open-access/self-archiving-pure/taverne- amendment. Take-down policy If you believe that this document breaches copyright please contact us providing details, and we will remove access to the work immediately and investigate your claim. Downloaded from the University of Groningen/UMCG research database (Pure): http://www.rug.nl/research/portal. For technical reasons the number of authors shown on this cover page is limited to 10 maximum. Download date: 20-03-2022
-
Upload
khangminh22 -
Category
Documents
-
view
1 -
download
0
Transcript of University of Groningen Corporate Governance and ...

University of Groningen
Corporate Governance and Managerial MisconductWijayati, Nureni
DOI:10.33612/diss.131947533
IMPORTANT NOTE: You are advised to consult the publisher's version (publisher's PDF) if you wish to cite fromit. Please check the document version below.
Document VersionPublisher's PDF, also known as Version of record
Publication date:2020
Link to publication in University of Groningen/UMCG research database
Citation for published version (APA):Wijayati, N. (2020). Corporate Governance and Managerial Misconduct: Evidence from Indonesia.University of Groningen. https://doi.org/10.33612/diss.131947533
CopyrightOther than for strictly personal use, it is not permitted to download or to forward/distribute the text or part of it without the consent of theauthor(s) and/or copyright holder(s), unless the work is under an open content license (like Creative Commons).
The publication may also be distributed here under the terms of Article 25fa of the Dutch Copyright Act, indicated by the “Taverne” license.More information can be found on the University of Groningen website: https://www.rug.nl/library/open-access/self-archiving-pure/taverne-amendment.
Take-down policyIf you believe that this document breaches copyright please contact us providing details, and we will remove access to the work immediatelyand investigate your claim.
Downloaded from the University of Groningen/UMCG research database (Pure): http://www.rug.nl/research/portal. For technical reasons thenumber of authors shown on this cover page is limited to 10 maximum.
Download date: 20-03-2022

Corporate Governance and Managerial Misconduct
Evidence from Indonesia
Nureni Wijayati

Publisher : University of Groningen Groningen, the Netherlands Cover photo : Humam S. Dawa
Sudirman Central Business District (SCBD), a bustling business area in Jakarta where the Indonesia Stock Exchange is located
Lay-out : Nureni Wijayati
Cover design : Devi Kristiana
Printed by : ProefschriftMaken https://www.proefschriftmaken.nl
© Nureni Wijayati, 2020 All rights reserved. Copyright of the published articles is with the corresponding journals or otherwise with the author. No part of this publication may be reproduced, stored in a retrieval system, or transmitted, in any form or by any means, without prior written permission of the publisher or the copyright-owning journal.

Corporate Governance and Managerial Misconduct
Evidence from Indonesia
PhD thesis
to obtain the degree of PhD at the University of Groningen on the authority of the
Rector Magnificus Prof. C. Wijmenga and in accordance with
the decision by the College of Deans
This thesis will be defended in public on
Thursday 17 September 2020 at 11.00 hours
by
Nureni Wijayati
born on 11 November 1971 in Semarang, Indonesia

Supervisors Prof. R.L. Holzhacker Prof. C.L.M. Hermes Prof. S. Utama Assessment Committee Prof. H.W. Hoen Prof. T. Randøy Prof. R.B.H. Hooghiemstra

Acknowledgments
In the name of Allah, the Most Gracious, the Most Merciful
I had enjoyed my career in several private companies as an accountant until 2009, when
I switched my path to be a full-time academic staff. Until that moment, taking a doctoral
study abroad had never crossed my mind. However, the academic atmosphere
encouraged me to go for a PhD scholarship. Praise be to Allah the Almighty, that my
scholarship application (the Netherlands Fellowship Programme - NFP) was approved
by Nuffic. Big thanks to NFP, a scholarship programme funded by the Dutch Ministry of
Foreign Affairs, for its financial support, which helped me to manage my life during my
study in the Netherlands and during my field study in Jakarta.
Completing a PhD trajectory was a long long journey for me. I had no experience as a
researcher when I first arrived in Groningen. I felt that writing a good academic paper
was so challenging. Nevertheless, I was very lucky to be surrounded by three genious
and generous supervisors. First and foremost, I would like to express my great
appreciation to Professor Ronald Holzhacker who opened the door by giving me a
precious opportunity to pursue my doctoral degree at the University of Groningen. I
never thought that I could broaden my perspective. He gave me a lot of insights and
different points of view for my dissertation. He occasionally invited and entertained us
(the SInGA members) at his home in Groningen. Moreover, he monitored me regularly
by visiting Jakarta, introduced me to various notable persons, and more importantly
motivated me to remain being optimistic.
My sincere gratitude to Professor Niels Hermes who not only encouraged me to finish
my work on time, but also provided related references to my papers. Honestly, at times I
felt that I was not able to fulfill his minimum requirements. However, step by step he
mentored me patiently and guided me persistently. He frequently sent feedback and
suggestions in weekends. No matter how busy he was, he always gave me constructive
comments, which I will never forget. Every single comment of his was simply superb.

Many things I have learned from him, such as scholarly professionalism, humblenesss,
simplicity, parenting, and many more. He is not only a great guru, but also a nice person
to discuss with.
I am also indebted to Professor Sidharta Utama, my supervisor at Universitas Indonesia,
who shared corporate governance cases and practices from Indonesia. I was engrossed
in discussing with him as he knows much about the real implementation of corporate
governance in Indonesia. He also introduced me to the Indonesian Institute for
Corporate Directorship (IICD) for gaining data on the ASEAN Corporate Governance
Scorecard (ACGS). In addition, I am very grateful for his valuable comments and
suggestions particularly for chapters 3 and 5.
Related to IICD, I would like to thank to Ms. Vita Diani as Executive Director of IICD
who supplied me with the detailed corporate governance scorecards. Without her kind
help, chapter 5 would never have been completed.
I would also like to say thank you to the Indonesian Institute of Certified Public
Accountants (IICPA) who gave me access that enabled me to distribute the
questionnaires to its members. Chapter 3 would not have been possible without the help
of Indonesian public accountants. Special thanks to Mr. Tarkosunaryo, MBA, CPA,
President of IICPA (IAPI) who allowed me to contribute at the Certification Division. I
have gained many insights from Mr. Tarko regarding auditing issues in Indonesia.
Much appreciation is given to the members of the assessment committee i.e., Professor
Herman Hoen, Professor Trond Randøy, and Professor Reggy Hooghiemstra. Thank
you for reading, assessing, and giving thoughtful suggestions for my manuscript.
I would also like to express my gratitude to Marijke Wubbolts for her kind assistance
from the beginning of my PhD journey to the end of the journey. Many thanks also go to
Hans Stavast who managed all matters related to my scholarship funding.
I want to express my credit to the Spirit Indonesia Groningen (SInGa) members
consisting of Kang Tatang Muttaqin, Mas Taufiq Hidayat, Laksmi Kusumawati, Mala
Sondang, Suwatin Miharti, Kuswanto, Annisa Paramita, Titissari Rumbogo, Yoga

Permana, Tri Efriandi, Isti Hidayati, and Petrus Farneubun. They always encouraged
each other to finish their study, especially during hard times.
I would like to extend my grateful thanks to Ronny who was very helpful during ups
and downs, cleaning and processing data, and brainstorming econometrics issues. We
talked not only about how to finish the dissertation, but also about how to fix our bikes.
I missed my beloved friends around Harmonie complex/ Academie Gebouw: Stanati,
Aynur Erde, Stefan Baack, Alisa Van der Haar, Yu Sun, Yingruo Wang, Joёlle Swart,
Yara Marusyk. Thank you for sharing and having fun.
Thank you to Indonesian community in Groningen, especially Isti, Yassaroh, Fitrilia,
Nahdia, Nuril, Achmad Suryadi, Icha, and Ali Syari’ati who assisted me in preparing
the defense ceremony; Oom Yon-Tante Indah, Bude Ari-Oom Herman, Mbak Lia-Mas
Yayok, Oom Rudie, Oom Archi-Tante Merry, Uwak Asiyah-Oom Menno, Bude
Nunung. To all PPIG-ers Irawaty, Amak, Tiur, Kadek, Acul, Elda, Amirah, Angela,
Putri, Doti, Karina, Nur Qom, Desti, Iging, Didik, Adhiyat, Radit, Nia, Ali, Ima, Ira S.,
Vera, Rosyta, Pak Asmoro, and others.
Last but not least, I am very grateful to my parents and my family who have
continuously supported me throughout the PhD life. Most importantly, my sincere
thanks go to my handsome boy, Humam Dawa. As a mother, I felt guilty that I was
thousands of miles away from him when he faced the junior high school and senior high
school national exams. I also apologised that I was unable to cuddle him when he was
sick. I am very proud of him for being strong and courageous.


i
Table of Contents
Table of Contents ......................................................................................................................... i
List of Tables ................................................................................................................................ v
List of Figures ............................................................................................................................. vii
List of Appendices ................................................................................................................... viii
Chapter 1 Introduction ................................................................................................................ 1
1.1 Introduction .......................................................................................................................... 1
1.2 Corporate Governance in Asia........................................................................................... 3
1.3 Research Questions.............................................................................................................. 5
1.4 Theoretical Background ...................................................................................................... 7
1.4.1 Agency theory ............................................................................................................... 7
1.4.2 Resource dependence theory ......................................................................................... 8
1.5 Structure of the Thesis ......................................................................................................... 9
Chapter 2 Corporate Governance and Corruption: A Comparative Study of Southeast Asia ............................................................. 17
2.1 Introduction ........................................................................................................................ 18
2.1.1 Background ................................................................................................................. 18
2.1.2 Research questions ...................................................................................................... 22
2.1.3 Scientific and social significance ................................................................................ 22
2.2 Literature Review .............................................................................................................. 24
2.2.1 Corporate governance ................................................................................................. 24
2.2.2 Agency problem and corruption ................................................................................. 28
2.2.3 Corporate governance and misconduct....................................................................... 29
2.2.4 Shareholder rights ....................................................................................................... 30
2.2.5 Board of directors ........................................................................................................ 31
2.2.6 Accounting and auditing practices ............................................................................ 32
2.2.7 Transparency .............................................................................................................. 33

ii
2.3 Institutional Setting ........................................................................................................... 34
2.4 Methodology ...................................................................................................................... 37
2.5 Discussion and Analysis ................................................................................................... 38
2.5.1 Comparative corporate governance institutional framework ..................................... 38
2.5.2 Shareholder rights ....................................................................................................... 39
2.5.3 Board of directors ........................................................................................................ 42
2.5.4 Accounting and auditing............................................................................................ 44
2.5.5 Transparency .............................................................................................................. 51
2.6 Conclusions ........................................................................................................................ 52
Chapter 3 Fraud Risk Assessments and External Auditors’ Perceptions......................... 55
3.1 Introduction ........................................................................................................................ 56
3.2 Literature Review .............................................................................................................. 59
3.2.1 The fraud risk assessment model: an overview ........................................................... 59
3.2.2 Fraud risk assessments ............................................................................................... 60
3.2.3 Fraud risk factors ........................................................................................................ 61
3.2.4 Materiality judgment ................................................................................................. 61
3.2.5 Professional scepticism ............................................................................................... 63
3.2.6 Litigation risk ............................................................................................................. 64
3.3 Hypothesis Development ................................................................................................. 64
3.3.1 Fraud risk factors and fraud risk assessment ............................................................. 64
3.3.2 Materiality judgment and fraud risk assessment ....................................................... 65
3.3.3 Professional scepticism and fraud risk assessment ..................................................... 66
3.3.4 Litigation risk and fraud risk assessment ................................................................... 67
3.3.5 Certification and fraud risk assessment ...................................................................... 67
3.3.6 Experience and fraud risk assessment ........................................................................ 68
3.3.7 Audit firm size and fraud risk assessment.................................................................. 69
3.4 Methodology ...................................................................................................................... 69
3.4.1 Questionnaire ............................................................................................................. 70
3.4.2 Fraud risk factors evaluation ...................................................................................... 71
3.4.3 Materiality judgment ................................................................................................. 73

iii
3.4.4 Professional scepticism ............................................................................................... 73
3.4.5 Litigation risk for auditors .......................................................................................... 75
3.4.6 Fraud risk assessments ............................................................................................... 75
3.4.7 Questionnaire distribution ......................................................................................... 76
3.4.8 Research model............................................................................................................ 78
3.5 Results ................................................................................................................................. 80
3.5.1 Descriptive statistics................................................................................................... 80
3.5.2 Responses .................................................................................................................... 82
3.5.3 Measurement models — confirmatory factor analysis ............................................... 83
3.5.4 Structural equation modelling results ........................................................................ 85
3.5.5 Bias tests ..................................................................................................................... 92
3.6 Conclusions ........................................................................................................................ 93
Chapter 4 The Value of Political Connections: The Impact of the Changing Political Landscape in Indonesia ........................................................................................ 103
4.1 Introduction ...................................................................................................................... 104
4.2 Literature Review and Hypothesis Development ...................................................... 106
4.2.1 The value of political connections ............................................................................. 106
4.2.2 Hypothesis development ........................................................................................... 109
4.3 Data and Methodology ................................................................................................... 115
4.3.1 Data sources and sample .......................................................................................... 115
4.3.2 Variables ................................................................................................................... 116
4.3.3 Model ........................................................................................................................ 120
4.3.4 Data description........................................................................................................ 121
4.4 Results ............................................................................................................................... 125
4.4.1 Main results.............................................................................................................. 125
4.4.2 Additional analyses .................................................................................................. 131
4.4.3 Endogeneity .............................................................................................................. 135
4.5 Discussion and Analysis ................................................................................................. 140
4.6 Conclusions ...................................................................................................................... 142

iv
Chapter 5 Boards, Transparency, and Earnings Management: Evidence from Indonesian Listed Firms ....................................................................................... 145
5.1 Introduction ...................................................................................................................... 146
5.2 Literature Review and Hypotheses Development ...................................................... 148
5.2.1 Earnings management, information disclosure and transparency, and the board of directors ......................................................................................... 148
5.2.2 Hypotheses development ........................................................................................... 152
5.3 Methodology .................................................................................................................... 159
5.3.1 Sampling ................................................................................................................... 159
5.3.2 Research models ........................................................................................................ 160
5.4 Results ............................................................................................................................... 169
5.4.1 Descriptive statistics................................................................................................. 169
5.4.2 Regression results and discussion ............................................................................ 174
5.5 Conclusions ...................................................................................................................... 187
Chapter 6 Conclusions ............................................................................................................. 201
6.1 The Main Findings of Each Study ................................................................................. 203
6.2 Policy Recommendations ............................................................................................... 208
6.3 Future Research................................................................................................................ 211
References .................................................................................................................................. 213
Summary ................................................................................................................................... 245
Samenvatting ............................................................................................................................. 251
Ringkasan................................................................................................................................... 257

v
List of Tables
Table 1.1 Summary of the empirical studies of the dissertation ........................................... 10
Table 2.1 Corruption rank in Southeast Asian countries, 2002-2012 .................................... 19
Table 2.2 The percentage of family controlled firms in 2008 ................................................. 35
Table 2.3 Corporate governance score ...................................................................................... 36
Table 2.4 Key corporate governance institutional frameworks ............................................ 45
Table 3.1 Fraud risk factors measurement ............................................................................... 72
Table 3.2 Descriptive statistics ................................................................................................... 81
Table 3.3 Sample distribution .................................................................................................... 82
Table 3.4 Descriptive statistics – respondents’ answers ......................................................... 82
Table 3.5 Goodness-of-fit results ............................................................................................... 84
Table 3.6 Standardized factor loadings .................................................................................... 84
Table 3.7 CR and AVE results .................................................................................................... 85
Table 3.8 Covariance matrix – latent variables ........................................................................ 85
Table 3.9 Univariate estimation ................................................................................................. 87
Table 3.10 Structural equation results – initial model ............................................................ 88
Table 3.11 Goodness-of-fit indices – SEM ................................................................................ 89
Table 3.12 SEM results —modified model ............................................................................... 89
Table 4.1 Political connections, 2000-2011 .............................................................................. 122
Table 4.2 Descriptive statistics ................................................................................................. 123
Table 4.3 Comparing politically and non-politically connected firms ............................... 124
Table 4.4 Correlations ............................................................................................................... 125
Table 4.5 Regression results ..................................................................................................... 126
Table 4.6 Small firms versus large firms ................................................................................ 129
Table 4.7 Multiple regressions – business groups................................................................. 136
Table 4.8 Balancing test ............................................................................................................. 138
Table 4.9 Summary of balancing test ...................................................................................... 139

vi
Table 4.10 Average treatment effects ...................................................................................... 140
Table 5.1 Descriptive statistics ................................................................................................. 171
Table 5.2 Mean scores of main variables ................................................................................ 172
Table 5.3 Correlations ............................................................................................................... 173
Table 5.4 Earnings management and board skills ................................................................ 174
Table 5.5 Earnings management and board commitment ................................................... 175
Table 5.6 Earnings management and board structure ......................................................... 175
Table 5.7 Earnings management and board inputs .............................................................. 176
Table 5.8 Voluntary disclosure and board inputs ................................................................. 178
Table 5.9 Mandatory disclosure and board inputs ............................................................... 179
Table 5.10 Board inputs, disclosure, and discretionary accruals ........................................ 182
Table 5.11 Sobel test and Goodman test results – voluntary disclosures .......................... 185
Table 5.12 Sobel test and Goodman test results – mandatory disclosures ........................ 185
Table 5.13 SEM results – voluntary disclosures .................................................................... 186
Table 5.14 SEM results – mandatory disclosures .................................................................. 186
Table 6.1 Summary of the main findings ............................................................................... 204

vii
List of Figures
Figure 1.1 Corporate governance mechanisms ................................................. 7
Figure 2.1 A theoretical framework .................................................................... 26
Figure 3.1 Fraud risk assessment model ............................................................ 60
Figure 3.2 Fraud risk assessment – the research model ................................... 79
Figure 3.3 Full modified SEM .............................................................................. 91
Figure 4.1 Distribution of PCF1 by industry ..................................................... 123
Figure 5.1 Research framework ........................................................................... 151

viii
List of Appendices
Appendix 3.1 The Case Material ............................................................................ 95
Appendix 3.2 Distribution of the Questionnaires ................................................ 98
Appendix 3.3 Goodness of Fit Statistics –CFA ..................................................... 100
Appendix 3.4 Goodness of Fit Statistics –Modified (Final) SEM ....................... 101
Appendix 4.1 Variable Definitions ......................................................................... 144
Appendix 5.1 Earnings Management Model ........................................................ 190
Appendix 5.2 Company List ................................................................................... 191
Appendix 5.3 Responsibilities of the Board Scorecard ........................................ 194
Appendix 5.4 Three Constructs .............................................................................. 198
Appendix 5.5 Variable Definitions ......................................................................... 199

ix


Chapter 1
1
Chapter 1 Introduction
1.1 Introduction
Corporate governance can be described as a set of mechanisms or practices that help
aligning objectives and interests between the suppliers of funds and the managers of
corporations (Shleifer and Vishny, 1997). This definition stems from a principal-agent
view, which addresses how to minimise conflicts between shareholders and managers.
The central theme of agency theory is to control opportunistic behaviour by
management, because managers may have interests that diverge from that of
shareholders’ interests. Opportunistic managerial behaviour may lead to managerial
misconduct.
The issue of managerial misconduct has been existing since the first emergence of
a stock-based company. The Verenigde Oost-indische Compagnie (VOC), the Dutch United
East India Company, which was established in 1602, pioneered the novel legal form of a
firm as a limited liability company (Dutch East India Company)1. The VOC, the first ever
multinational company in the world that sold shares to the public, stretched its
dominance from Japan, Southeast Asia, South Asia and South Africa. After almost two
centuries since its inception, the VOC went bankrupt in 1799. Besides increased
competition, the main cause of the insolvency was the conflict of interest between the
shareholders and the directors. The directors refused to provide audited financial
statements. Moreover, the directors were accused of managerial misconduct and
corruption (Van Riebeeck and the South-East Asian Connection to the Cape, 2015; de
Jongh, 2010).
1 https://people.hofstra.edu/geotrans/eng/ch2en/conc2en/map_VOC_Trade_Network.html, accessed on Jan 7, 2019.

Introduction
2
Since the 1980s, numerous blatant corporate crimes have occurred around the
world, such as Wells Fargo in the United States (Quartz at Work, 2017), Kobe Steel in
Japan (Bloomberg, 2017), Felda Global Ventures Holdings in Malaysia (New Straits
Times, 2017), and Meikarta (the Jakarta Post, 2018) and SNP Finance (the Jakarta Post,
2018) both in Indonesia. The latest fraud survey by the Association of Certified Fraud
Examiners (ACFE) reported that the total fraud loss around the world was higher than
$7 billion, based upon 2,690 fraud cases which included asset misappropriation,
corruption, and financial fraud (ACFE, 2018). The 2017 Asia-Pacific Fraud Survey found
that 63% of the respondents perceived that corrupt practices widely occurred in their
country, and 35% of them believed that unethical conduct was common in order to
secure business (EY, 2017).
The 2019 data reveal that Indonesia ranks relatively low on the list of least
corrupt countries, i.e., 85th of 180 countries with a score of 40 2 (Transparency
International, 2020), indicating that Indonesia is perceived as relatively highly corrupt.
A survey conducted by Ernst & Young in 2013 reported that 79% of respondents,
consisting of executives, senior managers and employees, agreed that “corrupt practices
happen widely in Indonesia” (EY, 2013). The likelihood of fraud can be limited by
installing measures or mechanisms aimed at preventing companies from becoming
involved in unethical practices. These mechanisms focus on the monitoring of
executives of companies and their decision-making.
Corporate governance may provide mechanisms that help preventing managerial
misconduct. These corporate governance mechanisms are based on the underlying
principles of transparency, accountability, responsibility and fairness. Two kinds of
mechanisms are prescribed in the corporate governance literature, i.e., internal control
mechanisms and external control mechanisms (Walsh and Seward, 1990; Denis and
McConnell 2003). Internal control mechanisms are derived from the internal
organisation, such as shareholders, board of directors, managerial compensation,
operating procedures, and internal controls. External control mechanisms consist of
2 The score ranges from 0 (highly corrupt) to 100 (very clean).

Chapter 1
3
factors external to the company, such as laws and regulations, codes, capital markets,
and competition (Cuervo, 2002; Gillan, 2006; Hanson and Song, 2006). Both mechanisms
are intended to mitigate agency problems, i.e., conflicts between shareholders and
management, and/or between minority shareholders and majority shareholders.
1.2 Corporate Governance in Asia
Corporate governance practices vary across countries (Arcot and Bruno, 2007). In a
broader context, corporate governance practices may be influenced by foreign factors
(such as globalization, market liberalization) and domestic factors (such as political,
economic, and law systems) (Aguilera and Cuervo-Cazurra, 2004). There are two main
types of corporate governance systems in the world, i.e., the Anglo-American (Anglo-
Saxon) model and the Continental (Western) European model (Judge, 2010). The Anglo-
Saxon model is characterised by more dispersed shareholders, a one-tier board
structure, and more reliance on market (external) mechanisms (Cuervo, 2002;
Soederberg, 2003). On the other hand, the Continental European model is more likely to
feature concentrated shareholders, with a two-tier board structure, and a heavier
reliance on internal control mechanisms (Cuervo, 2002; Goergen et al., 2008).
After the Asian financial crisis in 1998, the Southeast Asian countries were
encouraged by international institutions such as the OECD, IMF, and World Bank to
adopt features of the Anglo-American corporate governance model (Nowland, 2007).
Since then, a roaring applause has been extended by commentators to the countries,
because of the great improvement in corporate governance practices and the level of
transparency (Nowland, 2008; Ananchotikul and Eichengreen, 2009). However,
corporate governance systems of most Asian countries are still very similar to the
Continental European model, in which the agency conflict is prevalent in the form of
minority shareholders expropriation by controlling shareholders (Claessens et al., 1999,
2000; Mitton, 2002; Krishnamurti et al., 2005; Moskalev and Park, 2010; Yoshikawa and
Rasheed, 2010). The unique landscape of Asian business has called the interest of
scholars to investigate corporate governance practices in Asian countries. Some assert

Introduction
4
that the severity of the 1997 East Asian crisis partly is caused by lack of good governance
practices (Johnson et al., 2000; Haggard, 2002).
Business in East Asia, including Indonesia, is represented by at least three key
characteristics. First, business is dominated by concentrated family ownership or
business groups rather than dispersed shareholdings (Claessens, et al., 2000; Carney and
Child, 2013). Second, business is heavily based on a relation-based model rather than a
market-based one (Li, 2003). Third, business is more likely to seek and engage in
political connections (Luo, 2002; Chen et al., 2011). Since emerging economies are
characterised by a weak institutional framework and a lack of efficient capital, product,
and labour markets (Khanna et al., 2005), business groups are considered as the best
structure to run businesses, as business groups are deemed a substitute to solve
problems that arise due to market imperfections (Khanna and Rivkin, 2001; Chang and
Hong, 2002). Affiliated firms are typically linked to each other in a business group
through cross-shareholdings and/or a pyramidal structure (La Porta et al., 1999;
Claessens et al., 2000), interlocking directorates (Silva et al., 2006), and inter-company
transactions (Yeh et al., 2012; Nekhili and Cherif, 2011). Transaction costs can be reduced
as members of a business group can easily share key officers (Silva et al., 2006),
intangible assets and innovations (Hsieh et al., 2010; Chang and Hong, 2000), and
preferential loans (Berkman et al., 2009; Johnson et al., 2000).
Inter-company transactions or related party transactions are pervasive among
affiliated firms in business groups. These transactions are deemed more efficient than
arm’s-length transactions (that is, a market-based system) because they are based more
on informal and personal relations (Li, 2003). The costs of such transactions are low due
to speedy decision-making and a solid commitment within the group. However, related
party transactions may also lead controlling shareholders to expropriate minority
shareholders (Villalonga and Amit, 2006; Gonenc and Hermes, 2008; Utama et al., 2010;
Juliarto et al., 2013; Du et al., 2013). For instance, a parent company may lend money to
its subsidiaries with interest rates below the market rate. The controlling shareholders of

Chapter 1
5
the business group may extract benefits from such a transaction at the cost of other
(minority) shareholders.
A relation-based system also signifies that firms are likely to build political
connections in order to reduce environmental uncertainty (Morck and Yeung, 2004;
Hillman et al., 2009). As market mechanisms are less pronounced, firms try to get
favouritism and obtain preferential access to resources by establishing political
connections. In return, they need to pay politicians and government officials for getting
access to these preferential resources. The presence of politically connected firms is more
prevalent in jurisdictions with highly corrupt practices (Luo, 2002; Faccio, 2006; Wu,
2009). Because the nature of corruption is secretive, firms with political connections are
inclined to be more opaque (Leuz and Oberholzer-Gee, 2006; Chen et al., 2010), riskier
(Bliss et al., 2011; Wahab et al., 2011), and to expropriate minority shareholders (Habib et
al., 2017). Lack of transparency and weaker mechanisms of corporate control are
believed to be main contributors as to why corruption tends to breed (Faber, 2005;
Sullivan 2009; Halter et al., 2009; Bauhr and Grimes, 2017).
1.3 Research Questions
The central theme of the thesis is to examine how internal and external corporate
governance mechanisms can mitigate opportunities for managerial misconduct. In
particular, we aim at addressing how external and internal corporate governance
mechanisms can control misconduct by corporate managers in the context of Indonesia.
On the basis of this objective, the main research questions of this thesis are the
following:
1. Does a strong institutional framework mitigate opportunities for corruption
(Chapter 2)?
2. What factors determine external auditors when assessing fraud risks
(Chapter 3)?

Introduction
6
3. Does a change of the institutional landscape influence the value of politically
connected board members (Chapter 4)?
4. Do board characteristics improve transparency and mitigate earnings
management practices (Chapter 5)?
To answer these research questions, we carry out four empirical studies, using
data from Indonesia, to investigate how various corporate governance mechanisms may
contribute to disciplining managers and controlling managerial misconduct. Figure 1.1
presents the corporate governance mechanisms dealt with across the four empirical
studies. These studies analyse two external mechanisms (i.e., institutional framework,
external auditors), and two internal mechanisms (i.e., the characteristics of the board of
commissioners 3 , transparency). The first study (chapter 2) investigates the role of
Indonesia’s institutional framework of corporate governance in controlling the
opportunities for corruption. The second study (chapter 3) examines the perceptions of
external auditors when assessing fraud risks. The third study (chapter 4) investigates
the interaction between the board of commissioners and directors (internal mechanism)
and the change of the institutional framework (external mechanism) (see the dashed
line in figure 1.1), and its impact on the extent to which firms that have directors with
political connections perform differently from firms without these connections. The
fourth study (chapter 5) analyses the link between board characteristics (internal
mechanism), transparency (internal mechanism) (see the dashed line in figure 1), and
earnings management. The details of each study are discussed in section 1.5.
3 Indonesia adopts a two-tier board system in which there is a clear separation between the
supervisory board and the executive directors. Pursuant to Law No. 40 year 2007 on Limited Liability Companies, the supervisory board is called the Board of Commissioners (Dewan Komisaris in Indonesian), while the executive directors is called the Board of Directors (Direksi in Indonesian). The function of commissioners is the same as non-executive directors in a one-tier board system.

Chapter 1
7
1.4 Theoretical Background
Two theories are central to the analysis in the four studies i.e., agency theory and
resource dependence theory. Each theory is briefly discussed below.
**
Figure 1.1. Corporate governance mechanisms
1.4.1 Agency theory
Agency theory originates from the theory of the firm. This theory has been
developed by several prominent scholars such as Smith (1776), Berle and Means (1932),
Coase (1937), and Jensen and Meckling (1976). The theory acknowledges that when
management and ownership of a firm are split, which is the case for stock-based firms,
this may have consequences with respect to managerial behaviour. When managers are
appointed to operate a business on a daily basis without directly being controlled by the
shareholders, managers may run the business not in line with the interests of the
shareholders. This phenomenon was described as follows by Smith in his book entitled
An Inquiry into the Nature and Causes of the Wealth of Nations:”The directors of such
companies, however, being the managers rather of other people’s money than of their own, it
cannot well be expected that they should watch over it with the same anxious vigilance with
External mechanisms Internal mechanisms
Institutional framework (Chapters 2 and 4)
External auditors (Chapter 3)
Board of commissioners, Board
of directors (Chapter 4)
Board of commissioners (Chapter 5)
Transparency (Chapter 5)
Corporate governance mechanisms

Introduction
8
which the partners in a private copartnery frequently watch over their own” (Smith, 1776,
p.311).
Two hundred years later, in 1976, Jensen and Meckling in their seminal paper
developed a theory of the ownership structure of the firm, which integrated the
ingredients of agency theory, property rights theory, and finance theory (Jensen and
Meckling, 1976, p.1). According to Jensen and Meckling, a firm is formed by selling
stocks, which are held by many different investors. In this way, it is impossible for the
shareholders to operate the business by themselves. They need other persons to run the
business. The segregation between owners (principals) and managers (agents) may
result in conflicts as the principal’s interests may diverge from those of the agent’s.
Since then, the agency theory has become a powerful tool to analyze potential
conflicts of interest between principals and agents, not only in the area of economics but
also in other fields such as political science and sociology. Jensen and Meckling (1976)
offered two primary measures to reduce agency costs (that is, the costs of the separation
of ownership and control): control (monitoring) mechanisms, and managerial incentive
mechanisms. Monitoring mechanisms are intended to restrict the agents’ misbehaviour
in order to be aligned with shareholders’ interests. These include costs associated with
providing reliable and transparent financial statements, and the presence of
independent directors. This dissertation utilises this theory in Chapters 2, 3, 4, and 5.
1.4.2 Resource dependence theory
The resource dependence theory stresses that organizations are dependent on
resources. Organizations have to compete to obtain limited resources, in order to survive
and mitigate environmental uncertainty. The theory was introduced by Pfeffer and
Salancik (1978) in their book The External Control of Organizations. Although this theory is
not as dominant as agency theory, it has been widely used by corporate governance
scholars (Hillman et al., 2009). One of the strategies that companies may take is by
recruiting board members with specific characteristics aligned with the needs of the

Chapter 1
9
firm. Board capital consists of human capital (experience, expertise, skills, reputation),
and relational/social capital (networking) (Hillman and Dalziel, 2003).
Research using resource dependency theory has examined the importance of
board members in increasing firm performance by bringing valuable resources to the
company, such as competence and experience (Sellevoll et al., 2007; Martikainen et al.,
2016), multiple board appointments (Ferris et al., 2003; Jiraporn et al., 2008; Clements et
al., 2015; Muravyev et al., 2016), foreign directors (Masulis et al., 2012; Polovina and
Peasnell, 2015), and networking (Hillman, 2005; Stevenson and Radin, 2009; Hoitash,
2011; Johnson et al., 2013b). We use resource dependency theory in chapter 4 when we
discuss the connections board members have with politicians. These connections may be
a valuable resource to the company, which at least potentially may increase its financial
performance.
1.5 Structure of the Thesis
The thesis is divided into six (6) chapters. Chapter 1 is the introductory chapter, which
describes the objectives, the research questions, and the content of this thesis. Chapters
2, 3, 4, and 5 provide four (4) empirical studies, which analyse various corporate
governance mechanisms in Indonesia. The central topic of these four studies is related to
how these corporate governance mechanisms can control the opportunities for
managerial misconduct (see also Figure 1.1). Chapter 6 concludes and discusses the
main findings of the study. Table 1.1 summarises the four empirical studies in the
dissertation.
Chapter 2 presents a comparative study of institutional corporate governance
frameworks in Malaysia, Thailand, and Indonesia. It provides a basis to understand the
main characteristics of corporate governance in Indonesia, and how Indonesia has
developed its institutional framework as compared to Malaysia and Thailand. This
study contributes to the literature as previous research on corruption has been mainly

Introduction
10
Table 1.1 Summary of the empirical studies of the dissertation
Chapter Theory and governance mechanism
Research questions Methodology and
sample Variable of
interest
2 Agency theory
External mechanism (institutional frameworks)
How can an improved institutional framework for corporate governance decrease the level of corruption? How does the corporate governance institutional framework of Indonesia compare to that of Malaysia and Thailand?
- A comparative study
- Indonesia, Malaysia, and Thailand
- 2014
Corporate governance codes, capital market regulations, listing rules
3 Agency theory
External mechanism (external auditors)
Do fraud risk factors, materiality judgments, professional scepticism, litigation risk determine fraud risk assessments?
- A questionnaire-based study
- 435 external auditors
- 2015
Fraud risk factors, materiality judgments, professional scepticism, litigation risk
4 Agency theory and resource dependence theory
Internal and external mechanisms (board of commissioners and board of directors, and institutional landscape)
Does an institutional change influence the value of political connections?
- A quantitative study
- 2,877 observations
- From 2000 to 2011
The political landscape change
5 Agency theory
Internal mechanisms (board of commissioners and transparency)
Do board inputs improve transparency and mitigate earnings management?
- A quantitative study
- 245 observations - From 2013 to
2015
The mediation effect of disclosure & transparency
dominated by studies focusing on the macro/country level and using a quantitative
approach. These studies focus on issues such as the causes of corruption (e.g., Glaeser

Chapter 1
11
and Shleifer, 2002; Bohara et al., 2004; Schulze and Frank, 2003), the negative effects of
corruption on investment (e.g., Wei, 2000; Gyimah-Brempong, 2002), and the
determinants of corruption (e.g., Martin et al., 2007; Zhou et al., 2012). However, research
on the importance of corporate governance in curbing corruption has not been much
investigated (Wu, 2005).
Our study makes a contribution to the research on the relationship between
corporate governance and curbing corruption by examining the three countries’
institutional frameworks which consist of corporate governance codes, company law,
rules and regulations. Particularly, three components of corporate governance
mechanisms are evaluated i.e., shareholder rights, the board of directors, and the
accounting and auditing standards including transparency standards. The hypothesis of
this chapter is that a strong corporate governance institutional framework can reduce
opportunities for corruption. In general, our study supports the hypothesis, that is,
Indonesia’s corporate governance institutional framework is less strong than Malaysia
and Thailand, leading to a weak monitoring system. This condition makes the
opportunities for corruption more unimpeded.
The quality of institutions influences how well economic resources are allocated
among various parties (Acemoglu et al., 2005). Corporate governance mechanisms are
part of the country’s institutional framework, directing the interrelationship between
shareholders, board of directors, management, and other stakeholders (Cuervo, 2002).
By strengthening corporate control mechanisms, the business sector can contribute to
putting in place measures that ensure that business transactions are performed with
higher levels of integrity and reduced levels of misbehaviour, including corruption.
Sound corporate governance practices may promote investment and economic growth
(Claessens, 2006; Tiwari, 2010).
Chapter 3 focuses on external auditors’ perceptions of a fraud case. External
auditors are part of the external corporate governance mechanisms. They are responsible
for performing the audit of a firm’s financial statements to assure that the financial
reporting is free from material misstatements due to fraud or error. External auditors

Introduction
12
have responsibilities for identifying and assessing fraud risks (ISA 240, 2009). Because
they play a significant role in identifying and assessing fraud risks, it is important to
study factors that influence fraud risk assessment. To do so, we develop a vignette case
study, which describes a real fraud case in Indonesia. Referring to the vignette case, we
conduct a questionnaire which is distributed among Indonesian external auditors.
We extend the model of auditor judgments in assessing fraud risk as developed
by Hammersley (2011) by adding three variables of interest: materiality judgment,
professional scepticism, and litigation risk. While previous studies have investigated
factors that influence fraud risk assessments, such as scepticism (Boyle et al., 2015) and
fraud risk factors (Moyes, 2008; Johnson et al., 2013) independently from each other, our
research model predicts that external auditors’ fraud risk assessment is determined by
fraud risk factors, materiality judgment, professional scepticism, litigation risk, and
several auditor characteristics (certification, experience, and audit firm size)
simultaneously. Using Structural Equation Modelling, the results indicate that fraud risk
factors, materiality judgment, and professional scepticism are crucial factors for external
auditors when assessing fraud risks. More importantly, the results show that
professional scepticism mediates the relationship between materiality judgment and
fraud risk assessments. These results are deemed new in the auditing literature.
Investigating auditor judgments in assessing fraud risk is relevant, particularly
for Indonesia. The quality of audits in this country is generally low. Audit practices are
characterized by insufficient audit planning and low scepticism of fraud and
misstatements, and they are less critical of management assertion (ROSC, 2011, 2018).
This also means that there is much room to increase the number of certified accountants
and to improve auditor capacity. The number of licensed Certified Public Accountants
(CPAs) is very limited, only 1,350 (Finance Professions Supervisory Center, Pusat
Pembinaan Profesi Keuangan, 2015). The Indonesian Institute of Certified Public
Accountants (IICPA) has created, and should continue to create, various programmes to
attract accounting graduates and auditors in order to become a CPA.

Chapter 1
13
Chapter 4 portrays how institutional change in Indonesia during the early 2000s
affected the value of political connected firms. Particularly, we compare the financial
performance of politically connected firms and non-politically connected firms between
the pre-democratic era period (before 2005) and the democratic era period (after 2004).
The year 2004 is deemed a milestone entering the democratic era because Indonesia for
the first time ever introduced direct democratic presidential elections. Employing hand-
collected data on politically connected board members of 357 listed non-financial
Indonesian firms over the 2000-2011 period, the empirical results show that the financial
performance of large firms with political connections is higher than that of the
performance of large firms without such connections. We also find that the financial
performance of business group firms with political connections is higher than the
performance of business group firms or stand-alone firms without such connections.
Yet, in the democratic era the positive impact of political connections on performance
weakens. We interpret these findings as evidence that political connections became less
important for firms as a determinant of their performance after the Indonesian political
landscape changed to a more democratic regime.
Only a few studies have investigated the effect of institutional change on the
relationship between political connections and firm performance (Siegel, 2007). So far,
most of the work on the impact of political connections has regarded the institutional
context as constant (given). In addition, the studies of politically connected firms in
Southeast Asia commonly use data before or during the Asian crisis (e.g., Fisman, 2001,
Johnson and Mitton, 2003; Imai, 2006; Faccio, 2006; Leuz and Oberholzer-Gee, 2006;
Polsiri and Jiraporn, 2012). Our study is the first using longitudinal data, investigating
the impact of institutional changes on the performance of Indonesian PCFs which for the
period 2000-2011.
Chapter 5 describes the interrelations between board inputs, transparency, and
earnings management. Prior research has documented the direct association between
board characteristics and earnings management (e.g., Peasnell et al., 2005; Rahman and
Ali, 2006; Carcello et al., 2008; Jaggi et al., 2009; Jackling and Johl, 2009; Marra et al., 2011;

Introduction
14
Khalil and Ozkan, 2016; Marra et al., 2011; Chen et al., 2015). However, the results of
these studies are inconclusive. While all those studies assume a direct relationship
between board performance and earnings management, this study takes a different
stance. We argue that the association between boards and earnings management is not
necessarily direct. The main hypothesis is that board inputs affect earnings management
indirectly, by influencing the extent to which management is transparent (Cheng and
Courtenay, 2006; Rao and Tilt, 2016). Board inputs determine the level of transparency
and disclosure, which in turn mitigates earnings management practices.
Three constructs are developed to measure the level of board inputs, i.e. board
skills, board commitment, and board structure. The constructs are composite indices
created from selected questions based on the ASEAN Corporate Governance Scorecard,
which is provided by the Indonesian Institute for Corporate Directorship. The sample
consists of 104 listed non-financial Indonesian firms for the years 2013, 2014, and 2015.
The findings show that board skills and board commitment reduce earnings
management indirectly through mandatory disclosure, but not through voluntary
disclosure. Moreover, we find that Indonesian firms have not fully complied with
mandatory disclosure requirements.
Our findings suggest that a lack of compliance is a big concern for emerging
countries in general and for Indonesia in particular. This may occur because board
members may be less effective in their monitoring role. They may be less strict to enforce
higher disclosures. Among other things, this may be caused by the fact that regulatory
bodies do not impose any penalty for non-compliant firms. It seems that enforcement of
regulations is weak. Therefore, corporate governance mechanisms such as having
effective boards and imposing formal regulations do not necessarily result in good
implementation of corporate governance in practice.
Lastly, chapter 6 provides the highlights of the main findings. The four empirical
studies contribute to a deeper understanding of corporate governance practices in
Indonesia. First, much improvement has been achieved with regard to the corporate
governance institutional frameworks. However, the strong institutional frameworks do

Chapter 1
15
not necessarily imply that all firms comply with the rules and regulations. The
Indonesian corporate governance framework is mostly voluntary based. This means it is
less stringent in practice. Second, our findings also suggest that the capacity of the
supervisory directors needs to be improved. Although the independence board
structure may be satisfied, the board members are less effective in carrying out their
monitoring duties. Third, the financial reporting and audit quality are another big
concern. The audit quality can be improved when auditors demonstrate more
conservative and more sceptical behaviour, which may lead to increased fraud risk
assessments.
In addition, chapter 6 also discusses the practical implications and policy
recommendations. Policy makers and regulators such as the Financial Services
Authority (OJK) are necessary to focus more on the enforcement of law and regulations.
The enforcement division may consider being more stringent to penalise firms that do
not comply with the regulations. A more conducive environment for market-based
mechanisms should be promoted. For instance, channels for shareholder activism need
to be created therefore, shareholders can easily voice their opinions. For corporations, a
strong commitment to implement sound corporate governance mechanisms is a must.

Introduction
16

Chapter 2
17
Chapter 2 Corporate Governance and Corruption:
A Comparative Study of Southeast Asia4
Abstract
Over a decade after the 1997 Asian financial crisis, Indonesia and other Southeast Asian countries have made substantial governance reforms. The reform measures of the institutional framework, both in the public and corporate sectors have been intended to transform Indonesia into a clean, transparent and accountable country. While the reforms have resulted in increased political stability, improved government effectiveness, and a more conducive investment climate, corruption remain a large concern in Indonesia. This study aims at evaluating how corporate governance mechanisms can reduce opportunities for corruption. By utilizing agency theory, we argue that a strong corporate governance institutional framework helps to reduce a country’s level of corruption. We focus attention on three components of corporate governance mechanisms i.e. shareholder rights, the quality of the board of directors, and appropriate accounting and auditing standards, including transparency standards. We conducted a comparative study among Southeast Asian middle-income countries i.e. Indonesia, Malaysia and Thailand. We rely on accessible secondary data such as corporate governance codes, laws and regulations. Our study concludes that the Indonesian corporate governance institutional framework is less stringent compared to Malaysia and Thailand. This condition provides a favourable environment for corruption to persist because the standards and practices are less demanding and the companies do not necessarily have to comply with the existing regulatory framework. Keywords: Corporate governance, corruption, institutional framework, Southeast Asia,
Indonesia
4 This chapter is substantially drawn from Wijayati, N., Hermes, N., & Holzhacker, R. (2016).
Corporate governance and corruption: a comparative study of Southeast Asia in Holzhacker, Wittek, & Woltjer (Eds). Decentralization and Governance in Indonesia, pp. 259-292. Springer International Publishing. Switzerland. I am very thankful to Prof. Herman Hoen who delivered helpful comments on the earliest version of this chapter.

Corporate Governance and Corruption
18
2.1 Introduction
2.1.1 Background
After being hit hard by the 1997 Asian financial crisis, Indonesia embarked on a series of
governmental reforms and began to revise standards for corporate governance. Weak
governance practices have had a significant detrimental effect on Indonesia’s economy
and society. Many scholars have in particular stressed that sound corporate governance
is important in protecting country vulnerability to financial crisis (Mitton 2002; Johnson
et al. 2000; Baek et al. 2004; Kirkpatrick 2009). The reform initiatives have resulted in
increased political stability, improved government effectiveness, a more conducive
investment climate, and improved corporate governance. Substantial efforts, not only in
the public sector but also in the corporate sector, have been designed to transform
Indonesia into a clean, transparent and accountable country.5 In the private sector there
was an effort to promote good governance practices by establishing a new institution,
the National Committee on Corporate Governance (NCCG).6 Over the decade following
the 1997 crisis, corporate governance practices in Indonesia have improved through a
better legal framework particularly in the area of the financial and capital markets.
However, although Indonesia has enhanced its corporate governance practices and has
attempted to combat corruption practices7, this has not had a significant impact on
reducing the level of corruption.
5 Several laws have been introduced to tackle corruption issue such as Law No. 31 of 1999 on
Eradicating Criminal Acts of Corruption as amended by Law No. 20 of 2001, Law No. 28 of 1999 on State Officials who are Clean and Free of Corruption, Collusion, and Nepotism, and Law No.15 of 2002 on Criminal Acts of Money Laundering.
6 NCCG was established under a Ministerial Decree from the Coordinating Minister for the Economy, Finance and Industry No. KEP-31/M.EKUIN/06/2000. Then, in 2004 the NCCG was transformed into the National Committee on Governance (or KNKG), composed of the Public Governance Sub-Committee and the Corporate Governance Sub-Committee under a Ministerial Decree No. KEP-49/M.EKON/11/2004.
7 In an attempt to enhance the enforcement of law process, at the end of 2003 the government established the Indonesian Corruption Eradication Commission (or “KPK”), an independent body which has special authorities to prevent, combat, and prosecute any acts of corruption. The KPK has made significant performance since its establishment. Between 2004 and 2012, the KPK had handled 283 corruption cases which involved among 337 politicians, government officials, local leaders, and private sector executives (The 2012 KPK Annual Report).

Chapter 2
19
Compared to its neighbouring countries, Indonesia has indeed a chronic problem
with corruption. Table 2.1 shows the comparison of corruption perception ranks among
the Southeast Asian countries. The figures provided by the Worldwide Governance
Indicators show that Indonesia has experienced a positive trend in controlling
corruption. It implies that the level of corruption has decreased over time. However, if
we compare Indonesia with other countries in Southeast Asia, Indonesia’s ranking is
much lower than the others. It ranks second lowest in the region, below the Philippines
and Thailand. One important ingredient of corruption is bribery, which always involves
payers and receivers. This study focuses on the bribe payers, in particular firms or
corporations as a basis for our analysis. Referring to agency theory, we argue that
bribery is part of opportunistic behaviour by individuals and corporations, which can be
reduced by implementing sound corporate governance.
Table 2.1 Corruption rank in Southeast Asian countries, 2002-2012
Indonesia has made progress in the World Bank’s good governance indicator for corruption, gaining rather steadily in the past decade from 8% to almost 29% in the world wide rankings, but this remains well below the median for all countries. This ranking is also well below the position of other middle-income peers in the region, for example Malaysia at almost 66% and Thailand at almost 47%, are ranked considerably higher in the control of corruption.
Country 2002 2004 2006 2008 2010 2012 Singapore 98.5 98.5 97.6 98.1 98.6 97.1 Brunei 65.4 69.8 63.4 72.8 79.5 72.2 Malaysia 62.4 70.2 64.9 59.2 62.9 65.6 Thailand 47.8 51.7 44.4 42.2 48.1 46.9 Vietnam 34.6 24.4 24.9 25.7 31.4 35.4 Philippines 39.0 30.2 22.0 25.2 22.4 33.5 Indonesia 8.3 17.1 21.5 34.0 25.2 28.7 Cambodia 15.1 14.1 8.3 6.8 6.7 14.4
Source: The Worldwide Governance Indicator – The World Bank (2013) The score ranges from 0 (lowest rank) to 100 (highest rank)
We assess the quality of corporate governance by focusing on each country’s
institutional framework. This is motivated by the argument that institutions play a
crucial role in determining how economic resources are efficiently allocated. Countries
with sound rules of law including property rights protection tend to be wealthier and

Corporate Governance and Corruption
20
generate better economic performance (Acemoglu et al. 2005). More specifically in terms
of corporations, the variation in country’s legal framework and investor protection has
many consequences, such as the quality of investor protection can affect stock market
size, ownership concentration, corporate governance and firm performance (La Porta et
al. 1998; Djankov et al. 2008; Doidge et al. 2007).
In addition, the role of institutional mechanisms is more substantial, particularly
in the phase of a decentralized economy when regional development needs more local
entrepreneurs to be involved. Therefore, improved corporate governance frameworks
are required to provide a clearer guidance in managing business based on integrity and
professionalism. This study examines the country’s corporate governance institutional
framework that may influence the level of corruption. We focus on how laws and
regulations stipulate shareholder rights, board of directors, accounting and auditing,
and transparency. The analysis in this paper is based on the text content of the latest
version of corporate governance codes, laws, and regulations.8
The study of corporate governance and corruption is essentially relevant in the
context of middle-income countries including Indonesia, for at least three reasons. First,
before the 1997 crisis Indonesia had long employed a centralized government model and
relied most on the executive power (Brodjonegoro 2009). In 1999, there was a dramatic
change in political system when the government introduced a decentralisation law. It
has turned Indonesia into a more democratic regime, by granting more authority and
autonomy to the local government. Deregulation became a priority to stimulate
competition that is expected to lead faster economic development (Weingast 1995).
However, decentralisation itself does not necessarily improve investment if there is a
perceived lack of governance (Kessing et al. 2007). Furthermore, an open market
economy implies that the supply of corporate finance comes not only from domestic
investors, but also from overseas investors. It is important to stress that many foreign
investors demand high standards of disclosure and transparency from the firms in
8 In this paper, we do not consider the enforcement of law. It might be possible that strong regulations
do not necessarily imply a good implementation in practice.

Chapter 2
21
which they invest. Thus, the existence of sound corporate governance in the
decentralisation era is critical to attract (foreign) investors.
Second, the decentralisation process involves power sharing between central and
local governments, including the creation of market arrangements (Weingast 1995). It
means that economic activities are no longer limited to specific economic centers, but
they are more diffuse across different regions. As markets develop, the power of state in
controlling economic resources will decline, which may create more business
opportunities and new entrepreneurs (Cao and Nee 2000). The larger role of the private
sectors may contribute to enhancing societal welfare. To ensure that all economic actors
can fairly access economic resources, institutional arrangements are required. More
importantly, there must be institutional mechanisms to promote accountability, regulate
economic activities, and impose rules for the benefit of public interests. Firms may
deliver benefits for society through the value creation, not only for shareholders, but
also for other stakeholders. This sustainability can be achieved, among others, by
implementing good corporate governance9.
Third, good corporate governance can stimulate economic growth because it
provides a control mechanism to ensure that economic resources are efficiently
allocated. Firms may enhance thier governance by appointing competent and
independent directors, controlling management misconduct, and applying a higher
standard of financial reporting. In addition, companies are encouraged to generate
timely, accurate and transparent information. Reliable information is vital for investors
in allocating their funds to the most productive use. More disclosures lead to increased
investor confidence and therefore results in a greater opportunity for firms to further
expand. Thus, it may boost economic development (Morck et al. 2005; Tiwari 2010). Prior
studies also suggest that transparency has been considered as a key important
ingredient to restrict corruption (Lindstedt and Naurin 2010; Peisakhin and Pinto 2010).
9 Corporations have a responsibility to create financial profits for the shareholders on the one hand,
and on the other hand they contribute to the well-being of stakeholders, including society and the environment. It is also known as triple-bottom line notion (Hubbard 2009; Painter-Morland 2006).

Corporate Governance and Corruption
22
It facilitates shareholders and the public to access company information, make them
easier in detecting the probability of corrupt behaviour by the company. A higher
degree of transparency may reduce corruption and make markets more efficient, which
facilitates the economy to grow.
2.1.2 Research questions
As the nature of corrupt transactions is secretive, parties who are involved tend to
hide these illicit transactions. It leads companies to be relatively opaque, with low levels
of transparency and disclosure. Corporate governance provides instruments to
discipline such behaviour. Yet, how the corporate governance framework can reduce the
level of corruption is still unclear. To address the issue, this paper focuses on two
questions: first “How can an improved institutional framework for corporate
governance decrease the level of corruption?”, and second “How does the corporate
governance institutional framework of Indonesia compare to that in Malaysia and
Thailand? Three aspects of corporate governance are examined, namely two internal
control mechanisms (shareholder rights and board of directors10), and one external
control mechanism (accounting & auditing standards). We also discuss the importance
of transparency and disclosure as a key factor in mitigating corruption.
2.1.3 Scientific and social significance
Previous research on corruption have mainly focused on analyzing its causes
(Glaeser and Shleifer 2002; Bohara et al. 2004; La Porta et al. 1999; Treisman 2000; Schulze
and Frank 2003) and the negative effects of corruption, including lowering investment
(Gyimah-Brempong 2002; Wei 2000) and impeding economic growth (Drury et al. 2006).
However, little attention has been given to research on the relationship between
corporate governance and corruption. Wu (2005) asserts that the quality of corporate
governance has a significant impact on lowering the country’s level of corruption. To 10 The term of board of directors in this chapter refers to the non-executive directors and/or executive
directors, depending on the national context.

Chapter 2
23
measure the quality of corporate governance, Wu (2005) only employs the role of the
board of directors and the quality of accounting standards. This study complements the
previous literature by adding other variables which we consider as key elements of
corporate governance i.e. shareholder rights and transparency.
In addition, this study aims at comparing the Indonesian corporate governance
code11, laws, rules and regulations with those in Malaysia and Thailand. Our study may
contribute to strengthening the Indonesian corporate governance regulatory framework
through policy recommendations that enhance transparency. The public trust can be
encouraged through higher standards of integrity and transparency in the private
sector. More importantly, the improvement of corporate governance practices may
attract investors, enhance productivity, and contribute to sustainable economic
development. This, in turn, will bring Indonesia towards a developed country with a
higher rate of income per capita.
The rest of the paper is organised as follows. Section 2.2 reviews the previous
literature on corporate governance and corruption and presents a theoretical framework.
Section 2.3 provides an overview of the business landscape in Southeast Asian countries
and their current corporate governance performance. Section 2.4 describes the
methodology that is used. Section 2.5 presents a comparative analysis of the corporate
governance institutional framework of the three countries. Section 2.6 concludes our
study.
11 Corporate governance code generally consists of principles and standards which is voluntary with
regard to its implementation; it defines the structure and mechanism how corporations are governed. According to the Financial Reporting Council (2012) the code is not a rigid set of rules, that corporations are not necessary to be strictly bound with the code. Thus, it is contrary to laws and regulations which impose mandatory rules including the enforcement.

Corporate Governance and Corruption
24
2.2 Literature Review
2.2.1 Corporate governance
Corporate governance is characterized by the structure and process of how a
corporation is directed and controlled. It governs the relationships between the
shareholders, board of directors, management and other stakeholders to ensure that a
corporation achieves its objectives. However, corporate governance does not stand
alone, it is part of the political and economic system where laws, rules and regulations
apply. The Organization for Economic Co-operation and Development (OECD) declares
in its corporate governance framework that “corporate governance framework should
promote transparent and efficient markets, be consistent with the rule of law and clearly
articulate the division of responsibilities among different supervisory, regulatory and enforcement
authorities.” (OECD Principle I, 2004).
Corporate discipline mechanisms have become a central issue for discussion
among scholars as these may mitigate the divergence between shareholders and
managers. Research on corporate governance has extensively utilized traditional agency
theory since Jensen and Meckling (1976) constructed a fundamental argument of the
separation of ownership and control. Managers (agents) who run a day-to-day business
operation relatively have better information than shareholders (principals). This
asymmetric information enables the managers to perform unfavourable behaviour that
may hurt shareholder value. The managers may conceal any relevant information in
order to mask their actions, which may include fraud and financial manipulation
(Albrecht et al. 2004).
The principal-agent conflict model is prevalent among the Anglo-American
companies in which ownership structure is widely dispersed. However, when the
pattern of shareholdings is concentrated agency problems turn into conflicts between
controlling shareholders and minority shareholders or principal-principal conflicts
(Young et al. 2008). In this case, management tends to act in the best interest of the
controlling shareholders which can potentially expropriate the minority investors
(Claessens et al. 2002; Lemmon and Lins 2003).

Chapter 2
25
Nevertheless, whatever the type of the agency conflict, the essence lies in how to
minimise these conflicts. Any incongruent interests between shareholders and managers
or between majority and minority shareholders may be aligned through a monitoring
system. The literature on corporate governance suggests that there are two sets of
mechanisms that play a substantial role in controlling corporations (Weir et al. 2002;
Daily et al. 2003). We utilize a framework from the World Bank as seen in Figure 2.1. The
first set is internal control mechanisms, which mainly focus on the internal governance
of a company. It arranges the distribution of authority within a corporation, among the
shareholders, board of directors, and management. The description of shareholder
rights, the roles and responsibilities of boards of directors and management should be
clearly addressed. All shareholders should be treated equally and their rights should be
well protected. On behalf of the shareholders, the board of directors serves as corporate
supervisors and monitors. The effectiveness of the board of directors in serving their
duties is essential to ensure that the company delivers value to all stakeholders.
The second set of control mechanism of corporate governance comes from
external factors. Business is embedded in society which has a specific culture, legal
framework, and political and economic system. Globalization and competitive markets
have forced domestic companies to be more concerned about their governance. A more
open economy is likely to lead a higher level of competition, and lower barriers to entry,
which encourages companies to be more professional in managing their business. In
addition, an open economy attracts foreign investors to bring in capital and the presence
of foreign shareholders in domestic companies can change governance standard of
domestic companies. Foreign shareholders require a higher level of corporate
governance standard to ensure their interests are taken care of within the corporate
structure.

Corporate Governance and Corruption
26
Figure 2.1 A theoretical framework
The country’s legal origin also influences the institutional framework of
corporate governance. Countries may adopt a common law and civil law system.
Previous research has documented that countries with common law provide a better
legal system in terms of investor protection and law enforcement (La Porta et al. 2000). It
is hard and even impossible for countries to change their legal origins as it is considered
too costly. However, new laws can be mandated without changing the legal origins of a
country. For the purpose of improving corporate governance standards, rules and
regulations that induce accountability and transparency should be introduced. For
instance, the mandatory requirement to disclose the profile of the board of directors is
essential because shareholders and the public have better information to assess their
capabilities. Besides the rules and regulations, another tool to monitor firms is
accounting and auditing standards. The quality of accounting standards is related
positively to the level of corporate governance since strong accounting standards
enforce companies to disclose information in ways that generate transparent, accurate
Internal Factors:
Regulatory framework
- Codes - Standard Operating
Procedures
Key actors
- Shareholders - Board of Directors - Management
Quality of Corporate
Governance
Corporate Control Mechanisms
External Factors:
Regulatory framework - Codes - Laws and regulations - Acct and Audit
Standards
Key players - Competitors - Foreign investors - Reputational agents
Source: adapted from Corporate Governance: A Framework for Implementation. The World Bank Group (2000).

Chapter 2
27
and comparable financial information. Here, the role of regulatory agencies is essential
to provide regulatory frameworks that protect the public interest. It is believed that
strong regulatory frameworks can stimulate markets through the functions of
regulating, stabilizing, and enforcing contracts.
Additionally, there are still other elements that potentially improve the corporate
governance practices, i.e. the pressure from stakeholders such as employees, customers,
non-government organizations, and professional organizations. Most of these
stakeholders are independent groups which may be vocal since they represent the
public interest instead of their own interest. For example, a non-government
organization with a focus on environmental issues can challenge the company if there is
misconduct in managing industrial waste. Or, a credit rating agency will demonstrate its
expertise to assess the company risks. A company which has a higher level of
governance will be awarded a better rating than a company that is deemed less risky.
Even though this paper does not take into account these factors to be part of the
analysis, the roles of these external stakeholders are considered to be growing as a
company watchdog.
All instruments discussed above determine the level of corporate governance.
The quality of corporate governance can be enhanced if all components in the corporate
control mechanism work effectively. In other words, shareholders should be more active
to ensure that the board of directors and management do their duties properly; the
board of directors should strengthen their monitoring role without neglecting their
supervisory roles. Policy makers should enact adequate regulations that promote a
better investor protection and an efficient market. To be an efficient market, companies
are required to share their information to the public. In this sense, transparency is a key
point that enables investors and the public (outsiders) to assess the company
performance. The public interest should be protected, and it can be improved through
transparency. When the private sector has a strong commitment to properly manage
business activities through sound corporate governance, it can improve efficiency and

Corporate Governance and Corruption
28
productivity. Furthermore, it leads to promoting national economic development by
generating a higher income per capita, and ultimately it may create a prosperous society.
2.2.2 Agency problem and corruption
Corruption is a big concern in Southeast Asia. While Singapore and Malaysia are
perceived to be relatively “clean” countries, other emerging countries such as Indonesia,
Vietnam, the Philippines and Thailand has been struggling to combat an endemic
disease - corruption. Two key elements of corruption which relate to private sector are
bribery and fraud. Generally, bribery is a corrupt act which involves payers and
receivers. Rose-Ackerman (1999) specifically defines that bribery is a payment, in money
or kind that imposes a reciprocal obligation between two parties involved. The major
areas where the companies could bribe are when they are dealing with licensing,
procurement processes, and institutions where they have insiders’ information. In
contrast, fraud and embezzlement are corrupt acts that involve company’s insiders such
as management and employees. Nevertheless, whatever the kind of corruption, its
presence reflects how well the company governs its business.
A large body of literature has shown that management, in pursuing their own
personal interests, tends to hide relevant information to shareholders (Arnold and de
Lange 2004). For example, management can inflate the reported earnings in order to
obtain a greater bonus (Healy 1985; Balsam 1998; Shuto 2007). It seems to be favourable
for the shareholders as the firm’s income is increasing. However, what the management
displays is a distorted financial statement that incorporates manipulative actions. The
similar analogy can also be applied in terms of bribery case.
In order to win a procurement contract and get a lucrative license, management
and insiders may be tempted to pay bribes as a shortcut of doing business. The
asymmetric information problem makes it difficult for outside shareholders to access the
true information. As the nature of bribery is secretive, the managers can conceal such
transaction by deceiving the (outside) shareholders. The bribery case of Sentul City,
perhaps is a good example. Sentul City is one of the Indonesian publicly listed firms,

Chapter 2
29
engaging in real estate developments. In relation to getting a land conversion permit to
be utilized for a luxury housing project (nearly 3,000 hectares), one of its subsidiaries
was suspected to give a bribe to the local regent (The Jakarta Post, June 2014). The case
was under the investigation of the Corruption Eradication Commission, which allegedly
involved the CEO.
In the short run, both managers and shareholders of a corporation may gain
benefits from bribery. Since the company sales are boosting, the managers will be
awarded with higher compensation. However, it does not hold for over the long-term.
Wu (2005) contends that bribery bears some hidden costs, which can potentially turn
into future risks such as legal suits, fines and impairment to reputation. Bribery allows
managers to exploit the company resources for their own personal benefits at the
expense of the outside shareholders. Bribery may harm firm performance because it
impedes sales growth (Kochanova 2012; Seker and Yang 2012), and reduces productivity
(De Rosa et al. 2010). Moreover, bribery at country level will cause economic inefficiency
and distort economic growth (Drury et al. 2006; Meon and Sekkat 2005). In this context,
bribery not only expropriates the shareholders’ rights, but may also hurt the public
interest.
2.2.3 Corporate governance and corruption
Good governance is about principles of integrity, accountability and
responsibility. As discussed, corporate governance provides a mechanism of checks and
balances that may help a company not getting involved in misconduct including
corruption. How the corporate governance framework can reduce, though not eliminate,
the level of corruption will be addressed in this section. Specifically, we focus on four
elements of corporate governance that can potentially reduce the opportunities for
corruption, namely shareholders rights, board of directors, accounting and auditing
standards, and transparency.

Corporate Governance and Corruption
30
2.2.4 Shareholder rights
Unlike the typical agency problem between principal and agent (Jensen and
Meckling 1976) in Anglo-American countries, the conflict in Asian firms is best
described as the majority versus minority shareholders (Shleifer and Vishny 1997) or
principal-principal conflict (Jiang and Peng 2011; Young et al. 2008). The majority
shareholders in most cases are family owners who exercise their control through
pyramidal structure and cross-holdings. Using their control rights, inside shareholders
may more easily utilize firm resources for bribery activities. To mask those illegal
activities, the inside shareholders may then redistribute the costs and benefits of the
bribery to other companies in the same group (Wu 2005). Such behaviour is mostly not
known by the outside shareholders, since they do not have access to all the relevant
information. Even if they know, they do not have enough control rights to challenge
these practices. They are always to be losers when voting is in place. Their opportunity
to participate in key decision-making process is limited. For instance, in the case of the
appointment of directors, the minority and outside shareholders in many cases are not
involved in the process, because the controlling shareholders can appoint persons to seat
in the board based on their own interests.
Consequently, when the participation of outside shareholders is weak, their role
in corporate monitoring will be limited. In case of inadequate regulations, the
shareholder rights to actively participate and monitor the management and inside
shareholders are restricted. The incidence of bribery is greater when the regulations do
not facilitate the active participation of shareholders since there is less control from
them. Therefore, improved shareholder activism can create a better accountability
system to prevent bribery. In other words, a country’s corporate governance
institutional framework concerning the shareholder rights is crucial in determining the
level of corruption. Thus, we suggest that when the shareholder rights are better
protected, the level of corruption tends to be lower.

Chapter 2
31
2.2.5 Board of directors
The board of directors (non-executive directors or board of commissioners) of a
corporation have a mandate from the shareholders to direct, supervise, and monitor the
management, as well as assuring that all corporate activities comply with legal
requirements. They should ensure that the interests of shareholders and management,
and the interests of majority and minority shareholders are aligned. Many studies have
addressed how corporate control through boards can be exercised more effectively. For
example, the presence of independent or outside directors is important in providing
objective opinions to ensure that the decisions made are in the best interest of all
shareholders (Anderson and Reeb 2004). Furthermore, in order to get competent persons
the selection process and remuneration package of the Board should be clearly
formulated. Previous empirical research has found that fraud firms tend to have a lower
percentage of outside directors, fewer numbers of audit committee meetings, and a
higher percentage of dual-role CEOs (Farber 2004; Uzun et al. 2004; Sharma 2004).
Shortly, a strong board structure will enable to detect any opportunistic behaviour of the
management and inside shareholders.
Management or inside shareholders may obtain instant benefit from bribery
(with regard to securing the orders or boost the sales). However, such opportunistic
behaviour may lead to potential risks which are incongruent with the shareholders’
interests such as lowering firm growth (Seker and Young 2012; Kochanova 2012;
Svenson and Fisman 2007), and impairing firm reputation (Serafeim 2013; Karpoff et al.
2013). The existence of corporate governance frameworks that clearly formulate,
regulate and enforce the board function is fundamental in determining the quality of the
boards. Thus, strengthening the competency, roles and responsibilities of the board will
lower the incidence of bribery because it provides a reliable control mechanism in
preventing and detecting bribery. It implies that boards should prioritize a commitment
to conducting effective oversight in such way that it may lead not only to short-term
performance but also long-term performance. Based on the above discussion, we

Corporate Governance and Corruption
32
suggest that the quality of the board of directors has a positive impact to reduce the level
of corruption.
2.2.6 Accounting and auditing practices
Accounting and auditing standards are well recognized as a means to account for
company’s activities. Those standards and regulations are regarded as external devices
to discipline firms. On the one hand, accounting standards give a guidance for
companies how to report their economic transactions in figures. On the other hand,
auditing provides assurance that company’s financial reporting has complied with the
accounting standards. Previous research has documented that the quality of accounting
information is negatively related to the country level of corruption (Kimbro 2002; Picur
2004; Riahi-Belkaoui and AlNajjar 2006). When good accounting standards exist,
organizations are required to disclose information in ways that generate transparent,
accurate and comparable financial information. Malagueno (2010) argues that higher
accounting and auditing standards impose management to be more transparent with
respect to the use of the organisation’s assets, making corrupt practices are difficult to
undertake and conceal. However, the interesting issue is not the existence of those
standards per se, but to what extent the external disciplinary mechanisms are exercised.
A higher standard of accounting and auditing is needed to generate qualified
financial statements, which encourage investor confidence and public trust.
Consequently, the adoption of qualified accounting and auditing standards supplies a
complementary means in the process of combating corruption. It is suggested that when
the quality of the accounting and auditing practices is high, the level of corruption tends
to be low. A lower level of corruption may lead to enhance efficiency and economic
growth, because more resources can be directed to support productive activities instead
of paying bribes.

Chapter 2
33
2.2.7 Transparency
According to the OECD, disclosure and transparency is one of the corporate
governance principles. It states that “corporate governance framework should ensure
timely and accurate disclosure on all material matters, including financial situation,
performance, ownership and governance of the company.” (OECD Principle IV 2004).
Transparency refers to the openness of information, its truthfulness and no concealment
of relevant information. It means that transparency does not only relate to the
availability of the truthful information but also the publicity of all material information
in such a way that the public can access the information. Take a simple example
regarding board remuneration. The salaries and bonus packages of a board should be
properly documented and available not only in a company’s files, but should also be
publicly available. Information that is not disclosed either in the annual report or in the
company’s website is not useful from a corporate governance perspective, because it
cannot be easily accessed by the investors and the public. Generally speaking, good
corporate governance mechanisms are a necessary condition, but it is not sufficient for
protecting public interest. It should be accompanied by transparency.
Scholars have confirmed that transparency mitigates asymmetric information
which leads to lower conflict of interests (Brennan and Solomon 2008; Frankel and Li
2004). The basic premise of transparency is that more disclosure of material information
reduces the probability of the company to behave improperly. This concept can be
simply applied in the context of reducing bribery or corruption. A strong disclosure
requirement enables shareholders and the public to better monitor and scrutinize
company behaviours including potential illegal actions. Disclosures of executive
remuneration package, the selection process of the board of directors, any conflict of
interests, etc. are deemed able to prevent corruption. Transparency can be improved if
there is a strong regulatory framework for firms to publish any information that not
only influences economic decisions, but also protects the public interest. Hence, we
suggest that the level of corruption can be reduced if there are strong disclosure

Corporate Governance and Corruption
34
requirements. A higher level of transparency and disclosure provides a mechanism to
create an accountable business environment that ensures public trust.
Before getting into the discussion, section 2.3 will describe in a glance a typical
business landscape in Southeast Asia, followed by current development on corporate
governance in Indonesia, Malaysia and Thailand.
2.3 Institutional Setting
Business in Southeast Asia is heavily based on a relation-based model. Unlike a market-
based system which substantially relies on arm’s-length transactions, relation-based
system is rather subjective and unobservable (Li 2003). Furthermore, Li (2003) explains
that parties who are involved in a relation-based transaction tend to have a long
commitment. This long commitment is intended to ease coordination and reduce
transaction costs. Internal control mechanisms among inside players to monitor their
commitment are more prominent than external ones. Consequently, conglomerates or
business groups are regarded as an efficient way to control economic activities, to
enforce agreements outside of the court system, and to maintain long-term relations
among insiders. Recent data of 2008 reveals that more than 46% of top publicly traded
firms in East Asia are family-dominated (Carney and Child 2013). According to their
study, the Philippines hold the largest portion of family ownership, followed by
Hongkong and Singapore. Indonesia and Malaysia exhibits relatively the same portion
of family firms (see Table 2.2).
Another characteristic of the Asian business is the close ties between the
government and corporate sectors. It is rational for companies to build a link with
government officials, as resources are mostly under government control. The
government has the authority to issue licenses and permits, and it is manifested by
several government policies directed to support certain business groups based on
political favouritism. For instance, Johnson and Mitton (2003) in Malaysia found that

Chapter 2
35
Table 2.2 The percentage of family controlled firms in 2008
Carney and Child (2013) investigated the changes of ownership concentration among East Asia’s largest companies in 1996 and 2008. They found that compared to 1996, the number of family concentrated firms have declined in 2008 particularly in South-East Asia countries including Indonesia, Malaysia and Thailand. It results from major political changes with respect to democratization that occurred following the 1997 crisis.
Country No. of firms % of family ownership* Hong Kong 158 60.6 Indonesia 132 57.3 Japan 136 9.6 Korea 159 54.5 Malaysia 154 51.5 Philippines 114 78.5 Singapore 131 60.2 Taiwan 163 13.8 Thailand 149 37.8 East Asia nine 1,296 46.1
*based on the 10% cut-off level of ultimate control Source: Carney and Child (2013, p.505)
politically connected firms obtain preferential access in getting loans from state-owned
banks. Also in Indonesia, the government often awarded business licenses and
preferential treatment to its crony such as the Salim Group and the Barito Group (Luez
and Oberholzer-Gee, 2006). The corporate governance problem becomes more serious,
when government officials or politicians are getting involved in business. Power and
authority they possess might be misused to their own interests, either for their political
career or their own business. Former Thai Prime Minister Thaksin Shinawatra was a
billionaire who owned the largest telecommunications company – Shin Corp. In 2011 the
Supreme Court seized his assets of USD1.4 billion that were accrued through corruption
and conflict of interest during his administration (BBC News, 2011).
Over a decade following the 1997 crisis, Malaysia, Indonesia and Thailand have
been working on improving corporate governance practices. They have made a
significant progress in the area of strengthening the legal framework. In 2000, Malaysia
amended its Company Act 1965, while in 2008 Thailand revised its Public Limited
Companies Act 1992 and Securities and Exchange Act 1992. For Indonesia, a new

Corporate Governance and Corruption
36
Company Law was introduced in 2007 including the revision of the corporate
governance code. All those efforts have resulted in a more comprehensive regulatory
framework, which guides corporate governance practices in those countries. However,
the performance of each country in achieving corporate governance score varies. Table
2.3 displays a comparison of Corporate Governance scores assessed by the Asian
Corporate Governance Association (2012) and the Asian Development Bank (2013). Both
surveys unveil the same results that Thailand always ranks the best position compared
to Malaysia and Indonesia.
Table 2.3 Corporate governance score
Both surveys use different methodologies in assessing the quality of corporate governance that cause a different result. While ACGA takes a survey based upon a mixed assessment between company’s self-assessment and analyst’s perception, ADB scores the CG performance which is assessed by each country’s independent body. The scores achieved by Indonesia are quite unsatisfactory because they are still below the mean total score of the region.
Country ACGA, 2012 ADB, 2013 Indonesia 37 43.4 Malaysia 55 62.3 Philippines 41 48.9 Singapore 69 56.1 Thailand 58 67.7 Vietnam n/a 33.1 Mean total score 46 53.7
Source: The Asian Corporate Governance Association (2012), The Asian Development Bank (2013)
The Asian Corporate Governance Association (ACGA) has undertaken a
biannual survey in collaboration with CLSA Asia-Pacific Markets (a leading investment
group) since 2000. The survey assesses the quality of corporate governance of 864 listed
companies across Asia-Pacific markets in six areas, i.e. CG rules and practices,
enforcement, political and regulatory environment, accounting and auditing, and CG
culture. The score ranges from 0 (lowest rank) to 100 (highest rank). Similar to the
ACGA which selects the country’s largest companies based on their market
capitalization, the Asian Development Bank (ADB) in cooperation with the ASEAN
Capital Markets Forum (ACFM) rank the corporate governance performance of top

Chapter 2
37
ASEAN publicly listed companies. The ASEAN CG Scorecard is developed to cover the
OECD CG principles, specifically the rights of shareholders (26 indicators), equitable
treatment of shareholders (17), role of stakeholders (21), disclosure and transparency
(42), and responsibilities of the board (79). Moreover, the scoring is balanced with the
bonus and penalty mechanism. Companies which demonstrate an exemplary practice
beyond the minimum standards will be rewarded a bonus, whereas companies with
poor practices will get a penalty.
2.4 Methodology
In order to better understand how corporate governance practices in Indonesia can be
improved, we conducted a comparative study with two Southeast Asian middle-income
countries, Malaysia and Thailand. We examined each country’s institutional framework
which consists of its corporate governance code, company law, rules and regulations,
and related institutions that support corporate governance practices.12 Malaysia and
Thailand were chosen to be relevant counterparts for three reasons. Firstly, they both
suffered with Indonesia from the aftermath of the 1997 South-East Asian crisis. Besides
macroeconomic factors which are considered to be leading causes of the crisis (Corsetti
et al. 1998; Kumar and Debroy 1999), weak governance practice is also considered a main
factor that deepened and prolonged the crisis (Lee 1999; Johnson et al. 2000, Haggard
2002). Since then, emerging Southeast Asian countries have taken measures with regard
to the corporate governance improvement. Recently, Malaysia and Thailand have shown
their commitment to maintain a higher standard of corporate governance institutional
framework, making them regional leaders in this respect (ROSC, 2012b, 2012c).
Secondly, in the last decade, Indonesia, Malaysia and Thailand are regarded as
the top three GDP contributors among ASEAN member states, leading them to be
promising investment destinations. The latest figure indicates that in 2010 their GDP
represented around 68% of total ASEAN GDP (ACIF 2011). These three countries are
12 The legal framework here refers to those issued until 31 December 2013.

Corporate Governance and Corruption
38
classified as middle-income economies13 . At the same time, although Malaysia and
Thailand have much in common with Indonesia, their legal system is different. Unlike
the Indonesian system, which relies predominantly on civil law, Malaysia as a former
British colony adopted the common law system. Thailand applies a civil legal system,
mixed with some common law elements (Kanchanapoomi 2005). These different
characteristics of legal systems may be helpful in explaining why there are some
variations in corporate governance frameworks and in the performance of companies in
meeting these standards.
2.5 Discussion and Analysis
2.5.1 Comparative corporate governance institutional framework
This section will present a comparison of corporate governance institutional
frameworks in Indonesia, Malaysia and Thailand. We specifically focus on the issues of
shareholders, board of directors, accounting and auditing and transparency. In doing
the analysis, it is important to stress that we assume that the enforcement of law is a
given factor. It means that we do not incorporate any sanctions that may influence the
effectiveness of the existing legislation. Table 2.4 shows the comparison of corporate
governance institutional frameworks for Indonesia, Malaysia and Thailand. The legal
frameworks that we refer to consists of the companies acts, the securities and exchange
acts, the stock exchange rules, and corporate governance codes. The most recent laws
governing limited-liability companies in Indonesia, Malaysia, and Thailand are the
Company Law No.40/ 2007, the Companies Act 2007, and the Public Limited Companies
Act No.3/ 2008 respectively. Every country has a capital market regulator, which is
responsible for governing, supervising and enforcing the securities regulations, i.e.
Bapepam LK or OJK for Indonesia, the Securities Commission for Malaysia, and the 13 The World Bank classifies the low/middle/high income economies based on their Gross National
Income per capita. For the year 2013, low-income economies are defined as countries with GNI per capita <= US$1,045; middle-income economies between US$1,046 and US$12,745; and high-income economies >= US$12,746 (https://datahelpdesk.worldbank.org/knowledgebase/articles/906519).

Chapter 2
39
Securities and Exchange Commission for Thailand. In addition, those three agencies also
have a responsibility to oversee the operationalisation of the country’s stock exchange.
All publicly listed companies must comply with the regulations and listing requirements
stipulated by the respective capital market regulator and the stock exchange agency.
While the structure of legal and regulatory framework pertaining to the securities
regulations among the three countries is similar, there is a difference with respect to the
establishment of the corporate governance code. The Malaysian Code on Corporate
Governance is set by the Securities Commission, while the Corporate Governance
Principles for Listed Companies in Thailand is stipulated by the Stock Exchange of
Thailand. In Indonesia, however, the National Committee on Governance is responsible
for establishing and updating the Code of Good Corporate Governance. Even though
the Code is regarded to be voluntary for companies, there is a gap with respect to the
compliance particularly for publicly listed companies. In Malaysia and Thailand, under
the stock exchange agency’s rules, listed companies are required to explain the extent of
their compliance with the code. Any non-compliance items should be clearly explained
by the company. Unfortunately, this practice is not applied yet in Indonesia. It means
that listed companies are not required to report their compliance with any provisions of
corporate governance.
2.5.2 Shareholder rights
One pivotal agency problem in South-East Asian companies is that key decision
making is mostly held by single-majority power of family shareholders. Minority or
outside shareholders have limited rights to participate in the decision making process or
to request an additional explanation from the management. Accordingly, the main
concern is how to encourage the monitoring role of outside shareholders including the
channels, which enable them to voice more strongly. All three countries have provided
mechanisms to conduct shareholders’ meeting. Companies should announce and send a
meeting notice to all shareholders within a reasonable period prior to the date of the
meeting. This will give a greater chance for shareholders to schedule and attend the

Corporate Governance and Corruption
40
meeting. However, prior notice itself does not guarantee that the shareholders’ rights
can be easily exercised. Even though proxy voting is allowed in the three countries, the
possibility of proposing an additional agenda item varies among them. For shareholders
in Malaysia it is much easier to place items on the shareholders’ meeting agenda,
because it only requires a minimum threshold of 5%. Indonesia shareholders only
require 10% of total voting rights; the Company Act of Thailand requires 1/3 of total
shared issued. To cope with this issue, in 2006 the Stock Exchange of Thai launched a
best practice guideline for companies to establish a written mechanism that enables
minority shareholders to propose agenda items in advance prior to the meeting.
Another crucial issue with regard to investor protection is regulations focused on
Related Party Transactions (RPT). Many studies have documented that typical
concentrated ownership in Asian market provides greater opportunities for controlling
shareholders (insiders) to expropriate minority shareholders (outsiders) (Claessens et al.
2002; Villalonga and Amit 2006; Juliarto et al. 2013). Abusive RPT, among others, is one
way of expropriation of outsiders that insiders can take, including the sales of the
insiders’ assets to another firm in the same group at below market prices and intra-loans
without sufficient guarantees. To curb the pervasiveness of RPT, several regulations are
needed to ensure that shareholder rights are protected from such transactions. We can
see from Table 2.4, section 2c, that according to the Corporate Governance Codes in the
three countries, any interested parties who have conflicts of interest should abstain from
decision making and voting on the RPT.
In addition, the country’s securities regulator (the Security Commission and the
Stock Exchange) requires a threshold for RPT which should be approved by
independent shareholders and/or board of directors/board of commissioners. For
example, in Indonesia any RPT that is deemed to have a conflict of interest and that has
a value of more than 0.5% of paid-in capital must be first approved by non-interested
shareholders. Malaysia and Thailand apply a threshold of 5% of net tangible assets and
3% of net tangible assets, respectively. However, Indonesia has no provision requiring
that RPT should be assessed by an independent appraiser or even a statement from the

Chapter 2
41
Board of Commissioners or the Audit Committee concerning the reasons to take such
transactions. This makes it much more difficult for investors in Indonesia to judge
whether the transactions are objective and beneficial or not. Hence, the likelihood of
doing abusive practices may be easier in Indonesia than in Malaysia and Thailand.
Lastly, the shareholder rights can be improved by the establishment of
organizations that facilitate investors to be more active. The presence of these investor
organizations can reduce the free-rider problem, particularly among outside
shareholders. It is more efficient if shareholders unite in one group in order to promote
shareholders’ activism. However, to become an effective organization it should be
supported by appropriate institutional framework. One of the most active organizations
is the Minority Shareholders Watchdog Group (MSWG) which is established by major
Malaysian institutional investor groups in 2000. The MSWG has conducted various
activities such as Annual General Meetings (AGM) and Extraordinary General Meetings
(EGM) monitoring, the Directors' Remuneration Survey, Corporate Governance Survey
and the Dividend Survey (MSWG’s website). In Thailand a similar organization is the
Thai Investor Association, which has actively conducted an assessment of the AGM in
collaboration with the Stock Exchange of Thailand (SET’s website). Unfortunately, even
though Indonesia has the Indonesian Society of Securities Investors (ISSI), it is quite
passive.14 Indeed, shareholder activism in Indonesia is not common. One reason may be
that the cost of court actions in Indonesia is higher than in other Asia-Pacific countries
(ROCS, 2010), which may lead shareholders to be reluctant to file a suit against the
company. Recent empirical research also shows that the level of shareholder protection
in Indonesia is lower than in Malaysia. Djankov et al. (2008) reveal that Indonesia’s and
Thailand’s shareholder protection index is 4, while for Malaysia it is 5 (out of 6).15
14 In an attempt to find information about the ISSI, we did not obtain the ISSI’s website and nor news
about its activities. 15 Djankov et al. (2008) have revised the previous measure of shareholder protection (formerly known
as the anti-director rights index) which was first introduced by La Porta et al. (1998), after getting a constructive critique from a legal scholar (Spamann 2009).

Corporate Governance and Corruption
42
Even though Indonesia has made some improvements in empowering the
shareholder rights, the effectiveness of protecting outside shareholders is still under
question. The controlling shareholders often take a decisive position. In general, once the
management and inside shareholders made decisions, the outside shareholders will
follow without opposing them. Since the shareholder rights in Indonesia tend to be
overlooked, their participation in monitoring the company is a challenging issue. This
situation will generate greater room for management to be opportunists, facilitate them
to take abusive actions, including bribery beyond the outsiders’ control.
2.5.3 Board of directors
The structure and competency of the board of directors (BoD) have been a
growing issue in corporate governance deliberations focusing on the effectiveness of
their duties. In Southeast Asia, it is widely known that controlling shareholders tend to
appoint insiders to become a CEO and a board member. The executives and board
members are typically trusted people elected from other companies in the same group.
They can be family members, relatives or bureaucrats. More seriously, if those persons
are less competent and have conflicts of interests, their capability to monitor thoroughly
is questionable. Therefore, the selection and remuneration process including the
composition of the BoD becomes essential to be considered as part of control
mechanisms.
Since Indonesia applies a two-tier board system, there is a separation between the
supervisory board (board of commissioners) and the executives. On the other hand,
Malaysia and Thailand have a one-tier board system following the Anglo-American
model, where a CEO is part of the board members. In the one-tier system, the CEO is
usually appointed as a chairman. In that case, there is a lack of monitoring mechanism
that may lead to abuse of power. To counter this, it is important to split the position of
chairman and CEO. Malaysia and Thailand have stipulated this issue through its
respective stock exchange regulations. However, in Malaysia it is required that the
chairman should be an independent person. This provision is not present in Indonesia

Chapter 2
43
nor Thailand (see Table 2.4, section 3d). Given that ownership structure is mostly family-
dominated, when a chairman position is not independent, it is prone to be chaired by
controlling shareholder family members. This phenomenon is quite common in
Indonesian companies.
Another concern of board independence relates to the termination of board
membership. A policy to limit the tenure of a person sitting as an independent director
is really debatable. But, it is a common governance practice in the world to limit top
public positions like presidential terms or parliamentary tenures. With respect to
independent directors, there is no consensus to what extent it is necessary to regulate
term limits. However, nowadays many countries have either recommended or
introduced term limits for directors. The rationale behind this regulation is that their
independence will be impaired with the passage of time. They tend to become more
cooperative with other board members and management, which in turn leads to less
effective control. In 2012, the Malaysian Code on CG started to stipulate that a person
can serve as an independent director for a maximum cumulative period of 9 years.
Other countries which also have set such a regulation are the UK, Singapore, Hongkong,
and France. In addition, other jurisdictions simply recommend or encourage this, such
as Thailand, Spain and the Netherlands. For Indonesia, there are no guidelines for
director tenures or even a maximum age, making it possible for firms to install directors
for their entire life.
In addition, scholars also pay attention to multiple directorships, i.e. a director
who sits on multiple boards. A growing literature shows that the monitoring role of
boards is relatively less effective if board members hold many directorships (Fich and
Shivdasani 2006; Core et al. 1999). Non-executive directors (commissioners) who are too
busy, may harm firm value as they do not have enough time to effectively monitor
management (Ferris et al. 2003). Table 2.4 section 3d shows that in this context, again
Malaysia leads by introducing a regulation that limits the number of directorships up to
5 (five). It brings Malaysia to set best practices of corporate governance like others such
as Singapore, the Netherlands and the UK. The Bursa Malaysia (Malay Stock Exchange)

Corporate Governance and Corruption
44
also requires a mandatory training and continuing education program for the BoD,
Thailand only strongly encourages this and Indonesia has no clear provision on it. In
sum, Malaysia supplies a stronger regulatory framework with respect to the
effectiveness of board monitoring roles, compared to Thailand and Indonesia.
It is safe to conclude that on average the quality of the Indonesian commissioners
is less strong which may have a detrimental effect on the effectiveness of the board in
terms of their monitoring and controlling role. Since the board members mostly are
linked to inside shareholders, their independent and critical opinions are in doubt. The
loose monitoring system may increase the management’s opportunity to take action that
is not in line with the interests of the minority shareholders. Thus, it is easier for
management to act and conceal illicit transactions for their own benefits. Hence, we can
say that a stronger corporate governance framework with regard to the quality of the
supervisory board will limit the likelihood of corrupt activities.
2.5.4 Accounting and auditing
Both Indonesia and Malaysia have fully adopted the International Financial
Reporting Standards (IFRS) since 1 January 2012. Thailand followed to converge with
the IFRS in 2013. Most countries in the world have fully adopted the international
accounting standards i.e. the IFRS as well as the International Auditing Standards (IAS).
The introduction of those standards in the three countries is still in the early stage. It
does not mean that there are no variations in practice, however. Yet, it is beyond our
analysis to investigate the gap between the accounting standards and its actual
implementation. The more interesting issue relates to the independence of the
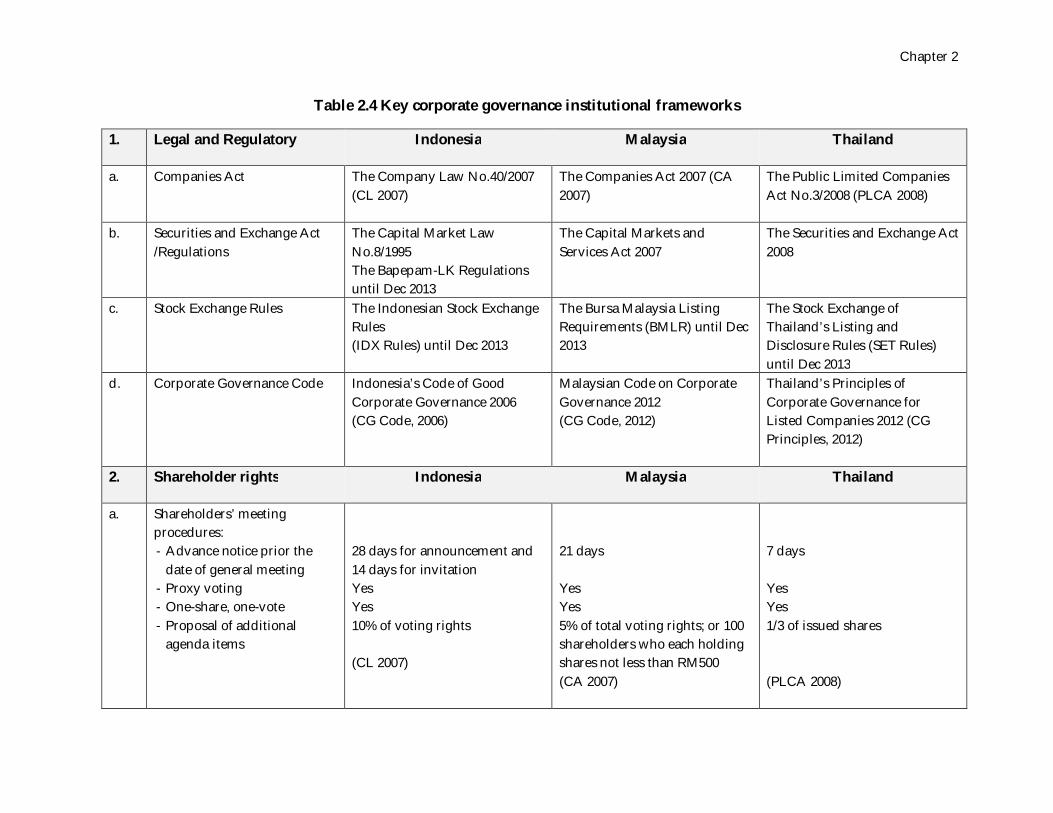
Chapter 2
Table 2.4 Key corporate governance institutional frameworks
1. Legal and Regulatory Indonesia Malaysia Thailand
a. Companies Act
The Company Law No.40/2007 (CL 2007)
The Companies Act 2007 (CA 2007)
The Public Limited Companies Act No.3/2008 (PLCA 2008)
b. Securities and Exchange Act /Regulations
The Capital Market Law No.8/1995 The Bapepam-LK Regulations until Dec 2013
The Capital Markets and Services Act 2007
The Securities and Exchange Act 2008
c. Stock Exchange Rules
The Indonesian Stock Exchange Rules (IDX Rules) until Dec 2013
The Bursa Malaysia Listing Requirements (BMLR) until Dec 2013
The Stock Exchange of Thailand’s Listing and Disclosure Rules (SET Rules) until Dec 2013
d. Corporate Governance Code
Indonesia’s Code of Good Corporate Governance 2006 (CG Code, 2006)
Malaysian Code on Corporate Governance 2012 (CG Code, 2012)
Thailand’s Principles of Corporate Governance for Listed Companies 2012 (CG Principles, 2012)
2. Shareholder rights Indonesia Malaysia Thailand
a. Shareholders’ meeting procedures: - Advance notice prior the
date of general meeting - Proxy voting - One-share, one-vote - Proposal of additional
agenda items
28 days for announcement and 14 days for invitation Yes Yes 10% of voting rights (CL 2007)
21 days Yes Yes 5% of total voting rights; or 100 shareholders who each holding shares not less than RM500 (CA 2007)
7 days Yes Yes 1/3 of issued shares (PLCA 2008)

Corporate Governance and Corruption
b. Minority and institutional shareholders participation
Indonesian Society of Securities Investors (relatively passive)
Minority Shareholders Watchdog Group (very active)
- Association of Investment Management Companies
- Thai Investor Association (very active)
c. Related party transactions: - Thresholds
- First approval
- Procedure
More than 0.5 % of paid-in capital (Bapepam-LK Regulations No. IX.E.1, 2008) By non-interested shareholders (Bapepam-LK Regulation No. IX.E.1, 2008) Any interested party having conflict of interest is prohibited to involved in discussions and decision making process (CG Code, 2006)
More than 5% of net tangible assets (BMLR Chapter 10, 2013) By non-interested shareholders (BMLR Chapter 10, 2013) Any interested party should withdraw their rights in decision making and voting session (BMLR Chapter 10, 2013)
More than 3% of net tangible assets (SET 22-01, 2003) By non-interested shareholders (SET 22-01, 2003) Any interested party should abstain in decision making and voting session (SET 22-01, 2003)
- Independent appraisal Only if it is deemed necessary by the Bapepam-LK (Bapepam-LK Regulation No. IX.E.1, 2008)
Yes, any related party transactions exceed the thresholds should be appraised by an independent appraiser (BMLR Chapter 10, 2013)
Specific transactions should be appraised by an independent appraiser (SET 22-01, 2003)
3. Board of Directors Indonesia Malaysia Thailand
a. Roles and responsibilities Clearly stated in the Company Law and CG Code
Clearly stated in the Companies Act and CG Code
Clearly stated in the Public Limited Companies Act and CG Principles
b. Component - Sufficient size (CG Code 2006) - Min. 30% of Board of Commissioners (BoC) must be independent (IDX Rule No.I-A, 2004)
- A balance of executives and non-executives (CG Code 2012) - At least 2 or 1/3 of BoD must be independent (BMLR Chapter 15, 2013)
- A balance of executives and non-executives (CG Principles 2012, SET Code of best practice, 1999) - Al least 3 or 1/3 of BoD must be independent (SET, 2008)

Chapter 2
c. Term limit of independence directors
No provision No more than a cumulative period of 9 years (CG Code 2012)
Encouraged to be limited in respective company’s policies (CG Principles, 2012)
d. Directorship Only for banking and financial institutions, max 2.
No more than 5 directorships in other listed companies (BMLR Chapter 15, 2013)
Encouraged to be limited, no more than 5 board of listed companies (CG Principles, 2012)
e. Separation of chairman and CEO
Yes, the nature of two-tier system (CG Code, 2006)
Yes, should be different persons (CG Code, 2012)
Strongly encouraged to be different persons (SET Code of best practice, 1999; CG Principles, 2012)
f. Position of chairman No provision Must be independent (CG Code 2012)
Strongly encouraged to be independent (SET Code of best practice, 1999; CG Principles 2012)
g. Education programs Not clearly regulated Mandatory training and continuing education programs (BMLR Chapter 15, 2013)
Strongly encouraged but not mandatory (CG Principles 2012)
h. Nomination and selection - Establishment of policies
and procedures
Nomination Committee (CG Code 2006) Not clearly regulated
Nomination Committee Should be formalized, as part of BoD duties (CG Code 2012, BMLR Chapter 15, 2013)
Nomination Committee Should be transparent (CG Principles 2012)
i. Remuneration - Establishment of policies
and procedures
Yes, proposed by the Remuneration Committee (CG Code, 2006)
Yes, proposed by the Remuneration Committee (CG Code, 2012)
Yes, proposed by the Remuneration Committee (CG Principles, 2012)
j. Conflicts of interest (CoI) A board member having CoI is not allowed to participate in discussions and decision making process (CG Code, 2006)
A board member having CoI (directly or indirectly) should not participate in voting and discussion (BMLR Chapter 10, 2013)
A board member having vested interests should not participate in decision making process (CG Principles, 2012)

Corporate Governance and Corruption
4. Accounting and Auditing Indonesia Malaysia Thailand
a. Full convergence to IFRS 1 Jan 2012
1 Jan 2012 2013
b. Term limit of independent auditors
Max. 3 years for public accountant partners, and 6 years for public accounting firms (Minister of Finance Regulation No.17/PMK.01/2008; ROSC, 2011)
No provision (ROSC, 2012a) Only requires a rotation of public accountant partners for every 5 years (not for accounting firms) (SEC News Release No.25/2005; ROSC, 2008)
c. Requirement of audit quality assurance
Yes (ROSC, 2011) Yes (ROSC, 2012a) Yes (ROSC, 2008)
d. Existence of auditor watchdog Auditor Oversight Committee (ROSC, 2011)
Audit Oversight Board (ROSC, 2012a)
Auditor Disciplinary Steering Group (ROSC, 2008)
5. Transparency and Disclosures
Indonesia Malaysia Thailand
a. CG Code and Principle Compliance
No specific provision for listed companies to report their compliance with CG Code (ROSC, 2010)
Listed companies should disclose their compliance or explain any non-compliance items (BMLR)
Listed companies should disclose their compliance or explain any non-compliance items (SET Rule)
b. Ownership structure Mandatory (Bapepam-LK Regulation No.VIII.G7, 2012)
Mandatory (BMLR) Mandatory (SET Rule)
c. BoD profile Mandatory (Bapepam-LK Regulation No.VIII.G7, 2012)
Mandatory (BMLR) Mandatory (SET Rule)
d. BoD nomination and selection Not clearly regulated
Mandatory (BMLR) Voluntary (CG Code, 2012)
e. Remuneration: Policies and procedures Values
Voluntary (CG Code, 2006) Voluntary (CG Code, 2006)
Mandatory (BMLR) Mandatory (BMLR)
Voluntary (CG Code, 2012) Mandatory (SET Rule)
f. Audit and non audit service fees
No provision (CG Code, 2006)
Mandatory (BMLR)
Mandatory (SET Rule)

Chapter 2
g. Conflicts of interest BoC shall make an annual statement that he/she has no CoI in any decisions he/she made, but not necessary to disclose in the annual report (CG Code, 2006)
BoD should disclose any conflict of interest in the annual report (BMLR)
BoD should avoid any CoI positions (SET Rule)
h. Code of Conduct Stated in CG Code, but no mandatory provision for companies to establish an ethical business conduct (CG Code, 2006)
Clearly stated in CG Code as part of BoD responsibility to formulize a company’s code of ethics (CG Code, 2012)
Clearly stated in CG Code as part of BoD responsibility to formulize a corporate’s code of conduct and code of ethics (CG Principles, 2012)
i. Whistleblowing Companies must develop a mechanism to accommodate whistleblower complaints (CG Code, 2006)
As part of the code of conduct (CG Code, 2012)
As part of the code of conduct (CG Principles, 2012)
Notes: to maintain a consistency in addressing specific issue, we utilize the following terms: No provision = there is no clause either under the CG code or laws and regulations explaining such issue. Not clearly regulated = only stated under the CG code but not governed by the laws and regulations.

Corporate Governance and Corruption
50
auditor. Similar to the case of independent directors, external auditors and auditing
firms should have a tenure restriction when serving their clients. Referring to Table 2.4
section 4b, Indonesia has stipulated a maximum period of 6 years for a public
accounting firm to be able to audit the same company, and 3 years for its partner
auditors. Thailand imposes this rule only for auditors (not for audit firms); Malaysia
until now does not have any provisions. The independence of independent auditors can
also be measured by their audit fees. There is a quite some literature which suggesting
that high audit fees paid by a company can intensify the economic bond between the
auditor and the client, leading to impair the auditor’s independence (Frankel et al. 2002;
Lin and Hwang 2010). When their independence is impaired, it may lead to a higher
possibility for the occurrence of earnings management, thus lowering the quality of
financial statements (Cahan et al. 2008; Larcker and Richardson 2004). Disclosure of
auditor’s fees in Indonesia does not take place, however, since there are no rules to
impose companies to do so.
Furthermore, the quality of accounting and auditing in Indonesia is increasingly
questionable pertaining to the low number of chartered accountants. Compared to
Malaysia and Thailand, the ratio of the Indonesian chartered accountants (CAs) to the
population is very low. For every 1 million inhabitants, Indonesia only has 71 CAs while
Malaysia and Thailand has 1,270 and 867 respectively (Asean Federation of Accountants
- AFA), 2013). Kimbro (2002) found that the number of accountants in a country has a
positive significant influence in reducing corruption level. Hence, Indonesia has several
challenges to improve its audit quality in the fight against corruption. Insufficient
number of qualified registered accountants, lack of resources in building a professional
accounting body, and inadequate capacity to ensure the quality of accounting and
auditing are some obstacles that lead to weakening the monitoring role. In conclusion,
Indonesia’s institutional framework in accounting and auditing is less strong than
Malaysia and Thailand, providing more room for corruption to exist.

Chapter 2
51
2.5.5 Transparency
Last but not least, transparency is a very essential tool to enhance corporate
discipline. A strong legal framework itself does not guarantee that companies follow the
rules. It should be enforced by mandatory disclosures, in which shareholders and the
public can scrutinize the company based on the information that the company declares.
Transparency and disclosure are considered as efficient and effective to enforce law.
International corporate governance code and best practice recommendations have
guided what items need to be disclosed, such as ownership structure, BoD profiles and
any other material information including the board selection process and remuneration
policies.
In terms of corporate code compliance, it should be noted that Indonesia does not
require listed companies to report their corporate governance practices. It means that
there is inadequate enforcement of law, since listed companies only adopt the code on a
voluntary basis without explaining any discrepancies. Crucial issues such as conflict of
interest, boards and executive remuneration, and auditor fees may thus not be reported
in the annual report. On the other hand, Malaysia and Thailand require mandatory
disclosure to what extent the companies comply with the corporate governance codes
and principles. If the company does not comply with any item of the codes, it should
explain the reason for the respective non-compliance item. Table 2.4 section 5, provides a
detailed comparison of the three countries related to the disclosure requirements.
While listed companies in the three countries are required to disclose audited
financial statements in the annual report, there is a variation regarding the regulations to
disclose non-financial information. As stipulated by the Malay securities commission
regulations, the members of the board of directors should disclose any conflicts of
interest they have. For example, when they engage in related party transactions, either
directly or indirectly (through their family members or relatives), and/or when they hold
other positions deemed to bear conflict of interest such as a position in the government
and political party, this should be reported. Such regulations are absent, both in
Indonesia and Thailand. However, in many areas Thailand has the same mandatory

Corporate Governance and Corruption
52
regulations as Malaysia to impose companies to declare information in the annual
report, including information about board remuneration, audit fees, and company code
of conduct. In addition, listed companies in Indonesia are not required to disclose the
board nomination and selection process, the policy to manage related party transactions
and the code of conduct.
On the basis of the aforementioned discussion, we can draw the conclusion that
on average, Malaysia has proven to be a leader of the three countries in the area of
transparency and disclosure, followed by Thailand. Indonesia mostly relies on the
voluntary based approach with respect to transparency and disclosure. This decreases
the company awareness of transparency. Lower levels of transparency make it easier for
companies to hide any material information that may involve abusive or non-arm’s
length transactions. This supports our conjecture that improved transparency will
reduce the probability of corruption.
2.6 Conclusions
As the economy is undergoing a process of decentralization, the role of the corporate
sector is more increasing, which results in the demand for improved corporate
governance. Competition and globalization impose companies to be more concerned
about the importance of corporate governance as this is particularly required by foreign
and institutional investors. Companies with better corporate governance perform better
and have a more positive market valuation (Klapper and Love 2004; Bhagat and Bolton
2008), allowing them to grow sustainably. The need of sound corporate governance is
essential to encourage a better investment climate, to improve a more efficient allocation
of economic resources, and to provide a reliable monitoring mechanism. It is believed
that corporate governance is not only directed to enhance shareholder value per se, but
also to foster economic growth (Mayer 2012; Tiwari 2010).
Furthermore, the implementation of sound corporate governance is more
meaningful in countries perceived as highly corrupt like Indonesia. Although
Indonesia’s level of corruption has reduced in the last decade, its achievement is still

Chapter 2
53
below the ranking of other middle-income countries in South-East Asia (World Bank
2013, the World Governance Indicator). A similar pattern applies for the performance of
corporate governance in which Indonesia’s score is not satisfactory enough compared to
Malaysia’s and Thailand’s (ACGA 2012, ADB 2013).
We focused on institutional framework to provide evidence that a stronger
institutional framework of corporate governance helps to decrease the likelihood of
corruption. Specifically, we utilized agency theory to shed light on the link between
corporate governance and corruption. It stems from the asymmetric information
problem that makes it hard for shareholders and the public to access the company’s
information. Managers and insiders are able to mask their bribery activities by reporting
false information to the public. The opportunistic behaviour of bribery can be reduced
by establishing corporate governance best practices that aim at reducing such behaviour.
These best practices focus on monitoring decision making by managers and ensuring
that business operations are operated with a high standard of integrity.
In this study, we compared the corporate governance institutional framework of
three South-East Asia countries, i.e. Indonesia, Malaysia, and Thailand. We found that
Malaysia has the strongest institutional framework with respect to shareholder rights,
the quality of the board of directors, accounting auditing, and transparency standards,
which in turn leads to a tightened monitoring system. When monitoring is well
developed, the opportunity for bribery and corruption can be curbed. It may explain
why Malaysia has a relatively lower level of corruption. On the other hand, Indonesia’s
institutional framework is less stringent compared to Malaysia and Thailand.
Some crucial issues that should be highlighted here include related party
transactions, shareholder activism, and the quality of the board of directors. The
Indonesian corporate governance framework mostly is voluntary based. This approach
may not provide sufficient conditions for companies to adopt corporate governance best
practices. Moreover, transparency is another challenging issue in Indonesia. Hence, the
probability of corruption is larger because companies can easily conceal the illicit
transactions without having to be worried. Our results suggest that Indonesia needs to

Corporate Governance and Corruption
54
improve its institutional framework of corporate governance to be in line with
international best practices.
Lastly, this study does not incorporate the enforcement of law as part of the
analysis. A strong legal framework does not necessarily imply a commitment to apply if
there is a lack of enforcement by state actors and regulatory bodies. Enforcing the laws
and regulations, however, is also another big concern in Indonesia. Future research may
focus on establishing whether there is a gap between the existing regulations and actual
implementation.

Chapter 3
55
Chapter 3 Fraud Risk Assessments and External
Auditors’ Perceptions16
Abstract
This research investigates the determinants of auditors’ decision making in fraud risk assessments. The data are based on a survey of 435 Indonesian external auditors conducted in 2015. Utilizing structural equation modelling we find that fraud risk factors, materiality judgments, and professional scepticism significantly influence fraud risk assessments. Materiality affects fraud risk assessments indirectly; professional scepticism acts as a mediating variable between materiality and fraud risk assessments. We also show that auditors’ materiality judgments significantly influence their perceptions of litigation risk, implying that litigation risk is lower when auditors perceive a misstatement as less material. Reducing materiality thresholds (i.e., becoming more conservative) increases auditors’ sceptical behaviour, leading to an increase in fraud risk assessments. Keywords: fraud risk assessments, external auditors, structural equation modelling
16 An earlier version of the chapter was presented at the Forensic Accounting Section Midyear
Conference, the American Accounting Association, Orlando, 24-25 February 2017. The chapter is co-authored with Niels Hermes. I am very grateful to Professor Sidharta Utama for the valuable comments on this paper, and Mr. Agung N. Soedibyo for reviewing the questionnaire material.

Fraud Risk Assessments and External Auditors’ Perceptions
56
3.1 Introduction
The prominent financial scandals of recent decades, such as those involving Enron in
2001, Tyco International in 2002, Olympus in 2011–2012, Tesco in 2014, and Toshiba in
2015 (Guardian, 2015), have led to an increased focus among academic scholars,
practitioners, and policy makers on the determinants of fraudulent financial statements.
Some studies blame external auditors for not detecting and preventing these fraud cases,
though the role of external auditors in evaluating fraud risks has become increasingly
challenging. In the past decade, auditing standards have promoted the implementation
of a risk-based audit approach, which emphasizes identifying and assessing risks during
an audit of financial statements (Robson et al., 2007; Blay et al., 2008).
Several studies have investigated auditors’ characteristics to determine how they
may assess fraud risk. For example, Carpenter and Reimer (2013) find that professional
scepticism is a crucial factor for auditors when assessing fraud risk. Others show that the
presence of fraud risk factors (i.e., red flags) may also be important (Apostolou et al.,
2001; Asare and Wright, 2004; Wilks and Zimbelman, 2004). Furthermore, Hammersley’s
(2011) model of fraud assessment suggests that an auditor’s ability to assess fraud risks
is affected by certain auditor characteristics (e.g., experience, capability) and the types of
fraud risk factors present. Auditors have responsibility to assess the accuracy of
financial statements, the likelihood of fraud, and the compliance of corporations with
legal obligations (European Union, 1996; Chui and Pike, 2013). Therefore, external
auditors are the appropriate people to determine the extent to which fraudulent
transactions occur.
Such considerations are especially relevant in certain sectors and societies. For
example, the Indonesian business sector has experienced fraudulent and corrupt
practices, for purposes such as getting easier access to resources, lowering penalties,
reducing costs (i.e., taxes), and speeding up transactions. A survey conducted by Ernst &
Young (EY) in 2013 reported that 79% of respondents, consisting of executives, senior
managers, and employees, agreed with the statement that: “…corrupt practices happen

Chapter 3
57
widely in Indonesia.” The general standard of business practices in Indonesia leads
employees recording suspicious transactions in their financial statements, reducing the
quality of these statements. Bhattacharya et al. (2003) report that Indonesia has the
lowest earnings opacity indicator. In addition, in the Milken Institute’s (2009) ranking of
the opacity index of 48 countries—based on assessments of corruption, legal system
inadequacies, economic enforcement policies, accounting standards and corporate
governance, and regulation—Indonesia ranked 35th. A higher score implies greater
opacity, which in turn indicates more corruption, a weaker legal system, and less
transparency.
Researching the quality of audits in Indonesia is relevant for two reasons. First,
Indonesia has insufficient professional accountants. Although a large number of
accountants have obtained a bachelor’s degree in accounting, only a small percentage of
them become certified professional accountants. With approximately 35,000 graduates
per year (AFA, 2014), and 53,500 registered accountants 17 (IAI, 2014), the total
cumulative number of accountants in Indonesia in July 2013 was estimated at 400,000.18
Of those, 20,735 hold the Indonesian certified accountant designation. This number,
relative to total population, is much lower than in Malaysia or Thailand (AFA, 2014).
Furthermore, as of December 2014, Indonesia only reported 1,053 licensed Certified
Public Accountants (CPAs) and 388 audit firms (Finance Professions Supervisory
Center, Pusat Pembinaan Profesi Keuangan, 2015). Vietnam and the Philippines, with
populations of 90 million and 100 million, respectively, have 1,350 and 21,500 CPAs
(AFA, 2014). In addition, 57% of Indonesian CPAs are over 50 years of age (606 of 1,053).
17 Starting in 2004, a graduate in accounting is encouraged to take a one-year professional accounting
course to obtain a professional accountant degree. Not all graduates take the professional course. Accounting graduates are required to pass the certification exams to obtain a certified accountant designation. There are three kinds of certification i.e.,: Certified Public Accountant (CPA), Chartered Accountant (CA), and Certified Professional Management Accountant (CPMA).
18 The exact number of accounting graduates is not well documented; this number is a rough estimation for the last decade.

Fraud Risk Assessments and External Auditors’ Perceptions
58
Second, because the number of CPAs in Indonesia is deficient, the quality of
audits might be questioned. Indonesia has been identified as having a weak institutional
setting, with less sound corporate governance. This may have important consequences
for the quality of financial statements (Report on the Observance of Standards and
Codes Corporate Governance – ROSC, 2010). Auditors have an important role in
generating qualified financial statements and improving accountability. Although
several laws and regulations have been introduced, their effective implementation
remains a concern. According to ROSC Accounting and Auditing (2011, 2018), auditing
firms in Indonesia have insufficient capacity when conducting financial statement
audits. Specifically, they generate insufficient audit planning, are less sceptical of fraud
and misstatements, and are less critical of management assertion.
This study considers how materiality judgments and professional scepticism
influence fraud risk assessments. In particular, we suggest and empirically analyse the
following relationships. Materiality affects fraud risk assessment through professional
scepticism and litigation risk, suggesting that these factors act as mediators. Reduced
materiality thresholds should increase sceptical behaviour and lead to heightened fraud
risk assessments. The perception of litigation risk is influenced by an auditor’s
materiality judgment, implying that the litigation risk is lower when the auditor
perceives that the misstatement is less material.
The remainder of the paper is organized as follows. Section 3.2 deals with the
discussion of the relevant literature. Section 3.3 derives our hypotheses. Section 3.4
continues by discussing the data collection and the empirical methodology employed.
Section 3.5 reports the results of the empirical analysis. Section 3.6 draws conclusions
and suggests for future research.

Chapter 3
59
3.2 Literature Review
3.2.1 The fraud risk assessment model: an overview
Hammersley (2011) developed a model of auditor judgments for assessing fraud
risk. She argues that an auditor’s characteristics and fraud risk factor characteristics
influence his or her ability to assess fraud risk and modify the audit program. In her
model, auditor characteristics are represented by knowledge. In particular, knowledge
that is gained from experience, capability, and motivation are crucial factors for
auditors’ judgments of fraud risks. Moreover, the presence of fraud risk factors leads
auditors to effectively assess fraud risks. To investigate the factors that affect fraud risk
assessments, we extend the model developed by Hammersley (2011) by adding three
variables of interest: materiality judgment, professional scepticism, and litigation risk. In
addition, we consider several auditor characteristics (i.e., certification, experience, and
audit firm size) that may also affect auditors’ performance in assessing fraud risks.
Figure 3.1 depicts our fraud risk assessment model. It predicts that the
assessment of fraud risks by auditors is influenced by four latent variables and three
control variables. Auditors consider several factors when assessing the level of fraud
risk, such as the availability of fraud risk factors (Pincus, 1989; Asare and Wright, 2004),
materiality judgments (Tuttle et al., 2002), professional scepticism (Nelson, 2009;
Carpenter and Reimers, 2013), and litigation risk (Arnold et al., 2001). In addition to the
direct effect of the four latent variables on fraud risk assessment, we add to this model
the relationships between materiality judgments and professional scepticism (Wright
and Wright, 1997; Braun, 2001; Ng and Tan, 2007; Legoria et al., 2013), as well as between
materiality judgments and litigation risk (Arnold et al., 2001; Zabel and Benjamin, 2002;
Cox et al., 2014). Before going into the details of these relationships, we first shortly
define the main concepts in the model.

Fraud Risk Assessments and External Auditors’ Perceptions
60
Figure 3.1 Fraud risk assessment model
3.2.2 Fraud risk assessments
Fraud risk assessments involve processes of proactively identifying and
addressing an organisation’s vulnerabilities to fraud (ACFE, 2016). To assess fraud risks,
auditors must obtain information from the organization, such as the nature of the
business, its environment, and its internal controls. The process of generating fraud risk
assessments can be performed individually or as a group. However, current auditing
standards require a discussion with the engagement team to help auditors determine the
likelihood that misstatements are fraudulent (Carpenter, 2007; ISA 315, 2009, paragraph
10; ISA 24019 , 2009, paragraph 15). To determine this likelihood, auditors establish
whether the fraud risk is low, medium, or high.
19 The Indonesian Institute of Certified Public Accountants introduced the Standar Auditing (SA
No.240), which is substantially in line with the ISA 240 with regard to auditor’s responsibilities relating to fraud in an audit of financial statements. SA No.240 was instituted on January 1, 2013.
Certification
Professional Scepticism
Materiality Judgment
Fraud Risk Factors
Fraud Risk Assessments Experience
Audit firm size
Litigation Risk

Chapter 3
61
3.2.3 Fraud risk factors
Many previous studies of fraud suggest that auditors rely on indicators to detect
the likelihood of fraud. These indicators – also known as fraud risk factors or red flags 20
alert auditors to the risk of possible fraud. The ISA 240 (2009, paragraph 11a) defines
fraud risk factors as “…events or conditions that indicate an incentive or pressure to
commit fraud or to provide an opportunity to commit fraud.” It also classifies fraud risk
factors based on the so-called fraud triangle concept, which includes incentives or
pressures, perceived opportunities, and attitudes or rationalizations. Several examples
of events or conditions are provided, such as the nature of the industry with significant
related party transactions (i.e., opportunity), intense competition that causes a
significant decline in profits (i.e., pressure), or management with low integrity (i.e.,
attitude). The availability of these fraud risk factors helps auditors identify potential
fraud, though it does not guarantee that fraud is present. General fraud risk factor
checklists are widely used as a method of detecting fraud (Pincus, 1989; Asare and
Wright, 2004).
3.2.4 Materiality judgment
In accounting, materiality is a crucial concept in any decision-making task. On
materiality, the International Standard on Auditing (ISA 320, 2009, paragraph 2) states,
“…the omission or misstatement of an issue is considered material if, due to size or
nature, it could influence the decisions that users make in the basis of the financial
statements.” Because materiality is a relative concept, an auditor cannot determine a set
amount that is universally considered material. Instead, professional judgment plays a
fundamental role in determining whether the detected misstatements are material.
Because it is a matter of judgment, the term materiality judgment is used.
20 In addition to fraud risk factors, researchers use the term red flags to describe cues or specific
circumstances that signal the likelihood of fraud incidence.

Fraud Risk Assessments and External Auditors’ Perceptions
62
Throughout the auditing process, an auditor considers the concept of materiality.
Auditors are required to adjust, disclose, or restate the amount they consider material. If
they fail to adjust material misstatements, it might lead to inaccurate decision-making by
those who make use of the financial statements. Current auditing standards require
auditors to report material concerns (ISA 240, 2009); therefore, external auditors are
responsible for any fraudulent material misstatements (ISA 240, 2009, paragraph 5, 10).
Singleton and Singleton (2007) argue that there are two reasons why it is hard to
detect fraud. First, the main purpose of financial audits is to detect material
misstatements. Because fraud mostly occurs below the materiality threshold set by the
auditor, normal auditing procedures cannot detect immaterial fraudulent activity.
Second, financial fraud is difficult to detect because it is typically committed by
managers, who seek to conceal it. Auditors face a dilemma of inferring materiality and
determining whether a misstatement will affect the decisions of financial statement
users (Tuttle et al., 2002). Therefore, it is reasonable if auditors ignore small or
immaterial misstatements. The quantitative materiality is typically a percentage of a
specific value in the financial statement such as revenue or assets. For example, 1% of
$10,000 in revenue is equal to $100; this $100 or 1% would be considered the materiality
threshold. Therefore, any misstatements less than $100 would be regarded as
immaterial.
However, materiality encompasses both quantitative and qualitative aspects. If
an auditor finds a misstatement amounting to $50 involving a senior manager who
made a fictitious invoice, the auditor still can deem the misstatement as material.
Therefore, regardless of the amount of the materiality, an auditor should be concerned if
he or she believes that the misstatement is fraudulent and involves management (ISA
240, 2009, paragraph 36 and A52; Vorhies, 2005; Vona, 2008, p.64). Relying on materiality
judgments (i.e., quantitative and qualitative), the auditor should re-evaluate assessments
of the fraud risks and consider modifying auditing procedures in response to the
assessed risks (ISA 240, 2009, paragraph 36). The auditor should take additional steps to

Chapter 3
63
investigate his or her initial findings of potential fraud (e.g., extending audit samples,
inquiries).
3.2.5 Professional scepticism
Current literature describes two viewpoints on professional scepticism: neutrality
and presumptive doubt (Nelson, 2009). Nelson (2009) argues that neutrality is a
condition in which the auditor insists on collecting and evaluating evidence without
assuming that management’s assertion is dishonest or biased ex ante (p.3). Hurtt (2010,
p.151) defines professional scepticism as a multidimensional construct that characterises
the propensity of a person to deter drawing conclusions until the evidence provides
sufficient support for one explanation over others. Nelson (2009) explains professional
scepticism as the tendency to be unbiased and accurate during risk assessments.
Presumptive doubt assumes that management’s assertion is biased or untruthful
(Shaub and Lawrence, 1996; Bell et al., 2005). Nelson (2009) defines a sceptic as a person
whose behaviour is more inclined to doubt the validity of all assertions. For auditors, it
would include a heightened assessment of risk and requirements of more convincing
evidence before concluding that management’s assertions are correct. Nelson (2009)
further argues that the essence of auditing is to test the assertions that the financial
statements are free of material misstatements (p.4). If the auditor believes that a
document might be inauthentic or have been modified without disclosure, he or she
should investigate further (ISA 240, 2009, paragraph 13; ISA 200, 2009, paragraph A21).
Although neutrality and presumptive doubt seem to be two opposite viewpoints on
professional scepticism, both have the same implications for the auditor’s responsibility
to find additional evidence when assessing potential fraud risks.

Fraud Risk Assessments and External Auditors’ Perceptions
64
3.2.6 Litigation risk
External auditors are responsible for detecting misstatements in a client’s
financial statements. In the event of an audit failure, auditors can be sued (Palmrose,
1988) if they did not detect misstatements in the financial statements (Carcello and
Palmrose, 1994; Bonner et al., 1998). The results imply that litigation risk is closely
related to auditing quality. When the litigation environment is strong, auditors have
more incentive to produce a higher quality audit (Venkataraman et al., 2008) because a
lawsuit constitutes a reputational risk for the auditor (Seetharaman et al., 2002; Khurana
and Raman, 2004; DeFond and Francis, 2005).
The level of litigation risk varies among countries. For example, Seetharaman et
al. (2002) find that United Kingdom (UK) firms cross-listed in capital markets in the
United States (US) charge higher audit fees than non-US capital markets. In their cross-
country study, Choi et al. (2009) confirm that auditors charge higher auditing fees for
firms that are cross-listed internationally in stronger legal regimes. The higher audit fees
suggest that auditors consider differences in litigation risk across jurisdictions.
Furthermore, research shows that individual perceptions of litigation risk are influenced
by other factors, such as gender (Harrant and Vaillant, 2008; Croson and Gneezy, 2009),
firm size (Basu et al., 2001; Francis and Wang, 2008), and client characteristics (Pratt and
Stice, 1994; Shu, 2000; Sun and Liu, 2011).
3.3 Hypothesis Development
3.3.1 Fraud risk factors and fraud risk assessment
Identifying fraud risk factors is the initial step required to perform a risk
assessment. Audit firms typically have a checklist or questionnaire to identify and
evaluate the presence of fraud risk factors. The auditing literature has identified several
fraud risk factors to help auditors assess fraud risks (e.g., Albrecht et al., 1985; Asare and
Wright, 2004; Mock and Turner, 2005; Carpenter, 2007; Moyes, 2008; Carpenter and
Reimers, 2013; Johnson et al., 2013). The fraud triangle framework (i.e., pressure,

Chapter 3
65
opportunity, and rationalization) is a widely used framework to identify fraud risk
factors and assess fraud risk (ISA 240, 2009).
Many studies provide empirical evidence about the importance of fraud risk
factors. Loebbecke et al. (1989) show that the most important red flags identified by
external auditors are when management decision-making is dominated by a single
person, poor profitability is reported, and the focus of management is on meeting
earnings expectations. The attitude of management, such as a lack of integrity and low
moral character, are also important factors that increase fraud risk (Albrecht and
Romney, 1986; Heiman-Hoffman et al., 1996). A survey of external auditors by Moyes
(2008) reveals that risk factors related to rationalization are perceived as more effective
in detecting fraud than those related to opportunity or pressure.
Although studies attribute various levels of importance to different fraud risk
factors, researchers and auditors agree that identifying the presence of fraud risk factors
is crucial to the risk assessment process. Hammersley (2011) argues that the presence of
fraud risk factors influences an auditor’s ability to assess fraud risks. Bell and Carcello
(2000) report that the identification of fraud risk factors affects the performance of
auditors during fraud risk assessments. Carpenter et al. (2002), and Wilks and
Zimbelman (2004) find that the use of fraud risk factors affects auditors’ assessment of
fraud risks. Furthermore, Boyle et al. (2015) examine the effect of different types of fraud
risk factors on fraud risk assessments and report that the evaluation of fraud risk factors
is positively correlated with fraud risk assessment. As auditors rely on fraud risk factors
to assess the level of fraud risk, we derive the following expectation:
H1: Fraud risk factors are positively associated with the level of fraud risk assessments.
3.3.2 Materiality judgment and fraud risk assessment
Research on materiality often focuses on how auditors use their judgment to
assess materiality (Messier et al., 2005; Acito et al., 2009; Kristensen, 2015). However, few
studies have investigated the effect of materiality judgments on fraud risk assessment.

Fraud Risk Assessments and External Auditors’ Perceptions
66
Bernardi and Pincus (1996) examine the relationship between auditor materiality
judgments and fraud risk assessments; yet, their findings are not significant. Auditors
usually make materiality judgments based on a materiality threshold. Icerman and
Hillison (1991) find that auditors’ decision to record or skip misstatements is influenced
by a materiality threshold. Wright and Wright (1997) and Braun (2001) report that
auditors rely on a materiality calculation when deciding whether to book detected
misstatements, implying that they may ignore immaterial misstatements. This is
corroborated by Nelson et al. (2005) who demonstrate that auditors use materiality
judgments to document material misstatements and ignore immaterial misstatements.
Materiality judgments thus are crucial for assessing the risk of misstatements
(Vorhies, 2005). When auditors judge a misstatement as fraudulent and thus material,
they tend to assign a higher fraud risk; when they consider a misstatement immaterial,
the fraud risk is lower. This means that the higher the materiality judgment, the higher
the assessed risk. Thus, we hypothesise:
H2: Materiality judgments are positively associated with fraud risk assessments.
3.3.3 Professional scepticism and fraud risk assessment
A lack of professional scepticism causes auditors to overlook material
misstatements (Beasley et al., 2001). Some argue that increased professional scepticism
would improve audit quality by, for example, increasing the likelihood of detecting
fraud (Nelson, 2009; Carpenter and Reimers, 2013) or decreasing the frequency of
earnings management (Chen et al., 2012). Payne and Ramsay (2005) find that auditors
tend to be less sceptical when fraud risk assessments have been lower. Boyle et al. (2015)
also find a significant negative link between professional scepticism and fraud risk
assessments. Maintaining professional scepticism is the primary task for auditors in all
circumstances, including fraud. Thus, professional scepticism plays an important role in
determining the level of fraud risk assessments. Therefore, we hypothesise:

Chapter 3
67
H3: Higher levels of professional scepticism have a positive effect on fraud risk
assessments.
3.3.4 Litigation risk and fraud risk assessment
Prior research suggests that auditing quality is linked to the level of litigation risk
faced by auditors (Khurana and Raman, 2004; Francis and Wang, 2008; Venkataraman et
al., 2008). Auditors are subject to litigation and reputational penalties if they produce
low-quality audits (Palmrose, 1988; Heninger, 2001). According to Krishnan and
Krishnan (1996), auditors face the possibility of litigation and reputational loss if they
misreport audit opinions. Bloomfield (1997) finds that fraud risk assessments are higher
when auditors face high legal liability penalties for audit failures, implying that auditors
consider the litigation risk factor during their fraud risk assessments.
Many fraud litigation cases name the auditor as a defendant (Fuerman, 2000;
Demirkan and Fuerman, 2014). The likelihood of being sued makes auditors more
prudent when assessing fraud risks. A survey by Hwang and Chang (2010) of auditors
in the US and Hong Kong indicates that auditors who practice in more litigious
jurisdictions (US) tend to reject clients’ aggressive reporting more than auditors in less
litigious jurisdictions (Hong Kong). Thus, litigation risk is an important factor for
auditors when assessing the risk of misstatements in a client’s financial statement. That
is, when auditors’ perception of litigation risk is high, they will assess fraud risks more
carefully. Therefore, we hypothesise:
H4: Litigation risk has a positive effect on fraud risk assessments.
3.3.5 Certification and fraud risk assessment
To obtain the Certified Public Accountant (CPA) certification, an auditor must
pass the exams administered by a national accounting professional association such as
the American Institute of Certified Public Accountants (AICPA), Institute of Chartered
Accountants in England and Wales (ICAEW), or Japanese Institute of Certified Public

Fraud Risk Assessments and External Auditors’ Perceptions
68
Accountants (JICPA). To maintain their designation, CPAs must develop and maintain
competency through a minimum number of continuing professional education (CPE)
modules each year. The CPE modules cover a variety of topics, including core
knowledge in auditing and accounting and soft skills (e.g., ethics, fraud detection skills,
critical thinking skills). Because CPA auditors are perceived to be of a higher quality
than non-certified auditors, we derive the following hypothesis:
H5: Holding a professional (either CPA or CA) certification has a positive effect on the
quality of fraud risk assessments.
3.3.6 Experience and fraud risk assessment
Psychological research has examined the positive effect of job experience on
individual performance (e.g., Earley et al., 1990; Glaser and Chi, 1988 in Libby and
Frederick 1990). Auditing tasks are generally related to the capability of auditors to
detect financial statement errors and misstatements. Libby and Frederick (1990) argue
that the likelihood of detecting financial statement errors improves as auditors gain
more experience. Ye et al. (2014) find that auditors in China with more auditing
experience are less likely to be associated with audit failure (i.e., sanctions), suggesting
that experience improves audit quality. A similar result by Francis and Yu (2009) shows
that more experienced auditors are more likely to ask clients to correct their financial
statements. Thus, experience leads to better auditing judgment and an increased
likelihood that auditors will detect errors and irregularities in financial statements.
However, auditing experience may also deflate the level of fraud risk assessment
(Hammersley et al., 2011). Fraud is difficult to detect (Pincus, 1989; Braun, 2000; Knapp
and Knapp, 2001). Loebbecke et al. (1989) find that the examples of fraud being detected
by auditing partners (e.g. more experienced auditors) are low. In addition, Montgomery
et al. (2002) and Pany and Whittington (2001) find that most auditors have never
experienced fraud during their careers. They are accustomed to auditing without fraud
and gain experience presuming non-error in their audit findings (Earley, 2001).

Chapter 3
69
The above discussion makes clear that the evidence on the relationship between
experience and fraud risk assessments is mixed. This leads us to the following
hypothesis:
H6: Experienced auditors may tend to either increase or lower their risk judgment of
fraud.
3.3.7 Audit firm size and fraud risk assessment
Audit firm size may affect the quality of audits. Research demonstrates that the
Big-4 audit firms (i.e., Deloitte, EY, KPMG, and PricewaterhouseCoopers) provide
higher quality audits than non-Big-4 audit firms (e.g., Raman and Wilson, 1994;
Krishnan and Schauer, 2000; Francis and Yu, 2009; Lawrence et al., 2011; Abughazaleh et
al., 2015), because they would like to maintain their good reputation (Simunic and Stein,
1996). In addition, larger audit firms have access to more resources (De Angelo, 1981;
Palmrose, 1986). Reputable audit firms are expected to have more expertise and higher
motivation, leading to lower rates of earnings management (Becker et al., 1998; Basu et
al., 2001; Francis and Wang, 2008; Sanjaya, 2008), detection errors (DeFond and
Jiambalvo, 1991; Bigus, 2015), and fraud (Ansah et al., 2002; Lennox and Pittman, 2010).
Based on these considerations we derive the following hypothesis:
H7: Audit firm size is positively associated with fraud risk assessment.
3.4 Methodology
This study adopts the Hammersley (2011) model to examine the factors that influence
external auditors’ fraud risk assessments. We make two important extensions to this
model. First, we add several factors suggested by previous studies, such as a
professional scepticism assessment (Payne and Ramsay, 2005; Carpenter and Reimers,
2013; Boyle et al., 2015), materiality (Wright and Wright, 1997; Singleton and Singleton,

Fraud Risk Assessments and External Auditors’ Perceptions
70
2007), and litigation risk (Bloomfield, 1997; Heninger, 2001). Second, we apply an
integrated fraud risk assessment model, which means that we are not only interested in
the direct relationship between various factors and fraud risk assessment, but also take
into account the relationships across factors. To perform such an integrated approach,
we use structural equation modelling (SEM), which can simultaneously estimate the
interrelatedness between factors, as well as the direct relationship between different
factors and fraud risk assessment (Sitorus and Scott, 2009).
3.4.1 Questionnaire
To answer our research questions, we surveyed external (independent) auditors
with a minimum of 6 months’ work experience. We developed a vignette case study for
this survey, as commonly employed in social sciences research. It describes a
hypothetical phenomenon that reflects a real-life context or problem. For this study, our
vignette case was inspired by the story of Sentul City (the Jakarta Post, 2014), reflecting a
bribery case in the property and real estate industry. Companies in this industry have a
relatively high probability to engage in bribery: the industry features the highest
prevalence of political connections in Indonesia (Wijayati et al., 2016).21 Cases such as
Adhi Karya (Tempo, 2013), Sentul City (the Jakarta Post, 2014), and Agung Podomoro
(the Jakarta Post, 2014; Reuters, 2016) are examples of recent bribery scandals, involving
Indonesian property companies. In the case of Sentul City, a property and real estate
company, through its affiliated firm, created a slush fund to gain a recommendation for
21 Before developing this survey instrument, two face-to-face interviews with three audit partners
were conducted on February 18 and February 25, 2015. All three partners agreed that property, real estate, and construction (next to mining) are closely related to bribery practices, especially with regard to land conversion and building permits. In addition, they noted that bribery practices are prevalent when companies deal with the tax authority. Companies in Indonesia usually rely on a third party (e.g., tax consultant, legal consultant) as a mediator to negotiate any extra costs.

Chapter 3
71
the issuance of a land conversion permit. The vignette case was designed to take 15–20
minutes to complete.22
The survey instrument consists of four sections: (1) a cover letter describing the
purpose of the survey and an anonymity promise; (2) demographic data of the
respondents; (3) case material; and (4) the respondent’s response to the case. After
completing the demographic data, the respondents had to read the short case, describing
an audit manager assigned to perform a financial statement audit of the fiscal year 2014
on a property company named PT Co Tbk (hereafter “the Company”). The case
description includes a suspicious transaction that is assumed to be immaterial compared
with the Company’s inventory value (i.e., .5% of the total inventory value). The
transaction was recorded as consulting fees as part of the land acquisition costs.
Regarding the land conversion process, the Company had transferred the funds to one
of its affiliated companies that were assigned to administer the land permit.23
On the basis of their reading, respondents rated their level of agreement with
nine statements on a seven-point Likert scale, from strongly disagree (1) to strongly
agree (7). The case material is listed in Appendix 3.1.
3.4.2 Fraud risk factors evaluation
Several fraud risk factors were implicitly incorporated into the case material and
translated into three statements. In the case material, we do not tell the respondents that
the three statements are fraud risk factors. The statements are cues provided to the
auditors to evaluate and judge. The fraud risk factors in this case are based on the fraud
triangle concept used in previous studies (e.g., Asare and Wright, 2004; Mock and
Turner, 2005; Moyes, 2008; Johnson et al., 2013).
22 We chose to develop a relatively short survey. According to the literature, the length of the survey
might affect the response rate, because respondents are more likely to complete shorter questionnaires (Crawford et al., 2001; Marcus et al., 2007).
23 Related party transactions are a common feature of business groups in Asia, including Indonesia (OECD, 2009).

Fraud Risk Assessments and External Auditors’ Perceptions
72
First, the level of fraud risks might vary by industry (Beasly, 1996; Mock and
Turner, 2005). Our vignette case is a growing company in the property industry, which,
as explained, might indicate that it is more likely to involve fraud than cases from other
industries.
Second, fraud risk factors may be related to the audited firm characteristics
(Mock and Turner, 2005; Johnson et al., 2013). For example, accounting complexity is
relevant in the vignette case, as indicated by related party transactions with the
Company’s subsidiaries, so it should be considered (Bell and Carcello, 2000; Apostolou
et al., 2001; ISA 240, 2009). The vignette case indicates that the Company performed a
related party transaction with its non-consolidated subsidiary.
Third, auditors and researchers agree that there is an opportunity to commit
fraud when the internal control is less effective (Apostolou et al., 2001; ISA 240, 2009;
Laufer, 2011; ACFE, 2016). The company in the vignette case issued bearer checks (i.e.,
without stating the name of the receiver) to pay the consulting fees. The consulting fees
were paid to obtain a land conversion permit issued by the local government. The three
statements of each fraud risk factor are presented in Table 3.1.
Table 3.1 Fraud risk factors measurement
Fraud risk factors described in the case Statement
Specific industry:
Property and Real Estate, the Company (PT Co) developed a new mega project.
The way the Company obtained the land conversion permit is a common practice in the property industry.
The payment of the consulting fees was paid through its non-consolidated subsidiary (PT Dun). The transaction was a related party transaction that was not included in the consolidated financial statements.
The consulting fees paid by the Company are a hidden transaction.
Evidence in the case included, but not limited to, the related party transaction, the non-consolidated subsidiary, and the issuance of bearer checks approved by management.
The evidence found is a strong cue to indicate that the Company might be involved in an illegal act.

Chapter 3
73
3.4.3 Materiality judgment
In the case reading, we provided the value of the questionable transaction
relative to the total value of the inventory (i.e., 0.5% of the inventory value). To measure
the perception of materiality, two statements were developed on the basis of the
materiality concept. Auditors mostly rely on quantitative materiality thresholds when
making a decision about misstatements (e.g., Petroni and Besly, 1996; Wright and
Wright, 1997; ISA 320, 2009, paragraph 10). Auditors tend to waive the correction of
misstatements if the amount is immaterial (e.g., Wright and Wright, 1997; Braun, 2001;
Nelson et al., 2005; Ng and Tan, 2007; Legoria et al., 2013). However, if the immaterial
transaction is presumed to involve top management, the auditor should be more alert
(Vorhies, 2005; ISA 240, 2009, paragraph 36 and A52; Vona, 2008, p.64). Building on
quantitative and qualitative materiality judgments, the auditor reevaluates whether the
misstatement is material (i.e., influencing the decision of financial statement users) (De
Zooert et al., 2003, 2006; Nelson et al., 2005; ISA 240, 2009, paragraph 36; ISA 320, 2009;
ISA 450, 2009), and considers modifying the auditing procedures by taking additional
steps to follow up on the initial findings (ISA 240, 2009, paragraph 36; ISA 450, 2009,
paragraph 6-7). Thus, the two statements in the questionnaire are:
Considering the materiality concept, the audit manager should further follow up his/her
initial findings.
Considering the materiality concept, the case would result in misstatements that could
influence the decisions made by financial statement users.
3.4.4 Professional scepticism
There is a trade-off between the cost and benefit of maintaining professional
scepticism, and the auditor often must make a choice between efficiency and
effectiveness. Researchers have investigated the effects of this trade-off on audit quality
(e.g., Rich et al., 1997; King, 2002; Demski, 2003; Nelson, 2009). One the one hand,
investors and society expect that auditors can prevent and detect all possible

Fraud Risk Assessments and External Auditors’ Perceptions
74
misstatements. This assumption implies that auditors extend their tasks by taking on
more evidence and adopting more auditing procedures to assess fraud risks. In addition,
auditors do not want to lose their reputation because of audit failure. As a result, these
precautions might lead to increased auditing costs, because more time and effort are
needed to investigate fraud.
On the other hand, however, auditing must be profitable to survive. Audit firms
face increased competition and time pressure. To survive, they are required to operate
more efficiently. Auditors might reduce or skip some auditing procedures, because
company budgets are limited (Coram et al., 2004; Gundry and Liyanarachchi, 2007;
McNamara et al., 2008). Reduced audit quality24 has been a common practice in auditing,
primarily because of time and budget pressures (Rhode, 1978; McDaniel, 1990; Willett
and Page, 1996; Coram et al., 2003; Paino et al., 2010). Thus, auditors face a dilemma
between encouraging professional scepticism and working with an auditing budget. The
limited auditing budget can pressure auditors to de-emphasize professional scepticism.
We adopt Nelson’s (2009, p 4) argument on presumptive doubt, namely, that to
ensure the financial statements are free from manipulation, auditors are encouraged to
actively seek evidence that managements assertions are correct. Under this definition,
Nelson (2009) asserts that it is possible to exercise too much scepticism, resulting in
expensive audits (i.e., auditors attempt too much). Auditors also should not assume that
management is dishonest. Therefore, auditors are professionally obligated to work hard
and collect evidence, but they do not assume bias ex ante (Nelson, 2009, p.3). To
accommodate this view of neutrality, we use the word “insist” to represent auditors’
duty to work hard and collect evidence. The following statements represent the
dilemma between cost and benefit in maintaining professional scepticism for auditors:
24 Reduced Audit Quality (RAQ) is defined as “actions taken by an auditor during an engagement
which reduce evidence gathering effectiveness inappropriately” (Malone and Roberts, 1996 p. 52).

Chapter 3
75
Considering the time and audit budget constraints, the audit manager should attempt to
find additional evidence because it is part of the auditor’s responsibility to provide
reasonable assurance that the financial statements are free from manipulation.
Considering the time and audit budget constraints, the audit manager should insist on
finding additional evidence because it is part of professional scepticism.
3.4.5 Litigation risk for auditors
In addition to fraud risk factors, materiality judgment, and professional
scepticism which are normally embedded in audit engagements, we consider litigation
risk a factor that might influence the fraud risk assessment (Bloomfield, 1997; Heninger,
2001; Hwang and Chang, 2010). To address the weaker laws in Indonesia (Global
Economy, 2018), we raised the possibility of being sued with the following statement:
The likelihood that the auditor will be sued is probable if the auditor does not restate the
consulting fee transaction.
3.4.6 Fraud risk assessments
We expect that auditors come up with a final judgment after evaluating the fraud
risk factors, exercising professional scepticism, and considering materiality and
litigation risk. Previous studies measured the fraud risk assessment by asking
respondents to rate the level of fraud risk (Carpenter et al., 2002; Payne and Ramsay,
2005; Carpenter and Reimers, 2013; Boyle et al., 2015). For example, Carpenter and
Reimers (2013) surveyed 80 auditors, asking the respondents to assess the likelihood of
fraud using an 11-point Likert scale (extremely unlikely to extremely likely). For this
study, the respondents were asked to indicate their agreement on the significance of
fraud risks, using a seven-point Likert scale (low to high). The respondents considered
the following statement:

Fraud Risk Assessments and External Auditors’ Perceptions
76
After discussing with the engagement team, the audit manager evaluates the risk related
to the land acquisition transaction and assesses it as a significant fraud risk that should
be further examined.
3.4.7 Questionnaire distribution
Prior to the pilot survey test, the draft questionnaire was reviewed by three audit
partners (i.e., individuals having a top position in an accounting firm) from three
different accounting firms. One is from a Big-4 firm, and two are from non-Big-4 firms.
These partners reviewed the draft in English and Indonesian. Although the
questionnaire was delivered in Indonesian, we asked the reviewers to read the English
version as well, because many terms in the case material are specific to the accounting
and auditing field, which originated in English.
In early May 2015, the three audit partners sent their feedback and proposed
corrections.25 After updating the questionnaire, a pilot test was conducted on May 13,
2015. We distributed 50 questionnaires to the auditors at a Continuing Professional
Education (CPE) event organized by the Indonesian Institute of Certified Public
Accountants (IICPA). Of those, 31 questionnaires were returned by mail, but only 24
were valid. On average, respondents ranked the questionnaire as easy to understand
(3.60 out of 5) and relevant (3.98 out of 5). Respondents understood the statements and
terms in the questionnaire (e.g., materiality, professional scepticism).
The questionnaire was refined further based on the comments from the pilot test.
The final questionnaire (see Appendix 3.1) was distributed at Continuing Professional
Education (CPE) events and directly to accounting and auditing firms. The strategies for
25 The following comments were most important. First, the term ‘fraud’ is more appropriate than
’corruption’; for auditors, ‘fraud’ is a common term and it is more acceptable. Psychologically, auditors will be reluctant to answer the questionnaire if the word ‘corruption’ is utilized. Second, some accounting terms should be replaced, for example ‘general ledger’ should be ‘account’. Third, ‘Land’ in a property company is a component of ‘Inventory account.’ In order to check the details of ‘Land’ transactions, auditors examine the Inventory account instead of ‘Cost of Goods Sold’ account. Thus, the word ’Cost of Goods Sold (COGS)’ in the case should be replaced by ‘Inventory.’

Chapter 3
77
obtaining a high rate were as follows: First, we contacted the auditors personally26 and
asked them to help distribute the questionnaires. Second, when delivering the
questionnaires to auditing firms, we asked the senior auditor to introduce it to the staff
that would be distributing the questionnaires (i.e., secretary or HR staff) and
communicated important survey details (e.g., anonymity, all questions should be
answered). To ensure the questionnaires were properly handled, we regularly contacted
the staff in charge or the senior auditor. After obtaining a sufficient response rate, the
questionnaires were picked up or delivered by mail. Although an email or a web survey
might have been more efficient, we preferred a paper-based survey, because previous
studies confirm that the response rates of email or web surveys are lower than
traditional mail surveys (Crawford et al., 2001; Shih and Fan, 2008). We were also
concerned about the stability of respondents' internet access, because Indonesia has the
slowest internet connection in the Asia Pacific region (The Jakarta Post, 2017).
Third, the distribution period was between May and June 2015. Because the
annual audit reports are due in April, this season is relatively less busy for auditors.
Fourth, we distributed most of the questionnaires in the Jakarta area. Almost 70% of the
headquarters and branches of accounting firms in Indonesia are in the greater Jakarta
area (Finance Professions Supervisory Center, Pusat Pembinaan Profesi Keuangan, 2015).
In addition, around 85% of audit firm employees work in the Jakarta area (Finance
Professions Supervisory Center, Pusat Pembinaan Profesi Keuangan, 2015). We also
delivered questionnaires to several cities outside Jakarta, such as Semarang, Lampung,
Banjarmasin, and Denpasar. However, response rates for these areas were very low.
We distributed 847 questionnaires between May 26, 2015, and June 29, 2015. In
total, 494 questionnaires were returned, resulting in a response rate of 58.3%. There was
almost no response from areas outside of Jakarta, such as Denpasar (Bali), Makassar
(Celebes), and Medan (Sumatra). The summary of the questionnaire distribution is
displayed in Appendix 3.2. The returned questionnaires were validated. We cross-
checked the demographic answers with available secondary data. For example, we
26 The author previously worked for the IICPA, which made it easier to get access.

Fraud Risk Assessments and External Auditors’ Perceptions
78
checked whether a partner holds CPA or CA credentials. If his or her answer was
uncertified, we referenced the list of CPAs (i.e., when his or her name was provided)
and revised it to be certified. Twelve respondents with less than 6 months’ experience
were excluded. We also excluded 47 incomplete questionnaires. After cleaning the data,
we were left with 435 valid questionnaires.
3.4.8 Research model
The research model refers to the Fraud Risk Assessment Model in Figure 3.1.
Figure 3.2 is similar to Figure 3.1, but includes the details of the empirical model we use.
In particular, the model is composed of two sub-models, that is, the measurement model
and the structural equation model (SEM). The measurement model describes how the
variables in the model have been measured. Our model includes five latent variables:
fraud risk factors, materiality (i.e., materiality judgment), professional scepticism,
litigation (i.e., litigation risk), and fraud risk assessment. The latent variables are
measured by one or more items (that is, statements) in the questionnaire. Next to these
latent variables, we include three direct measures of the certification and experience of
auditors, as well as the size of the audit firm.
In Figure 3.2, ff1, ff2, and ff3 are the three items (statements) in the questionnaire
related to fraud risk factors; mj1 andmj2 are the items (statements) related to materiality;
ps1 and ps2 are the items (statements) of scepticism; lr1 is the item (statement) related to
litigation; and fra1 is the item (statement) related to fraud risk assessment. certifdum is
our measure of auditors holding a certification yes or no; lnexper is the measure of the
extent to which auditors are experienced; and employee is our measure of audit firm size.

Chapter 3
79
Figure 3.2 Fraud risk assessment - the research model
The structural equation model (SEM) specifies the relationship between the
variables included in Figure 3.2. Our SEM can be specified as follows:
Fraud Risk Assessmenti = β1Fraudriski + β2Materialityi + β3Scepticismi +
β4Litigationi +β5Certificationi+ β6Experiencei +
β7FirmSizei + єi,
where the dependent variable is fraud risk assessment, based on one item (or question)
measured on a scale of 1 (strongly disagree) to 7 (strongly agree). The four independent
variables are measured based on one to three items (questions); all these items are
measured using a seven-point Likert scale, from strongly disagree to strongly agree.
Moreover, we add a dummy certification variable, which is equal to 1 if the respondent
CERTIFICATION
EXPERIENCE FRAUD RISK ASSESSMENT
FRAUD RISK FACTORS
SCEPTICISM
MATERIALITY
certifdum
fra1
ps1
ps2
ff3 ff2 ff1
employee
lnexpemj2
FIRM SIZE
lr1 LITIGATION
mj1

Fraud Risk Assessments and External Auditors’ Perceptions
80
holds a professional certification and 0 otherwise. We also include the natural logarithm
of years of audit experience as measure of individual auditor experience. Finally, we
add a measure of the size of the auditor firm. We categorize the auditing firms by the
number of employees, where firms with less than 30 employees are categorized as small,
between 30 and 200 employees as medium, between 200 and 500 employees as big, and
more than 500 employees as a Big-4.
3.5 Results
3.5.1 Descriptive statistics
Table 3.2 describes the descriptive statistics of the respondents. The respondents
ranged from junior to partner, from low to high experience, and from small to very big
audit firms. Most of our respondents did not hold any professional certifications as an
accountant (i.e., CPA or CA). According to the Government Regulation of Indonesia
No.20 year 2015 on Public Accountant Practice (PP No. 20/2015), auditors are not
required to be CPAs. Professional certification is required if an auditor applies for a
license as a public accountant and becomes a partner of an audit firm (Law No. 5 year
2011 on Public Accountants; the Minister of Finance Regulation No.17/PMK/2008 on
Public Accountant Services). An accountant may have a CPA designation for the
purpose of his/her professional career without having a license as a public accountant.
As of December 31, 2014, there were 1,053 CPAs in Indonesia, of which almost 58% are
older than 50 years of age (Finance Professions Supervisory Center, Pusat Pembinaan
Profesi Keuangan (PPPK), 2015).

Chapter 3
81
Table 3.2 Descriptive statistics
Variable Remark N Min Max Mean Std. Dev.
Certified No= 0; Yes= 1 435 0 1 0.24 0.427
Audit firm size No. of employees = small (1) to very big (4)
435 1 4 3.30 1.177
Experience Years of experience 435 0.5 42.0 5.09 6.889
On average, our respondents participating in the questionnaire had 5 years of
auditing experience, with minimum experience of 6 months and the maximum
experience of 42 years. The audit firm size ranged from small to very big. Junior auditors
with 1 year of experience accounted for 45% of the total sample, which might cause bias,
because their answers may not represent auditors’ opinions in general. Data about the
auditor population in Indonesia are limited; however, we compared the final sample
with the number of auditors listed by the Finance Professions Supervisory Center—
PPPK (2015).
As displayed in Table 3.3, the number of partners in our sample (8.51%) is similar
to the average population of external auditors in Indonesia (9.43%). The remainder of
the sample (91.49%) is composed of auditors at different levels, from manager to junior.
Unfortunately, the Indonesian population data for each level are unavailable. According
to our informal interviews with several notable public accountants, the structure of
auditing firms is similar to a pyramid, with partners at the top, followed by middle
management (i.e., managers and supervisors), and then staff (i.e., seniors and juniors) at
the bottom level. With respect to our sample, the distribution across levels is
representative of a pyramid structure. The managerial level composed 19% of
respondents, followed by 28% senior auditors and 44% junior auditors. Because it aligns
with the pyramidal structure discussed during our interviews, we suggest that sample
selection bias (i.e., sampling bias) is not an important issue.

Fraud Risk Assessments and External Auditors’ Perceptions
82
Table 3.3 Sample distribution
Rank Population Sample Partners – Public Accountants 9.43% 8.51% Auditors: 90.57% 91.49%
- Manager - Supervisor/Asst. Manager - Senior - Junior
N/A N/A N/A N/A
9.20% 9.65%
28.04% 44.60%
3.5.2 Responses
As described above, the vignette study provided nine statements and asked
respondents to what extent they agreed with each statement, using a seven-point Likert
scale that ranged from strongly disagree (1) to strongly agree (7). Table 3.4 displays the
basic descriptive statistics of their responses, which varied from strongly disagree to
strongly agree across all questions. The highest mean refers to the level of professional
scepticism (5.22), suggesting that our respondents agreed the auditor should seek
additional evidence. On average, the respondents also agreed that the fraud case (i.e.,
land acquisition transaction) bears a significant fraud risk that should be further
examined (5.12). The statement about litigation risk had the lowest mean (3.85),
indicating that the respondents assessed the probability of being sued as low, perhaps
because the legal framework in Indonesia is relatively weak, and/or the respondents
have never faced lawsuits for fraud cases.
Table 3.4 Descriptive statistics – respondents’ answers
No. Statement No. Min. Max. Mean Median Std. Dev.
1. FraudRiskFactor1 (ff1) 435 1 7 4.65 5 1.53 2. FraudRiskFactor2 (ff2) 435 1 7 4.91 5 1.33 3. FraudRiskFactor3 (ff3) 435 1 7 4.52 5 1.49 4. Materiality1 (mj1) 435 1 7 4.48 5 1.76 5. Materiality2 (mj2) 435 1 7 3.98 4 1.74 6. Scepticism1 (ps1) 435 1 7 5.22 5 1.56 7. Scepticism2 (ps2) 435 1 7 5.01 5 1.50 8. LitigationRisk1 (lr1) 435 1 7 3.85 4 1.74 9. FraudRiskAssessment1 (fra1) 435 1 7 5.12 5 1.50

Chapter 3
83
3.5.3 Measurement models — confirmatory factor analysis
We employed a confirmatory factor analysis (CFA) in Lisrel 8.80. The objective of
the CFA was to test the goodness of fit of the measurement models as a whole to our
five constructs (i.e., fraud risk factor, materiality, professional scepticism, litigation risk,
and fraud risk assessment). The goodness of fit of the measurement models indicates
how well the data fit the model (Hooper et al., 2008; Schermelleh-Engel and
Moosbrugger, 2003). We carry out various tests of the goodness of fit of our model,
including absolute fit measures (e.g., GFI, AGFI, RMSEA), and incremental fit measures
(e.g., NFI, CFI, IFI). The use of multiple fit indices, rather than a single index, has long
been recommended in the literature (e.g., Bentler and Bonnet, 1980; Joreskog and
Sorbom, 1993; Sharma et al., 2005). Appendix 3.3 details the full output of the goodness
of fit tests.
Table 3.5 provides an overview of the goodness of fit test. The table suggests that
the fit of the initial measurement model can be classified as good. For example, the root
mean square error of approximation (RMSEA) represents how well a model fits a
population. A value below 0.05 indicates that the model is a close fit, and a value
between 0.05 and 0.08 signals a good fit (Browne and Cudeck, 1992). The normed fit
index (NFI) is an incremental fit measure; it assesses how well a specified model fits
compared with a null (i.e., independent) model (Hooper et al., 2008). The specified
model is a good fit if the NFI has a value is at least 0.90 (Bentler and Bonnet, 1980).
Next, we evaluated whether the questions or statements we used were good
measures of our latent variables. A statement is deemed valid if the standardized factor
loading (SFL) is more than 0.7 (Doll et al., 1994) or 0.5 (Igbaria et al., 1997). The initial
output indicated that all statements had SFL values greater than 0.7, except ff1. The SFL
of ff1 was only 0.03 and not significant (i.e., t-value 0.6). We thus conclude that ff1 is not
valid a measure of fraud risk factors and remove it from the CFA. Next, we reran the
analysis, excluding ff1. The new results indicate that the corrected CFA is an
improvement. Table 3.6 displays the SFLs for each observed variable, all of which

Fraud Risk Assessments and External Auditors’ Perceptions
84
exceed 0.7 with statistically significant t-values at the 1% level. Therefore, the eight
observed variables are valid as measurements of the five latent variables. The goodness-
of-fit indices of the refined measurement model also indicate good fit.
Table 3.5 Goodness-of-fit results
No. Indices Target Estimation
1. Root Mean Square Error of Approximation (RMSEA) ≤ 0.05 0.048 2. p-value for test of close fit ≥ 0.05 0.53 3. Standardized Root Mean Square Residual (SRMR) ≤ 0.05 0.021 4. Goodness-of-Fit Index (GFI) ≥ 0.90 0.98 5. Normed Fit Index (NFI) ≥ 0.90 0.98 6. Non-Normed Fit Index (NNFI) ≥ 0.90 0.98 7. Comparative Fit Index (CFI) ≥ 0.90 0.99 8. Incremental Fit Index (IFI) ≥ 0.90 0.99 9. Adjusted Goodness-of-Fit Index (AGFI) ≥ 0.90 0.95
10. Critical N (CN) ≥ 200 383.84
Table 3.6 Standardized factor loadings
FRAUDRISK MATERIALITY SCEPTICISM LITIGATION ASSESSMENT
ff2 0.77 - - - - - - - - t-value 14.91 ff3 0.67 - - - - - - - - t-value 13.14 mj1 - - 0.83 - - - - - - t-value 18.23 mj2 - - 0.78 - - - - - - t-value 17.13 ps1 - - - - 0.86 - - - - t-value 20.94 ps2 - - - - 0.88 - - - - t-value 21.94 lr1 - - - - - - 1.00* - - t-value fra1 - - - - - - - - 1.00* t-value
*only one statement.

Chapter 3
85
We also checked construct reliability, using both the construct reliability (CR)
index and the average variance extracted (AVE). According to Hair et al. (2006), a
construct or latent variable has good reliability if it meets a cut-off of 0.7 for CR and 0.5
for AVE. The questions we developed reliably measure each related construct (Table
3.7).
Table 3.7 CR and AVE results
CR27 AVE28 Reliability
FRAUDRISK 0.69 0.52 Good MATERIALITY 0.79 0.65 Good SCEPTICISM 0.86 0.76 Good
The relationship between the latent variables is displayed in the covariance
matrix (Table 3.8). The results indicate that all latent variables are positively correlated.
As hypothesised, fraud risk, materiality, scepticism, and litigation seem to have a
positive association with fraud risk assessment.
Table 3.8 Covariance matrix – latent variables
FRAUDRISK MATERIALITY SCEPTICISM LITIGATION ASSESSMENT
FRAUDRISK 1.00 MATERIALITY 0.40 1.00 SCEPTICISM 0.58 0.67 1.00 LITIGATION 0.87 0.99 0.84 3.03 ASSESSMENT 0.92 0.77 1.01 1.28 2.19
3.5.4 Structural equation modelling results
The results of the Structural Equation Modelling (SEM) are based on two steps.
First, the individual SEM tests a single exogenous latent variable (i.e., univariate) (Table
3.9). Second, the full SEM, or hybrid model, which consists of the measurement models
and the structural model, tests the structural model simultaneously.
27 CR = (Σstandardized loading)2/((Σstandardized loading)2 + Σδj), where δjismeasurement error. 28AVE = Σstandardizedloading2/(Σstandardized loading2 + Σδj), whereδjismeasurement error.

Fraud Risk Assessments and External Auditors’ Perceptions
86
Individual SEM
The endogenous latent variable fraud risk assessment is individually regressed
on each exogenous latent variable (i.e., fraud risk, materiality, scepticism, and litigation).
The estimated coefficient of each variable is in Table 3.9, with t-statistics in parentheses.
As expected, every exogenous latent variable has a positive, significant effect on
fraud risk assessment (i.e., ASSESSMENT). The results indicate that all hypotheses
cannot be rejected, meaning that fraud risk factors, materiality judgment, professional
scepticism, or litigation risk have a statistically significant association with fraud risk
assessment.
Full SEM
After conducting the individual SEM, we estimated the full SEM simultaneously
(Table 3.10). Only fraud risk has a positive significant effect on assessment. As
hypothesised (H1), fraud risk factors help auditors assess the likelihood of fraud. This
finding is consistent with previous research that reports that the use of fraud risk factors
significantly affects auditors’ ability to assess fraud risks (Bell and Carcello, 2000; Wilks
and Zimbelman, 2004). The fraud risk factors warn auditors to be alert to the possibility
of fraud. In our vignette case, the auditors perceive the related party transaction,
combined with a weak internal control, as a mechanism to conceal illicit transactions.
For the other variables, we do not find support for the hypotheses. In contrast
with the individual SEM, in the full SEM, materiality, scepticism, and litigation do not
affect the fraud risk assessment. One reason for this outcome may that these variables
are interrelated. In theory, at least (see below), materiality judgments may be correlated
with scepticism and litigation risk.

Chapter 3
87
Table 3.9 Univariate estimation
Table 3.9 reports the results of the individual SEM. The endogenous latent variable (dependent variable) is Fraud Risk Assessment (ASSESSMENT). FRAUDRISK is an exogenous latent variable, representing Fraud Risk Factors. MATERIALITY is an exogenous latent variable, representing Materiality Judgment. SCEPTICISM is an exogenous variable, measuring the professional scepticism. LITIGATION is an exogenous latent variable, measuring the perception of litigation risks. The coefficients are displayed with t-statistics in parentheses.
Endogenous Latent Variable ASSESSMENT ASSESSMENT ASSESSMENT ASSESSMENT
(1) (2) (3) (4) (5) FRAUDRISK 0.90***
(11.57)
MATERIALITY 0.76*** (10.25)
SCEPTICISM 1.01*** (15.36)
LITIGATION 0.50*** (11.74)
***significant at the 1% level
The relationship between materiality judgments and scepticism may be explained
as follows. Auditors rely on quantitative materiality thresholds when making decisions
about misstatements and earnings management. They tend to waive corrections of
misstatements if the amount is immaterial (e.g., Wright and Wright, 1997; Braun, 2001;
Nelson et al., 2005; Ng and Tan, 2007: Legoria et al., 2013). In such cases, auditors are less
likely to find more evidence and more likely to trust the existing evidence. Thus,
auditors are less sceptical in case misstatements are less material. Therefore, the
materiality concept may be a constraint to adopting a more sceptical mindset. An
auditor’s perception of the level of materiality is positively correlated with his or her
professional scepticism.
Regarding litigation risk, Arnold et al. (2001) find a positive association between
the materiality estimate and the level of litigation risk in European countries. Zabel et al.
(2002) review court cases of accounting fraud in the US that specifically considered
materiality. Cox et al. (2014) find that the materiality disclosure in financial statements
reduces auditors’ litigation risks on the basis of the perception of users of financial

Fraud Risk Assessments and External Auditors’ Perceptions
88
statements. Thus, auditors’ perceptions of the level of materiality are positively
associated with their perception of the level of litigation risks. Building on these
relationships between some of the latent independent variables, we modified the SEM
model by adding two relationships, or so-called paths (i.e., from materiality to
scepticism, and from materiality to litigation risks) to the model.
Table 3.10 Structural equation results – initial model
Table 3.10 presents the results of the initial SEM. The endogenous latent variable (dependent variable) is Fraud Risk Assessment (ASSESSMENT). FRAUDRISK is an exogenous latent variable, representing Fraud Risk Factors. MATERIALITY is an exogenous latent variable, representing Materiality Judgment. SCEPTICISM is an exogenous variable, measuring the professional scepticism. LITIGATION is an exogenous latent variable, measuring the perception of litigation risks. CERTIFICATION is a dummy variable, equal to 1 if the respondent is holding a professional certification, and zero otherwise. EXPERIENCE is the natural logarithm of years of audit experience. FIRMSIZE is the category of audit firm size based on the number of employees from small (1) to very big (4).The coefficients are displayed with t-statistics in parentheses.
Exogenous Latent Variable Coefficient (1) (2)
FRAUDRISK 0.54***
(2.57) MATERIALITY
SCEPTICISM
0.13 (0.78) 0.49
LITIGATION
(1.70) 0.01
CERTIFICATION
(0.07) -2.36
EXPERIENCE
(-0.52) 0.47
FIRMSIZE
(0.42) -0.09
(-0.59) R-square
N 0.60 435
***significant at the 1% level
The overall goodness of fit of the modified SEM is satisfactory, as indicated by
several indices (Table 3.11). The indices reach values of more than 0.90. The results
imply that the relationship between the latent variables is well explained by the model.

Chapter 3
89
Thus, fraud risk factors, materiality judgments, professional scepticism, and litigation
risk are beneficial to explain the variation of fraud risk assessments. Appendix 3.4
demonstrates the complete indices of goodness of fit. Table 3.12 presents a path format
to explain the relationship of each path. In addition, the modified SEM is displayed in
Figure 3.3.
Table 3.11 Goodness-of-fit indices – SEM
No. Indices Target Estimation
1. Root Mean Square Error of Approximation (RMSEA) ≤ 0.05 0.07 2. p-value for test of close fit ≥ 0.05 0.01 3. Standardized Root Mean Square Residual (SRMR) ≤ 0.05 0.04 4. Goodness-of-Fit Index (GFI) ≥ 0.90 0.96 5. Normed Fit Index (NFI) ≥ 0.90 0.96 6. Non-Normed Fit Index (NNFI) ≥ 0.90 0.95 7. Comparative Fit Index (CFI) ≥ 0.90 0.97 8. Incremental Fit Index (IFI) ≥ 0.90 0.97 9. Adjusted Goodness-of-Fit Index (AGFI) ≥ 0.90 0.91
10. Critical N (CN) ≥ 200 217.46
Table 3.12 SEM results —modified model
Table 3.12 reports the results of the modified SEM. The endogenous latent variable is ASSESSMENT, SCEPTICISM, and LITIGATION. ASSESSMENT represents the level of fraud risk assessment. SCEPTICISM is to measure the professional scepticism. LITIGATION is to measure the perception of litigation risks FRAUDRISK is an exogenous latent variable, representing Fraud Risk Factors. MATERIALITY is an exogenous latent variable, representing Materiality Judgment. CERTIFICATION is a dummy variable, equal to 1 if the respondent is holding a professional certification, and zero otherwise. EXPERIENCE is the natural logarithm of years of audit experience. FIRMSIZE is the category of audit firm size based on the number of employees from small (1) to very big (4).The coefficients are displayed with t-statistics in parentheses.
Path Expected sign Coef. Std. Error t FRAUDRISK ASSESSMENT + 0.45 0.11 3.97*** MATERIALITY ASSESSMENT + 0.08 0.27 0.28 SCEPTICISM ASSESSMENT + 0.63 0.14 4.39*** LITIGATION ASSESSMENT + 0.07 0.06 1.23 MATERIALITY SCEPTICISM + 0.78 0.06 13.99*** MATERIALITY LITIGATION + 1.12 0.08 14.55*** CERTIFICATION ASSESSMENT + -0.22 0.30 -0.74 EXPERIENCE ASSESSMENT - -0.03 0.09 -0.38 FIRMSIZE ASSESSMENT + -0.02 0.05 -0.30
***significant at the 1% level

Fraud Risk Assessments and External Auditors’ Perceptions
90
Based on the estimation results of the modified SEM model, two of the three
variables of interest (i.e., fraud risk factors and scepticism) have a positive and
significant effect on fraud risk assessments, as hypothesised (H1, H3). The importance of
fraud risk factors as determinants of fraud risk assessments was already found in the
initial SEM model; the results of the modified SEM model confirm this outcome. The
importance of professional scepticism when assessing fraud risks is evident in the
modified model. This outcomes supports the view that the more sceptical auditors are,
the more prudent they tend to be. In this case, they also assess higher fraud risk.
Professional scepticism may be manifested by the behaviour of seeking additional
evidence despite auditing budget constraints. This interpretation of our findings is
corroborated by existing research on professional scepticism and fraud risk assessments
(Carpenter and Reimers, 2013; Payne and Ramsay, 2005).
The hypothesis of materiality judgment is positive, though the relationship is not
significant. The relationship between materiality judgment and fraud risk assessment is
supported by Bernardi and Pincus (1996). Auditors might judge that the suspicious
transaction is immaterial, which makes it unnecessary for them to investigate the initial
evidence. They also may believe the transaction will not cause a material misstatement
in the financial statements if left uncorrected (Icerman and Hillison, 1991; Wright and
Wright, 1997; Braun, 2001).
When assessing the level of fraud risk, auditors also consider the likelihood of
being sued. Our results show a positive but insignificant correlation between litigation
risk and fraud risk assessment. The fact that this relationship is insignificant may
support the view that auditors assume the litigation risk to be low because the legal
framework in Indonesia is relatively weak.
Our results also reveal that an auditor’s materiality judgment significantly
influences scepticism. This suggests that when the auditor perceives a misstatement is
material enough, he or she tends to seek additional evidence. This finding is consistent
with the guidance in ISA 240 that requires an auditor to investigate further when the
auditor believes material misstatements might be fraudulent (paragraphs 12-13). Our

Chapter 3
91
outcomes suggest that, even though materiality judgment does not seem to affect fraud
risk assessment directly, it does so indirectly through by influencing scepticism, which
directly affects fraud risk assessment. In other words, scepticism mediates the impact of
materiality judgment on fraud risk assessment.
Figure 3.3 Full modified SEM
An auditor’s materiality judgment also significantly influences the perception of
litigation risk. Logically, the higher the materiality misstatement, the higher the
litigation risk will be. This result supports Arnold et al.’s (2001) finding of a positive
correlation between materiality estimates and litigation risks. The auditor believes that
the litigation risk is lower when the misstatement is less material, and vice versa. Yet, as
CERTIFICATION
EXPERIENCE FRAUD RISK ASSESSMENT
FRAUD RISK FACTORS
SCEPTICISM
MATERIALITY
certifdu
fra1 mj1
ps1
ps2
ff3 ff2
employee
lnexpemj2
FIRM SIZE
lr1 LITIGATION

Fraud Risk Assessments and External Auditors’ Perceptions
92
is shown by our results, litigation risk does not seem to act as a mediating variable
between materiality judgments and fraud risk assessment.
Finally, none of other three variables are significant. Holding a professional
certification (H5) does not have any effect on fraud risk assessment. The same holds for
the level of experience of auditors (H6). Regarding audit firm size (H7), we find a
negative but insignificant coefficient, implying no difference between auditors from
audit firms of different size.
3.5.5 Bias tests
In order to carry out the empirical analysis, we have done our best to carefully
craft our survey design and sampling methodology. Nevertheless, one may still criticize
our approach. One potential criticism might be that our dependent and independent
variables come from the same respondent, which might create common method bias. To
test for common method bias, we followed Podsakoff et al.’s (2003, p.888) suggestions
regarding statistical tests. We used Harman’s single-factor test (i.e., all survey items load
on one exploratory factor analysis). If the total variance of the single factor is less than
50%, it dispels concerns about common method bias. Our test shows that the eight
variables inserted into a one-factor solution achieve a variance of 44.26%, so common
method bias is unlikely.
Furthermore, we use confirmatory factor analysis (CFA), which provides a more
complex tool to test common method bias (Podsakoff et al., 2003, p.889). As with
Harman’s single-factor test, the CFA creates one latent factor in which all question items
should load. After several trials, the CFA model resulted in poor goodness of fit
(RMSEA= 57.07,p-value = 0.00; NFI= -38.35; GFI= 0.0089; CN = 1.09). The poor fit makes
us confident that our questionnaire is free of common method bias.

Chapter 3
93
3.6 Conclusions
This research proposed a model of fraud risk assessments comprised of fraud risk
factors, materiality judgments, professional scepticism, litigation risk, and auditor
characteristics such as auditor’s certification, experience and audit firm size. We apply a
SEM approach to estimate the model. The results indicate that fraud risk factors,
materiality judgment, professional scepticism, and the perception regarding litigation
risk all strongly influence auditors’ decision making with regard to fraud risk
assessments in univariate models, supporting all hypotheses.
When we run all variables simultaneously in the full model, two variables, fraud
risk factors and professional scepticism, remain having significant effects on fraud risk
assessments. We provide evidence that materiality affects fraud risk assessment through
professional scepticism, suggesting that professional scepticism act as a mediating
variable. This finding demonstrates that materiality judgment plays a critical, but
indirect role when assessing fraud risk. In addition, being more conservative when
considering the materiality of a fraud case increases sceptical behaviour, resulting in
higher fraud risk assessments. Perceived higher materiality is also an indication of a
higher probability of being sued.
Although the results support our core arguments and hypotheses, this research
has several limitations. First, as a survey study, the respondents' answers might be
biased. Although we conducted a pilot test before distributing the questionnaires, the
respondents’ understanding when reading the case and their interpretation might differ.
However, the results of the common method bias tests indicate that the items in the
questionnaire are less likely to suffer from common method bias. Second, we developed
a fraud case that commonly happens in the Indonesian context. This means that we
should be cautionary in generalizing our results to jurisdictions.
Nevertheless, we believe that our analysis and results are interesting for
researchers and practitioners also outside Indonesia. They may inspire similar research
in other countries, taking into account the specific formal and informal institutional
context. It would, for instance, be interesting to see how auditors deal with fraud risk

Fraud Risk Assessments and External Auditors’ Perceptions
94
assessment when litigation risk is higher (that is, when the legal system is considered to
be stronger). It would also be interesting to repeat the research with vignette case
studies describing potential fraud cases in other industries. Follow-up studies like these
would allow for comparing our results with those of other studies, providing additional
insights in what really drives fraud risk assessments made by auditors.

Chapter 3
95
Appendix 3.1 The Case Material
Please read carefully the case below:
PT Co Tbk (“The Company”) - a publicly listed firm in Indonesia, engages in developing
and selling property and real estates. Since the early 2014, the Company has developed a
100-hectare residential project in a suburb area, which is called “Cosmogreen Residence”
(CR) project.
Goenarwan, CPA – an audit manager of an auditing firm, was assigned to conduct the
2014 financial statement audit in PT C Tbk. It was the third year of his audit engagement
in the Company. He paid attention on the account of Inventory, specifically sub account
Land, as it was the major component of Inventory. During his audit, he and his audit
staff examined the payment documents and other evidences related to the acquisition of
land in the CR project. He found a land permit document of IDR5 billion, that included
IDR2 billion (around US$222,000) as consulting fees. To ensure the validity of the
payment, then he checked the Company’s bank account and obtained some evidences as
follows:
The Company transferred to PT Dun (as an agent which was assigned to
administer the land licenses) amounting to IDR3 billion for the payments of the
land conversion permit. The payments were executed in two terms i.e., IDR1
billion and IDR2 billion respectively.
The Company issued two separate checks, each IDR1 billion, without stating the
name of the recipients. When Goenarwan enquired to Finance Manager, the
Finance Manager explained that in a process to free the respective land, the
Company had to deal with local authority to obtain a land conversion permit and
building permit. However, the Company has never dealt directly with the local
authority. The Company is used to hire a third party, such as PT Dun. In
addition, the Finance Manager asserted that the Company management had
agreed with respect to the payments and check issuances.

Fraud Risk Assessments and External Auditors’ Perceptions
96
PT Dun is an affiliated firm, and it is not consolidated. PT Co has 20% interest in
PT Dun and PT Dun is indirectly owned through PT Ego.
Goenarwan was thinking to further follow up his initial findings, because he felt that the
amount of IDR2 billion, just for getting a land permit was not fair. He exactly knew that
the value was not material, if it was compared to the Company’s total Inventory (only
0.5%).
Please answer all questions below based on your own best knowledge and
experience. Objective and realistic answers are strongly encouraged to give us an
appropriate feedback.
Fraud Risk Assessments
Based on the above case, to what extent you agree with the following statements:
Strongly disagree
1
2
3
4
5
6
Strongly agree
7 1. The way the Company obtained the land
conversion permit is a common practice in the property industry.
2. Considering the materiality concept Goenarwan, the audit manager should further follow up his initial findings regarding the land permit.
3. Considering the materiality concept, the case would result in misstatements that could influence the decisions made by the financial statement users.
4. Considering the time and audit budget constraints, Goenarwan, the audit manager should attempt to find additional evidence because it is part of the auditor’s
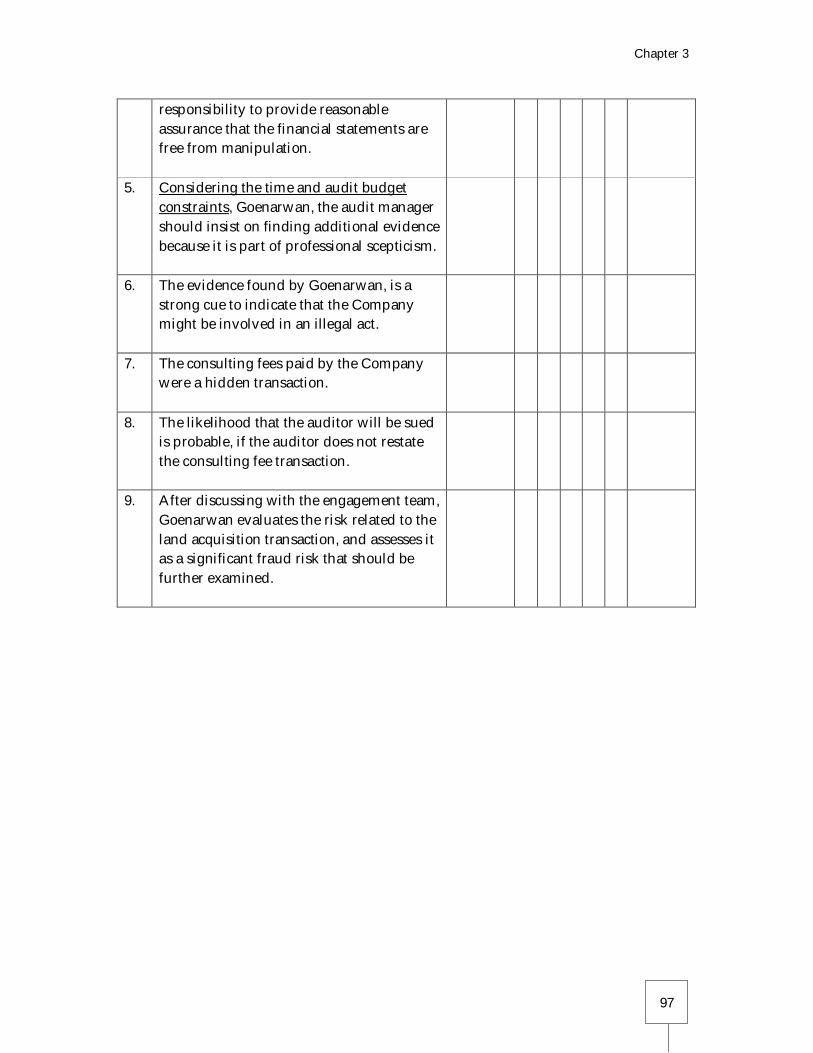
Chapter 3
97
responsibility to provide reasonable assurance that the financial statements are free from manipulation.
5. Considering the time and audit budget constraints, Goenarwan, the audit manager should insist on finding additional evidence because it is part of professional scepticism.
6. The evidence found by Goenarwan, is a strong cue to indicate that the Company might be involved in an illegal act.
7. The consulting fees paid by the Company were a hidden transaction.
8. The likelihood that the auditor will be sued is probable, if the auditor does not restate the consulting fee transaction.
9. After discussing with the engagement team, Goenarwan evaluates the risk related to the land acquisition transaction, and assesses it as a significant fraud risk that should be further examined.

Fraud Risk Assessments and External Auditors’ Perceptions
Appendix 3.2 Distribution of the Questionnaires
No. Delivery Date1) Receipt/ Distribution Point Address Remark Distributed Returned Response
Collection Date2) Rate
1 Wed, 13 May 2015 Wed, 13 May 2015 CPE - IICPA* Gren Alia Hotel, Jkt PILOT TEST 50 24 48.00
2 Tues, 26 May 2015 Tues, 26 May 2015 CPE - IICPA* Grand Mercure Hotel, Jkt
80 26 32.50
3 Wed, 27 May 2015 Tues, 9 Jun 2015 KAP A** Jakarta
30 30 100.00
4 Wed, 27 May 2015 Thur, 11 Jun 2015 KAP A** Jakarta
5 5 100.00
5 Thu, 28 May 2015 Wed, 17 Jun 2015 KAP B Jakarta
30 27 90.00
6 Thu, 28 May 2015 Wed, 17 Jun 2015 KAP C** Jakarta
30 18 60.00
7 Thu, 28 May 2015 Wed, 17 Jun 2015 KAP C** Jakarta
20 15 75.00
8 Thu, 28 May 2015 Wed, 17 Jun 2015 KAP C** Jakarta
20 16 80.00
9 Fri, 29 May 2015 Thur, 11 Jun 2015 KAP D Jakarta
80 56 70.00
10 Sat, 23 May 2015 Tues, 2 Jun 2015 CPE - IICPA* Surabaya
90 26 28.89
11 Wed, 3 Jun 2015 Tues, 11 Aug 2015 KAP E Jakarta
20 15 75.00
12 Wed, 3 Jun 2015 Wed, 17 Jun 2015 KAP B Jakarta
20 16 80.00
13 Mon. 8 Jun 2015 - KAP F Jakarta
10 0 0.00
14 Mon. 8 Jun 2015 - KAP G Jakarta
10 0 0.00
15 Mon. 8 Jun 2015 - KAP H Jakarta
10 0 0.00
16 Mon. 8 Jun 2015 - KAP I Jakarta
4 0 0.00
17 Mon. 8 Jun 2015 - KAP J Jakarta
8 0 0.00
18 Sat, 6 Jun 2015 Tues, 7 Jul 2015 KAP K Jakarta
20 13 65.00
19 Fri, 5 Jun 2015 Tues, 23 Jun 2015 KAP L Jakarta
30 25 83.33
20 Fri, 5 Jun 2015 Wed, 10 Jun 2015 KAP M Jakarta
12 2 16.67
21 Fri, 5 Jun 2015 Wed, 17 Jun 2015 KAP N Jakarta
41 41 100.00
22 Mon. 8 Jun 2015 Thur, 18 Jun 2015 KAP O Jakarta
10 9 90.00
23 Fri, 5 Jun 2015 Wed, 17 Jun 2015 KAP P** Jakarta
30 30 100.00
24 Mon. 8 Jun 2015 - KAP Q Jakarta
8 0 0.00
25 Mon. 8 Jun 2015 Tues, 14 Jul 2015 KAP R Jakarta
15 5 33.33

Chapter 3
No. Delivery Date1) Receipt/ Distribution Point Address Remark Distributed Returned Response
Collection Date2) Rate
26 Fri, 5 Jun 2015 Fri, 7 Aug 2015 KAP S Jakarta
8 8 100.00
27 Fri, 5 Jun 2015 - KAP T Jakarta
10 0 0.00
28 Fri, 5 Jun 2015 Wed, 17 Jun 2015 KAP U** Jakarta
30 30 100.00
29 Fri, 5 Jun 2015 Wed, 17 Jun 2015 KAP U** Jakarta
30 28 93.33
30 Mon. 8 Jun 2015 Thur, 30 Jul 2015 KAP V Jakarta
5 5 100.00
31 Mon. 8 Jun 2015 Tues, 29 Sep 2015 KAP W Jakarta
5 4 80.00
32 Mon. 8 Jun 2015 Tues, 14 Jul 2015 KAP A** Jakarta
5 4 80.00
33 Mon. 8 Jun 2015 Thur, 30 Jul 2015 KAP X Jakarta
5 5 100.00
34 Wed, 10 Jun 2015 - KAP Y Jakarta
15 0 0.00
35 Wed, 10 Jun 2015 Fri, 12 Jun 2015 KAP Z Jakarta
15 13 86.67
36 Mon, 22 Jun 2015 - KAP AA Jakarta
12 0 0.00
37 Mon, 22 Jun 2015 - KAP BB Denpasar
8 0 0.00
38 Mon, 22 Jun 2015 - KAP CC Medan
8 0 0.00
39 Mon, 22 Jun 2015 - KAP DD Banjarmasin
5 0 0.00
40 Mon, 22 Jun 2015 - KAP EE Bandung
8 0 0.00
41 Mon, 22 Jun 2015 - KAP FF Makassar
8 0 0.00
42 Mon, 22 Jun 2015 Mon, 29 Jun 2015 KAP GG Semarang
8 4 50.00
43 Mon, 22 Jun 2015 - KAP HH Bandar Lampung
5 0 0.00
44 Mon, 22 Jun 2015 Fri, 3 Jul 2015 KAP II Jakarta
9 9 100.00
45 Mon, 29 Jun 2015 Tues, 7 Jul 2015 KAP JJ Jakarta
15 9 60.00
TOTAL EXCL.THE PILOT TEST 847 494 58.32
*CPE - IICPA = The event of Continuing Professional Education organized by the Indonesian Institute of Certified Public Accountants **Big four accounting firms : Deloitte, EY, KPMG, and PwC.
Ramadan and Eid Mubarak Holidays in Indonesia : 15 - 26 July 2015 1) The date when the questionnaires were sent to every contact person either by mail or by direct visit.
2) The date when we received the filled-in questionnaires by mail or the date when we picked up the filled-in questionnaires directly.

Fraud Risk Assessments and External Auditors’ Perceptions
100
Appendix 3.3 Goodness of Fit Statistics - CFA
After excluding ff1
Goodness of Fit Statistics
Degrees of Freedom = 21 Minimum Fit Function Chi-Square = 44.14 (P = 0.0022)
Normal Theory Weighted Least Squares Chi-Square = 42.02 (P = 0.0042) Estimated Non-centrality Parameter (NCP) = 21.02
90 Percent Confidence Interval for NCP = (6.31 ; 43.50)
Minimum Fit Function Value = 0.10 Population Discrepancy Function Value (F0) = 0.048 90 Percent Confidence Interval for F0 = (0.015 ; 0.10)
Root Mean Square Error of Approximation (RMSEA) = 0.048 90 Percent Confidence Interval for RMSEA = (0.026 ; 0.069)
P-Value for Test of Close Fit (RMSEA < 0.05) = 0.53
Expected Cross-Validation Index (ECVI) = 0.30 90 Percent Confidence Interval for ECVI = (0.27 ; 0.36)
ECVI for Saturated Model = 0.30 ECVI for Independence Model = 6.46
Chi-Square for Independence Model with 55 Degrees of Freedom = 2779.63 Independence AIC = 2801.63
Model AIC = 132.02 Saturated AIC = 132.00
Independence CAIC = 2857.46 Model CAIC = 360.41
Saturated CAIC = 466.97
Normed Fit Index (NFI) = 0.98 Non-Normed Fit Index (NNFI) = 0.98
Parsimony Normed Fit Index (PNFI) = 0.38 Comparative Fit Index (CFI) = 0.99 Incremental Fit Index (IFI) = 0.99
Relative Fit Index (RFI) = 0.96
Critical N (CN) = 383.84
Root Mean Square Residual (RMR) = 0.046 Standardized RMR = 0.021
Goodness of Fit Index (GFI) = 0.98 Adjusted Goodness of Fit Index (AGFI) = 0.95
Parsimony Goodness of Fit Index (PGFI) = 0.31

Chapter 3
101
Appendix 3.4 Goodness of Fit Statistics –Modified (Final) SEM
Goodness of Fit Statistics
Degrees of Freedom = 29
Minimum Fit Function Chi-Square = 99.42 (P = 0.00) Normal Theory Weighted Least Squares Chi-Square = 93.78 (P = 0.00)
Estimated Non-centrality Parameter (NCP) = 64.78 90 Percent Confidence Interval for NCP = (39.21 ; 97.96)
Minimum Fit Function Value = 0.23 Population Discrepancy Function Value (F0) = 0.15 90 Percent Confidence Interval for F0 = (0.090 ; 0.23)
Root Mean Square Error of Approximation (RMSEA) = 0.072 90 Percent Confidence Interval for RMSEA = (0.056 ; 0.088)
P-Value for Test of Close Fit (RMSEA < 0.05) = 0.014
Expected Cross-Validation Index (ECVI) = 0.39 90 Percent Confidence Interval for ECVI = (0.33 ; 0.46)
ECVI for Saturated Model = 0.30 ECVI for Independence Model = 6.46
Chi-Square for Independence Model with 55 Degrees of Freedom = 2779.63 Independence AIC = 2801.63
Model AIC = 167.78 Saturated AIC = 132.00
Independence CAIC = 2857.46 Model CAIC = 355.57
Saturated CAIC = 466.97
Normed Fit Index (NFI) = 0.96 Non-Normed Fit Index (NNFI) = 0.95
Parsimony Normed Fit Index (PNFI) = 0.51 Comparative Fit Index (CFI) = 0.97 Incremental Fit Index (IFI) = 0.97
Relative Fit Index (RFI) = 0.93
Critical N (CN) = 217.46
Root Mean Square Residual (RMR) = 0.087 Standardized RMR = 0.042
Goodness of Fit Index (GFI) = 0.96 Adjusted Goodness of Fit Index (AGFI) = 0.91
Parsimony Goodness of Fit Index (PGFI) = 0.42

Fraud Risk Assessments and External Auditors’ Perceptions
102

Chapter 4
103
Chapter 4 The Value of Political Connections: The Impact
of the Changing Political Landscape in Indonesia29
Abstract
This study investigates the value of political connections before (2001-2004) and during the democratic era (2005-2011) in Indonesia. In particular, we investigate the impact of a substantial change in the country’s political and economic framework on the economic value of political connections of firms. Using a sample of 357 non-financial listed firms in Indonesia for the period 2000-2011, we find that, generally speaking, political connections are not associated with the performance of firms. That is, firms with political connections do not have lower or higher financial performance as compared to firms without such connections. However, when splitting up our sample according to size, we find that smaller firms with political connections perform worse than smaller firms without such connections. The opposite is true for large firms, that is, we show that financial performance of large firms with political connections is higher than that of the performance of large firms without such connections. We also find that in the democratic era the positive (negative) impact of political connections on the financial performance of large (small) firms has weakened. These outcomes suggest that small and large firms converge with respect to the impact political connections have on financial performance. We interpret these findings as evidence that political connections become less important for firms as a determinant of their performance after the Indonesian political landscape has changed to a more democratic regime.
Keywords: politically connected firms, political change, corporate boards, financial performance, Indonesia
29 An earlier version of this chapter was awarded as the second best paper at the 6th International
Accounting Conference, Yogyakarta, Indonesia, August 29, 2017. The chapter is co-authored with Niels Hermes and Ronald Holzhacker. The name of each co-author is listed based on his contribution to the research in descending order. The article has been submitted to an international journal and it is currently under review.

The Value of Political Connections
104
4.1 Introduction
The phenomenon of politically connected firms (PCFs) is common around the world, but
PCFs are more prevalent in countries with a high level of corruption (Faccio, 2006) and
weak institutions (Henisz and Zelner, 2003; Jiang and Peng, 2011). If a country’s
institutions are weak, there is likely to be a high degree of uncertainty with respect to
the outcomes of business decisions and practices. Political connections may help firms to
mitigate this uncertainty. Emerging economies in Southeast Asia, including Indonesia,
are typically characterized by a lack of investor protection, a low level of law
enforcement, and market inefficiency (La Porta et al., 2000). At the same time, however,
since the late 1990s, Indonesia has progressed in many ways, i.e. politically,
economically, as well as socially. One of the important changes, among other things, has
been the transformation into a more open and democratic country.
Existing research on PCFs and their financial performance commonly assumes the
institutional framework as given or simply disregards the institutional context in which
firms operate. Yet, in many emerging economies, political and economic reforms are
followed by changes in law and regulations, and as we have seen in the past few
decades, Indonesia is no exception. The question we address in this paper is whether
and to what extent these changes have had an impact on the interplay between business
and bureaucrats (Siegel, 2007). Therefore, our main research question focuses on
whether or not political reforms change the economic value of politically connected
firms using data from Indonesian companies. This research is relatively new to the
literature on the economics of PCFs.
Investigating Indonesian PCFs and the impact of political reforms on their
financial performance is relevant for two reasons. First, in 1997 the country was hit by
the Asian financial crisis. This crisis triggered the step-down of President Suharto in
1998. After the Suharto era ended in 1998, the Indonesian political, legal and business
landscape changed dramatically. For one thing, it resulted in a more decentralized
regime that discontinued Indonesia’s crony capitalist model under President Suharto
(Dieleman, 2010). This model was characterized by political and economic dominance of

Chapter 4
105
Suharto and his family, resulting in favouritism of, and rent-seeking behaviour among,
the military, ethnic Chinese conglomerates, indigenous (pribumi) businessmen, and
state-owned enterprises (Brown, 2006). During the reformation era (i.e. the period after
the fall of the Suharto regime), regulations that provided benefits for the military and
Chinese and indigenous business groups were eliminated (Webber, 2006).
Second, even though Indonesia has made improvements regarding its legal
framework and has made efforts to eradicate cronyism and corruption since the early
2000s, the country still suffers from corruption. According to Transparency
International, Indonesia still ranks among the most corrupt countries in the world
(Transparency International, 2017). The existence of close ties between politics and
business is one way through which corruption usually manifests itself. Investigating the
impact of connections between firms and politicians on firm performance may be
instrumental for developing strategies and reforms aimed at reducing corruption.
A few studies have looked into the financial performance of PCFs in Southeast
Asia, including Indonesia. However, most of them used data from the period before the
Asian crisis (Fisman, 2001; Johnson and Mitton, 2003; Imai, 2006). Only a few focused on
the effects of the economic and political changes following the Asian crisis (Faccio, 2006).
Yet, their data were limited to only one or a few years. Therefore, we performed the first
longitudinal study of the impact of political changes following the fall of the Suharto
regime in 1998 on the performance of Indonesian PCFs. In particular, we used hand-
collected data on board members and their political connections during the period 2000-
2011, resulting in a sample of 2,877 firm-year observations. We made a comparison
between the financial performance of PCFs and non-PCFs before and after 2004.
Creating two sub-periods is necessary, because the first democratic presidential elections
in Indonesia took place in 2004. We call the two sub-periods the pre-democratic and
democratic era. The democratic elections of 2004 are a landmark in the political and
economic reform process of Indonesia. Our study allows us to evaluate the impact of
these reforms on the performance of PCFs.

The Value of Political Connections
106
The remainder of this paper is organized as follows. Section 4.2 discusses the
literature on the value of political connections for firms and derives the hypotheses that
are tested in the empirical part of the paper. Section 4.3 provides an overview of the data
and methodology used. Next, section 4.4 presents the results of the empirical analyses,
and section 4.5 discusses their implications. Finally, section 4.6 provides conclusions and
suggestions for further research.
4.2 Literature Review and Hypothesis Development
4.2.1 The value of political connections
In the literature, firms are considered to be politically connected when one or
more of the members of the board is/are a (former) politician and/or this (these)
member(s) has (have) personal ties to the political elite of a country. Research on PCFs
has made use of two main theories to explain the role of politically connected board
members and their contribution to the financial performance of firms.
First, some studies use resource dependence theory when analyzing the financial
performance of PCFs vis-à-vis the performance of non-PCFs. This theory underscores
the fact that for its performance an organization is dependent on the external
environment (Pfeffer and Salancik, 1978; Hillman et al., 2009). When the external
environment is more uncertain, companies search for strategies to reduce environmental
uncertainty. This uncertainty may refer to the availability of resources, the decision-
making process of policy makers and government officials, and the outcomes of this
process that may be relevant for doing business. In this context, companies may
establish relationships with politicians to increase access to relevant resources and to
reduce uncertainty regarding policy decisions and their outcomes (Morck and Yeung,
2004). For instance, Faccio (2010) and Khwaja and Mian (2005), using data for Pakistan,
show that PCFs obtain preferential access to loans from state-owned banks. Johnson and
Mitton (2003) for Malaysia, and Chen et al.(2014) report similar outcomes in Taiwan.

Chapter 4
107
Furthermore, Faccio et al. (2006) show that governments around the world tend
to bail out weakly performing PCFs. Adhikari et al. (2006), Faccio (2010), and Wu et al.
(2012) provide evidence that PCFs experience tax benefits or pay lower tax rates, and
enjoy a lower cost of equity capital (Boubakri et al., 2012). Fisman (2001) shows that for
Indonesian PCFs with close connections to President Suharto’s regime, these
connections had high economic value. Leuz and Oberholzer-Gee (2006) demonstrate that
the Suharto government often arranged preferential financial access for politically
connected business groups, such as Golden Key and the Barito Pacific Group. In short,
these studies show that firms may benefit from establishing political connections in
order to get access to specific resources and to information that may mitigate uncertainty
(Singh et al, 2008).
In contrast, based on agency theory, studies show that political connections may
actually be costly resulting in lower firm value. Shleifer and Vishny (1994) argue that
government officials may make companies less efficient by extracting resources for rent-
seeking activities, for example by demanding bribery payments when providing access
to government projects, state bank finance, etc. In particular, they argue that these rent-
seeking activities increase problems of asymmetric information between the firm
management and investors. Transactions between management and bureaucrats are
often performed secretly. Firms with political connections tend to obscure such
transactions, because they do not want their illicit transactions to become known to the
public. As a result, firms with political connections are considered to be riskier by
investors (Gul, 2006; Bliss et al., 2011) and more opaque (Shleifer and Vishny, 1994; Leuz
and Oberholzer-Gee, 2006; Chaney et al., 2011). Rent-seeking activities by politicians
may thus hamper company performance. Several studies present evidence showing that
PCFs have lower firm value than non-PCFs (see, e.g., Faccio et al., 2006; Fan et al., 2007;
Boubakri et al., 2008; Faccio, 2010; Polsiri and Jiraporn, 2012).
The value of political connections may change if economic and political
conditions change. At the macroeconomic level, the power of political institutions has a
strong impact on how economic resources are allocated among economic actors.

The Value of Political Connections
108
Acemoglu et al.(2005) argue that when the power of the political system in a country is
centralized, economic institutions, such as markets, tend to be less developed. In these
countries, the allocation of economic resources is tightly controlled by the ruling
government. Under these conditions, markets may be far from competitive, because
supply and demand are determined by the state. Although democratization and
economic liberalization are not necessarily positively correlated30, prior research has
confirmed that having a democratic regime is associated with more liberal economic
institutions and better economic outcomes (e.g. Rodrik and Wacziarg, 2005; Huang,
2010; Francis and Ofori, 2015).
At the same time, however, there has been no consensus in the literature about
whether economic liberalization has a positive or negative impact on the value of
business-government ties (Siegel, 2007). Over the last decade, many countries in the
world have reformed their economic system from socialism to a market economy (see,
e.g., China, Russia). Enhancing market competition may have consequences for the
importance of having political connections. Connections with politicians and
bureaucrats may be less effective in a market economy, because business people have
more opportunities to gain access to resources, instead of relying only on the
government. When political power is concentrated, economic actors aim at being
connected to politicians and bureaucrats. This is an efficient way to obtain access to
resources, including favorable licenses and procurement contracts. Thus, the benefit of
political connections is valuable when the political regime is more concentrated and the
economic system is less competitive. However, when the market mechanism is put in
place, the power of bureaucrats to control resources may shrink (Cao and Nee, 2000).
This also means that building close ties with bureaucrats is less useful. This is confirmed
by Fan et al. (2007), Nee (1989), and Guthrie (1998). In particular, Fan et al. (2007)
investigate the performance of 790 newly and partially privatized firms in China and
find that firms with political connections perform worse than those without political
30 Vietnam is an example of a country that has a centralistic government combined with relatively
liberal economic institutions.

Chapter 4
109
connections, indicating that the value of political connections under the decentralized
regime is less important for firms to enhance their performance.
In contrast, some studies contend that political connections may still be
beneficial, even though market competition becomes more intense. These studies argue
that increasing the importance of the market mechanism does not necessarily lead to
changing the importance of political power (Walder, 2003; Walder and Nguyen, 2008).
They point out that the process of economic transition does not necessarily correlate
with the change of the political regime. According to these studies, market reforms may
still need the involvement of bureaucrats with respect to stipulating new regulations.
Yang (2002) asserts that in the Chinese case, bureaucrats still have opportunities to
retain their power as regulators and brokers. Moreover, business people may still need
information from politicians and bureaucrats about market regulations, procurement
processes, etc. to secure market position vis-à-vis their competitors (Park and Luo, 2001).
Accordingly, political connections remain valuable to reduce the uncertainty that is
introduced by regulatory changes and rapid market developments.
4.2.2 Hypothesis development
Since 1999, several changes in the institutional framework have influenced the
relationship between business and bureaucrats in Indonesia. First, the Indonesian
government aimed at changing political institutions. In particular, these changes were
introduced to turn the country into a more democratic nation. Before 1998, the
Indonesian economy had been characterized by crony capitalism. Only three parties
were allowed, that is, Golongan Karya (Golkar), Partai Persatuan Pembangunan, and Partai
Demokrasi Indonesia. Among these three parties, Golkar held the majority of the seats,
meaning that they effectively ruled the government (Ufen 2008, p.332). This allowed the
party to control most part of the economic resources. Even though Indonesia had turned
into an open economy well before the 1997 crisis, the government authority dictated the
allocation of resources. Many business opportunities were limited only to business
groups who maintained a close relationship with the Suharto family. Almost all

The Value of Political Connections
110
Indonesian conglomerates were dominated by the Chinese ancestry groups, which had a
long history of having political connections. Due to these connections, they often gained
special favors during Suharto’s ruling. For instance, the Salim Group (Soedono Salim),
one of the most prominent Indonesian business groups, was granted a favorable license
to import wheat flour, which enabled it to monopolize the flour milling business in
Indonesia (Sato, 1993). This is just one of many examples illustrating that political
connections were highly valuable for Indonesian business groups.
After the step-down of Suharto as president in 1998, the Indonesia government
initiated reforms of its political institutions. More specifically, the country went through
a process of democratic transformation from 1999 until 2004 (BTI, 2003; Webber, 2006).
One important aspect of this transformation was the reform of the Constitution (UUD
1945) in 1999 and 2000, which changed the Indonesian political system. In particular,
reforms included, among other things, a change in the division of powers between the
parliament and the President, direct presidential elections, a limitation of the tenure of
the presidency, and the independence of the judiciary system (Sherlock, 2004; Harijanti
and Lindsey, 2005). In 1999, a multi-party system and a direct poll for the parliament
members were introduced (Suryadinata, 2005). In 2004, the Indonesian government
employed a direct vote for the presidential elections (Ananta et al., 2005, p.67) and one
year later for regional leaders as well.
The change towards a multi-party system had a potentially strong impact on the
landscape of state-business relations. Before the democratic transformation, however
representatives of business built and maintained connections with the three leading
parties, they extended their connections with new political parties after the
transformation took off. At the same time, their motives to get involved with politicians
did not change, as they were still trying to get access to resources such as subsidies,
capital, etc., and information on procurement contracts and trade licenses.
Next to reforming political institutions, the Indonesian government also
established institutional change aimed at improving the business environment by
introducing several new laws and regulations. The years between 1999 and 2004 were

Chapter 4
111
regarded as the period of recovery after being hit hard by the crisis of 1997-1998. The
Indonesian government decided to open up domestic markets to increase competition
and to encourage an investment climate particularly conducive to attracting foreign
investors. Various legal instruments were launched in order to protect consumers’ rights
and society at large, such as the Anti-Monopoly and Competition Law No. 5 of 1999.
Before 1999, the government and political elite did not seriously pay attention to the
development of a competition law because the political and economic circumstances
were unfavorable to do so. Such an initiative would go at the cost of various
monopolistic industries that were protected by the government (Juwana, 2002). Law
No.5 year 1999 prohibits any monopolistic practices that hamper free market
competition. Principally, there are three types of prohibition defined in the Law, i.e.,
contracts (such as cartel, oligopoly, or vertical integration); prohibited activities
(monopoly, monopsony, market dominance, conspiracy); and prohibition against the
abuse of a market dominance (Juwana, 2002). In addition, to enforce the implementation
of Law 5, the Commission for the Supervision of Business Competition (KPPU), an
independent body that has the authority to investigate any violation of unfair business
practices including imposing administrative sanctions, was established in 2000. Overall,
the economic reforms established since the end of the 1990s have reduced governmental
preferential treatment for business groups, prevented markets to be dominated by
monopolies, and created room for new entrepreneurship.
Two other changes stand out when discussing the relationship between
institutional reforms and their impacts on state-business relationships. First, the
Indonesian government started a process of decentralization of political power. Two
laws directed at decentralization were stipulated, i.e. Law 22 of 1999 concerning regional
government, and Law 25 of 1999 on fiscal balance between the central government and
regional governments. Law 22/1999 provided more authority to regional governments
whereby each regional government (district or municipality) had more power to
manage its own budget and resources (Aspinall and Fealy, 2003). In particular, the
regional government had more responsibilities in the field of public works, health,

The Value of Political Connections
112
education, transportation, etc. Law 25/1999 specifically regulated the intergovernmental
financial relations between the central government and local governments. Under this
law, local governments were granted to administer two main sources of revenues i.e.
local-own revenues and intergovernmental transfers (revenue sharing from natural
resources and taxes, general and specific allocation funds) (Brodjonegoro and Asanuma,
2000).
During the period 2000-2003, there were problems regarding the implementation
of these decentralization laws due to the lack of clarity concerning their interpretation
(Brodjonegoro, 2009). Therefore, the decentralization process became ineffective as many
conflicts emerged between the central and local governments, as well as between local
government leaders and local legislative members. This led to negative effects for
society such as creating opportunities for corruption at the decentralized level (Kuncoro,
2006). To cope with these problems, the Indonesian government amended the laws to
ensure that the new laws (Law 22/2004 and Law 33/2004) provide a clearer guidance of
intergovernmental relations. According to the new laws, the local governments obtain
more power, not only politically, but also financially. The amendments have enabled
regional development and budget plans to be more harmonized with local needs in an
effort to promote a well-managed public sector (Brodjonegoro, 2009). Coupled with
simplified bureaucratic procedures, the “real” decentralization era (that is, after Law 32
and 33 were promulgated in October 2004) has led to a focus on promoting
accountability and transparency, which in turn fostered a climate conducive to new
business initiatives.
One important element of the decentralization processes was economic (market)
decentralization, shifting the responsibility of managing resources from the government
to the private sector (Bardhan, 2002). Market decentralization and deregulation facilitate
access to economic resources and stimulate fair competition. It may create more
opportunities for economic actors to obtain resources based on market mechanisms. In
the context of the analysis of the value of political connections in Indonesia after the
step-down of President Suharto, this is an important observation. Because government

Chapter 4
113
power in allocating scarce resources has reduced due to decentralization and
deregulation of markets, the importance of being connected with central bureaucrats has
become less as well.
In addition to changing laws, another radical change of the political framework
occurred in 2004. In July 2004, it is for the first time in the history of the country,
Indonesian people directly voted for the election of the President. The election was an
important milestone in the consolidation of Indonesia’s democratization process (Carter
Center, 2005). Actually, there were three elections in 2004, starting with the
parliamentary elections in April, followed by the first round and second round of the
presidential elections in July and September, respectively (Ananta and Riyanto, 2006).
These elections involved 24 political parties, more than 500,000 polling stations, and
around 150 million eligible voters (Ananta et al., 2005). The elections marked the start of
the road to a democratic state. The direct elections are not only applied to the
presidential candidates but also to local/ regional leader candidates. Starting from June
2005, provincial governors, municipal mayors, and district regents have been elected
directly by local residents.
Kesselman et al. (2013) classify countries into three types of democratic political
systems, i.e., a consolidated democracy, a newly established or transitional democracy,
and an authoritarian political system (pp.27-28). They present seven criteria to assess a
country as a democratic system. These criteria are: (1) free and fair elections of the top
public officers; (2) freedom to organize political parties; (3) transparency and
accountability of elected public officials; (4) strong political rights that is, the right to
voice, participate and vote to select key state officeholders; (5) an independent judiciary
system with a strong rule of law; (6) effective authority of the government; and (7)
commitment to resolve any conflicts peacefully. To what extent a state satisfies these
criteria determines its level of democracy.
Referring to the criteria suggested by Kesselman et al. (2013), we argue that
starting from 2004, Indonesia has entered into a newly established democratic state.
Since then, Indonesian people has been able to vote key public officials in direct, free,

The Value of Political Connections
114
and fair elections; the political rights are guaranteed; people can criticize and voice their
opinion; and citizens have more chance to participate in public decision making.
The change of political institutions may have had several consequences for
business. As the power and authority have shifted more to local governments, business
opportunities may have shifted to the regional level as well. Business no longer depends
on the centralized bureaucratic power. Instead, business may have to invest in good
relationships with local leaders and local parliamentary members (Hadiz and Robison,
2005).
Based on the above discussion, we argue that in the context of Indonesia, with a
more open and democratic political landscape and improved economic institutions,
political connections with the central government have become less important. Since the
early 2000s, the Indonesian state has reduced its power over resource allocation.
Increasing the role of allocation through markets imposes firms to be more innovative
and efficient. This means that business has to enlarge its options to gain access to
resources. Relying (only) on political connections is no longer the best strategy because
the power of bureaucrats diminishes as markets develop (Nee 1989; Cao and Nee, 2000).
We therefore expect that the decentralization and democratization that Indonesia has
experienced since the start of the 2000s, have mitigated the value for firms of having
connections with central bureaucrats and politicians.
On the basis of our discussion in this section, we derive the following hypothesis:
H1: The value of political connections for Indonesian firms is lower in the democratic era
(i.e. after 2004) as compared to the period before the start of this era.

Chapter 4
115
4.3 Data and Methodology
4.3.1 Data sources and sample
For the empirical analysis, we use data for a sample of non-financial companies
listed at the Indonesia Stock Exchange (IDX) for the period 2000-2011. Following Chen et
al. (2011), we exclude all state-owned companies (i.e. when the Indonesian government
is a majority shareholder by holding more than 50% of all outstanding shares) from our
sample and focus only on privately held firms.
We use data from the Indonesian Capital Market Directory for the names of the
members of the board of directors and for the composition of the shareholders. Board
members are categorized as having political connections if they serve (or have ever
served) as a military or government official, or as a member of parliament. To determine
whether a board member serves, or has ever served, as a military31 or government
official and/or as a member of parliament, we collect their curriculum vitae as declared
in the annual reports of the firms on which board they sit. The information contains a
career record of each board member, providing details about their current and previous
positions. When the information is not sufficiently disclosed, we search the internet
using the following combinations of terms:“board member’s name plus CV” or “board
member’s name plus profile (or profil in Indonesian)”.
Much time was spent to manually collect, identify and classify board-level data,
because the type of demographic data of Indonesian board members we need is
unavailable in data offered by providers such as Osiris, Thomson Reuters or BoardEx.
Our efforts allow us to create a unique hand-collected dataset of the composition of
boards of Indonesian firms, focusing on the presence of individuals who have direct
relations with the government. In the empirical analysis, we merge this unique dataset
with data on the financial performance of firms. Financial data are retrieved from
31 The role of the Indonesian military in politics and business has long been acknowledged. During
the New Order era (the Suharto era), the military had a dual function i.e., not only being involved in the national security and defence but also in socio-political affairs (Mietzner, 2006). Military officers were posted in the legislative body and in the government (as a minister, a governor, or an ambassador) (Bhakti et al., 2009). Moreover, the involvement of the military in business has been considered as substantial (Rabasa and Haseman, 2002).

The Value of Political Connections
116
Datastream. In case of missing values in Datastream, we checked and added information
from the annual reports of firms.
4.3.2 Variables
Dependent variables
In this study, we use accounting-based variables to measure firm performance.
This follows previous studies such as Imai (2006), Boubakri et al. (2008), and Faccio
(2010). Several other studies in corporate governance use both accounting-based and
stock market-based performance measures. Yet, in the context of emerging economies,
stock markets are usually not efficient, making stock market-based measures less
appropriate. Cheung and Coutts (2001) find that in Hong Kong, stock prices are not fully
efficient. Other studies confirm that Indonesia’s capital market is inefficient as well,
either in weak or semi-strong form (e.g. Affandi and Utama, 1998; Hermawan and
Subiyantoro, 2006; Bapepam-LK, 2011). In addition, Bhagat and Bolton (2008) argue that
stock market-based performance is deceiving even in a developed market like the one in
the US.
Therefore, we use two accounting-based measurements, i.e. Return On Assets
(ROA), and Return On Equity (ROE). The definition of these measurements is as follows
(Worldscope Database, 2010):
ROA = (net income + ((interest expense on debt-interest capitalized)*(1-tax rate)))
average of last year’s and current year’s total assets*100
ROE = (net income – preferred dividend requirement)
average of last year’s and current year’s common equity*100
We winsorise the data for ROA and ROE at the one percent level for both sides of the
sample to mitigate concerns with respect to outliers.

Chapter 4
117
Independent variables
Political connections
In our analysis, we focus on politically connected board members. Indonesian
companies apply a two-tier board system, so they have two boards: the board of
commissioners32 and the directors. Similar to previous studies (Goldman et al. 2009,
2013; Do et al. 2013; Khwaja and Mian 2005; Houston et al. 2014) a firm is regarded as
politically connected firm (PCF1) if at least one of its commissioners or one of its
directors is:
A current or former parliament member;
A current or former high-ranked government official or a member of the upper
echelons of governmental institutions, such as a director-general, a minister
and/ortop level positions of a government agency (Indonesia Stock Exchange,
Bapepam-LK, Tax, Audit);
A current or former high-ranked military official, i.e. a person who has (had)
obtained a general position;
A current or former political party official, such as the party leader/chair, secretary
general, member of the steering committee, etc.
A former board member (executive or non-executive) of a state-owned company;
A family member (wife/ husband, children, and brothers/ sisters) of a Member of
Parliament or government/political party official.
We create a binary variable, coded as one if the firm has at least one of its
commissioners or one of its directors is politically connected as defined above, and zero
otherwise (labelled PCF1_DUM).
32 Commissioners are the same as non-executive directors, a term that is commonly applied in the
corporate governance literature.

The Value of Political Connections
118
Political change
As described in the previous section, since 1999, Indonesia has moved forward to
becoming a democratic state. Step-by-step, the government has gradually promoted
good governance by being more transparent and accountable which culminated in the
first direct presidential elections in 2004. We argue that starting from 2004 Indonesia has
entered into being a democratic state. This is corroborated by the fact that according to
the Polity IV democracy index (Marshall et al., 2016), Indonesia has shown
improvements since 2004 with respect to its democratic nature. Between 1999 and 2003
the index was 6; between 2004 and 2013 the index improved by two points.33
For the purpose of this research, we split our sample into two periods, i.e. one
period before the democratic era and one during the democratic era, i.e. the periods
before and after the Indonesian government introduced direct presidential elections in
2004. We create a dummy variable (YEAR05-11), which has the value zero for the pre-
democratic era period covering the years 2000-2004; it has the value one for the
democratic era period covering the years 2005-2011. To investigate the hypothesis
predicting that the value of political connections is lower in the democratic era as
compared to the value during pre-democratic era period, the dummy variable is
interacted with the dummy variable of political connections. The interaction variable is
labelled YEAR05-11*PCF1_DUM. This interaction variable captures the idea that during
the democratic era the relationship between political connections and firm performance
changes. That is, the dummy variable capturing the democratic era period moderates the
relationship between political connections and firm performance.
33The Polity IV index ranges from minus 10 (full autocracy) to plus 10 (full democracy). The Polity IV
database has been used in many studies in the field of political economy (e.g. Francis and Ofori, 2015; Girma and Shortland, 2008; Rodrik and Wacziarg, 2005).

Chapter 4
119
Control variables
We use control variables commonly used in previous research on corporate
governance and political connections to account for other firm-level variables that may
influence firm performance, (Bai et al., 2004; Filatotchev et al., 2005; Imai, 2006; Li et al.,
2008). In particular we include the following control variables:
Leverage (LER): Leverage is defined as total liabilities divided by total common equity,
multiplied by100.The leverage ratio is a measure of firm risk.
Operating Profit Margin (OPM): The operating income margin is defined as operating
income divided by total net sales or revenues, multiplied by100.This variable is a
measure of firm profitability.
Sales (SALES): The variable Sales is measured as the natural logarithm of current year’s
total sales. This variable is a proxy of firm size.
Board size (BOARDSIZE): Board size is measured by adding the number of persons
sitting on the board of commissioners34plus the number of persons on the board of
directors, and is transformed into the natural logarithm. We hand-collect the number of
board members for each firm-year included in our dataset. Previous research shows that
board size affects firm performance (e.g. Dalton et al, 1999; Mak and Kusnadi, 2005;
Linck et al., 2008; Guest, 2009). Since board size is not our variable of interest, we do not
predict any direction of its relationship with firm performance. In the analysis, we take
into account the possibility that the relationship is non-linear (the squared form), as the
literature has shown that this may be the case (Arosa et al., 2013).
Share of board of commissioners (BOCSHARE): Following previous studies, we also include
the share of members of the board of commissioners in the total board (i.e. including the
members of the board of executive directors). Thus, we calculate the ratio of all members
of the board of commissioners divided by the number of all board members (Peng, 2004;
Mura, 2007; Jackling and Johl, 2009), multiplied by100.
34 In Indonesia, the supervisory board is called the Board of Commissioners – Dewan Komisaris in
Indonesian. The term and definition are clearly stated in Law No.40/2007 concerning Limited Liability Companies.
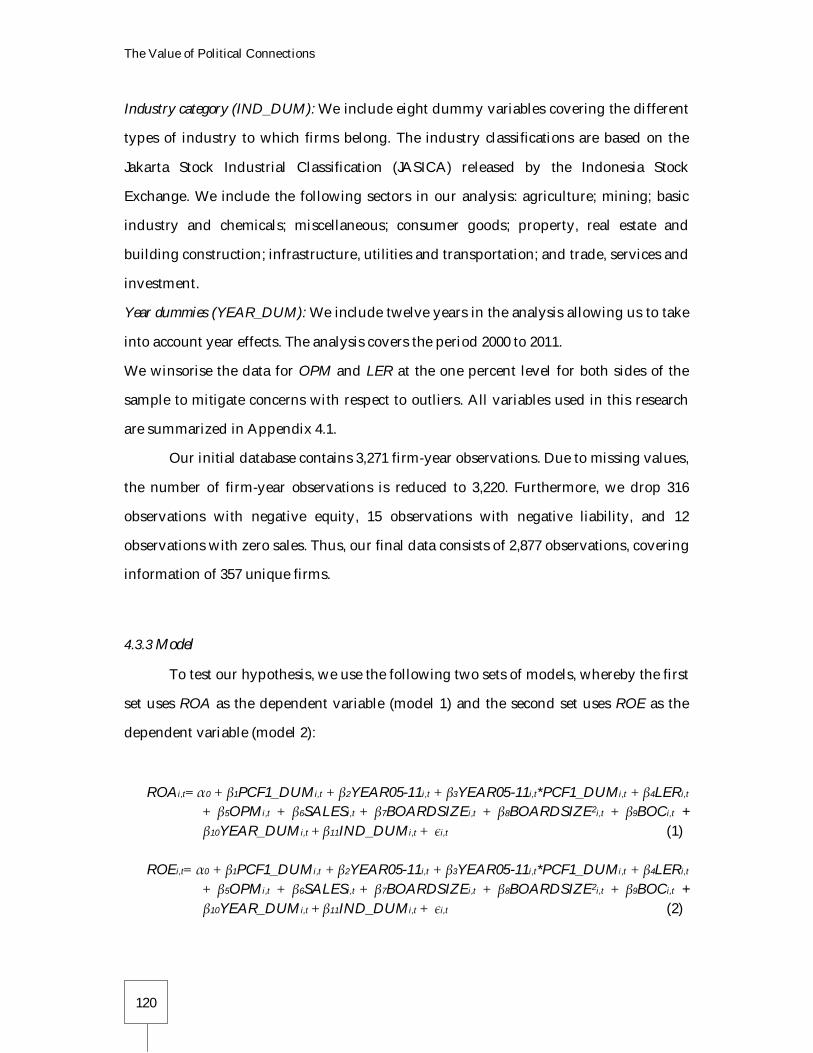
The Value of Political Connections
120
Industry category (IND_DUM): We include eight dummy variables covering the different
types of industry to which firms belong. The industry classifications are based on the
Jakarta Stock Industrial Classification (JASICA) released by the Indonesia Stock
Exchange. We include the following sectors in our analysis: agriculture; mining; basic
industry and chemicals; miscellaneous; consumer goods; property, real estate and
building construction; infrastructure, utilities and transportation; and trade, services and
investment.
Year dummies (YEAR_DUM): We include twelve years in the analysis allowing us to take
into account year effects. The analysis covers the period 2000 to 2011.
We winsorise the data for OPM and LER at the one percent level for both sides of the
sample to mitigate concerns with respect to outliers. All variables used in this research
are summarized in Appendix 4.1.
Our initial database contains 3,271 firm-year observations. Due to missing values,
the number of firm-year observations is reduced to 3,220. Furthermore, we drop 316
observations with negative equity, 15 observations with negative liability, and 12
observations with zero sales. Thus, our final data consists of 2,877 observations, covering
information of 357 unique firms.
4.3.3 Model
To test our hypothesis, we use the following two sets of models, whereby the first
set uses ROA as the dependent variable (model 1) and the second set uses ROE as the
dependent variable (model 2):
ROAi,t= α0 + β1PCF1_DUMi,t + β2YEAR05-11i,t + β3YEAR05-11i,t*PCF1_DUMi,t + β4LERi,t + β5OPMi,t + β6SALESi,t + β7BOARDSIZEi,t + β8BOARDSIZE2i,t + β9BOCi,t + β10YEAR_DUMi,t + β11IND_DUMi,t + єi,t (1)
ROEi,t= α0 + β1PCF1_DUMi,t + β2YEAR05-11i,t + β3YEAR05-11i,t*PCF1_DUMi,t + β4LERi,t
+ β5OPMi,t + β6SALESi,t + β7BOARDSIZEi,t + β8BOARDSIZE2i,t + β9BOCi,t + β10YEAR_DUMi,t + β11IND_DUMi,t + єi,t (2)

Chapter 4
121
The variable names have been explained above, i refers to firms and t refers to
time (year). Both models estimate the relationship between political connections of firms
and their financial performance before and during the democratic era. As discussed
earlier, we predict that the value of political connections is lower during the democratic
era (2005-2011) than the period before the democratic era started (2000-2004). To test this
hypothesis, we use our dummy variable YEAR05-11 and interact it with a dummy
variable capturing whether or not a firm has political connections. We expect that the
variable YEAR05-11 negatively moderates the relationship between the political
connections variable PCF1_DUM and firm performance measured by ROA or ROE.
4.3.4 Data description
Political connections, 2000-2011
Table 4.1 displays information about political connections of Indonesian firms for
the period 2000-2011. We have 2,877 firm-year observations, the 1,380 of which relate to
firms with political connections (column2) and 1,497 to firms without such connections
(column 3). The data set involves 12,093 observations for members of boards of
commissioners (column 5); 2,062 of them are politically connected (column 6). This
means that on average every PCF has between one and two members on the board of
commissioners with political connections. In contrast, the number of the executive
directors with political connections is very small; only 208 of 13,050 members of boards
of executive directors (BOD) have political connections.
Figure 4.1 reports the distribution of politically connected firms by industry. The
figure shows the percentage of PCFs for the periods 2000-2004 and 2005-2011. The
percentage of PCFs varies across industries and across the two periods. While the
property and real estate industry, and consumer goods industry had a decreasing
percentage of political connections from 2000-2004 to 2005-2011, other industries such as
infrastructure and agriculture show an increase in political connections over time.

The Value of Political Connections
122
Table 4.1 Political connections, 2000-2011
Year Total PCF1
Total Non-PCF1
Total Firms
Total number of
commissioners BOC-PC
Total number of executive directors BOD-PC
(1) (2) (3) (4) (5) (6) (7) (8) 2000 65 83 148 606 83 (13.7%) 729 13 (1.8%) 2001 73 99 172 712 85 (11.9%) 806 16(2.0%) 2002 92 106 198 838 123 (14.7%) 898 18(2.0%) 2003 94 120 214 903 129(14.3%) 937 18 (1.9%) 2004 100 115 215 902 140 (14.5%) 932 17 (1.8%) 2005 107 117 224 940 156 (16.6%) 984 16 (1.6%) 2006 112 126 238 1,007 166 (16.5%) 1,060 17 (1.6%) 2007 123 135 258 1,079 186 (17.2%) 1,154 15 (1.3%) 2008 142 141 283 1,188 212 (17.8%) 1,263 19 (1.5%) 2009 147 146 293 1,227 241 (19.6%) 1,295 19 (1.5%) 2010 157 150 307 1,284 262 (20.4%) 1,419 20 (1.4%) 2011 168 159 327 1,407 279 (19.8%) 1,573 20 (1.3%) Total 1,380 1,497 2,877 12,093 2,062 (17.1%) 13,050 208 (1.6%)
Note: BOC-PC (BOD-PC) refers to the number of members of the board of commissioners (executive directors) who are classified as having a political connection.
Figure 4.1 also shows that compared to other industries, the property and real
estate industry had the highest share of politically connected firms,in the period 2000-
2004 (65.6% of the total number of firms in this industry) as well as in the period 2005-
2011 (61.3%). More generally, our data suggests that regulated industries (such as
mining, infrastructure and property) are more likely to engage in political connections
than less regulated industries. The nature of these industries may influence the degree of
firm involvement in political ties (Holburn, 2008). Firms which operate in regulated
industries face more uncertainty, as they are more rigidly affected by public policies and
government intervention (Hillman, 2005; Garcia-Canal and Guillen, 2008; Jimenez et al.,
2014). They should comply with strict regulations, such as environmental disclosures in
mining industry. For these reasons, they have more incentives to develop connections
with politicians and/or individuals connected to the government, because this helps
them reducing the uncertainties they are faced with.

Chapter 4
Figure 4.1 Distribution of PCF1 by industry Data analysis
Table 4.2 presents descriptive statistics of the variables we use in the analysis. We
show descriptive statistics before (original) and after treating (winsorization or natural
log) the data. Looking at the minimum and maximum value of several of the variables
before and after winsorizing the data, winsorization seems justified. Looking at the data
after winsorizaton, average ROA (ROE) of the firms in our sample is 5.9 per cent (5.9 per
cent). The operating profit margin is 4 per cent, while the leverage ratio is 222 per cent.
Our sample has average level of sales of IDR2,373 billion. The average board sizeis 9
members; 48 per cent of them aremembers of the board of commisioners.
Table 4.2 Descriptive statistics
Variable Original Winsorization or natural log Mean Std.Dev Min Max Mean Std.Dev Min Max ROA (%) 6.08 15.72 -146.42 508.71 5.85 9.56 -25.64 40.88 ROE (%) -10.51 850.13 -44,897.39 4,039.12 5.93 32.94 -152.47 118.81 SALES (IDRbln) 2,373.12 6,988.98 0.23 163,000 13.13 1.92 5.43 18.91 LER (%) 446.79 4,785.49 0.19 174,446 222.26 435.35 2.26 3,305.33 OPM (%) -4.44 223.77 -10,481.30 83.95 4.06 30.88 -208.95 50.25 BOARDSIZE 8.69 3.23 4 28 8.69 3.23 4 28 BOCSHARE (%) 48.22 9.54 21.43 80 48.22 9.54 21.43 80
0 20 40 60 80
Agriculture
Mining
Basic Industry
Misc. Industry
Consumer Goods
Property & RE
Infrastructure
Invest & Trading
%
2005-2011
2000-2004

The Value of Political Connections
124
Table 4.3 provides a comparison between PCFs and non-PCFs with respect to the
means of the variables we use in the analysis. PCFs have much higher sales; the
difference is statistically significant (p-value < 0.01). In addition, PCFs have a
significantly higher number of board members and commissioners as compared to non-
PCFs. PCFs have a slightly better perfomance as measured by ROA and ROE as
compared to non-PCFs.
Table 4.3 Comparing politically and non-politically connected firms
Total=2,877 obs PCF1 (1,380 obs) Non PCF1 (1,497obs) t-test Variable Min Max Mean Min Max Mean (mean) SALES(IDRbln) 0.23 163,000 3,443 0.26 52,900 1,387 0.000*** ROA(%) -77.47 146.11 6.28 -146.42 508.71 5.89 0.085* ROE(%) -44,897.39 4,039.12 -20.73 -5,047.37 1,015.92 -1.09 0.016** LER(%) 0.32 103,798.10 458.41 0.19 174,446 436.08 0.048** OPM(%) -10,481.30 76.94 -8.74 -1,258.47 83.95 -0.48 0.001*** BOARDSIZE 4 28 9.73 4 20 7.73 0.000*** BOCSHARE(%) 22.22 80.00 50.03 21.43 75.00 46.54 0.000***
*significant at 10%, **significant at 5%, ***significant at 1%. Note: All values displayed in the table are based on raw data (without treatment). Yet, the t-test for ROA, ROE, LER, and OPM is run using the winsorized mean values.
Table 4.4 illustrates the correlations among the variables. From the table, we do
not find any correlation more than 70 per cent among independent variables. We also
calculate thevariance inflation factors (VIFs) to see whether our data suffer from
multicollinearity. Our results show that all independent variables have a VIF value less
than 2. This suggests that our data do not suffer from multicollinearity problems.
Our variable of interest PCF_DUM has a positive correlation with ROA, but this
correlation is less than 3 per cent, suggesting that on average political connections may
not have a strongly significant effect on firm performance. For ROE, the correlation is 4
per cent and significant at the 5 per cent level.

Chapter 4
125
Table 4.4 Correlations
N =2,877 ROAa ROEa PCF1_DUM
SALES OPM LER BOARD SIZE
BOC SHARE
ROAa 1.000 ROEa 0.692*** 1.000 PCF1_DUM 0.026 0.040** 1.000 SALES 0.354*** 0.257*** 0.238*** 1.000 OPM 0.425*** 0.331*** 0.058*** 0.418*** 1.000 LER -0.138*** -0.278*** 0.031* 0.062*** -0.051*** 1.000 BOARDSIZE 0.224*** 0.148*** 0.320*** 0.567*** 0.187*** 0.015 1.000 BOCSHARE -0.124*** -0.069*** 0.183*** -0.103*** -0.057*** 0.020 -0.070** 1.000
aDependent variables *significant at 10%, **significant at 5%, ***significant at 1%.
4.4 Results
4.4.1 Main results
Our main aim is to investigate the change of value of political connections on
firm performance over time. To address this question, we run regression models (1) and
(2) as defined in section 4.3.3 using fixed-effects estimations. We use the Hausman test,
which confirms we should use fixed-effects instead of random effects estimations. Table
4.5 displays the regression results with ROA and ROE as the dependent variables. The
univariate results in this table suggest that PCFs have a lower ROA and ROE as
compared to non-PCFs: PCF1_DUM has a negative coefficient in columns (2) and (4).Yet,
only one of the two coefficients is statistically significant. The results therefore do not
really support the hypothesis that political connections have an effect on the financial
performance of firms during the period of 2000-2011.
Next, we run multivariate regressions to investigate the value of political
connections in the democratic era (2005-2011) as compared to their value in the 2000-
2004 period. When we interact our political connections variable (PCF1) with the time
dummy indicating the switch to the democratic era, we find a positive coefficient for the
interaction term in regression model (1), that is, the model in which ROA is the
dependent variable (column 3). This suggests that a negative effect of political
connections on financial performance is mitigated during the democratic era. This result

The Value of Political Connections
126
Table 4.5 Regression results
Table 4.5 reports the results of the univariate regressions (column 2 and 4) and the multiple regressions (column 3 and 5). The dependent variable is the winsorized Return On Assets (ROA) and Return On Equity (ROE). PCF1_DUM is a dummy variable equal to one if a firm is politically connected, and zero otherwise. YEAR05-11 is a dummy variable equal to one if a year belongs to the period 2005-2011 (the democratic period), and zero if a year belongs to the period 2000-2004 (before the democratic period).YEAR05-11*PCF1_DUM is the variable of interest, i.e., the interaction between YEAR05-11 and PCF1_DUM. OPM is Operating Profits Margin (winsorized). LER is Liability to Equity Ratio (winsorized). SALES is the natural logarithm of total year-end sales. BOARDSIZE is the natural logarithm of the total number of board members (executive directors plus commissioners). BOCSHARE is the number of members of the board of commissioners divided by the total number of commissioners plus executive directors. Year dummies are yearly-dummy variables for year 2000 to 2011. Industry dummies are dummy variables for eight industry categories. The coefficients are displayed with t-statistics in parentheses.
Dependent variable ROA ROA ROE ROE
(1) (2) (3) (4) (5) Constant 6.403***
(19.93) 7.316 (0.96)
6.902*** (5.59)
34.895 (1.20)
PCF1_DUM -1.150*
(-1.90) -1.015 (-1.49)
-2.020 (-0.87)
3.352 (1.29)
YEAR05-11 0.604 (0.71)
16.521*** (5.07)
YEAR05-11*PCF1_DUM 0.924 (1.51)
-5.403** (-2.31)
OPM 0.077*** (11.66)
0.233*** (9.18)
LER -0.003*** (-6.38)
-0.021*** (-14.07)
SALES 0.775*** (2.95)
0.756 (0.76)
BOARDSIZE -7.401 (-1.11)
-16.638 (-0.65)
BOARDSIZE2 1.298 (0.82)
1.790 (0.30)
BOCSHARE -0.018 (-0.74)
-0.231** (-2.44)
Year dummies No Yes No Yes Industry dummies No Yes No Yes Observations 2,877 2,877 2,877 2,877 R2 (within, between, overall) 0.0014; 0.0139;
0.0007 0.1320; 0.2948;
0.1876 0.0003; 0.0122;
0.0016 0.1447; 0.0628;
0.0599 F-prob. 0.0000 0.0000 0.0000 0.0000 *significant at 10%, **significant at 5%, ***significant at 1% - two tailed.
is not significant, however. We therefore conclude that based on the analysis with ROA
as the dependent variable, we fail to find support for hypothesis 1, that is, we cannot
conclude that the value of political connections is reduced during the democratic era.

Chapter 4
127
When we turn to regression model (2) with ROE as the dependent variable, we
find that political connections do have a positive impact on performance, as PCF1_DUM
has a positive sign, which contrasts our finding in the univariate analysis (see the results
in column 5 as compared to those in column 4). Yet, this result is statistically
insignificant. The results further suggest that the positive effect is mitigated during the
democratic era as the interaction term YEAR05-11*PCF1_DUM is significant and its
coefficient has a negative sign (again, see column 5 in Table 4.5).
The fact that the sign for the variable PCF1_DUM switches from being negative
in the univariate analysis to positive in the multivariate setting suggests that there may
be heterogeneity within the sample with respect to the relationship between political
connections and firm performance. To account for heterogeneity, we split up the sample
in two sub-samples based on the size of companies. The descriptive statistics provided
evidence that larger firms have more political connections. This corroborates findings by
Johnson and Mitton (2003), Faccio (2006), and Faccio et al. (2010) who find that PCFs
have much higher market value and total assets as compared to non-PCFs.
Boubakri et al. (2012) suggest that large firms may enjoy more benefits from such
connections, because larger firms have more resources to get involved in political
activities and/or because political connections may support firms to become more
successful. Moreover, Watts and Zimmerman (1978, 1986) argue that large firms are
more likely to face political pressure from the regulator. To mitigate this political
pressure (such as giving funds to support the government programs, enviromental
issues), being politically connected is valuable (Agrawal and Knoeber, 2001; Hillman et
al., 2004). Finally, the so-called state-capture argument asserts that firms try to influence
policies and regulations in order to promote their private benefits (Bagashka, 2014).
They are willing to spend resources on developing political connections in order to
protect their market dominance or to eliminate the regulatory burden (Desai and
Olofsgard, 2011; Akcigit et al., 2018). Thus, especially larger firms have the opportunities
and resources to engage in developing political connections.

The Value of Political Connections
128
Following Boubakri et al. (2012), we split the sample into small firms versus
largefirms based on their total assets. Firms below (above) the median value of total
assets are classified as small (large). Table 4.6 reports the regression results for the two
firm sub-groups using ROA (columns 2 and 3) and ROE (columns 4 and 5) as the
dependent variable. The results seem different between small and large firms. For small
firms, having political connections negatively affects their performance, at least when
measured by ROA (the results using ROE as a measure for performance suggest
connections do not matter for performance). For large firms, the opposite holds, that is,
political connections positively affect their performance when measured by ROE (the
results using ROA suggest connections do not matter for performance). These results
confirm that larger firms tend to gain from political connections, generating higher
profitability, while small firms may actually lose from having such ties. This finding is in
line with Desai and Olofsgard’s (2008) research. Using the state-capture view, they find
that influential (large) firms are more likely to have excess labor in exchange for special
favors given by bureaucrats. Our data also confirm that on average politically connected
firms are larger (which may result in havinga higher number of employees) as compared
to non-PCFs.
Next, the results in Table 4.6 suggest that for smaller firms the negative impact of
political connections on profitability is weaker after 2004, that is, during the democratic
era. At the same time, the table shows that for larger firms the positive impact of
political connections on profitability also weakens after 2004. These outcomes imply that
during the democratic era small and large firms converge with respect to the value
political connections for their profitability. The positive (negative) impact of political
connections for large (small) firms is weakened during the period 2005-2011. This
suggests that firms that profit from having connections profit less after 2004, whereas
firms that may have lower performance due to having connections are hurt less from
2005 to 2011. Thus, the political and economic trans formation that Indonesia has experi-

Chapter 4
129
Table 4.6 Small firms versus large firms
Table 4.6 shows the results of the regression between small firms (50 per cent below the median value of total assets) and large firms (50 per cent above the median value of total assets). The dependent variable is the winsorized Return On Assets (ROA) and Return On Equity (ROE). PCF1_DUM is a dummy variable equal to one if a firm is politically connected and zero otherwise. YEAR05-11 is a dummy variable equal to one if a year belongs to the period 2005-2011 (the democratic period), and zero if a year belongs to the period 2000-2004 (before the democratic period). YEAR05-11*PCF1_DUM is the variable of interest, i.e., the interaction between YEAR05-11 and PCF1_DUM. OPM is Operating Profits Margin (winsorized). LER is Liability to Equity Ratio (winsorized). SALES is the natural logarithm of total year-end sales. BOARDSIZE is the natural logarithm of the total number of board members (executive directors plus commissioners). BOCSHARE is the number of members of the board of commissioners divided by the total number of commissioners plus executive directors. Year dummies are yearly-dummy variables for year 2000 to 2011. Industry dummies are dummy variables for eight industry categories. The coefficients are displayed with t-statistics in parentheses.
Dependent variable: ROA ROE
(1) Small firms
(2) Large firms
(3) Small firms
(4) Large firms
(5) Constant 10.194
(0.76) 2.857 (0.22)
53.608 (1.11)
59.588 (1.15)
PCF1_DUM -2.529**
(-2.11) 1.038 (1.20)
-2.359 (-0.55)
6.988**
(2.02) YEAR05-11 -2.131
(-1.59) 5.100*** (4.13)
11.245**
(2.34) 26.718***
(5.44) YEAR05-11*PCF1_DUM 2.270**
(2.21) -0.815 (-0.92)
0.035 (0.01)
-8.537**
(-2.42) OPM 0.037***
(5.05) 0.170***
(10.54) 0.142***
(5.40) 0.479***
(7.46) LER -0.004***
(-6.41) -0.001 (-1.10)
-0.028***
(-12.15) -0.016***
(-7.61) SALES 2.093***
(4.97) -0.189 (-0.41)
2.508*
(1.66) -2.153 (-1.19)
BOARDSIZE -26.125**
(-2.02) 2.570 (0.25)
-88.466*
(-1.90) -19.310 (-0.46)
BOARDSIZE2 6.372*
(1.95) -0.861 (-0.38)
22.148**
(1.89) 1.340 (0.15)
BOCSHARE -0.079
(-1.92) -0.002 (-0.08)
-0.396***
(-2.67) -0.157 (-1.24)
Year dummies Yes Yes Yes Yes Industry dummies Yes Yes Yes Yes Observations 1,438 1,439 1,438 1,439 R2 (within,between,overall) 0.1566; 0.1723;
0.1306 0.1500; 0.2252;
0.1519 0.1829; 0.0279;
0.0502 0.1551; 0.0927;
0.1125 F-prob. 0.0000 0.0000 0.0000 0.0000
*significant at 10%, **significant at 5%, ***significant at 1% - two tailed.

The Value of Political Connections
130
enced since 2004, that is the period during which the central government has become
less powerful in distributing resources and competitive markets have become more
important, have diverged outcomes for firms with political connections depending on
the size of the firm.
To summarize, our empirical analyses have so far seemed to indicate that
political connections at best have no impact on firm performance when looking at the
full sample of Indonesian firms. However, the outcomes lead to the possibility that there
is heterogeneity within our sample with respect to the relationship between connections
and performance. When splitting the sample into small and large firms, we find that
whereas for small firms, connections are associated with lower performance, the
opposite holds for large firms. Moreover, we find that the negative (positive) impact for
small (large) firms is weaker in the period after 2004, that is, during the democratic era.
Thus, when the economy and the political landscape transform into a more open and
democratic, the value of political connections for large firms dwindles. At the same time,
for small firms the barriers these connections may raise for performance also diminish
after 2004.
One way of interpreting these findings may be that the value of having political
connections was reduced after the Suharto regime was dismantled. The benefits that
firms gained during the Suharto era by having links to the central government and
military disappeared after the step-down of the President. As the access to resources
controlled by the government is now getting more open to all businesses, political
connections to get access to resources and information from the government are less
valuable. In other words, the access of firms with political connections to resources have
become more restricted as they have to share them more and more with other firms, also
those without such connections. This made connected firms less efficient resulting in
lower performance as they lost their comparative advantage in attracting valuable
information and inputs. However, this only holds for larger firms. Indeed these firms
have more resources to develop connections to the central government. Moreover, larger
firms are also more interesting for the central government to be related to. For smaller

Chapter 4
131
firms, political connections seem to be more like a barrier, i.e. they are costs rather than
being conducive to their performance. Indeed, according to Hadjikhani and Lee (2006),
building political connections is more costly for small as compared to large firms in
relative terms. Due to the scarcity of financial resources they are confronted with, the
costs of developing and keeping political connections small firms have to pay exceed the
benefits they obtain from these connections.
4.4.2 Additional analyses
As an additional analysis, we look at whether political connections matter for
firms being part of a business group as compared to stand-alone firms. As it is generally
known, many publicly listed companies in Indonesia are related to business groups
(Claessens et al., 2000). Like other countries in Asia, business groups in Indonesia play
an important role in the country’s economy (Claessens et al., 2000; Sato, 2003; Dieleman,
2010). According to the resource-based theory, a business group may improve firm
performance by sharing and exchanging valuable resources among affiliated firms
(Chang and Hong, 2000). The transaction costs can be reduced as members of a business
group make use of internal capital and labour markets, allowing them to share key
officers (Silva et al., 2006), intangible assets and innovation (Chang and Hong, 2002;
Hsieh et al., 2010), and preferential loans (Johnson et al., 2000; Berkman et al., 2009).
The existence of business groups and the connections between the firms within
the group opens up the possibility that even though an individual firm may have no
political connections itself, it may still indirectly profit from such connections through its
membership of the group. Thus, an individual firm having no board members with
political connections may still have access to resources supplied by the government,
because these resources are shared with politically connected firms in the same business
group.

The Value of Political Connections
132
To establish whether a firm is a member of one of the business groups in
Indonesia, we use the list of Indonesian richest men provided by Globe Asia (2011). The
list presents the names of Indonesian conglomerates and business groups. Next, we
search on the internet using the phrase “Lippo Group”, “Sinar Mas Group” and so on, in
order to obtain the company names belonging to the respective groups. Furthermore, we
scrutinize one section of the company’s information disclosed in the annual report,
describing the corporate structure in terms of: (1) the composition of its shareholders, (2)
the shareholdings of the company in all affiliated firms and subsidiaries, and (3) related
party transactions.
Based on this information, we can identify the names of publicly affiliated firms
belonging to the group, or the name of the parent company. To explain our approach,
we shortly describe Astra Group as an example. PT Astra Agro Lestari Tbk, one of Astra
Group’s affiliated firms, declares in its annual report that one of its main shareholders is
PT Astra International Tbk. Conversely, we use Astra International’s annual report to
find out that Astra International has several publicly listed subsidiaries such as PT Astra
Otoparts Tbk, PT United Tractors Tbk, including PT Astra Agro Lestari Tbk. Following
this methodology, we are able to reconstruct the set of firms affiliated to different
Indonesian business groups. A politically connected business group is defined if at least
one of the affiliated firms has board member(s) with connections. Note that all business
groups in our sample are politically connected, that is, we have no business groups
without political connections.
To analyze the importance of being member of a business group, we classify
firms into four categories, i.e. (1) business group firms that have political connections
(Type A=632 observations); (2) business group firms without political connections (Type
B=175 observations); (3) stand-alone firms with political connections (Type C=748
observations); and (4) stand-alone firms without political connections (Type D=1,322
observations). First, we compare Type B firms (dummy 1) with Type D firms (dummy 0)
to assess the performance of firms without connections which are part of a business
group vis-à-vis stand-alone firms without connections. Second, we compare the

Chapter 4
133
performance of Type A firms (dummy 1) vis-à-vis the performance of Type C firms
(dummy 0). Third, we compare the performance of Type A firms (dummy 1) with that of
Type B firms (dummy 0). Finally, we compare the performance of all business group
firms (Type A plus Type B = dummy 1) with the performance of all stand-alone firms
(Type C plus Type D = dummy 0).
Table 4.7 shows the regression results for the comparison between the four types
of firms. Column (2) shows that firms without political connections in business groups
(Type B) perform worse than stand-alone firms without connections (Type D) with
respect to both ROA and ROE. The results in column (3) show that if we compare firms
with political connections in business groups (Type A) with stand-alone firms having
connections (Type C), type A firms perform much better than type C firms, indicating
that politically connected business group firms gain more benefits from connections
than politically connected non-business group firms. Moreover, the table shows (see
column (4)) that firms having connections and being part of a business group (Type A)
also perform better than firms being member of a business group with no connections
(Type B).
As discussed above, the results from column (2) imply that firms that have no
connections themselves but that are part of politically connected business groups (Type
B) tend to have lower performance than stand-alone firms without connections (Type
D). We extend the analysis in this column by making a comparison between business
group firms with and without political connections versus stand-alone firms with and
without political connections. We pool together business group firms with connections
and business group firms without connections (Type A and Type B), and compare them
with all stand-alone firms (Type C and Type D). The results shown in column (5) differ
from those in column (2), that is, the results in column (5) show that firms affiliated with
a business group generally tend to perform better than firms not affiliated with any
business group. This finding shows that business group firms with political connections
strongly outperform business group firms without such connections. The outcomes also

The Value of Political Connections
134
indicate that business group firms with political connections are more likely to generate
higher firm performance than stand-alone firms.
The above results suggest that business group firms having no political
connections do not gain from their membership of a business group as they clearly
underperform vis-à-vis business group firms with political connections, but, perhaps
more interestingly, also vis-à-vis stand-alone firms without political connections.
Apparently, although political connections may be one of the business group’s valuable
resources, the benefits of these connections are not shared with non-politically
connected business group firms. This result contrasts with findings presented in other
studies on this issue (Chang and Hong, 2000, 2002; Silva et al., 2006; Hsieh et al., 2010).
Similar to the analysis of the more general case in which we compared politically
connected versus non-connected firms (when we used the dummy variable
PCF1_DUM), we find evidence that the positive relationship between political
connections and performance becomes negative in the democratic era. Column (5)
shows that all affiliated firms being member of business groups experience lower ROA
and ROE in the democratic era as compared to the pre-democratic era. The coefficients
of the variableYEAR05-11*TYPE_DUM are negative (-0.92 when using ROA as the
dependent variable, and -10.98 when using ROE as the dependent variable). Compared
to stand-alone firms, business group firms tend to perform worse in the democratic era.
The negative effect is particularly strong for affiliated firms with political
connections. The interaction effects in column 3 show that the performance of politically
connected firms in business groups drop by 3.6% (in terms of ROA) and 17.9% (in terms
of ROE) in the democratic era. These results are consistent when we compare politically
connected firms with non-politically connected firms in business groups (column 4).
After 2004, business group firms with political connections have lost their value of these
connections.
These outcomes can be explained by pointing out that since the democratic era
set in (that is, after 2004) centralized patronage networks have lost their value.
Historically, business group firms mainly developed political connections with politico-

Chapter 4
135
bureaucrats in Jakarta. Yet, during the democratic era, regional authorities emerged as
vital players for allocating resources. As a consequence, having connections with central
politico-bureaucrats has become less valuable. Many Indonesian business groups firms
face difficulties due to this development, resulting in weaker financial performance. One
illustration of this is the Lippo Group, which is well described by Chua (2008). In his
research of business groups in Indonesia, Chua argued that democracy was perceived as
a threat for the interest of the conglomerates (p.103). The Lippo Group tried to connect
to new political patrons at the regional level, but this strategy failed as its costs turned
out to be high. The turnover of regional politicians turned out to be high, meaning that
firms connected to politicians who had a high potential of not being re-elected next time
(p.104).
4.4.3 Endogeneity
In many cases, corporate governance research, at least potentially, suffers from
endogeneity (Adams et al., 2010). This may also hold for this study. Firms are not
randomly assigned having political connections. Instead, firms may make explicit
choices whether or not they develop political connections. These choices may be driven
by observable and non-observable firm characteristics, that is, political connections may
be endogenous. Not taking into account these characteristics may bias the outcomes of
the empirical analysis.

The Value of Political Connections
Table 4.7 Multiple regressions – business groups
The dependent variable is winsorised Return on Assets (ROA), and Return on Equity (ROE). TYPE_DUM is a dummy variable for each firm type being compared, for instance when comparing Type A and Type C the dummy is 1 for Type B firms and 0 for Type C firms. Type A refers to firms being member of a business group, having political connections. Type B refers to firms being member of a business group, having no political connections. Type C refers to stand-alone firms with political connections. Type D refers to stand-alone firms without political connections. YEAR05-11 is a dummy variable equal to 1 if a year belongs to the period 2005-2011 (the democratic period), and 0 if a year belongs to the period 2000-2004 (before the democratic period). YEAR05-11*TYPE_DUM is the variable of interest, i.e., the interaction between YEAR05-11 and TYPE_DUM. OPM is Operating Profits Margin (winsorised). LER is Liability to Equity Ratio (winsorised). SALES is the natural logarithm of total year-end sales. BOARDSIZE is the natural logarithm of the total number of board members (executive directors plus commissioners). BOCSHARE is the number of members of the board of commissioners divided by the total number of commissioners plus executive directors. Year dummies are yearly-dummy variables for year 2000 to 2011. Industry dummies are dummy variables for eight industry categories. The coefficients are displayed with t-statistics in parentheses.
Dependent variable: ROA ROE ROA ROE ROA ROE ROA ROE Type B=1 vs Type D=0 Type A=1 vs Type C=0 Type A=1 vs Type B=0 Type A&B=1 vs Type C&D=0
(1) (2) (3) (4) (5) Constant 31.379***
(2.79) 75.887*
(1.85) -16.287 (-1.39)
-27.294 (-0.54)
30.057** (1.97)
29.464 (0.43)
6.904 (0.90)
33.485 (1.15)
TYPE_DUM -4.052*
(-1.93) -9.994 (-1.31)
3.577** (2.08)
10.759 (1.46)
2.062* (1.65)
13.817*** (2.45)
0.438 (0.40)
6.122 (1.49)
YEAR05-11 -0.991 (-0.84)
10.199***
(2.38) 4.581*** (3.64)
27.642***
(5.10) 4.506*** (2.63)
32.971***
(4.27) 1.277 (1.54)
17.232***
(5.46) YEAR05-11*TYPE_DUM 1.027
(0.72) 4.216
(0.81) -3.579*** (-3.95)
-17.943***
(-4.61) -2.164 (-1.58)
-18.054***
(-2.93) -0.916 (-1.38)
-10.984***
(-4.35) OPM 0.100***
(10.83) 0.317***
(9.33) 0.061***
(6.48) 0.146***
(3.61) 0.072***
(5.46) 0.174***
(2.94) 0.078***
(11.74) 0.232***
(9.18) LER -0.005***
(-7.30) -0.032***
(-13.18) -0.001
(-1.43) -0.011***
(-5.41) -0.002**
(-2.35) -0.001
(-0.43) -0.003***
(-6.55) -0.022***
(-14.39) SALES 0.488
(1.29) -0.805 (-0.58)
0.653*
(1.70) 2.095 (1.27)
-0.187
(-0.39) 1.223 (0.56)
0.806***
(3.06) 1.142 (1.14)
BOARDSIZE -24.815**
(-2.43) -45.151 (-1.21)
9.274 (0.89)
-4.556 (-0.10)
-21.051 (-1.60)
-43.948 (-0.74)
-7.719 (-1.15)
-19.590 (-0.77)
BOARDSIZE2 5.290**
(2.10) 9.120 (0.99)
-1.906 (-0.80)
-1.185 (-0.12)
4.170 (1.41)
5.596 (0.42)
1.345 (0.85)
2.520 (0.42)
BOCSHARE -0.054 (-1.51)
-0.251*
(-1.93) -0.046 (-1.25)
-0.275*
(-1.73) 0.004 (0.08)
-0.022
(-0.11) -0.021 (-0.84)
-0.246***
(-2.61) Year dummies Yes Yes Yes Yes Yes Yes Yes Yes Industry dummies Yes Yes Yes Yes Yes Yes Yes Yes Observations Type B=175 and Type D=1,322 Type A=632 and Type C=748 Type A=632 and Type B=175 Type AB=807 and Type CD=2,070 R2 (within, between, overall) 0.1939; 0.2290;
0.2042 0.2151; 0.3978;
0.2060 0.1127; 0.2278;
0.1371 0.0942; 0.0489;
0.0206 0.1274; 0.1740;
0.0964 0.1230; 0.1160;
0.0997 0.1316; 0.2953;
0.1880 0.1493; 0.0654;
0.0621 F-prob. 0.0000 0.0000 0.0000 0.0000 0.0000 0.0000 0.0000 0.0000
*significant at 10%, **significant at 5%, ***significant at 1% - two tailed.

Chapter 4
137
To solve potential endogeneity concerns, we use Propensity Score Matching
(PSM) (Boubakri et al., 2012; Brockman et al., 2013; Houston et al., 2014). Using this
methodology requires creating two sets of firms. One set of firms has political
connections (the so-called treatment group), the other set of firms is similar to the
treated firms on a number of dimensions (i.e. they are matched), except for the fact that
the firms in this second set do not have political connections (the so-called control
group). After matching these two sets of firms, differences in financial performance can
be associated with having political connections, as the firms are similar on all other
observable characteristics that may explain firm performance. Using PSM relaxes
functional form assumptions in OLS regression estimations, resulting in more robust
outcomes (Shipman et al., 2017).
We match each observation from the treatment group (that is, politically
connected firms) with one from the control group (firms without political connections)
using total sales, operating profits margin, leverage, board size, board of commissioners
share, firm age, and total number of employees35 to estimate the propensity scores. We
use the nearest-neighbor matching approach with one per cent caliper, that is, each firm
from the treatment group is matched with a firm from the control group for which
propensity scores are as similar as possible, the maximum difference of the estimated
propensity score between a subject and a match being one per cent (one-to-one
matching) (Glazerman et al., 2003).
Before estimating the treatment effects, we need to check the matching quality
(Garrido et al., 2014). Table 4.8 displays the result of the propensity score test. We
observe that almost all covariates are satisfactorily balanced with a bias after matching
being less than 5 per cent (Rosenbaum and Rubin, 1985). For instance, the standardized
difference in the means of BOARDSIZE decreases from 64.6% in the unmatched sample 35 We have tried many combinations of various covariates (based on the variables we already have) to
select which combination is the best. The combination of covariates is regarded as satisfactory if the means of each covariate between the treated and the control groups are the same. Frequently, two or three covariates out of various covariates fail to reach the balancing property. After dozen times of ‘add-and-drop’, we find the best choice of a covariate combination including total sales, operating profits margin, leverage, board size, board of commissioners share, firm age, and total number of employees.

The Value of Political Connections
138
to -3.1% in the matched sample. Only LER and BOCSHARE have a bias of more than 5
per cent after matching, but the biases are not extremely high (6 and 8 percent,
respectively). The t-test between treated and control groups shows that the means of
each covariate do not differ after matching (the only exception is LER which is
significant at the 5% level).
Table 4.8 Balancing test
Table 4.8 shows the results of the balancing test to check the matching quality between treated groups and control groups. The covariates (variables) we use to estimate the propensity scores are total sales (SALES), operating profits margin (OPM), leverage (LER), board size (BOARDSIZE), board of commissioners share (BOCSHARE), firm age (FIRMAGE), and the number of employees (EMPLOYEES). %bias is the standardized difference in the mean of each covariate (in percentage) between the treated group and control group, in the unmatched sample and in the matched sample. %reduction ǀbiasǀ is the reduction percentage absolute bias from the unmatched sample to the matched sample. t-test is to compares between the mean of the treatment group and the mean of control group, whether the two means are statistically different (t-value ≥ 1.96 and p-value ≤ 0.05) or not (t-value < 1.96 and p-value > 0.05).
Covariate Sample Mean
%bias %reduction t-test
Treated Control ǀ bias ǀ t-value p> ǀ t ǀ SALES Unmatched 3.4e+06 1.4e+06 29.3 7.97 0.000 Matched 2.8e+06 3.1e+06 -4.1 85.9 -1.15 0.251 OPM Unmatched -8.74 -0.48 -3.6 -0.99 0.322 Matched -1.60 -1.60 0.0 100.0 0.00 1.000 LER Unmatched 458.41 436.08 0.5 0.13 0.900 Matched 463.91 167.24 6.2 -1228.3 2.50 0.013 BOARDSIZE Unmatched 9.73 7.73 64.6 17.40 0.000 Matched 9.59 9.68 -3.1 95.2 -0.72 0.472 BOCSHARE Unmatched 50.03 46.54 37.1 9.95 0.000 Matched 49.82 49.09 7.8 78.9 1.95 0.051 FIRMAGE Unmatched 28.27 24.42 27.1 7.30 0.000 Matched 28.11 28.68 -4.0 85.2 -0.93 0.352 EMPLOYEES Unmatched 3,844.00 2,275.00 20.4 5.53 0.000 Matched 3,455.20 3,668.30 -2.8 86.4 -0.73 0.465

Chapter 4
139
Table 4.9 shows the summary of the balancing test. The R-squared (Pseudo R2) in
the matched sample is very small (0.9%), indicating the similarity between the treated
and control groups for all covariates. The likelihood Ratio Chi-square (LRchi2) in the
matched sample is also much lower than in the unmatched sample (33 versus 466),
which means that the distribution of all covariates in the treatment group and the
control group after matching is rather similar. Finally, the mean and median
standardized difference for all covariates before matching is 26 and 27; after matching it
reduces to only 4. This again suggests that our matching efforts result in two groups (the
treated and the control group) that are highly comparable with respect to a significant
number of observable characteristics.
Table 4.9 Summary of balancing test
Table 4.9 is the summary of the balancing test for all covariates. Pseudo R2 is Pseudo R-squared, the statistical parameter for maximum likelihood estimates to measure variability of a logistic model. LRchi2 is Likelihood Ratio Chi-square, the deviance test statistic. Mean/median bias is the discrepancy of the parameter between the treated group and control group.
Sample Pseudo R2 LR chi2 Mean Bias Median Bias Unmatched 0.117 466.30 26.1 27.1
Matched 0.009 32.79 4.0 4.0
Table 4.10 reports the results of the PSM estimation, separating firms into two
sub-categories, that is, large and small firms. For PCF1_DUM the results are presented
from column (1) to column (4). For PCF1_DUM, before 2005 large firms with political
connections tend to have a higher ROA (ROE) than large firms without political
connections. In contrast, in the democratic era (2005-2011) the average treatment effect
becomes negative, meaning that large firms with political connections lose their
importance of connections. The results of the PSM estimation thus largely confirm the
outcomes discussed earlier.

The Value of Political Connections
140
Table 4.10 Average treatment effects
Table 4.10 presents the treatment effects of profitability between PCFs and non PCFs, using the propensity-score matching estimation. The dependent variable is Return On Assets (ROA) and Return On Equity (ROE). Average Treatment Effects on Treated (ATET) is a coefficient to measure the average effect received by the treatment group (PCFs). PCF1_DUM is a dummy variable equal to one if a firm is politically connected, and zero otherwise.
Dependent variable ROA – PCF1 ROE – PCF1 (1) (2) (3) (4) Panel A. All years 2000-2011 Small firms Large firms Small firms Large firms ATET t-stat
-0.92
-1.09 -0.62 -0.87
-0.36
-0.14 -2.13 -1.00
Observations 1,438 1,439 1,438 1,439 Panel B. 2000-2004 Small firms Large firms Small firms Large firms ATET t-stat
-1.84
-1.30 1.68 1.27
4.77
1.02 9.78 1.58
Observations 575 372 575 372 Panel C. 2005-2011 Small firms Large firms Small firms Large firms ATET t-stat
-0.08
-0.08 -0.80 -0.99
2.05
0.56 -3.86* -1.78
Observations 863 1,067 863 1,067 *significant at 10%, **significant at 5%, ***significant at 1%.
4.5 Discussion and Analysis
In general, our research finds that politically connected firms show lower financial
performance than firms without political connections. This result is consistent with
previous studies showing that political connections harm firm performance (Fan et al.,
2007, Siegel, 2007; Boubakri et al., 2008; Faccio, 2010). If we split the sample into small
and large firms, large firms with political connections show stronger financial
performance as compared to the performance of large firms with no political
connections. The opposite holds for small firms. These results suggest that firm size
matters for the value of political connections. We explain this by arguing that large firms
face more political pressures from the regulators (Watts and Zimmerman, 1978, 1986).
To mitigate the pressure, being politically connected is valuable (Agrawal and Knoeber,
2001; Hillman et al., 2004; Gray et al., 2016). Another explanation may be that larger firms
potentially have more resources to develop political connections (Boubakri et al., 2012).

Chapter 4
141
At the same time, these firms may also be more attractive for (former) high-rank
government officials or politicians to be on their board.
We also find that the change to the democratic era has an impact on the value of
political connections for both small and large firms. For small firms, the negative
magnitude of political connections on performance is attenuated after 2004.In contrast,
for large firms the positive impact of political connections on their performance is
smaller during the democratic era. These findings imply that the value of political
connections both for small and large firms are converging, which we interpret as
evidence for the fact that the value of political connections is reduced during the
democratic era. These results also hold when we apply propensity-score matching to
control for potential endogeneity.
Our results thus support the hypothesis that the impact of political connections
on firm performance is less pronounced in the democratic era. This may indicate that in
the democratic era when markets develop, the value of political connections is lower,
because the authority of the bureaucracy becomes less powerful. Our findings are in line
with the view of Cao and Nee (2000) regarding the impact of market transition. They
assert that the power of bureaucrats will be impaired when the economy is more open.
Fan et al. (2007), and Siegel (2007) also provide evidence that politically connected firms
perform worse during a period of decentralization. In our case, firms having connections
with the central bureaucrats in Jakarta have suffered in terms of their financial
performance during the democratic era as during this period there was a shift of power
from the central government to the regional authorities.
The change of the political landscape in Indonesia after 2004 was conducive to
this power shift. The free and open elections facilitated regional parliamentarians and
local leaders to increase their authority. This also meant that businesses needed to build
new connections with politico-bureaucrats at the local level (Hadiz and Robison, 2005
p.232). This, however, appeared to be a costly and time-consuming process, which may
have contributed to the decreasing performance of especially the large business group
firms with political connections to politicians in Jakarta.

The Value of Political Connections
142
4.6 Conclusions
This paper has investigated the effect of political connections on firm performance and
the impact of institutional change. In studying this topic we draw from Indonesia’s
political and economic transition since the late 1990s, which provides a unique research
setting to study the role of political connections in the context of changing political and
economic conditions. We designate the year 2005 as a starting point of the democratic
era after Indonesia introduced a direct presidential election in 2004. Our prediction is
that during the democratic era when markets are more open and the government is less
powerful, the value of political connections will shrink. While our full sample fails to
support the hypothesis, when bisecting into small and large firms, the empirical results
show the impact of connections on performance converges for the two groups, which
suggests that the value of political connections decreases during the democratic era.
In general, our results provide empirical evidence that politically connected firms
have lower firm performance than firms without such connections, which is consistent
with prior findings such as Fan et al. (2007), Boubakri et al. (2008), and Faccio (2010). Our
results also show that being politically connected is beneficial especially for large firms
and for firms that belong to a business group. To account for endogeneity problems, we
use Propensity Score Matching (PSM). The PSM estimations support our main results,
that is, politically connected firms have lost value of political connections during the
democratic era.
This study has a number of caveats. First, our study focuses on accounting
indicators to measure performance. Further research may test the value of political ties
utilizing other proxies such as financing costs (Su and Fung, 2013; Harymawan, 2018),
government procurement allocation (Goldman et al., 2009, 2013; Gürakar and Bircan,
2016), or market value (Wong, 2010; Gray et al., 2016) in order to better understand
channels through which political connections provide benefits to firms.

Chapter 4
143
Second, future research may dig deeper into the background of board members,
when and how they were appointed and when and why they left the board. The data we
have used for this research project do not allow for such a dynamic analysis.
Finally, it would be interesting to analyze to what extent local and/or regional
politicians and leaders are members of boards. Especially after 2004, when
decentralization played a major role in Indonesia’s economic and political development,
regions became important players. Connections to regional leaders may have actually
replaced the importance to connections to the central government. We leave this and the
other questions for potential future research.

The Value of Political Connections
144
Appendix 4.1 Variable Definitions
Variable
Definition
Return On Assets (ROA) (net income + ((interest expense on debt-interest capitalized)*(1-tax rate)))
average of last year’s and current year’s total assets*100
Return On Equity (ROE) (net income – preferred dividend requirement) average of last year’s and current year’s common equity*100
PCF1_DUM dummy variable, coded one (1) if the firm at least one of its
commissioners or one of its directors is politically connected, and zero (0) otherwise.
YEAR05-11 dummy variable, coded one (1) for the democratic period between 2005 and 2011, and zero (0) for the pre-democratic period between 2000 and 2004.
YEAR05-11*PCF1_DUM moderating variable, the interaction variable between YEAR05-11 and PCF1_DUM.
Leverage (LER) the ratio of total liabilitiesto total common equity, multiplied by 100.
Operating Profit Margin (OPM)
the ratio of operating income to total net sales or revenues, multiplied by 100.
Sales (SALES) the natural logarithm of current year’s total sales.
Board size (BOARDSIZE) the natural logarithm of the number of persons sitting on the board of commissioners plus the number of persons on the board of directors.
BOARDSIZE2 the natural logarithm of board size squared.
Share of board of commissioners (BOCSHARE)
the ratio of all members of the board commissioners to total board (all members of board of commissioners and board of directors), multiplied by 100.
Industry category (IND_DUM)
dummy variables indicating the industry to which a firm is.
Year dummies (YEAR_DUM)
dummy variables indicating the year of observation, i.e. 2000 – 2011.

Chapter 5
145
Chapter 5 Boards, Transparency, and Earnings
Management: Evidence from Indonesian Listed Firms36
Abstract
This paper aims at investigating the relationship between board inputs and earnings management as well as the relationship between board inputs and the level of transparency and disclosure. More specifically we examine the mediating effect of transparency and disclosure on earnings management. We develop three constructs measuring the level of board inputs, i.e. board skills, board commitment, and board structure. We use data from 104 listed non-financial Indonesian firms for which we have detailed data on their governance from the ASEAN Corporate Governance Scorecard for the years 2013, 2014, and 2015. The research finds that board inputs are not directly associated with earnings management. At the same time, the research finds that these inputs are positively associated with the level of information disclosure. Most importantly, the research finds that board skills and board commitment (but not board structure) mitigate earnings management indirectly through mandatory disclosure, but not through voluntary disclosure. Our findings suggest that mandatory disclosure plays a mediating role between board inputs and earnings management. Overall, these results imply that the monitoring role of the boards of Indonesian firms needs to be improved, particularly to enforce firms to comply with mandatory requirements. Moreover, our findings suggest that regulatory power of the Indonesian regulatory authority should be enhanced, that is, it should develop measures and instruments allowing it to better monitor compliance with these requirements. Keywords: Board inputs, transparency and disclosure, earnings management
36 This chapter is co-authored with Niels Hermes and Sidharta Utama. The name of each co-author is
listed based on his contribution to the research in descending order. I really appreciate Prof. Reggy Hooghiemstra for his useful comments on the earlier version of this paper.

Boards, Transparency, and Earnings Management
146
5.1 Introduction
In the finance and accounting literature, earnings management is described as the use of
accounting methods by managers to influence reported earnings (Chen et al., 2015a).
Managers use these methods to serve their own interests, rather than those of investors
and other stakeholders. Accounting methods used to perform earnings management are
not illegal; they are allowed within the boundaries of existing accounting standards and
regulations. Yet, research has shown that earnings management has a negative impact
on firm value (e.g., Kuang, 2008; Bergstresser and Philippon, 2006; Palmrose et al., 2004).
This is why earnings management is considered to be a potential source of agency
problems. Effective monitoring by the board is generally seen as a way to reduce this
type of agency problems.
Several studies have investigated the relationship between various board 37
features and earnings management (see, e.g., Peasnell et al., 2005; Carcello et al., 2008;
Jaggi et al., 2009; Jackling and Johl, 2009; Marra et al., 2011; Khalil and Ozkan, 2016).
These studies focus on the monitoring role of boards and how this contributes to
reducing earnings management. They use board characteristics, composition and
structure as proxies of the effectiveness of boards performing their monitoring role. The
empirical evidence on the effectiveness of monitoring by the board in controlling
earnings management has so far been inconclusive (Hermalin and Weisbach, 2003;
Rhoades et al., 2000). Some studies find that boards are effective in reducing earnings
management (Uzun et al., 2004; Peasnell et al., 2005; Jaggi et al., 2009; Marra et al., 2011).
Other studies, however, do not find evidence that boards are effective in mitigating
earnings management (Park and Shin, 2004; Jackling and Johl, 2009; Khalil and Ozkan,
2016).
Yet, these studies analyse the direct relationship between the performance of
boards and earnings management. In this study, we argue that the association between
boards and earnings management is not necessarily direct. Instead, we hypothesize that
37 In this study, boards refer to the non-executive board (or supervisory) board members. In
Indonesia, the supervisory board is known as the board of commissioners.
Chapter 5
147
boards may determine earnings management indirectly, by influencing the extent to
which management is transparent and discloses information to its stakeholders about
the performance of the firm (Cheng and Courtenay, 2006; Rao and Tilt, 2016), which in
turn reduces the possibilities of applying accounting methods that inflate (or deflate)
reported earnings. Thus, the level of corporate transparency limits management’s
discretion to manipulate earnings (Richardson, 2000).
To the best of our knowledge, this is the first study investigating the indirect
effect of boards on earnings management. Our analysis is based on data from the 104
largest Indonesian listed companies covering the years 2013-2015. Indonesia provides an
interesting institutional setting for a study on the role of boards in affecting earnings
management as it is characterized by a weak institutional environment, in which the
disclosure of information is more opaque and market mechanisms are less developed,
reducing their role in disciplining management. In such an environment, the role of
boards may be all the more important in dealing with agency problems such as earnings
management (Bhattacharya et al., 2003; Claessens and Fan, 2003).
In the analysis, we use three constructs to measure specific board characteristics.
These board characteristics enable boards to effectively carry out their role of monitoring
management. In particular, we develop constructs measuring board skills, board
commitment and board structure. Each construct is based on a number of questions
from a survey carried out by the Indonesian Institute for Corporate Directorship (IICD),
a non-profit organization aiming at promoting best practices of good corporate
governance. The survey is based on the ASEAN Corporate Governance Scorecard
(ACGS). The questions used in this survey are mainly derived from the OECD Principles
of Corporate Governance, and several items from international and regional best
practices (ADB, 2016).
Our results show that board skills, board commitment, and board structure do
not have a direct impact on reducing earnings management. In addition, the results also
show that the level of information disclosure is positively and significantly determined
by board skills and board commitment. Most importantly, we find that board

Boards, Transparency, and Earnings Management
148
commitment mitigates earnings management indirectly through higher levels of
mandatory disclosures, but not voluntary disclosures. Our findings indicate that the
level of information disclosure plays an important role as a mediating variable.
The findings in this study are relevant for emerging economies in general, and
for Indonesia in particular. Many emerging economies have introduced codes of
corporate governance during recent years. Among other things, these codes discuss
mandatory and voluntary disclosure rules. In practice, firms may not follow voluntary
and/or mandatory disclosures, because complying with them may be costly. Such
behavior is possible when boards are weak and are unable to monitor and enforce
higher disclosures, and when compliance is not monitored effectively by financial
markets and/or regulators. Lack of effective monitoring of compliance with regulations
is particularly at stake in emerging economies, where corporate governance mechanisms
such as boards, as well as formal institutions, such as financial markets and regulatory
power and authority are usually weaker.
The remainder of this paper is organized as follows. Section 2 discusses the
related literature. Section 3 contains a description of the sample and the variables used
in the model. Section 4 discusses the results, and Section 5 concludes the analysis.
5.2 Literature Review and Hypotheses Development
5.2.1 Earnings management, information disclosure and transparency, and the board of
directors
Earnings management refers to the intention to manage reported earnings by
management or other insiders. Schipper (1989, p.92) defines earnings management as
"...a purposeful intervention in the external financial reporting process, with the intent of
obtaining some private gain." In a similar vein, Healy and Wahlen (1999, p.368) assert
that "earnings management occurs when managers use judgment in financial reporting
and in structuring transactions to alter financial reports either to mislead some

Chapter 5
149
stakeholders about the underlying economic performance of the company or to
influence contractual outcomes that depend on reported accounting numbers."
Research has provided several explanations as to why managers commit earnings
management. The explanations relate to executive remuneration policies (Healy, 1985;
Bergstresser and Philippon, 2006; Johnson et al., 2009), meeting debt covenants (DeFond
and Jiambalvo, 1994; Holthausen et al., 1995; Dechow et al., 1996), and beating analysts'
forecasts (Ayers et al., 2006; Brown and Pinello, 2007). In all these cases, the driving force
for why managers may commit earnings management is that they are typically assessed
on the basis of their ability to meet earnings targets. These targets may be important in
determining their actual remuneration, the debt payments that have to be made and/or
the market’s perception of the performance of the firm. If the targets cannot be met,
managers may have incentives to commit earnings management (Dechow and Skinner,
2000). Although earnings management is allowed within the boundaries of existing
accounting standards and regulations, it is considered unethical as the intention is to
cheat financial statement users (Kaplan, 2001).
In the corporate governance literature, the non-executive directors (board of
commissioners) are seen as an important mechanism in disciplining top management by
monitoring their behaviour, such as earnings management. The discussion in the
literature focuses on the quality of the board enabling its members to carry out their
monitoring tasks. To capture board quality, researchers use measures of the structure
and composition of the board, as well as measures of the commitment and competence
of board members. To analyse the effectiveness of boards in carrying out their
monitoring role, they examine whether board inputs such as structure, composition,
commitment, and competence influence board output variables, such as information
disclosure, risk taking, etc. and/or firm value of other firm-level output variables (see,
e.g., Gul and Leung, 2004; Subramaniam et al., 2009; Bhagat and Black, 2002; De Andres
et al., 2005; Lam and Lee, 2012; Ahn and Shrestha, 2013; Ahmed et al., 2006; Alves, 2013;
Ran et al., 2015).

Boards, Transparency, and Earnings Management
150
In this paper, we investigate whether board monitoring can reduce earnings
management. While this relationship has been analysed before (see, e.g., Peasnell et al.,
2005; Rahman and Ali, 2006; Jaggi et al., 2009; Marra et al., 2011; Chen et al., 2015b), we
take a different approach. In our research framework, we focus on specific board
characteristics and their impact on both board and firm outputs. In particular, we
hypothesize that board inputs affect firm output directly and indirectly, through their
impact on board output variables that in turn affect firm output. Board output refers to
how effective the board performs its control and service tasks (Forbes and Milliken,
1999). The control task stresses the fact that the board’s role is to ensure investor
protection by monitoring the behavior and decision making of the top management
team. We measure board inputs as board skills, board commitment (i.e. the time board
members devote to their tasks), and board structure and composition (Forbes and
Milliken, 1999; Cornforth, 2001). Earnings management is our measure of firm output,
whereas information disclosure and transparency of information reporting by
management are used as board output measures.
Information disclosure refers to the process of making corporate information
publicly available and accessible. Depending on how information is disclosed, the firm
may contribute to increasing the transparency regarding its performance. By disclosing
information and increasing transparency, a firm can be held accountable on its
performance by its stakeholders. Ensuring information disclosure and transparency is
part of the board’s monitoring tasks, which can mitigate asymmetric information
problems between management and shareholders (Leuz and Verrecchia, 2000; Brown
and Hillegeist, 2007). High-quality disclosures enable investors to evaluate firm
performance better, which reduces the probability of over- or undervaluing the firm and
may attract investors (Grossman, 1981; Milgrom 1981). By increasing the level of
information disclosure, firms can obtain benefits such as enjoying lower cost of capital
(Kim and Verrecchia, 1994; Botosan, 1997) and higher firm value (Lang and Lundholm,
1993; Chi, 2009; Jiao, 2011; Sharif and Lai, 2015).

Chapter 5
151
Figure 5.1 describes our research setup. Path A describes the effect of board input
variables on firm output (e.g. earnings management). Path B describes the direct impact
of board inputs may have on board output variables (e.g. information disclosure and
transparency). Path C, finally, shows how board output may affect firm output.
Combining path B and C allows us to investigate whether and to what extent board
output (i.e. disclosure and transparency) mediates the relationship between each board
input (board skills, commitment, and structure and composition) and earnings
management. Such a mediation analysis thus allows us to investigate whether board
inputs affect earnings management indirectly by directly influencing levels of disclosure
and transparency of information reporting by management. This investigation is
motivated by previous research that argues that it is important to understand the
mechanism through which board inputs affect firm output (Bhattacharya et al., 2012;
Goh et al., 2016). For instance, Goh et al. (2016) find that transparency is an important
mediating mechanism between board independence and information asymmetry. This
has inspired us to research whether board inputs reduce earnings management through
transparency and disclosure of information reporting.
Board Inputs (X)
- Skills and Competencies
Board Output (M)
Firm Output (Y)
- Time Commitment
- Transparency & Disclosure
- Earnings Management
- Structure and Composition
Figure 5.1 Research framework
A
C B

Boards, Transparency, and Earnings Management
152
5.2.2 Hypotheses development
Board inputs and earnings management
As discussed earlier, one important task of the board is to monitor management
to protect investors from opportunistic behavior of managers. The existing research
commonly investigates the association between various features of the board of directors
and firm-level outcomes such as earnings management. In our research, we develop
three constructs as board inputs, reflecting the extent to which boards are able to carry
out their monitoring role effectively.
Skills and competencies
Forbes and Milliken (1999) assert that the presence of relevant skills and
competencies is required to make a board effective in monitoring the behavior of
managers. Forbes and Milliken (1999) categorize knowledge and skills into functional
area competencies and skills (such as finance, accounting, law, etc.) and firm-specific
competencies and skills (such as banking, manufacturing, etc.).
Having directors with accounting and finance expertise, and directors with prior
experience in the same industry in which the company is operating in, are examples of
valuable skills and competencies that increase the effectiveness of monitoring by boards.
Hillman and Dalziel (2003) argue that board capital (defined as human capital and social
capital) has a positive impact not only on the board advisory role but also on the board
monitoring role. Similarly, Carpenter and Westphal (2001) find that directors who have
past experience in the same industry are better able to monitor. If directors have
accounting or financial expertise, the likelihood of earnings management will be
decreased (Park and Shin, 2004; Hsu, 2015). Other prior studies also indicate that
experience and educational background improve the board capability to monitor
(Anderson et al., 2011; Jermias and Gani, 2014).
Based on the above discussion, we suggest that a board with skills and
competencies relevant for its monitoring task will be able to carry out its monitoring role
more effectively, leading to better firm-level outcomes. In particular, we expect that the

Chapter 5
153
better the monitoring task can be performed due to the presence of relevant skills and
competencies, the more effective the board will be in limiting earnings management
practices. Thus, we hypothesise that:
H1: A higher level of board members’ skills and competencies relevant for the monitoring
task of boards is negatively associated with the level of earnings management.
Time commitment
The extent to which board members can invest in carrying out their monitoring
task is restricted by the time they have available for this task, i.e. the time allotted to
monitoring management. Prior studies have used meetings and attendance to measure
the board members’ time commitment to their monitoring role. It is argued that the
higher frequency of board meetings may lead to enhanced board effectiveness as it
indicates the activity of board task in monitoring (Chen et al., 2006; Xie et al., 2003;
Vafeas, 1999). The number of meetings is an important mechanism to measure the
directors' monitoring effort (Adams, 2003; Brick and Chidambaran, 2010). Previous
empirical studies confirm the negative association between time commitment and
earnings management. For instance, Sarkar et al. (2008) find that diligent boards are
associated with lower earnings management. Xie et al. (2003) show that both board and
audit committee meeting frequencies are related to reduced discretionary accruals.
Corporate governance scholars also argue that directors who are sitting on
several boards at the same time (that is, they have multiple directorships) will be too
busy. The busyness hypothesis postulates that overcommitted directors have a negative
effect on monitoring performance. Due to their busyness, they may be less committed
and be less effective in monitoring (Ferris et al., 2003; Fich and Shivdasani, 2006; Jiraporn
et al., 2009a; Jiraporn et al., 2009b; Cashman et al., 2012)38. We therefore argue that board
38 Other scholars claim a different view. They argue that directors who sit on the board of several
companies have more experience and stronger networks, which may contribute to firm performance (Ferris et al., 2003; Jiraporn et al., 2008; Clements et al., 2015). This view is commonly

Boards, Transparency, and Earnings Management
154
members who limit the number of board positions they have in other companies will
have more time for monitoring, which positively affects the quality of their monitoring
abilities.
Summarizing the above discussion, we expect that board members who have
committed to devote their time to the company will be more effective in monitoring.
Therefore, we hypothesise that:
H2: A higher level of time board members commit to their work on boards is negatively
associated with the level of earnings management.
Structure and composition
Scholars have used various board structure characteristics in their research such
as size, diversity, the presence/absence of committees, board composition, etc. In this
research, we focus on one dimension of board structure and composition that has been
widely used in the literature, i.e. board independence (Beasley, 1996; Peasnell at al.,
2000; Alves, 2014; Chen et al., 2015b). The main reason for focusing on independence is
data driven. Our empirical analysis is based on data on board scorings provided by the
ASEAN Corporate Governance Scorecard (ACGS). These scorings are based on
questionnaires related to board structure focusing mainly on board independence.
Studies on board structure and its impact on firm-level outcomes suggest that
board independence is important to effectively monitor the behavior and performance
of management. Board members are assumed to be independent when, among other
things, they have no direct or indirect material relationship with the company on which
board they serve, are not an employee of this company, and have no business or family
relationship with the company, its management and/or shareholders. The board of
directors with a majority of independent directors is believed to be more vigilant in
called the experience hypothesis (Clements et al., 2015), which is basically taken from resource dependence theory (Hillman et al., 2009). This hypothesis is related to the advisory role by boards (Pfeffer and Salancik, 1978; Hillman and Dalziel, 2003).

Chapter 5
155
monitoring managerial behaviors by providing objective opinions (Pritchard, 2009;
Hillman et al., 2011). The monitoring abilities of the board are even stronger when board
committees consist of independent directors (Bradbury et al., 2006; Singhchawla et al.,
2011; Lam and Lee, 2012).
Based on the above discussion, we derive the following hypothesis:
H3: A higher level of board independence is negatively associated with earnings
management.
Board inputs and disclosure
Several studies have investigated the relationship between board characteristics
and information disclosure and transparency (Karamanou and Vafeas, 2005; Persons,
2009). To minimize the self-interested use of inside information by management, boards
are in place to ensure information is disclosed to the stakeholders of the company, e.g.
by monitoring the processes of information disclosure and transparency used by
management. In other words, board characteristics may influence to what extent
management of a firm is willing to disclose its information. Again, in our analysis we
focus on board skills and competencies, board time commitment, and board structure on
disclosure as important aspects of board characteristics.
Skills and competencies
As discussed earlier, skills and competencies improve the monitoring abilities of
board members, which allows them to affect the decision making process (Hambrick,
2007; Hambrick and Mason, 1984). Board members are expected to use their capabilities
to monitor firms’ decision (Barton et al., 2004, Coulson-Thomas, 2009). One of these
decisions is the disclosure of information to the stakeholders of the firm. The role of the
board is to ensure that information disclosure is sufficient enabling stakeholders to
verify whether their interests are taken into account by management.

Boards, Transparency, and Earnings Management
156
Board members with better skills and higher competencies are expected to
influence the extent to which a firm discloses information (Martikainen et al., 2016). Gul
and Leung (2004) argue that directors with rich experience are more effective in
monitoring and tend to generate higher levels of voluntary disclosures. Other studies
find that board members with expertise in accounting and finance are concerned with
disclosing information (Persons, 2009; Haniffa and Cooke, 2002; Mangena and
Tauringana, 2007; Akhtaruddin and Haron, 2010). Martikainen et al. (2016) find that
better educated board members positively affect the disclosure tone because they have
greater ability to present extensive information. Similarly, Chiang and He (2010) confirm
that continuing education is important to enhance transparency.
These previous findings suggest that board members equipped with better skills,
expertise, and experience have a better ability to monitor which may promote the level
of corporate disclosures. Hence, our hypothesis is:
H4: Board skills and competencies are positively associated with the level of information
disclosure.
Time commitment
Previous studies have shown that there is a positive association between the time
board members commit to their work on the board and the amount of information
disclosure. More time committed to board work is associated with more effective
monitoring as it increases possibilities to collect information on the performance of
management (Brick and Chidambaran, 2010). Time commitment signifies the board
members’ effort to ensure that management acts in the best interests of shareholders,
including delivering corporate information.
Corporate governance scholars typically measure time commitment by taking the
frequency of meetings, as it is a good proxy for the time invested by directors in
controlling management (Vafeas, 1999; O’Sullivan et al., 2008). Laksmana (2008) argues
that a higher frequency of board meetings makes discussions among directors about the

Chapter 5
157
performance of management more intense. Further, Laksmana (2008) and Barros (2013)
find that the meeting frequency of the board and the remuneration committee have a
positive impact on executive compensation disclosure. Allegrini and Greco (2013) find a
positive association between the number of the board (and audit committee) meetings
and disclosure.
Based on the results of previous studies, we posit there is a positive association
between board time commitment and the monitoring performance of board members,
which leads to enhancing corporate disclosure. Therefore, we conjecture:
H5: The amount of time board members spend on their board work is positively associated
with the level of information disclosure.
Structure and composition
To minimize the self-interested use of inside information by the management
boards monitor the behavior of management and provide information about this to the
stakeholders of the firm. Board structural characteristics such as board independence
and board committee independence may be instrumental in making boards more
effective in producing information about the behavior and decision-making by
management. Several studies have analysed the link between these board structural
characteristics and the extent of information disclosure by the firm. Cheng and
Courtenay (2006), Patelli and Prencipe (2007), and Akhtaruddin et al. (2009) show that
transparency increases with the number of independent directors. Torchia and Calabro
(2016) also find a significant positive relationship between the ratio of independent
directors and the level of financial transparency. O’Sullivan et al. (2008) and Allegrini
and Greco (2013) show that the presence of board committees with a majority of
independent directors is positively associated with corporate disclosures. Similar results
are reported in studies by Armstrong et al. (2014), Alfraih (2016), and Rao and Tilt (2016).

Boards, Transparency, and Earnings Management
158
We expect that increased independence in the board and board committees is
positively associated with the level of disclosure. Based on findings from previous
studies, we hypothesize the following:
H6: Higher levels of board independence are associated with higher levels of information
disclosure.
The mediating role of information disclosure
As a final step in our analysis, we investigate whether information disclosure
mediates the relationship between board inputs i.e., skills and competencies, time
commitment, and board structure and earnings management. In particular, we suggest
that boards may determine earnings management indirectly. They encourage
management to be more transparent and to disclose more information to stakeholders
(Cheng and Courtenay, 2006; Rao and Tilt, 2016). The existence of asymmetric
information (that is, the lack of transparency) between managers and shareholders may
contribute to the likelihood of opportunistic behavior by managers (Ndofor et al., 2015).
To mitigate this behavior, shareholders may require management to provide sufficient
corporate information to facilitate them to monitor management (Fama and Jensen,
1983). Higher levels of disclosure of information mitigate management’s discretion to
manipulate earnings (Richardson, 2000).
Based on the above reasoning, our hypothesis is:
H7: Disclosure positively mediates the relationship between board characteristics, such as
board skills and competencies, board time commitment, and board structure, and
earnings management.

Chapter 5
159
5.3 Methodology
5.3.1 Sampling
The sample for this study consists of Indonesian listed companies assessed by the
Indonesian Institute for Corporate Directorship (IICD), an independent institution, on
the quality of their corporate governance. This assessment is based on the so-called
ASEAN Corporate Governance Scorecard (ACGS). ACGS has been initiated by the
ASEAN Capital Markets Forum (ACMF) and the Asian Development Bank (ADB) and
has been used since 2011. The scorecard is derived from questions about various aspects
of the governance structure and quality of a firm. These questions are developed using
the OECD Principles of Corporate Governance and several items from international and
regional best practices.
More precisely, ACGS is composed of five dimensions of the OECD principles of
corporate governance that relate to the rights of shareholders (25 questions), equitable
treatment of shareholders (17 questions), the role of stakeholders (21 questions),
disclosure and transparency (41 questions), and the responsibilities of the board (74
questions). This study uses two dimensions of the scorecard: responsibilities of the
board, and disclosure and transparency. A detailed explanation of the content of the
questions related to these two dimensions is presented in Section 5.3.2. The assessment
of whether firms comply with the ACGS has been conducted by several independent
institutions in ASEAN countries, including Malaysia (Minority Shareholder Watchdog
Group), Singapore (Singapore Institute of Directors), Thailand (Thai Institute of
Directors), the Philippines (Institute of Corporate Directorship), and Vietnam (Vietnam
National University of Ho Chi Minh City).
In Indonesia, the assessment process has been undertaken by the Indonesian
Institute for Corporate Directorship (IICD), a non-profit organization aiming at
promoting best practices of good corporate governance. Each year, IICD selects the
companies to be included based on the top 100 of firms in terms of their market
capitalization. The total number of firm-year observations available for the period 2013-
2015 is 295, covering 245 non-financial and 50 financial firms. The assessment conducted

Boards, Transparency, and Earnings Management
160
in 2015 was based on the 2014 annual reports and other publicly available information,
the 2014 assessment was based on the 2013 annual reports, and so on. In our analysis we
leave out financial companies, leaving 245 observations that relate to 104 non-financial
firms.
Financial data of companies are retrieved from Datastream. Any missing data
have been manually collected from annual reports. In addition, some of the control
variables have been hand-collected from the annual reports of 2012-2014, such as the
number of foreign directors, the percentage of tradeable shares owned by investors,
shares owned by foreign investors, and shares owned by the government.
5.3.2 Research models
First, we examine whether the level of earnings management is determined by
board inputs, as prior studies have documented. We use the following model (model 1)
to test hypotheses 1, 2, and 3:
Discretionary_Accrualsi,t = α0 + β1Skillsi,t + β2Commitmenti,t + β3Structurei,t + β4-
β8Control Variablesi,t + β9-β10Year Dumi,t + β11-β17Industry Dumi,t + εi,t (1)
where Discretionary_Accrualsi,t is our measure of earnings management, defined as the
absolute value of discretionary accruals for firm i in year t; Skills is our measure of skills
and competencies of board members, defined as the score of total board skills and board
competencies for firm i in year t; Commitment captures time commitment of board
members, measured as the score of items reflecting board time commitment for firm i in
year t; Structure represents the structure and composition of the board and is measured
as the total score of items reflecting board structure and composition of firm i in year t;
Control Variablesi,t is a vector of control variables included in our model; Year Dumi,t is a
vector of dummy variables for the years 2013 and 2014; Industry Dumi,t is a vector of
dummy variables for different industry categories captured by the dataset; and εi,t is
error term. Detailed descriptions of the measurement of the variables in the model are
explained in the next section.

Chapter 5
161
Second, we investigate whether board inputs influence the level of corporate
disclosure. The model (model 2) to test hypotheses 4,5, and 6 is:
Disclosurei,t = α0 + β1Skillsi,t + β2Commitmenti,t + β3Structurei,t + β4-β8Control
Variablesi,t + β9-β10Year Dumi,t + β11-β17Industry Dumi,t + εi,t (2)
where, Disclosurei,t refers tothe extent of information disclosure provided by a firm in a
given year, which is measured as the score of items reflecting the willingness of firm i to
disclose information in year t. The measurement of this variable will be discussed in the
next section. The other variables in the model are similar to those in model 1.
Discretionary accruals
The dependent variable in model (1) is discretionary (abnormal) accruals, which
is generally used as a proxy measure of the presence of earnings management (Dechow
et al., 2010; Dechow et al., 2012). Jones (1991) pioneers the measurement of earnings
management by developing a model of discretionary accruals. The Jones (1991)
regression model starts with the concept of total accruals. Total accruals is the
dependent variable, and accounting variables that are expected to vary with normal
accruals are used as independent variables (i.e. variables such as sales growth and
accruals related to property plant and equipment) in the model.
The accruals model is based on the notion that financial statements are produced
based on an accrual basis instead of a cash basis. Total accruals are commonly defined as
the difference between expected income from continuing operations (resulting from the
accrual basis calculation) and actual cash flows from these operations (i.e. using cash
basis calculation). Total accruals are then categorized into Non-Discretionary Accruals
(NDA) and Discretionary Accruals (DA). NDA (or normal accruals) are accruals
reflecting normal business performance, which result from applying accounting
standards and which are free from managerial discretion. In contrast, DA is assumed to
reflect deviations in accruals that occur from managerial discretion to manage (that is,
Boards, Transparency, and Earnings Management
162
inflate or deflate) earnings. The residuals from the regression model are regarded as
discretionary accruals.
The explanatory power of the Jones (1991) model is relatively low (Dechow et al.,
1995). Sales growth and investment in fixed assets usually only explain about 10% of
variation in total accruals (Dechow et al., 2010, p.358). The Jones model does not
distinguish between cash sales and credit sales. Given the fact that management often
manipulates earnings through credit sales (accounts receivable), Dechow et al. (1995)
refine the Jones model by excluding credit sales growth. Other scholars have also
extended the Jones model in an attempt to increase the explanatory power of the model.
Kothari et al. (2005) suggest adding return on assets into the model. Dechow and Dichev
(2002) replace credit sales with operating cash flows. Francis et al. (2005) combine the
Jones model and the Dechow and Dichev (2002) model.39
We use four different models to measure discretionary models, that is, we use the
Jones model (Jones, 1991), the modified Jones model (Dechow et al., 1995), the Kothari
model (Kothari et al., 2005), and the Dechow and Dichev model (Dechow and Dichev,
2002). These are the most popular models in the literature on earnings management. All
four models are developed to differentiate between normal (non-discretionary) accruals
and abnormal (discretionary) accruals. The details of the model specifications of the four
models are provided in Appendix 5.1.
Discretionary accruals can be either positive or negative. Since our study does not
intend to analyse the determinants of either income-increasing or income-decreasing
motives, we use the absolute value of discretionary accruals as suggested in prior
research (e.g., Peasnell et al., 2005; Hribar and Nichols, 2007; Cohen et al., 2008; Sarkar et
al., 2008; Chen et al., 2015b; Khalil and Ozkan, 2016).
Studies on earnings management usually estimate abnormal accruals using a
cross-sectional model for each industry-year (Subramanyam, 1996; Barton, 2001; Cohen
et al., 2008). Since in our sample some industries are represented by only a few
39 See Dechow et al. (2010) for a comprehensive summary and review of the literature on discretionary
accruals models.

Chapter 5
163
companies40, we estimate discretionary accruals using a cross-sectional model, in which
we estimate the model for pooled firm-year observations and incorporate industry
dummy variables to control for the industry effect (Bradbury et al., 2006; Francis et al.,
2013; Carson et al., 2017).
We use the one-digit industry category taken from the Jakarta Stock Industrial
Classification (Jasica) Index. The index uses eight non-financial industry categories:
Agriculture, Mining, Basic Industry and Chemicals, Miscellaneous Industry, Consumer
Goods, Property, Real Estate and Construction, Infrastructure and Utilities, and Trade,
Services and Investment. The list of the companies can be found in Appendix 5.2.
Transparency and disclosure
The dependent variable in the second model is the Transparency and Disclosure
Score. This is a score based on answers to questions derived from the ACGS regarding
firm-level transparency and disclosure practices. As mentioned before, these questions
are mainly derived from the OECD Principle V regarding Disclosure and Transparency;
some of the questions are derived from the International Corporate Governance
Network (ICGN) Principles. The questions deal with what items should to be disclosed
and the channels through which corporate information should be published. They are
grouped into nine categories with 41 questions. These questions deal with disclosures
regarding ownership structure (5 items), quality of the annual report (12 items), related-
party transactions (3 items), shares owned by directors/commissioners (1 item), external
auditor (3 items), medium of communications (4 items), timeliness of annual report (3
items), company website (9 items), and investor relations (1 item). The index measures
the availability and timeliness of not only online but also offline information.
40 For instance, the industrial categories agriculture and miscellaneous consist of only 5 and 4
companies, respectively.

Boards, Transparency, and Earnings Management
164
The answer to each question is a simple yes or no. Questions answered with yes
get a score of 1, questions for which the answer is no obtain a score of 0. The
transparency and disclosure score is the simple un-weighted count of all yes answers to
the question related to information disclosure and transparency principles per firm per
year. Next, the total count of yes answers is divided by 41 and multiplied by 100,
meaning that the score ranges between 0 and 100. The higher the score, the better the
performance of a firm with respect to its transparency and disclosure practices.
We categorize the 41 questions into 19 mandatory and 22 voluntary items. The
mandatory items refer to Bapepam-LK Decree No. KEP-431/BL/2012 - Regulation
No.X.K.6 year 2012 concerning the Annual Report for Indonesian publicly listed firms.41
This regulation describes the disclosure requirements firms have to adhere to. For
instance, the regulation requires listed firms to disclose their corporate objectives,
profiles of directors, and the names of the ultimate shareholders. We will take into
account both mandatory disclosure (M-Disclosure) and voluntary disclosure (V-Dislosure)
in our analysis.
Independent variables
As discussed above, we have three variables measuring different types of board
inputs, that is, skills and competencies, time commitment, and structure and
composition. For each of these variables we develop measures based on data provided
by the IICD for the years 2012-2014. The IICD data are collected based on 74 questions
capturing board structure and board working procedures, including structures and
procedures related to information disclosures (ACMF, 2015). The details of the 74
questions are displayed in Appendix 5.3. For our analysis, we include questions
referring to procedures and practices that are mandatory requirements according to
Bapepam LK and the Indonesia Stock Exchange (that is, the listing rules). These include
requirements regarding the establishment of an audit committee with an independent 41 Bapepam LK is the Indonesian Capital Market and Financial Institutions Supervisory Agency. Since
December 31, 2012 its function has been transferred to the Otoritas Jasa Keuangan – OJK (the Financial Services Authority).

Chapter 5
165
chairman, and the use of a two-tier board model which means that firms should
segregate between the supervisory board and the executive directors.
From the remaining list of questions used by the IICD to evaluate the
responsibilities of the board, we select those questions that relate to our three board
input measures, that is, board skills and competencies, board time commitment and
board structure and composition. These three measures are based on 6, 9, and 9
underlying questions, respectively (see Appendix 5.4 for the summary). The answer to
each question is a simple yes or no. Questions answered with yes get a score of 1;
questions for which the answer is no obtain a score of 0. We calculate each measure as a
score based on the number of yes answers divided by the total number of questions
related to the measure, times 100.
Skills and Competencies
This variable captures board members’ expertise and experience. Moreover, it
takes into account whether or not the board has installed training and development
programs aimed at improving board members’ knowledge. We identify the following
six questions from the IICD dataset that relate to board skills and competencies:
1. Does at least one of the independent directors/commissioners have accounting expertise (accounting qualification or experience)?
2. Does at least one non-executive director/commissioner have prior working experience in the sector in which the company mainly operates?
3. Does the company have an orientation programs for new directors/commissioners?
4. Does the company have a policy that encourages directors/commissioners to attend on-going or continuing professional education programs?
5. Is an annual performance assessment conducted of the board of directors/commissioners?

Boards, Transparency, and Earnings Management
166
6. Is an annual performance assessment conducted of the board of directors/commissioners committees?
Time Commitment
This variable measures the commitment of board members to their work in the
board and in board committees. Using the questions taken from the IICD questionnaire
we focus on questions relating to multiple directorships and board meetings as they
may reflect the time board members allotted to their work for the board and board
committees. We use the following list of questions:
1. Has the company set a limit of five board seats an individual independent/ non-executive director/ commissioner may hold simultaneously?
2. Does the company have any executive directors who serve on more than two boards of listed companies outside of the group? (Reversed)42
3. Does the Nominating Committee meet at least twice during the year?
4. Does the Remuneration Committee meet at least twice during the year?
5. Does the Audit Committee meet at least four times during the year?
6. Does the board of directors/commissioners meet at least six times during the year?
7. Has each of the directors/commissioners attended at least 75% of all the board meetings held during the year?
8. Does the company require a minimum quorum of at least 2/3 for board decisions?
9. Does the non-executive directors/commissioners of the company meet separately at least once during the year without any executives present?
42 We assume that director busyness may hurt firm performance as busyness may impair the
monitoring abilities of a director. Therefore, this question is regarded a reverse scored question. A “Yes” answer is scored as zero and a “No” answer is scored one.

Chapter 5
167
Structure and Composition
This variable captures the extent to which the board as a whole, as well as the
board committees, consist of independent board members. We focus on the following
questions from the IICD questionnaire that relate to these two dimensions of the
structure and composition of boards:
1. Do independent directors/commissioners make up at least 50% of the board of directors/commissioners?
2. Are the independent directors/commissioners independent of management and major/substantial shareholders?
3. Does the company have a term limit of nine years or less for its independent directors/commissioners?
4. Does the Nominating Committee comprise of a majority of independent directors/commissioners? 43
5. Is the chairman of the Nominating Committee an independent director/commissioner?
6. Does the Remuneration Committee comprise of a majority of independent directors/commissioners?
7. Is the chairman of the Remuneration Committee an independent director/commissioner?
8. Does the Audit Committee comprise entirely of non-executive directors/commissioners with a majority of independent directors/commissioners?
9. Is the chairman an independent director/commissioner?
43 For questions 4 to 7, the calculation of the score may be adjusted depending on the answers to the
questions. The denominator in our calculation is based only on questions that apply to a specific company. So, if a company does not have a nomination committee and/or a remuneration committee, then the next questions related to the nomination and/or remuneration committee will not be taken into account. For example, if a company does not have a nomination committee, then the answers of question 4 and 5 are not applicable and are not counted. In this case, the score for this company is calculated based on 7 questions instead of 9 questions.

Boards, Transparency, and Earnings Management
168
Control variables
We include a number of board- and firm-level variables in the regression models
(1) and (2). These variables have been associated with levels of earnings management
and information disclosure in previous studies. Our first board-level variable is board
size. This variable has been used extensively in board research as it is considered to
affect board performance. On the one hand, a larger board has a higher capacity to carry
out its monitoring role (Dalton et al.,1999), which may be associated with lower levels of
earnings management and/or higher levels of information disclosure. On the other hand,
a larger board may suffer from communication and coordination problems leading to
lower board effectiveness in terms of its monitoring tasks (Jensen, 1993; Yermack, 1996;
Mak and Kusnadi, 2005; de Andres et al., 2005; Cheng, 2008; and Guest, 2009). To
capture both the positive and negative impact of board size, we include the size of the
board (denoted as Bocsize), measured as the number of supervisory board members, as
well as its squared term in models (1) and (2).
We also include a measure capturing the presence of foreign directors. Previous
studies have argued that foreign directors provide a more objective opinion and are
more independent of management as compared to domestic directors (Choi and Hasan,
2005). Moreover, they may bring knowledge and experience with respect to
international standards of corporate governance practices, which may contribute to
improving these practices of the firm on which boards they sit. Foreign directors may
thus improve overall board effectiveness with respect to disciplining managerial
performance (Ramaswamy, 2001), which may, among other things be associated with
lower levels of earnings management and/or higher levels of information disclosure
(Hooghiemstra et al., 2019). The measure we use is the total number of foreign
commissioners divided by the total number of supervisory board members (denoted as
Foreigncomm).
In terms of firm-level control variables, we use a market-based variable of firm
size (measured as the natural logarithm of the firm’s market capitalization -

Chapter 5
169
Lnmarketcap), leverage (measured as total debt divided by total assets - Leverage); and a
Big-4 dummy which is one if the firm is audited by a big-4 audit firm, and zero otherwise
to measure of the quality of the financial statements. Higher quality of financial
statements is associated with a higher level of disclosure, which is expected to reduce
earnings management. Moreover, we include several ownership variables that may
affect earnings management and disclosure, i.e., a measure of ownership of tradeable
shares owned by investors (that is, the number of shares held by public investors and
traded on the Indonesia stock exchange divided by the total number of outstanding
shares - Publicshares), a measure of foreign ownership (measured as a dummy variable
that takes the value of one if the majority of the outstanding shares is held by foreign
investors, and zero otherwise - Foreignown dummy), and a dummy variable indicating
whether or not the firm is a state-owned company (one if the firm is state-owned and
zero otherwise- SOE dummy).
The list of all variables used in this study is presented in Appendix 5.5.
5.4 Results
5.4.1 Descriptive statistics
Table 5.1 presents the descriptive statistics of the variables used in the analysis.
With respect to discretionary accruals, the table shows the mean (and median) absolute
values of discretionary accruals calculated based on the Jones model (DAccruals-J), the
Modified Jones model (DAccruals-MJ), two versions of the Kothari et al. model
(DAccruals-K1, K2), and the Dechow-Dichev model (DAccruals-DD). The values we
obtain for discretionary accruals based on the different models are quite similar, with
averages ranging from 0.061 to 0.063, except for the values based on the Dechow-Dichev
model (average 0.086). The values we find are comparable to those reported in Carson et
al. (2017), who calculated the mean absolute value of discretionary accruals for
Indonesian firms during 2003-2012 using the Kothari (1995) model.

Boards, Transparency, and Earnings Management
170
The average value for the mandatory transparency and disclosure score (M-
Disclosure) is 72. This indicates that more than two thirds of the 19 questions referring to
mandatory transparency and disclosure are answered ‘yes’. Thus, the Indonesian firms
in our sample only partially comply with mandatory disclosure requirements. This
suggests that with respect to mandatory transparency and disclosure practices,
Indonesian firms tend to breach the requirements. As this study is not focusing on why
Indonesian firms do not comply with regulations, we will not discuss the compliance
subject further.
Researchers typically use voluntary disclosure to investigate its effect on
asymmetric information or earnings management (Dye, 2001; Jon and Kim, 2007;
Roychowdhury and Sletten, 2012). For voluntary disclosure (V-Disclosure), the average
score is 56. Yet, the level of transparency and disclosure differs considerably between
firms as the scores range from 5 to 91. The best performing firms are in the mining
industry, and the infrastructure and utility industry (that is, telecommunication
companies, transportation, and toll road service providers). The performance of firms in
these industries may be explained by the fact that they are highly regulated. Previous
research has suggested that these industries are more sensitive to political and
environmental issues, making them more inclined to disclose information (Meek et al.,
1995).
Table 5.1 also shows descriptive statistics of our three board input variables. The
average scores for Skills, Commitment, and Structure are 36, 48, and 34, respectively.
These scores show that Indonesian firms on average do not perform very well with
respect to these board inputs as only 30 to 45 per cent of the questions referring to these
inputs are answered ‘yes’. Firms in the sample perform best with respect to board time
commitment. Analysis of the underlying data with respect to these three board input
variables shows that the frequency and attendance rate of board meetings are generally
low and companies often do not limit the number of directorships of their board
members.

Chapter 5
171
Several factors may explain why the score of the Structure variable is relatively
low. The data underlying this variable reveal that in Indonesia there was no regulation
regarding the maximum term of board members. Starting from 2014, the capital market
regulator has required that independent commissioners may only serve for two
consecutive serving terms. 44 However, listed firms in Indonesia mostly have not
implemented this regulation. With respect to board independence, Bapepam LK
regulates that at least 30 per cent of board members should be independent. Finally, the
data for Skills reveal that most of the companies in the sample do not have an orientation
and training program for their directors. They are also less likely to conduct an annual
performance assessment of the board of commissioners (committees), therefore their
competencies cannot be evaluated.
Table 5.1 Descriptive statistics
Variable (obs = 245) Mean Median Std. Dev. Min Max M-Disclosure 71.871 73.684 13.999 31.579 100 V-Disclosure 56.041 57.143 14.691 4.762 90.909 Skills 36.463 33.333 19.943 0 100 Commitment 47.648 44.444 18.520 11.111 88.889 Structure 34.413 33.333 16.794 11.111 85.714 Foreigncomm 0.138 0 0.211 0 0.833 Bocsize 5.588 6.000 1.968 2 13 Big-4 dummy 0.722 1 0.449 0 1 Marketcap (in IDRbio) 35,000 14,900 54,800 3,840 308,000 Leverage (%) 46.363 44.688 21.911 0.028 167.163 Publicshares (%) 33.173 33.450 17.549 0.333 86.100 Foreignown dummy 0.143 0 0.351 0 1 SOE dummy 0.127 0 0.333 0 1 DAccruals-J 0.063 0.046 0.065 0.000 0.451 DAccruals-MJ 0.062 0.046 0.062 0.000 0.412 DAccruals-K1 0.062 0.047 0.058 0.000 0.348 DAccruals-K2 0.061 0.045 0.060 0.001 0.402 DAccruals-DD 0.086 0.062 0.086 0.001 0.470
44 The listing regulation issued by the Indonesia Stock Exchange, i.e. Decree No.Kep-00001/BEI/01-
2014 dated 20 January 2014 on Amendment to Regulation I-A on Listing of Shares and Equity-Type Securities other than Shares Issued by Listed Companies. This regulation revokes and replaces the previous listing regulations under Decree No.Kep-305/BEJ/07-2004 dated 19 July 2004.

Boards, Transparency, and Earnings Management
172
Table 5.2 displays the annual data for M-Disclosure, V-Disclosure, Skills,
Commitment, and Structure. The table suggests that Indonesian firms have improved
their performance both in terms of informational transparency and disclosure
(particularly mandatory disclosure) and in terms of various board inputs. Yet,
improvements are fairly small. The only more or less substantial improvements have
been reported with respect to the level of mandatory disclosure, which increased from
65 in 2012 to 76 in 2014, and the level of skills, which went up from 34 in 2012 to 42 in
2014.
Table 5.2 Mean scores of main variables
Variable 2012 (79 obs)
2013 (83 obs)
2014 (83 obs)
Overall (245 obs)
M-Disclosure 65.32 73.91 76.07 71.87 V-Disclosure 56.65 52.09 59.42 56.04 Skills 34.39 32.53 42.37 36.46 Commitment 47.89 47.18 47.89 47.65 Structure 33.67 32.03 37.50 34.41
Table 5.3 provides the correlations between the variables used in the analysis.
Disclosure has a positive and significant correlation with all three boardvariables (Skills,
Commitment, and Structure). The correlation between discretionary accruals (using the
Jones model) and the board input variables is less strong. Only Skills shows a negative
and significant correlation with discretionary accruals. We further analyse the
relationship between these variables in a multivariate setting in the next section. Table
5.3 also reveals that the independent variables are not highly correlated. Most
correlations between independent variables are well below 0.70, suggesting that
multicollinearity is not a problem.

Chapter 5
Table 5.3 Correlations
Daccruals
Ja V-Disclosure M-Disclosure Skills Commit
ment Structure Foreign
com Bocsize Lnmarket
cap
Leverage Big-4
dummy Public shares
Foreign own
dummy SOE
dummy Daccruals-Ja 1.000
V-Disclosure -0.079 1.000
M-Disclosure -0.202*** 0.599*** 1.000
Skills -0.152** 0.446*** 0.457*** 1.000
Commitment -0.008 0.328*** 0.446*** 0.288*** 1.000
Structure -0.092 0.109* 0.110* 0.105 0.209*** 1.000
Foreigncomm -0.002 0.145** 0.006 0.068 -0.005 -0.090 1.000
Bocsize -0.104 0.216*** 0.255*** 0.270*** 0.000 -0.072 0.432*** 1.000
Lnmarketcap -0.119* 0.390*** 0.222*** 0.136** 0.071 -0.098 0.325*** 0.284*** 1.000
Leverage 0.072 0.135** 0.091 0.082 0.118* 0.102 0.088 0.022 -0.071 1.000
Big-4dummy -0.061 0.291*** 0.120* 0.113* 0.088 0.034 0.257*** 0.070 0.324*** 0.040 1.000
Publicshares 0.098 0.192*** 0.123* -0.015 0.150** -0.005 -0.214*** -0.088 0.039 0.080 -0.070 1.000
Foreignowndummy -0.042 0.089 0.060 0.151** 0.091 0.048 0.566*** 0.377*** 0.363*** 0.048 0.253*** -0.247*** 1.000
SOEdummy -0.071 0.304*** 0.424*** 0.393*** 0.381*** 0.133** -0.249*** 0.049 0.094 0.126** -0.066 0.073 -0.155** 1.000 a Dependent variable * significant at 10%, ** significant at 5%, *** significant at 1%

Boards, Transparency, and Earnings Management
174
5.4.2 Regression results and discussion
Board inputs and earnings management
Tables 5.4, 5.5, and 5.6 show the results of the univariate regression analysis of
model (1), that is, the relationship between the board input variables and discretionary
accruals (our measure of earnings management). We use OLS estimation with robust
standard errors to correct for heteroscedasticity. We apply different models to measure
discretionary accruals, as discussed in section 5.3. Based on hypotheses 1-3, we expect
that the absolute level of discretionary accruals is negatively associated with the board
input variables Skills, Commitment, and Structure. As discussed in section 5.2, board
inputs i.e., the skills and competencies of board members, devoted time, having
independent directors and independent board committee members will constrain
earnings management practices. The results only partly support our hypotheses. While
board skills is statistically significant, board commitment and board structure are not.
These results hold, independent of the model we use to measure discretionary accruals.
Therefore, we cannot conclude that, in the case of Indonesia, there is a direct negative
association between board inputs and earnings management. These board inputs do not
seem to affect earnings management practices in a direct way.
Table 5.4 Earnings management and board skills
The table presents the results of univariate regression models. Each single regression aims at testing the relationship between one of five discretionary accruals (DAccruals) models i.e., the Jones (J), Modified Jones (MJ), Kothari 1 (K1), Kothari 2 (K2) and Dechow&Dichev (DD) model, and Skills. The results show that Skills is negatively and significantly associated with DAccruals in all models. All models are estimated using Ordinary Least Squares (OLS) with robust standard errors. t-statistics are reported between parentheses. Dependent variable: DAccruals
Expected sign
J (OLS)
MJ (OLS)
K1 (OLS)
K2 (OLS)
DD (OLS)
Constant 0.0806*** (7.72)
0.0793*** (8.10)
0.0759*** (9.36)
0.0786***
(8.29) 0.1055*** (9.000)
Skills H1 Negative
-0.0005** (-2.23)
-0.0005** (-2.29)
-0.0004** (-2.22)
-0.0005** (-2.38)
-0.0005** (-2.39)
Observations 245 245 245 245 226 F-value 0.0265 0.0229 0.0274 0.0179 0.0176 R-squared 0.0231 0.0233 0.0178 0.0247 0.0151
* significant at 10%, ** significant at 5%, *** significant at 1% - two tailed

Chapter 5
175
Table 5.5 Earnings management and board commitment
The table presents the results of univariate regression models. Each single regression aims at testing the relationship between one of five discretionary accruals (DAccruals) models i.e., the Jones (J), Modified Jones (MJ), Kothari 1 (K1), Kothari 2 (K2) and Dechow&Dichev (DD) model, and Commitment. The results show that Commitment is not significantly associated with DAccruals in four of five models. All models are estimated using Ordinary Least Squares (OLS) with robust standard errors. t-statistics are reported between parentheses.
Dependent variable: DAccruals
Expected sign
J (OLS)
MJ (OLS)
K1 (OLS)
K2 (OLS)
DD (OLS)
Constant 0.0640*** (5.50)
0.0665*** (5.97)
0.0668*** (6.60)
0.0645*** (5.93)
0.1097*** (7.24)
Commitment H2 Negative
-0.0000 (-0.14)
-0.0001 (-0.49)
-0.0001 (-0.61)
-0.0001 (-0.36)
-0.0006** (-1.98)
Observations 245 245 245 245 226 F-value 0.8899 0.6240 0.5445 0.7170 0.0485 R-squared 0.0001 0.0008 0.0012 0.0004 0.0145 * significant at 10%, ** significant at 5%, *** significant at 1% - two tailed
Table 5.6 Earnings management and board structure
The table presents the results of univariate regression models. Each single regression aims at testing the relationship between one of five discretionary accruals (DAccruals) models i.e., the Jones (J), Modified Jones (MJ), Kothari 1 (K1), Kothari 2 (K2) and Dechow&Dichev (DD) model, and Structure. The results show that Structure is not significantly associated with DAccruals in four of five models. All models are estimated using Ordinary Least Squares (OLS) with robust standard errors. t-statistics are reported between parentheses.
Dependent variable: DAccruals
Expected sign
J (OLS)
MJ (OLS)
K1 (OLS)
K2 (OLS)
DD (OLS)
Constant 0.0749*** (7.32)
0.0772*** (7.62)*
0.0774*** (8.90)
0.0724*** (6.75)
0.0773*** (5.76)
Structure H3 Negative
-0.0004 (-1.39)
-0.0004 (-1.46)
-0.0005** (-2.17)
-0.0003 (-1.31)
0.0002 (0.67)
Observations 245 245 245 245 226 F-value 0.1646 0.1468 0.0309 0.1906 0.5061 R-squared 0.0085 0.0092 0.0173 0.0080 0.0022 * significant at 10%, ** significant at 5%, *** significant at 1% - two tailed

Boards, Transparency, and Earnings Management
176
Table 5.7 Earnings management and board inputs
The table reports the results of estimating equation (1). The dependent variable is Discretionary Accruals (DAccruals) using the Jones (J), Modified Jones (MJ), Kothari 1 (K1), Kothari 2 (K2), and Dechow&Dichev (DD) model. Skills, Commitment, and Structure are composite indices constructed from selected questions provided by the IICD. Foreigncomm is the ratio of the number of foreign commissioners to the total number of commissioners. Bocsize is the number of commissioners. Big-4 dummy takes the value of 1 if the firm is audited by a big-4 audit firm, otherwise zero. Publicshares is the number of shares held by public investors and traded on the stock exchange divided by the total number of outstanding shares. Foreignown dummy takes the value of 1 if more than 50% of the firm ownership are foreign shareholders, otherwise zero. SOE dummy is one if the firm is 50% more owned by the government and zero otherwise. Lnmarketcap is the natural log of total market capitalization. Leverage is the ratio of total liabilities to total assets. Year dummies for year 2013 and 2014 are included. Industry dummies for seven industry categories are also taken into account. All models are estimated using Ordinary Least Squares (OLS) with robust standard errors. t-statistics are reported between parentheses. Dependent variable: DAccruals
Expected sign
J (OLS)
MJ (OLS)
K1 (OLS)
K2 (OLS)
DD (OLS)
Constant 0.2229* (1.88)
0.2233** (1.96)
0.2614** (2.43)
0.1675 (1.50)
0.3311* (1.80)
Skills H1 Negative
-0.0003 (-1.08)
-0.0002 (-0.88)
-0.0001 (-0.45)
-0.0002 (-1.01)
-0.0005* (-1.72)
Commitment H2 Negative
0.0001 (0.33)
0.0000 (0.07)
0.0001 (0.27)
0.0000 (0.11)
-0.0004 (-1.48)
Structure H3 Negative
-0.0003 (-1.19)
-0.0003 (-1.18)
-0.0004* (-1.88)
-0.0003 (-0.97)
0.0002 (0.62)
Foreigncomm ? 0.0100 (0.37)
0.0007 (0.03)
0.0049 (0.22)
0.0022 (0.09)
-0.0256 (-0.79)
Bocsize ? -0.0069 (-0.76)
-0.0076 (-0.87)
-0.0135 (-1.52)
-0.007 (-0.84)
-0.028 (-1.62)
Bocsize2 ? 0.0003 (0.50)
0.0006 (0.64)
0.0009 (1.42)
0.0003 (0.48)
0.0021* (1.80)
Big-4 dummy Negative -0.0078 (-0.61)
-0.0055 (-0.46)
0.0002 (0.02)
-0.0054 (-0.45)
-0.0023 (-0.15)
Publicshares ? 0.0002 (0.77)
0.0002 (0.80)
0.0002 (0.83)
0.0002 (0.67)
-0.0006* (-1.74)
Foreignown dummy ? -0.0015 (-0.10)
-0.0024 (-0.15)
-0.0049 (-0.36)
-0.0042 (-0.28)
0.0416* (1.82)
SOE dummy ? -0.0126 (-0.89)
-0.0170 (-1.34)
-0.0135 (-1.15)
-0.0164 (-1.29)
0.0234 (1.02)
Lnmarketcap ? -0.0056 (-1.18)
-0.0056 (-1.22)
-0.0071 (-1.58)
-0.0032 (-0.72)
-0.0047 (-0.67)
Leverage Positive 0.0002 (0.82)
0.0002 (0.82)
0.0002 (1.32)
0.0001 (0.61)
0.0000 (0.15)
Year dummies Yes Yes Yes Yes Yes Industry dummies Yes Yes Yes Yes Yes Observations 245 245 245 245 245 F-prob 0.0000 0.0001 0.0000 0.0001 0.2749 R-squared 0.1613 0.1616 0.1681 0.1685 0.1185
* significant at 10%, ** significant at 5%, *** significant at 1% - two tailed

Chapter 5
177
Table 5.7 shows the results of the multiple regression analysis of model (1),
applying different discretionary accruals models. The regressions are carried out using
OLS estimation with robust standard errors.45 The results presented in table 5.7 show
that Skills, Commitment and Structure are not significantly associated with discretionary
accruals. These results hold independent of the discretionary-accruals model we apply.
Based on the OLS results, we fail to provide clear evidence that board inputs mitigate
earnings management. The results are similar to previous studies showing that board
inputs do not constrain earnings management (Johari et al., 2008; Ismail et al., 2009;
Kahlil and Ozkan, 2016).
Next, we investigate the association between board inputs and disclosure.
Following hypotheses 4-6 in section 5.2, we expect a positive relationship between board
inputs and the extent to which a firm discloses information and shows transparency.
Higher levels of board inputs related to skills and competencies of board members,
board time commitment, board structure and composition increase the quality of
monitoring by the board, which is expected to increase information disclosure. Table 5.8
presents for voluntary disclosures, while Table 5.9 shows the results for mandatory
disclosures. The outcomes shown in the first four columns of both tables are based on
OLS regressions with robust standard errors. Moreover, we run the Hausman test to
find out whether we should use fixed or random effects, instead of using simple OLS.
The results of this test suggest that the random effects (RE) estimation is preferred to the
fixed effects. The results based on random effects regressions are presented in column 5
of tables 5.8 and 5.9.
The results in tables 5.8 and 5.9 show there is a positive and statistically
significant association between board inputs and the level of voluntary disclosure, as
well as mandatory disclosure. The coefficient for all three board input variables is
positive and significant, even after taking into account the control variables, at least 45 We ran the same models as displayed in Table 5, using fixed and random effects. The Hausman test
for each model suggests that a random effects estimation is better than a fixed effects estimation (p-chi2 > 5%). Moreover, the Breusch-Pagan Lagrange Multiplier test recommends that OLS is more appropriate than random effects (prob-chi2 > 5%). Therefore, we simply use OLS instead of fixed effects and random effects.

Boards, Transparency, and Earnings Management
178
Table 5.8 Voluntary disclosure and board inputs
The table reports the results of estimating equation (2). The dependent variable is V-Disclosure, a voluntary disclosure index composed of 22 questions. Skills, Commitment, and Structure are composite indices constructed from selected questions provided by the IICD. Foreigncomm is the ratio of the number of foreign commissioners to the total number of commissioners. Bocsize is the number of commissioners. Big-4 dummy takes the value of 1 if the firm is audited by a big-4 audit firm and zero otherwise. Publicshares is the number of shares held by public investors and traded on the stock exchange divided by the total number of outstanding shares. Foreignown dummy takes the value of 1 if more than 50% of the firm ownership are foreign shareholders, otherwise zero. SOE dummy is one if the firm is 50% more owned by the government, otherwise zero. Lnmarketcap is the natural log of total market capitalization. Leverage is the ratio of total liabilities to total assets. Year dummies for year 2013 and 2014 are included. Industry dummies for seven industry categories are also taken into account. The models in columns (1) to (4) are estimated using Ordinary Least Squares (OLS) with robust standard errors; the model in column (5) is estimated using random effects (RE). t-statistics are reported between parentheses. Dependent variable: V-Disclosure
Expected sign
(1) OLS
(2) OLS
(3) OLS
(4) OLS
(5) RE
Constant 44.1537*** (24.96)
43.630*** (16.73)
52.666*** (23.46)
-73.294*** (-3.26)
-70.848** (-2.46)
Skills H4 Positive
0.326*** (8.22)
0.183*** (4.28)
0.148*** (3.39)
Commitment H5 Positive
0.260*** (5.14)
0.118*** (2.56)
0.081* (1.68)
Structure H6 Positive
0.0981* (1.74)
0.003 (0.06)
0.025 (0.51)
Foreigncomm Positive 6.340 (1.41)
8.613 (1.48)
Bocsize ? 1.751 (0.95)
1.368 (0.67)
Bocsize2 ? -0.086 (-0.63)
-0.060 (-0.38)
Big-4 dummy 4.661** (2.39)
4.525** (2.02)
Publicshares Positive 0.149*** (3.52)
0.136** (2.49)
Foreignown dummy Positive -4.616* (-1.95)
-3.490 (-1.02)
SOE dummy ? 4.934** (1.97)
7.375** (2.06)
Lnmarketcap 4.221*** (4.42)
4.179*** (3.38)
Leverage Positive 0.064*** (1.79)
0.056 (1.29)
Year dummies Yes Yes Industry dummies Yes Yes Observations 245 245 245 245 245 F-value 0.0000 0.0000 0.0828 0.0000 0.0000 R-squared 0.1959 0.1078 0.0126 0.4924 0.5329
* significant at 10%, ** significant at 5%, *** significant at 1% - two tailed

Chapter 5
179
Table 5.9 Mandatory disclosure and board inputs
The table reports the results of the equation (2) regression. The dependent variable is M-Disclosure, a mandatory disclosure index composed of 19 questions. Skills, Commitment, and Structure are composite indices constructed from selected questions provided by the IICD. Foreigncomm is the ratio of the number of foreign commissioners to the total number of commissioners. Bocsize is the number of commissioners. Big-4 dummy takes the value of 1 if the firm is audited by a big-4 audit firm and zero otherwise. Publicshares is the number of shares held by public investors and traded on the stock exchange divided by the total number of outstanding shares. Foreignown dummy takes the value of 1 if more than 50% of the firm ownership are foreign shareholders, otherwise zero. SOE dummy is one if the firm is 50% more owned by the government, otherwise zero. Lnmarketcap is the natural log of total market capitalization. Leverage is the ratio of total liabilities to total assets. Year dummies for year 2013 and 2014 are included. Industry dummies for seven industry categories are also taken into account. The models in columns (1) to (4) are estimated using Ordinary Least Squares (OLS) with robust standard errors; the model in column (5) is estimated using random effects (RE). t-statistics are reported between parentheses. Dependent variable: M-Disclosure
Expected sign
(1) OLS
(2) OLS
(3) OLS
(4) OLS
(5) RE
Constant 60.169*** (36.26)
55.793*** (24.43)
68.721*** (33.73)
-9.842 (-0.50)
-13.983 (-0.54)
Skills H4 Positive
0.321*** (8.79)
0.146*** (4.00)
0.099** (2.46)
Commitment H5 Positive
0.337*** (5.793)
0.231*** (5.68)
0.201*** (4.52)
Structure H6 Positive
0.092* (1.75)
0.006 (0.14)
-0.004 (-0.09)
Foreigncomm Positive 0.457 (0.11)
0.593 (0.11)
Bocsize ? 1.765 (1.06)
1.974 (1.08)
Bocsize2 ? -0.016 (-0.12)
-0.037 (-0.26)
Big-4 dummy 2.406 (1.40)
2.754 (1.37)
Publicshares Positive 0.067 (1.53)
0.049 (0.99)
Foreignown dummy Positive -1.380 (-0.59)
0.442 (0.14)
SOE dummy ? 10.934*** (3.98)
11.566*** (3.61)
Lnmarketcap 1.902** (2.22)
2.147 (1.94)
Leverage Positive 0.014 (0.42)
0.021 (0.56)
Year dummies Yes Yes Industry dummies Yes Yes Observations 245 245 245 245 245 F-value 0.0000 0.0000 0.0821 0.0000 0.0000 R-squared 0.2091 0.1993 0.0121 0.5222 0.5138
* significant at 10%, ** significant at 5%, *** significant at 1% - two tailed

Boards, Transparency, and Earnings Management
180
when we use OLS regressions with robust standard errors. If we apply random effects
estimations, we still find a positive and statistically significant association between
board inputs Skills and Commitment and the level of voluntary and mandatory
disclosure, whereas for Structure the association turns insignificant for both types of
disclosure. The latter outcome suggests that board independence is not associated with
voluntary disclosure in the Indonesian context. One reason for this finding may be that
in Indonesia board independence is more symbolic rather than substantive, that is,
board members are formally independent to comply with the rules, but in practice they
do not act as independent board members (Finkelstein and Mooney, 2003;
Hooghiemstra and van Manen, 2004). Our findings on board independence are
confirmed by previous studies using Indonesian data, such as Siregar and Utama (2008)
and Setiawan et al. (2019).
Our results seem to corroborate the idea that board inputs, such as Skills and
Commitment, help improve information disclosure and transparency provided by firms
in Indonesia. Overall, these findings are in line with previous research suggesting that
information disclosure is positively associated with board competencies (Persons, 2009;
Mangena and Tauringana, 2007; Akhtaruddin and Haron, 2010), and meetings
frequency (Allegrini and Greco, 2013; Laksmana, 2008; Barros et al., 2013).
Board inputs and earnings management: the mediating role of disclosures
In the previous section, we have shown that board skills, board commitment, and
board structure do not seem to be associated directly with earnings management. One
explanation for this finding may be that board inputs such as board skills, commitment
and structure, may only indirectly affect earnings management. In particular, it might be
that board inputs affect the level of disclosures, which in turn may affect earnings
management. As shown in tables 5.8 and 5.9 we do find evidence that Skills and
Commitment are significantly related to disclosure. We therefore aim at analyzing
whether board inputs influence earnings management through increased disclosures. In

Chapter 5
181
other words, we hypothesize that disclosures mediate the relationship between board
inputs and earnings management (hypothesis 7).
To test this hypothesis, we carry out a four-step approach suggested by Baron
and Kenny (1986). The first step is to run a simple regression model to individually
examine the direct effect of board skills, board commitment, or board structure on
earnings management (X predicts Y, or path A; see figure 5.1) . In the second step, we
perform a simple regression analysis of the direct effect of each board input (board
skills, board commitment, board structure) on mandatory disclosures or voluntary
disclosures (X predicts M, or path B in figure 5.1). For the third step, we carry out a
simple regression model analyzing the relationship between mandatory disclosures or
voluntary disclosures and earnings management (M predicts Y, or path C in figure 1). In
the final step, we apply multiple regressions in which each board input (board skills,
board commitment, board structure) and voluntary disclosures or mandatory
disclosures jointly predict earnings management (X and M both predict Y). If one or
more of the simple regressions performed in the first three steps does (do) not show
significant outcomes, the mediation effect is non-existent.
After conducting Step 1, the results show that only Skills is negatively and
significantly associated with earnings management. In Step 2, the results show that all
board inputs are positively and significantly associated with both voluntary and
mandatory disclosures. The results of the analysis in Step 3 suggest that mandatory
disclosures are negatively and significantly associated with earnings management, that
is, higher levels of mandatory disclosures reduce earnings management. However, we
do not find that voluntary disclosures are associated with earnings management in Step
3. The analysis in Step 4, finally, shows that the effect of M-Disclosure on DAccruals (that
is, earnings management) remains statistically significant after controlling for Skills (see
Table 5.10, panel B column (1)). Based on these outcomes, we may infer that mandatory
disclosures play a mediating role between Skills (but not Commitment and Structure) and
earnings management. In other words, Skills indirectly reduces earnings management

Boards, Transparency, and Earnings Management
182
through directly increasing mandatory disclosures, which in turn directly reduce
earnings management.
Table 5.10 Board inputs, disclosure, and discretionary accruals
Table 5.10 displays the regression results of DAccruals on Skills, Commitment, Structure, and Disclosures. Panel A reports results for voluntary disclosures (V-Disclosure); Panel B reports results for mandatory disclosures (M-Disclosure).The dependent variable in the models is the absolute value of discretionary accruals (DAccruals). In columns (1)-(3) we report the results when using the Jones model; in columns (4)-(6) we have used the Modified Jones model to calculate discretionary accruals. t-statistics are reported between parentheses. Dependent variable: DAccruals
(1) Jones
(2) Jones
(3) Jones
(4) MJones
(5) MJones
(6) MJones
PANEL A. Constant 0.0834***
(5.10) 0.0804***
(4.82) 0.0909***
(4.85) 0.0859***
(5.39) 0.0844***
(5.24) 0.0934*** (5.20)
Skills -0.0005* (1.87)
-0.0004* (-1.80)
Commitment 0.0001 (0.31)
0.0000 (0.05)
Structure
-0.0003 (1.28)
-0.0003 (-1.31)
V-Disclosure -0.0001 (-0.20)
-0.0004 (1.23)
-0.0003 (1.13)
-0.0002 (-0.51)
-0.0004 (-1.38)
-0.0004 (-1.39)
Observations 245 245 245 245 245 245 F-value 0.0776 0.4458 0.2385 0.0243 0.2935 0.1561 R-squared 0.0232 0.0065 0.0132 0.0613 0.0093 0.0166 PANEL B. Constant 0.1270***
(4.26) 0.1277***
(4.27) 0.1364***
(4.30) 0.1221***
(4.31) 0.1234***
(4.34) 0.1316*** (4.41)
Skills -0.0002* (1.87)
-0.0002 (-1.28)
Commitment 0.0004* (1.77)
0.0002 (1.26)
Structure
-0.0003 (-1.13)
-0.0003 (-1.21)
M-Disclosure -0.0008** (-1.99)
-0.0011*** (-2.74)
-0.0009** (-2.36)
-0.0007* (-1.91)
-0.0010*** (-2.56)
-0.0008** (-2.32)
Observations 245 245 245 245 245 245 F-value 0.0384 0.0191 0.0448 0.0353 0.0384 0.0417 R-squared 0.0452 0.0492 0.0457 0.0439 0.0434 0.0446
* significant at 10%, ** significant at 5%, *** significant at 1% - two tailed
This is an interesting and important finding as it suggests that board inputs may
affect earnings management, but only indirectly (through mandatory disclosures) and
only through a specific type of board inputs (Skills); other dimensions of board inputs

Chapter 5
183
(Commitment and Structure) do not seem to matter, at least not in the case of Indonesia.
These findings add to our knowledge of board inputs as a determinant of earnings
management. As mentioned, the empirical literature on the relationship between board
inputs and earnings management is inconclusive. Our study may add to explaining why
this is the case.
Although popular, the Baron Kenny method has been criticized (Rucker et al.,
2011). One main criticism is that the method is performed by using the simple OLS
regression, which requires a normality assumption. Another important shortcoming of
the method is that it does not allow for testing whether the mediation effect really exists
(MacKinnon et al., 2007). To overcome these drawbacks, we perform the Sobel and
Goodman test. In addition, we also apply Structural Equation Modeling (SEM) to
analyse the mediation effect (Gunzler et al., 2013; Danner et al., 2015).
Both the Sobel and Goodman tests can be used to analyse whether the indirect
effect of an independent variable (in our case, the board input variables) on the
dependent variable (earnings management in this study) through the mediating variable
(disclosures in this study) is significantly different from zero. Unlike the Baron Kenny
method and the Sobel and Goodman test, SEM can run a mediation model (that is, X
M Y) in a single regression analysis, instead of performing separate single equation
regression models. All three methods provide outcomes related to the total effect (that
is, X Y or path A in figure 1), the direct effect (X and M Y, that is, X predicts Y after
controlling for M), and the indirect effect. The indirect effect is the total effect minus the
direct effect. Rucker et al. (2011) recommend focusing on the magnitude of indirect
effects regardless of the significance of the direct effect before and after mediation is
assessed. According to them, if the indirect effect is statistically significant, the
mediation effect does exist.
Tables 5.11 and 5.12 present the results of the Sobel and Goodman test. Table 5.11
shows that voluntary disclosures do not act as a mediator for board skills in reducing
earnings management. The total effect and direct effect are statistically significant only
for Skills but the indirect effect is not, meaning that there is no empirical evidence for the

Boards, Transparency, and Earnings Management
184
existence of a mediating role for voluntary disclosures through which Skills help
reducing earnings management.
In contrast, table 5.12 shows there is evidence that mandatory disclosures
significantly mediate the relationship between Skills and Commitment on the one hand
and earnings management on the other hand. For both these board input variables the
coefficient for the indirect effect is significant and in both cases the Sobel and Goodman
test are statistically significant as well. In other words, both Skills and Commitment
indirectly reduce earnings management through directly increasing mandatory
disclosures, which in turn directly reduce earnings management.
The results from Tables 5.11 and 5.12 are supported by the SEM-based analysis.
The results of this analysis are presented in tables 5.13 and 5.14. Table 5.13 shows that,
also if we use SEM, there is no evidence for the hypothesis that board inputs indirectly
reduce earnings management through directly increasing voluntary disclosures, which
in turn directly reduce earnings management. Table 5.14, however, confirms our earlier
findings shown in table 5.12, that is, Skills and Commitment reduce earnings
management, but only indirectly through mandatory disclosures. We therefore conclude
that board skills and board commitment indirectly reduce earnings management
through mandatory disclosures.
The findings are highly relevant in the context of Indonesia. As we have shown
in the descriptive analysis, Indonesian firms generally speaking do not satisfy
mandatory disclosure requirements. This is a remarkable finding. Apparently,
implementing these mandatory requirements is not enforced effectively. Firms do not
expect and/or experience costs or value losses when they do not comply with these
mandatory requirements. At the same time, our analysis shows the value of complying
with these requirements as it seems to be associated with lower agency costs, such as
earnings management. Overall, our results imply that the monitoring role of the boards
of Indonesian firms needs to be improved, particularly to enforce firms to comply with
mandatory requirements at a higher level.

Chapter 5
Table 5.11 Sobel test and Goodman test results – voluntary disclosures
Independent variable
Mediating variable
Dependent variable
Total effect (z stats)
Direct effect (z stats)
Indirect effect (z stats)
Sobel test Goodman test
Mediation effect
Skills V-Disclosure DAccruals_MJ -0.0005*** (-2.41)
-0.0004 (-1.93)
-0.0001 (-0.50)
-0.0001 (-0.50)
-0.0001 (-0.50)
No
Commitment V-Disclosure DAccruals_MJ -0.0001 (-0.44)
0.0000 (0.05)
-0.0001 (-1.39)
-0.0001 (-1.39)
-0.0001 (-1.41)
No
Structure V-Disclosure DAccruals_MJ -0.0004 (-1.50)
-0.0003 (-1.34)
-0.0000 (-1.07)
-0.0000 (-1.07)
-0.0000 (-1.2)
No
* significant at 10%, ** significant at 5%, *** significant at 1% - two tailed
Table 5.12 Sobel test and Goodman test results – mandatory disclosures
Independent variable
Mediating variable
Dependent variable
Total effect (z stats)
Direct effect (z stats)
Indirect effect (z stats)
Sobel test Goodman test
Mediation effect
Skills M-Disclosure
DAccruals_MJ -0.0005** (-2.41)
-0.0002 (-1.11)
-0.0002** (-2.20)
-0.0002** (-2.20)
-0.0002** (-2.21)
Yes
Commitment M-Disclosure
DAccruals_MJ -0.0001 (-0.44)
0.0002 (1.06)
-0.0003*** (-3.03)
-0.0003*** (-3.03)
-0.0003*** (-3.05)
Yes
Structure M-Disclosure
DAccruals_MJ -0.0004 (-1.51)
-0.0003 (-1.19)
-0.0001 (-1.49)
-0.0001 (-1.49)
-0.0001 (-1.56)
No
* significant at 10%, ** significant at 5%, *** significant at 1% - two tailed

Boards, Transparency, and Earnings Management
Table 5.13 SEM results – voluntary disclosures
Independent Variable
Mediating Variable
Dependent Variable
Total Effect (z stats)
Direct Effect (z stats)
Indirect Effect (z stats)
Mediation Effect
Skills V-Disclosure DAccruals_MJ -0.0005** (-2.42)
-0.0004 (-1.94)
-0.0001 (-0.50)
No
Commitment V-Disclosure DAccruals_MJ -0.0001 (-0.45)
0.0000 (0.05)
-0.0001 (-1.40)
No
Structure V-Disclosure DAccruals_MJ -0.0004 (-1.51)
-0.0003 (-1.35)
-0.0000 (-1.07)
No
* significant at 10%, ** significant at 5%,; *** significant at the 1% level
Table 5.14 SEM results – mandatory disclosures
Independent Variable
Mediating Variable
Dependent Variable
Total Effect (z stats)
Direct Effect (z stats)
Indirect Effect (z stats)
Mediation Effect
Skills V-Disclosure DAccruals_MJ -0.0005** (-2.42)
-0.0002 (-1.12)
-0.0002** (-2.21)
Yes
Commitment V-Disclosure DAccruals_MJ -0.0001 (-0.45)
0.0002 (1.07)
-0.0003*** (-3.04)
Yes
Structure V-Disclosure DAccruals_MJ -0.0004 (-1.51)
-0.0003 (-1.19)
-0.0001 (-1.50)
No
* significant at 10%, ** significant at 5%, *** significant at 1% level

Chapter 5
187
5.5 Conclusions
In this paper we investigate the relationship between board inputs and earnings
management as well as the relationship between board inputs and the level of
transparency and disclosure. Our research is linked to the literature that stresses the
important role of boards in monitoring management and in reducing agency costs that
may occur due to the conflict of interests between managers and owners of the firm. One
type of agency costs is earnings management. Boards may have different features, or
inputs as we have labelled them, that may enhance their monitoring effectiveness and
that may be conducive to reducing agency costs such as earnings management. In our
analysis, we develop three constructs measuring the level of board inputs, i.e. board
skills, board commitment, and board structure. More skillful and experienced board
members are expected to be better equipped to carry out their monitoring role.
Committed board members devote more time to carrying out their task, which may
contribute to making them more effective monitors. Better structured boards also
contribute to more effective monitoring.
The aim of this paper is to investigate whether higher levels of board inputs
directly affect earnings management. In addition, we investigate whether these inputs
trigger higher levels of transparency and disclosure, which in turn contribute to lower
levels of earnings management. In the latter case, the impact of board inputs on earnings
management is indirect and is mediated through higher levels of transparency and
disclosure.
We use data from 104 listed non-financial Indonesian firms for which we have
detailed data on their governance from the ASEAN Corporate Governance Scorecard for
the years 2013, 2014, and 2015, and find that board inputs are not directly associated
with earnings management. At the same time, we find that board inputs are positively
associated with the level of information disclosure. Most importantly, however, we find
that board skills and board commitment (but not board structure) mitigate earnings
management indirectly through mandatory disclosure, but not through voluntary
disclosure.

Boards, Transparency, and Earnings Management
188
Our findings are highly relevant for emerging economies in general, and for
Indonesia in particular. Many emerging economies have introduced codes of corporate
governance during recent years. Among other things, these codes discuss mandatory
and voluntary disclosure rules. These rules describe what firms are required to do
(mandatory disclosures), or what they should do (voluntary disclosures), when it comes
to providing information to their stakeholders. In practice, firms may not follow
voluntary disclosures, because complying with them may be costly. For the same
reasons, they may even refrain from complying with mandatory disclosures. Such
behavior is possible when boards are weak and are unable to monitor and enforce
higher disclosures. Moreover, this behavior may also occur when compliance is not
monitored effectively by financial markets and/or regulators. Lack of effective
monitoring of compliance with regulations is particularly at stake in emerging
economies, where corporate governance mechanisms such as boards, as well as formal
institutions, such financial markets and regulatory power and authority are usually
weaker.
Weak monitoring of compliance with corporate governance requirement in
general, and disclosure rules in particular, is also an issue in Indonesia. On the one
hand, the quality of corporate governance seems rather weak. Our data show that the
quality of board inputs is indeed rather low, at least in the years for which we have data.
On the other hand, we also show that Indonesian firms generally do not satisfy all
mandatory disclosure requirements. This suggests that in Indonesia, implementing
mandatory disclosure requirements is not enforced effectively. Firms do not expect
and/or experience costs or value losses when they do not comply with these mandatory
requirements. Our analysis also shows, however, that complying with mandatory
disclosures has value: higher mandatory disclosures are associated with lower agency
costs, such as earnings management. Overall, therefore, our results imply that the
monitoring role of the boards of Indonesian firms needs to be strengthened to make sure
that firms comply with mandatory requirements a larger extent. Moreover, our findings
suggest that regulatory power should be enhanced. That is, the Indonesian regulatory

Chapter 5
189
authority responsible for corporate governance and the compliance with mandatory
requirements should develop measures and instruments allowing it to better monitor
compliance with these requirements.
The Indonesia Financial Services Authority (OJK) is the regulatory and
supervisory agency responsible for enhancing corporate governance of Indonesian
firms, among other things. In 2014, this authority initiated reforms to improve the
corporate governance framework by launching the Indonesian Corporate Governance
Roadmap with the support of the International Finance Corporate World Bank (the
Jakarta Post, 2014). The roadmap basically emphasizes three main areas of concern, that
is, strengthen the role of supervisory boards, improve company transparency and
disclosure and provide greater protection for shareholders and stakeholders. In
particular, the authority initiated a new regulation based on which listed companies are
required to implement the comply-or-explain approach with respect to complying with
corporate governance requirements. The regulation imposes publicly listed companies
to follow corporate governance best practices specified in the new regulation; any
violation may result in sanctions from OJK. It is beyond the scope of this paper to
analyse the impact of the new regulation on the quality of corporate governance of
Indonesian firms, and of their earnings management practices in particular. We leave
such an evaluation for future research.

Boards, Transparency, and Earnings Management
190
Appendix 5.1 Earnings Management Model
Model Formula Explanation
Jones Model (Jones, 1991)
TA = α + β ∆REV + β PPE + ε
TAit = Total accruals which is Net Income before extraordinary items (Operating Income) minus Net Operating Cash Flows for firm i in the year t
ΔREVit = the change in Net Revenues (Sales) from year t-1 to t, for firm i in the year t
ΔRECit = the change in Accounts (Trade) Receivable from t-1 to t
PPEit = Gross Property, Plant and Equipment
ROAit = Return on Assets year t for firm i
ROAit-1 = Return on Assets year t-1 for firm i
All variables are deflated by Total Assets t-1
Modified Jones Model (Dechow et al., 1995)
TA = α + β [∆REV −∆REC + β PPE + ε
Kothari Model 1 (Kothariet al., 2005)
TA = α + β [∆REV −∆REC ] + β PPE +β ROA + ε
Kothari Model 2 (Kothari et al., 2005)
TA = α + β [∆REV −∆REC ] + β PPE +β ROA + ε
Dechow and Dichev (2002) Model
∆WC = α + β CFO +β CFO + β CFO +ε
ΔWCit = the change in Working Capital from t-1 to t, for firm i in the year t; in which ΔWC is computed as ΔAccounts Receivable + ΔInventory – ΔAccounts Payable – ΔTaxes Payable + ΔOther Assets (net)
CFO = Net Cash Flows from Operation year t-1, t, and t+1 respectively
All variables are deflated by average Total Assets

Chapter 5
191
Appendix 5.2 Company List
2012 2013 2014
Agriculture Agriculture Agriculture 1 Astra agro lestari 1 Astra agro lestari 1 Astra agro lestari
2 Pp london sumatra indo. 2 Pp london sumatra indo. 2 Dharma satya nusantara 3 Salim ivomas pratama 3 Salim ivomas pratama 3 Eagle high plantations 4 Smart 4 Sawit sumbermas sarana 4 Pp london sumatra indo.
5 Smart 5 Salim ivomas pratama
6 Sawit sumbermas sarana
7 Smart
Mining Mining Mining 5 Adaro energy 6 Adaro energy 8 Adaro energy 6 Aneka tambang 7 Aneka tambang 9 Aneka tambang 7 Bayan resources 8 Apexindo pratama duta 10 Apexindo pratama duta 8 Bumi resources 9 Bayan resources 11 Bayan resources 9 Bukit asam 10 Bukit asam 12 Bukit asam
10 Garda tujuh buana 11 Golden energy mines 13 Golden energy mines 11 Golden energy mines 12 Indo tambangraya megah 14 Indo tambangraya megah 12 Harum energy 13 Medco energi intl. 15 Medco energi intl. 13 Indo tambangraya megah 14 Timah 16 Vale indonesia 14 Vale indonesia 15 Vale indonesia
Basic industry & chemicals
Basic industry & chemicals
Basic industry & chemicals
15 Charoen pokphand indo. 16 Arwana citramulia 17 Charoen pokphand indo. 16 Chandra asri petroch 17 Chandra asri petroch. 18 Chandra asri petroch. 17 Holcim indonesia 18 Charoen pokphand indo. 19 Holcim indonesia
18 Indocement tunggal prakarsa 19 Holcim indonesia 20 Indocement tunggal prakarsa
19 Japfa comfeed indonesia 20 Indah kiat pulp & paper 21 Japfa comfeed indonesia
20 Krakatau steel 21 Indocement tunggal prakarsa 22 Wijaya karya beton 21 Semen indonesia 22 Japfa comfeed indonesia
23 Krakatau steel
24 Semen indonesia
Miscellaneous industry Miscellaneous industry Miscellaneous industry 22 Astra international 25 Astra international 23 Astra international 23 Astra otoparts 26 Astra otoparts 24 Astra otoparts
24 Gajah tunggal 27 Gajah tunggal 25 Indomobil sukses intsl. 25 Indomobil sukses intsl. 28 Indomobil sukses intsl.

Boards, Transparency, and Earnings Management
192
2012 2013 2014
Consumer goods Consumer goods Consumer goods 26 Gudang garam 29 Gudang garam 26 Gudang garam 27 Hm sampoerna 30 Hm sampoerna 27 Hm sampoerna 28 Indofood cbp sukses mkm. 31 Indofood cbp sukses mkm. 28 Indofood cbp sukses mkm. 29 Indofood sukses makmur 32 Indofood sukses makmur 29 Indofood sukses makmur 30 Kalbe farma 33 Industri jamu dan fsmn. 30 Industri jamu dan fsmn. 31 Multi bintang indonesia 34 Kalbe farma 31 Kalbe farma 32 Nippon indosari corpindo 35 Multi bintang indonesia 32 Multi bintang indonesia
33 Tempo scan pacific 36 Tempo scan pacific 33 Tempo scan pacific 34 Ultra jaya milk industry 37 Ultra jaya milk industry 34 Ultra jaya milk industry 35 Unilever indonesia 38 Unilever indonesia 35 Unilever indonesia
Property, real estate & construction
Property, real estate & construction
Property, real estate & construction
36 Agung podomoro land 39 Alam sutera realty 36 Agung podomoro land
37 Alam sutera realty 40 Bumi serpong damai 37 Alam sutera realty 38 Bekasi fajar indl.est 41 Ciputra development 38 Bumi serpong damai 39 Bumi serpong damai 42 Danayasa arthatama 39 Ciputra development 40 Ciputra development 43 Duta pertiwi 40 Danayasa arthatama
41 Duta pertiwi 44 Jaya real property 41 Duta pertiwi 42 Jaya real property 45 Lippo karawaci 42 Jaya real property 43 Lippo karawaci 46 Mnc land 43 Lippo cikarang 44 Pakuwon jati 47 Pakuwon jati 44 Mnc land
45 Sentul city 48 Pembangunan perumahan 45 Pakuwon jati 46 Summarecon agung 49 Plaza indonesia realty 46 Pembangunan perumahan 47 Surya semesta internusa 50 Summarecon agung 47 Plaza indonesia realty 48 Wijaya karya 51 Wijaya karya 48 Summarecon agung 49 Waskita karya 52 Waskita karya 49 Wijaya karya
50 Waskita karya
Infrastructure & utilities Infrastructure & utilities Infrastructure & utilities 50 Xl axiata 53 Xl axiata 51 Xl axiata
51 Garuda indonesia 54 Garuda indonesia 52 Garuda indonesia 52 Inovisi infracom 55 Indosat 53 Indosat 53 Indosat 56 Jasa marga 54 Jasa marga 54 Jasa marga 57 Perusahaan gas negara 55 Perusahaan gas negara
55 Perusahaan gas negara 58 Sarana menara nusantara 56 Sarana menara nusantara 56 Sarana menara nusantara 59 Telekomunikasi indonesia 57 Telekomunikasi indonesia 57 Telekomunikasi indonesia 60 Tower bersama infr. 58 Tower bersama infrast. 58 Tower bersama infr. 61 Trada maritime
59 Trada maritime

Chapter 5
193
2012 2013 2014
Trade, services & investment
Trade, services & investment
Trade, services & investment
60 Abm investama 62 Abm investama 59 Abm investama 61 Ace hardware indonesia 63 Ace hardware indonesia 60 Ace hardware indonesia
62 Akr corporindo 64 Akr corporindo 61 Akr corporindo 63 Bumi resources minerals 65 Dian swastatika sentosa 62 Dian swastatika sentosa 64 Dian swastatika sentosa 66 Elang mahkota teknologi 63 Elang mahkota teknologi 65 Elang mahkota teknologi 67 Enseval putera megatrading 64 Enseval putera megatrading
66 Global mediacom 68 Global mediacom 65 Global mediacom 67 Hero supermarket 69 Hanson international 66 Hero supermarket 68 Indosiar karya media 70 Hero supermarket 67 Indoritel makmur intsl. 69 Matahari department store 71 Indoritel makmur intsl. 68 Intermedia capital
70 Matahari putra prima 72 Jaya konmgl.pratama 69 Jaya konmgl.pratama 71 Media nusnt.citra 73 Matahari department store 70 Link net 72 Mnc investama 74 Matahari putra prima 71 Matahari department store 73 Mitra adiperkasa 75 Media nusnt.citra 72 Matahari putra prima 74 Ramayana lestari sentosa 76 Mitra adiperkasa 73 Media nusnt.citra 75 Sugih energy 77 Mnc investama 74 Mitra adiperkasa 76 Surya citra media 78 Ramayana lestari sentosa 75 Mitra keluarga kyst. 77 Sumber alfaria trijaya 79 Saratoga investama sedaya 76 Mnc investama 78 Trikomsel oke 80 Sugih energy 77 Multipolar
79 United tractors 81 Sumber alfaria trijaya 78 Saratoga investama sedaya
82 Surya citra media 79 Sugih energy
83 United tractors 80 Sumber alfaria trijaya
81 Surya citra media
82 United tractors
83 Visi media asia

Boards, Transparency, and Earnings Management
194
Appendix 5.3 Responsibilities of the Board Scorecard
No. 1. Board Duties and Responsibilities
Clearly defined board responsibilities and corporate governance policy 1 1.1 Does the company disclose its corporate governance policy / board charter? 2 1.2 Are the types of decisions requiring board of directors/commissioners' approval
disclosed? 3 1.3 Are the roles and responsibilities of the board of directors/commissioners clearly
stated? Corporate Vision/Mission 4 1.4 Does the company have a vision and mission statement? 5 1.5 Has the board review the vision and mission/strategy in the last financial year? 6 1.6 Does the board of directors monitor/oversee the implementation of the corporate
strategy?
2. Board structure Code of Ethics or Conduct 7 2.1 Are the details of the code of ethics or conduct disclosed? 8 2.2 Does the company disclose that all directors/commissioners, senior management
and employees are required to comply with the code? 9 2.3 Does the company disclose how it implements and monitors compliance with the
code of ethics or conduct? Board Structure & Composition 10 2.4 Do independent directors/commissioners make up at least 50% of the board of
directors/commissioners? 11 2.5 Are the independent directors/commissioners independent of management and
major/ substantial shareholders? 12 2.6 Does the company have a term limit of nine years or less for its independent
directors/commissioners? 13 2.7 Has the company set a limit of five board seats that an individual
independent/non-executive director/commissioner may hold simultaneously? 14 2.8 Does the company have any executive directors who serve on more than two
boards of listed companies outside of the group? Nominating Committee 15 2.9 Does the company have a Nominating Committee (NC)? 16 2.10 Does the Nominating Committee comprise of a majority of independent
directors/commissioners? 17 2.11 Is the chairman of the Nominating Committee an independent
director/commissioner? 18 2.12 Does the company disclose the terms of reference/ governance structure/charter
of the Nominating Committee? 19 2.13 Did the Nominating Committee meet at least twice during the year?

Chapter 5
195
20 2.14 Is the attendance of members at Nominating Committee meetings disclosed? Remuneration Committee/ Compensation Committee 21 2.15 Does the company have a Remuneration Committee? 22 2.16 Does the Remuneration Committee comprise of a majority of independent
directors/commissioners? 23 2.17 Is the chairman of the Remuneration Committee an independent
director/commissioner? 24 2.18 Does the company disclose the terms of reference/ governance structure/ charter
of the Remuneration Committee? 25 2.19 Did the Remuneration Committee meet at least twice during the year? 26 2.20 Is the attendance of members at Remuneration Committee meetings disclosed? Audit Committee 27 2.21 Does the company have an Audit Committee? 28 2.22 Does the Audit Committee comprise entirely of non-executive
directors/commissioners with a majority of independent directors/commissioners?
29 2.23 Is the chairman of the Audit Committee an independent director/commissioner? 30 2.24 Does the company disclose the terms of reference/governance structure/charter of
the Audit Committee? 31 2.25 Does the Annual Report disclose the profile or qualifications of the Audit
Committee members? 32 2.26 Does at least one of the independent directors/commissioners of the committee
have accounting expertise (accounting qualification or experience)? 33 2.27 Did the Audit Committee meet at least four times during the year? 34 2.28 Is the attendance of members at Audit Committee meetings disclosed? 35 2.29 Does the Audit Committee have primary responsibility for recommendation on
the appointment, and removal of the external auditor?
3. Board Processes Board meetings and attendance 36 3.1 Are the board of directors meeting scheduled before the start of financial year? 37 3.2 Does the board of directors/commissioners meet at least six times during the
year? 38 3.3 Has each of the directors/commissioners attended at least 75% of all the board
meetings held during the year? 39 3.4 Does the company require a minimum quorum of at least 2/3 for board decisions? 40 3.5 Did the non-executive directors/commissioners of the company meet separately
at least once during the year without any executives present? Access to information 41 3.6 Are board papers for board of directors/commissioners meetings provided to the
board at least five business days in advance of the board meeting? 42 3.7 Does the company secretary play a significant role in supporting the board in
discharging its responsibilities?

Boards, Transparency, and Earnings Management
196
43 3.8 Is the company secretary trained in legal, accountancy or company secretarial practices?
Board Appointments and Re-Election 44 3.9 Does the company disclose the criteria used in selecting new
directors/commissioners? 45 3.10 Does the company disclose the process followed in appointing new
directors/commissioners? 46 3.11 Are all the directors/commissioners subject to re-election at least once every three
years? Remuneration Matters 47 3.12 Does the company disclose its remuneration (fees, allowances, benefit-in-kind
and other emoluments) policy/practices (i.e. the use of short term and long term incentives and performance measures) for its executive directors and CEO?
48 3.13 Is there disclosure of the fee structure for non-executive directors/commissioners? 49 3.14 Do the shareholders or the Board of Directors approve the remuneration of the
executive directors and/or the senior executives? 50 3.15 Do independent non-executive directors/commissioners receive options,
performance shares or bonuses? Internal Audit 51 3.16 Does the company have a separate internal audit processes? 52 3.17 Is the head of internal audit identified or, if outsourced, is the name of the
external firm disclosed? 53 3.18 Does the appointment and removal of the internal auditor require the approval of
the Audit Committee? Risk Oversight 54 3.19 Does the company disclose the internal control procedures/risk management
systems it has in place? 55 3.20 Does the Annual Report disclose that the board of directors/commissioners has
conducted a review of the company's material controls (including operational, financial and compliance controls) and risk management systems?
56 3.21 Does the company disclose how key risks are managed? 57 3.22 Does the Annual Report contain a statement from the board of
directors/commissioners or Audit Committee commenting on the adequacy of the company's internal controls/risk management systems?
4. People on the Board Board Chairman 58 4.1 Do different persons assume the roles of chairman and CEO? 59 4.2 Is the chairman an independent director/commissioner? 60 4.3 Are any of the directors a former CEO of the company in the past 2 years? 61 4.4 Are the role and responsibilities of the chairman disclosed?

Chapter 5
197
Skills and Competencies 62 4.5 Does at least one non-executive director/commissioner have prior working
experience in the major sector that the company is operating in? 63 4.6 Does the company disclose a board of directors/commissioners diversity policy?
5. Board Performance Directors Development 64 5.1 Does the company have orientation programmes for new
directors/commissioners? 65 5.2 Does the company have a policy that encourages directors/commissioners to
attend on-going or continuous professional education programmes? CEO/Executive Management Appointments and Performance 66 5.3 Does the company disclose how the board of directors/commissioners plans for
the succession of the CEO/Managing Director/President and key management? 67 5.4 Does the board of directors/commissioners conduct an annual performance
assessment of the CEO/Managing Director/President? Board Appraisal 68 5.5 Is an annual performance assessment conducted of the board of
directors/commissioners? 69 5.6 Does the company disclose the process followed in conducting the board
assessment? 70 5.7 Does the company disclose the criteria used in the board assessment? Director Appraisal 71 5.8 Is an annual performance assessment conducted of individual
director/commissioner? 72 5.9 Does the company disclose the process followed in conducting the
director/commissioner assessment? 73 5.10 Does the company disclose the criteria used in the director/commissioner
assessment? Committee Appraisal 74 5.11 Is an annual performance assessment conducted of the board of
directors/commissioners committees?

Boards, Transparency, and Earnings Management
198
Appendix 5.4 Three Constructs
No. Construct/ Indicators Board Structure and Composition
1 2.4 Do independent directors/commissioners make up at least 50% of the board of directors/commissioners?
2 2.5 Are the independent directors/commissioners independent of management and major/ substantial shareholders?
3 2.6 Does the company have a term limit of nine years or less for its independent directors/commissioners?
4 2.10 Does the Nominating Committee comprise of a majority of independent directors/commissioners?
5 2.11 Is the chairman of the Nominating Committee an independent director/commissioner? 6 2.16 Does the Remuneration Committee comprise of a majority of independent
directors/commissioners? 7 2.17 Is the chairman of the Remuneration Committee an independent director/commissioner? 8 2.22 Does the Audit Committee comprise entirely of non-executive directors/commissioners
with a majority of independent directors/commissioners? 9 4.2 Is the chairman an independent director/commissioner?
Board Time Commitment
1 2.7 Has the company set a limit of five board seats that an individual independent/non-executive director/commissioner may hold simultaneously?
2 2.8 Does the company have any executive directors who serve on more than two boards of listed companies outside of the group?
3 2.13 Did the Nominating Committee meet at least twice during the year? 4 2.19 Did the Remuneration Committee meet at least twice during the year? 5 2.27 Did the Audit Committee meet at least four times during the year?
6 3.2 Does the board of directors/commissioners meet at least six times during the year? 7 3.3 Has each of the directors/commissioners attended at least 75% of all the board meetings
held during the year? 8 3.4 Does the company require a minimum quorum of at least 2/3 for board decisions? 9 3.5 Did the non-executive directors/commissioners of the company meet separately at least
once during the year without any executives present?
Board Skills and Competencies 1 2.26 Does at least one of the independent directors/commissioners of the audit committee have
accounting expertise (accounting qualification or experience)? 2 4.5 Does at least one non-executive director/commissioner have prior working experience in
the major sector that the company is operating in?
3 5.1 Does the company have orientation programmes for new directors/commissioners? 4 5.2 Does the company have a policy that encourages directors/commissioners to attend on-
going or continuous professional education programmes? 5 5.5 Is an annual performance assessment conducted of the board of directors/commissioners? 6 5.11 Is an annual performance assessment conducted of the board of directors/commissioners
committees?

Chapter 5
199
Appendix 5.5 Variable Definitions
No. Variable
Definition
1 DAccruals denotes Discretionary Accruals calculated based on the Jones (J) model, or the Modified Jones (MJ) model, or the Kothari 1 (K1) model, or the Kothari 2 (K2) model, or the Dechow&Dichev (DD) model
2 Skills a board skills index constructed from 6(six) questions based on the IICD scorecard.
3 Commitment a board commitment index constructed from 9(nine) questions based on the IICD scorecard.
4 Structure a board structure index constructed from 9(nine) questions based on the IICD scorecard.
5 M-Disclosure a mandatory index constructed from 19 questions based on the IICD scorecard.
6 V-Disclosure a voluntary index constructed from 22 questions based on the IICD scorecard.
7 Foreigncomm a ratio of the number of foreign commissioners to the total number of commissioners
8 Bocsize the number of commissioners
9 Big-4 dummy takes the value of 1 if the firm audited by a big-4 audit firm, otherwise zero.
10 Publicshares the number of shares held by public investors and traded on the stock exchange divided by the total number of outstanding shares.
11 Foreignown dummy takes the value of 1 if more than 50% of the firm ownership are foreign shareholders, otherwise zero.
12 SOE dummy the value is one if the firm is 50% more owned by the government, otherwise zero.
13 Lnmarketcap a natural log of total market capitalization.
14 Leverage a ratio of total liabilities to total assets
15 Year dummies a yearly dummy for year 2013 and 2014.
16 Industry dummies an industrial dummy for seven industry categories.

Boards, Transparency, and Earnings Management
200

Chapter 6
201
Chapter 6 Conclusions
Corporate governance is a broad concept which involves law and regulations, codes,
policies and procedures. The purpose is to provide control mechanisms that direct the
relationships between a company’s management, its board, its shareholders and other
stakeholders (OECD, 2015). Various corporate governance best practices have been
developed to help companies implement them. However, in reality corporate
governance practices vary across countries. It is argued that certain corporate
governance prescriptions do not necessarily translate into similar outcomes and often
‘one size does not fit all’ (Hermes et al., 2006; Hofstetter, 2006; Arcot and Bruno, 2007;
Osma and Noguer, 2007; Davies and Schlitzer, 2008; Yoshikawa, 2015).
Variations in corporate governance practices are determined by several forces
such as legal tradition, the economy and capital market development (Aguilera and
Jackson, 2010; Daniel et al., 2012; Cumming et al., 2017). Prior research has shown that
the diversity of institutional environments shapes the effectiveness of corporate
governance mechanisms (Young et al., 2004; Berglöf and Claessens, 2006; Pejovic, 2011).
Therefore, taking into account the institutional context is crucial to better understand
how well the implementation of corporate governance mechanisms.
This dissertation aims at exploring how corporate governance practices are
implemented in a fast growing, middle-income country. Many studies have traditionally
regarded Indonesia as having weak investor protection and, weak enforcement of law
(Goyal and Muckley, 2013; La Porta et al., 2000), and low risk of litigation (Fitriany et al.,
2016). Even though corporate governance practices in Indonesia have improved
considerably over the past decade, the actual implementation of the practices still lags
behind.

Conclusions
202
Particularly, the dissertation investigates external and internal corporate
governance mechanisms which may discipline managers and control managerial
misconduct in Indonesia. The external mechanisms that we investigate are the
institutional framework and external auditors, while the internal mechanisms are the
board of directors and transparency. Four empirical studies have been carried out to
answer the following research questions:
1. Does a strong institutional framework mitigate opportunities for corruption
(Chapter 2)?
2. What factors influence external auditors when assessing fraud risks (Chapter 3)?
3. Does a change of the institutional landscape influence the value of politically
connected board members (Chapter 4)?
4. Do board characteristics improve transparency and mitigate earnings
management practices (Chapter 5)?
In chapter 2 of the thesis, we review the corporate governance institutional
framework to better understand the rules and regulations that regulate shareholders,
board of directors, accounting and auditing standards, and transparency. The results
provide insight into the importance of the institutional framework with regard to
controlling misbehaviour. In chapters 3-5, we further investigate the components of
corporate governance mechanisms i.e., external auditors, board of commissioners and
board of directors, and transparency. We select these mechanisms because we deem
them important for the governance of firms in an emerging economy such as Indonesia.
In particular, boards are responsible for monitoring and ensuring that
management always complies and runs business at the best interests of shareholders. As
part of the internal mechanisms, board members encourage firms to be transparent. In
addition, they also control managers from engaging in earnings management practices.
To assure that management performs properly, it is necessary to be assessed by external
parties, such as external auditors. Competent and qualified auditors are required to
supply an objective opinion that a company’s financial reporting is free from material

Chapter 6
203
misstatements and errors. Besides monitoring, the role of board members is to deliver
services by providing advice. Board of commissioners or board of directors who have
valuable resources such as political connections, may contribute, or even harm financial
performance. Yet, their impact on firm performance depends on the institutional
landscape.
The main findings of the four empirical studies are presented below, followed by
a discussion of practical implications and policy recommendations, and avenues for
future research.
6.1 The Main Findings of Each Study
The thesis consists of four (4) empirical studies, which are presented in Chapters 2, 3, 4,
and 5. Each chapter provides analyses regarding corporate governance mechanisms in
Indonesia. Table 6.1 summarises the main findings of the four empirical studies in the
dissertation.
The first study (chapter 2) explores the role of institutional frameworks in
constraining opportunities for corruption. The quality of institutional frameworks
renders a basis for the implementation of corporate governance mechanisms. This study
applies a qualitative approach focusing on comparing Indonesia’s corporate governance
institutional framework (code, laws, rules, and regulations) to the framework developed
in neighbouring countries i.e., Malaysia and Thailand. We evaluate corporate
governance measures in the areas of shareholder rights, board of
directors/commissioners, and the accounting and auditing standards including
transparency. The main finding of the study is that Indonesia’s corporate governance
institutional framework is weaker than that of Malaysia and Thailand.

Conclusions
204
Table 6.1 Summary of the main findings
Chapter Objective Hypotheses Findings
2 To investigate the role of the institutional framework in mitigating opportunities for corruption
- A better developed institutional framework for corporate governance can mitigate opportunities for corruption.
- Indonesia’s corporate governance institutional framework is weaker than in Malaysia and Thailand
- Indonesia’s corporate governance institutional framework is less demanding and less often enforced, which leads to greater opportunities for corruption.
3 To investigate the determinants of auditors’ decision making in fraud risk assessments
- Fraud risk factors are positively associated with fraud risk assessments.
- Materiality judgments are positively associated with fraud risk assessments.
- Professional scepticism is positively associated with fraud risk assessments.
- Litigation risk is positively associated with fraud risk assessments.
- Fraud risk factors, materiality judgments, and professional scepticism positively influence external auditors when assessing fraud risks.
- More conservative behaviour (by lowering materiality thresholds) increase auditors’ scepticism that leads to increased fraud risk assessment.
- Immaterial misstatements are perceived to be less litigious by external auditors.
4 To investigate the impact of a substantial change in the political and economic framework of the economic value of political connections.
- The value of political connections is lower in the democratic era as compared to the pre-democratic era.
- The value of political connections has become less important in the democratic era (after 2004).
- Politically connected firms tend to have lower performance than non-politically connected firms.
- Large firms and affiliated firms that belong to a business group and have political connections tend to obtain more benefits than small firms and stand-alone firms.

Chapter 6
205
Chapter Objective Hypotheses Findings
5 To investigate the interrelationships between board inputs, transparency, and earnings management
- Each board input (board skills, board commitment, board structure) is negatively associated with the level of earnings management.
- Each board input (board skills, board commitment, board structure) is positively associated with the level of information disclosure
- Disclosure positively mediates the relationship between each board input and earnings management
- Board skills, board commitment, and board structure are not associated with the level of earnings management.
- Board skills, board commitment, and board structure are positively associated with the level of information disclosure
- Board skills and board commitment mitigate earnings management indirectly through mandatory disclosure (but not voluntary disclosure).
Shareholder rights in Indonesia, particularly minority shareholders, are less
protected. Corporate decisions are mostly in the hands of controlling shareholders, and
minority shareholders are likely to have difficulties in participating in the corporate
decision-making process. One of the channels to expropriate minority shareholders is
through Related-Party Transactions (RPT). Unlike Malaysia and Thailand, Indonesia
does not have a provision or regulation concerning a requirement to seek advice from
the supervisory board members or the audit committee before exercising a significant
related-party transaction. This circumstance makes it easier for insiders (inside
shareholders and management) to carry out abusive related-party transactions, which
may be detrimental to outside shareholders.
International best practices stipulate several measures pertaining to the board of
directors such as board independence, term limitation, and restrictions on the number of
directorships a person may hold simultaneously. Our study reveals that Indonesia’s
regulations regarding the board of commissioners and the board of directors tend to be

Conclusions
206
less regulated. For instance, there are no rules with respect to the independence of the
chairman, and/or the maximum age and term limits for commissioners and directors.
With regard to transparency, Indonesia did not apply a comply-or-explain
approach until December 31, 2016.46 This means that Indonesian listed companies were
not required to report to what extent the companies comply with the corporate
governance codes and principles. In addition, there is no mandatory requirement for the
board of commissioners to disclose potential conflicts of interest when they are involved
in a related-party transaction or when they are related to a political party or the
government. Board remuneration, the board nomination and selection process and audit
fees are also not necessary components a firm needs to report about in the annual report.
In general, we conclude that the Indonesian corporate governance framework is
mostly voluntary based. Because the institutional frameworks are less demanding and
less enforced, companies have more room to diverge from best practices in corporate
governance. This may provide stronger opportunities for managerial misbehaviour.
The second study (chapter 3) surveys 435 external auditors’ perception on a fraud
case. When conducting the audit of a firm’s financial statements, external auditors are
responsible for assessing fraud risks to assure that the financial reporting is free from
material misstatement due to fraud or error. Contrary to prior research that estimates
the fraud risk assessment model using a multiple regression, our research model
predicts that external auditors’ fraud risk assessment is determined by fraud risk factors,
materiality judgment, professional scepticism, litigation risk, and several auditor
characteristics (certification, experience, and audit firm size) simultaneously.
Using Structural Equation Modelling, the findings confirm that fraud risk factors
(red flags), materiality judgment, and professional scepticism positively influence
external auditors when assessing fraud risks. More importantly, the research finds that
materiality judgment affects fraud risk assessments indirectly through professional
46 The Financial Services Authority (OJK) introduced Regulation No.21/POJK.04/ 2015 dated
November 16, 2015. The regulation requires listed firms to report and disclose their corporate governance implementation on the basis of the comply-or-explain approach that should be applied for the 2016 annual reports onwards.

Chapter 6
207
scepticism. These findings imply that conservative behaviour (by lowering materiality
thresholds) is important because it increases auditors’ scepticism, leading to increased
fraud risk assessments. Auditors also perceive that when a misstatement is less material
the litigation risk tends to be lower, that is, the probability of being sued is lower.
Generally speaking, the main finding of the research is that conservatism and
professional scepticism are critical factors that help improving the quality of audits.
Next, chapter 4 investigates the effect of political and economic change in
Indonesia on the value of political connections to firms. The study is the first using
longitudinal data for the 2000-2011 period. We use hand-collected data on politically
connected board members of 357 listed non-financial Indonesian firms. To analyse the
effect, the data are split into the pre-democratic era period (2000-2004) and the
democratic era period (2005-2011). We investigate the financial performance of
politically connected firms and non-politically connected firms for the pre-democratic
era period as compared to the democratic era period.
As hypothesised, the empirical results show that in the democratic era the impact
of political connections on financial performance is reduced for both small and large
firms. In other words, the value of political connections became less important after
Indonesia went into a more democratic regime after 2004. One of the lessons of the
analysis is that when markets are decentralised, access to economic resources becomes
more open. In the democratic era, a shift of power occurred from the central
government to the local government. The power of the central bureaucrats declined,
leading to lower financial performance for firms having political connections with them.
Businessmen could no longer depend only on the centralised authority, but rather had
to connect to regional leaders and local politicians to have access to necessary resources.
Chapter 5 examines the interrelations between board inputs, transparency, and
earnings management. While previous studies assume a direct relationship between
board performance and earnings management, this study takes a different view. The
main hypothesis of this study is that the relationship between board characteristics and
earnings management is not necessarily direct. Three steps are performed i.e., first, the

Conclusions
208
association between board inputs and earnings management; second, the association
between board inputs and the level of transparency and disclosure; and third, the
association between board inputs and earnings management through transparency and
disclosure. Three constructs are developed using data from the ASEAN Corporate
Governance Scorecard to measure board inputs, i.e. board skills, board commitment,
and board structure.
The results show that board inputs are not directly associated with earnings
management; however board inputs are positively associated with the level of
transparency and disclosure. In addition, the research also supports our main
hypothesis that board skills and board commitment (but not board structure) mitigate
earnings management indirectly through mandatory disclosure, but not through
voluntary disclosure. These results imply that mandatory disclosure plays an important
role as a mediating factor between board inputs and earnings management.
6.2 Policy Recommendations
Based on the analyses and the main findings, the empirical studies in this thesis have
several practical implications and policy recommendations that will be discussed below.
As discussed in chapter 2, section 4, shareholder rights in Indonesia are less
protected by law and market-based mechanisms are rarely implemented. In particular,
the market for corporate control is almost non-existent in Indonesia. This also means
that shareholders who want to change the CEO and/or board members who
underperform have hardly any means to do so. This results from the fact that
shareholder rights in Indonesia are not well protected. A more conducive environment
for market-based mechanisms may therefore need to be encouraged. Capital market
regulators and changes in business law may facilitate the creation of channels for
shareholder activism, allowing shareholders to more easily voice their opinion. It is
crucial to strengthen their rights to question, to challenge and to make proposals.

Chapter 6
209
Furthermore, the voting system needs to be improved. For instance, if
shareholders are not able to attend the shareholders’ meeting, they could be allowed to
vote by mail. As another example, the minimum share capital that is needed to call a
shareholder meeting could be reduced. These types of reforms support shareholders to
become more actively involved in monitoring company management.
As indicated in our analyses of the importance of transparency in reducing
earnings management (chapter 5), Indonesian listed companies tend to not fully comply
with mandatory requirements regarding corporate governance best practices. Lack of
effective monitoring of compliance with regulations is particularly a big concern in
emerging economies. Policy makers and regulators such as the Indonesian Financial
Services Authority (OJK) are necessary to monitor the enforcement of law and
regulations. In emerging economies such as Indonesia, enforcing compliance with
mandatory requirements may have to become more stringent in penalizing firms that do
not comply with the regulations. Our findings indicate that the quality of the boards (in
terms of skills, commitment, and independence) is not enough to make sure firms
comply with mandatory requirements regarding good corporate governance. The
monitoring role of the boards of Indonesian firms needs to be strengthened. More strict
enforcement of requirements by regulating bodies may be one way to achieve this.
More specifically, with regard to strengthening board skills and competencies,
regulatory bodies such as the OJK and the Indonesia Stock Exchange could introduce
provisions that mandate the setup of nomination and remuneration policies, the
continuing professional education for board members, and an annual performance
assessment of the board of commissioners. Furthermore, to improve board commitment,
companies could limit the number of directorships of their board members.
Regulations pertaining to transparency need to be extended in order to align with
international best practices. In Indonesia there are no regulations that require listed
companies to disclose audit fees, nomination and remuneration policies for the board of
directors, and conflicts of interest that the board members may have. Board members
should report and disclose their position with the government and/or political party,

Conclusions
210
which may be deemed to bear conflicts of interest. The absence of these regulations
makes it easier for companies to conceal significant information that may contain
unobserved or non-arm’s-length transactions.
In the era of democratisation and open markets, transparency is a prerequisite.
Economic resources are distributed more evenly and fairly across regions. The central
government no longer has full control over economic resources. To ensure that economic
actors can fairly access resources, it is necessary to set up mechanisms that stimulate
easiness in doing business. As reflected in chapter 4, the power of the central
government has diminished in the democratic regime. The authority shifting from the
central government to local governments has an impact on business. Business activities
are no longer concentrated in the centre of the country, but more dispersed over
different regions. As a consequence, business actors may have to build relationships
with local bureaucrats.
In addition to transparency, accountability is also vital. Reliable financial
reporting and auditing promote confidence not only to the capital market but also to the
public. To serve and protect the public interest, independent auditors are important to
provide assurance that the financial reporting of firms is free from material
misstatements due to fraud or error. As mentioned in chapter 3, in Indonesia the quality
of audits is low. Audits are characterised by insufficient audit planning, a lack of
scepticism related to possible fraud and misstatements, and a lack of management
questioning and criticism. Our empirical results have various practical implications.
Most importantly, our results suggest that auditors have to improve their professional
competence, particularly in the area of materiality judgment and scepticism. Auditors
should be encouraged to behave more conservatively (by lowering the materiality
threshold) and to be more sceptical, which will lead to an increase in critical fraud risk
assessments.

Chapter 6
211
6.3 Future Research
The dissertation explores corporate governance practices in the Indonesian context.
Therefore, the results in principle only hold for the specific jurisdiction. However, we do
believe that the empirical research offers insightful analyses that may inspire researchers
to do similar research in other countries with different institutional frameworks. For
instance, the fraud risk assessment research can be replicated in countries with higher
litigation risk to investigate how auditors engaged in more litigious countries have
different perceptions of fraud risk assessments.
Referring to the political connections research, it focuses only on accounting
indicators to measure firm performance. Further research may utilise other variables
measuring company performance or decision-making to see how political connections
do influence them. Examples could be testing the relationship between political
connections and market value, access to and costs of bank loans, and acquiring
government procurement projects. This type of analysis helps to understand the
channels through which political connections may provide benefits to firms. In addition,
the analysis of the interplay between business and local bureaucrats in the democratic
era would be an interesting topic for future research.
In November 2015, the Indonesia Financial Services Authority (OJK - the
regulatory and supervisory agency) introduced a new regulation, which requires
publicly listed companies to implement the comply-or-explain approach when it comes
to complying with corporate governance best practices. The regulation imposes publicly
listed companies to follow corporate governance best practices. Violation of the comply-
or-explain rule may result in sanctions from OJK. Future research may analyse the
impact of the new regulation on the quality of corporate governance of Indonesian
firms.

Conclusions
212

213
References
Abughazaleh, N., O'connell, V., & Princen, J. (2015). Audit quality, auditor size and legal environments. Quarterly Journal of Finance and Accounting, 53(3/4), 39-78.
Acemoglu, D., Johnson, S, & Robinson, J.A. (2005). Institutions as a fundamental cause of long-run growth. In P. Aghion & S. Durlauf (Eds.), Handbook of economic growth (Vol. 1A, 385–464)., Chapter 6 Amsterdam: Elsevier.
Acito, A.A., Burks, J.J., & Johnson, W.B. (2009). Materiality decisions and the correction of accounting errors. The Accounting Review, 84(3), 659-688.
Adams, R.B. (2003). What do boards do? Evidence from board committee and director compensation data. EFA 2005 Moscow Meetings Paper. https://ssrn.com/abstract=397401 or http://dx.doi.org/10.2139/ssrn.397401.
Adams, R.B., Hermalin, B.E., & Weisbach, M.S. (2010). The role of boards of directors in corporate governance: a conceptual framework and survey. Journal of Economic Literature, 48(1), 58-107.
Adhikari, A., Derashid, C., & Zhang, H. (2006). Public policy, political connections, and effective tax rates: longitudinal evidence from Malaysia. Journal of Accounting and Public Policy, 25(5), 574-595.
Affandi, U., & Utama, S. (1998). Uji efisiensi bentuk setengah kuat pada BEJ. Majalah Usahawan, No.3 Th.XXVII, 42-47.
Agrawal, A., & Knoeber, C.R. (2001). Do some outside directors play a political role? The Journal of Law and Economics, 44(1): 179-198.
Aguilera, R.V. and A. Cuervo-Cazurra. (2004). Codes of good corporate governance worldwide: what is the trigger? Organization Studies, 25(3), 415-443.
Ahmed, K., Hossain, M., & Adams, R.B. (2006). The effects of board composition and board size on the informativeness of annual accounting earnings. Corporate Governance: An International Review, 14(5), 418-431.
Ahn, S., & Shrestha, K. (2013). The differential effects of classified boards on firm value. Journal of Banking & Finance, 37(11), 3993-4013.
Akcigit, U., Baslandze, S. & Lotti, F. (2018). Connecting to power: political connections, innovation, and firm dynamics. Becker Friedman Institute, Working Paper No. 2018-72.
Akhtaruddin, M., & Haron, H. (2010). Board ownership, audit committees' effectiveness, and corporate voluntary disclosures. Asian Review of Accounting, 18(3), 245-259.
Akhtaruddin, M., Hossain, M.A., Hossain, M.S., & Yao, L. (2009). Corporate governance and voluntary disclosure in corporate annual reports of Malaysian listed firms. Journal of Applied Management Accounting Research, 7(1), 1-20.
Albrecht, S.W., & Romney, M.B. (1986). Red-flagging management fraud: a validation. Advances in Accounting, 3, 323-333.
Albrecht, S.W., Howe, K.R., & Romney, M.B. (1985). Deterring fraud: the internal auditors’ perspective. The Accounting Review, 60(4), 774-775.

214
Albrecht, W.S., Albrecht, C.C., & Albrecht, C.O. (2004). Fraud and corporate executives: agency, stewardship and broken trust. Journal of Forensic Accounting, V, 109-130.
Alfraih, M.M. (2016). The effectiveness of board of directors’ characteristics in mandatory disclosure compliance. Journal of Financial Regulation and Compliance, 24(2), 154-176.
Allegrini, M., & Greco, G. (2013). Corporate boards, audit committees and voluntary disclosure: evidence from Italian listed companies. Journal of Management & Governance, 17(1), 187–216.
Alves, S. (2014). The effect of board independence on the earnings quality: evidence from Portuguese listed companies. Australasian Accounting, Business and Finance Journal, 8(3), 23-44.
Alves, S. (2013). The impact of audit committee existence and external audit on earnings management: evidence from Portugal. Journal of Financial Reporting and Accounting, 11(2), 143-165.
Ananchotikul, S., & Eichengreen, B. (2009). Corporate governance reform in emerging markets: how much, why, and with what effects? Journal of the Japanese and International Economies, 23, 149-176.
Ananta, A., & Riyanto, Y.E. (2006). Riding along a bumpy road: Indonesian economy in an emerging democratic era. ASEAN Economic Bulletin, 23(1), 1-10.
Ananta, A., Arifin, E.N., & Suryadinata, L. (2005). Emerging Democracy in Indonesia. ISEAS. Singapore.
Anderson, R.C., & Reeb, D.M. (2004). Board composition: Balancing family influence in S&P 500 firms. Administrative Science Quarterly, 49(2), 209-237.
Anderson, R.C., Reeb, D.M., Upadhyay, A., & Zhao, W. (2011). The economics of director heterogeneity. Financial Management, 40(1), 5-38.
Ansah, S.O., Moyes, G.D., Oyelere, P.B., & Hay, D. (2002). An empirical analysis of the likelihood of detecting fraud in New Zealand. Managerial Auditing Journal, 17(4), 192-204.
Apostolou, B., Hassell, J.M., & Webber, S.A. (2001). Management fraud risk factors: ratings by forensic experts. The CPA Journal, 71(10), 48-52.
Arcot, S.R., & Bruno, V.G. (2007). One size does not fit all, after all: evidence from corporate governance. Journal of Empirical Legal Studies, 4(4), 1041-1057.
Armstrong, C.S., Core, J.E., & Guay, W.R.. (2014). Do independent directors cause improvements in firm transparency? Journal of Financial Economics, 113(3), 383-403.
Arnold, B., & de Lange, P. (2004). Enron: an examination of agency problems. Critical Perspectives on Accounting, 15, 751-765.
Arnold, D.F., Bernardi, R.A., & Neidermeyer, P.E. (2001). The association between European materiality estimates and client integrity, national culture, and litigation. The International Journal of Accounting, 36(4), 459-483.
Arosa, B., Iturralde, T., & Maseda, A. (2013). The board structure and firm performance in SMEs: evidence from Spain. Investigaciones Europeas de Dirección y Economía de la Empresa, 19, 127–135.

215
Asare, S.K., & Wright, A.M. (2004). The effectiveness of alternative risk assessment and program planning tools in a fraud setting. Contemporary Accounting Research, 21(2), 325-352.
ASEAN Capital Markets Forum. (2015). ASEAN corporate governance scorecard. http://www.sec.gov.ph/wp-content/uploads/2015/10/ASEAN_CG_SCORECARD_20_april_2015.pdf
ASEAN Community in Figures 2011 (ACIF 2011). (2012). Jakarta: ASEAN Secretariat. ASEAN Federation of Accountants (AFA). (2014). Current status of the accounting and
auditing profession in ASEAN countries. ASEAN Federation of Accountants. (2013). Annual Report.
http://www.aseanaccountants.org/resource-2-AFA%20Annual%20Report.html
Asian Corporate Governance Association (ACGA). (2012) CG Watch 2012: Market Rankings. Asian Development Bank (ADB). (2013). ASEAN corporate governance scorecard: Country
reports and assessments 2012-2013. Asian Development Bank (ADB). (2016). ASEAN corporate governance scorecard: Country
reports and assessments 2014. Metro Manila, Philippines. Asian Development Bank (ADB). (2017). ASEAN corporate governance scorecard: Country
reports and assessments 2015. Aspinall, E., & Fealy, G. (2003). Local power and politics in Indonesia decentralization and
democratization. Research School of Pacific and Asian Studies the Australian National University.
Association of Certified Fraud Examiners (ACFE). (2016). Fraud prevention and deterrence. http://www.acfe.com/uploadedFiles/ACFE_Website/Content/review/examreview/18-fraud-risk-assessment.pdf [Accessed on June 6, 2016].
Association of Certified Fraud Examiners (ACFE). (2018). Report to the nations. 2018 global study on occupational fraud and abuse. Austin, USA.
Ayers, B.C., Jiang, J., & Yeung, P.E. (2006). Discretionary accruals and earnings management: an analysis of pseudo earnings targets. The Accounting Review, 81(3), 617-652.
Badan Pengawas Pasar Modal dan Lembaga Keuangan (Bapepam-LK). http://www.bapepam.go.id/pasar_modal/index.htm
Baek, J.S., Kang, J.K., & Park, K.S. (2004). Corporate governance and firm value: evidence from the Korean financial crisis. Journal of Financial Economics, 71, 265–313.
Bagashka, T. (2014). Unpacking corruption: the effect of veto players on state capture and bureaucratic corruption. Political Research Quarterly, 67(1), 165-180.
Bai, C.E., Liu, Q., Lu, J., Song, F.M., & Zhang, J. (2004). Corporate governance and market valuation in China. Journal of Comparative Economics, 32(4), 599-616.
Balsam, S. (1998). Discretionary accounting choices and CEO compensation. Contemporary Accounting Research, 15, 229–252.
Bapepam-LK. (2012). Decree No. KEP-431/BL/2012 of Regulation No. X.K.6 concerning the Annual Report for Publicly Listed Firms.

216
Bapepam-LK. (20012. Decree No. KEP-347/BL/2012 of Regulation No.VIII.G7 concerning the Presentation and Disclosure Requirements for Financial Statements prepared by Publicly Listed Firms.
Bapepam-LK. (2008). Decree No. KEP-521/BL/2008 of Regulation No.IX.E.1 concerning Transactions with Affiliated Parties and Conflict of Interest on Certain Transactions.
Bapepam-LK. (2011). Volatilitas pasar modal Indonesia dan perekonomian dunia. Laporan Studi. Bardhan, P. (2002). Decentralization of governance and development. Journal of Economic
Perspectives, 16(4), 185-205. Baron, R.M., & Kenny, D.A. (1986). The moderator-mediator variable distinction in social
psychological research: conceptual, strategic, and statistical considerations. Journal of Personality and Social Psychology, 51(6), 1173-1182.
Barros, C.P., Boubaker, S., & Hamrouni, A. (2013). Corporate governance and voluntary disclosure in France. The Journal of Applied Business Research, 29(2), 561–577.
Barton, D., Coombes, P., & Wong, S.-Y. (2004). Asia's governance challenge. McKinsey Quarterly, 2, 54-61.
Barton, J. (2001). Does the use of financial derivatives affect earnings management decisions? The Accounting Review, 76(1), 1-26.
Basu, S., Hwang, L-S., & Jan, C-L. (2001). Differences in conservatism between big eight and non-big eight auditors. https://ssrn.com/abstract=2428836 or http://dx.doi.org/10.2139/ssrn.2428836.
Bauhr, M., & Grimes, M. (2017). Transparency to curb corruption? Concept, measures and empirical merit. Crime Law Social Change, 68, 431-458.
BBC News. (2011). Profile: Thaksin Shinawatra. http://www.bbc.co.uk/news/world-asia-pacific-13891650 [Accessed on Jan 26, 2014].
Beasley, M. (1996). An empirical analysis of the relation between the board of director composition and financial statement fraud. The Accounting Review, 71(4), 443-465.
Beasley, M.S., Carcello, J.V., & Hermanson, D. R. (2001). Top 10 audit deficiencies. Journal of Accountancy, 19(1), 63–66.
Becker, C.L., Defond, M.L., Jiambalvo, J., & Subramanyam, K.R. (1998). The effect of audit quality on earnings management. Contemporary Accounting Research, 15(1), 1-24.
Bell, T.B., & Carcello, J.Y. (2000). A decision aid for assessing the likelihood of fraudulent financial reporting. Auditing, 19(1), 169-184.
Bell, T.B., Peecher, M.E., & Solomon, I. (2005). The 21st century public company audit. New York: KPMG LLP.
Bentler, P.M., & Bonett, D.G. (1980). Significance tests and goodness of fit in the analysis of covariance structures. Psychological Bulletin, 88, 588–606.
Bergstresser, D., & Philippon, T. (2006). CEO incentives and earnings management. Journal of Financial Economics, 80(3), 511-529.
Berkman, H., Cole, R.A., & L.J. Fu. (2009). Expropriation through loan guarantees to related parties: evidence from China. Journal of Banking and Finance, 33(1), 141– 156.
Berle, A. A., & Means, G.C. (1932). The Modern corporation and private property. Commerce Clearing House, New York.

217
Bernardi, R.A, & K.V. Pincus. (1996). The relationship between materiality thresholds and judgments of fraud risk. Managerial Finance, 22(1), 1-15.
Bertelsmann Transformation Index (BTI). (2003). Bhagat, S., & Black, B. (2002). The non-correlation between board independence and long-
term firm performance. The Journal of Corporation Law, Winter, 231-273. Bhagat, S., & Bolton, B. (2008). Corporate governance and firm performance. Journal of
Corporate Finance, 14(2), 257-273. Bhakti, I.N., Yanuarti, S., & Nurhasim, M. (2009). Military politics, ethnicity and conflict in
Indonesia. Crise Working Paper No. 62. UK. https://assets.publishing.service.gov.uk/media/57a08b7bed915d3cfd000d4a/wp62.pdf [Accessed on July 20, 2018].
Bhattacharya, N., Frank, E., Olsson, P., & Schipper, K. (2012). Direct and mediated associations among earnings quality, information asymmetry and the cost of equity. Accounting Review, 87(2), 449-482.
Bhattacharya, U., Daouk, H., & Welker, M. (2003). The world price of earnings opacity. The Accounting Review, 78(3), 641-678.
Bigus, J. (2015). Auditor reputation under different negligence regimes. Abacus, 51(3), 356-378.
Blay, A., Kizirian, T., & Sneathen, L.D. (2008). Evidential effort and risk assessment in auditing. Journal of Business and Economics Research, 6(9), 39-52.
Bliss, M.A., Gul, F.A., & Majid, A. (2011). Political connections affect the role of independent audit committees and CEO duality? Some evidence from Malaysia audit pricing. Journal of Contemporary Accounting & Economics, 7(2), 82-98.
Bloomberg. (2017). Graft scandal at Malaysia palm oil giant brings risk for Najib. https://www.bloomberg.com/news/articles/2017-06-13/graft-scandal-at-malaysia-palm-oil-giant-brings-risks-for-najib [Accessed on Dec 13, 2018].
Bloomberg. (2017). Japan Inc. scandals build a case for corporate reform. https://www.bloomberg.com/view/articles/2017-10-12/japan-inc-scandals-build-a-case-for-corporate-reform [Accessed on Dec 13, 2018].
Bloomfield, R.J. (1997). Strategic dependence and the assessment of fraud risk: a laboratory study. The Accounting Review, 72(4), 517-538.
Bohara, A.K., Mitchell, N.J., & Mittendorff, C.F. (2004) Compound democracy and the control of corruption: a cross-country investigation. Policy Study Journal, 32(4), 481-499.
Bonner, S.E., Palmrose, Z-V., & Young, S.M. (1998). Fraud type and auditor litigation: an analysis of SEC accounting and auditing enforcement releases. The Accounting Review, 73(4), 503-532.
Botosan, C. (1997). Disclosure level and the cost of equity capital. The Accounting Review, 72(3), 323-349.
Boubakri, N., Cosset, J-C., & Saffar, W. (2008). Political connections of newly privatized firms. Journal of Corporate Finance, 14(5), 654-673.
Boubakri, N., Guedhami, O., Mishra, D, & Saffar, W. (2012). Political connections and the cost of equity capital. Journal of Corporate Finance, 18(3), 541-559.

218
Boyle, D.M., DeZoort, F.T., & Hermanson, D.R. (2015). The alternative of fraud model use on auditors’ fraud risk judgments. Journal of Accounting and Public Policy, 34(6), 578-596.
Bradbury, M.E., Mak, Y.T., & Tan, S. M. (2006). Board characteristics, audit committee characteristics and abnormal accruals. Pacific Accounting Review, 18(2): 47-68.
Braun, K. W. (2001). The disposition of audit-detected misstatements: An examination of risk and reward factors and aggregation effects. Contemporary Accounting Research, 18(1), 71–99.
Braun, R. L. (2000). The effect of time pressure on auditor attention to qualitative aspects of misstatements indicative of potential fraudulent financial reporting. Accounting, Organizations and Society, 25(3), 243-259.
Brennan, N.M., & Solomon, J. (2008). Corporate governance, accountability, and mechanisms of accountability: an overview. Accounting, Auditing and Accountability Journal, 21, 885-906.
Brick, I. E., & Chidambaran, N.K., (2010). Board meetings, committee structure, and firm value. Journal of Corporate Finance, 16(4), 533-553.
Brockman, P., Rui, O.M., & Zou, H. (2013). Institutions and the performance of politically connected M&As. Journal of International Business Studies, 44(8), 833-852.
Brodjonegoro, B. (2009). Fiscal decentralization in Indonesia : Its impacts on regional economic development and fiscal sustainability. In J.G.H. Coen & M. Ramstedt (Eds.)., Decentralization and regional autonomy in Indonesia: implementation and challenges. Singapore: ISEAS.
Brodjonegoro, B., & Asanuma, S. (2000). Regional autonomy and fiscal decentralization in democratic Indonesia. Hitotsubashi Journal of Economics, 4, 111-122. http://hermes-ir.lib.hit-u.ac.jp/rs/bitstream/10086/7707/1/HJeco0410201110.pdf [Accessed on Dec 6, 2018].
Brown, L.D. & Pinello, A.S. (2007). To what extent does the financial reporting process curb earnings surprise games? Journal of Accounting Research, 45(5), 947-981.
Brown, R.A. (2006). Indonesian corporations, cronyism, and corruption. Modern Asian Studies, 40(4), 953-993.
Brown, S., Hillegeist, S.A. (2007). How disclosure quality affects the level of information asymmetry. Review of Accounting Studies, 12, 443-477.
Browne, M. W., & Cudeck, R. (1992). Alternative ways of assessing model fit. Sociological Methods and Research, 21(2), 230-258.
Bursa Malaysia. http://www.bursamalaysia.com/market/listed-companies/ Cahan, S., Emanuel, D., Hay, D., & Wong, N. (2008). Non-audit fees, long-term auditor-
client relationships and earnings management. Accounting and Finance, 48, 181-207. Cao, Y., & Nee, V.G. (2000). Comment: Controversies and evidence in the market transition
debate. American Journal of Sociology, 105(4), 1174-1189. Carcello, J.V., & Palmrose. Z-V. (1994). Auditor litigation and modified reporting on
bankrupt clients. Journal of Accounting Research, 32(Supplement), 1-30.

219
Carcello, J.V., Hollingsworth, C.W., Klein, A., & Neal, T.L. (2008). Audit committee expertise, competing corporate governance mechanism, and earnings management in a post-SOX world. https://business.illinois.edu/accountancy/wp-content/uploads/sites/12/2014/11/Audit-2008-Carcello.pdf [Accessed on Dec 16, 2016].
Carney, R.W., & Child, T.B. (2013). Changes to the ownership and control of East Asian corporations between 1996 and 2008: the primacy of politics. Journal of Financial Economics, 107, 494-513.
Carpenter, M., & Westphal, J. (2001). The Strategic context of external network ties: examining the impact of director appointments on board involvement in strategic decision making. The Academy of Management Journal, 44(4), 639-660.
Carpenter, T.D. (2007). Audit team brainstorming, fraud risk identification, and fraud risk assessment: implications of SAS 99. The Accounting Review, 82(5), 1119-1140.
Carpenter, T.D., & Reimers, J.L. (2013) Professional skepticism: the effects of a partner's influence and the level of fraud indicators on auditors' fraud judgments and actions. Behavioral Research in Accounting, 25(2), 45-69.
Carpenter, T.D., Durtschi, C., & Gaynor, L.M. (2002). The role of experience in professional skepticism, knowledge acquisition, and fraud detection. doi: 10.2139/ssrn.346921
Carson, E., Simnett, R., Thürheimer, U., & Vanstraelen, A. (2017). The effect of national inspection regimes on audit quality.
https://ssrn.com/abstract=3049828 or http://dx.doi.org/10.2139/ssrn.3049828 Carter Center. (2005). The Carter Center 2004 Indonesia Election Report. Atlanta. Cashman, G.D., Gillan , S.L., & Jun, C. (2012). Going overboard? On busy directors and firm
value. Journal of Banking & Finance, 36(12), 3248–3259. Chaney, P.K., Faccio, M., & Parsley, D. (2011). The quality of accounting information in
politically connected firms. Journal of Accounting and Economics, 51(1–2), 58-76. Chang, S.J., & Hong, J. (2000). Economic performance of group-affiliated companies in
Korea: intragroup resource sharing and internal business transactions. The Academy of Management Journal, 43(3), 429-448.
Chang, S.J., & Hong, J. (2002). How much does the business group matter in Korea? Strategic Management Journal, 23(3), 265-274.
Chen, C.J.P., Ding, Y., & Kim, C. (2010). High-level politically connected firms, corruption, and analyst forecast accuracy around the world. Journal of International Business Study, 41, 1505-1524.
Chen, C.J.P., Li, Z., Su, X, & Sun, Z. (2011). Rent-seeking incentives, corporate political connections, and the control structure of private firms: Chinese evidence. Journal of Corporate Finance, 17(2), 229-243.
Chen, G., Firth, M., Gao, D.N., & Rui, O.M. (2006). Ownership structure, corporate governance, and fraud: Evidence from China. Journal of Corporate Finance, 12, 424-448.
Chen, G., Luo, S., Tang,Y., & Tong, J.Y. (2015a). Passing probation: earnings management by interim CEOs and its effect on their promotion prospects. Academy of Management Journal, 58(5), 1389-1418.
Chen, J., Cumming, D., Hou, W., & Lee, E. (2013). Executive integrity, audit opinion, and fraud in Chinese listed firms. Emerging Market Review, 15, 72-91.

220
Chen, K.Y., Elder, R., & Hsieh, Y.M. (2007). Corporate governance and earnings management: the implication of corporate governance best-practice principles for Taiwanese listed firms. Journal of Contemporary Accounting and Economics, 3(2), 73-105.
Chen, Q., Kelly, K., & Salterio, S. (2012). Do changes in audit actions and attitudes consistent with increased auditor scepticism deter aggressive earnings management? An experimental investigation. Accounting, Organizations and Society, 37(2), 95-115.
Chen, X., Cheng, Q., & Wang, X. (2015b). Does increased board independence reduce earnings management? Evidence from recent regulatory reforms. Review Accounting Studies, 2, 899–933.
Chen, Y-S., Shen, C-H., & Lin, C-Y. (2014). The benefits of political connection: evidence from individual bank-loan contracts. Journal of Financial Services Research, 45(3), 287-305.
Cheng, E.C.M., & Courtenay, S.M. (2006). Board composition, regulatory regime and voluntary disclosure. The International Journal of Accounting, 41(3), 262-289.
Cheng, S. (2008). Board size and the variability of corporate performance. Journal of Financial Economics, 87(1), 157-176.
Cheung, K-C., & Coutts, J.A. (2001). A note on weak form market efficiency in security prices: evidence from the Hong Kong stock exchange. Applied Economics Letters, 8(6), 407-410.
Chi, L-C. (2009). Do transparency and disclosure predict firm performance? Evidence from the Taiwan market. Expert Systems with Applications, 36(8), 11198-11203.
Chiang, H.T., & He, L.J. (2010). Board supervision capability and information transparency. Corporate Governance: An International Review, 18, 18–31.
Choi, J., Kim, J., Liu, X., & Simunic, D. (2009). Cross-listing audit fee premiums: theory and evidence. The Accounting Review, 84(5): 1429–1463.
Choi, S., & Hasan, I. (2005). Ownership, governance, and bank performance: Korean experience. Finance Markets Institutions & Instruments, 14(4), 214-242.
Chua, C. (2008). Chinese big business in Indonesia: the state of capital. Abingdon: Routledge. Chui, L., & Pike, B. (2013). Auditors' responsibility for fraud detection: New wine in old
bottles? Journal of Forensic & Investigative Accounting, 5(1), 204-233. Claessens, S. (2006). Corporate governance and development. The World Bank Research
Observer, 21(1), 91-122. Claessens, S., & Fan, J.P.H. (2002). Corporate governance in Asia: a survey. International
Review of Finance, 3(2), 71-103. Claessens, S., Djankov, S., & Lang, L.H.P. (2000). The separation of ownership and control
in East Asian corporations. Journal of Financial Economics, 58(1-2), 81-112. Claessens, S., Djankov, S., Fan, J.P.H., & Lang, L.H.P. (2002). Disentangling the incentive
and entrenchment effects of large shareholdings. The Journal of Finance, 57(6), 2741–2771.
Clements, C., Neill, J. D., & Wertheim, P. (2015). Multiple directorships, industry relatedness, and corporate governance effectiveness. Corporate Governance, 15(5), 590-606.
Coase, R.H. (1937). The Nature of the firm. Economica, New Series, 4(16), 386-405.

221
Cohen, D., Dey, A., & Lys, T. (2008). Real and accrual-based earnings management in the pre-and post-Sarbanes-Oxley periods. The Accounting Review, 83(3), 757–787.
Coram, P., Ng, J., & Woodliff, D. (2003). A survey of time budget pressure and reduced audit quality among Australian auditors. Australian Accounting Review, 13(29), 38–44.
Coram, P., Ng, J., & Woodliff, D. (2004). The effect of risk of misstatement on the propensity to commit reduced audit quality acts under time budget pressure. Auditing: A Journal of Practice and Theory, 23(2), 159-167.
Core, J., Holthausen, R., & Larcker, D. (1999). Corporate governance, chief executive officer compensation, and firm performance. Journal of Financial Economics, 51, 371-406.
Cornforth, C. (2001). What makes Boards effective? An examination of the relationships between board inputs, structures, processes, and effectiveness in non-profit organizations. Corporate Governance: An International Review, 9(3), 217–227.
Corsetti, G., Pesenti, P., & Roubini, N. (1998). What caused the Asian currency and financial crisis? Part I: A macroeconomic overview. National Bureau of Economic Research (NBER), Working Paper No. 6833.
Coulson-Thomas, C. (2009). Competences of an effective director. Industrial and Commercial Training, 41(1), 27-35.
Cox, R.K., Dayanandan, A., & Donker, H. (2014). Materiality disclosure and litigation risks: a Canadian perspective. International Journal of Disclosure and Governance, 11, 284-298.
Crawford, S.D., Couper, M.P., & Lamias, M.J. (2001). Web surveys perceptions of burden. Social Science Computer Review, 19(2), 146-162.
Croson, R., & Gneezy, U. (2009). Gender differences in preferences. Journal of Economic Literature, 47(2), 448–474.
Cuervo, A. (2002). Corporate governance mechanisms: a plea for less code of good governance and more market control. Corporate Governance: an International Review, 10(2), 84-93.
Daily, C.M., Dalton, D.R., & Cannella Jr, A.A. (2003). Corporate governance: decades of dialogue and data. Academy of Management Review, 28, 371-382.
Dalton, D.R., Daily, C.M., Johnson, J.L., & Ellstrand, A.E. (1999). Number of directors and financial performance: a meta-analysis. The Academy of Management Journal, 42(6), 674-686.
Danner, D., Hagemann, D., & Fiedler, K. (2015). Mediation analysis with structural equation models: combining theory, design, and statistics. European Journal of Social Psychology, 45(4), 460-481.
Davies, M., & Schlitzer, B. (2008). The impracticality of an international “one size fits all” corporate governance code of best practice. Managerial Auditing Journal, 23(6), 532-544.
De Andres, P., Azofra, V., & Lopez, F. (2005). Corporate boards in OECD countries: size, composition, functioning and effectiveness. Corporate Governance: An International Review, 13(2), 197-210.
De Angelo, L.E. (1981). Auditor size and audit quality. Journal of Accounting and Economics, 3(3), 183–199.
Dechow, P., & Dichev, I. (2002). The quality of accruals and earnings: the role of accrual estimation errors. The Accounting Review, 77, 35-59.

222
Dechow, P., & Skinner, D. (2000). Earnings management: reconciling the views of accounting academics, practitioners, and regulators. Accounting Horizons, 14(2), 235–250.
Dechow, P., Sloan, R., & Sweeney, A. (1995). Detecting earnings management. The Accounting Review, 70(2), 193–225.
Dechow, P., Sloan, R., & Sweeney, A. (1996). Causes and consequences of earnings manipulation: an analysis of firms subject to enforcement actions by the SEC. Contemporary Accounting Research, 13(1), 1–36.
Dechow, P., Ge, W., & Schrand, C. (2010). Understanding earnings quality: a review of the proxies, their determinants and their consequences. Journal of Accounting and Economics, 50(2-3), 344-401.
Dechow, P., Hutton, A., Kim, J., & Sloan, R. (2012). Detecting earnings management: a new approach. Journal of Accounting Research, 50(2), 275-334.
DeFond, M., & Jiambalvo, J. (1991). Incidence and circumstances of accounting errors. The Accounting Review, 66(3), 643-655.
DeFond, M.L. & Jiambalvo, J. (1994). Debt covenant violation and manipulation of accruals. Journal of Accounting and Economics, 17(1-2), 145-176.
DeFond, M.L., & Francis, J.R. (2005). Audit research after Sarbanes-Oxley. Auditing: A Journal of Practice and Theory, 25(s-1), 5-30.
De Jongh, M. (2010). Shareholder activism at the Dutch East India Company 1622-1625. Origins of shareholder advocacy. https://ssrn.com/abstract=1496871.
Demirkan, S., & Fuerman, R.D. (2014). Auditor litigation: evidence that revenue restatements are determinative. Research in Accounting Regulation, 26(2), 164-174.
Demski, J.S. (2003). Corporate conflicts of interest. Journal of Economic Perspectives, 17(2), 51-72.
Denis, D.K., & McConnell, J.J. (2003). International Corporate Governance. The Journal of Financial and Quantitative Analysis, 38(1), 1-36.
De Rosa, D., Gooroochurn, N., & Gorg, H. (2010). Corruption and productivity firm-level evidence from the BEEPS survey. Policy Research Working Paper. The World Bank No. 5348.
Desai, R.M., & Olofsgard, A. (2008). Do politically connected firms undermine their own competitiveness? Evidence from developing countries. Brookings Global Economy and Development, Working Paper 18.
Desai, R.M., & Olofsgard, A. (2011). The costs of political influence: firm-level evidence from developing countries. Quarterly Journal of Political Science, 6(2), 137-178.
DeZoort, F.T., Harrison, P., & Taylor, M. (2006). Accountability and auditors’ materiality judgments: the effects of differential pressure strength on conservatism, variability, and effort. Accounting, Organizations and Society, 31(4-5), 373–390.
DeZoort, F.T., Hermanson, D.R., & Houston, R.W. (2003). Audit committee support for auditors: the effects of materiality justification and accounting precision. Journal of Accounting and Public Policy, 22(2), 175–199.
Dieleman, M. (2010). Shock-imprinting: external shocks and ethnic Chinese business groups in Indonesia. Asia Pacific Journal of Management, 27(3), 481-502.

223
Djankov, S., La Porta, R., Lopez-de-Silanes, F., & Shleifer, A. (2008). The law and economics of self-dealing. Journal of Financial Economics, 88(3), 430-465.
Do, Q-A., Lee, Y-T., & Nguyen, B.D. (2013). Political connections and firm value: evidence from the regression discontinuity design of close gubernatorial elections. LIEPP Working Paper.
Doidge, C., Karolyi, A., & Stulz, R. (2007). Why do countries matter so much for corporate governance? Journal of Financial Economics, 86(1), 1-39.
Doll, W., Xia, W., & Torkzadeh, G. (1994). A confirmatory factor analysis of the end-user computing satisfaction instrument. MIS Quarterly, 18(4), 453-461.
Drury, A.C., Krieckhaus, J., & Lusztig, M. (2006). Corruption, democracy, and economic growth. International Political Science Review, 27(2), 121-136.
Du, J., He, Q., Yuen, S.W. (2013), Tunneling and the decision to go private: evidence from Hong Kong. Pacific Basin Finance Journal, 22(1), 50-68.
Dye, R. A. (2001). An evaluation of ‘‘essays on disclosure’’ and the disclosure literature in accounting. Journal of Accounting and Economics, 32, 181-235.
Earley, P., Lee, C., & Hanson, L. (1990). Joint moderating effects of job experience and task component complexity: relations among goal setting, task strategies, and performance. Journal of Organizational Behaviour, 11(1), 3-15.
Earley, C. E. (2001). Knowledge acquisition in auditing: training novice auditors to recognize cue relationships in real estate valuation. The Accounting Review, 76(1), 81-97.
Ernst and Young (EY). (2013). Asia-Pacific Fraud Survey 2013. Building a more ethical business environment.
Ernst and Young (EY). (2017). Asia-Pacific Fraud Survey 2017. Economic uncertainty unethical conduct.
European Union. (1996). Green paper on the role, the position, and the liability of the statutory auditor within the European Union. Official Journal of the European Communities, Oct, C321.
Faccio, M. (2006). Politically connected firms. The American Economic Review, 96(1), 369-386. Faccio, M. (2010). Differences between politically connected firms and non-connected firms:
a cross-country analysis. Financial Management, 39(3), 905-927. Faccio, M., Masulis, R.W., & McConnell, J.J. (2006). Political connections and corporate
bailouts. The Journal of Finance, 61(6), 2597-2634. Fama, E.F., & Jensen, M.C. (1983). Separation of ownership and control. The Journal of Law
and Economics, 26(2), 301-325. Fan, J., Wong, T., & Zhang, T. (2007). Politically connected CEOs, corporate governance and
post-IPO performance of China’s newly partially privatized firms. Journal of Financial Economics, 84(2), 330-357.
Farber, D.B. (2005). Restoring trust after fraud: does corporate governance matter? The Accounting Review, 80(2), 539-561.
Ferris, S., Jagannathan, M., & Pritchard, A. (2003). Too busy to mind the business? Monitoring by directors with multiple board appointments. The Journal of Finance, 58(3), 1087-1111.

224
Fich, E., & Shivdasani, A. (2006). Are busy boards effective monitors? The Journal of Finance,
61(2), 689-724. Filatotchev, I. Lien, Y.C.,, & Piesse, J. (2005). Corporate governance and performance in
publicly listed, family controlled firms: evidence from Taiwan. Asia Pacific Journal of Management, 22, 257-283.
Financial Reporting Council. (2012). The UK Corporate Governance Code. Finkelstein, S., & Mooney, A. (2003). Not the usual suspects: how to use board process to
make boards better. Academy of Management Review, 17(2), 101- 113. Fisman, R. (2001). Estimating the value of political connections. The American Economic
Review, 91, 1095-1102. Fitriany, Veronica, S., & Anggraita, V. (2016). Impact of abnormal audit fee to audit quality:
Indonesian case study. American Journal of Economics, 6(1), 72-78. Forbes, D.P., & Milliken, F.J. (1999). Cognition and corporate governance: understanding
boards of directors as strategic decision-making groups. Academy of Management Review, 24, 489-505.
Francis, B.B., & Ofori, E. (2015). Political regimes and stock market development. Eurasian Economic Review, 5, 111–137.
Francis, J. R., & Wang, D. (2008). The joint effect of investor protection and big 4 audits on earnings quality around the world. Contemporary Accounting Research, 25(1), 157-191.
Francis, J. R., & Yu, M. D. (2009). Big 4 office size and audit quality. The Accounting Review, 84(5), 1521-1552.
Francis, J., LaFond, R., Olsson, P., & Schipper, K. (2005). The Market pricing of accrual quality. Journal of Accounting and Economics, 39(2), 295-327.
Francis, J., Michas, P., & Seavey, S. (2013). Does audit market concentration harm the quality of audited earnings? Evidence from audit markets in 42 countries. Contemporary Accounting Research, 30(1), 325-355.
Frankel, R., & Li, X. (2004). Characteristics of a firm’s information asymmetry between insiders and outsiders. Journal of Accounting and Economics, 37, 229-259.
Frankel, R.M., Johnson, M.F., & Nelson, K.K. (2002). The relation between auditors’ fees for non audit services and earnings management. The Accounting Review, 35(1), 71-105.
Fuerman, R.D. (2000). Auditors and the post-litigation reform act environment. Research in Accounting Regulation, 14, 199-220.
Garcia-Canal, E., & Guillen, M.F. (2008). Risk and the strategy of foreign location choice in regulated industries. Strategic Management Journal, 29(10), 1097-1115.
Garrido, M.M, Kelley, A.S., Paris, J., Roza, K., Meier, D.E., Morrison, R.S., & Aldridge, M.D. (2014). Methods for constructing and assessing propensity scores. Health Services Research, 49(5), 1701-1720.
Gillan, S.L. (2006). Recent developments in corporate governance: an overview. Journal of Corporate Finance, 12, 381-402.
Girma, S., & Shortland, A. (2008). The political economy of financial development. Oxford Economics Papers, 60(4), 567–596.

225
Glaeser, E.L., & Shleifer, A. (2002). Legal origins. Quarterly Journal of Economics, 117(4), 1193-1229.
Glazerman, S., Levy, D.M., & Myers, D. (2003). Nonexperimental versus experimental estimates of earnings impacts. The American Academy of Political and Social Science, 589(1), 63-93.
Global Economy. (2018). https://www.theglobaleconomy.com/Indonesia/wb_ruleoflaw/ Globe Asia. (2011). 2011 Globe Asia’s 150 Richest Indonesians.
https://www.skyscrapercity.com/threads/2011-globe-asia%E2%80%99s-150-richest-indonesians.1396558/ [Accessed on Jan 19, 2015].
Goergen, M., Manjon, M.C., & Renneboog, L. (2008). Is the German system of corporate governance converging towards the Anglo-American model? Journal of Management and Governance, 12, 37–71.
Goh, B.W., Lee, J., Ng, J., & Ow Yong, K. (2016). The Effect of board independence on information asymmetry. European Accounting Review, 25(1), 155-182.
Goldman, E., Rocholl, J., & So, J. (2009). Do politically connected boards affect firm value? The Review of Financial Studies, 22(6), 2331-2360.
Goldman, E., Rocholl, J., & So, J. (2013). Politically connected boards of directors and the allocation of procurement contracts. Review of Finance, 17(5), 1617–1648.
Gonenc, H., Hermes, N. (2008). Propping: evidence from new share issues of Turkish business group firms. Journal of Multinational Financial Management, 18(3), 261-275.
Government Regulation of Indonesia. (2015). No.20 year 2015 on Public Accountant Practice (PP No. 20/2015).
Goyal, A., & Muckley, C. (2013). Cash dividends and investor protection in Asia. International Review of Financial Analysis, 29, 31–43.
Gray, S., Harymawan, I, & Nowland, J. (2016). Political and government connections on corporate boards in Australia: Good for business? Australian Journal of Management, 41(1), 3–26.
Grossman, S. (1981). An introduction to the theory of rational expectations under asymmetric information. Review of Economic Studies, 48(4), 541-559.
Guardian. (2015). The world's biggest accounting scandals. https://www.theguardian.com/business/2015/jul/21/the-worlds-biggest-accounting-scandals-toshiba-enron-olympus
Guest, P.M. (2009). The impact of board size on firm performance: evidence from the UK. The European Journal of Finance, 15(4), 385-404.
Gul, F. (2006). Auditors’ response to political connections and cronyism in Malaysia. Journal of Accounting Research, 44(5), 931-963.
Gul, F., & Leung, S. (2004). Board leadership, outside directors' expertise and voluntary corporate disclosures. Journal of Accounting and Public Policy, 23(5), 351-379.
Gundry, L.C., & Liyanarachchi, G.A. (2007). Time budget pressure, auditors' personality type, and the incidence of reduced audit quality practices. Pacific Accounting Review, 19(2), 125-152.

226
Gunzler, D., Chen, T., Wu, P., & Zhang, H. (2013). Introduction to mediation analysis with structural equation modeling. Shanghai Archives of Psychiatry, 25(6), 390-394.
Gürakar, E.Ç., & Bircan, T. (2016). Political connections and public procurement in Turkey: evidence from construction work contracts. The Economic Research Forum, Working Paper 1053. http://erf.org.eg/publications/political-connections-and-public-procurement-in-turkey-evidence-from-construction-work-contracts/
Guthrie, D. (1998). The declining significance of guanxi in China’s economic transition. China Quarterly, 154, 254-282.
Gyimah-Brempong, K. (2002). Corruption, economic growth and income inequality in Africa. Economics of Governance, 3, 183-209.
Habib, A., Muhammadi, A.H., & Jiang, H. (2017). Political connections and related party transactions: evidence from Indonesia. The International Journal of Accounting, 52(1), 45-63.
Hadiz, V., & Robison, R. (2005). Neo-liberal reforms and illiberal consolidations: the Indonesian paradox. The Journal of Development Studies, 41(2), 220-241.
Hadjikhani, A., & Lee, J-W. (2006). The competitive behavior of MNCs in the socio-political market. International Journal of Business Environment, 1(1), 24-50.
Haggard, S. (2002). Governance and growth: lesson from the Asian economic crisis. Asia-Pacific Economic Literature, 13(2), 30-42.
Hair, J. F., Black, W. C., Babin, B. J., Anderson, R. E., & Tatham, R. L. (2006). Multivariate data analysis. 6th edit. Upper Saddle River, NJ: Pearson Prentice Hall.
Halter, M., De Arruda, M., & Halter, R. (2009). Transparency to reduce corruption? Dropping hints for private organizations in Brazil. Journal of Business Ethics, 84(Supplement 3), 373-385.
Hambrick, D.C. (2007). Upper echelons theory: an update. The Academy of Management Review, 32(2), 334-343.
Hambrick, D.C., & Mason, P.A. (1984). Upper echelons: the organization as a reflection of its top managers. Academy of Management Review, 9, 193-206.
Hammersley, J.S. (2011). A review and model of auditor judgments in fraud-related planning tasks. Auditing: A Journal of Practice and Theory, 30(4), 101-128.
Hammersley, J.S., Johnstone, K.M., & Kadous, K. (2011). How do audit seniors respond to heightened fraud risk? Auditing: A Journal of Practice and Theory, 30(3), 81-101.
Haniffa, R.M., & Cooke, T.E. (2002). Culture, corporate governance and disclosure in
Malaysian corporations. Abacus, 38(3), 317-349. Hanson, R.C., & Song, M.H. (2006). Corporate governance and asset sales: the effect of
internal and external control mechanisms. The Financial Review, 41(3), 361-386. Harijanti, S.D., & Lindsey, T. (2005). Indonesia: general elections test the amended
Constitution and the new constitutional court. I·CON, 4(1), 138–150. http://icon.oxfordjournals.org/
Harrant, V., & Vaillant, N.G. (2008). Are women less risk averse than men? The impact of impending death on risk-taking behavior. Evolution and Human Behavior, 29, 396-401.

227
Harymawan, I. (2018). Why do firms appoint former military personnel as directors? Evidence of loan interest rate in militarily connected firms in Indonesia. Asian Review of Accounting, 26(1), 2-18.
Healy, P.M. (1985). The effect of bonus schemes on accounting decisions. Journal of Accounting and Economics, 7(1-3), 85-107.
Healy, P.M., & Wahlen, J.M. (1999). A review of the earnings management literature and its implications for standard setting. Accounting Horizons, 13(4), 365-383.
Heiman-Hoffman, V. B., Morgan, K. P., & Patton, J. M. (1996). The warning signs of fraudulent financial reporting. Journal of Accountancy, (October), 75-77.
Heninger, W.G. (2001). The association between auditor litigation and abnormal accruals. The Accounting Review, 76(1), 111-126.
Henisz, W. J., & Zelner, B. A. (2003). The strategic organization of political risks and opportunities. Strategic Organization, 1(4), 451–460.
Hermalin, B.E., & Weisbach, M.S. (2003). Boards of directors as an endogenously determined institution: a survey of the economic literature. Economic Policy Review, 9(Apr), 7-26.
Hermawan, M., & Subiyantoro, H. (2006). Pengujian pasar efisien bentuk lemah pada pasar modal di Indonesia. Jurnal Keuangan Publik.
Hermes, N., Postma, T.J., Zivkov, O. (2006). Corporate governance codes in the European Union: are they driven by external or domestic forces? International Journal of Managerial Finance, 2, 280-301.
Hillman, A.J. (2005). Politicians on the board of directors: do connections affect the bottom line? Journal of Management, 31(3), 464-481.
Hillman, A. J., & Dalziel, T. (2003). Boards of directors and firm performance: integrating agency and resource dependence perspectives. The Academy of Management Review, 28(3), 383-396.
Hillman, A. J., Keim, G.D., & Schuler, D. (2004). Corporate political activity: a review and research agenda. Journal of Management, 30(6), 837-857.
Hillman, A.J., Shropshire, C., Certo, S.T., Dalton, D.R., & Dalton, C.M. (2011). What I like about you: a multilevel study of shareholder discontent with director monitoring. Organization Science, 22(3), 675–687.
Hillman, A.J., Withers, M.C., & Collins, B.J. (2009). Resource dependence theory: a review. Journal of Management, 35(6), 1404-1427.
Hofstetter, K. (2006). One size does not fit all: corporate governance for controlled companies. North Carolina Journal of International Law and Commercial Regulation, 31(3), 597-603.
Hoitash, U. (2011). Should independent board members with social ties to management disqualify themselves from serving on the board? Journal of Business Ethics, 99(3), 399–423.
Holburn, G.L.F., & Bergh, R.G.V. (2008). Making friends in hostile environments: political strategy in regulated industries. Academy of Management Review, 33(2), 521-540.
Holthausen, R.W., Larcker, D.F., & Richard G.S. (1995). Annual bonus schemes and the manipulation of earnings. Journal of Accounting and Economics, 19(1), 29-74.

228
Hooghiemstra, R., & Manen, van J. (2004). The Independence paradox: (im)possibilities facing non‐executive directors in The Netherlands. Corporate Governance: an International Review, 12(3), 314-324.
Hooghiemstra, R., Hermes, N., Oxelheim, L., & Randøy, T. (2019). Strangers on the board: the impact of board internationalization on earnings management of Nordic firms. International Business Review, 28(1), 119-134.
Hooper, D., Coughlan, J., & Mullen, M.R. (2008). Structural equation modeling: guidelines for determining model fit. Electronic Journal of Business Research Methods Volume, 6(1), 53-60.
Houston, J.F., Jiang, L., Lin, C., & Ma, Y. (2014). Political connections and the cost of bank loans. Journal of Accounting Research, 52(1), 193–243.
Hribar, P., & Nichols, D.C. (2007). The use of unsigned earnings quality measures in tests of earnings management. Journal of Accounting Research, 45(5), 1017-1053.
Hsieh, T-J., Yeh, R-S., & Chen, Y-J. (2010). Business group characteristics and affiliated firm innovation: The case of Taiwan. Industrial Marketing Management, 39(4), 560-570.
Hsu, P.H. (2015). Do financial expert directors affect the incidence of accruals management to meet or beat analyst forecasts? Asia-Pacific Journal of Accounting & Economics, 22(4), 406-427.
Huang, Y. (2010). Political institutions and financial development: an empirical study. World Development, 38(12), 1667–1677.
Hubbard, G. (2009). Measuring organizational performance: beyond the triple bottom line. Business Strategy and the Environment, 19, 177–191.
Hurtt, R.K. (2010). Development of a scale to measure professional skepticism. Auditing: A Journal of Practice and Theory, 29(1), 149-171.
Hwang, N-C.R., & Chang, C.J. (2010). Litigation environment and auditors' decisions to accept clients' aggressive reporting, Journal of Accounting and Public Policy, 29(3), 281-295.
Icerman, R., & Hillison, W. (1991). Disposition of audit detected errors: some evidence on evaluative materiality. Auditing: A Journal of Practice & Theory, 10(1), 22–34.
Igbaria, M., Zinatelli, N., Cragg, P., & Cavaye, A.L.M. (1997). Personal computing acceptance factors in small firms: a structural equation model. MIS Quarterly, 21(3), 279-305.
Ikatan Akuntan Indonesia (IAI) - Indonesian Institute of Accountants. (2014). Era baru akuntan profesional PMK 25/PMK.01/2014 tentang akuntan beregister negara lahir sebagai legal backup profesi akuntan professional. http://www.iaiglobal.or.id/v03/berita-kegiatan/detailarsip-630 [Accessed on August 11, 2016].
Imai, M. (2006). Mixing family business with politics in Thailand. Asian Economic Journal, 20(3), 241-256.
Indonesian Law. (2011). Law No. 5 year 2011 concerning Public Accountants. Indonesian Law. (2007). Law No. 40 year 2007 concerning Limited Liability Companies. Indonesian Law. (1995). Law No. 8 year 1995 concerning Capital Market. Indonesia Stock Exchange. http://www.idx.co.id/index-En.html

229
Indonesia’s Code of Good Corporate Governance. (2006). National Committee on Governance
Policies. International Standard on Auditing (ISA) No. 200. (2009). Overall Objectives of the
Independent Auditor and the Conduct of an Audit in Accordance with International Standards on Auditing.
International Standard on Auditing (ISA) No. 240. (2009). The auditor’s responsibilities relating to fraud in an audit of financial statements.
International Standard on Auditing (ISA) No. 315. (2009). Identifying and assessing the risks of material misstatement through understanding the entity and its environment.
International Standard on Auditing (ISA) No. 320. (2009). Materiality in planning and performing an audit.
International Standard on Auditing (ISA) No. 450. (2009). Evaluation of misstatements identified during the audit.
Ismail, W.A., Dunstan, K., & van Zijl, T. (2009). Earnings quality and corporate governance following the implementation of Malaysian code of corporate governance. DOI:10.2139/ssrn.1543524.
Jackling, B., & Johl, S. (2009). Board structure and firm performance: evidence from India’s top companies. Corporate Governance: An International Review, 17(4), 492-509.
Jaggi, B., Leung, S., & Gul, F. (2009). Family control, board independence and earnings management: evidence based on Hong Kong firms. Journal of Accounting and Public Policy, 28(4), 281-300.
Jensen, M. (1993). The modern industrial revolution, exit, and the failure of internal control systems. The Journal of Finance, 48(3), 831-880.
Jensen, M.C., & Meckling, W.H. (1976). Theory of the firm: managerial behavior, agency costs and ownership structure. Journal of Financial Economics, 3, 305-360.
Jermias, J., & Gani, L. (2014). The impact of board capital and board characteristics on firm performance. The British Accounting Review, 46, 135–153.
Jiang, Y., & Peng, M.W. (2011). Principal-principal conflicts during crisis. Asia Pacific Journal of Management, 28(4), 683-695.
Jiao, Y. (2011). Corporate disclosure, market valuation, and firm performance. Financial Management, 40(3), 647-676.
Jimenez, A., Luis-Rico, I., Benito-Osorio, D. (2014). The influence of political risk on the scope of internationalization of regulated companies: insights from a Spanish sample. Journal of World Business, 49(3), 301-311.
Jiraporn, P. , Kim , Y.S., Davidson III, W.N. (2008). Multiple directorships and corporate diversification. Journal of Empirical Finance, 15(3), 418–435.
Jiraporn, P., Davidson III, W.N., DaDalt, P., & Ning, Y. (2009a). Too busy to show up? An analysis of directors’ absences. The Quarterly Review of Economics and Finance, 49, 1159-1171.
Jiraporn, P., Manohar, S., & Lee, C.I. (2009b). Ineffective corporate governance: Director busyness and board committee memberships. Journal of Banking & Finance, 33, 819-828.

230
Jo, H., & Kim, Y. (2007). Disclosure frequency and earnings management. Journal of Financial Economics, 84, 561-590.
Johari, N.H., Saleh, N.M., Jaffar, R., & Hassan, M.S. (2008). The influence of board independence, competency and ownership on earnings management in Malaysia. International Journal of Economics and Management, 2(2), 281–306.
Johnson, E.N., Kuhn Jr., J.R., & Hassell, J.M. (2013a). Auditor perceptions of client narcissism as a fraud attitude risk factor. Auditing: A Journal of Practice & Theory, 32(1), 203–219.
Johnson, S., & Mitton, T. (2003). Cronyism and capital controls: evidence from Malaysia. Journal of Financial Economics, 67(2), 351-382.
Johnson, S., Boone, P., Breach, A, & Friedman, A. (2000). Corporate governance in the Asian financial crisis. Journal of Financial Economics, 58, 141-186.
Johnson, S., Porta, R.L., Lopez-de-Silanes, F., & Shleifer, A. (2000). Tunneling. American Economic Review, 90(2), 22–27.
Johnson, S.A., Ryan, H.E. Jr., & Tian, Y.S. (2009). Managerial incentives and corporate fraud: the sources of incentives matter. Review of Finance, 13(1), 115–145.
Johnson, S.G., Schnatterly, K., & Hill, A.D. (2013b). Board composition beyond independence: social capital, human capital, and demographics. Journal of Management, 39(1), 232-262.
Jones, J. (1991). Earnings management during import relief investigations. Journal of Accounting Research, 29(2), 193-228.
Jöreskog, K. G., & Sörbom, D. (1993). LISREL 8: Structural equation modeling with the SIMPLIS command language. Scientific Software International; Lawrence Erlbaum Associates, Inc.
Judge, W. (2010). Editorial corporate governance mechanisms throughout the world. Corporate Governance: An International Review, 18(3), 159–160.
Juliarto, A., Tower, G., van der Zahn, M., & Rusmin, R. (2013). Managerial ownership influencing tunneling behavior. Australasian Accounting Business and Finance Journal, 7(2), 1-31.
Juwana, H. (2002). An overview of Indonesia's antimonopoly law. Washington University Global Studies Law Review, 1(1) Symposium: APEC Competition Policy and Economic Development, 185-199.
Kanchanapoomi, N. (2005). Accelerating corporate governance reform in Thailand: the benefits of private reform mechanisms. Southern California Interdisciplinary Law Journal, 15, 165-196.
Kaplan, S. E. (2001). Further evidence on the ethics of managing earnings: an examination of the ethically related judgments of shareholders and non-shareholders’. Journal of Accounting and Public Policy, 20, 27-44.
Karamanou, I., & Vafeas, N. (2005), The association between corporate boards, audit committees, and management earnings forecasts: an empirical analysis. Journal of Accounting Research, 43(3), 453-486.

231
Karpoff, J.M., Lee, D.S., & Martin, G.S. (2013). The Economics of foreign bribery: evidence from FCPA enforcement actions. http://papers.ssrn.com/sol3/papers.cfm?abstract_id=1573222 [Accessed on Feb 9, 2013].
Kesselman, M., Krieger, J., & Joseph, W.A. (2013). Introduction to comparative politics: political challenges and changing agendas. 6th edit. Cengage Learning. Boston, USA.
Kessing, S.G., Konrad, K.A., & Kotsogiannis, C. (2007). Foreign direct investment and the dark side of decentralization. Economic Policy, 22(49), 7-70.
Khalil, M., & Ozkan, A. (2016). Board independence, audit quality and earnings management: evidence from Egypt. Journal of Emerging Market Finance, 15(1), 1–35.
Khanna, T., Palepu, K.G., & Sinha, J. (2005). Strategies that fit emerging markets. Harvard Business Review, June. https://hbr.org/2005/06/strategies-that-fit-emerging-markets.
Khanna, T., & Rivkin, J. (2001). Estimating the performance effects of business groups in emerging markets. Strategic Management Journal, 22(1), 45-74.
Khurana, I.K., & Raman, K.K. (2004). Litigation risk and the financial reporting credibility of Big 4 versus non‐Big 4 audits: evidence from Anglo‐American countries. The Accounting Review, 79(2), 473‐495.
Khwaja, A.I., & Mian, A. (2005). Do lenders favor politically connected firms? Rent provision in an emerging financial market. Quarterly Journal of Economics, 120(4), 1371-1411.
Kim, O., & Verrecchia, R.E. (1994). Market liquidity and volume around earnings announcements. Journal of Accounting and Economics, 17(1-2), 41-67.
Kimbro, M.B. (2002). A cross-country empirical investigation of corruption and its relationship to economics, cultural, and monitoring institutions: an examination of the role of accounting and financial statements quality. Journal of Accounting and Auditing & Finance, 17, 325-349.
King, R. (2002). An experimental investigation of self-serving biases in an auditing trust game: the effect of group affiliation. The Accounting Review, 77(2), 265-284.
Kirkpatrick, G. (2009). The Corporate governance lessons from the financial crisis. Financial Market Trends, OECD.
Klapper, L.F., & Love, I. (2004). Corporate governance, investor protection, and performance in emerging markets. Journal of Corporate Finance, 10, 703-728.
Knapp, C.A., & Knapp, M.C. (2001). The effects of experience and explicit fraud risk assessment in detecting fraud with analytical procedures. Accounting, Organizations and Society, 25, 25-37.
Kochanova, A. (2012). The impact of bribery on firm performance: evidence from central and eastern European countries. The World Bank. Policy Research Working Paper.
Komisi Pemberantasan Korupsi (KPK). (2012). Annual Report. http://www.kpk.go.id/images/pdf/laptah/LAPTAH_KPK_2012.pdf
Komite Nasional Kebijakan Governance (KNKG). http://knkg-indonesia.com/home/ Kothari, S., Leone, A., & Wasley, C. (2005). Performance matched discretionary accrual
measures. Journal of Accounting and Economics, 39(1), 163-197.

232
Krishnamurti, C., Sěvić, A., & Šević, Ž. (2005). Legal Environment, firm-level corporate governance and expropriation of minority shareholders in Asia. Economic Change and Restructuring 38, 85–111.
Krishnan, J., & Khrisnan, J. (1996). The role of economic trade-offs in the audit opinion decision: an empirical analysis. Journal of Accounting, Auditing & Finance, 11(4), 565-586.
Krishnan, J., & Schauer, P. C. (2000). The Differentiation of quality among auditors: evidence from the not‐for‐profit sector. Auditing: A Journal of Practice & Theory, 19(2), 9-25.
Kristensen, R.H. (2015). Judgment in an auditor's materiality assessments. Danish Journal of Management & Business, 79(2), 53-65.
Kuang, Y. F. (2008). Performance-vested stock options and earnings management. Journal of Business Finance and Accounting, 35, 1049-1078
Kumar, R., and Debroy, B. (1999) The Asian crisis: an alternate view. The Asian Development Bank Economic Staff Paper Series. 59.
Kuncoro, A. (2006). Corruption and business uncertainty in Indonesia. ASEAN Economic Bulletin, 23(1), 11-30.
La Porta, R., Lopez-de-Silanes, F., Shleifer, A., & Vishny, R.W. (1998). Law and finance. Journal of Political Economy, 106(6), 1113-1155.
La Porta, R., Lopez-de-Silanes, F., Shleifer, A., and Vishny, R.W. (1999). The quality of government. Journal of Law, Economics and Organization, 15(1), 222-279.
La Porta, R., Lopez-de-Silanes, F., Shleifer, A., and Vishny, R.W. (2000). Investor protection and corporate governance. The Journal of Finance, 58, 3-27.
Laksmana, I. (2008). Corporate board governance and voluntary disclosure of executive compensation practices. Contemporary Accounting Research, 25(4), 1147–1182.
Lam, T., & Lee, S. (2012). Family ownership, board committees and firm performance: evidence from Hong Kong. Corporate Governance, 12(3), 353-366.
Lang, M., & Lundholm, R. (1993). Cross-Sectional determinants of analyst ratings of corporate disclosures. Journal of Accounting Research, 31(2), 246-271.
Larcker, D.F., & Richardson, S.A. (2004). Fees paid to audit firms, accrual choices, and corporate governance. Journal of Accounting Research, 42(3), 625-658.
Laufer, D. (2011). Small Business Entrepreneurs: a focus on fraud risk and prevention. American Journal of Economics and Business Administration, 3(2), 401–404.
Lawrence, A., Minutti-Meza, M., & Zhang, P. (2011). Can big 4 versus non-big 4 differences in audit-quality proxies be attributed to client characteristics? The Accounting Review, 86(1), 259-286.
Lee, E. (1999). The debate on the causes of the Asian crisis: crony capitalism versus international system failure. International Politics and Society, 2. http://library.fes.de/pdf-files/ipg/ipg-1999-2/artlee.pdf [Accessed on August 23, 2013].
Legoria, J., Melendrez, K.D., & Reynolds, J.K. (2013). Qualitative audit materiality and earnings management. Review of Account Studies, 18, 414–442.

233
Lemmon, M.L., & Lins, K.V. (2003). Ownership structure, corporate governance, and firm value: evidence from the East Asian financial crisis. Journal of Finance, 58(4), 1445-1468.
Lennox, C., & Pittman, J.A. (2010). Big five audits and accounting fraud. Contemporary Accounting Research, 27(1), 209-247.
Leuz, C., & Oberholzer-Gee, F. (2006). Political relationships, global financing, and corporate transparency: evidence from Indonesia. Journal of Financial Economics, 81(2), 411-439.
Leuz, C., & Verrecchia, R. (2000). The Economic consequences of increased disclosure. Journal of Accounting Research, 38, 91-124.
Li, H., Meng, L., Wang, Q., & Zhou, L. (2008). Political connections, financing and firm performance: evidence from Chinese private firms. Journal of Development Economics, 87(2), 283–299.
Li, J.S. (2003). Relation-based versus rule-based governance: an explanation of the East Asian miracle and Asian crisis. Review of International Economics, 11(4), 651-673.
Libby, R., & Frederick, D.M. (1990). Experience and the ability to explain audit findings. Journal of Accounting Research, 28(2), 348-367.
Lin, J.W., and Hwang, M.I. (2010) Audit quality, corporate governance and earnings management: a meta-analysis. International Journal of Auditing, 14, 57-77.
Linck, J.S., Netter, J.M., & Yang, T. (2008). The determinants of board structure. Journal of Financial Economics, 87(2), 308–32.
Lindstedt, C., & Naurin, D. (2010) Transparency is not enough: making transparency effective in reducing corruption. International Political Science Review, 31(3), 301-322.
Loebbecke, J.K., Eining, M.M., & Willingham, J.L. (1989). Auditors’ experience with material irregularities: frequency, nature and detectability. Auditing: A Journal of Practice and Theory, 9(1), 1-28.
MacKinnon, D.P., Fairchild, A.J., & Fritz, M.S. (2007). Mediation analysis. Annual Review of Psychology, 58, 593-614.
Mak, Y.T., & Kusnadi, Y. (2005). Size really matters: further evidence on the negative relationship between board size and firm value. Pacific-Basin Finance Journal, 13(3), 301-318.
Malagueno, R., Albrecht, C., Ainge, C., & Stephens, N. (2010). Accounting and corruption: a cross-country analysis. Journal of Money Laundering Control, 13(4), 372-393.
Malaysian Code on Corporate Governance. (2012). Suruhanjaya Sekuriti (Securities Commission Malaysia).
Malaysian Law. (2007). The Companies Act 2007. Malaysian Law. (2007). The Capital Markets and services Act 2007. Malone, C.F., & Roberts, R.W. (1996). Factors associated with the incidence of reduced
audit quality behavior. Auditing: A Journal of Practice and Theory, 15(2), 49-64. Mangena, M., & Tauringana, V. (2007). Corporate compliance with non-mandatory best
practice statements: the case of the ASB Statement on Interim Reports. European Accounting Review, 16(2), 399-427.

234
Marcus, B., Bosnjak, M., Lindner, S, Pilischenko, S. & Schütz, A. (2007). Compensating for low topic interest and long surveys: a field experiment on non response in web surveys. Social Science Computer Review, 25(3), 372-383.
Marra, A., Mazzola, P., & Prencipe, A. (2011). Board monitoring and earnings management pre- and post- IFRS. The International Journal of Accounting, 46(2), 205-230.
Marshall, M.G., Gurr, T.R., & Jaggers, K. (2016). Polity™ IV Project. Political regime characteristics and transitions, 1800-2016. http://www.systemicpeace.org/inscrdata.html [Accessed on Feb 10, 2017].
Martikainen, M., Miihkinen, A, & Watson, L. (2016). Board characteristics and disclosure tone. The 2016 AAA Annual Meeting.
Masulis, R.W., Wang, C., & Xie, F. (2012). Globalizing the boardroom—the effects of foreign directors on corporate governance and firm performance. Journal of Accounting and Economics, 53, 527–554.
Mayer, C. (2012). Regulating for value creation: What is the link between market confidence and contractual freedom? Corporate Governance, Value Creation and Growth, OECD.
McDaniel, L.S. (1990). The effects of time pressure and audit program structure on audit performance. Journal of Accounting Research, 28(2), 267-285.
McNamara, S.M., Maclachlan Ltd, T., & Liyanarachchi, G.A. (2008). Time budget pressure and auditor dysfunctional behaviour within an occupational stress model. Accountancy Business and the Public Interest, 7(1), 1-43.
Meek, G.K., Roberts, C. B., & Gray, S.J. (1995). Factors influencing voluntary annual report disclosures by U.S., U.K. and Continental European multinational corporations. Journal of International Business Studies, 26(3), 555-572.
Meon, P.G., & Sekkat, K. (2005). Does corruption grease and sand the wheels of growth? Public Choice, 122, 69-97.
Messier, W.F., Martinov-Bennie, N., & Eilifsen, A. (2005). A review and integration of empirical research on materiality: two decades later. Auditing: A Journal of Practice and Theory, 24(2), 153-187.
Mietzner, M. (2006). The politics of military reform in Post-Suharto Indonesia: Elite conflict, nationalism, and institutional resistance. Policy Studies No. 23. The East-West Center Washington.https://www.eastwestcenter.org/publications/politics-military-reform-post-suharto-indonesia-elite-conflict-nationalism-and-institut [Accessed on Apr 4, 2017].
Milgrom, P.R. (1981). Rational expectations, information acquisition, and competitive bidding. Econometrica, 49(4), 921-943.
Milken Institute. (2009). Opacity Index: Measuring Global Risks. Minister of Finance Regulation. (2008). No.17/PMK.01/2008 concerning Pubic Accountant
Services. Minority Shareholders Watchdog Group. http://www.mswg.org.my/ Mitton, T. (2002). A cross-firm analysis of the impact of corporate governance on the East
Asian financial crisis. Journal of Financial Economics, 64, 215–241.

235
Mock, T.J., & Turner, J.L. (2005). Auditor identification of fraud risk factors and their impact on audit programs. International Journal of Auditing, 9(1), 59-77.
Montgomery, D.D., Beasley, M.S., Menelaides, S.L., & Palmrose, Z. (2002). Auditors’ new procedures for detecting fraud. Journal of Accountancy, May, 63-66.
Morck, R., & Yeung, B. (2004). Family control and the rent-seeking society. Entrepreneurship Theory and Practice, 28(4): 391-409.
Morck, R., Wolfenson, D., & Yeung, B. (2005). Corporate governance, economic entrenchment, and growth. Journal of Economics Literature, 43, 655-720.
Moskalev, S., & Park, S. (2010). South Korean chaebols and value-based management. Journal of Business Ethics, 92(1), 49-62.
Moyes, G.D. (2008). CPA’s Perceptions of red flags used in detecting fraud. The ICFAI Journal of Audit Practice, V(1), 47-60
Mura, R. (2007). Firm performance: do non-executive directors have minds of their own? Evidence from UK panel data. Financial Management, 36(3), 81-112.
Muravyev, A., Talavera, O, & Weir, C. (2016). Performance effects of appointing other firms’ executive directors to corporate boards: an analysis of UK firms. Review of Quantitative Finance and Accounting, 46, 25–45.
Ndofor, H. A., Wesley, C., & Priem, R. L. (2015). Providing CEOs with opportunities to cheat the effects of complexity-based information asymmetries on financial reporting fraud. Journal of Management, 41(6), 1774-1797.
Nee, V. (1989). A theory of market transition: from redistribution to markets in state socialism. American Sociological Review, 54(5), 663–681.
Nekhili, M., & Cherif, M. (2011). Related parties transactions and firm's market value: the French case. Review of Accounting and Finance, 10(3), 291-315.
Nelson, M.W. (2009). A model and literature review of professional skepticism in auditing. Auditing: A Journal of Practice & Theory, 28(2), 1–34.
Nelson, M.W., Smith, S.D., & Palmrose, Z-V. (2005) The effect of quantitative materiality approach on auditors' adjustment decisions. The Accounting Review, 80(3), 897-920.
Nelson, M.W., Smith, S.D., & Palmrose, Z-V. (2005). The effect of quantitative materiality approach on auditors' adjustment decisions. The Accounting Review, 80(3), 897-920.
New Straits Times. (2017). Felda Global Ventures Holdings corruption investigation almost complete.https://www.nst.com.my/news/nation/2017/09/278930/felda-global-ventures-holdings-corruption-investigation-almost-complete [Accessed on Dec 13, 2018].
Ng, T. B-P., & Tan, H-T. (2007). Effects of qualitative factor salience, expressed client concern, and qualitative materiality thresholds on auditors’ audit adjustment decisions. Contemporary Accounting Research, 24(4), 1171–1192.
Nowland, J. (2007). Are East Asian companies benefiting from western board practices? Journal of Business Ethics, 79, 133-150.
Nowland, J. (2008). The effect of national governance codes on firm disclosure practices: evidence from analyst earnings forecasts. Journal Compilation Blackwell Publishing Ltd, 16(6), 475-491.

236
O’Sullivan, M., Percy, M., & Stewart, J. (2008). Australian evidence on corporate governance attributes and their association with forward-looking information in the annual report. Journal of Management and Governance, 12, 5–35.
Organisation for Economic Co-operation and Development (OECD). (1999). OECD Principles of corporate governance. OECD Publications, Paris.
Organisation for Economic Co-operation and Development (OECD). (2004). OECD Principles of corporate governance. OECD Publications, Paris.
Organisation for Economic Co-operation and Development (OECD). (2009). Guide on fighting abusive related party transactions in Asia.
Organisation for Economic Co-operation and Development (OECD). (2015). G20/OECD Principles of corporate governance. OECD Publishing, Paris. http://dx.doi.org/10.1787/9789264236882-en
OJK Circular Letter No. 32/SEOJK.04/2015 on Public Companies' Corporate Governance Guidelines.
OJK Regulation No. 21/POJK.04/2015 on the Implementation of Public Companies' Corporate Governance Guidelines.
Osma, B.G., & Noguer, B.G., (2007). The effect of the board composition and its monitoring committees on earnings management: evidence from Spain. Corporate Governance: An International Review, 15(6), 1413-1428.
Paino, H., Ismail, Z., & Smith, M. (2010). Dysfunctional audit behaviour: an exploratory study in Malaysia. Asian Review of Accounting, 18(2), 162-173.
Painter-Morland, M. (2006) Triple bottom-line reporting as social grammar: integrating corporate social responsibility and corporate codes of conduct. Business Ethics: A European Review, 15(4), 352-364.
Palmrose, Z-V. (1986). Audit fees and auditor size - further evidence. Journal of Accounting Research, 24(1), 97-110.
Palmrose, Z-V. (1988). An analysis of auditor litigation and audit service quality. The Accounting Review, 63 (January): 55-73.
Palmrose, Z-V., Richardson, V.J., & Scholz, S. (2004). Determinants of market reactions to restatement announcements. Journal of Accounting and Economics, 37(1), 59-89.
Pany, K. J., & Whittington, O. R. (2001). Research implications of the auditing standard board's current agenda. Accounting Horizons, 15(4), 401-411.
Park, S. H., & Luo, Y. (2001). Guanxi and organizational dynamics: organizational networking in Chinese firms. Strategic Management Journal, 22(5), 455–477.
Park, Y.W., & Shin, H.-H. (2004). Board composition and earnings management in Canada. Journal of Corporate Finance, 10, 431-457.
Patelli, L., & Prencipe, A. (2007). The relationship between voluntary disclosure and independent directors in the presence of a dominant shareholder. European Accounting Review, 16(1), 5-33.
Payne, E. A., & Ramsay, R. J. (2005). Fraud risk assessments and auditors’ professional scepticism. Managerial Auditing Journal, 20(3), 321–330.
Peasnell, K.V., Pope, P.F., & Young, S. (2000). Accrual management to meet earnings targets: UK evidence pre- and post-Cadbury. British Accounting Review, 32, 415–445.

237
Peasnell, K.V., Pope, P.F., & Young, S. (2003). Managerial equity ownership and the demand for outside directors. European Financial Management, 9(2), 231–250.
Peasnell, K.V., Pope, P.F., & Young, S. (2005). Board monitoring and earnings management: do outside directors influence abnormal accruals? Journal of Business Finance and Accounting, 32(7-8), 1311–1346.
Peisakhin, L., & Pinto, P. (2010). Is transparency an effective anti-corruption strategy? Evidence from a field experiment in India. Regulation and Governance, 4, 261-280.
Pejovic, C. (2011). Japanese corporate governance: behind legal norms. Penn State International Law Review, 29(3), 484-520. https://elibrary.law.psu.edu/cgi/viewcontent.cgi?article=1174&context=psilr
Peng, M.W. (2004). Outside directors and firm performance during institutional transitions. Strategic Management Journal, 25(5), 453-471.
Persons, O.S. (2009). Audit committee characteristics and earlier voluntary ethics disclosure among fraud and no-fraud firms. International Journal of Disclosure and Governance, 6(4), 284 – 297.
Petroni, K., & Beasley, M. (1996). Errors in accounting estimates and their relation to audit firm type. Journal of Accounting Research, 34(1), 151-171.
Pfeffer, J., & Salancik, G. (1978). The external control of organizations: a resource dependence perspective. Harper & Row. New York, USA.
Picur, R.D. (2004). Quality of accounting, earnings opacity and corruption. Review of Accounting and Finance, 3(1), 103-114.
Pincus, K.V. (1989). The efficacy of a red flags questionnaire for assessing the possibility of fraud. Accounting, Organizations and Society, 14(1-2), 153-163.
Podsakoff, P.M., MacKenzie, S.B., Lee, J.-Y., & Podsakoff, N.P. (2003). Common method biases in behavioural research: A critical review of the literature and recommended remedies. Journal of Applied Psychology, 88(5), 879–903.
Polovina, N., & Peasnell, K. (2015). The effect of foreign management and board membershipon the performance of foreign acquired Turkish banks. International Journal of Managerial Finance, 11(3), 359-372.
Polsiri, P., & Jiraporn, P. (2012). Political connections, ownership structure, and financial institution failure. Journal of Multinational Financial Management, 22(1), 39-53.
Pratt, J., & Stice, J.D. (1994). The Effects of client characteristics on auditor litigation risk judgments, required audit evidence, and recommended audit fees. The Accounting Review, 69, 639-656.
Pritchard, A.C. (2009). Monitoring of corporate groups by independent directors. Journal of Korean Law, 9, 1-25.
Pusat Pembinaan Profesi Keuangan (PPPK). (2015). Profil Akuntan Publik dan Kantor Akuntan Publik 2014. The Ministry of Finance – Republic of Indonesia.
Quartz at Work. (2017). The common bonus structures that can lead to corporate scandals. https://work.qz.com/work/1087903/the-common-bonus-structures-that-can-lead-to-corporate-corruption-scandals/ [Accessed on Dec 13, 2018].
Rabasa, A., & Haseman, J. (2002). The Military and democracy in Indonesia: challenges, politics, and power. RAND. California, USA.

238
Rahman, R.A., & Ali, F.H.M. (2006). Board, audit committee, culture and earnings management: Malaysian evidence. Managerial Auditing Journal, 21(7), 783-804.
Raman, K. K., & Wilson, E. R. (1994). Governmental audit procurement practices and seasoned bond prices. Accounting Review, 69(4), 517-538.
Ramaswamy, K. (2001). Foreign investors, foreign directors and corporate diversification: an empirical examination of large manufacturing companies in India. Asia Pacific Journal of Management, 18, 207–222.
Ran, G. , Fang, Q., Luo, S., & Chan, K.C. (2015). Supervisory board characteristics and accounting information: evidence from China. International Review of Economics and Finance, 37, 18-32.
Rao, K., & Tilt, C. (2016). Board diversity and CSR reporting: an Australian study. Meditari Accountancy Research, 24(2), 182-210.
Report on the Observance of Standards and Codes (ROSC) on Accounting and Auditing, Indonesia. (2011). The World Bank.
Report on the Observance of Standards and Codes (ROSC) on Accounting and Auditing, Malaysia. (2012a). The World Bank.
Report on the Observance of Standards and Codes (ROSC) on Accounting and Auditing, Thailand. (2008). The World Bank.
Report on the Observance of Standards and Codes (ROSC) on Corporate Governance, Indonesia. (2010). The World Bank.
Report on the Observance of Standards and Codes (ROSC) on Corporate Governance, Malaysia. (2012b). The World Bank.
Report on the Observance of Standards and Codes (ROSC) on Corporate Governance, Thailand. (2012c). The World Bank.
Report on the Observance of Standards and Codes (ROSC) on Accounting and Auditing, Indonesia. (2011). The World Bank.
Report on the Observance of Standards and Codes (ROSC) on Accounting and Auditing, Indonesia. (2018). The World Bank.
Reuters. (2016). Bribery probe hammers shares of Indonesian property firm Agung Podomoro. http://www.reuters.com/article/indonesia-agung-podomoro-probe-idUSL3N1771SG [Accessed on April 18, 2016].
Rhoades, D.L., Rechner, P.L., & Sundaramurthy, C. (2000). Board composition and financial performance: A meta-analysis of the influence of outside directors. Journal of Managerial Issues, 12(1), 76-91.
Rhode, J., (1978). The independent auditors’ work environment: a survey. Commission on Auditors’ Responsibilities, Research Study No. 4, AICPA, New York.
Riahi-Belkaoui, A., & AlNajjar, F.K. (2006) Earnings opacity internationally and elements of social, economic and accounting order. Review of Accounting and Finance, 5(3), 189-203.
Rich, J. S., Solomon, I., & Trotman, K. T. (1997). Multi-auditor judgment/decision making research: A decade later. Journal of Accounting Literature, 16, 86-126.
Richardson, V.J. (2000). Information asymmetry and earnings management: some evidence. Review of Quantitative Finance and Accounting, 15(4), 325-47.

239
Rodrik, D., & Wacziarg, R. (2005). Do democratic transitions produce bad economic outcomes? American Economic Review, Papers and Proceedings, 95(2), 50–55.
Rose-Ackerman, S. (1999). Corruption and government, causes, consequences and reform. Cambridge, U.K. Cambridge University Press.
Rosenbaum, P.R., & Rubin, D.B. (1985). Constructing a control group using multivariate matched sampling methods that incorporate the propensity score. The American Statistician, 39(1), 33-38.
Roychowdhury, S., & Sletten, E. (2012). Voluntary disclosure incentives and earnings informativeness. The Accounting Review, 87(5), 1679-1708.
Rucker, D.D., Preacher, K.J., Tormala, Z.L., & Petty R.E. (2011). Mediation analysis in social psychology: current practices and new recommendations. Social and Personality Psychology Compass, 5(6), 359-371.
Sanjaya, I.P.S. (2008). Auditor eksternal, komite audit dan manajemen laba. Jurnal Riset Akuntansi Indonesia, 11(1), 97-116.
Sarkar, J., Sarkar, S., & Sen, K. (2008). Board of directors and opportunistic earnings management: evidence from India. Journal of Accounting, Auditing and Finance, 23(4), 517-551.
Sato, Y. (1993). The Salim Group in Indonesia: the development and behavior of the largest conglomerate in Southeast Asia. The Developing Economies, 31(4), 408-441.
Sato, Y. (2003). Corporate governance in Indonesia: a study on governance of business groups. In Y. Shimomura (Ed.) The role of governance in Asia: 88–136. ISEAS, Singapore.
Schermelleh-Engel, K., Moosbrugger, H., & Müller, H. (2003). Evaluating the fit of structural equation models: tests of significance and descriptive goodness-of-fit measures. Methods of Psychological Research, 8(2), 23–74.
Schipper, K. (1989). Commentary on earnings management. Accounting Horizons, 3, 91-102. Schulze, G.G., and Frank, B. (2003). Deterrence versus intrinsic motivation: experimental
evidence on the determinants of corruptibility. Economics of Governance, 4, 143-160. Seetharaman, A., Gul, F., & Lynn, S. (2002). Litigation risk and audit fees: evidence from
UK firms cross-listed on US markets. Journal of Accounting and Economics, 33(1), 91–115.
Seker, M., & Yang, J. S. (2012). How bribery distorts firm growth: differences by firm attributes. Policy Research Working Paper, The World Bank No.6046.
Selevoll, T., Huse, M., & Hansen, C. (2007). The value creating board: results from the “follow-up surveys” 2005/2006 in Norwegian firms. Norwegian School of Management Research Report 2/2007.
Serafeim, G. (2013). Firm competitiveness and detection of bribery. Harvard Business School, Working Paper. 14-012, 1-28.
Setiawan, D., Taib, F.M., Phua, L-K., & Chee, H-K. (2019). IFRS and earnings management in Indonesia: the effect of independent commissioners. International Journal of Business and Society, 20(1), 37-58.

240
Sharif, S.P., & Lai, M.M. (2015).The effects of corporate disclosure practices on firm performance, risk and dividend policy. International Journal of Disclosure and Governance, 12(4), 311–326.
Sharma, S., Mukherjeeb, S., Kumarc, A., Dillon, W.R. (2005). A simulation study to investigate the use of cutoff values for assessing model fit in covariance structure models. Journal of Business Research, 58(7), 935-943.
Sharma, V.D. (2004) Board of director characteristics, institutional ownership, and fraud: evidence from Australia. Auditing: A Journal of Practice and Theory, 23(2), 105-117.
Shaub, M.K., & Lawrence, J.E. (1996). Ethics, experience and professional skepticism: a situational analysis. Behavioral Research in Accounting, 8(Supplement), 124–157.
Sherlock, S. (2004). The 2004 Indonesian elections: how the system work and what the parties stand for. Centre for Democratic Institutions. Australian National University.
Shih, T-H., Fan, X. (2008). Comparing response rates from web and mail surveys: a meta-analysis. Field Methods, 20(3), 249-271.
Shipman, J.E., Swanquist, Q.T., & Whited, R.L. (2017). Propensity score matching in accounting research. The Accounting Review, 92(1), 213-244.
Shleifer, A., & Vishny, R.W. (1994). Politicians and firms. Quarterly Journal of Economics, 109(4), 995-1025.
Shleifer, A., & Vishny, R.W. (1997). A survey of corporate governance. The Journal of Finance, 52(2), 737-783.
Shu, S. (2000). Auditor resignations: clientele effects and legal liability. Journal of Accounting and Economics, 29, 173‐205.
Shuto, A. (2007). Executive compensation and earnings management: empirical evidence from Japan. Journal of International Accounting, Auditing and Taxation, 16, 1-26.
Siegel, J. (2007). Contingent political capital and international alliances: evidence from South Korea. Administrative Science Quarterly, 52, 621–666.
Silva, F., Majluf, N., & Paredes, R.D. (2006). Family ties, interlocking directors and performance of business groups in emerging countries: The case of Chile. Journal of Business Research, 59(3), 315–321.
Simunic, D., & Stein, M. (1996). The impact of litigation risk on audit pricing: a review of the economics and the evidence. Auditing: A Journal of Practice & Theory, 15(Supplement), 119–134 .
Singh, V., Terjesen, S., & Vinnicombe, S. (2008). Newly appointed directors in the boardroom: how do women and men differ? European Management Journal, 26(1), 48–58.
Singhchawla, W., Evans, R., & Evans, J.P. (2011). Board independence, sub-committee independence and firm performance: evidence from Australia. Asia Pacific Journal of Economics & Business, 15(2), 1–15.
Singleton, T.W., & Singleton, A.J. (2007). Why don’t we detect more fraud? The Journal of Corporate Accounting and Finance, 18(4), 7-10.
Siregar, S.V., & Utama, S. (2008). Type of earnings management and the effect of ownership structure, firm size, and corporate-governance practices: Evidence from Indonesia. The International Journal of Accounting, 43, 1–27.

241
Sitorus, T., & Scott, D. (2009). Integrated fraud risk factors and robust methodology: a review and comment. International Journal of Auditing, 13(3), 281-297.
Smith, A. (1776). An inquiry into the nature and causes of the wealth of nations. Book V Chapter 1 Part 3.
Soederberg, S. (2003). The promotion of 'Anglo-American' corporate governance in the South: who benefits from the new international standard? Third World Quarterly, 24(1), 7-27.
Spamann, H. (2009). The "anti director rights index" revisited. The Review of Financial Studies, 23(2), 467-486.
Stevenson, W.B., & Radin, R.F. (2009). Social capital and social influence on the board of directors. Journal of Management Studies, 46(1), 16-44.
Stock Exchange of Thailand. http://www.set.or.th/en/ Su, Z-Q, & Fung, H-G. (2013). Political connections and firm performance in Chinese
companies. Pacific Economic Review, 18(3), 283–317. Subramaniam, N., McManus, L. & Zhang, J. (2009). Corporate governance, firm
characteristics and risk management committee formation in Australian companies. Managerial Auditing Journal, 24(4), 316-339.
Subramanyam, K. R. (1996). The pricing of discretionary accruals. Journal of Accounting and Economics, 22(1-3), 249-281.
Sullivan, J. D. (2009). The Moral compass of companies: business ethics and corporate governance as anti-corruption tools. International Finance Corporation. https://www.ifc.org/wps/wcm/connect/fb7be001-8a70-4129-a7c1-151e89520f21/Focus7_AntiCorruption.pdf?MOD=AJPERES&CVID=jtCwtbR
Sun, J., & Liu, G. (2011). Client‐specific litigation risk and audit quality differentiation. Managerial Auditing Journal, 26(4), 300-316.
Suryadinata, L. (2005). The year of a democratic election. Southeast Asian Affairs, 133-149. ISEAS – Yusof Ishak Institute.
Svensson, J., & Fisman, R. (2007) Are corruption and taxation really harmful to growth? Firm level evidence. Journal of Development Economics, 83(1), 63-75.
Tempo. (2013). Kasus Hambalang, Adhi Karya Setor Rp 10 Miliar. https://m.tempo.co/read/news/2013/07/17/063497058/kasus-hambalang-adhi-karya-setor-rp-10-miliar [Accessed on Oct 4, 2015].
Thai Law. (2008). Act No. 3 year 2008 concerning Public Limited Companies.
Thai Law. (2008). The Secuities and Exchange Act 2008. Thailand’s Principles of Corporate Governance for Listed Companies. (2012). The Stock
Exchange of Thailand. The Jakarta Post. (2018). Consumer finance firm allegedly defrauds banks of Rp 14 trillion.
https://www.thejakartapost.com/news/2018/09/25/consumer-finance-firm-allegedly-defrauds-banks-of-rp-14-trillion.html [Accessed on Nov 25, 2018].
The Jakarta Post. (2014). Farmers thank KPK for arresting Karawang regent. http://www.thejakartapost.com/news/2014/07/22/farmers-thank-kpk-arresting-karawang-regent.html [Accessed on Oct 4, 2015].

242
The Jakarta Post. (2017). Indonesia among Asia pacific countries with slowest internet connection. https://www.thejakartapost.com/life/2017/12/15/indonesia-among-asia-pacific-countries-with-slowest-internet-connection.html. [Accessed on Jan 23, 2018].
The Jakarta Post. (2014). KPK steps up investigation into Sentul City boss. http://www.thejakartapost.com/news/2014/10/06/kpk-steps-investigation-sentul-city-boss.html [Accessed on Oct 4, 2015].
The Jakarta Post. (2014). KPK to probe son of Sentul City boss. http://www.thejakartapost.com/news/2014/06/19/kpk-probe-son-sentul-city-boss.html [Accessed on Aug 28, 2014].
The Jakarta Post. (2018). Meikarta corruption trial kicks off in Bandung. https://www.thejakartapost.com/news/2018/12/20/meikarta-corruption-trial-kicks-off-in-bandung.html [Accessed on Feb 11, 2019].
The Jakarta Post. (2014). OJK launches roadmap for good corporate practice. https://www.thejakartapost.com/news/2014/02/05/ojk-launches-roadmap-good-corporate-practice.html [Accessed on Nov 11, 2018].
Tiwari, A.K. (2010) Corporate governance and economic growth. Economics Bulletin, 30(4), 1-17.
Torchia, M., & Calabrò, A. (2016). Board of directors and financial transparency and disclosure. Evidence from Italy. Corporate Governance, 16(3), 593 – 608.
Transparency International. (2017). Corruption Perceptions Index 2017. Berlin, Germany. Transparency International. (2020). Corruption Perceptions Index 2019. Berlin, Germany. Treisman, D. (2000) The causes of corruption: a cross-national study. Journal of Public
Economics, 76(3), 399-457. Tuttle, B., Coller, M., & Plumlee, R. (2002). The effect of misstatements on decisions of
financial statement users: An experimental investigation of auditor materiality thresholds. Auditing: A Journal of Practice & Theory, 21(2): 11–27.
Ufen, A. (2008). Political party and party system institutionalization in Southeast Asia: lessons for democratic consolidation in Indonesia, the Philippines and Thailand. The Pacific Review, 21(3), 327-350.
Utama, S., Utama, C.A., & Yuniasih, R. (2010). Related party transaction - efficient or abusive: Indonesia evidence. Asia Pacific Journal of Accounting and Finance, 1(1): 77-102.
Uzun, H., Szewczyk, S., & Varma, R. (2004). Board composition and corporate fraud. Financial Analysts Journal, 60(3), 33-43.
Vafeas, N. (1999). Board meeting frequency and firm performance. Journal of Financial Economics, 53(1), 113-142.
Van Riebeeck and the South-East Asian Connection to the Cape. (2015). https://camissapeople.wordpress.com/2015/12/02/van-riebeeck-the-south-east-asian-connection-to-the-cape/ [Accessed on Jan 7, 2019].
Venkataraman, R., Weber, J.P., & Willenborg, M. (2008). Litigation risk, audit quality, and audit fees: evidence from initial public offerings. The Accounting Review, 83(5), 1315- 1345.

243
Villalonga, B., & Amit, R. (2006). How do family ownership, control and management affect firm value? Journal of Financial Economics, 80(2), 385-417.
Vona, L.W. (2008). Fraud risk assessment. Building a fraud audit program. New Jersey, John Wiley & Sons, Inc.
Vorhies, J.B. (2005). The new importance of materiality. Journal of Accountancy. https://www.journalofaccountancy.com/issues/2005/may/thenewimportanceofmateriality.html [Accessed on March 21, 2018].
Wahab, E.A.A., Zain, M.M., & James, K. (2011). Political connections, corporate governance and audit fees in Malaysia. Managerial Auditing Journal, 26(5), 393-418.
Walder, A.G. (2003). Elite opportunity in transitional economies. American Sociological Review, 68(6), 899-916.
Walder, A.G., & Nguyen, G.H. (2008). Ownership, organization, and income inequality: market transition in rural Vietnam. American Sociological Review, 73(2), 251-269.
Walsh, J.P., & Seward, J.K. (1990). On the efficiency of internal and external corporate control mechanisms. The Academy of Management Review, 15(3), 421-458.
Watts, R. L., & Zimmerman, J.L. (1978). Towards a positive theory of the determination of accounting standards. The Accounting Review, 53(1), 112-134.
Watts, R. L., & Zimmerman, J.L. (1986). Positive accounting theory. New Jersey: Prentice-Hall. Webber, D. (2006). A consolidated patrimonial democracy? Democratization in post-
Suharto Indonesia. Democratization, 13(3), 396-420. Wei, SJ. (2000). How taxing is corruption on international investors? The Review of
Economics and Statistics, 82(1), 1-11. Weingast, B.R. (1995) The Economic role of political institutions: market-preserving
federalism and economic development. Journal of Law, Economics, & Organization, 11(1), 1-31.
Weir, C., Laing, D., & Phillip, J.M. (2002) Internal and external governance mechanisms: their impact on the performance of large UK public companies. Journal of Business Finance and Accounting, 29, 579-611.
Wijayati, N., Hermes, N., & Holzhacker, R. (2016). Corporate governance and corruption: a comparative study of Southeast Asia in Holzhacker, Wittek, & Woltjer (Eds). Decentralization and Governance in Indonesia, pp. 259-292. Springer International Publishing. Switzerland.
Wilks, T.J., & Zimbelman, M.F. (2004). Decomposition of fraud-risk assessments and auditors’ sensitivity to fraud cues. Contemporary Accounting Research, 21(3), 719-745.
Willett, C., & Page, M. (1996). A survey of time budget pressure and irregular auditing practices among newly qualified UK chartered accountants. British Accounting Review, 28, 101-120.
Wong, S. H-W. (2010). Political connections and firm performance: the case of Hong Kong. Journal of East Asian Studies, 10(2), 275-313.
World Bank. (2000). Corporate governance: a framework for implementation. Iskander, M.R., & Chamlou, N., 1-24.

244
World Bank. (2013). The Worldwide Governance Indicators. http://info.worldbank.org/governance/wgi/index.aspx#home
Worldscope Database. (2010). Data Definitions Guide. Thomson Reuters. Wright, A.M., & Wright, S. (1997). An examination of factors affecting the decision to waive
audit adjustments. Journal of Accounting, Auditing and Finance, 12(Winter), 15–36. Wright, S., & Wright, A. M. (1997). The effect of industry experience on hypothesis
generation and audit planning decisions. Behavioral Research in Accounting, 9, 273–294. Wu, W., Wu, C., Zhou, C., & Wu, J. (2012). Political connections, tax benefits and firm
performance: evidence from China. Journal of Accounting and Public Policy, 31(3), 277–300.
Wu, X. (2005). Corporate governance and corruption: a cross-country analysis. Governance: An International Journal of Policy, Administration, and Institution, 18(2), 151-170.
Wu, X. (2009). Determinants of bribery in Asian firms: evidence from the World Business Environment Survey. Journal of Business Ethics, 87, 75–88.
Xie, B., Davidson III, W.N., DaDalt, P. J. (2003). Earnings management and corporate governance: the role of the board and the audit committee. Journal of Corporate Finance, 9(3), 295-316.
Yang, M. M-h. (2002). The resilience of guanxi and its new deployments: a critique of some new guanxi scholarship. China Quarterly, 170, 459-476.
Yeh, Y-H., Shu, P-G., & Su, Y-H. (2012). Related-party transactions and corporate governance: the evidence from the Taiwan stock market. Pacific-Basin Finance Journal, 20(5), 755-776.
Ye, K., Cheng, Y., & Jingyu, G. (2014). How individual auditor characteristics impact the likelihood of audit failure: Evidence from China. Advances in Accounting, 30(2), 394-401.
Yermack, D. (1996). Higher market valuation of companies with a small board of directors. Journal of Financial Economics, 40(2), 185-211.
Yoshikawa. (2015). Corporate governance in Asia: one size does not fit all. http://www.dauphine.fr/en/actus/detailactu/article/corporate-governance-in-asia-one-size-does-not-fit-all.html [Accessed on May 1, 2020].
Yoshikawa, T., & Rasheed, A.A. (2010). Family control and ownership monitoring in family-controlled firms in Japan. Journal of Management Studies, 47(2), 274-295.
Young, M.N., Ahlstrom, D., & Bruton, G.D. (2004). The globalization of corporate governance in East Asia: the "transnational" solution. MIR: Management International Review, 44(2), 31-50.
Young, M.N., Peng, M.W., Ahlstrom, D., Bruton, G.D., & Jiang, Y. (2008) Governing the corporation in emerging economies: a review of the principal-principal perspective. Journal of Management Studies, 45, 196-220.
Zabel, R.B., & Benjamin, J.J. (2002). Reviewing materiality in accounting fraud. New York Law Journal, January, 1–4.

Summary
245
Summary
Corporate governance refers to the ways in which the stakeholders of a company
make sure that their interests are taken into account by the management of a company.
Corporate governance consists of formal and informal relationships between the board
of a company and its stakeholders that determine how these interests will be met, how
management reports about the decisions that should lead to the fulfilment of these
interests, and how performance with respect to meeting these interests will be
monitored (OECD, 1999). One important backbone of corporate governance research is
agency theory developed by, among others, Jensen and Meckling (1976). Central to their
theory is the notion of the separation of ownership and control. Their theory stresses
that agents (managers) have self-interests, which may diverge from the interests of the
principals (stakeholders) of the company. Based on this theory, they argue that effective
monitoring through various corporate governance mechanisms should be prioritized to
avoid deviant behaviour. These corporate governance mechanisms can be classified into
internal mechanisms and external mechanisms (Walsh and Seward, 1990; Denis and
McConnell 2003). Internal mechanisms deal with the internal organisation of a company,
such as board of directors and shareholders, while external mechanisms operate through
external factors such as the legal framework and capital markets (Cuervo, 2002; Gillan,
2006; Hanson and Song, 2006).
The dissertation aims at investigating how corporate governance mechanisms
can mitigate opportunities for deviant managerial behaviour in Indonesia. As an
emerging country, the corporate governance practices in Indonesia are different from
developed countries. Since the early 2000s, Indonesia has improved its corporate
governance practices through a better regulatory framework. However, Indonesia has
been relatively slower in reforming corporate practices as compared to other developing
countries in the Southeast Asia region (ADB, 2017).

Summary
246
The dissertation analyses two external mechanisms (i.e., the institutional
framework and external auditors), and two internal mechanisms (i.e., the characteristics
of the board of commissioners and transparency). Two studies present an analysis of a
single mechanism (Studies 1 and 2); two other studies analyse a combination of two
mechanisms (Studies 3 and 4). The interrelations of the mechanisms across the four
empirical studies are depicted in Figure 1.
Figure 1. Corporate governance mechanisms
Study 1 sheds light on the role of the institutional framework (external
mechanism) in mitigating opportunities for corruption. Study 2 deals with the
perceptions of external auditors (external mechanism) when assessing fraud risks.
Study 3 investigates the interaction between the board of commissioners and board of
directors (internal mechanism) and the change of the institutional framework (external
mechanism) (see the dashed line in figure 1), and its impact on the extent to which firms
that have directors with political connections perform differently from firms without
these connections. Study 4 analyses the link between board characteristics (internal
External mechanisms Internal mechanisms
Institutional framework
(Studies 1 and 3)
External auditors (Study 2)
Board of commissioners,
Board of directors (Study 3)
Board of commissioners
(Study 4)
Transparency (Study 4)
Corporate governance mechanisms

Summary
247
mechanism), transparency (internal mechanism) (see the dashed line in figure 1), and
earnings management. The details of each study are presented below.
The first study (chapter 2) investigates the role of the institutional framework in
controlling opportunities for corruption. It presents a comparative study of institutional
corporate governance frameworks in Malaysia, Thailand, and Indonesia. Relying on
agency theory, we argue that a strong corporate governance institutional framework can
reduce opportunities for corruption. Three corporate governance measures with respect
to shareholder rights, the board of directors, and the accounting and auditing standards,
including transparency, are evaluated. The main finding of the comparative study is
that, in general, Indonesia’s corporate governance institutional framework is less
stringent than that of Malaysia and Thailand, which results in a weaker monitoring
system. Because the institutional frameworks are less demanding and less enforced, this
may provide stronger opportunities for corruption.
The second study (chapter 3) focuses on external auditors’ perceptions on fraud
risk assessments. A survey of 435 external auditors is conducted, employing a vignette
case study, which is adapted from a real fraud case in Indonesia. The research model
predicts that external auditors’ fraud risk assessment is determined by fraud risk factors
(red flags), materiality judgment, professional scepticism, litigation risk, and several
auditor characteristics (such as certification, experience, and audit firm size). We find
evidence that fraud risk factors, materiality judgment, and professional scepticism
positively affect fraud risk assessments. Moreover, the analysis shows that materiality
judgment influences fraud risk assessment mostly indirectly through professional
scepticism. These findings have implications for auditors and their work, that is, they
show that it is important for auditors to maintain a conservative behaviour by lowering
materiality thresholds. This behaviour enhances auditors’ scepticism, which leads to
increased fraud risk assessments. These results are deemed new in the auditing
literature. Overall, the results suggest that the quality of audits can be improved when
auditors demonstrate more conservatism and more sceptical behaviour.
The third study (chapter 4) examines how institutional change that occurred in
2004 in Indonesia affects the value of political connected firms. Drawing from agency

Summary
248
theory and resource dependence theory, the study is one of the few studies in using
longitudinal data (2000-2011), investigating the impact of institutional changes on the
performance of politically connected firms. The data are split into the pre-democratic era
period (2000-2004) and the democratic era period (2005-2011) to enable us to measure
the net effect of the institutional change on the value of political connections. The year
2004 is deemed a milestone because Indonesia for the first time ever introduced direct
democratic presidential elections. Employing hand-collected data on politically
connected board members of 357 listed non-financial Indonesian firms, the empirical
results show that in the democratic era the impact of political connections on financial
performance diminishes for firms. These results indicate that the value of political
connections has become less important after Indonesia went into a more democratic
regime after 2004. These results can be explained by the fact that since 2004 there has
been a shift of power from the central government to the local (regional) government.
The power of the central bureaucrats declined, which led firms having political
connections to have suffered in terms of their financial performance.
The fourth study (chapter 5) explores the interrelationships between board
inputs, transparency and disclosure, and earnings management. While other studies
assume a direct relationship between board characteristics and earnings management,
this study argues that the association between boards and earnings management is not
necessarily direct. Board inputs determine the level of transparency and disclosure,
which in effect mitigates earnings management practices. Three board inputs are
constructed using data from the ASEAN Corporate Governance Scorecard, i.e. board
skills, board commitment, and board structure. Using a sample of 104 listed non-
financial Indonesian firms for the years 2013, 2014, and 2015, the findings show that the
board inputs are not directly associated with earnings management; they are, however,
positively associated with the level of information disclosure. Most importantly, the
results confirm that board skills and board commitment mitigate earnings management
indirectly through mandatory disclosure, but not through voluntary disclosure,
implying that mandatory disclosure acts as a mediating variable. In addition, the
findings indicate that Indonesian firms have not fully complied with mandatory

Summary
249
disclosure requirements. This may occur because supervisory board members may be
less effective in their monitoring role, or this may be caused by the fact that regulatory
bodies do not impose strong enough penalties for non-compliant firms.
Overall, the results of the empirical studies suggest that strong internal and
external corporate governance mechanisms are important for the performance of
companies in an emerging economy such as Indonesia. The thesis shows that having
sound corporate governance practices ensures that checks-and-balances are put in place
to prevent misbehaviour. Investing in corporate governance is critical not only for long-
run business sustainability, but also for the economy as a whole. The thesis also shows
that transparency and accountability create public trust, which may lead to attracting
investors and stimulating economic growth. Although the research has focused on
Indonesia, we do believe our findings may also hold important lessons for other
emerging countries. It would be interesting if the analyses we performed in the thesis
were repeated in different country contexts. We leave performing comparative research
for future research.

Summary
250

Samenvatting
251
Samenvatting Corporate governance verwijst naar de manier waarop stakeholders van een organisatie
ervoor zorgen dat het management van een organisatie rekening houdt met hun
belangen. Corporate governance wordt gevormd door formele en informele relaties tussen
het bestuur van een organisatie en haar stakeholders. Een belangrijke theorie in corporate
governance is de agency theory, ontwikkeld door onder andere Jensen en Meckling
(1976). Centraal in deze theorie is het idee dat eigendom en het management van een
onderneming zijn gescheiden. Volgens deze theorie hebben agenten (managers) eigen
belangen, die mogelijk anders zijn dan de belangen van de principalen (stakeholders) van
een organisatie. Jensen en Meckling (1976) stellen dat aan de hand van verschillende
zogenaamde corporate governance mechanismen toezicht kan worden gehouden op het
management, waardoor beslissingen die het management neemt de belangen van de
stakeholders dienen, in plaats van die van het management (in dit proefschrift
aangeduid met ongewenst gedrag). Deze mechanismen kunnen worden ingedeeld in
interne en externe mechanismen. Interne mechanismen hebben betrekking op de interne
organisatie van een onderneming, zoals de raad van bestuur en aandeelhouders; externe
mechanismen hebben betrekking op de externe omstandigheden waarin een
onderneming actief is, zoals de wetgeving en de kapitaalmarkt.
In dit proefschift wordt onderzocht hoe corporate governance mechanismen
ongewenst gedrag van het management kunnen helpen voorkomen of reduceren. Het
onderzoek richt zich daarbij op Indonesië. Dit land biedt interessante mogelijkheden
voor onderzoek naar de invloed van corporate governance op de besluitvorming door
het management van een onderneming, de mate waarin deze besluiten leiden tot
ongewenste uitkomsten, en de wijze waarop corporate governance mechanismen
ongewenst gedrag van het management helpen voorkomen. Omdat Indonesië een land
in ontwikkeling is, zijn corporate governance mechanismen relatief onderontwikkeld.
Sinds het begin van deze eeuw heeft het land wel gewerkt aan het verbeteren van

Samenvatting
252
zogenaamde corporate governance best practices. Tegelijkertijd heeft het land in
vergelijking met andere landen in Zuidoost-Azië relatief weinig progressie geboekt met
het verbeteren van deze best practices (ADB, 2017).
Het onderzoek in het proefschrift analyseert twee externe mechanismen (i.e., het
algemene institutionele raamwerk en de rol van externe auditors), en twee interne
mechanismen (i.e., de kenmerken van het bestuur en het belang van transparantie van
informatie). In twee studies wordt een analyse wordt de aandacht gericht op één enkel
mechanisme (Studie 1 en 2); twee andere studies analyseren richten zich op een
combinatie van twee mechanismen (Studie 3 en 4). Figuur 1 geeft een overzicht van de
verschillende studies en hun onderlinge relatie.
Figuur 1. Corporate governance mechanismen
Studie 1 schetst een beeld van de rol van het institutionele raamwerk (extern
mechanisme) bij het verkleinen van de kans op corruptie. Studie 2 behandelt de
perceptie van externe auditors bij het beoordelen van de kans op fraude. Studie 3
onderzoekt de interactie tussen de raad van commissarissen (interne mechanismen) en
de verandering van het institutionele raamwerk (externe mechanismen) (zie stippellijn
in figuur 1), in het bijzonder door te kijken naar hoe de veranderingen in dit raamwerk
External mechanismen Internal mechanismen
Institutionele raamwerk
(Studies 1 and 3)
Externe auditors (Studie 2)
Raad van Commissarissen
(Studie 3)
Raad van Commissarissen
(Studie 4) brnal mechanisms
Transparantie van informatie (Studie 4)
Corporate governance mechanismen

Samenvatting
253
van invloed zijn op de prestaties van ondernemingen waarvan de commissarissen
banden hebben met de politiek versus de prestaties van ondernemingen waarvan de
commissarissen deze banden niet hebben. In studie 4 wordt het verband onderzocht
tussen de wijze waarop de raad van commissarissen functioneert (interne
mechanismen), de mate van transparantie van informatieverschaffing (interne
mechanisme) (zie stippellijn figuur 1) en de mate waarin het management de inkomsten
stuurt (earnings management). De details van elk van deze studies worden hieronder
gegeven.
De eerste studie (hoofdstuk 2) onderzoekt hoe het algemene institutionele
raamwerk van een land de kans op corruptie kan verkleinen. Daarbij wordt een
vergelijking gemaakt tussen Maleisië, Thailand en Indonesië. De analyse maakt gebruik
van de agency theorie. De centrale stelling in dit hoofdstuk is dat sterk ontwikkelde
instituties die gericht zijn op het verbeteren van de best practices in corporate
governance de kans op corruptie verkleinen. De studie bestudeert hoe best practices in
corporate governance met betrekking tot de rechten van aandeelhouders, de raad van
commissarissen, en accounting en auditing standaarden, inclusief het belang van de
transparantie van informatievoorziening in de drie landen zijn ontwikkeld. Deze best
practices dragen ertoe bij dat er een stricter toezicht op het management van
ondernemingen mogelijk is, waardoor de kans op corruptie kleiner wordt. De
belangrijkste bevinding is dat de instituties die gericht zijn op het verbeteren van de best
practices in corporate governance in Indonesië minder sterk zijn ontwikkeld dan die in
Maleisië en Thailand. Dit betekent dat het toezicht op het management van Indonesische
ondernemingen minder strikt is, waardoor de kans op corruptie hoger zal zijn.
De tweede studie (hoofdstuk 3) is gericht op het bestuderen van de perceptie van
externe auditors van de kans op financiële fraude. Hiervoor is een enquête afgenomen
onder 435 externe auditors. Er is gebruik gemaakt van een zogenaamde vignette case
study methode, waarbij de casus die wordt beschreven is gebaseerd op een werkelijke
zich in Indonesië afspelende casus. Het onderzoeksmodel voorspelt dat de beoordeling
van de kans op fraude door externe auditors wordt bepaald op basis van zogenaamde
red flags, ofwel omstandigheden en factoren die de waarschijnlijkheid dat fraude

Samenvatting
254
optreedt verhogen, het oordeel van de auditor wat betreft de materialiteit van de de
casus, de mate van professionele scepsis van de auditor, zijn/haar inschatting van de
kans dat de casus zal leiden tot een rechtsgang, een aantal persoonskenmerken van de
auditor en het auditkantoor waar hij/zij werkzaam. Het onderzoek laat zien dat vooral
het materialiteitsoordeel en de professionele scepsis van de auditor de kans verhogen
dat hij/zij de kans op fraude hoger inschat in geval van de beschreven casus. Verder
toont de analyse aan dat het materialiteitsoordeel de beoordeling van de kans op fraude
vooral indirect beïnvloedt via professionele scepsis. Deze twee bevindingen hebben
mogelijke gevolgen voor auditors en hun taakuitvoering. Zij laten zien dat het voor
auditors belangrijk is om conservatief te blijven wanneer zij een inschatting moeten
maken van de materialiteit van een casus. Dit gedrag versterkt de professionele scepsis
van auditors, wat leidt tot meer vaststellingen van een kans op fraude. Deze resultaten
zijn nieuw in de audit-literatuur. Al met al suggereren ze dat de kwaliteit van de audits
verbeterd kan worden als auditors conservatiever en sceptischer zijn bij het beoordelen
van de kans op fraude.
De derde studie (hoofdstuk 4) onderzoekt hoe institutionele veranderingen zoals
die in 2004 plaatsvonden in Indonesië de financiële prestaties van ondernemingen met
politieke banden beïnvloeden. Deze studie is gebaseerd op de agency theory en de
resource dependence theory. Het is één van de weinige studies die gebruikmaakt van
longitudinale data (2000-2011), waarbij de invloed van institutionele veranderingen op
de prestaties van ondernemingen politieke banden wordt onderzocht. De data zijn
opgesplitst in de pre-democratische periode (2000-2004) en de democratische periode
(2005-2011), waardoor het mogelijk is het netto effect van de institutionele
veranderingen op de waarde van politieke banden voor ondernemingen te meten. Het
jaar 2004 wordt beschouwd als een mijlpaal, omdat in Indonesië dat jaar voor het eerst
directe democratische presidentsverkiezingen werden gehouden. Voor deze studies zijn
data betreffende bestuursleden met politieke banden van 357 beursgenoteerde niet-
financiële Indonesische ondernemingen met de hand verzameld. De resultaten van de
empirische analyse laten zien dat in de democratische periode het effect van politieke
banden op de financiële prestaties van ondernemingen afnam. Deze resultaten geven

Samenvatting
255
aan dat de waarde van politieke banden voor ondernemingen minder belangrijk zijn
sinds Indonesië in 2004 een democratisch gekozen regering kreeg. Deze resultaten
kunnen verklaard worden door het feit dat er vanaf 2004 een verschuiving van de macht
plaatsvond van de centrale autoriteiten naar regionale autoriteiten. De macht van de
centrale bureaucraten werd minder, waardoor het belang, en daarmee de waarde, van
politieke banden met de centrale autoriteiten voor ondernemingen afnam.
De vierde en laatste studie (hoofdstuk 5) onderzoekt de onderlinge relaties tussen
de wijze waarop de raad van commissarissen functioneert, de mate van transparantie
van informatieverschaffing die een onderneming verschaft en de mate waarin het
management de inkomsten stuurt (earnings management). Daar waar andere studies
uitgaan van een directe relatie tussen het functoneren van de raad van commissarissen
en earnings management, stelt deze studie dat de relatie tussen het functioneren van de
raad van commissarissen en earnings management niet per se alleen direct hoeft te zijn. In
deze studie wordt onderzocht in hoeverre het functioneren van de raad van
commissarissen mede bepalend is voor de mate van transparantie van informatie die de
onderneming betracht. Vervolgens wordt bestudeerd in hoeverre de mate van
transparantie mede bepalend is voor de mate waarin het management gebruik maakt
van earnings management. De data voor deze studie zijn afkomstig van de ASEAN
Corporate Governance Scorecards. Deze data bevatten onder meer gegevens met
betrekking tot de vaardigheden en competenties van de leden van de raad van
commissarissen, de betrokkenheid van de commissarissen bij de onderneming en de
inzet die zij vertonen met betrekking tot hun toezichthoudende rol, en de structuur en
samenstelling van de raad van commissarissen. Deze gegevens zijn verzameld voor 104
beursgenoteerde niet-financiële Indonesische ondernemingen voor de jaren 2013, 2014
en 2015. De resultaten van het onderzoek laten zien dat de vaardigheden en
competenties van de leden van de raad van commissarissen, alsmede hun
betrokkenheid bij de onderneming, een indirect negatief effect hebben op earnings
management, omdat deze beide kenmerken van de raad van commissarissen bijdragen
aan het verbeteren van de transparantie van informatie die ondernemingen verplicht
zijn te geven, wat vervolgens leidt tot een vermindering van het gebruik van earnings
Samenvatting
256
management. Voor informatie die ondernemingen niet verplicht hoeven te openbaren
vindt de studie geen verband met de vaardigheden, competenties en betrokkenheid van
de leden van de raad van commissarissen. Een interessante en belangrijke bevinding van
dit onderzoek is dat Indonesische ondernemingen zich klaarblijkelijk niet houden aan de
regels met betrekking tot de verplichte openbaarheid van gegevens. Dit wijst erop dat
de kwaliteit van corporate governance in Indonesië, hoewel verbeterd gedurende de
afgelopen jaren, nog steeds relatief zwak is. Het onderzoek suggereert dat dit komt
doordat het toezicht door de raad van commissarissen te wensen overlaat. Een andere
(niet in deze studie onderzochte) verklaring kan zijn dat de sancties op het niet
publiceren van verplichte informatie door ondernemingen niet of nauwelijks worden
gebruikt en/of niet effectief zijn.
Al met al laten de resultaten van de studies in dit proefschrift zien dat sterke
interne en externe corporate governance mechanismen belangrijk zijn voor het goed
functioneren van ondernemingen in een opkomende economie als Indonesië. Meer in
het bijzonder laten zij zien dat dergelijke mechanismen ervoor kunnen zorgen dat
ongewenst gedrag van het management (waarbij zij beslissingen neemt die het
eigenbelang, maar niet het belang van de andere stakeholders in de onderneming dienen)
kan worden gereduceerd.
Dit proefschrift laat zien dat een goed ontwikkelde corporate governance ervoor
kan zorgen dat checks-and-balances in organisaties worden toegepast die ongewenst
gedrag van het management kan reduceren of voorkomen. Investeren in corporate
governance is niet alleen belangrijk voor ondernemingen, maar ook voor de macro-
economie in het algemeen. Het proefschrift laat ook zien dat transparantie en
verantwoordingsplicht publiek vertrouwen wekt, wat weer kan leiden tot het
aantrekken van investeerders en het stimuleren van economische groei. Hoewel dit
onderzoek gericht is op Indonesië bevatten de resultaten wel degelijk ook belangrijke
lessen voor andere opkomende landen. Het zou interessant zijn wanneer het onderzoek
in dit proefschrift in de toekomst zou worden gerepliceerd in andere opkomende
economieën.

Ringkasan
257
Ringkasan
Tata kelola perusahaan mengacu pada cara-cara dimana para pemangku
kepentingan suatu perusahaan memastikan bahwa kepentingan mereka diperhatikan
oleh manajemen perusahaan. Tata kelola perusahaan mencakup hubungan formal dan
informal antara dewan komisaris dan para pemangku kepentingan yang menentukan
bagaimana kepentingan mereka akan dipenuhi, bagaimana manajemen melaporkan
kegiatan yang dapat memenuhi kepentingan-kepentingan tersebut, dan bagaimana
kinerja manajemen terkait pemenuhan kepentingan tersebut dimonitor (OECD, 1999).
Tulang punggung penelitian tata kelola perusahaan terletak pada teori keagenan yang
dikembangkan oleh, diantara yang lain, Jensen dan Meckling (1976). Gagasan utama
dari teori mereka adalah adanya pemisahan antara kepemilikan dan kontrol. Teori
mereka menekankan bahwa agen (manajer) memiliki kepentingan pribadi, yang dapat
menyimpang dari kepentingan pemilik (pemangku kepentingan) perusahaan.
Berdasarkan teori ini, Jensen dan Meckling berpendapat bahwa pelaksanaan monitoring
yang efektif melalui berbagai mekanisme tata kelola perusahaan harus ditegakkan
untuk mencegah perilaku manajer yang kurang baik. Mekanisme tata kelola perusahaan
dapat diklasifikasikan ke dalam mekanisme internal dan mekanisme eksternal (Walsh
dan Seward, 1990; Denis dan McConnell 2003). Mekanisme internal berkaitan dengan
organ internal perusahaan, seperti dewan komisaris dan pemegang saham, sedangkan
mekanisme eksternal melibatkan faktor/pihak eksternal seperti rerangka
hukum/peraturan dan pasar modal (Cuervo, 2002; Gillan, 2006; Hanson dan Song, 2006).
Disertasi ini bertujuan untuk menginvestigasi bagaimana mekanisme tata kelola
perusahaan di Indonesia dapat mengurangi peluang perilaku manajerial yang
menyimpang. Sebagai negara berkembang, praktik tata kelola perusahaan di Indonesia
berbeda dengan negara maju. Sejak awal 2000-an, Indonesia telah meningkatkan praktik
tata kelola perusahaan melalui kerangka kerja regulasi yang lebih baik. Namun
demikian, Indonesia relatif lebih lambat dalam mereformasi praktik korporasi

Ringkasan
258
dibandingkan dengan negara-negara berkembang lainnya di kawasan Asia Tenggara
(ADB, 2017).
Disertasi ini menganalisis dua jenis mekanisme eksternal (yaitu, rerangka
institusional dan auditor eksternal), dan dua jenis mekanisme internal (yaitu,
karakterisitk dewan komisaris dan transparansi). Dari empat studi yang dilakukan, dua
studi menyajikan analisis satu jenis mekanisme (Studi 1 dan 2); dan dua studi lainnya
menganalisis kombinasi dari dua jenis mekanisme. Hubungan antar berbagai
mekanisme dari keempat studi empiris tersebut dapat dilihat pada Gambar 1.
Gambar 1. Mekanisme Tata Kelola Perusahaan
Studi 1 menjelaskan mengenai peranan rerangka institusional (mekanisme
eksternal) dalam upaya memitigasi/ mencegah peluang korupsi. Studi 2 berkaitan
dengan persepsi auditor eksternal (mekanisme eksternal) ketika menilai risiko
kecurangan (fraud). Studi 3 meneliti interaksi antara dewan komisaris/ direksi
(mekanisme internal) dan perubahan rerangka institusional (mekanisme eksternal)
(lihat garis putus-putus di gambar 1), dan efek perubahan tersebut terhadap kinerja
perusahaan yang komisaris/ direkturnya mempunyai hubungan politis dan yang tidak
memiliki hubungan politis. Studi 4 menganalisis hubungan antara karakteristik dewan
komisaris (mekanisme internal), transparansi (mekanisme internal) (lihat garis putus-
Mekanisme Eksternal Mekanisme Internal
Rerangka Institusional
(Studi 1 and 3)
Auditor Eksternal (Studi 2)
Dewan Komisaris, Direksi (Studi 3)
Dewan Komisaris (Studi 4)
brnal mechanisms
Transparansi (Studi 4)
Mekanisme Tata Kelola Perusahaan

Ringkasan
259
putus di gambar 1), dan manajemen laba. Berikut ini adalah penjelasan lebih rinci
untuk masing-masing studi.
Studi pertama (bab 2) meneliti peran rerangka institusional dalam
mengendalikan peluang korupsi. Studi ini merupakan studi komparatif tentang
rerangka tata kelola perusahaan di Malaysia, Thailand, dan Indonesia. Berpijak pada
teori keagenan, kami berpendapat bahwa rerangka institusional tata kelola perusahaan
yang kuat dapat mengurangi peluang terjadinya korupsi. Tiga komponen tata kelola
perusahaan yaitu hak-hak pemegang saham, dewan komisaris, standard akuntansi dan
auditing, termasuk transparansi dievaluasi. Temuan utama dari studi komparatif ini
adalah, secara umum, rerangka institusional tata kelola perusahaan Indonesia kurang
kuat dibandingkan dengan Malaysia dan Thailand, yang mengakibatkan sistem
pengawasan menjadi lemah. Karena rerangka institusionalnya kurang memaksa, maka
hal ini memberikan peluang yang lebih besar untuk terjadinya korupsi.
Studi kedua (bab 3) berfokus pada persepsi auditor eksternal tentang penilaian
risiko kecurangan (fraud). Survei terhadap 435 auditor eksternal dilakukan, dengan
menggunakan studi kasus vignet yang diadaptasi dari kasus manipulasi riil di
Indonesia. Model penelitian dari studi ini memprediksi bahwa penilaian risiko
kecurangan oleh auditor eksternal ditentukan oleh faktor risiko kecurangan (red flags),
pertimbangan materialitas, skeptisisme profesional, risiko litigasi, dan beberapa
karakteristik auditor (seperti sertifikasi, pengalaman kerja, dan ukuran kantor akuntan
publik). Studi ini memberikan bukti bahwa faktor risiko kecurangan, pertimbangan
materialitas, dan skeptisisme profesional berpengaruh positif terhadap penilaian risiko
kecurangan. Selain itu, hasil analisis juga menunjukkan bahwa pertimbangan
materialitas mempengaruhi penilaian risiko kecurangan secara tidak langsung melalui
skeptisisme profesional. Temuan ini memiliki implikasi bagi para auditor dan pekerjaan
mereka yaitu, penting bagi para auditor untuk mempertahankan perilaku konservatif
dengan cara menurunkan batas ambang materialitas. Perilaku tersebut dapat
meningkatkan skeptisisme auditor, yang menghasilkan penilaian risiko kecurangan
yang lebih baik. Temuan ini dianggap baru dalam literatur audit. Secara keseluruhan,

Ringkasan
260
hasil studi ini menyimpulkan bahwa kualitas audit dapat ditingkatkan ketika auditor
menunjukkan sikap lebih konservatif dan berperilaku lebih skeptis.
Studi ketiga (bab 4) meneliti bagaimana perubahan institusional yang terjadi
pada tahun 2004 di Indonesia mempengaruhi nilai perusahaan yang memiliki hubungan
politis. Menggunakan teori agensi dan teori ketergantungan sumber daya (resource
dependence), studi ini merupakan salah satu dari sedikit studi yang menggunakan data
longitudinal (2000-2011), yang menginvestigasi dampak perubahan institusional pada
kinerja perusahaan yang terkoneksi secara politis. Data penelitian dipecah menjadi
periode era pra-demokrasi (2000-2004) dan periode era demokratis (2005-2011), agar
dapat dilakukan pengukuran terhadap efek bersih dari perubahan institusional
terhadap nilai koneksi politis. Tahun 2004 dianggap sebagai tonggak sejarah demokrasi
karena pada tahun tersebut Indonesia untuk pertama kalinya melaksanakan pemilihan
presiden secara langsung dan demokratis. Data anggota dewan komisaris dan direksi
yang memiliki koneksi politis dari 357 perusahaan publik non-keuangan dikumpulkan
secara manual. Hasil empiris menunjukkan bahwa di era demokrasi, efek koneksi politis
terhadap kinerja keuangan perusahaan mengalami penurunan. Hasil penelitian ini
mengindikasikan bahwa nilai koneksi politis menjadi kurang penting setelah Indonesia
memasuki rezim yang lebih demokratis yaitu setelah 2004. Hal ini dapat dijelaskan
berdasarkan fakta bahwa sejak 2004 telah terjadi pergeseran kekuasaan dari pemerintah
pusat ke pemerintah daerah. Kekuasaan birokrat pusat menurun, yang menyebabkan
perusahaan-perusahaan yang memiliki koneksi politis dengan mereka mengalami
penurunan kinerja keuangan.
Studi keempat (bab 5) mengeksplorasi hubungan antara dewan komisaris,
transparansi dan pengungkapan, dan manajemen laba. Penelitian terdahulu
mengasumsikan adanya hubungan langsung antara karakteristik dewan komisaris dan
manajemen laba, sementara penelitian ini berpendapat bahwa hubungan antara dewan
komisaris dan manajemen laba bersifat tidak langsung. Karakteristik (input) dewan
komisaris menentukan tingkat transparansi dan pengungkapan, yang selanjutnya akan
berdampak mengurangi praktik manajemen laba. Tiga input (karakteristik) dewan
komisaris disusun dengan menggunakan data dari ASEAN Corporate Governance

Ringkasan
261
Scorecard, yaitu keahlian, komitmen, dan struktur. Penelitian ini menggunakan sampel
104 perusahaan non-keuangan Indonesia yang terdaftar di bursa efek untuk tahun 2013,
2014, dan 2015. Hasil penelitian menunjukkan bahwa keahlian, komitmen, dan struktur
tidak terkait langsung dengan manajemen laba; tetapi mereka berhubungan positif
dengan tingkat pengungkapan informasi. Temuan yang paling penting adalah keahlian
dewan komisaris dan komitmen dewan komisaris terbukti menurunkan praktik
manajemen laba secara tidak langsung melalui pengungkapan wajib, namun tidak
melalui pengungkapan sukarela. Hal ini menyiratkan bahwa pengungkapan wajib
bertindak sebagai variabel mediasi. Selain itu, hasil penelitian juga menunjukkan bahwa
perusahaan-perusahaan Indonesia belum sepenuhnya mematuhi pengungkapan wajib.
Kondisi ini dapat terjadi karena anggota dewan komisaris mungkin kurang efektif
dalam hal pengawasan, atau ini mungkin disebabkan oleh fakta bahwa badan pengawas
tidak memberikan hukuman atau penalti yang cukup berat kepada perusahaan yang
tidak patuh.
Secara keseluruhan, hasil-hasil studi empiris di disertasi ini menunjukkan bahwa
mekanisme tata kelola perusahaan baik internal maupun eksternal yang kuat, sangat
diperlukan untuk pertumbuhan kinerja perusahaan-perusahaan yang berada dalam
perekonomian yang sedang tumbuh seperti Indonesia. Disertasi ini menunjukkan
bahwa praktik tata kelola perusahaan yang baik memastikan adanya check and balance
yang diterapkan untuk mencegah kecurangan. Penerapan tata kelola perusahaan sangat
penting, memberikan manfaat tidak hanya untuk keberlanjutan bisnis jangka panjang,
tetapi juga untuk perekonomian negara secara keseluruhan. Disertasi ini juga
menunjukkan bahwa transparansi dan akuntabilitas menciptakan kepercayaan publik,
yang selanjutnya memungkinkan untuk memberikan daya tarik bagi investor dan
mendorong pertumbuhan ekonomi. Meskipun penelitian ini hanya berfokus pada
Indonesia, namun demikian kami yakin bahwa temuan penelitian ini dapat memberikan
pelajaran penting bagi negara berkembang lainnya. Analisis yang telah dilakukan dalam
disertasi ini dapat direplikasi dalam konteks negara yang berbeda. Peluang untuk
penelitian yang akan datang seperti penelitian komparatif antar negara sangat terbuka
untuk dilakukan.

Ringkasan
262

263
About the Author
Nureni Wijayati is a lecturer at Universitas Indonesia, the Faculty of Economics and
Business, Depok, Indonesia. She obtained her bachelor and research master in
Accounting from the Faculty of Economics and Business, Universitas Indonesia
(FEBUI). Before becoming a full-time lecturer at FEBUI in 2009, she had enjoyed her
career as an accountant in the private sector. She holds a Chartered Accountant
designation from the Indonesian Institute of Accountants. She has also served as
Expert Staff at the Indonesian Institute of Certified Public Accountants.

264

265

266