Catalogues of hot white dwarfs in the Milky Way from GALEX's ...
22
Mon. Not. R. Astron. Soc. 411, 2770–2791 (2011) doi:10.1111/j.1365-2966.2010.17890.x Catalogues of hot white dwarfs in the Milky Way from GALEX’s ultraviolet sky surveys: constraining stellar evolution Luciana Bianchi, 1 Boryana Efremova, 1 James Herald, 1 L´ eo Girardi, 2 Alexandre Zabot, 3 Paola Marigo 4 and Christopher Martin 5 1 Department of Physics and Astronomy, Johns Hopkins University, 3400 N. Charles Street, Baltimore, MD 21218, USA 2 Astronomical Observatory of Padova, INAF, Vicolo dell’Osservatorio 5, I-35122 Padova, Italy 3 Universidade Federal da Fronteira Sul, Campus de Laranjeiras do Sul, Brazil 4 Department of Astronomy, University of Padua, Vicolo dell’Osservatorio 3, I-35122 Padova, Italy 5 California Institute of Technology, Pasadena, CA 91125, USA Accepted 2010 October 16. Received 2010 August 3; in original form 2010 March 9 ABSTRACT We present comprehensive catalogues of hot star candidates in the Milky Way (MW), selected from Galaxy Evolution Explorer (GALEX) far-UV (FUV; 1344–1786 Å) and near-UV (NUV; 1771–2831 Å) imaging. The FUV and NUV photometry allows us to extract the hottest stellar objects, in particular hot white dwarfs (WD), which are elusive at other wavelengths because of their high temperatures and faint optical luminosities. We generated catalogues of UV sources from two GALEX’s surveys: All-Sky Imaging Survey (AIS; depth AB magnitude ∼19.9/ 20.8 in FUV/NUV) and Medium-depth Imaging Survey (MIS; depth ∼22.6/22.7 mag). The two catalogues (from GALEX fifth data release) contain 65.3/12.6 million (AIS/MIS) unique UV sources with error NUV 0.5 mag, over 21 435/1579 deg 2 . We also constructed subcatalogues of the UV sources with matched optical photometry from Sloan Digital Sky Survey (SDSS; seventh data release): these contain 0.6/0.9 million (AIS/MIS) sources with errors 0.3 mag in both FUV and NUV, excluding sources with multiple optical counterparts, over an area of 7325/1103 deg 2 . All catalogues are available online. We then selected 28319 (AIS)/9028 (MIS) matched sources with FUV − NUV < −0.13; this colour cut corresponds to stellar T eff hotter than ∼18 000 K (the exact value varying with gravity). An additional colour cut of NUV−r > 0.1 isolates binaries with largely differing T eff s, and some intruding quasi- stellar objects (QSOs; more numerous at faint magnitudes). Available spectroscopy for a subsample indicates that hot-star candidates with NUV−r < 0.1 (mostly ‘single’ hot stars) have negligible contamination by non-stellar objects. We discuss the distribution of sources in the catalogues, and the effects of error and colour cuts on the samples. The density of hot-star candidates increases from high to low Galactic latitudes, but drops on the MW plane due to dust extinction. Our hot-star counts at all latitudes are better matched by MW models computed with an initial–final mass relation (IFMR) that favours lower final masses. The model analysis indicates that the brightest sample is likely composed of WDs located in the thin disc, at typical distances between 0.15 and 1 kpc, while the fainter sample comprises also a fraction of thick disc and halo stars. Proper motion distributions, available only for the bright sample (NUV < 18 mag), are consistent with the kinematics of a thin-disc population. Key words: catalogues – surveys – stars: evolution – white dwarfs – Galaxy: stellar content – ultraviolet: stars. 1 INTRODUCTION The vast majority of stars (initial mass 8M ) end their lives as white dwarfs (WD), after passing through the asymptotic giant E-mail: [email protected] branch (AGB) and planetary nebula (PN) phases, in which they shed much of their mass. The ejected material enriches the interstellar medium (ISM) with newly synthesized nuclear products (mainly He, C, N and possibly O) to different extents, depending on the initial stellar mass and exact evolutionary path (e.g. Marigo 2001; Karakas 2010). Intermediate-mass stars are the main providers of carbon and nitrogen, whereas low-mass stars are the most relevant C 2010 The Authors Monthly Notices of the Royal Astronomical Society C 2010 RAS Downloaded from https://academic.oup.com/mnras/article/411/4/2770/983368 by guest on 13 July 2022
-
Upload
khangminh22 -
Category
Documents
-
view
0 -
download
0
Transcript of Catalogues of hot white dwarfs in the Milky Way from GALEX's ...

Mon. Not. R. Astron. Soc. 411, 2770–2791 (2011) doi:10.1111/j.1365-2966.2010.17890.x
Catalogues of hot white dwarfs in the Milky Way from GALEX’sultraviolet sky surveys: constraining stellar evolution
Luciana Bianchi,1� Boryana Efremova,1 James Herald,1 Leo Girardi,2
Alexandre Zabot,3 Paola Marigo4 and Christopher Martin5
1Department of Physics and Astronomy, Johns Hopkins University, 3400 N. Charles Street, Baltimore, MD 21218, USA2Astronomical Observatory of Padova, INAF, Vicolo dell’Osservatorio 5, I-35122 Padova, Italy3Universidade Federal da Fronteira Sul, Campus de Laranjeiras do Sul, Brazil4Department of Astronomy, University of Padua, Vicolo dell’Osservatorio 3, I-35122 Padova, Italy5California Institute of Technology, Pasadena, CA 91125, USA
Accepted 2010 October 16. Received 2010 August 3; in original form 2010 March 9
ABSTRACTWe present comprehensive catalogues of hot star candidates in the Milky Way (MW), selectedfrom Galaxy Evolution Explorer (GALEX) far-UV (FUV; 1344–1786 Å) and near-UV (NUV;1771–2831 Å) imaging. The FUV and NUV photometry allows us to extract the hottest stellarobjects, in particular hot white dwarfs (WD), which are elusive at other wavelengths because oftheir high temperatures and faint optical luminosities. We generated catalogues of UV sourcesfrom two GALEX’s surveys: All-Sky Imaging Survey (AIS; depth AB magnitude ∼19.9/20.8 in FUV/NUV) and Medium-depth Imaging Survey (MIS; depth ∼22.6/22.7 mag). The twocatalogues (from GALEX fifth data release) contain 65.3/12.6 million (AIS/MIS) unique UVsources with errorNUV � 0.5 mag, over 21 435/1579 deg2. We also constructed subcataloguesof the UV sources with matched optical photometry from Sloan Digital Sky Survey (SDSS;seventh data release): these contain 0.6/0.9 million (AIS/MIS) sources with errors �0.3 magin both FUV and NUV, excluding sources with multiple optical counterparts, over an areaof 7325/1103 deg2. All catalogues are available online. We then selected 28 319 (AIS)/9028(MIS) matched sources with FUV − NUV < −0.13; this colour cut corresponds to stellarTeff hotter than ∼18 000 K (the exact value varying with gravity). An additional colour cutof NUV−r > 0.1 isolates binaries with largely differing Teffs, and some intruding quasi-stellar objects (QSOs; more numerous at faint magnitudes). Available spectroscopy for asubsample indicates that hot-star candidates with NUV−r < 0.1 (mostly ‘single’ hot stars)have negligible contamination by non-stellar objects. We discuss the distribution of sourcesin the catalogues, and the effects of error and colour cuts on the samples. The density ofhot-star candidates increases from high to low Galactic latitudes, but drops on the MW planedue to dust extinction. Our hot-star counts at all latitudes are better matched by MW modelscomputed with an initial–final mass relation (IFMR) that favours lower final masses. Themodel analysis indicates that the brightest sample is likely composed of WDs located in thethin disc, at typical distances between 0.15 and 1 kpc, while the fainter sample comprises alsoa fraction of thick disc and halo stars. Proper motion distributions, available only for the brightsample (NUV < 18 mag), are consistent with the kinematics of a thin-disc population.
Key words: catalogues – surveys – stars: evolution – white dwarfs – Galaxy: stellar content– ultraviolet: stars.
1 I N T RO D U C T I O N
The vast majority of stars (initial mass �8 M�) end their livesas white dwarfs (WD), after passing through the asymptotic giant
�E-mail: [email protected]
branch (AGB) and planetary nebula (PN) phases, in which they shedmuch of their mass. The ejected material enriches the interstellarmedium (ISM) with newly synthesized nuclear products (mainlyHe, C, N and possibly O) to different extents, depending on theinitial stellar mass and exact evolutionary path (e.g. Marigo 2001;Karakas 2010). Intermediate-mass stars are the main providers ofcarbon and nitrogen, whereas low-mass stars are the most relevant
C© 2010 The AuthorsMonthly Notices of the Royal Astronomical Society C© 2010 RAS
Dow
nloaded from https://academ
ic.oup.com/m
nras/article/411/4/2770/983368 by guest on 13 July 2022

Hot white dwarfs: UV catalogues 2771
component for the mass budget of stellar remnants in galaxies.Most of the stellar mass is shed in the AGB and PN phases, butthe evolution through these phases is still subject to considerableuncertainties, in particular regarding mass loss and the efficiency ofthe third dredge-up. Stars within an initial mass range of ∼0.8 to8 M� end as WDs with a narrow mass range, mostly below 0.8 M�.It is important to understand how the mass of their precursors relatesto the final WD mass, in order to understand the relative contributionof different stars to the chemical enrichment of elements such asHe, C, N and O.
While the evolution of the WD progenitors in the main-sequencephase is fairly well understood and observationally constrained, thehot-WD population is hitherto quite elusive, owing to their smallradius, hence low optical luminosity, and extremely hot temper-atures, to which optical colours are insensitive (see e.g. Bianchi2007; Bianchi et al. 2007a,b) as well as to their very short lifetimeson the constant-luminosity post-AGB phase. To make matters moredifficult, the post-AGB luminosity at a given stellar temperaturevaries significantly according to the stellar mass, making it impos-sible to infer absolute luminosity from other physical parameters.The evolutionary time spent on the constant-luminosity post-AGBphase and on the cooling track is also a strong function of the mass(Vassiliadis & Wood 1994). Therefore, the exact relation betweenprogenitor’s initial mass and WD mass [initial–final mass relation(IFMR)] remains to date a crucial missing link in our understandingof stellar evolution and chemical enrichment of the Galaxy.
A characterization of the population of hot WDs in the Milky Way(MW) can reduce these uncertainties, and lead to a better under-standing of processes that drive the chemical evolution of galaxieslike the MW. UV photometry combined with optical measurementssignificantly increases the sensitivity to the hottest temperatures.For example, the colour difference between a Teff = 50 000 K and20 000 K star is about 1.5 mag in FUV-g, but <0.4 mag in U −B, and <0.15 mag in g − r which are comparable to photometricerrors when large surveys are considered. The sensitivity gained byextending the measurements to UV wavelengths is more critical fordiscerning the hottest stars (see e.g. figs 5–7 of Bianchi et al. 2007a;Bianchi 2009).
The census and characterization of cool compact objects hassignificantly improved in recent years thanks to optical and IRsurveys. The Eisenstein et al. (2006) catalogue from the Sloan Dig-ital Sky Survey (SDSS) fourth data release (DR4) contains 9316spectroscopically confirmed WDs and 928 subdwarfs over an areaof 4783 deg2; about one fourth (2741) have Teff > 18 000 K asestimated by the SDSS pipeline automated spectral analysis. Anadditional ∼5–6000 WD are expected from seventh data release(DR7; Kleinman, Nitta & Koester 2009). Seven ultracool WD wereadded to the census by Harris et al. (2008). Gontcharov et al. (2010)extracted from Two Micron All Sky Survey (2MASS), Tycho-2,XPM and UCAC3 catalogues combined 34 WDs, 1996 evolved(11 000 < Teff < 60 000 K) and 7769 unevolved (Teff < 7000 K)subdwarfs, using multi-colour photometry and proper motions ofstars with 6 < Ks < 14 mag. The current version (2008) of theMcCook & Sion (1999) catalogue of spectroscopically confirmedWDs includes 10 132 entries (all types), a factor of 5 increase overa decade, with respect to the original (1999) version listing 2249WDs. Vennes et al. (2002) give a catalogue of 201 DA WDs, spectro-scopically confirmed from the ∼1000 H-rich DA WDs discoveredin the 2dF QSO redshift survey; Croom et al. (2004) 2dF cata-logue includes 2071 WDs over 2000 deg2. WDs in binaries fromthe SDSS were catalogued and studied by several authors, see e.g.Rebassa-Mansergas et al. (2010) and references therein, Silvestri
et al. (2007), Heller, Homeier & Dreizler (2009, WD-M star bina-ries) from spectroscopy; other authors used optical-IR photometryto search for binaries among the known WDs (e.g. Watcher et al.2003; Tremblay & Bergeron 2007). Special classes such as CVs areaddressed by other works (e.g. Szkody et al. 2009 and referencestherein; Gansicke et al. 2009), while others studied in detail thevery local population (e.g. Holberg, Oswalt & Sion 2002 discuss122 objects within 20 pc from the Sun, which they estimate to be an80 per cent complete sample within this distance, and which includesome double-degenerate systems).
Finding the hottest, smallest stars, however, remained a challengeprior to the GALEX UV sky surveys, which provide deep sensitivityand large area coverage. For example, 105 were found in the originalEUVE whole-sky survey, with small subsequent additions obtainedby combining EUVE and ROSAT [see e.g. Dupuis (2002) for areview and discussion]. The ROSAT whole-sky survey produced175 WD in X-rays, mostly DAs (Fleming et al. 1996, from ROSATPSPC).
Such catalogues of confirmed or candidate WDs enable the studyof these objects as astrophysical probes of stellar evolution, of MWstructure, of the local neighbourhood, etc. Most importantly, com-prehensive catalogues enable the selection of targets for follow-upspectroscopy, which then provides the detailed physics of theseobjects, especially when extended to the UV and far-UV (FUV)wavelengths, as proven by the score of results enabled by IUE,FUSE and HST spectrographs.
Bianchi (2007, 2009) and Bianchi et al. (2007a, 2009a, 2005)have demonstrated the power of FUV and near-UV (NUV) mea-surements, afforded for the first time over large areas of the sky byGALEX, to unambiguously detect and characterize extremely hotstellar sources. Not only the UV wavelengths are more sensitive tothe temperatures of hottest stars, but the combination of UV andoptical colours also allows a better separation of different classes ofastrophysical objects (e.g. Bianchi 2009 and references therein).
Our present work provides a selection of hot-star candidates fromUV photometry; about 40 000 hot-star candidates with FUV, NUVphotometric errors � 0.3 mag (about 74 000 with photometric errors� 0.5 mag), have also SDSS optical photometry. The majority arelikely hot WD with log(g) between 7 and 9. The catalogue coversdifferent latitudes and enables a first analysis of this stellar pop-ulation with MW models. Larger catalogues of UV sources withand without optical SDSS match are also constructed, and madeavailable as online products.
In Section 2, we describe the method used to construct ‘clean’catalogues of unique UV sources from two GALEX surveys withdifferent depths and coverage, and subsets of these catalogues withmatched optical photometry, and we present the catalogues’ char-acteristics. In Section 3, we extract samples of hot-star candidates,and analyse them with MW models in Section 4. Discussion andconclusions are given in Section 5.
2 T H E U V S K Y SU RV E Y S A N D T H E S O U R C EC ATA L O G U E S
2.1 The sky survey data
The Galaxy Evolution Explorer (GALEX) is imaging the sky in FUV(1344–1786 Å, λeff = 1538.6 Å) and NUV (1771–2831 Å, λeff =2315.7 Å) simultaneously, with a field-of-view of 1.◦2 diameter anda resolution of 4.2/5.3 arcsec (FUV/NUV) (Morrissey et al. 2007).The images are sampled with 1.5 arcsec pixels. Nested surveyswith different depth and coverage are in progress. The widest sky
C© 2010 The Authors, MNRAS 411, 2770–2791Monthly Notices of the Royal Astronomical Society C© 2010 RAS
Dow
nloaded from https://academ
ic.oup.com/m
nras/article/411/4/2770/983368 by guest on 13 July 2022
2772 L. Bianchi et al.
Figure 1. Top: sky coverage (in Galactic coordinates) of the GALEX data release GR5 showing the major surveys: AIS (orange), MIS (green) and DIS (blue).Bottom: the portion of the GALEX GR5 sky coverage for AIS and MIS overlapping with SDSS DR7.
coverage is provided by the All-Sky Imaging Survey (AIS) and theMedium [depth] Imaging Survey (MIS), that reach typical depthsof 19.9/20.8 mag (FUV/NUV) and 22.6/22.7 mag (FUV/NUV), re-spectively, in the AB magnitude system. The Nearby Galaxy Survey(NGS; Bianchi et al. 2003; Bianchi 2009; Gil de Paz et al. 2007),with over 300 fields at MIS depth, targeted nearby, hence fairlyextended, galaxies, therefore it has been excluded in the presentwork, lest some sources from galaxies ‘shredded’ by the pipelineintrude on our catalogue. See also Bianchi (2009, 2010); Bianchiet al. (2007a); Bianchi et al. (2010) for a general discussion of thecontent of the UV sky surveys.
In this paper, we use data from the GALEX fifth data release(GR5) AIS and MIS surveys, which include a total of 28 269 and2161 fields, respectively. The data are taken from the MultimissionArchive at the Space Telescope Science Institute (MAST) archive.We restrict the catalogues to sources within the central 1◦ diameterof the field (for good photometry and astrometry, and to excludeedge artefacts). With such restriction, and eliminating overlaps,these surveys cover a total unique area of 21 434.8 (AIS) and 1578.6(MIS) deg2 (Section 2.4). Section 2.2 describes the constructionof the catalogue of unique GALEX sources. In order to separatethe UV sources by astrophysical classes, we examine in this workthe portions of the GALEX GR5 AIS and MIS surveys that arealso included in the footprint of the SDSS DR7, which providesfive optical magnitudes: u g r i z in addition to the GALEX FUV,NUV magnitudes. The overlap between GALEX GR5 and SDSSDR7 includes 10 316/1655 (AIS/MIS) GALEX fields, and the area
coverage of the overlap is 7325 (AIS) and 1103 (MIS) deg2. Detailsof the area calculation are provided in Section 2.4. The sky coverageof AIS and MIS in the GALEX data release GR5 and its overlapwith SDSS DR7 are shown in Fig. 1.
2.2 The catalogue of unique UV sources
Here, we describe the procedure used to construct the catalogue ofunique GALEX sources (i.e. eliminating repeated measurements).All catalogues described in this paper are made publicly avail-able from our website http://dolomiti.pha.jhu.edu/uvsky, and fromMAST at http://galex.stsci.edu, and as High-Level Science Products(http://archive.stsci.edu/hlsp/, in the ‘Catalogues’ section). There-fore, we provide here information on how they were constructed thatwill be relevant for potential users, as well as to others interested inconstructing future versions of similar samples.
We extracted catalogues of GALEX sources from STScIMAST (www.mast.stsci.edu), at the CASJobs SQL interface(www.galex.stsci.edu). Sources were extracted from the table ‘pho-toobjall’, from the MIS and AIS surveys separately, with the criteriathat the source distance from the field centre had to be �0.◦5 andthe photometric error less than 0.5 mag in NUV. In other words, weinitially included in our general GALEX source catalogue all NUVreliable detections, regardless of whether they have also an FUVdetection. For our selection of hot-star candidates, we will eventu-ally impose the additional criterion of good FUV photometry. Theadditional restriction of errFUV < 0.5 mag significantly reduces the
C© 2010 The Authors, MNRAS 411, 2770–2791Monthly Notices of the Royal Astronomical Society C© 2010 RAS
Dow
nloaded from https://academ
ic.oup.com/m
nras/article/411/4/2770/983368 by guest on 13 July 2022

Hot white dwarfs: UV catalogues 2773
0 1000 2000 3000 4000FUV Exposure time (sec)
0
100
200
300
400
Num
ber
of field
s MIS
0 100 200 300 400FUV Exposure time (sec)
0
2000
4000
6000
8000
10000
AIS
-50 0 50Galactic latitude
0
2.0•103
4.0•103
6.0•103
8.0•103
1.0•104
1.2•104
Num
ber
of U
V s
ourc
es in e
ach fie
ld
MIS AIS
Figure 2. Top: distribution of FUV exposure times for AIS (10 s bins) and MIS surveys (50 s bins); a few fields have longer exposure times, off the scale of theplots. Bottom: number of UV sources (all UV detections, not just our selected hot stars) in each GALEX field (1◦ diameter), before merging the catalogues andremoving overlaps. Three shades of blue (light/medium/dark) for AIS indicate exposure times of <120/120–220/>220 s, respectively, and lighter/darker greenfor MIS fields indicate FUV exposures less/more than 1200 s. Generally, the number of UV source detections in a field increases with depth of exposure, asexpected, and as seen more distinctly for the AIS at the high latitudes, uncomplicated by dust extinction. A few fields, including some with short exposures, haveoverdensities. While the number of MW stars increases towards the MW disc, as shown by the AIS sources, at MIS depth most UV sources are extragalactic,hence show no correlation with Galactic latitude except for the foreground extinction. The sharp drop in the centre, due to dust extinction, defines the MW dustdisc.
number of sources (by a factor of up to 10; see Table 2), with respectto the total number of NUV detections, and of course introducesa bias in the source catalogue, the hottest and bluest sources (thesubject of this paper) being not affected but the redder sources beingprogressively eliminated, as discussed in Sections 2.5 and 3.3. Formore discussions about statistical properties, and biases inherent tosample selections, see Bianchi et al. (2010).
A few observations planned as part of the MIS or AIS surveysactually partly failed, and resulted in one of the detectors (most oftenFUV) not being exposed (such observations are typically repeatedlater). The observations with one of the two bands having zeroexposure time were eliminated from our catalogue, otherwise theywill bias the statistics of FUV-detection over the total number ofNUV detections, and the corresponding fields were not counted inthe area calculation.
Fig. 2 shows the distribution of exposure times (FUV is shown,but NUV is generally equal or larger), for the AIS and MIS fields.
The typical exposure time for MIS is 1500 s, which is met orexceeded by the majority of fields. The AIS survey aims at exposuretimes of the order of ∼100 s. We retained also fields with exposuresshorter than typical. Therefore, while the typical depth of the twosurveys (AIS and MIS) differ by ∼2 mag, the exposure level is notstrictly homogeneous across each catalogue.
Fig. 2 (bottom panel) shows the number of GALEX sources ineach GALEX field. We colour-coded the fields by three ranges of ex-posure time for the AIS (two for MIS), since the number of sourcesdetected above a given error-cut generally increases with exposuretime. This plot is useful to check for fields with overdensities, sincethe surveys, the broad AIS in particular, include also some stellarclusters. In general, the spread in number of sources per field is justabout a factor of 2 for MIS. A few AIS fields around latitude −30◦
have an overdensity of almost 1 dex; however the total number ofAIS fields in each 10◦-wide latitude bin (used in our analysis; seethe next section) is very large, and a few overdensities do not affect
C© 2010 The Authors, MNRAS 411, 2770–2791Monthly Notices of the Royal Astronomical Society C© 2010 RAS
Dow
nloaded from https://academ
ic.oup.com/m
nras/article/411/4/2770/983368 by guest on 13 July 2022

2774 L. Bianchi et al.
our analysis of stellar counts with MW models over wide areas.Fields with high density of sources, and in particular the stellarclusters included in the surveys, will be separately analysed else-where. They are included in our catalogue for completeness and forpossible use by others, although customized photometry is desirablein very crowded fields (e.g. de Martino et al. 2008).
Nearby galaxies are generally observed as part of the ‘NGS’survey which is excluded from our catalogue, but a few large galax-ies are also in the footprint of AIS and MIS and bright knots ofgalaxies ‘shredded’ by the pipeline may enter the catalogue as sep-arate sources (see Bianchi et al. 2007a). A few such sources mayhave FUV−NUV <−0.13 and appear point like in the SDSS cata-logue, and therefore may enter our catalogue of hot-star candidates(Section 3), but they would not affect the statistical results. Forother, more specific uses of our catalogue, they may be removedby checking against a list of nearby galaxies, as we did in Bianchiet al. (2007a). Using the ‘child’ flags from the SDSS pipeline, thattrack deblended sources, proved not to be useful in identifying andweeding out sources from ‘shredded galaxies’.
The searches and download of GALEX sources with the abovecriteria were done using the java CASJobs command-line tool(casjobs.jar). One problem we often encountered when using thistool to extract and download query results from the data base isthat sometimes the download pipe gets broken prematurely, and theresults are truncated without any warning being given. In order toverify that the output file contained all the results, a separate countquery was run on the SQL server and compared to the number ofoutput sources in the downloaded file each time. It was necessaryto subdivide the search in small latitude strips due to various limitsset by the CASjobs interface (e.g. query length, output file size), aswell as to avoid the frequent problem of the long searches beinginterrupted.
The GALEX archive contains multiple observations of the samesource, when some fields overlap or are repeated. Having all mea-surements of each source is useful for variability studies (whichwill be addressed in a forthcoming work) and for choosing the bestmeasurement when several are available. For our present purposewe constructed from the total output a unique-source catalogue,in the following manner. GALEX sources were considered possi-ble duplicates if they lied within 2.5 arcsec of each other. If twoGALEX sources were within this distance, but had the same ‘pho-toextractid’ (i.e., they are both from the same observation), theywere both considered unique. Otherwise, they were assumed to bemultiple observations of the same source. We choose, to representthe unique source, the measurement with the longest NUV exposuretime. In the case of equal exposure times, the observation where thesource was closer to the field centre was chosen (i.e. the sourcewith the smallest ‘fov_radius’ value from the ‘photoobjall’ table),as photometric quality is usually better in the central part of thefield.
2.3 The matched UV-optical source catalogue
A portion of the GALEX survey areas is in the footprint of the SDSSDR7 (see Fig. 1, bottom panel), and for the UV sources in this areawe constructed a catalogue of matched optical sources. We uploadedthe coordinates of our GALEX unique sources into the SDSS SQLinterface (version 3_5_16 rev 1.70, at casjobs.sdss.org) and queriedfor SDSS matches against the ‘photoprimary’ table (SDSS sourcecatalogue that includes only unique sources) using an initial searchradius of 4.2 arcsec. A match radius of 3 arcsec was eventually usedin the final catalogue, as we shall see.
As with the GALEX searches, the SDSS searches were done in anautomated way on 1◦-wide Galactic latitude strips using the casjobscommand-line tool. We found that there is currently a bug in theSDSS version of this tool (v0.03) that causes the last character of afile to be dropped when extracting query results. We compensatedfor this by writing our query to pad the end of the file with anadditional character.
2.3.1 Multiple matches
A given GALEX source may have multiple SDSS matches withinthe search radius, given the higher spatial resolution of the SDSS(∼1.4 arcsec). In such cases the CASjob search returns multiplelines with the same GALEX source and the various SDSS matches.We ‘ranked’ the multiple SDSS matched sources based on the dis-tance, with the closest SDSS source being retained as the ‘match’for the GALEX source and the additional SDSS sources beingnoted. When using UV-optical colours for source classification,UV sources with multiple optical matches must be excluded, be-cause, even though the closest optical source may be the actualcounterpart, the UV photometry at the GALEX spatial resolutionof ∼5 arcsec may be a composite measure of two optical sources,and therefore the colour would not be meaningful. The fractionof UV sources with multiple optical matches, eliminated from theanalysis sample, is then taken into account when estimating den-sity of astrophysical sources (# per deg2). This fraction is given inTable 2. Sources with multiple optical matches are listed separatelyin our hot-star catalogues, and are included with ‘rank’>0 in thetotal matched-source catalogue. The relative number of UV sourceswith multiple optical matches, shown in Fig. 3, increases towardslow Galactic latitudes, as expected. The figure refers to our final cat-alogue with match radius of 3 arcsec, and point-like sources only:approximately 10 per cent of the UV sources have more than oneoptical counterpart, at intermediate and high Galactic latitudes, in
Figure 3. Fraction of UV sources having multiple optical matches withina 3 arcsec match radius, as a function of Galactic latitude. Green dots showMIS data, blue dots show AIS data, divided in strips of 1◦ (small dots), aswell as averaged over 5◦ (blue circles). The increase towards the Galacticplane reflects the higher density of optical sources at low MW latitudes. Theplot also shows a slight North–South asymmetry. The fractions shown arefor point-like sources, with error cuts of 0.3 mag. The fraction increases ifa larger match radius is used. The red dots are the incidence of spuriousmatches (see text).
C© 2010 The Authors, MNRAS 411, 2770–2791Monthly Notices of the Royal Astronomical Society C© 2010 RAS
Dow
nloaded from https://academ
ic.oup.com/m
nras/article/411/4/2770/983368 by guest on 13 July 2022
Hot white dwarfs: UV catalogues 2775
agreement with our previous work on earlier data releases whichcovered mainly high Galactic latitudes (Bianchi et al. 2005, 2007a).The fraction increases to slightly over 20 per cent for latitudes |b|≈ 10◦–20◦, reflecting the higher density of stars in the MW disc,and is still very uncertain at latitudes |b| < 10◦, where we have littlearea coverage. For a larger match radius (4.2 arcsec), the fraction ofmultiple matches increases significantly, relative to the total numberof matches, and so does the incidence of spurious matches (Sec-tion 2.3.3), therefore we adopted a final match radius of 3 arcsec inour catalogue. The fraction is also higher if extended sources areincluded.
2.3.2 Other caveats
In the interest of others who may want to apply the same proce-dures, we also mention that, due to the large current area coverageand consequent large number of sources, when it is necessary toperform the searches on small contiguous portions of the sky (e.g.1◦ strips), it may happen that the coordinates of a GALEX UVsource fall in one strip (close to the latitude limit), and the SDSSmatch falls in the next latitude range, due to a small difference incoordinates. Such cases are included in the final catalogues in thelatitude range which is appropriate according to the position of theGALEX source. Care should also be taken when using the Galacticcoordinates as returned by the GALEX data base, as those coordi-nates differ by �0.5 arcsec from those derived by converting theGALEX RA, Dec. coordinates to Galactic coordinates using stan-dard astronomical packages (e.g. WCSTools from the SmithsonianAstrophysical Observatory). These differences probably arise be-cause the GALEX data base stores Galactic coordinates using realdata types, while using double precision data types to store RA andDec. values. Therefore, sorting GALEX search results based on theGalactic coordinates returned by the data base may give differentresults than using WCSTools to derive those coordinates from theGALEX RA and Dec.
Another contingency that must be tested for, in the above proce-dures, is whether a given SDSS source matches multiple GALEXsources. This can occur if an SDSS source lies somewhere in be-tween two GALEX sources which were deemed unique. In this case,the match query returns a match of each of the GALEX sources withthe same SDSS object. We retain the match with the GALEX sourcewhich is the closest to the SDSS source, and eliminate the other.This occurs rarely.
2.3.3 Spurious matches
The probability of spurious matches was estimated as follows. Werandomly selected 30 per cent of the coordinates from our matchedGALEX-SDSS catalogues (in separate 5◦ bins of Galactic latitude),and searched the SDSS data base against coordinates offset by0.5 arcmin from those of the real sources. The spurious matchrate, shown in Fig. 3 (red dots), is the number of incidenceswhere one or more matches were found (within a search radiusof 3 arcsec) divided by the number of uploaded coordinates. Asfor the multiple matches, it is higher towards the Galactic plane,where the stellar density increases and therefore also the proba-bility of random matches within a given radius. The rate is of theorder of a few per cent at high and intermediate latitudes. How-ever, matches that are positional coincidences are likely to haveodd colours and the fraction may be lower in selected analysissamples.
2.3.4 Comparison with other catalogues
We point out, in the interest of users of our catalogues, that thereare several differences from other basic matched source cataloguesposted on MAST. Most notably, we include only the central 1◦ di-ameter portion of the field, therefore we conservatively eliminate alledge sources (mostly defects or bad measurements but also somegood sources), but we retain all good portions. Secondly, we con-sider all existing measurements for each source, from which thebest is chosen. For example, the matched catalogue described byBudavari et al. (2009) instead eliminates overlap by reducing eachGALEX field to a hexagon (selection of primary). In this proce-dure, the vertices of the hexagons include sources near the edge(i.e. possibly also sources with poor photometry, and artefacts).Moreover, since the hexagons are fixed at nominal positions, butthe actual pointings may differ, unnecessary gaps between fields(which may not exist in the actual observations) are introduced,as the authors point out. Our partition, described in Section 2.4,and following Bianchi et al. (2007b), avoids such problems andenables better and more homogeneous photometry quality, as wellas easy and precise calculations of the unique-area coverage for ourGALEX surveys, and of overlap area with any other survey, consis-tent with the actual source catalogue rather than with nominal fieldcentres. This is preferable for our analysis. Such differences maycause samples selected from different matched catalogues, to differslightly.
2.4 Area coverage
In order to derive the density of sources extracted from our cata-logues, we computed the total areas of unique coverage, taking intoaccount overlap between fields, in the GALEX GR5, and then thearea overlapping with SDSS DR7, following the method of Bianchiet al. (2007b). Since we restricted the catalogues to sources withinthe central 1◦ of the GALEX field, for each field we considered aneffective radius of 0.◦5. Our code scans the entire sky and calculatesthe unique area covered by the GALEX fields, and the portion of thisarea covered also by the SDSS. First, the whole sky is divided insmall, approximately square, tassels, along Galactic longitude andlatitude. We used steps in l,b of 0.05/0.◦1 for MIS/AIS, respectively.Then, we find the distance between the centre of each tassel in ourwhole-sky grid and the centre of each GALEX field, and sum theareas of the tassels that are within half degree of a field centre,avoiding to count the same tassel twice, which eliminates overlapbetween fields.
The error in the estimated area depends on the step used tocalculate the grid of tassels (tassel size), and the number of tassels.The area of each tassel decreases at high latitudes (the step in l,b iskept constant over the whole sky), hence the statistical error due tothe tassels along the field’s edge (i.e. tassels that fall partly insideand partly outside the 1◦ circle of a GALEX field) varies with thelocation of the fields, both with latitude and with the relative locationof the field centre to a grid step. Such errors cancel out statisticallyfor a large number of fields. For a very small area however, i.e.for a few fields, it is desirable to use smaller tassels. We estimatethe uncertainty by computing the areas several times, each timeoffsetting the positions of the GALEX field centres by about halfthe size of a tassel, in both latitude and longitude directions. Theresulting uncertainty is �1 deg2, for our total area and the areas ofeach latitude bin.
C© 2010 The Authors, MNRAS 411, 2770–2791Monthly Notices of the Royal Astronomical Society C© 2010 RAS
Dow
nloaded from https://academ
ic.oup.com/m
nras/article/411/4/2770/983368 by guest on 13 July 2022
2776 L. Bianchi et al.
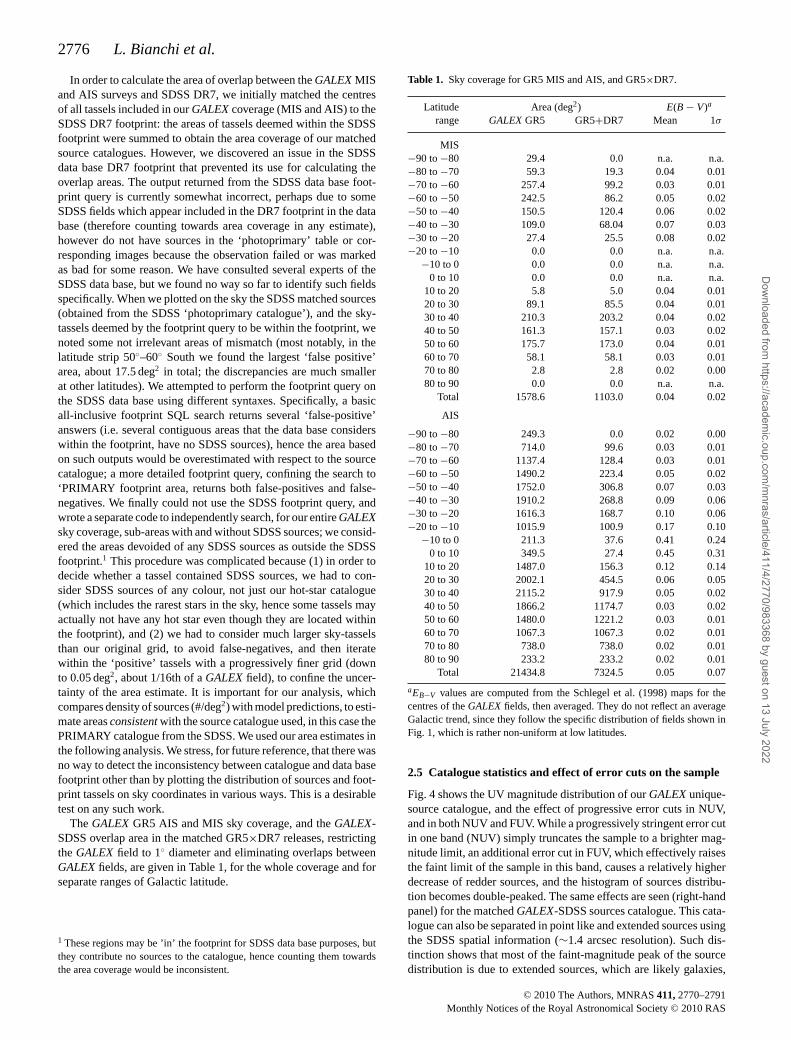
In order to calculate the area of overlap between the GALEX MISand AIS surveys and SDSS DR7, we initially matched the centresof all tassels included in our GALEX coverage (MIS and AIS) to theSDSS DR7 footprint: the areas of tassels deemed within the SDSSfootprint were summed to obtain the area coverage of our matchedsource catalogues. However, we discovered an issue in the SDSSdata base DR7 footprint that prevented its use for calculating theoverlap areas. The output returned from the SDSS data base foot-print query is currently somewhat incorrect, perhaps due to someSDSS fields which appear included in the DR7 footprint in the database (therefore counting towards area coverage in any estimate),however do not have sources in the ‘photoprimary’ table or cor-responding images because the observation failed or was markedas bad for some reason. We have consulted several experts of theSDSS data base, but we found no way so far to identify such fieldsspecifically. When we plotted on the sky the SDSS matched sources(obtained from the SDSS ‘photoprimary catalogue’), and the sky-tassels deemed by the footprint query to be within the footprint, wenoted some not irrelevant areas of mismatch (most notably, in thelatitude strip 50◦–60◦ South we found the largest ‘false positive’area, about 17.5 deg2 in total; the discrepancies are much smallerat other latitudes). We attempted to perform the footprint query onthe SDSS data base using different syntaxes. Specifically, a basicall-inclusive footprint SQL search returns several ‘false-positive’answers (i.e. several contiguous areas that the data base considerswithin the footprint, have no SDSS sources), hence the area basedon such outputs would be overestimated with respect to the sourcecatalogue; a more detailed footprint query, confining the search to‘PRIMARY footprint area, returns both false-positives and false-negatives. We finally could not use the SDSS footprint query, andwrote a separate code to independently search, for our entire GALEXsky coverage, sub-areas with and without SDSS sources; we consid-ered the areas devoided of any SDSS sources as outside the SDSSfootprint.1 This procedure was complicated because (1) in order todecide whether a tassel contained SDSS sources, we had to con-sider SDSS sources of any colour, not just our hot-star catalogue(which includes the rarest stars in the sky, hence some tassels mayactually not have any hot star even though they are located withinthe footprint), and (2) we had to consider much larger sky-tasselsthan our original grid, to avoid false-negatives, and then iteratewithin the ‘positive’ tassels with a progressively finer grid (downto 0.05 deg2, about 1/16th of a GALEX field), to confine the uncer-tainty of the area estimate. It is important for our analysis, whichcompares density of sources (#/deg2) with model predictions, to esti-mate areas consistent with the source catalogue used, in this case thePRIMARY catalogue from the SDSS. We used our area estimates inthe following analysis. We stress, for future reference, that there wasno way to detect the inconsistency between catalogue and data basefootprint other than by plotting the distribution of sources and foot-print tassels on sky coordinates in various ways. This is a desirabletest on any such work.
The GALEX GR5 AIS and MIS sky coverage, and the GALEX-SDSS overlap area in the matched GR5×DR7 releases, restrictingthe GALEX field to 1◦ diameter and eliminating overlaps betweenGALEX fields, are given in Table 1, for the whole coverage and forseparate ranges of Galactic latitude.
1 These regions may be ’in’ the footprint for SDSS data base purposes, butthey contribute no sources to the catalogue, hence counting them towardsthe area coverage would be inconsistent.
Table 1. Sky coverage for GR5 MIS and AIS, and GR5×DR7.
Latitude Area (deg2) E(B − V)a
range GALEX GR5 GR5+DR7 Mean 1σ
MIS−90 to −80 29.4 0.0 n.a. n.a.−80 to −70 59.3 19.3 0.04 0.01−70 to −60 257.4 99.2 0.03 0.01−60 to −50 242.5 86.2 0.05 0.02−50 to −40 150.5 120.4 0.06 0.02−40 to −30 109.0 68.04 0.07 0.03−30 to −20 27.4 25.5 0.08 0.02−20 to −10 0.0 0.0 n.a. n.a.
−10 to 0 0.0 0.0 n.a. n.a.0 to 10 0.0 0.0 n.a. n.a.
10 to 20 5.8 5.0 0.04 0.0120 to 30 89.1 85.5 0.04 0.0130 to 40 210.3 203.2 0.04 0.0240 to 50 161.3 157.1 0.03 0.0250 to 60 175.7 173.0 0.04 0.0160 to 70 58.1 58.1 0.03 0.0170 to 80 2.8 2.8 0.02 0.0080 to 90 0.0 0.0 n.a. n.a.
Total 1578.6 1103.0 0.04 0.02
AIS
−90 to −80 249.3 0.0 0.02 0.00−80 to −70 714.0 99.6 0.03 0.01−70 to −60 1137.4 128.4 0.03 0.01−60 to −50 1490.2 223.4 0.05 0.02−50 to −40 1752.0 306.8 0.07 0.03−40 to −30 1910.2 268.8 0.09 0.06−30 to −20 1616.3 168.7 0.10 0.06−20 to −10 1015.9 100.9 0.17 0.10
−10 to 0 211.3 37.6 0.41 0.240 to 10 349.5 27.4 0.45 0.31
10 to 20 1487.0 156.3 0.12 0.1420 to 30 2002.1 454.5 0.06 0.0530 to 40 2115.2 917.9 0.05 0.0240 to 50 1866.2 1174.7 0.03 0.0250 to 60 1480.0 1221.2 0.03 0.0160 to 70 1067.3 1067.3 0.02 0.0170 to 80 738.0 738.0 0.02 0.0180 to 90 233.2 233.2 0.02 0.01
Total 21434.8 7324.5 0.05 0.07
aEB−V values are computed from the Schlegel et al. (1998) maps for thecentres of the GALEX fields, then averaged. They do not reflect an averageGalactic trend, since they follow the specific distribution of fields shown inFig. 1, which is rather non-uniform at low latitudes.
2.5 Catalogue statistics and effect of error cuts on the sample
Fig. 4 shows the UV magnitude distribution of our GALEX unique-source catalogue, and the effect of progressive error cuts in NUV,and in both NUV and FUV. While a progressively stringent error cutin one band (NUV) simply truncates the sample to a brighter mag-nitude limit, an additional error cut in FUV, which effectively raisesthe faint limit of the sample in this band, causes a relatively higherdecrease of redder sources, and the histogram of sources distribu-tion becomes double-peaked. The same effects are seen (right-handpanel) for the matched GALEX-SDSS sources catalogue. This cata-logue can also be separated in point like and extended sources usingthe SDSS spatial information (∼1.4 arcsec resolution). Such dis-tinction shows that most of the faint-magnitude peak of the sourcedistribution is due to extended sources, which are likely galaxies,
C© 2010 The Authors, MNRAS 411, 2770–2791Monthly Notices of the Royal Astronomical Society C© 2010 RAS
Dow
nloaded from https://academ
ic.oup.com/m
nras/article/411/4/2770/983368 by guest on 13 July 2022

Hot white dwarfs: UV catalogues 2777
Figure 4. Distribution of UV sources in NUV magnitudes, and effects of error cuts and colour cuts. Left: the whole catalogue of GALEX unique sources(MIS), described in Section 2.2, with progressive error cuts in NUV, and in both FUV and NUV. A more stringent NUV error cut simply causes a brightercut-off at the faint end, as expected, while the requirement of significant detection (or good photometry) also in FUV modifies the overall distribution (‘redder’sources being eliminated), which becomes double-peaked. The distribution of the ‘bluest’ sources (FUV−NUV <−0.13), which include hot stars (this paper)and some QSOs (Bianchi et al. 2009a), is also shown. Right: NUV magnitude distribution of the matched UV-optical sources. Here, we also use the spatialinformation from the optical data, to separate point-sources (eliminating most galaxies, but not QSOs with a high contrast between the central source and theunderlying galaxy). The point-like sources with FUV−NUV <−0.13 and FUV, NUV error �0.3 mag (solid orange line) are the hot-star candidate sampleanalysed in this paper, and the green histogram are the ‘single’ hot stars. The figure, with the analysis in Section 4, shows that a potential halo component(NUV ∼ 24–25 mag) is eliminated by our error cut at the current survey’s depth; on the other hand, including objects with larger errors would cause our colourselection to include low-z QSOs.
as can be expected (e.g. Bianchi 2009). The most restricted samplein the right-panel histograms, the point-like matched sources witherror �0.3 mag in both FUV and NUV, and FUV−NUV <−0.13,are the subject of this paper; it contains mostly hot-star candi-dates (Teff > approximately 18 000 K), with some contaminationby QSOs at faint magnitudes and red optical colours, discussed inSection 3.2 (see also Bianchi et al. 2009a).
The analysis of the hot-star sample with MW models (see later)shows that the magnitude limit introduced by our error cut of�0.3 mag eliminates mostly halo and thick-disc MW stars from thesample (between the green solid and dashed lines on the right-handpanel). On the other hand, including sources with larger photomet-ric errors would introduce significant contamination of the sampleby non-stellar objects (see Fig. 5).
More statistical analysis of the catalogues, and discussion ofpotential biases in flux-limited sample selection, is given by Bianchiet al. (2010).
3 SE LEC TION OF HOT STARS
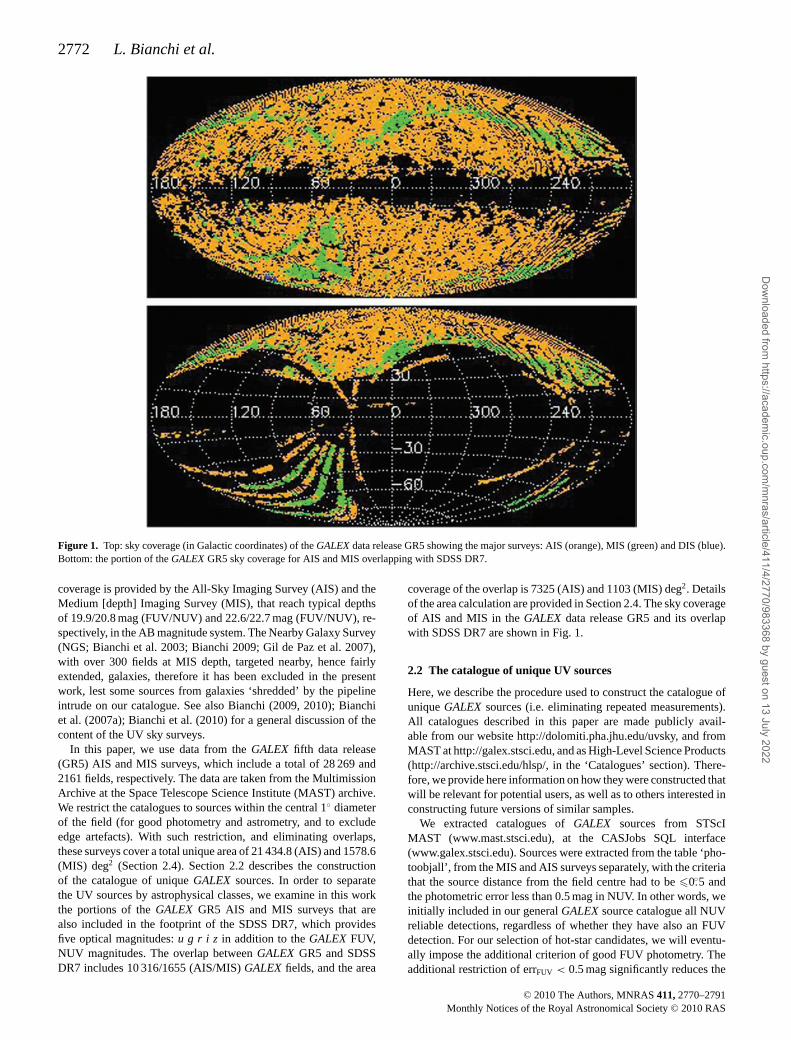
The matched GALEX-SDSS sources in our catalogues are shown incolour–colour diagrams in Fig. 5 as density plots. Model colours formajor classes of astrophysical objects are also shown to guide theeye in interpreting the distribution of sources. We refer to Bianchiet al. (2009a) and references therein for other similar figures anddescription of the model colours.
We selected hot stellar candidates by extracting the matchedpoint-like sources with FUV−NUV <−0.13 (in the AB magni-tude system), which corresponds to stars hotter than ≈18 000 K, theprecise Teff depending on the stellar gravity, and on the model atmo-spheres adopted (discussed later).2 This FUV−NUV limit was cho-
2 The measured colours also depend on extinction, however for a MW-type dust, with RV = 3.1, and moderate reddening amounts, the GALEX
sen to largely exclude all extragalactic objects, based on colours de-rived from canonical templates of QSOs and galaxies (e.g. Bianchi2009 and references therein; see also Fig. 5).
As shown by Fig. 5 in this work, and by fig. 7 (lower pan-els) of Bianchi et al. (2007a), at AIS depth (∼21th mag) sourceswith FUV−NUV <−0.13 have very little contamination by ex-tragalactic objects, but at fainter magnitudes a number of QSOsand galaxies with extremely ‘blue’ FUV-NUV colours is found.Bianchi et al. (2009a) have examined the nature of such uncommonQSOs, and their figs 1 and 2 show the location of these objectsin the colour–colour diagrams. These QSOs have extremely ‘blue’FUV−NUV (more negative than typical QSOs at any redshift), butoptical colours typical of QSOs and galaxies. Therefore, they over-lap, in UV–optical colour–colour diagrams, with the locus of hotstars with a cool companion, i.e. hot stars having very blue (i.e.negative) FUV−NUV colour but optical colours redder than whattheir FUV−NUV would imply for a single hot source. We discussthe QSO contamination in Section 3.2.
We restricted the catalogue to sources with photometric errors�0.3 mag in both FUV and NUV. Fig. 4, previously discussed, andTable 2 in this work show the effect of the error cuts on the sample’sstatistics. We additionally use one optical band (r) to separate thehot sources in ‘single’ star candidates, having colour NUV−r <
0.1, and ‘binary’ candidates having NUV−r > 0.1. In more detail,the NUV−r boundary between single and binary hot stars has acomplex dependence on stellar Teff and radii of the binary pair,which we will address in a different work. For example, a hotWD with an A-type companion, and pairs with small mass ratios,
FUV-NUV colour is basically reddening free. In fact, the higher selectiveextinction Aλ/EB−V in the FUV range is approximately equalled by theeffect of the broad 2175 Å feature in the NUV range (see Fig. 2 and Bianchi2009). The absorption in each UV band, however, is much higher than inoptical bands.
C© 2010 The Authors, MNRAS 411, 2770–2791Monthly Notices of the Royal Astronomical Society C© 2010 RAS
Dow
nloaded from https://academ
ic.oup.com/m
nras/article/411/4/2770/983368 by guest on 13 July 2022

2778 L. Bianchi et al.
Figure 5. Colour–colour diagrams for the GALEX UV sources matched to SDSS sources, at AIS and MIS depth. Blue/black densities are point-like/extendedsources, respectively. Model colours for stars (Teff sequence, for different gravities), QSO (redshift sequence, cyan) and galaxies (age sequences, green)are shown. The two purple stellar sequences (label ‘WD’) in the right-side panel are for log g = 9.0 and 7.0. Although gravity cannot be separated wellphotometrically at high Teff s, the vast majority of hot stellar sources are clustered in between these two model sequences, and much fewer are seen alongthe log g = 5 and 3 (red and yellow) sequences at hot temperatures, as expected. In the ≈2.5 mag shallower AIS survey the relative number of stars andextragalactic objects is comparable, while at MIS depth the latter dominate. From such diagrams the hot-star samples are selected (see text), with colour cutsshown by the green lines in the left-hand plot.
will fall in the colour selection of our ‘single’ hot-star sample.The adopted value is a useful cut to eliminate most extragalacticsources contaminating our FUV−NUV <−0.13 sample, as theyhave NUV−r > 0.1, however it is obviously an oversimplificationfor a detailed study of binaries. In sum, our so-called (for simplicity)‘binary’ sample includes stellar pairs with a hot WD and a coolerstar, and some QSOs; the ‘single’ sample includes all single starsand some binaries. We impose no error cut on the r magnitudes, inorder to not limit the sample of the hottest WDs, which are faintat optical wavelengths. If the restriction of error � 0.3 mag wereimposed to the rband, the density of objects in the MIS samplewould be reduced by about 30 per cent (GALEX is ‘deeper’ thanSDSS for very hot stars of low luminosity, see Section 3.1); the losswould be much smaller for the brighter AIS sample.
The density of hot-star candidates is shown in Fig. 6 and willbe discussed later. The magnitude distribution of the total hot-starcandidate sample (FUV−NUV <−0.13) is shown with shadowedhistograms in Fig. 8 and beyond, and the ‘single’ hot-star candi-dates (FUV−NUV <−0.13 and NUV−r < 0.1) with solid-colourhistograms.
3.1 Hot stars not detected by SDSS
While the SDSS depth of 22.3/23.3/23.1/22.3/20.8 AB magnitude inu,g,r,i,z provides a fairly complete match to the AIS UV source cata-logue, the hottest, smallest stars detected in the MIS may fall belowthe SDSS limit. This can be guessed by comparing in Figs 8, 10, 12the green-dashed histogram (matched GALEX-SDSS sources withFUV−NUV <−0.13) with the light-green filled-colour histogram(matched sources with FUV−NUV<−0.13 and NUV−r < 0.1, i.e.‘single’ hot stars). The hottest single WDs will be faintest at opticalwavelengths (e.g. a star with log g = 9 and Teff = 50 000/100 000 Kwould have FUV−r = −2.33/−2.61 in AB magnitude, accordingto our TLUSTY model grids). Therefore, hot WDs still detectablein UV at the depth of our MIS sample (see Fig. 4) may be belowthe SDSS detection limit, while hot WDs with an optically brighter
binary companion or QSOs, which have redder UV-optical colours,will be detectable also in the SDSS imaging. This explains why thedensity of MIS ‘single’ hot matched sources (light-green) drops atfaint magnitudes earlier than the dashed-green histogram, the dif-ference between the two being larger than what can be ascribed toQSO contamination (Section 3.2).
In order to estimate the incompleteness of faint hot-WD countsin our matched sample, we searched for GALEX MIS sources withFUV−NUV <−0.13 that are within the SDSS DR7 footprint, butdo not have SDSS counterpart. We found ≈1500 such sources, hav-ing no optical match in our catalogue with a match radius of 3 arcsec(Section 2.3). We performed a number of tests to verify if these arereal sources. We matched them against the SDSS catalogue, extend-ing the match radius to 6 arcsec, and found 399 additional matches,138 of them are classified as ‘point-like’ sources at the SDSS res-olution. These mostly appear to be actual sources in the images,although we note that for faint sources, the SDSS classificationof ‘extended’ and ‘point like’ is not always reliable, as shown byBianchi et al. (2009a). It is expected that a small number of sourcesmay have optical coordinates differing by more than 3 arcsec fromthe UV position; sometimes this is due to a nearby source not fullyresolved. For the remaining 1100 UV sources with no SDSS matchout to 6 arcsec, visual inspection of random subsamples revealedsome to be part of extended cirrus emission, many seem likelysources, a few cases are parts of a shredded galaxy. The ‘kron ra-dius’ from the GALEX pipeline gives an indication of the spatialextent of the source: 189 sources have kron radius larger than 3.5,hence are probably not stellar sources, but visual inspection sug-gests about 75 per cent of them to be real sources. Even visualinspection, however, is not always conclusive, for faint sources orcomplicated fields, and better resolution or deeper exposures wouldbe needed for a final sample. In sum, a very large fraction of the1500 objects unmatched within 3 arcsec are actual sources, and anundetermined fraction may be actual hot stars.
In spite of the large uncertainties, we added all these objects tothe ‘single’ hot matched sources catalogue, and show the total as
C© 2010 The Authors, MNRAS 411, 2770–2791Monthly Notices of the Royal Astronomical Society C© 2010 RAS
Dow
nloaded from https://academ
ic.oup.com/m
nras/article/411/4/2770/983368 by guest on 13 July 2022
Hot white dwarfs: UV catalogues 2779
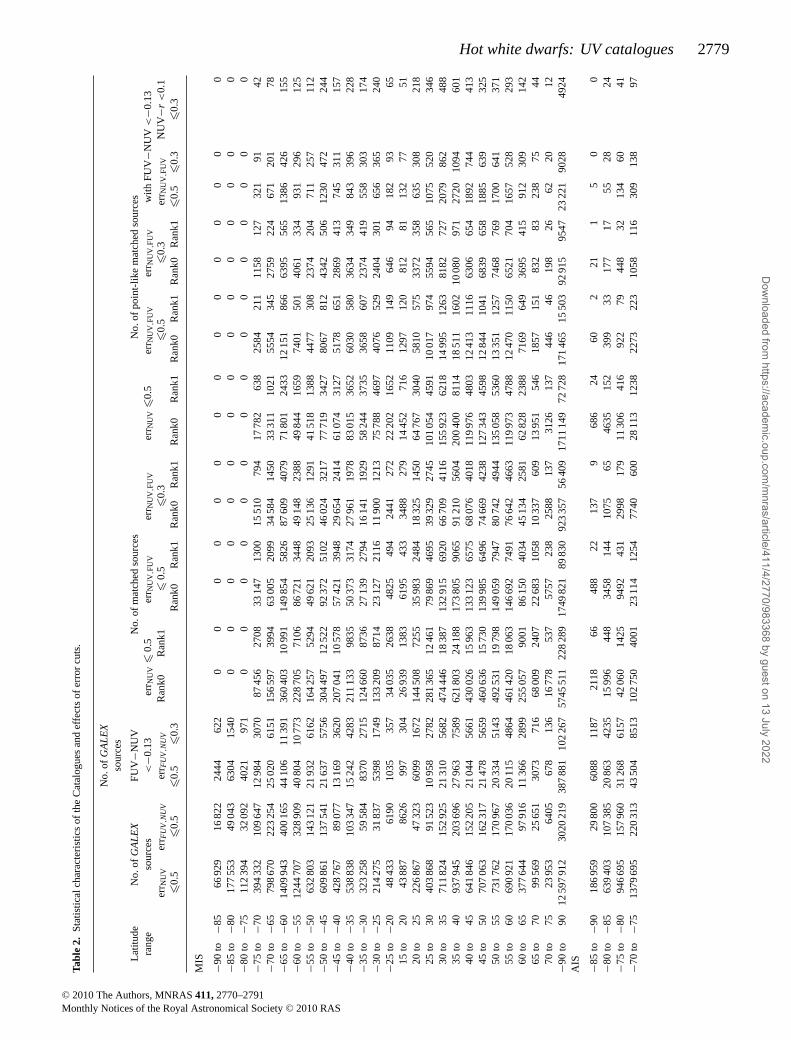
Tabl
e2.
Stat
istic
alch
arac
teri
stic
sof
the
Cat
alog
ues
and
effe
cts
ofer
ror
cuts
.
No.
ofG
ALE
Xso
urce
s
Lat
itude
No.
ofG
ALE
XFU
V−N
UV
No.
ofm
atch
edso
urce
sN
o.of
poin
t-lik
em
atch
edso
urce
sra
nge
sour
ces
<−0
.13
err N
UV
�0.
5er
r NU
V,F
UV
err N
UV
,FU
Ver
r NU
V�
0.5
err N
UV
,FU
Ver
r NU
V,F
UV
with
FUV
−NU
V<
−0.1
3er
r NU
Ver
r FU
V,N
UV
err F
UV
,NU
VR
ank0
Ran
k1�
0.5
�0.
3�
0.5
�0.
3er
r NU
V,F
UV
NU
V−r
<0.
1�
0.5
�0.
5�
0.5
�0.
3R
ank0
Ran
k1R
ank0
Ran
k1R
ank0
Ran
k1R
ank0
Ran
k1R
ank0
Ran
k1�
0.5
�0.
3�
0.3
MIS
−90
to−8
566
929
1682
224
4462
20
00
00
00
00
00
00
00
−85
to−8
017
755
349
043
6304
1540
00
00
00
00
00
00
00
0−8
0to
−75
112
394
3209
240
2197
10
00
00
00
00
00
00
00
−75
to−7
039
433
210
964
712
984
3070
8745
627
0833
147
1300
1551
079
417
782
638
2584
211
1158
127
321
9142
−70
to−6
579
867
022
325
425
020
6151
156
597
3994
6300
520
9934
584
1450
3331
110
2155
5434
527
5922
467
120
178
−65
to−6
014
0994
340
016
544
106
1139
136
040
310
991
149
854
5826
8760
940
7971
801
2433
1215
186
663
9556
513
8642
615
5−6
0to
−55
1244
707
328
909
4080
410
773
228
705
7106
8672
134
4849
148
2388
4984
416
5974
0150
140
6133
493
129
612
5−5
5to
−50
632
803
143
121
2193
261
6216
425
752
9449
621
2093
2513
612
9141
518
1388
4477
308
2374
204
711
257
112
−50
to−4
560
986
113
754
121
637
5756
304
497
1252
292
372
5102
4602
432
1777
719
3427
8067
812
4342
506
1230
472
244
−45
to−4
042
876
789
077
1316
936
2020
704
110
578
5742
139
4829
654
2414
6107
431
2751
7865
128
6941
374
531
115
7−4
0to
−35
538
838
103
347
1524
242
8321
113
398
3550
373
3174
2796
119
7883
015
3652
6030
580
3634
349
843
396
228
−35
to−3
032
325
859
584
8370
2715
124
660
8736
2713
927
9416
141
1929
5824
437
3536
5860
723
7441
955
830
317
4−3
0to
−25
214
275
3183
753
9817
4913
320
987
1423
127
2116
1190
012
1375
788
4697
4076
529
2404
301
656
365
240
−25
to−2
048
433
6190
1035
357
3403
526
3848
2549
424
4127
222
202
1652
1109
149
646
9418
293
6515
to20
4388
786
2699
730
426
939
1383
6195
433
3488
279
1445
271
612
9712
081
281
132
7751
20to
2522
686
747
323
6099
1672
144
508
7255
3598
324
8418
325
1450
6476
730
4058
1057
533
7235
863
530
821
825
to30
403
868
9152
310
958
2782
281
365
1246
179
869
4695
3932
927
4510
105
445
9110
017
974
5594
565
1075
520
346
30to
3571
182
415
292
521
310
5682
474
446
1838
713
291
569
2066
709
4116
155
923
6218
1499
512
6381
8272
720
7986
248
835
to40
937
945
203
696
2796
375
8962
180
324
188
173
805
9065
9121
056
0420
040
081
1418
511
1602
1008
097
127
2010
9460
140
to45
641
846
152
205
2104
456
6143
002
615
963
133
123
6575
6807
640
1811
997
648
0312
413
1116
6306
654
1892
744
413
45to
5070
706
316
231
721
478
5659
460
636
1573
013
998
564
9674
669
4238
127
343
4598
1284
410
4168
3965
818
8563
932
550
to55
731
762
170
967
2033
451
4349
253
119
798
149
059
7947
8074
249
4413
505
853
6013
351
1257
7468
769
1700
641
371
55to
6069
092
117
003
620
115
4864
461
420
1806
314
669
274
9176
642
4663
119
973
4788
1247
011
5065
2170
416
5752
829
360
to65
377
644
9791
611
366
2899
255
057
9001
8615
040
3445
134
2581
6282
823
8871
6964
936
9541
591
230
914
265
to70
9956
925
651
3073
716
6800
924
0722
683
1058
1033
760
913
951
546
1857
151
832
8323
875
4470
to75
2395
364
0567
813
616
778
537
5757
238
2588
137
3126
137
446
4619
826
6220
12−9
0to
9012
597
912
3020
219
387
881
102
267
5745
511
228
289
1749
821
8983
092
335
756
409
1711
149
7272
817
146
515
503
9291
595
4723
221
9028
4924
AIS −8
5to
−90
186
959
2980
060
8811
8721
1866
488
2213
79
686
2460
221
15
00
−80
to−8
563
940
310
738
520
863
4235
1599
644
834
5814
410
7565
4635
152
399
3317
717
5528
24−7
5to
−80
946
695
157
960
3126
861
5742
060
1425
9492
431
2998
179
1130
641
692
279
448
3213
460
41−7
0to
−75
1379
695
220
313
4350
485
1310
275
040
0123
114
1254
7740
600
2811
312
3822
7322
310
5811
630
913
897
C© 2010 The Authors, MNRAS 411, 2770–2791Monthly Notices of the Royal Astronomical Society C© 2010 RAS
Dow
nloaded from https://academ
ic.oup.com/m
nras/article/411/4/2770/983368 by guest on 13 July 2022

2780 L. Bianchi et al.Ta
ble
2–
cont
inue
d
No.
ofG
ALE
Xso
urce
s
Lat
itude
No.
ofG
ALE
XFU
V−N
UV
No.
ofm
atch
edso
urce
sN
o.of
poin
t-lik
em
atch
edso
urce
sra
nge
sour
ces
<−0
.13
err N
UV
�0.
5er
r NU
V,F
UV
err N
UV
,FU
Ver
r NU
V�
0.5
err N
UV
,FU
Ver
r NU
V,F
UV
with
FUV
−NU
V<
−0.1
3er
r NU
Ver
r FU
V,N
UV
err F
UV
,NU
VR
ank0
Ran
k1�
0.5
�0.
3�
0.5
�0.
3er
r NU
V,F
UV
NU
V−r
<0.
1�
0.5
�0.
5�
0.5
�0.
3R
ank0
Ran
k1R
ank0
Ran
k1R
ank0
Ran
k1R
ank0
Ran
k1R
ank0
Ran
k1�
0.5
�0.
3�
0.3
−65
to−7
017
7902
526
723
453
565
1032
910
440
636
7024
373
1188
8059
514
2890
711
1424
6422
110
7010
235
014
199
−60
to−6
518
2329
827
372
354
203
1065
015
159
260
6834
985
1981
1155
694
444
240
1714
3466
342
1584
181
489
233
176
−55
to−6
022
0242
530
945
062
380
1261
014
942
466
1629
732
1895
9752
819
5082
221
4835
8035
517
0016
853
729
421
4−5
0to
−55
2221
574
260
072
5581
311
764
137
391
6620
2159
116
4072
5173
256
334
2497
3270
348
1589
154
553
331
234
−45
to−5
025
2600
727
154
459
711
1280
519
582
110
880
2908
526
6510
396
1253
8113
143
0944
3356
222
2127
780
147
333
8−4
0to
−45
2644
017
259
939
5914
214
759
157
644
1224
820
715
3038
7274
1400
7924
953
9037
0868
018
0834
175
844
130
2−3
5to
−40
2824
496
243
813
5533
213
542
243
682
1544
628
209
3371
9899
1562
133
778
7605
5717
831
2900
417
1208
725
501
−30
to−3
530
2290
525
112
653
008
1453
517
113
214
681
1491
929
7755
7913
9511
251
479
6941
4885
721
7545
493
857
039
4−2
5to
−30
2725
467
171
367
3930
612
449
219
113
2049
115
759
3593
6299
1665
159
944
1226
354
2311
5429
7857
113
3082
961
1−2
0to
−25
2565
319
121
358
2999
711
039
158
390
1901
278
3222
5535
6311
1613
352
113
447
4060
922
2233
504
1037
650
476
−15
to−2
022
9473
890
915
2177
597
4810
499
913
902
4288
1362
2245
739
9413
510
745
2685
665
1536
384
660
406
291
−10
to−1
514
7412
654
091
1168
260
2610
744
114
988
4086
1142
2582
762
102
078
1282
132
3573
620
4851
160
735
023
1−5
to−1
046
873
520
256
3196
1719
1589
326
9083
422
454
714
715
334
2358
707
158
441
102
7739
220
to−5
8179
255
4433
812
60
00
00
00
00
00
00
00
5to
011
235
998
2267
332
447
3081
636
414
026
312
045
7777
434
013
324
111
337
182
10to
589
641
441
563
5055
2532
6700
910
668
4191
1170
2914
871
6478
495
7736
8392
125
2068
228
516
986
15to
1022
0974
193
883
1702
778
2513
341
520
698
6792
1979
4160
1267
124
034
1710
750
8512
0732
3080
675
845
830
120
to15
2785
094
137
819
2801
110
512
248
149
2294
622
199
3385
9760
1708
192
683
1608
883
7213
7646
1074
713
9889
268
825
to20
3078
141
180
485
3851
611
924
482
621
3464
650
125
5965
1950
427
7732
823
421
367
1428
420
1375
1010
2025
3916
0412
3030
to25
3074
765
199
400
4516
211
949
565
885
3403
959
037
6033
2086
626
2233
689
318
763
1437
418
5472
1788
527
7716
8313
0835
to30
3068
226
221
555
5083
111
949
770
294
4036
691
294
7455
3088
731
3142
058
720
138
1841
318
7990
8284
036
1521
3517
1440
to35
2827
184
215
451
5093
710
501
911
569
4368
210
949
780
9535
498
3333
459
207
2027
919
905
1846
9697
822
3899
2278
1774
45to
4028
6701
924
157
657
082
1074
211
4969
453
336
144
002
1017
245
305
4158
490
863
2148
421
555
2157
1028
498
041
7123
4518
5850
to45
2589
087
237
387
5535
196
9211
8727
153
682
158
334
1073
747
012
4333
455
468
1995
721
918
2243
1013
110
1340
1721
3916
7955
to50
2183
650
219
294
4951
186
3111
3538
451
155
165
181
1103
148
979
4336
414
632
1815
821
966
2136
9994
973
3845
1979
1556
60to
5520
3116
922
744
549
608
8489
1207
517
5516
118
725
412
923
5675
953
1739
061
117
457
2153
422
6498
5010
7135
7618
3814
1065
to60
1617
230
193
927
4137
072
2010
5837
550
788
173
459
1212
752
661
5039
332
166
1574
319
066
2203
8630
1048
3063
1531
1197
70to
6514
1933
516
894
536
062
6064
927
973
4293
415
137
610
316
4414
841
3627
812
012
937
1654
718
0874
4782
225
7813
2510
2275
to70
1204
662
135
513
2986
746
0579
248
637
015
121
558
8221
3414
731
9022
714
710
912
1319
014
9457
4967
521
2710
3379
280
to75
860
091
8848
019
796
2865
563
957
2790
678
969
5847
2102
622
3815
568
081
5886
4210
6936
6847
513
7064
551
285
to80
471
126
5966
712
490
1978
310
436
1538
153
200
3836
1475
715
1087
185
4318
5673
638
2445
290
842
401
307
90to
8516
432
220
454
4760
795
107
786
5417
1826
913
3050
9452
327
164
1384
1682
212
754
102
267
138
119
−90
to90
6526
629
158
0855
612
5328
029
079
013
704
403
753
888
1868
061
149
944
590
692
6451
059
2676
234
081
128
677
935
621
1390
4617
696
5101
228
319
2160
6
Not
e:T
heco
lum
ns‘r
ank0
’gi
veth
enu
mbe
rof
UV
sour
ces
with
one
SDSS
coun
terp
art(
with
inth
em
atch
radi
usof
3ar
csec
),an
d‘r
ank1
’of
thos
ew
ithm
ultip
leop
tical
mat
ches
.UV
sour
ces
with
mul
tiple
mat
ches
may
have
com
posi
teU
Vco
lour
s,th
eref
ore
are
excl
uded
from
the
anal
ysis
sam
ple;
thei
rex
clus
ion
isac
coun
ted
for
byco
rrec
ting
the
dens
ityof
sour
ces
by(r
ank1
/(ra
nk0+
rank
1)).
The
frac
tion
from
Col
umns
16–1
7(f
rom
whi
chou
ran
alys
issa
mpl
eis
extr
acte
d)is
plot
ted
inFi
g.3.
Num
bers
inC
olum
ns18
,19
and
20in
clud
eon
ly‘r
ank0
’so
urce
s.
C© 2010 The Authors, MNRAS 411, 2770–2791Monthly Notices of the Royal Astronomical Society C© 2010 RAS
Dow
nloaded from https://academ
ic.oup.com/m
nras/article/411/4/2770/983368 by guest on 13 July 2022
Hot white dwarfs: UV catalogues 2781
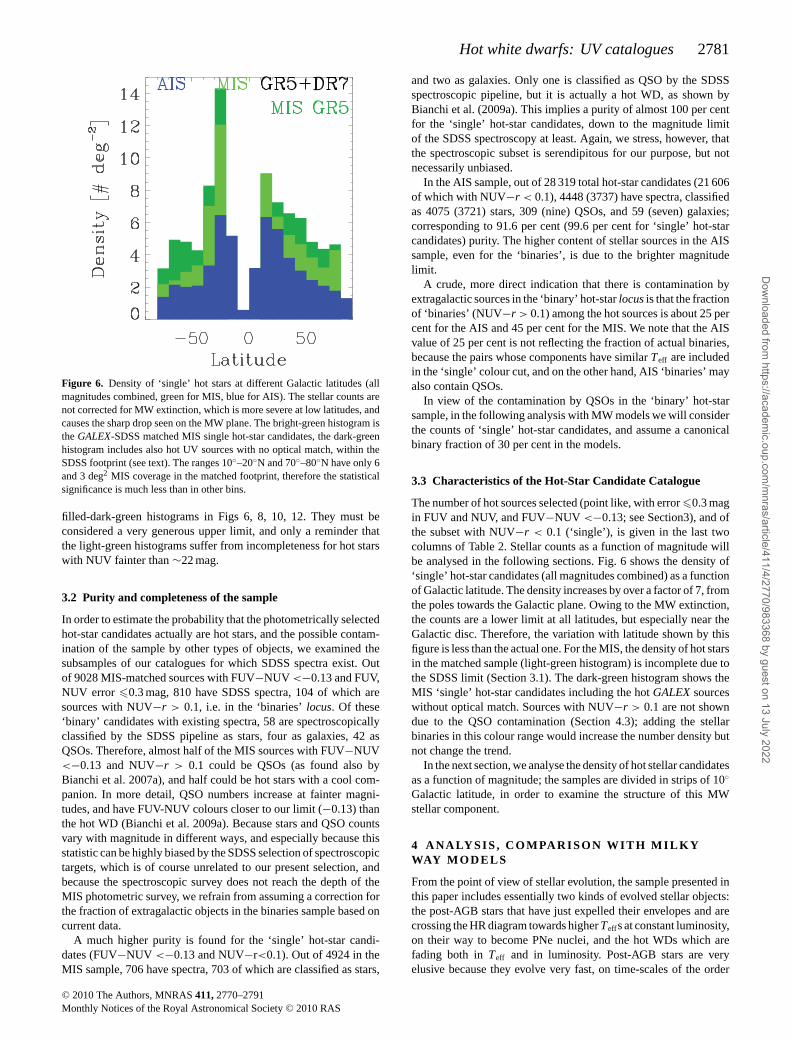
Figure 6. Density of ‘single’ hot stars at different Galactic latitudes (allmagnitudes combined, green for MIS, blue for AIS). The stellar counts arenot corrected for MW extinction, which is more severe at low latitudes, andcauses the sharp drop seen on the MW plane. The bright-green histogram isthe GALEX-SDSS matched MIS single hot-star candidates, the dark-greenhistogram includes also hot UV sources with no optical match, within theSDSS footprint (see text). The ranges 10◦–20◦N and 70◦–80◦N have only 6and 3 deg2 MIS coverage in the matched footprint, therefore the statisticalsignificance is much less than in other bins.
filled-dark-green histograms in Figs 6, 8, 10, 12. They must beconsidered a very generous upper limit, and only a reminder thatthe light-green histograms suffer from incompleteness for hot starswith NUV fainter than ∼22 mag.
3.2 Purity and completeness of the sample
In order to estimate the probability that the photometrically selectedhot-star candidates actually are hot stars, and the possible contam-ination of the sample by other types of objects, we examined thesubsamples of our catalogues for which SDSS spectra exist. Outof 9028 MIS-matched sources with FUV−NUV <−0.13 and FUV,NUV error �0.3 mag, 810 have SDSS spectra, 104 of which aresources with NUV−r > 0.1, i.e. in the ‘binaries’ locus. Of these‘binary’ candidates with existing spectra, 58 are spectroscopicallyclassified by the SDSS pipeline as stars, four as galaxies, 42 asQSOs. Therefore, almost half of the MIS sources with FUV−NUV<−0.13 and NUV−r > 0.1 could be QSOs (as found also byBianchi et al. 2007a), and half could be hot stars with a cool com-panion. In more detail, QSO numbers increase at fainter magni-tudes, and have FUV-NUV colours closer to our limit (−0.13) thanthe hot WD (Bianchi et al. 2009a). Because stars and QSO countsvary with magnitude in different ways, and especially because thisstatistic can be highly biased by the SDSS selection of spectroscopictargets, which is of course unrelated to our present selection, andbecause the spectroscopic survey does not reach the depth of theMIS photometric survey, we refrain from assuming a correction forthe fraction of extragalactic objects in the binaries sample based oncurrent data.
A much higher purity is found for the ‘single’ hot-star candi-dates (FUV−NUV <−0.13 and NUV−r<0.1). Out of 4924 in theMIS sample, 706 have spectra, 703 of which are classified as stars,
and two as galaxies. Only one is classified as QSO by the SDSSspectroscopic pipeline, but it is actually a hot WD, as shown byBianchi et al. (2009a). This implies a purity of almost 100 per centfor the ‘single’ hot-star candidates, down to the magnitude limitof the SDSS spectroscopy at least. Again, we stress, however, thatthe spectroscopic subset is serendipitous for our purpose, but notnecessarily unbiased.
In the AIS sample, out of 28 319 total hot-star candidates (21 606of which with NUV−r < 0.1), 4448 (3737) have spectra, classifiedas 4075 (3721) stars, 309 (nine) QSOs, and 59 (seven) galaxies;corresponding to 91.6 per cent (99.6 per cent for ‘single’ hot-starcandidates) purity. The higher content of stellar sources in the AISsample, even for the ‘binaries’, is due to the brighter magnitudelimit.
A crude, more direct indication that there is contamination byextragalactic sources in the ‘binary’ hot-star locus is that the fractionof ‘binaries’ (NUV−r > 0.1) among the hot sources is about 25 percent for the AIS and 45 per cent for the MIS. We note that the AISvalue of 25 per cent is not reflecting the fraction of actual binaries,because the pairs whose components have similar Teff are includedin the ‘single’ colour cut, and on the other hand, AIS ‘binaries’ mayalso contain QSOs.
In view of the contamination by QSOs in the ‘binary’ hot-starsample, in the following analysis with MW models we will considerthe counts of ‘single’ hot-star candidates, and assume a canonicalbinary fraction of 30 per cent in the models.
3.3 Characteristics of the Hot-Star Candidate Catalogue
The number of hot sources selected (point like, with error �0.3 magin FUV and NUV, and FUV−NUV <−0.13; see Section3), and ofthe subset with NUV−r < 0.1 (‘single’), is given in the last twocolumns of Table 2. Stellar counts as a function of magnitude willbe analysed in the following sections. Fig. 6 shows the density of‘single’ hot-star candidates (all magnitudes combined) as a functionof Galactic latitude. The density increases by over a factor of 7, fromthe poles towards the Galactic plane. Owing to the MW extinction,the counts are a lower limit at all latitudes, but especially near theGalactic disc. Therefore, the variation with latitude shown by thisfigure is less than the actual one. For the MIS, the density of hot starsin the matched sample (light-green histogram) is incomplete due tothe SDSS limit (Section 3.1). The dark-green histogram shows theMIS ‘single’ hot-star candidates including the hot GALEX sourceswithout optical match. Sources with NUV−r > 0.1 are not showndue to the QSO contamination (Section 4.3); adding the stellarbinaries in this colour range would increase the number density butnot change the trend.
In the next section, we analyse the density of hot stellar candidatesas a function of magnitude; the samples are divided in strips of 10◦
Galactic latitude, in order to examine the structure of this MWstellar component.
4 ANALYSI S , COMPARI SON WI TH MI LKYWAY M O D E L S
From the point of view of stellar evolution, the sample presented inthis paper includes essentially two kinds of evolved stellar objects:the post-AGB stars that have just expelled their envelopes and arecrossing the HR diagram towards higher Teffs at constant luminosity,on their way to become PNe nuclei, and the hot WDs which arefading both in Teff and in luminosity. Post-AGB stars are veryelusive because they evolve very fast, on time-scales of the order
C© 2010 The Authors, MNRAS 411, 2770–2791Monthly Notices of the Royal Astronomical Society C© 2010 RAS
Dow
nloaded from https://academ
ic.oup.com/m
nras/article/411/4/2770/983368 by guest on 13 July 2022

2782 L. Bianchi et al.
of 103–105 yr (Vassiliadis & Wood 1994). Hot WDs evolve withlonger time scales, but at significantly fainter luminosities. Both areelusive at all wavelengths except the UV. Our hot-star census basedon the UV sky surveys provides the first opportunity to examine acomprehensive, unbiased sample of such objects. Our hot post-AGBand WD candidate sample extends over a significant sky coverage,and clearly presents a disc-like distribution, concentrated towardsthe Galactic disc (Fig. 6). Such sample will be analysed in thecontext of a model for the MW geometry below.
4.1 Constraining Milky Way models
In this section we analyse the number counts and sky distributionof our hot-star candidates, using the TRILEGAL stellar populationsynthesis code (Girardi et al. 2005). TRILEGAL creates mock cat-alogues of stars belonging to the MW, and then distributes themalong the line-of-sight. It extracts the simulated stars from extendedlibraries of evolutionary tracks and synthetic stellar spectra, assum-ing reasonable prescriptions for the distributions of ages, masses andmetallicities of the MW stellar components: thin and thick discs,halo and bulge. We note here that the bulge component does notcontribute almost any source to our hot-star sample, and is thereforenot shown in the plots of our model results.
The thin-disc density, ρ thin, decreases exponentially with thegalactocentric radius, R, and as a squared hyperbolic secant functionin the direction perpendicular to the plane, z:
ρdisc = C exp(−R/hR) sech2(2 z/hz) . (1)
The scalelength is set to hR = 2800 pc, whereas the scaleheightincreases with the population age t as
hz(t) = 95 (1 + t/(4.4 Gyr))1.67 . (2)
Such an increase is necessary to describe the observed increase ofthe velocity dispersion W with age (see e.g. Holmberg, Nordstrom& Andersen 2009).
The thick disc follows the same functional form but with bothscale parameters fixed as hR = 2800 pc and hz = 800 pc. The con-stants C, for the thin and thick discs, are adjusted so that the surfacethin-disc density is equal to 59 M� pc−2, whereas the local thickdisc density is 0.0015 M� pc−3. The halo is modelled as an oblatespheroid following a deprojected r1/4 law, with a local density of0.00015 M� pc−3. Finally, the Sun is located at R = 8700 pc, z =24.2 pc.
The default parameters for the geometry of the MW componentsin TRILEGAL are calibrated to reproduce the star counts in a lo-cal sample extracted from the Hipparcos catalogue, and in severalmulti-band catalogues including the shallow, all-sky 2MASS, and afew deep surveys such as EIS-deep and DMS (Girardi et al. 2005).For regions out of the Galactic plane, i.e. for |b| > 10◦, errors in thestar counts predicted by TRILEGAL are typically of about 10 to 20per cent down to K ∼ 14 (Girardi et al., in preparation) .
The reddening is taken into account in the MW models as follows.Along a given line-of-sight, the value of E(B − V) at infinity istaken from the Schlegel, Finkbeiner & Davis (1998) maps. Thetotal extinction is then distributed along the line-of-sight as if itwere generated by an exponential dust layer with scaleheight hdust
z ;its default value is hdust
z = 110 pc. In this way, the closest simulatedstars are unreddened, whereas those at distances of a few hundredparsec are reddened by the full amount predicted by the Schlegelet al. (1998) maps.
We use a new version of TRILEGAL, which has been modifiedfor the purposes of this analysis in several ways; most of these
Figure 7. Comparison of model magnitudes (NUV) and colour (FUV-NUV)of stars with log(g) = 7.0 and 9.0, of varying Teff . Model magnitudes areconstructed from our grid of pure-H TLUSTY NLTE model spectra and fromKoester (2008) LTE models. The latter include convection, which TLUSTY(ver198) does not. Our colour cut of FUV−NUV <−0.13 corresponds toTeff ≈ 18 800/17 200 K (log (g) = 9.0/7.0) in the TLUSTY models, andto Teff = 18 000 K in solar Kurucz-model colours with log (g) = 5.0 (notshown). While TLUSTY and Koester model colours with log (g) = 7.0 agreequite well for Teff up to 26 000 K, the two grids are discrepant by ∼0.15 magfor log (g) = 9.0, where the Lyα wings are broad enough to enter the GALEXFUV band when convection is taken into account. The situation reverses athotter Teff s. A colour cut at FUV−NUV <−0.5 benefits from less scatteramong model grids, which we could take as a measure of less uncertainty,however the resulting sample (the very hottest stars) would be drasticallyreduced, and so the statistical significance.
modifications will be detailed in a subsequent paper (Zabot et al.,in preparation) . Post-AGB stars, PNe nuclei and WDs of typesDA and DB have been included using the evolutionary tracks fromVassiliadis & Wood (1994) and Althaus, Serenelli & Benvenuto(2001) and Althaus et al. (2005), together with the Koester (2008)synthetic spectra. In the present version we have considered onlythe DAs, since they are the dominant type among hot WDs (Hansen& Liebert 2003). The fraction of DBs is known to increase sig-nificantly for WDs cooler than 12 000 K, thanks to convection inthe He layers (Bergeron, Ruiz & Leggett 1997; Hansen & Liebert2003). Such cool WDs, however, are not included in our selectionof sources. The TRILEGAL code uses the Koester (2008) grids toassign magnitudes to the theoretical stars. In Fig. 7 we show a com-parison with magnitudes calculated from TLUSTY models, and inFig. 8 we compare stellar counts obtained by selecting model starsby Teff and by synthetic colours, in order to illustrate the sometimesneglected effect of the model-atmosphere uncertainties.
Following our preliminary findings of discrepancies between pre-dictions and hot-star counts based on earlier data releases (Bianchiet al. 2009b), the TRILEGAL code has been modified to also allowthe choice of IMFR independent from the prescription adopted forthe previous evolutionary phases. In this way, the mass distributionof the WDs does not need to follow the constraints imposed bythe previous TP-AGB tracks, which come from Marigo & Girardi(2007, hereafter MG07).
C© 2010 The Authors, MNRAS 411, 2770–2791Monthly Notices of the Royal Astronomical Society C© 2010 RAS
Dow
nloaded from https://academ
ic.oup.com/m
nras/article/411/4/2770/983368 by guest on 13 July 2022
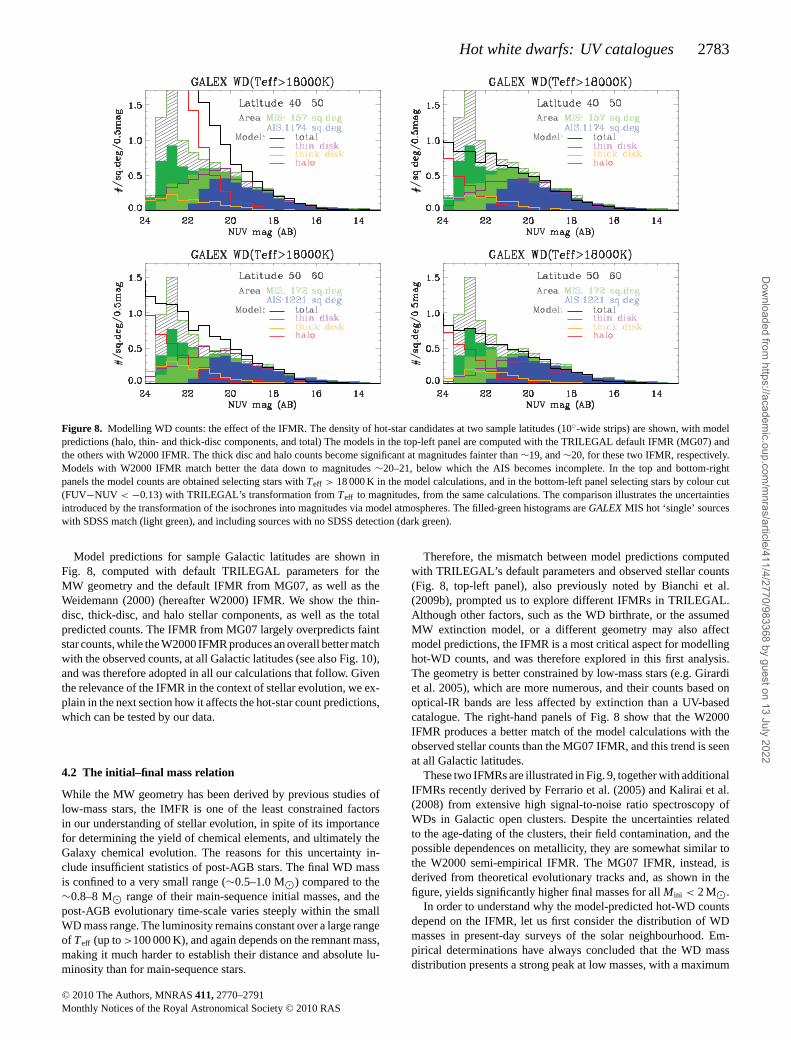
Hot white dwarfs: UV catalogues 2783
Figure 8. Modelling WD counts: the effect of the IFMR. The density of hot-star candidates at two sample latitudes (10◦-wide strips) are shown, with modelpredictions (halo, thin- and thick-disc components, and total) The models in the top-left panel are computed with the TRILEGAL default IFMR (MG07) andthe others with W2000 IFMR. The thick disc and halo counts become significant at magnitudes fainter than ∼19, and ∼20, for these two IFMR, respectively.Models with W2000 IFMR match better the data down to magnitudes ∼20–21, below which the AIS becomes incomplete. In the top and bottom-rightpanels the model counts are obtained selecting stars with Teff > 18 000 K in the model calculations, and in the bottom-left panel selecting stars by colour cut(FUV−NUV < −0.13) with TRILEGAL’s transformation from Teff to magnitudes, from the same calculations. The comparison illustrates the uncertaintiesintroduced by the transformation of the isochrones into magnitudes via model atmospheres. The filled-green histograms are GALEX MIS hot ‘single’ sourceswith SDSS match (light green), and including sources with no SDSS detection (dark green).
Model predictions for sample Galactic latitudes are shown inFig. 8, computed with default TRILEGAL parameters for theMW geometry and the default IFMR from MG07, as well as theWeidemann (2000) (hereafter W2000) IFMR. We show the thin-disc, thick-disc, and halo stellar components, as well as the totalpredicted counts. The IFMR from MG07 largely overpredicts faintstar counts, while the W2000 IFMR produces an overall better matchwith the observed counts, at all Galactic latitudes (see also Fig. 10),and was therefore adopted in all our calculations that follow. Giventhe relevance of the IFMR in the context of stellar evolution, we ex-plain in the next section how it affects the hot-star count predictions,which can be tested by our data.
4.2 The initial–final mass relation
While the MW geometry has been derived by previous studies oflow-mass stars, the IMFR is one of the least constrained factorsin our understanding of stellar evolution, in spite of its importancefor determining the yield of chemical elements, and ultimately theGalaxy chemical evolution. The reasons for this uncertainty in-clude insufficient statistics of post-AGB stars. The final WD massis confined to a very small range (∼0.5–1.0 M�) compared to the∼0.8–8 M� range of their main-sequence initial masses, and thepost-AGB evolutionary time-scale varies steeply within the smallWD mass range. The luminosity remains constant over a large rangeof Teff (up to >100 000 K), and again depends on the remnant mass,making it much harder to establish their distance and absolute lu-minosity than for main-sequence stars.
Therefore, the mismatch between model predictions computedwith TRILEGAL’s default parameters and observed stellar counts(Fig. 8, top-left panel), also previously noted by Bianchi et al.(2009b), prompted us to explore different IFMRs in TRILEGAL.Although other factors, such as the WD birthrate, or the assumedMW extinction model, or a different geometry may also affectmodel predictions, the IFMR is a most critical aspect for modellinghot-WD counts, and was therefore explored in this first analysis.The geometry is better constrained by low-mass stars (e.g. Girardiet al. 2005), which are more numerous, and their counts based onoptical-IR bands are less affected by extinction than a UV-basedcatalogue. The right-hand panels of Fig. 8 show that the W2000IFMR produces a better match of the model calculations with theobserved stellar counts than the MG07 IFMR, and this trend is seenat all Galactic latitudes.
These two IFMRs are illustrated in Fig. 9, together with additionalIFMRs recently derived by Ferrario et al. (2005) and Kalirai et al.(2008) from extensive high signal-to-noise ratio spectroscopy ofWDs in Galactic open clusters. Despite the uncertainties relatedto the age-dating of the clusters, their field contamination, and thepossible dependences on metallicity, they are somewhat similar tothe W2000 semi-empirical IFMR. The MG07 IFMR, instead, isderived from theoretical evolutionary tracks and, as shown in thefigure, yields significantly higher final masses for all Mini < 2 M�.
In order to understand why the model-predicted hot-WD countsdepend on the IFMR, let us first consider the distribution of WDmasses in present-day surveys of the solar neighbourhood. Em-pirical determinations have always concluded that the WD massdistribution presents a strong peak at low masses, with a maximum
C© 2010 The Authors, MNRAS 411, 2770–2791Monthly Notices of the Royal Astronomical Society C© 2010 RAS
Dow
nloaded from https://academ
ic.oup.com/m
nras/article/411/4/2770/983368 by guest on 13 July 2022

2784 L. Bianchi et al.
Figure 9. Left: some of the IFMRs implemented in TRILEGAL, and tested in this work. The MG07 IFMR depends on metallicity, so that different age–metallicity relations (AMR) will sample it in different ways; the curve shown here is for the Rocha-Pinto et al. (2000) AMR, which is used to model the MWthin disc in TRILEGAL. Other IFMRs are the semi-empirical one from W2000, and the purely empirical ones by Ferrario et al. (2005) and Kalirai et al. (2008).Right: the distribution of initial and final WD masses (top and bottom panels, respectively) derived from TRILEGAL models using the MG07 (red lines) andW2000 (black lines) IFMR. The different lines illustrate the contributions from the different MW components, for one sample latitude, down to NUV = 21.5.
close to 0.55 or 0.65 M� and a well-defined tail of more mas-sive WDs, as well as a faint low-mass tail believed to be eitherobservational errors or the result of binary evolution (e.g. Berg-eron, Saffer & Liebert 1992; Bragaglia, Renzini & Bergeron 1995;Madej, Nalezyty & Althaus 2004; Liebert, Bergeron & Holberg2005; Kepler et al. 2007; Hu, Wu & Wu 2007; Holberg et al. 2008).
The origin of this peaked mass distribution can be readily derivedfrom basic population synthesis theory (see Marigo 2001; Ferrarioet al. 2005). Given a volume-limited sample containing stellar pop-ulations of all ages between T = 0 and T = 10 Gyr, the distributionof WD initial masses will be given by
N (Mini) ∝ φM (Mini) ψ[T − τH(Mini)] τWD(Mini) , (3)
where φM is the IMF, ψ[T − τH] is the star formation rate atthe time of stellar birth T − τH, and τH and τWD are the mainsequence and WD lifetimes, respectively. The first two terms in theright-hand side of this equation represent the production rate (or,alternatively, the ‘death rate’) of evolved stars with different masses,in number of stars per unit time. Considering a Salpeter (1955) IMF,φM ∝ M−2.35
ini , and a reasonably constant star formation rate ψ overthe galaxy history; the equation above indicates a marked peak ofthe production rate at the minimum initial mass for the formationof a WD, which is about 1 M� for a galaxy age of T = 10 Gyr. Forhigher initial masses, the production rate should fall as M−2.35
ini . Thisbehaviour will be shared by any galaxy model with nearly constantstar formation, independently of its IFMR.
Assuming a constant and monotonic IFMR, MWD(Mini), the WDmass distribution is given by
N (MWD) ∝(
dMWD
dMini
)−1
N (Mini) , (4)
therefore, for almost-linear and linear IFMRs like the W2000, Fer-rario et al. (2005), and Kalirai et al. (2008) ones, the WD produc-tion rate is still expected to behave like a power law peaked at thesmallest masses. This smallest mass corresponds to a WD mass of∼0.55 M� (see Fig. 9).
The WD lifetime τWD18k, defined as the total time after the AGBin which the star will be hotter than 18 000 K, is longer for WDsof higher mass, because, although they evolve much faster in theconstant-luminosity phase, they reach higher Teff than lower-massWDs, and spend a longer time in their WD cooling track beforefading below the Teff = 18 000 K limit. Models using differentIFMRs simply associate the final masses, hence also these τWD18k
lifetimes, to different initial masses, without affecting the WD pro-duction rate. The end result in terms of mass distribution N(Mini)(see equation 4) is that smaller WD masses will weigh the dis-tribution towards shorter τWD, hence decreasing the numbers ofobserved WDs with Teff > 18 000 K. This effect explains the highernumber of hot WDs predicted by the MG07 IFMR wit respect tothe W2000 IFMR (Fig. 8). In fact, as can be inferred from Fig. 9,the W2000 IFMR gives significantly lower WD final masses (henceshorter τWD18k) for the interval of initial masses between 0.6 and∼2 M�. Because of the IFM being skewed towards lower masses,these objects represent numerically the majority within the wholemass range.
Fig. 9 (right-hand panel) shows the distribution of initial and finalWD masses derived from TRILEGAL for a sample latitude, usingeither the MG07 or W2000 IFMR. It shows that most of the hotWDs observed by GALEX are expected to derive from low-massstars, with initial masses below ∼2 M�. Moreover, it indicatesthat the bulk of observed WDs have low masses, typically 0.55 �MWD � 0.6 M� in the case of the W2000 IFMR. There is no directconfirmation of this particular prediction, although it is in line withWD mass determinations derived from spectroscopic surveys ofmore limited samples (e.g. Bergeron et al. 1992; Bragaglia et al.1995; Madej et al. 2004; Liebert et al. 2005; Kepler et al. 2007; Huet al. 2007; Holberg et al. 2008).
In the calculations with MG07 IFMR the distribution of predictedWD masses is quite different from the W2000 case, with a broadmass distribution extending from 0.55 to 0.65 M�, followed by asort of gap, and a second peak of WD masses located slightly above
C© 2010 The Authors, MNRAS 411, 2770–2791Monthly Notices of the Royal Astronomical Society C© 2010 RAS
Dow
nloaded from https://academ
ic.oup.com/m
nras/article/411/4/2770/983368 by guest on 13 July 2022

Hot white dwarfs: UV catalogues 2785
0.7 M�. These features reflect the positive slope of this IFMR upto Mini � 2 M�, and its plateau at MWD � 0.7 M� for 2 � Mini �3.5 M� (see Fig. 9, left). Another particularity of this IFMR is thehigh masses (about 0.64 M�) predicted for the WDs belonging tothe halo and thick disc. This prediction conflicts with recent massdeterminations of WDs in old star clusters, which indicate valuesclose to 0.53 M� (Kalirai et al. 2008, 2009). A similar trend is seenat different latitudes.
Overall, an IFMR such as that of W2000 produces predictedcounts closer to the observed numbers, at bright magnitudes whereour sample is complete, and at the same time mass distributions inagreement with those derived from spectroscopy of nearby WDs.These aspects underscore the difficulties of deriving the IFMR fromtheoretical evolutionary tracks of AGB stars, even when these tracksare directly calibrated with observations of AGB stars in the LocalGroup, as is the case of MG07. This work, and future analysesplanned on a wider sky area to explore concurrently the effectsof the MW dust geometry, suggests that a deeper investigation ofAGB evolution is necessary, especially concerning the theoreticalprescriptions for mass loss, to reconcile constraints provided byWDs in our Galaxy and those provided by AGB stars in nearbygalaxies.
We finally note that even models calculated with W2000 IFMRtend to predict more faint-star counts than our ‘single’ WD sample(Fig. 10). The mismatch is significant if we consider the red modellines (model stars selected by their synthetic FUV-NUV colour),which should be the most consistent with the observed sampleselection, to the extent that the model atmospheres used by TRILE-GAL are correct. Therefore, we explored also the case of a Kaliraiet al. (2008) IFMR: the predicted counts are lower at faint mag-nitudes (especially the halo component fainter than NUV ∼ 22),as expected from Fig. 9 (left), while still generally in line with thebright star counts. Because of the incompleteness of our sampleat magnitudes fainter than ∼21, and other factors that cannot beconclusively constrained with the current sample, we defer morequantitative conclusions which rests on a comparison of faint starsto a future work, and we adopt in this work the W2000 IFMR, thatmatches well the bright star counts, to explore other effects.
4.3 Milky Way geometry
As explained above the default parameters in the TRILEGAL code,in particular the MW geometry, were defined from previous anal-yses of stellar counts from several surveys, performed with thiscode. Particularly important in this context were the 2MASS starcounts, which are sensitive to the low-mass stars (<0.8 M�). Theselow-mass stars do not overlap with the mass range of the hot-WDprogenitors (about 0.8–8 M�), however they are very numerousand long-lived, and are little affected by uncertainties in stellar evo-lutionary models. Therefore, we should expect the geometry to bewell constrained by previous works, except for the limited extent ofthe previous surveys.
The agreement between our data and model predictions (withW2000 IFMR) is generally good at bright magnitudes, where oursample is complete. In more detail, we should also explore the de-pendence of observed and predicted stellar counts with longitude.The effect is more prominent towards the Galactic plane, there-fore we examined latitudes between 20◦ and 30◦ North and South,and computed models with evenly spaced coverage along thesestrips. The models predict, as expected, different counts towardsthe Galaxy centre and anti-centre, shown in Fig. 11. The coverageof our present GALEX-SDSS matched catalogue at low latitudes is
still too sparse for a conclusive comparison, which will be insteadattempted by matching the AIS data with GSC2, and with the in-creased MIS coverage expected in the GALEX ‘Extended Mission’phase.
Finally, because our UV-optical matched samples are completeto UV magnitudes brighter than ∼20–21, therefore mostly sensitiveto the thin-disc population (Figs 8 and 10), and because the modelswith default MW geometry slightly overpredict the stellar counts atlow (especially Northern) Galactic latitudes, we explored differentgeometries of the thin disc with TRILEGAL. In particular, in Fig. 12we show the effect of adopting more strongly peaked density distri-butions at the Galactic plane: either the simple vertical exponentiallaw, ∝ ρz/hz [which has been adopted in many MW models, startingfrom the classical Bahcall & Soneira (1980, 1984)’s], or the simplehyperbolic secant law, sech(2z/hz). The results confirm that the de-fault geometry adopted by Girardi et al. (2005) and in this work, i.e.the squared hyperbolic secant law, provides the closest prediction tothe observed counts. The same distribution does also provide a goodmatch to star counts of ‘normal stars’ in 2MASS and in the localHipparcos sample (Girardi et al. 2005). The slight overpredictionand underprediction of hot-star counts at certain latitudes may alsobe due to extinction by interstellar dust, which may be either patchy(as in fact it is) or have a slightly different distribution than assumed.These remaining discrepancies and the effects of dust distributionmay be addressed with a wider MIS coverage in the future.
4.4 The kinematic of Milky Way stars
The plots of stellar density versus Galactic latitude presented in theprevious sections clearly indicate that we are looking at a populationof objects for which the mean distance is larger than the meanscaleheight on the thin disc. At typical distances of a few hundredparsec, there will be no parallax measurements for such stars. Themost direct distance information we can find for them is related totheir proper motions.
The table ‘USNO’ in the SDSS data base contains proper motionsfor SDSS objects made after recalibrating USNO-B1.0 (Munn et al.2004) against SDSS astrometry. The systematic errors are quotedto less than 1 mas year−1. The UCAC3 proper motion catalogue isstrongly incomplete for our sample, owing to its magnitude limitof f .mag ∼ 17 (which roughly corresponds to r ∼ 17). In fact, wechecked and found that just a handful of our hot-WD candidates arepresent in UCAC3.
Fig. 13 presents the histograms of proper motions, μ, for the hotstars in the 20–30N strip of MIS, and for three different cuts in NUVmagnitude. The observed distributions are compared with thosepredicted from the TRILEGAL models, computed for the samearea and for the W2000 IFMR. The model distributions are derivedas follows. The observed velocity ellipsoids (σU , σ V , σ W ) of eachGalaxy component are taken form the literature. Each simulated staris then given a random space velocity that follows the Schwarzschilddistribution for this ellipsoid. Space velocities are then correctedfor the solar motion (cf. Dehnen & Binney 1998) and projected onthe sky using the transformations derived from Hipparcos. The finalresults are simulated proper motions and radial velocities. We adoptan age-dependent velocity ellipsoid for the thin disc, derived fromthe Geneva-Copenhagen Survey of Solar neighbourhood (Holmberget al. 2009). For the thick disc and halo, velocity ellipsoids are takenfrom Layden et al. (1996). These prescriptions provide a first-orderdescription of the general distributions of proper motions and radialvelocities, but are not expected to describe the details of the localvelocity streams, nor the effects caused by disc shear in the more
C© 2010 The Authors, MNRAS 411, 2770–2791Monthly Notices of the Royal Astronomical Society C© 2010 RAS
Dow
nloaded from https://academ
ic.oup.com/m
nras/article/411/4/2770/983368 by guest on 13 July 2022
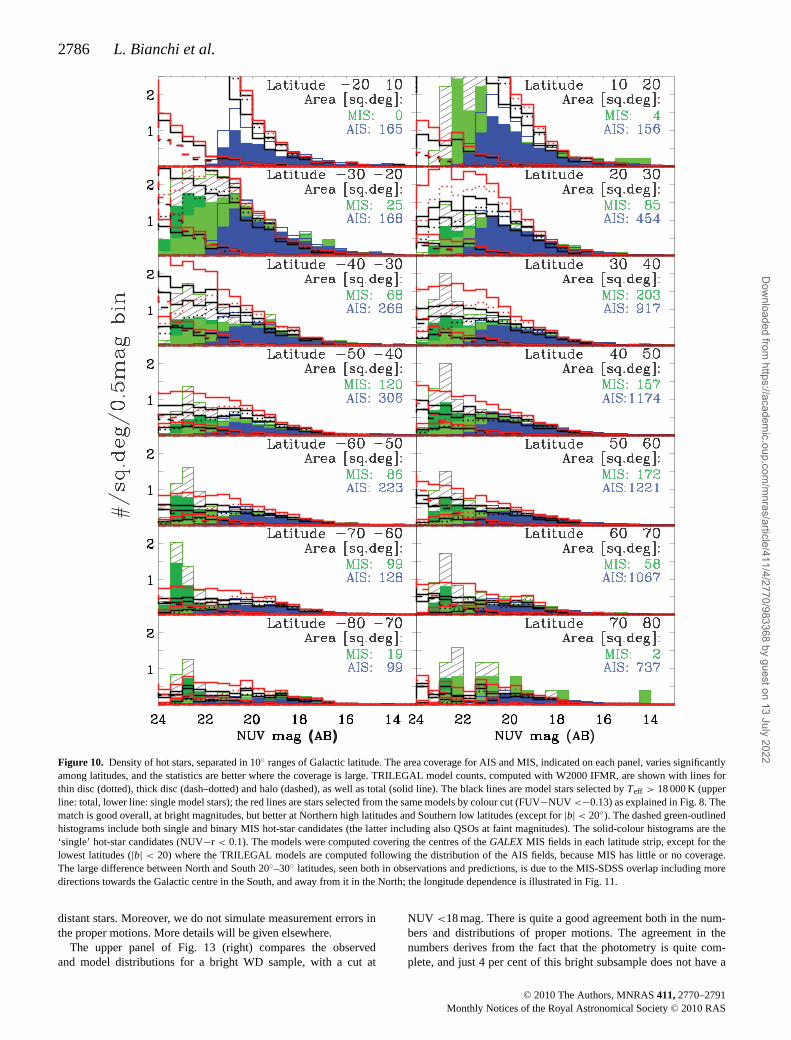
2786 L. Bianchi et al.
Figure 10. Density of hot stars, separated in 10◦ ranges of Galactic latitude. The area coverage for AIS and MIS, indicated on each panel, varies significantlyamong latitudes, and the statistics are better where the coverage is large. TRILEGAL model counts, computed with W2000 IFMR, are shown with lines forthin disc (dotted), thick disc (dash–dotted) and halo (dashed), as well as total (solid line). The black lines are model stars selected by Teff > 18 000 K (upperline: total, lower line: single model stars); the red lines are stars selected from the same models by colour cut (FUV−NUV <−0.13) as explained in Fig. 8. Thematch is good overall, at bright magnitudes, but better at Northern high latitudes and Southern low latitudes (except for |b| < 20◦). The dashed green-outlinedhistograms include both single and binary MIS hot-star candidates (the latter including also QSOs at faint magnitudes). The solid-colour histograms are the‘single’ hot-star candidates (NUV−r < 0.1). The models were computed covering the centres of the GALEX MIS fields in each latitude strip, except for thelowest latitudes (|b| < 20) where the TRILEGAL models are computed following the distribution of the AIS fields, because MIS has little or no coverage.The large difference between North and South 20◦–30◦ latitudes, seen both in observations and predictions, is due to the MIS-SDSS overlap including moredirections towards the Galactic centre in the South, and away from it in the North; the longitude dependence is illustrated in Fig. 11.
distant stars. Moreover, we do not simulate measurement errors inthe proper motions. More details will be given elsewhere.
The upper panel of Fig. 13 (right) compares the observedand model distributions for a bright WD sample, with a cut at
NUV <18 mag. There is quite a good agreement both in the num-bers and distributions of proper motions. The agreement in thenumbers derives from the fact that the photometry is quite com-plete, and just 4 per cent of this bright subsample does not have a
C© 2010 The Authors, MNRAS 411, 2770–2791Monthly Notices of the Royal Astronomical Society C© 2010 RAS
Dow
nloaded from https://academ
ic.oup.com/m
nras/article/411/4/2770/983368 by guest on 13 July 2022
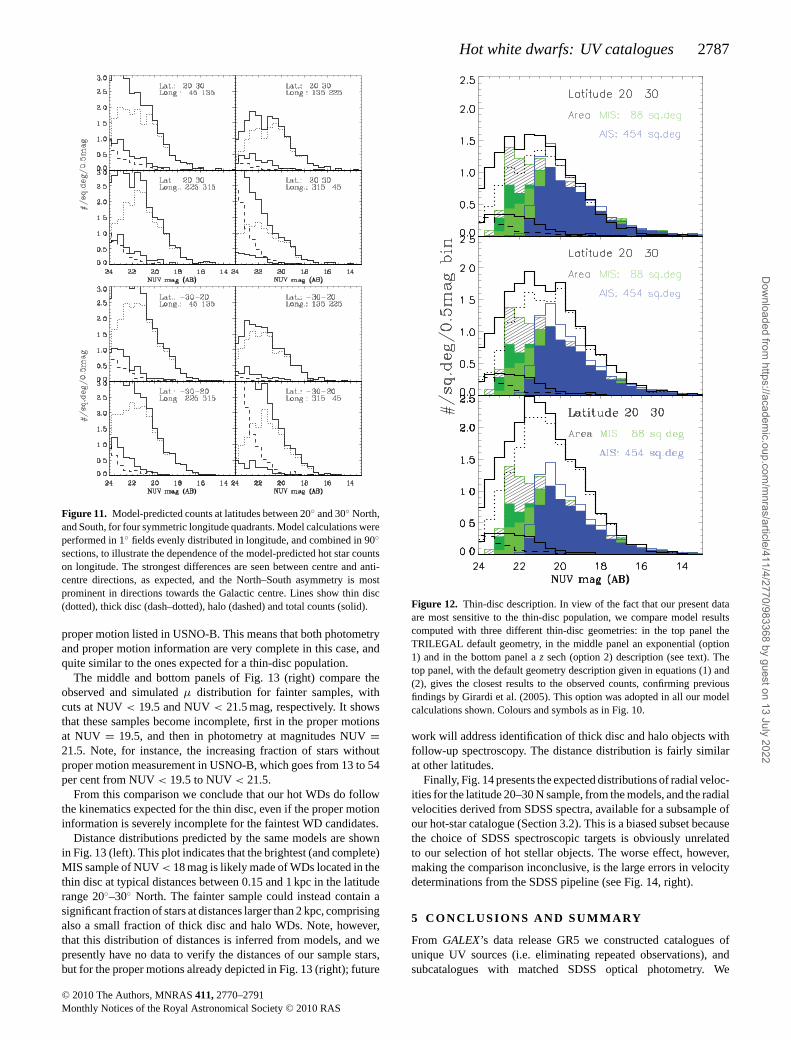
Hot white dwarfs: UV catalogues 2787
Figure 11. Model-predicted counts at latitudes between 20◦ and 30◦ North,and South, for four symmetric longitude quadrants. Model calculations wereperformed in 1◦ fields evenly distributed in longitude, and combined in 90◦sections, to illustrate the dependence of the model-predicted hot star countson longitude. The strongest differences are seen between centre and anti-centre directions, as expected, and the North–South asymmetry is mostprominent in directions towards the Galactic centre. Lines show thin disc(dotted), thick disc (dash–dotted), halo (dashed) and total counts (solid).
proper motion listed in USNO-B. This means that both photometryand proper motion information are very complete in this case, andquite similar to the ones expected for a thin-disc population.
The middle and bottom panels of Fig. 13 (right) compare theobserved and simulated μ distribution for fainter samples, withcuts at NUV < 19.5 and NUV < 21.5 mag, respectively. It showsthat these samples become incomplete, first in the proper motionsat NUV = 19.5, and then in photometry at magnitudes NUV =21.5. Note, for instance, the increasing fraction of stars withoutproper motion measurement in USNO-B, which goes from 13 to 54per cent from NUV < 19.5 to NUV < 21.5.
From this comparison we conclude that our hot WDs do followthe kinematics expected for the thin disc, even if the proper motioninformation is severely incomplete for the faintest WD candidates.
Distance distributions predicted by the same models are shownin Fig. 13 (left). This plot indicates that the brightest (and complete)MIS sample of NUV < 18 mag is likely made of WDs located in thethin disc at typical distances between 0.15 and 1 kpc in the latituderange 20◦–30◦ North. The fainter sample could instead contain asignificant fraction of stars at distances larger than 2 kpc, comprisingalso a small fraction of thick disc and halo WDs. Note, however,that this distribution of distances is inferred from models, and wepresently have no data to verify the distances of our sample stars,but for the proper motions already depicted in Fig. 13 (right); future
Figure 12. Thin-disc description. In view of the fact that our present dataare most sensitive to the thin-disc population, we compare model resultscomputed with three different thin-disc geometries: in the top panel theTRILEGAL default geometry, in the middle panel an exponential (option1) and in the bottom panel a z sech (option 2) description (see text). Thetop panel, with the default geometry description given in equations (1) and(2), gives the closest results to the observed counts, confirming previousfindings by Girardi et al. (2005). This option was adopted in all our modelcalculations shown. Colours and symbols as in Fig. 10.
work will address identification of thick disc and halo objects withfollow-up spectroscopy. The distance distribution is fairly similarat other latitudes.
Finally, Fig. 14 presents the expected distributions of radial veloc-ities for the latitude 20–30 N sample, from the models, and the radialvelocities derived from SDSS spectra, available for a subsample ofour hot-star catalogue (Section 3.2). This is a biased subset becausethe choice of SDSS spectroscopic targets is obviously unrelatedto our selection of hot stellar objects. The worse effect, however,making the comparison inconclusive, is the large errors in velocitydeterminations from the SDSS pipeline (see Fig. 14, right).
5 C O N C L U S I O N S A N D S U M M A RY
From GALEX’s data release GR5 we constructed catalogues ofunique UV sources (i.e. eliminating repeated observations), andsubcatalogues with matched SDSS optical photometry. We
C© 2010 The Authors, MNRAS 411, 2770–2791Monthly Notices of the Royal Astronomical Society C© 2010 RAS
Dow
nloaded from https://academ
ic.oup.com/m
nras/article/411/4/2770/983368 by guest on 13 July 2022
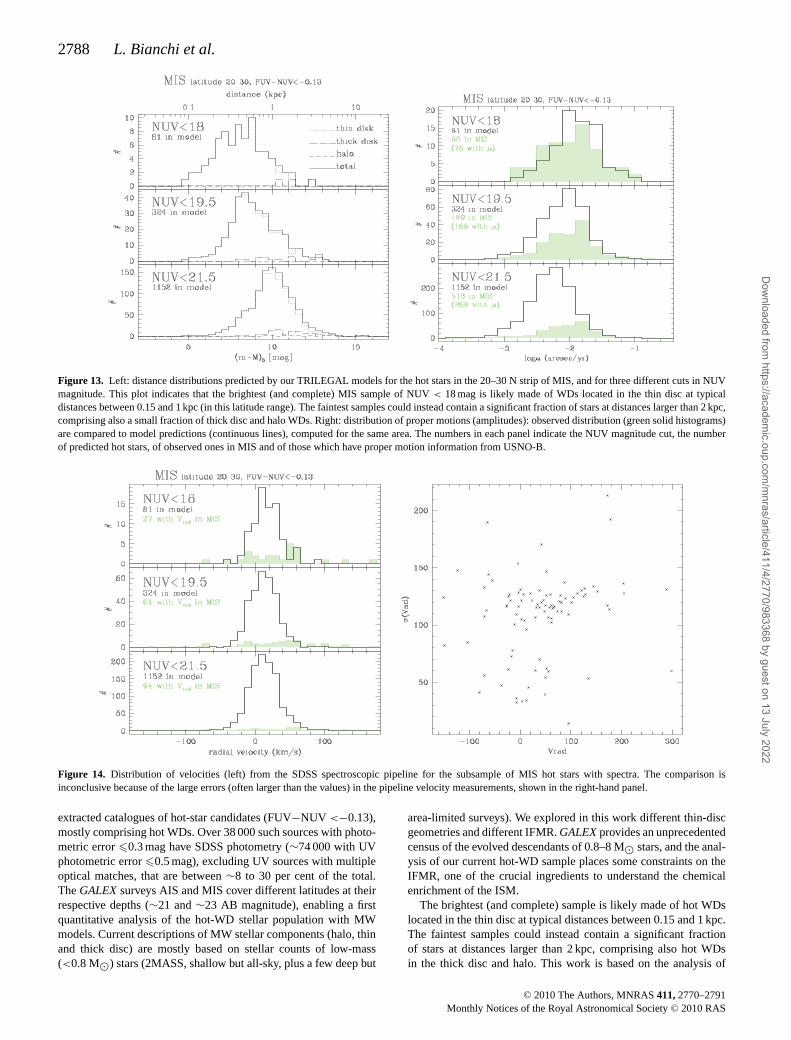
2788 L. Bianchi et al.
Figure 13. Left: distance distributions predicted by our TRILEGAL models for the hot stars in the 20–30 N strip of MIS, and for three different cuts in NUVmagnitude. This plot indicates that the brightest (and complete) MIS sample of NUV < 18 mag is likely made of WDs located in the thin disc at typicaldistances between 0.15 and 1 kpc (in this latitude range). The faintest samples could instead contain a significant fraction of stars at distances larger than 2 kpc,comprising also a small fraction of thick disc and halo WDs. Right: distribution of proper motions (amplitudes): observed distribution (green solid histograms)are compared to model predictions (continuous lines), computed for the same area. The numbers in each panel indicate the NUV magnitude cut, the numberof predicted hot stars, of observed ones in MIS and of those which have proper motion information from USNO-B.
Figure 14. Distribution of velocities (left) from the SDSS spectroscopic pipeline for the subsample of MIS hot stars with spectra. The comparison isinconclusive because of the large errors (often larger than the values) in the pipeline velocity measurements, shown in the right-hand panel.
extracted catalogues of hot-star candidates (FUV−NUV <−0.13),mostly comprising hot WDs. Over 38 000 such sources with photo-metric error �0.3 mag have SDSS photometry (∼74 000 with UVphotometric error �0.5 mag), excluding UV sources with multipleoptical matches, that are between ∼8 to 30 per cent of the total.The GALEX surveys AIS and MIS cover different latitudes at theirrespective depths (∼21 and ∼23 AB magnitude), enabling a firstquantitative analysis of the hot-WD stellar population with MWmodels. Current descriptions of MW stellar components (halo, thinand thick disc) are mostly based on stellar counts of low-mass(<0.8 M�) stars (2MASS, shallow but all-sky, plus a few deep but
area-limited surveys). We explored in this work different thin-discgeometries and different IFMR. GALEX provides an unprecedentedcensus of the evolved descendants of 0.8–8 M� stars, and the anal-ysis of our current hot-WD sample places some constraints on theIFMR, one of the crucial ingredients to understand the chemicalenrichment of the ISM.
The brightest (and complete) sample is likely made of hot WDslocated in the thin disc at typical distances between 0.15 and 1 kpc.The faintest samples could instead contain a significant fractionof stars at distances larger than 2 kpc, comprising also hot WDsin the thick disc and halo. This work is based on the analysis of
C© 2010 The Authors, MNRAS 411, 2770–2791Monthly Notices of the Royal Astronomical Society C© 2010 RAS
Dow
nloaded from https://academ
ic.oup.com/m
nras/article/411/4/2770/983368 by guest on 13 July 2022
Hot white dwarfs: UV catalogues 2789
matched GALEX-SDSS sources, and the SDSS magnitude limitprevents the analysis of thick-disc and halo components. Hot WDsare, however, detectable at such larger distances at MIS depth(see dark-green histograms in Figs 8 and 10, and Section 3.1),and will be investigated in a future work with deeper opticaldata.
Model predictions of hot-star counts at different latitudes, com-puted with currently accepted MW geometry, and assuming W2000IFMR, match the data quite well at intermediate latitudes and brightmagnitudes, but are somewhat discrepant at low latitudes and faintmagnitudes. There is a slight but systematic North–South asymme-try, and MW models with canonical geometry for stars and dustmatch better the data at Southern low latitudes, and at Northernhigh latitudes, indicating that the dust distribution on the MW discmay also be better constrained by our data than was previouslypossible. The dust distribution will be investigated with the futuremore extended sky coverage from the ongoing GALEX mission.However, the observed asymmetry may also be due to the longi-tude dependence of the stellar populations, as our present matched-sources sample covers unevenly North and South Galactic latitudes(Fig. 1). Our MIS matched-sources sample is incomplete at magni-tudes fainter than about ∼21.5 due to the SDSS limits for the hottestsources. At all latitudes, and at magnitudes where the samples arecomplete, MW model predictions of hot WD counts computed withIFMRs favouring lower final masses match the GALEX hot WDcounts significantly better than the IFMR currently postulated byMG07 from AGB stars data. This result contributes an importantconstraint to stellar evolution in the final phases which drive theyield of chemical elements.
5.1 The implications for stellar evolution
What are the implications of constraining the IFMR for the galaxychemical evolution? The IFMR contains the record of the nucle-osynthesis history during the TP-AGB phase, as well as determinesthe contribution of AGB stars in terms of dark remnants. The IFMRand the final yield of chemical elements are significantly affectedby the occurrence (or not) of the so-called ‘third dredge-up’. Ateach dredge-up episode the core mass is reduced by an amountMdredge = λ Mc, TP, where λ is the classical efficiency param-eter, and Mc, TP denotes the mass growth of the core during thepreceeding interpulse period.
In the extreme case where λ ∼ 1, no increment of the C–O coreis predicted. As a consequence, for low-mass stars not experiencingthe third dredge-up (λ = 0, M < Mdredge
min ), the remnant mass scalesdirectly with the duration of the TP-AGB lifetime, while for starsin which the third dredge-up takes place (λ > 0, M ≥ Mdredge
min )this simple proportionality is replaced by a more complex interplaybetween core growth, dredge-up and mass loss. For such more mas-sive stars (M ≥ Mdredge
min , where Mdredgemin ≈ 1.0–1.5M�, depending
on metallicity and model details) the final mass and the chemicalyields are related as we will briefly discuss below (see Marigo &Girardi 2001 for more details).
For the generic element k, the corresponding AGB yield is definedas
MAGBy (k) =
∫τAGB
[Xk(t) − X0k ]M(t) dt, (5)
where X0i is the initial abundance at the epoch of star forma-
tion, Xi(t) is the value at time t and M(t) is the current mass-lossrate.
Let us first consider, in the IFMRs in Fig. 9, the part forMini < Mdredge
min . The chemical yields produced by these stars (mainly13C, 14N and 4He) are determined by the first dredge-up, and thecool-bottom process (Boothroyd & Sackmann 1999) or thermo-haline mixing (Charbonnel & Zahn 2007) operating during theRGB, as no subsequent dredge-up events take place on the AGBaccording to the standard stellar evolution theory. For these low-mass stars, the AGB yield, defined by equation (5), simplifies asMAGB
y (k) = [XRGBk − X0
k ]MejAGB, where XRGB
k is the surface abun-
dance left after the RGB phase, and MejAGB is the total amount of
mass ejected on the AGB. In turn, the expelled mass is related tothe final mass through M
ejAGB = MAGB,0 − Mfinal, where MAGB,0
denotes the stellar mass at the onset of the AGB phase. The finalmasses of these stars with Mini < Mdredge
min can be reduced by simplyinvoking more efficient mass loss along the AGB. Their chemicalyields would increase correspondingly, since less envelope masswill be locked in the central core following the outward displace-ment of the H-burning shell, so that M
ejAGB will be larger. For
instance, for an AGB mass of MAGB,0 = 1.2 M�, a final mass Mfinal
= 0.55 M� versus Mfinal = 0.60 M� would imply an increase of theAGB chemical yield by (0.60 − 0.55)/(1.2 − 0.60) ≈ 10 per cent,as well as a larger total chemical yield, including the RGB windcontribution.
For Minitial ≥ Mdredgemin , in addition to the first dredge-up (and
possibly second dredge-up on the early-AGB), the chemical yieldsinclude also the enrichment, mainly in 4He and primary 12C, pro-duced by the He-shell flashes and brought up to the surface by thethird dredge-up, and the enrichment of 14N produced by the hot-bottom burning process occurring in the most massive AGB stars(Minitial � 4.0–4.5 M�). Again, smaller final masses are reachedwhen higher mass-loss rates occur, and/or deeper dredge-up (i.e.larger λ). These two factors may affect the chemical yields in op-posite ways. On one hand, a high mass loss limits the number ofdredge-up episodes, hence lowering the chemical yields; on theother hand, a deeper dredge-up conveys larger amounts of carbonand helium to the surface layer, which are then ejected. In addition,mass loss and dredge-up efficiency are actually inter-related, a largersurface C abundance generally favouring stronger dust-driven massloss in C stars (e.g. Mattsson et al. 2008), while a significant reduc-tion of the mass of the envelope may decrease its penetration (i.e.lower λ) during the third dredge-up (see e.g. Karakas, Lattanzio& Pols 2002). In sum, a higher mass expelled does not directlyimply that such material is relatively more enriched of processedelements.
An IFMR similar to Weidemann (2000) weighs the final massestowards lower values than e.g. the IFRM of MG07 in the rangeMinitial � 3.0 M�, while the two relations essentially agree at higherMinitial. For Minitial � Mdredge
min , forcing the theoretical IFMR to con-verge on a W2000-type IFMR by assuming a higher mass loss wouldproduce a modest increase of the chemical yields from these ob-jects (because more mass is ejected), compared to the MG07 IMFRcase. As for the initial mass range Mdredge
min ≤ Minitial ≤ 3.0 M�, ahigher mass loss (necessary to reach a smaller final mass, as sug-gested by our WD counts) may reduce the number of dredge-upepisodes on the TP-AGB and this may lead to a lower yield of pro-cessed material. In other words, constraining the IFMR translatesinto constraining the total mass lost in the AGB phase. The chem-ical composition of the ejecta from these stars, however, is alsocritically sensitive to the depth of the third dredge-up, which can becalibrated by measurements of abundances in PNe (Marigo et al.2003) and by a better estimate of the duration of the AGB phase atdifferent metallicity (Marigo et al., in preparation).
C© 2010 The Authors, MNRAS 411, 2770–2791Monthly Notices of the Royal Astronomical Society C© 2010 RAS
Dow
nloaded from https://academ
ic.oup.com/m
nras/article/411/4/2770/983368 by guest on 13 July 2022

2790 L. Bianchi et al.
5.2 Future work
With the current MIS coverage (1103 deg2 overlapping with SDSSphotometry in GR5), we compared with MW models stellar countssummed in 10◦ latitude strips, combining all longitudes in orderto obtain acceptable statistics. In order to disentangle geometry ofthe stellar populations, dust extinction and stellar evolution in moredetail, we need to also analyse the longitude dependence of stellarcounts, as demonstrated by Figs 10 and 11. We will explore dusteffects in the MW disc by matching the AIS with GSC2, for a largersky coverage (see Bianchi et al. 2010). The density of hot stars (therarest in nature) is very low, and large area coverage is needed forgood statistics.
The MW halo and thick disc components, however, become sig-nificant at UV magnitudes fainter than about 21, therefore requirea wider MIS coverage (planned in the GALEX Extended Missionphase) to be usefully constrained (see Figs 1, 8 and 10), and deeperoptical surveys.
Finally, hot WDs in binaries, again elusive at optical wavelengths,are uniquely and unambiguously revealed and characterized by theGALEX UV sky survey, matched to optical surveys. These binariessample different types of stellar pairs (different Teff ranges) thanthose detected and characterized by optical surveys, thanks to theUV photometry (e.g. fig. 6 of Bianchi et al. 2007b). Because our cur-rent photometric selection includes contamination by extragalacticobjects in the ‘binary’ locus, and on the other hand the binariesdo not significantly change the distribution of stellar counts, whichwas the subject of the present analysis, the binary candidates willbe investigated in a future work.
5.3 Final remarks: the online catalogues
The present catalogue of ‘single’ hot-star candidates has a highpurity, as estimated from the serendipitous (but not unbiased) spec-troscopic SDSS coverage. While we expect most of the hottestsources to be high gravity objects (CSPN, subdwarfs or WD), wedid not apply any cut in gravity, therefore main-sequence stars andsupergiants hotter than ∼18 000 K are also included in our cata-logues. Their number is very small compared to the evolved stars,however their inclusion in the catalogue makes it more generallyuseful.
Finally, we remind future users of our catalogues that GALEX UVsources with more than one optical counterpart were excluded fromthe analysis of the hot-star sample (and should be excluded from anysample based on photometric colour selection), but their fraction canbe corrected statistically using Table 2. They are included (flaggedwith ‘rank’ = 1) in our online catalogues. A few per cent of thematched sources may be spurious matches (Fig. 3) but these wouldmostly have random UV-optical colours. The hot-star candidateswith NUV−r > 0.1 includes also some extragalactic objects, therelative fraction is magnitude and latitude dependent.
The source catalogues (GALEX unique sources, GALEX-SDSSmatched sources, hot-stars samples) are available in electronic formonly, from the author’s web site (http://dolomiti.pha.jhu.edu/uvsky)where files description can be found, and will be also posted onMAST (http://galex.stsci.edu and http://archive.stsci.edu/hlsp/). Astatistical analysis and discussion of properties, useful to potentialusers of our (and similar) catalogues for understanding complete-ness and biases of any sample selection, is given by Bianchi et al.(2010).
AC K N OW L E D G M E N T S
Data presented in this paper were obtained from the MultimissionArchive at the Space Telescope Science Institute (MAST). STScI isoperated by the Association of Universities for Research in Astron-omy, Inc., under NASA contract NAS5-26555. Support for MASTfor non-HST data is provided by the NASA Office of Space Sciencevia grant NAG5-7584 and by other grants and contracts.
GALEX is a NASA Small Explorer, launched in 2003 April. Wegratefully acknowledge NASA’s support for construction, opera-tion, and science analysis of the GALEX mission, developed incooperation with the Centre National d’Etudes Spatiales of Franceand the Korean Ministry of Science and Technology. LB and JHacknowledge partial support from FUSE GI grant H901 (NASANNX08AG97G). AZ acknowledges financial support from CNPq-MCT/Brazil. LG acknowledges partial funding from contract ASI-INAF I/016/07/0. We are very grateful to A. Thakar for discussionsof many issues regarding the SDSS data base, and to L. G. Althaus,A. Kanaan, S. O. Kepler, and D. Koester for providing their WDmodels.
REFERENCES
Althaus L. G., Serenelli A. M., Benvenuto O. G., 2001, MNRAS, 323,471
Althaus L. G., Garcıa-Berro E., Isern J., Corsico A. H., 2005, A&A, 441,689
Bahcall J. N., Soneira R. M., 1980, ApJS, 44, 73Bahcall J. N., Soneira R. M., 1984, ApJS, 55, 67Bergeron P., Saffer R. A., Liebert J., 1992, ApJ, 394, 228Bergeron P., Ruiz M. T., Leggett S. K., 1997, ApJS, 108, 339Bianchi L., 2007, in Gomez de Castro A. I., Barstow M. A., eds,
UV Astronomy: Stars from Birth to Death. UCM, Madrid, p. 65(http://www.ucm.es/info/nuva)
Bianchi L., 2009, Ap&SS, 320, 11Bianchi L., 2010, in Shustov B., Gomez de Castro A. I., Sachkov M., eds,
Ap&SS (special issue ‘The UV Universe 2010’), in pressBianchi L., Madore B., Thilker D., Gil de Paz A., Martin C., The GALEX
Team 2003, in Livio M., Brown T., eds, The Local Group as an Astro-physical Laboratory. STScI Publ., Baltimore, p. 10
Bianchi L. et al., 2005, ApJ, 619, L27Bianchi L. et al., 2007a, ApJS, 173, 659Bianchi L. et al., 2007b, in Gomez de Castro A. I., Barstow M. A.,
eds, UV Astronomy: Stars from Birth to Death. UCM, Madrid, p. 95(http://www.ucm.es/info/nuva)
Bianchi L., Hutchings J. B., Efremova B., Herald J., Bressan A., Martin C.,2009a, AJ, 137, 3761
Bianchi L., Efremova B., Herald J., Girardi L., 2009b, in Van SteenbergM. E., Sonneborn G., Moos H. W., Blair W. P., eds, AIP Conf. Ser.Vol. 1135, Future Directions in Ultraviolet Spectroscopy. Am. Inst.Phys., New York, p. 326
Bianchi L. et al., 2010, in Shustov B., Gomez de Castro A. I., Sachkov M.,eds, Ap&SS (special issue ‘The UV Universe 2010’), in press
Boothroyd A. I., Sackmann I.-J., 1999, ApJ, 510, 232Bragaglia A., Renzini A., Bergeron P., 1995, ApJ, 443, 735Budavari T. et al., 2009, ApJ, 694, 1281Charbonnel C., Zahn J.-P., 2007, A&A, 467, L15Croom S. M., Smith R. J., Boyle B. J., Shanks T.., Miller L., Outram P. J.,
Loaring N. S., 2004, MNRAS, 349, 1397de Martino C., Bianchi L., Pagano I., Herald J., Thilker D., 2008, Mem. Soc.
Astron. Ital., 79, 704Dehnen W., Binney J. J., 1998, MNRAS, 298, 387Dupuis J., 2002, in Howell S. B., Dupuis J., Golombek D., Walter F. M.,
Cullison J., eds, ASP Conf. Ser. Vol. 264, Continuing the Challenge of
C© 2010 The Authors, MNRAS 411, 2770–2791Monthly Notices of the Royal Astronomical Society C© 2010 RAS
Dow
nloaded from https://academ
ic.oup.com/m
nras/article/411/4/2770/983368 by guest on 13 July 2022

Hot white dwarfs: UV catalogues 2791
EUV Astronomy: Current Analysis and Prospects for the Future. Astron.Soc. Pac., San Francisco, p. 15
Eisenstein D. J. et al., 2006, ApJS, 167, 40Ferrario L., Wickramasinghe D., Liebert J., Williams K. A., 2005, MNRAS,
361, 1131Fleming T. A., Snowden S. L., Pfeffermann E., Briel U., Greiner J., 1996,
A&A, 316, 147Gansicke B. T. et al., 2009, MNRAS, 397, 2170Gil de Paz A. et al., 2007, ApJS, 173, 185Girardi L., Groenewegen M. A. T., Hatziminaoglou E., da Costa L., 2005,
A&A, 436, 895Gontcharov G. A., Bajkova A. T., Fedorov P. N., Akhmetov V. S., 2010,
preprint (arXiv:1003.3456)Hansen B. M. S., Liebert J., 2003, ARA&A, 41, 465Harris H. C. et al., 2008, ApJ, 679, 697Heller R., Homeier D., Dreizler S., 2009, A&A, 496, 191Holberg J. B., Oswalt T., Sion E. M., 2002, ApJ, 571, 512Holberg J. B., Sion E. M., Oswalt T., McCook G. P., Foran S., Subasavage
J. P., 2008, AJ, 135, 1225Holmberg J., Nordstrom B., Andersen J., 2009, A&A, 501, 941Hu Q., Wu C., Wu X., 2007, A&A, 466, 627Kalirai J. S., Hansen B. M. S., Kelson D. D., Reitzel D. B., Rich R. M.,
Richer H. B., 2008, ApJ, 676, 594Kalirai J. S., Saul Davis D., Richer H. B., Bergeron P., Catelan M., Hansen
B. M. S., Rich R. M., 2009, ApJ, 705, 408Karakas A. I., 2010, MNRAS, 403, 1413Karakas A. I., Lattanzio J. C., Pols O. R., 2002, Pub. Astron. Soc. Australia,
19, 515Kepler S. O., Kleinman S. J., Nitta A., Koester D., Castanheira B. G.,
Giovannini O., Costa A. F. M., Althaus L., 2007, MNRAS, 375, 1315Kleinman S.J, Nitta A., Koester D., 2009, J. Phys.: Conf. Ser., 172, 2020
Koester D., 2008, Mem. Soc. Astron. Ital., 75, 282Layden A. C., Hanson R. B., Hawley S. L., Klemola A. R., Hanley C. J.,
1996, AJ, 112, 2110Liebert J., Bergeron P., Holberg J. B., 2005, ApJS, 156, 47McCook G. P., Sion E. M., 1999, ApJS, 121, 1Madej J., Nalezyty M., Althaus L. G., 2004, A&A, 419, L5Marigo P., 2001, A&A, 370, 194Marigo P., Girardi L., 2001, A&A, 377, 132Marigo P., Girardi L., 2007, A&A, 469, 239 (MG07)Marigo P., Bernard Salas J., Pottasch S. R., Tielens A. G. G. M., Wesselius
P. R., 2003, A&A, 409, 619Mattsson L., Wahlin R., Hofner S., Eriksson K., 2008, A&A, 484, L5Morrissey P. et al., 2007, ApJS, 173, 682Munn J. A. et al., 2004, AJ, 127, 3034Rebassa-Mansergas A., Gansicke B. T., Schreiber M. R., Koester D.,
Rodrıguez-Gil P., 2010, MNRAS, 402, 620Rocha-Pinto H. J., Maciel W. J., Scalo J., Flynn C., 2000, A&A, 358, 850Salpeter E. E., 1955, ApJ, 121, 161Schlegel D. J., Finkbeiner D. P., Davis M., 1998, ApJ, 500, 525Silvestri N. M. et al., 2007, AJ, 134, 741Szkody P. et al., 2009, AJ, 137, 4011Tremblay P. E., Bergeron P., 2007, ApJ, 657, 1013Vassiliadis E., Wood P. R., 1994, ApJS, 92, 125Vennes S., Smith R. J., Boyle B. J., Croom S. M., Kawka A., Shanks T.,
Miller L., Loaring N., 2002, MNRAS, 335, 673Wachter S., Hoard D. W., Hansen K. H., Wilcox R. E., Taylor H. M.,
Finkelstein S. L., 2003, ApJ, 586, 1356Weidemann V., 2000, A&A, 363, 647 (W2000)
This paper has been typeset from a TEX/LATEX file prepared by the author.
C© 2010 The Authors, MNRAS 411, 2770–2791Monthly Notices of the Royal Astronomical Society C© 2010 RAS
Dow
nloaded from https://academ
ic.oup.com/m
nras/article/411/4/2770/983368 by guest on 13 July 2022